UNITED STATES
SECURITIES AND EXCHANGE COMMISSION
WASHINGTON, D.C. 20549
FORM 10-K
FORM 10-K
xþ ANNUAL REPORT PURSUANT TO SECTION 13 OR 15(d) OF THE SECURITIES EXCHANGE ACT OF 1934
For the fiscal year ended October 25, 2013.
| | | | |
For the fiscal year ended | | October 28, 2011
| | |
OR
¨ TRANSITION REPORT PURSUANT TO SECTION 13 OR 15(d) OF THE SECURITIES EXCHANGE ACT OF 1934
For the transition period from to
Commission file number1-6357

ESTERLINE TECHNOLOGIES CORPORATION
(Exact name of registrant as specified in its charter)
| | |
| Delaware | | 13-2595091 |
(State or other jurisdiction
of incorporation or organization)
| | (I.R.S. Employer Identification No.) |
500 108th Avenue N.E., Bellevue, Washington 98004
| | |
500 108th Avenue NE | | |
Bellevue, Washington | | 98004 |
(Address of principal executive offices) | | (Zip code) |
(Address of principal executive offices)(Zip Code)
| | | | |
Registrant’s telephone number, including area code | | 425/
Registrant’s telephone number, including area code(425) 453-9400 | | |
Securities registered pursuant to Section 12(b) of the Act:
| | |
| | Name of each exchange |
| Title of each class | | Name of each exchange on which registered |
| Common Stock ($.20 par value) | | New York Stock Exchange |
Preferred Stock Purchase Rights | | New York Stock Exchange |
Securities registered pursuant to Section 12(g) of the Act: None
Indicate by check mark if the registrant is a well-known seasoned issuer, as defined in Rule 405 of the Securities Act. Yes xþ No ¨
Indicate by check mark if the registrant is not required to file reports pursuant to Section 13 or Section 15(d) of the Act. Yes ¨ No xþ
Indicate by check mark whether the registrant: (1) has filed all reports required to be filed by Section 13 or 15(d) of the Securities Exchange Act of 1934 during the preceding 12 months (or for such shorter period that the Registrant was required to file such reports), and (2) has been subject to such filing requirements for the past 90 days.
Yes xþ No ¨
Indicate by check mark whether the registrant has submitted electronically and posted on its corporate Web site, if any, every Interactive Data File required to be submitted and posted pursuant to Rule 405 of Regulation S-T (§232.405 of this chapter) during the preceding 12 months (or for such shorter period that the registrant was required to submit and post such files). Yes xþ No ¨
Indicate by check mark if disclosure of delinquent filers pursuant to Item 405 of Regulation S-K is not contained herein, and will not be contained, to the best of registrant’s knowledge, in definitive proxy or information statements incorporated by reference in Part III of this Form 10-K or any amendment to this Form 10-K. xþ
Indicate by check mark whether the registrant is a large accelerated filer, an accelerated filer, or a non-accelerated filer. See definition of “accelerated filer and large accelerated filer” in Rule 12b-2 of the Exchange Act. (Check one):
Large accelerated filer x Accelerated filer ¨ Non-accelerated filer ¨
| | | | | | | | |
| Large accelerated filer | | þ | | | | Accelerated filer | | ¨ |
| Non-accelerated filer | | ¨ | | (Do not check if a smaller reporting company) | | Smaller reporting company | | ¨ |
Indicate by check mark whether the registrant is a shell company (as defined in Rule 12b-2 of the Exchange Act). Yes ¨ No xþ
As of December 19, 2011, 30,624,33416, 2013, 31,575,039 shares of the Registrant’s common stock were outstanding. The aggregate market value of shares of common stock held by non-affiliates as of April 29, 2011,26, 2013, was $2,191,628,226$2,308,350,938 (based upon the closing sales price of $71.80$73.86 per share).
Documents Incorporated by Reference
Part III incorporates information by reference to the registrant’s definitive proxy statement, to be filed with the Securities and Exchange Commission within 120 days after the close of the fiscal year ended October 28, 2011.
25, 2013.
2
PART I
This Report includes a number of forward-looking statements that reflect the Company’s current views with respect to future events and financial performance. Please refer to the section addressing forward-looking information on page 910 for further discussion. In this report, “we,” “our,” “us,” “Company,” and “Esterline” refer to Esterline Technologies Corporation and subsidiaries, unless otherwise noted or context otherwise indicates.
Item 1. Business
(a) General Development of Business.Business
Esterline, a Delaware corporation formed in 1967, is a leading specialized manufacturing company principally serving aerospace and defense customers. We design, manufacture and market highly engineered products and systems for application within the industries we serve.
Our strategy is to maintain a leadership position in niche markets for the development and manufacture of highly engineered products that are essential to our customers. We are concentrating our efforts to expand selectively our capabilities in these markets, to anticipate the global needs of our customers and to respond to such needs with comprehensive solutions. Our current business and strategic growth plan focuses on the continuous development of these products in three key technology segments: Avionics & Controls, Sensors & Systems, and Advanced Materials, including thermally engineered components and specialized high-performance elastomers and other complex materials, principally for aerospace and defense markets.Materials. Our products are often mission-critical equipment,mission critical, which have been designed into particular military and commercial platforms and in certain cases can only be replaced by products of other manufacturers following a formal certification process. As part of our implementation of this growth plan, we focus on among other things, expansion of our capabilities as a more comprehensive supplier to our customers. Such expansion included the February 4, 2013, acquisition of the Gamesman Group (Gamesman), which is a global supplier of input devices principally serving the gaming industry; the July 26, 2011, acquisition of the Souriau Group (Souriau), which is a leading global supplier of highly engineered connection technologies for harsh environments; and the December 30, 2010, acquisition of Eclipse Electronic Systems, Inc. (Eclipse), which develops and manufactures embedded communication intercept receivers for signal intelligence applications; and the October 15, 2010, execution of a license agreement with L-3 Avionics Systems, Inc. for the SmartDeck® integrated cockpit technologies to enhance our integrated cockpit capabilities for both original equipment manufacturer (OEM) and retrofit opportunities. We also divested non-core businesses operating as Pressure Systems, Inc., Muirhead Aerospace and Traxsys Input Products Limited.applications. These acquisitions and divestitures are described in more detail in the “Overview” section of Management’s Discussion and Analysis of Financial Condition and Results of Continuing Operations contained in Item 7 of this report.
Our products have a long history in the aerospace and defense industry and are found on most military and commercial aircraft, helicopters, and land-based systems. For example, our products are used on the majority of active and in-production U.S. military aircraft and on every Boeing commercial aircraft platform manufactured in the past 6575 years. In addition, our products are supplied to Airbus, allmany of the major regional and business jet manufacturers, and the major aircraft engine manufacturers. We work closely with OEMs on new, highly engineered products with the objective of such products becoming designed into our customers’ platforms; this integration often results in sole-source positions for OEM production and aftermarket business. We broadly categorize our commercial and military aerospace aftermarket sales as retrofit, repair services, and spare parts. Spare parts alone made up approximately 10% of total sales in fiscal 2013. Retrofit and repair services, which represent 5% of total sales, carry higher margins than OEM sales, but lower margins than spare parts sales. In many cases, our aftermarket sales span the entire life of an aircraft.
We differentiate ourselves through our engineering and manufacturing capabilities and our reputation for safety, quality, on-time delivery, reliability, and innovation – all embodied in the Esterline Performance System, our way of approaching business that helps ensure all employees are focused on continuous improvement. Safety of our operations is a critical factor in our business, and accordingly, we incorporate applicable regulatory guidance in the design of our facilities and the training oftrain our employees using abehavior-based approach that focuses on safety-designed work habits and on-going safety audits. We work closelyOur industries are highly regulated, and compliance with OEMs on new, highly engineered product designs which often resultsapplicable regulations, including export control and anti-bribery regulations, is an important focus in our products being designed into their platforms;business. For example, we have a global code of business conduct and ethics that covers compliance with laws, and we provided training on this integration often resultscode to our worldwide employees in sole-source positions for OEM productionfiscal 2013. In addition, we maintain local ethics advisors and aftermarket business. In fiscal 2011, approximately 35% ofexport control specialists in our salesbusiness units to commercial and military aerospace customers were derived from aftermarket business. Our aftermarket sales, including retrofits, spare parts, and repair services, historically carry a higher gross margin than sales to OEMs. In many cases, aftermarket sales extend well beyond the OEM production period, supporting the platform during its entire life cycle.support our compliance efforts.
Our sales are diversified across three broad markets: defense, commercial aerospace, and general industrial. For fiscal 2011,2013, approximately 40%35% of our sales were from the defense market, 45% from the commercial aerospace market, and 15%20% from the general industrial market.
3
(b) Financial Information About Industry Segments.Segments
A summary of net sales to unaffiliated customers, operating earnings and identifiable assets attributable to our business segments for fiscal years 2011, 2010,2013, 2012, and 20092011 is reported in Note 1716 to the Company’s Consolidated Financial Statements, for the fiscal year ended October 28, 2011, and appears in Item 8 of this report.
(c) Narrative Description of Business.Business
Avionics & Controls
Our Avionics & Controls business segment includes avionics systems, control systems, interface technologies and communication systems, and interface technologies capabilities. Avionics systems designs and develops cockpit systems integration and avionics subsystems for commercial and military applications. Control and communication systems designs and manufactures technology interface systems for military and commercial aircraft and land- andland-based as well as sea-based military vehicles. Interface technologies manufacturesAdditionally, control and develops custom control panels and input systems for medical, industrial, military and casino gaming industries. Communicationcommunication systems designs and manufactures military audio and data products for severe battlefield environments, embedded communication intercept receivers for signal intelligence applications, as well as communication control systems to enhance security and aural clarity in military applications. Interface technologies manufactures and develops custom control panels and input systems for medical, industrial, military and gaming industries. We are a market leader in global positioning systems (GPS), head-up displays, enhanced vision systems, and electronic flight management systems that are used in a broad variety of control and display applications. In addition, we develop, manufacture and market sophisticated, high reliabilityhighly reliable technology interface systems for commercial and military aircraft. These products include lighted push-button and rotary switches, keyboards, lighted indicators, panels and displays. Over the years, ourOur products have been integrated into many existing aircraft designs, including every Boeing commercial aircraft platform currently in production. Our large installed base provides us with a significant spare parts and retrofit business. We are a Tier 1 supplier on the B-787Boeing 787 program to design and manufacture all of the cockpit overhead panels and embedded software for these systems. We manufacture control sticks, grips and wheels, as well as specialized switching systems. In this area, we primarily serve commercial and military aviation, and airborne and ground-based military equipment manufacturing customers. For example, we are a leading manufacturer of pilot control grips for most types of military fighter jets and helicopters. Additionally, our software engineering center supports our customers’ needs with such applications as primary flight displays, flight management systems, air data computers and engine control systems.
Our proprietary products meet critical operational requirements and provide customers with significant technological advantages in such areas as night vision compatibility and active-matrix liquid-crystal displays (a technology enabling pilots to read display screens in a variety of light conditions as well as from extreme angles). Our products are incorporated in a wide variety of platforms ranging from military helicopters, fighters and transports, to commercial wide- and narrow-body, regional and business jets. In fiscal 2011,2013, some of our largest customers for these products included Alsalam Aircraft Company, BAE Systems, The Boeing Company, Canadian Commercial Corp., Fisco, Hawker Beechcraft, Honeywell, Thales, Lockheed Martin, Rockwell Collins, Sikorsky, Thales, and Sikorsky.
We also manufacture a full line of keyboard, switch and input technologies for specialized medical equipment, communication systems and comparable equipment for military applications. These products include custom keyboards, keypads, and input devices that integrate cursor control devices, bar-code scanners, displays, video, and voice activation. We also produce instruments that are used for point-of-use and point-of-care diagnostics. We have developed a wide variety of technologies, including plastic and vinyl membranes that protect high-use switches and fully depressible buttons, and backlit elastomer switch coverings that are resistant to exposure from harsh chemicals. These technologies now serve as the foundation for a small but growing portion of our product line. In fiscal 2011, some of our largest customers for these products included Alere, Applied Quality Communications, Dictaphone, Frymaster, General Electric, Jabil Circuit, Philips, Roche, Siemens, and WMS.Triman.
In addition, we design and manufacture ruggedized military personal communication equipment, primarily headsets. We are the sole supplier of Active Noise Reduction (ANR) headsets to the British Army’s tracked and wheeled vehicle fleets under the Bowman communication system program. In the U.S., we supply ANR headsets to the U.S. Army’s tracked and wheeled vehicle fleets under the Vehicle Intercom System (VIS) and VIS-X programs comprising over 200,000 vehicles, and we are the sole supplier to the U.S. Marine Corps for their MRAP fleet. We are also the sole ANR headset supplier to the Canadian Army. We have a long-standing relationship with armies around the world, including forces in Australia, India, Australia, Spain,Saudi Arabia, and Saudi Arabia.Spain. We design and manufacture signalssignal intelligence and communications intelligence (SIGINT/COMINT) receiver hardware for the airborne intelligence, surveillance and reconnaissance (ISR) market. These products incorporate modern, open-architecture software/firmware configurable designs, are deployed on a wide range of U.S. and foreign manned airborne platforms, and on such next generation unmanned platforms as the Northrop Grumman Global Hawk and General Atomics Reaper and Predator. In fiscal 2011,2013, some of our largest customers for these products
4
included Northrop Grumman, L-3 Communications, Lockheed Martin, Simex Defense,BAE Systems, The Boeing Company, the British Ministry of Defence (MoD), L-3 Communications, Lockheed Martin, Northrop Grumman, and The Boeing Company.Sanmina.
We also manufacture a full line of keyboard, switch and input technologies for specialized medical equipment and communication systems for military applications. These products include custom keyboards, keypads, and input devices that integrate cursor control devices, barcode scanners, displays, video, and voice activation. We also produce instruments that are used for point-of-use and point-of-care diagnostics. We have developed a wide variety of technologies, including plastic and vinyl membranes that protect high-use switches and fully depressible buttons, and backlit elastomer switch coverings that are resistant to exposure from harsh chemicals. These technologies now serve as the foundation for a small but growing portion of our product line. In fiscal 2013, some of our largest customers for these products included Alere, Aristocrat Technologies, General Electric, Inspired Gaming, Merck, Nuance, Philips, Quidel, Roche, and WMS.
4
Sensors & Systems
Our Sensors & Systems business segment includes power systems, connection technologies and advanced sensors capabilities. We develop and manufacture high-precision temperature, pressure and speed sensors principally for aerospace and defense customers, electrical interconnection systems for severe environments for aerospace, defense, geophysics & marine, and nuclear customers, as well as electrical power switching, control and data communication devices, and other related systems principally for aerospace and defense customers. We are the OEM sole-source and aftersales supplier of temperature probes for use on all versions of the General Electric/Snecma CFM-56 jet engine. The CFM-56 jet engine has an installed base of 22,000,25,000, is standard equipment on newthe current generation B-737Boeing 737 aircraft and was selected as the engine for approximately 50%60% of all Airbus single-aisle aircraft delivered to date. We were contractedhave a contract to design and manufacture the B-787’sBoeing 787’s sensors for the environmental control system, and provide the primary power distribution assembly for the Airbus A400M military transport. Additionally, we have secured a Tier 1 position with Rolls-Royce for the complete suite of sensors for the engines that will power the A400M and A350. We design and manufacture micro packaging, planet probe interconnectors, launcher umbilicals, and composite connectors for the B-787.Boeing 787. Unique electrical interconnection products account for about 75% of our connection technologies sales, and standard products qualified to customer standards or military specifications account for 25% of sales. The principal customers for our products in this business segment are jet engine manufacturers, airframe and industrial manufacturers. In fiscal 2011,2013, some of our largest customers for these products included Avent,Airbus, Astrium, The Boeing Company, Bombardier, Dassault, Flame, General Electric, Honeywell, Labinal, Rolls-Royce, Pratt & Whitney,SAFRAN, Sercel, and SAFRAN.UTC.
Advanced Materials
Our Advanced Materials business segment includes engineered materials and defense technologies capabilities. We develop and manufacture high-performance elastomer products used in a wide range of commercial aerospace, space, and military applications, and highly engineered thermal components for commercial aerospace and industrial applications. We also develop and manufacture combustible ordnance and countermeasures for military applications.
Specialized High-Performance Applications. We specialize in the development of proprietary formulations for silicone rubber and other elastomer products. Our elastomer products are engineered to address specific customer requirements where superior performance in high temperature, high pressure, caustic, abrasive and other difficult environments is critical. These products include clamping devices, thermal fire barrier insulation products, sealing systems, tubing and coverings designed in custom-molded shapes. Some of the products include proprietary elastomers that are specifically designed for use on or near a jet engine. We are a leading U.S. supplier of high-performance elastomer products to the aerospace industry, with our primary customers for these products being jet and rocket engine manufacturers, commercial and military airframe manufacturers, as well as commercial airlines. In fiscal 2011,2013, some of the largest customers for these products included Alliant Techsystems, The Boeing Company, Honeywell,Goodrich, KAPCO, Lockheed Martin, Northrop Grumman, Pattonair, and Pattonair.Spirit AeroSystems. We also develop and manufacture high temperature, lightweight metallic insulation systems for aerospace and marine applications. Our commercial aerospace programs include the B-737,Boeing 737, A320, and A380 series aircraft and the V2500 and BR710 engines. Our insulation material is used on diesel engine manifolds for earthmoving and agricultural applications. In addition, we specialize in the development of thermal protection for fire, nuclear, and petro-chemical industries. We design and manufacture high temperature components for industrial and marine markets. Our manufacturing processes consist of cutting, pressing, and welding stainless steel, Inconelinconel and titanium fabrications. In fiscal 2011,2013, some of the largest customers of these products included Acktiv Nuclear, Airbus, The Boeing Company, B/E Aerospace, Goodrich, GKN Aerospace, KAPCO, Lockheed Martin, Northrop Grumman, Pattonair, Petrofac Engineering & Construction, Rolls-Royce, Short Brothers, Spirit AeroSystems, and Spirit AeroSystems.Wesco Aircraft.
Ordnance and Countermeasure Applications. We develop and manufacture combustible ordnance and warfare countermeasure devices for military customers. We manufacture molded fiber cartridge cases, mortar increments, igniter tubes and other combustible ordnance components primarily for the U.S. Department of Defense. Safety of our operations is a critical factor in manufacturing ordnance and countermeasures, and accordingly, we incorporate applicable regulatory guidance in the design of our facilities and in the training of our employees. As part of our behavior-based approach to training, employees learn safety-designed work habits and perform on-going safety audits. We also monitor safety metrics to ensure compliance. We are currently the sole supplier of combustible casings utilized by the U.S. Armed Forces. Sales are made either directly to the U.S. Department of Defense or through prime contractors, Alliant Techsystems and General Dynamics. These products include the combustible case for the U.S. Army’s new generation 155mm Modular Artillery Charge System, the 120mm combustible case used with the main armament system on the U.S. Army and Marine Corps’ M1-A1/2 tanks, and the 60mm, 81mm and 120mm combustible mortar increments. We are one of two suppliers to the U.S.
5
Army of infrared decoy flares used by aircraft to help protect against radar and infrared guided missiles. Additionally, we
5
are a supplier of infrared decoy flares to the MoD and other international defense agencies. We are currently the only supplier of radar countermeasures to the U.S. Army.
A summary of product lines contributing sales of 10% or more of total sales for fiscal years 2011, 2010,2013, 2012, and 20092011 is reported in Note 1716 to the Consolidated Financial Statements for the fiscal year ended October 28, 2011, and appears inunder Item 8 of this report.
Marketing and Distribution
We believe that a key to continued success is our ability to meet customer requirements both domestically and internationally. We have and will continue to improve our world-wide sales and distribution channels in order to provide wider market coverage and to improve the effectiveness of our customers’ supply chain. For example, our medical device assembly operation in Shanghai, China, serves our global medical customers, our service center in Singapore improves our capabilities in Asia for our temperature sensor customers, our marketing representative office in Bangalore, India, facilitates marketing opportunities in India, and our marketing representative office in Beijing, China, facilitates marketing opportunities in China. Other enhancements include combining sales and marketing forces of our operating units where appropriate, cross-training our sales representatives on multiple product lines, and cross-stocking our spares and components.
In the technical and highly engineered product segments in which we compete, relationship selling is particularly appropriate in targeted marketing segments where customer and supplier design and engineering inputs need to be tightly integrated. Participation in industry trade shows is an effective method of meeting customers, introducing new products, and exchanging technical specifications. In addition to technical and industry conferences, our products are supported through direct internal international sales efforts, as well as through manufacturer representatives and selected distributors. As of October 28, 2011, 37625, 2013, 398 sales people, 290324 representatives, and 259340 distributors supportsupported our operations internationally.
Backlog
Backlog was $1.3 billion at October 28, 2011, compared with $1.1 billion at the end of25, 2013, and October 29, 2010.26, 2012. We estimate that approximately $352.8$332 million of backlog is scheduled to be shipped after fiscal 2012.2014.
Backlog is subject to cancellation until delivered, and therefore, we cannot assure that our backlog will be converted into revenue in any particular period or at all. Backlog does not include the total contract value of cost-plus reimbursable contracts, which are funded as we incur the costs. Except for the released portion, backlog also does not include fixed-price multi-year contracts.
Competition
Our products and services are affected by varying degrees of competition. We compete with other companies in most markets we serve, manyserve. Many of whichthese companies have far greater sales volumes and financial resources.resources than we do. Some of our competitors are also our customers on certain programs. The principal competitive factors in the commercial markets in which we participate are product performance, on-time delivery, service and price. Part of product performance requires expenditures in research and development that lead to product improvement. The market for many of our products may be affected by rapid and significant technological changes and new product introductions. Our principal competitors include Astronautics, BAE, Bose, ELBIT,Eaton, Elbit, EMS, Eaton, GE Aerospace, Honeywell, IAI, L-3, Otto Controls, RAFI, Rockwell Collins, SELEX, Telephonics, Thales, Ultra Electronics, Universal Avionics Systems Corporation, and Zodiac in our Avionics & Controls segment; Ametek, Amphenol, Eaton, Goodrich, Hamilton Sundstrand, MPC Products, Meggitt, STPI-Deutsch, Tyco,TE Connectivity, and Zodiac in our Sensors & Systems segment; and Chemring, Doncasters, Hitemp,Hi-Temp, J&M, JPR Hutchinson, Kmass, Meggitt (including Dunlop Standard Aerospace Group), Rheinmetall, Trelleborg, ULVA, UMPCO, and UMPCOWoodward Products in our Advanced Materials segment.
Research and Development
Our product development and design programs utilize an extensive base of professional engineers, technicians and support personnel, supplemented by outside engineering and consulting firms when needed. In fiscal 2011,2013, we expended approximately $94.5$95.7 million for research, development and engineering, compared with $69.8$107.7 million in fiscal 20102012 and $64.5$94.5 million in fiscal 2009.2011. Research and development expense has averaged 5.2% of sales for the three years ended October 25, 2013. We believe continued product development is key to our long-term growth, and consequently, we consistently invest in research and development. Examples include research and development projects relating to advanced vision systems, SmartDeck® integrated flight control and display system, avionics control panels, A350
6
engine sensors, high temperature, low observable material for military applications,
6
and spectral countermeasure flares for military applications. We actively participate in customer-funded research and development programs, including applications on C-130 cockpit upgrades, P-8 aircraft and power systems for the HH-47 Chinook helicopter and A400M.
Foreign Operations
Our principal foreign operations consist of manufacturing facilities located in Canada, China, the Dominican Republic, France, Germany, Canada,India, Japan, Mexico, Morocco, and the United Kingdom, India, Morocco, the Dominican Republic, Mexico and China, and include sales and service operations located in Brazil, Singapore,China, and China.Singapore. For further information regarding foreign operations, see Note 1716 to the Consolidated Financial Statements under Item 8 of this report.
U.S. Government Contracts and Subcontracts
As a contractor and subcontractor to the U.S. government (primarily the U.S. Department of Defense), we are subject to various laws and regulations that are more restrictive than those applicable to private sector contractors. Approximately 10%6% of our sales werewas made directly to the U.S. government in fiscal 2011.2013. In addition, we estimate that our subcontracting activities to contractors for the U.S. government accounted for approximately 20%17% of sales during fiscal 2011.2013. In total, we estimate that approximately 30%23% of our sales during the fiscal year werewas subject to U.S. government contracting regulations. Such contracts may be subject to termination, reduction or modification in the event of changes in government requirements, reductions in federal spending, and other factors.
Historically, our U.S. government contracts and subcontracts have been predominately fixed-price contracts. Generally, fixed-price contracts offer higher margins than cost-plus contracts in return for accepting the risk that increased or unexpected costs may reduce anticipated profits or cause us to sustain losses on the contracts. The accuracy and appropriateness of certain costs and expenses used to substantiate our direct and indirect costs for the U.S. government under both cost-plus and fixed-price contracts are subject to extensive regulation and audit by the Defense Contract Audit Agency, an arm of the U.S. Department of Defense. The contracts and subcontracts to which we are a party are also subject to profit and cost controls and standard provisions for termination at the convenience of the U.S. government. Upon termination, other than for our default, we will normally be entitled to reimbursement for allowable costs and to an allowance for profit. To date, none of our material fixed-price contracts have been terminated.
We are subject to U.S. export laws and regulations, including the International Traffic in Arms Regulations (ITAR), that generally restrict the export of defense products, technical data, and defense services. We recorded a $10 million charge as of July 26, 2013, for penalties proposed by the DDTC Office of Compliance associated with our earlier handling of ITAR-controlled transactions and related compliance errors, as described further in this report under “Item 3 – Legal Proceedings.” Our failure to comply with applicable regulations could result in penalties, loss, or suspension of contracts or other consequences, and the costs to maintain compliance with these regulations may be higher than we anticipate. Any of these consequences could adversely affect our operations or financial condition.
Patents and Licenses
Although we hold a number of patents and licenses, we do not believe that our operations are dependent on our patents and licenses. In general, we rely on technical superiority, continual product improvement, exclusive product features, lean manufacturing and operational excellence, including superior lead-time, on-time delivery performance and quality, and customer relationships to maintain competitive advantage.
Seasonality
The timing of our revenues is impacted by the purchasing patterns of our customers, and as a result we do not generate revenues evenly throughout the year. Moreover, our first fiscal quarter, November through January, includes significant holiday vacation periods in both Europe and North America. This leads to decreased order and shipment activity; consequently, first quarter results are typically weaker than other quarters and not necessarily indicative of our performance in subsequent quarters.
Sources and Availability of Raw Materials and Components
The sources and availability of certain raw materials and components are not as critical as they would be for manufacturers of a single product line, due to our vertical integration and diversification. However, certain components, supplies and raw materials for our operations are purchased from single sources. In such instances, we strive to develop alternative sources and design modifications to minimize the effect of business interruptions.
7
Environmental Matters
We are subject to federal, state, local and foreign laws, regulations and ordinances that (i) govern activities or operations that may have adverse environmental effects, such as discharges to air and water, as well as handling and disposal practices for solid and hazardous waste, and (ii) impose liability for the costs of cleaning up, and certain damages resulting from, sites or past spills, disposals or other releases of hazardous substances.
7
At various times we have been identified as a potentially responsible party pursuant to the Comprehensive Environmental Response, Compensation, and Liability Act of 1980 (CERCLA), and analogous state environmental laws, for the cleanup of contamination resulting from past disposals of hazardous wastes at certain sites to which we, among others, sent wastes in the past. CERCLA requires potentially responsible persons to pay for cleanup of sites from which there has been a release or threatened release of hazardous substances. Courts have interpreted CERCLA to impose strict, joint and several liability on all persons liable for cleanup costs. As a practical matter, however, at sites where there are multiple potentially responsible persons, the costs of cleanup typically are allocated among the parties according to a volumetric or other standard.
We have accrued liabilities for environmental remediation costs expected to be incurred by our operating facilities.incurred. Environmental exposures are provided for at the time they are known to exist or are considered reasonably probable and estimable.
Employees
We had 12,11412,049 employees at October 28, 2011,25, 2013, of which 5,3584,982 were based in the United States, 4,1104,174 in Europe, 1,0911,026 in Canada, 600632 in Mexico, 443584 in Asia, 347516 in Morocco and 165135 in the Dominican Republic. Approximately 12% of the U.S.-based employees were represented by a labor union. Our European operations are subject to national trade union agreements and to local regulations governing employment.
(d) Financial Information About Foreign and Domestic Operations and Export Sales.Sales
See risk factor below entitled “Political and economic changes in foreign countries and markets, including foreign currency fluctuations, may have a material effect on our operating results” under Item 1A of this report and Note 1716 to the Consolidated Financial Statements under Item 8 of this report.
(e) Available Information ofAbout the Registrant.Registrant
You can access financial and other information on our Web site,www.esterline.com. We make available through our Web site, free of charge, copies of our annual report on Form 10-K, quarterly reports on Form 10-Q, current reports on Form 8-K and amendments to those reports filed or furnished pursuant to Section 13(a) or Section 15(d) of the Securities Exchange Act of 1934, as amended (the “Exchange Act”), as soon as reasonably practicable after filing such material electronically or otherwise furnishing it to the Securities and Exchange Commission (SEC). The SEC also maintains a Web site atwww.sec.gov, which contains reports, proxy and information statements, and other information regarding public companies, including Esterline. Any reports filed with the SEC may also be obtained from the SEC’s Reference Room at 100 F Street, NE, Washington, DC 20549. Our Corporate Governance Guidelines and charters for our board committees are available on our Web site,www.esterline.com on the Corporate Governance tab, and our Code of Business Conduct and Ethics, which includes a code of ethics applicable to our accounting and financial employees, including our Chief Executive Officer and Chief Financial Officer, is available on our Web site atwww.esterline.com on the Corporate Governance tab. Each of these documents is also available in print (at no charge) to any shareholder upon request. Our Web site and the information contained therein or connected thereto are not incorporated by reference into this Form 10-K.
8
Executive Officers of the Registrant
The names and ages of all executive officers of the Company and the positions and offices held by such persons as of December 12, 2011,20, 2013, are as follows:
| | | | | | | | | | |
Name | | | | Position with the Company | | Age |
R. Bradley Lawrence | | Age Executive Chairman | | 66 |
R. Bradley Lawrence | | Curtis C. Reusser | | President and Chief Executive Officer | | 53 |
Robert D. George | | 64 Chief Financial Officer, Vice President, and
Corporate Development | | 57 |
Robert D. George | | | | Vice President, Chief Financial Officer, | | | | | | |
| | | | Corporate Development and Secretary | | | | 55 | | |
Alain M. Durand | | | | Group Vice President | | 46 |
C. Thomas Heine | | 44 Vice President, Human Resources | | 65 |
Frank E. Houston | | | | Senior Group Vice President | | | | 60 | | 62 |
Stephen R. Larson | | Marcia J. Mason | | Vice President Strategy & Technologyand General Counsel | | | | 67 | | 61 |
Marcia J. Mason | | | | Vice President, Human Resources | | | | 59 | | |
Albert S. Yost | | | | Group Vice President and Treasurer | | | | 46 | | 48 |
8
Mr. Lawrence has been Executive Chairman since September 2013. Previously, he was Chairman, Chief Executive Officer and President since March 2012. In addition, he served as President and Chief Executive Officer since November 2009. Prior to that time, he was2009, President and Chief Operating Officer since July 2009, and Group Vice President since January 2007. From September 2002 to January 2007, he was President of Advanced Input Systems, a subsidiary of the Company. Mr. Lawrence has an M.B.A. from the University of Pittsburgh and a B.S. degree in Business Administration from Pennsylvania State University.
Mr. Reusser has been President and Chief Executive Officer since October 2013. Previously, he was President, Aircraft Systems of UTC Aerospace Systems for United Technologies Corporation, a provider of a broad range of high-technology products and services to the global aerospace and building systems industries, from July 2012 to October 2013. Prior to that time, he was President of the Electronic Systems segment of Goodrich Corporation, an aerospace and defense company that was acquired by UTC in July 2012, from January 2008 to July 2012. Mr. Reusser has a B.S. degree in Industrial and Mechanical Engineering from the University of Washington and a Certificate in Business Management from the University of San Diego.
Mr. George has been Chief Financial Officer, Vice President, and Corporate Development since October 2012. From July 2011 to October 2012, he was Vice President, Chief Financial Officer, Corporate Development and Secretary since July 2011.Secretary. Prior to that time, he was Vice President, Chief Financial Officer, Secretary and Treasurer since July 1999. Mr. George has an M.B.A. from the Fuqua School of Business at Duke University and a B.A. degree in Economics from Drew University.
Mr. Durand has been Group Vice President since June 2011. Prior to that time, he was President of the Advanced Sensors business platform from May 2007 to June 2011. From July 2004 to May 2007, he was President of Auxitrol Technologies, a subsidiary of the Company. Mr. Durand has an M.B.A. from Ecole Supérieure de Commerce in Reims, France, and a Mechanical Engineering degree from Ecole Catholique d’Arts et Métiers in Lyons,Lyon, France.
Mr. Heine has been Vice President, Human Resources since August 2012. Prior to that time, he was Vice President, Leadership and Organizational Development since March 2007. He has an M.P.A. in Human Resource Management from the University of Colorado and a B.S. degree in English from Eastern Michigan University.
Mr. Houston has been Senior Group Vice President since December 2009. Prior to that time, he was Group Vice President since March 2005. Mr. Houston has an M.B.A. from the University of Washington and a B.A. degree in Political Science from Seattle Pacific University.
Mr. Larson has been Vice President, Strategy & Technology since January 2000. Mr. Larson has an M.B.A. from the University of Chicago and a B.S. degree in Electrical Engineering from Northwestern University.
Ms. Mason has been Vice President and General Counsel since September 2013. Prior to that time she was General Counsel and Vice President, Administration from August 2012 to September 2013, and Vice President, Human Resources sincefrom March 1993.1993 to July 2012. Ms. Mason has a J.D. degree from Northwestern University School of Law and a B.A. degree in Political Science from Portland State University.
Mr. Yost has been Group Vice President and Treasurer since November 2009 and July 2011. Prior to that time, he was Group Vice President since November 2009.2011, respectively. Previously, he was President of Advanced Input Systems, a subsidiary of the Company from January 2007, and held management responsibilities for Esterline’s Interface Technologies business platform from May 2007. From April 2002 to April 2007, he was Director of Finance for Advanced Input Systems. Mr. Yost has an M.B.A. from Utah State University and a B.A. degree in Economics from Brigham Young University.
9
Forward-Looking Statements
This annual report on Form 10-K includes forward-looking statements. These statements may be identified by the use of forward-looking terminology such as “anticipate,” “believe,” “continue,” “could,” “estimate,” “expect,” “intend,” “may,” “might,” “plan,” “potential,” “predict,” “should” or “will” or the negative thereof or other variations thereon or comparable terminology. In particular, statements about our expectations, beliefs, plans, objectives, assumptions or future events or performance contained in this report under the headings “Risks Relating to Our Business and Our Industry,” “Management’s Discussion and Analysis of Financial Condition and Results of Continuing Operations” and “Business” are forward-looking statements.
We have based these forward-looking statements on our current expectations, assumptions, estimates and projections. While we believe these expectations, assumptions, estimates and projections are reasonable, such forward-looking statements are only predictions and involve known and unknown risks and uncertainties, many of which are beyond our control. These and other important factors, including those discussed in this report under the headings “Risks Relating to Our Business and Our Industry,” “Management’s Discussion and Analysis of Financial Condition and Results of Continuing Operations” and “Business” may cause our actual results, performance or achievements to differ materially from any future results, performance or achievements expressed or implied by these forward-looking statements. Some of the key factors that could cause actual results to differ from our expectations are:
| — | | A significant downturn in the aerospace industry;
|
| — | | A significant reduction in defense spending;
|
| — | | A decrease in demand for our products as a result of competition, technological innovation or otherwise;
|
| — | | Our inability to integrate acquired operations or complete acquisitions; and
|
| — | | Loss of a significant customer or defense program.
|
A significant downturn in the aerospace industry;
A significant reduction in defense spending;
A decrease in demand for our products as a result of competition, technological innovation or otherwise;
Our inability to execute on our accelerated integration plans or otherwise integrate acquired operations or complete acquisitions;
Our ability to comply with the complex applicable laws that affect our business; and
Loss of a significant customer or defense program.
Given these risks and uncertainties, you are cautioned not to place undue reliance on such forward-looking statements. The forward-looking statements included or incorporated by reference into this report are made only as of the date hereof. We do not undertake and specifically decline any obligation to update any such statements or to publicly announce the results of any revisions to any such statements to reflect future events or developments.
9
Item 1A. Risk Factors
Risks Relating to Our Business and Our Industry
A recurrent global recession mayReductions in defense spending could adversely affect our accessbusiness.
Approximately 35% of our business is dependent on defense spending. The defense industry is dependent upon the level of equipment expenditures by the armed forces of countries throughout the world, and especially those of the United States, which represents a significant portion of world-wide defense expenditures. In August 2011, Congress enacted the Budget Control Act of 2011 (BCA), which resulted in substantial, automatic reductions in both defense and discretionary spending. The automatic across-the-board budget cuts, or sequestration, are incremental to capital, cost of capital, and business operations.
Ifspending reductions already included in the global recession recurs, our future cost of debt and equity capital could be adversely affected. Any inability to obtain adequate financing from debt and equity sources could force us to self fund strategic initiatives or even forgo some opportunities, potentially harmingdefense funding over a ten-year period. These spending cuts impacted our financial position, results in fiscal 2013, and could have significant future consequences to our business and industry, including disruption of programs and personnel reductions that could impact our manufacturing operations and liquidity.engineering capabilities.
Economic conditions may impairThe loss of a significant customer or defense program could have a material adverse effect on our customers’ businessoperating results.
Some of our operations are dependent on a relatively small number of customers and markets,aerospace and defense programs, which change from time to time. Significant customers in fiscal 2013 included The Boeing Company, Flame, General Electric, Hawker Beechcraft, Honeywell, Lockheed Martin, Northrop Grumman, Rolls-Royce, Sikorsky, and the U.S. Department of Defense. There can be no assurance that our current significant customers will continue to buy our products at current levels. The loss of a significant customer or the cancellation of orders related to a sole-source defense program could have a material adverse effect on our operating results if we were unable to replace the related sales.
We are subject to numerous regulatory requirements, which could adversely affect our business.
Among other things, we are subject to the Foreign Corrupt Practices Act, or FCPA, and the U.K. Bribery Act, which generally prohibit companies and their intermediaries from bribing foreign officials for the purpose of obtaining or keeping business or otherwise obtaining favorable treatment. In particular, we may be held liable for actions taken by our strategic or local partners even though our partners are not subject to the FCPA or the U.K. Bribery Act. Any determination that we have violated the FCPA or the U.K. Bribery Act could result in sanctions that could have a material adverse effect on our business, financial condition and results of operations.
In
10
We are also subject to a variety of international laws, as well as U.S. export laws and regulations, such as the eventInternational Traffic in Arms Regulations (ITAR), which generally restrict the export of defense products, technical data and defense services. We have filed voluntary reports that disclosed certain technical and administrative violations of the ITAR with the U.S. Department of State’s Directorate of Defense Trade Controls (DDTC) Office of Defense Trade Controls Compliance (DDTC Office of Compliance). As further described in this report under “Item 3 – Legal Proceedings,” we recorded a recurrent global recession in$10 million charge as of July 26, 2013, for penalties proposed by the United StatesDDTC Office of Compliance associated with our earlier handling of ITAR-controlled transactions, including the substance of our prior voluntary disclosures and other partsaspects of the world, customers may chooseITAR compliance errors. Our failure to delaycomply with these regulations could result in penalties, loss, or postpone purchases from us until the economy and their businesses strengthen. Decisions by currentsuspension of contracts or future customers to forgo or defer purchases and/or our customers’ inability to pay us for our products mayother consequences. Any of these could adversely affect our earningsoperations and financial condition.
We may be unable to realize expected benefits from our business integration efforts and our profitability may be hurt or our business otherwise might be adversely affected.
We recently announced that we are accelerating plans to consolidate certain facilities and to create greater cost efficiencies through shared services in sales, general administration and support functions across our segments. We have never before pursued integration initiatives to this extent, and there is no assurance that our efforts will be successful. These plans are intended to generate operating expense savings through direct and indirect overhead expense reductions as well as other savings. These integration activities are complex. If we do not successfully manage our current integration activities, or any other similar activities that we may undertake in the future, expected efficiencies and benefits might be delayed or not realized, and our operations and business could be disrupted. Risks associated with these actions include inability to or delay in the planned transfer of business activities to other locations due to dependency on third party agreements or certification of projects affected by the transfer, unanticipated costs in implementing the initiatives, delays in implementation of anticipated workforce reductions, adverse effects on employee morale, creation of customer or supplier uncertainty that may impact our business and the failure to meet operational targets due to the loss of employees. If any of these risks are realized, our ability to achieve anticipated cost reductions may be impaired or our business may otherwise be harmed, which could have a material adverse effect on our competitive position, results of operations, cash flow.flows or financial condition.
Implementing our acquisition strategy involves risks, and our failure to successfully implement this strategy could have a material adverse effect on our business.
One of our key strategies is to grow our business by selectively pursuing acquisitions. Since 1996 we have completed over 30 acquisitions, and we are continuing to actively pursue additional acquisition opportunities, some of which may be material to our business and financial performance. Although we have been successful with this strategy in the past, we may not be able to grow our business in the future through acquisitions for a number of reasons, including:
| — | | Acquisition financing not being available on acceptable terms or at all;
|
| — | | Encountering difficulties identifying and executing acquisitions;
|
| — | | Increased competition for targets, which may increase acquisition costs;
|
| — | | Consolidation in our industry reducing the number of acquisition targets; and
|
| — | | Competition laws and regulations preventing us from making certain acquisitions.
|
Acquisition financing not being available on acceptable terms or at all;
Encountering difficulties identifying and executing acquisitions;
Increased competition for targets, which may increase acquisition costs;
Consolidation in our industry reducing the number of acquisition targets; and
Competition laws and regulations preventing us from making certain acquisitions.
In addition, there are potential risks associated with growing our business through acquisitions, including the failure to successfully integrate and realize the expected benefits of an acquisition. For example, with any past or future acquisition, there is the possibility that:
| — | | The business culture of the acquired business may not match well with our culture;
|
| — | | Technological and product synergies, economies of scale and cost reductions may not occur as expected;
|
| — | | Management may be distracted from overseeing existing operations by the need to integrate acquired businesses;
|
| — | | We may acquire or assume unexpected liabilities;
|
| — | | Unforeseen difficulties may arise in integrating operations and systems;
|
| — | | We may fail to retain and assimilate employees of the acquired business;
|
| — | | We may experience problems in retaining customers and integrating customer bases; and
|
| — | | Problems may arise in entering new markets in which we may have little or no experience.
|
The business culture of the acquired business may not match well with our culture;
Technological and product synergies, economies of scale and cost reductions may not occur as expected;
Management may be distracted from overseeing existing operations by the need to integrate acquired businesses;
We may acquire or assume unexpected liabilities;
Unforeseen difficulties may arise in integrating operations and systems;
We may fail to retain and assimilate employees of the acquired business;
We may experience problems in retaining customers and integrating customer bases; and
Problems may arise in entering new markets in which we may have little or no experience.
Failure to continue implementing our acquisition strategy, including successfully integrating acquired businesses, could have a material adverse effect on our business, financial condition and results of operations.
11
Our future financial results could be adversely impacted by asset impairment charges.
We are required to test both acquired goodwill and other indefinite-lived intangible assets for impairment on an annual basis based upon a fair value approach, rather than amortizing them over time. We have chosen to perform our annual impairment reviews of goodwill and other indefinite-lived intangible assets during the fourth quarter of each fiscal year. We also are required to test goodwill for impairment between annual tests if events occur or circumstances change that would more likely than not reduce our enterprise fair value below its book value. These events or circumstances could include a significant change in the business climate, including a significant sustained decline in an entity’s market value, legal factors, operating performance indicators, competition, sale or disposition of a significant portion of the business, or other factors. If the fair market value is less than the book value of goodwill, we could be required to record an impairment charge. The valuation of reporting units requires judgment in estimating future cash flows, discount rates and estimated product life cycles. In making these judgments, we evaluate the financial health of the business, including such factors as industry performance, changes in technology and operating cash flows.
10
As we have grown through acquisitions, we have accumulated $1.2$1.1 billion of goodwill, and have $48.8$47.2 million of indefinite-lived intangible assets, out of total assets of $3.4$3.3 billion at October 28, 2011.25, 2013. As a result, the amount of any annual or interim impairment could be significant and could have a material adverse effect on our reported financial results for the period in which the charge is taken. For example, we recorded an impairment charge of $3.5 million in fiscal 2013, and an impairment charge of $52.2 million in fiscal 2012 at Racal Acoustics, Inc. (Racal Acoustics). In addition, we may incur additional charges.
We performed our annual impairment review for fiscal 20112013 as of July 30, 2011,27, 2013, and our Step One analysis indicates that no impairment of goodwill andor other indefinite-lived assets exists at any of our other reporting units. Our Souriau reporting unit’s margin in passing the Step One analysis was approximately 12%, mainly reflecting lower market valuation assumptions in 2013. Management expects that continued improvements in operations will result in favorable actual results compared with our original plan. It is possible, however, that as a result of events or circumstances, we could conclude at a later date that goodwill of $347.6 million at Souriau may be considered impaired. We also may be required to record an earnings charge or incur unanticipated expenses if, due to a change in strategy or other reasons, we determined the value of other assets has been impaired. These other assets include trade names of $33.7 million and intangible assets of $181.7 million.
A long-lived asset to be disposed of is reported at the lower of its carrying amount or fair value less cost to sell. An asset (other than goodwill and indefinite-lived intangible assets) is considered impaired when estimated future undiscounted cash flows are less than the carrying amount of the asset. In the event the carrying amount of such asset is not deemed recoverable, the asset is adjusted to its estimated fair value. Fair value is generally determined based upon estimated discounted future cash flows. As we have grown through acquisitions, we have accumulated $645.1$533.8 million of definite-lived intangible assets. As a result, the amount of any annual or interim impairment could be significant and could have a material adverse effect on our reported financial results for the period in which the charge is taken.
The amount of debt we have outstanding, as well as any debt we may incur in the future, could have an adverse effect on our operational and financial flexibility.
As of October 28, 2011,25, 2013, we had approximately $1.0 billion$689.1 million of long-term debt outstanding, which is long-term debt.outstanding. Under our existing secured credit facility, we have a $460 million revolving line of credit, and a €125an €18.0 million term loan (Euro Term Loan). Up to $100.0, and a $170.6 million in letters of credit may be drawn in U.K. pounds or euros in addition to U.S. dollars.term loan (U.S. Term Loan). The credit facility is secured by substantially all of the Company’s assets and interest is based on standard inter-bank offering rates. In addition, we have unsecured foreign currency credit facilities that have been extended by foreign banks for up to $32.5$66.2 million. Available credit under the above credit facilities was $122.4$363.5 million at October 28, 2011,25, 2013, reflecting bank borrowings of $365.0$130.0 million and letters of credit of $5.1$32.7 million.
We also have outstanding $175.0 million 6.625% senior notes due in March 2017 and $250.0 million 7.0% senior notesSenior Notes due in August 2020.2020 (2020 Notes). The indentures governing those notes and other debt agreements limit, but do not prohibit, us from incurring additional debt in the future. Our level of debt could have significant consequences to our business, including the following:
| — | | Depending on interest rates and debt maturities, a substantial portion of our cash flow from operations could be dedicated to paying principal and interest on our debt, thereby reducing funds available for our acquisition strategy, capital expenditures or other purposes; |
| — | | A significant amount of debt could make us more vulnerable to changes in economic conditions or increases in prevailing interest rates;
|
| — | | Our ability to obtain additional financing for acquisitions, capital expenditures or for other purposes could be impaired;
|
| — | | The increase in the amount of debt we have outstanding increases the risk of non-compliance with some of the covenants in our debt agreements which require us to maintain specified financial ratios; and
|
| — | | We may be more leveraged than some of our competitors, which may result in a competitive disadvantage.
|
The loss of a significant customer or defense program could have a material adverse effect on our operating results.debt, thereby reducing funds available for our acquisition strategy, capital expenditures or other purposes;
A significant amount of debt could make us more vulnerable to changes in economic conditions or increases in prevailing interest rates;
Our ability to obtain additional financing for acquisitions, capital expenditures or for other purposes could be impaired;
Some12
The increase in the amount of debt we have outstanding increases the risk of non-compliance with some of the covenants in our debt agreements which require us to maintain specified financial ratios; and
We may be more leveraged than some of our operations are dependent oncompetitors, which may result in a relatively small number of customers and aerospace and defense programs, which change from time to time. Significant customers in fiscal 2011 included The Boeing Company, Hawker Beechcraft, Flame, General Electric, Honeywell, Lockheed Martin, Northrop Grumman, Rolls-Royce, Sikorsky, and the U.S. Department of Defense. There can be no assurance that our current significant customers will continue to buy our products at current levels. The loss of a significant customer or the cancellation of orders related to a sole-source defense program could have a material adverse effect on our operating results if we were unable to replace the related sales.competitive disadvantage.
Our revenues are subject to fluctuations that may cause our operating results to decline.
Our business is susceptible to seasonality and economic cycles, and as a result, our operating results have fluctuated widely in the past and are likely to continue to do so. Our revenue tends to fluctuate based on a number of factors, including domestic and foreign economic conditions and developments affecting the specific industries and customers we serve. For example, it is possible that thea global recession could recuroccur and result in a more severe downturn in commercial aviation and
defense.11
defense. It is also possible that in the future our operating results in a particular quarter or quarters will not meet the expectations of securities analysts or investors, causing the market price of our common stock or senior notes to decline. We believe that quarter-to-quarter comparisons of our operating results are not a good indication of our future performance and should not be relied upon to predict our future performance.
A global recession may adversely affect our business operations and results, capital, and cost of capital.
In the event of a global recession, our customers may choose to delay or postpone purchases from us until the economy and their business strengthen. Decisions by current or future customers to forgo or defer purchases and/or our customers’ inability to pay for our products may adversely affect our earnings and cash flow. A recession could also adversely affect our future cost of debt and equity. Any inability to obtain adequate financing from debt and equity sources could force us to self-fund strategic initiatives or even forgo some opportunities, potentially harming our financial position, results of operations, and liquidity.
Our operations depend on our production facilities throughout the world. These production facilities are subject to physical and other risks that could disrupt production.
Our production facilities could be damaged or disrupted by a natural disaster, labor strike, war, political unrest, terrorist activity or a pandemic. Several of our production facilities are located in California, and thus are in areas with above average seismic activity and may also be at risk of damage in wildfires. Although we have obtained property damage and business interruption insurance for our production facilities, a major catastrophe such as an earthquake or other natural disaster at any of our sites, or significant labor strikes, work stoppage, political unrest, war or terrorist activities in any of the areas where we conduct operations, could result in a prolonged interruption of our business. Any disruption resulting from these events could cause significant delays in shipments of products and the loss of sales and customers. We cannot assure you that we will have insurance to adequately compensate us for any of these events.
Political and economic changes in foreign countries and markets, including foreign currency fluctuations, may have a material effect on our operating results.
Foreign sales originating from non-U.S. locations were approximately 45%50% of our total sales in fiscal 2011,2013, and we have manufacturing facilities in a number of foreign countries. A substantial portion of our Avionics & Controls operations is based in Canada and the U.K., and a substantial portion of our Sensors & Systems operations is based in the U.K. and France. We also have manufacturing operations in China, the Dominican Republic, Germany, India, Japan, Mexico, China, and Morocco. Doing business in foreign countries is subject to numerous risks, including political and economic instability, restrictive trade policies of foreign governments, economic conditions in local markets, health concerns, inconsistent product regulation or unexpected changes in regulatory and other legal requirements by foreign agencies or governments, the imposition of product tariffs and the burdens of complying with a wide variety of international and U.S. export laws and differing regulatory requirements. To the extent that foreign sales are transacted in a foreign currency, we are subject to the risk of losses due to foreign currency fluctuations. In addition, we have substantial assets denominated in foreign currencies, primarily the Canadian dollar, U.K. pound and euro, that are not offset by liabilities denominated in those foreign currencies. These net foreign currency investments are subject to material changes in the event of fluctuations in foreign currencies against the U.S. dollar.
We are subject to numerous regulatory requirements, which could adversely affect our business.
Among other things, we are subject to the Foreign Corrupt Practices Act, or FCPA, and the U.K. Bribery Act which generally prohibit companies and their intermediaries from bribing foreign officials for the purpose of obtaining or keeping business or otherwise obtaining favorable treatment. In particular, we may be held liable for actions taken by our strategic or local partners even though our partners are not subject to the FCPA or the U.K. Bribery Act. Any determination that we have violated the FCPA or the U.K. Bribery Act could result in sanctions that could have a material adverse effect on our business, financial condition and results of operations.
We are also subject to a variety of international laws, as well as U.S. export laws and regulations, such as the International Traffic in Arms Regulations (ITAR), which generally restrict the export of defense products, technical data and defense services. We have filed voluntary disclosure reports in fiscal 2011 at certain U.S. operating units and voluntarily reported certain technical violations of U.S. export laws and regulations. We are enhancing our internal and external auditing compliance program. While management believes that this increased oversight is adequate to address the technical violations, the impact of filing these voluntary disclosure statements covering technical violations, as well as compliance with these laws and regulations and any changes thereto, are difficult to predict. The costs of compliance including penalties, any failure to comply, and any changes to such laws and regulations could adversely affect our operations in the future.
A downturn in the aircraft market could adversely affect our business.
The aerospace industry is cyclical in nature and affected by periodic downturns that are beyond our control. The principal customers for manufacturers of commercial aircraft are the commercial and regional airlines, which can be adversely affected by a number of factors, including a recession, increasing fuel and labor costs, intense price competition, outbreak
13
of infectious disease and terrorist attacks, as well as economic cycles, all of which can be unpredictable and are outside our control. Any decrease in demand resulting from a downturn in the market could adversely affect our business, financial condition and results of operations.
Reductions in defense spending could adversely affect our business.
Approximately 40% of our business is dependent on defense spending. The defense industry is dependent upon the level of equipment expenditures by the armed forces of countries throughout the world, and especially those of the United States, which represents a significant portion of world-wide defense expenditures. The war on terror has increased the level of equipment expenditures by the U.S. armed forces. This level of spending may not be sustainable in light of government spending priorities by the U.S. and the winding down of U.S. armed forces operations in Iraq and Afghanistan. In addition, as a result of the failure of the Joint Select Committee on Deficit Reduction (Super Committee) to agree on a deficit reduction plan, mandatory reductions in defense are required under the Budget Control Act. The extent and scope of these cuts is difficult to assess at this time. Any decrease in demand for new aircraft and equipment or use of existing aircraft and equipment will likely result in a decrease in demand of our products and services, and correspondingly, our revenues, thereby adversely affecting our business, financial condition and results of operations.
12
We may not be able to compete effectively.
Our products and services are affected by varying degrees of competition. We compete with other companies and divisions and units of larger companies in most markets we serve, many of which have greater sales volumes or financial, technological or marketing resources than we do. Our principal competitors include: Astronautics, BAE, Bose, Eaton, ECE, ELBIT,Elbit, EMS, Eaton, GE Aerospace, Honeywell, IAI, L-3, Otto Controls, RAFI, Rockwell Collins, SELEX, Telephonics, Thales, Ultra Electronics, and Universal Avionics Systems Corporation in our Avionics & Controls segment; Ametek, Amphenol, Eaton, ECE, Goodrich, Hamilton Sundstrand, MPC Products, Meggitt, STPI-Deutsch, and TycoTE Connectivity in our Sensors & Systems segment; and Chemring, Doncasters, Hitemp,Hi-Temp, J&M, JPR Hutchinson, Kmass, Meggitt (including Dunlop Standard Aerospace Group), Rheinmetall, Trelleborg, ULVA, and UMPCO in our Advanced Materials segment. The principal competitive factors in the commercial markets in which we participate are product performance, service and price. Maintaining product performance requires expenditures in research and development that lead to product improvement and new product introduction. Companies with more substantial financial resources may have a better ability to make such expenditures. We cannot assure that we will be able to continue to successfully compete in our markets, which could adversely affect our business, financial condition and results of operations.
Our backlog is subject to modification or termination, which may reduce our sales in future periods.
We currently have a backlog of orders based on our contracts with customers. Under many of our contracts, our customers may unilaterally modify or terminate their orders at any time. In addition, the maximum contract value specified under a government contract awarded to us is not necessarily indicative of the sales that we will realize under that contract. For example, we are a sole-source prime contractor for many different military programs with the U.S. Department of Defense. We depend heavily on the government contracts underlying these programs. Over its lifetime, a program may be implemented by the award of many different individual contracts and subcontracts. The funding of government programs is subject to congressional appropriation.
Changes in defense procurement models may make it more difficult for us to successfully bid on projects as a prime contractor and limit sole-source opportunities available to us.
In recent years, the trend in combat system design and development appears to be evolving toward the technological integration of various battlefield components, including combat vehicles, command and control network communications, advanced technology artillery systems and robotics. If the U.S. military procurement approach continues to require this kind of overall battlefield combat system integration, we expect to be subject to increased competition from aerospace and defense companies which have significantly greater resources than we do. This trend could create a role for a prime contractor with broader capabilities that would be responsible for integrating various battlefield component systems and potentially eliminating or reducing the role of sole-source providers or prime contractors of component weapon systems.
We may lose money or generate less than expected profits on our fixed-price contracts.
Our customers set demanding specifications for product performance, reliability and cost. Some of our government contracts and subcontracts provide for a predetermined, fixed price for the products we make regardless of the costs we incur. Therefore, we must absorb cost overruns, notwithstanding the difficulty of estimating all of the costs we will incur in performing these contracts and in projecting the ultimate level of sales that we may achieve. Our failure to anticipate technical problems, estimate costs accurately, integrate technical processes effectively or control costs during performance of a fixed-price contract may reduce the profitability of a fixed-price contract or cause a loss. While we believe that we have recorded adequate provisions in our financial statements for losses on our fixed-price contracts as required under GAAP, we cannot assure that our contract loss provisions will be adequate to cover all actual future losses. Therefore, we may incur losses on fixed-price contracts that we had expected to be profitable, or such contracts may be less profitable than expected.
The market for our products may be affected by our ability to adapt to technological change.
The rapid change of technology is a key feature of all of the markets in which our businesses operate. To succeed in the future, we will need to design, develop, manufacture, assemble, test, market, and support new products and enhancements to our existing products in a timely and cost-effective manner. Historically, our technology has been developed through internal research and development expenditures, as well as customer-sponsored research and development programs. There is no guarantee that we will continue to maintain, or benefit from, comparable levels of research and development in the14
13
future. In addition, our competitors may develop technologies and products that are more effective than those we develop or that render our technology and products obsolete or noncompetitive. Furthermore, our products could become unmarketable if new industry standards emerge. We cannot assure that our existing products will not require significant modifications in the future to remain competitive or that new products we introduce will be accepted by our customers, nor can we assure that we will successfully identify new opportunities and continue to have the needed financial resources to develop new products in a timely or cost-effective manner.
Our business is subject to government contracting regulations, and our failure to comply with such laws and regulations could harm our operating results and prospects.
We estimate that approximately 30%23% of our sales in fiscal 20112013 were attributable to contracts in which we were either the prime contractor to, or a subcontractor to a prime contractor to, the U.S. government. As a contractor and subcontractor to the U.S. government, we must comply with laws and regulations relating to the formation, administration and performance of federal government contracts that affect how we do business with our customers and may impose added costs to our business. For example, these regulations and laws include provisions that contracts we have been awarded are subject to:
| — | | Protest or challenge by unsuccessful bidders; and
|
| — | | Unilateral termination, reduction or modification in the event of changes in government requirements.
|
Protest or challenge by unsuccessful bidders; and
Unilateral termination, reduction or modification in the event of changes in government requirements.
The accuracy and appropriateness of certain costs and expenses used to substantiate our direct and indirect costs for the U.S. government under both cost-plus and fixed-price contracts are subject to extensive regulation and audit by the Defense Contract Audit Agency, an arm of the U.S. Department of Defense. Responding to governmental audits, inquiries or investigations may involve significant expense and divert management attention. Our failure to comply with these or other laws and regulations could result in contract termination, suspension or debarment from contracting with the federal government, civil fines and damages, and criminal prosecution and penalties, any of which could have a material adverse effect on our operating results.
A significant portion of our business depends on U.S. government contracts, which are often subject to competitive bidding, and a failure to compete effectively or accurately anticipate the success of future projects could adversely affect our business.
We obtain many of our U.S. government contracts through a competitive bidding process that subjects us to risks associated with:
| — | | The frequent need to bid on programs in advance of the completion of their design, which may result in unforeseen technological difficulties and/or cost overruns;
|
| — | | The substantial time and effort, including design, development and marketing activities, required to prepare bids and proposals for contracts that may not be awarded to us; and
|
| — | | The design complexity and rapid rate of technological advancement of defense-related products.
|
The frequent need to bid on programs in advance of the completion of their design, which may result in unforeseen technological difficulties and/or cost overruns;
The substantial time and effort, including design, development and marketing activities, required to prepare bids and proposals for contracts that may not be awarded to us; and
The design complexity and rapid rate of technological advancement of defense-related products.
In addition, in order to win the award of developmental programs, we must be able to align our research and development and product offerings with the government’s changing concepts of national defense and defense systems. The government’s termination of, or failure to fully fund, one or more of the contracts for our programs would have a negative impact on our operating results and financial condition. Furthermore, we serve as a subcontractor on several military programs that, in large part, involve the same risks as prime contracts.
Overall, we rely on key contracts with U.S. government entities for a significant portion of our sales and business. A substantial reduction in these contracts would materially adversely affect our operating results and financial position.
The market for our products may be affected by our ability to adapt to technological change.
The rapid change of technology is a key feature of all of the markets in which our businesses operate. To succeed in the future, we will need to design, develop, manufacture, assemble, test, market, and support new products and enhancements to our existing products in a timely and cost-effective manner. Historically, our technology has been developed through internal research and development expenditures, as well as customer-sponsored research and development programs. There is no guarantee that we will continue to maintain, or benefit from, comparable levels of research and development in the future. In addition, our competitors may develop technologies and products that are more effective than those we develop or that render our technology and products obsolete or noncompetitive. Furthermore, our products could become unmarketable if new industry standards emerge. We cannot assure that our existing products will not require significant modifications in the future to remain competitive or that new products we introduce will be accepted by our customers, nor can we assure that we will successfully identify new opportunities and continue to have the needed financial resources to develop new products in a timely or cost-effective manner.
15
The airline industry is heavily regulated and if we fail to comply with applicable requirements, our results of operations could suffer.
Governmental agencies throughout the world, including the U.S. Federal Aviation Administration or the FAA,(FAA), prescribe standards and qualification requirements for aircraft components, including virtually all commercial airline and general aviation products, as well as regulations regarding the repair and overhaul of aircraft engines. Specific regulations vary from country to country, although compliance with FAA requirements generally satisfies regulatory requirements in other countries. We include, with the replacement parts that we sell to our customers, documentation certifying that each part complies with applicable regulatory requirements and meets applicable standards of airworthiness established by the FAA or the equivalent regulatory agencies in other countries. In order to sell our products, we and the products we manufacture must also be certified by our individual OEM customers. If any of the material authorizations or approvals qualifying us to supply our products is revoked or suspended, then the sale of the subject product would be prohibited by law, which would have an adverse effect on our business, financial condition and results of operations.
14
From time to time, the FAA or equivalent regulatory agencies in other countries propose new regulations or changes to existing regulations, which are usually more stringent than existing regulations. If these proposed regulations are adopted and enacted, we may incur significant additional costs to achieve compliance, which could have a material adverse effect on our business, financial condition and results of operations.
We depend on the continued contributions of our executive officers and other key management, each of whom would be difficult to replace.
Our future success depends to a significant degree upon the continued contributions of our senior management and our ability to attract and retain other highly qualified management personnel. We face competition for management from other companies and organizations. Therefore, we may not be able to retain our existing management personnel or fill new management positions or vacancies created by expansion or turnover at our existing compensation levels. Although we have entered into change of control agreements with some members of senior management, we do not have employment contracts with our key executives, nor have we purchased “key-person” insurance on the lives of any of our key officers or management personnel to reduce the impact to our company that the loss of any of them would cause. Specifically, the loss of any of our executive officers would disrupt our operations and divert the time and attention of our remaining officers. Additionally, failure to attract and retain highly qualified management personnel would damage our business prospects.
If we are unable to protect our intellectual property rights adequately, the value of our products could be diminished.
Our success is dependent in part on obtaining, maintaining and enforcing our proprietary rights and our ability to avoid infringing on the proprietary rights of others. While we take precautionary steps to protect our technological advantages and intellectual property and rely in part on patent, trademark, trade secret and copyright laws, we cannot assure that the precautionary steps we have taken will completely protect our intellectual property rights. Because patent applications in the United States are maintained in secrecy until either the patent application is published or a patent is issued, we may not be aware of third-party patents, patent applications and other intellectual property relevant to our products that may block our use of our intellectual property or may be used in third-party products that compete with our products and processes. In the event a competitor successfully challenges our products, processes, patents or licenses or claims that we have infringed upon their intellectual property, we could incur substantial litigation costs defending against such claims, be required to pay royalties, license fees or other damages or be barred from using the intellectual property at issue, any of which could have a material adverse effect on our business, operating results and financial condition.
In addition to our patent rights, we also rely on unpatented technology, trade secrets and confidential information. Others may independently develop substantially equivalent information and techniques or otherwise gain access to or disclose our technology. We may not be able to protect our rights in unpatented technology, trade secrets and confidential information effectively. We require each of our employees and consultants to execute a confidentiality agreement at the commencement of an employment or consulting relationship with us. However, these agreements may not provide effective protection of our information or, in the event of unauthorized use of disclosure, they may not provide adequate remedies.
Future asbestos claims could harm our business.
We are subject to potential liabilities relating to certain products we manufactured containing asbestos. To date, our insurance has covered claims against us relating to those products. Commencing November 1, 2003, insurance coverage for asbestos claims has been unavailable. However, we continue to have some insurance coverage for exposure to asbestos contained in our products prior to that date.
16
As a result of the endtermination of the NASA Space Shuttle program, manufacturing of rocket engine insulation material containing asbestos ceased in July 2010. In December 2011, we dismantled our facility used to manufacture the asbestos-based insulation for the Space Shuttle program. We have an agreement with the customer for indemnification for certain losses we may incur as a result of asbestos claims relating to a product we previously manufactured, but we cannot assure that this indemnification agreement will fully protect us from losses arising from asbestos claims.
To the extent we are not insured or indemnified for losses from asbestos claims relating to our products, asbestos claims could adversely affect our operating results and our financial condition.
15
Environmental laws and regulations may subject us to significant liability.
Our business and our facilities are subject to a number of federal, state, local and foreign laws, regulations and ordinances governing, among other things, the use, manufacture, storage, handling and disposal of hazardous materials and certain waste products. Among these environmental laws are rules by which a current or previous owner or operator of land may be liable for the costs of investigation, removal or remediation of hazardous materials at such property. In addition, these laws typically impose liability regardless of whether the owner or operator knew of, or was responsible for, the presence of any hazardous materials. Persons who arrange for the disposal or treatment of hazardous materials may be liable for the costs of investigation, removal or remediation of such substances at the disposal or treatment site, regardless of whether the affected site is owned or operated by them.
The California Attorney General’s office filed a complaint against Kirkhill-TA, a subsidiary included in our Advanced Materials segment, with the Superior Court of California, Orange County, on behalf of California and the Santa Ana Regional Water Quality Control Board (Board) regarding discharge of industrial waste water from its Brea, California, facility into Fullerton Creek and Craig Lake. The Company reached a settlement with the Board of $1.9 million, including legal costs, in 2011. The full amount is recorded on the balance sheet as an accrued liability.
Because we own and operate, and previously owned and operated, a number of facilities that use, manufacture, store, handle or arrange for the disposal of various hazardous materials, we may incur costs for investigation, removal and remediation, as well as capital costs, associated with compliance with environmental laws. At the time of our asset acquisition of the Electronic Warfare Passive Expendables Division of BAE Systems North America (BAE), certain environmental remedial activities were required under a Part B Permit issued to the infrared decoy flare facility by the Arkansas Department of Environmental Quality under the Federal Resource Conservation and Recovery Act. The Part B Permit was transferred to our subsidiary, Armtec, along with the remedial obligations. Under the terms of the asset purchase agreement, BAE Systems agreed to perform and pay for these remedial obligations at the infrared decoy flare facility up to a maximum amount of $25.0 million. BAE is currently conducting monitoring activities as required under the asset purchase agreement. Although environmental costs have not been material in the past, we cannot assure that these matters, or any similar liabilities that arise in the future, will not exceed our resources, nor can we completely eliminate the risk of accidental contamination or injury from these materials.
An accident at our combustible ordnance or flare countermeasure operations could harm our business.
We are subject to potential liabilities in the event of an accident at our combustible ordnance and flare countermeasure operations. Our products are highly flammable during certain phases of the manufacturing process. Accordingly, our facilities are designed to isolate these operations from direct contact with employees. Our overall safety infrastructure is compliant with regulatory guidelines. In addition, we utilize hazard detection and intervention systems. Our employees receive safety training and participate in internal safety demonstrations. We continuously track safety effectiveness in relation to the U.S. Bureau of Labor Statistics, OSHA, and the HSE in the U.K. to help ensure performance is within industry standards. In addition, we perform on-going process safety hazards analysis,hazard analyses, which isare conducted by trained safety teams to identify risk areas that arise. We monitor progress through review of safety action reports that are produced as part of our operations. Although we believe our safety programs are robust and our compliance with our programs is high, it is possible for an accident to occur. For example, an explosion occurred in 2006 at our Wallop facility in the U.K. (causing a fatality, several minor injuries, and extensive damage to the facility). We are insured in excess of our deductible on losses from property, loss of business, and for personal liability claims from an accident. Weaccident; however, we may not be able to maintain insurance coverage in the future at an acceptable cost. Significant losses not covered by insurance could have a material adverse effect on our business, financial condition, and results of operations.
We may be required to defend lawsuits or pay damages in connection with the alleged or actual harm caused by our products.
We face an inherent business risk of exposure to product liability claims in the event that the use of our products is alleged to have resulted in harm to others or to property. For example, our operations expose us to potential liabilities for personal injury or death as a result of the failure of an aircraft component that has been designed, manufactured or serviced by us. We may incur significant liability if product liability lawsuits against us are successful. While we believe our current general liability and product liability insurance is adequate to protect us from future product liability claims, we cannot assure that coverage will be adequate to cover all claims that may arise. Additionally, we may not be able to maintain insurance coverage in the future at an acceptable cost. Significant losses not covered by insurance or for which third-party indemnification is not available could have a material adverse effect on our business, financial condition and results of operations.
17
Our financial performance may be adversely affected by information technology business disruptions.
Our business may be impacted by information technology attacks or failures. Cybersecurity attacks, in particular, are evolving and include, but are not limited to, malicious software, attempts to gain unauthorized access to data, and other electronic security breaches that could lead to disruptions in systems, unauthorized release of confidential or otherwise protected information and corruption of data. We have experienced cybersecurity attacks in the past and may experience them in the future, potentially with more frequency. We have taken measures to mitigate potential risks to our technology and our operations from these information technology-related potential disruptions. For example, we utilized third-party software and tools at many domestic operating locations to scan incoming email for viruses and other harmful content and to scan networks maintained by certain of our domestic operating units that exclusively perform U.S. defense work. However, given the unpredictability of the timing, nature and scope of such disruptions, we could potentially be subject to production downtimes, operational delays, other detrimental impacts on our operations or ability to provide products and services to our customers, the compromising of confidential or otherwise protected information, destruction or corruption of data, security breaches, or other manipulation or improper use of our systems or networks. We may also experience financial losses from remedial actions, loss of business or potential liability under contracts or pursuant to regulations that require us to maintain confidential and other data securely, and/or damage to our reputation. Any of these consequences could have a material adverse effect on our competitive position, results of operations, cash flows or financial condition.
1618
Item 2. Properties
The following table summarizes our properties that are greater than 100,000 square feet or related to a principal operation, including identification of the business segment, as of October 28, 2011:25, 2013:
| | | | | | | | | | | | | | |
Location | | Type of Facility | | Business Segment | | Approximate
Square
Footage | | | Owned
or
Leased | | | |
| | | | | |
Brea, CA | | Office & Plant | | Advanced Materials | | | 329,000 | | | | Owned | | | |
Montréal, Canada | | Office & Plant | | Avionics & Controls | | | 269,000 | | | | Owned | | | |
East Camden, AR | | Office & Plant | | Advanced Materials | | | 262,000266,000 | | | | Leased | | | |
Stillington, U.K. | | Office & Plant | | Advanced Materials | | | 218,000222,000 | | | | Owned | | | |
Everett, WA | | Office & Plant | | Avionics & Controls | | | 216,000 | | | | Leased | | | |
Champagné, France | | Office & Plant | | Sensors & Systems | | | 171,000191,000 | | | | Owned | | | |
Coeur d’Alene, ID | | Office & Plant | | Avionics & Controls | | | 140,000 | | | | Leased | | | |
Coachella, CA | | Office & Plant | | Advanced Materials | | | 126,000140,000 | | | | Owned | | | |
Marolles, France | | Office & Plant | | Sensors & Systems | | | 124,000128,000 | | | | Owned | | | |
Buena Park, CA | | Office & Plant | | Sensors & Systems | | | 110,000 | | | | Owned* | | | |
Bourges, France | | Office & Plant | | Sensors & Systems | | | 109,000 | | | | Owned | | | |
Farnborough, U.K. | | Office & Plant | | Sensors & Systems | | | 103,000 | | | | Leased | | | |
Kent, WA | | Office & Plant | | Advanced Materials | | | 103,000 | | | | Owned | | | |
Hampshire, U.K. | | Office & Plant | | Advanced Materials | | | 102,000 | | | | Owned | | | |
Wenatchee, WA | | Office & Plant | | Sensors & Systems | | | 104,00096,000 | | | | Leased | | | |
Farnborough, U.K.
| | Office & Plant | | Sensors & Systems | | | 103,000 | | | | Leased | | | |
Hampshire, U.K.
| | Office & Plant | | Advanced Materials | | | 103,000 | | | | Owned | | | |
Kent, WA
| | Office & Plant | | Advanced Materials | | | 103,000 | | | | Owned | | | |
Milan, TN | | Office & Plant | | Advanced Materials | | | 96,000 | | | | Leased | | | |
Sylmar, CA | | Office & Plant | | Avionics & Controls | | | 96,000 | | | | Leased | | | |
Valencia, CA | | Office & Plant | | Advanced Materials | | | 88,000 | | | | Owned | | | |
Kanata, Canada | | Office & Plant | | Avionics & Controls | | | 81,00083,000 | | | | Leased | | | |
Gloucester, U.K. | | Office & Plant | | Advanced Materials | | | 59,000 | | | | Leased | | | |
* The building is located on a parcel of land covering 16.1 acres that is leased by the Company.
In total, we own approximately 2,100,0002,300,000 square feet and lease approximately 2,100,0002,000,000 square feet of manufacturing facilities and properties.
Item 3. Legal Proceedings
From time to time we are involved in legal proceedings arising in the ordinary course of our business. We believe we have adequately reservedadequate reserves for these liabilities have been made and that there is no litigation pending that could have a material adverse effect on our results of operations and financial condition.
We are subject to U.S. export laws and regulations, including the International Traffic in Arms Regulations (ITAR), that generally restrict the export of defense products, technical data, and defense services. We have filed voluntary reports that disclosed certain technical and administrative violations of the ITAR with the U.S. Department of State’s Directorate of Defense Trade Controls (DDTC) Office of Defense Trade Controls Compliance (DDTC Office of Compliance). To address these problems, we have made a number of investments in our export compliance functions, including: additional staffing, ongoing implementation of a new software system, employee training, and establishment of a regular compliance audit program and corrective action process. The DDTC Office of Compliance acknowledged our progress and continuing improvements, but nevertheless informed us that it intends to impose civil monetary fines and administrative sanctions based on the information it had concerning our earlier history in handling ITAR-controlled transactions, including the substance of our prior voluntary disclosures and other aspects of ITAR compliance errors. Management has been in discussions with the agency and provided supplemental information with the intent of reaching a settlement. On August 15, 2013, the DDTC Office of Compliance proposed a total penalty of $20 million, with $10 million suspended and eligible for offset credit based on verified expenditures for past and future remedial compliance measures. Based on this proposal, we estimated and recorded a $10 million charge as of July 26, 2013, for this matter. We have continued discussions with the DDTC Office of Compliance on final settlement terms, and the final settlement is subject to approval by the agency. While we cannot be certain of the outcome, management believes that the final resolution of this matter will not be materially different from our estimated accrual.
Item 4. Submission of Matters to a Vote of Security HoldersMine Safety Disclosures
No matter was submitted to a vote of security holders during the fourth quarter of the fiscal year ended October 28, 2011.
Not applicable.
1719
PART II
Item 5. Market for Registrant’s Common Equity, Related Stockholder Matters and Issuer Purchases of Equity Securities
Market Price of Esterline Common Stock
In Dollars
| | For Fiscal Years | | 2011 | | | 2010 | | | 2013 | | | | | 2012 | |
| | | High | | | Low | | | High | | | Low | | | High | | | Low | | | | | High | | | Low | |
| Quarter | | | | | | | | | | | | | | | | | | | | | | | | |
First | | $ 73.49 | | | | | $ 56.61 | | | | | $ 44.27 | | | | | $ 36.75 | | | $ | 69.16 | | | $ | 54.77 | | | | | $ | 62.35 | | | $ | 48.50 | |
Second | | 73.46 | | | | | 64.93 | | | | | 57.86 | | | | | 37.69 | | | | 77.90 | | | | 62.61 | | | | | | 76.86 | | | | 60.55 | |
Third | | 82.28 | | | | | 69.54 | | | | | 57.55 | | | | | 44.65 | | | | 83.87 | | | | 69.16 | | | | | | 70.47 | | | | 56.88 | |
Fourth | | 78.04 | | | | | 47.48 | | | | | 60.99 | | | | | 43.58 | | | | 85.30 | | | | 74.81 | | | | | | 60.85 | | | | 51.13 | |
| | | | |
Principal Market – New York Stock Exchange
At the end of fiscal 2011,2013, there were approximately 369295 holders of record of the Company’s common stock. On December 19, 2011,16, 2013, there were 359294 holders of record of our common stock.
No cash dividends were paid during fiscal 20112013 and 2010.2012. We are restricted from paying dividends under our current secured credit facility, and we do not anticipate paying any dividends in the foreseeable future.
The following graph shows the performance of the Company’s common stock compared to the S&P 500 Index, the S&P MidCap 400 Index, and the S&P 400 Aerospace & Defense Index for a $100 investment made on October 27, 2006.
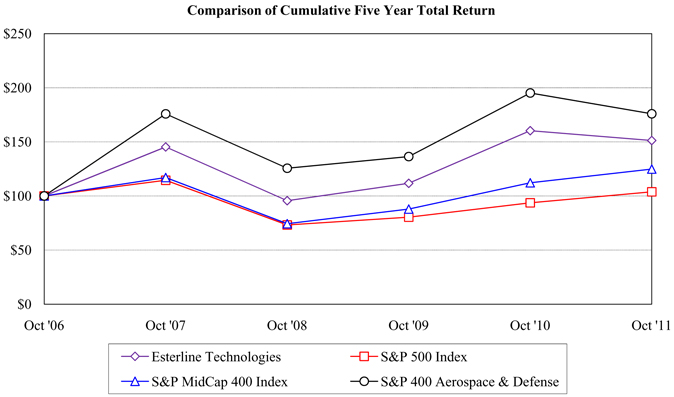
31, 2008.
18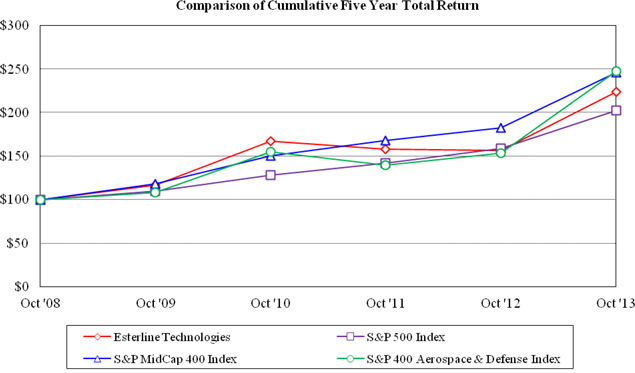
20
Item 6. Selected Financial Data
Selected Financial Data
In Thousands, Except Per Share Amounts
| | For Fiscal Years | | 2011 | | 2010 | | 2009 | | 2008 | | 2007 | | | 2013 | | | 2012 | | | 2011 | | | 2010 | | | 2009 | |
| Operating Results1 | | | | | | | | | | | | | | | | | | | | |
Net sales | | $ | 1,717,985 | | | $ | 1,526,601 | | | $ | 1,407,459 | | | $ | 1,462,196 | | | $ | 1,188,745 | | | $ | 1,969,754 | | | $ | 1,992,318 | | | $ | 1,717,985 | | | $ | 1,526,601 | | | $ | 1,407,459 | |
Cost of sales | | | 1,128,265 | | | | 1,010,390 | | | | 954,161 | | | | 981,934 | | | | 824,326 | | | | 1,243,758 | | | | 1,273,365 | | | | 1,128,265 | | | | 1,010,390 | | | | 954,161 | |
Selling, general
and administrative | | | 304,154 | | | | 258,290 | | | | 235,483 | | | | 234,451 | | | | 195,641 | | | | 391,147 | | | | 382,887 | | | | 304,154 | | | | 258,290 | | | | 235,483 | |
Research, development
and engineering | | | 94,505 | | | | 69,753 | | | | 64,456 | | | | 85,097 | | | | 65,438 | | | | 95,736 | | | | 107,745 | | | | 94,505 | | | | 69,753 | | | | 64,456 | |
Gain on sale of product
line | | | | (2,264 | ) | | | 0 | | | | 0 | | | | 0 | | | | 0 | |
Gain on settlement of
contingency | | | | 0 | | | | (11,891 | ) | | | 0 | | | | 0 | | | | 0 | |
Goodwill impairment | | | | 3,454 | | | | 52,169 | | | | 0 | | | | 0 | | | | 0 | |
Other (income) expense | | | (6,853 | ) | | | (8 | ) | | | 7,970 | | | | 86 | | | | 24 | | | | 0 | | | | (1,263 | ) | | | (6,853 | ) | | | (8 | ) | | | 7,970 | |
Insurance recovery | | | 0 | | | | 0 | | | | 0 | | | | 0 | | | | (37,467 | ) | |
Operating earnings from
continuing operations | | | | 237,923 | | | | 189,306 | | | | 197,914 | | | | 188,176 | | | | 145,389 | |
Interest income | | | (1,615 | ) | | | (960 | ) | | | (1,634 | ) | | | (4,373 | ) | | | (3,085 | ) | | | (539 | ) | | | (465 | ) | | | (1,615 | ) | | | (960 | ) | | | (1,634 | ) |
Interest expense | | | 40,216 | | | | 33,181 | | | | 28,689 | | | | 29,922 | | | | 35,298 | | | | 39,667 | | | | 46,238 | | | | 40,216 | | | | 33,181 | | | | 28,689 | |
Loss on extinguishment
of debt | | | 831 | | | | 1,206 | | | | 0 | | | | 0 | | | | 1,100 | | |
Gain on derivative
financial instrument | | | 0 | | | | 0 | | | | 0 | | | | (1,850 | ) | | | 0 | | |
Income from
continuing operations
before income taxes | | | 158,482 | | | | 154,749 | | | | 118,334 | | | | 136,929 | | | | 107,470 | | |
Earnings from
continuing operations
before income taxes | | | | 197,849 | | | | 143,533 | | | | 158,482 | | | | 154,749 | | | | 118,334 | |
| Income tax expense | | | 24,938 | | | | 24,504 | | | | 12,549 | | | | 25,288 | | | | 21,403 | | | | 30,085 | | | | 29,958 | | | | 24,938 | | | | 24,504 | | | | 12,549 | |
Income from continuing
operations including
noncontrolling interests | | | 133,544 | | | | 130,245 | | | | 105,785 | | | | 111,641 | | | | 86,067 | | |
Income (loss) from
discontinued operations
attributable to Esterline,
net of tax | | | (47 | ) | | | 11,881 | | | | 14,230 | | | | 9,275 | | | | 6,370 | | |
Earnings from continuing
operations including
noncontrolling interests | | | | 167,764 | | | | 113,575 | | | | 133,544 | | | | 130,245 | | | | 105,785 | |
Earnings (loss) from
discontinued operations
attributable to Esterline,
net of tax | | | | (1,300 | ) | | | 0 | | | | (47 | ) | | | 11,881 | | | | 14,230 | |
Net earnings attributable
to Esterline | | | 133,040 | | | | 141,920 | | | | 119,798 | | | | 120,533 | | | | 92,284 | | | | 164,734 | | | | 112,535 | | | | 133,040 | | | | 141,920 | | | | 119,798 | |
| Earnings per share
attributable to
Esterline – diluted: | | | | | | | | | | | |
Continuing operations | | $ | 4.27 | | | $ | 4.27 | | | $ | 3.52 | | | $ | 3.72 | | | $ | 3.27 | | |
Discontinued
operations | | | 0.00 | | | | 0.39 | | | | 0.48 | | | | 0.31 | | | | 0.25 | | |
Earnings per share
attributable to
Esterline – diluted | | | 4.27 | | | | 4.66 | | | | 4.00 | | | | 4.03 | | | | 3.52 | | |
| | |
Gross margin as a percent
of sales | | | | 36.9% | | | | 36.1% | | | | 34.3% | | | | 33.8% | | | | 32.2% | |
Selling, general and
administrative as a
percent of sales | | | | 19.9% | | | | 19.2% | | | | 17.7% | | | | 16.9% | | | | 16.7% | |
Research, development and
engineering as a
percent of sales | | | | 4.9% | | | | 5.4% | | | | 5.5% | | | | 4.6% | | | | 4.6% | |
21
Selected Financial Data
In Thousands, Except Per Share Amounts
| | | | | | | | | | | | | | | | | | | | |
| For Fiscal Years | | 2013 | | | 2012 | | | 2011 | | | 2010 | | | 2009 | |
| | | | | |
Operating Results1 | | | | | | | | | | | | | | | | | | | | |
Earnings (loss) per share
attributable to
Esterline – diluted: | | | | | | | | | | | | | | | | | | | | |
Continuing operations | | $ | 5.23 | | | $ | 3.60 | | | $ | 4.27 | | | $ | 4.27 | | | $ | 3.52 | |
Discontinued
operations | | | (.04 | ) | | | .00 | | | | .00 | | | | .39 | | | | .48 | |
Earnings (loss) per share
attributable to
Esterline – diluted | | | 5.19 | | | | 3.60 | | | | 4.27 | | | | 4.66 | | | | 4.00 | |
| |
| | | | | |
Financial Structure | | | | | | | | | | | | | | | | | | | | |
Total assets | | $ | 3,262,112 | | | $ | 3,227,117 | | | $ | 3,378,586 | | | $ | 2,587,738 | | | $ | 2,314,247 | |
Credit facilities | | | 130,000 | | | | 240,000 | | | | 360,000 | | | | 0 | | | | 0 | |
Long-term debt, net | | | 537,859 | | | | 598,060 | | | | 660,028 | | | | 598,972 | | | | 520,158 | |
Total Esterline
shareholders’ equity | | | 1,873,605 | | | | 1,610,481 | | | | 1,562,835 | | | | 1,412,796 | | | | 1,253,021 | |
| | | | | |
Weighted average shares
outstanding – diluted | | | 31,738 | | | | 31,282 | | | | 31,154 | | | | 30,477 | | | | 29,951 | |
| |
| | | | | |
Other Selected Data | | | | | | | | | | | | | | | | | | | | |
Cash flows provided
(used) by operating
activities | | $ | 250,772 | | | $ | 194,171 | | | $ | 192,429 | | | $ | 179,801 | | | $ | 156,669 | |
Cash flows provided
(used) by investing activities | | | (93,721 | ) | | | (48,502 | ) | | | (869,021 | ) | | | (20,719 | ) | | | (250,357 | ) |
Cash flows provided
(used) by financing activities | | | (141,023 | ) | | | (167,820 | ) | | | 436,420 | | | | 84,260 | | | | 103,515 | |
Net increase (decrease)
in cash | | | 18,503 | | | | (24,360 | ) | | | (237,085 | ) | | | 245,326 | | | | 16,149 | |
EBITDA from continuing
operations2 | | | 348,278 | | | | 295,221 | | | | 280,926 | | | | 257,815 | | | | 214,553 | |
Capital expenditures3 | | | 55,335 | | | | 49,446 | | | | 49,507 | | | | 45,417 | | | | 58,694 | |
Interest expense | | | 39,667 | | | | 46,238 | | | | 40,216 | | | | 33,181 | | | | 28,689 | |
| | | | | |
Depreciation and
amortization from
continuing operations | | | 110,355 | | | | 105,915 | | | | 83,012 | | | | 69,639 | | | | 69,164 | |
Ratio of debt to EBITDA4 | | | 2.0 | | | | 2.9 | | | | 3.7 | | | | 2.4 | | | | 2.5 | |
| |
| 1 | Operating results reflect the segregation of continuing operations from discontinued operations. See Note 21 to the Consolidated Financial Statements. Operating results include the acquisitions of Gamesman in February 2013, Souriau in July 2011, Eclipse in December 2010, and Racal Acoustics in January 2009, NMC in December 2008, and CMC Electronics, Inc. (CMC) in March 2007.2009. See Note 1514 to the Consolidated Financial Statements. |
19
Selected Financial Data
In Thousands, Except Per Share Amounts
| | | | | | | | | | | | | | | | | | | | |
| For Fiscal Years | | 2011 | | | 2010 | | | 2009 | | | 2008 | | | 2007 | |
| | | | | |
Financial Structure | | | | | | | | | | | | | | | | | | | | |
Total assets | | $ | 3,378,586 | | | $ | 2,587,738 | | | $ | 2,314,247 | | | $ | 1,922,102 | | | $ | 2,039,059 | |
Credit facilities | | | 360,000 | | | | 0 | | | | 0 | | | | 0 | | | | 0 | |
Long-term debt, net | | | 660,028 | | | | 598,972 | | | | 520,158 | | | | 388,248 | | | | 455,002 | |
Total Esterline
shareholders’ equity | | | 1,562,835 | | | | 1,412,796 | | | | 1,253,021 | | | | 1,026,341 | | | | 1,121,826 | |
| | | | | |
Weighted average shares
outstanding – diluted | | | 31,154 | | | | 30,477 | | | | 29,951 | | | | 29,908 | | | | 26,252 | |
| |
| | | | | |
Other Selected Data | | | | | | | | | | | | | | | | | | | | |
Cash flows provided
(used) by operating
activities | | $ | 192,429 | | | $ | 179,801 | | | $ | 156,669 | | | $ | 118,893 | | | $ | 121,724 | |
Cash flows provided
(used) by investing
activities | | | (869,021 | ) | | | (20,719 | ) | | | (250,357 | ) | | | (30,139 | ) | | | (382,340 | ) |
Cash flows provided
(used) by financing
activities | | | 436,420 | | | | 84,260 | | | | 103,515 | | | | (63,278 | ) | | | 361,914 | |
Net increase (decrease)
in cash | | | (237,085 | ) | | | 245,326 | | | | 16,149 | | | | 13,576 | | | | 104,431 | |
EBITDA from continuing
operations2 | | | 280,926 | | | | 257,815 | | | | 214,553 | | | | 223,443 | | | | 192,974 | |
Capital expenditures3 | | | 49,507 | | | | 45,417 | | | | 58,694 | | | | 38,785 | | | | 29,145 | |
Interest expense | | | 40,216 | | | | 33,181 | | | | 28,689 | | | | 29,922 | | | | 35,298 | |
| | | | | |
Depreciation and
amortization from
continuing operations | | | 83,012 | | | | 69,639 | | | | 69,164 | | | | 62,815 | | | | 52,191 | |
| |
| 2 | EBITDA from continuing operations is a measurement not calculated in accordance with GAAP. We define EBITDA from continuing operations as operating earnings from continuing operations plus depreciation and amortization (excluding amortization of debt issuance costs). We do not intend EBITDA from continuing operations to represent cash flows from continuing operations or any other items calculated in accordance with GAAP, or as an indicator of Esterline’s operating performance. Our definition of EBITDA from continuing operations may not be comparable with EBITDA from continuing operations as defined by other companies. We believe EBITDA is commonly used by financial analysts and others in the aerospace and defense industries and thus provides useful information to investors. Our management and certain financial creditors use EBITDA as one measure of our leverage capacity and debt servicing ability, and is shown here with respect to Esterline for comparative purposes. EBITDA is not necessarily indicative of amounts that may be available for discretionary uses by us. The following table reconciles operating earnings from continuing operations to EBITDA from continuing operations. |
22
Our management and certain financial creditors use EBITDA as one measure of our leverage capacity and debt servicing ability, and is shown here with respect to Esterline for comparative purposes. EBITDA is not necessarily indicative of amounts that may be available for discretionary uses by us. EBITDA includes goodwill impairment charges of $3,454 and $52,169 in fiscal 2013 and 2012, respectively. The following table reconciles operating earnings from continuing operations to EBITDA from continuing operations:
| | | | | | | | | | | | | | | | | | | | |
| In Thousands | | | | | | | | | | | | | | | |
| | | | | |
| For Fiscal Years | | 2013 | | | 2012 | | | 2011 | | | 2010 | | | 2009 | |
| | | | | |
Operating earnings from
continuing
operations | | $ | 237,923 | | | $ | 189,306 | | | $ | 197,914 | | | $ | 188,176 | | | $ | 145,389 | |
Depreciation and
amortization from
continuing operations | | | 110,355 | | | | 105,915 | | | | 83,012 | | | | 69,639 | | | | 69,164 | |
| |
EBITDA from continuing
operations | | $ | 348,278 | | | $ | 295,221 | | | $ | 280,926 | | | $ | 257,815 | | | $ | 214,553 | |
| |
| 3 | Excludes capital expenditures accounted for as a capitalized lease obligation of $11,691, $8,139 $28,202, and $7,981$28,202 in fiscal 2013, 2010, and 2009, and 2008, respectively. |
In Thousands
| | | | | | | | | | | | | | | | | | | | |
| For Fiscal Years | | 2011 | | | 2010 | | | 2009 | | | 2008 | | | 2007 | |
| | | | | |
Operating earnings from
continuing operations | | $ | 197,914 | | | $ | 188,176 | | | $ | 145,389 | | | $ | 160,628 | | | $ | 140,783 | |
Depreciation and
amortization from
continuing operations | | | 83,012 | | | | 69,639 | | | | 69,164 | | | | 62,815 | | | | 52,191 | |
| |
EBITDA from
continuing operations | | $ | 280,926 | | | $ | 257,815 | | | $ | 214,553 | | | $ | 223,443 | | | $ | 192,974 | |
| |
| 4 | We define the ratio of debt to EBITDA as total debt divided by EBITDA. |
2023
Item 7. Management’s Discussion and Analysis of Financial Condition and Results of Continuing Operations
The following discussion and analysis of our financial condition and results of operations should be read in conjunction with our financial statements and related notes in Item 8 of this report. This discussion and analysis contains forward-looking statements and estimates that involve risks, uncertainties and assumptions. Our actual results may differ materially from those anticipated in these forward-looking statements as a result of many factors, including, but not limited to, those discussed in the “Forward-Looking Statements” section in Item 1 of this report and the “Risk Factors” section in Item 1A of this report.
OVERVIEW
We operate our businesses in three segments: Avionics & Controls, Sensors & Systems and Advanced Materials. Our segments are structured around our technical capabilities. Sales in all segments include domestic, international, defense and commercial customers.
The Avionics & Controls segment includes avionics systems, control systems, interface technologies and communication systems, and interface technologies capabilities. Avionics systems designs and develops cockpit systems integration and avionics solutions for commercial and military applications. Control and communication systems designs and manufactures technology interface systems for military and commercial aircraft and land- and sea-based military vehicles. Interface technologies manufacturesAdditionally, control and develops custom control panels and input systems for medical, industrial, military and casino gaming industries. Communicationcommunication systems designs and manufactures military audio and data products for severe battlefield environments, embedded communication intercept receivers for signal intelligence applications, as well as communication control systems to enhance security and aural clarity in military applications. Interface technologies manufactures and develops custom control panels and input systems for medical, industrial, military and gaming industries.
The Sensors & Systems segment includes power systems, connection technologies and advanced sensors capabilities. Power systems develops and manufactures electrical power switching and other related systems, principally for aerospace and defense customers. Connection Technologiestechnologies develops and manufactures highly engineered connectors for harsh environments and serves the aerospace, defense & space, power generation, rail and industrial equipment markets. Advanced Sensorssensors develops and manufactures high precision temperature and pressure sensors for aerospace and defense customers.
The Advanced Materials segment includes engineered materials and defense technologies capabilities. Engineered materials develops and manufactures thermally engineered components and high-performance elastomer products used in a wide range of commercial aerospace and military applications. Defense technologies develops and manufactures combustible ordnance components and warfare countermeasure devices for military customers. Sales in all segments include domestic, international, defense and commercial customers.
Our current business and strategic plan focuses on the continued development of our products principally for aerospace and defense markets. We are concentrating our efforts to expand our capabilities in these markets and to anticipate the global needs of our customers and respond to such needs with comprehensive solutions. These efforts focus on continuous research and new product development, acquisitions and strategic realignments of operations to expand our capabilities as a more comprehensive supplier to our customers across our entire product offering.
On December 5, 2013, we announced the acceleration of our plans to consolidate certain facilities and create cost-efficiency through shared services in sales, general and administrative and support functions. We are currently launching integration activities in each segment and expect to record charges and expenses of approximately $40 million. We expect to incur costs of $25 million to $30 million in fiscal 2014 to support these efforts, with the balance to be incurred in fiscal 2015. The costs are mainly for severance, relocation of facilities and long-lived asset impairment losses. Expense savings on short-cycle activities will commence in fiscal 2014, with substantially more savings expected in fiscal 2015. We expect these projects to build to anticipated savings in excess of $15 million annually starting in fiscal 2016. The projects have payback periods of approximately two years.
On February 4, 2013, we acquired the Gamesman Group (Gamesman). Gamesman is a global supplier of input devices principally serving the gaming industry. Gamesman is included in the Avionics & Controls segment.
On July 26, 2011, the Companywe acquired the Souriau Group (Souriau). Souriau is a leading global supplier of highly engineered connection technologies for harsh environments. Souriau is included in our Sensors & Systems segment.
On December 30, 2010, the Company acquired Eclipse Electronic Systems, Inc. (Eclipse). Eclipse is a designer and manufacturer of embedded communication intercept receivers for signal intelligence applications. Eclipse is included in our Avionics & Controls segment.
On September 8, 2010, we sold Pressure Systems, Inc. (PSI), which was included in the Sensors & Systems segment. The results of PSI are accounted for as discontinued operations in the consolidated statement of operations. On November 3, 2008, we sold Muirhead Aerospace (Muirhead) and Traxsys Input Products Limited (Traxsys). Muirhead and Traxsys were included in the Sensors & Systems segment. The results of Muirhead and Traxsys are accounted for as discontinued operations in the consolidated statement of operations.
During the fourth fiscal quarter of 2011, income2013, earnings from continuing operations was $19.4were $66.2 million, or $0.62$2.07 per diluted share, compared with $49.3$61.7 million, or $1.60$1.97 per diluted share, in the prior-year period. The decrease in income from continuing operations reflected reduced operating earnings from Avionics & Controls and Sensors & Systems, increased operating earnings from Advanced Materials and the effect of Souriau acquisition-related expenses. The decrease in operating earnings of Avionics & Controls reflected lower sales and earnings of avionics systems and communication systems due to
2124
reduced requirements from defense customers, as well asSales during the timingfourth fiscal quarter of receiving orders and increased research, engineering and development expense. The decrease at Sensors & Systems reflected an operating loss at Souriau of $21.62013 were $534.2 million due primarily to the purchase accounting requirement to recognize the fair value of acquired inventory as expense over the first inventory turn. The increase at Advanced Materials reflected strong earnings from our engineered materials operations and a gain on sale of a facility, partially offset by decreased earnings of our defense technologies operations due to lower demand from countermeasures. Income from continuing operations was also impacted by higher interest expense and benefited from a lower income tax rate of 11.8% compared to 17.4%with $530.7 million in the prior-year period. Avionics & Controls segment sales increased 2.3% to $225.4 million from the prior-year period, mainly reflecting the Gamesman acquisition. Sensors & Systems sales increased 1.6% to $177.3 million and Advanced Materials sales decreased 3.2% to $131.5 million. Total sales were impacted by reductions in defense spending mainly due to the continued uncertainty of U.S. congressional budget cuts, or sequestration, on defense spending. The decreaseimpact of sequestration is yet to be fully determined, and additional reductions in defense spending over the income tax rate mainly reflected income tax benefits associated with the acquisition of Souriau and lower earningsnext decade could occur.
Gross margin in the fourth fiscal quarter of 2011.
During fiscal 2011, income from continuing operations2013 was $133.1 million or $4.27 per diluted share38.4% of sales compared with $130.0 million or $4.27 per diluted share during fiscal 2010, reflecting improved sales and earnings from Avionics & Controls and Advanced Materials and weaker results from Sensors & Systems. Sales and operating earnings were strong the first half of the year compared to38.5% in the prior-year periodperiod. Research, development and weaker in the second half of the year, principally reflecting reduced sales and earnings from our defense focused business operations and the operating loss of Souriau due to the inventory fair value adjustment noted above. Avionics & Controls reflected strong sales and earnings of avionics systems and control systems and weaker sales and earnings of communication systems and interface technologies. Sensors & Systems reflected improved sales and earnings of power systems and advanced sensors, partially offset by the operating loss of Souriau. Advanced Materials results reflected strong sales and earnings from engineered materials and weak performance from defense technologies, primarily due toengineering decreased demand for countermeasures.
The income tax rate for fiscal 2011 was 15.7% compared with 15.8% for fiscal 2010.
Net income in fiscal 2011 was $133.0$1.7 million or $4.27 per diluted share, compared with net income of $141.9 million or $4.66 per diluted share in fiscal 2010. Fiscal 2010 included income from discontinued operations of $0.39 per diluted share in fiscal 2010, reflecting the gain on the sale of PSI in September 2010.
Results of Continuing Operations
Fiscal 2011 Compared with Fiscal 2010
Sales for fiscal 2011 increased 12.5% over the prior year. Sales by segment were as follows:
| | | | | | | | | | |
| Dollars In Thousands | | Increase (Decrease)
From Prior Year | | 2011 | | | 2010 | |
| | | |
Avionics & Controls | | 6.6% | | $ | 841,939 | | | $ | 790,016 | |
Sensors & Systems | | 38.9% | | | 414,609 | | | | 298,559 | |
Advanced Materials | | 5.3% | | | 461,437 | | | | 438,026 | |
| |
Total | | | | $ | 1,717,985 | | | $ | 1,526,601 | |
| |
The $51.9 million or 6.6% increase in Avionics & Controls mainly reflected increased sales volumes of avionics systems of $25 million, control systems of $25 million, and communication systems of $6 million, mostly offset by decreased sales volumes of interface technologies systems. The increase in avionics systems principally reflected strong sales volumes of avionics products of $18.2 million. The increase in control systems reflected strong OEM and after-market sales and a $4.4 million retroactive price settlement due to product scope changes. The first six months of fiscal 2011 benefited from higher demand for after-market spares due to restocking of depleted inventory by our customers. During the second six months, demand levels for spares declined and more closely reflected the underlying activity of the flying fleet. Our after-market spares sales volume level for fiscal 2012 is forecasted to continue this trend. The increased sales of communication systems principally reflected $37.6 million in incremental sales from the Eclipse acquisition completed in the first fiscal quarter of 2011, partially offset by decreased sales of hearing protection headset devices due to uncertainty over the U.S. and U.K. military budgets. Avionics & Controls segment sales are expected to increase modestly to about $850 million in fiscal 2012, reflecting a strong commercial aerospace market, improved requirements for headsets and embedded communication intercept receivers for signal intelligence applications, higher requirements for input devices for medical applications, and partially offset by lower sales of avionics systems due to delayed orders for retrofits of military transport aircraft.
The $116.1 million or 38.9% increase in Sensors & Systems mainly reflected incremental sales from the Souriau acquisition in the third quarter of fiscal 2011 of $78 million and increased sales volumes of advanced sensors of $16 million and power systems of $22 million. The increase in advanced sensors sales mainly reflected strong aftermarket demand for
22
temperature and pressure sensors. The increase in power systems mainly reflected higher OEM and retrofit sales for commercial aviation. Induring the fourth fiscal quarter of 2011, Souriau’s sales were impacted by lower demand for industrial applications, which is expected2013 to continue in the first fiscal quarter4.3% of 2012sales. Selling, general and improve over the remaining three fiscal quarters of 2012 as sales for defense, nuclear, and other industrial applications increase. Segment sales in the second, third and fourth quarters of fiscal 2011 reflected a stronger pound sterling and euro compared to the U.S. dollar compared to the prior-year period, while sales in the first quarter of fiscal 2011 reflected a weaker pound sterling and euro relative to the U.S. dollar relative to the prior-year period. Sensors & Systems sales in fiscal 2012 are expected to be nearly $730administrative expense decreased $4.9 million in fiscal 2012, reflecting a full year of Souriau’s sales.
The $23.4 million or 5.3% increase in sales of Advanced Materials principally reflected a $33 million decrease in sales volumes of defense technologies and a $54 million increase in sales of engineered materials. The decrease in sales of defense technologies mainly reflected lower sales volumes of countermeasures, principally due to lower requirements from our non-U.S. customers. The increase in sales of engineered materials reflected strong demand for elastomer and insulation materials for commercial aerospace applications. Advanced Materials segment sales are expected to be nearly $480 million in fiscal 2012, reflecting strong commercial aerospace and energy markets and improved demand for non-U.S. flare countermeasures.
Foreign sales, including export sales by domestic operations, totaled $971.0 million and $860.0 million, and accounted for 56.5% and 56.3% of our sales in fiscal 2011 and 2010, respectively.
Overall, gross margin as a percentage of sales was 34.3% and 33.8% in fiscal 2011 and 2010, respectively. Gross profit was $589.7 million and $516.2 million in fiscal 2011 and 2010, respectively.
Avionics & Controls segment gross margin was 38.8% and 35.7% for fiscal 2011 and 2010, respectively. Segment gross profit was $326.5 million compared to $282.4 million in the prior-year period. About 70% of the net $44 million increase in segment gross profit was due to strong sales volume and improved gross margin on avionics systems. This reflects increased sales volumes of aviation products and higher gross margin on cockpit integration sales. Nearly 35% of the increase in segment gross profit reflected robust sales of control systems due to strong aftermarket demand and the $4.4 million retroactive price increase referenced above. Control systems gross profit was impacted by a $2.0 million charge induring the fourth fiscal quarter of 2011 for engineering costs not probable2013 to 17.3% of recovery from the customer. Eclipse’s gross profit was impacted by purchase accounting requirements resulting insales, mainly reflecting a $5.4 million inventory fair value adjustment and recognizing the adjustment as expense over the first inventory turn; approximately $2.0 million was recorded as an expense in the fourth fiscal quarterfavorable settlement of 2011. Interface technologies gross profit decreased by approximately $3.5 million, principally due to lower demand and gross margin for interface devices for casino gaming applications.
Sensors & Systems segment gross margin was 28.3% and 34.6% for fiscal 2011 and 2010, respectively. Segment gross profit was $117.4 million and $103.2 million for fiscal 2011 and 2010, respectively. Connection technologies reported only minimal gross profit, net of a $27.9 million inventory fair value adjustment, principally recognized in the fourth fiscal quarter of 2011. An additional $12.6 million in fair value adjustments will be recognized in the first fiscal quarter of 2012. Approximately 55% of the increase in segment gross profit was due to increased sales volumes of pressure sensors for OEM and aftermarket requirements. About 45% of the increase in segment gross profit was due to improved gross margin on power systems reflecting increased retrofit and OEM sales.
Advanced Materials segment gross margin was 31.6% and 29.8% for fiscal 2011 and 2010, respectively. Segment gross profit was $145.8 million and $130.6 million for fiscal 2011 and 2010, respectively. A $26 million increase in engineered materials gross profit was partially offset by a decrease in gross profit at our defense technologies operations. The increase in engineered materials gross profit was principally due to increased sales volumes of elastomer and insulation material for commercial aerospace applications. The decrease in gross profit of defense technologies mainly reflected lower sales volumes of countermeasures.
Selling, general and administrative expenses (which include corporate expenses) increased to $304.2 million in fiscal 2011 compared with $258.3 million in fiscal 2010. The $45.9 million increase reflected an increase of $9 million of corporate expense, $14 million at our Avionics & Controls segment, and $23 million at our Sensors & Systems segment. The $9 million increase at corporate primarily reflects Souriau acquisition-related expenses; approximately $1.4 million was incurred in the fourth fiscal quarter of 2011. The $14 million increase at Avionics & Controls reflects $8 million in incremental selling, general and administrative expenses related to the Eclipse acquisition. The $23 million increase at Sensors & Systems reflects $20 million in incremental selling, general and administrative expenses related to the Souriau acquisition. Selling, general and administrative expenses at Advanced Materials increased slightly compared to the prior-year period reflecting $1.9 million for an estimated liability for an environmental issue, $2.0 million in severance at our defense technologies operations and a $1.3 million expense principally related to the write-off of accounts receivable. These increases were principally offset by a $3.2 million gain on a sale of a facility and an insurance recovery in fiscal 2010.
23
Research, development and related engineering spending increased to $94.5 million, or 5.5% of sales, in fiscal 2011 compared with $69.8 million, or 4.6% of sales, in fiscal 2010. The $24.8 million increase in research, development and related engineering expense principally reflects $14 million in higher spending on avionics systems, $4 million on control systems and $4 million on communication systems.
In fiscal 2011 we benefited from $6.3 million in foreign currency exchange gains associated with funding the acquisition of Souriau.claim.
Segment earnings (operating earnings excluding corporate expenses and other income or expense) for the fourth quarter of fiscal 2011 were $45.1totaled $101.2 million, or 9.0%19.0% of sales, compared with $83.2$90.3 million, or 19.3%17.0% of sales, forin the prior-year period. The $38.1increase in segment earnings reflected improved operating earnings from Sensors & Systems and Advanced Materials, while Avionics & Controls earnings were even compared to the prior-year period. Avionics & Controls earnings in the fourth fiscal quarter of 2013 benefited from a gain on sale of a product line and recognition of previously deferred revenue. Operating earnings of Sensors & Systems increased due to improved gross margin and lower research, development and engineering expense. Advanced Materials earnings compared favorably to the prior-year period mainly reflecting a favorable settlement of an environmental claim and a recovery of non-recurring engineering expense from a customer. The income tax rate for the fourth fiscal quarter of 2013 was 20.4% compared to 13.0% in the prior-year period. Our income tax rate in the fourth fiscal quarter of 2012 was favorably impacted by a $1.4 million decreaserelease of valuation allowance related to foreign tax credits as a result of a tax examination.
Loss from discontinued operations for the fourth fiscal quarter of 2013 was $0.3 million or $0.01 per diluted share. There was no income or loss from discontinued operations in the prior-year period.
Net income for the fourth fiscal quarter of 2013 was $65.9 million, or $2.06 per diluted share, compared with $61.7 million, or $1.97 per diluted share, in the fourth fiscal quarter of 2012.
During fiscal 2013, earnings mainly reflectedfrom continuing operations was $166.0 million, or $5.23 per diluted share, compared with $112.5 million, or $3.60 per diluted share, during fiscal 2012. In fiscal 2013 we recorded a $3.5 million, or $0.11 per diluted share, impairment charge against goodwill of Racal Acoustics, Inc. (Racal Acoustics), our military headset business, which is included in our Avionics & Controls segment, due to continued weakness in Racal Acoustics’ fiscal 2013 and five-year forecast resulting from further delays and reductions in global defense programs. The results for fiscal 2013 also were impacted by a $10 million charge, or $0.32 per diluted share, related to our pending matter with the operating lossDDTC, as more fully discussed below. In the prior-year period, we recorded a $52.2 million, or $1.67 per diluted share, impairment charge against goodwill of SouriauRacal Acoustics. In fiscal 2012, all contingencies relating to a dispute between CMC Electronics, Inc. (CMC) and a former parent company were resolved, and accordingly, we recorded a gain of $21.6approximately $11.9 million principallyor $9.5 million after tax.
During fiscal 2013, sales declined 1.1% to $1.97 billion. Gross margin increased to 36.9%. Research, development and engineering decreased $12.0 million across all segments to 4.9% of sales. Selling, general and administrative expense increased $8.3 million to 19.9% of sales, mainly due to the fair value inventory adjustment noted above$10.0 million charge for the DDTC matter.
We are subject to U.S. export laws and partiallyregulations, including the International Traffic in Arms Regulations (ITAR), that generally restrict the export of defense products, technical data, and defense services. We have filed voluntary disclosure reports concerning certain technical and administrative violations of the ITAR with the U.S. Department of State’s Directorate of Defense Trade Controls (DDTC) Office of Defense Trade Controls Compliance (DDTC Office of Compliance). To address these problems, we have made a number of investments in our export compliance functions, including: additional staffing, ongoing implementation of a new software system, employee training, and establishment of a regular compliance audit program and corrective action process. The DDTC Office of Compliance acknowledged our progress and continuing improvements, but nevertheless informed us that it intends to impose civil monetary fines and administrative sanctions based on the information it had concerning our earlier history in handling ITAR-controlled transactions, including the substance of our prior voluntary disclosures and other aspects of ITAR compliance errors. Management has been in discussions with the agency and provided supplemental information with the intent of reaching a settlement. On August 15, 2013, the DDTC Office of Compliance proposed a total penalty of $20 million, with $10 million suspended and eligible for offset credit based on verified expenditures for past and future remedial compliance measures. Based on this proposal, we estimated and recorded a $10 million charge in fiscal 2013. We have continued discussions with the DDTC Office of Compliance on final settlement terms, and the final settlement is subject to approval by incremental earningsthe
25
agency. While we cannot be certain of Eclipsethe outcome, management believes that the final resolution of $2.3 million. this matter will not be materially different from our estimated accrual. Management believes that the additional expense associated with improving our compliance program will increase compliance cost about $10 million in fiscal 2014 compared to the prior-year period.
The income tax rate for fiscal 2013 was 15.2% compared with 20.9% for fiscal 2012, mainly reflecting the impact of fiscal 2012 expense associated with the Racal Acoustics impairment, which was not deductible for income tax purposes.
Loss from discontinued operations for fiscal 2013 was $1.3 million or $0.04 per diluted share. There was no income or loss from discontinued operations in the prior-year period.
Net income for fiscal 2013 was $164.7 million, or $5.19 per diluted share, compared with $112.5 million, or $3.60 per diluted share, for fiscal 2012.
Cash flows from operating activities were $250.8 million in fiscal 2013 compared to $194.2 million in the prior-year period.
Results of Operations
Fiscal 2013 Compared with Fiscal 2012
Sales for fiscal 2013 decreased 1.1% over the prior year. Sales by segment were as follows:
| | | | | | | | | | |
| In Thousands | | Increase (Decrease)
From Prior Year | | 2013 | | | 2012 | |
| | | |
Avionics & Controls | | (2.3)% | | $ | 771,657 | | | $ | 790,015 | |
Sensors & Systems | | (0.1)% | | | 701,930 | | | | 702,394 | |
Advanced Materials | | (0.7)% | | | 496,167 | | | | 499,909 | |
| |
Total | | | | $ | 1,969,754 | | | $ | 1,992,318 | |
| |
The $18.4 million, or 2.3% decrease alsoin Avionics & Controls mainly reflected weaker operating earnings at ourdecreased sales volumes of avionics systems and communications headset operations totaling $15of $12 million and defense technologies countermeasure operations totaling $8control and communication systems of $41 million, partially offset by stronger operating results at our engineered materials operationsan increase in sales volumes of $11 million. Avionicsinterface technologies. The decrease in avionics systems earnings in the fourth quarter were impacted by higher research and development expense andwas principally due to lower shipments of the integrated cockpit integration sales volumes for the T-6B military trainer compared to the same periods last year. The decrease at communication systems and defense technologies was due to lower demandretrofits for headsets and flare countermeasures, respectively, which reflect slower than expected order releases from our defense customers. Engineered materials operations benefited from strong demand for elastomer and insulation materials for commercial aerospace.military transport aircraft. The decrease in segment earnings alsocontrol and communication sales mainly reflected a $2.0$28 million write-offdecrease in sales of engineering costs at controls systems, a $1.1 million inventory and accounts receivable write-off at advanced sensors, a $2.0 million write-off of accounts receivable and inventory at defense technologies,communication intercept receivers for signal intelligence applications and a $0.6 million late delivery penalty at engineering materials, partially offset by a $3.2 million gain on the sale of an engineered material facility.
Segment earnings for fiscal 2011 were $240.0 million, or 14.0% of sales, compared with $228.6 million, or 15.0% of sales, for fiscal 2010. Avionics & Controls segment earnings were $135.2 million or 16.1% of sales in fiscal 2011 compared with $125.9 million or 15.9% of sales in fiscal 2010, mainly reflecting a $12 million increase in avionics systems, a $9 million increase in control systems, a $10.0$7 million decrease in communication systems to enhance security and a $2aural clarity in military communication applications. The increase in interface technologies was principally due to incremental sales from the Gamesman acquisition.
Sensors & Systems sales were even with the prior-year period. A $6 million decrease in interface technologies. sales of advanced sensors was offset by an equal increase in power systems sales. The decrease in advanced sensors sales reflected lower OEM and aftermarket sales. The increase in power systems sales principally reflected retrofit sales. Connection technologies sales were even with the prior-year period reflecting a weaker euro relative to the U.S. dollar compared to the prior-year period. Strong sales of connection technologies for commercial aviation were offset by weaker sales for industrial equipment and defense applications.
The $3.7 million, or 0.7% decrease, in sales of Advanced Materials principally reflected lower sales volumes of combustible ordnance reflecting the impact from sequestration, partially offset by higher international sales of flare countermeasures.
Foreign sales originating from non-U.S. locations, including export sales by domestic operations, totaled $1.2 billion in both fiscal 2013 and 2012, and accounted for 59.5% and 59.2% of our sales in fiscal 2013 and 2012, respectively.
Overall, gross margin as a percentage of sales was 36.9% and 36.1% in fiscal 2013 and 2012, respectively. Gross profit was $726.0 million and $719.0 million in fiscal 2013 and 2012, respectively.
Avionics & Controls segment gross margin was 38.5% and 39.5% for fiscal 2013 and 2012, respectively. Segment gross profit was $296.9 million compared to $311.7 million in the prior-year period. The decrease in gross profit mainly reflected lower sales of communication intercept receivers for signal intelligence applications and communication systems to enhance security and aural clarity in military communication applications.
26
Sensors & Systems segment gross margin was 37.4% and 34.8% for fiscal 2013 and 2012, respectively. Segment gross profit was $262.8 million and $244.6 million for fiscal 2013 and 2012, respectively. The increase in gross profit was mainly due to increased gross profit in connection technologies, reflecting a $12 million charge recorded in the first quarter of fiscal 2012 due to recording Souriau’s acquired inventory at its fair value. Segment gross profit also benefited from strong retrofit sales of power systems.
Advanced Materials segment gross margin was 33.5% and 32.5% for fiscal 2013 and 2012, respectively. Segment gross profit partially offset by a $14was $166.2 million and $162.7 million for fiscal 2013 and 2012, respectively. The increase in research, developmentgross profit was principally due to higher sales of elastomer materials primarily for defense applications.
Selling, general and engineering expense and a $5.0administrative expenses (which include corporate expenses) increased to $391.2 million, or 19.9% of sales, in fiscal 2013 compared with $382.9 million, or 19.2% of sales, in fiscal 2012. The $8.3 million increase in selling, general and administrative expenses reflecting increased bid and proposal expense and incentive compensation. Control systems benefited from increased gross profit, partially offset byreflects a $4$19 million increase in research, engineeringcorporate expense, a $5.1 million reduction in Avionics & Controls and development, net of a $1.1an $8.7 million recovery of non-recurring engineeringreduction in Advanced Materials expense. The increase in corporate expense upon settlement withwas mainly due to the customer.$10 million loss contingency related to the DDTC matter, professional fees for regulatory compliance and expenses related to our European headquarters. The decrease in Avionics & Controls expense reflected a $1 million reduction of our allowance for doubtful accounts for Hawker Beechcraft; in addition, the prior-year period reflected bad debt expense of $2.3 million due to the bankruptcy of Hawker Beechcraft. The $8.7 million decrease in Advanced Materials mainly reflected recovery of a prior-year $2.4 million estimated liability for an environmental claim. The claim was settled in fiscal 2013 for $0.5 million and fully indemnified by the prior owner of the business. Advanced Materials selling, general and administrative expenses were also lower due to decreased legal, bad debt and severance expenses.
Research, development and related engineering spending decreased to $95.7 million, or 4.9% of sales, in fiscal 2013 compared with $107.7 million, or 5.4% of sales, in fiscal 2012. The decrease in research, development and engineering spending principally reflects lower spending on avionics systems.
Segment earnings for fiscal 2013 were $300.1 million, or 15.2% of sales, compared with $219.4 million, or 11.0% of sales, for fiscal 2012. The increase in segment earnings reflects the $52.2 million impairment charge against goodwill of Racal Acoustics in fiscal 2012. We also recorded an impairment charge of $3.5 million against goodwill of Racal Acoustics in the third fiscal quarter of 2013. If the impairment charges in each period in fiscal 2013 and 2012 are excluded, segment earnings totaled $303.5 million, or 15.4% of sales, and $271.5 million, or 13.6% of sales, for fiscal 2013 and 2012, respectively.
Avionics & Controls segment earnings were $103.2 million, or 13.4% of sales, in fiscal 2013 compared with $54.9 million, or 7.0% of sales, in fiscal 2012. Excluding the impairment charges in both fiscal 2013 and 2012 referred to above, segment earnings were $106.7 million, or 13.8% of sales, and $107.1 million, or 13.6% of sales, in fiscal 2013 and 2012, respectively. Control and communication systems earnings decreased $12 million mainly reflecteddue to decreased gross profit from lower sales of certain communication systems for audio and data products for severe battlefield environments, resulting in a $14 million decrease in communication systems earnings, partially offset by incremental income from the Eclipse acquisition. We expect that segment operating earnings will be about 16% of sales on sales of $850 million for fiscal 2012, reflecting a strong commercial aerospace market and improved sales and profits from sales of headset devices and embedded communication intercept receivers for signal intelligence applications. Avionics systems earnings increased from the prior period reflecting decreased research, development and engineering expense of $7 million. Segment earnings also benefited from a $2.3 million gain on sale of a product line and certain contractual recoveries of non-recurring engineering expense.
Sensors & Systems segment earnings were $22.5$89.7 million, or 5.4%12.8% of sales, in fiscal 20112013 compared with $33.9$70.9 million, or 11.4%10.1% of sales, in fiscal 2010, principally2012, reflecting a $6.6the $12.0 million increasecharge in advanced sensors and a $4.5 million increase in2012 due to recording Souriau’s acquired inventory at its fair value. Sensors & Systems earnings also benefited from increased earnings of power systems both operations benefiting from increasedimproved gross profit. Souriau incurred an operating loss of $22.4 million, principally reflecting the inventory fair value adjustment referenced above. As noted above, Souriau’s operating results will be impacted by a $12.6 million fair value inventory adjustment in the first fiscal quarter of 2012. We expect that segment earnings will be nearly 10% of sales on sales of $730.0 million, reflecting a strong commercial aerospace market, stronger demand for connectors for industrial applications in the second half of the fiscal year and fully recognizing the fair value inventory adjustment related to the Souriau acquisition in the first fiscal quarter of 2012.margin.
Advanced Materials segment earnings were $82.3$107.2 million, or 17.8%21.6% of sales, in fiscal 20112013 compared with $68.8$93.5 million, or 15.7%18.7% of sales, in fiscal 2010,2012, primarily reflecting increased earnings from sales of engineered materials of $7 million, partially offset by a $15 million decrease inweaker earnings from sales of defense technologies. The increase in engineered materials principallyearnings reflected the increase in gross profit, a $3.2 million gain on sale of a facility, partially offset by a $1.9 million increase in an estimated liability for an environmental issue. Defense technologies principally reflected a $19 million decrease in earnings for countermeasures operations and increased earnings of combustible ordnance. The decrease in earnings for countermeasures mainly reflected the decrease in gross profit and certain charges inprofit.
In the fourth fiscal quarter of 2011 totaling $2.0fiscal 2013, we sold a product line in our Avionics & Controls segment and realized a $2.3 million consisting principally of a write-off of an accounts receivable of $0.8 million and $0.5 million in inventory. Also, $2.0 million in severance was recorded ingain.
In the third fiscalsecond quarter of 2011. We expect that segment earnings will be nearly 18%fiscal 2012, all contingencies relating to a dispute between CMC and a former parent company were resolved, and accordingly, we recorded a gain of sales on sales of about $480approximately $11.9 million reflecting a strong commercial aerospace market and improved sales and profitability from sales of international flare countermeasures.or $9.5 million after tax.
24
Interest expense increaseddecreased to $40.2$39.7 million during fiscal 20112013 compared with $33.2$46.2 million in the prior year, reflecting higherlower borrowings.
27
The income tax rate for fiscal 20112013 was 15.7%15.2% compared with 15.8%20.9% in fiscal 2010.2012. The tax rate was lower than the statutory rate, as both years benefited from various tax credits and certain foreign interest expense deductions. During fiscal 2011,2013, we recognized $11.4$12.7 million of discrete income tax benefits as a result ofprincipally related to the following items: $3.1items. The first item was approximately $1.5 million of income tax benefits due to the retroactive extension of the U.S. federal research and experimentation credits and the releasecredits. The second item was approximately $2.5 million of a valuation allowancetax benefits related to a net operating lossthe settlement of an acquired subsidiary; $5.6 million of incomeU.S. and foreign tax benefits associated with net operating losses of an acquired subsidiary as a result of concluding a tax examination; $3.5 million of net reduction of deferred income tax liabilities as a result of enactment of income tax laws reducing the U.K. statutory income tax rate; and $0.8 million of income tax expense as a result of reconciling the prior-year’s income tax returns to the prior year’s provision for income tax. We expect the income tax rate to be approximately 20% in fiscal 2012.
In fiscal 2010, we recognized $11.0 million in net discrete tax benefits.examinations. The $11.0 million discrete tax benefits were the result of four events. The first eventthird item was a $7.6$4.9 million tax benefit as a result ofrelated to the release of tax reserves for uncertain tax positions mainly associated with losses on the disposition of assets. This release of tax reserves resulted fromdue to the expiration of a statute of limitations. The second eventfourth item was a $1.7$3.8 million net reduction inof net deferred income tax liabilities which was theas a result of the enactment of tax laws reducing the U.K. statutory income tax rate. The third event was a $0.8
In fiscal 2012, we recognized $8.7 million tax expense related to tax liabilities associated with an examination of the U.S. federal and statediscrete income tax returns. The fourth event was a $2.5 million reduction of valuation allowances related to acquired net operating losses and foreign tax credits that were generated in prior years.
The income tax rate differed from the statutory rate in fiscal 2011 and 2010, as both years benefited from various tax credits and certain foreign interest expense deductions.
It is reasonably possible that within the next 12 months approximately $0.8 million of tax benefits associated with research and experimentation tax credits, capital and operating losses that are currently unrecognized could be recognized as a result of the following items. The first item was a $2.3 million tax benefit due to a change in French tax laws associated with the holding company structure and the financing of the Souriau acquisition. The second item was a $2.9 million reduction of the U.K. statutory income tax rate. The third item was a $2.1 million tax benefit as a result of reconciling the prior-year’s income tax return to the U.S. income tax provision and settlement of examinations and/or the expirationtax examinations. The fourth item was a $1.4 million release of a statutevaluation allowance related to foreign tax credits as a result of limitations.a tax examination.
We expect the income tax rate to be in the range of 21% to 22% in fiscal 2014.
To the extent that sales are transacted in a currency other than the functional currency of the operating unit, we are subject to foreign currency fluctuation risk.
We use forward contracts to hedge our foreign currency exchange risk. To the extent that these hedges qualify under U.S. GAAP, the amount of gain or loss is deferred in Accumulated Other Comprehensive Income (AOCI) until the related sale occurs. Also, we are subject to foreign currency gains or losses from embedded derivatives on backlog denominated in a currency other than the functional currency of our operating companies or its customers. Gains and losses on forward contracts, embedded derivatives, and revaluation of assets and liabilities denominated in a currency other than the functional currency of the Company for fiscal 20112013 and 2010 are2012 were as follows:
(In thousands)Thousands
Gain (Loss)
| | | | | | | | |
| | | 2011 | | | 2010 | |
| | |
Forward foreign currency contracts – loss | | $ | (941 | ) | | $ | (139 | ) |
Forward foreign currency contracts – reclassified from AOCI | | | 10,092 | | | | 11,042 | |
Embedded derivatives – gain (loss) | | | 906 | | | | (1,476 | ) |
Revaluation of monetary assets/liabilities – gain (loss) | | | 4,174 | | | | (3,282 | ) |
| |
Total | | $ | 14,231 | | | $ | 6,145 | |
| |
| | | | | | | | |
| | | 2013 | | | 2012 | |
| | |
Forward foreign currency contracts | | $ | 2,559 | | | $ | (5,735 | ) |
Forward foreign currency contracts – reclassified from AOCI | | | (1,024 | ) | | | 784 | |
Embedded derivatives | | | 755 | | | | 426 | |
Revaluation of monetary assets/liabilities | | | (4,016 | ) | | | 981 | |
| |
Total | | $ | (1,726 | ) | | $ | (3,544 | ) |
| |
New orders for fiscal 20112013 were $1.9 billion compared with $1.6$2.1 billion for fiscal 2010.2012. Orders by segment for fiscal 2013 decreased for our Avionics & Controls and Advanced Materials segments compared to the prior-year period and increased across allfor Sensors & Systems compared to the prior-year period. The decrease in orders for Avionics & Controls and Advanced Materials was mainly due to the effects of our segments, principally reflecting the acquired backlog of Eclipse and Souriau and partially offset by order declines for avionics systems, certain communication systems and defense technologies.sequestration. Backlog at the end of fiscal 20112013 and 2012 was $1.3 billion compared with $1.1 billion at the end of the prior year.billion. Approximately $352.8$332 million is scheduled to be delivered after fiscal 2012.2014. Backlog is subject to cancellation until delivery.
2528
Fiscal 20102012 Compared with Fiscal 20092011
Sales for fiscal 20102012 increased 8.5%16.0% over the prior year. Sales by segment were as follows:
| | | | | | | | | | | | | | | | |
| Dollars In Thousands | | Increase (Decrease)
From Prior Year | | 2010 | | 2009 | | |
| In Thousands | | | Increase (Decrease)
From Prior Year | | 2012 | | | 2011 | |
| Avionics & Controls | | 17.4% | | $ | 790,016 | | | $ | 672,828 | | | (6.2)% | | | $ 790,015 | | | | $ 841,939 | |
Sensors & Systems | | (7.2)% | | | 298,559 | | | | 321,753 | | | 69.4% | | | 702,394 | | | | 414,609 | |
Advanced Materials | | 6.1% | | | 438,026 | | | | 412,878 | | | 8.3% | | | 499,909 | | | | 461,437 | |
| | | | |
Total | | | | $ | 1,526,601 | | | $ | 1,407,459 | | | | | | $ 1,992,318 | | | | $ 1,717,985 | |
| | | | |
The 17.4% increase$51.9 million, or 6.2% decrease, in Avionics & Controls mainly reflected increaseddecreased sales volumes of avionics systems of $71.9 million, interface technologies systems of $27.0$64 million and communication systems offset by an increase in sales volumes of $22.2 million.control systems. The decrease in avionics systems was principally due to lower cockpit integration sales volumes for the T-6B military trainer and retrofits for military transport aircraft. The decrease in sales for the T-6B was due the bankruptcy filing of Hawker Beechcraft. The decrease in segment sales also reflected a $16 million decrease in sales of hearing protection headsets due to reduced demand and order delays, of which about 50% was offset by higher sales of communication intercept receivers for signal intelligence applications. The increase in avionicscontrol systems principally reflected strong cockpit integration sales volumes.was mainly due to higher sales to OEM customers. The prior-year period benefited from a $4.4 million retroactive price settlement due to product scope changes.
The $287.8 million, or 69.4% increase, in interface technologies systems mainly reflected increased sales volumes of input devices for casino gaming and medical applications. The increased sales of communication systemsSensors & Systems principally reflected $16.9 million in incremental sales from the Racal AcousticsSouriau acquisition completed in the first fiscal quarter of 2009. These increases were partially offset by lower$250 million and increased sales volumes of control systems of $4.1 million, principally cockpit controls for commercial and military applications.
The 7.2% decrease in Sensors & Systems mainly reflected decreased sales volumesvolume of advanced sensors of $10.3 million and power systems of $12.9$36 million. The decreaseAbout 60% of the increase in advanced sensors principally reflected lower OEM sales volumes of temperature and pressure sensors due to the downturn in commercial aviation and in particular business jets. Additionally, fiscal 2009 benefited from a $1.8 million retroactive price adjustment and settlement with certain customers. The decrease in power systems sales wasreflected increased sales of power systems due to the downturn inhigher demand for commercial aviation and was partially offset by a $3.7 millionproducts. The increase in retrofitadvanced sensors reflected higher OEM sales and strong aftermarket demand for commercial aviation.aerospace and industrial customers. Sales in the first six months of fiscal 20102012 reflected a stronger pound sterling andweaker euro relative to the U.S. dollar and a weaker pound sterling and euro relative tocompared with the U.S. dollar during the second six months of the fiscal year.prior-year period.
The 6.1%$38.5 million, or 8.3% increase, in sales of Advanced Materials principally reflected an increase inincreased sales volumes of engineered materials of $40 million, partially offset by decreased sales volumes of defense technologies. The increase in engineered materials primarily reflected strong demand for elastomer and insulation materials for commercial aviation products. The decrease in defense technologies andprincipally reflected a decrease in sales of engineered materials. The increase in sales of defense technologies mainly reflected higher sales volumes of countermeasures of $36.5 million, principally related to low sales volume in the prior-year periodnon-U.S. countermeasure flares due to thereduced demand and order delays in the processing of and scheduling shipments of our international customers. The $10.9 million decrease in sales of engineered materials reflectedas well as lower demand for elastomer materials due to the downturn in commercial aviation and industrial commercial markets.combustible ordnance.
Foreign sales originating from non-U.S. locations, including export sales by domestic operations, totaled $860.0 million$1.2 billion and $788.8$971.0 million, and accounted for 56.3%59.2% and 56.0%56.5% of our sales in fiscal 20102012 and 2009,2011, respectively.
Overall, gross margin as a percentage of sales was 33.8%36.1% and 32.2%34.3% in fiscal 20102012 and 2009,2011, respectively. Gross profit was $516.2$719.0 million and $453.3$589.7 million in fiscal 20102012 and 2009,2011, respectively.
Avionics & Controls segment gross margin was 35.7%39.5% and 35.4%38.8% for fiscal 20102012 and 2009,2011, respectively. Segment gross profit was $282.4$311.7 million compared to $238.5$326.5 million in the prior-year period. About 60% of the increaseThe decrease in segment gross profit was mainly due to stronglower sales of avionics systems, reflecting increased sales volumes of cockpit integration for the T-6B military trainer cockpit and aretrofits of military transport cockpit retrofit program. The remaining 40% increase in segment gross profit reflected strong sales volumes of interface technologies systems and communication systems,aircraft, partially offset by an $8.7 million decrease in control systems. The increase in interface technologiesincreased gross profit is due to higher sales volumes of input devices for casino gaming applications and higher sales volumes for medical applications. The increase in communication systems gross profit mainly reflects incremental gross profit from the acquisition of Racal Acoustics in the first fiscal quarter of 2009. The decrease in gross profit on control systems is mainly due to weaker gross margin of controls for commercial and military applications, as well as higher operating costs from our new control systems facility.avionics software testing business.
Sensors & Systems segment gross margin was 34.6%34.8% and 32.3%28.3% for fiscal 20102012 and 2009,2011, respectively. Segment gross profit was $103.2$244.6 million and $104.0$117.4 million for fiscal 20102012 and 2009,2011, respectively. The declineApproximately 10% of the increase in gross profit is principally due toreflected strong demand for power systems for commercial aviation applications. Approximately 85% of the effect of a decrease in advanced sensors sales volume in fiscal 2010, partially offset by an increase in gross margin. The increase in gross marginprofit was mainly due to incremental gross profit from the Souriau acquisition. Souriau’s gross profit was impacted by a $1.2$12 million charge in the first fiscal quarter of 2012 due to recording Souriau’s acquired inventory at its fair value. The prior-year period included a $27.9 million inventory write-offfair value adjustment, recognized principally in the fourth fiscal 2009. Power systems gross profit improved slightly due to retrofits for commercial aviation applications and strong cost control, partially offset by lower sales volumes.quarter of 2011.
26
Advanced Materials segment gross margin was 29.8%32.5% and 26.9%31.6% for fiscal 20102012 and 2009,2011, respectively. Segment gross profit was $130.6$162.7 million and $110.9$145.8 million for fiscal 20102012 and 2009, respectively,2011, respectively. The increase in gross profit was principally due to higher sales of elastomer materials and insulation materials primarily for commercial aviation applications. Gross profit on defense technologies increased slightly, principally reflecting an increase in defense technologies offset by a small decrease in engineered materials. The increased gross profit and margin on defense technologies reflected a $23.5 million increase onflare countermeasures, partially offset by decreasedlower gross profit on combustible ordnance. The increase in gross profit on countermeasures was principallyordnance due to decreased sales volume with additional benefits from improved sales mix and efficiency from longer production runs. Fiscal 2009 countermeasures gross profit was impacted by delays in the processing of and scheduling shipments of our international customers. The decrease in gross profit on engineered materials principally reflected $2.3 million in costs associated with closing a facility.volumes.
29
Selling, general and administrative expenses (which include corporate expenses) increased to $258.3$382.9 million, or 19.2% of sales, in fiscal 20102012 compared with $235.5$304.2 million, or 17.7% of sales, in fiscal 2009.2011. The increase in selling, general and administrative expense principally reflected a $65.1 million increase in selling, general and administrative expense at our Sensors & Systems segment due to incremental selling, general and administrative expense from the acquisition of Racal AcousticsSouriau acquisition. Selling, general and NMC of $5.8administrative expense increased $19.4 million at Avionics & Controls and Advanced Materials. This increase reflects a $9.1$2.8 million increase in corporate expense mainlybad debt due to incentive compensation and professional fees, and the effectbankruptcy filing of exchange rates on operating expenses at our non-U.S. operations of $4.7 million. As a percentage of sales,Hawker Beechcraft, $5 million in incremental selling, general and administrative expenses were 16.9%expense from the Eclipse acquisition, and 16.7%$4.3 million in severance costs. Corporate expense decreased $5.8 million from fiscal 2010 and 2009, respectively.2011, principally reflecting lower acquisition-related expenses.
Research, development and related engineering spending increased to $69.8$107.7 million, or 4.6%5.4% of sales, in fiscal 20102012 compared with $64.5$94.5 million, or 4.6%5.5% of sales, in fiscal 2009.2011. The $13.2 million increase in research, development and related engineering expense principally reflects $2.4 million in higherthe incremental spending on communication systems and $2.1of $9 million on controlconnection technologies reflecting a full-year impact due to the acquisition of Souriau and $6 million on power systems.
Segment earnings (which exclude corporate expenses and other income and expense) increased 23.8% duringfor fiscal 2010 to $228.62012 were $219.4 million, compared to $184.7 million in the prior year. Segment earnings as a percentor 11.0% of sales, were 15.0% and 13.1%compared with $240.0 million, or 14.0% of sales, for fiscal 2011. The decrease in segment earnings reflects the $52.2 million impairment charge against goodwill of Racal Acoustics. If the impairment charge is excluded, segment earnings totaled $271.5 million, or 13.6% of sales, for fiscal 2010 and 2009, respectively.2012.
Avionics & Controls segment earnings were $125.9$54.9 million, or 15.9%7.0% of sales, in fiscal 20102012 compared with $99.3$135.2 million, or 14.8%16.1% of sales, in fiscal 2009, principally reflecting2011. Excluding the $52.2 million impairment charge, segment earnings were $107.1 million, or 13.6% of sales, in fiscal 2012. The decrease in segment earnings from the prior-year period reflects a $20.3$22 million increasedecrease in avionics systems. Avionics systems benefited from strong gross profit, partially offset byearnings and a $4.7 million increase in selling, general and administrative expenses, principally due to the effects of foreign currency exchange rates. Segment earnings also benefited from increased earnings of interface technologies systems and communication systems of $15.3 million and were partially offset by a $9.0$5 million decrease in control systems. Interface technologies benefited from strong gross profit from sales of input devices for casino gaming and medical applications. The increase in communication systems earnings was due to incremental earnings from the Racal Acoustics acquisition of $1.5 million and improved gross margin. Controlearnings. Avionics systems earnings were impacted by decreased gross profit and $4.1a $2.3 million bad debt expense due to the bankruptcy of Hawker Beechcraft, partially offset by a decrease in increasedspending on research, development costs.and engineering. Control systems earnings were impacted by an increase in research, development and engineering expense. Additionally, the second fiscal quarter of 2011 benefited from a $1.1 million recovery of non-recurring engineering expense upon settlement with a customer of control systems.
Sensors & Systems segment earnings were $33.9$70.9 million, or 11.4%10.1% of sales, in fiscal 20102012 compared with $31.7$22.5 million, or 9.9%5.4% of sales, in fiscal 2009, mainly2011, principally reflecting a $1.2$40 million decrease in incremental earnings from the Souriau acquisition and increases in sales in both power systems and advanced sensorssensors. Souriau incurred an operating loss of $22.4 million in fiscal 2011 principally reflecting the inventory fair value adjustment referenced above. Power systems benefited from increased gross profit,profits, partially offset by decreased selling, generalhigher research, development and administrative expenses, principallyengineering spending. Advanced sensors benefited from increased gross profits mainly due to the $3.0higher aftermarket demand and a $1.9 million impairmentrecovery of non-recurring engineering and higher French tax credits on a subsidiary trade name recorded in fiscal 2009.research, development and engineering expense.
Advanced Materials segment earnings were $68.8$93.5 million, or 15.7%18.7% of sales, in fiscal 20102012 compared with $53.6$82.3 million, or 13.0%17.8% of sales, in fiscal 2009,2011, primarily reflecting a $21.4 million increase in defense technologies, partially offset by decreasedincreased earnings from sales of engineered materials. Defensematerials of $9 million and improved earnings from sales of defense technologies. The increase in engineered materials earnings reflected the increase in gross profit. The prior-year period benefited from a $3.2 million gain on sale of a facility, partially offset by a $1.7 million increase in an estimated liability for an environmental issue, which was paid in fiscal 2012. The improvement in results for defense technologies principally reflected a $24.6 millionan increase in earnings for countermeasures operations andpartially offset by decreased earnings of combustible ordnance.ordnance of $3 million.
Prior to our March 2007 acquisition of CMC, CMC was involved in a transaction in which CMC shareholders had a limited amount of time in which to tender their shares in exchange for cash. In May 2008, after the prescribed time period had expired, CAD $11.8 million remained unclaimed. As a result, the paying agent returned the unclaimed amount to CMC in accordance with Canadian law. In December 2008, CMC’s former parent company instituted a legal action against the paying agent, alleging negligence and breached contract terms by returning the funds to CMC. The increaseplaintiff lost at trial and appealed. In the second quarter of fiscal 2012, CMC received notice that the plaintiff abandoned its appeal. In addition, CMC and the paying agent settled all remaining issues. All contingencies relating to this matter were resolved, and accordingly, the Company recorded a gain of approximately CAD $11.8 million or $11.9 million, or $9.5 million after tax, in countermeasures earnings reflected strong gross profit and a turnaround from a $6.0 million operating loss incurred inthe second fiscal 2009. The decrease in combustible ordnance is due to decreased gross profit. The reduction in engineered materials earnings reflected $3.6 million in costs associated with closing a facility and a $1.8 million decrease in foreign currency exchange gains, principally on forward contracts which are marked to market each period.quarter of 2012.
Interest expense increased to $33.2$46.2 million during fiscal 20102012 compared with $28.7$40.2 million in the prior year, reflecting increased senior debt and higher borrowings under capitalized lease obligations.borrowings.
During the fourth quarter of fiscal 2010, we paid off $175.0 million in senior subordinated debt and incurred a loss of $1.2 million due to the extinguishment of debt.
On January 26, 2009, we acquired Racal Acoustics for £122.6 million or $171.3 million. Racal Acoustics develops and manufactures high technology ruggedized personal communication equipment for the defense market segment. The acquisition was funded with cash proceeds from the sale of U.K.-based Muirhead and Traxsys and our line of credit. To facilitate the acquisition of Racal Acoustics, we executed a $159.7 million U.S.-dollar denominated intercompany loan with a wholly-owned subsidiary, for which its functional currency is the pound sterling. Due to our holding of pounds sterling to fund the acquisition during a period of foreign exchange volatility, we incurred a $7.9 million foreign currency transaction loss in January 2009, which was recorded in other expense.
27
The income tax rate for fiscal 20102012 was 15.8%20.9% compared with 10.6%15.7% in fiscal 2009.2011. The tax rate was lower than the statutory rate, as both years benefited from various tax credits and certain foreign interest expense deductions. The tax rate for During
30
fiscal 2009 was significantly lower due to enhanced tax benefits associated with specific foreign exchange losses and higher R&D tax credits. In fiscal 2010,2012, we recognized $11.0$8.7 million in netof discrete tax benefits. The $11.0 million discreteincome tax benefits were the result of four events. The first event was a $7.6 million benefit as a result of the release offollowing items: The first item was a $2.3 million tax reserves for uncertainbenefit due to a change in French tax positions mainlylaws associated with losses on dispositionthe holding company structure and the financing of assets. This release of tax reserves resulted from the expiration of a statute of limitations.Souriau acquisition. The second eventitem was a $1.7$2.9 million net reduction in deferred income tax liabilities, which was the result of the enactment of tax laws reducing the U.K. statutory income tax rate. The third eventitem was a $0.8$2.1 million tax expense related to tax liabilities associated with an examination of the U.S. federal and state income tax returns. The fourth event was a $2.5 million reduction of valuation allowances related to net operating losses and foreign tax credits that were generated in prior years.
In fiscal 2009, we recognized $5.0 million in net discrete tax benefits. The $5.0 million discrete tax benefits were the result of five events. The first event was a $2.0 million tax benefit for the reduction of previously recorded withholding tax liabilities as a result of the enactment of a U.S.-Canadian tax treaty. The second event was a $0.6 million expense resulting from the reversal of previously recorded tax benefits associated with the implementation of CMC’s SADI program. The third event was a $1.5 million tax benefit associated with the reconciliation ofreconciling the prior year’s U.S. income tax return to the U.S. income tax provision.provision and settlement of tax examinations. The fourth eventitem was an adjustment that resulted in a reclassification$1.4 million release of $3.4valuation allowance related to foreign tax credits as a result of a tax examination.
In fiscal 2011, we recognized $11.4 million of discrete income tax benefits from discontinued operationsas result of the following items. The first item was $3.1 million of income tax benefits due to continued operations offset by a $1.0 million tax expense to establishthe retroactive extension of the U.S. federal research and experimentation credits and the release of a valuation allowance for U.S. foreignrelated to a net operating loss of an acquired subsidiary. The second item was $5.6 million of income tax credits that are not expected tobenefits associated with net operating losses of an acquired subsidiary as a result inof concluding a current or futuretax examination. The third item was $3.5 million of net reduction of deferred income tax liabilities as a result of a reduction in U.S.the U.K. statutory income taxes.tax rate. The fifth eventfourth item was a $0.3$0.8 million of income tax expense associated withas a result of reconciling the reconciliation of the prior year’s foreignprior-year’s income tax returns to the foreignprior year’s provision for income tax provisions.tax.
To the extent that sales are transacted in a currency other than the functional currency of the operating unit, we are subject to foreign currency fluctuation risk.
We use forward contracts to hedge our foreign currency exchange risk. To the extent that these hedges qualify under U.S. GAAP, the amount of gain or loss is deferred in Accumulated Other Comprehensive Income (AOCI) until the related sale occurs. Also, we are subject to foreign currency gains or losses from embedded derivatives on backlog denominated in a currency other than the functional currency of our operating companies or its customers. Gains and losses on forward contracts, embedded derivatives, and revaluation of assets and liabilities denominated in a currency other than the functional currency of the Company for fiscal 20102012 and 2009 are2011 were as follows:
(In thousands)
| | | | | | | | |
| | | 2010 | | | 2009 | |
| | |
Forward foreign currency contracts – gain (loss) | | $ | (139 | ) | | $ | 7,031 | |
Forward foreign currency contracts – reclassified from AOCI | | | 11,042 | | | | (11,610 | ) |
Embedded derivatives – gain (loss) | | | (1,476 | ) | | | (2,666 | ) |
Revaluation of monetary assets/liabilities – gain (loss) | | | (3,282 | ) | | | (5,334 | ) |
| |
Total | | $ | 6,145 | | | $ | (12,579 | ) |
| |
| | | | | | | | |
| In Thousands | | | | | | |
| Gain (Loss) | | | | | | |
| | | 2012 | | | 2011 | |
| | |
Forward foreign currency contracts | | | $ (5,735 | ) | | | $ 701 | |
Forward foreign currency contracts – reclassified from AOCI | | | 784 | | | | 10,185 | |
Embedded derivatives | | | 426 | | | | 797 | |
Revaluation of monetary assets/liabilities | | | 981 | | | | 2,108 | |
| |
Total | | | $ (3,544 | ) | | | $ 13,791 | |
| |
New orders for fiscal 20102012 were $1.6$2.1 billion compared with $1.4$1.9 billion forin fiscal 2009.2011. Orders increased across all our segments. Backlog at our Avionics & Controlsthe end of fiscal 2012 and Advanced Materials and declined at Sensors & Systems due to the downturn in commercial aviation.2011 was $1.3 billion.
Liquidity and Capital Resources
Working Capital and Statement of Cash Flows
Cash and cash equivalents at the end of fiscal 20112013 totaled $185.0$179.2 million, a decreasean increase of $237.1$18.5 million from the prior year. Net working capital decreasedincreased to $621.0$683.6 million at the end of fiscal 20112013 from $752.2$639.3 million at the end of the prior year.
Cash flows from operating activities were $250.8 million and $194.2 million in fiscal 2013 and 2012, respectively. The increase principally reflected higher net earnings. Sources and uses of cash flows from operating activities principally consistconsisted of cash received from the sale of products offset byand cash payments for material, labor and operating expenses.expense.
Cash flows from operating activities were $192.4 million and $179.8 million in fiscal 2011 and 2010, respectively. The increase principally reflected higher cash collections from customers, lower cash payments for income taxes, and partially offset by higher cash contributions to our defined benefit pension plans and payments for inventory and interest.
28
Cash flows used by investing activities were $869.0$93.7 million and $20.7$48.5 million in fiscal 20112013 and 2010,2012, respectively. Cash flows used by investing activities in fiscal 20112013 principally reflected the usecash paid for acquisitions of $40.7 million, net of cash for acquisition of businesses of $814.9 millionacquired, and capital assetsexpenditures of $49.5$55.3 million. Cash flows used by investing activities in fiscal 20102012 principally reflected the use of cash for the purchase of capital assets of $45.5 million, partially offset by cash proceeds from the sale of Pressure Systems, Inc. of $25.0$49.4 million.
Cash flows providedused by financing activities were $436.4$141.0 million and $167.8 million in fiscal 20112013 and cash flows provided by financing activities were $84.3 million in fiscal 2010.2012, respectively. Cash flows providedused by financing activities in fiscal 20112013 primarily reflected a $400.0 million increase inproceeds from our new credit facility $176.9of $175.0 million in proceeds for the issuanceand repayment of long-term debt and $164.9 million in cash repaymentscredit facilities of long-term debt.$345.4 million. Cash flows providedused by financing activities in fiscal 2010 principally2012 primarily reflected proceeds from the issuance of $250.0 million in senior notes, partially offset by the repaymentcash repayments of our $175.0 million senior subordinatedlong-term debt due in 2013.and credit facilities of $223.1 million.
Capital Expenditures
Net property, plant and equipment was $368.4$371.2 million at the end of fiscal 20112013 compared with $273.8$356.4 million at the end of the prior year. Capital expenditures for fiscal 20112013 and 20102012 were $49.5$55.3 million and $53.7$49.4 million, respectively (excluding
31
acquisitions), and included facilities, machinery, equipment and enhancements to information technology systems. Capital expenditures for fiscal 2010 included $8.1 million under a capitalized lease obligation related to a new facility for an avionics controls operation and a facility expansion for an interface technologies facility. Capital expenditures are anticipated to approximate $65.0$75.0 million for fiscal 2012.2014. We will continue to support expansion through investments in infrastructure including machinery, equipment, and information systems.
Acquisitions
On December 20, 2013, we acquired Sunbank Family of Companies, LLC (Sunbank) for approximately $45 million and up to $5 million in contingent consideration based upon achievement of certain sales levels over a two-year period. Sunbank is a manufacturer of electrical cable accessories, connectors and flexible conduit systems. Sunbank is included in the Sensors & Systems segment. The acquisition was funded under our credit facility and available cash.
On February 4, 2013, we acquired the Gamesman Group (Gamesman) for $40.8 million. Gamesman is a global supplier of input devices principally serving the gaming industry. Gamesman is included in our Avionics & Controls segment.
On July 26, 2011, we acquired the Souriau Group (Souriau) for $726.7 million, net of acquired cash. Souriau is a leading global supplier of highly engineered connectors for harsh environments serving aerospace, defense & space, power generation, rail, and industrial equipment markets. Souriau is included in our Sensors & Systems segment.
On December 30, 2010, the Companywe acquired Eclipse Electronic Systems, Inc. (Eclipse) for $123.8 million. Eclipse is a designer and manufacturer of embedded communication intercept receivers for signal intelligence applications. Eclipse is included in our Avionics & Controls segment.
On July 26, 2011, the Company acquired the Souriau Group (Souriau) for approximately $726.7 million, net of acquired cash. Souriau is a leading global supplier of highly engineered connection technologies for harsh environments. Souriau is included in our Sensors & Systems segment.
Debt Financing
Total debt increased $423.0decreased $159.5 million from the prior year to approximately $1.0 billion$689.1 million at the end of fiscal 2011.2013. Total debt outstanding at the end of fiscal 20112013 consisted of $250.0 million Seniorof 2020 Notes, due in 2020, $176.4$170.6 million of Senior Notes due in 2017, $162.7the U.S. Term Loan, $24.8 million (€115.018.0 million) under our Euro Term Loan, $360.0$130.0 million in borrowings under our secured credit facility, $45.2$56.9 million government refundable advances, $56.2 million under capital lease obligations, and $42.3$0.5 million in various foreign currency debt agreements and other debt agreements.
In April 2013, we amended the secured credit facility to provide for $175.0 million term loan (U.S. Term Loan). The interest rate on the U.S. Term Loan ranges from LIBOR plus 1.5% to LIBOR plus 2.25%, depending on the leverage ratios at the time the funds are drawn. At October 25, 2013, we had $170.6 million outstanding under the U.S. Term Loan at an interest rate of LIBOR plus 1.75%, which is currently 1.93%. The loan amortizes at 1.25% of the original principal balance quarterly through March 2016, with the remaining balance due in July 2016.
In July 2011, we amended the secured credit facility to provide for a new €125.0 million term loan (Euro Term Loan). The interest rate on the Euro Term Loan ranges from euro LIBOR plus 1.5% to euro LIBOR plus 2.25%, depending on the leverage ratios at the time the funds are drawn. At October 25, 2013, we had €18.0 million outstanding or $24.8 million under the Euro Term Loan at an interest rate of euro LIBOR plus 1.75%, which is currently 1.84%. The loan amortizes at 1.25% of the original principal balance quarterly through March 2016, with the remaining balance due in July 2016.
In March 2011, we entered into a secured credit facility for $460.0 million made available through a group of banks. The credit facility is secured by substantially all of our assets and interest is based on standard inter-bank offering rates. The credit facility expires in July 2016. The interest rate will rangeranges from LIBOR plus 1.5% to LIBOR plus 2.25%, depending on the leverage ratios at the time the funds are drawn. At October 28, 2011,25, 2013, we had $360.0$130.0 million outstanding under the secured credit facility at an initial interest rate of LIBOR plus 1.75% or 2.0%, which is currently 1.93%.
In July 2011, we amended the secured An additional $66.2 million of unsecured foreign currency credit facility to providefacilities have been extended by foreign banks for a new €125.0total of $526.2 million term loan (Euro Term Loan). The interest rate on the Euro Term Loan will range from Euro LIBOR plus 1.5% to Euro LIBOR plus 2.25% depending on the leverage ratios at the time the funds are drawn. At October 28, 2011, the Company had €115.0 million outstanding or $162.7 millionavailable companywide. Available credit under the Euro Term Loanabove credit facilities was $363.5 million at an interest ratefiscal 2013 year end, when reduced by outstanding borrowings of Euro LIBOR plus 1.75% or 3.06%. The loan amortizes at 1.25%$130.0 million and letters of the original principal balance quarterly through March 2016, with the remaining balance due in July 2016.credit of $32.7 million.
On August 2, 2010, the Companywe issued $250.0 million in 7% Seniorof 2020 Notes due 2020 requiring semi-annual interest payments in March and September of each year until maturity. The net proceeds from the sale of the notes, after deducting $4.4 million of debt issuance cost, were $245.6 million. The Senior2020 Notes are general unsecured senior obligations of the Company.company. The Senior2020 Notes are guaranteed, jointly and severally on a senior basis, by all the existing and future domestic subsidiaries of the Companycompany unless designated as an “unrestricted subsidiary,” and those foreign subsidiaries that executed related subsidiary guarantees under the indenture covering the Senior2020 Notes. The Senior2020 Notes are subject to redemption at the option of the Companycompany at any time prior to August 1, 2015, at a price equal to 100% of the principal amount, plus any accrued interest to the date of redemption and a make-whole provision. In addition, before August 1, 2013, the Company
29
may redeem up to 35% of the principal amount at 107.000% plus accrued interest with proceeds of one or more Public Equity Offerings. The Senior2020 Notes are also subject to redemption at the option of the Company,company, in whole or in part, on or after August 1, 2015, at redemption prices starting at 103.500% of the principal amount plus accrued interest during the period beginning August 1, 2015, and declining annually to 100% of principal and accrued interest on or after August 1, 2018.
The Company also has
32
In April 2013, we redeemed the $175.0 million outstanding of6.625% Senior Notes due March 2017 (2017 Notes). In connection with the redemption, we wrote off $1.3 million in 2017, with anunamortized debt issuance costs as a charge against interest expense. In addition, we incurred a $3.9 million redemption premium and received proceeds of $2.9 million from the termination of its $175.0 million interest rate of 6.625%. The Senior Notes are general unsecured senior obligationsswap agreements. As a result, the redemption of the Company. The Senior2017 Notes are guaranteed, jointly and severallyresulted in a net loss of $0.9 million on a senior basis, by all the existing and future domestic subsidiariesextinguishment of the Company unless designated as an “unrestricted subsidiary,” and those foreign subsidiaries that executed related subsidiary guarantees under the indenture covering the Senior Notes. The Senior Notes are subject to redemption at the option of the Company at any time prior to March 1, 2012, at a price equal to 100% of the principal amount, plus any accrued interest to the date of redemption and a make-whole provision. The Senior Notes are also subject to redemption at the option of the Company, in whole or in part, on or after March 1, 2012, at redemption prices starting at 103.3125% of the principal amount plus accrued interest during the period beginning March 1, 2007, and declining annually to 100% of principal and accrued interest on or after March 1, 2015.debt.
We believe cash on hand, funds generated from operations and other available debt facilities are sufficient to fund operating cash requirements and capital expenditures through fiscal 2012. Current conditions in the capital markets are uncertain; however, we2014. We believe we will have adequate access to capital markets to fund future acquisitions.
Permanent Investment of Undistributed Earnings of Foreign Subsidiaries
Our non-U.S. subsidiaries had $130.2have $167.2 million in cash and cash equivalents at October 28, 2011.25, 2013. Cash and cash equivalents at our U.S. parent and subsidiaries aggregated $54.8$12.0 million ofat October 28, 2011,25, 2013, and cash flow from these operations is sufficient to fund working capital, capital expenditures, acquisitions and debt repayments of our domestic operations. We have available credit to our U.S. parent and subsidiaries of $330.0 million on our U.S. secured credit facility. The earnings of our non-U.S. subsidiaries are considered to be indefinitely invested, and accordingly, no provision for federal income taxes has been made on accumulated earnings of foreign subsidiaries. The amount of the unrecognized deferred income tax liability for temporary differences related to investments in foreign subsidiaries is not practical to determine because of the complexities regarding the calculation of unremitted earnings and the potential for tax credits.
Government Refundable Advances
Government refundable advances consist of payments received from the Canadian government to assist in the research and development related to commercial aviation. These advances totaled $56.9 million and $51.8 million at October 25, 2013, and October 26, 2012, respectively. The repayment of the advances is based on year-over-year commercial aviation revenue growth at CMC beginning in 2014. Imputed interest on the advances was 4.61% at October 25, 2013.
Pension and Other Post-Retirement Benefit Obligations
Our pension plans principally include a U.S. pension plan maintained by Esterline and non-U.S. plans maintained by CMC. Our principal post-retirement plans include non-U.S. plans maintained by CMC, which are non-contributory health care and life insurance plans.
We account for pension expense using the end of the fiscal year as our measurement date, and we make actuarially computed contributions to our pension plans as necessary to adequately fund benefits. Our funding policy is consistent with the minimum funding requirements of ERISA. In fiscal 20112013 and 2010,2012, operating cash flow included $32.5$27.0 million and $20.0$27.3 million, respectively, of cash funding to these pension plans. We expect pension funding requirements for the plans maintained by Esterline and CMC to be approximately $21.2$12.0 million and $8.1$10.6 million, respectively, in fiscal 2012.2014. The rate of increase in future compensation levels is consistent with our historical experience and salary administration policies. The expected long-term rate of return on plan assets is based on long-term target asset allocations of 70% equity and 30% fixed income. We periodically review allocations of plan assets by investment type and evaluate external sources of information regarding long-term historical returns and expected future returns for each investment type, and accordingly, believe a 7.5 and6.34% to 7.0% assumed long-term rate of return on plan assets is appropriate for both the Esterline and CMC plan, respectively.plans. Current allocations are consistent with the long-term targets.
We made the following assumptions with respect to our Esterline pension obligation in 2011fiscal 2013 and 2010:2012:
| | | | | | | | |
| | | 2011 | | | 2010 | |
| Principal assumptions as of fiscal year end: | | | | | | | | |
Discount rate | | | 5.0 | % | | | 5.5 | % |
Rate of increase in future compensation levels | | | 4.5 | % | | | 4.5 | % |
Assumed long-term rate of return on plan assets | | | 7.5 | % | | | 8.0 | % |
30
| | | | | | | | |
| | | 2013 | | | 2012 | |
| | |
Principal assumptions as of fiscal year end: | | | | | | | | |
Discount rate | | | 4.7 | % | | | 3.85 | % |
Rate of increase in future compensation levels | | | 4.5 | % | | | 4.5 | % |
Assumed long-term rate of return on plan assets | | | 7.0 | % | | | 7.0 | % |
We made the following assumptions with respect to our CMC pension obligation in 2011fiscal 2013 and 2010:2012:
| | | | | | | | | |
| | | | | | 2013 | | | 2012 | |
| | | 2011 | | | 2010 | | |
| Principal assumptions as of fiscal year end: | | | | | | | | |
Discount rate | | | 5.0 | % | | | 5.0 | % | | | 4.5 | % | | | 4.35 | % |
Rate of increase in future compensation levels | | | 3.1 | % | | | 3.2 | % | | | 3.0 | % | | | 3.1 | % |
Assumed long-term rate of return on plan assets | | | 7.0 | % | | | 7.0 | % | | | 6.34 | % | | | 6.5 – 6.75 | % |
33
We use a discount rate for expected returns that is a spot rate developed from a yield curve established from high-quality corporate bonds and matched to plan-specific projected benefit payments. Although future changes to the discount rate are unknown, had the discount rate increased or decreased by 25 basis points in 2011,fiscal 2013, pension liabilities in total would have decreased $9.4$11.8 million or increased $11.3$12.3 million, respectively. If all other assumptions are held constant, the estimated effect on fiscal 20112013 pension expense from a hypothetical 25 basis points increase or decrease in both the discount rate and expected long-term rate of return on plan assets would not have a material effect on our pension expense.
We made the following assumptions with respect to our Esterline post-retirement obligation in 2011fiscal 2013 and 2010:2012:
| | | | | | | | | |
| | | | | | 2013 | | | 2012 | |
| | | 2011 | | | 2010 | | |
| Principal assumptions as of fiscal year end: | | | | | | | | |
Discount rate | | | 5.0 | % | | | 5.5 | % | | | 4.7 | % | | | 3.85 | % |
Initial weighted average health care trend rate | | | 6.0 | % | | | 6.0 | % | | | 6.0 | % | | | 6.0 | % |
Ultimate weighted average health care trend rate | | | 6.0 | % | | | 6.0 | % | | | 6.0 | % | | | 6.0 | % |
We made the following assumptions with respect to our CMC post-retirement obligation in 2011fiscal 2013 and 2010:2012:
| | | | | | | | | |
| | | | | | 2013 | | | 2012 | |
| | | 2011 | | | 2010 | | |
| Principal assumptions as of fiscal year end: | | | | | | | | |
Discount rate | | | 5.0 | % | | | 5.0 | % | | | 4.5 | % | | | 4.35 | % |
Initial weighted average health care trend rate | | | 3.7 | % | | | 4.1 | % | | | 6.3 | % | | | 3.7 | % |
Ultimate weighted average health care trend rate | | | 3.2 | % | | | 3.4 | % | | | 4.2 | % | | | 3.2 | % |
The assumed health care trend rate has a significant impact on our post-retirement benefit obligations. Our health care trend rate was based on the experience of our plan and expectations for the future. A 100 basis points increase in the health care trend rate would increase our post-retirement benefit obligation by $1.0$1.9 million at October 28, 2011.25, 2013. A 100 basis points decrease in the health care trend rate would decrease our post-retirement benefit obligation by $0.9$0.5 million at October 28, 2011.25, 2013. Assuming all other assumptions are held constant, the estimated effect on fiscal 20112013 post-retirement benefit expense from a hypothetical 100 basis points increase or decrease in the health care trend rate would not have a material effect on our post-retirement benefit expense.
Research and Development Expense
For the three years ended October 28, 2011,25, 2013, research and development expense has averaged 4.9%5.2% of sales. We estimate that research and development expense in fiscal 20122014 will be about 5.5%5% of sales for the full year.
Contractual Obligations
The following table summarizes our outstanding contractual obligations as of fiscal year end. Liabilities for income taxes were excluded from the table, as we are not able to make a reasonably reliable estimate of the amount and period of related future payments.
In Thousands
| | | | | | | | | | | | | | | | | | | | |
| | | Total | | | Less than 1 year | | | 1-3 years | | | 4-5 years | | | After 5 years | |
| | | | | |
Long-term debt1 | | | $ 761,871 | | | | $ 25,143 | | | | $ 319,428 | | | | $ 10,364 | | | | $ 406,936 | |
Interest obligations | | | 118,125 | | | | 17,500 | | | | 35,000 | | | | 35,000 | | | | 30,625 | |
Operating lease obligations | | | 64,838 | | | | 14,973 | | | | 17,974 | | | | 13,542 | | | | 18,349 | |
Purchase obligations | | | 688,546 | | | | 630,524 | | | | 52,131 | | | | 5,412 | | | | 479 | |
| |
Total contractual obligations | | | $ 1,633,380 | | | | $ 688,140 | | | | $ 424,533 | | | | $ 64,318 | | | | $ 456,389 | |
| |
| | | | | | | | | | | | | | | | | | | | |
| | | Total | | | Less than
1 year | | | 1-3 years | | | 4-5 years | | | After 5 years | |
| | | | | |
Long-term debt | | $ | 626,439 | | | $ | 11,496 | | | $ | 17,887 | | | $ | 136,193 | | | $ | 460,863 | |
Credit facilities | | | 365,000 | | | | 5,000 | | | | 0 | | | | 360,000 | | | | 0 | |
Interest obligations | | | 222,915 | | | | 29,340 | | | | 58,680 | | | | 58,680 | | | | 76,215 | |
Operating lease obligations | | | 65,085 | | | | 15,084 | | | | 22,072 | | | | 12,578 | | | | 15,351 | |
Capital lease obligations | | | 118,024 | | | | 4,025 | | | | 8,773 | | | | 8,660 | | | | 96,566 | |
Purchase obligations | | | 696,692 | | | | 654,996 | | | | 39,154 | | | | 1,847 | | | | 695 | |
| |
Total contractual obligations | | $ | 2,094,155 | | | $ | 719,941 | | | $ | 146,566 | | | $ | 577,958 | | | $ | 649,690 | |
| |
| 1 | Includes $72.7 million representing interest on capital lease obligations. |
31
Seasonality
The timing of our revenues is impacted by the purchasing patterns of our customers and, as a result, we do not generate revenues evenly throughout the year. Moreover, our first fiscal quarter, November through January, includes significant holiday vacation periods in both Europe and North America. This leads to decreased order and shipment activity; consequently, first quarter results are typically weaker than other quarters and not necessarily indicative of our performance in subsequent quarters.
34
Disclosures About Market Risk
Interest Rate Risks
Our debt includes fixed rate and variable rate obligations at October 28, 2011.25, 2013. We are not subject to interest rate risk on the fixed rate obligations. We are subject to interest rate risk on the euro term loan, interest rate swap agreements,Euro Term Loan, U.S. Term Loan, and U.S. credit facility. For long-term debt, the table presents principal cash flows and the related weighted-average interest rates by contractual maturities.
A hypothetical 10% increase or decrease in average market rates would not have a material effect on our pretax income.
In Thousands
| | | | | | Long-Term Debt – Variable Rate | | |
| In Thousands | | | Long-Term Debt – Variable Rate | |
| Maturing in: | | | |
| Principal
Amount |
| | | |
| Average
Rates |
(1) | |
| Principal
Amount |
| |
| Average
Rates |
1,2 |
| 2012 | | | | $ | 8,844 | | | | | | * | | |
2013 | | | | | 8,844 | | | | | | * | | |
2014 | | | | | 8,844 | | | | | | * | | | $ | 17,377 | | | | * | |
2015 | | | | | 8,844 | | | | | | * | | | | 17,379 | | | | * | |
2016 | | | | | 487,349 | | | | | | * | | | | 290,716 | | | | * | |
2017 and thereafter | | | | | 0 | | | | | | * | | |
2017 | | | | 0 | | | | * | |
2018 | | | | 0 | | | | * | |
2019 and thereafter | | | | 0 | | | | * | |
| | | | |
Total | | | | $ | 522,725 | | | | | | | $ | 325,472 | | | |
| | | | | | | | | | |
| Fair Value at | | | | | | | | | |
10/28/2011 | | | | $ | 522,725 | | | | | | |
Fair Value at 10/25/2013 | | | $ | 325,472 | | | |
| 1 | Borrowings under the Euro Term Loan bear interest at a rate equal to either: (a) the euro term loan facilityLIBOR rate plus 1.75% or (b) the “Base Rate” (defined as the higher of Wells Fargo Bank, National Association’s prime rate and the Federal funds rate plus 0.75%). |
| 2 | Borrowings under the U.S. Term Loan bear interest at a rate equal to either: (a) the LIBOR rate plus 1.75% or (b) the “Base Rate” (defined as the higher of WachoviaWells Fargo Bank, National Association’s prime rate and the Federal funds rate plus 0.50%0.75%) plus 0.75%. |
In Thousands
| | | | | | | | | | | | | | | | | | | | | | | | | | | | |
| | | Long-Term Debt – Fixed Rate | | | | | Long-Term Debt – Variable Rate | |
Maturing in: | |
| Principal
Amount |
| | | |
| Average
Rates |
| | | |
| Notional
Amount |
| | | |
| Average
Pay Rate |
(1) | | | |
| Average
Receive
Rate |
|
| | | | | | | | | |
2012 | | $ | 0 | | | | | | 6.625% | | | | | $ | 0 | | | | | | * | | | | | | 6.625% | |
2013 | | | 0 | | | | | | 6.625% | | | | | | 0 | | | | | | * | | | | | | 6.625% | |
2014 | | | 0 | | | | | | 6.625% | | | | | | 0 | | | | | | * | | | | | | 6.625% | |
2015 | | | 0 | | | | | | 6.625% | | | | | | 0 | | | | | | * | | | | | | 6.625% | |
2016 | | | 0 | | | | | | 6.625% | | | | | | 0 | | | | | | * | | | | | | 6.625% | |
2017 and thereafter | | $ | 100,000 | | | | | | 6.625% | | | | | | 100,000 | | | | | | * | | | | | | 6.625% | |
| | | | | | | |
Total | | $ | 100,000 | | | | | | | | | | | $ | 100,000 | | | | | | | | | | | | | |
| | | | | | | | | | | | | | | | | | | | | | | | | |
| | | | | | | | | |
Fair Value at | | | | | | | | | | | | | | | | | | | | | | | | | | | | |
10/28/2011 | | $ | 100,000 | | | | | | | | | | | $ | 126 | | | | | | | | | | | | | |
1 | The average pay rate is LIBOR plus 4.865%.
|
32
In Thousands
| | | | | | | | | | | | | | | | | | | | | | | | | | | | |
| | | Long-Term Debt – Fixed Rate | | | | | Long-Term Debt – Variable Rate | |
Maturing in: | |
| Principal
Amount |
| | | |
| Average
Rates |
| | | |
| Notional
Amount |
| | | |
| Average
Pay Rate |
(1) | | | |
| Average
Receive
Rate |
|
| | | | | | | | | |
2012 | | $ | 0 | | | | | | 6.625% | | | | | $ | 0 | | | | | | * | | | | | | 6.625% | |
2013 | | | 0 | | | | | | 6.625% | | | | | | 0 | | | | | | * | | | | | | 6.625% | |
2014 | | | 0 | | | | | | 6.625% | | | | | | 0 | | | | | | * | | | | | | 6.625% | |
2015 | | | 0 | | | | | | 6.625% | | | | | | 0 | | | | | | * | | | | | | 6.625% | |
2016 | | | 0 | | | | | | 6.625% | | | | | | 0 | | | | | | * | | | | | | 6.625% | |
2017 and thereafter | | $ | 75,000 | | | | | | 6.625% | | | | | | 75,000 | | | | | | * | | | | | | 6.625% | |
| | | | | | | |
Total | | $ | 75,000 | | | | | | | | | | | $ | 75,000 | | | | | | | | | | | | | |
| | | | | | | | | | | | | | | | | | | | | | | | | |
| | | | | | | | | |
Fair Value at | | | | | | | | | | | | | | | | | | | | | | | | | | | | |
10/28/2011 | | $ | 75,000 | | | | | | | | | | | $ | 1,228 | | | | | | | | | | | | | |
1 | The average pay rate is LIBOR plus 4.47%.
|
Currency Risks
We own significant operations in Canada, France and the United Kingdom. To the extent that sales are transacted in a foreign currency, we are subject to foreign currency fluctuation risk. Furthermore, we have assets denominated in foreign currencies that are not offset by liabilities in such foreign currencies. At October 28, 2011,25, 2013, we had the following monetary assets subject to foreign currency fluctuation risk: U.S. dollar-denominated backlog with customers whose functional currency is other than the U.S. dollar; U.S. dollar-denominated accounts receivable and payable; and certain forward contracts, which are not accounted for as a cash flow hedge. The foreign exchange rate for the dollar relative to the euro decreased to 0.7070.724 at October 28, 2011,25, 2013, from 0.7180.773 at October 29, 2010;26, 2012; the dollar relative to the U.K. pound decreased to 0.6200.619 from 0.624;0.621; and the dollar relative to the Canadian dollar decreasedincreased to 0.9921.045 from 1.02.0.997. Foreign currency transactions affecting monetary assets and forward contracts resulted in a $14.2$1.7 million loss in fiscal 2013, a $3.5 million loss in fiscal 2012, and a $13.8 million gain in fiscal 2011, a $6.1 million gain in fiscal 2010, and a $12.6 million loss in fiscal 2009.2011. The $14.2$13.8 million gain in fiscal 2011 included a $6.3 million gain due to our holding euros to fund the Souriau acquisition. The $12.6 million loss in fiscal 2009 was principally due to our holding of pounds sterling to fund the Racal Acoustics acquisition during a period of foreign exchange volatility, resulting in a $7.9 million foreign currency transaction loss in January 2009.
Our policy is to hedge a portion of our forecasted transactions using forward exchange contracts with maturities up to 2345 months. The Company does not enter into any forward contracts for trading purposes. At October 28, 2011,25, 2013, and October 29, 2010,26, 2012, the notional value of foreign currency forward contracts was $431.2$373.2 million and $245.5$359.3 million, respectively. The net fair value of these contracts was a $5.7$1.3 million asset and an $11.1a $2.5 million asset at October 28, 2011,25, 2013, and October 29, 2010,26, 2012, respectively. If the U.S. dollar increased by a hypothetical 5%, the effect on the fair value of the foreign currency contracts would be an increase of $19.0$17.9 million. If the U.S. dollar decreased by a hypothetical 5%, the effect on the fair value of the foreign currency contracts would be a decrease of $21.9$19.8 million.
The following tables provide information about our significant derivative financial instruments, including foreign currency forward exchange agreements and certain firmly committed sales transactions denominated in currencies other than the functional currency at October 28, 2011,25, 2013, and October 29, 2010.26, 2012. The information about certain firmly committed sales contracts and derivative financial instruments is in U.S. dollar equivalents. For forward foreign currency exchange agreements, the following tables present the notional amounts at the current exchange rate and weighted-average contractual foreign currency exchange rates by contractual maturity dates.
3335
Firmly Committed Sales Contracts
Operations with Foreign Functional Currency
At October 28, 201125, 2013
Principal Amount by Expected Maturity
| | | 00000000000000000 | | | | 00000000000000000 | | | | 00000000000000000 | | | | | | | | | | | | | |
| In Thousands | | Firmly Committed Sales Contracts in United States Dollar | | | Firmly Committed Sales Contracts in United States Dollar | |
Fiscal Years | | | Canadian Dollar | | | | Euro | | | | U.K. Pound | | | Canadian Dollar | | | Euro | | | U.K. Pound | |
| 2012 | | $ | 177,056 | | | $ | 74,559 | | | $ | 67,277 | | |
2013 | | | 12,289 | | | | 14,855 | | | | 14,601 | | |
2014 | | | 311 | | | | 304 | | | | 6,313 | | | $ | 138,219 | | | $ | 84,796 | | | $ | 70,724 | |
2015 | | | 0 | | | | 22 | | | | 6,021 | | | | 65,340 | | | | 17,961 | | | | 11,784 | |
2016 and thereafter | | | 5,796 | | | | 6 | | | | 6,076 | | |
2016 | | | | 21,302 | | | | 333 | | | | 12,052 | |
2017 | | | | 3,976 | | | | 544 | | | | 2,448 | |
2018 and thereafter | | | | 12,355 | | | | 0 | | | | 0 | |
| | | | |
Total | | $ | 195,452 | | | $ | 89,746 | | | $ | 100,288 | | | $ | 241,192 | | | $ | 103,634 | | | $ | 97,008 | |
| | | | |
Derivative Contracts
Operations with Foreign Functional Currency
At October 28, 201125, 2013
Notional Amount by Expected Maturity
Average Foreign Currency Exchange Rate (USD/Foreign Currency)1
Related Forward Contracts to Sell U.S. Dollar for Euro
| | 00000000000000000 | | | 00000000000000000 | | | | 00000000000000000 | |
| Dollars in Thousands, Except for Average Contract Rate | | United States Dollar | |
Fiscal Years | | | | | Notional Amount | | | | Avg. Contract Rate | |
| | | |
2012 | | | | $ | 76,200 | | | | 1.373 | |
2013 | | | | | 4,240 | | | | 1.388 | |
| |
Total | | | | $ | 80,440 | | | | | |
| | | | | |
| | | |
Fair Value at 10/28/2011 | | | | $ | 2,060 | | | | | |
| | | | | | | | |
| In Thousands, Except for Average Contract Rate | | United States Dollar | |
| Fiscal Years | | Notional Amount | | | Avg. Contract Rate | |
| | |
2014 | | $ | 62,632 | | | | 1.319 | |
2015 | | | 6,230 | | | | 1.339 | |
| |
Total | | $ | 68,862 | | | | | |
| | | | | |
| | |
Fair Value at 10/25/2013 | | $ | 3,117 | | | | | |
| 1 | The Company has no derivative contracts maturing after fiscal 2013. 2015. |
Derivative Contracts
Operations with Foreign Functional Currency
At October 28, 201125, 2013
Notional Amount by Expected Maturity
Average Foreign Currency Exchange Rate (USD/Foreign Currency)1
Related Forward Contracts to Sell U.S. Dollar for U.K. Pound
| | 0000000000000000 | | | 0000000000000000 | | | | 0000000000000000 | |
| Dollars in Thousands, Except for Average Contract Rate | | United States Dollar | |
Fiscal Years | | | | | Notional Amount | | | | Avg. Contract Rate | |
| | | |
2012 | | | | $ | 53,124 | | | | 1.581 | |
2013 | | | | | 15,110 | | | | 1.594 | |
| |
Total | | | | $ | 68,234 | | | | | |
| | | | | |
| | | |
Fair Value at 10/28/2011 | | | | $ | 816 | | | | | |
| | | | | | | | |
| In Thousands, Except for Average Contract Rate | | United States Dollar | |
| Fiscal Years | | Notional Amount | | | Avg. Contract Rate | |
| | |
2014 | | $ | 53,182 | | | | 1.568 | |
2015 | | | 22,290 | | | | 1.543 | |
2016 | | | 6,643 | | | | 1.573 | |
| |
Total | | $ | 82,115 | | | | | |
| | | | | |
| | |
Fair Value at 10/25/2013 | | $ | 2,738 | | | | | |
| 1 | The Company has no derivative contracts maturing after fiscal 2013. 2016. |
3436
Derivative Contracts
Operations with Foreign Functional Currency
At October 28, 201125, 2013
Notional Amount by Expected Maturity
Average Foreign Currency Exchange Rate (USD/Foreign Currency)1
Related Forward Contracts to Sell U.S. Dollar for Canadian Dollar
| | 00000000000000000 | | | 00000000000000000 | | | | 00000000000000000 | |
| Dollars in Thousands, Except for Average Contract Rate | | United States Dollar | |
Fiscal Years | | | | | Notional Amount | | | | Avg. Contract Rate | |
| | | |
2012 | | | | $ | 145,002 | | | | .980 | |
2013 | | | | | 87,594 | | | | 1.000 | |
| |
Total | | | | $ | 232,596 | | | | | |
| | | | | |
| | | |
Fair Value at 10/28/2011 | | | | $ | 3,593 | | | | | |
| | | | | | | | |
| In Thousands, Except for Average Contract Rate | | United States Dollar | |
| Fiscal Years | | Notional Amount | | | Avg. Contract Rate | |
| | |
2014 | | $ | 127,074 | | | | .974 | |
2015 | | | 90,900 | | | | .962 | |
| |
Total | | $ | 217,974 | | | | | |
| | | | | |
| | |
Fair Value at 10/25/2013 | | $ | (4,497 | ) | | | | |
| 1 | The Company has no derivative contracts maturing after fiscal 2013. 2015. |
Firmly Committed Sales Contracts
Operations with Foreign Functional Currency
At October 29, 201026, 2012
Principal Amount by Expected Maturity
| | | 00000000000000000 | | | | 00000000000000000 | | | | 00000000000000000 | | | | | | | | | | | | | |
| In Thousands | | Firmly Committed Sales Contracts in United States Dollar | | | Firmly Committed Sales Contracts in United States Dollar | |
| Fiscal Years | | Canadian Dollar | | | Euro | | | U.K. Pound | | | Canadian Dollar | | | Euro | | | U.K. Pound | |
| 2011 | | $ | 211,481 | | | $ | 55,841 | | | $ | 33,198 | | |
2012 | | | 30,692 | | | | 11,920 | | | | 2,646 | | |
2013 | | | 849 | | | | 20 | | | | 116 | | | $ | 157,010 | | | $ | 78,043 | | | $ | 60,288 | |
2014 | | | 383 | | | | 0 | | | | 116 | | | | 43,991 | | | | 16,225 | | | | 12,908 | |
2015 and thereafter | | | 7,145 | | | | 0 | | | | 0 | | |
2015 | | | | 20,685 | | | | 360 | | | | 2,457 | |
2016 | | | | 14,720 | | | | 16 | | | | 2,457 | |
2017 and thereafter | | | | 9,499 | | | | 10 | | | | 6,974 | |
| | | | |
Total | | $ | 250,550 | | | $ | 67,781 | | | $ | 36,076 | | | $ | 245,905 | | | $ | 94,654 | | | $ | 85,084 | |
| | | | |
Derivative Contracts
Operations with Foreign Functional Currency
At October 29, 201026, 2012
Notional Amount by Expected Maturity
Average Foreign Currency Exchange Rate (USD/Foreign Currency)1
Related Forward Contracts to Sell U.S. Dollar for Euro
| | 00000000000000000 | | | 00000000000000000 | | | | 00000000000000000 | |
| Dollars in Thousands, Except for Average Contract Rate | | United States Dollar | |
| Fiscal Years | | | | Notional Amount | | | Avg. Contract Rate | |
| | | |
2011 | | | | $ | 31,248 | | | | 1.357 | |
2012 | | | | | 3,210 | | | | 1.321 | |
| |
Total | | | | $ | 34,458 | | | | | |
| | | | | |
| | | |
Fair Value at 10/29/2010 | | | | $ | 937 | | | | | |
| | | | | | | | |
| In Thousands, Except for Average Contract Rate | | United States Dollar | |
| Fiscal Years | | Notional Amount | | | Avg. Contract Rate | |
| | |
2013 | | $ | 75,938 | | | | 1.291 | |
2014 | | | 4,320 | | | | 1.281 | |
| |
Total | | $ | 80,258 | | | | | |
| | | | | |
| | |
Fair Value at 10/26/2012 | | $ | 258 | | | | | |
| 1 | The Company has no derivative contracts maturing after fiscal 2012. 2014. |
3537
Derivative Contracts
Operations with Foreign Functional Currency
At October 29, 201026, 2012
Notional Amount by Expected Maturity
Average Foreign Currency Exchange Rate (USD/Foreign Currency)1
Related Forward Contracts to Sell U.S. Dollar for U.K. Pound
| | 00000000000000000 | | | 00000000000000000 | | | | 00000000000000000 | |
| Dollars in Thousands, Except for Average Contract Rate | | United States Dollar | |
| Fiscal Years | | | | Notional Amount | | | Avg. Contract Rate | |
| | | |
2011 | | | | $ | 43,253 | | | | 1.561 | |
2012 | | | | | 11,740 | | | | 1.556 | |
| |
Total | | | | $ | 54,993 | | | | | |
| | | | | |
| | | |
Fair Value at 10/29/2010 | | | | $ | 1,223 | | | | | |
| | | | | | | | |
| In Thousands, Except for Average Contract Rate | | United States Dollar | |
| Fiscal Years | | Notional Amount | | | Avg. Contract Rate | |
| | |
2013 | | $ | 47,098 | | | | 1.587 | |
2014 | | | 16,982 | | | | 1.588 | |
2015 | | | 5,030 | | | | 1.600 | |
2016 | | | 4,633 | | | | 1.599 | |
| |
Total | | $ | 73,743 | | | | | |
| | | | | |
| | |
Fair Value at 10/26/2012 | | $ | 923 | | | | | |
| 1 | The Company has no derivative contracts maturing after fiscal 2012. 2016. |
Derivative Contracts
Operations with Foreign Functional Currency
At October 29, 201026, 2012
Notional Amount by Expected Maturity
Average Foreign Currency Exchange Rate (USD/Foreign Currency)1
Related Forward Contracts to Sell U.S. Dollar for Canadian Dollar
| | 00000000000000000 | | | 00000000000000000 | | | | 00000000000000000 | |
| Dollars in Thousands, Except for Average Contract Rate | | United States Dollar | |
| Fiscal Years | | | | Notional Amount | | | Avg. Contract Rate | |
| | | |
2011 | | | | $ | 112,854 | | | | .908 | |
2012 | | | | | 43,220 | | | | .944 | |
| |
Total | | | | $ | 156,074 | | | | | |
| | | | | |
| | | |
Fair Value at 10/29/2010 | | | | $ | 9,541 | | | | | |
| | | | | | | | |
| In Thousands, Except for Average Contract Rate | | United States Dollar | |
| Fiscal Years | | Notional Amount | | | Avg. Contract Rate | |
| | |
2013 | | $ | 126,728 | | | | .992 | |
2014 | | | 77,624 | | | | .980 | |
| |
Total | | $ | 204,352 | | | | | |
| | | | | |
| | |
Fair Value at 10/26/2012 | | $ | 1,331 | | | | | |
| 1 | The Company hadhas no derivative contracts maturing after fiscal 2012. 2014. |
Critical Accounting Policies
Our financial statements and accompanying notes are prepared in accordance with U.S. generally accepted accounting principles. Preparing financial statements requires management to make estimates and assumptions that affect the reported amounts of assets, liabilities, revenues and expenses. Actual results may differ from estimates under different assumptions or conditions. These estimates and assumptions are affected by our application of accounting policies. Our critical accounting policies include revenue recognition, accounting for the allowance for doubtful accounts receivable, accounting for inventories, at the lowerimpairment of cost or market, accounting for goodwill and intangible assets, in business combinations, impairment of goodwill and intangiblelong-lived assets, accounting for legal contingencies, accounting for pension benefits, and accounting for income taxes.
Revenue Recognition
We recognize revenue when the title and risk of loss have passed to the customer, there is persuasive evidence of an agreement, delivery has occurred or services have been rendered, the price is determinable, and the collectibilitycollectability is reasonably assured. We recognize product revenues at the point of shipment or delivery in accordance with the terms of sale. Sales are net of returns and allowances. Returns and allowances are not significant because products are manufactured to customer specification and are covered by the terms of the product warranty.
36
Revenues and profits on fixed-price contracts with significant engineering as well as production requirements are recorded based on the achievement of contractual milestones and the ratio of total actual incurred costs to date to total estimated
38
costs for each contract (cost-to-cost method). We review cost performance and estimates to complete on our ongoing contracts at least quarterly. The impact of revisions of profit estimates are recognized on a cumulative catch-up basis in the period in which the revisions are made. Provisions for anticipated losses on contracts are recorded in the period they become evident. When change orders have been approved by both the company and the customer for both scope and price and realization is deemed probable, the original contract price is adjusted and revenues are recognized on contract performance (as determined by the achievement of contractual milestones and the cost-to-cost method). For partially approved change orders, costs attributable to unpriced change orders are treated as costs of the contract performance in the period the costs are incurred. Claims are also recognized as contract revenue when approved by both the company and the customer, based on contract performance.
Allowance for Doubtful Accounts
We establish an allowance for doubtful accounts for losses expected to be incurred on accounts receivable balances. Judgment is required in estimation of the allowance and is based upon specific identification, collection history and creditworthiness of the debtor.
Inventories
We account for inventories on a first-in, first-out or average cost method of accounting at the lower of its cost or market. The determination of market requires judgment in estimating future demand, selling prices and cost of disposal. Judgment is required when determining inventory cost adjustments. Inventory cost adjustments are recorded when inventory is considered to be excess or obsolete based upon an analysis of actual on-hand quantities on a part-level basis to forecasted product demand and historical usage.
Impairment of Goodwill and Intangible Assets
Goodwill and indefinite-lived intangible assets are required to be tested for impairment at least annually. We are also required to test goodwill for impairment between annual tests if events occur or circumstances change that would more likely than not reduce our enterprise fair value below its book value. These events or circumstances could include a significant change in the business climate, including a significant sustained decline in an entity’s market value, legal factors, operating performance indicators, competition, sale or disposition of a significant portion of the business, or other factors.
Goodwill is tested for impairment in a two-step process. The first step (Step One) of the goodwill impairment test involves estimating the fair value of a reporting unit. Fair value (Fair Value) is defined as “the amount at which an asset (or liability) could be bought (or incurred) or sold (or settled) in a current transaction between willing parties, that is, other than in a forced liquidation sale.” A reporting unit is generally defined at the operating segment level or at the component level one level below the operating segment, if said component constitutes a business. The Fair Value of a reporting unit is then compared to its carrying value, which is defined as the book basis of total assets less total liabilities. In the event a reporting unit’s carrying value exceeds its estimated Fair Value, evidence of potential impairment exists. In such a case, the second step (Step Two) of the impairment test is required, which involves allocating the Fair Value of the reporting unit to all of the assets and liabilities of that unit, with the excess of Fair Value over allocated net assets representing the Fair Value of goodwill. An impairment loss is measured as the amount by which the carrying value of the reporting unit’s goodwill exceeds the estimated Fair Value of goodwill.
As we have grown through acquisitions, we have accumulated $1.2$1.1 billion of goodwill and $48.8$47.2 million of indefinite-lived intangible assets out of total assets of $3.4$3.3 billion at October 28, 2011.25, 2013. The amount of any annual or interim impairment could be significant and could have a material adverse effect on our reported financial results for the period in which the charge is taken. During the third fiscal quarter of 2013, management performed a Step One impairment test for Racal Acoustics, Inc. (Racal Acoustics) upon identification of an indicator of impairment. The Company’s third quarter forecast in 2013 projected a higher operating loss in fiscal 2013 and lower earnings over the five years compared to the prior-year forecast due to further delays and reductions in global defense programs. As required under U.S. GAAP, a Step Two impairment test was required in fiscal 2013, because the current fair value of the business using a discounted cash flow and market approach was less than its carrying amount of the business. Under Step Two, the fair value of all Racal Acoustics’ assets and liabilities were estimated, including tangible assets, existing technology, and trade names, for the purpose of deriving an estimate of the implied fair value of goodwill. The implied fair value of the goodwill was then compared to the recorded goodwill to determine the amount of the impairment. Assumptions used in measuring the value of these assets and liabilities included the discount rates, royalty rates, and obsolescence rates used in valuing the intangible assets and pricing of comparable transactions in the market in valuing the tangible assets. The excess of the carrying amount of goodwill over the implied fair value of goodwill resulted in an impairment charge of $3.5 million in fiscal 2013. An impairment charge of $52.2 million was recorded at Racal Acoustics in fiscal 2012.
39
We performed our annual impairment review for fiscal 20112013 as of July 30, 2011,27, 2013, and our Step One analysis indicates that no impairment of goodwill or other indefinite-lived assets exists at any of our other reporting units.
During fiscal 2009, management determined Our Souriau reporting unit’s margin in passing the Step One analysis was about 12%, mainly reflecting lower market valuation assumptions in 2013. Management expects that the trade name useful life was no longer indefinitecontinued improvements in operations will result in favorable actual results compared to our original plan. It is possible, however, that as a result of further integrationevents or circumstances, we could conclude at a later date that goodwill of advanced sensors units and promotion of the Advanced Sensors brand name. An impairment test was$347.6 million at Souriau may be considered impaired. We also may be required to be performedrecord an earnings charge or incur unanticipated expenses if, due to a change in strategy or other reasons, we determined the value theof other assets has been impaired. These other assets include trade name at fair value, which resulted in the impairment chargenames of $3.0$33.7 million and intangible assets of $181.7 million.
The valuation of reporting units requires judgment in estimating future cash flows, discount rates and estimated product life cycles. In making these judgments, we evaluate the financial health of the business, including such factors as industry performance, changes in technology and operating cash flows.
37
We used available market data and a discounted cash flow analysis in completing our 20112013 annual impairment test. We believe that our cash flow estimates are reasonable based upon the historical cash flows and future operating and strategic plans of our reporting units. In addition to cash flow estimates, our valuations are sensitive to the rate used to discount cash flows and future growth assumptions. TheExcept for Souriau, the fair value of all our reporting units exceeds its book value by greater than 30%20%. A 0.5% change in the discount rate used in the cash flow analysis would result in a change in the fair value of our other reporting units of approximately $94.9$83.6 million. A 0.5% change in the growth rate assumed in the calculation of the terminal value of cash flows would result in a change in the fair value of our other reporting units by $63.8$53.4 million. None of these changes would have resulted in any of our other reporting units to be impaired.
Impairment of Long-lived Assets
Long-lived assets that are to be disposed of are required to be reported at the lower of its carrying amount or fair value less cost to sell. An asset (other than goodwill and indefinite-lived intangible assets) is considered impaired when estimated future cash flows are less than the carrying amount of the asset. The first step (Step One) of an impairment test of long-lived assets is to determine the amount of future undiscounted cash flow of the long-lived asset. In the event the undiscounted future cash flow is less than the carrying amount of the long-lived asset, a second step is required (Step Two), and the long-lived asset is adjusted to its estimated fair value. Fair value is generally determined based upon estimated discounted future cash flows.
We performed a Step One impairment test of property, plant and equipment with a net book value of $28.0 million at our non-U.S. flare countermeasure operation. Our non-U.S. flare countermeasure operation incurred an operating loss of $9.8 million in fiscal 2011. We determined that the undiscounted future cash flow of the business was significantly in excess of the book value of property, plant and equipment, and accordingly, no Step Two impairment test was required.
As we have grown through acquisitions, we have accumulated $645.1$533.8 million of definite-lived intangible assets. The amount of any annual or interim impairment could be significant and could have a material adverse effect on our reported financial results for the period in which the charge is taken.
Contingencies
We are party to various lawsuits and claims, both as plaintiff and defendant, and have contingent liabilities arising from the conduct of business. We are covered by insurance for general liability, product liability, workers’ compensation and certain environmental exposures, subject to certain deductible limits. We are self-insured for amounts less than our deductible and where no insurance is available. An estimated loss from a contingency should be accrued by a charge to income if it is probable that an asset has been impaired or a liability has been incurred and the amount of the loss can be reasonably estimated. Disclosure of a contingency is required if there is at least a reasonable possibility that a loss has been incurred. We evaluate, among other factors, the degree of probability of an unfavorable outcome and the ability to make a reasonable estimate of the amount of loss.
40
Pension and Other Post-Retirement Benefits
We account for pension expense using the end of the fiscal year as our measurement date. We select appropriate assumptions including discount rate, rate of increase in future compensation levels and assumed long-term rate of return on plan assets and expected annual increases in costs of medical and other health care benefits in regard to our post-retirement benefit obligations. Our assumptions are based upon historical results, the current economic environment and reasonable expectations of future events. Actual results which vary from our assumptions are accumulated and amortized over future periods, and accordingly, are recognized in expense in these periods. Significant differences between our assumptions and actual experience or significant changes in assumptions could impact the pension costs and the pension obligation.
Income Taxes
The objectives of accounting for income taxes are to recognize the amount of taxes payable or refundable for the current year and deferred tax liabilities and assets for the future tax consequences of events that have been recognized in our financial statements or tax returns. Judgment is required in assessing the future tax consequences of events that have been recognized in our financial statements or tax returns. Variations in the actual outcome of these future tax consequences could materially impact our financial position and results of operations.
38
Recent Accounting Pronouncements
In September 2011, the Financial Accounting Standards Board (FASB) amended guidance related to the testing of goodwill for impairment. The revised standard is intended to reduce the cost and complexity of the annual goodwill impairment test by providing entities an option to perform a qualitative assessment to determine whether further impairment testing is necessary. The Company will adopt this guidance in the first quarter of 2012 and does not expect a significant impact to the Company’s financial statements.
In June 2011, the FASB amended requirements for the presentation of other comprehensive income (OCI), requiring presentation of comprehensive income in either a single, continuous statement of comprehensive income or on separate but consecutive statements, the statement of operations and the statement of OCI. The amendment is effective for the Company at the beginning of fiscal year 2013, with early adoption permitted. The adoption of this guidance will not impact the Company’s financial position, results of operations or cash flows and will only impact the presentation of OCI on the financial statements.
In May 2011, the FASB amended the guidance regarding fair value measurement and disclosure. The amended guidance clarifies the application of existing fair value measurement and disclosure requirements. The amendment is effective for the Company at the beginning of fiscal 2012, with early adoption prohibited. The adoption of this amendment is not expected to materially affect the Company’s financial statements.
Item 7A. Quantitative and Qualitative Disclosures about Market Risk
We hereby incorporate by reference the information set forth under the section “Disclosures About Market Risk” under Item 7.
41
Item 8. Financial Statements and Supplementary Data
Consolidated Statement of Operations
In Thousands, Except Per Share Amounts
| | | | | | | | | | | | |
For Each of the Three Fiscal Years in the Period Ended October 28, 2011 | | 2011 | | | 2010 | | | 2009 | |
| | | |
Net Sales | | $ | 1,717,985 | | | $ | 1,526,601 | | | $ | 1,407,459 | |
Cost of Sales | | | 1,128,265 | | | | 1,010,390 | | | | 954,161 | |
| |
| | | 589,720 | | | | 516,211 | | | | 453,298 | |
Expenses | | | | | | | | | | | | |
Selling, general and administrative | | | 304,154 | | | | 258,290 | | | | 235,483 | |
Research, development and engineering | | | 94,505 | | | | 69,753 | | | | 64,456 | |
Other (income) expense | | | (6,853 | ) | | | (8 | ) | | | 7,970 | |
| |
Total Expenses | | | 391,806 | | | | 328,035 | | | | 307,909 | |
| | | |
Operating Earnings From Continuing Operations | | | 197,914 | | | | 188,176 | | | | 145,389 | |
Interest income | | | (1,615 | ) | | | (960 | ) | | | (1,634 | ) |
Interest expense | | | 40,216 | | | | 33,181 | | | | 28,689 | |
Loss on extinguishment of debt | | | 831 | | | | 1,206 | | | | 0 | |
| |
| | | |
Income From Continuing Operations | | | | | | | | | | | | |
Before Income Taxes | | | 158,482 | | | | 154,749 | | | | 118,334 | |
Income Tax Expense | | | 24,938 | | | | 24,504 | | | | 12,549 | |
| |
Income From Continuing Operations | | | | | | | | | | | | |
Including Noncontrolling Interests | | | 133,544 | | | | 130,245 | | | | 105,785 | |
| | | |
Income Attributable to Noncontrolling Interests | | | (457 | ) | | | (206 | ) | | | (217 | ) |
| |
Income From Continuing Operations | | | | | | | | | | | | |
Attributable to Esterline, Net of Tax | | | 133,087 | | | | 130,039 | | | | 105,568 | |
| | | |
Income (Loss) From Discontinued Operations | | | | | | | | | | | | |
Attributable to Esterline, Net of Tax | | | (47 | ) | | | 11,881 | | | | 14,230 | |
| |
| | | |
Net Earnings Attributable to Esterline | | $ | 133,040 | | | $ | 141,920 | | | $ | 119,798 | |
| |
39
Consolidated Statement of Operations
In Thousands, Except Per Share Amounts
| | | | | | | | | | | | |
For Each of the Three Fiscal Years in the Period Ended October 28, 2011 | | 2011 | | | 2010 | | | 2009 | |
| | | |
Earnings Per Share Attributable to Esterline – Basic: | | | | | | | | | | | | |
Continuing operations | | $ | 4.36 | | | $ | 4.34 | | | $ | 3.55 | |
Discontinued operations | | | .00 | | | | .39 | | | | .48 | |
| |
| | | |
Earnings Per Share Attributable to
Esterline – Basic | | $ | 4.36 | | | $ | 4.73 | | | $ | 4.03 | |
| |
| | | |
Earnings Per Share Attributable to Esterline – Diluted: | | | | | | | | | | | | |
Continuing operations | | $ | 4.27 | | | $ | 4.27 | | | $ | 3.52 | |
Discontinued operations | | | .00 | | | | .39 | | | | .48 | |
| |
| | | |
Earnings Per Share Attributable to
Esterline – Diluted | | $ | 4.27 | | | $ | 4.66 | | | $ | 4.00 | |
| |
| | | | | | | | | | | | |
For Each of the Three Fiscal Years in the Period Ended October 25, 2013 | | 2013 | | | 2012 | | | 2011 | |
| | | |
Net Sales | | $ | 1,969,754 | | | $ | 1,992,318 | | | $ | 1,717,985 | |
Cost of Sales | | | 1,243,758 | | | | 1,273,365 | | | | 1,128,265 | |
| |
| | | 725,996 | | | | 718,953 | | | | 589,720 | |
Expenses | | | | | | | | | | | | |
Selling, general and administrative | | | 391,147 | | | | 382,887 | | | | 304,154 | |
Research, development and engineering | | | 95,736 | | | | 107,745 | | | | 94,505 | |
Gain on sale of product line | | | (2,264 | ) | | | 0 | | | | 0 | |
Gain on settlement of contingency | | | 0 | | | | (11,891 | ) | | | 0 | |
Goodwill impairment | | | 3,454 | | | | 52,169 | | | | 0 | |
Other income | | | 0 | | | | (1,263 | ) | | | (6,853 | ) |
| |
Total Expenses | | | 488,073 | | | | 529,647 | | | | 391,806 | |
| | | |
Operating Earnings From Continuing Operations | | | 237,923 | | | | 189,306 | | | | 197,914 | |
Interest income | | | (539 | ) | | | (465 | ) | | | (1,615 | ) |
Interest expense | | | 39,667 | | | | 46,238 | | | | 40,216 | |
Loss on extinguishment of debt | | | 946 | | | | 0 | | | | 831 | |
| |
| | | |
Earnings From Continuing Operations Before Income Taxes | | | 197,849 | | | | 143,533 | | | | 158,482 | |
Income Tax Expense | | | 30,085 | | | | 29,958 | | | | 24,938 | |
| |
Earnings From Continuing Operations Including Noncontrolling Interests | | | 167,764 | | | | 113,575 | | | | 133,544 | |
| | | |
Earnings Attributable to Noncontrolling Interests | | | (1,730 | ) | | | (1,040 | ) | | | (457 | ) |
| |
Earnings From Continuing Operations Attributable to Esterline, Net of Tax | | | 166,034 | | | | 112,535 | | | | 133,087 | |
| | | |
Loss From Discontinued Operations Attributable to Esterline, Net of Tax | | | (1,300 | ) | | | 0 | | | | (47 | ) |
| |
| | | |
Net Earnings Attributable to Esterline | | $ | 164,734 | | | $ | 112,535 | | | $ | 133,040 | |
| |
| | |
Earnings (Loss) Per Share Attributable to Esterline – Basic: | | | | | | | | | |
Continuing operations | | $ | 5.32 | | | $ | 3.66 | | | $ | 4.36 | |
Discontinued operations | | | (.04 | ) | | | .00 | | | | .00 | |
| |
| | | |
Earnings (Loss) Per Share Attributable to
Esterline – Basic | | $ | 5.28 | | | $ | 3.66 | | | $ | 4.36 | |
| |
| | |
Earnings (Loss) Per Share Attributable to Esterline – Diluted: | | | | | | | | | |
Continuing operations | | $ | 5.23 | | | $ | 3.60 | | | $ | 4.27 | |
Discontinued operations | | | (.04 | ) | | | .00 | | | | .00 | |
| |
| | | |
Earnings (Loss) Per Share Attributable to
Esterline – Diluted | | $ | 5.19 | | | $ | 3.60 | | | $ | 4.27 | |
| |
See Notes to Consolidated Financial Statements.
4042
Consolidated Balance Sheet
In Thousands, Except Share and Per Share Amounts
| | | | | | | | | | | | |
| As of October 28, 2011 and October 29, 2010 | | 2011 | | | 2010 | | |
| As of October 25, 2013 and October 26, 2012 | | | 2013 | | | 2012 | |
| Assets | | | | | | | | |
| Current Assets | | | | | | | | |
Cash and cash equivalents | | $ | 185,035 | | | $ | 422,120 | | | $ | 179,178 | | | $ | 160,675 | |
Cash in escrow | | | 5,011 | | | | 0 | | | | 4,018 | | | | 5,016 | |
Accounts receivable, net of allowances
of $7,063 and $4,865 | | | 369,826 | | | | 309,242 | | |
Accounts receivable, net of allowances
of $9,215 and $9,029 | | | | 383,666 | | | | 383,362 | |
Inventories | | | 402,548 | | | | 262,373 | | | | 447,663 | | | | 409,837 | |
Income tax refundable | | | 2,857 | | | | 17,806 | | | | 6,526 | | | | 4,832 | |
Deferred income tax benefits | | | 48,251 | | | | 37,539 | | | | 47,277 | | | | 46,000 | |
Prepaid expenses | | | 19,245 | | | | 16,264 | | | | 18,183 | | | | 21,340 | |
Other current assets | | | 6,540 | | | | 11,241 | | | | 5,204 | | | | 4,631 | |
| | | | |
Total Current Assets | | | 1,039,313 | | | | 1,076,585 | | | | 1,091,715 | | | | 1,035,693 | |
| Property, Plant and Equipment | | | | | | | | |
Land | | | 34,029 | | | | 28,583 | | | | 32,785 | | | | 32,597 | |
Buildings | | | 225,600 | | | | 186,435 | | | | 247,885 | | | | 231,210 | |
Machinery and equipment | | | 410,291 | | | | 330,986 | | | | 487,191 | | | | 437,734 | |
| | | | |
| | | 669,920 | | | | 546,004 | | | | 767,861 | | | | 701,541 | |
Accumulated depreciation | | | 301,504 | | | | 272,234 | | | | 396,664 | | | | 345,140 | |
| | | | |
| | | 368,416 | | | | 273,770 | | | | 371,197 | | | | 356,401 | |
| Other Non-Current Assets | | | | | | | | |
Goodwill | | | 1,163,725 | | | | 739,730 | | | | 1,128,977 | | | | 1,098,962 | |
Intangibles, net | | | 693,915 | | | | 389,017 | | | | 580,949 | | | | 609,045 | |
Debt issuance costs, net of accumulated
amortization of $2,700 and $4,536 | | | 10,695 | | | | 7,774 | | |
Debt issuance costs, net of accumulated
amortization of $4,359 and $4,577 | | | | 6,211 | | | | 8,818 | |
Deferred income tax benefits | | | 79,605 | | | | 87,622 | | | | 71,840 | | | | 97,952 | |
Other assets | | | 22,917 | | | | 13,240 | | | | 11,223 | | | | 20,246 | |
| | | | |
Total Assets | | $ | 3,378,586 | | | $ | 2,587,738 | | | $ | 3,262,112 | | | $ | 3,227,117 | |
| | | | |
See Notes to Consolidated Financial Statements.
4143
| | | | | | | | | | | | |
| As of October 28, 2011 and October 29, 2010 | | 2011 | | | 2010 | | |
| As of October 25, 2013 and October 26, 2012 | | | 2013 | | | 2012 | |
| Liabilities and Shareholders’ Equity | | | | | | | | |
| Current Liabilities | | | | | | | | |
Accounts payable | | $ | 119,888 | | | $ | 82,275 | | | $ | 123,597 | | | $ | 108,689 | |
Accrued liabilities | | | 270,422 | | | | 215,094 | | | | 253,561 | | | | 269,553 | |
Credit facilities | | | 5,000 | | | | 1,980 | | |
Current maturities of long-term debt | | | 11,595 | | | | 12,646 | | | | 21,279 | | | | 10,610 | |
Deferred income tax liabilities | | | 9,538 | | | | 7,155 | | | | 2,307 | | | | 5,125 | |
Federal and foreign income taxes | | | 1,918 | | | | 5,227 | | | | 7,348 | | | | 2,369 | |
| | | | |
Total Current Liabilities | | | 418,361 | | | | 324,377 | | | | 408,092 | | | | 396,346 | |
| Long-Term Liabilities | | | | | | | | |
Credit facilities | | | 360,000 | | | | 0 | | | | 130,000 | | | | 240,000 | |
Long-term debt, net of current maturities | | | 660,028 | | | | 598,972 | | | | 537,859 | | | | 598,060 | |
Deferred income tax liabilities | | | 238,709 | | | | 127,081 | | | | 193,119 | | | | 205,198 | |
Pension and post-retirement obligations | | | 107,877 | | | | 105,333 | | | | 68,102 | | | | 132,074 | |
Other liabilities | | | 19,693 | | | | 16,476 | | | | 40,188 | | | | 34,904 | |
| Shareholders’ Equity | | | | | | | | |
Common stock, par value $.20 per share,
authorized 60,000,000 shares, issued and
outstanding 30,613,448 and 30,279,509 shares | | | 6,123 | | | | 6,056 | | |
Common stock, par value $.20 per share,
authorized 60,000,000 shares, issued and
outstanding 31,441,949 and 30,869,390 shares | | | | 6,288 | | | | 6,174 | |
Additional paid-in capital | | | 551,703 | | | | 528,724 | | | | 604,511 | | | | 569,235 | |
Retained earnings | | | 1,007,821 | | | | 874,781 | | | | 1,285,090 | | | | 1,120,356 | |
Accumulated other comprehensive income (loss) | | | (2,812 | ) | | | 3,235 | | |
Accumulated other comprehensive loss | | | | (22,284 | ) | | | (85,284 | ) |
| | | | |
Total Esterline shareholders’ equity | | | 1,562,835 | | | | 1,412,796 | | | | 1,873,605 | | | | 1,610,481 | |
Noncontrolling interests | | | 11,083 | | | | 2,703 | | | | 11,147 | | | | 10,054 | |
| | | | |
Total Shareholders’ Equity | | | 1,573,918 | | | | 1,415,499 | | | | 1,884,752 | | | | 1,620,535 | |
| | | | |
Total Liabilities and Shareholders’ Equity | | $ | 3,378,586 | | | $ | 2,587,738 | | | $ | 3,262,112 | | | $ | 3,227,117 | |
| | | | |
See Notes to Consolidated Financial Statements.
4244
Consolidated Statement of Cash Flows
In Thousands
| | | | | | | | | | | | |
For Each of the Three Fiscal Years in the Period Ended October 28, 2011 | | 2011 | | | 2010 | | | 2009 | |
| | | |
Cash Flows Provided (Used) by Operating Activities | | | | | | | | | | | | |
Net earnings including noncontrolling interests | | $ | 133,497 | | | $ | 142,126 | | | $ | 120,015 | |
Adjustments to reconcile net earnings including
noncontrolling interests to net cash provided | | | | | | | | | | | | |
(used) by operating activities: | | | | | | | | | | | | |
Depreciation and amortization | | | 84,658 | | | | 72,117 | | | | 71,511 | |
Deferred income tax | | | (12,345 | ) | | | (9,997 | ) | | | (11,468 | ) |
Share-based compensation | | | 7,963 | | | | 7,134 | | | | 7,349 | |
Gain on sale of discontinued operations | | | 0 | | | | (14,625 | ) | | | (26,481 | ) |
Gain on sale of capital assets | | | (3,684 | ) | | | 0 | | | | 0 | |
Working capital changes, net of
effect of acquisitions: | | | | | | | | | | | | |
Accounts receivable | | | 23,811 | | | | (39,164 | ) | | | 54,546 | |
Inventories | | | 15 | | | | 10,734 | | | | 6,054 | |
Prepaid expenses | | | 667 | | | | 1,114 | | | | (3,890 | ) |
Other current assets | | | (2,575 | ) | | | 2,285 | | | | (15,428 | ) |
Accounts payable | | | (2,942 | ) | | | 856 | | | | (18,787 | ) |
Accrued liabilities | | | (10,509 | ) | | | 21,303 | | | | (11,933 | ) |
Federal and foreign income taxes | | | (816 | ) | | | (6,607 | ) | | | 737 | |
Other liabilities | | | (22,983 | ) | | | (7,571 | ) | | | (7,663 | ) |
Other, net | | | (2,328 | ) | | | 96 | | | | (7,893 | ) |
| |
| | | 192,429 | | | | 179,801 | | | | 156,669 | |
Cash Flows Provided (Used)
by Investing Activities | | | | | | | | | | | | |
Purchases of capital assets | | | (49,507 | ) | | | (45,540 | ) | | | (59,184 | ) |
Escrow deposit | | | (14,033 | ) | | | 0 | | | | 0 | |
Proceeds from sale of discontinued
operations, net of cash | | | 0 | | | | 24,994 | | | | 62,944 | |
Proceeds from sale of capital assets | | | 9,453 | | | | 595 | | | | 1,089 | |
Acquisitions of businesses,
net of cash acquired | | | (814,934 | ) | | | (768 | ) | | | (255,206 | ) |
| |
| | | (869,021 | ) | | | (20,719 | ) | | | (250,357 | ) |
| | | | | | | | | | | | |
For Each of the Three Fiscal Years in the Period Ended October 25, 2013 | | 2013 | | | 2012 | | | 2011 | |
| | | |
Cash Flows Provided (Used)
by Operating Activities | | | | | | | | | | | | |
Net earnings including noncontrolling interests | | $ | 166,464 | | | $ | 113,575 | | | $ | 133,497 | |
Adjustments to reconcile net earnings including
noncontrolling interests to net cash provided
(used) by operating activities: | | | | | | | | | | | | |
Depreciation and amortization | | | 112,132 | | | | 107,792 | | | | 84,658 | |
Deferred income tax | | | (24,419 | ) | | | (25,410 | ) | | | (12,345 | ) |
Share-based compensation | | | 9,575 | | | | 9,543 | | | | 7,963 | |
Gain on sale of capital assets | | | (2,303 | ) | | | (944 | ) | | | (9,453 | ) |
Gain on settlement of contingency | | | 0 | | | | (11,891 | ) | | | 0 | |
Goodwill impairment | | | 3,454 | | | | 52,169 | | | | 0 | |
Working capital changes, net of
effect of acquisitions: | | | | | | | | | | | | |
Accounts receivable | | | 5,015 | | | | (22,381 | ) | | | 23,811 | |
Inventories | | | (28,317 | ) | | | (19,303 | ) | | | 15 | |
Prepaid expenses | | | 3,604 | | | | (2,506 | ) | | | 667 | |
Other current assets | | | (1,558 | ) | | | (1,002 | ) | | | (2,575 | ) |
Accounts payable | | | 9,008 | | | | (6,482 | ) | | | (2,942 | ) |
Accrued liabilities | | | (3,120 | ) | | | 14,879 | | | | (10,509 | ) |
Federal and foreign income taxes | | | 5,786 | | | | (2,858 | ) | | | (816 | ) |
Other liabilities | | | (7,602 | ) | | | (14,702 | ) | | | (22,983 | ) |
Other, net | | | 3,053 | | | | 3,692 | | | | 3,441 | |
| |
| | | 250,772 | | | | 194,171 | | | | 192,429 | |
Cash Flows Provided (Used)
by Investing Activities | | | | | | | | | | | | |
Purchases of capital assets | | | (55,335 | ) | | | (49,446 | ) | | | (49,507 | ) |
Escrow deposit | | | 0 | | | | 0 | | | | (14,033 | ) |
Proceeds from sale of capital assets | | | 2,303 | | | | 944 | | | | 9,453 | |
Acquisition of businesses,
net of cash acquired | | | (40,689 | ) | | | 0 | | | | (814,934 | ) |
| |
| | | (93,721 | ) | | | (48,502 | ) | | | (869,021 | ) |
4345
| | | | | | | | | | | | | | | | | | |
For Each of the Three Fiscal Years in the Period Ended October 28, 2011 | | 2011 | | | 2010 | | | 2009 | | |
For Each of the Three Fiscal Years in the Period Ended October 25, 2013 | | | 2013 | | | 2012 | | | 2011 | |
| Cash Flows Provided (Used)
by Financing Activities | | | | | | | | | | | | |
Proceeds provided by stock issuance
under employee stock plans | | | 13,253 | | | | 13,654 | | | | 3,137 | | | | 22,854 | | | | 7,658 | | | | 13,253 | |
Excess tax benefits from stock option exercises | | | 1,830 | | | | 3,488 | | | | 119 | | | | 2,961 | | | | 382 | | | | 1,830 | |
Proceeds from long-term credit facilities | | | 400,014 | | | | (4,015 | ) | | | 99 | | |
Repayment of long-term debt and credit facilities | | | (164,916 | ) | | | (183,082 | ) | | | (34,444 | ) | |
Repayment of long-term credit facilities | | | | (110,000 | ) | | | (150,000 | ) | | | (35,000 | ) |
Repayment of long-term debt | | | | (235,428 | ) | | | (73,145 | ) | | | (129,916 | ) |
Proceeds from issuance of long-term credit facilities | | | | 175,000 | | | | 30,000 | | | | 400,014 | |
Proceeds from issuance of long-term debt | | | 176,875 | | | | 250,000 | | | | 125,000 | | | | 0 | | | | 0 | | | | 176,875 | |
Proceeds from government assistance | | | 15,000 | | | | 9,168 | | | | 11,145 | | | | 5,092 | | | | 17,285 | | | | 15,000 | |
Dividends paid to noncontrolling interests | | | (238 | ) | | | (234 | ) | | | (283 | ) | | | (1,048 | ) | | | 0 | | | | (238 | ) |
Debt and other issuance costs | | | (5,398 | ) | | | (4,719 | ) | | | (1,258 | ) | | | (454 | ) | | | 0 | | | | (5,398 | ) |
| | | | |
| | | 436,420 | | | | 84,260 | | | | 103,515 | | | | (141,023 | ) | | | (167,820 | ) | | | 436,420 | |
| Effect of Foreign Exchange Rates on Cash
and Cash Equivalents | | | 3,087 | | | | 1,984 | | | | 6,322 | | | | 2,475 | | | | (2,209 | ) | | | 3,087 | |
| | | | |
| Net Increase (Decrease) in Cash
and Cash Equivalents | | | (237,085 | ) | | | 245,326 | | | | 16,149 | | | | 18,503 | | | | (24,360 | ) | | | (237,085 | ) |
Cash and Cash Equivalents
– Beginning of Year | | | 422,120 | | | | 176,794 | | | | 160,645 | | | | 160,675 | | | | 185,035 | | | | 422,120 | |
| | | | |
Cash and Cash Equivalents – End of Year | | $ | 185,035 | | | $ | 422,120 | | | $ | 176,794 | | | $ | 179,178 | | | $ | 160,675 | | | $ | 185,035 | |
| | | | |
| Supplemental Cash Flow Information | | | | | | | | | | | | |
Cash paid for interest | | $ | 38,361 | | | $ | 30,629 | | | $ | 27,988 | | | $ | 38,376 | | | $ | 43,854 | | | $ | 38,361 | |
Cash paid for taxes | | | 45,074 | | | | 53,704 | | | | 40,293 | | | | 43,842 | | | | 54,366 | | | | 45,074 | |
| Supplemental Non-cash Investing and
Financing Activities | | | | | | | | | | | | |
Capital asset and lease obligation additions | | | 0 | | | | 8,139 | | | | 28,202 | | | | 11,691 | | | | 0 | | | | 0 | |
See Notes to Consolidated Financial Statements.
4446
Consolidated Statement of Shareholders’ Equity
EquityNoncontrolling Interest, and Comprehensive Income (Loss)
In Thousands, Except Per Share Amounts
| | | | | | | | | | | | | | | | | | |
For Each of the Three Fiscal Years in the Period Ended October 28, 2011 | | 2011 | | 2010 | | 2009 | | |
For Each of the Three Fiscal Years in the Period Ended October 25, 2013 | | | 2013 | | | 2012 | | | 2011 | |
| Common Stock, Par Value $.20 Per Share | | | | | | | | | | | | |
Beginning of year | | $ | 6,056 | | | $ | 5,955 | | | $ | 5,927 | | | $ | 6,174 | | | $ | 6,123 | | | $ | 6,056 | |
Shares issued under stock option plans | | | 67 | | | | 101 | | | | 28 | | | | 114 | | | | 51 | | | | 67 | |
| | | | |
End of year | | | 6,123 | | | | 6,056 | | | | 5,955 | | | | 6,288 | | | | 6,174 | | | | 6,123 | |
| Additional Paid-in Capital | | | | | | | | | | | | |
Beginning of year | | | 528,724 | | | | 504,549 | | | | 493,972 | | | | 569,235 | | | | 551,703 | | | | 528,724 | |
Shares issued under stock option plans | | | 15,016 | | | | 17,041 | | | | 3,228 | | | | 25,701 | | | | 7,989 | | | | 15,016 | |
Share-based compensation expense | | | 7,963 | | | | 7,134 | | | | 7,349 | | | | 9,575 | | | | 9,543 | | | | 7,963 | |
| | | | |
End of year | | | 551,703 | | | | 528,724 | | | | 504,549 | | | | 604,511 | | | | 569,235 | | | | 551,703 | |
| Retained Earnings | | | | | | | | | | | | |
Beginning of year | | | 874,781 | | | | 732,861 | | | | 613,063 | | | | 1,120,356 | | | | 1,007,821 | | | | 874,781 | |
Net earnings | | | 133,040 | | | | 141,920 | | | | 119,798 | | | | 164,734 | | | | 112,535 | | | | 133,040 | |
| | | | |
End of year | | | 1,007,821 | | | | 874,781 | | | | 732,861 | | | | 1,285,090 | | | | 1,120,356 | | | | 1,007,821 | |
| Accumulated Other Comprehensive Income (Loss) | | | | | | | Accumulated Other Comprehensive Income (Loss) | | | | | |
Beginning of year | | | 3,235 | | | | 9,656 | | | | (86,621 | ) | | | (85,284 | ) | | | (2,812 | ) | | | 3,235 | |
Change in fair value of derivative
financial instruments, net of tax (expense)
benefit of $2,282, $1,045 and $(11,072) | | | (5,934 | ) | | | (1,407 | ) | | | 24,179 | | |
Change in pension and post-retirement
obligations, net of tax (expense) benefit
of $5,060, $3,741 and $11,636 | | | (9,986 | ) | | | (10,618 | ) | | | (20,265 | ) | |
Change in fair value of derivative
financial instruments, net of tax
benefit of $913, $1,158 and $2,282 | | | | (3,119 | ) | | | (2,399 | ) | | | (5,934 | ) |
Change in pension and post-retirement
obligations, net of tax benefit (expense)
of $(22,897), $11,626 and $5,060 | | | | 42,994 | | | | (23,708 | ) | | | (9,986 | ) |
Foreign currency translation adjustment | | | 9,873 | | | | 5,604 | | | | 92,363 | | | | 23,125 | | | | (56,365 | ) | | | 9,873 | |
| | | | |
End of year | | | (2,812 | ) | | | 3,235 | | | | 9,656 | | | | (22,284 | ) | | | (85,284 | ) | | | (2,812 | ) |
| Noncontrolling Interests | | | | | | | | | | | | |
Beginning of year | | | 2,703 | | | | 2,731 | | | | 2,797 | | | | 10,054 | | | | 11,083 | | | | 2,703 | |
Shares repurchases | | | | 0 | | | | (2,069 | ) | | | 0 | |
Noncontrolling interest resulting
from an acquisition | | | | 0 | | | | 0 | | | | 8,160 | |
Net changes in equity attributable to
noncontrolling interest | | | 8,380 | | | | (28 | ) | | | (66 | ) | | | 1,093 | | | | 1,040 | | | | 220 | |
| | | | |
End of year | | | 11,083 | | | | 2,703 | | | | 2,731 | | | | 11,147 | | | | 10,054 | | | | 11,083 | |
| | | | |
Total Shareholders’ Equity | | $ | 1,573,918 | | | $ | 1,415,499 | | | $ | 1,255,752 | | | $ | 1,884,752 | | | $ | 1,620,535 | | | $ | 1,573,918 | |
| | | | |
| Comprehensive Income (Loss) | | | | | | | |
Comprehensive Income | | | | | | | |
Net earnings | | $ | 133,040 | | | $ | 141,920 | | | $ | 119,798 | | | $ | 164,734 | | | $ | 112,535 | | | $ | 133,040 | |
Change in fair value of derivative
financial instruments, net of tax | | | (5,934 | ) | | | (1,407 | ) | | | 24,179 | | | | (3,119 | ) | | | (2,399 | ) | | | (5,934 | ) |
Change in pension and post-retirement
obligations, net of tax | | | (9,986 | ) | | | (10,618 | ) | | | (20,265 | ) | | | 42,994 | | | | (23,708 | ) | | | (9,986 | ) |
Foreign currency translation adjustment | | | 9,873 | | | | 5,604 | | | | 92,363 | | | | 23,125 | | | | (56,365 | ) | | | 9,873 | |
| | | | |
Comprehensive Income (Loss) | | $ | 126,993 | | | $ | 135,499 | | | $ | 216,075 | | |
Comprehensive Income | | | $ | 227,734 | | | $ | 30,063 | | | $ | 126,993 | |
| | | | |
See Notes to Consolidated Financial Statements.
4547
Notes to Consolidated Financial Statements
NOTE 1: Accounting Policies
Nature of Operations
Esterline Technologies Corporation (the Company) designs, manufactures and markets highly engineered products. The Company serves the aerospace and defense industry, primarily in the United States and Europe. The Company also serves the industrial/commercial and medical markets.
Principles of Consolidation and Basis of Presentation
The consolidated financial statements include the accounts of the Company and all subsidiaries. All significant intercompany accounts and transactions have been eliminated. Classifications have been changed for certain amounts in prior periods to conform with the current year’s presentation. The Company’s fiscal year ends on the last Friday of October.
Management Estimates
To prepare financial statements in conformity with U.S. generally accepted accounting principles, management is required to make estimates and assumptions that affect the reported amounts of assets and liabilities, disclosure of contingent assets and liabilities at the date of the financial statements, and the reported amounts of revenues and expenses during the reporting period. Actual results could differ from those estimates.
Concentration of Risks
The Company’s products are principally focused on the aerospace and defense industry, which includes military and commercial aircraft original equipment manufacturers and their suppliers, commercial airlines, and the United States and foreign governments. Sales directly to the U.S. government aggregated 10%6% and 7% of sales in fiscal 20112013 and 2010.2012, respectively. Accordingly, the Company’s current and future financial performance is dependent on the economic condition of the aerospace and defense industry. The commercial aerospace market hasand defense markets have historically been subject to cyclical downturns during periods of weak economic conditions or material changes arising from domestic or international events. Management believes that the Company’s sales are fairly well balanced across its customer base, which includes not only aerospace and defense customers but also medical and industrial commercial customers. However, material changes in the economic conditions of the aerospace industry could have a material effect on the Company’s results of operations, financial position or cash flows.
Revenue Recognition
The Company recognizes revenue when the title and risk of loss have passed to the customer, there is persuasive evidence of an agreement, delivery has occurred or services have been rendered, the price is determinable, and the collectibilitycollectability is reasonably assured. The Company recognizes product revenues at the point of shipment or delivery in accordance with the terms of sale. Sales are net of returns and allowances. Returns and allowances are not significant because products are manufactured to customer specification and are covered by the terms of the product warranty.
Revenues and profits on fixed-price contracts with significant engineering as well as production requirements are recorded based on the achievement of contractual milestones and the ratio of total actual incurred costs to date to total estimated costs for each contract (cost-to-cost method). Types of milestones include design review and prototype completion. The Company reviews cost performance and estimates to complete on its ongoing contracts at least quarterly. The impact of revisions of profit estimates are recognized on a cumulative catch-up basis in the period in which the revisions are made. Provisions for anticipated losses on contracts are recorded in the period they become evident. When change orders have been approved by both the company and the customer for both scope and price and realization is deemed probable, the original contract price is adjusted and revenues are recognized on contract performance (as determined by the achievement of contractual milestones and the cost-to-cost method). For partially approved change orders, costs attributable to unpriced change orders are treated as costs of the contract performance in the period the costs are incurred. Claims are also recognized as contract revenue when approved by both the company and the customer, based on contract performance.
Research and Development
Expenditures for internally-funded research and development are expensed as incurred. Customer-funded research and development projects performed under contracts are accounted for as work in process as work is performed and recognized as cost of sales and sales under the proportional performance method. Research and development expenditures are net of government assistance and tax subsidies, which are not contingent upon paying income tax. In addition, government assistance for research and development is recorded as a reduction of research and development expense when repayment royalties are contingent upon sales generated directly from the funded research and development. If reimbursement is not tied directly to sales generated from the funded research and development, the assistance is accounted for as a loan until the criteria for forgiveness has been met.
4648
Financial Instruments
Fair Value of Financial Instruments
The Company’s financial instruments consist primarily of cash and cash equivalents, accounts receivable, accounts payable,short-term borrowings, long-term debt, foreign currency forward contracts, and interest rate swap agreements. The carrying amounts of cash and cash equivalents, accounts receivable, and accounts payable approximate their respective fair values because of theshort-term maturities or expected settlement dates of these instruments. The fair market value of the Company’s long-term debt and short-term borrowings was estimated at $1.0 billion$711.6 million and $640.5$882.5 million at fiscal year end 20112013 and 2010,2012, respectively. These estimates were derived using discounted cash flows with interest rates currently available to the Company for issuance of debt with similar terms and remaining maturities.
Foreign Currency Exchange Risk Management
The Company is subject to risks associated with fluctuations in foreign currency exchange rates from the sale of products in currencies other than its functional currency. Furthermore, the Company has assets denominated in foreign currencies that are not offset by liabilities in such foreign currencies. The Company has significant operations in Canada, France, Germany and the United Kingdom, and accordingly, we may experience gains or losses due to foreign exchange fluctuations.
The Company’s policy is to hedge a portion of its forecasted transactions using forward exchange contracts, with maturities up to 2324 months. These forward contracts have been designated as cash flow hedges. The portion of the net gain or loss on a derivative instrument that is effective as a hedge is reported as a component of other comprehensive income in shareholders’ equity and is reclassified into earnings in the same period during which the hedged transaction affects earnings. The remaining net gain or loss on the derivative in excess of the present value of the expected cash flows of the hedged transaction is recorded in earnings immediately. If a derivative does not qualify for hedge accounting, or a portion of the hedge is deemed ineffective, the change in fair value is recorded in earnings. The amount of hedge ineffectiveness has not been material in any of the three fiscal years in the period ended October 28, 2011.25, 2013. At October 28, 2011,25, 2013, and October 29, 2010,26, 2012, the notional value of foreign currency forward contracts accounted for as a cash flow hedge was $288.9$271.3 million and $205.7$260.7 million, respectively. The fair value of these contracts was $4.6a $2.3 million liability and $10.7a $1.5 million asset at October 28, 2011,25, 2013, and October 29, 2010,26, 2012, respectively. The Company does not enter into any forward contracts for trading purposes.
In February 2006, the Company entered into a U.K. term loan for £57.0 million. The Company designated the U.K. term loan as a hedge of the investment in a certain U.K. business unit. The foreign currency gain or loss that is effective as a hedge is reported as a component of accumulated other comprehensive income in shareholders’ equity. The U.K. term loan was paid off in fiscal 2009. The loss of $4.8 million net of taxes included in Accumulated Other Comprehensive Income will remain until the underlying investment in a certain U.K. business unit is liquidated.
In July 2011, the Company entered into a Euro Term Loan for €125.0 million under the secured credit facility. The Company designated the Euro Term Loan a hedge of the investment in a certain French business unit. The foreign currency gain or loss that is effective as a hedge is reported as a component of accumulated other comprehensive income in shareholders’ equity. To the extent that this hedge is ineffective, the foreign currency gain or loss is recorded in earnings. There was no ineffectiveness in 2011.fiscal 2013 or fiscal 2012. The gain or loss included in Accumulated Other Comprehensive Income will remain until the underlying investment in a certain French business unit is liquidated. The amount of foreign currency translation included in Accumulated Other Comprehensive Income was a gain of $5.1$17.2 million at October 28, 2011.25, 2013.
Interest Rate Risk Management
Depending on the interest rate environment, the Company may enter into interest rate swap agreements to convert the fixed interest rates on notes payable to variable interest rates or terminate any swap agreements in place. These interest rate swap agreements have been designated as fair value hedges. Accordingly, a gain or loss on swap agreements as well as the offsetting loss or gain on the hedged portion of notes payable are recognized in interest expense during the period of the change in fair values. The Company attempts to manage exposure to counterparty credit risk by only entering into agreements with major financial institutions which are expected to be able to fully perform under the terms of the agreement.
In Decemberfiscal 2010, the Company entered into an interest rate swap agreementagreements for $75.0$175.0 million on the $175.0 million Senior Notes due in 2017.2017 Notes. The swap agreementagreements exchanged the fixed interest rate on the 2017 Notes of 6.625% for a variable interest rate onrate. In the $75.0 millionsecond quarter of fiscal 2013, the principal amount outstanding. The variable interest rate is based upon LIBOR plus 4.47%swap agreements were terminated, and was 4.90% at October 28, 2011.
47
In November 2010, the Company entered into an interest rate swap agreement for $100.0 million onredeemed the 2017 Notes with proceeds from the $175.0 million Senior Notes due in 2017.U.S. Term Loan. The swap agreement exchanged the fixed interest rate of 6.625% forCompany recorded a variable interest rategain on the $100.0 millionswap termination of $2.9 million. The gain is included in the principal amount outstanding. The variable interest rate is based upon LIBOR plus 4.87% and was 5.29% at October 28, 2011.
In June 2009,Loss on Extinguishment of Debt in the Company entered into an interest rate swap agreement on the $175.0 million Senior Subordinated Notes due in 2013. The swap agreement exchanged the fixed interest rateConsolidated Statement of 7.75% for a variable interest rate on the $175.0 million principal amount outstanding. The variable interest rate is based upon LIBOR plus 5.37% and was 5.61% at October 30, 2009. The swap was terminated in fourth quarter of fiscal 2010 upon the repayment of the $175.0 million Senior Subordinated Notes due in 2013.
A deferred gain of $3.7 million from terminated swap agreements was recognized in fiscal 2010 upon the repayment of the $175.0 million Senior Subordinated Notes due 2013. A loss on extinguishment of debt was recorded for $1.2 million, which includes the recognition of the previously deferred gains of $3.7 million.Operations.
Depending on the interest rate environment, the Company may enter into interest rate swap agreements to convert the variable interest rates on notes payable to fixed interest rates. These swap agreements are accounted for as cash flow hedges and the fair market value of the hedge instrument is included in Other Comprehensive Income.
The fair market value of the interest rate swaps was estimated by discounting expected cash flows using quoted market interest rates.
49
Foreign Currency Translation
Foreign currency assets and liabilities are translated into their U.S. dollar equivalents based on year endyear-end exchange rates. Revenue and expense accounts are translated at average exchange rates. Aggregate exchange gains and losses arising from the translation of foreign assets and liabilities are included in shareholders’ equity as a component of comprehensive income. Accumulated gain on foreign currency translation adjustment was $68.6$35.4 million, $58.8$12.3 million and $53.2$68.6 million as of the fiscal years ended October 25, 2013, October 26, 2012, and October 28, 2011, October 29, 2010, and October 30, 2009, respectively.
Foreign Currency Transaction Gains and Losses
Foreign currency transaction gains and losses are included in results of operations and are primarily the result of revaluing assets and liabilities denominated in a currency other than the functional currency, gains and losses on forward exchange contracts and the change in value of foreign currency embedded derivatives in backlog. These foreign currency transactions resulted in a $14.2$1.7 million loss in fiscal 2013, a $3.5 million loss in fiscal 2012, and a $13.8 million gain in fiscal 2011, a $6.1 million gain in fiscal 2010, and a $12.6 million loss in fiscal 2009.2011.
Cash Equivalents
Cash equivalents consist of highly liquid investments with original maturities of three months or less at the date of purchase. Fair value of cash equivalents approximates carrying value. Cash equivalents included $29.3 million and $28.8 million in cash for a letter of credit at October 28, 2011, and October 29, 2010, respectively.
Accounts Receivable
Accounts receivable are recorded at the net invoice price for sales billed to customers. Accounts receivable are considered past due when outstanding more than normal trade terms allow. An allowance for doubtful accounts is established when losses are expected to be incurred. Accounts receivable are written off to the allowance for doubtful accounts when the balance is considered to be uncollectible.
Inventories
Inventories are stated at the lower of cost or market using the first-in, first-out (FIFO) or average cost method. Inventory cost includes material, labor and factory overhead. The Company defers pre-production engineering costs as work-in-process inventory in connection with long-term supply arrangements that include contractual guarantees for reimbursement from the customer. Inventory cost adjustments are recorded when inventory is considered to be excess or obsolete based upon an analysis of actual on-hand quantities on a part level basis to forecasted product demand and historical usage.
Property, Plant and Equipment, and Depreciation
Property, plant and equipment is carried at cost and includes expenditures for major improvements. Depreciation is generally provided on the straight-line method based upon estimated useful lives ranging from 15 to 30 years for buildings
48
and 3 to 10 years for machinery and equipment. Depreciation expense was $42.5$55.4 million, $39.5$52.4 million, and $39.2$42.5 million for fiscal years 2011, 20102013, 2012, and 2009,2011, respectively. Assets under capital leases were $38.1$47.1 million at October 28, 2011,25, 2013, and $44.4$38.8 million at October 29, 2010.26, 2012. Amortization expense of assets accounted for as capital leases is included with depreciation expense. The fair value of liabilities related to the retirement of property is recorded when there is a legal or contractual obligation to incur asset retirement costs and the costs can be estimated. The Company records the asset retirement cost by increasing the carrying cost of the underlying property by the amount of the asset retirement obligation. The asset retirement cost is depreciated over the estimated useful life of the underlying property.
Debt Issuance Costs
Costs incurred to issue debt are deferred and amortized as interest expense over the term of the related debt using a method that approximates the effective interest method.
Long-lived Asset Impairments
The carrying amount of long-lived assets is reviewed periodically for impairment. An asset (other than goodwill and indefinite-lived intangible assets) is considered impaired when estimated future undiscounted cash flows are less than the carrying amount of the asset. In the event the carrying amount of such asset is not deemed recoverable, the asset is adjusted to its estimated fair value. Fair value is generally determined based upon estimated discounted future cash flows.
Contingencies
The Company is party to various lawsuits and claims, both as plaintiff and defendant, and has contingent liabilities arising from the conduct of business. The Company is covered by insurance for general liability, product liability, workers’ compensation and certain environmental exposures, subject to certain deductible limits. The Company is self-insured for amounts less than our deductible and where no insurance is available. An estimated loss from a contingency should be accrued by a charge to income if it is probable that an asset has been impaired or a liability has been incurred and the amount of the loss can be reasonably estimated. The Company evaluates, among other factors, the degree of probability of an unfavorable outcome and the ability to make a reasonable estimate of the amount of loss.
50
Goodwill and Intangibles
Goodwill is not amortized, but is tested for impairment at least annually.annually or when circumstances require. A reporting unit is generally defined at the operating segment level or at the component level one level below the operating segment, if said component constitutes a business. Goodwill is allocated to reporting units based upon the purchase price of the acquired unit, the valuation of acquired tangible and intangible assets, and liabilities assumed. When a reporting unit’s carrying value exceeds its estimated fair value, an impairment test is required. This test involves allocating the fair value of the reporting unit to all of the assets and liabilities of that unit, with the excess of fair value over allocated net assets representing the fair value of goodwill. An impairment loss is measured as the amount by which the carrying value of goodwill exceeds the estimated fair value of goodwill.
Intangible assets are amortized over their estimated period of benefit, ranging from 2 to 20 years. Amortization expense is reflected in selling, general and administrative expense on the Consolidated Statement of Operations. The Company periodically evaluates the recoverability of intangible assets and takes into account events or circumstances that warrant revised estimates of useful lives or that indicate that an impairment exists.
Indefinite-lived intangible assets (other than goodwill) are tested annually for impairment or more frequently on an interim basis if circumstances require.
Environmental
Environmental exposures are provided for at the time they are known to exist or are considered probable and reasonably estimable. No provision has been recorded for environmental remediation costs which could result from changes in laws or other circumstances currently not contemplatedknown by the Company. Costs provided for future expenditures on environmental remediation are not discounted to present value.
Pension Plan and Post-Retirement Benefit Plan Obligations
The Company accounts for pension expense using the end of the fiscal year as its measurement date. Management selects appropriate assumptions including discount rate, rate of increase in future compensation levels and assumed long-term rate of return on plan assets and expected annual increases in costs of medical and other health care benefits in regard to the Company’s post-retirement benefit obligations. These assumptions are based upon historical results, the current economic environment and reasonable expectations of future events. Actual results which vary from assumptions are accumulated and amortized over future periods, and accordingly, are recognized in expense in these periods. Significant differences between our assumptions and actual experience or significant changes in assumptions could impact the pension costs and the pension obligation.
Discontinued Operations
In fiscal 2013, the Company recorded a $2.0 million liability related to environmental remediation at a previously sold business for which the Company provided indemnification. A loss of $1.3 million, net of tax, is reflected in discontinued operations on the Consolidated Statement of Operations.
Legal Expenses
The Company recognizes legal costs related to loss contingencies when the expense is incurred.
Share-Based Compensation
The Company measures the cost of employee services received in exchange for an award of equity instruments based on the grant-date fair value of the award.
Product Warranties
Estimated product warranty expenses are recorded when the covered products are shipped to customers and recognized as revenue. Product warranty expense is estimated based upon the terms of the warranty program.
49
Income Taxes
The Company recognizes the amount of taxes payable or refundable for the current year and deferred tax liabilities and assets for the future tax consequences of events that have been recognized in our financial statements or tax returns.
Earnings Per Share
Basic earnings per share is computed on the basis of the weighted average number of common shares outstanding during the year. Diluted earnings per share also includes the dilutive effect of stock options.options and restricted stock units. Common shares issuable from stock options that are excluded from the calculation of diluted earnings per share because they were anti-dilutive were 331,300, 50,984,162,100, 627,475, and 1,385,596331,300 for fiscal 2011, 20102013, 2012, and 2009,2011, respectively. The weighted average
51
number of shares outstanding used to compute basic earnings per share was 30,509,000, 29,973,000,31,173,000, 30,749,000, and 29,717,00030,509,000 for fiscal years 2011, 20102013, 2012, and 2009,2011, respectively. The weighted average number of shares outstanding used to compute diluted earnings per share was 31,154,000, 30,477,000,31,738,000, 31,282,000, and 29,951,00031,154,000 for fiscal years 2011, 20102013, 2012, and 2009,2011, respectively.
Subsequent Events
On December 5, 2013, the Company announced the acceleration of its plans to consolidate certain facilities and create cost-efficiency through shared services in sales, general and administrative support functions. These integration activities are launching currently in each segment, and are expected to result in charges and expenses of approximately $40 million. The Company expects to incur costs of $25 million to $30 million in fiscal 2014 to support these efforts, with the balance to be incurred in fiscal 2015. The costs are mainly for severance, relocation of facilities and long-lived asset impairment losses.
On December 20, 2013, the Company acquired Sunbank Family of Companies, LLC (Sunbank) for approximately $45 million and up to $5 million in contingent consideration based upon achievement of certain sales levels over a two-year period. Sunbank is a manufacturer of electrical cable accessories, connectors and flexible conduit systems. Sunbank is included in the Sensors & Systems segment. The acquisition was funded under our credit facility and available cash.
The Company has evaluated subsequent events through the date the Consolidated Financial Statements were issued.
Recently Issued Accounting Standards
In September 2011, the Financial Accounting Standards Board (FASB) amended guidance related to the testing of goodwill for impairment. The revised standard is intended to reduce the cost and complexity of the annual goodwill impairment test by providing entities an option to perform a qualitative assessment to determine whether further impairment testing is necessary. The Company will adopt this guidance in the first quarter of 2012 and does not expect a significant impact to the Company’s financial statements.
In June 2011, the FASB amended requirements for the presentation of other comprehensive income (OCI), requiring presentation of comprehensive income in either a single, continuous statement of comprehensive income or on separate but consecutive statements, the statement of operations and the statement of OCI. The amendment is effective for the Company at the beginning of fiscal year 2013, with early adoption permitted. The adoption of this guidance will not impact the Company’s financial position, results of operations, or cash flows and will only impact the presentation of OCI on the financial statements.
In May 2011, the FASB amended the guidance regarding fair value measurement and disclosure. The amended guidance clarifies the application of existing fair value measurement and disclosure requirements. The amendment is effective for the Company at the beginning of fiscal 2012, with early adoption prohibited. The adoption of this amendment is not expected to materially affect the Company’s financial statements.
NOTE 2:Discontinued Operations
On September 8, 2010, the Company sold Pressure Systems, Inc., which was included in the Sensors & Systems segment, for approximately $25.0 million, resulting in an after tax gain of $10.4 million. As a result, the consolidated income statement presents Pressure Systems, Inc. as discontinued operations.
On November 3, 2008, the Company sold U.K.-based Muirhead Aerospace Limited and Traxsys Input Products Limited, which were included in the Sensors & Systems segment, for approximately £40.0 million or $63.4 million, resulting in an after-tax gain of $12.6 million. As a result, the consolidated income statement presents Muirhead Aerospace Limited and Traxsys Input Products Limited as discontinued operations.
The operating results of the discontinued operations for fiscal year 2011, 2010 and 2009 consisted of the following:
| | | | | | | | | | | | |
| In Thousands | | 2011 | | | 2010 | | | 2009 | |
| | | |
Sales | | $ | 0 | | | $ | 16,509 | | | $ | 17,979 | |
| | | |
Income (loss) before taxes | | | (75 | ) | | | 16,960 | | | | 29,071 | |
Tax expense (benefit) | | | (28 | ) | | | 5,079 | | | | 14,841 | |
| |
| | | |
Income (loss) from discontinued operations | | $ | (47 | ) | | $ | 11,881 | | | $ | 14,230 | |
| |
In fiscal 2009, the Company recorded an adjustment that resulted in a reclassification of $3,392,000 of tax benefits from discontinued operations to continued operations offset by a $1,026,000 tax expense to establish a valuation allowance for U.S. foreign tax credits that are not expected to result in a current or future reduction in U.S. income taxes.
50
NOTE 3: Inventories
Inventories at the end of fiscal 20112013 and 20102012 consisted of the following:
| | In Thousands | | 2011 | | | 2010 | | | 2013 | | | 2012 | |
| Raw materials and purchased parts | | $ | 130,444 | | | $ | 109,595 | | | $ | 165,231 | | | $ | 146,390 | |
Work in process | | | 168,934 | | | | 73,336 | | | | 169,165 | | | | 155,617 | |
Inventory costs under long-term contracts | | | 18,990 | | | | 26,256 | | | | 13,717 | | | | 19,207 | |
Finished goods | | | 84,180 | | | | 53,186 | | | | 99,550 | | | | 88,623 | |
| | | | |
| | $ | 402,548 | | | $ | 262,373 | | | $ | 447,663 | | | $ | 409,837 | |
| | | | |
NOTE 4:3: Goodwill
The following table summarizes the changes in goodwill by segment for fiscal 20112013 and 2010:2012:
| | In Thousands | | Avionics &
Controls | | | Sensors &
Systems | | Advanced
Materials | | Total | | | Avionics &
Controls | | | Sensors &
Systems | | | Advanced
Materials | | | Total | |
| Balance, October 30, 2009 | | $ | 427,978 | | | $ | 92,622 | | | $ | 216,208 | | | $ | 736,808 | | |
Balance, October 28, 2011 | | | $ | 513,508 | | | $ | 435,645 | | | $ | 214,572 | | | $ | 1,163,725 | |
Sale of product line | | | | (523 | ) | | | 0 | | | | 0 | | | | (523 | ) |
Goodwill adjustments | | | 1,007 | | | | 0 | | | | 0 | | | | 1,007 | | | | (234 | ) | | | 24,280 | | | | 0 | | | | 24,046 | |
Sale of businesses | | | 0 | | | | (3,319 | ) | | | 0 | | | | (3,319 | ) | |
Goodwill impairment | | | | (52,169 | ) | | | 0 | | | | 0 | | | | (52,169 | ) |
Foreign currency translation adjustment | | | 9,354 | | | | (1,914 | ) | | | (2,206 | ) | | | 5,234 | | | | (4,490 | ) | | | (31,505 | ) | | | (122 | ) | | | (36,117 | ) |
| | | | |
| Balance, October 29, 2010 | | | 438,339 | | | | 87,389 | | | | 214,002 | | | | 739,730 | | |
Balance, October 26, 2012 | | | | 456,092 | | | | 428,420 | | | | 214,450 | | | | 1,098,962 | |
Goodwill from acquisitions | | | 67,613 | | | | 343,053 | | | | 0 | | | | 410,666 | | | | 21,640 | | | | 0 | | | | 0 | | | | 21,640 | |
Goodwill adjustments | | | | 0 | | | | 2,904 | | | | 0 | | | | 2,904 | |
Goodwill impairment | | | | (3,454 | ) | | | 0 | | | | 0 | | | | (3,454 | ) |
Foreign currency translation adjustment | | | 7,556 | | | | 5,203 | | | | 570 | | | | 13,329 | | | | (9,575 | ) | | | 18,159 | | | | 341 | | | | 8,925 | |
| | | | |
Balance, October 28, 2011 | | $ | 513,508 | | | $ | 435,645 | | | $ | 214,572 | | | $ | 1,163,725 | | |
Balance, October 25, 2013 | | | $ | 464,703 | | | $ | 449,483 | | | $ | 214,791 | | | $ | 1,128,977 | |
| | | | |
During the third fiscal quarter of 2013 and 2012, management performed Step One impairment tests for Racal Acoustics upon identification of an indicator of impairment. The Company’s third quarter forecast in 2013 projected a higher operating loss in fiscal 2013 and lower earnings over the five years compared to the prior-year forecast due to further delays and reductions in global defense programs. As required under U.S. GAAP, a Step Two impairment test was required in fiscal 2013, because the current fair value of the business using a discounted cash flow and market approach was less than its carrying amount of the business. Under Step Two, the fair value of all Racal Acoustics’ assets and liabilities was estimated, including tangible assets, existing technology, and trade names, for the purpose of deriving an estimate of the implied fair value of goodwill. The implied fair value of the goodwill was then compared to the recorded goodwill to determine the amount of the impairment. Assumptions used in measuring the value of these assets and liabilities included
52
the discount rates, royalty rates, and obsolescence rates used in valuing the intangible assets, and pricing of comparable transactions in the market in valuing the tangible assets. The excess of the carrying amount of goodwill over the implied fair value of goodwill resulted in an impairment charge of $3.5 million in fiscal 2013. An impairment charge of $52.2 million was recorded at Racal Acoustics in fiscal 2012.
NOTE 5: 4:Intangible Assets
Intangible assets at the end of fiscal 20112013 and 20102012 were as follows:
| | | | | | | 2011 | | | 2010 | | | | | | | | | | | | | | | | | | | | | |
In Thousands | |
| Weighted
Average Years
Useful Life |
| |
| Gross
Carrying
Amount |
| |
| Accum.
Amort. |
| |
| Gross
Carrying
Amount |
| |
| Accum.
Amort. |
| | | | | 2013 | | | 2012 | |
| | | | Weighted
Average Years
Useful Life | | | Gross
Carrying
Amount | | | Accum.
Amort. | | | Gross
Carrying
Amount | | | Accum.
Amort. | |
| Amortized Intangible Assets: | | | | | | | | | | | | | �� | | | | | | | |
Programs | | | 15 | | | $ | 728,433 | | | $ | 157,383 | | | $ | 442,104 | | | $ | 120,220 | | | | 15 | | | $ | 726,049 | | | $ | 251,437 | | | $ | 701,396 | | | $ | 202,333 | |
Core technology | | | 16 | | | | 9,589 | | | | 5,514 | | | | 9,589 | | | | 4,916 | | | | 16 | | | | 9,589 | | | | 6,711 | | | | 9,589 | | | | 6,112 | |
Patents and other | | | 12 | | | | 101,834 | | | | 31,835 | | | | 42,336 | | | | 27,728 | | | | 12 | | | | 93,291 | | | | 37,024 | | | | 96,721 | | | | 38,140 | |
| | | | |
Total | | | | $ | 839,856 | | | $ | 194,732 | | | $ | 494,029 | | | $ | 152,864 | | | | | $ | 828,929 | | | $ | 295,172 | | | $ | 807,706 | | | $ | 246,585 | |
| | | | |
| Indefinite-lived Intangible Assets: | | | | | | | | | | | | | | | | | | | | |
Trademark | | | | $ | 48,791 | | | | | $ | 47,852 | | | | | | | $ | 47,192 | | | | | $ | 47,924 | | | |
| | | | |
Programs represent the valuation of systems or components sold under long-term supply agreements with aerospace companies, military contractors, and OEM manufacturers using similar technology. The valuation of the program includes the values of the program-specific technology, the backlog of contracts, and the relationship with customers which lead to potential future contracts. The valuation of the program is based upon its discounted cash flow at a market-based discount rate.
In fiscal 2009, management determined that a certain trade name useful life was no longer indefinite as a result of further integration of advanced sensors units and promotion of the Advanced Sensors brand name. An impairment test was required to be performed to value the trade name at fair value, which resulted in a $3.0 million impairment charge. The fair value of the trade name was determined by the relief-from-royalty method of the income approach. The remaining book value of the trade name will be amortized to expense over its five-year useful life.
51
Amortization of intangible assets was $40,539,000, $30,705,000,$54,998,000, $53,523,000, and $30,613,000$40,539,000 in fiscal years 2011, 2010,2013, 2012, and 2009,2011, respectively.
Estimated amortization expense related to intangible assets for each of the next five fiscal years is as follows:
In Thousands
| | | | |
| In Thousands | | | |
| |
Fiscal Year | | | | |
| |
2012 | | $ | 55,523 | |
2013 | | | 54,940 | |
2014 | | | 54,316 | |
2015 | | | 53,230 | |
2016 | | | 52,870 | |
| | | | |
Fiscal Year | | | | |
| |
2014 | | $ | 57,495 | |
2015 | | | 56,286 | |
2016 | | | 55,686 | |
2017 | | | 54,511 | |
2018 | | | 53,847 | |
53
NOTE 6: 5:Accrued Liabilities
Accrued liabilities at the end of fiscal 20112013 and 20102012 consisted of the following:
| | | | | | | | | | | | |
| In Thousands | | 2011 | | | 2010 | | | 2013 | | | 2012 | |
| Payroll and other compensation | | $ | 123,454 | | | $ | 81,530 | | | $ | 119,677 | | | $ | 128,269 | |
Commissions | | | 5,675 | | | | 4,873 | | | | 4,786 | | | | 5,776 | |
Casualty and medical | | | 13,435 | | | | 14,605 | | | | 13,738 | | | | 12,971 | |
Interest | | | 6,599 | | | | 6,370 | | | | 6,707 | | | | 7,091 | |
Warranties | | | 19,298 | | | | 17,159 | | | | 19,372 | | | | 21,870 | |
State and other tax accruals | | | 5,383 | | | | 4,785 | | | | 6,536 | | | | 6,136 | |
Customer deposits | | | 25,143 | | | | 21,378 | | | | 21,500 | | | | 18,193 | |
Deferred revenue | | | 22,602 | | | | 17,435 | | | | 15,888 | | | | 30,707 | |
Contract reserves | | | 13,050 | | | | 13,218 | | | | 12,737 | | | | 12,553 | |
Forward foreign exchange contracts | | | 614 | | | | 2,112 | | | | 7,645 | | | | 2,375 | |
Unclaimed property – non-U.S. | | | 11,861 | | | | 11,530 | | |
Litigation reserves | | | | 10,266 | | | | 1,163 | |
Environmental reserves | | | 4,426 | | | | 2,713 | | | | 810 | | | | 3,119 | |
Asset retirement obligations | | | 308 | | | | 1,645 | | |
Rent and future lease obligations | | | 1,308 | | | | 1,687 | | | | 1,357 | | | | 2,258 | |
Other | | | 17,266 | | | | 14,054 | | | | 12,542 | | | | 17,072 | |
| | | | |
| | $ | 270,422 | | | $ | 215,094 | | | $ | 253,561 | | | $ | 269,553 | |
| | | | |
Accrued liabilities are recorded to reflect the Company’s contractual obligations relating to warranty commitments to customers. Warranty coverage of various lengths and terms is provided to customers depending on standard offerings and negotiated contractual agreements. An estimate for warranty expense is recorded at the time of sale based on the length of the warranty and historical warranty return rates and repair costs.
Changes in the carrying amount of accrued product warranty costs are summarized as follows:
| | | | | | | | |
| In Thousands | | 2011 | | | 2010 | |
| | |
Balance, beginning of year | | $ | 17,159 | | | $ | 14,685 | |
Warranty costs incurred | | | (4,583 | ) | | | (4,478 | ) |
Product warranty accrual | | | 7,239 | | | | 8,488 | |
Acquisitions | | | 645 | | | | 0 | |
Release of reserves | | | (1,476 | ) | | | (1,794 | ) |
Sale of businesses | | | 0 | | | | (90 | ) |
Foreign currency translation adjustment | | | 314 | | | | 348 | |
| |
Balance, end of year | | $ | 19,298 | | | $ | 17,159 | |
| |
52
| | | | | | | | |
| In Thousands | | 2013 | | | 2012 | |
| | |
Balance, beginning of year | | $ | 21,870 | | | $ | 19,298 | |
Warranty costs incurred | | | (4,912 | ) | | | (2,752 | ) |
Product warranty accrual | | | 7,380 | | | | 8,471 | |
Release of reserves | | | (4,555 | ) | | | (2,967 | ) |
Foreign currency translation adjustment | | | (411 | ) | | | (180 | ) |
| |
Balance, end of year | | $ | 19,372 | | | $ | 21,870 | |
| |
NOTE 7: 6:Retirement Benefits
Approximately 41%39% of U.S. employees have a defined benefit earned under the Esterline pension plan.
Under the Esterline plan, pension benefits are based on years of service and five-year average compensation or the highest five consecutive years’ compensation during the last ten years of employment. Esterline amended its defined benefit plan to add the cash balance formula with annual pay credits ranging from 2% to 6% effective January 1, 2003. Participants elected either to continue earning benefits under the current plan formula or to earn benefits under the cash balance formula. Effective January 1, 2003, all new participants are enrolled in the cash balance formula. Esterline also has an unfunded supplemental retirement plan for key executives providing for periodic payments upon retirement.
CMC sponsors defined benefit pension plans and other retirement benefit plans for its non-U.S. employees. Pension benefits are based upon years of service and final average salary. Other retirement benefit plans are non-contributory health care and life insurance plans.
The Company accounts for pension expense using the end of the fiscal year as its measurement date. In addition, the Company makes actuarially computed contributions to these plans as necessary to adequately fund benefits. The Company’s funding policy is consistent with the minimum funding requirements of ERISA. The accumulated benefit obligation and projected benefit obligation for the Esterline plans are $242,163,000$266,745,000 and $250,136,000,$275,746,000, respectively, with plan assets of $193,888,000$259,924,000 as of October 28, 2011.25, 2013. The underfunded status for the Esterline plans is $56,248,000$15,822,000 at October 28, 2011.25, 2013. Contributions to the Esterline plans totaled $24,556,000$16,174,000 and $13,910,000$17,097,000 in fiscal years 20112013 and 2010,2012, respectively. The expected funding requirement for fiscal 20122014 for the U.S. pension plans maintained by Esterline is $21,235,000.
54
$12,000,000. The accumulated benefit obligation and projected benefit obligation for the CMC plans are $126,705,000$137,954,000 and $128,944,000,$139,109,000, respectively, with plan assets of $103,737,000$126,117,000 as of October 28, 2011.25, 2013. The underfunded status for these CMC plans is $25,207,000$12,992,000 at October 28, 2011.25, 2013. Contributions to the CMC plans totaled $7,906,000$10,859,000 and $6,091,000$10,241,000 in fiscal 20112013 and 2010,2012, respectively. The expected funding requirement for fiscal 20122014 for the CMC plans is $8,112,000.$10,593,000.
Principal assumptions of the Esterline and CMC plans are as follows:
| | | | Esterline
Defined Benefit
Pension Plans | | CMC
Defined Benefit
Pension Plans | | | Esterline Defined Benefit Pension Plans | | | | CMC Defined Benefit Pension Plans |
| | | 2011 | | 2010 | | 2011 | | 2010 | | | 2013 | | 2012 | | | | 2013 | | 2012 |
| Principal assumptions
as of fiscal year end: | | | | | | | | | | | | | | | | | | |
Discount Rate | | | 5.0 | % | | | 5.5 | % | | | 5.0 | % | | | 5.0 | % | | 4.7% | | 3.85% | | | | 4.5% | | 4.35% |
Rate of increase in future
compensation levels | | | 4.5 | % | | | 4.5 | % | | | 3.1 | % | | | 3.2 | % | | 4.5% | | 4.5% | | | | 3.0% | | 3.1% |
Assumed long-term rate
of return on plan assets | | | 7.5 | % | | | 8.0 | % | | | 7.0 | % | | | 7.0 | % | | 7.0% | | 7.0% | | | | 6.34% | | 6.5 – 6.75% |
| | | | Esterline
Post-Retirement
Benefit Plans | | CMC
Post-Retirement
Benefit Plans | | | Esterline Post-Retirement Benefit Plans | | | | CMC Post-Retirement Pension Plans |
| | | 2011 | | 2010 | | 2011 | | 2010 | | | 2013 | | 2012 | | | | 2013 | | 2012 |
| Principal assumptions
as of fiscal year end: | | | | | | | | | | | | | | | | | | |
Discount Rate | | | 5.0 | % | | | 5.5 | % | | | 5.0 | % | | | 5.0 | % | | 4.7% | | 3.85% | | | | 4.5% | | 4.35% |
Initial weighted average
health care trend rate | | | 6.0 | % | | | 6.0 | % | | | 3.7 | % | | | 4.1 | % | | 6.0% | | 6.0% | | | | 6.3% | | 3.7% |
Ultimate weighted average
health care trend rate | | | 6.0 | % | | | 6.0 | % | | | 3.2 | % | | | 3.4 | % | | 6.0% | | 6.0% | | | | 4.2% | | 3.2% |
The Company uses a discount rate for expected returns that is a spot rate developed from a yield curve established from high-quality corporate bonds and matched to plan-specific projected benefit payments. Although future changes to the discount rate are unknown, had the discount rate increased or decreased by 25 basis points, pension liabilities in total would have decreased $9.4$11.8 million or increased $11.3$12.3 million, respectively. If all other assumptions are held constant, the estimated effect on fiscal 20112013 pension expense from a hypothetical 25 basis points increase or decrease in both the
53
discount rate and expected long-term rate of return on plan assets would not have a material effect on our pension expense. Management is not aware of any legislative or other initiatives or circumstances that will significantly impact the Company’s pension obligations in fiscal 2012.2014.
The assumed health care trend rate has a significant impact on the Company’s post-retirement benefit obligations. The Company’s health care trend rate was based on the experience of its plan and expectations for the future. A 100 basis points increase in the health care trend rate would increase the post-retirement benefit obligation by $1.0$1.9 million. A 100 basis points decrease in the health care trend rate would decrease the post-retirement benefit obligation by $0.9$0.5 million. Assuming all other assumptions are held constant, the estimated effect on fiscal 20112013 post-retirement benefit expense from a hypothetical 100 basis points increase or decrease in the health care trend rate would not have a material effect on our post-retirement benefit expense.
55
Plan assets are invested in a diversified portfolio of equity and debt securities, consisting primarily of common stocks, bonds and government securities. The objective of these investments is to maintain sufficient liquidity to fund current benefit payments and achieve targeted risk-adjusted returns. Management periodically reviews allocations of plan assets by investment type and evaluates external sources of information regarding the long-term historical returns and expected future returns for each investment type, and accordingly, the 7.5%6.34% to 7.0% assumed long-term rate of return on plan assets is considered to be appropriate. Allocations by investment type are as follows:
| | | | | | | | | | | |
| | | | | | | | | Actual | |
| | | | | Actual | | | Target | | | 2013 | | | | 2012 | |
| | | Target | | 2011 | | 2010 | | | |
Plan assets allocation as of fiscal year end: | | | | | | | | | | | | |
Equity securities | | | 55 – 75 | % | | | 52.3 | % | | | 57.0 | % | | 55 – 75% | | | 63.9 | % | | | 58.8% | |
Debt securities | | | 25 – 45 | % | | | 38.7 | % | | | 39.0 | % | | 25 – 45% | | | 33.6 | % | | | 38.7% | |
Cash | | | 0 | % | | | 9.0 | % | | | 4.0 | % | | 0% | | | 2.5 | % | | | 2.5% | |
| | | |
Total | | | | | 100.0 | % | | | 100.0 | % | | | | | 100.0 | % | | | 100.0% | |
The following table presents the fair value of the Company’s Pension Plan assets as of October 28, 2011,25, 2013, by asset category segregated by level within the fair value hierarchy, as described in Note 8.7.
| | | | | | | | | | | | |
| In Thousands | | Fair Value Hierarchy | |
| | | Level 1 | | | Level 2 | | | Total | |
Asset category: | | | | | | | | | | | | |
Equity Funds | | | | | | | | | | | | |
Registered Investments Company
Funds – U.S. Equity | | $ | 47,444 | | | $ | 0 | | | $ | 47,444 | |
Commingled Trust Funds – U.S. Equity | | | 0 | | | | 27,936 | | | | 27,936 | |
U.S. Equity Securities | | | 25,729 | | | | 0 | | | | 25,729 | |
Non-U.S. Equity Securities | | | 21,444 | | | | 0 | | | | 21,444 | |
Commingled Trust Fund – Non-U.S.
Securities | | | 0 | | | | 34,707 | | | | 34,707 | |
Fixed Income Securities | | | | | | | | | | | | |
Registered Investments Company
Funds – Fixed Income | | | 31,790 | | | | 0 | | | | 31,790 | |
Commingled Trust Fund – Fixed Income | | | 0 | | | | 38,070 | | | | 38,070 | |
Mortgage and Asset-backed | | | 0 | | | | 317 | | | | 317 | |
Non-U.S. Foreign Commercial
and Government Bonds | | | 46,410 | | | | 0 | | | | 46,410 | |
Cash and Cash Equivalents | | | 26,979 | | | | 0 | | | | 26,979 | |
| |
Total | | $ | 199,796 | | | $ | 101,030 | | | $ | 300,826 | |
| |
54
| | | | | | | | | | | | |
| In Thousands | | Fair Value Hierarchy | |
| | | Level 1 | | | Level 2 | | | Total | |
Asset category: | | | | | | | | | | | | |
Equity Funds | | | | | | | | | | | | |
Registered Investments Company
Funds – U.S. Equity | | $ | 106,436 | | | $ | 0 | | | $ | 106,436 | |
Commingled Trust Funds – U.S. Equity | | | 0 | | | | 26,923 | | | | 26,923 | |
U.S. Equity Securities | | | 37,280 | | | | 0 | | | | 37,280 | |
Non-U.S. Equity Securities | | | 25,584 | | | | 0 | | | | 25,584 | |
Commingled Trust Fund – Non-U.S. Securities | | | 0 | | | | 53,347 | | | | 53,347 | |
Fixed Income Securities | | | | | | | | | | | | |
Registered Investments Company
Funds – Fixed Income | | | 33,494 | | | | 0 | | | | 33,494 | |
Commingled Trust Fund – Fixed Income | | | 0 | | | | 41,428 | | | | 41,428 | |
Non-U.S. Foreign Commercial and
Government Bonds | | | 56,351 | | | | 0 | | | | 56,351 | |
Cash and Cash Equivalents | | | 9,966 | | | | 0 | | | | 9,966 | |
| |
Total | | $ | 269,111 | | | $ | 121,698 | | | $ | 390,809 | |
| |
The following table presents the fair value of the Company’s Pension Plan assets as of October 29, 2010,26, 2012, by asset category segregated by level within the fair value hierarchy, as described in Note 8.7.
| | | | | | | | | | | | | | | | | | |
| In Thousands | | Fair Value Hierarchy | | | Fair Value Hierarchy | |
| | | Level 1 | | | Level 2 | | | Total | | | Level 1 | | | Level 2 | | | Total | |
Asset category: | | | | | | | | | | | | |
Equity Funds | | | | | | | | | | | | |
Registered Investments Company
Funds – U.S. Equity | | $ | 44,705 | | | $ | 0 | | | $ | 44,705 | | | $ | 61,634 | | | $ | 0 | | | $ | 61,634 | |
Commingled Trust Funds – U.S. Equity | | | 0 | | | | 25,885 | | | | 25,885 | | | | 0 | | | | 18,751 | | | | 18,751 | |
U.S. Equity Securities | | | 24,113 | | | | 0 | | | | 24,113 | | | | 46,140 | | | | 0 | | | | 46,140 | |
Non-U.S. Equity Securities | | | 21,932 | | | | 0 | | | | 21,932 | | | | 24,986 | | | | 0 | | | | 24,986 | |
Commingled Trust Fund – Non-U.S.
Securities | | | 0 | | | | 35,545 | | | | 35,545 | | | | 0 | | | | 45,213 | | | | 45,213 | |
Fixed Income Securities | | | | | | | | | | | | |
Registered Investments Company
Funds – Fixed Income | | | 28,075 | | | | 0 | | | | 28,075 | | | | 35,528 | | | | 0 | | | | 35,528 | |
Commingled Trust Fund – Fixed Income | | | 0 | | | | 33,413 | | | | 33,413 | | | | 0 | | | | 44,194 | | | | 44,194 | |
Mortgage and Asset-backed | | | 0 | | | | 449 | | | | 449 | | |
Non-U.S. Foreign Commercial
and Government Bonds | | | 43,797 | | | | 0 | | | | 43,797 | | |
Non-U.S. Foreign Commercial and | | | | | | | |
Government Bonds | | | | 49,749 | | | | 0 | | | | 49,749 | |
Cash and Cash Equivalents | | | 11,975 | | | | 0 | | | | 11,975 | | | | 8,427 | | | | 0 | | | | 8,427 | |
| | | | |
Total | | $ | 174,597 | | | $ | 95,292 | | | $ | 269,889 | | | $ | 226,464 | | | $ | 108,158 | | | $ | 334,622 | |
| | | | |
56
Valuation Techniques
Level 1 Equity Securities are actively traded on U.S. and non-U.S. exchanges and are either valued using the market approach at quoted market prices on the measurement date or at the net asset value of the shares held by the plan on the measurement date based on quoted market prices.
Level 1 fixed income securities are primarily valued using the market approach at either quoted market prices, pricing models that use observable market data, or bids provided by independent investment brokerage firms.
Level 2 primarily consists of commingled trust funds that are primarily valued at the net asset value provided by the fund manager. Net asset value is based on the fair value of the underlying investments.
Cash and cash equivalents includesinclude cash which is used to pay benefits and cash invested in a short-term investment fund that holds securities with values based on quoted market prices, but for which the funds are not valued on quoted market basis.
Net periodic pension cost for the Company’s defined benefit plans at the end of each fiscal year consisted of the following:
| | | | | | | | | | | | | | | | | | | | | | | | |
| | | Defined Benefit
Pension Plans | | | Post-Retirement
Benefit Plans | |
| In Thousands | | 2011 | | | 2010 | | | 2009 | | | 2011 | | | 2010 | | | 2009 | |
| | | | | | |
Components of Net
Periodic Cost | | | | | | | | | | | | | | | | | | | | | | | | |
Service cost | | $ | 8,583 | | | $ | 7,370 | | | $ | 5,413 | | | $ | 447 | | | $ | 326 | | | $ | 366 | |
Interest cost | | | 19,044 | | | | 18,950 | | | | 19,151 | | | | 754 | | | | 785 | | | | 773 | |
Expected return
on plan assets | | | (20,354 | ) | | | (17,954 | ) | | | (14,878 | ) | | | 0 | | | | 0 | | | | 0 | |
Amortization of prior
service cost | | | 21 | | | | 21 | | | | 18 | | | | 0 | | | | 0 | | | | 0 | |
Amortization of
actuarial (gain) loss | | | 8,450 | | | | 7,602 | | | | 3,961 | | | | (17 | ) | | | (78 | ) | | | (90 | ) |
| |
Net periodic cost | | $ | 15,744 | | | $ | 15,989 | | | $ | 13,665 | | | $ | 1,184 | | | $ | 1,033 | | | $ | 1,049 | |
| |
| | | | | | | | | | | | | | | | | | | | | | | | |
| In Thousands | | Defined Benefit
Pension Plans | | | Post-Retirement
Benefit Plans | |
| | | 2013 | | | | 2012 | | | | 2011 | | | | 2013 | | | | 2012 | | | | 2011 | |
| | | | | | |
Components of Net
Periodic Cost | | | | | | | | | | | | | | | | | | | | | | | | |
Service cost | | $ | 11,848 | | | $ | 9,393 | | | $ | 8,583 | | | $ | 508 | | | $ | 436 | | | $ | 447 | |
Interest cost | | | 17,893 | | | | 19,403 | | | | 19,044 | | | | 674 | | | | 715 | | | | 754 | |
Expected return
on plan assets | | | (22,476 | ) | | | (21,508 | ) | | | (20,354 | ) | | | 0 | | | | 0 | | | | 0 | |
Amortization of prior
service cost | | | 384 | | | | 41 | | | | 21 | | | | (150 | ) | | | (69 | ) | | | 0 | |
Amortization of
actuarial (gain) loss | | | 14,255 | | | | 10,551 | | | | 8,450 | | | | 103 | | | | 41 | | | | (17 | ) |
| |
Net periodic cost | | $ | 21,904 | | | $ | 17,880 | | | $ | 15,744 | | | $ | 1,135 | | | $ | 1,123 | | | $ | 1,184 | |
| |
5557
The funded status of the defined benefit pension and post-retirement plans at the end of fiscal 20112013 and 20102012 were as follows:
| | | | | | | | | | | | | | | | |
| | | Defined Benefit
Pension Plans | | | Post-Retirement
Benefit Plans | |
| In Thousands | | 2011 | | | 2010 | | | 2011 | | | 2010 | |
| | | | |
Benefit Obligations | | | | | | | | | | | | | | | | |
Beginning balance | | $ | 360,859 | | | $ | 313,071 | | | $ | 15,078 | | | $ | 12,891 | |
Currency translation adjustment | | | 3,697 | | | | 5,111 | | | | 384 | | | | 498 | |
Service cost | | | 8,583 | | | | 7,370 | | | | 447 | | | | 326 | |
Interest cost | | | 19,044 | | | | 18,950 | | | | 754 | | | | 785 | |
One-time charge benefit adjustment | | | 0 | | | | 646 | | | | 0 | | | | (425 | ) |
Plan participants contributions | | | 95 | | | | 146 | | | | 0 | | | | 0 | |
Amendment | | | 0 | | | | 0 | | | | (287 | ) | | | 0 | |
Actuarial (gain) loss | | | 18,490 | | | | 35,117 | | | | (880 | ) | | | 1,774 | |
Acquisitions | | | 10,147 | | | | 0 | | | | 0 | | | | 0 | |
Benefits paid | | | (19,336 | ) | | | (19,552 | ) | | | (1,104 | ) | | | (771 | ) |
| |
Ending balance | | $ | 401,579 | | | $ | 360,859 | | | $ | 14,392 | | | $ | 15,078 | |
| |
| | | | |
Plan Assets – Fair Value | | | | | | | | | | | | | | | | |
Beginning balance | | $ | 269,889 | | | $ | 230,186 | | | $ | 291 | | | $ | 0 | |
Currency translation adjustment | | | 2,873 | | | | 4,932 | | | | 4 | | | | 0 | |
Realized and unrealized gain
(loss) on plan assets | | | 14,936 | | | | 33,610 | | | | 0 | | | | 0 | |
Acquisitions | | | 0 | | | | 0 | | | | 0 | | | | 0 | |
Plan participants contributions | | | 95 | | | | 146 | | | | 0 | | | | 0 | |
Company contribution | | | 33,228 | | | | 21,284 | | | | 510 | | | | 1,062 | |
Expenses paid | | | (859 | ) | | | (610 | ) | | | 0 | | | | 0 | |
Benefits paid | | | (19,336 | ) | | | (19,659 | ) | | | (805 | ) | | | (771 | ) |
| |
Ending balance | | $ | 300,826 | | | $ | 269,889 | | | $ | 0 | | | $ | 291 | |
| |
| | | | |
Funded Status | | | | | | | | | | | | | | | | |
Fair value of plan assets | | $ | 300,826 | | | $ | 269,889 | | | $ | 0 | | | $ | 291 | |
Benefit obligations | | | (401,579 | ) | | | (360,859 | ) | | | (14,392 | ) | | | (15,078 | ) |
| |
Net amount recognized | | $ | (100,753 | ) | | $ | (90,970 | ) | | $ | (14,392 | ) | | $ | (14,787 | ) |
| |
56
| | | | Defined Benefit
Pension Plans | | Post-Retirement
Benefit Plans | | | | | | | | | | | | | | | | | |
| In Thousands | | 2011 | | 2010 | | 2011 | | 2010 | | | Defined Benefit
Pension Plans | | Post-Retirement
Benefit Plans | |
| | | 2013 | | 2012 | | 2013 | | 2012 | |
Amount Recognized in the | | | | | | | | | |
Consolidated Balance Sheet | | | | | | | | | |
| Benefit Obligations | | | | | | | | | |
Beginning balance | | | $ | 456,861 | | | $ | 401,579 | | | $ | 17,040 | | | $ | 14,392 | |
Currency translation adjustment | | | | (4,948 | ) | | | (2,623 | ) | | | (559 | ) | | | (175 | ) |
Service cost | | | | 11,848 | | | | 9,393 | | | | 508 | | | | 436 | |
Interest cost | | | | 17,893 | | | | 19,403 | | | | 674 | | | | 715 | |
Plan participants contributions | | | | 156 | | | | 44 | | | | 0 | | | | 0 | |
Amendment | | | | 273 | | | | 416 | | | | 0 | | | | 546 | |
Actuarial (gain) loss | | | | (16,905 | ) | | | 50,116 | | | | 14 | | | | 1,918 | |
Other adjustment | | | | 287 | | | | 0 | | | | (252 | ) | | | 0 | |
Benefits paid | | | | (22,332 | ) | | | (21,467 | ) | | | (712 | ) | | | (792 | ) |
| | | |
Ending balance | | | $ | 443,133 | | | $ | 456,861 | | | $ | 16,713 | | | $ | 17,040 | |
| | | |
| | Plan Assets – Fair Value | | | | | | | | | |
Beginning balance | | | $ | 334,622 | | | $ | 300,826 | | | $ | 0 | | | $ | 0 | |
Currency translation adjustment | | | | (5,377 | ) | | | (838 | ) | | | 0 | | | | 0 | |
Realized and unrealized gain
(loss) on plan assets | | | | 55,730 | | | | 27,918 | | | | 0 | | | | 0 | |
Plan participants contributions | | | | 156 | | | | 44 | | | | 0 | | | | 0 | |
Company contribution | | | | 28,927 | | | | 29,014 | | | | 712 | | | | 792 | |
Other adjustment | | | | 92 | | | | 0 | | | | 0 | | | | 0 | |
Expenses paid | | | | (1,009 | ) | | | (875 | ) | | | 0 | | | | 0 | |
Benefits paid | | | | (22,332 | ) | | | (21,467 | ) | | | (712 | ) | | | (792 | ) |
| | | |
Ending balance | | | $ | 390,809 | | | $ | 334,622 | | | $ | 0 | | | $ | 0 | |
| | | |
| | Funded Status | | | | | | | | | |
Fair value of plan assets | | | $ | 390,809 | | | $ | 334,622 | | | $ | 0 | | | $ | 0 | |
Benefit obligations | | | | (443,133 | ) | | | (456,861 | ) | | | (16,713 | ) | | | (17,040 | ) |
| | | |
Net amount recognized | | | $ | (52,324 | ) | | $ | (122,239 | ) | | $ | (16,713 | ) | | $ | (17,040 | ) |
| | | |
| Amount Recognized in the
Consolidated Balance Sheet | | | | | | | | | |
Non-current asset | | | $ | 2,201 | | | $ | 0 | | | $ | 0 | | | $ | 0 | |
Current liability | | $ | (1,205 | ) | | $ | (1,096 | ) | | $ | (557 | ) | | $ | (586 | ) | | | (2,351 | ) | | | (6,145 | ) | | | (785 | ) | | | (1,060 | ) |
Non-current liability | | | (99,548 | ) | | | (89,874 | ) | | | (13,835 | ) | | | (14,201 | ) | | | (52,174 | ) | | | (116,094 | ) | | | (15,928 | ) | | | (15,980 | ) |
| | | | |
Net amount recognized | | $ | (100,753 | ) | | $ | (90,970 | ) | | $ | (14,392 | ) | | $ | (14,787 | ) | | $ | (52,324 | ) | | $ | (122,239 | ) | | $ | (16,713 | ) | | $ | (17,040 | ) |
| | | | |
| Amounts Recognized in Accumulated Other Comprehensive Income | | | | | | | | | | | | | | | | |
Net actuarial loss (gain) | | $ | 115,738 | | | $ | 99,469 | | | $ | (1,233 | ) | | $ | (39 | ) | | $ | 82,796 | | | $ | 148,758 | | | $ | 768 | | | $ | 759 | |
Prior service cost | | | 268 | | | | 297 | | | | 0 | | | | 0 | | | | 490 | | | | 589 | | | | 161 | | | | 0 | |
Transition asset (obligation) | | | 0 | | | | 0 | | | | 0 | | | | 0 | | |
| | | | |
Ending balance | | $ | 116,006 | | | $ | 99,766 | | | $ | (1,233 | ) | | $ | (39 | ) | | $ | 83,286 | | | $ | 149,347 | | | $ | 929 | | | $ | 759 | |
| | | | |
The accumulated benefit obligation for all pension plans was $387,378,000$427,625,000 at October 28, 2011,25, 2013, and $349,489,000$442,165,000 at October 29, 2010.26, 2012.
58
Estimated future benefit payments expected to be paid from the plan or from the Company’s assets are as follows:
In Thousands
| Fiscal Year | | | | |
| 2012 | | $ | 24,047 | | |
2013 | | | 24,416 | | |
2014 | | | 25,519 | | | $ | 26,856 | |
2015 | | | 26,516 | | | | 27,085 | |
2016 | | | 27,529 | | | | 28,655 | |
2017 – 2021 | | | 167,627 | | |
2017 | | | | 29,975 | |
2018 | | | | 31,895 | |
2019 – 2023 | | | | 169,548 | |
Employees may participate in certain defined contribution plans. The Company’s contribution expense under these plans totaled $8,203,000, $7,533,000,$9,421,000, $8,900,000, and $7,418,000$8,203,000 in fiscal 2013, 2012, and 2011, 2010, and 2009, respectively.
NOTE 8: 7: Fair Value Measurements
Fair value is defined as the price that would be received to sell an asset or paid to transfer a liability in an orderly transaction between market participants at the measurement date. A fair value hierarchy has been established that prioritizes the inputs to valuation techniques used to measure fair value. An assetasset’s or liability’s level within the fair value hierarchy is based on the lowest level of input that is significant to the fair value measurement. The hierarchy of fair value measurements is described below:
Level 1 – Valuations are based on quoted prices that the Company has the ability to obtain in actively traded markets for identical assets and liabilities. Since valuations are based on quoted prices that are readily and regularly available in an active market or exchange traded market, a valuation of these instruments does not require a significant degree of judgment.
Level 2 – Valuations are based on quoted prices for similar instruments in active markets, quoted prices for identical or similar instruments in markets that are not active, and model-based valuation techniques for which all significant assumptions are observable in the market.
Level 3 – Valuations are based on model-based techniques for which some or all of the assumptions are obtained from indirect market information that is significant to the overall fair value measurement and which require a significant degree of management judgment.
57
The following table sets forth the Company’s financial assets and liabilities that were measured at fair value on a recurring basis by level within the fair value hierarchy at the end of fiscal 20112013 and 2010:2012:
| | | | Level 2 | | |
| | | | | | | | | | |
| In Thousands | | 2011 | | | 2010 | | | Level 2 | |
| | | | | 2013 | | | | 2012 | |
Assets: | | | | | | | | | | |
Derivative contracts designated as hedging instruments | | $ | 7,553 | | | $ | 11,552 | | | | | $ | 2,270 | | | $ | 7,753 | |
Derivative contracts not designated as hedging instruments | | $ | 2,214 | | | $ | 1,256 | | | | | | 3,670 | | | | 1,387 | |
Embedded derivatives | | $ | 38 | | | $ | 23 | | | | | | 706 | | | | 51 | |
| Liabilities: | | | | | | | | | | |
Derivative contracts designated as hedging instruments | | $ | 1,632 | | | $ | 950 | | | | | $ | 4,541 | | | $ | 2,143 | |
Derivative contracts not designated as hedging instruments | | $ | 1,070 | | | $ | 782 | | | | | | 122 | | | | 361 | |
Embedded derivatives | | $ | 895 | | | $ | 1,815 | | | | | | 344 | | | | 470 | |
| | | | | |
| | | Level 3 | |
| | | | | | | |
| In Thousands | | 2011 | | | 2010 | | | | Level 3 | |
| | | | | 2013 | | | | 2012 | |
Liabilities: | | | | | | | | | | |
Contingent purchase obligation | | $ | 13,350 | | | $ | 0 | | | | | $ | 4,000 | | | $ | 9,000 | |
59
The Company’s embedded derivatives are the result of entering into sales or purchase contracts that are denominated in a currency other than the Company’s functional currency or the supplier’s or customer’s functional currency. The fair value is determined by calculating the difference between quoted exchange rates at the time the contract was entered into and the period-end exchange rate. These contracts are categorized as Level 2 in the fair value hierarchy.
The Company’s derivative contracts consist of foreign currency exchange contracts and interest rate swap agreements. These derivative contracts are over the counter and their fair value is determined using modeling techniques that include market inputs such as interest rates, yield curves, and currency exchange rates. These contracts are categorized as Level 2 in the fair value hierarchy.
The Company’s contingent purchase obligation consists of up to $14.0 million of additional consideration in connection with the acquisition of Eclipse. The contingent consideration will be paid to the seller if certain performance objectives are met over the three-year period.period from the date of acquisition. The value recorded on the balance sheet was derived from the estimated probability that the performance objective will be met by the end of the three-year period. The contingent purchase obligation is categorized as Level 3 in the fair value hierarchy. There were no Level 3 assets at October 29, 2010.The Company paid $5.0 million of the contingent purchase obligation in 2013.
NOTE 9: 8:Derivative Financial Instruments
The Company uses derivative financial instruments in the form of foreign currency forward exchange contracts and interest rate swap contracts for the purpose of minimizing exposure to changes in foreign currency exchange rates on business transactions and interest rates, respectively. The Company’s policy is to execute such instruments with banks the Company believes to be credit worthy and not to enter into derivative financial instruments for speculative purposes. These derivative financial instruments do not subject the Company to undue risk, as gains and losses on these instruments generally offset gains and losses on the underlying assets, liabilities, or anticipated transactions that are being hedged.
All derivative financial instruments are recorded at fair value in the Consolidated Balance Sheet. For a derivative that has not been designated as an accounting hedge, the change in the fair value is recognized immediately through earnings. For a derivative that has been designated as an accounting hedge of an existing asset or liability (a fair value hedge), the change in the fair value of both the derivative and underlying asset or liability is recognized immediately through earnings. For a derivative designated as an accounting hedge of an anticipated transaction (a cash flow hedge), the change in the fair value is recorded on the Consolidated Balance Sheet in Accumulated Other Comprehensive Income (AOCI) to the extent the derivative is effective in mitigating the exposure related to the anticipated transaction. The change in the fair value related to the ineffective portion of the hedge, if any, is immediately recognized in earnings. The amount recorded within AOCI is reclassified into earnings in the same period during which the underlying hedged transaction affects earnings.
58
The fair values of derivative instruments are presented on a gross basis, as the Company does not have any derivative contracts which are subject to master netting arrangements. The Company does not have any derivative instruments with credit-risk-related contingent features or that required the posting of collateral as of October 28, 2011.25, 2013. The cash flows from derivative contracts are recorded in operating activities in the Consolidated Statement of Cash Flows.
Foreign Currency Forward Exchange Contracts
The Company transacts business in various foreign currencies which subjects the Company’s cash flows and earnings to exposure related to changes in foreign currency exchange rates. These exposures arise primarily from purchases or sales of products and services from third parties. Foreign currency forward exchange contracts provide for the purchase or sale of foreign currencies at specified future dates at specified exchange rates and are used to offset changes in the fair value of certain assets or liabilities or forecasted cash flows resulting from transactions denominated in foreign currencies. As of October 28, 2011,25, 2013, and October 29, 2010,26, 2012, the Company had outstanding foreign currency forward exchange contracts principally to sell U.S. dollars with notional amounts of $431.2$369.0 million and $245.5$358.4 million, respectively. These notional values consist primarily of contracts for the European euro, British pound sterling and Canadian dollar, and are stated in U.S. dollar equivalents at spot exchange rates at the respective dates.
Interest Rate Swaps
The Company manages its exposure to interest rate risk by maintaining an appropriate mix of fixed and variable rate debt, which over time should moderate the costs of debt financing. When considered necessary, the Company may use financial instruments in the form of interest rate swaps to help meet this objective. In Novemberfiscal 2010, the Company entered into an interest rate swap agreementagreements for $100.0 million on the $175.0 million Senior Notes due in 2017.2017 Notes. The swap agreementagreements exchanged the fixed interest rate of 6.625% for a variable interest rate onrate. In the $100.0 millionsecond quarter of fiscal 2013, the principal amount outstanding. The variable interest rate is based upon LIBOR plus 4.865%swap agreements were terminated and was 5.293% at October 28, 2011. The fair value of the Company’s interest rate swap was a $0.1 million asset at October 28, 2011, and was estimated by discounting expected cash flows using market interest rates. The Company records interest receivable and interest payable on interest rate swaps on a net basis. In December 2010, the Company entered into an interest rate swap agreement for $75.0 million onredeemed the 2017 Notes with the proceeds from the $175.0 million Senior Notes due in 2017.U.S. Term Loan. The swap agreement exchanged the fixed interest rate of 6.625% forCompany recorded a variable interest rategain on the $75.0 millionswap termination of $2.9 million. The gain is included in the principal amount outstanding. The variable interest rate is based upon LIBOR plus 4.47% and was 4.898% at October 28, 2011. The fair valueLoss on Extinguishment of Debt in the Company’s interest rate swap was a $1.2 million asset at October 28, 2011, and was estimated by discounting expected cash flows using market interest rates. The Company recognized a net interest receivableConsolidated Statement of $0.4 million at October 28, 2011.Operations.
60
Embedded Derivative Instruments
The Company’s embedded derivatives are the result of entering into sales or purchase contracts that are denominated in a currency other than the Company’s functional currency or the supplier’s or customer’s functional currency.
Net Investment Hedge
In July 2011, the Company entered into a Euro Term Loan for €125.0 million under the secured credit facility. The Company designated the Euro Term Loan a hedge of the investment in a certain French business unit. The foreign currency gain or loss that is effective as a hedge is reported as a component of other comprehensive income in shareholders’ equity. To the extent that this hedge is ineffective, the foreign currency gain or loss is recorded in earnings. There washas been no ineffectiveness.ineffectiveness since inception of the hedge.
Fair Value of Derivative Instruments
Fair values of derivative instruments in the Consolidated Balance Sheet at the end of fiscal 20112013 and 20102012 consisted of:
| | | | | | | | | | |
| | | | | Fair Value | |
| In Thousands | | Classification | | 2011 | | | 2010 | |
| | | |
Foreign Currency Forward Exchange Contracts: | | Other current assets | | $ | 7,092 | | | $ | 11,218 | |
| | Other assets | | | 1,321 | | | | 1,590 | |
| | Accrued liabilities | | | 1,606 | | | | 1,563 | |
| | Other liabilities | | | 1,096 | | | | 169 | |
| | | |
Embedded Derivative Instruments: | | Other current assets | | $ | 38 | | | $ | 23 | |
| | Accrued liabilities | | | 82 | | | | 189 | |
| | Other liabilities | | | 813 | | | | 1,626 | |
| | | |
Interest Rate Swap: | | Long-term debt, net of current maturities | | $ | 1,354 | | | $ | 0 | |
59
| | | | | | | | | | |
| In Thousands | | Classification | | Fair Value | |
| | | | | 2013 | | | 2012 | |
| | | |
Foreign Currency Forward Exchange Contracts: | | Other current assets | | $ | 4,547 | | | $ | 3,694 | |
| | Other assets | | | 1,393 | | | | 1,294 | |
| | Accrued liabilities | | | 3,002 | | | | 2,228 | |
| | Other liabilities | | | 1,661 | | | | 276 | |
| | | |
Embedded Derivative Instruments: | | Other current assets | | $ | 59 | | | $ | 51 | |
| | Other assets | | | 647 | | | | 0 | |
| | Accrued liabilities | | | 344 | | | | 148 | |
| | Other liabilities | | | 0 | | | | 322 | |
| | | |
Interest Rate Swap: | | Long-term debt, net | | | | | | | | |
| | of current maturities | | $ | 0 | | | $ | 4,152 | |
The effect of derivative instruments on the Consolidated Statement of Operations for fiscal 20112013 and 20102012 consisted of:
| | In Thousands | | Location of Gain (Loss) | | 2011 | | 2010 | | | Location of Gain (Loss) | | 2013 | | 2012 | |
| Fair Value Hedges: | | | | | | | | | | | | |
Interest rate swap contracts | | Interest Expense | | $ | 2,547 | | | $ | 2,772 | | | Interest Expense | | $ | 1,058 | | | $ | 2,388 | |
Interest rate swap contracts | | Loss on Early | | | | | |
| | | Loss on Extinguishment | | | | |
| | Extinguishment of Debt | | $ | 0 | | | $ | 3,744 | | | of Debt | | $ | 2,918 | | | $ | 0 | |
Embedded derivatives | | Sales | | $ | 929 | | | $ | (1,476 | ) | | Sales | | $ | 835 | | | $ | 433 | |
| Cash Flow Hedges: | | | | | | | | | | | | |
Foreign currency forward exchange contracts: | | | | | | | | | | | | |
Amount of (loss) gain recognized in
AOCI (effective portion) | | AOCI | | $ | (18,307 | ) | | $ | (13,495 | ) | | AOCI | | $ | (3,007 | ) | | $ | (4,343 | ) |
Amount of gain (loss) reclassified from
AOCI into income | | Sales | | $ | 10,092 | | | $ | 11,042 | | | Sales | | $ | (1,025 | ) | | $ | 784 | |
| Net Investment Hedges: | | | | | | | | | | | | |
Euro term loan | | AOCI | | $ | 5,054 | | | $ | 0 | | | AOCI | | $ | (2,697 | ) | | $ | 14,812 | |
During fiscal years 20112013 and 2010,2012, the Company recorded lossesa gain of $0.3$2.5 million and $0.1a loss of $1.1 million on foreign currency forward exchange contracts that have not been designated as an accounting hedge, respectively. These foreign currency exchange gains are included in selling, general and administrative expense.
There was no significant impact to the Company’s earnings related to the ineffective portion of any hedging instruments during fiscal years 20112013 and 2010.2012. In addition, there was no significant impact to the Company’s earnings when a hedged firm commitment no longer qualified as a fair value hedge or when a hedged forecasted transaction no longer qualified as a cash flow hedge during fiscal years 20112013 and 2010.2012.
61
Amounts included in AOCI are reclassified into earnings when the hedged transaction settles. The Company expects to reclassify approximately $4.3$0.8 million of net gainloss into earnings over the next 12 months. The maximum duration of a foreign currency cash flow hedge contract at October 28, 2011,25, 2013, is 2324 months.
NOTE 10: 9:Income Taxes
Income tax expense from continuing operations for each of the fiscal years consisted of:
| | In Thousands | | 2011 | | 2010 | | 2009 | | | 2013 | | 2012 | | 2011 | |
| Current | | | | | | | | | | | | |
U.S. Federal | | $ | 14,817 | | | $ | 16,787 | | | $ | 11,653 | | | | $ 27,364 | | | | $ 33,790 | | | | $ 14,817 | |
State | | | 2,994 | | | | 2,781 | | | | 1,043 | | | | 4,147 | | | | 356 | | | | 2,994 | |
Foreign | | | 19,472 | | | | 14,933 | | | | 11,321 | | | | 22,993 | | | | 21,222 | | | | 19,472 | |
| | | | |
| | | 37,283 | | | | 34,501 | | | | 24,017 | | | | 54,504 | | | | 55,368 | | | | 37,283 | |
| Deferred | | | | | | | | | | | | |
U.S. Federal | | | 8,332 | | | | 1,188 | | | | (5,514 | ) | | | (5,027 | ) | | | (4,578 | ) | | | 8,332 | |
State | | | 205 | | | | (480 | ) | | | 20 | | | | (1,592 | ) | | | 793 | | | | 205 | |
Foreign | | | (20,882 | ) | | | (10,705 | ) | | | (5,974 | ) | | | (17,800 | ) | | | (21,625 | ) | | | (20,882 | ) |
| | | | |
| | | (12,345 | ) | | | (9,997 | ) | | | (11,468 | ) | | | (24,419 | ) | | | (25,410 | ) | | | (12,345 | ) |
| | | | |
Income tax expense | | $ | 24,938 | | | $ | 24,504 | | | $ | 12,549 | | | | $ 30,085 | | | | $ 29,958 | | | | $ 24,938 | |
| | | | |
U.S. and foreign components of incomeearnings from continuing operations before income taxes for each of the fiscal years were:
| | | | | | | | | | | | |
| In Thousands | | 2011 | | | 2010 | | | 2009 | |
| | | |
U.S. | | $ | 110,798 | | | $ | 71,980 | | | $ | 75,287 | |
Foreign | | | 47,684 | | | | 82,769 | | | | 43,047 | |
| |
Income from continuing operations,
before income taxes | | $ | 158,482 | | | $ | 154,749 | | | $ | 118,334 | |
| |
60
| | | | | | | | | | | | |
| In Thousands | | 2013 | | | 2012 | | | 2011 | |
| | | |
U.S. | | | $ 96,105 | | | | $ 108,436 | | | | $ 110,798 | |
Foreign | | | 101,744 | | | | 35,097 | | | | 47,684 | |
| |
Earnings from continuing operations,
before income taxes | | | $ 197,849 | | | | $ 143,533 | | | | $ 158,482 | |
| |
Primary components of the Company’s deferred tax assets (liabilities) at the end of the fiscal yearyears resulted from temporary tax differences associated with the following:
| | In Thousands | | 2011 | | | 2010 | | | 2013 | | 2012 | |
| Reserves and liabilities | | $ | 45,526 | | | $ | 37,395 | | | | $ 60,397 | | | | $ 58,510 | |
NOL carryforwards (net of valuation allowances of $0.3 million and
$5.4 million at fiscal year end 2011 and 2010, respectively) | | | 247 | | | | 1,302 | | |
Tax credit carryforwards (net of valuation allowance of $1.4 million
and $1.6 million at fiscal year end 2011 and 2010, respectively) | | | 26,237 | | | | 27,931 | | |
NOL carryforwards | | | | 879 | | | | 725 | |
Tax credit carryforwards | | | | 29,862 | | | | 26,687 | |
Employee benefits | | | 13,500 | | | | 12,176 | | | | 14,974 | | | | 17,524 | |
Retirement benefits | | | 19,629 | | | | 29,959 | | | | 2,759 | | | | 25,379 | |
Non-qualified stock options | | | 10,977 | | | | 9,943 | | | | 12,618 | | | | 13,220 | |
Other | | | 3,560 | | | | 2,039 | | | | 650 | | | | 600 | |
| | | | |
Total deferred tax assets | | | 119,676 | | | | 120,745 | | | | 122,139 | | | | 142,645 | |
| Depreciation and amortization | | | (22,382 | ) | | | (12,173 | ) | | | (18,969 | ) | | | (18,024 | ) |
Intangibles and amortization | | | (207,619 | ) | | | (106,507 | ) | | | (173,524 | ) | | | (182,921 | ) |
Deferred costs | | | (6,216 | ) | | | (8,408 | ) | | | (4,535 | ) | | | (5,981 | ) |
Hedging activities | | | (1,007 | ) | | | (2,171 | ) | | | (22 | ) | | | (111 | ) |
Other | | | (2,843 | ) | | | (561 | ) | | | (1,398 | ) | | | (1,979 | ) |
| | | | |
Total deferred tax liabilities | | | (240,067 | ) | | | (129,820 | ) | | | (198,448 | ) | | | (209,016 | ) |
| | | | |
Net deferred tax liabilities | | $ | (120,391 | ) | | $ | (9,075 | ) | | | $ (76,309 | ) | | | $ (66,371 | ) |
| | | | |
During fiscal 2011, approximately $5.2 million of unrecognized tax benefits associated with research and experimentation tax credits and operating losses were recognized as a result of settlement of examinations and the expiration of statute of limitations. The tax credit carryforward of $1.4 million will expire in 2018. During fiscal 2010, approximately $6.8 million of unrecognized foreign tax benefits associated with losses on the disposition of assets were released as a result of the expiration of a statute of limitations and the settlement of examinations.carryforwards can be carried forward indefinitely.
The Company operates in numerous taxing jurisdictions and is subject to regular examinations by various U.S. federal, state and foreign jurisdictions for various tax periods. Additionally, the Company has retained tax liabilities and the rights to tax refunds in connection with various acquisitions and divestitures of businesses in prior years. The Company’s income
62
tax positions are based on research and interpretations of income tax laws and rulings in each of the jurisdictions in which the Company does business. Due to the subjectivity and complexity of the interpretations of the tax laws and rulings in each jurisdiction, the differences and interplay in the tax laws between those jurisdictions as well as the inherent uncertainty in estimating the final resolution of complex tax audit matters, the Company’s estimates of income tax liabilities and assets may differ from actual payments, assessments or refunds.
Management believes that it is more likely than not that the Company will realize the current and long-term deferred tax assets as a result of future taxable income. Significant factors management considered in determining the probability of the realization of the deferred tax assets include the reversal of deferred tax liabilities,expected future earnings, the Company’s historical operating results and expected future earnings.the reversal of deferred tax liabilities. Accordingly, no valuation allowance has been recorded on the deferred tax assets other than certain net operating losses and foreign tax credits. Both the net operating losses and the foreign tax credits begin to expire in 2018.assets.
The U.S. and various state and foreign income tax returns are open to examination, and presently severalthere are foreign income tax returns are under examination. Such examinations could result in challenges to tax positions taken, and accordingly, the Company may record adjustments to provisions based on the outcomes of such matters. However, the Company believes that the resolution of these matters, after considering amounts accrued, will not have a material adverse effect on its consolidated financial statements.
The incremental tax benefit received by the Company upon exercise of non-qualified employee stock options was $1.8$3.0 million, $3.5$0.4 million, and $0.1$1.8 million in fiscal 2013, 2012, and 2011, 2010, and 2009, respectively.
61
A reconciliation of the U.S. federal statutory income tax rate to the effective income tax rate for each of the fiscal years was as follows:
| | | | | | | | | | | | | | | | | | |
| | | 2011 | | 2010 | | 2009 | | | 2013 | | | 2012 | | | 2011 | |
| U.S. statutory income tax rate | | | 35.0 | % | | | 35.0 | % | | | 35.0 | % | | | 35.0 | % | | | 35.0 | % | | | 35.0 | % |
State income taxes | | | 1.4 | | | | 1.2 | | | | 0.6 | | | | 0.7 | | | | 0.7 | | | | 1.4 | |
Foreign taxes | | | (10.8 | ) | | | (10.3 | ) | | | (16.0 | ) | | | (11.3 | ) | | | (14.8 | ) | | | (10.6 | ) |
Goodwill impairment | | | | 0.6 | | | | 12.7 | | | | 0.0 | |
Penalties | | | | 1.8 | | | | 0.0 | | | | 0.0 | |
Difference in foreign tax rates | | | | (1.1 | ) | | | (2.3 | ) | | | (0.2 | ) |
Domestic manufacturing deduction | | | (1.3 | ) | | | (0.7 | ) | | | (1.2 | ) | | | (1.4 | ) | | | (2.3 | ) | | | (1.3 | ) |
Research & development credits | | | (5.5 | ) | | | (3.3 | ) | | | (6.1 | ) | | | (3.7 | ) | | | (3.4 | ) | | | (5.5 | ) |
Net change in tax reserves | | | (2.4 | ) | | | (4.3 | ) | | | 1.0 | | | | (3.0 | ) | | | 0.5 | | | | (2.4 | ) |
Suspended losses | | | 0.0 | | | | 0.0 | | | | (5.6 | ) | |
U.S. tax on foreign income | | | 0.0 | | | | 0.0 | | | | 6.6 | | |
U.S. foreign tax credits | | | 0.0 | | | | 0.0 | | | | (6.7 | ) | |
Valuation allowance | | | (3.0 | ) | | | (1.6 | ) | | | 2.3 | | | | 0.0 | | | | (1.0 | ) | | | (3.0 | ) |
Change in foreign tax rates | | | (2.2 | ) | | | (1.1 | ) | | | 0.0 | | |
Change in foreign tax rates and laws | | | | (1.7 | ) | | | (3.6 | ) | | | (2.2 | ) |
Acquisition and organizational restructuring | | | 3.0 | | | | 0.0 | | | | 0.0 | | | | 0.0 | | | | 0.0 | | | | 3.0 | |
Other, net | | | 1.5 | | | | 0.9 | | | | 0.7 | | | | (0.7 | ) | | | (0.6 | ) | | | 1.5 | |
| | | | |
Effective income tax rate | | | 15.7 | % | | | 15.8 | % | | | 10.6 | % | | | 15.2 | % | | | 20.9 | % | | | 15.7 | % |
| | | | |
No provision for federal income taxes has been made on accumulated earnings of foreign subsidiaries, since such earnings are considered indefinitely reinvested. The amount of undistributed foreign earnings which are considered to be indefinitely reinvested at October 28, 2011,25, 2013, is $369.6approximately $571.0 million. Furthermore, with respect to the requirements of ASC 740-30-50-2(c), the Company determined it was not practical to estimate the deferred taxes on these earnings. The amount of deferred income taxes is not practical to compute due to the complexity of the Company’s international holding company structure, layers of regulatory requirements that have to be evaluated to determine the amount of allowable dividends, numerous potential repatriation scenarios that could be created to facilitate the repatriation of earnings to the U.S., and the complexity of computing foreign tax credits.
In accordance with ASC 805, formerly Financial Accounting Standard 141(R), “Business Combinations,” the Company adopted the provisions related to accounting for business combination transactions at the beginning of fiscal year 2010. Changes in tax uncertainties established at an acquisition date are accounted for as adjustments to tax expense, rather than an adjustment to goodwill. Approximately $5.2 million of income tax benefit associated with the release of unrecognized tax benefits related to an acquired business was recognized in fiscal 2011.
63
A reconciliation of the beginning and ending amount of unrecognized tax benefits is as follows:
| | In Thousands | | Total | | | Total | |
| Unrecognized tax benefits as of October 29, 2010 | | $ | 15,248 | | |
Unrecognized tax benefits as of October 26, 2012 | | | $ | 14,979 | |
Unrecognized gross benefit change: | | | | |
Gross increases due to prior-period adjustments | | | 392 | | | | 538 | |
Gross (decrease) due to prior-period adjustments | | | 0 | | | | (1,287 | ) |
Gross increases due to current-period adjustment | | | 1,610 | | | | 4,260 | |
Gross (decrease) due to current-period adjustment | | | 0 | | | | 0 | |
Gross (decrease) due to settlements with taxing authorities | | | (6,095 | ) | | | (888 | ) |
Gross (decrease) due to a lapse with taxing authorities | | | (247 | ) | | | (5,594 | ) |
| | | | |
Total change in unrecognized gross benefit | | $ | (4,340 | ) | | | (2,971 | ) |
| | | | |
| Unrecognized tax benefits as of October 28, 2011 | | $ | 10,908 | | |
Unrecognized tax benefits as of October 25, 2013 | | | $ | 12,008 | |
| | | | |
| Unrecognized tax benefits that, if recognized, would impact the effective tax rate | | $ | 10,908 | | | $ | 12,008 | |
| Statement of operations: | | | | |
Total amount of interest income (expense) included in income tax expense | | $ | (576 | ) | | $ | 1,154 | |
| Recognized in the statement of financial position: | | | | |
Total amount of accrued interest included in income taxes payable | | $ | 1,437 | | | $ | 876 | |
During the next 12 months, it is reasonably possible that approximately $0.8$1.6 million of previously unrecognized tax benefits related to operating losses and tax credits could decrease as a result of settlement of examinations and/or the expiration of statutes of limitations. The Company recognizes interest related to unrecognized tax benefits in income tax expense.
62
The Company is no longer subject to income tax examinations by tax authorities in its major tax jurisdictions as follows:
| | |
| | Years No Longer |
Tax Jurisdiction | | Years No Longer
Subject to Audit |
U.S. Federal | | 2007 and prior |
Canada | | 2005 and prior |
Canada | | 2004 and prior |
France | | 2007 and prior |
Germany | | 2009 and prior |
United Kingdom | | 20082010 and prior |
NOTE 11: 10:Debt
Long-term debt at the end of fiscal 20112013 and 20102012 consisted of the following:
| | In Thousands | | 2011 | | | 2010 | | | 2013 | | | 2012 | |
| U.S. credit facility | | $ | 360,000 | | | $ | 0 | | | $ | 130,000 | | | $ | 240,000 | |
Euro Term Loan, due July 2016 | | | | 24,847 | | | | 80,240 | |
U.S. Term Loan, due July 2016 | | | | 170,625 | | | | 0 | |
6.625% Senior Notes, due March 2017 | | | | 0 | | | | 175,000 | |
7.00% Senior Notes, due August 2020 | | | 250,000 | | | | 250,000 | | | | 250,000 | | | | 250,000 | |
U.S. term loan, due March 2012 | | | 0 | | | | 120,313 | | |
Euro term loan, due March 2016 | | | 162,725 | | | | 0 | | |
6.625% Senior Notes, due March 2017 | | | 175,000 | | | | 175,000 | | |
Obligations under Capital Leases | | | 45,184 | | | | 44,368 | | |
Government refundable advances | | | | 56,897 | | | | 51,763 | |
Obligations under capital leases | | | | 56,229 | | | | 44,847 | |
Other | | | 38,714 | | | | 21,937 | | | | 540 | | | | 6,820 | |
| | | | |
| | | 1,031,623 | | | | 611,618 | | | | 689,138 | | | | 848,670 | |
| Less current maturities | | | 11,595 | | | | 12,646 | | | | 21,279 | | | | 10,610 | |
| | | | |
Carrying amount of long-term debt | | $ | 1,020,028 | | | $ | 598,972 | | | $ | 667,859 | | | $ | 838,060 | |
| | | | |
Long-term debt
In March 2011, the Company entered into a secured credit facility for $460 million made available through a group of banks. The credit facility is secured by substantially all of the Company’s assets and interest is based on standard inter-bank offering rates. The credit facility expires in MarchJuly 2016. The interest rate will range from LIBOR plus 1.5% to LIBOR
64
plus 2.25% depending on the leverage ratios at the time the funds are drawn. At October 28, 2011,25, 2013, the Company had $360.0$130.0 million outstanding under the secured credit facility at an interest rate of LIBOR plus 1.75% or 2.0%, which is currently 1.93%. An additional $32,460,000$66.2 million of unsecured foreign currency credit facilities have been extended by foreign banks for a total of $492,460,000$526.2 million available companywide. Available credit under the above credit facilities was $122,369,000$363.5 million at fiscal 20112013 year end, when reduced by outstanding borrowings of $365,000,000$130.0 million and letters of credit of $5,091,000.$32.7 million.
In July 2011, the Company amended the secured credit facility to provide for a new €125.0 €125.0��million term loan (Euro Term Loan). The interest rate on the Euro Term Loan will range from Euroeuro LIBOR plus 1.5% to Euro LIBOR plus 2.25%, depending on the leverage ratios at the time the funds are drawn. At October 28, 2011,25, 2013, the Company had €115.0€18.0 million outstanding or $162.7$24.8 million under the Euro Term Loan at an interest rate of Euroeuro LIBOR plus 1.75% or 3.06%, which is currently 1.84%. The loan amortizes at 1.25% of the original principal balance quarterly through March 2016, with the remaining balance due in July 2016.
On August 2, 2010,In April 2013, the Company amended the secured credit facility to provide for $175.0 million term loan (U.S. Term Loan). The interest rate on the U.S. Term Loan ranges from LIBOR plus 1.5% to LIBOR plus 2.25%, depending on the leverage ratios at the time the funds are drawn. At October 25, 2013, the Company had $170.6 million outstanding under the U.S. Term Loan at an interest rate of LIBOR plus 1.75%, which is currently 1.93%. The loan amortizes at 1.25% of the original principal balance quarterly through March 2016, with the remaining balance due in July 2016.
In March 2007, the Company issued $250.0$175.0 million in 7%6.625% Senior Notes due 2020March 2017 (2017 Notes), and requiring semi-annual interest payments in March and September of each year until maturity. The net proceeds from the sale of the notes, after deducting $4.4 million of debt issuance cost, were $245.6 million. The Senior2017 Notes are general unsecured senior obligations of the Company. The Senior2017 Notes are guaranteed, jointly and severally on a senior basis, by all the existing and future domestic subsidiaries of the Company unless designated as an “unrestricted subsidiary,” and those foreign subsidiaries that executed related subsidiary guarantees under the indenture covering the Senior2017 Notes. The Senior2017 Notes are subject to redemption at the option of the Company at any time prior to August 1, 2015, at a price equal to 100% of the principal amount, plus any accrued interest to the date of redemption and a make-whole provision. In addition, before August 1, 2013, the Company may redeem up to 35% of the principal amount at 107.000% plus accrued interest with proceeds of one or more Public Equity Offerings. The Senior Notes are also subject to redemption at the option of the Company, in whole or in part, on or after August 1, 2015, at redemption prices starting at 103.500% of the principal amount plus accrued interest during the period beginning August 1, 2015, and declining annually to 100% of principal and accrued interest on or after August 1, 2018.
63
On March 1, 2007, the Company issued $175.0 million in 6.625% Senior Notes due March 1, 2017, and requiring semi-annual interest payments in March and September of each year until maturity. The Senior Notes are general unsecured senior obligations of the Company. The Senior Notes are guaranteed, jointly and severally on a senior basis, by all the existing and future domestic subsidiaries of the Company unless designated as an “unrestricted subsidiary,” and those foreign subsidiaries that executed related subsidiary guarantees under the indenture covering the Senior Notes. The Senior Notes are subject to redemption at the option of the Company at any time prior to March 1, 2012, at a price equal to 100% of the principal amount, plus any accrued interest to the date of redemption and a make-whole provision. The Senior Notes arewere also subject to redemption at the option of the Company, in whole or in part, on or after March 1, 2012, at redemption prices starting at 103.3125% of the principal amount plus accrued interest during the period beginning March 1, 2007, and declining annually to 100% of principal and accrued interest on or after March 1, 2015.
In November 2010, the Company entered into an interest rate swap agreement for $100.0 million on the $175.0 million Senior Notes due in 2017.2017 Notes. The swap agreement exchanged the fixed interest rate of 6.625% for a variable interest rate, LIBOR plus 4.865%. The fair value of the Company’s interest rate swap was a $126,000$1.9 million asset at October 28, 2011.26, 2012.
In December 2010, the Company entered into an interest rate swap agreement for $75.0 million on the $175.0 million Senior Notes due in 2017.2017 Notes. The swap agreement exchanged the fixed interest rate of 6.625% for a variable interest rate, LIBOR plus 4.47%. The fair value of the Company’s interest rate swap was a $1,228,000$2.2 million asset at October 28, 2011.26, 2012.
OnIn April 2013, the Company redeemed the $175.0 million 2017 Notes. In connection with the redemption, the Company wrote off $1.3 million in unamortized debt issuance costs as a charge against interest expense. In addition, the Company incurred a $3.9 million redemption premium and received proceeds of $2.9 million from the termination of its $175.0 million interest rate swap agreements. As a result, the redemption of the 2017 Notes resulted in a net loss of $0.9 million on extinguishment of debt.
In August 2, 2010, the Company repurchased approximately $157.6issued $250.0 million in 7% Senior Notes due August 2020 (2020 Notes) and requiring semi-annual interest payments in March and September of each year until maturity. The net proceeds from the sale of the notes, after deducting $4.4 million of debt issuance cost, were $245.6 million. The 2020 Notes are general unsecured senior obligations of the Senior SubordinatedCompany. The 2020 Notes are guaranteed, jointly and severally on a senior basis, by all the existing and future domestic subsidiaries of the Company unless designated as an “unrestricted subsidiary,” and those foreign subsidiaries that executed related subsidiary guarantees under the indenture covering the 2020 Notes. The 2020 Notes are subject to redemption at the option of the Company at any time prior to August 1, 2015, at a price equal to 100% of the principal amount, plus any accrued interest to the date of redemption and a make-whole provision. The 2020 Notes are also subject to redemption at the option of the Company, in whole or in part, on or after August 1, 2015, at redemption prices starting at 103.500% of the principal amount plus accrued interest during the period beginning August 1, 2015, and declining annually to 100% of principal and accrued interest on or after August 1, 2018.
Based on quoted market prices, the fair value of the Company’s $250.0 million 2020 Notes was $272.5 million and $277.5 million as of October 25, 2013, and October 26, 2012, respectively. The fair value of the Company’s $175.0 million 2017 Notes was $181.3 million as of October 26, 2012. The carrying amounts of the secured credit facility, the Euro Term Loan due 2016, and the U.S. Term Loan due 2016 approximate fair value. Estimates of fair value for the 2020 Notes and 2017 Notes were based on Level 2 inputs as defined in 2013 under a cash tender offer.the fair value hierarchy.
65
Government refundable advances consist of payments received from the Canadian government to assist in research and development related to commercial aviation. The remaining $17.4 millionrepayment of Senior Subordinated Notes duethis advance is based on year-over-year commercial aviation revenue growth at CMC beginning in 2013 were redeemed2014. Imputed interest on September 9, 2010. A loss on extinguishmentthe advance was 4.61% at October 25, 2013. The discounted value of debt recognized was $56.9 million and $51.8 million as of $1.2 million was recorded, which includes recognizing previously recorded deferred gains on terminated interest rate swaps of $3.7 million.October 25, 2013, and October 26, 2012, respectively.
Capital leases
In fiscal 2008, the Company entered into a land and building lease for a 216,000 square-foot manufacturing facility for a control systems operation.an Avionics & Controls segment facility. The land and building lease has a fixed term of 30 years and includes an option to purchase the building at fair market value five years after construction is complete. The expected minimum lease payments include a 2% minimum annual rent increase. At October 28, 2011,25, 2013, the amount recorded as a capitalized lease obligation is $31.9$32.3 million. The imputed interest rate is 8.2%9.0%.
In fiscal 2009, the Company amended the building lease for an interface technologiesAvionics & Controls facility to extend the term of the lease to 2027. At October 28, 2011,25, 2013, the amount recorded as a capitalized lease obligation is $12.4$11.8 million. The imputed interest rate is 6.4%.
In fiscal 2013, the Company amended the building lease for an Avionics & Controls facility to extend the term of the lease to 2022. At October 25, 2013, the amount recorded as a capitalized lease obligation is $11.7 million. The imputed interest rate is 4.5%.
As of October 28, 2011,25, 2013, aggregate annual maturities of long-term debt and future non-cancelable minimum lease payments under capital lease obligations were as follows:
In Thousands
| | | $118,024 | | | $118,024 | | | $118,024 | |
| In Thousands | | | | | | | | | | |
| Fiscal Year | | Debt | | | | | Capital
Leases | |
2012 | | $ | 11,496 | | | | | $ | 4,025 | |
2013 | | | 9,006 | | | | | | 4,447 | |
2014 | | | 8,881 | | | | | | 4,326 | |
2015 | | | 8,844 | | | | | | 4,387 | |
2016 | | | 487,349 | | | | | | 4,273 | |
2017 and thereafter | | | 460,863 | | | | | | 96,566 | |
| |
| | $ | 986,439 | | | | | $ | 118,024 | |
| |
| | | |
Less: amount representing interest | | | | | | | | | 72,840 | |
| | | | | | | | | | |
Total principal payments | | | | | | | | $ | 45,184 | |
| | | | | | | | | | |
| | | | |
Fiscal Year | | | | |
| |
2014 | | $ | 25,143 | |
2015 | | | 23,402 | |
2016 | | | 296,026 | |
2017 | | | 5,182 | |
2018 | | | 5,182 | |
2019 and thereafter | | | 406,936 | |
| |
Total | | $ | 761,871 | |
| |
| |
Less: amount representing interest on capital leases | | | 72,733 | |
| | | | |
Total long-term debt | | $ | 689,138 | |
| | | | |
A number of underlying agreements contain various covenant restrictions which include maintenance of net worth, payment of dividends, interest coverage, and limitations on additional borrowings. The Company was in compliance with these covenants at October 28, 2011.25, 2013.
Subsequent to year end, the Company has paid down $20,000,000 on the U.S. credit facility and $5,000,000 on the foreign credit facility.
64
NOTE 12: 11:Commitments and Contingencies
Rental expense for operating leases for engineering, selling, administrative and manufacturing totaled $14,208,000, $14,498,000,$17,996,000, $17,603,000 and $16,166,000$14,208,000 in fiscal years 2013, 2012, and 2011, 2010, and 2009, respectively.
66
At October 28, 2011,25, 2013, the Company’s rental commitments for noncancelable operating leases with a duration in excess of one year were as follows:
In Thousands
| | | | |
| In Thousands | | | | |
| |
| Fiscal Year | | | | |
| |
2012 | | $ | 15,084 | |
2013 | | | 12,074 | |
2014 | | | 9,998 | |
2015 | | | 7,084 | |
2016 | | | 5,494 | |
2017 and thereafter | | | 15,351 | |
| |
| | $ | 65,085 | |
| |
The Company receives government funding under the Technology Partnership Canada program to assist in the development of certain new products. The amounts are reimbursable through royalties on future revenues derived from funded products if and when they are commercialized.
| | | | |
Fiscal Year | | | | |
| |
2014 | | $ | 14,973 | |
2015 | | | 9,993 | |
2016 | | | 7,981 | |
2017 | | | 7,205 | |
2018 | | | 6,337 | |
2019 and thereafter | | | 18,349 | |
| |
| | $ | 64,838 | |
| |
The Company is subject to purchase obligations for goods and services. The purchase obligations include amounts under legally enforceable agreements for goods and services with defined terms as to quantity, price and timing of delivery. As of October 28, 2011,25, 2013, the Company’s purchase obligations were as follows:
In Thousands
| | | 696,692 | | | | 696,692 | | | | 696,692 | | | | 696,692 | | | | 696,692 | |
| | | Total | | | Less than 1 year | | | 1-3 years | | | 4-5 years | | | After 5 years | |
| | | | | |
Purchase obligations | | $ | 696,692 | | | $ | 654,996 | | | $ | 39,154 | | | $ | 1,847 | | | $ | 695 | |
| | | | | | | | | | | | | | | | | | | | |
| In Thousands | | | | | | | | | | | | | | | |
| | | Total | | | Less than
1 year | | | 1-3 years | | | 4-5 years | | | After 5
years | |
| | | | | |
Purchase obligations | | $ | 688,546 | | | $ | 630,524 | | | $ | 52,131 | | | $ | 5,412 | | | $ | 479 | |
The Company is subject to U.S. export laws and regulations, including the International Traffic in Arms Regulations (ITAR), that generally restricts the export of defense products, technical data, and defense services. The Company filed voluntary disclosure reports concerning certain technical and administrative violations of the ITAR with the U.S. Department of State’s Directorate of Defense Trade Controls (DDTC) Office of Defense Trade Controls Compliance (DDTC Office of Compliance). To address these problems, the Company has made a number of investments in its export compliance functions, including: additional staffing, ongoing implementation of a new software system, employee training, and establishment of a regular compliance audit program and corrective action process. The DDTC Office of Compliance acknowledged the Company’s progress and continuing improvements, but nevertheless informed the Company that it intends to impose civil monetary fines and administrative sanctions based on the information it had concerning the Company’s earlier history in handling ITAR-controlled transactions, including the substance of its prior voluntary disclosures and other aspects of ITAR compliance errors. Management has been in discussions with the agency and provided supplemental information with the intent of reaching a settlement. On August 15, 2013, the DDTC Office of Compliance proposed a total penalty of $20 million, with $10 million suspended and eligible for offset credit based on verified expenditures for past and future remedial compliance measures. Based on this proposal, the Company estimated and recorded a $10 million charge in fiscal 2013. Management has continued discussions with the DDTC Office of Compliance on final settlement terms, and the final settlement is subject to approval by the agency.
The Company is a party to various lawsuits and claims, both as plaintiff and defendant, and has contingent liabilities arising from the conduct of business, none of which, in the opinion of management, is expected to have a material effect on the Company’s financial position or results of operations. The Company believes that it has made appropriate and adequate provisions for contingent liabilities.
Prior to the March 2007 acquisition of CMC, CMC was involved in a transaction in which CMC shareholders had a limited amount of time in which to tender their shares in exchange for cash. In May 2008, after the prescribed time period had expired, CAD $11.8 million remained unclaimed. As a result, the paying agent returned the unclaimed amount to CMC in accordance with Canadian law. In December 2008, CMC’s former parent company instituted a legal action against the paying agent, alleging negligence and breached contract terms by returning the funds to CMC. The California Attorney General’s office filed a complaint against Kirkhill-TA, a subsidiary included in our Advanced Materials segment, withplaintiff lost at trial and appealed. In the Superior Courtsecond quarter of California, Orange County, on behalf of Californiafiscal 2012, CMC received notice that the plaintiff abandoned its appeal. In addition, CMC and the Santa Ana Regional Water Quality Control Board (Board) regarding dischargepaying agent settled all remaining issues. All contingencies relating to this matter were resolved, and accordingly, the Company recorded a gain of industrial waste water from its Brea, California, facility into Fullerton Creek and Craig Lake. The Company reached a settlement withapproximately CAD $11.8 million or $11.9 million or $9.5 million after tax, in the Boardsecond fiscal quarter of $1.9 million, including legal costs, in 2011. The full amount is recorded on the balance sheet as an accrued liability.2012.
Approximately 543601 U.S.-based employees or 12% of total U.S.-based employees were represented by various labor unions. The Company’s European operations are subject to national trade union agreements and to local regulations governing employment.
67
NOTE 13:12: Employee Stock Plans
The Company has three share-based compensation plans, which are described below. The compensation cost that has been charged against income for those plans for fiscal 2013, 2012, and 2011 2010, and 2009 was $7.9$9.6 million, $7.1$9.5 million, and $7.3$7.9 million, respectively. The total income tax benefit recognized in the income statement for the share-based compensation arrangement for fiscal 2013, 2012, and 2011 2010,was $3.0 million, $2.9 million, and 2009 was $2.7 million, $2.2 million, and $2.3 million, respectively.
65
Employee Stock Purchase Plan
The Company offers an employee stock purchase plan to its employees. The plan qualifies as a noncompensatory employee stock purchase plan under Section 423 of the Internal Revenue Code. Employees are eligible to participate through payroll deductions subject to certain limitations.
The plan is as a safe harbor design where shares are purchased by participants at 95% of the fair market value on the purchase date and, therefore, compensation cost is not recorded. During fiscal 2011,2013, employees purchased 25,92930,873 shares at a fair market value price of $70.36$67.97 per share. At the end of fiscal 2011,2013, the Company had reserved 179,50073,272 shares for issuance under its employee share-save scheme for U.K. employees, leaving a balance of 759,420641,112 shares available for issuance in the future. As of October 28, 2011,25, 2013, deductions aggregating $640,721$738,490 were accrued for the purchase of shares on December 15, 2011.2013.
The fair value of the awards under the employee stock purchase plan was estimated using a Black-Scholes pricing model which uses the assumptions noted in the following table. The Company uses historical data to estimate volatility of the Company’s common stock. The risk-free rate for the contractual life of the option is based on the U.S. Treasury zero coupon issues in effect the time of grant.
| | | | |
| | 2009 | |
| |
Volatility
| | | 33.8% | |
Risk-free interest rate
| | | 3.32% | |
Expected life (months)
| | | 6 | |
Dividends
| | | 0 | |
| |
Employee Share-Save Scheme
In 2009, the Company began offering shares under its employee share-save scheme for U.K. employees. This plan allows participants the option to purchase shares at 95% of the market price of the stock as of the beginning of the offering period. The term of these options is three years. The share-save scheme is not a “safe-harbor” design, and, therefore, compensation cost is recognized on this plan.
Under the employee share-save scheme, option exercise prices are equal to the fair market value of the Company’s common stock on the date of grant. The Company granted 9,956, 10,13316,722, 45,063 and 164,1999,956 options in fiscal 2011, 2010,2013, 2012, and 2009,2011, respectively. The weighted-average grant date fair value of options granted in fiscal 20112013 was $26.14$20.24 per share. During fiscal 2013, 10,468 options were exercised at a weighted average exercise price of $41.04.
The fair value of the awards under the employee share-save scheme was estimated using a Black-Scholes pricing model which uses the assumptions noted in the following table. The risk-free rate for the contractual life of the option is based on the U.S. Treasury zero coupon issues in effect the time of grant.
| | | | 2011 | | | 2010 | | | 2009 | | | 2013 | | 2012 | | 2011 | |
| Volatility | | | 51.10 | % | | | 51.61 | % | | | 50.08% | | | | 36.97 | % | | | 38.96 | % | | | 51.10% | |
Risk-free interest rate | | | 0.98 | % | | | 1.34 | % | | | 0.58% | | | | 0.40 | % | | | 0.38 | % | | | 0.98% | |
Expected life (years) | | | 3 | | | | 3 | | | | 3 | | | | 3 | | | | 3 | | | | 3 | |
Dividends | | | 0 | | | | 0 | | | | 0 | | | | 0 | | | | 0 | | | | 0 | |
| | | | |
Equity Incentive Plan
The Company also provides a nonqualified stock optionan equity incentive plan (equity incentive plan) for officers and key employees. At the end of fiscal 2011,2013, the Company had 2,769,7103,665,557 shares reserved for issuance to officers and key employees, of which 934,8101,776,939 shares were available to be granted in the future.
The Board of Directors authorized the Compensation Committee to administer awards granted under the equity incentive plan including option grants, and to establish the terms of such awards. Awards under the equity incentive plan may be granted to eligible employees of the Company over the 10-year period ending March 3, 2014.5, 2023. Options granted generally become exercisable ratably over a period of four years following the date of grant and expire on the tenth anniversary of the grant. Option exercise prices are equal to the fair market value of the Company’s common stock on the date of grant. The weighted-average grant date fair value of the options granted in fiscal 20112013 and 20102012 was $32.51$29.65 per share and $21.45$24.61 per share, respectively.
The fair value of each option granted by the Company was estimated using a Black-Scholes pricing model which uses the assumptions noted in the following table. The Company uses historical data to estimate volatility of the Company’s common stock and option exercise and employee termination assumptions. The range of the expected term reflects the results from certain groups of employees exhibiting different behavior. The risk-free rate for the periods within the contractual life of the grant is based upon the U.S. Treasury zero coupon issues in effect at the time of the grant.
6668
| | | | 2011 | | | 2010 | | | 2009 | | | 2013 | | 2012 | | 2011 | |
| Volatility | | | 40.8 – 42.8 | % | | | 43.0 – 43.2 | % | | | 36.8 – 43.1% | | | | 41.89 – 44.25 | % | | | 41.62 – 44.29 | % | | | 40.8 – 42.8% | |
Risk-free interest rate | | | 2.02 – 3.64 | % | | | 2.42 – 4.00 | % | | | 1.43 – 3.12% | | | | 0.79 – 1.88 | % | | | 0.91 – 2.11 | % | | | 2.02 – 3.64% | |
Expected life (years) | | | 4.5 – 9.5 | | | | 4.5 – 9.5 | | | | 4.5 – 9.5 | | | | 4.5 – 9.5 | | | | 4.5 – 9.5 | | | | 4.5 – 9.5 | |
Dividends | | | 0 | | | | 0 | | | | 0 | | | | 0 | | | | 0 | | | | 0 | |
| | | | |
The following table summarizes the changes in outstanding options granted under the Company’s stock option plans:equity incentive plan:
| | | | 2011 | | | 2010 | | | 2009 | | | 2013 | | | 2012 | | | 2011 | |
| | | Shares
Subject to
Option | | Weighted
Average
Exercise
Price | | | Shares
Subject to
Option | | Weighted
Average
Exercise
Price | | | Shares
Subject to
Option | | Weighted
Average
Exercise
Price | | | Shares
Subject to
Option | | Weighted
Average
Exercise
Price | | | Shares
Subject to
Option | | Weighted
Average
Exercise
Price | | | Shares
Subject to
Option | | Weighted
Average
Exercise Price | |
Outstanding,
beginning of year | | | 1,838,950 | | | $ | 39.31 | | | | 1,960,775 | | | $ | 35.54 | | | | 1,665,925 | | | $ | 36.75 | | | | | | | | 2,124,300 | | | $ | 46.18 | | | | 1,825,300 | | | $ | 44.49 | | | | 1,838,950 | | | $ | 39.31 | |
Granted | | | 331,300 | | | | 67.03 | | | | 359,800 | | | | 41.83 | | | | 429,400 | | | | 31.69 | | | | | | | | 257,000 | | | | 65.58 | | | | 386,400 | | | | 52.97 | | | | 331,300 | | | | 67.03 | |
Exercised | | | (295,175 | ) | | | 37.03 | | | | (455,700 | ) | | | 24.96 | | | | (25,100 | ) | | | 13.61 | | | | | | | | (518,537 | ) | | | 37.89 | | | | (60,775 | ) | | | 36.52 | | | | (295,175 | ) | | | 37.03 | |
Cancelled | | | (40,175 | ) | | | 41.69 | | | | (25,925 | ) | | | 41.37 | | | | (109,450 | ) | | | 43.90 | | | | | | |
Forfeited/cancelled | | | | (29,025 | ) | | | 55.83 | | | | (26,625 | ) | | | 50.68 | | | | (49,775 | ) | | | 47.28 | |
| | | | | | | | |
Outstanding,
end of year | | | 1,834,900 | | | $ | 44.63 | | | | 1,838,950 | | | $ | 39.31 | | | | 1,960,775 | | | $ | 35.54 | | | | | | | | 1,833,738 | | | $ | 51.09 | | | | 2,124,300 | | | $ | 46.18 | | | | 1,825,300 | | | $ | 44.49 | |
| | | | | | | | |
Exercisable,
end of year | | | 994,950 | | | $ | 39.85 | | | | 956,350 | | | $ | 38.73 | | | | 1,121,725 | | | $ | 32.76 | | | | | | | | 1,075,788 | | | $ | 45.65 | | | | 1,258,900 | | | $ | 41.89 | | | | 994,950 | | | $ | 39.85 | |
| | | | | | | | |
The aggregate intrinsic value of the option shares outstanding and exercisable at October 28, 2011,25, 2013, was $26.1$54.5 million and $17.1$37.8 million, respectively.
The number of option shares vested or that are expected to vest at October 28, 2011,25, 2013, was 1.7 million and the aggregate intrinsic value was $24.9$52.4 million. The weighted average exercise price and weighted average remaining contractual term of option shares vested or that are expected to vest at October 28, 2011,25, 2013, was $44.35$50.64 and 6.56.0 years, respectively. The weighted-average remaining contractual term of option shares currently exercisable is 5.34.6 years as of October 28, 2011.25, 2013.
The table below presents stock activity related to stock options exercised in fiscal 20112013 and 2010:2012:
| | | 000000000 | | | | 000000000 | | | | | |
| In Thousands | | 2011 | | | 2010 | | | 2013 | | | 2012 | |
| Proceeds from stock options exercised | | $ | 11,710 | | | $ | 11,399 | | | $ | 20,072 | | | $ | 5,240 | |
Tax benefits related to stock options exercised | | $ | 1,830 | | | $ | 3,488 | | | $ | 2,961 | | | $ | 366 | |
Intrinsic value of stock options exercised | | $ | 9,940 | | | $ | 12,376 | | | $ | 18,448 | | | $ | 1,751 | |
Total unrecognized compensation expense for stock options that have not vested as of October 28, 2011,25, 2013, is $7.8$6.0 million, which will be recognized over a weighted average period of 1.9 years. The total fair value of option shares vested during the year ended October 28, 2011,25, 2013, was $5.5$7.9 million.
The following table summarizes information for stock options outstanding at October 28, 2011:25, 2013:
| | | | | | | | | | | | | | |
| | | | | Options Outstanding | | Options Exercisable | | |
| | | Range of Exercise Prices | | Shares | | Weighted Average Remaining Life (years) | | Weighted Average Price | | Shares | | Weighted Average Price | | |
| | | | | | | |
| $ | | 15.82 – 38.00 | | 450,950 | | 6.24 | | $ 30.24 | | 261,050 | | $ 29.36 | | |
| | 38.01 – 40.00 | | 406,625 | | 4.56 | | 38.93 | | 402,625 | | 38.93 | | |
| | 40.01 – 42.40 | | 309,250 | | 8.00 | | 41.23 | | 76,825 | | 41.24 | | |
| | 42.41 – 55.00 | | 336,775 | | 5.79 | | 51.85 | | 254,450 | | 51.63 | | |
| | 55.01 – 79.90 | | 331,300 | | 9.28 | | 67.03 | | 0 | | 0.00 | | |
| | |
| | | | | | | | | | | | | | |
| | | Options Outstanding | | | | Options Exercisable |
Range of Exercise Prices | | Shares | | Weighted Average Remaining
Life (years) | | Weighted
Average Price | | | | Shares | | | Weighted
Average Price |
| | | | | | |
$ 19.65 – 38.00 | | 223,975 | | 4.1 | | $ 31.05 | | | | | 223,975 | | | $ 31.05 |
38.01 – 40.00 | | 193,413 | | 2.4 | | 38.92 | | | | | 193,413 | | | 38.92 |
40.01 – 50.00 | | 285,375 | | 5.5 | | 41.87 | | | | | 213,350 | | | 42.08 |
50.01 – 52.00 | | 278,850 | | 8.0 | | 51.06 | | | | | 70,525 | | | 51.03 |
52.01 – 65.00 | | 590,025 | | 6.2 | | 58.79 | | | | | 329,825 | | | 56.87 |
65.01 – 82.01 | | 262,100 | | 8.7 | | 69.94 | | | | | 44,700 | | | 73.57 |
|
69
The Company granted 55,280 restricted stock units (RSUs) during fiscal 2013. The fair value of each RSU granted by the Company is equal to the fair market value of the Company’s common stock on the date of grant. RSUs granted generally have a three-year cliff vesting schedule. There were no restricted stock units issued in fiscal 2012 or fiscal 2011.
The following table summarizes the changes in RSUs granted under the Company’s equity incentive plans:
| | | | | | | | | | | | |
| | | 2013 | |
| | | Shares | | | Weighted
Average
Grant Date
Fair Value | | | Weighted
Average
Remaining
Life (years) | |
| | | |
Non-vested, beginning of year | | | 0 | | | $ | .00 | | | | | |
Granted | | | 55,280 | | | | 70.23 | | | | | |
Forfeited/cancelled | | | (400 | ) | | | 66.55 | | | | | |
| |
Non-vested, end of year | | | 54,880 | | | $ | 70.26 | | | | 2.5 | |
| |
67Total unrecognized compensation expense for RSUs that have not vested as of October 25, 2013, is $2.6 million, which will be recognized over a weighted average period of 1.9 years.
NOTE 14: 13:Capital Stock
The authorized capital stock of the Company consists of 25,000 shares of preferred stock ($100 par value), 475,000 shares of serial preferred stock ($1.00 par value), each issuable in series, and 60,000,000 shares of common stock ($.20 par value). At the end of fiscal 2011,2013, there were no shares of preferred stock or serial preferred stock outstanding.
Effective December 5, 2002, the Board of Directors adopted a Shareholder Rights Plan, providing for the distribution of one Series B Serial Preferred Stock Purchase Right (Right) for each share of common stock held as of December 23, 2002. Each Right entitles the holder to purchase one one-hundredth of a share of Series B Serial Preferred Stock at an exercise price of $161.00, as may be adjusted from time to time.NOTE 14: Acquisitions
The Right to purchase shares of Series B Serial Preferred Stock is triggered once a person or entity (together with such person’s or entity’s affiliates) beneficially owns 15% or more of the outstanding shares of common stock ofOn February 4, 2013, the Company (such person or entity, an Acquiring Person). Whenacquired the RightGamesman Group (Gamesman) for $40.8 million. Gamesman is triggered,a global supplier of input devices principally serving the holder may purchase one one-hundredth of a share of Series B Serial Preferred Stock at an exercise price of $161.00 per share. If aftergaming industry. Gamesman is included in the Rights are triggered, (i) the Company is the surviving corporation in a merger or similar transaction with an Acquiring Person, (ii) the Acquiring Person beneficially owns more than 15% of the outstanding shares of common stock or (iii) the Acquiring Person engages in other “self-dealing” transactions, holders of the Rights can elect to purchase shares of common stock of the Company with a market value of twice the exercise price. Similarly, if after the Rights are triggered, the Company is not the surviving corporation of a merger or similar transaction or the Company sells 50% or more of its assets to another person or entity, holders of the Rights may elect to purchase shares of common stock of the surviving corporation or that person or entity who purchased the Company’s assets with a market value of twice the exercise price.
NOTE 15: AcquisitionsAvionics & Controls segment.
On July 26, 2011, the Company acquired the Souriau Group (Souriau) for approximately $726.7 million, including cash on hand of $17.8 million. Souriau is a leading global supplier of highly engineered connectors for harsh environments serving aerospace, defense & space, power generation, rail, and industrial equipment markets. Souriau is included in the Sensors & Systems segment.
The following summarizes the allocation of the estimated fair value of the assets acquired and liabilities assumed at the date of acquisition. The allocation of the purchase price is preliminary. Differences between the preliminary and final purchase price allocation could be material. We have not completed our analysis estimating the fair value of property, plant and equipment, intangible assets, income tax liabilities and certain contingent liabilities. The estimated fair value adjustment for inventory iswas $41.7 million, which will behas been recognized as cost of goods sold over 4.5 months, which is the estimated inventory turnover. Acquisition-related costs of $9.2 million have been recognized as selling, general and administrative expense in fiscal 2011. The purchase price includes the value of future development of existing technologies, the introduction of new technologies, and the addition of new customers. These factors resulted in recording goodwill of $355.7$380.5 million. The amount allocated to goodwill is not deductible for income tax purposes. The Company incurred transaction expenses of $9.2 million, which were recorded in selling, general and administrative expense. The Company also benefited from $6.3 million in gains related to foreign currency fluctuation associated with acquiring Souriau. In the period from July 26, 2011, through October 28, 2011, Souriau recognized a net loss of $19.2 million on sales of $77.9 million.
In Thousands
As of July 26, 2011
| | | | |
Current assets
| | | $ 228,694 | |
Property, plant and equipment
| | | 91,843 | |
Intangible assets subject to amortization
| | | | |
Programs (15 year weighted average useful life)
| | | 233,903 | |
Trade name (10 year weighted average useful life)
| | | 46,075 | |
Goodwill
| | | 355,735 | |
Other assets
| | | 553 | |
| |
Total assets acquired
| | | 956,803 | |
| |
Current liabilities assumed
| | | 111,932 | |
Long-term liabilities assumed
| | | 109,797 | |
Noncontrolling interest
| | | 8,369 | |
| |
Net assets acquired
| | | $ 726,705 | |
| |
6870
| | | | |
| In Thousands | | | |
| As of July 26, 2011 | | | |
| |
Current assets | | $ | 228,199 | |
Property, plant and equipment | | | 91,843 | |
Intangible assets subject to amortization | | | | |
Programs (15 year weighted average useful life) | | | 224,296 | |
Trade name (10 year weighted average useful life) | | | 45,709 | |
Goodwill | | | 380,458 | |
Other assets | | | 6,900 | |
| | | | |
Total assets acquired | | | 977,405 | |
| |
Current liabilities assumed | | | 110,596 | |
Long-term liabilities assumed | | | 131,735 | |
Noncontrolling interest | | | 8,369 | |
| | | | |
Net assets acquired | | $ | 726,705 | |
| | | | |
Pro Forma Financial Information
The following pro forma financial information shows the results of continuing operations for the yearsyear ended October 28, 2011, and October 29, 2010, respectively, as though the acquisition of Souriau had occurred at the beginning of each respectivethe fiscal year. The pro forma financial information includes, where applicable, adjustments for: (i) the amortization of acquired intangible assets, (ii) additional interest expense on acquisition relatedacquisition-related borrowings and (iii) the income tax effect on the pro forma adjustments. The pro forma adjustments related to the acquisition of Souriau are based on a preliminary purchase price allocation. Differences between the preliminary and final purchase price allocation could have an impact on the pro forma financial information presented and such impact could be material. The pro forma financial information below is presented for illustrative purposes only and is not necessarily indicative of the operating results that would have been achieved had the acquisition been completed as of the date indicated above or the results that may be obtained in the future.
| | | 00000000000 | | | | 00000000000 | | | |
| In Thousands | | 2011 | | | 2010 | | |
| In Thousands, Except Per Share Amounts | | | 2011 | |
| Pro forma net sales | | $ | 1,972,079 | | | $ | 1,813,975 | | | $ | 1,972,079 | |
Pro forma net income | | $ | 159,353 | | | $ | 147,599 | | | $ | 159,353 | |
| Basic earnings per share as reported | | $ | 4.36 | | | $ | 4.73 | | | $ | 4.36 | |
Pro forma basic earnings per share | | $ | 5.22 | | | $ | 4.92 | | | $ | 5.22 | |
| Diluted earnings per share as reported | | $ | 4.27 | | | $ | 4.66 | | | $ | 4.27 | |
Pro forma diluted earnings per share | | $ | 5.12 | | | $ | 4.84 | | | $ | 5.12 | |
On December 30, 2010, the Company acquired Eclipse Electronic Systems, Inc. (Eclipse) for $123.8 million. The purchase price includesincluded cash of $14.0 million in contingent consideration, which was deposited in an escrow account, and will be paidpayable to the seller if certain performance objectives arewere met over the three-year period. The estimated fair value of the contingent consideration isat acquisition was $13.4 million. At October 25, 2013, the liability is $4.0 million and $10.0 million has been paid to the seller. Eclipse is a designer and manufacturer of embedded communication intercept receivers for signal intelligence applications andapplications. Eclipse is included in the Avionics & Controls segment.
The following summarizes the allocation of the estimated fair value of the assets acquired and liabilities assumed at the date of acquisition. The purchase price includes the value of future development of existing technologies, the introduction of new technologies, and the addition of new customers. These factors resulted in recording goodwill of $67.6$67.4 million. The amount allocated to goodwill is not deductible for income tax purposes.
In Thousands
As of December 30, 201071
| | | | |
Current assets
| | | $ 31,826 | |
Property, plant and equipment
| | | 2,154 | |
Intangible assets subject to amortization
| | | | |
Technology (10 year weighted average useful life)
| | | 53,200 | |
Goodwill
| | | 67,613 | |
| |
Total assets acquired
| | | 154,793 | |
| |
Current liabilities assumed
| | | 35,974 | |
Long-term liabilities assumed
| | | 8,350 | |
| |
Net assets acquired
| | | $ 110,469 | |
| |
| | | | |
| In Thousands | | | |
| As of December 30, 2010 | | | |
| |
Current assets | | $ | 31,827 | |
Property, plant and equipment | | | 2,154 | |
Intangible assets subject to amortization | | | | |
Technology (9 year weighted average useful life) | | | 53,200 | |
Goodwill | | | 67,378 | |
| | | | |
Total assets acquired | | | 154,559 | |
| |
Current liabilities assumed | | | 35,740 | |
Long-term liabilities assumed | | | 8,350 | |
| | | | |
Net assets acquired | | $ | 110,469 | |
| | | | |
The above acquisitions were accounted for under the purchase method of accounting and the results of operations were included from the effective date of each acquisition.
69
NOTE 16: 15:Accumulated Other Comprehensive Income (Loss)Loss
The components of Accumulated Other Comprehensive Income (Loss):Loss:
| | 000000000000 | | | 000000000000 | | | | 000000000000 | | | | | |
| In Thousands | | | | 2011 | | | 2010 | | | 2013 | | 2012 | |
| Unrealized gain on derivative contracts | | | | $ | 5,738 | | | $ | 13,954 | | |
Unrealized gain (loss) on derivative contracts | | | $ | (1,851 | ) | | $ | 2,181 | |
Tax effect | | | | | (1,716 | ) | | | (3,998 | ) | | | 355 | | | (558 | ) |
| | | | |
| | | | | 4,022 | | | | 9,956 | | | | (1,496 | ) | | | 1,623 | |
| Pension and post-retirement obligations | | | | | (114,773 | ) | | | (99,727 | ) | | | (84,215 | ) | | | (150,106 | ) |
Tax effect | | | | | 39,302 | | | | 34,242 | | | | 28,030 | | | | 50,927 | |
| | | | |
| | | | | (75,471 | ) | | | (65,485 | ) | | | (56,185 | ) | | | (99,179 | ) |
| Currency translation adjustment | | | | | 68,637 | | | | 58,764 | | | | 35,397 | | | | 12,272 | |
| | | | |
Accumulated other comprehensive loss | | | $ | (22,284 | ) | | $ | (85,284 | ) |
| | | | |
Accumulated other comprehensive income (loss) | | | | $ | (2,812 | ) | | $ | 3,235 | | |
| | |
NOTE 17:16: Business Segment Information
The Company’s businesses are organized and managed in three reporting segments: Avionics & Controls, Sensors & Systems and Advanced Materials. Operating segments within each reporting segment are aggregated. Operations within the Avionics & Controls segment focus on integrated cockpit systems, technology interface systems for commercial and military aircraft, and similar devices for land- and sea-based military vehicles, secure communication systems, military audio and data products, embedded communication intercept receivers, specialized medical equipment and other industrial applications. Sensors & Systems includes operations that produce high-precision temperature and pressure sensors, electrical power switching, electrical interconnection systems, and other related systems principally for aerospace and defense customers. The Advanced Materials segment focuses on thermally engineered components for critical aerospace applications, high-performance elastomer products used in a wide range of commercial aerospace and military applications, and combustible ordnance and warfare countermeasure devices. All segments include sales to domestic, international, defense and commercial customers.
Geographic sales information is based on product origin. The Company evaluates these segments based on segment profits prior to net interest, other income/expense, corporate expenses and federal/foreign income taxes.
72
Details of the Company’s operations by business segment for the last three fiscal years were as follows:
| | | 000000000000 | | | | 000000000000 | | | | 000000000000 | |
| In Thousands | | 2011 | | | 2010 | | | 2009 | |
| | | |
Sales | | | | | | | | | | | | |
Avionics & Controls | | $ | 841,939 | | | $ | 790,016 | | | $ | 672,828 | |
Sensors & Systems | | | 414,609 | | | | 298,559 | | | | 321,753 | |
Advanced Materials | | | 461,437 | | | | 438,026 | | | | 412,878 | |
| |
| | $ | 1,717,985 | | | $ | 1,526,601 | | | $ | 1,407,459 | |
| |
| | | |
Income From Continuing Operations | | | | | | | | | | | | |
Avionics & Controls | | $ | 135,187 | | | $ | 125,888 | | | $ | 99,313 | |
Sensors & Systems | | | 22,536 | | | | 33,894 | | | | 31,739 | |
Advanced Materials | | | 82,307 | | | | 68,785 | | | | 53,602 | |
| |
Segment Earnings | | | 240,030 | | | | 228,567 | | | | 184,654 | |
| | | |
Corporate expense | | | (48,969 | ) | | | (40,399 | ) | | | (31,295 | ) |
Other income (expense) | | | 6,853 | | | | 8 | | | | (7,970 | ) |
Loss on extinguishment of debt | | | (831 | ) | | | (1,206 | ) | | | 0 | |
Interest income | | | 1,615 | | | | 960 | | | | 1,634 | |
Interest expense | | | (40,216 | ) | | | (33,181 | ) | | | (28,689 | ) |
| |
| | $ | 158,482 | | | $ | 154,749 | | | $ | 118,334 | |
| |
70
| | In Thousands | | | 2013 | | 2012 | | 2011 | |
| Sales | | | | | | | |
Avionics & Controls | | | $ | 771,657 | | | $ | 790,015 | | | $ | 841,939 | |
Sensors & Systems | | | | 701,930 | | | 702,394 | | | 414,609 | |
Advanced Materials | | | | 496,167 | | | 499,909 | | | 461,437 | |
| | | |
| | | $ | 1,969,754 | | | $ | 1,992,318 | | | $ | 1,717,985 | |
| | | |
| Earnings From Continuing Operations | | | | | | | |
Avionics & Controls | | | $ | 103,232 | 1 | | $ | 54,917 | 1 | | $ | 135,187 | |
Sensors & Systems | | | | 89,696 | | | | 70,890 | | | | 22,536 | |
Advanced Materials | | | | 107,161 | | | | 93,546 | | | | 82,307 | |
| | | |
Segment Earnings | | | | 300,089 | | | | 219,353 | | | | 240,030 | |
| Corporate expense | | | | (62,166 | ) | | | (43,201 | ) | | | (48,969 | ) |
Gain on settlement of contingency | | | | 0 | | | | 11,891 | | | | 0 | |
Other income (expense) | | | | 0 | | | | 1,263 | | | | 6,853 | |
Loss on extinguishment of debt | | | | (946 | ) | | | 0 | | | | (831 | ) |
Interest income | | | | 539 | | | | 465 | | | | 1,615 | |
Interest expense | | | | (39,667 | ) | | | (46,238 | ) | | | (40,216 | ) |
| | | |
| | | $ | 197,849 | | | $ | 143,533 | | | $ | 158,482 | |
| | | |
| | | 000000000000 | | | | 000000000000 | | | | 000000000000 | | |
| In Thousands | | 2011 | | | 2010 | | | 2009 | | | | 2013 | | | | 2012 | | | | 2011 | |
| Identifiable Assets | | | | | | | | | | | | |
Avionics & Controls | | | $ 1,333,735 | | | | $ 1,253,605 | | | | $ 1,168,102 | | | $ | 1,275,514 | | | $ | 1,261,300 | | | $ | 1,333,735 | |
Sensors & Systems | | | 1,349,776 | | | | 432,099 | | | | 447,325 | | | | 1,282,219 | | | | 1,204,073 | | | | 1,349,776 | |
Advanced Materials | | | 563,662 | | | | 607,040 | | | | 573,284 | | | | 560,681 | | | | 558,058 | | | | 563,662 | |
Corporate1 | | | 131,413 | | | | 294,994 | | | | 125,536 | | |
Corporate2 | | | | 143,698 | | | | 203,686 | | | | 131,413 | |
| | | | |
| | | $ 3,378,586 | | | | $ 2,587,738 | | | | $ 2,314,247 | | | $ | 3,262,112 | | | $ | 3,227,117 | | | $ | 3,378,586 | |
| | | | |
| Capital Expenditures2 | | | | | | | |
Avionics & Controls2 | | | $ 22,369 | | | | $ 11,892 | | | | $ 30,698 | | |
Capital Expenditures | | | | | | | |
Avionics & Controls | | | $ | 14,381 | 3 | | $ | 14,356 | | | $ | 22,369 | |
Sensors & Systems | | | 10,469 | | | | 8,021 | | | | 8,207 | | | | 21,856 | | | | 18,788 | | | | 10,469 | |
Advanced Materials | | | 16,341 | | | | 25,309 | | | | 19,512 | | | | 18,917 | | | | 14,783 | | | | 16,341 | |
Discontinued Operations | | | 0 | | | | 123 | | | | 490 | | |
Corporate | | | 328 | | | | 195 | | | | 277 | | | | 181 | | | | 1,519 | | | | 328 | |
| | | | |
| | | $ 49,507 | | | | $ 45,540 | | | | $ 59,184 | | | $ | 55,335 | | | $ | 49,446 | | | $ | 49,507 | |
| | | | |
| Depreciation and Amortization | | | | | | | | | | | | |
Avionics & Controls | | | $ 38,391 | | | | $ 32,841 | | | | $ 28,521 | | | $ | 43,124 | | | $ | 40,096 | | | $ | 38,391 | |
Sensors & Systems | | | 20,523 | | | | 13,264 | | | | 15,154 | | | | 41,845 | | | | 40,333 | | | | 20,523 | |
Advanced Materials | | | 23,439 | | | | 22,914 | | | | 24,830 | | | | 24,313 | | | | 24,666 | | | | 23,439 | |
Discontinued Operations | | | 0 | | | | 583 | | | | 638 | | |
Corporate | | | 2,305 | | | | 2,515 | | | | 2,368 | | | | 2,850 | | | | 2,697 | | | | 2,305 | |
| | | | |
| | | $ 84,658 | | | | $ 72,117 | | | | $ 71,511 | | | $ | 112,132 | | | $ | 107,792 | | | $ | 84,658 | |
| | | | |
| 1 | Fiscal 2013 includes a $3.5 million impairment charge against Racal Acoustics’ goodwill and fiscal 2012 includes a $52.2 million impairment charge against Racal Acoustics’ goodwill. |
| 2 | Primarily cash and deferred tax assets (see Note 10)9). |
23 | Excludes capital expenditures accounted for as a capitalized lease obligation of $8,139 and $28,202$11,691 in fiscal 2010 and 2009, respectively. 2013. |
73
The Company’s operations by geographic area for the last three fiscal years were as follows:
| | | 000000000000 | | | | 000000000000 | | | | 000000000000 | |
| In Thousands | | 2011 | | | 2010 | | | 2009 | |
| | | |
Sales | | | | | | | | | | | | |
Domestic | | | | | | | | | | | | |
Unaffiliated customers – U.S. | | | $ 747,021 | | | | $ 666,645 | | | | $ 618,614 | |
Unaffiliated customers – export | | | 171,416 | | | | 147,008 | | | | 155,617 | |
Intercompany | | | 32,197 | | | | 25,491 | | | | 17,185 | |
| |
| | | 950,634 | | | | 839,144 | | | | 791,416 | |
Canada | | | | | | | | | | | | |
Unaffiliated customers | | | 317,924 | | | | 287,365 | | | | 218,177 | |
Intercompany | | | 5,318 | | | | 4,490 | | | | 4,089 | |
| |
| | | 323,242 | | | | 291,855 | | | | 222,266 | |
France | | | | | | | | | | | | |
Unaffiliated customers | | | 160,993 | | | | 98,641 | | | | 155,494 | |
Intercompany | | | 17,724 | | | | 12,104 | | | | 20,098 | |
| |
| | | 178,717 | | | | 110,745 | | | | 175,592 | |
United Kingdom | | | | | | | | | | | | |
Unaffiliated customers | | | 228,383 | | | | 255,313 | | | | 230,164 | |
Intercompany | | | 23,563 | | | | 12,232 | | | | 12,648 | |
| |
| | | 251,946 | | | | 267,545 | | | | 242,812 | |
All Other Foreign | | | | | | | | | | | | |
Unaffiliated customers | | | 92,248 | | | | 71,629 | | | | 29,393 | |
Intercompany | | | 29,640 | | | | 14,533 | | | | 2,626 | |
| |
| | | 121,888 | | | | 86,162 | | | | 32,019 | |
| | | |
Eliminations | | | (108,442 | ) | | | (68,850 | ) | | | (56,646 | ) |
| |
| | | $ 1,717,985 | | | | $ 1,526,601 | | | | $ 1,407,459 | |
| |
71
| | | 000000000000 | | | | 000000000000 | | | | 000000000000 | | | | | | | |
| In Thousands | | 2011 | | 2010 | | | 2009 | | | 2013 | | | 2012 | | | 2011 | |
| Segment Earnings1 | | | | | | | |
Sales1 | | | | | | | |
Domestic | | | | | | | |
Unaffiliated customers – U.S. | | | $ | 797,780 | | | $ | 813,375 | | | $ | 747,021 | |
Unaffiliated customers – export | | | | 182,267 | | | | 197,142 | | | | 171,416 | |
Intercompany | | | | 31,202 | | | | 35,779 | | | | 32,197 | |
| | | |
| | | | 1,011,249 | | | | 1,046,296 | | | | 950,634 | |
Canada | | | | | | | |
Unaffiliated customers | | | | 247,542 | | | | 267,304 | | | | 317,924 | |
Intercompany | | | | 6,554 | | | | 2,844 | | | | 5,318 | |
| | | |
| | | | 254,096 | | | | 270,148 | | | | 323,242 | |
France | | | | | | | |
Unaffiliated customers | | | | 423,774 | | | | 410,766 | | | | 160,993 | |
Intercompany | | | | 39,745 | | | | 41,454 | | | | 17,724 | |
| | | |
| | | | 463,519 | | | | 452,220 | | | | 178,717 | |
United Kingdom | | | | | | | |
Unaffiliated customers | | | | 247,229 | | | | 235,699 | | | | 228,383 | |
Intercompany | | | | 26,402 | | | | 19,305 | | | | 23,563 | |
| | | |
| | | | 273,631 | | | | 255,004 | | | | 251,946 | |
All Other Foreign | | | | | | | |
Unaffiliated customers | | | | 71,162 | | | | 68,032 | | | | 92,248 | |
Intercompany | | | | 44,829 | | | | 37,683 | | | | 29,640 | |
| | | |
| | | | 115,991 | | | | 105,715 | | | | 121,888 | |
| Eliminations | | | | (148,732 | ) | | | (137,065 | ) | | | (108,442 | ) |
| | | |
| | | $ | 1,969,754 | | | $ | 1,992,318 | | | $ | 1,717,985 | |
| | | |
| In Thousands | | | | 2013 | | | | 2012 | | | | 2011 | |
| Segment Earnings2 | | | | | | | |
Domestic | | $ | 178,145 | | | $ | 132,966 | | | $ | 118,349 | | | $ | 170,575 | | | $ | 172,046 | | | $ | 178,145 | |
Canada | | | 38,027 | | | | 35,583 | | | | 18,279 | | | | 41,374 | | | | 33,777 | | | | 38,027 | |
France | | | (7,615 | ) | | | 16,096 | | | | 15,268 | | | | 49,042 | | | | 33,152 | | | | (7,615 | ) |
United Kingdom | | | 24,305 | | | | 39,250 | | | | 28,435 | | | | 28,985 | | | | (29,237 | ) | | | 24,305 | |
All other foreign | | | 7,168 | | | | 4,672 | | | | 4,323 | | | | 10,113 | | | | 9,615 | | | | 7,168 | |
| | | | |
| | $ | 240,030 | | | $ | 228,567 | | | $ | 184,654 | | | $ | 300,089 | | | $ | 219,353 | | | $ | 240,030 | |
| | | | |
| Identifiable Assets2 | | | | | | | |
Identifiable Assets3 | | | | | | | |
Domestic | | $ | 947,896 | | | $ | 756,043 | | | $ | 760,480 | | | $ | 1,020,952 | | | $ | 1,015,994 | | | $ | 947,896 | |
Canada | | | 583,042 | | | | 638,199 | | | | 565,434 | | | | 533,559 | | | | 576,053 | | | | 583,042 | |
France | | | 1,050,999 | | | | 214,669 | | | | 211,152 | | | | 918,592 | | | | 836,578 | | | | 1,050,999 | |
United Kingdom | | | 582,436 | | | | 614,523 | | | | 586,795 | | | | 515,090 | | | | 477,214 | | | | 582,436 | |
All other foreign | | | 82,800 | | | | 69,310 | | | | 64,850 | | | | 130,221 | | | | 117,592 | | | | 82,800 | |
| | | | |
| | $ | 3,247,173 | | | $ | 2,292,744 | | | $ | 2,188,711 | | | $ | 3,118,414 | | | $ | 3,023,431 | | | $ | 3,247,173 | |
| | | | |
| 1 | Based on country from which the sale originated and the sale was recorded. |
| 2 | Before corporate expense, shown on page 70.73. |
23 | Excludes corporate, shown on page 71. 73. |
The Company’s principal foreign operations consist of manufacturing facilities located in Canada, China, the Dominican Republic, France, Germany, India, Mexico, Morocco, and the United Kingdom, India, Morocco, the Dominican Republic, Mexico, and China and include sales and service operations located in SingaporeBrazil, China, Japan, and China.Singapore. Intercompany sales are at prices comparable with sales to unaffiliated customers. U.S. government sales as a percent of Advanced Materials and Avionics & Controls sales were 19.9%19.6% and 3.8%3.1%, respectively, in fiscal 20112013 and 7.0%6.0% of consolidated sales. In fiscal 2010,2012, the U.S. government sales as a percent of Advanced Materials and Avionics & Controls sales were 25.2%19.4% and 5.9%5.4%, respectively, and 10.0%7.0% of consolidated sales. In fiscal 2009,2011, the U.S. government sales as a percent of Advanced Materials and Avionics & Controls sales were 23.3%19.9% and 5.5%3.8%, respectively, and 10.0%7.0% of consolidated sales.
74
Product lines contributing sales of 10% or more of total sales in any of the last three fiscal years were as follows:
| | | 00000000 | | | | 00000000 | | | | 00000000 | |
| | | 2011 | | | 2010 | | | 2009 | |
| | | |
Sensors | | | 8 | % | | | 8 | % | | | 10% | |
Avionics | | | 16 | % | | | 17 | % | | | 14% | |
| |
| | | | | | | | | | | | |
| | | 2013 | | | 2012 | | | 2011 | |
| | | |
Connectors | | | 17 | % | | | 17 | % | | | 5% | |
Avionics | | | 11 | % | | | 11 | % | | | 16% | |
| |
72
NOTE 18:17: Quarterly Financial Data (Unaudited)
The following is a summary of unaudited quarterly financial information:
In Thousands, Except Per Share Amounts
| | | 0000000000 | | | | 0000000000 | | | | 0000000000 | | | | 0000000000 | |
| Fiscal Year 2011 | | Fourth | | | Third | | | Second | | | First | |
| | | | |
Net sales | | $ | 502,397 | | | $ | 409,512 | | | $ | 435,277 | | | $ | 370,799 | |
Gross margin | | | 153,112 | | | | 143,539 | | | | 160,947 | | | | 132,122 | |
| | | | |
Income from
continuing operations | | $ | 19,412 | 1,2,3,4 | | $ | 37,741 | 5 | | $ | 45,951 | 6 | | $ | 29,983 | |
Income from
discontinued operations | | $ | 28 | | | $ | (46 | ) | | $ | (37 | ) | | $ | 8 | |
| |
Net earnings | | $ | 19,440 | | | $ | 37,695 | | | $ | 45,914 | | | $ | 29,991 | |
| |
| | | | |
Earnings per share – basic | | | | | | | | | | | | | | | | |
Continuing operations | | $ | .64 | | | $ | 1.23 | | | $ | 1.51 | | | $ | .99 | |
Discontinued operations | | $ | .00 | | | $ | .00 | | | $ | .00 | | | $ | .00 | |
| |
Earnings per share – basic | | $ | .64 | | | $ | 1.23 | | | $ | 1.51 | | | $ | .99 | |
| |
| | | | |
Earnings per share – diluted | | | | | | | | | | | | | | | | |
Continuing operations | | $ | .62 | | | $ | 1.21 | | | $ | 1.47 | | | $ | .97 | |
Discontinued operations | | $ | .00 | | | $ | .00 | | | $ | .00 | | | $ | .00 | |
| |
Earnings per share – diluted9 | | $ | .62 | | | $ | 1.21 | | | $ | 1.47 | | | $ | .97 | |
| |
| | | | |
| Fiscal Year 2010 | | Fourth | | | Third | | | Second | | | First | |
| | | | |
Net sales | | $ | 430,450 | | | $ | 378,349 | | | $ | 382,492 | | | $ | 335,310 | |
Gross margin | | | 157,949 | | | | 128,955 | | | | 126,636 | | | | 102,671 | |
| | | | |
Income from
continuing operations | | $ | 49,291 | 7,8 | | $ | 39,253 | 8 | | $ | 29,110 | | | $ | 12,385 | |
Income from
discontinued operations | | $ | 10,398 | | | $ | 605 | | | $ | 538 | | | $ | 340 | |
| |
Net earnings | | $ | 59,689 | | | $ | 39,858 | | | $ | 29,648 | | | $ | 12,725 | |
| |
| | | | |
Earnings per share – basic | | | | | | | | | | | | | | | | |
Continuing operations | | $ | 1.63 | | | $ | 1.31 | | | $ | .97 | | | $ | .42 | |
Discontinued operations | | $ | .35 | | | $ | .02 | | | $ | .02 | | | $ | .01 | |
| |
Earnings per share – basic | | $ | 1.98 | | | $ | 1.33 | | | $ | .99 | | | $ | .43 | |
| |
| | | | |
Earnings per share – diluted | | | | | | | | | | | | | | | | |
Continuing operations | | $ | 1.60 | | | $ | 1.28 | | | $ | .96 | | | $ | .41 | |
Discontinued operations | | $ | .34 | | | $ | .02 | | | $ | .02 | | | $ | .01 | |
| |
Earnings per share – diluted9 | | $ | 1.94 | | | $ | 1.30 | | | $ | .98 | | | $ | .42 | |
| |
| | | | | | | | | | | | | | | | |
| Fiscal Year 2013 | | Fourth | | | Third | | | Second | | | First | |
| | | | |
Net sales | | $ | 534,162 | | | $ | 478,068 | | | $ | 499,562 | | | $ | 457,962 | |
Gross profit | | | 205,373 | | | | 178,902 | | | | 181,376 | | | | 160,345 | |
| | | | |
Earnings from continuing operations | | | 66,188 | | | | 39,213 | 1,2,3 | | | 35,522 | | | | 25,111 | 4 |
Loss from discontinued operations | | | (325 | ) | | | (975 | ) | | | 0 | | | | 0 | |
| |
Net earnings | | $ | 65,863 | | | $ | 38,238 | | | $ | 35,522 | | | $ | 25,111 | |
| |
| | | | |
Earnings (loss) per share – basic | | | | | | | | | | | | | | | | |
Continuing operations | | $ | 2.11 | | | $ | 1.25 | | | $ | 1.14 | | | $ | .81 | |
Discontinued operations | | | (.01 | ) | | | (.03 | ) | | | .00 | | | | .00 | |
| |
Earnings (loss) per share – basic | | $ | 2.10 | | | $ | 1.22 | | | $ | 1.14 | | | $ | .81 | |
| |
| | | | |
Earnings (loss) per share – diluted | | | | | | | | | | | | | | | | |
Continuing operations | | $ | 2.07 | | | $ | 1.23 | | | $ | 1.12 | | | $ | .80 | |
Discontinued operations | | | (.01 | ) | | | (.03 | ) | | | .00 | | | | .00 | |
| |
Earnings (loss) per share – diluted8 | | $ | 2.06 | | | $ | 1.20 | | | $ | 1.12 | | | $ | .80 | |
| |
| | | | |
Fiscal Year 2012 | | | Fourth | | | | Third | | | | Second | | | | First | |
| | | | |
Net sales | | $ | 530,656 | | | $ | 485,949 | | | $ | 504,831 | | | $ | 470,882 | |
Gross profit | | | 204,253 | | | | 172,096 | | | | 184,523 | | | | 158,081 | |
| | | | |
Earnings (loss) from
continuing operations | | | 61,660 | | | | (17,104 | )5,6 | | | 45,191 | 7 | | | 22,788 | |
Earnings from discontinued operations | | | 0 | | | | 0 | | | | 0 | | | | 0 | |
| |
Net earnings | | $ | 61,660 | | | $ | (17,104 | ) | | $ | 45,191 | | | $ | 22,788 | |
| |
| | | | |
Earnings (loss) per share – basic | | | | | | | | | | | | | | | | |
Continuing operations | | $ | 2.00 | | | $ | (.55 | ) | | $ | 1.47 | | | $ | .74 | |
Discontinued operations | | | .00 | | | | .00 | | | | .00 | | | | .00 | |
| |
Earnings (loss) per share – basic | | $ | 2.00 | | | $ | (.55 | ) | | $ | 1.47 | | | $ | .74 | |
| |
| | | | |
Earnings (loss) per share – diluted | | | | | | | | | | | | | | | | |
Continuing operations | | $ | 1.97 | | | $ | (.55 | ) | | $ | 1.44 | | | $ | .73 | |
Discontinued operations | | | .00 | | | | .00 | | | | .00 | | | | .00 | |
| |
Earnings (loss) per share – diluted8 | | $ | 1.97 | | | $ | (.55 | ) | | $ | 1.44 | | | $ | .73 | |
| |
7375
| 1 | Included a $2.0$8.2 million gain on sale of an engineered materials facility, netincome tax benefits related to the favorable resolution of tax. certain tax matters. |
| 2 | Included $16.4a $3.5 million in acquisition-related accounting charges, net of tax. The operating loss at Souriau accounted for $14.3 million, net of tax, and was principally duegoodwill impairment charge related to the adjustment of inventory to fair value. Approximately $1.3 million, net of tax, was due to the adjustment of Eclipse inventory to fair value. Approximately $0.9 million, net of tax, was due to Souriau acquisition-related expenses. Racal Acoustics. |
| 3 | Included a $2.6$10.0 million charge for contract assertions, net of tax. Approximately $1.3 million, net of tax, was due to a charge at control systems for engineering costs not probable of recovery from the customer. Approximately $1.0 million, net of tax, was principally due to the write off of accounts receivable related to a manufacturing license at defense technologies. Approximately $0.4 million, net of tax, was due to a late delivery penalty at engineered materials. our pending matter with the DDTC. |
| 4 | Included $1.2$3.7 million in working capital charges, net of tax. Approximately $0.7 million, netincome tax benefits related to the favorable resolution of certain tax was due to an inventory and trade accounts receivable write off at advanced sensors. Approximately $0.5 million, net of tax, was due to an inventory write off at defense technologies. matters. |
| 5 | Included $5.2a $52.2 million benefit as a result of the release of tax reserves for uncertain tax positions associated with losses on the disposition of assets. This release resulted from the expiration of a statute of limitations. goodwill impairment charge related to Racal Acoustics. |
| 6 | Included $3.1$4.6 million reduction of valuation allowancesincome tax benefits related to net operating losses and foreignthe favorable resolution of certain tax credits that were generated in prior years. matters. |
| 7 | Included $2.5a $9.5 million reductiongain on settlement of valuation allowances related toa contingency, net operating losses and foreign tax credits that were generated in prior years. of tax. |
| 8 | Included $7.6 million benefit as a result of the release of tax reserves for uncertain tax positions associated with losses on the disposition of assets. Of the $7.6 million, $6.4 million was included in third quarter 2010 and $1.2 million was included in fourth quarter 2010, respectively. This release resulted from the expiration of a statute of limitations.
|
9 | The sum of the quarterly per share amounts may not equal per shareshares amounts reported for year-to-date periods. This is due to changes in the number of weighted average shares outstanding and the effects of rounding for each period. |
NOTE 19:18: Guarantors
The following schedules set forth condensed consolidating financial information as required by Rule 3-10 of Securities and Exchange Commission Regulation S-X for fiscal 2011, 2010,2013, 2012, and 20092011 for (a) Esterline Technologies Corporation (the Parent); (b) on a combined basis, the current subsidiary guarantors (Guarantor Subsidiaries) of the secured credit facility, Senior2017 Notes due 2017,(for periods prior to the ending of the fiscal quarter ended April 26, 2013), and Senior Notes due 2020;2020 Notes; and (c) on a combined basis, the subsidiaries that are not guarantors of the secured credit facility, Senior2017 Notes due 2017,(for periods prior to the ending of the fiscal quarter ended April 26, 2013), and Senior2020 Notes due 2020 (Non-Guarantor Subsidiaries). The Guarantor Subsidiaries previously guaranteed the Senior Subordinated Notes due 2013 that were repurchased or otherwise redeemed in August 2010. The Guarantor Subsidiaries are direct and indirect wholly-owned subsidiaries of Esterline Technologies Corporation and have fully and unconditionally, jointly and severally, guaranteed the secured credit facility, 2017 Notes (for periods prior to the Senior Notes due 2017,ending of the Senior Notes due 2020,fiscal quarter ended April 26, 2013), and the Senior Subordinated Notes (until such Senior Subordinated Notes were repurchased or otherwise redeemed in August 2010).
2020 Notes.
7476
Condensed Consolidating Balance Sheet as of October 28, 201125, 2013
| | | 0000000000 | | | | 0000000000 | | | | 0000000000 | | | | 0000000000 | | | | 0000000000 | |
| In Thousands | | Parent | | | Guarantor
Subsidiaries | | | Non-
Guarantor
Subsidiaries | | | Eliminations | | | Total | |
| | | | | |
Assets | | | | | | | | | | | | | | | | | | | | |
| | | | | |
Current Assets | | | | | | | | | | | | | | | | | | | | |
Cash and cash equivalents | | $ | 49,837 | | | $ | 13,450 | | | $ | 121,748 | | | $ | 0 | | | $ | 185,035 | |
Escrow deposit | | | 5,011 | | | | 0 | | | | 0 | | | | 0 | | | | 5,011 | |
Accounts receivable, net | | | 158 | | | | 137,927 | | | | 231,741 | | | | 0 | | | | 369,826 | |
Inventories | | | 0 | | | | 143,866 | | | | 258,682 | | | | 0 | | | | 402,548 | |
Income tax refundable | | | 0 | | | | 0 | | | | 2,857 | | | | 0 | | | | 2,857 | |
Deferred income tax benefits | | | 25,585 | | | | 1,574 | | | | 21,092 | | | | 0 | | | | 48,251 | |
Prepaid expenses | | | 59 | | | | 5,006 | | | | 14,180 | | | | 0 | | | | 19,245 | |
Other current assets | | | 140 | | | | 344 | | | | 6,056 | | | | 0 | | | | 6,540 | |
| |
Total Current Assets | | | 80,790 | | | | 302,167 | | | | 656,356 | | | | 0 | | | | 1,039,313 | |
| | | | | |
Property, Plant &
Equipment, Net | | | 1,109 | | | | 161,297 | | | | 206,010 | | | | 0 | | | | 368,416 | |
Goodwill | | | 0 | | | | 313,788 | | | | 849,937 | | | | 0 | | | | 1,163,725 | |
Intangibles, Net | | | 0 | | | | 140,590 | | | | 553,325 | | | | 0 | | | | 693,915 | |
Debt Issuance Costs, Net | | | 9,033 | | | | 0 | | | | 1,662 | | | | 0 | | | | 10,695 | |
Deferred Income Tax
Benefits | | | 27,925 | | | | 125 | | | | 51,555 | | | | 0 | | | | 79,605 | |
Other Assets | | | 10,307 | | | | 2,321 | | | | 10,289 | | | | 0 | | | | 22,917 | |
Amounts Due From (To)
Subsidiaries | | | 350,407 | | | | 482,330 | | | | 0 | | | | (832,737 | ) | | | 0 | |
Investment in Subsidiaries | | | 1,953,823 | | | | 624,856 | | | | 321,170 | | | | (2,899,849 | ) | | | 0 | |
| |
Total Assets | | $ | 2,433,394 | | | $ | 2,027,474 | | | $ | 2,650,304 | | | $ | (3,732,586 | ) | | $ | 3,378,586 | |
| |
| | | | | |
Liabilities and Shareholders’ Equity | | | | | | | | | | | | | | | | | | | | |
| | | | | |
Current Liabilities | | | | | | | | | | | | | | | | | | | | |
Accounts payable | | $ | 812 | | | $ | 26,525 | | | $ | 92,551 | | | $ | 0 | | | $ | 119,888 | |
Accrued liabilities | | | 18,587 | | | | 79,524 | | | | 172,311 | | | | 0 | | | | 270,422 | |
Credit facilities | | | 0 | | | | 0 | | | | 5,000 | | | | 0 | | | | 5,000 | |
Current maturities of
long-term debt | | | 0 | | | | 211 | | | | 11,384 | | | | 0 | | | | 11,595 | |
Deferred income tax
liabilities | | | 238 | | | | (1 | ) | | | 9,301 | | | | 0 | | | | 9,538 | |
Federal and foreign
income taxes | | | (1,326 | ) | | | (25,185 | ) | | | 28,429 | | | | 0 | | | | 1,918 | |
| |
Total Current Liabilities | | | 18,311 | | | | 81,074 | | | | 318,976 | | | | 0 | | | | 418,361 | |
| | | | | |
Credit Facilities | | | 360,000 | | | | 0 | | | | 0 | | | | 0 | | | | 360,000 | |
Long-Term Debt, Net | | | 426,354 | | | | 44,289 | | | | 189,385 | | | | 0 | | | | 660,028 | |
Deferred Income Tax
Liabilities | | | 32,959 | | | | 21,971 | | | | 183,779 | | | | 0 | | | | 238,709 | |
Pension and Post-Retirement
Obligations | | | 17,849 | | | | 38,335 | | | | 51,693 | | | | 0 | | | | 107,877 | |
Other Liabilities | | | 4,003 | | | | 8,549 | | | | 7,141 | | | | 0 | | | | 19,693 | |
Amounts Due To (From)
Subsidiaries | | | 0 | | | | 0 | | | | 444,820 | | | | (444,820 | ) | | | 0 | |
Shareholders’ Equity | | | 1,573,918 | | | | 1,833,256 | | | | 1,454,510 | | | | (3,287,766 | ) | | | 1,573,918 | |
| |
Total Liabilities and
Shareholders’ Equity | | $ | 2,433,394 | | | $ | 2,027,474 | | | $ | 2,650,304 | | | $ | (3,732,586 | ) | | $ | 3,378,586 | |
| |
| | | | | | | | | | | | | | | | | | | | |
| In Thousands | | Parent | | | Guarantor
Subsidiaries | | | Non-
Guarantor
Subsidiaries | | | Eliminations | | | Total | |
| | | | | |
Assets | | | | | | | | | | | | | | | | | | | | |
| | | | | |
Current Assets | | | | | | | | | | | | | | | | | | | | |
Cash and cash equivalents | | $ | 7,826 | | | $ | 4,876 | | | $ | 166,476 | | | $ | 0 | | | $ | 179,178 | |
Cash in escrow | | | 4,018 | | | | 0 | | | | 0 | | | | 0 | | | | 4,018 | |
Accounts receivable, net | | | 316 | | | | 154,492 | | | | 228,858 | | | | 0 | | | | 383,666 | |
Inventories | | | 0 | | | | 190,830 | | | | 256,833 | | | | 0 | | | | 447,663 | |
Income tax refundable | | | 0 | | | | 6,526 | | | | 0 | | | | 0 | | | | 6,526 | |
Deferred income tax benefits | | | 26,731 | | | | 171 | | | | 20,375 | | | | 0 | | | | 47,277 | |
Prepaid expenses | | | 117 | | | | 5,510 | | | | 12,556 | | | | 0 | | | | 18,183 | |
Other current assets | | | 86 | | | | 115 | | | | 5,003 | | | | 0 | | | | 5,204 | |
| |
Total Current Assets | | | 39,094 | | | | 362,520 | | | | 690,101 | | | | 0 | | | | 1,091,715 | |
| | | | | |
Property, Plant &
Equipment, Net | | | 1,754 | | | | 175,402 | | | | 194,041 | | | | 0 | | | | 371,197 | |
Goodwill | | | 0 | | | | 344,995 | | | | 783,982 | | | | 0 | | | | 1,128,977 | |
Intangibles, Net | | | 0 | | | | 144,222 | | | | 436,727 | | | | 0 | | | | 580,949 | |
Debt Issuance Costs, Net | | | 5,252 | | | | 0 | | | | 959 | | | | 0 | | | | 6,211 | |
Deferred Income Tax
Benefits | | | 16,782 | | | | 0 | | | | 55,058 | | | | 0 | | | | 71,840 | |
Other Assets | | | 18 | | | | 3,692 | | | | 7,513 | | | | 0 | | | | 11,223 | |
Amounts Due From (To)
Subsidiaries | | | 0 | | | | 549,307 | | | | 0 | | | | (549,307 | ) | | | 0 | |
Investment in Subsidiaries | | | 2,588,478 | | | | 979,123 | | | | 349,104 | | | | (3,916,705 | ) | | | 0 | |
| |
Total Assets | | $ | 2,651,378 | | | $ | 2,559,261 | | | $ | 2,517,485 | | | $ | (4,466,012 | ) | | $ | 3,262,112 | |
| |
| | | | |
Liabilities and Shareholders’ Equity | | | | | | | | | | | | | | | | | |
| | | | | |
Current Liabilities | | | | | | | | | | | | | | | | | | | | |
Accounts payable | | $ | 1,714 | | | $ | 29,064 | | | $ | 92,819 | | | $ | 0 | | | $ | 123,597 | |
Accrued liabilities | | | 21,652 | | | | 87,826 | | | | 144,083 | | | | 0 | | | | 253,561 | |
Current maturities of
long-term debt | | | 8,750 | | | | 237 | | | | 12,292 | | | | 0 | | | | 21,279 | |
Deferred income tax
liabilities | | | 568 | | | | 24 | | | | 1,715 | | | | 0 | | | | 2,307 | |
Federal and foreign
income taxes | | | 2,408 | | | | (27,399 | ) | | | 32,339 | | | | 0 | | | | 7,348 | |
| |
Total Current Liabilities | | | 35,092 | | | | 89,752 | | | | 283,248 | | | | 0 | | | | 408,092 | |
| | | | | |
Credit Facilities | | | 130,000 | | | | 0 | | | | 0 | | | | 0 | | | | 130,000 | |
Long-Term Debt, Net | | | 411,875 | | | | 55,562 | | | | 70,422 | | | | 0 | | | | 537,859 | |
Deferred Income Tax
Liabilities | | | 57,757 | | | | (7 | ) | | | 135,369 | | | | 0 | | | | 193,119 | |
Pension and Post-Retirement
Obligations | | | 17,500 | | | | 618 | | | | 49,984 | | | | 0 | | | | 68,102 | |
Other Liabilities | | | 12,298 | | | | 194 | | | | 27,696 | | | | 0 | | | | 40,188 | |
Amounts Due To (From)
Subsidiaries | | | 102,104 | | | | 0 | | | | 405,018 | | | | (507,122 | ) | | | 0 | |
Shareholders’ Equity | | | 1,884,752 | | | | 2,413,142 | | | | 1,545,748 | | | | (3,958,890 | ) | | | 1,884,752 | |
| |
Total Liabilities and
Shareholders’ Equity | | $ | 2,651,378 | | | $ | 2,559,261 | | | $ | 2,517,485 | | | $ | (4,466,012 | ) | | $ | 3,262,112 | |
| |
7577
Condensed Consolidating Statement of Operations and Comprehensive Income (Loss) for the fiscal year ended October 25, 2013
| | | | | | | | | | | | | | | | | | | | |
| In Thousands | | Parent | | | Guarantor
Subsidiaries | | | Non-
Guarantor
Subsidiaries | | | Eliminations | | | Total | |
| | | | | |
Net Sales | | $ | 0 | | | $ | 955,403 | | | $ | 1,018,658 | | | $ | (4,307 | ) | | $ | 1,969,754 | |
Cost of Sales | | | 0 | | | | 593,564 | | | | 654,501 | | | | (4,307 | ) | | | 1,243,758 | |
| |
| | | 0 | | | | 361,839 | | | | 364,157 | | | | 0 | | | | 725,996 | |
Expenses | | | | | | | | | | | | | | | | | | | | |
Selling, general
and administrative | | | 0 | | | | 165,540 | | | | 225,607 | | | | 0 | | | | 391,147 | |
Research, development
and engineering | | | 0 | | | | 50,806 | | | | 44,930 | | | | 0 | | | | 95,736 | |
Gain on sale of product line | | | 0 | | | | (2,264 | ) | | | 0 | | | | 0 | | | | (2,264 | ) |
Gain on settlement
of contingency | | | 0 | | | | 0 | | | | 0 | | | | 0 | | | | 0 | |
Goodwill impairment | | | 0 | | | | 0 | | | | 3,454 | | | | 0 | | | | 3,454 | |
Other income | | | 0 | | | | 0 | | | | 0 | | | | 0 | | | | 0 | |
| |
Total Expenses | | | 0 | | | | 214,082 | | | | 273,991 | | | | 0 | | | | 488,073 | |
| | | | | |
Operating Earnings from Continuing
Operations | | | 0 | | | | 147,757 | | | | 90,166 | | | | 0 | | | | 237,923 | |
Interest income | | | (15,639 | ) | | | (7,704 | ) | | | (54,606 | ) | | | 77,410 | | | | (539 | ) |
Interest expense | | | 30,050 | | | | 26,868 | | | | 60,159 | | | | (77,410 | ) | | | 39,667 | |
Loss on extinguishment of debt | | | 946 | | | | 0 | | | | 0 | | | | 0 | | | | 946 | |
| |
| | | | | |
Earnings (Loss) from Continuing
Operations Before Taxes | | | (15,357 | ) | | | 128,593 | | | | 84,613 | | | | 0 | | | | 197,849 | |
Income Tax Expense (Benefit) | | | (3,320 | ) | | | 25,242 | | | | 8,163 | | | | 0 | | | | 30,085 | |
| |
Earnings (Loss) From Continuing
Operations Including
Noncontrolling Interests | | | (12,037 | ) | | | 103,351 | | | | 76,450 | | | | 0 | | | | 167,764 | |
Earnings Attributable to
Noncontrolling Interests | | | 0 | | | | 0 | | | | (1,730 | ) | | | 0 | | | | (1,730 | ) |
| |
Earnings (Loss) From Continuing
Operations Attributable to
Esterline, Net of Tax | | | (12,037 | ) | | | 103,351 | | | | 74,720 | | | | 0 | | | | 166,034 | |
| | | | | |
Loss From Discontinued
Operations Attributable to
Esterline, Net of Tax | | | (1,300 | ) | | | 0 | | | | 0 | | | | 0 | | | | (1,300 | ) |
Equity in Net Income of
Consolidated Subsidiaries | | | 178,071 | | | | 1,697 | | | | 3,705 | | | | (183,473 | ) | | | 0 | |
| |
Net Earnings (Loss)
Attributable to Esterline | | $ | 164,734 | | | $ | 105,048 | | | $ | 78,425 | | | $ | (183,473 | ) | | $ | 164,734 | |
| |
| | | | | |
Comprehensive Income (Loss) | | | | | | | | | | | | | | | | | | | | |
| | | | | |
Net earnings (loss) | | $ | 164,734 | | | $ | 105,048 | | | $ | 78,425 | | | $ | (183,473 | ) | | $ | 164,734 | |
Change in fair value of derivative
financial instruments, net of tax | | | 0 | | | | 0 | | | | (3,119 | ) | | | 0 | | | | (3,119 | ) |
Change in pension and
post-retirement obligations,
net of tax | | | 36,669 | | | | 0 | | | | 6,325 | | | | 0 | | | | 42,994 | |
Foreign currency translation
adjustment | | | 23,125 | | | | 100 | | | | 40,442 | | | | (40,542 | ) | | | 23,125 | |
| |
Comprehensive Income (Loss) | | $ | 224,528 | | | $ | 105,148 | | | $ | 122,073 | | | $ | (224,015 | ) | | $ | 227,734 | |
| |
78
Condensed Consolidating Statement of Cash Flows for the fiscal year ended October 25, 2013
| | | | | | | | | | | | | | | | | | | | |
| In Thousands | | Parent | | | Guarantor
Subsidiaries | | | Non-
Guarantor
Subsidiaries | | | Eliminations | | | Total | |
| | | | | |
Cash Flows Provided (Used)
by Operating Activities | | | | | | | | | | | | | | | | | | | | |
Net earnings (loss) including
noncontrolling interests | | $ | 166,464 | | | $ | 105,048 | | | $ | 78,425 | | | $ | (183,473 | ) | | $ | 166,464 | |
Depreciation & amortization | | | 0 | | | | 43,539 | | | | 68,593 | | | | 0 | | | | 112,132 | |
Deferred income taxes | | | 8,274 | | | | (13,674 | ) | | | (19,019 | ) | | | 0 | | | | (24,419 | ) |
Share-based compensation | | | 0 | | | | 4,163 | | | | 5,412 | | | | 0 | | | | 9,575 | |
Gain on sale of capital assets | | | 0 | | | | (1,013 | ) | | | (1,290 | ) | | | 0 | | | | (2,303 | ) |
Gain on settlement of contingency | | | 0 | | | | 0 | | | | 0 | | | | 0 | | | | 0 | |
Goodwill impairment | | | 0 | | | | 0 | | | | 3,454 | | | | 0 | | | | 3,454 | |
Working capital changes, net
of effect of acquisitions
Accounts receivable | | | (135 | ) | | | (4,976 | ) | | | 10,126 | | | | 0 | | | | 5,015 | |
Inventories | | | 0 | | | | (16,652 | ) | | | (11,665 | ) | | | 0 | | | | (28,317 | ) |
Prepaid expenses | | | (41 | ) | | | 1,775 | | | | 1,870 | | | | 0 | | | | 3,604 | |
Other current assets | | | 1,332 | | | | 437 | | | | (3,327 | ) | | | 0 | | | | (1,558 | ) |
Accounts payable | | | (230 | ) | | | 362 | | | | 8,876 | | | | 0 | | | | 9,008 | |
Accrued liabilities | | | 5,955 | | | | 6,725 | | | | (15,800 | ) | | | 0 | | | | (3,120 | ) |
Federal & foreign
income taxes | | | 4,445 | | | | (8,193 | ) | | | 9,534 | | | | 0 | | | | 5,786 | |
Other liabilities | | | 3,271 | | | | (185 | ) | | | (10,688 | ) | | | 0 | | | | (7,602 | ) |
Other, net | | | (89 | ) | | | 2,329 | | | | 813 | | | | 0 | | | | 3,053 | |
| |
| | | 189,246 | | | | 119,685 | | | | 125,314 | | | | (183,473 | ) | | | 250,772 | |
| | | | | |
Cash Flows Provided (Used)
by Investing Activities | | | | | | | | | | | | | | | | | | | | |
Purchases of capital assets | | | (105 | ) | | | (15,937 | ) | | | (39,293 | ) | | | 0 | | | | (55,335 | ) |
Escrow deposit | | | 0 | | | | 0 | | | | 0 | | | | 0 | | | | 0 | |
Proceeds from sale of
capital assets | | | 0 | | | | 1,013 | | | | 1,290 | | | | 0 | | | | 2,303 | |
Acquisition of businesses,
net of cash acquired | | | 0 | | | | 0 | | | | (40,689 | ) | | | 0 | | | | (40,689 | ) |
| |
| | | (105 | ) | | | (14,924 | ) | | | (78,692 | ) | | | 0 | | | | (93,721 | ) |
79
Condensed Consolidating Statement of Cash Flows for the fiscal year ended October 25, 2013
| | | | | | | | | | | | | | | | | | | | |
| In Thousands | | Parent | | | Guarantor
Subsidiaries | | | Non-
Guarantor
Subsidiaries | | | Eliminations | | | Total | |
| | | | | |
Cash Flows Provided (Used)
by Financing Activities | | | | | | | | | | | | | | | | | | | | |
Proceeds provided by stock
issuance under employee
stock plans | | | 22,854 | | | | 0 | | | | 0 | | | | 0 | | | | 22,854 | |
Excess tax benefits from
stock option exercises | | | 2,961 | | | | 0 | | | | 0 | | | | 0 | | | | 2,961 | |
Repayment of long-term
credit facilities | | | (110,000 | ) | | | 0 | | | | 0 | | | | 0 | | | | (110,000 | ) |
Repayment of long-term debt | | | (179,375 | ) | | | (326 | ) | | | (55,727 | ) | | | 0 | | | | (235,428 | ) |
Proceeds from issuance of
long-term credit facilities | | | 175,000 | | | | 0 | | | | 0 | | | | 0 | | | | 175,000 | |
Proceeds from issuance of
long-term debt | | | 0 | | | | 0 | | | | 0 | | | | 0 | | | | 0 | |
Proceeds from government
assistance | | | 0 | | | | 0 | | | | 5,092 | | | | 0 | | | | 5,092 | |
Dividends paid to
noncontrolling interest | | | 0 | | | | 0 | | | | (1,048 | ) | | | 0 | | | | (1,048 | ) |
Debt and other issuance costs | | | (454 | ) | | | 0 | | | | 0 | | | | 0 | | | | (454 | ) |
Net change in intercompany
financing | | | (109,094 | ) | | | (100,893 | ) | | | 26,514 | | | | 183,473 | | | | 0 | |
| |
| | | (198,108 | ) | | | (101,219 | ) | | | (25,169 | ) | | | 183,473 | | | | (141,023 | ) |
| | | | | |
Effect of Foreign Exchange Rates
on Cash and Cash Equivalents | | | 23 | | | | 10 | | | | 2,442 | | | | 0 | | | | 2,475 | |
| |
| | | | | |
Net Increase (Decrease) in
Cash and Cash Equivalents | | | (8,944 | ) | | | 3,552 | | | | 23,895 | | | | 0 | | | | 18,503 | |
Cash and Cash Equivalents
– Beginning of Year | | | 16,770 | | | | 1,324 | | | | 142,581 | | | | 0 | | | | 160,675 | |
| |
Cash and Cash Equivalents
– End of Year | | $ | 7,826 | | | $ | 4,876 | | | $ | 166,476 | | | $ | 0 | | | $ | 179,178 | |
| |
80
Condensed Consolidating Balance Sheet as of October 26, 2012
| | | | | | | | | | | | | | | | | | | | |
| In Thousands | | Parent | | | Guarantor
Subsidiaries | | | Non-
Guarantor
Subsidiaries | | | Eliminations | | | Total | |
| | | | | |
Assets | | | | | | | | | | | | | | | | | | | | |
| | | | | |
Current Assets | | | | | | | | | | | | | | | | | | | | |
Cash and cash equivalents | | $ | 16,770 | | | $ | 1,324 | | | $ | 142,581 | | | $ | 0 | | | $ | 160,675 | |
Cash in escrow | | | 5,016 | | | | 0 | | | | 0 | | | | 0 | | | | 5,016 | |
Accounts receivable, net | | | 181 | | | | 140,631 | | | | 242,550 | | | | 0 | | | | 383,362 | |
Inventories | | | 0 | | | | 159,573 | | | | 250,264 | | | | 0 | | | | 409,837 | |
Income tax refundable | | | 0 | | | | 4,832 | | | | 0 | | | | 0 | | | | 4,832 | |
Deferred income tax benefits | | | 22,874 | | | | 105 | | | | 23,021 | | | | 0 | | | | 46,000 | |
Prepaid expenses | | | 76 | | | | 5,391 | | | | 15,873 | | | | 0 | | | | 21,340 | |
Other current assets | | | 134 | | | | 552 | | | | 3,945 | | | | 0 | | | | 4,631 | |
| |
Total Current Assets | | | 45,051 | | | | 312,408 | | | | 678,234 | | | | 0 | | | | 1,035,693 | |
| | | | | |
Property, Plant &
Equipment, Net | | | 2,811 | | | | 161,998 | | | | 191,592 | | | | 0 | | | | 356,401 | |
Goodwill | | | 0 | | | | 314,641 | | | | 784,321 | | | | 0 | | | | 1,098,962 | |
Intangibles, Net | | | 0 | | | | 126,142 | | | | 482,903 | | | | 0 | | | | 609,045 | |
Debt Issuance Costs, Net | | | 7,508 | | | | 0 | | | | 1,310 | | | | 0 | | | | 8,818 | |
Deferred Income Tax
Benefits | | | 36,610 | | | | (283 | ) | | | 61,625 | | | | 0 | | | | 97,952 | |
Other Assets | | | 8,082 | | | | 1,561 | | | | 10,603 | | | | 0 | | | | 20,246 | |
Amounts Due From (To)
Subsidiaries | | | 0 | | | | 491,143 | | | | 0 | | | | (491,143 | ) | | | 0 | |
Investment in Subsidiaries | | | 2,457,859 | | | | 1,179,938 | | | | 170,223 | | | | (3,808,020 | ) | | | 0 | |
| |
Total Assets | | $ | 2,557,921 | | | $ | 2,587,548 | | | $ | 2,380,811 | | | $ | (4,299,163 | ) | | $ | 3,227,117 | |
| |
| | | |
Liabilities and Shareholders’ Equity | | | | | | | | | | | | | |
| | | | | |
Current Liabilities | | | | | | | | | | | | | | | | | | | | |
Accounts payable | | $ | 1,944 | | | $ | 26,351 | | | $ | 80,394 | | | $ | 0 | | | $ | 108,689 | |
Accrued liabilities | | | 17,495 | | | | 79,103 | | | | 172,955 | | | | 0 | | | | 269,553 | |
Current maturities of
long-term debt | | | 0 | | | | 174 | | | | 10,436 | | | | 0 | | | | 10,610 | |
Deferred income tax
liabilities | | | 213 | | | | (1 | ) | | | 4,913 | | | | 0 | | | | 5,125 | |
Federal and foreign
income taxes | | | (3,418 | ) | | | (23,822 | ) | | | 29,609 | | | | 0 | | | | 2,369 | |
| |
Total Current Liabilities | | | 16,234 | | | | 81,805 | | | | 298,307 | | | | 0 | | | | 396,346 | |
| | | | | |
Credit Facilities | | | 240,000 | | | | 0 | | | | 0 | | | | 0 | | | | 240,000 | |
Long-Term Debt, Net | | | 429,152 | | | | 44,107 | | | | 124,801 | | | | 0 | | | | 598,060 | |
Deferred Income Tax
Liabilities | | | 46,730 | | | | (7 | ) | | | 158,475 | | | | 0 | | | | 205,198 | |
Pension and Post-Retirement
Obligations | | | 20,507 | | | | 54,886 | | | | 56,681 | | | | 0 | | | | 132,074 | |
Other Liabilities | | | 5,189 | | | | 4,194 | | | | 25,521 | | | | 0 | | | | 34,904 | |
Amounts Due To (From)
Subsidiaries | | | 179,574 | | | | 0 | | | | 369,962 | | | | (549,536 | ) | | | 0 | |
Shareholders’ Equity | | | 1,620,535 | | | | 2,402,563 | | | | 1,347,064 | | | | (3,749,627 | ) | | | 1,620,535 | |
| |
Total Liabilities and
Shareholders’ Equity | | $ | 2,557,921 | | | $ | 2,587,548 | | | $ | 2,380,811 | | | $ | (4,299,163 | ) | | $ | 3,227,117 | |
| |
81
Condensed Consolidating Statement of Operations and Comprehensive Income (Loss) for the fiscal year ended October 26, 2012
| | | | | | | | | | | | | | | | | | | | |
| In Thousands | | Parent | | | Guarantor
Subsidiaries | | | Non-
Guarantor
Subsidiaries | | | Eliminations | | | Total | |
| | | | | |
Net Sales | | $ | 0 | | | $ | 920,027 | | | $ | 1,076,296 | | | $ | (4,005 | ) | | $ | 1,992,318 | |
Cost of Sales | | | 0 | | | | 569,181 | | | | 708,189 | | | | (4,005 | ) | | | 1,273,365 | |
| |
| | | 0 | | | | 350,846 | | | | 368,107 | | | | 0 | | | | 718,953 | |
Expenses | | | | | | | | | | | | | | | | | | | | |
Selling, general
and administrative | | | 0 | | | | 146,761 | | | | 236,126 | | | | 0 | | | | 382,887 | |
Research, development
and engineering | | | 0 | | | | 50,372 | | | | 57,373 | | | | 0 | | | | 107,745 | |
Gain on sale of product line | | | 0 | | | | 0 | | | | 0 | | | | 0 | | | | 0 | |
Gain on settlement of
contingency | | | 0 | | | | 0 | | | | (11,891 | ) | | | 0 | | | | (11,891 | ) |
Goodwill impairment | | | 0 | | | | 0 | | | | 52,169 | | | | 0 | | | | 52,169 | |
Other income | | | 0 | | | | 0 | | | | (1,263 | ) | | | 0 | | | | (1,263 | ) |
| |
Total Expenses | | | 0 | | | | 197,133 | | | | 332,514 | | | | 0 | | | | 529,647 | |
| | | | | |
Operating Earnings from
Continuing Operations | | | 0 | | | | 153,713 | | | | 35,593 | | | | 0 | | | | 189,306 | |
Interest income | | | (14,178 | ) | | | (16,141 | ) | | | (60,299 | ) | | | 90,153 | | | | (465 | ) |
Interest expense | | | 34,948 | | | | 27,210 | | | | 74,233 | | | | (90,153 | ) | | | 46,238 | |
Loss on extinguishment of debt | | | 0 | | | | 0 | | | | 0 | | | | 0 | | | | 0 | |
| |
| | | | | |
Earnings (Loss) from Continuing
Operations Before Taxes | | | (20,770 | ) | | | 142,644 | | | | 21,659 | | | | 0 | | | | 143,533 | |
Income Tax Expense (Benefit) | | | (5,591 | ) | | | 32,314 | | | | 3,235 | | | | 0 | | | | 29,958 | |
| |
Earnings (Loss) From Continuing
Operations Including
Noncontrolling Interests | | | (15,179 | ) | | | 110,330 | | | | 18,424 | | | | 0 | | | | 113,575 | |
Earnings Attributable to
Noncontrolling Interests | | | 0 | | | | 0 | | | | (1,040 | ) | | | 0 | | | | (1,040 | ) |
| |
Earnings (Loss) From Continuing
Operations Attributable to
Esterline, Net of Tax | | | (15,179 | ) | | | 110,330 | | | | 17,384 | | | | 0 | | | | 112,535 | |
| | | | | |
Earnings (Loss) From Discontinued
Operations Attributable to
Esterline, Net of Tax | | | 0 | | | | 0 | | | | 0 | | | | 0 | | | | 0 | |
Equity in Net Income of
Consolidated Subsidiaries | | | 127,714 | | | | 17,659 | | | | (145 | ) | | | (145,228 | ) | | | 0 | |
| |
Net Earnings (Loss)
Attributable to Esterline | | $ | 112,535 | | | $ | 127,989 | | | $ | 17,239 | | | $ | (145,228 | ) | | $ | 112,535 | |
| |
| | | | | |
Comprehensive Income (Loss) | | | | | | | | | | | | | | | | | | | | |
| | | | | |
Net earnings (loss) | | $ | 112,535 | | | $ | 127,989 | | | $ | 17,239 | | | $ | (145,228 | ) | | $ | 112,535 | |
Change in fair value of derivative
financial instruments, net of tax | | | 0 | | | | 0 | | | | (2,399 | ) | | | 0 | | | | (2,399 | ) |
Change in pension and
post-retirement obligations,
net of tax | | | (15,727 | ) | | | 0 | | | | (7,981 | ) | | | 0 | | | | (23,708 | ) |
Foreign currency translation
adjustment | | | (56,365 | ) | | | 172 | | | | (58,746 | ) | | | 58,574 | | | | (56,365 | ) |
| |
Comprehensive Income (Loss) | | $ | 40,443 | | | $ | 128,161 | | | $ | (51,887 | ) | | $ | (86,654 | ) | | $ | 30,063 | |
| |
82
Condensed Consolidating Statement of Cash Flows for the fiscal year ended October 26, 2012
| | | | | | | | | | | | | | | | | | | | |
| In Thousands | | Parent | | | Guarantor
Subsidiaries | | | Non-
Guarantor
Subsidiaries | | | Eliminations | | | Total | |
| | | | | |
Cash Flows Provided (Used)
by Operating Activities | | | | | | | | | | | | | | | | | | | | |
Net earnings (loss) including
noncontrolling interests | | $ | 113,575 | | | $ | 127,989 | | | $ | 17,239 | | | $ | (145,228 | ) | | $ | 113,575 | |
Depreciation & amortization | | | 0 | | | | 39,405 | | | | 68,387 | | | | 0 | | | | 107,792 | |
Deferred income taxes | | | 18,013 | | | | (20,600 | ) | | | (22,823 | ) | | | 0 | | | | (25,410 | ) |
Share-based compensation | | | 0 | | | | 4,246 | | | | 5,297 | | | | 0 | | | | 9,543 | |
Gain on sale of capital assets | | | 0 | | | | (410 | ) | | | (534 | ) | | | 0 | | | | (944 | ) |
Gain on settlement of contingency | | | 0 | | | | 0 | | | | (11,891 | ) | | | 0 | | | | (11,891 | ) |
Goodwill impairment | | | 0 | | | | 0 | | | | 52,169 | | | | 0 | | | | 52,169 | |
Working capital changes, net
of effect of acquisitions
Accounts receivable | | | (23 | ) | | | (2,704 | ) | | | (19,654 | ) | | | 0 | | | | (22,381 | ) |
Inventories | | | 0 | | | | (15,707 | ) | | | (3,596 | ) | | | 0 | | | | (19,303 | ) |
Prepaid expenses | | | (17 | ) | | | (385 | ) | | | (2,104 | ) | | | 0 | | | | (2,506 | ) |
Other current assets | | | 6 | | | | (208 | ) | | | (800 | ) | | | 0 | | | | (1,002 | ) |
Accounts payable | | | 1,132 | | | | (174 | ) | | | (7,440 | ) | | | 0 | | | | (6,482 | ) |
Accrued liabilities | | | (1,929 | ) | | | (156 | ) | | | 16,964 | | | | 0 | | | | 14,879 | |
Federal & foreign
income taxes | | | (4,345 | ) | | | (3,497 | ) | | | 4,984 | | | | 0 | | | | (2,858 | ) |
Other liabilities | | | (20,618 | ) | | | 12,196 | | | | (6,280 | ) | | | 0 | | | | (14,702 | ) |
Other, net | | | (1,418 | ) | | | 580 | | | | 4,530 | | | | 0 | | | | 3,692 | |
| |
| | | 104,376 | | | | 140,575 | | | | 94,448 | | | | (145,228 | ) | | | 194,171 | |
Cash Flows Provided (Used)
by Investing Activities | | | | | | | | | | | | | | | | | | | | |
Purchases of capital assets | | | (1,503 | ) | | | (23,553 | ) | | | (24,390 | ) | | | 0 | | | | (49,446 | ) |
Escrow deposit | | | 0 | | | | 0 | | | | 0 | | | | 0 | | | | 0 | |
Proceeds from sale of
capital assets | | | 0 | | | | 410 | | | | 534 | | | | 0 | | | | 944 | |
Acquisition of businesses,
net of cash acquired | | | 0 | | | | 0 | | | | 0 | | | | 0 | | | | 0 | |
| |
| | | (1,503 | ) | | | (23,143 | ) | | | (23,856 | ) | | | 0 | | | | (48,502 | ) |
83
Condensed Consolidating Statement of Cash Flows for the fiscal year ended October 26, 2012
| | | | | | | | | | | | | | | | | | | | |
| In Thousands | | Parent | | | Guarantor
Subsidiaries | | | Non-
Guarantor
Subsidiaries | | | Eliminations | | | Total | |
| | | | | |
Cash Flows Provided (Used)
by Financing Activities | | | | | | | | | | | | | | | | | | | | |
Proceeds provided by stock
issuance under employee
stock plans | | | 7,658 | | | | 0 | | | | 0 | | | | 0 | | | | 7,658 | |
Excess tax benefits from
stock option exercises | | | 382 | | | | 0 | | | | 0 | | | | 0 | | | | 382 | |
Repayment of long-term
credit facilities | | | (150,000 | ) | | | 0 | | | | 0 | | | | 0 | | | | (150,000 | ) |
Repayment of long-term debt | | | 0 | | | | (405 | ) | | | (72,740 | ) | | | 0 | | | | (73,145 | ) |
Proceeds from issuance of
long-term credit facilities | | | 30,000 | | | | 0 | | | | 0 | | | | 0 | | | | 30,000 | |
Proceeds from issuance
of long-term debt | | | 0 | | | | 0 | | | | 0 | | | | 0 | | | | 0 | |
Proceeds from government
assistance | | | 0 | | | | 0 | | | | 17,285 | | | | 0 | | | | 17,285 | |
Dividends paid to
noncontrolling interest | | | 0 | | | | 0 | | | | 0 | | | | 0 | | | | 0 | |
Debt and other issuance costs | | | 0 | | | | 0 | | | | 0 | | | | 0 | | | | 0 | |
Net change in intercompany
financing | | | (24,731 | ) | | | (129,158 | ) | | | 8,661 | | | | 145,228 | | | | 0 | |
| |
| | | (136,691 | ) | | | (129,563 | ) | | | (46,794 | ) | | | 145,228 | | | | (167,820 | ) |
| | | | | |
Effect of Foreign Exchange Rates
on Cash and Cash Equivalents | | | 751 | | | | 5 | | | | (2,965 | ) | | | 0 | | | | (2,209 | ) |
| |
| | | | | |
Net Increase (Decrease) in
Cash and Cash Equivalents | | | (33,067 | ) | | | (12,126 | ) | | | 20,833 | | | | 0 | | | | (24,360 | ) |
Cash and Cash Equivalents
– Beginning of Year | | | 49,837 | | | | 13,450 | | | | 121,748 | �� | | | 0 | | | | 185,035 | |
| |
Cash and Cash Equivalents
– End of Year | | $ | 16,770 | | | $ | 1,324 | | | $ | 142,581 | | | $ | 0 | | | $ | 160,675 | |
| |
84
Condensed Consolidating Statement of Operations and Comprehensive Income (Loss) for the fiscal year ended October 28, 2011
| | | 0000000000000 | | | | 0000000000000 | | | | 0000000000000 | | | | 0000000000000 | | | | 0000000000000 | |
| In Thousands | | Parent | | | Guarantor
Subsidiaries | | | Non-
Guarantor
Subsidiaries | | | Eliminations | | | Total | |
| | | | | |
Net Sales | | | $ 0 | | | | $ 880,711 | | | | $ 840,130 | | | | $ (2,856 | ) | | | $ 1,717,985 | |
Cost of Sales | | | 0 | | | | 563,033 | | | | 568,088 | | | | (2,856 | ) | | | 1,128,265 | |
| |
| | | 0 | | | | 317,678 | | | | 272,042 | | | | 0 | | | | 589,720 | |
Expenses | | | | | | | | | | | | | | | | | | | | |
Selling, general
and administrative | | | 0 | | | | 120,548 | | | | 183,606 | | | | 0 | | | | 304,154 | |
Research, development
and engineering | | | 0 | | | | 39,352 | | | | 55,153 | | | | 0 | | | | 94,505 | |
Other (income) expense | | | 0 | | | | 38 | | | | (6,891 | ) | | | 0 | | | | (6,853 | ) |
| |
Total Expenses | | | 0 | | | | 159,938 | | | | 231,868 | | | | 0 | | | | 391,806 | |
| | | | | |
Operating Earnings from
Continuing Operations | | | 0 | | | | 157,740 | | | | 40,174 | | | | 0 | | | | 197,914 | |
Interest income | | | (15,461 | ) | | | (4,702 | ) | | | (45,411 | ) | | | 63,959 | | | | (1,615 | ) |
Interest expense | | | 33,270 | | | | 22,178 | | | | 48,727 | | | | (63,959 | ) | | | 40,216 | |
Loss on extinguishment of debt | | | 831 | | | | 0 | | | | 0 | | | | 0 | | | | 831 | |
| |
| | | | | |
Income (Loss) from Continuing
Operations Before Taxes | | | (18,640 | ) | | | 140,264 | | | | 36,858 | | | | 0 | | | | 158,482 | |
Income Tax Expense (Benefit) | | | (4,274 | ) | | | 21,322 | | | | 7,890 | | | | 0 | | | | 24,938 | |
| |
Income (Loss) From Continuing
Operations Including
Noncontrolling Interests | | | (14,366 | ) | | | 118,942 | | | | 28,968 | | | | 0 | | | | 133,544 | |
Income Attributable to
Noncontrolling Interests | | | 0 | | | | 0 | | | | (457 | ) | | | 0 | | | | (457 | ) |
| |
Income (Loss) From Continuing
Operations Attributable to
Esterline, Net of Tax | | | (14,366 | ) | | | 118,942 | | | | 28,511 | | | | 0 | | | | 133,087 | |
| | | | | |
Income From Discontinued
Operations Attributable to
Esterline, Net of Tax | | | 0 | | | | (47 | ) | | | 0 | | | | 0 | | | | (47 | ) |
Equity in Net Income of
Consolidated Subsidiaries | | | 147,406 | | | | 16,523 | | | | 13,103 | | | | (177,032 | ) | | | 0 | |
| |
Net Earnings (Loss) Attributable
to Esterline | | | $ 133,040 | | | | $ 135,418 | | | | $ 41,614 | | | | $ (177,032 | ) | | | $ 133,040 | |
| |
| | | | | | | | | | | | | | | | | | | | |
| In Thousands | | Parent | | | Guarantor
Subsidiaries | | | Non-
Guarantor
Subsidiaries | | | Eliminations | | | Total | |
| | | | | |
Net Sales | | $ | 0 | | | $ | 880,711 | | | $ | 840,130 | | | $ | (2,856 | ) | | $ | 1,717,985 | |
Cost of Sales | | | 0 | | | | 563,033 | | | | 568,088 | | | | (2,856 | ) | | | 1,128,265 | |
| |
| | | 0 | | | | 317,678 | | | | 272,042 | | | | 0 | | | | 589,720 | |
Expenses | | | | | | | | | | | | | | | | | | | | |
Selling, general
and administrative | | | 0 | | | | 120,548 | | | | 183,606 | | | | 0 | | | | 304,154 | |
Research, development
and engineering | | | 0 | | | | 39,352 | | | | 55,153 | | | | 0 | | | | 94,505 | |
Gain on sale of product line | | | 0 | | | | 0 | | | | 0 | | | | 0 | | | | 0 | |
Gain on settlement of
contingency | | | 0 | | | | 0 | | | | 0 | | | | 0 | | | | 0 | |
Goodwill impairment | | | 0 | | | | 0 | | | | 0 | | | | 0 | | | | 0 | |
Other (income) expense | | | 0 | | | | 38 | | | | (6,891 | ) | | | 0 | | | | (6,853 | ) |
| |
Total Expenses | | | 0 | | | | 159,938 | | | | 231,868 | | | | 0 | | | | 391,806 | |
| | | | | |
Operating Earnings from
Continuing Operations | | | 0 | | | | 157,740 | | | | 40,174 | | | | 0 | | | | 197,914 | |
Interest income | | | (15,461 | ) | | | (4,702 | ) | | | (45,411 | ) | | | 63,959 | | | | (1,615 | ) |
Interest expense | | | 33,270 | | | | 22,178 | | | | 48,727 | | | | (63,959 | ) | | | 40,216 | |
Loss on extinguishment of debt | | | 831 | | | | 0 | | | | 0 | | | | 0 | | | | 831 | |
| |
| | | | | |
Earnings (Loss) from Continuing
Operations Before Taxes | | | (18,640 | ) | | | 140,264 | | | | 36,858 | | | | 0 | | | | 158,482 | |
Income Tax Expense (Benefit) | | | (4,274 | ) | | | 21,322 | | | | 7,890 | | | | 0 | | | | 24,938 | |
| |
Earnings (Loss) From Continuing
Operations Including
Noncontrolling Interests | | | (14,366 | ) | | | 118,942 | | | | 28,968 | | | | 0 | | | | 133,544 | |
Earnings Attributable to
Noncontrolling Interests | | | 0 | | | | 0 | | | | (457 | ) | | | 0 | | | | (457 | ) |
| |
Earnings (Loss) From Continuing
Operations Attributable to
Esterline, Net of Tax | | | (14,366 | ) | | | 118,942 | | | | 28,511 | | | | 0 | | | | 133,087 | |
| | | | | |
Loss From Discontinued
Operations Attributable to
Esterline, Net of Tax | | | 0 | | | | (47 | ) | | | 0 | | | | 0 | | | | (47 | ) |
Equity in Net Income of
Consolidated Subsidiaries | | | 147,406 | | | | 16,523 | | | | 13,103 | | | | (177,032 | ) | | | 0 | |
| |
Net Earnings (Loss)
Attributable to Esterline | | $ | 133,040 | | | $ | 135,418 | | | $ | 41,614 | | | $ | (177,032 | ) | | $ | 133,040 | |
| |
| | | | | |
Comprehensive Income (Loss) | | | | | | | | | | | | | | | | | | | | |
| | | | | |
Net earnings (loss) | | $ | 133,040 | | | $ | 135,418 | | | $ | 41,614 | | | $ | (177,032 | ) | | $ | 133,040 | |
Change in fair value of derivative
financial instruments, net of tax | | | 0 | | | | 0 | | | | (5,934 | ) | | | 0 | | | | (5,934 | ) |
Change in pension and
post-retirement obligations,
net of tax | | | (7,157 | ) | | | 0 | | | | (2,829 | ) | | | 0 | | | | (9,986 | ) |
Foreign currency translation
adjustment | | | 9,873 | | | | 450 | | | | 2,077 | | | | (2,527 | ) | | | 9,873 | |
| |
Comprehensive Income (Loss) | | $ | 135,756 | | | $ | 135,868 | | | $ | 34,928 | | | $ | (179,559 | ) | | $ | 126,993 | |
| |
7685
Condensed Consolidating Statement of Cash Flows for the fiscal year ended October 28, 2011
| | | 0000000000 | | | | 0000000000 | | | | 0000000000 | | | | 0000000000 | | | | 0000000000 | |
| In Thousands | | Parent | | | Guarantor
Subsidiaries | | | Non-
Guarantor
Subsidiaries | | | Eliminations | | | Total | |
| | | | | |
Cash Flows Provided (Used)
by Operating Activities | | | | | | | | | | | | | | | | | | | | |
Net earnings (loss) including
noncontrolling interests | | $ | 133,497 | | | $ | 135,418 | | | $ | 41,614 | | | $ | (177,032 | ) | | $ | 133,497 | |
Depreciation & amortization | | | 0 | | | | 35,616 | | | | 49,042 | | | | 0 | | | | 84,658 | |
Deferred income tax | | | 11,438 | | | | 707 | | | | (24,490 | ) | | | 0 | | | | (12,345 | ) |
Share-based compensation | | | 0 | | | | 3,617 | | | | 4,346 | | | | 0 | | | | 7,963 | |
Gain on sale of capital assets | | | 0 | | | | (3,605 | ) | | | (79 | ) | | | 0 | | | | (3,684 | ) |
Working capital changes, net
of effect of acquisitions | | | | | | | | | | | | | | | | | | | | |
Accounts receivable | | | 116 | | | | 1,768 | | | | 21,927 | | | | 0 | | | | 23,811 | |
Inventories | | | 0 | | | | (8,452 | ) | | | 8,467 | | | | 0 | | | | 15 | |
Prepaid expenses | | | (10 | ) | | | 722 | | | | (45 | ) | | | 0 | | | | 667 | |
Other current assets | | | (140 | ) | | | (300 | ) | | | (2,135 | ) | | | 0 | | | | (2,575 | ) |
Accounts payable | | | (132 | ) | | | (2,219 | ) | | | (591 | ) | | | 0 | | | | (2,942 | ) |
Accrued liabilities | | | 362 | | | | (6,253 | ) | | | (4,618 | ) | | | 0 | | | | (10,509 | ) |
Federal & foreign
income taxes | | | 11,949 | | | | (6,050 | ) | | | (6,715 | ) | | | 0 | | | | (816 | ) |
Other liabilities | | | (16,200 | ) | | | (3,996 | ) | | | (2,787 | ) | | | 0 | | | | (22,983 | ) |
Other, net | | | 8,164 | | | | (19,245 | ) | | | 8,753 | | | | 0 | | | | (2,328 | ) |
| |
| | | 149,044 | | | | 127,728 | | | | 92,689 | | | | (177,032 | ) | | | 192,429 | |
| | | | | |
Cash Flows Provided (Used)
by Investing Activities | | | | | | | | | | | | | | | | | | | | |
Purchases of capital assets | | | (328 | ) | | | (22,724 | ) | | | (26,455 | ) | | | 0 | | | | (49,507 | ) |
Escrow deposit | | | (14,033 | ) | | | 0 | | | | 0 | | | | 0 | | | | (14,033 | ) |
Proceeds from sale of
capital assets | | | 0 | | | | 6,541 | | | | 2,912 | | | | 0 | | | | 9,453 | |
Acquisitions of businesses,
net of cash acquired | | | 0 | | | | (106,059 | ) | | | (708,875 | ) | | | 0 | | | | (814,934 | ) |
| |
| | | (14,361 | ) | | | (122,242 | ) | | | (732,418 | ) | | | 0 | | | | (869,021 | ) |
| | | | | | | | | | | | | | | | | | | | |
| In Thousands | | Parent | | | Guarantor
Subsidiaries | | | Non-
Guarantor
Subsidiaries | | | Eliminations | | | Total | |
| | | | | |
Cash Flows Provided (Used)
by Operating Activities | | | | | | | | | | | | | | | | | | | | |
Net earnings (loss) including
noncontrolling interests | | $ | 133,497 | | | $ | 135,418 | | | $ | 41,614 | | | $ | (177,032 | ) | | $ | 133,497 | |
Depreciation & amortization | | | 0 | | | | 35,616 | | | | 49,042 | | | | 0 | | | | 84,658 | |
Deferred income taxes | | | 11,438 | | | | 707 | | | | (24,490 | ) | | | 0 | | | | (12,345 | ) |
Share-based compensation | | | 0 | | | | 3,617 | | | | 4,346 | | | | 0 | | | | 7,963 | |
Gain on sale of capital assets | | | 0 | | | | (6,541 | ) | | | (2,912 | ) | | | 0 | | | | (9,453 | ) |
Gain on settlement of contingency | | | 0 | | | | 0 | | | | 0 | | | | 0 | | | | 0 | |
Goodwill impairment | | | 0 | | | | 0 | | | | 0 | | | | 0 | | | | 0 | |
Working capital changes, net
of effect of acquisitions
Accounts receivable | | | 116 | | | | 1,768 | | | | 21,927 | | | | 0 | | | | 23,811 | |
Inventories | | | 0 | | | | (8,452 | ) | | | 8,467 | | | | 0 | | | | 15 | |
Prepaid expenses | | | (10 | ) | | | 722 | | | | (45 | ) | | | 0 | | | | 667 | |
Other current assets | | | (140 | ) | | | (300 | ) | | | (2,135 | ) | | | 0 | | | | (2,575 | ) |
Accounts payable | | | (132 | ) | | | (2,219 | ) | | | (591 | ) | | | 0 | | | | (2,942 | ) |
Accrued liabilities | | | 362 | | | | (6,253 | ) | | | (4,618 | ) | | | 0 | | | | (10,509 | ) |
Federal & foreign
income taxes | | | 11,949 | | | | (6,050 | ) | | | (6,715 | ) | | | 0 | | | | (816 | ) |
Other liabilities | | | (16,200 | ) | | | (3,996 | ) | | | (2,787 | ) | | | 0 | | | | (22,983 | ) |
Other, net | | | 8,164 | | | | (16,309 | ) | | | 11,586 | | | | 0 | | | | 3,441 | |
| |
| | | 149,044 | | | | 127,728 | | | | 92,689 | | | | (177,032 | ) | | | 192,429 | |
| | | | | |
Cash Flows Provided (Used)
by Investing Activities | | | | | | | | | | | | | | | | | | | | |
Purchases of capital assets | | | (328 | ) | | | (22,724 | ) | | | (26,455 | ) | | | 0 | | | | (49,507 | ) |
Escrow deposit | | | (14,033 | ) | | | 0 | | | | 0 | | | | 0 | | | | (14,033 | ) |
Proceeds from sale of
capital assets | | | 0 | | | | 6,541 | | | | 2,912 | | | | 0 | | | | 9,453 | |
Acquisition of businesses,
net of cash acquired | | | 0 | | | | (106,059 | ) | | | (708,875 | ) | | | 0 | | | | (814,934 | ) |
| |
| | | (14,361 | ) | | | (122,242 | ) | | | (732,418 | ) | | | 0 | | | | (869,021 | ) |
7786
Condensed Consolidating Statement of Cash Flows for the fiscal year ended October 28, 2011
| | | 0000000000 | | | | 0000000000 | | | | 0000000000 | | | | 0000000000 | | | | 0000000000 | |
| In Thousands | | Parent | | | Guarantor
Subsidiaries | | | Non-
Guarantor
Subsidiaries | | | Eliminations | | | Total | |
| | | | | |
Cash Flows Provided (Used)
by Financing Activities | | | | | | | | | | | | | | | | | | | | |
Proceeds provided by stock
issuance under employee
stock plans | | | 13,253 | | | | 0 | | | | 0 | | | | 0 | | | | 13,253 | |
Excess tax benefits from
stock option exercises | | | 1,830 | | | | 0 | | | | 0 | | | | 0 | | | | 1,830 | |
Proceeds from long-term
credit facilities | | | 395,000 | | | | 0 | | | | 5,014 | | | | 0 | | | | 400,014 | |
Repayment of long-term debt
and credit facilities | | | (155,313 | ) | | | (321 | ) | | | (9,282 | ) | | | 0 | | | | (164,916 | ) |
Proceeds from issuance of
long-term debt | | | 0 | | | | 0 | | | | 176,875 | | | | 0 | | | | 176,875 | |
Proceeds from government
assistance | | | 0 | | | | 0 | | | | 15,000 | | | | 0 | | | | 15,000 | |
Dividends paid to
noncontrolling interest | | | 0 | | | | 0 | | | | (238 | ) | | | 0 | | | | (238 | ) |
Debt and other issuance costs | | | (3,640 | ) | | | 0 | | | | (1,758 | ) | | | 0 | | | | (5,398 | ) |
Net change in intercompany
financing | | | (541,098 | ) | | | 5,972 | | | | 358,094 | | | | 177,032 | | | | 0 | |
| |
| | | (289,968 | ) | | | 5,651 | | | | 543,705 | | | | 177,032 | | | | 436,420 | |
| | | | | |
Effect of Foreign Exchange Rates
on Cash and Cash Equivalents | | | 72 | | | | (4 | ) | | | 3,019 | | | | 0 | | | | 3,087 | |
| |
| | | | | |
Net Increase (Decrease) in
Cash and Cash Equivalents | | | (155,213 | ) | | | 11,133 | | | | (93,005 | ) | | | 0 | | | | (237,085 | ) |
Cash and Cash Equivalents
– Beginning of Year | | | 205,050 | | | | 2,317 | | | | 214,753 | | | | 0 | | | | 422,120 | |
| |
Cash and Cash Equivalents
– End of Year | | $ | 49,837 | | | $ | 13,450 | | | $ | 121,748 | | | $ | 0 | | | $ | 185,035 | |
| |
| | | | | | | | | | | | | | | | | | | | |
| In Thousands | | Parent | | | Guarantor
Subsidiaries | | | Non-
Guarantor
Subsidiaries | | | Eliminations | | | Total | |
| | | | | |
Cash Flows Provided (Used)
by Financing Activities | | | | | | | | | | | | | | | | | | | | |
Proceeds provided by stock
issuance under employee
stock plans | | | 13,253 | | | | 0 | | | | 0 | | | | 0 | | | | 13,253 | |
Excess tax benefits from
stock option exercises | | | 1,830 | | | | 0 | | | | 0 | | | | 0 | | | | 1,830 | |
Repayment of long-term
credit facilities | | | (35,000 | ) | | | 0 | | | | 0 | | | | 0 | | | | (35,000 | ) |
Repayment of long-term debt | | | (120,313 | ) | | | (321 | ) | | | (9,282 | ) | | | 0 | | | | (129,916 | ) |
Proceeds from issuance of
long-term credit facilities | | | 395,000 | | | | 0 | | | | 5,014 | | | | 0 | | | | 400,014 | |
Proceeds from issuance
of long-term debt | | | 0 | | | | 0 | | | | 176,875 | | | | 0 | | | | 176,875 | |
Proceeds from government
assistance | | | 0 | | | | 0 | | | | 15,000 | | | | 0 | | | | 15,000 | |
Dividends paid to
noncontrolling interest | | | 0 | | | | 0 | | | | (238 | ) | | | 0 | | | | (238 | ) |
Debt and other issuance costs | | | (3,640 | ) | | | 0 | | | | (1,758 | ) | | | 0 | | | | (5,398 | ) |
Net change in intercompany
financing | | | (541,098 | ) | | | 5,972 | | | | 358,094 | | | | 177,032 | | | | 0 | |
| |
| | | (289,968 | ) | | | 5,651 | | | | 543,705 | | | | 177,032 | | | | 436,420 | |
| | | | | |
Effect of Foreign Exchange Rates
on Cash and Cash Equivalents | | | 72 | | | | (4 | ) | | | 3,019 | | | | 0 | | | | 3,087 | |
| |
| | | | | |
Net Increase (Decrease) in
Cash and Cash Equivalents | | | (155,213 | ) | | | 11,133 | | | | (93,005 | ) | | | 0 | | | | (237,085 | ) |
Cash and Cash Equivalents
– Beginning of Year | | | 205,050 | | | | 2,317 | | | | 214,753 | | | | 0 | | | | 422,120 | |
| |
Cash and Cash Equivalents
– End of Year | | $ | 49,837 | | | $ | 13,450 | | | $ | 121,748 | | | $ | 0 | | | $ | 185,035 | |
| |
7887
Condensed Consolidating Balance Sheet as of October 29, 2010
| | | 0000000000 | | | | 0000000000 | | | | 0000000000 | | | | 0000000000 | | | | 0000000000 | |
| In Thousands | | Parent | | | Guarantor
Subsidiaries | | | Non-
Guarantor
Subsidiaries | | | Eliminations | | | Total | |
| | | | | |
Assets | | | | | | | | | | | | | | | | | | | | |
| | | | | |
Current Assets | | | | | | | | | | | | | | | | | | | | |
Cash and cash equivalents | | $ | 205,050 | | | $ | 2,317 | | | $ | 214,753 | | | $ | 0 | | | $ | 422,120 | |
Accounts receivable, net | | | 274 | | | | 131,531 | | | | 177,437 | | | | 0 | | | | 309,242 | |
Inventories | | | 0 | | | | 118,567 | | | | 143,806 | | | | 0 | | | | 262,373 | |
Income tax refundable | | | 12,548 | | | | 0 | | | | 5,258 | | | | 0 | | | | 17,806 | |
Deferred income tax benefits | | | 23,507 | | | | (1,627 | ) | | | 15,659 | | | | 0 | | | | 37,539 | |
Prepaid expenses | | | 49 | | | | 5,729 | | | | 10,486 | | | | 0 | | | | 16,264 | |
Other current assets | | | 0 | | | | 1 | | | | 11,240 | | | | 0 | | | | 11,241 | |
| |
Total Current Assets | | | 241,428 | | | | 256,518 | | | | 578,639 | | | | 0 | | | | 1,076,585 | |
| | | | | |
Property, Plant &
Equipment, Net | | | 1,249 | | | | 162,407 | | | | 110,114 | | | | 0 | | | | 273,770 | |
Goodwill | | | 0 | | | | 246,176 | | | | 493,554 | | | | 0 | | | | 739,730 | |
Intangibles, Net | | | 0 | | | | 89,812 | | | | 299,205 | | | | 0 | | | | 389,017 | |
Debt Issuance Costs, Net | | | 7,774 | | | | 0 | | | | 0 | | | | 0 | | | | 7,774 | |
Deferred Income Tax
Benefits | | | 44,407 | | | | 3,537 | | | | 39,678 | | | | 0 | | | | 87,622 | |
Other Assets | | | (69 | ) | | | 2,004 | | | | 11,305 | | | | 0 | | | | 13,240 | |
Amounts Due From (To)
Subsidiaries | | | 41,529 | | | | 271,345 | | | | 0 | | | | (312,874 | ) | | | 0 | |
Investment in Subsidiaries | | | 1,710,032 | | | | 149,607 | | | | 227,869 | | | | (2,087,508 | ) | | | 0 | |
| |
Total Assets | | $ | 2,046,350 | | | $ | 1,181,406 | | | $ | 1,760,364 | | | $ | (2,400,382 | ) | | $ | 2,587,738 | |
| |
| | | | | |
| Liabilities and Shareholders’ Equity | | | | | | | | | | | | | | | | | | | | |
| | | | | |
Current Liabilities | | | | | | | | | | | | | | | | | | | | |
Accounts payable | | $ | 944 | | | $ | 28,345 | | | $ | 52,986 | | | $ | 0 | | | $ | 82,275 | |
Accrued liabilities | | | 18,662 | | | | 73,870 | | | | 122,562 | | | | 0 | | | | 215,094 | |
Credit facilities | | | 0 | | | | 0 | | | | 1,980 | | | | 0 | | | | 1,980 | |
Current maturities of
long-term debt | | | 10,938 | | | | 80 | | | | 1,628 | | | | 0 | | | | 12,646 | |
Deferred income tax
liabilities | | | 197 | | | | 278 | | | | 6,680 | | | | 0 | | | | 7,155 | |
Federal and foreign
income taxes | | | (727 | ) | | | (20,522 | ) | | | 26,476 | | | | 0 | | | | 5,227 | |
| |
Total Current Liabilities | | | 30,014 | | | | 82,051 | | | | 212,312 | | | | 0 | | | | 324,377 | |
| | | | | |
Long-Term Debt, Net | | | 534,375 | | | | 44,525 | | | | 20,072 | | | | 0 | | | | 598,972 | |
Deferred Income Tax
Liabilities | | | 40,300 | | | | 123 | | | | 86,658 | | | | 0 | | | | 127,081 | |
Pension and Post-Retirement
Obligations | | | 16,629 | | | | 42,279 | | | | 46,425 | | | | 0 | | | | 105,333 | |
Other Liabilities | | | 9,533 | | | | 251 | | | | 6,692 | | | | 0 | | | | 16,476 | |
Amounts Due To (From)
Subsidiaries | | | 0 | | | | 0 | | | | 310,115 | | | | (310,115 | ) | | | 0 | |
Shareholders’ Equity | | | 1,415,499 | | | | 1,012,177 | | | | 1,078,090 | | | | (2,090,267 | ) | | | 1,415,499 | |
| |
Total Liabilities and | | | | | | | | | | | | | | | | | | | | |
Shareholders’ Equity | | $ | 2,046,350 | | | $ | 1,181,406 | | | $ | 1,760,364 | | | $ | (2,400,382 | ) | | $ | 2,587,738 | |
| |
79
Condensed Consolidating Statement of Operations for the fiscal year ended October 29, 2010
| | | 0000000000 | | | | 0000000000 | | | | 0000000000 | | | | 0000000000 | | | | 0000000000 | |
| In Thousands | | Parent | | | Guarantor
Subsidiaries | | | Non-
Guarantor
Subsidiaries | | | Eliminations | | | Total | |
| | | | | |
Net Sales | | $ | 0 | | | $ | 788,677 | | | $ | 738,811 | | | $ | (887 | ) | | $ | 1,526,601 | |
Cost of Sales | | | 0 | | | | 520,739 | | | | 490,538 | | | | (887 | ) | | | 1,010,390 | |
| |
| | | 0 | | | | 267,938 | | | | 248,273 | | | | 0 | | | | 516,211 | |
Expenses | | | | | | | | | | | | | | | | | | | | |
Selling, general
and administrative | | | 0 | | | | 121,115 | | | | 137,175 | | | | 0 | | | | 258,290 | |
Research, development
and engineering | | | 0 | | | | 29,385 | | | | 40,368 | | | | 0 | | | | 69,753 | |
Other (income) expense | | | 0 | | | | (12 | ) | | | 4 | | | | 0 | | | | (8 | ) |
| |
Total Expenses | | | 0 | | | | 150,488 | | | | 177,547 | | | | 0 | | | | 328,035 | |
| | | | | |
Operating Earnings from | | | | | | | | | | | | | | | | | | | | |
Continuing Operations | | | 0 | | | | 117,450 | | | | 70,726 | | | | 0 | | | | 188,176 | |
Interest income | | | (15,838 | ) | | | (2,516 | ) | | | (38,172 | ) | | | 55,566 | | | | (960 | ) |
Interest expense | | | 28,948 | | | | 20,023 | | | | 39,776 | | | | (55,566 | ) | | | 33,181 | |
Loss on extinguishment of debt | | | 1,206 | | | | 0 | | | | 0 | | | | 0 | | | | 1,206 | |
| |
| | | | | |
Income (Loss) from Continuing
Operations Before Taxes | | | (14,316 | ) | | | 99,943 | | | | 69,122 | | | | 0 | | | | 154,749 | |
Income Tax Expense (Benefit) | | | (3,286 | ) | | | 22,752 | | | | 5,038 | | | | 0 | | | | 24,504 | |
| |
Income (Loss) From Continuing | | | | | | | | | | | | | | | | | | | | |
Operations Including | | | | | | | | | | | | | | | | | | | | |
Noncontrolling Interests | | | (11,030 | ) | | | 77,191 | | | | 64,084 | | | | 0 | | | | 130,245 | |
Income Attributable to | | | | | | | | | | | | | | | | | | | | |
Noncontrolling Interests | | | 0 | | | | 0 | | | | (206 | ) | | | 0 | | | | (206 | ) |
| |
Income (Loss) From Continuing
Operations Attributable to
Esterline, Net of Tax | | | (11,030 | ) | | | 77,191 | | | | 63,878 | | | | 0 | | | | 130,039 | |
| | | | | |
Income From Discontinued
Operations Attributable to
Esterline, Net of Tax | | | 9,545 | | | | 2,336 | | | | 0 | | | | 0 | | | | 11,881 | |
Equity in Net Income of
Consolidated Subsidiaries | | | 143,405 | | | | 36,860 | | | | 3,395 | | | | (183,660 | ) | | | 0 | |
| |
Net Earnings (Loss) Attributable
to Esterline | | $ | 141,920 | | | $ | 116,387 | | | $ | 67,273 | | | $ | (183,660 | ) | | $ | 141,920 | |
| |
80
Condensed Consolidating Statement of Cash Flows for the fiscal year ended October 29, 2010
| | | | | | | | | | | | | | | | | | | | |
| In Thousands | | Parent | | | Guarantor
Subsidiaries | | | Non-
Guarantor
Subsidiaries | | | Eliminations | | | Total | |
| | | | | |
Cash Flows Provided (Used)
by Operating Activities | | | | | | | | | | | | | | | | | | | | |
Net earnings (loss) including
noncontrolling interests | | $ | 141,920 | | | $ | 116,387 | | | $ | 67,479 | | | $ | (183,660 | ) | | $ | 142,126 | |
Depreciation & amortization | | | 0 | | | | 32,390 | | | | 39,727 | | | | 0 | | | | 72,117 | |
Deferred income tax | | | 994 | | | | 27 | | | | (11,018 | ) | | | 0 | | | | (9,997 | ) |
Share-based compensation | | | 0 | | | | 3,306 | | | | 3,828 | | | | 0 | | | | 7,134 | |
Gain on sale of
discontinued operations | | | (14,625 | ) | | | 0 | | | | 0 | | | | 0 | | | | (14,625 | ) |
Working capital changes, net
of effect of acquisitions | | | | | | | | | | | | | | | | | | | | |
Accounts receivable | | | (274 | ) | | | (13,793 | ) | | | (25,097 | ) | | | 0 | | | | (39,164 | ) |
Inventories | | | 0 | | | | 1,483 | | | | 9,251 | | | | 0 | | | | 10,734 | |
Prepaid expenses | | | (49 | ) | | | (854 | ) | | | 2,017 | | | | 0 | | | | 1,114 | |
Other current assets | | | 0 | | | | (1 | ) | | | 2,286 | | | | 0 | | | | 2,285 | |
Accounts payable | | | 366 | | | | 6,043 | | | | (5,553 | ) | | | 0 | | | | 856 | |
Accrued liabilities | | | 5,637 | | | | 12,968 | | | | 2,698 | | | | 0 | | | | 21,303 | |
Federal & foreign
income taxes | | | (777 | ) | | | (19,136 | ) | | | 13,306 | | | | 0 | | | | (6,607 | ) |
Other liabilities | | | 6,138 | | | | (6,550 | ) | | | (7,159 | ) | | | 0 | | | | (7,571 | ) |
Other, net | | | (8,173 | ) | | | 10,872 | | | | (2,603 | ) | | | 0 | | | | 96 | |
| |
| | | 131,157 | | | | 143,142 | | | | 89,162 | | | | (183,660 | ) | | | 179,801 | |
| | | | | |
Cash Flows Provided (Used)
by Investing Activities | | | | | | | | | | | | | | | | | | | | |
Purchases of capital assets | | | (182 | ) | | | (18,920 | ) | | | (26,438 | ) | | | 0 | | | | (45,540 | ) |
Proceeds from sale of
discontinued operations,
net of cash | | | 24,994 | | | | 0 | | | | 0 | | | | 0 | | | | 24,994 | |
Proceeds from sale of
capital assets | | | 0 | | | | 488 | | | | 107 | | | | 0 | | | | 595 | |
Acquisitions of businesses,
net of cash acquired | | | 0 | | | | (360 | ) | | | (408 | ) | | | 0 | | | | (768 | ) |
| |
| | | 24,812 | | | | (18,792 | ) | | | (26,739 | ) | | | 0 | | | | (20,719 | ) |
81
Condensed Consolidating Statement of Cash Flows for the fiscal year ended October 29, 2010
| | | 0000000000 | | | | 0000000000 | | | | 0000000000 | | | | 0000000000 | | | | 0000000000 | |
| In Thousands | | Parent | | | Guarantor
Subsidiaries | | | Non-
Guarantor
Subsidiaries | | | Eliminations | | | Total | |
| | | | | |
Cash Flows Provided (Used)
by Financing Activities | | | | | | | | | | | | | | | | | | | | |
Proceeds provided by stock
issuance under employee
stock plans | | | 13,654 | | | | 0 | | | | 0 | | | | 0 | | | | 13,654 | |
Excess tax benefits from
stock option exercises | | | 3,488 | | | | 0 | | | | 0 | | | | 0 | | | | 3,488 | |
Net change in credit facilities | | | 0 | | | | 0 | | | | (4,015 | ) | | | 0 | | | | (4,015 | ) |
Repayment of long-term debt | | | (182,029 | ) | | | (385 | ) | | | (668 | ) | | | 0 | | | | (183,082 | ) |
Proceeds from issuance
of long-term debt | | | 250,000 | | | | 0 | | | | 0 | | | | 0 | | | | 250,000 | |
Proceeds from government
assistance | | | 0 | | | | 0 | | | | 9,168 | | | | 0 | | | | 9,168 | |
Debt and other issuance costs | | | (4,719 | ) | | | 0 | | | | 0 | | | | 0 | | | | (4,719 | ) |
Dividends paid to
noncontrolling interest | | | 0 | | | | 0 | | | | (234 | ) | | | 0 | | | | (234 | ) |
Net change in intercompany
financing | | | (79,220 | ) | | | (126,284 | ) | | | 21,844 | | | | 183,660 | | | | 0 | |
| |
| | | 1,174 | | | | (126,669 | ) | | | 26,095 | | | | 183,660 | | | | 84,260 | |
| | | | | |
Effect of Foreign Exchange Rates
on Cash and Cash Equivalents | | | 0 | | | | 15 | | | | 1,969 | | | | 0 | | | | 1,984 | |
| |
| | | | | |
Net Increase (Decrease) in
Cash and Cash Equivalents | | | 157,143 | | | | (2,304 | ) | | | 90,487 | | | | 0 | | | | 245,326 | |
Cash and Cash Equivalents
– Beginning of Year | | | 47,907 | | | | 4,621 | | | | 124,266 | | | | 0 | | | | 176,794 | |
| |
Cash and Cash Equivalents
– End of Year | | $ | 205,050 | | | $ | 2,317 | | | $ | 214,753 | | | $ | 0 | | | $ | 422,120 | |
| |
82
Condensed Consolidating Statement of Operations for the fiscal year ended October 30, 2009
| | | | | | | | | | | | | | | | | | | | |
| In Thousands | | Parent | | | Guarantor Subsidiaries | | | Non- Guarantor Subsidiaries | | | Eliminations | | | Total | |
| | | | | |
Net Sales | | | $ 0 | | | | $ 761,270 | | | | $ 647,624 | | | | $ (1,435 | ) | | | $ 1,407,459 | |
Cost of Sales | | | 0 | | | | 512,090 | | | | 443,506 | | | | (1,435 | ) | | | 954,161 | |
| |
| | | 0 | | | | 249,180 | | | | 204,118 | | | | 0 | | | | 453,298 | |
Expenses | | | | | | | | | | | | | | | | | | | | |
Selling, general
and administrative | | | 0 | | | | 117,783 | | | | 117,700 | | | | 0 | | | | 235,483 | |
Research, development
and engineering | | | 0 | | | | 27,771 | | | | 36,685 | | | | 0 | | | | 64,456 | |
Other expense (income) | | | 4,202 | | | | 10,652 | | | | (6,884 | ) | | | 0 | | | | 7,970 | |
| |
Total Expenses | | | 4,202 | | | | 156,206 | | | | 147,501 | | | | 0 | | | | 307,909 | |
| | | | | |
Operating Earnings from
Continuing Operations | | | (4,202 | ) | | | 92,974 | | | | 56,617 | | | | 0 | | | | 145,389 | |
Interest income | | | (23,125 | ) | | | (3,717 | ) | | | (35,894 | ) | | | 61,102 | | | | (1,634 | ) |
Interest expense | | | 26,983 | | | | 23,925 | | | | 38,883 | | | | (61,102 | ) | | | 28,689 | |
| |
| | | | | |
Income (Loss) from Continuing
Operations Before Taxes | | | (8,060 | ) | | | 72,766 | | | | 53,628 | | | | 0 | | | | 118,334 | |
Income Tax | | | | | | | | | | | | | | | | | | | | |
Expense (Benefit) | | | (1,231 | ) | | | 1,331 | | | | 12,449 | | | | 0 | | | | 12,549 | |
| |
Income (Loss) From Continuing
Operations Including
Noncontrolling Interests | | | (6,829 | ) | | | 71,435 | | | | 41,179 | | | | 0 | | | | 105,785 | |
Income Attributable to
Noncontrolling Interests | | | 0 | | | | 0 | | | | (217 | ) | | | 0 | | | | (217 | ) |
| |
Income (Loss) From Continuing
Operations Attributable
to Esterline, Net of Tax | | | (6,829 | ) | | | 71,435 | | | | 40,962 | | | | 0 | | | | 105,568 | |
| | | | | |
Income From Discontinued
Operations Attributable to
Esterline, Net of Tax | | | 0 | | | | 14,230 | | | | 0 | | | | 0 | | | | 14,230 | |
Equity in Net Income of
Consolidated Subsidiaries | | | 126,627 | | | | 22,717 | | | | 5,733 | | | | (155,077 | ) | | | 0 | |
| |
Net Earnings (Loss) | | | | | | | | | | | | | | | | | | | | |
Attributable to Esterline | | | $ 119,798 | | | | $ 108,382 | | | | $ 46,695 | | | | $ (155,077 | ) | | | $ 119,798 | |
| |
83
Condensed Consolidating Statement of Cash Flows for the fiscal year ended October 30, 2009
| | | | | | | | | | | | | | | | | | | | |
| In Thousands | | Parent | | | Guarantor Subsidiaries | | | Non- Guarantor Subsidiaries | | | Eliminations | | | Total | |
| | | | | |
Cash Flows Provided (Used)
by Operating Activities | | | | | | | | | | | | | | | | | | | | |
Net earnings (loss) including
noncontrolling interests | | $ | 119,798 | | | $ | 108,382 | | | $ | 46,912 | | | $ | (155,077 | ) | | $ | 120,015 | |
Depreciation & amortization | | | 0 | | | | 30,667 | | | | 40,844 | | | | 0 | | | | 71,511 | |
Deferred income tax | | | (7,128 | ) | | | (1,536 | ) | | | (2,804 | ) | | | 0 | | | | (11,468 | ) |
Share-based compensation | | | 0 | | | | 3,728 | | | | 3,621 | | | | 0 | | | | 7,349 | |
Gain on sale of
discontinued operations | | | 0 | | | | (26,481 | ) | | | 0 | | | | 0 | | | | (26,481 | ) |
Working capital changes, net
of effect of acquisitions | | | | | | | | | | | | | | | | | | | | |
Accounts receivable | | | 205 | | | | 10,487 | | | | 43,854 | | | | 0 | | | | 54,546 | |
Inventories | | | 0 | | | | 10,273 | | | | (4,219 | ) | | | 0 | | | | 6,054 | |
Prepaid expenses | | | 26 | | | | (273 | ) | | | (3,643 | ) | | | 0 | | | | (3,890 | ) |
Other current assets | | | 0 | | | | 0 | | | | (15,428 | ) | | | 0 | | | | (15,428 | ) |
Accounts payable | | | 68 | | | | (7,854 | ) | | | (11,001 | ) | | | 0 | | | | (18,787 | ) |
Accrued liabilities | | | (2,642 | ) | | | (7,726 | ) | | | (1,565 | ) | | | 0 | | | | (11,933 | ) |
Federal & foreign
income taxes | | | (8,969 | ) | | | 9,448 | | | | 258 | | | | 0 | | | | 737 | |
Other liabilities | | | 2,928 | | | | (12,038 | ) | | | 1,447 | | | | 0 | | | | (7,663 | ) |
Other, net | | | 1 | | | | 2,102 | | | | (9,996 | ) | | | 0 | | | | (7,893 | ) |
| |
| | | 104,287 | | | | 119,179 | | | | 88,280 | | | | (155,077 | ) | | | 156,669 | |
| | | | | |
Cash Flows Provided (Used)
by Investing Activities | | | | | | | | | | | | | | | | | | | | |
Purchases of capital assets | | | (213 | ) | | | (36,459 | ) | | | (22,512 | ) | | | 0 | | | | (59,184 | ) |
Proceeds from sale of
discontinued operations,
net of cash | | | 0 | | | | 62,944 | | | | 0 | | | | 0 | | | | 62,944 | |
Proceeds from sale of
capital assets | | | 0 | | | | 705 | | | | 384 | | | | 0 | | | | 1,089 | |
Acquisitions of businesses,
net of cash acquired | | | 0 | | | | (89,812 | ) | | | (165,394 | ) | | | 0 | | | | (255,206 | ) |
| |
| | | (213 | ) | | | (62,622 | ) | | | (187,522 | ) | | | 0 | | | | (250,357 | ) |
84
Condensed Consolidating Statement of Cash Flows for the fiscal year ended October 30, 2009
| | | | | | | | | | | | | | | | | | | | |
| In Thousands | | Parent | | | Guarantor Subsidiaries | | | Non- Guarantor Subsidiaries | | | Eliminations | | | Total | |
| | | | | |
Cash Flows Provided (Used)
by Financing Activities | | | | | | | | | | | | | | | | | | | | |
Proceeds provided by stock
issuance under employee
stock plans | | | 3,137 | | | | 0 | | | | 0 | | | | 0 | | | | 3,137 | |
Excess tax benefits from
stock option exercises | | | 119 | | | | 0 | | | | 0 | | | | 0 | | | | 119 | |
Net change in credit facilities | | | 0 | | | | 0 | | | | 99 | | | | 0 | | | | 99 | |
Repayment of long-term debt | | | (33,019 | ) | | | (740 | ) | | | (685 | ) | | | 0 | | | | (34,444 | ) |
Proceeds from issuance
of long-term debt | | | 125,000 | | | | 0 | | | | 0 | | | | 0 | | | | 125,000 | |
Proceeds from government
assistance | | | 0 | | | | 0 | | | | 11,145 | | | | 0 | | | | 11,145 | |
Debt and other issuance costs | | | (1,258 | ) | | | 0 | | | | 0 | | | | 0 | | | | (1,258 | ) |
Dividends paid to
noncontrolling interests | | | 0 | | | | 0 | | | | (283 | ) | | | 0 | | | | (283 | ) |
Net change in intercompany
financing | | | (231,030 | ) | | | (72,854 | ) | | | 148,807 | | | | 155,077 | | | | 0 | |
| |
| | | (137,051 | ) | | | (73,594 | ) | | | 159,083 | | | | 155,077 | | | | 103,515 | |
| | | | | |
Effect of Foreign Exchange Rates
on Cash and Cash Equivalents | | | 0 | | | | (255 | ) | | | 6,577 | | | | 0 | | | | 6,322 | |
| |
| | | | | |
Net Increase (Decrease) in
Cash and Cash Equivalents | | | (32,977 | ) | | | (17,292 | ) | | | 66,418 | | | | 0 | | | | 16,149 | |
Cash and Cash Equivalents
– Beginning of Year | | | 80,884 | | | | 21,913 | | | | 57,848 | | | | 0 | | | | 160,645 | |
| |
Cash and Cash Equivalents
– End of Year | | $ | 47,907 | | | $ | 4,621 | | | $ | 124,266 | | | $ | 0 | | | $ | 176,794 | |
| |
85
Report of Independent Registered Public Accounting Firm
The Board of Directors and Shareholders
Esterline Technologies Corporation
We have audited the accompanying consolidated balance sheets of Esterline Technologies Corporation as of October 28, 201125, 2013, and October 29, 2010,26, 2012, and the related consolidated statements of operations, shareholders’ equity, noncontrolling interests and comprehensive income, (loss), and cash flows for each of the three years in the period ended October 28, 2011.25, 2013. Our audits also included the financial statement schedule listed in the Index at Item 15(a)(2). These financial statements and schedule are the responsibility of the Company’s management. Our responsibility is to express an opinion on these financial statements and schedule based on our audits.
We conducted our audits in accordance with the standards of the Public Company Accounting Oversight Board (United States). Those standards require that we plan and perform the audit to obtain reasonable assurance about whether the financial statements are free of material misstatement. An audit includes examining, on a test basis, evidence supporting the amounts and disclosures in the financial statements. An audit also includes assessing the accounting principles used and significant estimates made by management, as well as evaluating the overall financial statement presentation. We believe that our audits provide a reasonable basis for our opinion.
In our opinion, the financial statements referred to above present fairly, in all material respects, the consolidated financial position of Esterline Technologies Corporation at October 28, 2011 and October 29, 2010,25, 2013, and the consolidated results of its operations and its cash flows for each of the three years in the period ended October 28, 2011,25, 2013, in conformity with U.S. generally accepted accounting principles. Also, in our opinion, the related financial statement schedule, when considered in relation to the basic financial statements taken as a whole, presents fairly in all material respects the information set forth therein.
As discussed in Note 10 to the financial statements, in 2010 the Company changed its method of accounting for business combination transactions upon the adoption of Financial Accounting Standards Board ASC Topic 805.
We also have audited, in accordance with the standards of the Public Company Accounting Oversight Board (United States), Esterline Technologies Corporation’s internal control over financial reporting as of October 28, 2011,25, 2013, based on criteria established in Internal Control-Integrated Framework issued by the Committee of Sponsoring Organizations of the Treadway Commission (1992 framework) and our report dated December 23, 201120, 2013, expressed an unqualified opinion thereon.
/s/ Ernst & Young LLP
Seattle, Washington
December 23, 2011
20, 2013
8688
Report of Independent Registered Public Accounting Firm
The Board of Directors and Shareholders
Esterline Technologies Corporation
We have audited Esterline Technologies CorporationCorporation’s internal control over financial reporting as of October 28, 2011,25, 2013, based on criteria established in Internal Control—Integrated Framework issued by the Committee of Sponsoring Organizations of the Treadway Commission (1992 framework) (the COSO criteria). Esterline Technologies Corporation’s management is responsible for maintaining effective internal control over financial reporting, and for its assessment of the effectiveness of internal control over financial reporting included in the accompanying Management’s Report on Internal Control Over Financial Reporting. Our responsibility is to express an opinion on the company’s internal control over financial reporting based on our audit.
We conducted our audit in accordance with the standards of the Public Company Accounting Oversight Board (United States). Those standards require that we plan and perform the audit to obtain reasonable assurance about whether effective internal control over financial reporting was maintained in all material respects. Our audit included obtaining an understanding of internal control over financial reporting, assessing the risk that a material weakness exists, testing and evaluating the design and operating effectiveness of internal control based on the assessed risk, and performing such other procedures as we considered necessary in the circumstances. We believe that our audit provides a reasonable basis for our opinion.
A company’s internal control over financial reporting is a process designed to provide reasonable assurance regarding the reliability of financial reporting and the preparation of financial statements for external purposes in accordance with generally accepted accounting principles. A company’s internal control over financial reporting includes those policies and procedures that (1) pertain to the maintenance of records that, in reasonable detail, accurately and fairly reflect the transactions and dispositions of the assets of the company; (2) provide reasonable assurance that transactions are recorded as necessary to permit preparation of financial statements in accordance with generally accepted accounting principles, and that receipts and expenditures of the company are being made only in accordance with authorizations of management and directors of the company; and (3) provide reasonable assurance regarding prevention or timely detection of unauthorized acquisition, use or disposition of the company’s assets that could have a material effect on the financial statements.
Because of its inherent limitations, internal control over financial reporting may not prevent or detect misstatements. Also, projections of any evaluation of effectiveness to future periods are subject to the risk that controls may become inadequate because of changes in conditions, or that the degree of compliance with the policies or procedures may deteriorate.
As indicated in the accompanying Management’s Report on Internal Control Over Financial Reporting, management’s assessment of and conclusion on the effectiveness of internal control over financial reporting did not include the internal controls of Eclipse Electronic Systems (Eclipse) and the Souriau Group (Souriau)Gamesman Limited (Gamesman), which areis included in the 20112013 consolidated financial statements of Esterline Technologies Corporation. EclipseCorporation and constituted $149$56.0 million and $110.7$38.6 million of total and net assets, respectively, as of October 28, 2011,25, 2013, and $37.6$24.0 million and $5.8$1.6 million of revenues and net income, respectively, for the year then ended. Souriau constituted $892 million and $704 million of total and net assets, respectively, as of October 28, 2011, and $77.9 million and $19.2 million of revenues and net loss, respectively, for the year then ended. Our audit of internal control over financial reporting of Esterline Technologies Corporation also did not include an evaluation of the internal control over financial reporting of Eclipse and the Souriau.Gamesman.
In our opinion, Esterline Technologies Corporation maintained, in all material respects, effective internal control over financial reporting as of October 28, 2011,25, 2013, based ontheon the COSO criteria.criteria.
We also have audited, in accordance with the standards of the Public Company Accounting Oversight Board (United States), the accompanying consolidated balances sheets of Esterline Technologies Corporation as of October 28, 2011 and October 29, 2010,25, 2013 , and the related consolidated statements of operations, shareholders’ equity, noncontrolling interests and comprehensive income, (loss), and cash flows for each of the three years in the period ended October 28, 201125, 2013, of Esterline Technologies Corporation and our report dated December 23, 201120, 2013, expressed an unqualified opinion thereon.
/s/ Ernst & Young LLP
Seattle, Washington
December 23, 2011
20, 2013
8789
Item 9. Changes in and Disagreements with Accountants on Accounting and Financial Disclosure
None.
Item 9A. Controls and Procedures
Disclosure Controls and Procedures
Our principal executive and financial officers evaluated our disclosure controls and procedures (as defined in Rules 13a-15(e) and 15d-15(e) under the Exchange Act) as of October 28, 2011.25, 2013. Based upon that evaluation, they concluded as of October 28, 2011,25, 2013, that our disclosure controls and procedures were effective to ensure that information we are required to disclose in the reports that we file under the Exchange Act is recorded, processed, summarized and reported within time periods specified in Securities and Exchange Commission rules and forms. In addition, our principal executive and financial officers concluded as of October 28, 2011,25, 2013, that our disclosure controls and procedures are also effective to ensure that information required to be disclosed in reports that we file or submit under the Exchange Act is accumulated and communicated to our management, including our chief executive officer and chief financial officer, to allow timely decisions regarding required disclosure.
Management’s Report on Internal Control Overover Financial Reporting
Our management is responsible for establishing and maintaining adequate internal control over financial reporting as defined in Rules 13a-15(f) and 15d-15(f) under the Securities Exchange Act of 1934. Our internal control system over financial reporting is designed by, or under the supervision of, our chief executive officer and chief financial officer, and is effected by our board of directors, management and other personnel to provide reasonable assurance regarding the reliability of financial reporting and the preparation of financial statements for external purposes in accordance with generally accepted accounting principles. Our internal control over financial reporting includes those policies and procedures that:
(i) pertain to the maintenance of records that, in reasonable detail, accurately and fairly reflect the assets of the company;
(ii) provide reasonable assurance that transactions are recorded as necessary to permit preparation of financial statements in accordance with U.S. generally accepted accounting principles and that transactions are made only in accordance with the authorization of our management and directors; and
(iii) provide reasonable assurance regarding prevention or timely detection of unauthorized transactions that could have a material effect on the financial statements.
Because of inherent limitations, internal control over financial reporting may not prevent or detect misstatements. Therefore, even those systems determined to be effective can provide only reasonable assurance with respect to financial statement preparation and presentation. Also, projections of any evaluation of effectiveness to future periods are subject to risk that controls may become inadequate because of changes in condition, or that the degree of compliance with the policies or procedures may deteriorate.
Our management assessed the effectiveness of Esterline’s internal control over financial reporting as of October 28, 2011.25, 2013. In making this assessment, our management used the criteria set forth by the Committee of Sponsoring Organizations of the Treadway Commission (COSO) in Internal Control-Integrated Framework.Framework (1992 framework). On December 30, 2010,February 4, 2013, the Company completed the acquisition of Eclipse Electronic Systems (Eclipse), and on July 26, 2011, the Company also completed the acquisition of the Souriau Group (Souriau)Gamesman Limited (Gamesman). As permitted by applicable guidelines established by the Securities and Exchange Commission, our management excluded the Eclipse and SouriauGamesman operations from its assessment of internal control over financial reporting as of October 28, 2011. Eclipse25, 2013. Gamesman constituted $149 million and $110.7 millionapproximately 1.80 percent of total and net assets respectively, as of October 28, 2011,25, 2013, and $37.6 million and $5.8 million1.22 percent of revenues and net income, respectively,total sales for the year then ended. Souriau constituted $892 million and $704 million of total and net assets, respectively, as of October 28, 2011, and $77.9 million and $19.2 million of revenues and net loss, respectively, for the year then ended. Both Eclipse and SouriauGamesman will be included in the Company’s assessment for the fiscal year ending October 26, 2012.31, 2014. Based on management’s assessment and those criteria, our management concluded that our internal control over financial reporting was effective as of October 28, 2011.25, 2013.
Our independent registered public accounting firm, Ernst & Young LLP, has issued an audit report on the effectiveness of internal control over financial reporting. This report appears on page 87.
89.
88
|
/s/ R. Bradley LawrenceCurtis C. Reusser |
R. Bradley LawrenceCurtis C. Reusser |
Director, President and Chief Executive Officer
|
(Principal Executive Officer) |
90
|
/s/ Robert D. George |
Robert D. George |
Vice President, Chief Financial Officer and |
Corporate Development and Secretary |
(Principal Financial Officer) |
|
|
/s/ Gary J. Posner |
Gary J. Posner |
| Corporate Controller and Chief Accounting Officer |
(Principal Accounting Officer) |
Changes in Internal Control Over Financial Reporting
During the three months ended October 28, 2011,25, 2013, there were no changes in our internal control over financial reporting that materially affected, or are reasonably likely to materially affect, our internal control over financial reporting.
Item 9B. Other Information
None.Disclosure Pursuant to Section 13(r) of the Securities Exchange Act of 1934
Section 219 of the Iran Threat Reduction and Syria Human Rights Act of 2012 added Section 13(r) to the Securities Exchange Act of 1934, as amended. Section 13(r) requires us to disclose whether we or any of our affiliates knowingly engaged in certain activities, transactions, or dealings relating to Iran or with any person the property and interests in property of which are blocked pursuant to Executive Order Nos. 132224 or 13382 (relating to blocking property and prohibiting transactions with: (i) persons who commit, threat to commit, or support terrorism; and (ii) weapons of mass destruction proliferators and their supporters).
CMC Electronics Inc. (“CMC”), one of our Canadian subsidiaries, sells subscriptions to a navigation database that is used in the flight-management systems it manufactures and sells for use in airplanes and other aircraft. The navigation database is updated approximately once a month, and the updates are automatically made available electronically to CMC’s subscribing customers in an email notification. Customers may download the updates using instructions provided in the email.
In March 2013, CMC quoted and provided a one-year subscription to the navigation database to Ukrainian-Mediterranean Airlines (“UM Air”) for use in flight-management systems installed in UM Air’s fleet of MD-83 aircraft. CMC received $8,814 from UM Air in March 2013 for that subscription. On May 31, 2013, the Office of Foreign Assets Control of the U.S. Department of the Treasury designated UM Air as a Specially Designated Global Terrorist (“SDGT”) pursuant to Executive Order No. 132224. On June 19, 2013, in accordance with the pre-existing subscription agreement, CMC’s system automatically delivered an email notification to UM Air containing instructions on how to download the latest update to the navigation database, and UM Air downloaded the update. Within 4 days thereafter, CMC ran its periodic prohibited party screening of its customer base and discovered that UM Air had been designated as an SDGT. CMC promptly stopped UM Air from downloading further updates to its navigation database, and ceased any further transactions with UM Air. The net profit on the subscription sold to UM Air was $6,027. CMC has not engaged in any activity with UM Air since June 19, 2013, and CMC does not intend to conduct further transactions with UM Air, including under the subscription agreement. CMC has also enhanced its customer screening practices to more timely identify and address such issues in the future.
8991
PART III
Item 10. Directors and Executive Officers of the Registrant
We hereby incorporate by reference the information set forth under “Election of Directors,” “Section 16(a) Beneficial Ownership Reporting Compliance,” “Code of Ethics,” “Other Information as to Directors – Board and Board Committees,” and “Other Information as to Directors – Director Nominations and Qualifications” in the definitive form of the Company’s Proxy Statement, relating to its Annual Meeting of Shareholders to be held on March 7, 2012.5, 2014.
Information regarding our executive officers required by this item appears in Item 1 of this report under “Executive Officers of the Registrant.”
Item 11. Executive Compensation
We hereby incorporate by reference the information set forth under “Other Information as to Directors – Director Compensation,” “Executive Compensation – Compensation Discussion and Analysis,” “Compensation Committee Report” and “Compensation Committee Interlocks and Insider Participation” in the definitive form of the Company’s Proxy Statement, relating to its Annual Meeting of Shareholders to be held on March 7, 2012.5, 2014.
Item 12. Security Ownership of Certain Beneficial Owners and Management and Related Stockholder Matters
We hereby incorporate by reference the information set forth under “Security Ownership of Certain Beneficial Owners and Management” and “Equity Compensation Plan Information” in the definitive form of the Company’s Proxy Statement, relating to its Annual Meeting of Shareholders to be held on March 7, 2012.5, 2014.
Item 13. Certain Relationships and Related Transactions, and Director Independence
We hereby incorporate by reference the information set forth under “Certain Relationships and Related Transactions” and “Other Information as to Directors – Board and Board Committees” in the definitive form of the Company’s Proxy Statement, relating to its Annual Meeting of Shareholders to be held on March 7, 2012.5, 2014.
Item 14. Independent Registered Public Accounting Firm Fees and Services
We hereby incorporate by reference the information set forth under “Independent Registered Public Accounting Firm’s Fees” in the definitive form of the Company’s Proxy Statement relating to the Annual Meeting of Shareholders to be held on March 7, 2012.
5, 2014.
9092
PART IV
Item 15. Exhibits and Financial Statement Schedules
(a)(1) Financial Statements.
Our Consolidated Financial Statements are as set forth under Item 8 of this report on Form 10-K.
(a)(2) Financial Statement Schedules.
The following consolidated financial statement schedule of the Company is included as follows:
ESTERLINE TECHNOLOGIES CORPORATION AND SUBSIDIARIES
SCHEDULE II – VALUATION AND QUALIFYING ACCOUNTS
(In Thousands)
| | | 000000000 | | | | 000000000 | | | | 000000000 | | | | 000000000 | | | | 000000000 | | | | | | | | | | | | | | | | | | | | | |
Reserve for Doubtful Accounts Receivable | | Balance at
Beginning
of Year | | | Charged
to Costs &
Expenses | | | Other 1 | | | Deductions | | Balance
at End
of Year | | | Balance at
Beginning
of Year | | | Charged
to Costs &
Expenses | | | Other 1 | | | Deductions 2 | | | Balance
at End
of Year | |
| Fiscal Years | | | | | | | | | | | | | | | | | | | | |
| 2013 | | | $ | 9,029 | | | $ | 981 | | | $ | 0 | | | $ | (795 | ) | | $ | 9,215 | |
| | | | | | | | | | | | | | | | |
| 2012 | | | $ | 7,063 | | | $ | 4,343 | | | $ | 0 | | | $ | (2,377 | ) | | $ | 9,029 | |
| | | | | | | | | | | | | | | | |
| 2011 | | $ | 4,865 | | | $ | 1,407 | | | $ | 1,081 | | | $ | (290 | )2 | | $ | 7,063 | | | $ | 4,865 | | | $ | 1,407 | | | $ | 1,081 | | | $ | (290 | ) | | $ | 7,063 | |
| | | | | | | | | | | | | | | | | | | | | | | | | | | | | | |
| 2010 | | $ | 5,297 | | | $ | 644 | | | $ | 0 | | | $ | (1,076 | )2 | | $ | 4,865 | | |
| | | | | | | | | | | | | | | | |
| 2009 | | $ | 5,191 | | | $ | 738 | | | $ | 3 | | | $ | (635 | )2 | | $ | 5,297 | | |
| | | | | | | | | | | | | | | | |
| 1 | Acquisition-related addition. |
| 2 | Uncollectible accounts written off, net of recoveries. |
All other schedules for which provision is made in the applicable accounting regulations of the Securities and Exchange Commission are not required under the related instructions or are inapplicable and therefore have been omitted.
(a)(3) Exhibits.
See Exhibit Index on pages 94-99.
96-101.
9193
SIGNATURES
Pursuant to the requirements of Section 13 or 15(d) of the Securities Exchange Act of 1934, the Company has duly caused this report to be signed on its behalf by the undersigned, thereunto duly authorized.
| | | | | | |
| | ESTERLINE TECHNOLOGIES CORPORATION | | |
| | | | (Registrant) | | |
| | | |
| | By | | /s/ Robert D. George | | |
| | | | Robert D. George |
| | Chief Financial Officer, |
| | | | Vice President, and | | |
| | | | Chief Financial Officer,Corporate Development | | |
| | | | Corporate Development and Secretary | | |
| | | | (Principal Financial Officer) | | |
Dated: December 23, 201120, 2013
Pursuant to the requirements of the Securities Exchange Act of 1934, this Report has been signed below by the following persons on behalf of the Registrant and in the capacities and on the dates indicated.
| | | | | | | | |
| | | | |
/s/ R. Bradley LawrenceCurtis C. Reusser (Curtis C. Reusser) | | | | Director, President and | | Chief Executive Officer December 23, 2011 (Principal Executive Officer)
|
(R. Bradley Lawrence) | | | | Chief Executive Officer | | December 20, 2013 Date |
| | | | (Principal Executive Officer) | | |
| | | |
/s/ Robert D. George (Robert D. George) | | | | Chief Financial Officer, Vice President | |
and Corporate DevelopmentDecember 23, 2011 (Principal Financial Officer)
|
(Robert D. George) | | | | Chief Financial Officer, | | December 20, 2013 Date |
| | | | Corporate Development and Secretary | | |
| | | | (Principal Financial Officer) | | |
| | | |
/s/ Gary J. Posner (Gary J. Posner) | | | | Corporate Controller and | | December 23, 2011Chief Accounting Officer
|
(Gary J. Posner)Principal Accounting Officer) | | | | Chief Accounting Officer | | December 20, 2013 Date |
| | | | (Principal Accounting Officer) | | |
| | | |
/s/ Robert W. CreminR. Bradley Lawrence (R. Bradley Lawrence) | | | | Executive Chairman | | December 23, 2011
|
(Robert W. Cremin) | | | | | | December 20, 2013 Date |
| | | |
/s/ Lewis E. Burns
| | | | Director | | December 23, 2011
|
(Lewis E. Burns) | | | | | | Date |
| | | |
/s/ John F. Clearman
| | | | Director | | December 23, 2011
|
(John F. Clearman) | | | | | | Date |
| | | |
/s/ Delores M. Etter (Delores M. Etter) | | | | Director | | | | December 23, 201120, 2013 Date |
(Delores M. Etter) | | | | | | Date |
| | | |
/s/ Anthony P. Franceschini (Anthony P. Franceschini) | | | | Director | | December 23, 2011
|
(Anthony P. Franceschini) | | | | | | December 20, 2013 Date |
92
| | | | | | |
/s/ Paul V. Haack (Paul V. Haack) | | | | Director | | | | December 23, 2011 20, 2013 Date |
(Paul V. Haack) | | | | | | Date |
| | | |
/s/ Mary L. Howell (Mary L. Howell) | | | | Director | | | | December 23, 201120, 2013 Date |
94
| | | | | | | | |
/s/ Scott E. Kuechle (Mary L. Howell)Scott E. Kuechle) | | | | Director | | | | December 20, 2013 Date |
| | | | |
/s/ Jerry D. Leitman (Jerry D. Leitman) | | | | Director | | December 23, 2011
|
(Jerry D. Leitman) | | | | | | December 20, 2013 Date |
| | | | |
/s/ James J. Morris (James J. Morris) | | | | Director | | December 23, 2011
|
(James J. Morris) | | | | | | December 20, 2013 Date |
| | | | |
/s/ Gary E. Pruitt (Gary E. Pruitt) | | | | Director | | December 23, 2011
|
(Gary E. Pruitt) | | | | December 20, 2013 Date |
| | | | |
/s/ Henry W. Winship (Henry W. Winship) | | | | Director | | | | December 20, 2013 Date |
9395
| | |
Exhibit
Number
| | Exhibit Index |
| |
3.1 | | Restated Certificate of Incorporation for Esterline Technologies Corporation, dated June 6, 2002. (Incorporated by reference to Exhibit 3.1 to the Company’s Quarterly Report on Form 10-Q for the quarter ended April 26, 2002 [Commission File Number 1-6357], with Form of Certificate of Designation, dated December 11, 2002.) (Incorporated by reference to Exhibit 4.1 to Esterline’s Registration of Securities on Form 8-A filed December 12, 2002 [Commission File Number 1-6357].) |
| |
3.2 | | Amended and Restated By-laws of the Company, effective December 10, 2009.13, 2012. (Incorporated by reference to Exhibit 3.23.1 to the Company’s Current Report on Form 8-K filed on December 16, 200918, 2012 [Commission File Number 1-6357].) |
| |
4.1 | | Rights Agreement dated as of December 11, 2002, between Esterline Technologies Corporation and Mellon Investor Services LLC, as Rights Agent, which includes as Exhibit A the Form of Certificate of Designation of Series B Serial Preferred Stock, as Exhibit B the Form of Rights Certificate and as Exhibit C the Summary of Rights to Purchase Preferred Shares. (Incorporated by reference to Exhibit 4.1 to the Company’s Registration Statement on Form 8-A, as amended, filed on December 12, 2002 [Commission File Number 1-6357].) |
| |
4.2
| | Indenture relating to Esterline Technologies Corporation’s 7.75% Senior Subordinated Notes due 2013, dated as of June 11, 2003. (Incorporated by reference to Exhibit 4.1 to the Company’s Quarterly Report on Form 10-Q for the quarter ended August 1, 2003 [Commission File Number 1-6357].) |
| |
4.3
| | Form of Exchange Note for the 7.75% Senior Subordinated Notes due 2013. (Incorporated by reference to Exhibit 4.3 to the Company’s Form S-4, as amended, filed on September 30, 2003 [Commission File Number 333-109325].) |
| |
4.4
| | Registration Rights Agreement among Esterline Technologies Corporation, its subsidiaries listed on Schedule 1 thereto, Wachovia Capital Markets, LLC, Banc of Americas Securities LLC, KeyBanc Capital Markets, a division of McDonald Investments and Wells Fargo Securities, LLC, dated March 1, 2007 (“2007 Registration Rights Agreement”). (Incorporated by reference to Exhibit 10.47 to the Company’s Current Report on Form 8-K filed on March 7, 2007 [Commission File Number 1-6357].) |
| |
4.5
| | Indenture relating to Esterline Technologies Corporation’s 6.625% Senior Notes due 2017, dated as of March 1, 2007. (Incorporated by reference to Exhibit 4.2 to the Company’s Current Report on Form 8-K filed on March 7, 2007 [Commission File Number 1-6357].) |
| |
4.6
| | Form of Exchange Note for the 6.625% Senior Notes due 2017. (Incorporated by reference to Exhibit 4.3 to the Company’s Registration Statement on Form S-4 filed on June 29, 2007 [Commission File Number 333-144161].) |
| |
4.7
| | Supplemental Indenture, relating to Esterline Technologies Corporation’s 7.75% Senior Subordinated Notes due 2013, dated as of June 27, 2007. (Incorporated by reference to Exhibit 4.1 to the Company’s Current Report on Form 8-K filed on June 28, 2007 [Commission File Number 1-6357].) |
| |
4.8
| | Amendment dated as of July 31, 2007 to 2007 Registration Rights Agreement. (Incorporated by reference to Exhibit 4.5 to the Company’s Registration Statement on Form S-4/A filed on August 6, 2007 [Commission File Number 333-144161].) |
| |
4.9
| | Supplemental Indenture, relating to Esterline Technologies Corporation’s 6.625% Senior Notes due 2017, dated as of July 26, 2007. (Incorporated by reference to Exhibit 4.4 to the Company’s Registration Statement on Form S-4/A filed on August 6, 2007 [Commission File Number 333-144161].) |
| |
4.10
| | Registration Rights Agreement among Esterline Technologies Corporation, its subsidiaries listed on the signature pages thereto, Banc of America Securities LLC, as representative of the initial purchasers party thereto, dated August 2, 2010. (Incorporated by reference to Exhibit 4.2 to the Company’s Current Report on Form 8-K filed on August 2, 2010 [Commission File Number 1-6357].) |
94
| | |
Exhibit
Number
| | Exhibit Index
|
| |
4.11
| | Indenture relating to Esterline Technologies Corporation’s 7% Senior Notes due 2020, dated as of August 2, 2010. (Incorporated by reference to Exhibit 4.1 to the Company’s Current Report on Form 8-K filed on August 2, 2010 [Commission File Number 1-6357].) |
| |
4.12
4.2 | | Supplemental Indenture, relating to Esterline Technologies Corporation’s 7% Senior Notes due 2020, dated as of August 2, 2010. (Incorporated by reference to Exhibit 4.3 to the Company’s Current Report on Form 8-K filed on August 2, 2010 [Commission File Number 1-6357].) |
| |
4.13
10.1 | | Form of Exchange Note for the 7% Senior Notes due 2020. (Incorporated by reference to Exhibit 4.3 to the Company’s Registration Statement on Form S-4 filed on October 19, 2010 [Commission File Number 333-170032].) |
| |
10.1
| | ThirdFourth Amendment to Credit Agreement, dated as of July 20, 2011,April 8, 2013, among Esterline Technologies Corporation, the Guarantors, Wells Fargo Bank, National Association, as Administrative Agent, and the lenders and other parties thereto. (Incorporated by reference to Exhibit 10.1 to the Company’s Current Report on Form 8-K filed July 26, 2011April 9, 2013 [Commission File Number 1-6357].) |
| |
10.2* | | Summary of Non-Employee Director Compensation for Services on the Board of Directors of Esterline Technologies Corporation. (Incorporated by reference to Exhibit 10.3 to the Company’s Quarterly Report on Form 10-Q for the quarter ended January 29, 2010 [Commission File Number 1-6357].) |
| |
10.3*
| | Esterline Technologies Corporation Supplemental Retirement Income Plan. (Incorporated by reference to Exhibit 10.15 to the Company’s Annual Report on Form 10-K for the year ended October 27, 2006 [Commission File Number 1-6357].) |
| |
10.4*
10.3* | | Esterline Technologies Corporation Long-Term Incentive Plan.Plan, for fiscal years 2013 – 2015. (Incorporated by reference to Exhibit 10.2 to the Company’s Quarterly Report on Form 10-Q for the quarter ended January 28, 201125, 2013 [Commission File
Number 1-6357].) |
| |
10.5*
10.4* | | Esterline Technologies Corporation Fiscal Year 2011 AnnualLong-Term Incentive Compensation Plan.Plan, for fiscal years 2012 – 2014. (Incorporated by reference to Exhibit 10.110.2 to the Company’s Quarterly Report on Form 10-Q for the quarter ended January 27, 2012 [Commission File Number 1-6357].) |
| |
| 10.5* | | Esterline Technologies Corporation Long-Term Incentive Plan, for fiscal years 2011 – 2013. (Incorporated by reference to Exhibit 10.2 to the Company’s Quarterly Report on Form 10-Q for the quarter ended January 28, 2011 [Commission File Number 1-6357].) |
| |
10.6* | | Esterline Technologies Corporation Fiscal Year 2013 Annual Incentive Compensation Plan. (Incorporated by reference to Exhibit 10.1 to the Company’s Quarterly Report on Form 10-Q for the quarter ended January 25, 2013 [Commission File Number 1-6357].) |
| |
| 10.7* | | Esterline Technologies Supplemental Executive Retirement and Deferred Compensation Plan. (Incorporated by reference to Exhibit 10.43 to the Company’s Annual Report on Form 10-K for the year ended October 27, 2006 [Commission File Number 1-6357].) |
96
| | |
Exhibit
Number | | Exhibit Index |
| |
10.7*
10.8* | | Esterline Technologies Corporation 2002 Employee Stock Purchase Plan, as amended on March 3, 2010. (Incorporated by reference to Annex B of the Registrant’s Definitive Proxy Statement on Schedule 14A, filed on January 22, 2010 [Commission File Number 1-6357].) |
| |
10.8*
10.9* | | Esterline Technologies Corporation 2004 Equity Incentive Plan, as amended on March 3, 2010. (Incorporated by reference to Annex A of the Registrant’s Definitive Proxy Statement on Schedule 14A, filed on January 22, 2010 [Commission File Number 1-6357].) |
| |
10.9*
10.10* | | Esterline Technologies Corporation 2013 Equity Incentive Plan. (Incorporated by reference to Annex A of the Registrant’s Definitive Proxy Statement on Schedule 14A, filed on January 25, 2013 [Commission File Number 1-6357].) |
| |
| 10.11* | | Form of Global Stock Option Agreement.Agreement for Esterline Technologies Corporation Amended and Restated 2004 Equity Incentive Plan. (Incorporated by reference to Exhibit 10.36a10.3 to the Company’s Quarterly Report on Form 10-Q for the quarter ended January 28, 200525, 2013 [Commission File Number 1-6357].) |
| |
10.10*
10.12* | | Form of Restricted Stock Unit Option Agreement for Esterline Technologies Corporation Amended and Restated 2004 Equity Incentive Plan. (Incorporated by reference to Exhibit 10.4 to the Company’s Quarterly Report on Form 10-Q for the quarter ended January 25, 2013 [Commission File Number 1-6357].) |
| |
| 10.13* | | Form of Global Stock Option Agreement for Esterline Technologies Corporation 2013 Equity Incentive Plan. |
| |
| 10.14* | | Form of Restricted Stock Unit Options Agreement for Esterline Technologies Corporation 2013 Equity Incentive Plan. |
| |
| 10.15* | | Restricted Stock Unit Agreement between Robert D. George and Esterline Technologies Corporation dated September 11, 2013. |
| |
| 10.16* | | Restricted Stock Unit Agreement between Alain M. Durand and Esterline Technologies Corporation dated September 11, 2013. |
| |
| 10.17* | | Restricted Stock Unit Agreement between Albert S. Yost and Esterline Technologies Corporation dated September 11, 2013. |
| |
| 10.18* | | Restricted Stock Unit Agreement between Curtis C. Reusser and Esterline Technologies Corporation dated October 28, 2013. |
| |
| 10.19* | | Executive Officer Termination Protection Agreement. (Incorporated by reference to Exhibit 10.19 to the Company’s Annual Report on Form 10-K for the year ended October 28, 2005 [Commission File Number 1-6357].) |
95
| | |
Exhibit
Number
| | Exhibit Index
|
| |
10.11*
10.20* | | Offer Letter from Esterline Technologies Corporation to Frank Houston dated March 4, 2005. (Incorporated by reference to Exhibit 10.19e to the Company’s Current Report on Form 8-K dated March 29, 2005 [Commission File Number 1-6357].) |
| |
10.12*
10.21* | | Offer Letter from Esterline Technologies Corporation to Brad Lawrence dated December 11, 2006. (Incorporated by reference to Exhibit 10.19f to the Company’s Current Report on Form 8-K dated January 23, 2007 [Commission File Number 1-6357].) |
| |
| 10.22* | | Offer Memo from Esterline Technologies Corporation to Alain Durand dated June 14, 2011. (Incorporated by reference to Exhibit 10.3 to the Company’s Quarterly Report on Form 10-Q for the quarter ended January 27, 2012 [Commission File Number 1-6357].) |
97
| | |
10.13*Exhibit
Number
| | Exhibit Index |
| |
| 10.23* | | Promotion Letter from Esterline Technologies Corporation Amendedto Marcia Mason dated August 1, 2012. (Incorporated by reference to Exhibit 10.5 to the Company’s Quarterly Report on Form 10-Q for the quarter ended January 25, 2013 [Commission File Number 1-6357].) |
| |
| 10.24* | | Promotion Letter from Esterline Technologies Corporation to Albert Yost dated November 16, 2009. (Incorporated by reference to Exhibit 10.6 to the Company’s Quarterly Report on Form 10-Q for the quarter ended January 25, 2013 [Commission File Number 1-6357].) |
| |
| 10.25* | | Offer Letter from Esterline Technologies Corporation to Curtis C. Reusser dated September 11, 2013. (Incorporated by reference to Exhibit 10.1 to the Company’s Current Report on Form 8-K dated September 12, 2013 [Commission File Number 1-6357].) |
| |
| 10.26 | | Letter Agreement, dated December 13, 2012, among Esterline Technologies Corporation, Relational Investors, LLC and Restated 1997 Stock Option Plan.the other parties named in the Letter Agreement. (Incorporated by reference to Exhibit 99.1 to the Company’s Registration StatementCurrent Report on Form S-8 filed March 14, 20038-K dated December 18, 2012 [Commission File Number 333-103846]1-6357].) |
| |
10.14
10.27 | | Real Property Lease and Sublease, dated June 28, 1996, between 810 Dexter L.L.C. and Korry Electronics Co. (Incorporated by reference to Exhibit 10.22 to the Company’s Annual Report on Form 10-K for the year ended October 28, 2005 [Commission File Number 1-6357].) |
| |
10.15
10.28 | | Industrial Lease dated July 17, 1984, between 901 Dexter Associates and Korry Electronics Co., First Amendment to Lease dated May 10, 1985, Second Amendment to Lease dated June 20, 1986, Third Amendment to Lease dated September 1, 1987, and Notification of Option Exercise dated January 7, 1991, relating to the manufacturing facility of Korry Electronics at 901 Dexter Avenue N., Seattle, Washington. (Incorporated by reference to Exhibit 10.4 to the Company’s Annual Report on Form 10-K for the year ended October 28, 2005 [Commission File Number 1-6357].) |
| |
10.16
10.29 | | Fourth Amendment dated July 27, 1994, to Industrial Lease dated July 17, 1984 between Houg Family Partnership, as successor to 901 Dexter Associates, and Korry Electronics Co. (Incorporated by reference to Exhibit 10.4a to the Company’s Annual Report on Form 10-K for the year ended October 28, 2005 [Commission File Number 1-6357].) |
| |
10.17
10.30 | | Industrial Lease dated July 17, 1984, between 801 Dexter Associates and Korry Electronics Co., First Amendment to Lease dated May 10, 1985, Second Amendment to Lease dated June 20, 1986, Third Amendment to Lease dated September 1, 1987, and Notification of Option Exercise dated January 7, 1991, relating to the manufacturing facility of Korry Electronics at 801 Dexter Avenue N., Seattle, Washington. (Incorporated by reference to Exhibit 10.5 to the Company’s Annual Report on Form 10-K for the year ended October 28, 2005 [Commission File Number 1-6357].) |
| |
10.18
10.31 | | Fourth Amendment dated March 28, 1994, to Industrial Lease dated July 17, 1984, between Michael Maloney and the Bancroft & Maloney general partnership, as successor to 801 Dexter Associates, and Korry Electronics Co. (Incorporated by reference to Exhibit 10.5a to the Company’s Annual Report on Form 10-K for the year ended October 28, 2005 [Commission File Number 1-6357].) |
| |
10.19
10.32 | | Property lease between Slibail Immobilier and Norbail Immobilier and Auxitrol S.A., dated April 29, 1997, relating to the manufacturing facility of Auxitrol at 5, allée Charles Pathé, 18941 Bourges Cedex 9, France, effective on the construction completed date (December 5, 1997). (Incorporated by reference to Exhibit 10.25 to the Company’s Annual Report on Form 10-K for the year ended October 28, 2005 [Commission File Number 1-6357].) |
| |
10.20
10.33 | | Industrial and Build-to-Suit Purchase and Sale Agreement between The Newhall Land and Farming Company, Esterline Technologies Corporation and TA Mfg. Co., dated February 13, 1997 including Amendments, relating to premises located at 28065 West Franklin Parkway, Valencia, CA. (Incorporated by reference to Exhibit 10.26 to the Company’s Annual Report on Form 10-K for the year ended October 28, 2005 [Commission File Number 1-6357].) |
98
| | |
Exhibit
Number | | Exhibit Index |
| |
10.21
10.34 | | Lease Agreement, dated as of February 27, 1998, between Glacier Partners and Advanced Input Devices, Inc., as amended by Lease Amendment #1, dated February 27, 1998. (Incorporated by reference to Exhibit 10.31 to the Company’s Annual Report on Form 10-K for the year ended October 27, 2000 [Commission File Number 1-6357].) |
96
| | |
Exhibit
Number
| | Exhibit Index
|
| |
10.22
10.35 | | Lease Amendment #2 between Glacier Partners and Advanced Input Devices, Inc., dated July 2, 2002, and Lease Amendment #3 between Glacier Partners and Advanced Input Devices, Inc., dated September 18, 2009. (Incorporated by reference to Exhibit 10.4 to the Company’s Annual Report on Form 10-K for the year ended October 30, 2009 [Commission File Number 1-6357].) |
| |
10.23
10.36 | | Lease Agreement, dated as of August 6, 2003, by and between the Prudential Insurance Company of America and Mason Electric Co., relating to premises located at Sylmar, California. (Incorporated by reference to Exhibit 10.34 to the Company’s Annual Report on Form 10-K for the year ended October 31, 2003 [Commission File Number 1-6357].) |
| |
10.24
10.37 | | Occupation Lease of Buildings known as Phases 3 and 4 on the Solartron Site at Victoria Road, Farnborough, Hampshire between J Sainsbury Developments Limited and Weston Aerospace Limited, dated July 21, 2000. (Incorporated by reference to Exhibit 10.35 to the Company’s Annual Report on Form 10-K for the year ended October 31, 2003 [Commission File Number 1-6357].) |
| |
10.25
10.38 | | Lease Agreement dated as of March 19, 1969, as amended, between Leach Corporation and Gin Gor Ju, Trustee of Ju Family Trust, relating to premises located in Orange County. (Incorporated by reference to Exhibit 10.37 to the Company’s Annual Report on Form 10-K for the year ended October 29, 2004 [Commission File Number 1-6357].) |
| |
10.26
10.39 | | Lease Agreement, dated November 29, 2005 between Lordbay Investments Limited, Darchem Engineering Limited and Darchem Holdings Limited relating to premises located at Units 4 and 5 Eastbrook Road, London Borough of Gloucestershire Gloucester. (Incorporated by reference to Exhibit 10.38 to the Company’s Quarterly Report on Form 10-Q for the quarter ended April 28, 2006 [Commission File Number 1-6357].) |
| |
10.27
10.40 | | Amendment No. 1 dated as of November 23, 2005 to Lease Agreement dated as of March 1, 1994 between Highland Industrial Park, Inc. and Armtec Countermeasures Company. (Incorporated by reference to Exhibit 10.41 to the Company’s Quarterly Report on Form 10-Q for the quarter ended April 28, 2006 [Commission File Number 1-6357].) |
| |
10.28
10.41 | | Lease Agreement dated November 4, 2002, between American Ordnance LLC and FR Countermeasures, relating to premises located at 25A Ledbetter Gate Road, Milan, Tennessee. (Incorporated by reference to Exhibit 10.44 to the Company’s Annual Report on Form 10-K for the year ended October 27, 2006 [Commission File Number 1-6357].) |
| |
10.29
10.42 | | Lease Agreement between Capstone PF LLC and Korry Electronics Co. dated as of March 26, 2008. (Incorporated by reference to Exhibit 10.1 to the Company’s Quarterly Report on Form 10-Q for the quarter ended May 2, 2008 [Commission File Number 1-6357].) |
| |
10.30
10.43 | | Exhibit C to Lease Agreement between Capstone PF LLC and Korry Electronics Co. dated as of March 26, 2008. (Incorporated by reference to Exhibit 10.2 to the Company’s Quarterly Report on Form 10-Q for the quarter ended August 1, 2008 [Commission File Number 1-6357].) |
| |
10.31
10.44 | | First Amendment to Building Lease and Sublease, dated June 25, 2008, between Capstone PF LLC and Korry Electronics Co. (Incorporated by reference to Exhibit 10.3 to the Company’s Quarterly Report on Form 10-Q for the quarter ended August 1, 2008 [Commission File Number 1-6357].) |
| |
10.32
10.45 | | Second Amendment to Building Lease and Sublease, dated July 30, 2008, between Capstone PF LLC and Korry Electronics Co. (Incorporated by reference to Exhibit 10.4 to the Company’s Quarterly Report on Form 10-Q for the quarter ended August 1, 2008 [Commission File Number 1-6357].) |
9799
| | |
Exhibit
Number
| | Exhibit Index |
| |
10.33
10.46 | | Subordination, Nondisturbance and Attornment Agreement and Estoppel Certificate, dated July 30, 2008, between Keybank National Association and Korry Electronics Co. (Incorporated by reference to Exhibit 10.5 to the Company’s Quarterly Report on Form 10-Q for the quarter ended August 1, 2008 [Commission File Number 1-6357].) |
| |
10.34
10.47 | | Lease Extension Agreement between Weir Redevelopment Company and Kirkhill TA dated October 30, 2009. (Incorporated by reference to Exhibit 10.4 to the Company’s Quarterly Report on Form 10-Q for the quarter ended January 29, 2010 [Commission File Number 1-6357].) |
| |
10.35
| | Agreement of purchase and sale and joint escrow instruction between Kirkhill-TA Co., a California corporation, and Absolute Screen Print, Inc., a California corporation, dated August 11, 2011. (Incorporated by reference to Exhibit 10.1 to the Company’s Quarterly Report on Form 10-Q for the quarter ended July 29, 2011 [Commission File Number 1-6357].) |
| |
10.36
10.48 | | First and Second Amendment to Office Lease Agreement between City Center Bellevue Property LLC, a Delaware limited partnership, and Esterline Technologies Corporation, a Delaware corporation, dated April 14, 2011, and May 4, 2011. (Incorporated by reference to Exhibit 10.2 to the Company’s Quarterly Report on Form 10-Q for the quarter ended July 29, 2011 [Commission File Number 1-6357].) |
| |
10.37
10.49 | | Agreement of purchase and sale and joint escrow instruction between Kirkhill-TA Co., a California corporation, and Absolute Screen Print, Inc., a California corporation, dated August 11, 2011. (Incorporated by reference to Exhibit 10.1 to the Company’s Quarterly Report on Form 10-Q for the quarter ended July 29, 2011 [Commission File Number 1-6357].) |
| |
| 10.50 | | Agreement for the sale and purchase of the entire issued share capital of Muirhead Aerospace Limited between Esterline Technologies Limited, Esterline Technologies Corporation, EMA Holding UK Limited, and Ametek, Inc. dated November 3, 2008. (Incorporated by reference to Exhibit 10.33 to the Company’s Annual Report on Form 10-K for the year ended October 29, 201028, 2011 [Commission File Number 1-6357].) |
| |
10.38
10.51 | | Stock Purchase Agreement between NMC Group, Inc. and Esterline Technologies Corporation dated November November��17, 2008. (Incorporated by reference to Exhibit 10.34 to the Company’s Annual Report on Form 10-K for the year ended October 29, 2010 [Commission File Number 1-6357].) |
| |
10.39
10.52 | | Share Sale and Purchase Agreement Relating to Racal Acoustics Global Limited dated December 21, 2008. (Incorporated by reference to Exhibit 10.5 to the Company’s Quarterly Report on Form 10-Q for the quarter ended January 30, 2009 [Commission File Number 1-6357].) |
| |
10.40
10.53 | | Stock Purchase Agreement by and between Measurement Specialties, Inc., Pressure Systems, Inc. and Esterline Technologies Corporation dated September 8, 2010, relating to the sale of all issued and outstanding shares of Pressure Systems, Inc. (Incorporated by reference to Exhibit 10.37 to the Company’s Annual Report on Form 10-K for the year ended October 29, 2010 [Commission File Number 1-6357].) |
| |
10.41
10.54 | | Stock Purchase Agreement By and Among Eclipse Electronic Systems, Inc., Its Shareholders, and Esterline Technologies Corporation dated as of December 28, 2010. (Incorporated by reference to Exhibit 10.3 to the Company’s Quarterly Report on Form 10-Q for the quarter ended January 28, 2011 [Commission File Number 1-6357].) |
| |
10.42
10.55 | | Share Purchase Agreement between FCPR Sagard, FCPR Sagard Connecteurs, Individuals, The Mezzanine Sellers as Sellers and Esterline Technologies Corporation as Buyer, dated May 23, 2011. (Incorporated by reference to Exhibit 10.1 to the Company’s Quarterly Report on Form 10-Q for the quarter ended April 29, 2011 [Commission File Number 1-6357].) |
| |
| 10.56 | | First Amendment to Lease between The Prudential Insurance Company of America and Mason Electric, Co. dated July 29, 2004. (Incorporated by reference to Exhibit 10.1 to the Company’s Quarterly Report on Form 10-Q for the quarter ended July 26, 2013 [Commission File Number 1-6357].) |
| |
| 10.57 | | Second Amendment to Lease between Sylmar Cascades Properties, L.P. and Mason Electric, Co. dated January 19, 2007. (Incorporated by reference to Exhibit 10.2 to the Company’s Quarterly Report on Form 10-Q for the quarter ended July 26, 2013 [Commission File Number 1-6357].) |
100
| | |
Exhibit
Number | | Exhibit Index |
| |
| 10.58 | | Third Amendment to Lease between Sylmar Cascades Properties, L.P. and Mason Electric, Co. dated January 1, 2013. (Incorporated by reference to Exhibit 10.3 to the Company’s Quarterly Report on Form 10-Q for the quarter ended July 26, 2013 [Commission File Number 1-6357].) |
| |
| 11.1 | | Schedule setting forth computation of earnings per share for the five fiscal years ended October 28, 2011.25, 2013. |
| |
12.1 | | Statement of Computation of Ratio of Earnings to Fixed Charges. |
| |
21.1 | | List of subsidiaries. |
| |
23.1 | | Consent of Independent Registered Public Accounting Firm. |
98
| | |
Exhibit
Number
| | Exhibit Index
|
| |
31.1 | | Certification of Chief Executive Officer. |
| |
31.2 | | Certification of Chief Financial Officer. |
| |
32.1 | | Certification (of R. Bradley Lawrence) pursuant to 18 U.S.C. Section 1350, as adopted pursuant to Section 906 of the Sarbanes-Oxley Act of 2002. |
| |
32.2 | | Certification (of Robert D. George) pursuant to 18 U.S.C. Section 1350, as adopted pursuant to Section 906 of the Sarbanes-Oxley Act of 2002. |
| |
| 101.INS | | XBRL Instance Document |
| |
| 101.SCH | | XBRL Taxonomy Extension Schema |
| |
| 101.CAL | | XBRL Taxonomy Extension Calculation Linkbase |
| |
| 101.DEF | | XBRL Taxonomy Extension Definition Linkbase |
| |
| 101.LAB | | XBRL Taxonomy Extension Label Linkbase |
| |
| 101.PRE | | XBRL Taxonomy Extension Presentation Linkbase |
| * Indicates | Indicates management contract or compensatory plan or arrangement. |
99101