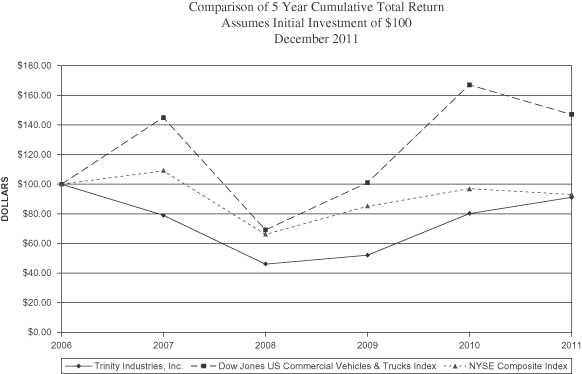
| 2006 | 2007 | 2008 | 2009 | 2010 | 2011 | |||||||||||||||||||
Trinity Industries, Inc. | 100 | 79 | 46 | 52 | 80 | 91 | ||||||||||||||||||
Dow Jones US Commercial Vehicles & Trucks Index | 100 | 145 | 69 | 101 | 167 | 147 | ||||||||||||||||||
New York Stock Exchange Composite Index | 100 | 109 | 66 | 85 | 97 | 93 | ||||||||||||||||||
2007.
(Mark One)
| (Mark One) | |
| þ | ANNUAL REPORT PURSUANT TO SECTION 13OR 15(d) OF THE SECURITIES EXCHANGE ACTOF 1934 |
OR
| OR | |
| ¨ | TRANSITION REPORT PURSUANT TOSECTION 13 OR 15(d) OF THESECURITIES EXCHANGE ACT OF 1934 |
| Delaware | 75-0225040 | |
| (State or Other Jurisdiction of Incorporation or Organization) | (I.R.S. Employer Identification No.) | |
2525 Stemmons Freeway, Dallas, Texas | 75207-2401 | |
| (Address of principal executive offices) | (Zip Code) | |
Title of each class |
| |
Common Stock ($1.00 par value) | New York Stock Exchange, Inc. | |
Large accelerated filer þAccelerated filer ¨Non-accelerated filer ¨Smaller reporting company ¨ (Do not check if a smaller reporting company) | ||||||
Indicate by check mark whether the Registrant is a shellcompany (as defined in Rule 12b-2 of the Exchange Act). Yes ¨ No þ
$1,938.9 million.
79,118,471.
| Caption | Page | |||||
| ||||||
| Item 5. | ||||||
| ||||||
Changes in and Disagreements with Accountants on Accounting and Financial Disclosure | ||||||
| Item 10. | ||||||
Security Ownership of Certain Beneficial Owners and Management and Related Stockholder Matters | ||||||
Certain Relationships and Related Transactions, and Director Independence | ||||||
www.trin.net.
Railcars
Inland barges
Structuralstructural wind towers
Highway products
Concreteaggregates;
Tank containers
Steel parts and steel components.
|
|
|
|
|
|
|
2012
.Our crash cushionstank heads we manufacture in the production of our tank cars and containers. We also sell our tank heads to a broad range of other protective barriers include multiple proprietary productsmanufacturers. There is strong competition in the tank heads business.
We sell highway products in Canada, Mexico, and all 50 of the United States. We compete against several national and regional guardrail manufacturers. We also export our proprietary highway products to more than 60 countries worldwide.
In addition, we provide hot-dip galvanizing services toforeign manufacturers of fabricated steel materials from our production facilities in north Texas and manufacture a line of construction equipmentstructural wind towers for the mining industry.
North American market.
564.1 million.
We are a leading manufacturer in North America of structural wind towers used in the wind energy market. These towers are manufactured in the United States and Mexico to customer specifications and installed by our customers. Our customers are generally turbine producers. Our structural wind towers backlog as of December 31, 2011 was approximately $934.3 million. Approximately $412.5 million of this backlog is involved in litigation filed by the Company against one of our structural wind tower customers for breach of contract by failing to comply with the customer’s multi-year, contractual purchase obligations.
We are a leading manufacturer in North America of tank containers and tank heads for pressure and non-pressure vessels. We manufacture tanks in the United States and Mexico. We market a portion of our products in Mexico under the brand name of TATSA®. In 2011, we began manufacturing frac tanks to support industries requiring temporary liquid storage, primarily the oil and gas industry.
We manufacture tank heads, which are pressed metal components used in the manufacturing of many of our finished products, as well as pressure rated or non-pressure rated, depending on their intended use. We use a significant portion of the tank heads we manufacture in the production of our tank cars and containers. We also sell our tank heads to a broad range of other manufacturers. There is strong competition in the tank heads business.
We manufacture tanks that are used by industrial plants, utilities, residences, and small businesses in suburban and rural areas. We also manufacture fertilizer containers for bulk storage, farm storage, and the application and distribution of anhydrous ammonia. Our tank products range from nine-gallon tanks for motor fuel use to 1.8 million-gallon bulk storage spheres. We sell our tanks to dealers and large industrial users. In the United States we generally deliver the containers to our customers who install and fill the containers. Our competitors include large and small manufacturers of tanks.
We manufacture utility, traffic, and lighting structures, which are used principally by municipalities, and various other local and state governmental entities. We also manufacture transmission structures to be used in the erection of private and public electric transmission lines. These structures are manufactured in the United States and Mexico to customer specifications and installed by our customers.
There are a number of well-established entities that actively compete with us in the business of manufacturing energy equipment including several domestic and foreign manufacturers of structural wind towers for the North American market.
All Other. All Other includes our captive insurance and transportation companies; legal, environmental, and maintenance costs associated with non-operating facilities; other peripheral businesses; and the change in market valuation related to ineffective commodity hedges.
| As of December 31, | ||||||||
| 2011 | 2010 | |||||||
| (in millions) | ||||||||
Rail Group | ||||||||
External Customers | $ | 1,973.2 | $ | 346.6 | ||||
Leasing Group | 621.9 | 111.0 | ||||||
|
|
|
| |||||
| $ | 2,595.1 | $ | 457.6 | |||||
Inland Barge | $ | 494.6 | $ | 508.0 | ||||
Structural wind towers | $ | 934.3 | $ | 1,000.0 | ||||
| December 31, 2012 | December 31, 2011 | |||||||
| (in millions) | ||||||||
| Rail Group | ||||||||
| External Customers | $ | 2,867.5 | $ | 1,973.2 | ||||
| Leasing Group | 834.7 | 621.9 | ||||||
| $ | 3,702.2 | $ | 2,595.1 | |||||
| Inland Barge | $ | 564.1 | $ | 494.6 | ||||
| Structural wind towers | $ | 680.3 | $ | 934.3 | ||||
remainder contracted for delivery in future years.
Cement. Cement required for theour ready-mix concrete and aggregates businessoperations is received primarily from Texas. In 2011,2012, the supply of cement was sufficient in our markets to meet demand. We have not experienced difficulties supplying concrete to our customers.
Business Group | December 31, | 2012 | |||
Rail Group | 6,210 | ||||
Construction Products Group | 1,950 | ||||
Inland Barge Group | 2,010 | ||||
Energy Equipment Group | 4,580 | ||||
Railcar Leasing and Management Services Group | 130 | ||||
All Other | 340 | ||||
| Corporate | 270 | ||||
| 15,490 | |||||
| |||||
activities, or properties, may give rise to additional compliance and other costs that could have a material adverse effect on our financial condition and operations.
particularly natural gas for plant operations and diesel fuel for vehicles, could have a material adverse effect upon our ability to conduct our business. The likelihood of such an occurrence or its duration, and its ultimate effect on our operations, cannot be reasonably predicted at this time.
| Name | Age | Office | Officer Since | |||
Timothy R. Wallace* | 59 | Chairman, Chief Executive Officer, and President | 1985 | |||
James E. Perry* | 41 | Senior Vice President and Chief Financial Officer | 2005 | |||
William A. McWhirter II* | 48 | Senior Vice President and Group President | 2005 | |||
D. Stephen Menzies* | 57 | Senior Vice President and Group President | 2001 | |||
S. Theis Rice* | 62 | Senior Vice President, Human Resources and Chief Legal Officer | 2002 | |||
| Donald G. Collum | 64 | Vice President and Chief Audit Executive | 2005 | |||
| Tammy D. Gilbert | 52 | Vice President, Information Technology | 2012 | |||
| Virginia C. Gray, Ph.D. | 53 | Vice President, Organizational Development | 2007 | |||
Mary E. Henderson* | 54 | Vice President, Chief Accounting Officer, and Controller | 2009 | |||
| John M. Lee | 52 | Vice President, Business Development | 1994 | |||
| Gail M. Peck | 45 | Vice President and Treasurer | 2010 | |||
| Heather Perttula Randall | 39 | Vice President, Legal Affairs and Government Relations | 2011 | |||
| Jared S. Richardson | 40 | Vice President, Associate General Counsel and Secretary | 2010 | |||
| Stephen W. Smith | 63 | Vice President | 2012 | |||
| C. Michael Williams | 57 | Vice President, Human Resources | 2012 | |||
Name | Age | Office | Officer Since | Term Expires | ||||
| Timothy R. Wallace* | 58 | Chairman, Chief Executive Officer, and President | 1985 | May 2012 | ||||
| James E. Perry* | 40 | Senior Vice President and Chief Financial Officer | 2005 | May 2012 | ||||
| Antonio Carrillo* | 45 | Senior Vice President and Group President | 2010 | May 2012 | ||||
| William A. McWhirter II* | 47 | Senior Vice President and Group President | 2005 | May 2012 | ||||
| D. Stephen Menzies* | 56 | Senior Vice President and Group President | 2001 | May 2012 | ||||
| S. Theis Rice* | 61 | Senior Vice President, Human Resources and Chief Legal Officer | 2002 | May 2012 | ||||
| Madhuri A. Andrews | 45 | Vice President, Information Technology | 2008 | May 2012 | ||||
| Donald G. Collum | 63 | Vice President and Chief Audit Executive | 2005 | May 2012 | ||||
| Virginia C. Gray, Ph.D. | 52 | Vice President, Organizational Development | 2007 | May 2012 | ||||
| Mary E. Henderson* | 53 | Vice President, Chief Accounting Officer, and Controller | 2009 | May 2012 | ||||
| John M. Lee | 51 | Vice President, Business Development | 1994 | May 2012 | ||||
| Gail M. Peck | 44 | Vice President and Treasurer | 2010 | May 2012 | ||||
| Heather Perttula Randall | 38 | Vice President, Legal Affairs and Government Relations | 2011 | May 2012 | ||||
| Jared S. Richardson | 39 | Associate General Counsel and Secretary | 2010 | May 2012 |
|
1934.
Mr. Carrillo joined Trinity in 1996 asAmerica's Vice President, of Operations of Trinity Industries de MexicoTransition, Transformation, and in 1999 became the President of Trinity Industries de Mexico. In 2005, he was named President of Trinity’s Energy Equipment Group. In 2009, Mr. Carrillo was named Group President of the Energy Equipment GroupProject/Program Management. She has also held executive positions with Electronic Data Systems, Sabre Holdings, American Airlines, and in 2010 was named Vice President. He was elected Senior Vice President in 2011. Mr. Carrillo retains responsibility for Trinity’s operations in Mexico.
Dr. Gray joined Trinity in 2007 and was appointed Vice President, Organizational Development. Prior to that, she was President of Vehicles of Change, a consulting firm focused on improving organizational effectiveness.
Harris Methodist Hospital.
In 2012, Mr. Menzies joined Trinity in 2001 as President of Trinity Industries Leasing Company. In 2006, he becameMcWhirter was named Senior Vice President and Group President forTrinityRail®.
of the Construction Products, Energy Equipment, and Inland Barge Groups.
Following a period of weak railcar demand that began in 2009, new orders for railcars improved significantly in 2011 due to increased demand for the shipment of commodities, replacement of older railcars, and federal tax benefits received from taking delivery of railcars in 2011 and 2012. Orders for structural wind towers have been slow since mid-2008 when energy development companies encountered tightened credit markets, lower demand for electricity and heightened competition arising from declining natural gas prices. The continued slowdown in the residential and commercial construction markets negatively impacted the results of our Construction Products Group as well. We continually assess our manufacturing capacity and take steps to align our production capacity with demand for our products. As a result of our assessment, we adapted to the rapid decline in market conditions that began in 2009 by reducing our production footprint and staffing levels and causing certain facilities to be on non-operating status. Due to improvements in demand, we increased production staff at certain facilities in late 2010 and during 2011. We expect that facilities on non-operating status will be available for future operations to the extent that demand further increases.
To the extent that we do not have such arrangements in place, an increase in steel prices could materially lower our margins and profitability. In general, we believe there is enough capacity in the supply industryaddition, our ability to meet current production level demands. We believedemands is dependent on the existing contracts and commercial relationships we have in place will meet our current production forecasts. However, anyability to obtain a sufficient amount of steel. An unanticipated interruption in our supply chain could have an adverse impact on both our margins and production schedules.
permits.
apply and if we are found liable in any such incident, it could have a material adverse effect on our financial condition, business, and operations.
As of December 31, 2011, there was $308.5 million of indebtedness outstanding and $166.5 million was available under the TILC warehouse loan facility. Borrowings under the warehouse facility are secured by the specific railcars financed by such borrowings and the underlying leases. A decline in the value of the railcars securing borrowings under the warehouse facility or in the creditworthiness of the lessees under the associated leases could reduce TRLWT’s ability to obtain long-term financing for such railcars. Additionally, fluctuations in interest rates from the time TRLWT purchases railcars with short-term borrowings under the warehouse facility and the time TRLWT obtains permanent financing for such railcars could decrease our profitability on the leasing of the railcars and could have an adverse impact on our financial results. If TRLWT is unable to obtain long-term financing to replace borrowings under the warehouse facility, the lenders under the warehouse facility may foreclose on the portion of TRLWT’s lease fleet pledged to secure its loan facility, which foreclosure, if a significant number of railcars is affected, could result in the loss of a significant amount of TRLWT’s assets.
goods produced in America; more stringent or restrictive laws, rules, and regulations relating to labor or the environment; adverse tax consequences; and price exchange controls could limit operations affecting production throughput and makemaking the manufacture and distribution of our products less timely or more difficult. Furthermore, any material change in the quotas, regulations, or duties on imports imposed by the United StatesU.S. government and agencies, or on exports by the government of Mexico or its agencies, could affect our ability to export products that we manufacture in Mexico. Because we have operations outside the United States,U.S., we could be adversely affected by final judgments of non-compliance with the U.S. Foreign Corrupt Practices Act and similar anti-corruption laws of other countries.
mine safety and health regulations in the United StatesU.S. or in foreign jurisdictions in which we operate could increase our operating costs. We are unable to predict the ultimate cost of compliance with these health and safety laws and regulations. Accordingly, there can be no assurance that we will not become involved in future litigation, investigations, or other proceedings or if we were found to be responsible or liable in any litigation, investigations, or proceedings, that such costs would not be material to us.
period financial statements. For a further discussion of some of our critical accounting policies and standards and recent accounting changes, see Critical Accounting Policies and Estimates in Management’sManagement's Discussion and Analysis of Financial Condition and Results of Operations and Note 1 Summary of Significant Accounting Policies of the Notes to Consolidated Financial Statements.
| Approximate Square Feet | Approximate Square Feet Located In | |||||||||||||||
| Owned | Leased | US | Mexico | |||||||||||||
Rail Group | 5,278,900 | 32,000 | 3,573,100 | 1,737,800 | ||||||||||||
Construction Products Group | 1,494,400 | 63,400 | 1,557,800 | — | ||||||||||||
Inland Barge Group | 919,000 | 97,100 | 1,016,100 | — | ||||||||||||
Energy Equipment Group | 1,505,500 | 261,100 | 923,600 | 843,000 | ||||||||||||
Executive Offices | 173,000 | — | 173,000 | — | ||||||||||||
|
|
|
|
|
|
|
| |||||||||
| 9,370,800 | 453,600 | 7,243,600 | 2,580,800 | |||||||||||||
|
|
|
|
|
|
|
| |||||||||
| Approximate Square Feet | Approximate Square Feet Located In | |||||||||||
| Owned | Leased | US | Mexico | |||||||||
| Rail Group | 6,185,400 | 92,700 | 4,280,600 | 1,997,500 | ||||||||
| Construction Products Group | 1,833,900 | 98,100 | 1,932,000 | — | ||||||||
| Inland Barge Group | 948,500 | 97,100 | 1,045,600 | — | ||||||||
| Energy Equipment Group | 1,799,500 | 250,300 | 1,206,800 | 843,000 | ||||||||
| Executive Offices | 186,000 | — | 186,000 | — | ||||||||
| 10,953,300 | 538,200 | 8,651,000 | 2,840,500 | |||||||||
| Production Capacity Utilized | |||||
Rail Group | |||||
| 70 | % | |||
Construction Products Group | 75 | % | |||
| Inland Barge Group | % | ||||
Energy Equipment Group | % | ||||
| Market for Registrant's Common Equity, Related Stockholder Mattersand Issuer Purchases of Equity Securities. |
Our common stock is traded on the New York Stock Exchange under the ticker symbol “TRN”. The following table shows the closing price range of our common stock by quarter for the years ended December 31, 20112012 and 2010.
| Prices | ||||||||
Year Ended December 31, 2011 | High | Low | ||||||
Quarter ended March 31, 2011 | $ | 36.67 | $ | 26.31 | ||||
Quarter ended June 30, 2011 | 37.76 | 30.54 | ||||||
Quarter ended September 30, 2011 | 37.25 | 21.05 | ||||||
Quarter ended December 31, 2011 | 30.62 | 19.94 | ||||||
Year Ended December 31, 2010 | High | Low | ||||||
Quarter ended March 31, 2010 | $ | 20.58 | $ | 15.22 | ||||
Quarter ended June 30, 2010 | 26.46 | 17.72 | ||||||
Quarter ended September 30, 2010 | 22.27 | 16.45 | ||||||
Quarter ended December 31, 2010 | 26.68 | 22.01 | ||||||
2011.
| Prices | |||||||
| Year Ended December 31, 2012 | High | Low | |||||
| Quarter ended March 31, 2012 | $ | 35.93 | $ | 29.69 | |||
| Quarter ended June 30, 2012 | 33.48 | 22.80 | |||||
| Quarter ended September 30, 2012 | 33.55 | 21.85 | |||||
| Quarter ended December 31, 2012 | 36.05 | 29.01 | |||||
| Year Ended December 31, 2011 | High | Low | |||||
| Quarter ended March 31, 2011 | $ | 36.67 | $ | 26.31 | |||
| Quarter ended June 30, 2011 | 37.76 | 30.54 | |||||
| Quarter ended September 30, 2011 | 37.25 | 21.05 | |||||
| Quarter ended December 31, 2011 | 30.62 | 19.94 | |||||
At December 31, 2011,2012, we had approximately 1,8581,867 record holders of common stock. The par value of the common stock is $1.00 per share.
Trinity has paid 191195 consecutive quarterly dividends. Quarterly dividends declared by Trinity for the years ended December 31, 20112012 and 20102011 are as follows:
Year Ended December 31, | ||||||||
| 2011 | 2010 | |||||||
Quarter ended March 31, | $ | 0.08 | $ | 0.08 | ||||
Quarter ended June 30, | 0.09 | 0.08 | ||||||
Quarter ended September 30, | 0.09 | 0.08 | ||||||
Quarter ended December 31, | 0.09 | 0.08 | ||||||
|
|
|
| |||||
Total | $ | 0.35 | $ | 0.32 | ||||
|
|
|
| |||||
| Year Ended December 31, | |||||||
| 2012 | 2011 | ||||||
| Quarter ended March 31, | $ | 0.09 | $ | 0.08 | |||
| Quarter ended June 30, | 0.11 | 0.09 | |||||
| Quarter ended September 30, | 0.11 | 0.09 | |||||
| Quarter ended December 31, | 0.11 | 0.09 | |||||
| Total | $ | 0.42 | $ | 0.35 | |||
-
| 2006 | 2007 | 2008 | 2009 | 2010 | 2011 | |||||||||||||||||||
Trinity Industries, Inc. | 100 | 79 | 46 | 52 | 80 | 91 | ||||||||||||||||||
Dow Jones US Commercial Vehicles & Trucks Index | 100 | 145 | 69 | 101 | 167 | 147 | ||||||||||||||||||
New York Stock Exchange Composite Index | 100 | 109 | 66 | 85 | 97 | 93 | ||||||||||||||||||
2007.
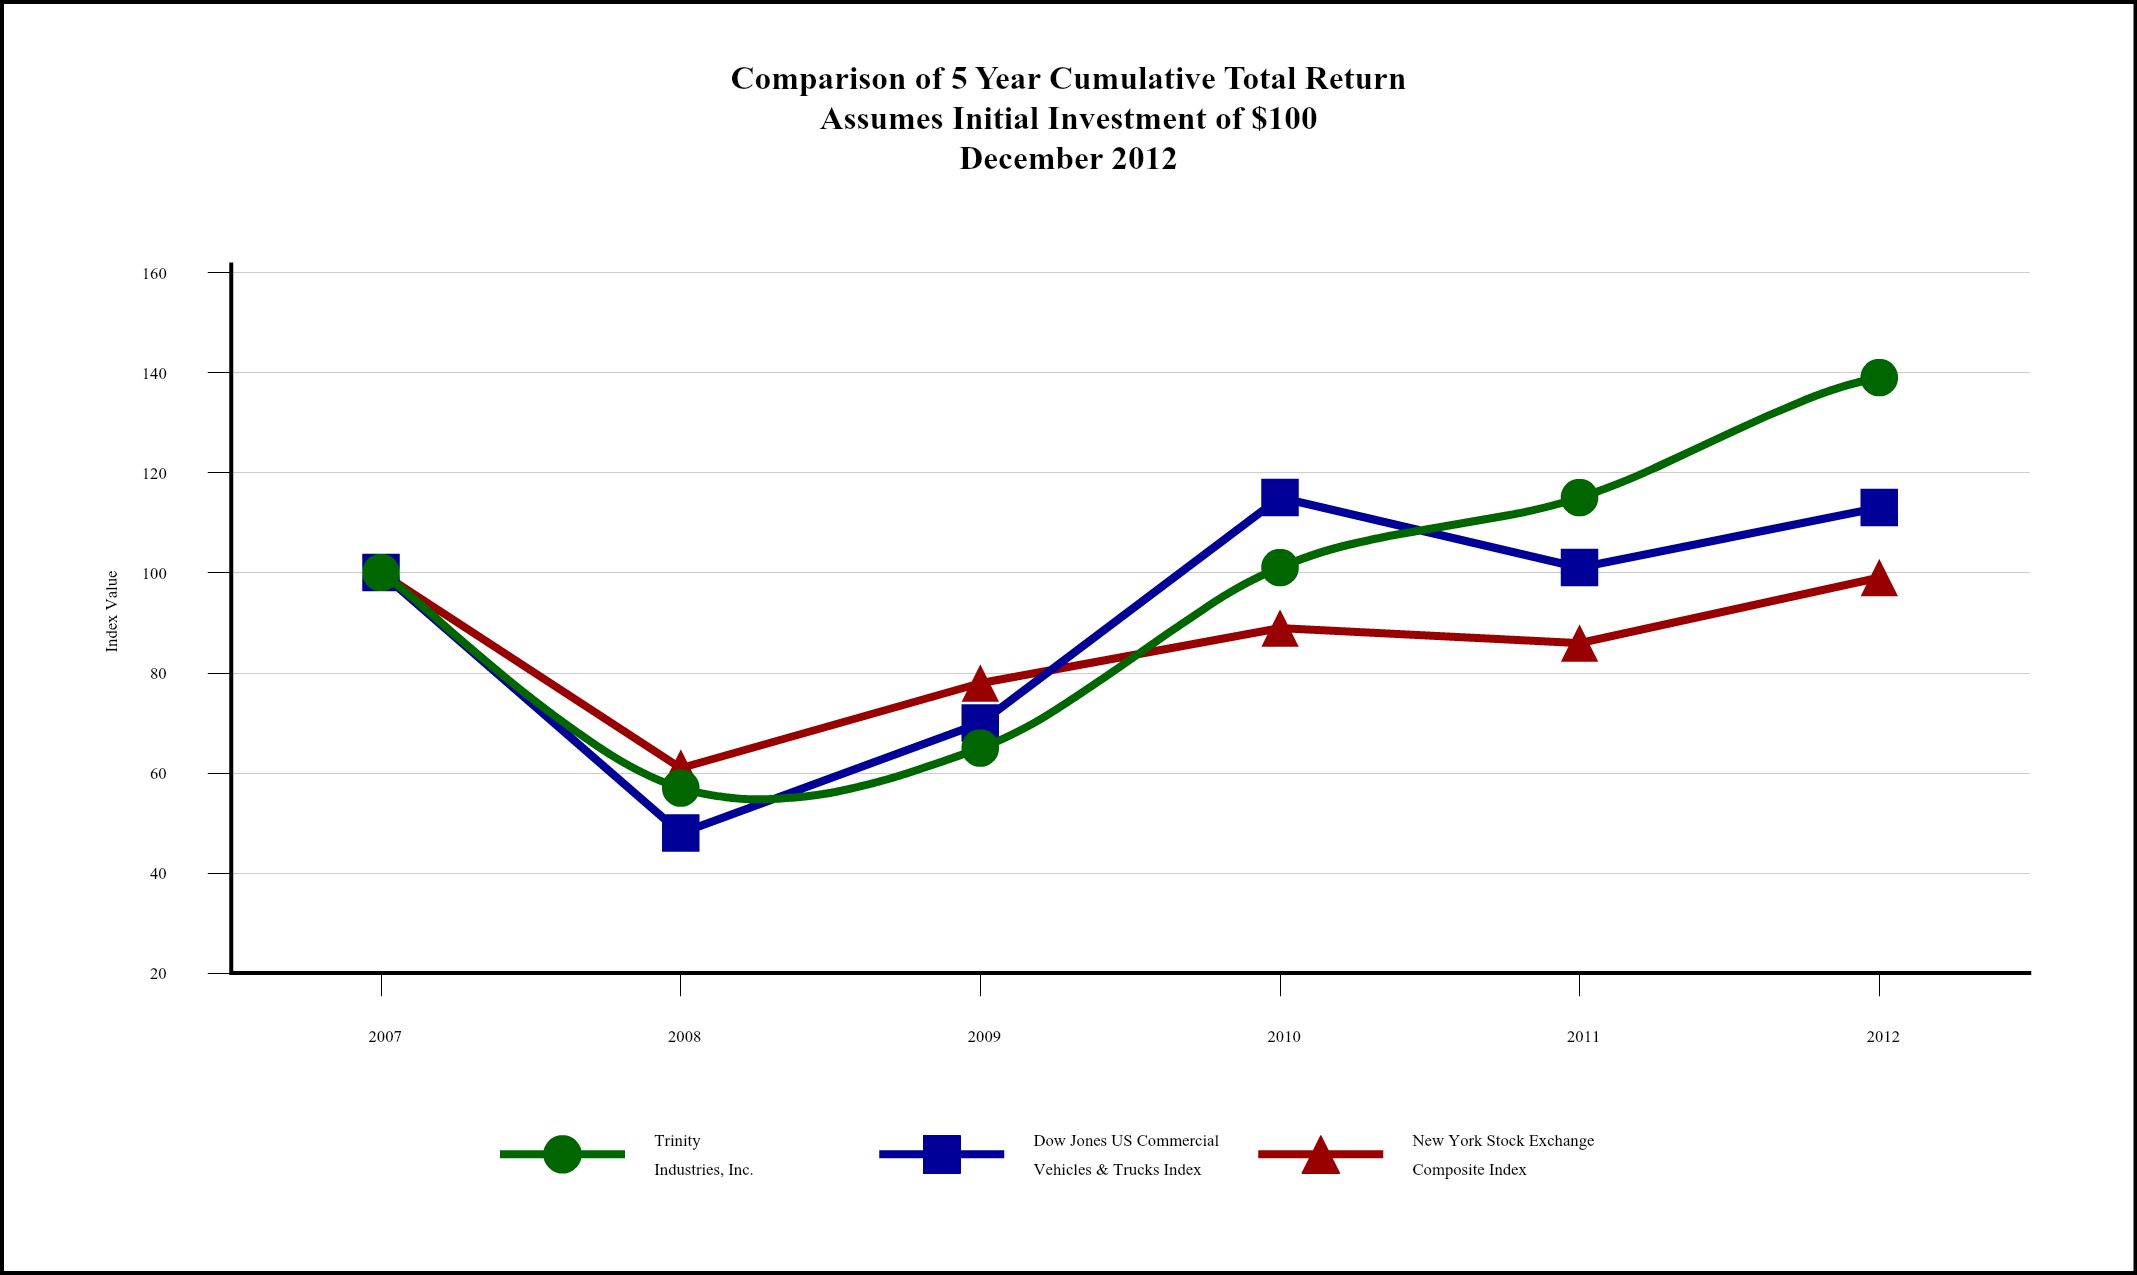
| 2007 | 2008 | 2009 | 2010 | 2011 | 2012 | ||||||||||||
| Trinity Industries, Inc. | 100 | 57 | 65 | 101 | 115 | 139 | |||||||||||
| Dow Jones US Commercial Vehicles & Trucks Index | 100 | 48 | 70 | 115 | 101 | 113 | |||||||||||
| New York Stock Exchange Composite Index | 100 | 61 | 78 | 89 | 86 | 99 | |||||||||||
Period | Number of Shares Purchased (1) | Average Price Paid per Share (1) | Total Number of Shares (or Units) Purchased as Part of Publicly Announced Plans or Programs (2) | Maximum Number (or Approximate Dollar Value) of Shares (or Units) that May Yet Be Purchased Under the Plans or Programs (2) | ||||||||||||
October 1, 2011 through October 31, 2011 | 12,327 | $ | 21.53 | — | $ | 200,000,000 | ||||||||||
November 1, 2011 through November 30, 2011 | 161 | $ | 28.09 | — | $ | 200,000,000 | ||||||||||
December 1, 2011 through December 31, 2011 | 122 | $ | 29.77 | — | $ | 200,000,000 | ||||||||||
|
|
|
| |||||||||||||
Total | 12,610 | $ | 21.70 | — | $ | 200,000,000 | ||||||||||
|
|
|
| |||||||||||||
2012
:| Period | Number of Shares Purchased (1) | Average Price Paid per Share (1) | Total Number of Shares (or Units) Purchased as Part of Publicly Announced Plans or Programs (2) | Maximum Number (or Approximate Dollar Value) of Shares (or Units) that May Yet Be Purchased Under the Plans or Programs (2) | ||||||||||
| October 1, 2012 through October 31, 2012 | 3,659 | $ | 31.23 | — | $ | 200,000,000 | ||||||||
| November 1, 2012 through November 30, 2012 | 61,383 | $ | 31.84 | — | $ | 200,000,000 | ||||||||
| December 1, 2012 through December 31, 2012 | 361 | $ | 35.22 | — | $ | 200,000,000 | ||||||||
| Total | 65,403 | $ | 31.82 | — | $ | 200,000,000 | ||||||||
| (in millions, except percent and per share data) | Year Ended December 31, | |||||||||||||||||||
| 2011 | 2010 | 2009 | 2008 | 2007 | ||||||||||||||||
Statement of Operations Data: | ||||||||||||||||||||
Revenues | $ | 3,075.1 | $ | 2,155.5 | $ | 2,420.9 | $ | 3,803.4 | $ | 3,723.3 | ||||||||||
Operating profit (loss) | 425.3 | 303.8 | (30.9 | ) | 559.5 | 529.8 | ||||||||||||||
Income (loss) from continuing operations | 145.7 | 75.4 | (137.7 | ) | 282.4 | 289.8 | ||||||||||||||
Discontinued operations: | ||||||||||||||||||||
Loss from discontinued operations, net of benefit for income taxes of $—, $—, $—, $(0.0), and $(0.2) | — | — | — | (1.5 | ) | (0.7 | ) | |||||||||||||
|
|
|
|
|
|
|
|
|
| |||||||||||
Net income (loss) | $ | 145.7 | $ | 75.4 | $ | (137.7 | ) | $ | 280.9 | $ | 289.1 | |||||||||
|
|
|
|
|
|
|
|
|
| |||||||||||
Net income (loss) attributable to Trinity | $ | 142.2 | $ | 67.4 | $ | (137.7 | ) | $ | 280.9 | $ | 289.1 | |||||||||
|
|
|
|
|
|
|
|
|
| |||||||||||
Net income (loss) attributable to Trinity Industries, Inc. per common share: | ||||||||||||||||||||
Basic: | ||||||||||||||||||||
Continuing operations | $ | 1.77 | $ | 0.85 | $ | (1.81 | ) | $ | 3.49 | $ | 3.58 | |||||||||
Discontinued operations | — | — | — | (0.02 | ) | (0.01 | ) | |||||||||||||
|
|
|
|
|
|
|
|
|
| |||||||||||
| $ | 1.77 | $ | 0.85 | $ | (1.81 | ) | $ | 3.47 | $ | 3.57 | ||||||||||
|
|
|
|
|
|
|
|
|
| |||||||||||
Diluted: | ||||||||||||||||||||
Continuing operations | $ | 1.77 | $ | 0.85 | $ | (1.81 | ) | $ | 3.47 | $ | 3.55 | |||||||||
Discontinued operations | — | — | — | (0.02 | ) | (0.01 | ) | |||||||||||||
|
|
|
|
|
|
|
|
|
| |||||||||||
| $ | 1.77 | $ | 0.85 | $ | (1.81 | ) | $ | 3.45 | $ | 3.54 | ||||||||||
|
|
|
|
|
|
|
|
|
| |||||||||||
Weighted average number of shares outstanding: | ||||||||||||||||||||
Basic | 77.5 | 76.8 | 76.4 | 78.4 | 78.7 | |||||||||||||||
Diluted | 77.8 | 77.0 | 76.4 | 78.8 | 79.4 | |||||||||||||||
Dividends declared per common share | $ | 0.35 | $ | 0.32 | $ | 0.32 | $ | 0.31 | $ | 0.26 | ||||||||||
Balance Sheet Data: | ||||||||||||||||||||
Total assets | $ | 6,121.0 | $ | 5,760.0 | $ | 4,656.4 | $ | 4,911.6 | $ | 4,039.7 | ||||||||||
Debt — recourse | 457.7 | 450.3 | 646.0 | 584.4 | 590.3 | |||||||||||||||
Debt — non-recourse | 2,517.2 | 2,457.4 | 1,199.1 | 1,190.3 | 643.9 | |||||||||||||||
Stockholders’ equity | $ | 1,948.3 |
| $ | 1,845.7 | $ | 1,806.3 | $ | 1,912.3 | $ | 1,812.7 | |||||||||
Ratio of total debt to total capital | 60.4 | % | 61.2 | % | 50.5 | % | 48.1 | % | 40.5 | % | ||||||||||
Book value per share | $ | 24.29 | $ | 23.13 | $ | 22.81 | $ | 24.08 | $ | 22.27 | ||||||||||
Effective
| Year Ended December 31, | |||||||||||||||||||
| 2012 | 2011 | 2010 | 2009 | 2008 | |||||||||||||||
| (in millions, except percent and per share data) | |||||||||||||||||||
| Statement of Operations Data: | |||||||||||||||||||
| Revenues | $ | 3,811.9 | $ | 2,938.3 | $ | 1,930.7 | $ | 2,162.9 | $ | 3,423.6 | |||||||||
| Operating profit (loss) | 574.8 | 426.8 | 294.2 | (36.1 | ) | 536.7 | |||||||||||||
| Income (loss) from continuing operations | 251.9 | 146.8 | 69.4 | (140.8 | ) | 266.8 | |||||||||||||
| Income (loss) from discontinued operations, net of provision (benefit) for income taxes of $1.1, $(0.4), $3.6, $2.0, and $7.8 | 1.8 | (1.1 | ) | 6.0 | 3.1 | 14.1 | |||||||||||||
| Net income (loss) | $ | 253.7 | $ | 145.7 | $ | 75.4 | $ | (137.7 | ) | $ | 280.9 | ||||||||
| Net income (loss) attributable to Trinity Industries, Inc. | $ | 255.2 | $ | 142.2 | $ | 67.4 | $ | (137.7 | ) | $ | 280.9 | ||||||||
| Net income (loss) attributable to Trinity Industries, Inc. per common share: | |||||||||||||||||||
| Basic: | |||||||||||||||||||
| Continuing operations | $ | 3.18 | $ | 1.78 | $ | 0.77 | $ | (1.85 | ) | $ | 3.30 | ||||||||
| Discontinued operations | 0.02 | (0.01 | ) | 0.08 | 0.04 | 0.17 | |||||||||||||
| $ | 3.20 | $ | 1.77 | $ | 0.85 | $ | (1.81 | ) | $ | 3.47 | |||||||||
| Diluted: | |||||||||||||||||||
| Continuing operations | $ | 3.17 | $ | 1.78 | $ | 0.77 | $ | (1.85 | ) | $ | 3.28 | ||||||||
| Discontinued operations | 0.02 | (0.01 | ) | 0.08 | 0.04 | 0.17 | |||||||||||||
| $ | 3.19 | $ | 1.77 | $ | 0.85 | $ | (1.81 | ) | $ | 3.45 | |||||||||
| Weighted average number of shares outstanding: | |||||||||||||||||||
| Basic | 77.3 | 77.5 | 76.8 | 76.4 | 78.4 | ||||||||||||||
| Diluted | 77.5 | 77.8 | 77.0 | 76.4 | 78.8 | ||||||||||||||
| Dividends declared per common share | $ | 0.42 | $ | 0.35 | $ | 0.32 | $ | 0.32 | $ | 0.31 | |||||||||
| Balance Sheet Data: | |||||||||||||||||||
| Total assets | $ | 6,669.9 | $ | 6,121.0 | $ | 5,760.0 | $ | 4,656.4 | $ | 4,911.6 | |||||||||
| Debt - recourse | $ | 458.1 | $ | 455.0 | $ | 449.4 | $ | 645.5 | $ | 583.9 | |||||||||
| Debt - non-recourse | $ | 2,596.9 | $ | 2,517.2 | $ | 2,457.4 | $ | 1,199.1 | $ | 1,190.3 | |||||||||
| Stockholders' equity | $ | 2,137.6 | $ | 1,948.3 | $ | 1,845.7 | $ | 1,806.3 | $ | 1,912.3 | |||||||||
| Ratio of total debt to total capital | 58.8 | % | 60.4 | % | 61.2 | % | 50.5 | % | 48.1 | % | |||||||||
| Book value per share | $ | 27.02 | $ | 24.29 | $ | 23.13 | $ | 22.81 | $ | 24.08 | |||||||||
accompanying consolidated balance sheets.
•Company Overview
•Executive Summary
•Results of Operations
•Liquidity and Capital Resources
•Contractual Obligations and Commercial Commitments
•Critical Accounting Policies and Estimates
•Recent Accounting Pronouncements
Forward Looking•Forward-Looking Statements
As
| As of December 31, | ||||||||
| 2011 | 2010 | |||||||
| (in millions) | ||||||||
Rail Group | ||||||||
External Customers | $ | 1,973.2 | $ | 346.6 | ||||
Leasing Group | 621.9 | 111.0 | ||||||
|
|
|
| |||||
| $ | 2,595.1 | $ | 457.6 | |||||
Inland Barge | $ | 494.6 | $ | 508.0 | ||||
Structural wind towers | $ | 934.3 | $ | 1,000.0 | ||||
| December 31, 2012 | December 31, 2011 | ||||||
| (in millions) | |||||||
| Rail Group | |||||||
| External Customers | $ | 2,867.5 | $ | 1,973.2 | |||
| Leasing Group | 834.7 | 621.9 | |||||
| $ | 3,702.2 | $ | 2,595.1 | ||||
| Inland Barge | $ | 564.1 | $ | 494.6 | |||
| Structural wind towers | $ | 680.3 | $ | 934.3 | |||
remainder contracted for delivery in future years.
In May 2011, the Company’s inland barge manufacturing facility in Missouri experienced a flood resulting in significant damages to Trinity’s property and a temporary disruption of its production activities. The Company is insured against losses due to property damage and business interruption subject to certain deductibles. Trinity received $35.0 million in payments from its insurance carriers of which $22.7 million pertained to the replacement of or repairs to damaged property, plant, and equipment with a net book value of $5.7 million, with the remainder pertaining primarily to the reimbursement of flood-related expenses and lost production. Accordingly, the Company recognized a gain of $17.0 million in the fourth quarter of 2011 from the disposition of flood-damaged property, plant, and equipment. Additionally, our barge manufacturing operations incurred approximately $8.6 million in costs, net of insurance reimbursements, related to damages and lost productivity resulting from the flood. During the fourth quarter of 2011, the Company’s inland barge production capacity at its Missouri operations was restored to its pre-flood levels. With respect to the flood at our Tennessee manufacturing facility in May 2010, operating profit in 2011 includes insurance proceeds of $6.5 million and a $0.6 million gain from the disposition of damaged property, plant, and equipment related to the flood.
In July 2011, TRIP Rail Holdings LLC (“TRIP Holdings”) issued $175.0 million in Senior Secured Notes (the “TRIP Holdings Senior Secured Notes”) and TRIP Rail Master Funding LLC (“TRIP Master Funding”), a Delaware limited liability company and limited purpose, wholly-owned subsidiary of TRIP Holdings, issued $857.0 million in Secured Railcar Equipment Notes (the “TRIP Master Funding Secured Railcar Equipment Notes”). The proceeds from the TRIP Holdings Senior Secured Notes and the TRIP Master Funding Secured Railcar Equipment Notes were primarily used by TRIP Master Funding to purchase all of the railcar equipment owned by TRIP Rail Leasing LLC (“TRIP Leasing”) which, in turn, repaid the borrowings under its Warehouse Loan Agreement in full.
The TRIP Holdings Senior Secured Notes have a stated final maturity date of July 6, 2014 and bear interest at 8.00% payable quarterly with a yield to call interest rate of 12.00% for redemptions or other prepayments on or prior to January 15, 2013 and 15.00% for redemptions or other prepayments after such date. The TRIP Holdings Senior Secured Notes are secured, among other things, by a pledge of each equity investor’s ownership interest in TRIP Holdings and certain distributions made to TRIP Holdings from TRIP Master Funding and are non-recourse to Trinity, TILC, TRIP Master Funding, and the other equity investors in TRIP Holdings. Trinity purchased $112.0 million of the TRIP Holdings Senior Secured Notes in July 2011.
The TRIP Master Funding Secured Railcar Equipment Notes were issued pursuant to an Indenture, dated as of July 6, 2011 between TRIP Master Funding and Wilmington Trust Company, as indenture trustee, with a final maturity date in July 2041. The TRIP Master Funding Secured Railcar Equipment Notes consist of three classes of notes with the Class A-1a notes bearing interest at 4.37%, the Class A-1b notes bearing interest at Libor plus 2.50%
2010
| Year Ended December 31, 2012 | |||||||||||||||
| Revenues | Percent Change 2012 versus 2011 | ||||||||||||||
| External | Intersegment | Total | |||||||||||||
| ($ in millions) | |||||||||||||||
| Rail Group | $ | 1,512.1 | $ | 500.9 | $ | 2,013.0 | 57.9 | % | |||||||
| Construction Products Group | 461.2 | 22.5 | 483.7 | 6.7 | |||||||||||
| Inland Barge Group | 675.2 | — | 675.2 | 23.1 | |||||||||||
| Energy Equipment Group | 506.0 | 52.6 | 558.6 | 18.1 | |||||||||||
| Railcar Leasing and Management Services Group | 644.4 | 2.7 | 647.1 | 17.2 | |||||||||||
| All Other | 13.0 | 68.4 | 81.4 | 31.7 | |||||||||||
| Eliminations – Lease subsidiary | — | (485.9 | ) | (485.9 | ) | ||||||||||
| Eliminations – Other | — | (161.2 | ) | (161.2 | ) | ||||||||||
| Consolidated Total | $ | 3,811.9 | $ | — | $ | 3,811.9 | 29.7 | ||||||||
| Year Ended December 31, 2011 | |||||||||||||||
| Revenues | Percent Change 2011 versus 2010 | ||||||||||||||
| External | Intersegment | Total | |||||||||||||
| ($ in millions) | |||||||||||||||
| Rail Group | $ | 931.7 | $ | 343.0 | $ | 1,274.7 | 144.1 | % | |||||||
| Construction Products Group | 440.4 | 12.9 | 453.3 | 28.1 | |||||||||||
| Inland Barge Group | 548.5 | — | 548.5 | 29.9 | |||||||||||
| Energy Equipment Group | 454.8 | 18.0 | 472.8 | 12.7 | |||||||||||
| Railcar Leasing and Management Services Group | 551.4 | 0.6 | 552.0 | 18.8 | |||||||||||
| All Other | 11.5 | 50.3 | 61.8 | 27.4 | |||||||||||
| Eliminations – Lease subsidiary | — | (325.5 | ) | (325.5 | ) | ||||||||||
| Eliminations – Other | — | (99.3 | ) | (99.3 | ) | ||||||||||
| Consolidated Total | $ | 2,938.3 | $ | — | $ | 2,938.3 | 52.2 | ||||||||
| Year Ended December 31, 2010 | |||||||||||||||
| Revenues | |||||||||||||||
| External | Intersegment | Total | |||||||||||||
| ($ in millions) | |||||||||||||||
| Rail Group | $ | 289.7 | $ | 232.4 | $ | 522.1 | |||||||||
| Construction Products Group | 333.5 | 20.5 | 354.0 | ||||||||||||
| Inland Barge Group | 422.3 | — | 422.3 | ||||||||||||
| Energy Equipment Group | 408.5 | 11.1 | 419.6 | ||||||||||||
| Railcar Leasing and Management Services Group | 464.5 | — | 464.5 | ||||||||||||
| All Other | 12.2 | 36.3 | 48.5 | ||||||||||||
| Eliminations – Lease subsidiary | — | (216.8 | ) | (216.8 | ) | ||||||||||
| Eliminations – Other | — | (83.5 | ) | (83.5 | ) | ||||||||||
| Consolidated Total | $ | 1,930.7 | $ | — | $ | 1,930.7 | |||||||||
| Year Ended December 31, 2011 | ||||||||||||||||
| Revenues | Percent Change | |||||||||||||||
| External | Intersegment | Total | 2011 versus 2010 | |||||||||||||
| (in millions, except percents) | ||||||||||||||||
Rail Group | $ | 931.7 | $ | 343.0 | $ | 1,274.7 | 144.1 | % | ||||||||
Construction Products Group | 577.2 | 12.9 | 590.1 | 2.0 | % | |||||||||||
Inland Barge Group | 548.5 | — | 548.5 | 29.9 | % | |||||||||||
Energy Equipment Group | 454.8 | 18.0 | 472.8 | 12.7 | % | |||||||||||
Railcar Leasing and Management Services Group | 551.4. | 0.6 | 552.0 | 18.8 | % | |||||||||||
All Other | 11.5 | 50.3 | 61.8 | 27.4 | % | |||||||||||
Eliminations – lease subsidiary | — | (325.5 | ) | (325.5 | ) | |||||||||||
Eliminations – other | — | (99.3 | ) | (99.3 | ) | |||||||||||
|
|
|
|
|
| |||||||||||
Consolidated Total | $ | 3,075.1 | $ | — | $ | 3,075.1 | 42.7 | % | ||||||||
|
|
|
|
|
| |||||||||||
| Year Ended December 31, 2010 | ||||||||||||||||
| Revenues | Percent Change | |||||||||||||||
| External | Intersegment | Total | 2010 versus 2009 | |||||||||||||
| (in millions, except percents) | ||||||||||||||||
Rail Group | $ | 289.7 | $ | 232.4 | $ | 522.1 | (41.7 | )% | ||||||||
Construction Products Group | 558.3 | 20.5 | 578.8 | 7.5 | % | |||||||||||
Inland Barge Group | 422.3 | — | 422.3 | (19.9 | )% | |||||||||||
Energy Equipment Group | 408.5 | 11.1 | 419.6 | (17.7 | )% | |||||||||||
Railcar Leasing and Management Services Group | 464.5 | — | 464.5 | 25.5 | % | |||||||||||
All Other | 12.2 | 36.3 | 48.5 | 0.2 | % | |||||||||||
Eliminations – lease subsidiary | — | (216.8 | ) | (216.8 | ) | |||||||||||
Eliminations – other | — | (83.5 | ) | (83.5 | ) | |||||||||||
|
|
|
|
|
| |||||||||||
Consolidated Total | $ | 2,155.5 | $ | — | $ | 2,155.5 | (11.0 | )% | ||||||||
|
|
|
|
|
| |||||||||||
| Year Ended December 31, 2009 | ||||||||||||||||
| Revenues | ||||||||||||||||
| External | Intersegment | Total | ||||||||||||||
| (in millions) | ||||||||||||||||
Rail Group | $ | 485.2 | $ | 410.1 | $ | 895.3 | ||||||||||
Construction Products Group | 524.0 | 14.5 | 538.5 | |||||||||||||
Inland Barge Group | 527.3 | — | 527.3 | |||||||||||||
Energy Equipment Group | 502.2 | 7.8 | 510.0 | |||||||||||||
Railcar Leasing and Management Services Group | 370.2 | — | 370.2 | |||||||||||||
All Other | 12.0 | 36.4 | 48.4 | |||||||||||||
Eliminations – lease subsidiary | — | (391.6 | ) | (391.6 | ) | |||||||||||
Eliminations – other | — | (77.2 | ) | (77.2 | ) | |||||||||||
|
|
|
|
|
| |||||||||||
Consolidated Total | $ | 2,420.9 | $ | — | $ | 2,420.9 | ||||||||||
|
|
|
|
|
| |||||||||||
Our revenues for the yearyears ended December 31, 2012 and 2011 increased from the previous year primarily due to higher shipment volumes in our Rail and Inland Barge Groups while our Leasing Group experienced increased revenue primarily due to higher railcar sales from the lease fleet, higher rentalincreased revenues from lease fleet additions, and higher rental rates. Our revenues for the year ended December 31, 2010 decreased from 2009 primarily due to the impact
| Year Ended December 31, | ||||||||||||
| 2011 | 2010 | 2009 | ||||||||||
| (in millions) | ||||||||||||
Rail Group | $ | 77.3 | $ | 1.5 | $ | (355.9 | ) | |||||
Construction Products Group | 53.4 | 47.4 | 32.6 | |||||||||
Inland Barge Group | 106.4 | 69.0 | 125.2 | |||||||||
Energy Equipment Group | 8.9 | 35.1 | 73.8 | |||||||||
Railcar Leasing and Management Services Group | 254.5 | 207.0 | 149.0 | |||||||||
All Other | (3.8 | ) | (11.4 | ) | 0.8 | |||||||
Corporate | (43.6 | ) | (33.8 | ) | (30.8 | ) | ||||||
Eliminations – lease subsidiary | (28.3 | ) | (8.4 | ) | (22.6 | ) | ||||||
Eliminations – other | 0.5 | (2.6 | ) | (3.0 | ) | |||||||
|
|
|
|
|
| |||||||
Consolidated Total | $ | 425.3 | $ | 303.8 | $ | (30.9 | ) | |||||
|
|
|
|
|
| |||||||
| Year Ended December 31, | |||||||||||
| 2012 | 2011 | 2010 | |||||||||
| (in millions) | |||||||||||
| Rail Group | $ | 199.0 | $ | 77.3 | $ | 1.5 | |||||
| Construction Products Group | 44.8 | 54.9 | 37.8 | ||||||||
| Inland Barge Group | 124.7 | 106.4 | 69.0 | ||||||||
| Energy Equipment Group | 18.2 | 8.9 | 35.1 | ||||||||
| Railcar Leasing and Management Services Group | 300.9 | 254.5 | 207.0 | ||||||||
| All Other | (10.2 | ) | (3.8 | ) | (11.4 | ) | |||||
| Corporate | (51.5 | ) | (43.6 | ) | (33.8 | ) | |||||
| Eliminations – lease subsidiary | (50.8 | ) | (28.3 | ) | (8.4 | ) | |||||
| Eliminations – other | (0.3 | ) | 0.5 | (2.6 | ) | ||||||
| Consolidated Total | $ | 574.8 | $ | 426.8 | $ | 294.2 | |||||
Our operating profit for the year ended December 31,
| Year Ended December 31, | ||||||||||||
| 2011 | 2010 | 2009 | ||||||||||
| (in millions) | ||||||||||||
Interest income | $ | (1.5 | ) | $ | (1.4 | ) | $ | (1.7 | ) | |||
Interest expense | 185.3 | 182.1 | 123.2 | |||||||||
Other, net | 4.0 | 6.8 | (5.3 | ) | ||||||||
|
|
|
|
|
| |||||||
Total | $ | 187.8 | $ | 187.5 | $ | 116.2 | ||||||
|
|
|
|
|
| |||||||
| Year Ended December 31, | |||||||||||
| 2012 | 2011 | 2010 | |||||||||
| (in millions) | |||||||||||
| Interest income | $ | (1.5 | ) | $ | (1.5 | ) | $ | (1.4 | ) | ||
| Interest expense | 194.7 | 185.3 | 182.1 | ||||||||
| Other, net | (4.3 | ) | 4.0 | 6.8 | |||||||
| Consolidated Total | $ | 188.9 | $ | 187.8 | $ | 187.5 | |||||
| Year Ended December 31, | ||||||||||||
2011 | 2010 | 2009 | ||||||||||
Statutory rate | 35.0 | % | 35.0 | % | 35.0 | % | ||||||
State taxes | 2.1 | 3.3 | 1.9 | |||||||||
Impairment of goodwill | — | — | (23.7 | ) | ||||||||
Changes in valuation allowances | — | — | (6.5 | ) | ||||||||
Tax settlements | — | 4.4 | — | |||||||||
Changes in tax reserves | — | (9.6 | ) | — | ||||||||
Other, net | 1.6 | 2.0 | (0.3 | ) | ||||||||
|
|
|
|
|
| |||||||
Effective rate | 38.7 | % | 35.1 | % | 6.4 | % | ||||||
|
|
|
|
|
| |||||||
| Year Ended December 31, | ||||||||
| 2012 | 2011 | 2010 | ||||||
| Statutory rate | 35.0 | % | 35.0 | % | 35.0 | % | ||
| State taxes | 2.0 | 2.1 | 3.4 | |||||
| Tax settlements | (0.6 | ) | — | 4.8 | ||||
| Changes in tax reserves | (1.4 | ) | 0.4 | (10.7 | ) | |||
| Other, net | (0.3 | ) | 1.1 | 2.5 | ||||
| Effective rate | 34.7 | % | 38.6 | % | 35.0 | % | ||
The current provision for income taxes of $30.9$31.7 million exceedsexceeded expected cash taxes of $12.1 million related to 2011 income due to additional accruals for uncertain tax positions, refunds of excess payments from prior years, and prior year true ups.
| Year Ended December 31, | Percent Change | |||||||||||||||||||
| 2011 | 2010 | 2009 | 2011 versus 2010 | 2010 versus 2009 | ||||||||||||||||
| ($ in millions) | ||||||||||||||||||||
Revenues: | ||||||||||||||||||||
Rail | $ | 1,105.5 | $ | 391.9 | $ | 776.8 | 182.1 | % | (49.5 | )% | ||||||||||
Components | 169.2 | 130.2 | 118.5 | 30.0 | % | 9.9 | % | |||||||||||||
|
|
|
|
|
| |||||||||||||||
Total revenues | $ | 1,274.7 | $ | 522.1 | $ | 895.3 | 144.1 | % | (41.7 | )% | ||||||||||
Operating profit (loss) | $ | 77.3 | $ | 1.5 | $ | (355.9 | ) | |||||||||||||
Operating profit (loss) margin | 6.1 | % | 0.3 | % | (39.8 | )% | ||||||||||||||
Railcar shipments in 2011 increased by 9,315 railcars to approximately 14,065 railcars when compared with 2010. Railcars shipped in 2010 and 2009 were approximately 4,750 and 9,100 railcars, respectively.
| Year Ended December 31, | Percent Change | ||||||||||||||||
| 2012 | 2011 | 2010 | 2012 versus 2011 | 2011 versus 2010 | |||||||||||||
| ($ in millions) | |||||||||||||||||
| Revenues: | |||||||||||||||||
| Rail | $ | 1,850.5 | $ | 1,105.5 | $ | 391.9 | 67.4 | % | 182.1 | % | |||||||
| Components | 162.5 | 169.2 | 130.2 | (4.0 | ) | 30.0 | |||||||||||
| Total revenues | 2,013.0 | 1,274.7 | 522.1 | 57.9 | 144.1 | ||||||||||||
| Operating costs: | |||||||||||||||||
| Cost of revenues | 1,773.9 | 1,167.3 | 489.3 | 52.0 | 138.6 | ||||||||||||
| Selling, engineering, and administrative costs | 40.1 | 34.0 | 31.3 | 17.9 | 8.6 | ||||||||||||
| Property disposition (gains)/losses | — | (3.9 | ) | — | |||||||||||||
| Operating profit | $ | 199.0 | $ | 77.3 | $ | 1.5 | |||||||||||
| Operating profit margin | 9.9 | % | 6.1 | % | 0.3 | % | |||||||||||
| Year Ended December 31, | ||||||||||||
| 2011 | 2010 | 2009 | ||||||||||
| (in millions, except railcars) | ||||||||||||
External Customers | $ | 1,973.2 | $ | 346.6 | $ | 75.6 | ||||||
Leasing Group | 621.9 | 111.0 | 119.8 | |||||||||
|
|
|
|
|
| |||||||
Total | $ | 2,595.1 | $ | 457.6 | $ | 195.4 | ||||||
|
|
|
|
|
| |||||||
Number of railcars | 29,000 | 5,960 | 2,320 | |||||||||
For
| Year Ended December 31, | |||||||||||
| 2012 | 2011 | 2010 | |||||||||
| (in millions) | |||||||||||
| External Customers | $ | 2,867.5 | $ | 1,973.2 | $ | 346.6 | |||||
| Leasing Group | 834.7 | 621.9 | 111.0 | ||||||||
| Total | $ | 3,702.2 | $ | 2,595.1 | $ | 457.6 | |||||
| Year Ended December 31, | ||||||||
| 2012 | 2011 | 2010 | ||||||
| Beginning balance | 29,000 | 5,960 | 2,320 | |||||
| Orders received | 22,350 | 37,105 | 8,390 | |||||
| Shipments | (19,360 | ) | (14,065 | ) | (4,750 | ) | ||
| Ending balance | 31,990 | 29,000 | 5,960 | |||||
Operating profit for the Rail Group increased $75.8 million for the year ended December 31, 2011 compared to the same period last year. This increase was primarily due to significantly higher volume of railcars delivered during the year. Operating loss for the Rail Group decreased $357.4 million for the year ended December 31, 2010 compared to the prior year. This decrease was primarily due to a $325.0 million goodwill impairment charge during the quarter ended June 30, 2009. The effect of significantly reduced railcar shipments on operating profit during 2010 was partially offset by a reduction in operating expenses.
2017.
2012 | 55,200 | |||
2013 | 59,600 | |||
2014 | 62,100 | |||
2015 | 61,600 | |||
2016 | 60,000 |
TILC
| 2013 | 53,000 | |
| 2014 | 62,200 | |
| 2015 | 63,100 | |
| 2016 | 57,700 | |
| 2017 | 55,300 | |
| Year Ended December 31, | Percent Change | ||||||||||||||||
| 2012 | 2011 | 2010 | 2012 versus 2011 | 2011 versus 2010 | |||||||||||||
| ($ in millions) | |||||||||||||||||
| Revenues: | |||||||||||||||||
| Highway Products | $ | 376.1 | $ | 377.0 | $ | 312.9 | (0.2 | )% | 20.5 | % | |||||||
| Aggregates | 65.1 | 45.5 | 32.1 | 43.1 | 41.7 | ||||||||||||
| Other | 42.5 | 30.8 | 9.0 | * | * | ||||||||||||
| Total revenues | 483.7 | 453.3 | 354.0 | 6.7 | 28.1 | ||||||||||||
| Operating costs: | |||||||||||||||||
| Cost of revenues | 387.0 | 357.9 | 280.8 | 8.1 | 27.5 | ||||||||||||
| Selling, engineering, and administrative costs | 52.0 | 40.8 | 36.1 | 27.5 | 13.0 | ||||||||||||
| Property disposition (gains)/losses | (0.1 | ) | (0.3 | ) | (0.7 | ) | |||||||||||
| Operating profit | $ | 44.8 | $ | 54.9 | $ | 37.8 | |||||||||||
| Operating profit margin | 9.3 | % | 12.1 | % | 10.7 | % | |||||||||||
| Year Ended December 31, | Percent Change | |||||||||||||||||||
| 2011 | 2010 | 2009 | 2011 versus 2010 | 2010 versus 2009 | ||||||||||||||||
| ($ in millions) | ||||||||||||||||||||
Revenues: | ||||||||||||||||||||
Concrete and Aggregates | $ | 182.3 | $ | 256.9 | $ | 291.4 | (29.0 | )% | (11.8 | )% | ||||||||||
Highway Products | 377.0 | 312.9 | 238.0 | 20.5 | % | 31.5 | % | |||||||||||||
Other | 30.8 | 9.0 | 9.1 | * | (1.1 | )% | ||||||||||||||
|
|
|
|
|
| |||||||||||||||
Total revenues | $ | 590.1 | $ | 578.8 | $ | 538.5 | 2.0 | % | 7.5 | % | ||||||||||
Operating profit | $ | 53.4 | $ | 47.4 | $ | 32.6 | ||||||||||||||
Operating profit margin | 9.0 | % | 8.2 | % | 6.1 | % | ||||||||||||||
*not meaningful
| Year Ended December 31, | Percent Change | ||||||||||||||||
| 2012 | 2011 | 2010 | 2012 versus 2011 | 2011 versus 2010 | |||||||||||||
| ($ in millions) | |||||||||||||||||
| Revenues | $ | 675.2 | $ | 548.5 | $ | 422.3 | 23.1 | % | 29.9 | % | |||||||
| Operating costs: | |||||||||||||||||
| Cost of revenues | 538.9 | 445.0 | 350.3 | 21.1 | 27.0 | ||||||||||||
| Selling, engineering, and administrative costs | 15.4 | 14.7 | 12.7 | 4.8 | 15.7 | ||||||||||||
| Property disposition (gains)/losses | (3.8 | ) | (17.6 | ) | (9.7 | ) | |||||||||||
| Operating profit | $ | 124.7 | $ | 106.4 | $ | 69.0 | |||||||||||
| Operating profit margin | 18.5 | % | 19.4 | % | 16.3 | % | |||||||||||
Operating profitequipment that were under lease to third-party customers.
Inland Barge Group
| Year Ended December 31, | Percent Change | |||||||||||||||||||
| 2011 | 2010 | 2009 | 2011 versus 2010 | 2010 versus 2009 | ||||||||||||||||
| ($ in millions) | ||||||||||||||||||||
Revenues | $ | 548.5 | $ | 422.3 | $ | 527.3 | 29.9 | % | (19.9 | )% | ||||||||||
Operating profit | $ | 106.4 | $ | 69.0 | $ | 125.2 | ||||||||||||||
Operating profit margin | 19.4 | % | 16.3 | % | 23.7 | % | ||||||||||||||
Revenues and operating profit increased for the year ended December 31, 2011 compared to the prior year2010 due to higher volumes of tank barges and a change in the mix of tank barge types. In addition,As with 2012, we experienced improved efficiencies related to higher tank barge production in 2011 as compared with 2010.
| Impact to operating profit as a result of the floods Benefit (Cost) | ||||||||
| Year Ended December 31, | ||||||||
| 2011 | 2010 | |||||||
(in millions) | ||||||||
Tennessee flood – May 2010 | ||||||||
Costs, net of insurance advances related to damages and lost productivity | $ | — | $ | (4.6 | ) | |||
Insurance proceeds related to business interruption | 6.5 | — | ||||||
Gain on disposition of damaged property, plant, and equipment | 0.6 | 9.7 | ||||||
|
|
|
| |||||
| $ | 7.1 | $ | 5.1 | |||||
Missouri flood – May 2011 | ||||||||
Costs, net of insurance advances related to damages and lost productivity | $ | (8.6 | ) | $ | — | |||
Gain on disposition of damaged property, plant, and equipment | 17.0 | — | ||||||
|
|
|
| |||||
| 8.4 | — | |||||||
|
|
|
| |||||
Combined net effect of both floods | $ | 15.5 | $ | 5.1 | ||||
Excluding the net $5.1 million increase in operating profit in 2010 resulting from the effectsfollows:
Impact to Operating Profit as a Result of Floods Benefit (Cost) | |||||||||||
| Year Ended December 31, | |||||||||||
| 2012 | 2011 | 2010 | |||||||||
| (in millions) | |||||||||||
| Tennessee flood - May 2010 | |||||||||||
| Costs, net of insurance advances related to damages and lost productivity | $ | — | $ | — | $ | (4.6 | ) | ||||
| Insurance proceeds related to business interruption | — | 6.5 | — | ||||||||
| Gain on disposition of damaged property, plant, and equipment | — | 0.6 | 9.7 | ||||||||
| — | 7.1 | 5.1 | |||||||||
| Missouri flood - May 2011 | |||||||||||
| Costs, net of insurance advances related to damages and lost productivity | — | (8.6 | ) | — | |||||||
| Gain on disposition of damaged property, plant, and equipment | 0.4 | 17.0 | — | ||||||||
| 0.4 | 8.4 | — | |||||||||
| Combined net effect of both floods | $ | 0.4 | $ | 15.5 | $ | 5.1 | |||||
| Year Ended December 31, | Percent Change | |||||||||||||||||||
| 2011 | 2010 | 2009 | 2011 versus 2010 | 2010 versus 2009 | ||||||||||||||||
| ($ in millions) | ||||||||||||||||||||
Revenues: | ||||||||||||||||||||
Structural wind towers | $ | 245.2 | $ | 252.1 | $ | 358.3 | (2.7 | )% | (29.6 | )% | ||||||||||
Other | 227.6 | 167.5 | 151.7 | 35.9 | % | 10.4 | % | |||||||||||||
|
|
|
|
|
| |||||||||||||||
Total revenues | $ | 472.8 | $ | 419.6 | $ | 510.0 | 12.7 | % | (17.7 | )% | ||||||||||
Operating profit | $ | 8.9 | $ | 35.1 | $ | 73.8 | ||||||||||||||
Operating profit margin | 1.9 | % | 8.4 | % | 14.5 | % | ||||||||||||||
| Year Ended December 31, | Percent Change | ||||||||||||||||
| 2012 | 2011 | 2010 | 2012 versus 2011 | 2011 versus 2010 | |||||||||||||
| ($ in millions) | |||||||||||||||||
| Revenues: | |||||||||||||||||
| Structural wind towers | $ | 262.4 | $ | 245.2 | $ | 252.1 | 7.0 | % | (2.7 | )% | |||||||
| Other | 296.2 | 227.6 | 167.5 | 30.1 | 35.9 | ||||||||||||
| Total revenues | 558.6 | 472.8 | 419.6 | 18.1 | 12.7 | ||||||||||||
| Operating costs: | |||||||||||||||||
| Cost of revenues | 510.3 | 432.1 | 360.7 | 18.1 | 19.8 | ||||||||||||
| Selling, engineering, and administrative costs | 30.8 | 31.8 | 25.9 | (3.1 | ) | 22.8 | |||||||||||
| Property disposition (gains)/losses | (0.7 | ) | — | (2.1 | ) | ||||||||||||
| Operating profit | $ | 18.2 | $ | 8.9 | $ | 35.1 | |||||||||||
| Operating profit margin | 3.3 | % | 1.9 | % | 8.4 | % | |||||||||||
Revenues and operating profit decreased for the year ended towers.
wind towers shipped. As of December 31, 2011,2012
manufacture of towers.
| Year Ended December 31, | Percentage Change | ||||||||||||||||
| 2012 | 2011 | 2010 | 2012 versus 2011 | 2011 versus 2010 | |||||||||||||
| ($ in millions) | |||||||||||||||||
| Revenues: | |||||||||||||||||
| Wholly owned subsidiaries: | |||||||||||||||||
| Leasing and management | $ | 409.8 | $ | 375.1 | $ | 345.4 | 9.3 | % | 8.6 | % | |||||||
| Railcar sales | 118.6 | 59.4 | 3.1 | * | * | ||||||||||||
| 528.4 | 434.5 | 348.5 | 21.6 | 24.7 | |||||||||||||
| TRIP Holdings: | |||||||||||||||||
| Leasing and management | 118.7 | 117.5 | 116.0 | 1.0 | 1.3 | ||||||||||||
| Railcar sales | — | — | — | — | — | ||||||||||||
| 118.7 | 117.5 | 116.0 | 1.0 | 1.3 | |||||||||||||
| Total revenues | $ | 647.1 | $ | 552.0 | $ | 464.5 | 17.2 | 18.8 | |||||||||
| Operating Profit: | |||||||||||||||||
| Wholly-owned subsidiaries: | |||||||||||||||||
| Leasing and management | $ | 175.2 | $ | 156.3 | $ | 131.7 | |||||||||||
| Railcar sales: | |||||||||||||||||
| Railcars owned one year or less at the time of sale | 24.8 | 13.2 | 0.2 | ||||||||||||||
| Railcars owned more than one year at the time of sale | 32.8 | 11.8 | 6.6 | ||||||||||||||
| 232.8 | 181.3 | 138.5 | |||||||||||||||
| TRIP Holdings: | |||||||||||||||||
| Leasing and management | 67.4 | 68.8 | 68.5 | ||||||||||||||
| Railcar sales: | |||||||||||||||||
| Railcars owned one year or less at the time of sale | — | — | — | ||||||||||||||
| Railcars owned more than one year at the time of sale | 0.7 | 4.4 | — | ||||||||||||||
| 68.1 | 73.2 | 68.5 | |||||||||||||||
| Total operating profit | $ | 300.9 | $ | 254.5 | $ | 207.0 | |||||||||||
| Operating profit margin: | |||||||||||||||||
| Leasing and management | 45.9 | % | 45.7 | % | 43.4 | % | |||||||||||
| Railcar sales | * | * | * | ||||||||||||||
| Total operating profit margin | 46.5 | 46.1 | 44.6 | ||||||||||||||
Depreciation, interest, and rent expense(1): | |||||||||||||||||
| Depreciation expense | $ | 120.5 | $ | 115.7 | $ | 112.6 | |||||||||||
| Rent expense | $ | 50.9 | $ | 48.6 | $ | 48.6 | |||||||||||
| Interest expense: | |||||||||||||||||
| Wholly-owned subsidiaries | $ | 101.2 | $ | 101.3 | $ | 91.7 | |||||||||||
| TRIP Holdings: | |||||||||||||||||
| External | 60.0 | 53.1 | 46.9 | ||||||||||||||
| Intercompany | 13.1 | 6.4 | — | ||||||||||||||
| 73.1 | 59.5 | 46.9 | |||||||||||||||
| Total interest expense | $ | 174.3 | $ | 160.8 | $ | 138.6 | |||||||||||
| Fleet utilization: | |||||||||||||||||
| Wholly-owned subsidiaries | 98.4 | % | 99.3 | % | 99.3 | % | |||||||||||
| TRIP Holdings | 99.2 | % | 99.9 | % | 99.9 | % | |||||||||||
| Total fleet | 98.6 | % | 99.5 | % | 99.4 | % | |||||||||||
| Year Ended December 31, | Percent Change | |||||||||||||||||||
| 2011 | 2010 | 2009 | 2011 versus 2010 | 2010 versus 2009 | ||||||||||||||||
| ($ in millions) | ||||||||||||||||||||
Revenues: | ||||||||||||||||||||
Wholly-owned subsidiaries: | ||||||||||||||||||||
Leasing and management | $ | 375.1 | $ | 345.4 | $ | 329.3 | 8.6 | % | 4.9 | % | ||||||||||
Railcar sales(1) | 59.4 | 3.1 | 40.9 | * | * | |||||||||||||||
|
|
|
|
|
| |||||||||||||||
| 434.5 | 348.5 | 370.2 | 24.7 | % | (5.9 | )% | ||||||||||||||
TRIP Holdings: | ||||||||||||||||||||
Leasing and management | 117.5 | 116.0 | — | 1.3 | % | — | ||||||||||||||
Railcar sales(1) | — | — | — | — | — | |||||||||||||||
|
|
|
|
|
| |||||||||||||||
| 117.5 | 116.0 | — | 1.3 | % | — | |||||||||||||||
|
|
|
|
|
| |||||||||||||||
Total revenues | $ | 552.0 | $ | 464.5 | $ | 370.2 | 18.8 | % | 25.5 | % | ||||||||||
Operating profit: | ||||||||||||||||||||
Wholly-owned subsidiaries: | ||||||||||||||||||||
Leasing and management | $ | 156.3 | $ | 131.7 | $ | 128.5 | ||||||||||||||
Railcar sales(1): | ||||||||||||||||||||
Railcars owned one year or less at the time of sale | 13.2 | 0.2 | 2.1 | |||||||||||||||||
Railcars owned more than one year at the time of sale | 11.8 | 6.6 | 18.4 | |||||||||||||||||
|
|
|
|
|
| |||||||||||||||
| 181.3 | 138.5 | 149.0 | ||||||||||||||||||
TRIP Holdings: | ||||||||||||||||||||
Leasing and management | 68.8 | 68.5 | — | |||||||||||||||||
Railcar sales(1): | ||||||||||||||||||||
Railcars owned one year or less at the time of sale | — | — | — | |||||||||||||||||
Railcars owned more than one year at the time of sale | 4.4 | — | — | |||||||||||||||||
|
|
|
|
|
| |||||||||||||||
| 73.2 | 68.5 | — | ||||||||||||||||||
|
|
|
|
|
| |||||||||||||||
Total operating profit | $ | 254.5 | $ | 207.0 | $ | 149.0 | ||||||||||||||
Operating profit margin: | ||||||||||||||||||||
Leasing and management | 45.7 | % | 43.4 | % | 39.0 | % | ||||||||||||||
Railcar sales | * | * | * | |||||||||||||||||
Total operating profit margin | 46.1 | % | 44.6 | % | 40.2 | % | ||||||||||||||
Fleet utilization: | ||||||||||||||||||||
Wholly-owned subsidiaries | 99.3 | % | 99.3 | % | 97.8 | % | ||||||||||||||
TRIP Holdings | 99.9 | % | 99.9 | % | — | |||||||||||||||
Total fleet | 99.5 | % | 99.4 | % | 97.8 | % | ||||||||||||||
Total revenues increased for the year ended December 31, 20112012 compared to the prior year primarily due to increased railcar sales from the lease fleet, increased revenues related to additions to the lease fleet and higher rental rates. Total revenues increased for the year ended December 31, 2011 compared to 2010 primarily due to increased railcar sales from the lease fleet, as well as rental revenues related to additions to the lease fleet and higher rental rates. Total revenues decreased
revenues related to additions2012 when compared to the lease fleet of our wholly-owned subsidiaries. Additionally,prior year. Interest expense increased during 2012 compared with 2011 due to the adoption of an accounting pronouncement, the Leasing Group's results of operations for the years ended December 31, 2011 and December 31, 2010 include TRIP Holdings and its subsidiaries. See Notes 1 and 6refinancing of the Notes to Consolidated Financial Statements.
TRIP warehouse loan in 2011. Operating profit increased for the year ended
December 31, 2011 compared to2011.
| No. of cars | Average age | Average remaining lease term | ||||||||||
Wholly-owned subsidiaries | 54,595 | 6.6 | 3.5 | |||||||||
TRIP Holdings | 14,350 | 4.3 | 3.1 | |||||||||
|
| |||||||||||
Total fleet | 68,945 | 6.1 | 3.4 | |||||||||
| No. of cars | Average age | Average remaining lease term | ||||||
| Wholly-owned subsidiaries | 57,000 | 7.1 | 3.3 | |||||
| TRIP Holdings | 14,455 | 5.3 | 3.1 | |||||
| Total fleet | 71,455 | 6.7 | 3.3 | |||||
| Year Ended December 31, | Percent Change | |||||||||||||||||||
| 2011 | 2010 | 2009 | 2011 versus 2010 | 2010 versus 2009 | ||||||||||||||||
| ($ in millions) | ||||||||||||||||||||
Revenues | $ | 61.8 | $ | 48.5 | $ | 48.4 | 27.4 | % | 0.2 | % | ||||||||||
Operating profit (loss) | $ | (3.8 | ) | $ | (11.4 | ) | $ | 0.8 | ||||||||||||
| Year Ended December 31, | Percent Change | ||||||||||||||||
| 2012 | 2011 | 2010 | 2012 versus 2011 | 2011 versus 2010 | |||||||||||||
| ($ in millions) | |||||||||||||||||
| Revenues | $ | 81.4 | $ | 61.8 | $ | 48.5 | 31.7 | % | 27.4 | % | |||||||
| Operating costs: | |||||||||||||||||
| Cost of revenues | 86.8 | 61.8 | 55.6 | 40.5 | 11.2 | ||||||||||||
| Selling, engineering, and administrative costs | 5.2 | 5.8 | 5.3 | (10.3 | ) | 9.4 | |||||||||||
| Property disposition (gains)/losses | (0.4 | ) | (2.0 | ) | (1.0 | ) | |||||||||||
| Operating loss | $ | (10.2 | ) | $ | (3.8 | ) | $ | (11.4 | ) | ||||||||
sales volume.
| Year Ended December 31, | Percent Change | ||||||||||||||||
| 2012 | 2011 | 2010 | 2012 versus 2011 | 2011 versus 2010 | |||||||||||||
| ($ in millions) | |||||||||||||||||
| Operating costs | $ | (51.5 | ) | $ | (43.6 | ) | $ | (33.8 | ) | 18.1 | % | 29.0 | % | ||||
| Year Ended December 31, | Percent Change | |||||||||||||||||||
| 2011 | 2010 | 2009 | 2011 versus 2010 | 2010 versus 2009 | ||||||||||||||||
| ($ in millions) | ||||||||||||||||||||
Operating costs | $ | 43.6 | $ | 33.8 | $ | 30.8 | 29.0 | % | 9.7 | % | ||||||||||
The increase in operating costs for the yearyears ended December 31, 2012 and 2011 compared to 2010with the prior year is due to higher incentive and deferred compensation costs. Thecosts and an increase in operating costs for the year ended December 31, 2010 compared to 2009 is due to additional costs from the acquisitioncertain legal reserves.
| Year Ended December 31, | ||||||||||||
| 2011 | 2010 | 2009 | ||||||||||
| (in millions) | ||||||||||||
Total cash provided by (required by) | ||||||||||||
Operating activities | $ | 104.3 | $ | 170.5 | $ | 707.3 | ||||||
Investing activities | (85.0 | ) | (308.2 | ) | (187.4 | ) | ||||||
Financing activities | (22.2 | ) | (120.1 | ) | (69.9 | ) | ||||||
|
|
|
|
|
| |||||||
Net increase (decrease) in cash and cash equivalents | $ | (2.9 | ) | $ | (257.8 | ) | $ | 450.0 | ||||
|
|
|
|
|
| |||||||
2011
| Year Ended December 31, | |||||||||||
| 2012 | 2011 | 2010 | |||||||||
| (in millions) | |||||||||||
| Total cash provided by (required by): | |||||||||||
| Operating activities | $ | 527.4 | $ | 110.9 | $ | 170.5 | |||||
| Investing activities | (311.4 | ) | (85.0 | ) | (308.2 | ) | |||||
| Financing activities | 5.9 | (28.8 | ) | (120.1 | ) | ||||||
| Net increase (decrease) in cash and cash equivalents | $ | 221.9 | $ | (2.9 | ) | $ | (257.8 | ) | |||
2011
2011.
TILC warehouse loan facility. Debt retirements during 2010 totaled $363.9 million including $40.0 million in debt assumed as a result of the Quixote acquisition. We also purchased an additional equity interest in TRIP Holdings from one of its other investors for $28.6 million in the comparable prior year period. Restricted cash increased by $33.2 million during 2011. We intend to use our cash and committed credit facilities to fund the operations, expansions, and growth initiatives of the Company.
2010 compared with 2009
Operating Activities. Net cash provided by the operating activities of continuing operations for the year ended December 31, 2010 was $170.5 million compared to $707.3 million of net cash provided by the operating activities of continuing operations for the same period in 2009.
Accounts receivables at December 31, 2010 increased by $62.2 million or 39% since December 31, 2009 due to higher shipping volumes at year end primarily in our Rail and Energy Equipment Groups. Raw materials inventory at December 31, 2010 increased by $72.3 million or 75% since December 31, 2009 primarily attributable to higher levels in our Rail and Energy Equipment Groups required to meet production demands. Finished goods inventory decreased slightly by $9.3 million since December 31, 2009 primarily due to lower finished goods inventory in our Rail Group. Accounts payable increased by $53.4 million or 70% since December 31, 2009 primarily due to higher production activity while accrued liabilities decreased by $59.5 million due to the normal settlement of certain items during the year.
Investing Activities. Net cash required by investing activities of continuing operations for the year ended December 31, 2010 was $308.2 million compared to $187.4 million for the same period in 2009. Capital expenditures for the year ended December 31, 2010 were $254.8 million, of which $213.8 million were for net additions to the lease fleet and $12.0 million were for replacement of flood-damaged property. This compares to $390.4 million of capital expenditures for the same period in 2009, of which $343.0 million were for net additions to the lease fleet. Proceeds from the sale of property, plant, and equipment and other assets were $84.5 million for the year ended December 31, 2010, comprised primarily of the sale of assets in our Construction Products Group for $30.8 million, railcar sales from the lease fleet totaling $33.6 million, and proceeds from the disposition of flood-damaged property, plant and equipment of $12.0 million. This compares to $273.0 million for the same period in 2009 comprised primarily of railcar sales from the lease fleet, which included $144.4 million to TRIP Leasing, and the sale of non-operating assets. Cash required related to acquisitions amounted to $49.9 million, excluding $17.1 million in cash balances acquired from Quixote.
Financing Activities. Net cash required by financing activities during the years ended December 31, 2010 and 2009 was $120.1 million and $69.9 million, respectively. As stated previously, in 2010, TRL 2010 issued $369.2 million in aggregate principal amount of Secured Railcar Equipment Notes which are non-recourse to Trinity. A portion of the proceeds from the TRL 2010 financing was used to retire, in full, our 6.5% Senior Notes due March 2014 and repay a portion of our borrowings under our TILC warehouse loan facility. In addition,Debt retirements during the year ended December 31, 2010 we retired $40.0 totaled $363.5 million including $40.0 million in debt assumed as a result of the Quixote acquisition. We also purchased an additional equity interest in TRIP Holdings from one of its other investors for $28.6 million.$
28.6 million in the comparable prior year period. Restricted cash increased by $33.2 million during 2011.
As of December 31, 2011, peak borrowings for the year of $308.52012
On July 6, 2011, TRIP Holdings
The TRIP Master Funding Secured Railcar Equipment Notes were issued pursuant to an Indenture, dated July 6, 2011 between TRIP Master Funding and Wilmington Trust Company, as indenture trustee, with astated final maturity date in July 2041.of
On December 9, 2010,TRL
further increases.
Statements for information about the investment in TRIP Holdings.
Statements for information about off balance sheet arrangements.
2012
. See Note 11 of the Notes to Consolidated Financial Statements for a description of the Company's debt instruments.| Included in accompanying balance sheet at December 31, 2011 | ||||||||||||||||||||
| Notional Amount | Interest Rate(1) | Liability | AOCL —loss/ (income) | Noncontrolling Interest | ||||||||||||||||
| (in millions, except %) | ||||||||||||||||||||
Interest rate locks: | ||||||||||||||||||||
2005-2006 | $ | 200.0 | 4.87 | % | — | $ | (2.3 | ) | — | |||||||||||
2006-2007 | $ | 370.0 | 5.34 | % | — | $ | 10.6 | — | ||||||||||||
TRIP Holdings(2) | $ | 788.5 | 3.60 | % | — | $ | 23.4 | $ | 17.5 | |||||||||||
Interest rate swaps: | ||||||||||||||||||||
TRIP Rail Master Funding secured railcar equipment notes | $ | 89.5 | 2.62 | % | $ | 4.8 | $ | 2.7 | $ | 2.0 | ||||||||||
2008 debt issuance | $ | 474.7 | 4.13 | % | $ | 48.9 | $ | 46.7 | — | |||||||||||
| Included in accompanying balance sheet at December 31, 2012 | ||||||||||||||||||
Notional Amount | Interest Rate(1) | Liability | AOCL – loss/ (income) | Noncontrolling Interest | ||||||||||||||
| (in millions, except %) | ||||||||||||||||||
| Expired hedges: | ||||||||||||||||||
| 2006 secured railcar equipment notes | $ | 200.0 | 4.87 | % | $ | — | $ | (1.9 | ) | $ | — | |||||||
| Promissory notes | $ | 370.0 | 5.34 | % | $ | — | $ | 7.2 | $ | — | ||||||||
| TRIP Holdings | $ | 788.5 | 3.60 | % | $ | — | $ | 19.9 | $ | 14.9 | ||||||||
| Open hedges: | ||||||||||||||||||
| TRIP Master Funding secured railcar equipment notes | $ | 78.4 | 2.62 | % | $ | 5.2 | $ | 2.9 | $ | 2.2 | ||||||||
| Promissory notes | $ | 443.8 | 4.13 | % | $ | 37.6 | $ | 34.9 | $ | — | ||||||||
(1) | Weighted average fixed interest rate |
| Effect on interest expense-increase/(decrease) | |||||||||||||||
| Year Ended December 31, | Expected effect during next twelve months(1) | ||||||||||||||
| 2012 | 2011 | 2010 | |||||||||||||
| (in millions) | |||||||||||||||
| Expired hedges: | |||||||||||||||
| 2006 secured railcar equipment notes | $ | (0.3 | ) | $ | (0.4 | ) | $ | (0.4 | ) | $ | (0.3 | ) | |||
| Promissory notes | $ | 3.3 | $ | 3.5 | $ | 3.8 | $ | 3.1 | |||||||
| TRIP Holdings | $ | 6.0 | $ | 17.4 | $ | 29.3 | $ | 5.6 | |||||||
Open hedges(2): | |||||||||||||||
| TILC Warehouse | $ | — | $ | — | $ | 0.5 | $ | — | |||||||
| TRIP Master Funding secured railcar equipment notes | $ | 2.0 | $ | 1.1 | $ | — | $ | 1.8 | |||||||
| Promissory notes | $ | 18.4 | $ | 19.6 | $ | 19.7 | $ | 16.7 | |||||||
|
| Effect on interest expense — increase/(decrease) | ||||||||||||||||
| Expected effect during next twelve months(1) | ||||||||||||||||
| Year Ended December 31, | ||||||||||||||||
| 2011 | 2010 | 2009 | ||||||||||||||
| (in millions) | ||||||||||||||||
Interest rate locks: | ||||||||||||||||
2005-2006 | $ | (0.4 | ) | $ | (0.4 | ) | $ | (0.4 | ) | $ | (0.3 | ) | ||||
2006-2007 | $ | 3.5 | $ | 3.8 | $ | 4.0 | $ | 3.4 | ||||||||
TRIP Holdings(2) | $ | 17.4 | $ | 29.3 | — | $ | 6.0 | |||||||||
Interest rate swaps: | ||||||||||||||||
TILC warehouse | — | $ | 0.5 | $ | 2.9 | — | ||||||||||
TRIP Rail Master Funding secured railcar equipment notes | $ | 1.1 | — | — | $ | 1.7 | ||||||||||
2008 debt issuance | $ | 19.6 | $ | 19.7 | $ | 21.6 | $ | 17.0 | ||||||||
(1) | Based on fair value as of December 31, |
(2) |
|
hedges with changes in the fair value of the instruments of $4.5
In anticipation of a future debt issuance,
The effect on interest expense results primarily from monthly interest settlements.
| Effect on operating income — increase/(decrease) | ||||||||||||
| Year Ended December 31, | ||||||||||||
| 2011 | 2010 | 2009 | ||||||||||
| (in millions) | ||||||||||||
Fuel hedges(1) | ||||||||||||
Effect of mark to market valuation | $ | 0.0 | $ | 0.0 | $ | (0.3 | ) | |||||
Settlements | 0.4 | (0.1 | ) | (1.2 | ) | |||||||
|
|
|
|
|
| |||||||
| $ | 0.4 | $ | (0.1 | ) | $ | (1.5 | ) | |||||
Foreign exchange hedges(2) | $ | 0.1 | $ | (0.9 | ) | $ | (1.9 | ) | ||||
| Effect on operating income - increase/(decrease) | |||||||||||
| Year Ended December 31, | |||||||||||
| 2012 | 2011 | 2010 | |||||||||
| (in millions) | |||||||||||
Fuel hedges(1) | |||||||||||
| Effect of mark-to-market valuation | $ | 0.4 | $ | 0.0 | $ | 0.0 | |||||
| Settlements | 0.0 | 0.4 | (0.1 | ) | |||||||
| $ | 0.4 | $ | 0.4 | $ | (0.1 | ) | |||||
Foreign exchange hedges(2) | $ | (0.4 | ) | $ | 0.1 | $ | (0.9 | ) | |||
(1) | Included in cost of revenues in the accompanying consolidated statement of operations |
(2) | Included in other, net in the accompanying consolidated statement of operations |
2012 2012. Contractual Obligations and Commercial Commitments Debt and capital lease obligations: Debt: Parent and wholly-owned subsidiaries, excluding unamortized debt discount TRIP Holdings Capital lease obligations Interest Operating leases Obligations for purchase of goods and services1 Letters of credit Leasing Group — operating leases related to sale/leaseback transactions Other Total As of Goodwill is required to be tested for impairment annually, or on an interim basis, whenever events or circumstances change, indicating that the carrying amount of the goodwill might be impaired. The goodwill impairment test is a two-step process requiring the comparison of the reporting indemnification. However, estimates of future response costs are necessarily imprecise. Accordingly, there can be no assurance that we will not become involved in future litigation or other proceedings or, if we were found to be responsible or liable in any litigation or proceeding, that such costs would not be material to us. Assumptions used to determine benefit obligations at the annual measurement date were: Obligation discount rate Compensation increase rate Assumptions used to determine net periodic benefit costs were: Obligation discount rate Long-term rate of return on plan assets Compensation increase rate either of these assumptions on the net retirement cost for the year ended Assumptions: Obligation discount rate: Increase of 50 basis points Decrease of 50 basis points Long-term rate of return on plan assets: Increase of 50 basis points Decrease of 50 basis points Statements for information about recent accounting pronouncements. the cyclical nature of industries in which we compete; variations in weather in areas where our construction products are sold, used, or installed; naturally-occurring events and disasters causing disruption to our manufacturing, product deliveries, and production capacity, thereby giving rise to an increase in expenses, loss of revenue, and property losses; the timing of introduction of new products; the timing and delivery of customer orders or a breach of customer contracts; the credit worthiness of customers and their access to capital; product price changes; changes in mix of products sold; the extent of utilization of manufacturing capacity; availability and costs of steel, component parts, supplies, and other raw materials; competition and other competitive factors; changing technologies;Natural gas and diesel fuelWe maintain a program to mitigate the impact of fluctuations in the price of natural gas and diesel fuel purchases. The intent of the program is to protect our operating profit from adverse price changes by entering into derivative instruments. For those instruments that do not qualify for hedge accounting treatment, any changes in their valuation are recorded directly to the consolidated statement of operations. The amount recorded in the consolidated balance sheetssheet as of December 31, 2011 and 20102012 for these instruments was not significant.Foreign exchange hedgeWe enter into foreign exchange hedges to mitigate the impact on operating profit of unfavorable fluctuations in foreign currency exchange rates. These instruments are short term with quarterly maturities and no remaining balance in AOCL as of December 31, 2011 and 2010.Zinc.We maintain a program to mitigate the impact35Stock-Based CompensationWe have a stock-based compensation plan covering our employees and our Board of Directors. See Note 16 of the Notes to Consolidated Financial Statements.Employee Retirement PlansAs disclosed in Note 14 of the Notes to Consolidated Financial Statements, the projected benefit obligation for the employee retirement plans exceeds the plans’plans' assets by $74.2$102.4 million as of December 31, 20112012 as compared to $44.7$74.2 million as of December 31, 2010.2011. The change was primarily due to actual investment returns falling short of previous actuarial estimates and a fifty115 basis point reduction in the obligation discount rate assumption. We continue to sponsor an employee savings plan under the existing 401(k) plan that covers substantially all employees and includes both a company matching contribution and an annual retirement contribution of up to 3% each of eligible compensation based on our performance, as well as a Supplemental Profit Sharing Plan. Both the annual retirement contribution and the company matching contribution are discretionary, requiring board approval, and made annually with the investment of the funds directed by the participants.Employer contributions for the year ending December 31, 20122013 are expected to be $17.3$18.9 million for the defined benefit plans compared to $15.4$17.3 million contributed during 2011.2012. Employer contributions to the 401(k) plans and the Supplemental Profit Sharing Plan for the year ending December 31, 20122013 are expected to be $9.3$11.9 million compared to $8.2$9.3 million during 2011.During the first quarter of 2009, the Company amended its Supplemental Retirement Plan (the “Supplemental Plan”) to reduce future retirement plan costs. This amendment provided that all benefit accruals under the Supplemental Plan cease effective March 31, 2009, and the Supplemental Plan was frozen as of that date. In addition, the Company amended the Trinity Industries, Inc. Standard Pension Plan (the “Pension Plan”). This amendment was designed to reduce future pension costs and provided that, effective March 31, 2009, all future benefit accruals under the Pension Plan automatically cease for all participants, and the accrued benefits under the Pension Plan were determined and frozen as of that date. Accordingly, as a result of these amendments, accrued pension liability was reduced by $44.1 million with an offsetting reduction in funded status of pension liability included in AOCL.Contractual ObligationsObligation and Commercial CommitmentsAs of December 31, 2011,2012, we had the following contractual obligations and commercial commitments: Payments Due by Period Total 1 Year
or Less 2-3
Years 4-5
Years After
5 Years (in millions) $ 2,124.9 $ 80.0 $ 452.5 $ 503.2 $ 1,089.2 901.2 41.0 142.5 65.3 652.4 48.6 2.8 6.0 6.8 33.0 1,055.2 153.1 281.1 229.4 391.6 4,129.9 276.9 882.1 804.7 2,166.2 12.6 4.3 4.1 2.3 1.9 399.6 388.8 10.3 0.5 — 74.1 69.2 4.9 — — 633.5 52.8 106.5 99.0 375.2 10.9 5.6 3.0 2.3 — $ 5,260.6 $ 797.6 $ 1,010.9 $ 908.8 $ 2,543.3 Payments Due by Period Contractual Obligations and Commercial Commitments Total 1 Yearor Less 2-3Years 4-5Years After5 Years (in millions) Debt and capital lease obligations: Debt: Parent and wholly-owned subsidiaries, excluding unamortized debt discount $ 2,237.8 $ 95.0 $ 338.7 $ 502.8 $ 1,301.3 TRIP Holdings 858.9 41.0 137.0 49.7 631.2 Capital lease obligations 45.8 2.9 6.4 7.2 29.3 Interest 1,035.8 166.6 285.8 215.1 368.3 4,178.3 305.5 767.9 774.8 2,330.1 Operating leases 11.8 3.9 4.7 2.0 1.2 Obligations for purchase of goods and services1649.6 630.1 14.8 4.7 — Letters of credit 69.5 66.7 2.8 — — Leasing Group - operating leases related to sale/leaseback transactions 627.8 58.5 113.3 106.8 349.2 Other 17.5 14.9 1.8 0.8 — Total $ 5,554.5 $ 1,079.6 $ 905.3 $ 889.1 $ 2,680.5 1 Includes $567.1 million in purchase obligations for raw materials and components principally by the Rail, Inland Barge, and Energy Equipment Groups.1Includes $347.5 million in purchase obligations for raw materials and components principally by the Rail, Inland Barge, and Energy Equipment Groups.20112012 and 2010,2011, we had approximately $65.8$59.0 million and $48.0$65.8 million, respectively, of tax liabilities, including interest and penalties, related to uncertain tax positions. Because of the high degree of uncertainty regarding the timing of future cash outflows associated with these liabilities, we are unable to estimate the years in which settlement will occur with the respective taxing authorities. See Note 13 of the Notes to Consolidated Financial Statements.36Critical Accounting Policies and EstimatesManagement’sManagement's Discussion and Analysis of Financial Condition and Results of Operations discusses our consolidated financial statements, which have been prepared in accordance with accounting principles generally accepted in the United States.U.S. The preparation of these consolidated financial statements requires management to make estimates and assumptions that affect the reported amounts of assets and liabilities, the disclosure of contingent assets and liabilities at the date of the financial statements, and the reported amounts of revenues and expenses during the reporting period. On an on-going basis, management evaluates its estimates and judgments, including those related to bad debts, inventories, property, plant, and equipment, goodwill, income taxes, warranty obligations, insurance, restructuring costs, contingencies, and litigation. Management bases its estimates and judgments on historical experience and on various other factors that are believed to be reasonable under the circumstances, the results of which form the basis for making judgments about the carrying values of assets and liabilities that are not readily apparent from other sources. Actual results may differ from these estimates under different assumptions or conditions.We believe the following critical accounting policies, among others, affect our more significant judgments and estimates used in the preparation of our consolidated financial statements.InventoryWe state all our inventories at the lower of cost or market. Our policy related to excess and obsolete inventory requires thean analysis of inventory to be analyzed at the business unit level on a quarterly basis and to recordthe recording of any required adjustments. In assessing the ultimate realization of inventories, we are required to make judgments as to future demand requirements and compare that with the current or committed inventory levels. It is possible that changes in required inventory reserves may occur in the future due to then current market conditions.Long-lived AssetsWe periodically evaluate the carrying value of long-lived assets to be held and used for potential impairment. The carrying value of long-lived assets to be held and used is considered impaired only when the carrying value is not recoverable through undiscounted future cash flows and the fair value of the assets is less than its carrying value. Fair value is determined primarily using the anticipated cash flows discounted at a rate commensurate with the risks involved or market quotes as available. Impairment losses on long-lived assets held for sale are determined in a similar manner, except that fair values are reduced by the estimated cost to dispose of the assets.GoodwillGoodwillunit’sunit's estimated fair value with the carrying amount of its net assets. Step two of the impairment test is necessary to determine the amount of goodwill impairment to be recorded when the reporting unit’sunit's recorded net assets exceed its fair value. Impairment is assessed at the “reporting unit” level by applying a fair value-based test for each unit with recorded goodwill. The estimates and judgments that most significantly affect the fair value calculations are assumptions related to revenue and operating profit growth, discount rates and exit multiples. Due to an overall market decline for products in the Rail Group during the second quarter of 2009, we concluded that indications of impairment existed that required an interim goodwill impairment analysis. Accordingly, we tested the Rail Group’s goodwill for impairment as of June 30, 2009 and recorded a charge of $325.0 million during the second quarter of 2009. As of December 31, 2011,2012, the Company’sCompany's annual impairment test of goodwill was completed at the reporting unit level and no additional impairment charges were determined to be necessary. See Note 1 of the Notes to Consolidated Financial Statements for further explanation.Given the uncertainties of the economy and its potential impact on our businesses, there can be no assurance that our estimates and assumptions regarding the fair value of our reporting units, made for the purposes of the long-lived asset and goodwill impairment tests, will prove to be accurate predictions of the future. If our assumptions regarding forecasted cash flows are not achieved, it is possible that additional impairments of remaining goodwill and long-lived assets may be required.WarrantiesThe Company provides warranties against workmanship and materials defects generally ranging from one to five years depending on the product. The warranty costs are estimated using a two-step approach. First, an engineering estimate is made for the cost of all claims that have been filed by a customer. Second, based on historical claims experience, a cost is accrued for all products still within a warranty period for which no claims have been filed. The Company provides for the estimated cost of product warranties at the time revenue is recognized related to products covered by warranties and assesses the adequacy of the resulting reserves on a quarterly basis.37InsuranceWe are effectively self-insured for workers’workers' compensation claims. A third-party administrator processes all such claims. We accrue our workers’workers' compensation liability based upon independent actuarial studies. To the extent actuarial assumptions change and claims experience rates differ from historical rates, our liability may change.Contingencies and LitigationThe Company is involved in claims and lawsuits incidental to our business. Based on information currently available with respect to such claims and lawsuits, including information on claims and lawsuits as to which the Company is aware but for which the Company has not been served with legal process, it is management’smanagement's opinion that the ultimate outcome of all currentsuch claims and litigation, and other claims, including settlements, in the aggregate will not have a material adverse effect on the Company’sCompany's overall financial condition for purposes of financial reporting. However, resolution of certain claims or lawsuits by settlement or otherwise, could impact the operating results of the reporting period in which such resolution occurs.EnvironmentalWe are involved in various proceedings related to environmental matters. We have provided reserves to cover probable and estimable liabilities with respect to such proceedings, taking into account currently available information and our contractual rights ofIncome TaxesThe Company accounts for income taxes under the asset and liability method prescribed by ASC 740. See Note 13 in the Notes to Consolidated Financial Statements. Deferred tax assets and liabilities are recognized for the future tax consequences attributable to temporary differences between the financial statement carrying amount of existing assets and liabilities and their respective tax bases and other tax attributes using currently enacted tax rates. The effect of a change in tax rates on deferred tax assets and liabilities is recognized in income in the period that includes the enactment date. Management is required to estimate the timing of the recognition of deferred tax assets and liabilities, make assumptions about the future deductibility of deferred tax assets and assess deferred tax liabilities based on enacted law and tax rates for the appropriate tax jurisdictions to determine the amount of such deferred tax assets and liabilities. Changes in the calculated deferred tax assets and liabilities may occur in certain circumstances, including statutory income tax rate changes, statutory tax law changes, changes in the anticipated timing of recognition of deferred tax assets and liabilities or changes in the structure or tax status of the Company. The Company assesses whether a valuation allowance should be established against its deferred tax assets based on consideration of all available evidence, both positive and negative, using a more likely than not standard. This assessment considers, among other matters, the nature, frequency and severity of recent losses; a forecast of future profitability; the duration of statutory carryback and carryforward periods; the Company’sCompany's experience with tax attributes expiring unused; and tax planning alternatives.At December 31, 2011,2012, the Company, excluding TRIP Holdings, had $124.2$103.3 million of Federal consolidated net operating loss carryforwards after the estimated current year utilization of $42.9 million, and tax-effected $5.6$5.4 million of state loss carryforwards. The Company has $42.2 million of foreign tax credit carryforwards which will expire between 2014 and 2022. The Federal net operating loss carryforwards are due to expire between 2028 and 2031. We have established a valuation allowance for Federal, state, and foreign tax operating losses and credits which may not be realizable. We believe that it is more likely than not that we will be able to generate sufficient future taxable income to utilize the remaining deferred tax assets.TRIP Holdings had $383.3$439.7 million in Federal tax loss carryforwards at December 31, 2011.2012 which are due to expire between 2027 and 2032. We expect TRIP Holdings to begin utilizing their tax loss carryforwards beginning in 2020. Because TRIP Holdings files a separate tax return from the Company, its tax loss carryforwards can only be used by TRIP Holdings and cannot be used to offset future taxable income of the Company. The Federal tax loss carryforwards are due to expire between 2024 and 2031. Our ability to utilize the tax loss carryforwards that were acquired as part of the Quixote acquisition against future taxable income is subject to restrictions under the Internal Revenue Code. We have established a valuation allowance for Federal, state, and foreign tax operating losses which may not be realizable.At times, we may claim tax benefits that may be challenged by a tax authority. We recognize tax benefits only for tax positions that are more likely than not to be sustained upon examination by tax authorities. The amount recognized is measured as the largest amount of benefit that is greater than 50 percent likely to be realized upon settlement. A liability for “unrecognized tax benefits” is recorded for any tax benefits claimed in our tax returns that do not meet these recognition and measurement standards.38PensionsThe Company sponsors defined benefit plans which provide retirement income and death benefits for certain eligible employees. The Company’sCompany's pension costs and liabilities are primarily determined using actuarial assumptions regarding the long-term rate of return on plan assets and the discount rate used to determine the present value of future benefit obligations. The compensation increase rate assumption pertains solely to the pension plan of the Company’sCompany's Inland Barge segment as the accrued benefits of the Company’sCompany's remaining pension plans were frozen in 2009. Pension assumptions are reviewed annually by outside actuaries and the Company’sCompany's management. These actuarial assumptions are summarized in the following table: Year Ended December 31, �� 2011 2010 2009 5.40 % 5.90 % 6.10 % 3.00 % 3.00 % 3.00 % 5.90 % 6.10 % 6.50 % 7.75 % 7.75 % 7.75 % 3.00 % 3.00 % 4.00 % Year Ended December 31, 2012 2011 2010 Assumptions used to determine benefit obligations at the annual measurement date were: Obligation discount rate 4.25 % 5.40 % 5.90 % Compensation increase rate 4.00 % 3.00 % 3.00 % Assumptions used to determine net periodic benefit costs were: Obligation discount rate 5.40 % 5.90 % 6.10 % Long-term rate of return on plan assets 7.75 % 7.75 % 7.75 % Compensation increase rate 3.00 % 3.00 % 3.00 % The obligation discount rate assumption is determined by deriving a single discount rate from a theoretical settlement portfolio of high quality corporate bonds sufficient to provide for the plans’plans' projected benefit payments. The expected long-term rate of return on plan assets is an assumption reflecting the anticipated weighted average rate of earnings on the portfolio over the long-term. To arrive at this rate, we developed estimates based upon the anticipated performance of the assets in its portfolio. The effect of a change in20112012 and on the projected benefit obligations at December 31, 20112012 is summarized as follows: Effect on Net
Retirement Cost for
the Year Ended
December 31, 2011 Effect on
Projected Benefit
Obligations at
December 31,
2011 Increase/(decrease)
(in millions) $ (0.2 ) $ (22.1 ) $ 0.4 $ 23.5 $ (1.5 ) $ — $ 1.5 $ — Effect on Net Retirement Cost for the Year Ended December 31, 2012 Effect on Projected Benefit Obligations at December 31, 2012 Assumptions: Increase/(decrease)(in millions)Obligation discount rate: Increase of 50 basis points $ (0.5 ) $ (29.0 ) Decrease of 50 basis points $ 0.5 $ 32.3 Long-term rate of return on plan assets: Increase of 50 basis points $ (1.5 ) $ — Decrease of 50 basis points $ 1.5 $ — Recent Accounting PronouncementsSee Note 1 of the Notes to Consolidated Financial Statements.39Forward-Looking StatementsThis annual report on Form 10-K (or statements otherwise made by the Company or on the Company’s behalf from time to time in other reports, filings with the SEC,Securities and Exchange Commission (“SEC”), news releases, conferences, World Wide Web postings or otherwise) contains forward-looking statements within the meaning of the Private Securities Litigation Reform Act of 1995. Any statements contained herein that are not historical facts are forward-looking statements and involve risks and uncertainties. These forward-looking statements include expectations, beliefs, plans, objectives, future financial performances, estimates, projections, goals, and forecasts. Trinity uses the words “anticipates,” “believes,” “estimates,” “expects,” “intends,” “forecasts,” “may,” “will,” “should,” and similar expressions to identify these forward-looking statements. Potential factors, which could cause our actual results of operations to differ materially from those in the forward-looking statements include, among others:market conditions and demand for our business products and services;
surcharges and other fees added to fixed pricing agreements for steel, component parts, supplies and other raw materials;
interest rates and capital costs;
counter-party risks for financial instruments;
long-term funding of our operations;
taxes;
the stability of the governments and political and business conditions in certain foreign countries, particularly Mexico;
changes in import and export quotas and regulations;
business conditions in emerging economies;
costs and results of litigation; and
legal, regulatory, and environmental issues.
2012
.| Page | ||||
Due to the adoption
Contents
We have audited Trinity Industries, Inc. and Subsidiaries’ internal control over financial reporting as of December 31, 2011, based on criteria established in Internal Control — Integrated Framework issued by the Committee of Sponsoring Organizations of the Treadway Commission (the COSO criteria). Trinity Industries, Inc. and Subsidiaries’ management is responsible for maintaining effective internal control over financial reporting, and for its assessment of the effectiveness of internal control over financial reporting included in the accompanying Management’s Report on Internal Control over Financial Reporting. Our responsibility is to express an opinion on the Company’s internal control over financial reporting based on our audit.
We conducted our audit in accordance with the standards of the Public Company Accounting Oversight Board (United States). Those standards require that we plan and perform the audit to obtain reasonable assurance about whether effective internal control over financial reporting was maintained in all material respects. Our audit included obtaining an understanding of internal control over financial reporting, assessing the risk that a material weakness exists, testing and evaluating the design and operating effectiveness of internal control based on the assessed risk, and performing such other procedures as we considered necessary in the circumstances. We believe that our audit provides a reasonable basis for our opinion.
A company’s internal control over financial reporting is a process designed to provide reasonable assurance regarding the reliability of financial reporting and the preparation of financial statements for external purposes in accordance with generally accepted accounting principles. A company’s internal control over financial reporting includes those policies and procedures that (1) pertain to the maintenance of records that, in reasonable detail, accurately and fairly reflect the transactions and dispositions of the assets of the company; (2) provide reasonable assurance that transactions are recorded as necessary to permit preparation of financial statements in accordance with generally accepted accounting principles, and that receipts and expenditures of the company are being made only in accordance with authorizations of management and directors of the company; and (3) provide reasonable assurance regarding prevention or timely detection of unauthorized acquisition, use, or disposition of the company’s assets that could have a material effect on the financial statements.
Because of its inherent limitations, internal control over financial reporting may not prevent or detect misstatements. Also, projections of any evaluation of effectiveness to future periods are subject to the risk that controls may become inadequate because of changes in conditions, or that the degree of compliance with the policies or procedures may deteriorate.
In our opinion, Trinity Industries, Inc. and Subsidiaries maintained, in all material respects, effective internal control over financial reporting as of December 31, 2011, based on the COSO criteria.
We also have audited, in accordance with the standards of the Public Company Accounting Oversight Board (United States), the consolidated balance sheets of Trinity Industries, Inc. and Subsidiaries as of December 31, 2011 and 2010, and the related consolidated statements of operations, cash flows, and stockholders’ equity for each of the three years in the period ended December 31, 2011 of Trinity Industries, Inc. and Subsidiaries and our report dated February 16, 2012 expressed an unqualified opinion thereon.
/s/ ERNST & YOUNG LLP
Dallas, Texas
February 16, 2012
Report of Independent Registered Public Accounting Firm
The Board of Directors and Stockholders
Trinity Industries, Inc.
As discussed in Note 1 to the consolidated financial statements, during the year ended December 31, 2010, the Company adopted a new accounting standard relating to consolidation of variable interest entities.
/s/ ERNST & YOUNG LLP
| /s/ ERNST & YOUNG LLP |
21, 2013
| Year Ended December 31, | ||||||||||||
| 2011 | 2010 | 2009 | ||||||||||
| (in millions, except per share data) | ||||||||||||
Revenues: | ||||||||||||
Manufacturing | $ | 2,523.7 | $ | 1,691.0 | $ | 2,050.7 | ||||||
Leasing | 551.4 | 464.5 | 370.2 | |||||||||
|
|
|
|
|
| |||||||
| 3,075.1 | 2,155.5 | 2,420.9 | ||||||||||
Operating costs: | ||||||||||||
Cost of revenues: | ||||||||||||
Manufacturing | 2,164.7 | 1,434.7 | 1,712.5 | |||||||||
Leasing | 290.3 | 244.0 | 226.7 | |||||||||
Other | 27.9 | 10.9 | 25.7 | |||||||||
|
|
|
|
|
| |||||||
| 2,482.9 | 1,689.6 | 1,964.9 | ||||||||||
Selling, engineering, and administrative expenses: | ||||||||||||
Manufacturing | 142.2 | 132.3 | 142.5 | |||||||||
Leasing | 23.4 | 20.1 | 12.9 | |||||||||
Other | 43.5 | 33.9 | 30.7 | |||||||||
|
|
|
|
|
| |||||||
| 209.1 | 186.3 | 186.1 | ||||||||||
Goodwill impairment | — | — | 325.0 | |||||||||
Gain on disposition of property, plant, and equipment: | ||||||||||||
Net gains on lease fleet sales | 16.2 | 6.6 | 18.4 | |||||||||
Disposition of flood-damaged property, plant, and equipment | 17.6 | 9.7 | — | |||||||||
Other | 8.4 | 7.9 | 5.8 | |||||||||
|
|
|
|
|
| |||||||
| 42.2 | 24.2 | 24.2 | ||||||||||
|
|
|
|
|
| |||||||
Total operating profit (loss) | 425.3 | 303.8 | (30.9 | ) | ||||||||
Other (income) expense: | ||||||||||||
Interest income | (1.5 | ) | (1.4 | ) | (1.7 | ) | ||||||
Interest expense | 185.3 | 182.1 | 123.2 | |||||||||
Other, net | 4.0 | 6.8 | (5.3 | ) | ||||||||
|
|
|
|
|
| |||||||
| 187.8 | 187.5 | 116.2 | ||||||||||
|
|
|
|
|
| |||||||
Income (loss) before income taxes | 237.5 | 116.3 | (147.1 | ) | ||||||||
Provision (benefit) for income taxes: | ||||||||||||
Current | 30.9 | (19.2 | ) | 14.4 | ||||||||
Deferred | 60.9 | 60.1 | (23.8 | ) | ||||||||
|
|
|
|
|
| |||||||
| 91.8 | 40.9 | (9.4 | ) | |||||||||
|
|
|
|
|
| |||||||
Net income (loss) | 145.7 | 75.4 | (137.7 | ) | ||||||||
Net income attributable to noncontrolling interest | 3.5 | 8.0 | — | |||||||||
|
|
|
|
|
| |||||||
Net income (loss) attributable to Trinity Industries, Inc. | $ | 142.2 | $ | 67.4 | $ | (137.7 | ) | |||||
|
|
|
|
|
| |||||||
Net income (loss) attributable to Trinity Industries, Inc. per common share: | ||||||||||||
Basic | $ | 1.77 | $ | 0.85 | $ | (1.81 | ) | |||||
Diluted | $ | 1.77 | $ | 0.85 | $ | (1.81 | ) | |||||
Weighted average number of shares outstanding: | ||||||||||||
Basic | 77.5 | 76.8 | 76.4 | |||||||||
Diluted | 77.8 | 77.0 | 76.4 | |||||||||
Dividends declared per common share | $ | 0.35 | $ | 0.32 | $ | 0.32 | ||||||
| Year Ended December 31, | |||||||||||
| 2012 | 2011 | 2010 | |||||||||
| (in millions, except per share amounts) | |||||||||||
| Revenues: | |||||||||||
| Manufacturing | $ | 3,167.5 | $ | 2,386.9 | $ | 1,466.2 | |||||
| Leasing | 644.4 | 551.4 | 464.5 | ||||||||
| 3,811.9 | 2,938.3 | 1,930.7 | |||||||||
| Operating costs: | |||||||||||
| Cost of revenues: | |||||||||||
| Manufacturing | 2,649.9 | 2,039.3 | 1,236.3 | ||||||||
| Leasing | 350.3 | 290.3 | 244.0 | ||||||||
| Other | 51.3 | 27.9 | 10.9 | ||||||||
| 3,051.5 | 2,357.5 | 1,491.2 | |||||||||
| Selling, engineering, and administrative expenses: | |||||||||||
| Manufacturing | 143.4 | 127.1 | 111.4 | ||||||||
| Leasing | 29.4 | 23.4 | 20.1 | ||||||||
| Other | 51.3 | 43.5 | 33.9 | ||||||||
| 224.1 | 194.0 | 165.4 | |||||||||
| Gains on disposition of property, plant, and equipment: | |||||||||||
| Net gains on railcar lease fleet sales | 33.5 | 16.2 | 6.6 | ||||||||
| Disposition of flood-damaged property, plant, and equipment | 0.4 | 17.6 | 9.7 | ||||||||
| Other | 4.6 | 6.2 | 3.8 | ||||||||
| 38.5 | 40.0 | 20.1 | |||||||||
| Total operating profit | 574.8 | 426.8 | 294.2 | ||||||||
| Other (income) expense: | |||||||||||
| Interest income | (1.5 | ) | (1.5 | ) | (1.4 | ) | |||||
| Interest expense | 194.7 | 185.3 | 182.1 | ||||||||
| Other, net | (4.3 | ) | 4.0 | 6.8 | |||||||
| 188.9 | 187.8 | 187.5 | |||||||||
| Income from continuing operations before income taxes | 385.9 | 239.0 | 106.7 | ||||||||
| Provision (benefit) for income taxes: | |||||||||||
| Current | 7.7 | 31.7 | (31.2 | ) | |||||||
| Deferred | 126.3 | 60.5 | 68.5 | ||||||||
| 134.0 | 92.2 | 37.3 | |||||||||
| Net income from continuing operations | 251.9 | 146.8 | 69.4 | ||||||||
| Income (loss) from discontinued operations, net of provision (benefit) for income taxes of $1.1, $(0.4), and $3.6 | 1.8 | (1.1 | ) | 6.0 | |||||||
| Net income | 253.7 | 145.7 | 75.4 | ||||||||
| Net income (loss) attributable to noncontrolling interest | (1.5 | ) | 3.5 | 8.0 | |||||||
| Net income attributable to Trinity Industries, Inc. | $ | 255.2 | $ | 142.2 | $ | 67.4 | |||||
| Net income (loss) attributable to Trinity Industries, Inc. per common share: | |||||||||||
| Basic: | |||||||||||
| Continuing operations | $ | 3.18 | $ | 1.78 | $ | 0.77 | |||||
| Discontinued operations | 0.02 | (0.01 | ) | 0.08 | |||||||
| $ | 3.20 | $ | 1.77 | $ | 0.85 | ||||||
| Diluted: | |||||||||||
| Continuing operations | $ | 3.17 | $ | 1.78 | $ | 0.77 | |||||
| Discontinued operations | 0.02 | (0.01 | ) | 0.08 | |||||||
| $ | 3.19 | $ | 1.77 | $ | 0.85 | ||||||
| Weighted average number of shares outstanding: | |||||||||||
| Basic | 77.3 | 77.5 | 76.8 | ||||||||
| Diluted | 77.5 | 77.8 | 77.0 | ||||||||
| Dividends declared per common share | $ | 0.42 | $ | 0.35 | $ | 0.32 | |||||
| December 31, 2011 | December 31, 2010 | |||||||
| (in millions) | ||||||||
ASSETS |
| |||||||
Cash and cash equivalents | $ | 351.1 | $ | 354.0 | ||||
Short-term marketable securities | — | 158.0 | ||||||
Receivables, net of allowance for doubtful accounts of $8.3 and $5.5 | 384.3 | 232.0 | ||||||
Income tax receivable | 1.6 | 7.4 | ||||||
Inventories: | ||||||||
Raw materials and supplies | 324.8 | 169.4 | ||||||
Work in process | 125.6 | 83.3 | ||||||
Finished goods | 99.5 | 78.6 | ||||||
|
|
|
| |||||
| 549.9 | 331.3 | |||||||
Restricted cash, including TRIP Holdings of $74.6 and $46.0 | 240.3 | 207.1 | ||||||
Property, plant, and equipment, at cost, including TRIP Holdings of $1,257.7 and $1,282.1 | 5,407.9 | 5,202.2 | ||||||
Less accumulated depreciation, including TRIP Holdings of $122.7 and $90.3 | (1,228.4 | ) | (1,090.2 | ) | ||||
|
|
|
| |||||
| 4,179.5 | 4,112.0 | |||||||
Goodwill | 225.9 | 197.6 | ||||||
Other assets | 188.4 | 160.6 | ||||||
|
|
|
| |||||
| $ | 6,121.0 | $ | 5,760.0 | |||||
|
|
|
| |||||
LIABILITIES AND STOCKHOLDERS’ EQUITY |
| |||||||
Accounts payable | $ | 207.4 | $ | 132.8 | ||||
Accrued liabilities | 421.3 | 375.6 | ||||||
Debt: | ||||||||
Recourse, net of unamortized discount of $99.8 and $111.1 | 457.7 | 450.3 | ||||||
Non-recourse: | ||||||||
Parent and wholly-owned subsidiaries | 1,616.0 | 1,453.5 | ||||||
TRIP Holdings | 901.2 | 1,003.9 | ||||||
|
|
|
| |||||
| 2,974.9 | 2,907.7 | |||||||
Deferred income | 38.7 | 33.6 | ||||||
Deferred income taxes | 434.7 | 391.0 | ||||||
Other liabilities | 95.7 | 73.6 | ||||||
|
|
|
| |||||
| 4,172.7 | 3,914.3 | |||||||
Stockholders’ equity: | ||||||||
Preferred stock — 1.5 shares authorized and un-issued | — | — | ||||||
Common stock — shares authorized — 200.0; shares issued and outstanding at December 31, 2011 — 81.7; at December 31, 2010 — 81.7 | 81.7 | 81.7 | ||||||
Capital in excess of par value | 626.5 | 606.1 | ||||||
Retained earnings | 1,314.7 | 1,200.5 | ||||||
Accumulated other comprehensive loss | (134.0 | ) | (95.5 | ) | ||||
Treasury stock — at December 31, 2011 — 1.5 shares; at December 31, 2010 — 1.9 shares | (25.1 | ) | (28.0 | ) | ||||
|
|
|
| |||||
| 1,863.8 | 1,764.8 | |||||||
Noncontrolling interest | 84.5 | 80.9 | ||||||
|
|
|
| |||||
| 1,948.3 | 1,845.7 | |||||||
|
|
|
| |||||
| $ | 6,121.0 | $ | 5,760.0 | |||||
|
|
|
| |||||
Statements of Comprehensive Income
| Year Ended December 31, | ||||||||||||
| 2012 | 2011 | 2010 | ||||||||||
| (in millions) | ||||||||||||
| Net income | $ | 253.7 | $ | 145.7 | $ | 75.4 | ||||||
| Other comprehensive income (loss): | ||||||||||||
| Unrealized loss on derivative financial instruments: | ||||||||||||
| Unrealized gain (loss) arising during the period, net of tax expense (benefit) of $4.2, $(1.9), and $(10.4) | 7.2 | (3.9 | ) | (18.5 | ) | |||||||
| Reclassification adjustments for losses included in net income, net of tax expense of $3.2, $2.3, and $1.3 | 5.8 | 4.1 | 2.1 | |||||||||
| Currency translation adjustment – reclassification adjustment for loss included in net income, net of tax expense of $0.4, $0.0, and $0.0 | 0.6 | 0.0 | 0.0 | |||||||||
| Net actuarial gains (losses) of defined benefit plans: | ||||||||||||
| Unrealized gain (loss) arising during the period, net of tax expense (benefit) of $(17.8), $(17.5), and $4.4 | (30.3 | ) | (29.8 | ) | 7.5 | |||||||
| Amortization of net actuarial loss, net of tax expense of $1.1, $0.6, and $0.8 | 2.2 | 1.2 | 1.2 | |||||||||
| Other, net of tax benefit of $-, $-, and $0.7 | — | — | 1.1 | |||||||||
| (14.5 | ) | (28.4 | ) | (6.6 | ) | |||||||
| Comprehensive income | 239.2 | 117.3 | 68.8 | |||||||||
| Less: comprehensive income (loss) attributable to noncontrolling interest | 0.1 | 3.6 | (1.1 | ) | ||||||||
| Comprehensive income attributable to Trinity Industries, Inc. | $ | 239.1 | $ | 113.7 | $ | 69.9 | ||||||
| Year Ended December 31, | ||||||||||||
| 2011 | 2010 | 2009 | ||||||||||
| (in millions) | ||||||||||||
Operating activities: | ||||||||||||
Net income (loss) | $ | 145.7 | $ | 75.4 | $ | (137.7 | ) | |||||
Adjustments to reconcile net income (loss) to net cash provided by operating activities: | ||||||||||||
Goodwill impairment | — | — | 325.0 | |||||||||
Depreciation and amortization | 192.9 | 189.6 | 160.8 | |||||||||
Stock-based compensation expense | 23.5 | 15.7 | 13.5 | |||||||||
Excess tax benefits from stock-based compensation | (3.2 | ) | (0.6 | ) | — | |||||||
Provision (benefit) for deferred income taxes | 60.9 | 60.1 | (23.8 | ) | ||||||||
Net gains on sales of railcars owned more than one year at the time of sale | (16.2 | ) | (6.6 | ) | (18.4 | ) | ||||||
Gain on disposition of property, plant, equipment, and other assets | (8.4 | ) | (7.9 | ) | (5.8 | ) | ||||||
Gain on disposition of flood-damaged property, plant, and equipment | (17.6 | ) | (9.7 | ) | — | |||||||
Other | 19.3 | 5.0 | 8.8 | |||||||||
Changes in assets and liabilities: | ||||||||||||
(Increase) decrease in receivables | (146.3 | ) | (62.2 | ) | 91.5 | |||||||
(Increase) decrease in income tax receivable | 5.8 | 3.8 | 87.5 | |||||||||
(Increase) decrease in inventories | (212.2 | ) | (88.7 | ) | 380.1 | |||||||
(Increase) decrease in other assets | (13.5 | ) | 27.8 | (24.1 | ) | |||||||
Increase (decrease) in accounts payable | 73.1 | 53.4 | (140.8 | ) | ||||||||
Increase (decrease) in accrued liabilities | (14.2 | ) | (59.5 | ) | (20.5 | ) | ||||||
Increase (decrease) in other liabilities | 14.7 | (25.1 | ) | 11.2 | ||||||||
|
|
|
|
|
| |||||||
Net cash provided by operating activities | 104.3 | 170.5 | 707.3 | |||||||||
|
|
|
|
|
| |||||||
Investing activities: | ||||||||||||
(Increase) decrease in short-term marketable securities | 158.0 | (88.0 | ) | (70.0 | ) | |||||||
Proceeds from sales of railcars owned more than one year at the time of sale | 60.6 | 33.6 | 154.3 | |||||||||
Proceeds from lease fleet sales — sale and leaseback | 44.4 | — | 103.6 | |||||||||
Proceeds from disposition of property, plant, equipment, and other assets | 11.2 | 38.9 | 15.1 | |||||||||
Proceeds from disposition of flood-damaged property, plant, and equipment | 23.3 | 12.0 | — | |||||||||
Capital expenditures — leasing, net of railcars owned one year or less at the time of sale | (258.6 | ) | (213.8 | ) | (343.0 | ) | ||||||
Capital expenditures — manufacturing and other | (52.0 | ) | (29.0 | ) | (47.4 | ) | ||||||
Capital expenditures — replacement of flood-damaged property, plant, and equipment | (29.4 | ) | (12.0 | ) | — | |||||||
Acquisitions, net of cash acquired | (42.5 | ) | (49.9 | ) | — | |||||||
|
|
|
|
|
| |||||||
Net cash required by investing activities | (85.0 | ) | (308.2 | ) | (187.4 | ) | ||||||
|
|
|
|
|
| |||||||
Financing activities: | ||||||||||||
Proceeds from issuance of common stock, net | 2.1 | 1.7 | 1.1 | |||||||||
Excess tax benefits from stock-based compensation | 3.2 | 0.6 | — | |||||||||
Payments to retire debt — assumed debt of Quixote | — | (40.0 | ) | — | ||||||||
Payments to retire debt — other | (1,113.0 | ) | (363.9 | ) | (294.0 | ) | ||||||
Proceeds from issuance of debt | 1,145.9 | 363.5 | 281.1 | |||||||||
Stock repurchases | — | — | (6.3 | ) | ||||||||
(Increase) decrease in restricted cash | (33.2 | ) | (25.4 | ) | (26.5 | ) | ||||||
Purchase of additional interest in TRIP Holdings | — | (28.6 | ) | — | ||||||||
Dividends paid to common shareholders | (27.2 | ) | (25.4 | ) | (25.3 | ) | ||||||
Distribution to noncontrolling interest | — | (2.6 | ) | — | ||||||||
|
|
|
|
|
| |||||||
Net cash (required) provided by financing activities | (22.2 | ) | (120.1 | ) | (69.9 | ) | ||||||
Net (decrease) increase in cash and cash equivalents | (2.9 | ) | (257.8 | ) | 450.0 | |||||||
Cash and cash equivalents at beginning of period | 354.0 | 611.8 | 161.8 | |||||||||
|
|
|
|
|
| |||||||
Cash and cash equivalents at end of period | $ | 351.1 | $ | 354.0 | $ | 611.8 | ||||||
|
|
|
|
|
| |||||||
Interest paid for the years ended December 31, 2011, 2010, and 2009, was $154.9 million, $160.5 million, and $101.4 million, respectively. There was no capitalized interest in the years ended December 31, 2011, 2010, and 2009. Tax payments made, net of refunds received, for the year ended December 31, 2011 were $2.5 million. Tax refunds received, net of payments made, for the years ended December 31, 2010 and 2009 were $16.0 million and $85.6 million, respectively.
Non-cash investing and financing activity: During the year ended December 31, 2009, the Company acquired $56.6 million of equipment on lease through the assumption of capital lease obligations.
Balance Sheets
| December 31, 2012 | December 31, 2011 | |||||||
| (in millions) | ||||||||
| ASSETS | ||||||||
| Cash and cash equivalents | $ | 573.0 | $ | 351.1 | ||||
| Receivables, net of allowance for doubtful accounts of $4.6 and $8.3 | 390.0 | 385.9 | ||||||
| Inventories: | ||||||||
| Raw materials and supplies | 405.3 | 319.5 | ||||||
| Work in process | 140.9 | 125.6 | ||||||
| Finished goods | 121.5 | 99.5 | ||||||
| 667.7 | 544.6 | |||||||
| Restricted cash, including TRIP Holdings of $50.3 and $74.6 | 223.2 | 240.3 | ||||||
| Property, plant, and equipment, at cost, including TRIP Holdings of $1,272.4 and $1,257.7 | 5,642.0 | 5,336.8 | ||||||
| Less accumulated depreciation, including TRIP Holdings of $153.8 and $122.7 | (1,343.0 | ) | (1,177.7 | ) | ||||
| 4,299.0 | 4,159.1 | |||||||
| Goodwill | 240.4 | 219.5 | ||||||
| Assets held for sale and discontinued operations | 27.9 | 32.5 | ||||||
| Other assets | 248.7 | 188.0 | ||||||
| $ | 6,669.9 | $ | 6,121.0 | |||||
| LIABILITIES AND STOCKHOLDERS' EQUITY | ||||||||
| Accounts payable | $ | 188.2 | $ | 207.4 | ||||
| Accrued liabilities | 583.1 | 421.3 | ||||||
| Debt: | ||||||||
| Recourse, net of unamortized discount of $87.5 and $99.8 | 458.1 | 455.0 | ||||||
| Non-recourse: | ||||||||
| Parent and wholly-owned subsidiaries | 1,738.0 | 1,616.0 | ||||||
| TRIP Holdings | 858.9 | 901.2 | ||||||
| 3,055.0 | 2,972.2 | |||||||
| Deferred income | 44.5 | 38.7 | ||||||
| Deferred income taxes | 572.4 | 434.7 | ||||||
| Liabilities held for sale and discontinued operations | 3.7 | 2.7 | ||||||
| Other liabilities | 85.4 | 95.7 | ||||||
| 4,532.3 | 4,172.7 | |||||||
| Stockholders’ equity: | ||||||||
| Preferred stock – 1.5 shares authorized and unissued | — | — | ||||||
| Common stock – 200.0 shares authorized; shares issued and outstanding at December 31, 2012 and 2011 – 81.7 | 81.7 | 81.7 | ||||||
| Capital in excess of par value | 652.6 | 626.5 | ||||||
| Retained earnings | 1,536.7 | 1,314.7 | ||||||
| Accumulated other comprehensive loss | (150.1 | ) | (134.0 | ) | ||||
| Treasury stock – shares at December 31, 2012 – 2.6; at December 31, 2011 – 1.5 | (67.9 | ) | (25.1 | ) | ||||
| 2,053.0 | 1,863.8 | |||||||
| Noncontrolling interest | 84.6 | 84.5 | ||||||
| 2,137.6 | 1,948.3 | |||||||
| $ | 6,669.9 | $ | 6,121.0 | |||||
| Common Stock | Accumulated Other | Treasury Stock | ||||||||||||||||||||||||||||||||||||||
| Shares | $1 Par Value | Capital in Excess of Par Value | Retained Earnings | Shares | Cost | Trinity Stockholders’ Equity | Noncontrolling Interest | Total Stockholders’ Equity | ||||||||||||||||||||||||||||||||
| (in millions, except par value) | ||||||||||||||||||||||||||||||||||||||||
Balances at December 31, 2008 | 81.7 | $ | 81.7 | $ | 612.7 | $ | 1,427.0 | $ | (161.3 | ) | (2.3 | ) | $ | (47.8 | ) | $ | 1,912.3 | $ | — | $ | 1,912.3 | |||||||||||||||||||
Net loss | — | — | — | (137.7 | ) | — | — | — | (137.7 | ) | — | (137.7 | ) | |||||||||||||||||||||||||||
Other comprehensive loss, net of tax: | ||||||||||||||||||||||||||||||||||||||||
Change in funded status of pension liability | — | — | — | — | 35.6 | — | — | 35.6 | — | 35.6 | ||||||||||||||||||||||||||||||
Unrealized gain on derivative financial instruments | — | — | — | — | 27.8 | — | — | 27.8 | — | 27.8 | ||||||||||||||||||||||||||||||
Other changes | — | — | — | — | (0.1 | ) | — | — | (0.1 | ) | — | (0.1 | ) | |||||||||||||||||||||||||||
|
|
|
|
|
| |||||||||||||||||||||||||||||||||||
Comprehensive net loss | (74.4 | ) | — | (74.4 | ) | |||||||||||||||||||||||||||||||||||
Cash dividends on common stock | — | — | — | (25.3 | ) | — | — | — | (25.3 | ) | — | (25.3 | ) | |||||||||||||||||||||||||||
Restricted shares issued, net | — | — | (12.6 | ) | — | — | 0.5 | 12.6 | — | — | — | |||||||||||||||||||||||||||||
Shares repurchased | — | — | — | — | — | (0.8 | ) | (6.3 | ) | (6.3 | ) | — | (6.3 | ) | ||||||||||||||||||||||||||
Stock options exercised | — | — | (0.6 | ) | — | — | 0.1 | 1.7 | 1.1 | — | 1.1 | |||||||||||||||||||||||||||||
Income tax expense from stock options exercised | — | — | (2.1 | ) | — | — | — | — | (2.1 | ) | — | (2.1 | ) | |||||||||||||||||||||||||||
Stock-based compensation expense | — | — | 1.0 | — | — | — | — | 1.0 | — | 1.0 | ||||||||||||||||||||||||||||||
Other | — | — | — | (0.1 | ) | — | — | 0.1 | — | — | — | |||||||||||||||||||||||||||||
|
|
|
|
|
|
|
|
|
|
|
|
|
|
|
|
|
|
|
| |||||||||||||||||||||
Balances at December 31, 2009 | 81.7 | $ | 81.7 | $ | 598.4 | $ | 1,263.9 | $ | (98.0 | ) | (2.5 | ) | $ | (39.7 | ) | $ | 1,806.3 | $ | — | $ | 1,806.3 | |||||||||||||||||||
Cumulative effect of consolidating TRIP Holdings (see Notes 1 and 6) | — | — | — | (105.4 | ) | — | — | — | (105.4 | ) | 129.9 | 24.5 | ||||||||||||||||||||||||||||
|
|
|
|
|
|
|
|
|
|
|
|
|
|
|
|
|
|
|
| |||||||||||||||||||||
Balances at December 31, 2009 as adjusted | 81.7 | 81.7 | 598.4 | 1,158.5 | (98.0 | ) | (2.5 | ) | (39.7 | ) | 1,700.9 | 129.9 | 1,830.8 | |||||||||||||||||||||||||||
Net income | — | — | — | 67.4 | — | — | — | 67.4 | 8.0 | 75.4 | ||||||||||||||||||||||||||||||
Other comprehensive income (loss), net of tax: | ||||||||||||||||||||||||||||||||||||||||
Change in funded status of pension liability | — | — | — | — | 8.7 | — | — | 8.7 | — | 8.7 | ||||||||||||||||||||||||||||||
Unrealized loss on derivative financial instruments | — | — | — | — | (7.3 | ) | — | — | (7.3 | ) | (9.1 | ) | (16.4 | ) | ||||||||||||||||||||||||||
Other changes | — | — | — | — | 1.1 | — | — | 1.1 | — | 1.1 | ||||||||||||||||||||||||||||||
|
|
|
|
|
| |||||||||||||||||||||||||||||||||||
Comprehensive net income (loss) | 69.9 | (1.1 | ) | 68.8 | ||||||||||||||||||||||||||||||||||||
Purchase of additional interest in TRIP Holdings | — | — | 10.3 | — | — | — | — | 10.3 | (47.9 | ) | (37.6 | ) | ||||||||||||||||||||||||||||
Cash dividends on common stock | — | — | — | (25.4 | ) | — | — | — | (25.4 | ) | — | (25.4 | ) | |||||||||||||||||||||||||||
Restricted shares issued, net | — | — | (2.3 | ) | — | — | 0.4 | 9.2 | 6.9 | — | 6.9 | |||||||||||||||||||||||||||||
Stock options exercised | — | — | (0.8 | ) | — | — | 0.1 | 2.5 | 1.7 | — | 1.7 | |||||||||||||||||||||||||||||
Income tax expense from stock options exercised | — | — | (0.2 | ) | — | — | — | — | (0.2 | ) | — | (0.2 | ) | |||||||||||||||||||||||||||
Stock-based compensation expense | — | — | 0.6 | — | — | — | — | 0.6 | — | 0.6 | ||||||||||||||||||||||||||||||
Other | — | — | 0.1 | — | — | 0.1 | — | 0.1 | — | 0.1 | ||||||||||||||||||||||||||||||
|
|
|
|
|
|
|
|
|
|
|
|
|
|
|
|
|
|
|
| |||||||||||||||||||||
Balances at December 31, 2010 | 81.7 | $ | 81.7 | $ | 606.1 | $ | 1,200.5 | $ | (95.5 | ) | (1.9 | ) | $ | (28.0 | ) | $ | 1,764.8 | $ | 80.9 | $ | 1,845.7 | |||||||||||||||||||
Net income | — | — | — | 142.2 | — | — | — | 142.2 | 3.5 | 145.7 | ||||||||||||||||||||||||||||||
Other comprehensive income, net of tax: | ||||||||||||||||||||||||||||||||||||||||
Change in funded status of pension liability | — | — | — | — | (28.6 | ) | — | — | (28.6 | ) | — | (28.6 | ) | |||||||||||||||||||||||||||
Unrealized loss on derivative financial instruments | — | — | — | — | 0.1 | — | — | 0.1 | 0.1 | 0.2 | ||||||||||||||||||||||||||||||
|
|
|
|
|
| |||||||||||||||||||||||||||||||||||
Comprehensive net income | 113.7 | 3.6 | 117.3 | |||||||||||||||||||||||||||||||||||||
Cash dividends on common stock | — | — | — | (28.0 | ) | — | — | — | (28.0 | ) | — | (28.0 | ) | |||||||||||||||||||||||||||
Restricted shares issued, net | — | — | 6.7 | — | — | 0.2 | 0.3 | 7.0 | — | 7.0 | ||||||||||||||||||||||||||||||
Stock options exercised | — | — | (0.5 | ) | — | — | 0.2 | 2.6 | 2.1 | — | 2.1 | |||||||||||||||||||||||||||||
Income tax benefit from stock options exercised | — | — | 3.5 | — | — | — | — | 3.5 | — | 3.5 | ||||||||||||||||||||||||||||||
Stock-based compensation expense | — | — | 0.6 | — | — | — | — | 0.6 | — | 0.6 | ||||||||||||||||||||||||||||||
Reclassification of purchase of additional interest in TRIP Holdings | — | — | 15.5 | — | (15.5 | ) | — | — | — | — | — | |||||||||||||||||||||||||||||
Tax expense allocation related to TRIP Holdings unrealized loss on derivative financial instruments | — | — | (5.5 | ) | — | 5.5 | — | — | — | — | — | |||||||||||||||||||||||||||||
Other | — | — | 0.1 | — | — | — | — | 0.1 | — | 0.1 | ||||||||||||||||||||||||||||||
|
|
|
|
|
|
|
|
|
|
|
|
|
|
|
|
|
|
|
| |||||||||||||||||||||
Balances at December 31, 2011 | 81.7 | $ | 81.7 | $ | 626.5 | $ | 1,314.7 | $ | (134.0 | ) | (1.5 | ) | $ | (25.1 | ) | $ | 1,863.8 | $ | 84.5 | $ | 1,948.3 | |||||||||||||||||||
|
|
|
|
|
|
|
|
|
|
|
|
|
|
|
|
|
|
|
| |||||||||||||||||||||
| Year Ended December 31, | ||||||||||||
| 2012 | 2011 | 2010 | ||||||||||
| (in millions) | ||||||||||||
| Operating activities: | ||||||||||||
| Net income | $ | 253.7 | $ | 145.7 | $ | 75.4 | ||||||
| Adjustments to reconcile net income to net cash provided by operating activities: | ||||||||||||
| (Income) loss from discontinued operations | (1.8 | ) | 1.1 | (6.0 | ) | |||||||
| Depreciation and amortization | 193.7 | 187.7 | 180.9 | |||||||||
| Stock-based compensation expense | 27.7 | 22.8 | 14.4 | |||||||||
| Excess tax benefits from stock-based compensation | (0.6 | ) | (3.2 | ) | (0.6 | ) | ||||||
| Provision for deferred income taxes | 126.3 | 60.5 | 68.5 | |||||||||
| Net gains on sales of railcars owned more than one year at the time of sale | (33.5 | ) | (16.2 | ) | (6.6 | ) | ||||||
| Gain on disposition of property, plant, equipment, and other assets | (4.6 | ) | (6.2 | ) | (3.8 | ) | ||||||
| Gain on disposition of flood-damaged property, plant, equipment, and other assets | (0.4 | ) | (17.6 | ) | (9.7 | ) | ||||||
| Non-cash interest expense | 22.0 | 18.6 | 13.6 | |||||||||
| Other | (3.2 | ) | 1.4 | (6.0 | ) | |||||||
| Changes in assets and liabilities: | ||||||||||||
| (Increase) decrease in receivables | 2.7 | (150.3 | ) | (56.0 | ) | |||||||
| (Increase) decrease in inventories | (117.2 | ) | (212.5 | ) | (88.3 | ) | ||||||
| (Increase) decrease in other assets | (43.1 | ) | (7.7 | ) | 27.5 | |||||||
| Increase (decrease) in accounts payable | (16.7 | ) | 74.9 | 50.9 | ||||||||
| Increase (decrease) in accrued liabilities | 125.5 | (11.5 | ) | (62.0 | ) | |||||||
| Increase (decrease) in other liabilities | (3.9 | ) | 14.0 | (25.4 | ) | |||||||
| Net cash provided by operating activities - continuing operations | 526.6 | 101.5 | 166.8 | |||||||||
| Net cash provided by operating activities - discontinued operations | 0.8 | 9.4 | 3.7 | |||||||||
| Net cash provided by operating activities | 527.4 | 110.9 | 170.5 | |||||||||
| Investing activities: | ||||||||||||
| (Increase) decrease in short-term marketable securities | — | 158.0 | (88.0 | ) | ||||||||
| Proceeds from sales of railcars owned more than one year at the time of sale | 126.3 | 60.6 | 33.6 | |||||||||
| Proceeds from lease fleet sales – sale and leaseback | 58.3 | 44.4 | — | |||||||||
| Proceeds from disposition of property, plant, equipment, and other assets | 16.8 | 8.5 | 7.0 | |||||||||
| Proceeds from disposition of flood-damaged property, plant, and equipment | — | 23.3 | 12.0 | |||||||||
| Capital expenditures – leasing, net of sold railcars owned one year or less | (352.6 | ) | (258.6 | ) | (213.8 | ) | ||||||
| Capital expenditures – manufacturing and other | (116.6 | ) | (47.6 | ) | (27.0 | ) | ||||||
| Capital expenditures – replacement of flood-damaged property, plant, and equipment | — | (29.4 | ) | (12.0 | ) | |||||||
| Acquisitions, net of cash acquired | (46.2 | ) | (42.5 | ) | (47.9 | ) | ||||||
| Other | 1.7 | — | — | |||||||||
| Net cash required by investing activities - continuing operations | (312.3 | ) | (83.3 | ) | (336.1 | ) | ||||||
| Net cash provided (required) by investing activities - discontinued operations | 0.9 | (1.7 | ) | 27.9 | ||||||||
| Net cash required by investing activities | (311.4 | ) | (85.0 | ) | (308.2 | ) | ||||||
| Financing activities: | ||||||||||||
| Proceeds from issuance of common stock, net | 4.1 | 2.1 | 1.7 | |||||||||
| Excess tax benefits from stock-based compensation | 0.6 | 3.2 | 0.6 | |||||||||
| Payments to retire debt | (378.4 | ) | (1,112.3 | ) | (363.5 | ) | ||||||
| Payments to retire debt - assumed debt of Quixote | — | — | (40.0 | ) | ||||||||
| Proceeds from issuance of debt | 443.8 | 1,143.3 | 362.7 | |||||||||
| (Increase) decrease in restricted cash | 17.1 | (33.2 | ) | (25.4 | ) | |||||||
| Shares repurchased | (45.2 | ) | — | — | ||||||||
| Purchase of additional interest in TRIP Holdings | — | — | (28.6 | ) | ||||||||
| Dividends paid to common shareholders | (31.7 | ) | (27.2 | ) | (25.4 | ) | ||||||
| Distribution to noncontrolling interest | — | — | (2.6 | ) | ||||||||
| Other | (5.3 | ) | (6.6 | ) | — | |||||||
| Net cash provided (required) by financing activities - continuing operations | 5.0 | (30.7 | ) | (120.5 | ) | |||||||
| Net cash provided by financing activities - discontinued operations | 0.9 | 1.9 | 0.4 | |||||||||
| Net cash provided (required) by financing activities | 5.9 | (28.8 | ) | (120.1 | ) | |||||||
| Net increase (decrease) in cash and cash equivalents | 221.9 | (2.9 | ) | (257.8 | ) | |||||||
| Cash and cash equivalents at beginning of period | 351.1 | 354.0 | 611.8 | |||||||||
| Cash and cash equivalents at end of period | $ | 573.0 | $ | 351.1 | $ | 354.0 | ||||||
Common Stock | Treasury Stock | |||||||||||||||||||||||||||||||||||||
| Shares | $1 Par Value | Capital in Excess of Par Value | Retained Earnings | Accumulated Other Comprehensive Loss | Shares | Amount | Trinity Stockholders’ Equity | Noncontrolling Interest | Total Stockholders’ Equity | |||||||||||||||||||||||||||||
| (in millions, except par value) | ||||||||||||||||||||||||||||||||||||||
| Balances at December 31, 2009 | 81.7 | $ | 81.7 | $ | 598.4 | $ | 1,158.5 | $ | (98.0 | ) | (2.5 | ) | $ | (39.7 | ) | $ | 1,700.9 | $ | 129.9 | $ | 1,830.8 | |||||||||||||||||
| Net income | — | — | — | 67.4 | — | — | — | 67.4 | 8.0 | 75.4 | ||||||||||||||||||||||||||||
| Other comprehensive income (loss) | — | — | — | — | 2.5 | — | — | 2.5 | (9.1 | ) | (6.6 | ) | ||||||||||||||||||||||||||
| Cash dividends on common stock | — | — | — | (25.4 | ) | — | — | — | (25.4 | ) | — | (25.4 | ) | |||||||||||||||||||||||||
| Restricted shares issued, net | — | — | (2.3 | ) | — | — | 0.4 | 9.2 | 6.9 | — | 6.9 | |||||||||||||||||||||||||||
| Stock options exercised | — | — | (0.8 | ) | — | — | 0.1 | 2.5 | 1.7 | — | 1.7 | |||||||||||||||||||||||||||
| Income tax expense from stock options exercised | — | — | (0.2 | ) | — | — | — | — | (0.2 | ) | — | (0.2 | ) | |||||||||||||||||||||||||
| Stock-based compensation expense | — | — | 0.6 | — | — | — | — | 0.6 | — | 0.6 | ||||||||||||||||||||||||||||
| Purchase of additional interest in TRIP Holdings | — | — | 10.3 | — | — | — | — | 10.3 | (47.9 | ) | (37.6 | ) | ||||||||||||||||||||||||||
| Other | — | — | 0.1 | — | — | 0.1 | — | 0.1 | — | 0.1 | ||||||||||||||||||||||||||||
| Balances at December 31, 2010 | 81.7 | $ | 81.7 | $ | 606.1 | $ | 1,200.5 | $ | (95.5 | ) | (1.9 | ) | $ | (28.0 | ) | $ | 1,764.8 | $ | 80.9 | $ | 1,845.7 | |||||||||||||||||
| Net income | — | — | — | 142.2 | — | — | — | 142.2 | 3.5 | 145.7 | ||||||||||||||||||||||||||||
| Other comprehensive income (loss) | — | — | — | — | (28.5 | ) | — | — | (28.5 | ) | 0.1 | (28.4 | ) | |||||||||||||||||||||||||
| Cash dividends on common stock | — | — | — | (28.0 | ) | — | — | — | (28.0 | ) | — | (28.0 | ) | |||||||||||||||||||||||||
| Restricted shares issued, net | — | — | 6.7 | — | — | 0.2 | 0.3 | 7.0 | — | 7.0 | ||||||||||||||||||||||||||||
| Stock options exercised | — | — | (0.5 | ) | — | — | 0.2 | 2.6 | 2.1 | — | 2.1 | |||||||||||||||||||||||||||
| Income tax benefit from stock options exercised | — | — | 3.5 | — | — | — | — | 3.5 | — | 3.5 | ||||||||||||||||||||||||||||
| Stock-based compensation expense | — | — | 0.6 | — | — | — | — | 0.6 | — | 0.6 | ||||||||||||||||||||||||||||
| Reclassification of purchase of additional interest in TRIP Holdings | — | — | 15.5 | — | (15.5 | ) | — | — | — | — | — | |||||||||||||||||||||||||||
| Tax expense allocation related to TRIP Holdings unrealized loss on derivative financial instruments | — | — | (5.5 | ) | — | 5.5 | — | — | — | — | — | |||||||||||||||||||||||||||
| Other | — | — | 0.1 | — | — | — | — | 0.1 | — | 0.1 | ||||||||||||||||||||||||||||
| Balances at December 31, 2011 | 81.7 | $ | 81.7 | $ | 626.5 | $ | 1,314.7 | $ | (134.0 | ) | (1.5 | ) | $ | (25.1 | ) | $ | 1,863.8 | $ | 84.5 | $ | 1,948.3 | |||||||||||||||||
| Net income (loss) | — | — | — | 255.2 | — | — | — | 255.2 | (1.5 | ) | 253.7 | |||||||||||||||||||||||||||
| Other comprehensive income (loss) | — | — | — | — | (16.1 | ) | — | — | (16.1 | ) | 1.6 | (14.5 | ) | |||||||||||||||||||||||||
| Cash dividends on common stock | — | — | — | (33.2 | ) | — | — | — | (33.2 | ) | — | (33.2 | ) | |||||||||||||||||||||||||
| Restricted shares issued, net | — | — | 26.4 | — | — | 0.4 | (1.7 | ) | 24.7 | — | 24.7 | |||||||||||||||||||||||||||
| Stock options exercised | — | — | (0.7 | ) | — | — | 0.3 | 4.8 | 4.1 | — | 4.1 | |||||||||||||||||||||||||||
| Income tax benefit from stock options exercised | — | — | 0.2 | — | — | — | — | 0.2 | — | 0.2 | ||||||||||||||||||||||||||||
| Stock-based compensation expense | — | — | 0.2 | — | — | — | — | 0.2 | — | 0.2 | ||||||||||||||||||||||||||||
| Shares repurchased | — | — | — | — | — | (1.8 | ) | (45.2 | ) | (45.2 | ) | — | (45.2 | ) | ||||||||||||||||||||||||
| Other | — | — | — | — | — | 0.0 | (0.7 | ) | (0.7 | ) | — | (0.7 | ) | |||||||||||||||||||||||||
| Balances at December 31, 2012 | 81.7 | $ | 81.7 | $ | 652.6 | $ | 1,536.7 | $ | (150.1 | ) | (2.6 | ) | $ | (67.9 | ) | $ | 2,053.0 | $ | 84.6 | $ | 2,137.6 | |||||||||||||||||
2 Acquisitions and Divestitures. when products are shipped or services are provided. year outstanding. assets exceed its fair value. Impairment is assessed at the “reporting unit” level by applying a fair value-based test for each unit with recorded goodwill. The estimates and judgments that most significantly affect the fair value calculations are assumptions related to revenue and operating profit growth, discount rates and exit multiples. 2012 Depending on the product, the Company provides warranties against materials and manufacturing defects generally ranging from one to five years. The warranty costs are estimated using a two-step approach. First, an engineering estimate is made for the cost of all claims that have been asserted by customers. Second, based on historical claims experience, a cost is accrued for all products still within a warranty period for which no claims have been filed. The Company provides for the estimated cost of product Certain prior year balances have been reclassified in the Consolidated Balance Sheets and Consolidated Statements of 2011: Construction Products Group 2010: Construction Products Group Quixote Other Energy Equipment Group the accompanying consolidated balance sheets as follows: Assets: Cash equivalents Restricted cash Equity call agreement with TRIP Holdings equity investor(1) Total assets Liabilities: Interest rate hedges(2) Wholly-owned subsidiary TRIP Holdings Equity put agreement with TRIP Holdings equity investor(3) Fuel derivative instruments(1) Total liabilities Assets: Cash equivalents Short-term marketable securities Restricted cash Fuel derivative instruments(1) Total assets Liabilities: Interest rate hedges(2) Wholly-owned subsidiary TRIP Holdings Total liabilities Fair value is defined as the exchange price that would be received for an asset or paid to transfer a liability (an exit price) in the principal or most advantageous market valued using energy and commodity market data. Interest rate hedges are valued at exit prices obtained from each counterparty. See Note Recourse: Convertible subordinated notes Less: unamortized discount Capital lease obligations Term loan Other Non-recourse: 2006 secured railcar equipment notes Promissory notes 2009 secured railcar equipment notes 2010 secured railcar equipment notes TILC warehouse facility TRIP Holdings senior secured notes TRIP Master Funding secured railcar equipment notes TRIP Holdings warehouse loan Total See Note 11 Debt for a description of the Company's long-term debt. respective segment. Gains and losses from the sale of property, plant, and equipment Rail Group Construction Products Group Inland Barge Group Energy Equipment Group Railcar Leasing and Management Services Group All Other Corporate Eliminations-Lease subsidiary Eliminations – Other Consolidated Total Rail Group Construction Products Group Inland Barge Group Energy Equipment Group Railcar Leasing and Management Services Group All Other Corporate Eliminations-Lease subsidiary Eliminations – Other Consolidated Total Rail Group Construction Products Group Inland Barge Group Energy Equipment Group Railcar Leasing and Management Services Group All Other Corporate Eliminations-Lease subsidiary Eliminations – Other Consolidated Total Capital expenditures for the Inland Barge Group in 2011 and 2010 primarily relate to the repair and replacement of flood-damaged property, plant, and equipment at the Company's manufacturing facilities in Missouri and Tennessee. See Note 8 Property, Plant, and Equipment. Mexico Mexico Cash, cash equivalents, and short-term marketable securities Property, plant, and equipment, net Net deferred profit on railcars sold to the Leasing Group Restricted cash Debt: Recourse Less: unamortized discount Non-recourse Less: non-recourse debt owned by Trinity Total debt Net deferred tax liabilities Cash, cash equivalents, and short-term marketable securities Property, plant, and equipment, net Net deferred profit on railcars sold to the Leasing Group Restricted cash Debt: Recourse Less: unamortized discount Non-recourse Total debt Net deferred tax liabilities Revenues: Wholly-owned subsidiaries: Leasing and management Railcar sales(1) TRIP Holdings: Leasing and management Railcar sales(1) Total revenues Operating profit: Wholly-owned subsidiaries: Leasing and management Railcar sales(1): Railcars owned one year or less at the time of sale Railcars owned more than one year at the time of sale TRIP Holdings: Leasing and management Railcar sales(1): Railcars owned one year or less at the time of sale Railcars owned more than one year at the time of sale Total operating profit Operating profit margin: Leasing and management Railcar sales Total operating profit margin Interest and rent expense(2): Rent expense Interest expense: Wholly-owned subsidiaries TRIP Holdings: External Intercompany Total interest expense Wholly-owned subsidiaries TRIP Holdings Future operating lease obligations of Trusts’ railcars Future contractual minimum rental revenues of Trusts’ railcars Future operating lease obligations Future contractual minimum rental revenues The assets of TRIP Holdings may only be used to satisfy the liabilities of TRIP Holdings, and the liabilities and indebtedness of TRIP Holdings have recourse only to TRIP Holdings' assets. Capital contributions Equity purchased from investors Equity in earnings Equity in unrealized losses on derivative financial instruments Distributions Deferred broker fees Rail Group: Sales of railcars to TRIP Leasing Gain on sales of railcars to TRIP Leasing Deferral of gain on sales of railcars to TRIP Leasing based on Trinity’s equity interest TILC: Sales of railcars to TRIP Leasing: Railcars owned one year or less at the time of sale Railcars owned for more than one year at the time of sale Recognition of previously deferred gain on sales of railcars to TRIP Leasing Deferral of gain on sales of railcars to TRIP Leasing based on Trinity’s equity interest 2012 Interest rate locks: 2005-2006 2006-2007 TRIP Holdings(2) Interest rate swaps: TRIP Rail Master Funding secured railcar equipment notes 2008 debt issuance Interest rate locks: 2005-2006 2006-2007 TRIP Holdings(2) Interest rate swaps: TILC warehouse TRIP Rail Master Funding secured railcar equipment notes 2008 debt issuance The effect on interest expense results primarily from monthly interest settlements. Fuel hedges(1) Effect of mark to market valuation Settlements Foreign exchange hedges(2) 2012 Manufacturing/Corporate: Land Buildings and improvements Machinery and other Construction in progress Less accumulated depreciation Leasing: Wholly-owned subsidiaries: Machinery and other Equipment on lease Less accumulated depreciation TRIP Holdings: Equipment on lease Less accumulated depreciation Net deferred profit on railcars sold to the Leasing Group Sold to wholly-owned subsidiaries Sold to TRIP Holdings of Rail Group Construction Products Group Energy Equipment Group Railcar Leasing and Management Services Group Accumulated goodwill impairment losses as of December 31, 2012 and 2011 totaled offset partially by a divestiture. Beginning balance Warranty costs incurred Warranty originations and revisions Warranty expirations Ending balance Manufacturing/Corporate — Recourse: Revolving credit facility Convertible subordinated notes Less: unamortized discount Other Leasing — Recourse: Capital lease obligations Term loan Leasing — Non-recourse: 2006 secured railcar equipment notes Promissory notes 2009 secured railcar equipment notes 2010 secured railcar equipment notes TILC warehouse facility TRIP Holdings senior secured notes: Total outstanding Less: owned by Trinity TRIP Master Funding secured railcar equipment notes TRIP warehouse loan Total debt Coupon rate interest Amortized debt discount . Recourse: Manufacturing/Corporate Leasing – capital lease obligations (Note 5) Leasing – term loan (Note 5) Non-recourse – leasing (Note 5): 2006 secured railcar equipment notes Promissory notes 2009 secured railcar equipment notes 2010 secured railcar equipment notes TILC warehouse facility TRIP Holdings senior secured notes Total outstanding Less: owned by Trinity TRIP Master Funding secured railcar equipment notes Facility termination payments: TILC warehouse facility Total principal payments Foreign currency exchange transactions Loss (gain) on equity investments Costs related to redemption of Senior Notes Other Other, net Current: Federal State Foreign Total current Deferred: Federal State Foreign Total deferred Provision Deferred tax liabilities: Depreciation, depletion, and amortization Derivatives Convertible debt Total deferred tax liabilities Deferred tax assets: Workers compensation, pensions, and other benefits Warranties and reserves Equity items Tax loss carryforwards and credits Inventory Accrued liabilities and other Total deferred tax assets Net deferred tax liabilities before valuation allowance Valuation allowance Net deferred tax liabilities before reserve for uncertain tax positions Deferred tax assets included in reserve for uncertain tax positions Adjusted net deferred tax liabilities examination by taxing authorities at different times. The their tax status. Generally, states’ statutes of limitations in the Year Ended December 31, Statutory rate State taxes Impairment of goodwill Changes in valuation allowances Tax settlements Changes in tax reserves Other, net Effective rate Beginning balance Additions for tax positions related to the current year Additions for tax positions of prior years Reductions for tax positions of prior years Settlements Expirations of statute of limitations Ending balance subsidiary. Settlements during Income tax expense for the year ended Assumptions used to determine benefit obligations at the annual measurement date were: Obligation discount rate Compensation increase rate Assumptions used to determine net periodic benefit costs were: Obligation discount rate Long-term rate of return on plan assets Compensation increase rate Expense Components Service cost Interest Expected return on plan assets Amortization and deferral: Actuarial loss Prior service cost Other Defined benefit expense Profit sharing Net expense Accumulated Benefit Obligations Projected Benefit Obligations: Beginning of year Service cost Interest Benefits paid Actuarial loss Amendments Settlements End of year Plans’ Assets: Beginning of year Actual return on assets Employer contributions Benefits paid Settlements End of year Consolidated Balance Sheet Components: Funded status 2013 Actuarial gain (loss) Amortization of actuarial loss Amortization of prior service cost Other Curtailments Settlements Total before income taxes Income tax expense (benefit) Net amount recognized in other comprehensive income (loss) Cash and cash equivalents Equity securities Debt securities Total Temporary cash investments Common trust funds Registered investment companies Temporary cash investments Common trust funds Registered investment companies Corporate stock Corporate bonds U.S. government obligations 2012 2013 2014 2015 2016 2017-2021 Net income (loss) attributable to Trinity Industries, Inc. Other comprehensive income (loss): Change in funded status of pension liability, net of tax expense (benefit) of $(16.9), $5.2, and $20.9 Change in unrealized (loss) gain on derivative financial instruments, net of tax (benefit) expense of $0.4, $(2.6), and $14.2 Other changes, net of tax benefit of $—, 0.7, and (0.0) Comprehensive net income (loss) attributable to Trinity Industries, Inc. Currency translation adjustments, net of tax benefit of $(0.2) and $(0.2) Funded status of pension liability, net of tax benefit of $(41.7) and $(24.8) Unrealized loss on derivative financial instruments, net of tax benefit of $(34.9) and $(21.4) Options outstanding at December 31, 2010 Granted Exercised Cancelled Options outstanding at December 31, 2011 Options exercisable: December 31, 2010 December 31, 2011 Restricted share awards outstanding at December 31, 2010 Granted Vested Forfeited Restricted share awards outstanding at December 31, 2011 Expense related to performance units is recognized ratably from their award date to the end of the performance period, generally either Net income attributable to Trinity Industries, Inc. Unvested restricted share participation Net income attributable to Trinity Industries, Inc. — basic Effect of dilutive securities: Stock options Net income attributable to Trinity Industries, Inc. — diluted Net income attributable to Trinity Industries, Inc. Unvested restricted share participation Net income attributable to Trinity Industries, Inc. — basic Effect of dilutive securities: Stock options Net income attributable to Trinity Industries, Inc. — diluted Net loss attributable to Trinity Industries, Inc. Unvested restricted share participation Net loss attributable to Trinity Industries, Inc. — basic Effect of dilutive securities: Stock options Net loss attributable to Trinity Industries, Inc. — diluted follows. Amounts previously reported have been adjusted to reflect discontinued operations resulting from the expected sale of the Company's ready-mix concrete operations. See Note 2 Acquisitions and Divestitures. JOSHUA HARMAN, on behalf of the UNITED STATES OF AMERICA, PLAINTIFF/Relator (“Mr. Harman”) v. TRINITY INDUSTRIES, INC., DEFENDANT, Case 2:12-cv-00089-JRG. Although the Company has not received service of process in this litigation, it has obtained a copy of the complaint. Mr. Harman alleges that the Company presented false or fraudulent claims, records or statements to the United States to obtain payment or approval, ostensibly related to the ET-Plus, and seeks damages equaling the cost to recall and replace all installations of the ET-Plus plus treble civil penalties, costs, and interest. The Company notes that since its introduction in 2000, including all improvement modifications thereafter, the ET-Plus has satisfied the testing criteria required by the governing National Cooperative Highway Research Program Report 350 and the product approval requirements of the Federal Highway Administration. The Company intends to vigorously defend Mr. Harman's allegations which will likely result in certain legal expenses. We do not believe that a loss is probable nor can a range of losses be determined. Accordingly, no accrual or range of loss has been included in the accompanying consolidated financial statements. continuing. Revenues: Manufacturing Leasing Operating costs: Costs of revenues: Manufacturing Leasing Other Selling, engineering, and administrative expenses Gain (loss) on disposition of property, plant, and equipment: Net gains on lease fleet sales Disposition of flood-damaged property, plant, and equipment Other Operating profit Net income Net income attributable to Trinity Industries, Inc. Net income attributable to Trinity Industries, Inc. per common share – basic and diluted Revenues: Manufacturing Leasing Operating costs: Costs of revenues: Manufacturing Leasing Other Selling, engineering, and administrative expenses Gain (loss) on disposition of property, plant, and equipment: Net gains on lease fleet sales Disposition of flood-damaged property, plant, and equipment Other Operating profit Net income Net income attributable to Trinity Industries, Inc. Net income attributable to Trinity Industries, Inc. per common share – basic and diluted Total cash provided by (required by): Operating activity Investing activity Financing activity Net increase (decrease) in cash and cash equivalents Total cash provided by (required by): Operating activity Investing activity Financing activity Net increase (decrease) in cash and cash equivalents Total cash provided by (required by): Operating activity Investing activity Financing activity Net increase (decrease) in cash and cash equivalents.. Total cash provided by (required by): Operating activity Investing activity Financing activity Net increase (decrease) in cash and cash equivalents.. Procedures. Information regarding the directors of the Company is incorporated by reference to the information set forth under the caption “Proposal 1 Information regarding compensation of executive officers and directors is incorporated by reference to the information set forth under the caption “Executive Compensation” in the Information concerning security ownership of certain beneficial owners and management is incorporated herein by reference from the 2012 Plan Category Equity compensation plans approved by security holders: Stock Options Restricted stock units and performance units Equity compensation plans not approved by security holders Total Information regarding certain relationships and related person transactions is incorporated by reference to the information set forth under the captions “Corporate Governance-Compensation Committee Interlocks and Insider Participation” and “Transactions with Related Persons” in the Information regarding principal accountant fees and services is incorporated by reference to the information set forth under the captions “Fees of Independent Registered Public Accounting Firm for Fiscal Years Exhibits and Financial Statement Schedules. 2012 21, 2013 Senior Vice President and DESCRIPTION DESCRIPTION 10-K for the annual period ended December 31, Note 1. Summary of Significant Accounting PoliciesPrinciples of ConsolidationThe financial statements of Trinity Industries, Inc. and its consolidated subsidiaries (“Trinity”, “Company”, “we” or “our”) include the accounts of all majority owned subsidiaries. The equity method of accounting is used for companies in which the Company has significant influenceits wholly-owned subsidiaries and 50% or less ownership.its majority-owned subsidiary, TRIP Rail Holdings LLC ("TRIP Holdings"). All significant intercompany accounts and transactions have been eliminated.On January 1, 2010, Certain amounts previously reported have been adjusted in the Company adopted the provisions of a new accounting standard, Accounting Standards Codification (“ASC”) 810-10, requiring the inclusion of theaccompanying consolidated financial statements of TRIP Holdings and subsidiary in the consolidated financial statements of the Company as of January 1, 2010. Prior to January 1, 2010, the Company’s investment in TRIP Holdings was accounted for using the equity method. Accordingly, the consolidated balance sheets of the Company as of December 31, 2011 and 2010 and the consolidated statements of operations, cash flows, and stockholders’ equity for the years ended December 31, 2011 and 2010 include the accounts of all subsidiaries including TRIP Holdings. As a result of adopting this pronouncement, we determinedremove the effects on Trinity’s consolidated financial statements as if TRIP Holdings had been included in the Company’s consolidated financial statements from TRIP Holdings’ inception and recorded a charge to retained earnings of $105.4 million, net of $57.7 million of tax benefit, and a noncontrolling interest of $129.9 million as of January 1, 2010. Prior periods were not restated. All significant intercompany accounts and transactions have been eliminated. Profits have been deferred on sales of railcars from the Rail or Leasing Group to TRIP Holdings and will be amortized over the life of the related equipment. Additionally, any future profits on the sale of railcars to TRIP Holdings will be deferred and amortized over the life of the related equipment. The noncontrolling interest represents the non-Trinity equity interest in TRIP Holdings. In September 2010, Trinity increased its ownership interest in TRIP Holdings to 57%. The effect of adopting this accounting standard was an increase to income from continuing operations and net income attributable to Trinity Industries, Inc. of $5.3 million or $0.07 per share in 2010.discontinued operations. See Note 6 Investment in TRIP Holdings for further discussion.Stockholders' EquityStockholders’ EquityIn On December 9, 2010,September 2012, the Company’s Board of Directors authorized a $200new $200 million share repurchase program, effective JanuaryOctober 1, 2011. This2012, which expires on December 31, 2014. The new program replaced the Company’s previous share repurchaseprior program and expires December 31, 2012. No shares were repurchased under this program forwhich expired on September 30, 2012. During the year ended December 31, 2011.For2012, the quarter ended June 30,Company repurchased 1,834,221 shares under the prior program at a cost of $45.2 million.In 2011, an amount of $15.5$15.5 million was reclassified between capital in excess of par value and accumulated other comprehensive loss to properly reflect the additional amount of accumulated unrealized loss on derivative financial instruments attributable to the Company after the purchase of additional interests in TRIP Holdings.Revenue RecognitionRevenues for contracts providing for a large number of units and few deliveries are recorded as the individual units are produced, inspected, and accepted by the customer as the risk of loss passes to the customer upon pre-delivery acceptance on these contracts. This occurs primarily in the Rail and Inland Barge Groups. Revenue from rentals and operating leases, including contracts which contain non-level fixed rental payments, is recognized monthly on a straight-line basis. Fees for shipping and handling are recorded as revenue. For all other products, we recognize revenue when products are shipped or services are provided.Effective December 31, 2011, the Company adopted the emerging industry policy of recognizing revenueRevenue is recognized from the sales of railcars from the lease fleet on a gross basis in leasing revenues and cost of revenues if the railcar has been owned by the lease fleet for one year or less at the time of sale. Sales of railcars from the lease fleet that have been owned by the lease fleet for more than one year are recognized as a net gain or loss from the disposal of a long-term asset. Prior year reported balances have been reclassified to conform to this policy resulting in a decrease inFees for shipping and handling are recorded as revenue. For all other products, we recognize revenue of $33.6 million and $154.3 million for the years ended December 31, 2010 and 2009, respectively. Additionally, this change resulted in additional cash flow provided by operating activities with an offsetting decrease in cash flow from investing activities of $0.3 million and $2.1 million for the years ended December 31, 2010 and 2009, respectively.Income TaxesThe liability method is used to account for income taxes. Deferred income taxes represent the tax effects of temporary differences between the carrying amounts of assets and liabilities for financial reporting purposes and the amounts used for income tax purposes. Valuation allowances reduce deferred tax assets to an amount that will more likely than not be realized.The Company regularly evaluates the likelihood of realization of tax benefits derived from positions it has taken in various federal and state filings after consideration of all relevant facts, circumstances, and available information. For those tax benefitspositions that are deemed more likely than not that willto be sustained, the Company recognizes the benefit it believes is cumulatively greater than 50% likely to be realized. To the extent the Company were to prevail in matters for which accruals have been established or be required to pay amounts in excess of recorded reserves, the effective tax rate in a given financial statement period could be materially impacted.Financial InstrumentsThe Company considers all highly liquid debt instruments to be either cash and cash equivalents if purchased with a maturity of three months or less, or short-term marketable securities if purchased with a maturity of more than three months and less than one year.Financial instruments that potentially subject the Company to a concentration of credit risk are primarily cash investments, short-term marketable securities, and receivables. The Company places its cash investments and short-term marketable securities in bank deposits and investment grade, short-term debt instruments and limits the amount of credit exposure to any one commercial issuer. Concentrations of credit risk with respect to receivables are limited due to control procedures tothat monitor the credit worthiness of customers, the large number of customers in the Company’sCompany's customer base, and their dispersion across different industries and geographic areas. As receivables are generally unsecured, the Company maintains an allowance for doubtful accounts49based upon the expected collectability of all receivables. Receivable balances determined to be uncollectible are charged against the allowance. The carrying values of cash, receivables and accounts payable are considered to be representative of their respective fair values. One customerAt December 31, 2012, one customer’s net receivable balance in our Energy Equipment Group, all within terms, accounted for approximately 21% of the totalconsolidated net receivables balance outstanding at December 31, 2011 and paid approximately 69% of their balance to date in 2012.InventoriesInventories are valued at the lower of cost or market, with cost determined principally on the first in first out method. Market is replacement cost or net realizable value. Work in process and finished goods include material, labor, and overhead.Property, Plant, and EquipmentProperty, plant, and equipment are stated at cost and depreciated over their estimated useful lives using the straight-line method. The estimated useful lives are: buildings and improvements — - 3 to 30 years;years; leasehold improvements —- the lesser of the term of the lease or 7 years;years; machinery and equipment — - 2 to 10 years;years; information systems hardware and software — - 2 to 5 years;years; and railcars in our lease fleet —- generally 35 years.years. The costs of ordinary maintenance and repair are charged to operating costs while renewals and major replacements are capitalized.Long-lived AssetsThe Company periodically evaluates the carrying value of long-lived assets to be held and used for potential impairment. The carrying value of long-lived assets to be held and used is considered impaired only when their carrying value is not recoverable through undiscounted future cash flows and the fair value of the assets is less than their carrying value. Fair value is determined primarily using the anticipated cash flows discounted at a rate commensurate with the risks involved or market quotes as available. Impairment losses on long-lived assets held for sale are determined in a similar manner, except that fair values are reduced for the estimated cost to dispose of the assets. Impairment losses were not material for the years ended December 31, 2012, 2011 2010,, and 2009.2010.Goodwill and Intangible AssetsGoodwill is required to be tested for impairment annually, or on an interim basis whenever events or circumstances change, indicating that the carrying amount of the goodwill might be impaired. The goodwill impairment test is a two-step process with step one requiring the comparison of the reporting unit’sunit's estimated fair value with the carrying amount of its net assets. Step two of the impairment test is necessary to determine the amount of goodwill impairment to be recorded when the reporting unit’sunit's recorded netDue to an overall market decline for products in the Rail Group during the second quarter of 2009, we concluded that indications of impairment existed that required an interim goodwill impairment analysis. Accordingly, we tested the Rail Group’s goodwill for impairment as of June 30, 2009 and recorded a charge of $325.0 million during the second quarter of 2009. See Note 9 Goodwill for further explanation and results of this test. As of 20112012 and 2010,2011, the Company’sCompany's annual impairment test of goodwill was completed at the reporting unit level and no additional impairment charges were determined to be necessary.Intangible assets with defined useful lives, which as of December 31, 20112012 had net book values of $24.7$21.7 million, are amortized over their estimated useful lives, and arewere also evaluated for potential impairment at least annually. Impairment losses were not material for the years ended as of December 31, 2011, 2010, and 2009.Restricted CashRestricted cash consists of cash and cash equivalents that are held as collateral for the Company’sCompany's non-recourse debt and lease obligations and as such are restricted in use.InsuranceThe Company is effectively self-insured for workers’workers' compensation. A third party administrator is used to process claims. We accrue our workers’workers' compensation liability based upon independent actuarial studies.WarrantiesWarranties50warranties at the time revenue is recognized related to products covered by warranties, and assesses the adequacy of the resulting reserves on a quarterly basis.Foreign Currency TranslationOperations outside the United States prepare financial statements in currencies other than the United States dollar. The income statement amounts are translated at average exchange rates for the year, while the assets and liabilities are translated at year-end exchange rates. Translation adjustments are accumulated as a separate component of stockholders’stockholders' equity and other comprehensive loss. The functional currency of our Mexico operations is considered to be the United States dollar.Other Comprehensive Income (Loss)Other comprehensive income (loss) is defined as the change in equity of a business enterprise during a period from transactions and other events and circumstances from non-owner sources. Comprehensive net income (loss) consists of net income (loss), foreign currency translation adjustments, the effective unrealized portions of changes in fair value ofgains and losses on the Company’sCompany's derivative financial instruments, and the change innet actuarial gains and losses of the funded status of pension liabilities.Company's defined benefit plans. See Note 15 Accumulated Other Comprehensive Loss (“AOCL”). All components are shown net of tax.Recent Accounting PronouncementsIn June 2011, the Financial Accounting Standards Board (“FASB”) issued Accounting Standards Update No. 2011-05, “Comprehensive Income (ASC Topic 220): Presentation of Comprehensive Income,” (“ASU 2011-05”) which amends currentamended prior comprehensive income guidance. This accounting update eliminates the option to present the components of other comprehensive income as part of the statement of shareholders’ equity. Instead, the Company must report comprehensive income in either a single continuous statement of comprehensive income which contains two sections, net income and other comprehensive income, or in two separate but consecutive statements. ASU 2011-05 will bebecame effective for public companies during the interim and annual periods beginning after Dec.December 15, 2011 with early adoption permitted. Accordingly, the Company adopted this new standard on January 1,2012. 2012 by including the consolidated statement of comprehensive income with its consolidated financial statements and revising Note 15 Accumulated Other Comprehensive Loss. The adoption of ASU 2011-05 did not have an impact on the Company’s consolidated financial position, results of operations or cash flows as it only requires a change in reporting format with regard to components of other comprehensive income.In February 2013, the formatFinancial Accounting Standards Board issued Accounting Standards Update No. 2013-02, "Reporting of the current presentation.In June 2009, the FASB issued a new accounting standard, ASC 810-10,Amounts Reclassified out of Accumulated Other Comprehensive Income," ("ASU 2013-02") which amended prior reporting requirements with respect to comprehensive income by requiring additional disclosures about the previous accounting rules for consolidationamounts reclassified out of variable interest entities. The new standard replaced the quantitative-based risks and rewards calculation for determining which enterprise has a controlling financial interest in a variable interest entity with an approach focused on identifying which enterprise has the power to direct the activities of a variable interest entity that most significantly affect its economic performance and the obligation to absorb losses of the entity or the right to receive benefits from the entity. Additionally, the new standard provided more timely and useful information about an enterprise’s involvement with a variable interest entity. This standard wasaccumulated other comprehensive loss by component. ASU 2013-02 became effective for public companies during interim and annual reporting periods beginning after NovemberDecember 15, 2009.2012 with early adoption permitted. Accordingly, the Company adopted this new standard on January 1, 2010. See Note 6 Investment in TRIP Holdings for additional explanation2013. The adoption of ASU 2013-02 did not have an impact on the effectsCompany's consolidated financial position, results of implementing this pronouncement as it applies to our investment in TRIP Holdings.Management’soperations, or cash flows.Management's EstimatesThe preparation of financial statements in conformity with generally accepted accounting principles requires management to make estimates and assumptions that affect the reported amounts of assets and liabilities and disclosure of contingent assets and liabilities at the date of the financial statements and the reported amounts of revenues and expenses during the reporting period. Actual results could differ from those estimates.ReclassificationsReclassifications and Revisions Operations and Cash Flows to conform to the 2011 presentations related to the presentation of lease fleet railcar sales. The effect of properly classifying deferred loan issuance costs incurred in the Consolidated Statements of Cash Flows from an operating activity within the change in other assets to a financing activity to properly state such costs as financing activities, amounted to $6.6 million2012 presentation.Note 2. Acquisitions and $19.0 million forDivestituresFor the years ended December 31, 20102012 and 2009, respectively. See Note 19Selected Quarterly Financial Data for further discussion.Note 2. Acquisitions and DivestituresFor the year ended December 31, 2011, all of our acquisition and divestiture activity occurred in the Construction Products Group. This activity consisted of four divestiture. divestiture during 2012, and four acquisitions and one divestiture in 2011. For the year ended December 31, 2010, we completed three acquisitions consisting of two by the Construction Products Group and one by the Energy Equipment Group. For the year ended December 31, 2010, there were two divestitures which occurred in the Construction Products Group. One of the 2012 acquisitions, completed in December 2012, was recorded based on a preliminary valuation of the net assets acquired. As a result of our acquisition activity, we recorded certain assets and liabilities at their acquisition date fair value based on level 3 inputs. Such assets and liabilities were not significant in relation to consolidated assets and liabilities. See Note 3 Fair Value Accounting for a discussion of inputs in determining fair value.51In February 2010, the CompanyCompany's Construction Products Group acquired Quixote Corporation (“Quixote”), a leading manufacturer of energy-absorbing highway crash cushions, truck-mounted attenuators, and other transportation products, for a total cost of $58.1 million.$58.1 million. In addition, the Company assumed $40.0$40.0 million in debt that was subsequently retired in the first quarter of 2010. Based on its valuation of the net assets acquired, Trinity recorded goodwill of $22.7$22.7 million and $24.2$24.2 million in intangible assets primarily consisting of the acquisition-date fair value allocated to patents, trade names and customer relationships that are being amortized over their estimated economic life which generally ranges from four to twenty years and. years. As a result of the acquisition, the Company recorded transaction-related expenses of $4.6$4.6 million including a $1.5$1.5 million write-down of its pre-acquisition investment in Quixote classified as other selling, engineering, and administrative costs. In addition to the transaction-related expenses listed above, there was a $1.8$1.8 million reclassification of previously-recognized charges from AOCL to earnings representing the decline in fair value of the Company’sCompany's pre-acquisition investment in Quixote, included in other,Other, net in the consolidated statement of operations. See Note 12 Other, Net and Note 15 Accumulated Other Comprehensive Loss.Acquisition and divestiture activity for 2012, 2011 and 2010 is summarized below: Year Ended December 31, 2012 2011 2010 (in millions) Acquisitions: Total cost $ 48.8 $ 56.4 $ 70.5 Net cash paid $ 46.2 $ 42.5 $ 49.9 Goodwill recorded $ 20.9 $ 29.3 $ 33.3 Divestitures: Proceeds $ 2.1 $ 8.3 $ 30.8 Gain recognized $ 1.5 $ 0.7 $ 3.8 Goodwill charged off $ 0.1 $ 1.0 $ 16.5 Discontinued operation - Ready Mix Concrete OperationsIn December 2012, the Company entered into an agreement to sell its remaining ready-mix concrete operations. The terms of the transaction are expected to be finalized and the transaction closed during 2013. The expected divestiture of our remaining ready-mix concrete operations has been accounted for and reported as follows. There was no acquisitiona discontinued operation and, divestiture activityaccordingly, historical amounts previously reported have been adjusted, where appropriate, to remove the effect of discontinued operations. Further, assets and liabilities related to the discontinued operations have been classified as Assets/Liabilities Held for Sale and Discontinued Operations in 2009: Acquisitions Divestitures Total cost Net cash
paid during
the year Goodwill
recorded Proceeds Gain
recognized Goodwill
charged off (in millions) $ 56.4 $ 42.5 $ 29.3 $ 8.3 $ 0.7 $ 1.0 $ 58.1 $ 39.9 $ 22.7 $ — $ — $ — 5.0 5.0 4.0 30.8 3.8 16.5 63.1 44.9 26.7 30.8 3.8 16.5 7.4 5.0 6.6 — — — $ 70.5 $ 49.9 $ 33.3 $ 30.8 $ 3.8 $ 16.5 December 31,2012 December 31,2011 (in millions) Assets of Ready-Mix Concrete Operations: Inventories $ 4.5 $ 5.3 Property, plant, and equipment, net 16.9 20.4 Goodwill 6.3 6.4 Other 0.2 0.4 $ 27.9 $ 32.5 Liabilities of Ready-Mix Concrete Operations: Debt $ 3.7 $ 2.7 $ 3.7 $ 2.7 Condensed results of operations for the Ready-Mix Concrete Operations for the years ended December 31, 2012, 2011, and 2010 are as follows: Year Ended December 31, 2012 2011 2010 Revenues $ 121.4 $ 136.8 $ 224.8 Income (loss) from discontinued operations before income taxes $ 2.9 $ (1.5 ) $ 9.6 Provision (benefit) for income taxes 1.1 (0.4 ) 3.6 Net income (loss) from discontinued operations $ 1.8 $ (1.1 ) $ 6.0 52Note 3. Fair Value AccountingAssets and liabilities measured at fair value on a recurring basis are summarized below: Fair Value Measurement as of December 31, 2011 (in millions) Level 1 Level 2 Level 3 Total $ 246.6 $ — $ — $ 246.6 240.3 — — 240.3 — — 0.7 0.7 $ 486.9 $ — $ 0.7 $ 487.6 $ — $ 48.9 $ — $ 48.9 — 4.8 — 4.8 — — 3.1 3.1 — 0.1 — 0.1 $ — $ 53.8 $ 3.1 $ 56.9 Fair Value Measurement as of December 31, 2010 (in millions) Level 1 Level 2 Level 3 Total $ 286.0 $ — $ — $ 286.0 158.0 — — 158.0 207.1 — — 207.1 — 0.1 — 0.1 $ 651.1 $ 0.1 $ — $ 651.2 $ — $ 45.7 $ — $ 45.7 — 48.3 — 48.3 $ — $ 94.0 $ — $ 94.0 Fair Value Measurement as of December 31, 2012 (in millions) Level 1 Level 2 Level 3 Total Assets: Cash equivalents $ 246.6 $ 155.0 $ — $ 401.6 Restricted cash 223.2 — — 223.2 Equity call agreement with TRIP Holdings equity investor1— — 0.8 0.8 Fuel derivative instruments1— 0.1 — 0.1 Total assets $ 469.8 $ 155.1 $ 0.8 $ 625.7 Liabilities: Interest rate hedges:2 Wholly-owned subsidiary $ — $ 37.6 $ — $ 37.6 TRIP Holdings — 5.2 — 5.2 Equity put agreement with TRIP Holdings equity investor3— — 2.9 2.9 Fuel derivative instruments2— 0.0 — 0.0 Total liabilities $ — $ 42.8 $ 2.9 $ 45.7 Fair Value Measurement as of December 31, 2011 (in millions) Level 1 Level 2 Level 3 Total Assets: Cash equivalents $ 246.6 $ — $ — $ 246.6 Restricted cash 240.3 — — 240.3 Equity call agreement with TRIP Holdings equity investor1— — 0.7 0.7 Total assets $ 486.9 $ — $ 0.7 $ 487.6 Liabilities: Interest rate hedges:2 Wholly-owned subsidiary $ — $ 48.9 $ — $ 48.9 TRIP Holdings — 4.8 — 4.8 Equity put agreement with TRIP Holdings equity investor3— — 3.1 3.1 Fuel derivative instruments2— 0.1 — 0.1 Total liabilities $ — $ 53.8 $ 3.1 $ 56.9 1 Included in other assets on the consolidated balance sheet.2 Included in accrued liabilities on the consolidated balance sheet.3 Included in other liabilities on the consolidated balance sheet.(1)Included in other assets on the consolidated balance sheet.(2)Included in accrued liabilities on the consolidated balance sheet.(3)Included in other liabilities on the consolidated balance sheet.tofor that asset or liability in an orderly transaction between market participants on the measurement date. An entity is required to establish a fair value hierarchy that maximizes the use of observable inputs and minimizes the use of unobservable inputs when measuring fair value. The Level 1 – This level is defined as quoted prices in active markets for identical assets or liabilities. The Company’s cash equivalents, short-term marketable securities,excluding commercial paper, and restricted cash are instruments of the United StatesU.S. Treasury fully-insured certificates of deposit or highly-rated money market mutual funds.Level 2 – This level is defined as observable inputs other than Level 1 prices such as quoted prices for similar assets or liabilities; quoted prices in markets that are not active; or other inputs that are observable or can be corroborated by observable market data for substantially the full term of the assets or liabilities. Cash equivalents include commercial paper valued using quoted prices in secondary markets. The Company’s fuel derivative instruments, which are commodity options, are53Level 3 – This level is defined as unobservable inputs that are supported by little or no market activity and that are significant to the fair value of the assets or liabilities. The equity put and call agreements with the TRIP equity investor are valued based on cash flow projections and certain assumptions regarding the likelihood of exercising the option under the related agreement. See Note 6 Investment in TRIP Holdings.The carrying amounts and estimated fair values of our long-term debt wereare as follows: December 31, 2011 December 31, 2010 Carrying
Value Estimated
Fair Value Carrying
Value Estimated
Fair Value (in millions) $ 450.0 $ 439.4 $ 450.0 $ 448.3 (99.8 ) (111.1 ) 350.2 338.9 48.6 48.6 51.2 51.2 54.7 55.7 57.4 54.2 4.2 4.2 2.8 2.8 457.7 547.9 450.3 556.5 269.3 278.5 283.2 302.8 465.5 448.6 493.8 482.2 218.4 228.6 229.2 256.1 354.3 333.1 367.1 345.5 308.5 308.5 80.2 80.2 61.2 61.6 — — 840.0 834.9 — — — — 1,003.9 994.0 2,517.2 2,493.8 2,457.4 2,460.8 $ 2,974.9 $ 3,041.7 $ 2,907.7 $ 3,017.3 December 31, 2012 December 31, 2011 CarryingValue EstimatedFair Value CarryingValue EstimatedFair Value (in millions) Recourse: Convertible subordinated notes $ 450.0 $ 506.6 $ 450.0 $ 439.4 Less: unamortized discount (87.5 ) (99.8 ) 362.5 350.2 Capital lease obligations 45.8 45.8 48.6 48.6 Term loan 48.6 53.3 54.7 55.7 Other 1.2 1.2 1.5 1.5 458.1 606.9 455.0 545.2 Non-recourse: 2006 secured railcar equipment notes 255.8 292.0 269.3 278.5 Promissory notes 424.1 414.6 465.5 448.6 2009 secured railcar equipment notes 209.2 260.4 218.4 228.6 2010 secured railcar equipment notes 341.5 387.2 354.3 333.1 2012 secured railcar equipment notes 333.8 321.7 — — TILC warehouse facility 173.6 173.6 308.5 308.5 TRIP Holdings senior secured notes 61.2 62.5 61.2 61.6 TRIP Master Funding secured railcar equipment notes 797.7 952.0 840.0 834.9 2,596.9 2,864.0 2,517.2 2,493.8 Total $ 3,055.0 $ 3,470.9 $ 2,972.2 $ 3,039.0 The estimated fair value of our convertible subordinated notes was based on a quoted market price as of December 31, 20112012 and 2010, respectively.2011, respectively (Level 1 input). The estimated fair values of our 2006, 2009, 2010, and 20102012 secured railcar equipment notes, promissory notes, TRIP Holdings senior secured notes, TRIP Rail Master Funding LLC (“TRIP Master Funding”) secured railcar equipment notes, TRIP Holdings warehouse loan, and term loan are based on our estimate of their fair value as of December 31, 20112012 and 2010,2011, respectively. These values were determined by discounting their future cash flows at the current market interest rate.rate (Level 3 inputs). The carrying value of our Trinity Industries Leasing Company (“TILC”) warehouse facility approximates fair value because the interest rate adjusts to the market interest rate and the Company’s credit rating has not changed since the loan agreement was renewed in February 2011.2011 and extended in February 2013 (Level 3 input). The fair values of all other financial instruments are estimated to approximate carrying value.54Note 4. Segment InformationThe Company reports operating results in five principal business segments: (1) the Rail Group, which manufactures and sells railcars and related parts and components; (2) the Construction Products Group, which manufactures and sells highway products and concreteother steel products for infrastructure-related projects and produces aggregates; (3) the Inland Barge Group, which manufactures and sells barges and related products for inland waterway services; (4) the Energy Equipment Group, which manufactures and sells products for energy related businesses, including structural wind towers, tank containers and tank heads for pressure and non-pressure vessels, frac tanks, and utility, traffic, and lighting structures; and (5) the Railcar Leasing and Management Services Group (“Leasing Group”), which owns and operates a fleet of railcars as well as provides third-party fleet management, maintenance, and leasing services. The segment All Other includes our captive insurance and transportation companies; legal, environmental, and maintenance costs associated with non-operating facilities; other peripheral businesses; and the change in market valuation related to ineffective commodity hedges. Gains and losses from the sale of property, plant, and equipment whichthat are related to manufacturing and dedicated to the specific manufacturing operations of a particular segment are included in operating profit of thatwhichthat can be utilized by multiple segments are included in operating profit of the All Other segment.As discussed in Note 2, Acquisitions and Divestitures, in December 2012, the Company entered into an agreement to sell its remaining ready-mix concrete operations that have historically been a component of the Construction Products Group. The expected divestiture of our remaining ready-mix concrete operations has been accounted for and reported as a discontinued operation and, accordingly, historical segment information previously reported has been adjusted to exclude the discontinued operations from the Construction Products Group.Sales and related net profits from the Rail Group to the Leasing Group are recorded in the Rail Group and eliminated in consolidation. Sales between these groups are recorded at prices comparable to those charged to external customers, taking into consideration quantity, features, and production demand. Amortization of deferred profit on railcars sold to the Leasing Group is included in the operating profits of the Leasing Group. Sales of railcars from the lease fleet are included in the Leasing Group. Revenue and operating profit55The financial information from continuing operations for these segments is shown in the tables below. We operate principally in North America.Year EndedDecember 31, 2012 Revenues Operating Profit (Loss) Assets Depreciation & Amortization Capital Expenditures External Intersegment Total (in millions) Rail Group $ 1,512.1 $ 500.9 $ 2,013.0 $ 199.0 $ 916.2 $ 21.8 $ 47.8 Construction Products Group 461.2 22.5 483.7 44.8 415.2 16.6 15.7 Inland Barge Group 675.2 — 675.2 124.7 154.4 7.6 15.0 Energy Equipment Group 506.0 52.6 558.6 18.2 400.1 19.0 25.2 Railcar Leasing and Management Services Group 644.4 2.7 647.1 300.9 4,538.8 120.5 352.6 All Other 13.0 68.4 81.4 (10.2 ) 30.9 4.4 6.6 Corporate — — — (51.5 ) 744.9 3.9 6.3 Eliminations – Lease subsidiary — (485.9 ) (485.9 ) (50.8 ) (446.2 ) — — Eliminations – Other — (161.2 ) (161.2 ) (0.3 ) (112.3 ) (0.1 ) — Consolidated Total $ 3,811.9 $ — $ 3,811.9 $ 574.8 $ 6,642.0 $ 193.7 $ 469.2 Year EndedDecember 31, 2011 Revenues Operating
Profit
(Loss) Depreciation &
Amortization Capital
Expenditures External Intersegment Total Assets (in millions) $ 931.7 $ 343.0 $ 1,274.7 $ 77.3 $ 684.6 $ 23.9 $ 11.4 577.2 12.9 590.1 53.4 403.2 20.7 12.1 548.5 — 548.5 106.4 189.2 6.4 38.0 (1) 454.8 18.0 472.8 8.9 392.9 18.4 10.4 551.4 0.6 552.0 254.5 4,462.1 115.7 258.6 11.5 50.3 61.8 (3.8 ) 30.5 4.4 4.0 — — — (43.6 ) 512.9 3.6 5.5 — (325.5 ) (325.5 ) (28.3 ) (440.3 ) — — — (99.3 ) (99.3 ) 0.5 (114.1 ) (0.2 ) — $ 3,075.1 $ — $ 3,075.1 $ 425.3 $ 6,121.0 $ 192.9 $ 340.0 Revenues Operating Profit (Loss) Assets Depreciation & Amortization Capital Expenditures External Intersegment Total (in millions) Rail Group $ 931.7 $ 343.0 $ 1,274.7 $ 77.3 $ 684.6 $ 23.9 $ 11.4 Construction Products Group 440.4 12.9 453.3 54.9 370.7 15.5 7.7 Inland Barge Group 548.5 — 548.5 106.4 189.2 6.4 38.0 Energy Equipment Group 454.8 18.0 472.8 8.9 392.9 18.4 10.4 Railcar Leasing and Management Services Group 551.4 0.6 552.0 254.5 4,462.1 115.7 258.6 All Other 11.5 50.3 61.8 (3.8 ) 30.5 4.4 4.0 Corporate — — — (43.6 ) 512.9 3.6 5.5 Eliminations – Lease subsidiary — (325.5 ) (325.5 ) (28.3 ) (440.3 ) — — Eliminations – Other — (99.3 ) (99.3 ) 0.5 (114.1 ) (0.2 ) — Consolidated Total $ 2,938.3 $ — $ 2,938.3 $ 426.8 $ 6,088.5 $ 187.7 $ 335.6 Year EndedDecember 31, 2010 Operating Revenues Profit Depreciation & Capital External Intersegment Total (Loss) Assets Amortization Expenditures (in millions) $ 289.7 $ 232.4 $ 522.1 $ 1.5 $ 482.9 $ 24.0 $ 4.0 558.3 20.5 578.8 47.4 335.2 23.7 5.5 422.3 — 422.3 69.0 94.5 5.5 14.6 (1) 408.5 11.1 419.6 35.1 352.4 17.1 8.1 464.5 — 464.5 207.0 4,452.6 112.6 213.8 12.2 36.3 48.5 (11.4 ) 27.5 3.6 4.2 — — — (33.8 ) 538.5 3.4 4.6 — (216.8 ) (216.8 ) (8.4 ) (522.1 ) — — — (83.5 ) (83.5 ) (2.6 ) (1.5 ) (0.3 ) — $ 2,155.5 $ — $ 2,155.5 $ 303.8 $ 5,760.0 $ 189.6 $ 254.8 (1)Primarily related to repair and replacement of property, plant and equipment at the Company’s inland barge manufacturing facilities in Missouri and Tennessee. See Note 8 – Property, Plant, and Equipment.Year Ended December 31, 2009 Revenues Operating
Profit
(Loss) Depreciation &
Amortization Capital
Expenditures External Intersegment Total Assets (in millions) $ 485.2 $ 410.1 $ 895.3 $ (355.9 ) $ 450.7 $ 25.0 $ 19.6 524.0 14.5 538.5 32.6 277.3 23.5 11.6 527.3 — 527.3 125.2 69.4 6.1 1.3 502.2 7.8 510.0 73.8 242.0 16.9 9.1 370.2 — 370.2 149.0 3,167.3 82.4 343.0 12.0 36.4 48.4 0.8 27.6 3.1 2.0 — — — (30.8 ) 753.1 4.2 3.8 — (391.6 ) (391.6 ) (22.6 ) (329.0 ) — — — (77.2 ) (77.2 ) (3.0 ) (2.0 ) (0.4 ) — $ 2,420.9 $ — $ 2,420.9 $ (30.9 ) $ 4,656.4 $ 160.8 $ 390.4 Effective December 31, 2011, the Company adopted the emerging industry policy of recognizing revenue from the sales of railcars from the lease fleet on a gross basis in leasing revenues and cost of revenues if the railcar has been owned by the lease fleet for one year or less at the time of sale. Sales of railcars from the lease fleet which have been owned by the lease fleet for more than one year are recognized as a net gain or loss from the disposal of a long-term asset. Prior year reported balances have been reclassified to conform to this policy. See Note 1 of the Notes to Consolidated Financial Statements. Revenues Operating Profit (Loss) Assets Depreciation & Amortization Capital Expenditures External Intersegment Total (in millions) Rail Group $ 289.7 $ 232.4 $ 522.1 $ 1.5 $ 482.9 $ 24.0 $ 4.0 Construction Products Group 333.5 20.5 354.0 37.8 294.0 15.0 3.5 Inland Barge Group 422.3 — 422.3 69.0 94.5 5.5 14.6 Energy Equipment Group 408.5 11.1 419.6 35.1 352.4 17.1 8.1 Railcar Leasing and Management Services Group 464.5 — 464.5 207.0 4,452.6 112.6 213.8 All Other 12.2 36.3 48.5 (11.4 ) 27.5 3.6 4.2 Corporate — — — (33.8 ) 538.5 3.4 4.6 Eliminations – Lease subsidiary — (216.8 ) (216.8 ) (8.4 ) (522.1 ) — — Eliminations – Other — (83.5 ) (83.5 ) (2.6 ) (1.5 ) (0.3 ) — Consolidated Total $ 1,930.7 $ — $ 1,930.7 $ 294.2 $ 5,718.8 $ 180.9 $ 252.8 Corporate assets are composed of cash and cash equivalents, short-term marketable securities, notes receivable, certain property, plant, and equipment, and other assets. Capital expenditures do not include business acquisitions.56Externally reported revenues and operating profit for our Mexico operations for the years ended December 31, 2012, 2011 2010,, and 20092010 are presented below: External Revenues Operating Profit Year Ended
December 31, Year Ended
December 31, 2011 2010 2009 2011 2010 2009 (in millions) $ 123.0 $ 98.3 $ 86.8 $ 18.4 $3.4 $ 15.2 External Revenues Operating Profit Year Ended December 31, Year Ended December 31, 2012 2011 2010 2012 2011 2010 (in millions) Mexico $ 96.4 $ 123.0 $ 98.3 $ 0.2 $ 18.4 $ 3.4 Total assets and long-lived assets for our Mexico operations as of December 31, 20112012 and 20102011 are presented below: Total Assets Long-Lived Assets December 31, 2011 2010 2011 2010 (in millions) $ 240.4 $ 288.8 $ 143.2 $ 151.7 Total Assets Long-Lived Assets December 31, 2012 2011 2012 2011 (in millions) Mexico $285.8 $240.4 $141.2 $143.2 57Note 5. Railcar Leasing and Management Services GroupThe Railcar Leasing and Management Services Group owns and operates a fleet of railcars as well as provides third-party fleet management, maintenance, and leasing services. Selected consolidating financial information for the Leasing Group is as follows: December 31, 2011 Leasing Group Wholly
Owned
Subsidiaries TRIP
Holdings Manufacturing/
Corporate Total (in millions) $ 3.2 $ — $ 347.9 $ 351.1 $ 3,066.0 $ 1,135.0 $ 510.0 $ 4,711.0 (344.5 ) (187.0 ) — (531.5 ) $ 2,721.5 $ 948.0 $ 510.0 $ 4,179.5 $ 165.7 $ 74.6 $ — $ 240.3 $ 103.3 $ — $ 454.2 $ 557.5 — — (99.8 ) (99.8 ) 103.3 — 354.4 457.7 1,616.0 1,010.0 — 2,626.0 — (108.8 ) — (108.8 ) $ 1,719.3 $ 901.2 $ 354.4 $ 2,974.9 $ 582.4 $ 4.7 $ (152.4 ) $ 434.7 December 31, 2010 Leasing Group Wholly
Owned
Subsidiaries TRIP
Holdings Manufacturing/
Corporate Total (in millions) $ 3.8 $ — $ 508.2 $ 512.0 $ 2,965.4 $ 1,191.8 $ 491.4 $ 4,648.6 (340.4 ) (196.2 ) — (536.6 ) $ 2,625.0 $ 995.6 $ 491.4 $ 4,112.0 $ 161.1 $ 46.0 $ — $ 207.1 $ 108.6 $ — $ 452.8 $ 561.4 — — (111.1 ) (111.1 ) 108.6 — 341.7 450.3 1,453.5 1,003.9 — 2,457.4 $ 1,562.1 $ 1,003.9 $ 341.7 $ 2,907.7 $ 515.7 $ (0.3 ) $ (124.4 ) $ 391.0 December 31, 2012 Leasing Group Wholly-OwnedSubsidiaries TRIPHoldings Manufacturing/Corporate Total (in millions) Cash and cash equivalents $ 5.7 $ — $ 567.3 $ 573.0 Property, plant, and equipment, net $ 3,203.8 $ 1,118.6 $ 539.3 $ 4,861.7 Net deferred profit on railcars sold to the Leasing Group (381.8 ) (180.9 ) — (562.7 ) $ 2,822.0 $ 937.7 $ 539.3 $ 4,299.0 Restricted cash $ 172.9 $ 50.3 $ — $ 223.2 Debt: Recourse $ 94.4 $ — $ 451.2 $ 545.6 Less: unamortized discount — — (87.5 ) (87.5 ) 94.4 — 363.7 458.1 Non-recourse 1,738.0 967.7 — 2,705.7 Less: non-recourse debt owned by Trinity — (108.8 ) — (108.8 ) Total debt $ 1,832.4 $ 858.9 $ 363.7 $ 3,055.0 Net deferred tax liabilities $ 671.1 $ 5.4 $ (120.7 ) $ 555.8 December 31, 2011 Leasing Group Wholly-OwnedSubsidiaries TRIPHoldings Manufacturing/Corporate Total (in millions) Cash and cash equivalents $ 3.2 $ — $ 347.9 $ 351.1 Property, plant, and equipment, net $ 3,066.0 $ 1,135.0 $ 489.6 $ 4,690.6 Net deferred profit on railcars sold to the Leasing Group (344.5 ) (187.0 ) — (531.5 ) $ 2,721.5 $ 948.0 $ 489.6 $ 4,159.1 Restricted cash $ 165.7 $ 74.6 $ — $ 240.3 Debt: Recourse $ 103.3 $ — $ 451.5 $ 554.8 Less: unamortized discount — — (99.8 ) (99.8 ) 103.3 — 351.7 455.0 Non-recourse 1,616.0 1,010.0 — 2,626.0 Less: non-recourse debt owned by Trinity — (108.8 ) — (108.8 ) Total debt $ 1,719.3 $ 901.2 $ 351.7 $ 2,972.2 Net deferred tax liabilities $ 582.4 $ 4.7 $ (152.4 ) $ 434.7 See Note 1 Summary of Significant Accounting Policies, Note 6 Investment in TRIP Holdings and Note 11 Debt for a further discussion regarding the accounting for the Company’s investment in TRIP Holdings and TRIP Holdings’ debt. Year Ended
December 31, Percent Change 2011 2010 2009 2011
versus 2010 2010
versus 2009 ($ in millions) $ 375.1 $ 345.4 $ 329.3 8.6 % 4.9 % 59.4 3.1 40.9 * * 434.5 348.5 370.2 24.7 % (5.9 )% 117.5 116.0 — 1.3 % — — — — — — 117.5 116.0 — 1.3 % — $ 552.0 $ 464.5 $ 370.2 18.8 % 25.5 % $ 156.3 $ 131.7 $ 128.5 13.2 0.2 2.1 11.8 6.6 18.4 181.3 138.5 149.0 68.8 68.5 — — — — 4.4 — — 73.2 68.5 — $ 254.5 $ 207.0 $ 149.0 45.7 % 43.4 % 39.0 % * * * 46.1 % 44.6 % 40.2 % $ 48.6 $ 48.6 $ 46.7 $ 101.3 $ 91.7 $ 80.1 $ 53.1 $ 46.9 $ — 6.4 — — 59.5 46.9 — $ 160.8 $ 138.6 $ 80.1 58 Year Ended December 31, Percent Change 2012 2011 2010 2012 versus 2011 2011 versus 2010 ($ in millions) Revenues: Wholly owned subsidiaries: Leasing and management $ 409.8 $ 375.1 $ 345.4 9.3 % 8.6 % Railcar sales 118.6 59.4 3.1 * * 528.4 434.5 348.5 21.6 24.7 TRIP Holdings: Leasing and management 118.7 117.5 116.0 1.0 1.3 Railcar sales — — — — — 118.7 117.5 116.0 1.0 1.3 Total revenues $ 647.1 $ 552.0 $ 464.5 17.2 18.8 Operating Profit: Wholly owned subsidiaries: Leasing and management $ 175.2 $ 156.3 $ 131.7 Railcar sales: Railcars owned one year or less at the time of sale 24.8 13.2 0.2 Railcars owned more than one year at the time of sale 32.8 11.8 6.6 232.8 181.3 138.5 TRIP Holdings: Leasing and management 67.4 68.8 68.5 Railcar sales: Railcars owned one year or less at the time of sale — — — Railcars owned more than one year at the time of sale 0.7 4.4 — 68.1 73.2 68.5 Total operating profit $ 300.9 $ 254.5 $ 207.0 Operating profit margin: Leasing and management 45.9 % 45.7 % 43.4 % Railcar sales * * * Total operating profit margin 46.5 46.1 44.6 Depreciation, interest, and rent expense(1): Depreciation expense $ 120.5 $ 115.7 $ 112.6 Rent expense $ 50.9 $ 48.6 $ 48.6 Interest expense: Wholly-owned subsidiaries $ 101.2 $ 101.3 $ 91.7 TRIP Holdings: External 60.0 53.1 46.9 Intercompany 13.1 6.4 — 73.1 59.5 46.9 Total interest expense $ 174.3 $ 160.8 $ 138.6 *Not meaningful(1)Effective December 31, 2011, the Company adopted the emerging industry policy of recognizing revenue from the sales of railcars from the lease fleet on a gross basis in leasing revenues(1) Depreciation and cost of revenues if the railcar has been owned by the lease fleet for one year or less at the time of sale. Sales of railcars from the lease fleet which have been owned by the lease fleet for more than one yearrent expense are recognized as a net gain or loss from the disposal of a long-term asset. Prior year reported balances have been reclassified to conform to this policy. See Note 1 of the Notes to Consolidated Financial Statements.(2)Rent expense is a componentcomponents of operating profit. Interest expense is not a component of operating profit and includes the effect of hedges. Intercompany interest expense arises from Trinity’s ownership of a portion of TRIP Holdings’ Senior Secured Notes and is eliminated in consolidation. See Note 11 Debt.For the year ended December 31, 2009, revenues59Equipment consists primarily of railcars leased by third parties. The Leasing Group purchases equipment manufactured predominantly by the Rail Group and enters into lease contracts with third parties with terms generally ranging between one and twenty years. The Leasing Group primarily enters into operating leases. Future contractual minimum rental revenues on leases are as follows: 2012 2013 2014 �� 2015 2016 Thereafter Total (in millions) $ 255.9 $ 205.7 $ 153.5 $ 116.3 $ 81.6 $ 181.8 $ 994.8 93.6 62.6 41.9 33.7 28.9 55.7 316.4 $ 349.5 $ 268.3 $ 195.4 $ 150.0 $ 110.5 $ 237.5 $ 1,311.2 2013 2014 2015 2016 2017 Thereafter Total (in millions) Wholly-owned subsidiaries $ 274.9 $ 222.9 $ 177.7 $ 136.8 $ 95.0 $ 205.7 $ 1,113.0 TRIP Holdings 94.3 71.8 59.1 48.9 34.9 44.0 353.0 $ 369.2 $ 294.7 $ 236.8 $ 185.7 $ 129.9 $ 249.7 $ 1,466.0 Debt.The Leasing Group’s debt at December 31, 2011 consists2012 consisted of both recourse and non-recourse debt. In 2009, the Company entered into a seven-year $61.0seven-year $61.0 million term loan agreement and capital lease obligations totaling $56.6 million.$56.6 million. These debt obligations are guaranteed by Trinity Industries, Inc. and certain subsidiaries, and secured by railcar equipment and related leases. As of December 31, 2011,2012, Trinity’s wholly-owned subsidiaries included in the Leasing Group held equipment with a net book value of approximately $2,489.1$2,660.5 million that is pledged as collateral for Leasing Group debt held by those subsidiaries, including equipment with a net book value of $51.0$49.6 million securing capital lease obligations. The net book value of unpledged equipment at December 31, 2012 was $450.2 million. See Note 11 Debt for the form, maturities, and descriptions of Leasing Group debt.TRIP Holdings. Debt owed by TRIP Holdings and its subsidiaries is nonrecourse to Trinity and TILC and is secured solely by the consolidated assets of TRIP Holdings and the equity interests of TRIP Holdings. In July 2011, TRIP Holdings and its newly-formed subsidiary, TRIP Rail Master Funding, LLC (“TRIP Master Funding”), issued $1,032.0$1,032.0 million in new debt and repaid all of the outstanding borrowings of the previously-existingexisting TRIP Warehouse Loan. TRIP HoldingsMaster Funding equipment with a net book value of $1,135.0$1,118.6 million, excluding deferred profit onresulting from the sale of railcars sold to TRIP Holdings,Master Funding, is pledged as collateral for the TRIP Holdings'Master Funding debt. See Note 6 Investment in TRIP Holdings for a description of TRIP Holdings.Off Balance Sheet Arrangements.In prior years, the Leasing Group completed a series of financing transactions whereby railcars were sold to one or more separate independent owner trusts (“Trusts”). Each of the Trusts financed the purchase of the railcars with a combination of debt and equity. In each transaction, the equity participant in the Trust is considered to be the primary beneficiary of the Trust and therefore, the debt related to the Trust is not included as part of the consolidated financial statements. The Leasing Group, through newly formed, wholly-owned, qualified subsidiaries, leased railcars from the Trusts under operating leases with terms of 22 years, and subleased the railcars to independent third partythird-party customers under shorter term operating rental agreements. Under the terms of the operating lease agreements between the subsidiaries and the Trusts, the Leasing Group has the option to purchase at a predetermined fixed price, certain of the railcars from the Trusts in 2016 and other railcars in 2019.2019. The Leasing Group also has options to purchase the railcars at the end of the respective lease agreements in 2023, 2026, and 2027 at the then fair market value of the railcars as determined by a third party, independent appraisal. At the expiration of the operating lease agreements, the Company has no further obligations with respect to the leased railcars.These Leasing Group subsidiaries had total assets as of December 31, 20112012 of $219.1$208.7 million, including cash of $88.6$83.2 million and railcars of $97.6 million.$93.0 million. The right, title, and interest in each sublease, cash, and railcars are pledged to collateralize the lease obligations to the Trusts and are included in the consolidated financial statements of the Company. Trinity does not guarantee the performance of the subsidiaries’ lease obligations. Certain ratios and cash deposits must be maintained by the Leasing Group’s subsidiaries in order for excess cash flow, as defined in the agreements, from the lease to third parties to be available to Trinity. Future operating lease obligations of the Leasing Group’s subsidiaries as well as future contractual minimum rental revenues related to these leases due to the Leasing Group are as follows: 2012 2013 2014 2015 2016 Thereafter Total (in millions) $ 44.5 $ 45.7 $ 44.9 $ 43.2 $ 40.2 $ 341.8 $ 560.3 $ 57.5 $ 40.7 $ 26.3 $ 19.8 $ 12.5 $ 24.0 $ 180.8 2013 2014 2015 2016 2017 Thereafter Total �� (in millions) Future operating lease obligations of Trusts’ railcars $ 45.6 $ 44.7 $ 43.0 $ 40.1 $ 41.9 $ 298.9 $ 514.2 Future contractual minimum rental revenues of Trusts’ railcars $ 55.0 $ 39.8 $ 30.5 $ 21.9 $ 13.1 $ 30.0 $ 190.3 In each transaction, the Leasing Group has entered into a servicing and re-marketing agreement with the Trusts that requires the Leasing Group to endeavor, consistent with customary commercial practice as would be used by a prudent person, to maintain railcars under lease for the benefit of the Trusts. The Leasing Group also receives management fees under the terms of the agreements. In each transaction, an independent trustee for the Trusts has authority for appointment of the railcar fleet manager.60Operating Lease Obligations.Obligations. Future amounts due as well as future contractual minimum rental revenues related to operating leases other than leases with the Trusts are as follows: 2012 2013 2014 2015 2016 Thereafter Total (in millions) $ 8.3 $ 8.0 $ 7.9 $ 7.9 $ 7.7 $ 33.4 $ 73.2 $ 9.4 $ 8.5 $ 7.9 $ 5.0 $ 4.3 $ 7.5 $ 42.6 2013 2014 2015 2016 2017 Thereafter Total (in millions) Future operating lease obligations $ 12.9 $ 12.8 $ 12.8 $ 12.7 $ 12.1 $ 50.3 $ 113.6 Future contractual minimum rental revenues $ 16.6 $ 16.0 $ 12.4 $ 11.4 $ 8.9 $ 14.0 $ 79.3 Operating lease obligations totaling $30.3$26.1 million are guaranteed by Trinity Industries, Inc. and certain subsidiaries.61Note 6. Investment in TRIP HoldingsIn 2007, the Company and other third-party equity investors formed TRIP Holdings for the purpose of providing railcar leasing and management services in North America. TRIP Holdings, through its wholly-owned subsidiary, TRIP Rail Leasing LLC (“TRIP Leasing”), purchased railcars from the Company’s Rail and Leasing Groups funded by capital contributions from TRIP Holdings’ equity investors and borrowings under the TRIP Warehouse Loan, defined as such in Note 11 Debt.Loan. As of December 31, 2011,2012, TRIP LeasingHoldings’ subsidiaries had purchased $1,284.7$1,331.4 million of railcars from the Company. Railcars purchased from the Company by TRIP LeasingHoldings’ subsidiaries were required to be purchased at prices comparable with the prices of all similar, new railcars sold contemporaneously by the Company and at prices based on third-party appraised values for used railcars.In 2010, Trinity purchased2011, as a 29% interest inresult of refinancing TRIP Holdings for $28.6 million from another equity investor. The carrying amount of the noncontrolling interest was reduced by $45.3 million to reflect the change in its ownership interest, resulting in an increase to stockholders’ equity attributable to Trinity Industries’ controlling interest of $10.3 million, net of tax.In July 2011,Holdings’ previous credit facility, TRIP Holdings and its newly-formed subsidiary, TRIP Master Funding, issued $1,032.0 which was used by TRIP Master Funding to purchase all of the railcar equipment owned by TRIP Leasing which, in turn, repaid all outstanding borrowings under the previously-existingthen existing TRIP Warehouse Loancredit facility and settled all outstanding related interest rate hedges. See Note 11 Debt for a description ofregarding TRIP Holdings and its related debt.Additionally, Trinity entered into agreements with an equity investor of TRIP Holdings potentially requiring Trinity, under certain limited circumstances, to acquire from the equity investor an additional 16.3% equity ownership in TRIP Holdings if the option is exercised to its fullest extent. Under the agreement, if exercised, Trinity would be required to pay the equity investor an amount equal to 90% of the equity investor’s net investment in TRIP Holdings. Similarly, at its option, Trinity, under certain limited circumstances, may acquire all of the equity investor’s equity ownership in TRIP Holdings at an amount equal to 100% of the equity investor’s net investment in TRIP Holdings. The agreements expire in July 2014. See Note 3 Fair Value Accounting and Note 12 Other, net.At December 31, 2011,2012, the Company owned 57% of TRIP Holdings with the remainder owned by three other third-party equity investors. The Company's noncontrolling interest represents the non-Trinity equity interest in TRIP Holdings. The Company receives distributions from TRIP Holdings as an equity investor, when allowed, in proportion to its 57% equity interest, and has an interest in the net assets of TRIP Holdings upon a liquidation event in the same proportion. The terms of the Company’s equity investment are identical to the terms of each of the other equity investors. The manager of TRIP Holdings, TILC, may be removed without cause as a result of a majority vote of the third-party equity investors. Other than as described further below,above, Trinity has had no remaining equity commitment to TRIP Holdings as of December 31, 20112012 and has had no obligation to guarantee performance under any TRIP-related debt agreements, guarantee any railcar residual values, shield any parties from losses, or guarantee minimum yields.The manager of TRIP Holdings, Trinity Industries Leasing Company (“TILC”), may be removed without cause as a result of a majority vote of the third-party equity investors.The Company’s carrying value of its investment in TRIP Holdings is as follows: December 31,
2011 December 31,
2010 (in millions) $ 47.3 $ 47.3 44.8 44.8 92.1 92.1 12.0 7.5 (1.3 ) (1.4 ) (7.0 ) (7.0 ) (0.6 ) (0.8 ) $ 95.2 $ 90.4 On January 1, 2010, the Company adopted the provisions of a new accounting pronouncement, ASC 810-10, which amended the rules regarding the consolidation of variable interest entities. Under this new standard, which changed the criteria for determining which enterprise has a controlling financial interest, the Company was determined to be the primary beneficiary of TRIP Holdings because of its combined role as both equity member and manager/servicer of TRIP Holdings. As a result of adopting thispronouncement, the consolidated financial statements of TRIP Holdings and subsidiary are required to be included with the consolidated financial statements of the Company. We determined the effects on Trinity’s consolidated financial statements as if TRIP Holdings had been included in the Company’s consolidated financial statements from TRIP Holdings’ inception, and recorded a charge to retained earnings of $105.4 million, net of $57.7 million in tax benefit, and a noncontrolling interest of $129.9 million as of January 1, 2010. With the acquisition by Trinity of the additional ownership interest in TRIP Holdings in September 2010, the Company’s controlling financial interest in TRIP Holdings derives from its majority ownership. Accordingly, the consolidated balance sheets of the Company as of December 31, 2011 and 2010 and the consolidated statements of operations, cash flows, and stockholders’ equity for the twelve months ended December 31, 2011 and 2010 include the accounts of TRIP Holdings. Prior periods were not restated. All significant intercompany accounts and transactions have been eliminated. Profits have been deferred on sales of railcars from the Rail or Leasing Group to TRIP Holdings and will be amortized over the life of the related equipment. Additionally, any future profits on the sale of railcars to TRIP Holdings will be deferred and amortized over the life of the related equipment. The noncontrolling interest represents the non-Trinity equity interest in TRIP Holdings. The assets of TRIP Holdings may only be used to satisfy liabilities of TRIP Holdings, and the liabilities of TRIP Holdings have recourse only to TRIP Holdings’ assets.Prior to January 1, 2010, profit on equipment sales to TRIP Leasing was recognized at the time of sale to the extent of the non-Trinity interests in TRIP Holdings. The deferred profit on the sale of equipment to TRIP Leasing pertaining to TILC’s interest in TRIP Holdings was being amortized over the depreciable life of the related equipment. All other fee income to TILC earned from services provided to TRIP Holdings was recognized by TILC to the extent of the non-Trinity interests in TRIP Holdings. Effective January 1, 2010, amortization of the deferred profit on the sale of equipment is recorded as if the entire profit on equipment sales to TRIP Leasing was deferred at the time of the sale and amortized over the depreciable life of the related equipment. All fee income to TILC earned from services provided to TRIP Holdings has been eliminated for the twelve months ended December 31, 2011 and 2010.Sales of railcars to TRIP Leasing and related gains for the years ended December 31, 2011, 2010, and 2009 are as follows: Year Ended December 31, 2011 2010 2009 (in millions) $ — $ — $ 113.0 $ — $ — $ 11.2 $ — $ — $ 2.8 $ — $ — $ 39.4 — — 144.4 $ — $ — $ 183.8 $ — $ — $ 30.3 $ — $ — $ 7.6 In July 2011, Trinity entered into agreements with an equity investor of TRIP Holdings potentially requiring Trinity, under certain limited circumstances, to acquire from the equity investor an additional 16.3% equity ownership in TRIP Holdings if the option is exercised to its fullest extent. Under the agreement, if exercised, Trinity would be required to pay the equity investor an amount equal to 90% of the equity investor’s net investment in TRIP Holdings. Similarly, at its option, Trinity, under certain limited circumstances, may acquire all of the equity investor’s equity ownership in TRIP Holdings at an amount equal to 100% of the equity investor’s net investment in TRIP Holdings. The agreements expire in July 2014. The fair value of these agreements was recorded in the accompanying consolidated statement of operations as an expense of $2.4 million for the year ended December 31, 2011. See Note 3 Fair Value Accounting and Note 12 Other, Net. December 31,
2012 December 31,
2011 (in millions) Capital contributions $ 47.3 $ 47.3 Equity purchased from investors 44.8 44.8 92.1 92.1 Equity in earnings 10.1 12.0 Equity in unrealized losses on derivative financial instruments 0.8 (1.3 ) Distributions (7.0 ) (7.0 ) Deferred broker fees (0.4 ) (0.6 ) $ 95.6 $ 95.2 Administrative fees paid to TILC by TRIP Holdings and subsidiaries for the years ended December 31, 2012, 2011 2010,, and 20092010 were $4.3$4.8 million $3.7, $4.3 million, and $4.5$3.7 million, respectively.62Note 7. Derivative InstrumentsWe use derivative instruments to mitigate the impact of changes in interest rates, both in anticipation of future debt issuances and pricing for zinc, natural gas, and diesel fuel prices, as well as to convert a portionoffset interest rate variability of our variable-ratecertain floating rate debt to fixed-rate debt. Additionally, weissuances outstanding. We also use derivative instruments to mitigate the impact of unfavorable fluctuationschanges in natural gas and diesel fuel prices and changes in foreign currency exchange rates. We also use derivatives to lock in fixed interest rates in anticipation of future debt issuances. For derivative instruments designated as hedges, the Company formally documents the relationship between the derivative instrument and the hedged item, as well as the risk management objective and strategy for the use of the derivative instrument. This documentation includes linking the derivatives that are designated as fair value or cash flow hedges to specific assets or liabilities on the balance sheet, commitments, or forecasted transactions. At the time a derivative instrument is entered into, and at least quarterly thereafter, the Company assesses whether the derivative instrument is effective in offsetting the changes in fair value or cash flows of the hedged item. Any change in fair value resulting in ineffectiveness, as defined by accounting standards issued by the FASB, is recognized in current period earnings. For derivative instruments that are designated and qualify as cash flow hedges, the effective portion of the gain or loss on the derivative instrument is recorded in AOCL as a separate component of stockholders’stockholders' equity and reclassified into earnings in the period during which the hedge transaction affects earnings. Trinity monitors its derivative positions and the credit ratings of its counterparties and does not anticipate losses due to counterparties’counterparties' non-performance. See Note 3 Fair Value Accounting for discussion of how the Company valued its commodity hedges and interest rate swaps at December 31, 2011.Interest rate hedges Included in accompanying balance
sheet at December 31, 2011 Notional
Amount Interest
Rate(1) Liability AOCL —
loss/
(income) Noncontrolling
Interest (in millions, except %) $ 200.0 4.87 % — $ (2.3 ) — $ 370.0 5.34 % — $ 10.6 — $ 788.5 3.60 % — $ 23.4 $ 17.5 $ 89.5 2.62 % $ 4.8 $ 2.7 $ 2.0 $ 474.7 4.13 % $ 48.9 $ 46.7 — Included in accompanying balance sheet
at December 31, 2012 NotionalAmount InterestRate(1) Liability AOCL –loss/(income) NoncontrollingInterest (in millions, except %) Expired hedges: 2006 secured railcar equipment notes $ 200.0 4.87 % $ — $ (1.9 ) $ — Promissory notes $ 370.0 5.34 % $ — $ 7.2 $ — TRIP Holdings $ 788.5 3.60 % $ — $ 19.9 $ 14.9 Open hedges: TRIP Master Funding secured railcar equipment notes $ 78.4 2.62 % $ 5.2 $ 2.9 $ 2.2 Promissory notes $ 443.8 4.13 % $ 37.6 $ 34.9 $ — (1)Weighted average fixed interest rate Effect on interest expense-increase/(decrease) Year Ended December 31, Expected effect during next twelve months(1) 2012 2011 2010 (in millions) Expired hedges: 2006 secured railcar equipment notes $ (0.3 ) $ (0.4 ) $ (0.4 ) $ (0.3 ) Promissory notes $ 3.3 $ 3.5 $ 3.8 $ 3.1 TRIP Holdings $ 6.0 $ 17.4 $ 29.3 $ 5.6 Open hedges(2): TILC Warehouse $ — $ — $ 0.5 $ — TRIP Master Funding secured railcar equipment notes $ 2.0 $ 1.1 $ — $ 1.8 Promissory notes $ 18.4 $ 19.6 $ 19.7 $ 16.7 (1) Weighted average fixed interest rate(2) Previously classified with interest rate swaps Effect on interest
expense –increase/(decrease) Year Ended December 31, Expected effect
during next
twelve months(1) 2011 2010 2009 (in millions) $ (0.4 ) $ (0.4 ) $ (0.4 ) $ (0.3 ) $ 3.5 $ 3.8 $ 4.0 $ 3.4 $ 17.4 $ 29.3 — $ 6.0 — $ 0.5 $ 2.9 — $ 1.1 — — $ 1.7 $ 19.6 $ 19.7 $ 21.6 $ 17.0 (1)Based on fair value as of December 31, 20112012(2) Previously classified with interest rate swapsCash flows related to open hedges are included as a change in accrued liabilities in the Consolidated Statements of Cash Flows.During 2005 and 2006, we entered into interest rate swap transactionsderivatives in anticipation of a future debt issuance.issuing our 2006 Secured Railcar Equipment Notes. These derivative instruments, with a notional amount of $200$200.0 million, were settled in 2006 and fixed the interest rate on a portion of a futurethe related debt issuance associated with a railcar leasingtransaction in 2006 and settled at maturity in the first quarter of 2006.issuance. These interest rate swaps werederivative instrument transactions are being accounted for as cash flow hedges with changes in the fair value of the instruments of $4.563related debt issuance closed in May 2006.2006. The balance is being amortized over the term of the related debt. The effect on interest expense is due to amortization of the AOCL balance.In anticipation of a future debt issuance,During 2006 and 2007, we entered into interest rate swap transactions during the fourth quarterderivatives in anticipation of 2006 and during 2007.issuing our Promissory Notes. These derivative instruments, with a notional amount of $370$370.0 million hedged, were settled in 2008 and fixed the interest rate on a portion of a futurethe related debt issuance associated with an anticipated railcar leasing transaction, which closed in May 2008.issuance. These instruments settled during the second quarter of 2008 and werederivative instrument transactions are being accounted for as cash flow hedges with changes in the fair value of the instruments of $24.5$24.5 million recorded as a loss in AOCL through the date the related debt issuance closed in May 2008.2008. The balance is being amortized over the term of the related debt. The effect on interest expense is due to amortization of the AOCL balance.During 2008, we entered into interest rate swap transactions, with a notional amount of $200$200.0 million, which were being used to hedge our exposure to changes in the variable interest rate associated with our TILC warehouse facility. The effect on interest expense included the mark to marketmark-to-market valuation on the interest rate swap transactions and monthly interest settlements. These interest rate hedges expired during the fourth quarter of 2010.2010.In May 2008, we entered into an interest rate swap transaction that is being usedderivative instrument, expiring in 2015, to fix the LIBORvariable Libor component of the debt issuance which closed in May 2008.Promissory Notes. This derivative instrument transaction is being accounted for as a cash flow hedge. The effect on interest expense results primarily from monthly interest settlements. In 2009, $1.0 million in unrealized derivative losses were reclassified from AOCL to interest expense that was related to a partial retirement of the debt issuance in the fourth quarter of 2009.Between 2007 and 2009, TRIP Holdings, as required by its warehouse loan agreement,the TRIP Warehouse Loan, entered into interest rate swap transactions,derivatives, all of which qualified as cash flow hedges, to reduce the effect of changes in variable interest rates.rates in the TRIP Warehouse Loan. In July 2011, these interest rate hedges were terminated in connection with the refinancing of the TRIP Warehouse Loan. Balances included in AOCL at the date the hedges were terminated are being amortized over the expected life of the new debt with $6.0$5.6 million of additional interest expense expected to be recognized during the next twelve months following December 31, 2011.2012. Also in July 2011, TRIP Holdings’ wholly-owned subsidiary, TRIP Rail Master Funding, entered into an interest rate swap transactionderivative instrument, expiring in 2021, with a notional amount of $94.1$94.1 million to reduce the effect of changes in variable interest rates associated with the Class A-1b notes of the TRIP Master Funding secured railcar equipment notes.See Note 11 Debt for a discussion ofregarding the related debt instruments.Other Derivatives Effect on operating income —
increase/(decrease) Year Ended December 31, 2011 2010 2009 (in millions) $ 0.0 $ 0.0 $ (0.3 ) 0.4 (0.1 ) (1.2 ) $ 0.4 $ (0.1 ) $ (1.5 ) $ 0.1 $ (0.9 ) $ (1.9 ) (1) Included in cost of revenues in the accompanying consolidated statement of operations(2) Included in other, net in the accompanying consolidated statement of operations Effect on operating income - increase/(decrease) Year Ended December 31, 2012 2011 2010 (in millions) Fuel hedges(1) Effect of mark-to-market valuation $ 0.4 $ 0.0 $ 0.0 Settlements 0.0 0.4 (0.1 ) $ 0.4 $ 0.4 $ (0.1 ) Foreign exchange hedges(2)$ (0.4 ) $ 0.1 $ (0.9 ) (1)Included in cost of revenues in the accompanying consolidated statement of operations (2)Included in other, net in the accompanying consolidated statement of operations Natural gas and diesel fuelWe maintain a program to mitigate the impact of fluctuations in the price of natural gas and diesel fuel purchases. The intent of the program is to protect our operating profit from adverse price changes by entering into derivative instruments. For those instruments that do not qualify for hedge accounting treatment, any changes in their valuation are recorded directly to the consolidated statement of operations. The amount recorded in the consolidated balance sheetssheet as of December 31, 2011 and 20102012 for these instruments was not significant.Foreign exchange hedgeWe enter into foreign exchange hedges to mitigate the impact on operating profit of unfavorable fluctuations in foreign currency exchange rates. These instruments are short term with quarterly maturities and no remaining balance in AOCL as of December 31, 2011 and 2010.Zinc.We maintain a program to mitigate the impact64Note 8. Property, Plant, and EquipmentThe following table summarizes the components of property, plant, and equipment as of December 31, 20112012 and 2010. December 31,
2011 December 31,
2010 (in millions) $ 41.6 $ 40.9 429.7 418.4 758.7 699.7 12.8 9.7 1,242.8 1,168.7 (732.8 ) (677.3 ) 510.0 491.4 9.6 38.2 3,429.3 3,249.8 3,438.9 3,288.0 (372.9 ) (322.6 ) 3,066.0 2,965.4 1,257.7 1,282.1 (122.7 ) (90.3 ) 1,135.0 1,191.8 (344.5 ) (340.4 ) (187.0 ) (196.2 ) $ 4,179.5 $ 4,112.0 December 31,
2012 December 31,
2011 (in millions) Manufacturing/Corporate: Land $ 37.7 $ 34.7 Buildings and improvements 431.0 407.9 Machinery and other 745.3 716.4 Construction in progress 46.1 12.7 1,260.1 1,171.7 Less accumulated depreciation (720.8 ) (682.1 ) 539.3 489.6 Leasing: Wholly-owned subsidiaries: Machinery and other 9.6 9.6 Equipment on lease 3,662.6 3,429.3 3,672.2 3,438.9 Less accumulated depreciation (468.4 ) (372.9 ) 3,203.8 3,066.0 TRIP Holdings: Equipment on lease 1,272.4 1,257.7 Less accumulated depreciation (153.8 ) (122.7 ) 1,118.6 1,135.0 Net deferred profit on railcars sold to the Leasing Group Sold to wholly-owned subsidiaries (381.8 ) (344.5 ) Sold to TRIP Holdings (180.9 ) (187.0 ) $ 4,299.0 $ 4,159.1 Amounts previously reported have been adjusted to exclude discontinued operations resulting from the expected sale of the Company's remaining ready-mix concrete operations. See Note 2 Acquisitions and Divestitures.We lease certain equipment and facilities under operating leases. Future minimum rent expense on non-Leasing Group leases in each year is (in millions): 2012 — $4.3; 2013 — $2.4; - $3.9; 2014 — $1.7; - $2.7; 2015 — $1.3; - $2.0; 2016 — $1.0; - $1.3; 2017 - $0.7; and $1.9$1.2 thereafter. See Note 5 Railcar Leasing and Management Services Group for information related to the lease agreements, future operating lease obligations, and future minimum rent expense associated with the Leasing Group.We did not capitalize any interest expense as part of the construction of facilities and equipment during 20112012 or 2010.2011.In May 2011 and May 2010, the Company’sCompany's inland barge manufacturing facilities in Missouri and Tennessee, respectively, experienced floods resulting in significant damages to Trinity’sTrinity's property and temporary disruptionsdisruption of its production activities. The Company is insured against losses due to property damage and business interruption subject to certain deductibles. With respect to the Missouri flood, Trinity received $35$35.0 million in payments from its insurance carriers of which $22.7$22.7 million pertained to the replacement of or repairs to damaged property, plant, and equipment with a net book value of $5.7$5.7 million, with the remainder pertaining primarily to the reimbursement of flood-related expenses and lost production. Accordingly, the Company recognized a gain$17.0the fourth quarter of 2012 and $17.0 million in 2011 from the disposition of the Missouri flood-damaged property, plant, and equipment. With respect to the Tennessee flood, Trinity received $27.5$27.5 million in payments from its insurance carrier of which $12.6$12.6 million pertained to the replacement of or repairs to damaged property, plant, and equipment with a net book value of $2.3$2.3 million, with the remainder pertaining primarily to the reimbursement of flood-related expenses. Accordingly, the Company recognized a gain of $9.7$9.7 million in 2010 and $0.6$0.6 million in 2011 from the disposition of the Tennessee flood-damaged property, plant, and equipment.We estimate the fair market value of properties no longer in use or held for sale based on the location and condition of the properties, the fair market value of similar properties in the area, and the Company’sCompany's experience selling similar properties in the past. As of December 31, 2011,2012, the Company had non-operating plants with a net book value of $4.3 million.$7.4 million. Our estimated fair value of these assets exceeds their book value.65Note 9. GoodwillGoodwill by segment is as follows: December 31,
2011 December 31,
2010 (in millions) $ 122.5 $ 122.5 90.7 62.4 10.9 10.9 1.8 1.8 $ 225.9 $ 197.6 December 31,
2012 December 31,
2011 (in millions) Rail Group $ 122.5 $ 122.5 Construction Products Group 105.2 84.3 Energy Equipment Group 10.9 10.9 Railcar Leasing and Management Services Group 1.8 1.8 $ 240.4 $ 219.5 Amounts previously reported have been adjusted to exclude discontinued operations resulting from the expected sale of the Company's ready-mix concrete operations. See Note 2 Acquisitions and Divestitures.As of December 31, 20112012 and 2010,2011, the Company’sCompany's annual impairment test of goodwill was completed at the reporting unit level and no additional impairment charges were determined to be necessary.The net increase in the Construction Products Group goodwill as of December 31, 2011 over the same period last year2012 is due to 20112012 acquisitions and divestitures. See Note 2 Acquisitions and Divestitures.Note 10. WarrantiesThe changes in the accruals for warranties for the years ended December 31, 2012, 2011, 2010, and 20092010 are as follows: December 31,
2011 December 31,
2010 December 31,
2009 (in millions) $ 13.2 $ 19.6 $ 25.7 (6.3 ) (5.7 ) (8.6 ) 9.1 1.9 9.8 (2.5 ) (2.6 ) (7.3 ) $ 13.5 $ 13.2 $ 19.6 December 31, 2012 December 31, 2011 December 31, 2010 (in millions) Beginning balance $ 13.5 $ 13.2 $ 19.6 Warranty costs incurred (5.9 ) (6.3 ) (5.7 ) Warranty originations and revisions 7.7 9.1 1.9 Warranty expirations (2.8 ) (2.5 ) (2.6 ) Ending balance $ 12.5 $ 13.5 $ 13.2 66Note 11. DebtThe following table summarizes the components of debt as of December 31, 20112012 and 2010. December 31,
2011 December 31,
2010 (in millions) $ — $ — 450.0 450.0 (99.8 ) (111.1 ) 350.2 338.9 4.2 2.8 354.4 341.7 48.6 51.2 54.7 57.4 457.7 450.3 269.3 283.2 465.5 493.8 218.4 229.2 354.3 367.1 308.5 80.2 170.0 — (108.8 ) — 61.2 — 840.0 — — 1,003.9 2,517.2 2,457.4 $ 2,974.9 $ 2,907.7 On October 20, we amended: December 31,
2012 December 31,
2011 (in millions) Manufacturing/Corporate – Recourse: Revolving credit facility $ — $ — Convertible subordinated notes 450.0 450.0 Less: unamortized discount (87.5 ) (99.8 ) 362.5 350.2 Other 1.2 1.5 363.7 351.7 Leasing – Recourse: Capital lease obligations 45.8 48.6 Term loan 48.6 54.7 94.4 103.3 Total recourse debt 458.1 455.0 Leasing – Non-recourse: 2006 secured railcar equipment notes 255.8 269.3 Promissory notes 424.1 465.5 2009 secured railcar equipment notes 209.2 218.4 2010 secured railcar equipment notes 341.5 354.3 2012 secured railcar equipment notes 333.8 — TILC warehouse facility 173.6 308.5 TRIP Holdings senior secured notes: Total outstanding 170.0 170.0 Less: owned by Trinity (108.8 ) (108.8 ) 61.2 61.2 TRIP Master Funding secured railcar equipment notes 797.7 840.0 Total non–recourse debt 2,596.9 2,517.2 Total debt $ 3,055.0 $ 2,972.2 Amounts previously reported have been adjusted to exclude discontinued operations resulting from the expected sale of the Company's ready-mix concrete operations. See Note 2 Acquisitions and extended our $425.0Divestitures.We have a $425.0 million unsecured revolving credit facility for an additional four years and it nowthat matures on October 20, 2016.2016. As of December 31, 2011,2012, we had letters of credit issued under our revolving credit facility in an aggregate principal amount of $74.1$68.6 million, leaving $350.9$356.4 million available for borrowing. Other than with respect to suchthese letters of credit, there were no borrowings under our revolving credit facility as of December 31, 2011,2012, or for the twelve month period then ended. Of the outstanding letters of credit as of December 31, 2011,2012, a total of $69.2$66.7 million is expected to expire in 20122013 and the remainder in 2013.2014. The majority of our letters of credit obligations supportssupport the Company'sCompany’s various insurance programs and generally renewsrenew each year. Trinity’s revolving credit facility requires the maintenance of ratios related to minimum interest coverage for the leasing and manufacturing operations and maximum leverage. Borrowings under the amended credit facility bear interest at Libor plus 150.0 basis points1.50% or prime plus 50.0 basis points.0.50%. As of December 31, 2011,2012, we were in compliance with all such financial covenants.The Company’s $450.0Company's $450.0 million of Convertible Subordinated Notes due 2036 (“Convertible Subordinated Notes”) bear an interest rate of 3 7/8% per annum on the principal amount payable semi-annually in arrears on June 1 and December 1 of each year. In addition, commencing with the six-monthsix-month period beginning June 1, 2018 and for each six-monthsix-month period thereafter, we will pay contingent interest to the holders of the Convertible Subordinated Notes under certain circumstances. The Convertible Subordinated Notes mature on June 1, 2036, unless redeemed, repurchased, or converted earlier. We may not redeem the Convertible Subordinated Notes before June 1, 2018.2018. On or after that date, we may redeem all or part of the Convertible Subordinated Notes for cash at 100% of the principal amount of the notes to be redeemed, plus accrued and unpaid interest (including any contingent interest) up to, but excluding, the redemption date. Holders of the Convertible Subordinated Notes may require us to purchase all or a portion of their notes on June 1, 2018 or upon a fundamental change. In each case, the Convertible Subordinated Notes would be purchased for cash at a price equal to 100% of the principal amount of the notes to be purchased plus any accrued and unpaid interest (including any contingent interest) to, but excluding, the purchase date.67The convertible subordinated notes are recorded net of unamortized discount to reflect their underlying economics by capturing the value of the conversion option as borrowing costs. As of December 31, 20112012 and 2010,2011, capital in excess of par value included$92.8 million related to the estimated value of the Convertible Subordinated Notes’ conversion options, in accordance with ASC 470-20. Debt discount recorded in the consolidated balance sheet is being amortized through June 1, 2018 to yield an effective annual interest rate of 8.42% based upon the estimated market interest rate for comparable non-convertible debt as of the issuance date of the Convertible Subordinated Notes. Total interest expense recognized on the Convertible Subordinated Notes for the years ended December 31, 2012, 2011 2010,, and 2009,2010, is as follows: Year Ended December 31, 2011 2010 2009 (in millions) $ 17.4 $ 17.4 $ 17.4 11.3 10.5 9.6 $ 28.7 $ 27.9 $ 27.0 Year Ended December 31, 2012 2011 2010 (in millions) Coupon rate interest $ 17.4 $ 17.4 $ 17.4 Amortized debt discount 12.3 11.3 10.5 $ 29.7 $ 28.7 $ 27.9 At December 31, 2011,2012, the Convertible Subordinated Notes were convertible at a price of $51.41$51.11 per share resulting in 8,753,1618,804,539 issuable shares. As of December 31, 2011,2012, if the Convertible Subordinated Notes had been converted, no shares would have been issued since the trading price of the Company’s common stock was below the conversion price of the Convertible Subordinated Notes. The Company has not entered into any derivatives transactions associated with these notes.In May 2006, Trinity Rail Leasing V, L.P., a limited partnership (“TRL V”) and a limited purpose, indirect wholly-owned subsidiary of the Company owned through TILC issued $355.0$355.0 million in aggregate principal amount of Secured Railcar Equipment Notes, Series 2006-1A2006-1A (the “2006“2006 Secured Railcar Equipment Notes”), of which $269.3$255.8 million was outstanding as of December 31, 2011.2012. The 2006 Secured Railcar Equipment Notes were issued pursuant to a Master Indenture, dated May 24, 2006, between TRL V and Wilmington Trust Company, as indenture trustee. The 2006 Secured Railcar Equipment Notes bear interest at a fixed rate of 5.9%5.90% per annum, are payable monthly, and have a final maturity of May 14, 2036.2036. The 2006 Secured Railcar Equipment Notes are obligations of TRL V and are non-recourse to Trinity. The obligations are secured by a portfolio of railcars and operating leases thereon, certain cash reserves, and other assets acquired and owned by TRL V.In May 2008, Trinity Rail Leasing VI LLC, a Delaware limited liability company (“TRL VI”), a limited purpose, indirect wholly-owned subsidiary of Trinity, issued $572.2$572.2 million of 30-year30-year promissory notes (the “Promissory Notes”) to financial institutions, of which $465.5$424.1 million was outstanding as of December 31, 2011.2012. The Promissory Notes are secured by a portfolio of railcars and operating leases thereon, certain cash reserves and other assets acquired and owned by TRL VI. The Promissory Notes are obligations of TRL VI and are non-recourse to Trinity. TRL VI acquired the railcars securing the Promissory Notes by purchase from TILC and a subsidiary. The Promissory Notes bear interest at a floating rate of one-month LIBORone-month Libor plus a margin of 1.50%. The LIBORLibor portion of the interest rate on the Promissory Notes is fixed at approximately 4.13% for the first seven years from the date of issuance of the Promissory Notes through interest rate swaps. The interest rate margin on the Promissory Notes will increase by 0.50% on each of the seventh and eighth anniversary dates of the issuance of the Promissory Notes, and by an additional 2.00% on the tenth anniversary date of the issuance of the Promissory Notes. The Promissory Notes may be prepaid at any time.In November 2009, Trinity Rail Leasing VII LLC, a Delaware limited liability company (“TRL VII”), a limited purpose, indirect wholly-owned subsidiary of the Company owned through TILC, issued $238.3$238.3 million in aggregate principal amount of Secured Railcar Equipment Notes, Series 2009-12009-1 (“the 2009 Secured Railcar Equipment Notes”), of which $218.4$209.2 million was outstanding as of December 31, 2011.2012. The 2009 Secured Railcar Equipment Notes were issued pursuant to a Master Indenture, dated November 5, 2009 between TRL VII and Wilmington Trust Company, as indenture trustee. The 2009 Secured Railcar Equipment Notes bear interest at a fixed rate of 6.66% per annum, are payable monthly, and have a final maturity date of November 16, 2039.2039. The 2009 Secured Railcar Equipment Notes are obligations of TRL VII and are non-recourse to Trinity. The obligations are secured by a portfolio of railcars and operating leases thereon, certain cash reserves, and other assets acquired and owned by TRL VII.In October 2010, Trinity Rail Leasing 2010 LLC, a Delaware limited liability company ("TRL 2010"2010"), a limited purpose, indirect wholly-owned subsidiary of the Company owned through TILC, issued $369.2$369.2 million in aggregate principal amount of Secured Railcar Equipment Notes, Series 2010-12010-1 (“2010 Secured Railcar Equipment Notes"), of which $354.3$341.5 million was outstanding as of December 31, 2011.2012. The 2010 Secured Railcar Equipment Notes were issued pursuant to an Indenture, dated as of October 25, 2010 between TRL 2010 and Wilmington Trust Company, as indenture trustee. The 2010 Secured Railcar Equipment Notes bear interest at a fixed rate of 5.19%, are payable monthly, and have a stated final maturity date of October 16, 2040.2040. The 2010 Secured Railcar Equipment Notes are obligations of TRL 2010 and are non-recourse to Trinity. The obligations are secured by a portfolio of railcars and operating leases thereon, certain cash reserves, and other assets acquired and owned by TRL 2010.2010.In December 2012, Trinity Rail Leasing 2012 LLC, a Delaware limited liability company ("TRL 2012"), a limited purpose, indirect wholly-owned subsidiary of the Company owned through TILC, issued $145.4 million in aggregate principal amount of68Series 2012-1 Class A-1 Secured Railcar Equipment Notes (the "2012 Class A-1 Notes") and $188.4 million in aggregate principal amount of Series 2012-1 Class A-2 Secured Railcar Equipment Notes (the "2012 Class A-2 Notes") and collectively with the 2012 Class A-1 Notes, the "2012 Secured Railcar Equipment Notes", of which $145.4 million and $188.4 million, respectively, were outstanding as of December 31, 2012. The $475.02012 Class A-1 Notes and the 2012 Class A-2 notes were issued pursuant to an Indenture, dated as of December 19, 2012 between TRL 2012 and Wilmington Trust Company, as indenture trustee. The 2012 Class A-1 Notes bear interest at a fixed rate of 2.27%, are payable monthly, and have a stated final maturity date of January 15, 2043. The 2012 Class A-2 Notes bear interest at a fixed rate of 3.53%, are payable monthly, and have a stated final maturity date of January 15, 2043. The 2012 Secured Railcar Equipment Notes are obligations of TRL 2012 and are non-recourse to Trinity. The obligations are secured by a portfolio of railcars and operating leases thereon, certain cash reserves, and other assets acquired and owned by TRL 2012.The $475.0 million TILC warehouse loan facility, established to finance railcars owned by TILC, had $308.5$173.6 million outstanding and $166.5$301.4 million available as of December 31, 2011.2012. The warehouse loan is a non-recourse obligation secured by a portfolio of railcars and operating leases, certain cash reserves, and other assets acquired and owned by the warehouse loan facility. The principal and interest of this indebtedness are paid from the cash flows of the underlying leases. Advances under the facility bear interest at a defined index rate plus a margin, for an all-in interest rate of 2.30%2.25% at December 31, 2011.2012. In February 2011,2013, the warehouse loan facility was renewedextended for an additional two yearssix months and now matures in February 2013.August 2013. Amounts outstanding at maturity, absent renewal, will be payable in three installments in August 2013, February 2014, August 2014, and August 2014.February 2015.In June 2007, TRIP Leasing entered into a $1.19$1.19 billion Warehouse Loan Agreement which contained a floating rate revolving facility (the “TRIP Warehouse Loan”). In July 2011, TRIP Holdings issued $175.0$175.0 million in Senior Secured Notes (the “TRIP Holdings Senior Secured Notes”) and TRIP Master Funding, a Delaware limited liability company and limited purpose, wholly-owned subsidiary of TRIP Holdings, issued $857.0$857.0 million in Secured Railcar Equipment Notes (the “TRIP Master Funding Secured Railcar Equipment Notes”). The proceeds from the TRIP Holdings Senior Secured Notes and the TRIP Master Funding Secured Railcar Equipment Notes were primarily used by TRIP Master Funding to purchase all of the railcar equipment owned by TRIP Leasing which, in turn, repaid the TRIP Warehouse Loan in full.The TRIP Holdings Senior Secured Notes, as amended, have a stated final maturity date of July 6, 2014 and bear interest at 8.00%10.00% payable quarterly with yield to call interest rates of 12.00% for redemptions or other prepayments on or prior to January 15, 2013 and 15.00% for redemptions or other prepayments after such date.quarterly. The TRIP Holdings Senior Secured Notes are secured, among other things, by a pledge of each equity investor’sinvestor's ownership interest in TRIP Holdings and certain distributions made to TRIP Holdings from TRIP Master Funding and are non-recourse to Trinity, TILC, TRIP Master Funding, and the other equity investors in TRIP Holdings. Trinity purchased $112.0 million of the TRIP Holdings Senior Secured Notes in July 2011.The TRIP Master Funding Secured Railcar Equipment Notes were issued pursuant to an Indenture, dated July 6, 2011 between TRIP Master Funding and Wilmington Trust Company, as indenture trustee, with a final maturity date in July 2041.2041. The TRIP Master Funding Secured Railcar Equipment Notes consist of three classes with the Class A-1a notes bearing interest at 4.37%, the Class A-1b notes bearing interest at Libor plus 2.50%, and the Class A-2 notes bearing interest at 6.02%, all payable monthly. The TRIP Master Funding Secured Railcar Equipment Notes are non-recourse to Trinity, TILC, and the other equity investors in TRIP Holdings and are secured by TRIP Master Funding’sFunding's portfolio of railcars and operating leases thereon, its cash reserves and all other assets owned by TRIP Master Funding. As of December 31, 2011,2012, there were $211.1$184.1 million $119.3, $104.0 million, and $509.6$509.6 million of Class A-1a, Class A-1b, and of Class A-2 notes outstanding, respectively.In 2009, the Company entered into a seven-year $61.0seven-year $61.0 million term loan agreement and capital lease obligations totaling $56.6 million.$56.6 million. These new debt obligations are guaranteed by the Company and secured by railcar equipment and related leases.In November 2010, the Company redeemed all of its $201.5$201.5 million unsecured 6 1/6.5%2% Senior Notes whichthat were scheduled to mature in 2014 at a redemption price 102.167% of the principal amount, pursuant to the terms of the indenture. The Company incurred approximately $5.9$5.9 million in expenses related to the redemption which are included in Other Income and Expense in 2010.201069The remaining principal payments under existing debt agreements as of December 31, 20112012, after considering the extension of the TILC warehouse facility in February 2013, are as follows: 2012 2013 2014 2015 2016 Thereafter (in millions) $ 1.1 $ 1.2 $ 1.2 $ 0.2 $ 0.2 $ 450.3 2.8 2.9 3.1 3.3 3.5 33.0 2.8 3.0 3.3 3.5 42.1 — 13.5 15.1 16.9 18.6 21.9 183.3 31.2 33.6 30.4 28.1 342.2 — 9.2 10.2 9.9 9.6 6.5 173.0 12.8 14.6 14.0 15.3 15.0 282.6 9.4 8.5 4.6 — — — — — 170.0 — — — — — (108.8 ) — — — 61.2 41.0 41.1 40.2 35.9 29.4 652.4 — 94.8 191.2 — — — $ 123.8 $ 225.0 $ 376.0 $ 114.5 $ 460.8 $ 1,774.6 2013 2014 2015 2016 2017 Thereafter (in millions) Recourse: Manufacturing/Corporate $ 0.2 $ 0.2 $ 0.2 $ 0.2 $ 0.4 $ 450.0 Leasing – capital lease obligations (Note 5) 2.9 3.1 3.3 3.5 3.7 29.3 Leasing – term loan (Note 5) 3.0 3.3 3.5 38.8 — — Non-recourse – leasing (Note 5): 2006 secured railcar equipment notes 15.1 16.9 18.6 21.9 24.1 159.2 Promissory notes 28.9 25.8 23.2 346.2 — — 2009 secured railcar equipment notes 10.2 9.9 9.6 6.5 6.3 166.7 2010 secured railcar equipment notes 14.6 14.0 15.3 15.0 13.7 268.9 2012 secured railcar equipment notes 15.3 16.6 15.7 15.9 13.8 256.5 TILC warehouse facility 7.7 4.7 0.5 — — — TRIP Holdings senior secured notes: Total outstanding — 170.0 — — — — Less: owned by Trinity — (108.8 ) — — — — 61.2 TRIP Master Funding secured railcar equipment notes 41.0 40.1 35.7 29.3 20.4 631.2 Facility termination payments - TILC warehouse facility — 107.1 53.6 — — — Total principal payments $ 138.9 $ 302.9 $ 179.2 $ 477.3 $ 82.4 $ 1,961.8 Note 12. Other, NetOther, net (income) expense consists of the following items: Year Ended December 31, 2011 2010 2009 (in millions) $ 3.1 $ — $ 2.2 (0.6 ) 1.7 (6.5 ) — 5.9 — 1.5 (0.8 ) (1.0 ) $ 4.0 $ 6.8 $ (5.3 ) Year Ended December 31, 2012 2011 2010 (in millions) Foreign currency exchange transactions $ (2.3 ) $ 3.1 $ — (Gain) loss on equity investments (0.4 ) (0.6 ) 1.7 Costs related to redemption of Senior Notes — — 5.9 Other (1.6 ) 1.5 (0.8 ) Other, net $ (4.3 ) $ 4.0 $ 6.8 Other for the year ended December 31, 2012 and 2011 includes $2.4$0.3 million in income and $2.4 million in expense, respectively, from the recognition of certain equity repurchase agreements with an investor in TRIP Holdings at fair value. See Note 3 Fair Value Accounting and Note 6 Investment in TRIP Holdings. Loss on equity investments for the year ended December 31, 2010 includes a $1.8$1.8 million loss on the write-down of the Company’sCompany's pre-acquisition investment in Quixote Corporation. See Note 2 Acquisitions and Divestitures. See Note 11 Debt for further explanation of the Senior Notes redemption. Gain on equity investments for 2009 includes a $3.7 million gain from the sale70Note 13. Income TaxesThe components of the provision for income taxes from continuing operations are as follows: Year Ended December 31, 2011 2010 2009 (in millions) $ 20.0 $ (22.2 ) $ 5.8 5.5 (2.0 ) 0.7 5.4 5.0 7.9 30.9 (19.2 ) 14.4 62.7 57.0 (27.1 ) 1.2 3.4 (3.5 ) (3.0 ) (0.3 ) 6.8 60.9 60.1 (23.8 ) $ 91.8 $ 40.9 $ (9.4 ) Year Ended December 31, 2012 2011 2010 (in millions) Current: Federal $ (5.7 ) $ 20.8 $ (33.8 ) State 7.0 5.5 (2.4 ) Foreign 6.4 5.4 5.0 Total current 7.7 31.7 (31.2 ) Deferred: Federal 126.6 62.2 65.4 State 3.2 1.3 3.5 Foreign (3.5 ) (3.0 ) (0.4 ) Total deferred 126.3 60.5 68.5 Provision $ 134.0 $ 92.2 $ 37.3 Amounts previously reported have been adjusted to exclude discontinued operations resulting from the expected sale of the Company's ready-mix concrete operations. See Note 2 Acquisitions and Divestitures.Deferred income taxes represent the tax effects of temporary differences between the carrying amounts of assets and liabilities for financial reporting purposes and the amounts used for income tax purposes. The components of deferred tax liabilities and assets are as follows: December 31, 2011 2010 (in millions) $ 740.8 $ 667.3 14.5 — 88.4 80.9 843.7 748.2 47.8 44.7 14.4 17.5 72.8 56.4 234.9 224.3 11.1 7.6 4.7 1.6 385.7 352.1 458.0 396.1 19.3 19.9 477.3 416.0 (42.6 ) (25.0 ) $ 434.7 $ 391.0 December 31, 2012 2011 (in millions) Deferred tax liabilities: Depreciation, depletion, and amortization $ 887.6 $ 740.8 Derivatives 12.4 14.5 Convertible debt 96.5 88.4 Total deferred tax liabilities 996.5 843.7 Deferred tax assets: Workers compensation, pensions, and other benefits 52.4 47.8 Warranties and reserves 15.6 14.4 Equity items 81.5 72.8 Tax loss carryforwards and credits 249.7 234.9 Inventory 17.9 11.1 Accrued liabilities and other 3.9 4.7 Total deferred tax assets 421.0 385.7 Net deferred tax liabilities before valuation allowance 575.5 458.0 Valuation allowance 19.7 19.3 Net deferred tax liabilities before reserve for uncertain tax positions 595.2 477.3 Deferred tax assets included in reserve for uncertain tax positions (39.4 ) (42.6 ) Adjusted net deferred tax liabilities $ 555.8 $ 434.7 At December 31, 2011,2012, the Company, excluding TRIP Holdings, had $124.2$103.3 million of Federal consolidated net operating loss carryforwards after the estimated current year utilization of $42.9 million, and tax-effected $5.6$5.4 million of state loss carryforwards. The Company has $42.2 million of foreign tax credit carryforwards which will expire between 2014 and 2022. The Federal net operating loss carryforwards are due to expire between 2028 and 2031. We have established a valuation allowance for Federal, state, and foreign tax operating losses and credits which may not be realizable. We believe that it is more likely than not that we will be able to generate sufficient future taxable income to utilize the remaining deferred tax assets.TRIP Holdings had $383.3$439.7 million in Federal tax loss carryforwards at December 31, 2011.2012 which are due to expire between 2027 and 2032. We expect TRIP Holdings to begin utilizing their tax loss carryforwards beginning in 2020. Because TRIP Holdings files a separate tax return from the Company, its tax loss carryforwards can only be used by TRIP Holdings and cannot be used to offset future taxable income of the Company.71The provision for income taxes results in effective tax rates that differ from the statutory rates. The following is a reconciliation between the statutory U.S. Federal income tax loss carryforwards are due to expire between 2024rate and 2031.the Company’s effective income tax rate on income from continuing operations: Year Ended December 31, 2012 2011 2010 Statutory rate 35.0 % 35.0 % 35.0 % State taxes 2.0 2.1 3.4 Tax settlements (0.6 ) — 4.8 Changes in tax reserves (1.4 ) 0.4 (10.7 ) Other, net (0.3 ) 1.1 2.5 Effective rate 34.7 % 38.6 % 35.0 % On January 2, 2013, the American Taxpayer Relief Act of 2012 was signed into law. We expect TRIP Holdings to begin utilizing their tax loss carryforwards beginning in 2020. Our ability to utilizebelieve the tax loss carryforwards that were acquired as partimpact of the Quixote acquisition against future taxable income is subject to restrictions under the Internal Revenue Code. We have established a valuation allowance for Federal, state, and foreign tax operating losses which maythis law will not be realizable.Realizationmaterial to Trinity.Income from continuing operations before income taxes for the years endedDecember 31, 2012, 2011, and 2010 was $376.3 million, $225.9 million, and $103.4 million, respectively, for U.S. operations, and $9.6 million, $13.1 million, and $3.3 million, respectively, for foreign operations. The Company has provided U.S. deferred income taxes on the un-repatriated earnings of deferred tax assets is dependent on generating sufficient taxable income in future periods. We have established valuation allowances against tax losses and credits thatits foreign operations.During the year ended December 31, 2012, we will most likely be unable to utilize. We believe that it is more likely than not that we will be able to generate sufficient future taxable income to utilizesettled our audit with the remaining deferred tax assets.We are currently under two separate Internal Revenue Service (“IRS”) examination cycles for the yearsDuring the year ended 2004 through 2005 and 2006 through 2008. OurDecember 31, 2012, we recognized a tax benefit of $4.4 million due to the release of net tax reserves primarily as a result of certain state tax issues where the statute of limitations therefore remains open fromhad lapsed.The IRS field work for our 2006-2008 audit cycle has concluded and all issues, except for transfer pricing, have been agreed to and tentatively settled. The transfer pricing issue has been appealed and we are working with both the year ended December 31, 2004U.S. and forward. Our 2004-2005 examMexican taxing authorities to coordinate taxation. As we do not control the timing of when our issues will be settled, we cannot determine when the 2006-2008 cycle iswill close and all issues formally settled and thus when the statute of limitations for years after 2005 will close. In addition, we are currently under administrative appealIRS audit for certain unresolved issues. the 2009- 2011 tax years.We expect this cycle to be effectively settled during the first or second quarter of 2012. Additionally, the 2006-2008 cycle is stillhave various subsidiaries in the examination levelMexico that file separate tax returns and thus we are unablesubject to determine how long these periods will remain open.thus its statute of limitations remains open. In addition, anotheropen through June 2014. Another Mexican subsidiary filed an amended return and thus, its subsidiary’s statute of limitations for the 2005 statute tax year remains open through July 2013. Statute2013. The remaining entities are open for their 2006 tax years and forward.Our two Swiss subsidiaries, one of which is a holding company and the other of which is dormant, have been audited by the taxing authorities through 2008 and 2009. The statute of limitations of all of Mexican subsidiaries for 2006 and forwardin Switzerland is generally five years remain open.Duringfrom the third quarter ended September 30, 2011, we effectively settled an audit of one of our Swiss subsidiaries which covered the years 2006 through 2009. There was no impact to the income statement as a resultend of the settlement.Our various other European subsidiaries, including subsidiariestax year, but can be extended up to were sold in 2006, are impacted bysubject to various statutes of limitations which are generally open from 2003 forward. An exceptionwith regard to this is our discontinued operations in Romania, which have been audited through 2004.United StatesU.S. are open from 2002The provision for income taxes results in effective tax rates different from the statutory rates. The following is a reconciliation between the statutory United States Federal income tax rate and the Company’s effective income tax rate: 2011 2010 2009 35.0 % 35.0 % 35.0 % 2.1 3.3 1.9 — — (23.7 ) — — (6.5 ) — 4.4 — — (9.6 ) — 1.6 2.0 (0.3 ) 38.7 % 35.1 % 6.4 % Income (loss) from continuing operations before income taxes for the year ended December 31, 2011, 2010, and 2009 was $224.4 million, $113.7 million, and $(158.4) million, respectively, for United States operations, and $13.1 million, $2.9 million, and $11.5 million, respectively, for foreign operations. The Company has provided United States deferred income taxes on the un-repatriated earnings of its foreign operations. The Company has $37.8 million of foreign tax credit carryforwards which will expire between 2014 and 2021.The change in unrecognized tax benefits for the years ended December 31, 2012, 2011, and 2010 were was as follows: Year Ended December 31, 2011 2010 2009 (in millions) $ 36.8 $ 40.1 $ 32.9 3.8 3.3 5.8 16.4 9.3 7.5 (0.1 ) (5.6 ) (4.5 ) (3.5 ) (9.5 ) (1.5 ) (0.9 ) (0.8 ) (0.1 ) $ 52.5 $ 36.8 $ 40.1 The additions Year Ended December 31, 2012 2011 2010 (in millions) Beginning balance $ 52.5 $ 36.8 $ 40.1 Additions for tax positions related to the current year 4.1 3.8 3.3 Additions for tax positions of prior years — 16.4 9.3 Reductions for tax positions of prior years (1.1 ) (0.1 ) (5.6 ) Settlements (3.4 ) (3.5 ) (9.5 ) Expiration of statute of limitations (3.4 ) (0.9 ) (0.8 ) Ending balance $ 48.7 $ 52.5 $ 36.8 72Additions for tax positions related to the current year infor 2012 were amounts provided for tax positions that will be taken for Federal and state income tax purposes when we file those tax returns. Additions for tax positions related to the amounts of $3.8 million and $3.3 millioncurrent year for the years ended December 31, 2011 and December 31, 2010 respectively, were amounts provided for tax positions previously taken in foreign jurisdictions and tax positions taken for Federal and state income tax purposes as well as deferred tax liabilities that have been reclassified to uncertain tax positions.Additions for tax positions of prior years for the year ended December 31, 2011 and December 31, 2010 of $16.4 million and $9.3 million, respectively, arewere primarily due to Federal tax positions taken on prior year returns that have beenwere proposed by the IRS but not previously reserved. TheseSince these items are primarily timing differences, and thus we wouldwill be allowed a future tax deduction. We haveDuring 2011, we recorded a corresponding deferred tax asset for the future tax reduction of taxes related to these adjustments.The reduction in tax positions of prior years of $0.1 million and $5.6 million for the years ended December 31, 2011 and December 31, 2010, respectively, was primarily related to new guidance issued in March 2012 by the IRS regarding the capitalization of fixed assets as well as state taxes.Settlements during 2012 primarily related to the year ended December 31,settlement of our 2004-2005 IRS audit as well as the related impact on state tax returns. Settlements during 2011 primarily relaterelated to thean audit of a separate tax return of our Swiss subsidiary that resulted in the payment of $2.8 million of taxes and interest. Subsequent to the payment of the taxes, we applied for and received treaty relief from the Swiss tax authorities and received $1.8 million in tax refunds. The tax that was not refunded is creditable against future US income tax and thus is being carried as a deferred tax asset. the year ended December 31, 2010 related to a first quarter tax settlement of a 2002 Mexico tax issue of one of our subsidiaries and a third quarter settlement of the 1998-2002 IRS audit.The expiration of statute of limitations primarily relate to state taxes where the statute has closed.The total amount of unrecognized tax benefits including interest and penalties at December 31, 20112012 and 2010,2011, that would affect the Company’s overall effective tax rate if recognized was $19.4$13.2 million and $14.9$19.4 million, respectively. There is a reasonable possibility that unrecognized Federal and stateUnrecognized tax benefits will decrease by December 31, 2012 duesubject to a lapse in the statute of limitations for assessing tax. Amounts subject to a lapse in statute by December 31, 20122013 total $2.5 million.$1.0 million. Further, there is a reasonable possibility that the unrecognized Federal tax benefits will decrease by December 31, 20122013 due to settlements with taxing authorities. Amounts expected to settle by December 31, 20122013 total $3.3 million.$28.7 million.Trinity accounts for interest expense and penalties related to income tax issues as income tax expense. Accordingly, interest expense and penalties associated with an uncertain tax position are included in the income tax provision. The total amount of accrued interest and penalties as of December 31, 20112012 and 20102011 was $13.3$10.3 million and $11.2$13.3 million, respectively. Income tax expense for the yearsyear ended December 31, 2011 and 20102012, included an increase to income tax expense of $2.1 million and reductiona decrease in income tax expense of $4.8$3.0 million respectively, in interest expense and penalties related to uncertain tax positions.73Note 14. Employee Retirement PlansThe Company sponsors defined benefit plans and defined contribution profit sharing plans whichthat provide retirement income and death benefits for eligible employees. The annual measurement date of the benefit obligations, fair value of plan assets, and funded status is December 31.Actuarial Assumptions Year Ended December 31, 2011 2010 2009 5.40 % 5.90 % 6.10 % 3.00 % 3.00 % 3.00 % 5.90 % 6.10 % 6.50 % 7.75 % 7.75 % 7.75 % 3.00 % 3.00 % 4.00 % Year Ended December 31, 2012 2011 2010 Assumptions used to determine benefit obligations at the annual measurement date were: Obligation discount rate 4.25% 5.40% 5.90% Compensation increase rate 4.00% 3.00% 3.00% Assumptions used to determine net periodic benefit costs were: Obligation discount rate 5.40% 5.90% 6.10% Long-term rate of return on plan assets 7.75% 7.75% 7.75% Compensation increase rate 3.00% 3.00% 3.00% The obligation discount rate assumption is determined by deriving a single discount rate from a theoretical settlement portfolio of high quality corporate bonds sufficient to provide for the plans’plans' projected benefit payments. The expected long-term rate of return on plan assets is an assumption reflecting the anticipated weighted average rate of earnings on the portfolio over the long-term. To arrive at this rate, we developed estimates based upon the anticipated performance of the assets in its portfolio. The compensation increase rate pertains solely to the pension plan of the Company’sCompany's Inland Barge segment as the accrued benefits of the Company’sCompany's remaining pension plans were frozen in 2009.Components of Net Retirement Cost Year Ended December 31, 2012 2011 2010 (in millions) Expense Components Service cost $ 0.9 $ 0.8 $ 0.9 Interest 19.4 19.6 18.7 Expected return on plan assets (22.9 ) (22.8 ) (20.1 ) Amortization and deferral: Actuarial loss 3.2 1.8 1.9 Prior service cost 0.1 0.1 0.1 Other — — 0.2 Defined benefit expense 0.7 (0.5 ) 1.7 Profit sharing 11.9 9.3 8.3 Net expense $ 12.6 $ 8.8 $ 10.0 74Table of Contents Year Ended December 31, 2011 2010 2009 (in millions) $ 0.8 $ 0.9 $ 3.0 19.6 18.7 19.7 (22.8 ) (20.1 ) (15.7 ) 1.8 1.9 4.2 0.1 0.1 0.1 — 0.2 (0.4 ) (0.5 ) 1.7 10.9 9.3 8.3 7.6 $ 8.8 $ 10.0 $ 18.5 Obligations and Funded Status Year Ended December 31, 2011 2010 (in millions) $ 364.8 $ 335.7 $ 335.8 $ 326.1 0.8 0.9 19.6 18.7 (14.7 ) (12.9 ) 23.3 3.3 — 0.2 — (0.5 ) $ 364.8 $ 335.8 $ 291.1 $ 257.6 (1.2 ) 35.3 15.4 11.6 (14.7 ) (12.9 ) — (0.5 ) $ 290.6 $ 291.1 $ (74.2 ) $ (44.7 ) Year Ended December 31, 2012 2011 (in millions) Accumulated Benefit Obligations $ 442.5 $ 364.8 Projected Benefit Obligations: Beginning of year $ 364.8 $ 335.8 Service cost 0.9 0.8 Interest 19.4 19.6 Benefits paid (13.3 ) (14.7 ) Actuarial loss 70.7 23.3 End of year $ 442.5 $ 364.8 Plans' Assets: Beginning of year $ 290.6 $ 291.1 Actual return on assets 45.5 (1.2 ) Employer contributions 17.3 15.4 Benefits paid (13.3 ) (14.7 ) End of year $ 340.1 $ 290.6 Consolidated Balance Sheet Components: Funded status $ (102.4 ) $ (74.2 ) Percent of projected benefit obligations funded 76.9 % 79.7 % The unfunded status of the plans of $74.2$102.4 million and $44.7$74.2 million at December 31, 20112012 and 2010,2011, respectively, was recognized in the accompanying balance sheets as accrued pension liability and included in Accrued Liabilities. No plan assets are expected to be returned to us during the year ending December 31, 2012.Amounts Recognized in Other Comprehensive Income (Loss) Year Ended December 31, 2011 2010 2009 (in millions) $ (47.3 ) $ 11.9 $ 18.7 1.7 1.9 4.2 0.1 0.1 0.1 — (0.2 ) — — — 33.5 — 0.2 — (45.5 ) 13.9 56.5 (16.9 ) 5.2 20.9 $ (28.6 ) $ 8.7 $ 35.6 Year Ended December 31, 2012 2011 2010 (in millions) Actuarial gain (loss) $ (48.1 ) $ (47.3 ) $ 11.9 Amortization of actuarial loss 3.2 1.7 1.9 Amortization of prior service cost 0.1 0.1 0.1 Other — — (0.2 ) Settlements — — 0.2 Total before income taxes (44.8 ) (45.5 ) 13.9 Income tax expense (benefit) (16.7 ) (16.9 ) 5.2 Net amount recognized in other comprehensive income (loss) $ (28.1 ) $ (28.6 ) $ 8.7 Included in AOCL at December 31, 20112012 were the following amounts that have not been recognized in net periodic pension cost: prior service cost of $0.3 million ($$0.2 million ($0.1 million net of related income taxes) and unrecognized actuarial losses of $112.1$156.9 million ($70.5 ($98.7 million net of related income taxes).Actuarial loss included in AOCL and expected to be recognized in net periodic pension cost for the year ended December 31, 20122013 is $3.4$4.8 million ($2.2 ($3.0 million net of related income taxes).75Plan AssetsThe estimated fair value of plan assets at year end 20112012 and 2010,2011, indicating input levels used to determine fair value, and the range of target asset allocations are as follows: Target
Allocation December 31,
2011 December 31,
2010 3 % 1 % 55-65 % 66 68 35-45 % 31 31 100 % 100 % Fair Value Measurement as of
December 31, 2011 (in millions) Level 1 Level 2 Level 3 Total $ 9.7 $ — $ — $ 9.7 — 207.4 — 207.4 73.5 — — 73.5 $ 83.2 $ 207.4 $ — $ 290.6 Fair Value Measurement as of
December 31, 2010 (in millions) Level 1 Level 2 Level 3 Total $ 3.5 $ — $ — $ 3.5 — 210.3 — 210.3 71.7 — — 71.7 2.9 — — 2.9 2.0 — — 2.0 0.7 — — 0.7 $ 80.8 $ 210.3 $ — $ 291.1 TargetAllocation December 31,
2012 December 31,
2011Cash and cash equivalents 1 % 3 % Equity securities 60-80% 73 66 Debt securities 20-40% 26 31 Total 100 % 100 % Fair Value Measurement as of December 31, 2012 (in millions) Level 1 Level 2 Level 3 Total Temporary cash investments $ 3.3 $ — $ — $ 3.3 Common trust funds — 336.8 — 336.8 $ 3.3 $ 336.8 $ — $ 340.1 Fair Value Measurement as of December 31, 2011 (in millions) Level 1 Level 2 Level 3 Total Temporary cash investments $ 9.7 $ — $ — $ 9.7 Common trust funds — 207.4 — 207.4 Registered investment companies 73.5 — — 73.5 $ 83.2 $ 207.4 $ — $ 290.6 The Company’sCompany's pension investment strategies have been developed as part of a comprehensive asset/liability management process that considers the relationship between both the assets and liabilities of the plans. These strategies consider not only the expected risk and returns on plan assets, but also the actuarial projections of liabilities, projected contributions, and funded status. The equity allocation is heavily weighted toward domestic large capitalized companies. There is also a lesser exposure to domestic small/mid cap companies, as well as international equities.equities, and domestic real estate investment trusts. The fixed income allocation is equally split betweenweighted toward domestic long duration bonds. There is also a limited duration portfoliolesser exposure to domestic high yield and a core plus portfolio that has a duration in-line with published bond indices.emerging market sovereign debt. This asset mix is designed to meet the longer-term obligations of the plan as projected by actuarial studies.The principal pension investment strategies include asset allocation and active asset management. The range of target asset allocations has been determined after giving consideration to the expected returns of each asset category, the expected performance of each asset category, the volatility of the asset returns over time, and the complementary nature of the asset mix within the portfolio. Each asset category is managed by external money managers with the objective of generating returns that exceed market-based benchmarks.The pension plan assets are valued at fair value. The following is a description of the valuation methodologies used in determining fair value, including the general classification of such instruments pursuant to the valuation hierarchy as described further in Note 3 Fair Value Accounting.Temporary cash investments —- These investments consist of U.S. dollars held in master trust accounts with the trustee. These temporary cash investments are classified as Level 1 instruments.Common trust funds —- Common trust funds are comprised of shares or units in commingled funds that are not publicly traded. The underlying assets in these funds are publicly traded on exchanges and price quotes for the assets held by these funds are readily available. Holdings of common trust funds are classified as Level 2 investments.Registered investment companies —- Registered investment companies are mutual funds registered with the Securities and Exchange Commission. Mutual fund shares are traded actively on public exchanges. The share prices for mutual funds are published at the close of each business day. Holdings of mutual funds are classified as Level 1 investments.Corporate stock —This investment category consists76Table of stock issued by U.S. companies traded actively on exchanges. Price quotes for these shares are readily available. Holdings of corporate stock are classified as Level 1 investments.ContentsCorporate bonds — Corporate bonds consist of fixed income securities of U.S. and non-U.S. corporations. These assets are valued using quoted prices in active markets. Corporate bonds are classified as Level 1 investments.U.S. government obligations — U.S government obligations consist of fixed income securities issued directly by the U.S. Treasury or by government-sponsored enterprises. These assets are valued using quoted prices in active markets. U.S. government obligations are classified as Level 1 investments.Cash FlowsEmployer contributions for the year ending December 31, 20122013 are expected to be $17.3$18.9 million for the defined benefit plans compared to $15.4$17.3 million contributed during 2011.2012. Employer contributions to the 401(k) plans and the Supplemental Profit Sharing Plan for the year ending December 31, 20122013 are expected to be $9.3$11.9 million compared to $8.2$9.3 million $7.9, $8.2 million and $7.4$7.9 million during 2012, 2011 2010,, and 2009,2010, respectively.Benefit payments expected to be paid during the next ten years are as follows: Amounts (in millions) $ 14.7 15.7 16.8 18.0 19.3 116.1 During the first quarter of 2009, the Company amended its Supplemental Retirement Plan (the “Supplemental Plan”) to reduce future retirement plan costs. This amendment provides that all benefit accruals under the Supplemental Plan cease effective March 31, 2009, and the Supplemental Plan was frozen as of that date. In addition, the Company amended the Trinity Industries, Inc. Standard Pension Plan (the “Pension Plan”). This amendment was designed to reduce future pension costs and provides that, effective March 31, 2009, all future benefit accruals under the Pension Plan automatically ceased for all participants, and the accrued benefits under the Pension Plan were determined and frozen as of that date. Accordingly, as a result of these amendments, the accrued pension liability was reduced by $44.1 million with an offsetting reduction in funded status of pension liability included in AOCL. Years ending December 31, (in millions) 2013 $ 15.8 2014 16.8 2015 18.0 2016 19.2 2017 20.6 2018-2022 122.5 Participants in the Pension Plan are now eligible to receive future retirement benefits through a company-funded annual retirement contribution provided through the Profit Sharing Plan for Employees of Trinity Industries, Inc. and Certain Affiliates. The contribution ranges from one to three percent of eligible compensation based on service. Both the annual retirement contribution and the company matching contribution are discretionary, requiring board approval, and are made annually with the investment of the funds directed by the participants.Note 15. Accumulated Other Comprehensive LossComprehensive net income (loss) is as follows: Year Ended December 31, 2011 2010 2009 (in millions) $ 142.2 $ 67.4 $ (137.7 ) (28.6 ) 8.7 35.6 0.1 (7.3 ) 27.8 — 1.1 (0.1 ) $ 113.7 $ 69.9 $ (74.4 ) The components ofChanges in accumulated other comprehensive loss for the twelve months ended December 31, 2012, 2011, and 2010are as follows: December 31,
2011 December 31,
2010 (in millions) $ (17.1 ) $ (17.1 ) (70.7 ) (42.1 ) (46.2 ) (36.3 ) $ (134.0 ) $ (95.5 ) Currency translation adjustments Unrealized loss on derivative financial instruments Net actuarial gains/(losses) of defined benefit plans Other AccumulatedOtherComprehensiveLoss (in millions) Balances at December 31, 2009 $ (17.1 ) $ (29.0 ) $ (50.8 ) $ (1.1 ) $ (98.0 ) Other comprehensive income (loss) — (7.3 ) 8.7 1.1 2.5 Balances at December 31, 2010 (17.1 ) (36.3 ) (42.1 ) — (95.5 ) Other comprehensive income (loss) — 0.1 (28.6 ) — (28.5 ) Reclassification of purchase of additional interest in TRIP Holdings — (15.5 ) — — (15.5 ) Tax expense allocation related to TRIP Holdings unrealized loss on derivative financial instruments — 5.5 — — 5.5 Balances at December 31, 2011 (17.1 ) (46.2 ) (70.7 ) — (134.0 ) Other comprehensive income (loss) 0.6 11.4 (28.1 ) — (16.1 ) Balances at December 31, 2012 $ (16.5 ) $ (34.8 ) $ (98.8 ) $ — $ (150.1 ) See Note 7 Derivative Instruments for information on the reclassification of amounts in accumulated other comprehensive loss into earnings.77Note 16. Stock-Based CompensationThe Company’sCompany's 2004 Amended and Restated Stock Option and Incentive Plan (“the Plan”) provides for awarding 6,000,000 (adjusted for stock splits) shares of common stock plus (i) shares covered by forfeited, expired, and canceled options granted under prior plans; and (ii) shares tendered as full or partial payment for the purchase price of an award or to satisfy tax withholding obligations. At December 31, 2011,2012, a total of 2,062,1021,443,350 shares were available for issuance. The Plan provides for the granting of nonqualified and incentive stock options having maximum ten-yearten-year terms to purchase common stock at its market value on the award date; stock appreciation rights based on common stock fair market values with settlement in common stock or cash; restricted stock awards; restricted stock units; and performance awards with settlement in common stock or cash on achievement of specific business objectives. Under previous plans, nonqualified and incentive stock options, restricted shares, and restricted stock units were granted at their fair market values. Options become exercisable in various percentages over periods ranging up to five years.The cost of employee services received in exchange for awards of equity instruments are referred to as share-based payments and are based on the grant date fair-value of those awards. Stock-based compensation includes compensation expense, recognized over the applicable vesting periods, for both new share-based awards and share-based awards granted prior to, but not yet vested, as of January 1, 2006. The Company uses the Black-Scholes-Merton option pricing model to determine the fair value of stock options granted to employees. Stock-based compensation totaled approximately $23.5$28.3 million $15.7, $23.5 million, and $13.5$15.7 million for the years ended December 31, 2012, 2011 2010,, and 2009,2010, respectively.The income tax benefit related to stock-based compensation expense was $10.0$6.4 million $4.0, $10.0 million, and $2.3$4.0 million for the years ended December 31, 2012, 2011 2010,, and 2009,2010, respectively. The Company has presented excess tax benefits from the exercise of stock-based compensation awards as a financing activity in the consolidated statement of cash flows. No stock-based compensation costs were capitalized as part of the cost of an asset for the years ended December 31, 2012, 2011 2010,, and 2009.2010.Stock OptionsExpense related to stock options issued to eligible employees under the Plan is recognized over their vesting period on a straight line basis. Stock options generally vest over 5 years and have contractual terms of 10 years. Number
of
Shares Weighted-
Average
Exercise
Price Weighted-
Average
Remaining
Contractual
Terms
(Years) Aggregate
Intrinsic
Value (in millions) 880,087 $ 16.35 — — (226,571 ) $ 16.51 — — 653,516 $ 16.30 5.3 $ 9.0 449,587 $ 16.46 3.1 $ 4.6 223,016 $ 16.42 2.1 $ 3.0 Number of Shares Weighted Average Exercise Price Weighted Average Remaining Contractual Terms (Years) Aggregate Intrinsic Value (in millions) Options outstanding at December 31, 2011 653,516 $ 16.30 Granted — — Exercised (419,158 ) $ 16.04 Cancelled (373 ) 14.47 Options outstanding at December 31, 2012 233,985 $ 16.78 4.1 $4.5 Options exercisable: December 31, 2011 223,016 $ 16.42 2.1 $3.0 December 31, 2012 233,985 $ 16.78 4.1 $4.5 At December 31, 2011,2012, there was no unrecognized compensation expense related to stock options was $0.4 million. At December 31, 2011, for unrecognized compensation expense related to stock options, the weighted average recognition period was 0.4 years.options. The intrinsic value of options exercised totaled approximately $3.6$6.6 million $0.9, $3.6 million, and $0.3$0.9 million during fiscal years 2012, 2011 2010,, and 2009,2010, respectively.Restricted StockRestricted share awards consist of restricted stock, restricted stock units, and performance units. Restricted stock and restricted stock units generally vest for periods ranging from one to fifteen years from the date of grant. Certain restricted stock and restricted stock units vest in their entirety upon the employee's retirement from the Company, the employee's reaching the age of 65, or when the employee's age plus years of vested service equal 80. Restricted stock units issued to non-employee directors under the Plan vest on the grant date or on the first business day immediately preceding the next Annual Meeting of Stockholders and are released upon completion of the directors' service to the Company. Expense related to restricted stock and restricted stock units issued to eligible employees under the Plan is recognized ratably over the vesting period or to the date on which retirement eligibility is achieved, if shorter. Restricted stock and restricted stock units generally vest for periods ranging from one to fifteen years from the date of grant. Certain restricted stock and restricted stock units vest in their entirety upon the employee’s retirement from the Company, the employee’s reaching the age of 65 or when the employee’s age plus years of vested service equal 80. Restricted stock units issued to non-employee directors under the Plan vest on the grant date or on the first business day immediately preceding the next Annual Meeting of Stockholders. Performance units are amortized from their award date to the end of the performance period, generally either two or three years. Performance units are granted to employees based upon their target value however, depending upon the achievement of certain specified goals, may increase in value up to 200% of target. Certain performance awards provide that the Board of Directors has the right to disallow the granting of performance units for values in excess of target and, accordingly, no expense in excess of the target value is recognized for any units subject to such negative discretion. The performance units vest78upon certification by the Human Resources Committee of the Board of Directors of the achievement of the specified performance goals. Number of
Restricted
Share
Awards Weighted
Average
Fair
Value
per
Award 2,976,128 $ 24.79 925,140 34.21 (745,147 ) 25.62 (93,460 ) 26.17 3,062,661 $ 27.39 Number of Restricted Share Awards Weighted Average Fair Value per Award Restricted share awards outstanding at December 31, 2011 3,062,661 $ 27.39 Granted 1,067,105 29.44 Vested (644,044 ) 27.78 Forfeited (184,351 ) 30.30 Restricted share awards outstanding at December 31, 2012 3,301,371 $ 27.82 At December 31, 2011,2012, unrecognized compensation expense related to restricted share awards totaled approximately $67.2$62.8 million which will be recognized over a weighted average period of 4.2 years. The total fair value of shares vested and released during fiscal years 2012, 2011 2010,, and 20092010 was $23.3$16.9 million $11.7, $23.3 million, and $7.4$11.7 million, respectively. The weighted average fair value of restricted share awards granted during 2012, 2011 2010,, and 20092010 was $34.21, $25.18$29.44, $34.21 and $15.68$25.18 per share, respectively.Note 17. Earnings Per Common ShareBasic net income attributable to Trinity Industries, Inc. per common share is computed by dividing net income attributable to Trinity remaining after allocation to unvested restricted shares by the weighted average number of basic common shares outstanding for the period. Except when the effect would be antidilutive, the calculation of diluted net income attributable to Trinity per common share includes the net impact of unvested restricted shares and shares that could be issued under outstanding stock options. Total weighted average restricted shares and antidilutive stock options were 3.1 million shares, 3.0 million shares, 2.8 million shares, and 3.72.8 million shares, respectively, for the years ended December 31, 2012, 2011 2010, and 2009,2010, respectively.The computation of basic and diluted net income (loss) attributable to Trinity Industries, Inc. is as follows: Year Ended December 31, 2011 Income
(Loss) Avg. Shares
Outstanding Earnings
Per Share (in millions, except per share amounts) $ 142.2 (4.8 ) 137.4 77.5 $ 1.77 — 0.3 $ 137.4 77.8 $ 1.77 Year Ended December 31, 2010 Income
(Loss) Avg. Shares
Outstanding Earnings
Per Share (in millions, except per share amounts) $ 67.4 (2.3 ) 65.1 76.8 $ 0.85 — 0.2 $ 65.1 77.0 $ 0.85 Year Ended December 31, 2009 Income (Loss) Avg. Shares
Outstanding Loss
Per Share (in millions, except per share amounts) $ (137.7 ) (1.0 ) (138.7 ) 76.4 $ (1.81 ) — — $ (138.7 ) 76.4 $ (1.81 ) Year Ended
December 31, 2012 (in millions, except per share amounts) Income(Loss) AverageShares EPS Net income from continuing operations $ 251.9 Less: net loss from continuing operations attributable to noncontrolling interest (1.5 ) Net income from continuing operations attributable to Trinity Industries, Inc. 253.4 Unvested restricted share participation (7.7 ) Net income from continuing operations attributable to Trinity Industries, Inc. – basic 245.7 77.3 $ 3.18 Effect of dilutive securities: Stock options — 0.2 Net income from continuing operations attributable to Trinity Industries, Inc. – diluted $ 245.7 77.5 $ 3.17 Net income from discontinued operations, net of taxes $ 1.8 Unvested restricted share participation (0.1 ) Net income from discontinued operations, net of taxes – basic 1.7 77.3 $ 0.02 Effect of dilutive securities: Stock options — 0.2 Net income from discontinued operations, net of taxes – diluted $ 1.7 77.5 $ 0.02 79 Year Ended
December 31, 2011 (in millions, except per share amounts) Income(Loss) AverageShares EPS Net income from continuing operations $ 146.8 Less: net income from continuing operations attributable to noncontrolling interest 3.5 Net income from continuing operations attributable to Trinity Industries, Inc. 143.3 Unvested restricted share participation (5.0 ) Net income from continuing operations attributable to Trinity Industries, Inc. – basic 138.3 77.5 $ 1.78 Effect of dilutive securities: Stock options — 0.3 Net income from continuing operations attributable to Trinity Industries, Inc. – diluted $ 138.3 77.8 $ 1.78 Net loss from discontinued operations, net of taxes $ (1.1 ) Unvested restricted share participation — Net loss from discontinued operations, net of taxes – basic (1.1 ) 77.5 $ (0.01 ) Effect of dilutive securities: Stock options — 0.3 Net loss from discontinued operations, net of taxes – diluted $ (1.1 ) 77.8 $ (0.01 ) Year Ended
December 31, 2010 (in millions, except per share amounts) Income(Loss) AverageShares EPS Net income from continuing operations $ 69.4 Less: net income from continuing operations attributable to noncontrolling interest 8.0 Net income from continuing operations attributable to Trinity Industries, Inc. 61.4 Unvested restricted share participation (2.1 ) Net income from continuing operations attributable to Trinity Industries, Inc. – basic 59.3 76.8 $ 0.77 Effect of dilutive securities: Stock options — 0.2 Net income from continuing operations attributable to Trinity Industries, Inc. – diluted $ 59.3 77.0 $ 0.77 Net income from discontinued operations, net of taxes $ 6.0 Unvested restricted share participation (0.2 ) Net income from discontinued operations, net of taxes – basic 5.8 76.8 $ 0.08 Effect of dilutive securities: Stock options — 0.2 Net income from discontinued operations, net of taxes – diluted $ 5.8 77.0 $ 0.08 80Note 18. Commitments and ContingenciesHighway Products LitigationOn September 2, 2011, the Company and Contingenciesthe Texas A&M University System, as Plaintiffs, filed litigation in Virginia asserting claims of patent and trademark infringement against SPIG Industry, LLC, SPIG Industry, Inc., and Selco Construction Services, Inc. The litigation alleged that without authorization SPIG Industry, LLC and SPIG Industry, Inc. manufactured and sold, and Selco Construction Services, Inc. installed certain highway guardrail end terminal products that copied the Plaintiffs' ET-Plus System (“ET-Plus”).The ET-Plus is a patented, energy-absorbing, guardrail end terminal system designed by engineers at the Texas A&M Transportation Institute. The ET-Plus is manufactured under license, marketed and sold by Trinity Highway Products, LLC, a wholly owned subsidiary of the Company. The ET-Plus is typically purchased by state Departments of Transportation and highway construction contractors for use along roadways and medians. The Company settled the infringement lawsuit on acceptable terms and thereafter proceeded with defamation and disparagement lawsuits in Texas and Georgia alleging that Joshua Harman, an officer in each of SPIG Industry, LLC, SPIG Industry, Inc., and Selco Construction Services, Inc. has made and continues to make egregiously false and misleading statements and claims about the ET-Plus and the Company.In a related matter, on January 28, 2013, the Company was advised that the United States filed a “Notice of Election to Decline Intervention” in a False Claims Act (Qui Tam) complaint filed under seal on March 6, 2012 in the United States District Court for the Eastern District of Texas, Marshall Division styled Railworthiness DirectiveAs previously reported, in 2011the Company received a letter fromthe approval of the Federal Railroad Administration (“FRA”) containingto implement a railworthiness directive pertaining to a specific designvoluntary recertification of948 tank cars manufacturedowned or managed by the Company for useCompany’s wholly-owned, railcar leasing subsidiary and used in transporting poison inhalation hazard (“PIH”) materials. The Company has manufactured 948 railcars of this design. These tank cars are owned or managed by the Company’s wholly-owned, railcar leasing subsidiary. The FRA was notified of five tank cars with potential leaks around the manway nozzles. Pursuant to the directive, 100 recently manufactured tank cars were removed from service. An additional 67 randomly selected tank cars out of 848 manufactured since 2006, which have operated without incident, have been removed from service.In September 2011, the FRA issued an addendum to its June 2011 railworthiness directive, approving the Company’s voluntary recertification of all 948 tank cars used in PIH service. The recertification process is scheduled to beunderway and being performed through September 2014 in conjunction with the normal 35five year, federally mandated inspection cycle for tank cars in PIH service. Maintenance costs associated with this recertification process are expensed as incurred in accordance with generally accepted accounting principles.incurred. The additional costs estimated to be incurred for compliance with the directive are not expected to be significant.Other MattersIn January 2012, a Company subsidiary,As previously reported, Trinity Structural Towers, Inc., filed a law suit againstwholly-owned subsidiary of the Company, is in litigation with a structural wind towertowers customer for the customer’s breach of a long-term supply contract due tofor the customer’s failure to comply with its’ contractual purchase obligations. The customer and Trinity Structural Towers, Inc. entered into a multi-year contract in whichmanufacture of towers. While the customer agreed to purchase a fixed number of structural wind towers each year duringpartially performed the term of the contract. The customer purchased a portion of its contractual commitment butcontract, it ultimately defaulted on its purchase obligation thereafter and did not remedy such default following notice from Trinity Structural Towers, Inc. to cure the default. The customer has filed an answerwritten notice. Discovery in thethis litigation and the discovery process is expected to commence in the first quarter of 2012.The Company is involved in claims and lawsuits incidental to our business arising from various matters including product warranty, personal injury, environmental issues, workplace laws, and various governmental regulations. The Company evaluates its exposure to such claims and suits periodically and establishes accruals for these contingencies when a range of loss can be reasonably estimated. The range of loss for such matters, taking into consideration our rights in indemnity and recourse to third parties is $6.2$4.0 million to $22.9 million.$29.4 million. Total accruals of $12.3$16.1 million, including environmental and workplace matters described below, are included in accrued liabilities in the accompanying consolidated balance sheet. The Company believes any additional liability would not be material to its financial position or results of operations.81Trinity is subject to remedial orders and Federal, state, local, and foreign laws and regulations relating to the environment and the workplace. The Company has reserved $7.6$7.2 million to cover our probable and estimable liabilities with respect to the investigations, assessments, and remedial responses to such matters, taking into account currently available information and our contractual rights to indemnification and recourse to third parties. However, estimates of liability arising from future proceedings, assessments, or remediation are inherently imprecise. Accordingly, there can be no assurance that we will not become involved in future litigation or other proceedings involving the environment and the workplace or, if we are found to be responsible or liable in any such litigation or proceeding, that such costs would not be material to the Company. We believe that we are currently in substantial compliance with environmental and workplace laws and regulations.Other CommitmentsNon-cancelable purchase obligations amounted to $399.6$649.6 million as of December 31, 2011,2012, of which $347.5$567.1 million is for the purchase of raw materials and components, principally by the Rail, Inland Barge, and Energy Equipment Groups.82Note 19. Selected Quarterly Financial Data (Unaudited)Effective December 31, 2011, the Company adopted the emerging industry policy Three Months Ended March 31,
2012 June 30,
2012 September 30, 2012 December 31,
2012 (in millions except per share data) Revenues: Manufacturing $ 754.1 $ 803.2 $ 748.0 $ 862.2 Leasing 142.1 192.3 159.3 150.7 896.2 995.5 907.3 1,012.9 Operating costs: Costs of revenues: Manufacturing 645.7 665.8 630.7 707.7 Leasing 73.4 112.1 84.3 80.5 Other 11.1 14.4 13.1 12.7 730.2 792.3 728.1 800.9 Selling, engineering, and administrative expenses 50.7 53.0 55.8 64.6 Gain on disposition of property, plant, and equipment 7.4 2.3 17.3 11.5 Operating profit 122.7 152.5 140.7 158.9 Net income from continuing operations 52.4 66.1 62.4 71.0 Discontinued operations, net of tax (0.1 ) 1.4 0.7 (0.2 ) Net income 52.3 67.5 63.1 70.8 Net income attributable to Trinity Industries, Inc. 52.9 67.8 63.2 71.3 Net income attributable to Trinity Industries, Inc. per common share: Basic: Continuing operations $ 0.66 $ 0.82 $ 0.79 $ 0.90 Discontinued operations — 0.02 0.01 — $ 0.66 $ 0.84 $ 0.80 $ 0.90 Diluted: Continuing operations $ 0.66 $ 0.82 $ 0.79 $ 0.90 Discontinued operations — 0.02 0.01 — $ 0.66 $ 0.84 $ 0.80 $ 0.90 83 Three Months Ended March 31,
2011 June 30,
2011 September 30,
2011 December 31,
2011 (in millions except per share data) Revenues: Manufacturing $ 473.3 $ 546.1 $ 609.2 $ 758.3 Leasing 119.8 128.2 147.4 156.0 593.1 674.3 756.6 914.3 Operating costs: Costs of revenues: Manufacturing 393.0 466.8 518.3 661.2 Leasing 60.5 63.3 78.6 87.9 Other 8.1 7.4 7.1 5.3 461.6 537.5 604.0 754.4 Selling, engineering, and administrative expenses 45.8 43.7 50.0 54.5 Gain on disposition of property, plant, and equipment 1.6 2.3 2.0 34.1 Operating profit 87.3 95.4 104.6 139.5 Net income from continuing operations 26.8 31.6 31.1 57.3 Discontinued operations, net of tax (1.2 ) 0.0 0.5 (0.4 ) Net income 25.6 31.6 31.6 56.9 Net income attributable to Trinity Industries, Inc. 24.2 30.0 31.9 56.1 Net income (loss) attributable to Trinity Industries, Inc. per common share: Basic: Continuing operations $ 0.32 $ 0.37 $ 0.39 $ 0.71 Discontinued operations (0.02 ) — 0.01 (0.01 ) $ 0.30 $ 0.37 $ 0.40 $ 0.70 Diluted: Continuing operations $ 0.32 $ 0.37 $ 0.39 $ 0.71 Discontinued operations (0.02 ) — 0.01 (0.01 ) $ 0.30 $ 0.37 $ 0.40 $ 0.70 Amounts previously reported have been adjusted to reflect discontinued operations resulting from the salesexpected sale of railcars from the lease fleet on a gross basis in leasing revenues and cost of revenues if the railcar has been owned by the lease fleet for one year or less at the time of sale. Sales of railcars from the lease fleet which have been owned by the lease fleet for more than one year are recognized as a net gain or loss from the disposal of a long-term asset.Company's ready-mix concrete operations. See Note 12 Acquisitions and Divestitures.84Item 9. Changes in and Disagreements with Accountants on Accounting andFinancial Statements.september 30 september 30 september 30 september 30 Three Months Ended March 31,
2011 June 30,
2011 September 30,
2011 December 31,
2011 (in millions except per share data) $ 514.4 $ 580.1 $ 643.7 $ 785.5 119.8 128.2 147.4 156.0 634.2 708.3 791.1 941.5 431.7 498.2 548.4 686.4 60.5 63.3 78.6 87.9 8.1 7.4 7.1 5.3 500.3 568.9 634.1 779.6 50.3 47.5 53.5 57.8 1.1 0.4 1.6 13.1 — — 0.6 17.0 0.8 3.1 (0.3 ) 4.8 1.9 3.5 1.9 34.9 85.5 95.4 105.4 139.0 25.6 31.6 31.6 56.9 24.2 30.0 31.9 56.1 $ 0.30 $ 0.37 $ 0.40 $ 0.70 Three Months Ended March 31,
2010 June 30,
2010 September 30,
2010 December 31,
2010 (in millions except per share data) $ 332.8 $ 423.5 $ 417.9 $ 516.8 114.9 115.2 115.2 119.2 447.7 538.7 533.1 636.0 283.1 351.7 348.1 451.8 64.0 61.8 59.2 59.0 4.1 2.1 2.1 2.6 351.2 415.6 409.4 513.4 48.4 45.5 48.7 43.7 1.7 0.3 2.3 2.3 — — 10.2 (0.5 ) 2.2 1.0 4.4 0.3 3.9 1.3 16.9 2.1 52.0 78.9 91.9 81.0 4.3 21.1 31.5 18.5 2.0 18.4 29.7 17.3 $ 0.02 $ 0.23 $ 0.37 $ 0.22 Effective December 31, 2011, deferred loan issuance costs incurred have been classified in our Consolidated Statements of Cash Flows in financing activities as a deduction from debt proceeds to properly state such costs as financing activities. Previously such costs were classified as an operating activity within the change in other assets. The impact to properly state operatingDisclosure.None.Item 9A. Controls and financing activities for the three months ended March 31, 2011 and the six months ended June 30, 2011 was $5.9 million and the nine months ended September 30, 2011 impact was $21.1 million. The impact in 2010 to properly state operating and financing activities for the periods ended March 31, 2010 and June 30, 2010, was $0.2 million, while the impact for the nine months ended September 30, 2010 was $0.3 million. The impact for the year ended December 31, 2010 was $6.6 million. The following quarterly Consolidated Statements of Cash Flows for 2011 and 2010 are summarized as follows 1) originally reported as adjusted for the change in accounting for lease fleet railcar sales explained above and 2) as adjusted for the change in accounting for lease fleet railcar sales and the proper recognition of deferred loan issuance costs as financing activities:Three Months Three Months Three Months Three Months Originally Reported as Adjusted for the Change in Presentation
for Lease Fleet Railcar Sales Three Months
Ended
March 31,
2011 Six Months
Ended
June 30,
2011 Nine Months
Ended
September 30,
2011 (in millions) $ (11.5 ) $ (3.2 ) $ 28.6 (35.6 ) (58.3 ) (125.6 ) (46.6 ) (35.4 ) 15.8 $ (93.7 ) $ (96.9 ) $ (81.2 ) Three Months
Ended
March 31,
2010 Six Months
Ended
June 30,
2010 Nine Months
Ended
September 30,
2010 Year
Ended
December
31,
2010 (in millions) $ (16.2 ) $ 6.1 $ 47.5 $ 163.9 (268.4 ) (304.0 ) (333.0 ) (308.2 ) (69.5 ) (103.6 ) (175.1 ) (113.5 ) $ (354.1 ) $ (401.5 ) $ (460.6 ) $ (257.8 ) Three Months Three Months Three Months Three Months As Adjusted for the Change in Presentation for Lease Fleet Railcar
Sales and the Recognition of Deferred Loan Issuance Costs as
Financing Activities Three Months
Ended
March 31,
2011 Six Months
Ended
June 30,
2011 Nine Months
Ended
September 30,
2011 (in millions) $ (5.6 ) $ 2.7 $ 49.7 (35.6 ) (58.3 ) (125.6 ) (52.5 ) (41.3 ) (5.3 ) $ (93.7 ) $ (96.9 ) $ (81.2 ) Three Months
Ended
March 31,
2010 Six Months
Ended
June 30,
2010 Nine Months
Ended
September 30,
2010 Year
Ended
December
31,
2010 (in millions) $ (16.0 ) $ 6.3 $ 47.8 $ 170.5 (268.4 ) (304.0 ) (333.0 ) (308.2 ) (69.7 ) (103.8 ) (175.4 ) (120.1 ) $ (354.1 ) $ (401.5 ) $ (460.6 ) $ (257.8 ) Item 9.Changes in and Disagreements with Accountants on Accounting and Financial Disclosure.None.Item 9A.Controls and Procedures.Disclosure Controls and Procedures.The Company maintains controls and procedures designed to ensure that it is able to collect the information it is required to disclose in the reports it files with the SEC, and to process, summarize, and disclose this information within the time periods specified in the rules of the SEC. The Company’sCompany's Chief Executive and Chief Financial Officers are responsible for establishing and maintaining these procedures and, as required by the rules of the SEC, evaluating their effectiveness. Based on their evaluation of the Company’sCompany's disclosure controls and procedures which took place as of the end of the period covered by this report, the Chief Executive and Chief Financial Officers believe that these procedures are effective to ensure that the Company is able to collect, process, and disclose the information it is required to disclose in the reports it files with the SEC within the required time periods.Management’sManagement's Report on Internal Control over Financial Reporting.Management of the Company is responsible for establishing and maintaining effective internal control over financial reporting as defined in Rules 13a-15(f) under the Securities Exchange Act of 1934. The Company’sCompany's internal control over financial reporting is designed to provide reasonable assurance regarding the reliability of financial reporting and the preparation of financial statements for external purposes in accordance with accounting principles generally accepted in the United States.Because of its inherent limitations, internal control over financial reporting may not prevent or detect misstatements. Therefore, even those systems determined to be effective can provide only reasonable assurance, as opposed to absolute assurance, of achieving their internal control objectives.Management assessed the effectiveness of the Company’sCompany's internal control over financial reporting as of December 31, 2011.2012. In making this assessment, management used the criteria set forth by the Committee of Sponsoring Organizations of the Treadway Commission (COSO) inInternal Control —- Integrated Framework. Based on our assessment, we believe that, as of December 31, 2011,2012, the Company’sCompany's internal control over financial reporting was effective based on those criteria.The effectiveness of internal control over financial reporting as of December 31, 2011,2012, has been audited by Ernst & Young LLP, the independent registered public accounting firm who also audited the Company’sCompany's consolidated financial statements. Ernst & Young LLP’sLLP's attestation report on effectiveness of the Company’sCompany's internal control over financial reporting follows:85Report of Independent Registered Public Accounting FirmThe Board of Directors and Stockholders Trinity Industries, Inc.We have audited Trinity Industries, Inc. and Subsidiaries' internal control over financial reporting as of December 31, 2012, based on criteria established in Internal Control - Integrated Framework issued by the Committee of Sponsoring Organizations of the Treadway Commission (the COSO criteria). Trinity Industries, Inc. and Subsidiaries' management is responsible for maintaining effective internal control over financial reporting, and for its assessment of the effectiveness of internal control over financial reporting included in the accompanying Management's Report on Internal Control over Financial Reporting. Our responsibility is to express an opinion on the Company's internal control over financial reporting based on our audit.We conducted our audit in accordance with the standards of the Public Company Accounting Oversight Board (United States). Those standards require that we plan and perform the audit to obtain reasonable assurance about whether effective internal control over financial reporting was maintained in all material respects. Our audit included obtaining an understanding of internal control over financial reporting, assessing the risk that a material weakness exists, testing and evaluating the design and operating effectiveness of internal control based on the assessed risk, and performing such other procedures as we considered necessary in the circumstances. We believe that our audit provides a reasonable basis for our opinion.A company's internal control over financial reporting is included herein.a process designed to provide reasonable assurance regarding the reliability of financial reporting and the preparation of financial statements for external purposes in accordance with generally accepted accounting principles. A company's internal control over financial reporting includes those policies and procedures that (1) pertain to the maintenance of records that, in reasonable detail, accurately and fairly reflect the transactions and dispositions of the assets of the company; (2) provide reasonable assurance that transactions are recorded as necessary to permit preparation of financial statements in accordance with generally accepted accounting principles, and that receipts and expenditures of the company are being made only in accordance with authorizations of management and directors of the company; and (3) provide reasonable assurance regarding prevention or timely detection of unauthorized acquisition, use, or disposition of the company's assets that could have a material effect on the financial statements.Because of its inherent limitations, internal control over financial reporting may not prevent or detect misstatements. Also, projections of any evaluation of effectiveness to future periods are subject to the risk that controls may become inadequate because of changes in conditions, or that the degree of compliance with the policies or procedures may deteriorate.In our opinion, Trinity Industries, Inc. and Subsidiaries maintained, in all material respects, effective internal control over financial reporting as of December 31, 2012, based on the COSO criteria.We also have audited, in accordance with the standards of the Public Company Accounting Oversight Board (United States), the consolidated balance sheets of Trinity Industries, Inc. and Subsidiaries as of December 31, 2012 and 2011, and the related consolidated statements of operations, comprehensive income, cash flows, and stockholders' equity for each of the three years in the period ended December 31, 2012 of Trinity Industries, Inc. and Subsidiaries and our report dated February 21, 2013 expressed an unqualified opinion thereon.Dallas, TexasFebruary 21, 201386Item 9B. Other Information.None.PART IIIItem 10. Directors, Executive Officers and Corporate Governance. Directors, Executive Officers and Corporate Governance.—- Election of Directors” in the Company’sCompany's Proxy Statement for the 20122013 Annual Meeting of Stockholders (the “2012“2013 Proxy Statement”). Information relating to the executive officers of the Company is set forth in Part I of this report under the caption “Executive Officers and Other Corporate Officers of the Company.” Information relating to the Board of Directors’Directors' determinations concerning whether at least one of the members of the Audit Committee is an “audit committee financial expert” as that term is defined under Item 407 (d)(5) of Regulation S-K is incorporated by reference to the information set forth under the caption “Corporate Governance —- Board Committees —- Audit Committee” in the Company’s 2012Company's 2013 Proxy Statement. Information regarding the Company’sCompany's Audit Committee is incorporated by reference to the information set forth under the caption “Corporate Governance —- Board Committees —- Audit Committee” in the Company’s 2012Company's 2013 Proxy Statement. Information regarding compliance with Section 16(a) of the Securities and Exchange Act of 1934 is incorporated by reference to the information set forth under the caption “Additional Information —- Section 16(a) Beneficial Ownership Reporting Compliance” in the Company’s 2012Company's 2013 Proxy Statement.The Company has adopted a Code of Business Conduct and Ethics that applies to all of its directors, officers, and employees. The Code of Business Conduct and Ethics is on the Company’sCompany's website atwww.trin.net under the caption “Investor Relations/ Governance.” The Company intends to post any amendments or waivers for its Code of Business Conduct and Ethics to the Company’sCompany's website atwww.trin.net to the extent applicable to an executive officer or director of the Company.Item 11. Executive Compensation.Executive Compensation.Company’s 2012Company's 2013 Proxy Statement. Information concerning compensation committee interlocks and insider participation is incorporated by reference to the information set forth under the caption “Corporate Governance —- Compensation Committee Interlocks and Insider Participation” in the Company’s 2012Company's 2013 Proxy Statement. Information about the compensation committee report is incorporated by reference to the information set forth under the caption “Executive Compensation —- Human Resources Committee Report” in the Company’s 2012Company's 2013 Proxy Statement.Company’s 2012Company's 2013 Proxy Statement, under the caption “Security Ownership —- Security Ownership of Certain Beneficial Owners and Management.”The following table sets forth information about Trinity common stock that may be issued under all of Trinity’sTrinity's existing equity compensation plans as of December 31, 2011.Equity.Equity Compensation Plan Information (a) (b) (c) Number of Securities to be Issued Upon Exercise of Outstanding Options, Warrants and Rights Weighted-Average Exercise Price of Outstanding Options, Warrants and Rights Number of Securities Remaining Available for Future Issuance under Equity Compensation Plans (Excluding Securities Reflected in Column (a)) Plan Category: Equity compensation plans approved by security holders: Stock Options 233,985 $ 16.78 Restricted stock units and performance units 901,219 1 $ — 1,135,204 1,443,350 Equity compensation plans not approved by security holders — 2 — Total 1,135,204 1,443,350 ____________1 Includes 306,074 shares of common stock issuable upon the vesting and conversion of restricted stock units and 595,145 shares of common stock issuable upon the vesting and conversion of performance units. The Board of Directors has the right to disallow the granting of performance units for values in excess of target and, accordingly, no expense or number of shares in excess of the target value is recognized for any units subject to negative discretion. The restricted stock units and performance units do not have an exercise price.2 Excludes information regarding the Trinity Deferred Plan for Director Fees. This plan permits the deferral of the payment of the annual retainer fee and board and committee meeting fees. At the election of the participant, the deferred fees may be converted into phantom stock units with a fair market value equal to the value of the fees deferred, and such phantom stock units are credited to the director's account (along with the amount of any dividends or stock distributions). At the time a participant ceases to be a director, cash will be distributed to the participant. At December 31, 2012, there were 111,753 phantom stock units credited to the accounts of participants. Also excludes information regarding the Trinity Industries Supplemental Profit Sharing Plan (“Supplemental Plan”) for certain of its highly compensated employees. Information about the Supplemental Plan is incorporated herein by reference from the Company's 2013 Proxy Statement, under the caption “Executive Compensation Plan Information- Post-Employment Benefits.” At December 31, 2012, there were 45,480 stock units credited to the accounts of participants under the Supplemental Plan. (a) (b) (c) Number of Securities Number of Securities Remaining Available for to be Issued Weighted-Average Future Issuance under Upon Exercise of Exercise Price of Equity Compensation Outstanding Options, Outstanding Options, Plans (Excluding Securities Warrants and Rights Warrants and Rights Reflected in Column (a)) 653,516 $ 16.30 614,654 (1) — 1,268,170 2,062,102 — (2) — 1,268,170 2,062,102 (2)Excludes information regarding the Trinity Deferred Plan for Director Fees. This plan permits the deferral of the payment of the annual retainer fee and board and committee meeting fees. At the election of the participant, the deferred fees may be converted into phantom stock units with a fair market value equal to the value of the fees deferred, and such phantom stock units are credited to the director’s account (along with the amount of any dividends or stock distributions). At the time a participant ceases to be a director, cash will be distributed to the participant. At December 31, 2011, there were 106,126 phantom stock units credited to the accounts of participants. Also excludes information regarding the Trinity Industries Supplemental Profit Sharing Plan (“Supplemental Plan”) for certain of its highly compensated employees. Information about the Supplemental Plan is incorporated herein by reference from the Company’s 2012 Proxy Statement, under the caption “Executive Compensation — Post-Employment Benefits.” At December 31, 2011, there were 45,904 stock units credited to the accounts of participants under the Supplemental Plan.Item 13.Certain Relationships and Related Transactions, and Director Independence.Company’s 2012Company's 2013 Proxy Statement. Information regarding the independence of directors is incorporated by reference to the information set forth under the captions “Corporate Governance-Independence of Directors” in the Company’s 2012Company's 2013 Proxy Statement.Item 14. Principal Accountant Fees and Services.Principal Accountant Fees and Services.20112012 and 2010”2011” in the Company’s 2012Company's 2013 Proxy Statement.88PART IVItem 15.Item 15.Exhibits and Financial Statement Schedules.(a) (1) Financial Statements.See Item 8.(2) Financial Statement Schedule.All schedules are omitted because they are not required, not significant, not applicable or the information is shown in the financial statements or the notes to consolidated financial statements.(3) Exhibits.See Index to Exhibits for a listing of Exhibits which are filed herewith or incorporated herein by reference to the location indicated.89EXHIBIT 23CONSENT OF INDEPENDENT REGISTERED PUBLIC ACCOUNTING FIRMWe consent to the incorporation by reference in the following Registration Statements:1) Post-Effective Amendment No. 3 to the Registration Statement (Form S-8, No. 2-64813), 2) Post-Effective Amendment No. 1 to the Registration Statement (Form S-8, No. 33-10937), 3) Registration Statement (Form S-8, No. 33-35514), 4) Registration Statement (Form S-8, No. 33-73026), 5) Registration Statement (Form S-8, No. 333-77735), 6) Registration Statement (Form S-8, No. 333-91067), 7) Registration Statement (Form S-8, No. 333-85588), 8) Registration Statement (Form S-8, No. 333-85590), 9) Registration Statement (Form S-8, No. 333-114854), 10) Registration Statement (Form S-8, No. 333-115376), 11) Registration Statement (Form S-3, No. 333-134596), 12) Registration Statement (Form S-8, No. 333-159552), and13) Registration Statement (Form S-8, No. 333-169452), and 14) Registration Statement (Form S-8, No. 333-183941); of our reports dated February 16, 201221, 2013 with respect to the consolidated financial statements of Trinity Industries, Inc. and Subsidiaries and the effectiveness of internal control over financial reporting of Trinity Industries, Inc. and Subsidiaries included in this Annual Report (Form 10-K) of Trinity Industries, Inc. and Subsidiaries for the year ended December 31, 2011./s/ ERNST & YOUNG LLPDallas, TexasFebruary 16, 201290SIGNATURESPursuant to the requirements of Section 13 or 15(d) of the Securities Exchange Act of 1934, the registrant has duly caused this report to be signed on its behalf by the undersigned, thereunto duly authorized.TRINITY INDUSTRIES, INC. By /s/ James E. Perry Registrant James E. Perry Chief Financial Officer Dated: February 16, 201221, 2013Pursuant to the requirements of the Securities Exchange Act of 1934, this report has been signed below by the following persons on behalf of the registrant and in the capacities and on the dates indicated.Directors:/s/ John L. Adams /s/ Diana S. NatalicioMelendy Lovett John L. Adams Diana S. NatalicioMelendy LovettDirector Director Dated: February 16, 201221, 2013 Dated: February 16, 201221, 2013/s/ Rhys J. Best /s/ Douglas L. Rock Rhys J. Best Douglas L. Rock Director Director Dated: February 16, 201221, 2013 Dated: February 16, 201221, 2013/s/ David W. Biegler David W. Biegler DirectorDated: February 16, 2012Principal Executive Officer: Director /s/ Leldon E. EcholsDated: February 21, 2013 /s/ Timothy R. Wallace Leldon E. Echols Timothy R. Wallace Director/s/ Leldon E. Echols Chairman, Chief Executive Officer, President, and Director Dated: February 16, 2012Leldon E. Echols Dated: February 16, 201221, 2013Director Dated: February 21, 2013 Principal Financial Officer: /s/ Ronald J. Gafford Ronald J. Gafford /s/ James E. Perry Ronald J. GaffordDirector James E. Perry DirectorDated: February 21, 2013 Senior Vice President and Chief Financial Officer Dated: February 16, 2012 Dated: February 16, 201221, 2013 /s/ Ronald W. Haddock Ronald W. Haddock Director Dated: February 16, 2012Principal Accounting Officer: /s/ Adrián LajousDated: February 21, 2013 /s/ Mary E. Henderson /s/ Adrián Lajous Mary E. Henderson DirectorAdrián Lajous Vice President, Chief Accounting Officer, and Controller Dated: February 16, 2012Director Dated: February 16, 201221, 2013Dated: February 21, 2013 /s/ Charles W. Matthews Charles W. Matthews Director Dated: February 16, 201221, 2013 91INDEX TO EXHIBITSTrinity Industries, Inc.Index to Exhibits(Item 15(b))NO. (3.1) Certificate of Incorporation of Trinity Industries, Inc., as amended May 23, 2007 (incorporated by reference to Exhibit 3.1 to our Quarterly Report on Form 10-Q for the quarterly period ended June 30, 2007)(filed herewith).(3.2) Amended and Restated By-Laws of Trinity Industries, Inc., as amended May 2, 2011December 7, 2012 (incorporated by reference to Exhibit 3.199.1 to our Quarterly Report on Form 10-Q for the quarterly period ended June 30, 2011)8-K filed December 12, 2012).(4.01)(4.1) Indenture, dated June 7, 2006, between Trinity Industries, Inc. and Wells Fargo Bank, National Association, as trustee (including the Form of 3 7/8% Convertible Subordinated Note due 2036 as an exhibit thereto) (filed herewith)(incorporated by reference to Exhibit 4.01 to our Annual Report on Form 10-K for the annual period ended December 31, 2011).(4.01.1)(4.1.1) Officers’Officers' Certificate of Trinity Industries, Inc. pursuant to the Indenture dated June 7, 2006, relating to the Company’sCompany's 3 7/8% Convertible Subordinated Notes due 2036 (filed herewith)(incorporated by reference to Exhibit 4.01.1 to our Annual Report on Form 10-K for the annual period ended December 31, 2011).(4.1)(4.2) Specimen Common Stock Certificate of Trinity Industries, Inc. (incorporated by reference to Exhibit 4.1 of Registration Statement No. 333-159552 filed May 28, 2009). (4.2)(4.3) Pass Through Trust Agreement dated as of February 15, 2002 among Trinity Industries Leasing Company, Trinity Industries, Inc. and Wilmington Trust Company, as Trustee (incorporated by reference to Exhibit 4.4 to our Annual Report on Form 10-K for the annual period ended December 31, 2007). (4.2.1)(4.3.1) Trust Indenture and Security Agreement dated as of February 15, 2002 among Trinity Industries Leasing Company, Trinity Industries, Inc. and The Bank of New York, as Trustee (incorporated by reference to Exhibit 4.4.1 to our Annual Report on Form 10-K for the annual period ended December 31, 2007). (4.2.2)(4.3.2) Trust Indenture and Security Agreement dated as of February 15, 2002 among Trinity Industries Leasing Company, Trinity Industries, Inc. and The Bank of New York, as Trustee (incorporated by reference to Exhibit 4.4.2 to our Annual Report on Form 10-K for the annual period ended December 31, 2007). (4.2.3)(4.3.3) Trust Indenture and Security Agreement dated as of February 15, 2002 among Trinity Industries Leasing Company, Trinity Industries, Inc. and The Bank of New York, as Trustee (incorporated by reference to Exhibit 4.4.3 to our Annual Report on Form 10-K for the annual period ended December 31, 2007). (10.1.1) Form of Amended and Restated Executive Severance Agreement entered into between Trinity Industries, Inc. and the Chief Executive Officer, and each of the Senior Vice Presidents (incorporated by reference to Exhibit 10.1.1 to our Quarterly Report on Form 10-Q for the quarterly period ended September 30, 2008).* (10.1.2)(10.1.2 Form of Amended and Restated Executive Severance Agreement entered into between Trinity Industries, Inc. and certain executive officers and certain other subsidiary and divisional officers of Trinity Industries, Inc. (incorporated by reference to Exhibit 10.1.2 to our Annual Report on Form 10-K for the annual period ended December 31, 2008).* (10.2) Trinity Industries, Inc. Directors’Directors' Retirement Plan, as amended September 10, 1998 (incorporated by reference to Exhibit 10.2 of Registration Statement No. 333-117526 filed July 21, 2004).*(10.2.1) Amendment No. 2 to the Trinity Industries, Inc. Directors’Directors' Retirement Plan (incorporated by reference to Exhibit 10.2.1 to our Annual Report on Form 10-K for the annual period ended December 31, 2010).*(10.2.2) Amendment No. 3 to the Trinity Industries, Inc. Directors’Directors' Retirement Plan (filed herewith)(incorporated by reference to Exhibit 10.2.2 to our Annual Report on Form 10-K for the annual period ended December 31, 2011).*(10.3) 1993 Stock Option and Incentive Plan (incorporated by reference to Exhibit 4.1 of Registration Statement No. 33-73026 filed December 15, 1993).* (10.3.1) Amendment No. 1 to the 1993 Stock Option and Incentive Plan (filed herewith)(incorporated by reference to Exhibit 10.3.1 to our Annual Report on Form 10-K for the annual period ended December 31, 2011).*(10.3.2) Amendment No. 2 to the 1993 Stock Option and Incentive Plan (filed herewith)(incorporated by reference to Exhibit 10.3.2 to our Annual Report on Form 10-K for the annual period ended December 31, 2011).*(10.3.3) Amendment No. 3 to the 1993 Stock Option and Incentive Plan (filed herewith)(incorporated by reference to Exhibit 10.3.3 to our Annual Report on Form 10-K for the annual period ended December 31, 2011).*(10.3.4) Amendment No. 4 to the 1993 Stock Option and Incentive Plan (filed herewith)(incorporated by reference to Exhibit 10.3.4 to our Annual Report on Form 10-K for the annual period ended December 31, 2011).*(10.3.5) Amendment No. 5 to the 1993 Stock Option and Incentive Plan (filed herewith)(incorporated by reference to Exhibit 10.3.5 to our Annual Report on Form 10-K for the annual period ended December 31, 2011).*(10.4) Supplemental Profit Sharing Plan for Employees of Trinity Industries, Inc. and Certain Affiliates as restated effective January 1, 2005 (incorporated by reference to Exhibit 10.5 to our Annual Report on Form 10-K for the annual period ended December 31, 2007).* (10.5) Trust Agreement for Trinity Industries, Inc. Deferred Compensation Trust dated December 15, 2011 (filed herewith)(incorporated by reference to Exhibit 10.5 to our Annual Report on Form 10-K for the annual period ended December 31, 2011).*92INDEX TO EXHIBITSTrinity Industries, Inc.Index to Exhibits(Item 15(b))NO. (10.6) Trust Agreement for Trinity Industries, Inc. Supplemental Profit Sharing and Directors Fee Trust dated December 15, 2011 (filed herewith)(incorporated by reference to Exhibit 10.6 to our Annual Report on Form 10-K for the annual period ended December 31, 2011).*(10.7) Supplemental Retirement Plan as Amended and Restated effective January 1, 2009 (incorporated by reference to Exhibit 10.7 to our Quarterly Report on Form 10-Q for the quarterly period ended September 30, 2008).* (10.7.1) Amendment No. 1 to the Supplemental Retirement Plan as Amended and Restated effective January 1, 2009 (incorporated by reference to Exhibit 10.7.1 to our Form 8-K filed February 17, 2009).* (10.8) Trinity Industries, Inc. Deferred Plan for Director Fees, as amended (incorporated by reference to Exhibit 10.9 of Registration Statement No. 333-117526 filed July 21, 2004).* (10.8.1) Amendment to Trinity Industries, Inc. Deferred Plan for Director Fees dated December 7, 2005 (filed herewith)(incorporated by reference to Exhibit 10.8.1 to our Annual Report on Form 10-K for the annual period ended December 31, 2011).*(10.8.2) Trinity Industries, Inc. 2005 Deferred Plan for Director Fees (filed herewith)(incorporated by reference to Exhibit 10,8.2 to our Annual Report on Form 10-K for the annual period ended December 31, 2011).*(10.9) Trinity Industries, Inc. 1998 Stock Option and Incentive Plan (incorporated by reference to Exhibit 4.2 of Registration Statement No. 333-77735 filed May 4, 1999).* (10.9.1) Amendment No. 1 to the Trinity Industries, Inc. 1998 Stock Option Plan and Incentive Plan (incorporated by reference to Exhibit 10.9.1 to our Annual Report on Form 10-K for the annual period ended December 31, 2009).* (10.9.2) Amendment No. 2 to the Trinity Industries, Inc. 1998 Stock Option and Incentive Plan (incorporated by reference to Exhibit 10.9.2 to our Annual Report on Form 10-K for the annual period ended December 31, 2009).* (10.9.3) Amendment No. 3 to the Trinity Industries, Inc. 1998 Stock Option and Incentive Plan (filed herewith)(incorporated by reference to Exhibit 10.9.3 to our Annual Report on Form 10-K for the annual period ended December 31, 2011).*(10.9.4) Amendment No. 4 to the Trinity Industries, Inc. 1998 Stock Option and Incentive Plan (filed herewith)(incorporated by reference to Exhibit 10.9.4 to our Annual Report on Form 10-K for the annual period ended December 31, 2011).*(10.10) Amended and Restated Trinity Industries, Inc. 2004 Stock Option and Incentive Plan (incorporated by reference to Exhibit 10.1 to our Form 8-K filed May 4, 2010).* (10.10.1) Form of Notice of Grant of Stock Options and Non-Qualified Option Agreement with Non-Qualified Stock Option Terms and Conditions as of September 8, 2004 (incorporated by reference to Exhibit 10.10.1 to our Annual Report on Form 10-K for the annual period ended December 31, 2010).* (10.10.1.1) Non-Qualified Stock Option Terms and Conditions as of December 6, 2005 (filed herewith)( incorporated by reference to Exhibit 10.10.1.1 to our Annual Report on Form 10-K for the annual period ended December 31, 2011).*(10.10.1.2) Form of Notice of Grant of Stock Options and Non-Qualified Option Agreement with Non-Qualified Stock Option Terms and Conditions as of December 9, 2008 (incorporated by reference to Exhibit 10.11.1.2 to our Annual Report on Form 10-K for the annual period ended December 31, 2008).* (10.10.2) Form of Notice of Grant of Stock Options and Incentive Stock Option Agreement with Incentive Stock Option Terms and Conditions as of September 8, 2004 (incorporated by reference to Exhibit 10.10.2 to our Annual Report on Form 10-K for the annual period ended December 31, 2010).* (10.10.2.1) Incentive Stock Option Terms and Conditions as of December 6, 2005 (filed herewith)(incorporated by reference to Exhibit 10.10.2.1 to our Annual Report on Form 10-K for the annual period ended December 31, 2011).*(10.10.2.2) Form of Notice of Grant of Stock Options and Incentive Stock Option Agreement with Incentive Stock Option Terms and Conditions as of December 9, 2008 (incorporated by reference to Exhibit 10.11.2.2 to our Annual Report on Form 10-K for the annual period ended December 31, 2008).* (10.10.3) Form of Restricted Stock Grant Agreement for grants issued prior to 2008 (incorporated by reference to Exhibit 10.11.3 to our Annual Report on Form 10-K for the annual period ended December 31, 2007).* (10.10.3.1) Form of Restricted Stock Grant Agreement for grants issued commencing 2008 (incorporated by reference to Exhibit 10.11.3 to our Quarterly Report on Form 10-Q for the quarterly period ended September 30, 2008).* (10.10.4) Form of Non-Qualified Stock Option Agreement for Non-Employee Directors (incorporated by reference to Exhibit 10.10.4 to our Annual Report on Form 10-K for the annual period ended December 31, 2010).* (10.10.5) Form of Restricted Stock Unit Agreement for Non-Employee Directors for grants issued prior to 2008 (incorporated by reference to Exhibit 10.11.5 to our Annual Report on Form 10-K for the annual period ended December 31, 2007).* 93INDEX TO EXHIBITSTrinity Industries, Inc.Index to Exhibits(Item 15(b))NO. DESCRIPTION (10.10.5.1) Form of Restricted Stock Unit Agreement for Non-Employee Directors for grants issued commencing 2008 (incorporated by reference to Exhibit 10.11.5 to our Quarterly Report on Form 10-Q for the quarterly period ended September 30, 2008).* (10.10.6) Form of Performance Restricted Stock Unit Grant Agreement for grants issued commencing 2011 (incorporated by reference to Exhibit 10.1 to our Quarterly Report on Form 10-Q for the quarterly period ended June 30, 2011).* NO.DESCRIPTION(10.11) Supplemental Retirement and Director Retirement Trust of Trinity Industries, Inc. Supplemental Retirement Plan Trust (incorporated by reference to Exhibit 10.1110.1 to our AnnualQuarterly Report on Form 10-K10-Q/A for the annualquarterly period ended DecemberMarch 31, 2009)2012).*(10.12) Form of 2008 Deferred Compensation Plan and Agreement as amended and restated entered into between Trinity Industries, Inc. and certain officers of Trinity Industries, Inc. or its subsidiaries (incorporated by reference to Exhibit 10.13 to our Annual Report on Form 10-K for the annual period ended December 31, 2007).* (10.13) Trinity Industries, Inc. Short-Term Management Incentive Plan (incorporated by reference to Exhibit 10.14 to our Annual Report on Form 10-K for the annual period ended December 31, 2007).* (10.14) Equipment Lease Agreement (TRL 1 2001-1A) dated as of May 17, 2001 between TRLI-1A Railcar Statutory Trust, lesser, and Trinity Rail Leasing I L.P., lessee (incorporated by reference to Exhibit 10.15 to our Annual Report on Form 10-K for the annual period ended December 31, 2007). (10.14.1) Participation Agreement (TRL 1 2001-1A) dated as of May 17, 2001 among Trinity Rail Leasing I L.P., lessee, et. al. (incorporated by reference to Exhibit 10.15.1 to our Annual Report on Form 10-K for the annual period ended December 31, 2007). (10.14.2) Equipment Lease Agreement (TRL 1 2001-1B) dated as of July 12, 2001 between TRL 1 2001-1B Railcar Statutory Trust, lessor, and Trinity Rail Leasing I L.P., lessee (incorporated by reference to Exhibit 10.15.2 to our Annual Report on Form 10-K for the annual period ended December 31, 2007). (10.14.3) Participation Agreement (TRL 1 2001-1B) dated as of May 17, 2001 among Trinity Rail Leasing I L.P., lessee, et. al. (incorporated by reference to Exhibit 10.15.3 to our Annual Report on Form 10-K for the annual period ended December 31, 2007). (10.14.4) Equipment Lease Agreement (TRL 1 2001-1C) dated as of December 28, 2001 between TRL 1 2001-1C Railcar Statutory Trust, lessor, and Trinity Rail Leasing 1 L.P., lessee (incorporated by reference to Exhibit 10.15.4 to our Annual Report on Form 10-K for the annual period ended December 31, 2007). (10.14.5) Participation Agreement (TRL 1 2001-1C) dated as of December 28, 2001 among Trinity Rail Leasing 1 L.P., lessee, et. al. (incorporated by reference to Exhibit 10.15.5 to our Annual Report on Form 10-K for the annual period ended December 31, 2007). (10.15) Equipment Lease Agreement (TRL III 2003-1A) dated as of November 12, 2003 between TRL III-1A Railcar Statutory Trust, lessor, and Trinity Rail Leasing III L.P., lessee (incorporated by reference to Exhibit 10.16 to our Annual Report on Form 10-K for the annual period ended December 31, 2007). (10.15.1) Participation Agreement (TRL III 2003-1A) dated as of November 12, 2003 between TRL III-1A among Trinity Rail Leasing III L.P., lessee, et. al. (incorporated by reference to Exhibit 10.16.1 to our Annual Report on Form 10-K for the annual period ended December 31, 2007). (10.15.2) Equipment Lease Agreement (TRL III 2003-1B) dated as of November 12, 2003 between TRL III-1B Railcar Statutory Trust, lessor, and Trinity Rail Leasing III L.P., lessee, (incorporated by reference to Exhibit 10.16.2 to our Annual Report on Form 10-K for the annual period ended December 31, 2007). (10.15.3) Participation Agreement (TRL III 2003-1B) dated as of November 12, 2003 between TRL III-1B among Trinity Rail Leasing III L.P., lessee, et. al. (incorporated by reference to Exhibit 10.16.3 to our Annual Report on Form 10-K for the annual period ended December 31, 2007). (10.15.4) Equipment Lease Agreement (TRL III 2003-1C) dated as of November 12, 2003 between TRL III-1C Railcar Statutory Trust, lessor, and Trinity Rail Leasing III L.P., lessee (incorporated by reference to Exhibit 10.16.4 to our Annual Report on Form 10-K for the annual period ended December 31, 2007). (10.15.5) Participation Agreement (TRL III 2003-1C) dated as of November 12, 2003 between TRL III-1C among Trinity Rail Leasing III L.P., lessee, et. al. (incorporated by reference to Exhibit 10.16.5 to our Annual Report on Form 10-K for the annual period ended December 31, 2007). (10.16) Equipment Lease Agreement (TRL IV 2004-1A) between TRL IV 2004-1A Statutory Trust, lessor, and Trinity Rail Leasing IV L.P., lessee (incorporated by reference to Exhibit 10.17 to our Annual Report on Form 10-K for the annual period ended December 31, 2007). (10.16.1) Participation Agreement (TRL IV 2004-1A) among Trinity Rail Leasing IV, L.P., lessee, et. al (incorporated by reference to Exhibit 10.17.1 to our Annual Report on Form 10-K for the annual period ended December 31, 2007). 94INDEX TO EXHIBITSTrinity Industries, Inc.Index to Exhibits(Item 15(b))NO. DESCRIPTION (10.17) Third Amended and Restated Credit Agreement dated as of October 20, 2011 among Trinity Industries, Inc, as Borrower, JP Morgan Chase Bank, N.A., individually and as Administrative Agent, and certain other Lenders party thereto from time to time (filed herewith)(incorporated by reference to Exhibit 10.17 to our Annual Report on Form 10-K for the annual period ended December 31, 2011).(10.18) Second Amended and Restated Warehouse Loan Agreement dated as of May 29, 2009 among Trinity Industries NO.DESCRIPTIONLeasing Company, Trinity Rail Leasing Warehouse Trust (formerly known as Trinity Rail Leasing Trust II), The Committed Lenders and the Conduit Lenders from time to time party hereto, Credit Suisse, New York Branch, as Agent, and Wilmington Trust Company, as Collateral Agent and Depositary (incorporated by reference to Exhibit 10.19 to our Form 8-K filed on June 2, 2009). (10.18.1) Amendment No.1 to the Second Amended and Restated Warehouse Loan Agreement, dated February 4, 2011, amending the Second Amended and Restated of Warehouse Loan Agreement dated May 29, 2009 (incorporated by reference to Exhibit 10.1 to our Form 8-K filed on February 8, 2011). (10.19)(10.18.2) Amendment No. 3 to the Second Amended and Restated Warehouse Loan Agreement, dated February 1, 2013, amending the Second Amended and Restated Warehouse Loan Agreement dated May 29, 2009 (incorporated by reference to Exhibit 10.1 to our From 8-K filed on February 4, 2013). (10.19) Term Loan Agreement dated as of May 9, 2008 among Trinity Rail Leasing VI LLC, the Committed Lenders and the Conduit Lenders From Time to Time Party Hereto, DVB Bank AG, as Agent, and Wilmington Trust Company; as Collateral and Depositary (incorporated by reference to Exhibit 10.20 to our Quarterly Report on Form 10-Q for the quarterly period ended June 30, 2008). (10.19.1) Purchase and Sale Agreement (TILC) dated as of May 9, 2008 among Trinity Industries Leasing Company, as Seller and Trinity Rail Leasing VI LLC, as Buyer (incorporated by reference to Exhibit 10.20.1 to our Quarterly Report on Form 10-Q for the quarterly period ended June 30, 2008). (10.19.2) Purchase and Sale Agreement (TRLT-II) dated as of May 9, 2008 among Trinity Rail Leasing Trust II, as Seller, Trinity Rail Leasing VI LLC, as Buyer and Trinity Industries Leasing Company (incorporated by reference to Exhibit 10.20.2 to our Quarterly Report on Form 10-Q for the quarterly period ended June 30, 2008). (10.20) Master Indenture dated November 5, 2009, between Trinity Rail Leasing VII LLC and Wilmington Trust Company, as indenture trustee (incorporated by reference to Exhibit 10.20 to our Annual Report on Form 10-K for the annual period ended December 31, 2009). (10.20.1) Purchase and Contribution Agreement, dated November 5, 2009, among Trinity Industries Leasing Company, Trinity Rail Leasing Warehouse Trust, and Trinity Rail Leasing VII L.L.C. (incorporated by reference to Exhibit 10.20.1 to our Annual Report on Form 10-K for the annual period ended December 31, 2009). (10.21) Perquisite Plan beginning January 1, 2004 in which the Company’sCompany's Executive Officers participate (incorporated by reference to Exhibit 10.21 to our Annual Report on Form 10-K for the annual period ended December 31, 2010).*(10.22) Purchase and Contribution Agreement, dated May 18, 2006, among Trinity Industries Leasing Company, Trinity Leasing Trust II, and Trinity Rail Leasing V L.P. (filed herewith)(incorporated by reference to Exhibit 10.22 to our Annual Report on Form 10-K for the annual period ended December 31, 2011).(10.22.1) Master Indenture dated May 24, 2006, between Trinity Rail Leasing V L.P. and Wilmington Trust Company, as indenture trustee (filed herewith).(10.23)Board Compensation Summary Sheet (incorporated by reference to Exhibit 10.27 to our Quarterly Report on Form 10-Q for the quarterly period ended September 30, 2008).*(10.24)Retirement Transition Agreement between Trinity North American Freight Car, Inc. and Martin Graham (incorporated by reference to Exhibit 10.2810.22.1 to our Annual Report on Form2007)2011).*(10.25)(10.23) Retirement Transition Agreement between Trinity Industries, Inc. and Mark W. Stiles (incorporated by reference to Exhibit 10.1 to our Form 8-K filed July 30, 2010)Board Compensation Summary Sheet (filed herewith).*(10.26)(10.25) Indenture dated as of October 25, 2010, between Trinity Rail Leasing 2010 LLC and Wilmington Trust Company, as indenture trustee (incorporated by reference to Exhibit 10.2 to our Quarterly Report on Form 10-Q for the quarterly period ended September 30, 2010). (10.26.1)(10.25.1) Purchase and Contribution Agreement, dated as of October 25, 2010, among Trinity Rail Leasing Warehouse Trust, Trinity Industries Leasing Company, and Trinity Rail Leasing 2010 LLC (incorporated by reference to Exhibit 10.3 to our Quarterly Report on Form 10-Q for the quarterly period ended September 30, 2010). (10.26.2)(10.25.2) Note Purchase Agreement dated October 18, 2010 among Trinity Industries, Inc., Trinity Industries Leasing Company, Trinity Rail Leasing 2010 LLC, Credit Suisse Securities (USA) LLC, Lloyds TSB Bank PLC, Credit Agricole Securities (USA) Inc., Wells Fargo Securities, LLC, and Rabo Securities USA, Inc. (incorporated by reference to Exhibit 10.4 to our Quarterly Report on Form 10-Q for the quarterly period ended September 30, 2010). 95INDEX TO EXHIBITSTrinity Industries, Inc.Index to Exhibits(Item 15(b))NO. (10.27)DESCRIPTION(10.26) Note Purchase Agreement dated June 29, 2011, among Trinity Industries Leasing Company, TRIP Rail Holdings LLC, TRIP Rail Leasing LLC, and TRIP Rail Master Funding LLC, and Credit Suisse Securities (USA) LLC (incorporated by reference to Exhibit 10.2 to our Quarterly Report on Form 10-Q for the quarterly period ended June 30, 2011). (10.27.1)(10.26.1) Purchase and Contribution Agreement dated July 6, 2011, among TRIP Rail Leasing, LLC, Trinity Industries NO.DESCRIPTIONLeasing Company, TRIP Rail Master Funding LLC (incorporated by reference to Exhibit 10.3 to our Quarterly Report on Form 10-Q for the quarterly period ended June 30, 2011). (10.27.2)(10.26.2) Master Indenture dated July 6, 2011, among TRIP Rail Master Funding LLC and Wilmington Trust Company, as indenture trustee (incorporated by reference to Exhibit 10.4 to our Quarterly Report on Form 10-Q for the quarterly period ended June 30, 2011). (10.28)(10.27) Form of Indemnification Agreement between Trinity Industries, Inc. and certain directors and executive officers (incorporated by reference to Exhibit 10.28 to our Annual Report on Form 10-K for the annual period ended December 31, 2011). (10.28) Note Purchase Agreement dated December 12, 2012, among Trinity Industries, Inc., Trinity Industries Leasing Company, Trinity Rail Leasing 2012 LLC, Credit Suisse Securities (USA) LLC, Credit Agricole Securities (USA) Inc., Lloyd's Securities Inc., Rabo Securities USA, Inc., and Wells Fargo Securities, LLC (filed herewith). (12)(10.28.1) Master Indenture dated December 19, 2012, between Trinity Rail Leasing 2012 LLC and Wilmington Trust Company, as Indenture Trustee (filed herewith). (10.28.2) Purchase and Contribution Agreement, dated December 19, 2012, among Trinity Rail Leasing Warehouse Trust, Trinity Industries Leasing Company, and Trinity Rail Leasing 2012 LLC (filed herewith). (12) Computation of Ratio of Earnings to Fixed Charges (filed herewith). (21) Listing of subsidiaries of Trinity Industries, Inc. (filed herewith). (23) Consent of Ernst & Young LLP (contained on page 8790 of this document and filed herewith).(31.1) Rule 13a-15(e) and 15d-15(e) Certification of the Chief Executive Officer (filed herewith). (31.2) Rule 13a-15(e) and 15d-15(e) Certification of the Chief Financial Officer (filed herewith). (32.1) Certification pursuant to 18U.S.C. Section 1350, as adopted pursuant to Section 906 of the Sarbanes-Oxley Act of 2002 (filed herewith). (32.2) Certification pursuant to 18U.S.C. Section 1350, as adopted pursuant to Section 906 of the Sarbanes-Oxley Act of 2002 (filed herewith). (95) Mine Safety Disclosure Exhibit (filed herewith). 101.INS XBRL Instance Document (filed electronically herewith) **101.SCH XBRL Taxonomy Extension Schema Document (filed electronically herewith) **101.CAL XBRL Taxonomy Extension Calculation Linkbase Document (filed electronically herewith) **101.LAB XBRL Taxonomy Extension Label Linkbase Document (filed electronically herewith) **101.PRE XBRL Taxonomy Extension Presentation Linkbase Document (filed electronically herewith) **101.DEF XBRL Taxonomy Extension Definition Linkbase Document (filed electronically herewith) **____________* Management contracts and compensatory plan arrangements. **Pursuant to Rule 406T of Regulation S-T, these interactive data files are deemed not filed or part of a registration statement or prospectus for purposes of Section 11 or 12 of the Securities Act of 1933 or Section 18 of the Securities Exchange Act of 1934 and otherwise are not subject to liability.9396