UNITED STATES
SECURITIES AND EXCHANGE COMMISSION
WASHINGTON,
United States
Securities and Exchange Commission
FORM 10-K
[ x ] Annual Report Pursuant to Section 13 or 15(d) of the Securities Exchange Act of 1934
For the fiscal year ended: December 31, 2011
[ ] Transition Report Pursuant to Section 13 or 15(d) of the Securities Exchange Act of 1934
For the transition period from to .
|
|
| [X] Annual Report Pursuant to Section 13 or 15(d) of the Securities Exchange Act of 1934 |
| for the fiscal year ended: December 31, 2014 |
|
|
| [ ] Transition Report Pursuant to Section 13 or 15(d) of the Securities Exchange Act of 1934 |
for the transition period from to . |
Commission File Number:001-34624
UMPQUA HOLDINGS CORPORATIONUmpqua Holdings Corporation (Exact name
(Exact Name of Registrant as
specifiedSpecified in
its charter)Its Charter) |
| |
| OREGON | | 93-1261319 |
(State or Other Jurisdiction
of Incorporation or Organization) | | (I.R.S. Employer Identification Number) |
| of Incorporation or Organization) | |
ONEOne SW COLUMBIA STREET, SUITEColumbia Street, Suite 1200 PORTLAND, OREGON
(Address of
principal executive offices) (zip code)Principal Executive Offices)(Zip Code)
(
Registrant’s telephone number, including area code)Registrant's Telephone Number, Including Area Code)
Securities registered pursuant to Section 12(b) of the Act:
|
| |
Title of each class | | Name of each exchange on which registered |
NONE | |
| Securities registered pursuant to Section 12(g) of the Act: Common Stock |
Securities registered pursuant to Section 12(g) of the Act: Common Stock
Indicate by check mark if the registrant is a well-known seasoned issuer, as defined in Rule 405 of the Securities Act.
Indicate by check mark if the registrant is not required to file reports pursuant to Section 13 or Section 15(d) of the
Act. Yes
Indicate by check mark whether the registrant: (1) has filed all reports required to be filed by Section 13 or 15(d) of the Securities Exchange Act of 1934 during the preceding 12 months (or for such shorter period that the registrant was required to file such reports), and (2) has been subject to such filing requirements for the past 90 days.
Indicate by check mark whether the registrant has submitted electronically and posted on its corporate Web site, if any, every Interactive Data File required to be submitted and posted pursuant to Rule 405 of Regulation S-T (§232.405 of this chapter) during the preceding 12 months (or for such shorter period that the registrant was required to submit and post such files).
Indicate by check mark if disclosure of delinquent filers pursuant to Item 405 of Regulation S-K is not contained herein, and will not be contained, to the best of
registrant’sregistrant's knowledge, in definitive proxy or information statements incorporated by reference in Part III of this Form 10-K or any amendment to this Form 10-K. [ ]
Indicate by check mark whether the registrant is a large accelerated filer, an accelerated filer,
non-accelerated filer, or a
non-accelerated filer.smaller reporting company. See
definitiondefinitions of
“accelerated filer”"large accelerated filer",
“large accelerated filer”"accelerated filer", and
“smaller"smaller reporting
company”company" in Rule 12b-2 of the
Exchange Act.
Check one:[X] Large
Acceleratedaccelerated filer [
x ] Accelerated filer [ ] Non-accelerated filer [ ] Smaller reporting company
[ ] Indicate by check mark whether the registrant is a shell company (as defined in Rule 12b-2 of the Exchange Act). Yes
The aggregate market value of the voting common stock held by non-affiliates of the registrant as of June 30,
2011,2014, based on the closing price on that date of
$11.57$17.92 per share, and
113,403,414171,963,532 shares held was
$1,312,077,500.$3,081,586,493.
Indicate the number of shares outstanding for each of the
issuer’sissuer's classes of common stock, as of the latest practical date:
The number of shares of the
Registrant’sRegistrant's common stock (no par value) outstanding as of January 31,
20122015 was
112,193,401.220,385,190.
DOCUMENTS INCORPORATED BY REFERENCE
Portions of the Proxy Statement for the
20122015 Annual Meeting of Shareholders of Umpqua Holdings Corporation
("Proxy Statement") are incorporated by reference in this Form 10-K in response to Part III, Items 10, 11, 12, 13 and 14.
Umpqua Holdings Corporation
UMPQUA HOLDINGS CORPORATION
FORM 10-K CROSS REFERENCE INDEX
In this Annual Report on Form 10-K, we refer to Umpqua Holdings Corporation as the "Company," "Umpqua," "we," "us," "our," or similar references; to Sterling Financial Corporation as "Sterling"; and to the merger of Sterling with and into Umpqua effective as of April 18, 2014, as the "Sterling merger" or the "Merger." This Annual Report on Form 10-K contains forward-looking statements, within the meaning of Section 27A of the Securities Act of 1933 and Section 21E of the Securities Exchange Act of 1934, which are intended to be covered by the safe harbor for “forward-looking statements”"forward-looking statements" provided by the Private Securities Litigation Reform Act of 1995. These statements may include statements that expressly or implicitly predict future results, performance or events. Statements other than statements of historical fact are forward-looking statements. You can find many of these statements by looking for words such as “anticipates,” “expects,” “believes,” “estimates”"anticipates," "expects," "believes," "estimates" and “intends”"intends" and words or phrases of similar meaning. We make forward-looking statements regarding projected sources of funds, use of proceeds, availability of acquisition and growth opportunities, dividends, adequacy of our allowance for loan and lease losses, reserve for unfunded commitments and provision for loan and lease losses, performance of troubled debt restructurings, our commercial real estate portfolio and subsequent chargeoffs.chargeoffs, our covered loan portfolio and the Federal Deposit Insurance Corporation ("FDIC") indemnification asset, the benefits of the Financial Pacific leasing, Inc. ("FinPac") acquisition, and the merger ("Merger") with Sterling Financial Corporation, the Sterling merger integration, and the impact of Basel III on our capital. Forward-looking statements involve substantial risks and uncertainties, many of which are difficult to predict and are generally beyond our control. There are many factors that could cause actual results to differ materially from those contemplated by these forward-looking statements. Risks and uncertainties that could cause our financial performance to differ materially from our goals, plans, expectations and projections expressed in forward-looking statements include those set forth in our filings with the SEC,Securities and Exchange Commission ("SEC"), Item 1A of this Annual Report on Form 10-K, and the following:
our ability to attract new deposits and loans and leases;
demand for financial services in our market areas;
competitive market pricing factors;
deterioration in economic conditions that could result in increased loan and lease losses;
risks associated with concentrations in real estate related loans;
market interest rate volatility;
compression of our net interest margin;
stability of funding sources and continued availability of borrowings;
changes in legal or regulatory requirements or the results of regulatory examinations that could restrict growth;
our ability to recruit and retain key management and staff;
availability of, and competition for acquisition opportunities;
risks associated with merger and acquisition integration;
significant decline in the market value of the Company that could result in an impairment of goodwill;
our ability to raise capital or incur debt on reasonable terms;
regulatory limits on the Bank's ability to pay dividends to the Company;
the impact of the Dodd-Frank Wall Street Reform and Consumer Protection Act ("Dodd-Frank Act") on the Company's business operations, including the impact of provisions and regulations related to executive compensation;
FDIC deposit insuranceassessments, and interchange fees, which may affect our regulatory compliance costs, interest expense and ability to recruit executives; and
the impact of the new "Basel III" capital rules issued by federal banking regulators in July 2013 ("Basel III Rules") including on the fair value, of our trust preferred securities.
benefits from the Merger may not be fully realized or may take longer to realize than expected, including as a result of changes in general economic and market conditions, interest rates, monetary policy, laws and regulations and their enforcement, and the degree of competition in the geographic and business areas in which we operate;
Merger integration may take longer to accomplish than expected;
the anticipated growth opportunities and cost savings from the Merger may not be fully realized or may take longer to realize than expected;
operating costs, customer losses and business disruption following factors that might cause actual resultsthe Merger and during integration activities, including adverse developments in relationships with employees, may be greater than expected; and
management time and effort will be diverted to
differ materially from those presented: | • | | our ability to attract new deposits and loans and leases;
|
| • | | demand for financial services in our market areas;
|
| • | | competitive market pricing factors;
|
| • | | deterioration in economic conditions that could result in increased loan and lease losses;
|
| • | | risks associated with concentrations in real estate related loans;
|
| • | | market interest rate volatility;
|
| • | | stability of funding sources and continued availability of borrowings;
|
| • | | changes in legal or regulatory requirements or the results of regulatory examinations that could restrict growth;
|
| • | | our ability to recruit and retain key management and staff;
|
| • | | availability of, and competition for, FDIC-assisted and other acquisition opportunities;
|
| • | | risks associated with merger and acquisition integration;
|
| • | | significant decline in the market value of the Company that could result in an impairment of goodwill;
|
| • | | our ability to raise capital or incur debt on reasonable terms;
|
| • | | regulatory limits on the Bank’s ability to pay dividends to the Company;
|
| • | | the impact of the Dodd-Frank Wall Street Reform and Consumer Protection Act (“Dodd-Frank Act”) and related rules and regulations on the Company’s business operations and competitiveness, including the impact of executive compensation restrictions, which may affect the Company’s ability to retain and recruit executives in competition with firms in other industries who do not operate under those restrictions;
|
| • | | the impact of the Dodd-Frank Act on the Company’s interchange fee revenue, interest expense, FDIC deposit insurance assessments and regulatory compliance expenses, which includes a maximum permissible interchange fee that an issuer may receive for an electronic debit transaction, resulting in an approximate 50% decrease in interchange revenue on an average transaction.
|
the resolution of Merger-related issues.
For a more detailed discussion of some of the risk factors, see the section entitled
“Risk Factors”"Risk Factors" below. We do not intend to update any factors, except as required by SEC rules, or to publicly announce revisions to any of our forward-looking statements. Any forward-looking statement speaks only as of the date that such statement was made. You should consider any forward looking statements in light of this explanation, and we caution you about relying on forward-looking statements.
Introduction
Umpqua Holdings Corporation,
Introduction
Umpqua Holdings Corporation (referred to in this report as “we,” “our,” “Umpqua,” and “the Company”), an Oregon corporation, was formed as a bank holding company in March 1999. At that time, we acquired 100% of the outstanding shares of South Umpqua Bank, an Oregon state-chartered bank formed in 1953. We became a financial holding company in March 2000 under the provisions of the Gramm-Leach-Bliley Act.Act of 1999 ("GLB Act"). Umpqua has two principal operating subsidiaries, Umpqua Bank (the “Bank”"Bank") and Umpqua Investments, Inc. (“("Umpqua Investments”Investments"). Prior to July 2009, Umpqua Investments was known as Strand, Atkinson, Williams and York, Inc. (“Strand”).
We file annual reports on Form 10-K, quarterly reports on Form 10-Q, current reports on Form 8-K, proxy statements and other information with the Securities and Exchange Commission (“SEC”).SEC. You may obtain these reports, and any amendments, from the SEC’sSEC's website atwww.sec.gov. You may obtain copies of these reports, and any amendments, through our website atwww.umpquaholdingscorp.com. These reports are available through our website as soon as reasonably practicable after they are filed electronically with the SEC. All of our SEC filings since November 14, 2002 have been made available on our website within two days of filing with the SEC.
General Background
Headquartered
With headquarters located in
Portland,Roseburg, Oregon, Umpqua Bank is considered one of the most innovative community banks in the United States
combiningand has implemented a variety of retail marketing strategies to increase revenue and differentiate itself from its competition. The Bank combines a high touch customer experience with the sophisticated products and expertise of a commercial bank. The Bank
has implemented a variety of retail marketing strategies to increase revenue and differentiate the company from its competition. The Bank provides a wide range of banking, wealth management, mortgage
banking and other financial services to corporate, institutional, and individual customers.
Along with its subsidiaries, theThe Bank
is subject to the regulations of state and federal agencies and undergoes periodic examinations by these regulatory agencies. See “Supervision and Regulation” below for additional information.also has a wholly-owned subsidiary, Financial Pacific Leasing Inc., a commercial equipment leasing company.
Umpqua Investments is a registered broker-dealer and
registered investment advisor with offices in Portland, Lake Oswego, and Medford, Oregon, and
offeredSanta Rosa, California, and also offers products and services through Umpqua Bank stores. The firm is one of the oldest investment companies in the Northwest and is actively engaged in the communities it serves. Umpqua Investments offers a full range of investment products and services including: stocks, fixed income securities (municipal, corporate, and government bonds, CDs, and money market instruments), mutual funds, annuities, options, retirement planning, money management services and life insurance.
Along with its subsidiaries, the Company is subject to the regulations of state and federal agencies and undergoes periodic examinations by these regulatory agencies.
Recent Development
As of the close of business on April 18, 2014, the Company completed its merger with Sterling Financial Corporation, a Washington corporation ("Sterling"). The results of Sterling's operations are included in the Company's financial results beginning April 19, 2014 and the combined company's banking operations are operating under the Umpqua Bank name and brand.
Umpqua
Bank’sBank's principal objective is to become the leading community-oriented financial services retailer throughout the
Pacific NorthwestWestern United States. The merger completed with Sterling in April 2014 expanded into Southern California, Eastern Washington, Eastern Oregon, and
Northern California. We plan to continue the expansion of our market from Seattle to San Francisco, primarily along the I-5 corridor.Idaho markets. We intend to continue to grow our assets and increase profitability and shareholder value by differentiating ourselves from competitors through the following strategies:
Capitalize Onon Innovative Product Delivery System. Our philosophy has been to develop an environment for the customer that makes the banking experience relevant and enjoyable. With this approach in mind, we have developed a unique store concept that offers “one-stop”"one-stop" shopping and includes distinct physical areas or boutiques, such as a “serious"serious about service center,”" an “investment"investment opportunity center”center" and a “computer"computer café,”" which make the Bank’sBank's products and services more tangible and accessible. In 2006, we introduced our “Neighborhood Stores”"Neighborhood Stores" and in 2007, we introduced the Umpqua “Innovation"Innovation Lab.”" In 2010, we introduced the next generation version of our Neighborhood Store in the Capitol Hill area of Seattle, Washington. In 2013, we introduced the next generation of our flagship store in San Francisco. We are continuing to remodel existing and acquired stores in metropolitan locations to further our retail vision and have a consistent brand experience.
Deliver Superior Quality Service. We insist on quality service as an integral part of our culture, from the Board of Directors to our new salesnewest associates, and believe we are among the first banks to introduce a measurable quality service program. Under our “return"return on quality”quality" program, the performance of each sales associate and store iswas evaluated monthly based on specific measurable factors such as the “sales"sales effectiveness ratio”ratio" that totals the average number of banking products purchased by each new customer. The evaluations also encompass factors such as the number of new loan and deposit accounts generated in each store, reports by incognito “mystery shoppers”"mystery shoppers" and customer surveys. Based on scores achieved, Umpqua’s “returnUmpqua's "return onquality” quality" program rewards both individual sales associates and store teams with financial incentives. Through such programs, we are able to measure the quality of service provided to our customers and maintain employee focus on quality customer service.
Establish Strong Brand Awareness. As a financial services retailer, we devote considerable resources to developing the “Umpqua Bank”"Umpqua Bank" brand. This is done through design strategy, marketing, merchandising, community based events, and delivery through our customer facing channels. From Bank branded bags of custom roasted coffee beans and chocolate coins with each transaction, to educational seminars and three Umpqua-branded ice cream trucks, Umpqua’sUmpqua's goal is to engage our customer with the brand in a whole new way. The unique look and feel of our stores and interactive displays help position us as an innovative, customer-friendly retailer of financial products and services. We build consumer preference for our products and services through strong brand awareness. Use Technology to Expand Customer Base. Although our strategy continues to emphasize superior personal service, as consumer preferences evolve we continue to expand user-friendly, technology-based systems to attract customers who want to interact with their financial institution electronically. We offer technology-based services including remote deposit capture, online banking, bill pay and treasury services, mobile banking, voice response banking, automatic payroll deposit programs, advanced function ATMs, interactive product kiosks, and a robust internet web site. We believe the availability of both traditional bank services and electronic banking services enhances our ability to attract a broader range of customers and wrap our value proposition across all channels. Increase Market Share in Existing Markets and Expand Into New Markets. As a result of our innovative retail product orientation, measurable quality service program and strong brand awareness, we believe that there is significant potential to increase business with current customers, to attract new customers in our existing markets and to enter new markets. Pursue Strategic Acquisitions. A part of our strategy in this economic environment is to pursue the acquisition of banks within orand financial services companies in proximity to our geographic footprint that may be operating under capital constraints, regulatory pressure or other competitive disadvantages. We also consider the acquisition of certain failing banks that the FDIC makes available for bid, and that meet our strategic objectives. Failed bank transactions are attractive opportunities becausemarkets where we can acquire loans subject to a loss share agreement with the FDIC, or at a significant discount, that limits our downside risk on the purchased loan portfolio and, apart from our assumption of deposit liabilities, we have significant discretion as to the non-deposit liabilities that we assume. Assets purchased from the FDIC are marked to their fair value. We have completed four FDIC-assisted transactions since January 1, 2009.see growth potential. Our goal of increasing our share of financial services in our market areas is driven by a marketing and sales strategy with the following key components:
Media Advertising. Our comprehensive marketing campaigns aim to strengthen the Umpqua Bank brand and heighten public awareness about our innovative delivery of financial products and services. The Bank has been recognized nationally for its use of new media and unique approach. From programs like Umpqua’sthe Bank's Discover Local Music Project and ice cream trucks, to campaigns like “SaveSave Hard Spend Smart”Smart and the “Lemonaire,”Lemonaire, Umpqua is utilizing nontraditional media channels and leveraging mass market media in new ways. In 2005 Umpqua dubbed the term “hand-shake marketing” to describe the Company’s fresh approach to localized marketing. Retail Store Concept. As a financial services provider, we believe that the store environment is critical to successfully market and sell products and services. Retailers traditionally have displayed merchandise within their stores in a manner designed to encourage customers to purchase their products. Purchases are made on the spur of the moment due to the products’products' availability and attractiveness. Umpqua Bank believes this same concept can be applied to financial institutions and accordingly displays financial services and products through tactile merchandising within our stores. Unlike many financial institutions whose strategy is to discourage customers from visiting their facilities in favor of ATMs or other forms of electronic banking, we encourage customers to visit our stores, where they are greeted by well-trained sales associates and encouraged to browse and to make “impulse"impulse purchases.”" Our “Next Generation”"Next Generation" store model includes features like free wireless, free use of laptop computers, openingopen rooms with refrigerated beverages and innovative products packaging like MainStreet for businesses –- aUmpqua Holdings Corporation
package that includes relationship pricing for deposit and loan products, and invitation to “Business Therapy”"Business Therapy" seminars. The stores host a variety of after-hours events, from poetry readings to seminars on how to build an art collection. To bring financial services to our customers in a cost-effective way, we introduced “Neighborhood"Neighborhood Stores.”" We build these stores in established neighborhoods and design them to be neighborhood hubs. These stand-alone full-service stores are smaller and emphasize advanced technology. To strengthen brand recognition, all Neighborhood Stores are similar in appearance. Umpqua’s “Innovation Lab”Umpqua's "Innovation Lab" is a one-of-a-kind location, showcasing emerging and existing technologies that foster community and redefine what consumers can expect from a banking experience. As a testing ground for new initiatives, the Lab"Innovation Lab" will change regularly to feature new technology, products, services and community events.
In 2013, Umpqua Bank launched our flagship store in San Francisco which received international recognition as the Retail Design Institutes 2013 Store of the Year award.
Service Culture. Umpqua believes We believe strongly that if we lead with a service culture, we will have more opportunity to sell our products and services and to create deeper customer relationships across all divisions, from retail to mortgage and commercial. Although a successful marketing program will attract customers to visit, a service environment and a well-trained sales team are critical to selling our products and services. We believe that our service culture has become well established throughout the organization due to our unique facility designs and ongoing training of our associates on all aspects of sales and service. We provide training at our in-house training facility, known as “The World’s"The World's Greatest Bank University,”" to recognize and celebrate exceptional service, and pay commissions for the sale of the Bank’sBank's products and services. This service culture has helped transform us from a traditional community bank to a nationally recognized marketing company focused on selling financial products and services. We offer a full array of financial products to meet the banking needs of our market area and target customers. To ensure the ongoing viability of our product offerings, we regularly examine the desirability and profitability of existing and potential new products. To make it easy for new prospective customers to bank with us and access our products, we offer a
“Switch"Switch Kit,
”" which allows a customer to open a primary checking account with Umpqua Bank in less than ten minutes. Other avenues through which customers can access our products include our web site equipped with an e-switchkit which includes internet banking through
“umpqua.online,”"umpqua.online," mobile banking, and our 24-hour telephone voice response system.
Deposit Products. We offer a traditional array of deposit products, including non-interest bearing checking accounts, interest bearing checking and savings accounts, money market accounts and certificates of deposit. These accounts earn interest at rates established by management based on competitive market factors and management’smanagement's desire to increase certain types or maturities of deposit liabilities. Our approach is to tailor fit products and bundle those that meet the customer’scustomer's needs. This approach addsis designed to add value for the customer, increasesincrease products per household and produces higher servicegenerate related fee income. We also offer a senior checking product which is augmented by Club Carefree, a group that enjoys travel, purchase discounts, and topical seminars.During the economic downturn, Umpqua opted to increase FDIC insurance coverage for our customers, providing greater peace of mind during these difficult times. In addition, the Company has an agreement with Promontory Interfinancial Network that makes it possible to offer FDIC insurance to depositors in excess of the current deposit limits. This Certificate of Deposit Account Registry Service (“CDARS”) uses a deposit-matching program to distribute excess deposit balances across other participating banks. This product is designed to enhance our ability to attract and retain customers and increase deposits, by providing additional FDIC coverage to customers. Due to the nature of the placement of the funds, CDARS deposits are classified as “brokered deposits” by regulatory agencies.
Private Bank. Umpqua Private Bank serves high net worth individuals with liquid investable assets by providing customized financial solutions and offerings. The private bank is designed to augment Umpqua’sUmpqua's existing high-touch customer experience, and works collaboratively with the Bank’sBank's affiliate retail brokerage Umpqua Investments and with the independent capitalinvestment management firm Ferguson Wellman Capital Management, Inc. ("Ferguson Wellman") to offer a comprehensive, integrated approach that meets clients’clients' financial goals, including financial planning, trust services, and investments. Retail Brokerage Services and Investment Advisory Services. Umpqua Investments providesin its combined role as a broker/dealer and a registered investment advisor may provide comprehensive financial planning advice to its clients as well as standard broker/dealer services for traditional brokerage accounts. This advice can include cash management, risk management (insurance planning/sales), investment planning (including investment advice, supervisory services and/or portfolio checkups), retirement planning (for employees and employers), and/or estate planning. The broker/dealer side of Umpqua Investments offers a full range of brokerage services including equity and fixed income products, mutual funds, annuities, options retirement planning and money management services. Additionally, UmpquaInvestments offers life insurance.insurance products. At December 31, 2011,2014, Umpqua Investments had 41has 42 Series 7-licensed financial advisors serving clients at threefour stand-alone retail brokerage offices, one location located within a retirement facility, and “Investment"Investment Opportunity Centers”Centers" located in many Bank stores.
Asset Management Services. Umpqua entered into a strategic alliance with Ferguson Wellman in the fall of 2009 to further enhance our offerings to individuals, unionsCommercial Loans and corporate retirement plans, endowments and foundations.Commercial LoansLeases and Commercial Real Estate Loans. We offer specialized loans for business and commercial customers, including accounts receivable and inventory financing, multi-family loans, equipment loans, commercial equipment leases, international trade, real estate construction loans and permanent financing and SBASmall Business Administration ("SBA") program financing as well as capital markets and treasury management services. Additionally, we offer specially designed loan products for small businesses through our Small Business Lending Center, and have recently introduced a new business banking division to increase lending to small and mid-sized businesses. Ongoing credit management activities continue to focus on commercial real estate loans given this is a significant portion of our loan portfolio. We are also engaged in initiatives that continue to diversify the loan portfolio including a strong focus on commercial and industrial loans in addition to financing owner-occupied properties.
Residential Real Estate Loans. Real estate loans are available for construction, purchase, and refinancing of residential owner-occupied and rental properties. Borrowers can choose from a variety of fixed and adjustable rate options and terms. We sell most residential real estate loans that we originate into the secondary market. Servicing is retained on the majority of these loans. We also support the Home Affordable Refinance Program and Home Affordable Modification Program. Consumer Loans. We provide loans to individual borrowers for a variety of purposes, including secured and unsecured personal loans, home equity and personal lines of credit and motor vehicle loans. Loans may be made directly to borrowers or through Umpqua's dealer banking department.
Market Area and Competition
The geographic markets we serve are highly competitive for deposits, loans, leases and retail brokerage services. We compete with traditional banking institutions, as well as non-bank financial service providers, such as credit unions, brokerage firms and mortgage companies. In our primary market areas of Oregon,
Western Washington,
Northern California,
Idaho, and Nevada, major banks and large regional banks generally hold dominant market share positions. By virtue of their larger capital bases, these institutions have significantly larger lending limits than we do and generally have more expansive branch networks. Competition also includes other commercial banks that are community-focused.
As the industry becomes increasingly dependent on and oriented toward technology-driven delivery systems, permitting transactions to be conducted by telephone, computer and the internet, non-bank institutions are able to attract funds and provide lending and other financial services even without offices located in our primary service area. Some insurance companies and brokerage firms compete for deposits by offering rates that are higher than may be appropriate for the Bank in relation to its asset and liability management objectives. However, we offer a wide array of deposit products and believe we can compete effectively through rate-driven product promotions. We also compete with full service investment firms for non-bank financial products and services offered by Umpqua Investments.
Credit unions present a significant competitive challenge for our banking services and products. As credit unions currently enjoy an exemption from income tax, they are able to offer higher deposit rates and lower loan rates than we can on a comparable basis. Credit unions are also not currently subject to certain regulatory constraints, such as the Community Reinvestment Act
("CRA"), which, among other things, requires us to implement procedures to make and monitor loans throughout the communities we serve. Adhering to such regulatory requirements raises the costs associated with our lending activities, and reduces potential operating profits. Accordingly, we seek to compete by focusing on building customer relationships, providing superior service and offering a wide variety of commercial banking products,
that do not compete directly with products and services typically offered by the credit unions, such as commercial real estate loans, inventory and accounts receivable financing, and SBA program loans for qualified businesses.
Many of our stores are located in markets that have historically experienced growth below statewide averages.
During the past several years, the States of Oregon, California, Washington,
Idaho, and Nevada have experienced economic difficulties. To the extent
Umpqua Holdings Corporation
the fiscal condition of state and local governments does not improve, there could be an adverse effect on business conditions in the affected state that would negatively impact the prospects for the Bank’sBank's operations located there.
The current adverse economic conditions, driven by the U.S. recession, the housing market downturn, and declining real estate values in our markets, have negatively impacted aspects of our loan portfolio and the markets we serve. Continued deterioration in the real estate market or other segments of our loan portfolio could further negatively impact our operations in these markets, financial condition and results of operations.
The following table presents the
Bank’sBank's market share percentage for total deposits as of June 30,
2011,2014, in each county where we have operations. The table also indicates the ranking by deposit size in each market. All information in the table was obtained from SNL Financial,
of Charlottesville, Virginia, which compiles deposit data published by the FDIC as of June 30,
20112014 and updates the information for any bank mergers and acquisitions completed subsequent to the reporting date.
| | | | | | | | | | | | |
| Oregon | |
| County | | Market
Share | | | Market
Rank | | | Number
of Stores | |
Benton | | | 7.3% | | | | 7 | | | | 1 | |
Clackamas | | | 4.6% | | | | 7 | | | | 5 | |
Coos | | | 39.6% | | | | 1 | | | | 5 | |
Curry | | | 27.6% | | | | 2 | | | | 1 | |
Deschutes | | | 4.7% | | | | 8 | | | | 5 | |
Douglas | | | 60.2% | | | | 1 | | | | 9 | |
Jackson | | | 16.7% | | | | 1 | | | | 9 | |
Josephine | | | 18.3% | | | | 1 | | | | 5 | |
Lane | | | 17.8% | | | | 1 | | | | 9 | |
Lincoln | | | 12.1% | | | | 4 | | | | 2 | |
Linn | | | 12.7% | | | | 4 | | | | 3 | |
Marion | | | 8.4% | | | | 5 | | | | 3 | |
Multnomah | | | 3.3% | | | | 6 | | | | 16 | |
Washington | | | 4.1% | | | | 9 | | | | 4 | |
| | | | | | | | | | | | |
| California | |
| County | | Market
Share | | | Market
Rank | | | Number
of Stores | |
Amador | | | 5.6 | % | | | 7 | | | | 1 | |
Butte | | | 3.3 | % | | | 8 | | | | 2 | |
Calaveras | | | 23.7 | % | | | 2 | | | | 4 | |
Colusa | | | 35.7 | % | | | 1 | | | | 2 | |
Contra Costa | | | 0.2 | % | | | 24 | | | | 2 | |
El Dorado | | | 7.9 | % | | | 4 | | | | 5 | |
Glenn | | | 27.7 | % | | | 3 | | | | 2 | |
Humboldt | | | 25.1 | % | | | 1 | | | | 7 | |
Lake | | | 16.4 | % | | | 3 | | | | 2 | |
Mendocino | | | 3.3 | % | | | 7 | | | | 1 | |
Napa | | | 12.4 | % | | | 3 | | | | 7 | |
Placer | | | 6.7 | % | | | 3 | | | | 9 | |
Sacramento | | | 1.1 | % | | | 15 | | | | 6 | |
San Joaquin | | | 0.6 | % | | | 20 | | | | 1 | |
Shasta | | | 2.8 | % | | | 8 | | | | 1 | |
Solano | | | 4.0 | % | | | 9 | | | | 4 | |
Sonoma | | | 0.1 | % | | | 20 | | | | 1 | |
Stanislaus | | | 0.9 | % | | | 15 | | | | 2 | |
Sutter | | | 15.7 | % | | | 2 | | | | 2 | |
Tehama | | | 16.9 | % | | | 1 | | | | 2 | |
Trinity | | | 26.1 | % | | | 2 | | | | 1 | |
Tuolumne | | | 18.7 | % | | | 3 | | | | 5 | |
Yolo | | | 2.8 | % | | | 10 | | | | 1 | |
Yuba | | | 24.4 | % | | | 2 | | | | 2 | |
|
| Washington | |
| County | | Market
Share | | | Market
Rank | | | Number
of Stores | |
Clark | | | 8.4 | % | | | 7 | | | | 5 | |
King | | | 0.5 | % | | | 21 | | | | 10 | |
Pierce | | | 4.2 | % | | | 7 | | | | 11 | |
Snohomish | | | 0.8 | % | | | 21 | | | | 1 | |
|
| Nevada | |
| County | | Market
Share | | | Market
Rank | | | Number
of Stores | |
Washoe | | | 0.6 | % | | | 7 | | | | 4 | |
|
| | | | | | | | | | | | | | |
| Oregon | | Washington |
| | Market | Market | Number | | | Market | Market | Number |
| County | Share | Rank | of Stores | | County | Share | Rank | of Stores |
| Baker | 31.9 | % | 1 |
| 1 |
| | Adams | 20.86 | % | 3 |
| 2 |
|
| Benton | 7.4 | % | 7 |
| 2 |
| | Asotin | 17.23 | % | 2 |
| 2 |
|
| Clackamas | 2.3 | % | 9 |
| 6 |
| | Benton | 4.78 | % | 8 |
| 2 |
|
| Columbia | 15.8 | % | 3 |
| 1 |
| | Clallam | 3.64 | % | 10 |
| 2 |
|
| Coos | 37.8 | % | 1 |
| 5 |
| | Clark | 17.66 | % | 2 |
| 13 |
|
| Curry | 47.2 | % | 1 |
| 4 |
| | Columbia | 27.65 | % | 2 |
| 1 |
|
| Deschutes | 7.7 | % | 6 |
| 8 |
| | Douglas | 12.62 | % | 3 |
| 1 |
|
| Douglas | 64.2 | % | 1 |
| 9 |
| | Franklin | 4.87 | % | 9 |
| 1 |
|
| Grant | 21.4 | % | 3 |
| 1 |
| | Garfield | 58.08 | % | 1 |
| 1 |
|
| Harney | 23.2 | % | 3 |
| 1 |
| | Grant | 7.81 | % | 7 |
| 2 |
|
| Jackson | 18.3 | % | 1 |
| 11 |
| | Grays Harbor | 9.51 | % | 4 |
| 3 |
|
| Josephine | 21.2 | % | 1 |
| 5 |
| | King | 2.6 | % | 8 |
| 26 |
|
| Klamath | 27.0 | % | 2 |
| 5 |
| | Kitsap | 0.81 | % | 14 |
| 1 |
|
| Lake | 27.8 | % | 3 |
| 1 |
| | Kittitas | 12.06 | % | 4 |
| 2 |
|
| Lane | 16.1 | % | 2 |
| 10 |
| | Klickitat | 34.22 | % | 1 |
| 2 |
|
| Lincoln | 7.1 | % | 7 |
| 2 |
| | Lewis | 15.83 | % | 2 |
| 4 |
|
| Linn | 12.1 | % | 5 |
| 3 |
| | Okanogan | 22.92 | % | 2 |
| 2 |
|
| Malheur | 23.3 | % | 2 |
| 3 |
| | Pierce | 4.19 | % | 8 |
| 12 |
|
| Marion | 8.6 | % | 5 |
| 4 |
| | Skamania | 61.72 | % | 1 |
| 1 |
|
| Multnomah | 4.6 | % | 6 |
| 20 |
| | Snohomish | 1.58 | % | 13 |
| 2 |
|
| Polk | 6.2 | % | 7 |
| 1 |
| | Spokane | 11.8 | % | 4 |
| 9 |
|
| Tillamook | 32.0 | % | 2 |
| 2 |
| | Thurston | 3.73 | % | 11 |
| 4 |
|
| Umatilla | 5.2 | % | 7 |
| 2 |
| | Walla Walla | 4.01 | % | 5 |
| 2 |
|
| Union | 24.5 | % | 1 |
| 3 |
| | Whatcom | 2.43 | % | 12 |
| 4 |
|
| Wallowa | 24.1 | % | 2 |
| 1 |
| | Whitman | 5.46 | % | 7 |
| 3 |
|
| Washington | 6.8 | % | 6 |
| 8 |
| | | | | |
| Yamhill | 2.4 | % | 9 |
| 1 |
| | | | | |
|
| | | | | | | | | | | | | | |
| California | | Idaho |
| | Market | Market | Number | | | Market | Market | Number |
| County | Share | Rank | of Stores | | County | Share | Rank | of Stores |
| Amador | 4.4 | % | 7 |
| 1 |
| | Ada | 0.6 | % | 17 |
| 2 |
|
| Butte | 2.7 | % | 10 |
| 2 |
| | Adams | 34.7 | % | 2 |
| 1 |
|
| Calaveras | 26.4 | % | 2 |
| 4 |
| | Benewah | 17.1 | % | 4 |
| 1 |
|
| Colusa | 38.7 | % | 1 |
| 2 |
| | Idaho | 47.9 | % | 1 |
| 3 |
|
| Contra Costa | 0.6 | % | 16 |
| 3 |
| | Kootenai | 2.9 | % | 10 |
| 3 |
|
| El Dorado | 6.3 | % | 5 |
| 5 |
| | Latah | 25.7 | % | 2 |
| 3 |
|
| Glenn | 29.0 | % | 2 |
| 2 |
| | Nez Perce | 15.8 | % | 3 |
| 2 |
|
| Humboldt | 23.0 | % | 1 |
| 7 |
| | Valley | 23.2 | % | 3 |
| 2 |
|
| Lake | 17.9 | % | 2 |
| 2 |
| | | | | |
| Los Angeles | 0.0 | % | 86 |
| 2 |
| | Nevada |
| Marin | 2.0 | % | 12 |
| 2 |
| | Washoe | 0.2 | % | 8 |
| 4 |
|
| Mendocino | 3.0 | % | 7 |
| 1 |
| | | | | |
| Napa | 9.0 | % | 4 |
| 6 |
| | | | | |
| Orange | 0.2 | % | 39 |
| 1 |
| | | | | |
| Placer | 4.7 | % | 6 |
| 9 |
| | | | | |
| Sacramento | 0.7 | % | 19 |
| 6 |
| | | | | |
| San Diego | 0.1 | % | 35 |
| 3 |
| | | | | |
| San Francisco | 0.0 | % | 41 |
| 2 |
| | | | | |
| San Joaquin | 0.5 | % | 18 |
| 1 |
| | | | | |
| San Luis Obispo | 0.2 | % | 12 |
| 1 |
| | | | | |
| Santa Clara | 0.0 | % | 43 |
| 1 |
| | | | | |
| Shasta | 1.7 | % | 9 |
| 1 |
| | | | | |
| Solano | 3.2 | % | 8 |
| 4 |
| | | | | |
| Sonoma | 5.4 | % | 7 |
| 10 |
| | | | | |
| Stanislaus | 0.7 | % | 16 |
| 2 |
| | | | | |
| Sutter | 12.7 | % | 2 |
| 2 |
| | | | | |
| Tehama | 17.2 | % | 1 |
| 2 |
| | | | | |
| Trinity | 27.2 | % | 2 |
| 1 |
| | | | | |
| Tuolumne | 14.9 | % | 3 |
| 5 |
| | | | | |
| Ventura | 0.0 | % | 25 |
| 1 |
| | | | | |
| Yolo | 2.3 | % | 12 |
| 1 |
| | | | | |
| Yuba | 27.2 | % | 2 |
| 2 |
| | | | | |
Lending and Credit Functions
The Bank makes both secured and unsecured loans to individuals and businesses. At December 31, 2011,2014, commercial real estate, commercial, residential, and consumer and other represented approximately 64%58.1%, 25%19.2%, 10%20.2%, and 1%2.5%, respectively, of the total non-covered loan and lease portfolio. Inter-agency guidelines adopted by federal bank regulators mandate that financial institutions establish real estate lending policies with maximum allowable real estate loan-to-value limits, subject to an allowable amount of non-conforming loans as a percentage of capital. We have adopted as loan policy loan-to-value limits that range from 5% to 10% less than the federal guidelines for each category; however, policy exceptions are permitted for real estate loan customers with strong financial credentials.
Loans andLeases
We manage asset quality and control credit risk through diversification of the loan and lease portfolio and the application of policies designed to promote sound underwriting and loan and lease monitoring practices. The Bank's Credit Quality Group is charged with monitoring asset quality, establishing credit policies and procedures and enforcing the consistent application of these policies and procedures across the Bank. The provision for loan and lease losses charged to earnings is based upon management's judgment of the amount necessary to maintain the allowance at a level adequate to absorb probable incurred losses. The amount of provision charged is dependent upon many factors, including loan and lease growth, net charge-offs, changes in the composition of the loan and lease portfolio, delinquencies, management's assessment of loan and lease portfolio quality, general economic conditions that can impact the value of collateral, and other trends. The evaluation of these factors is performed through an analysis of the adequacy of the allowance for loan and lease losses. Reviews of non-performing, past due loans and leases and larger credits, designed to identify potential charges to the allowance for loan and lease losses, and to determine the adequacy of the allowance, are conducted on a quarterly basis. These reviews consider such factors as the financial strength of borrowers, the value of the applicable collateral, loan and lease loss experience, estimated loan and lease losses, growth in the loan and lease portfolio, prevailing economic conditions and other factors.
A loan is considered impaired when, based on current information and events, we determine it is probable that we will not be able to collect all amounts due according to the loan contract, including scheduled interest payments. Generally, when loans are identified as impaired they are moved to our Special Assets Department. When we identify a loan as impaired, we measure the loan for potential impairment using discount cash flows, except when the sole remaining source of the repayment for the loan is the liquidation of the collateral. In these cases, we will use the current fair value of collateral, less selling costs. The starting point for determining the fair value of collateral is through obtaining a current external appraisal. Generally, external appraisals for collateral dependent loans are updated every 12 months. We obtain appraisals from a pre-approved list of independent, third party, local appraisal firms. Upon receipt and review, an external appraisal is utilized to measure a loan for potential impairment. Our impairment analysis documents the date of the appraisal used in the analysis, whether the officer preparing the report deems it current, and, if not, allows for internal valuation adjustments with justification. Typical justified adjustments might include discounts for continued market deterioration subsequent to appraisal date, adjustments for the release of collateral contemplated in the appraisal, or the value of other collateral or consideration not contemplated in the appraisal. An appraisal over one year old in most cases will be considered stale dated and an updated or new appraisal will be required. Any adjustments from appraised value to net realizable value are detailed and justified in the impairment analysis, which is reviewed and approved by senior credit quality officers and the Bank's ALLL Committee. Although an external appraisal is the primary source to value collateral dependent loans, we may also utilize values obtained through purchase and sale agreements, negotiated short sales, broker price opinions, or the sales price of the note. These alternative sources of value are used only if deemed to be more representative of value based on updated information regarding collateral resolution. Impairment analyses are updated, reviewed and approved on a quarterly basis at or near the end of each reporting period. Appraisals or other alternative sources of value received subsequent to the reporting period, but prior to our filing of periodic reports, are considered and evaluated to ensure our periodic filings are materially correct and not misleading. Based on these processes, we do not believe there are significant time lapses for the recognition of additional loan loss provisions or charge-offs from the date they become known.
Loans and leases are classified as non-accrual when collection of principal or interest is doubtful—generally if they are past due as to maturity or payment of principal or interest by 90 days or more—unless such loans and leases are well-secured and in the process of collection. Additionally, all loans that are impaired are considered for non-accrual status. Loans and leases placed on non-accrual will typically remain on non-accrual status until all principal and interest payments are brought current and the prospects for future payments in accordance with the loan or lease agreement appear relatively certain.
Upon acquisition of real estate collateral, typically through the foreclosure process, we promptly begin to market the property for sale. If we do not begin to receive offers or indications of interest we will analyze the price and review market conditions to assess whether a lower price reflects the market value of the property and would enable us to sell the property. In addition, we update appraisals on other real estate owned property six to 12 months after the most recent appraisal. Increases in valuation adjustments recorded in a period are primarily based on a) updated appraisals received during the period, or b) management's authorization to reduce the selling price of the property during the period. Unless a current appraisal is available, an appraisal will be ordered prior to a loan moving to other real estate owned. Foreclosed properties held as other real estate owned are recorded at the lower of the recorded investment in the loan (prior to foreclosure) or the fair market value of the property less expected selling costs.
Loans are reported as restructured when the Bank grants a more than insignificant concession(s) to a borrower experiencing financial difficulties that it would not otherwise consider. Examples of such concessions include a reduction in the loan rate, forgiveness of principal or accrued interest, extending the maturity date(s) or providing a lower interest rate than would be normally available for a transaction of similar risk. As a result of these concessions, restructured loans are impaired as the Bank will not collect all amounts due, both principal and interest, in accordance with the terms of the original loan agreement. Impairment reserves on non-collateral dependent restructured loans are measured by comparing the present value of expected future cash flows on the restructured loans discounted at the interest rate of the original loan agreement to the loan's carrying value. These impairment reserves are recognized as a specific component to be provided for in the allowance for loan and lease losses.
Employees
As of December 31, 2014, we had a total of 4,569 full-time equivalent employees. None of the employees are subject to a collective bargaining agreement and management believes its relations with employees to be good. Information regarding employment agreements with our executive officers is contained in Item 11 below, which item is incorporated by reference to our proxy statement for the 2015 annual meeting of shareholders.
Government Policies
The operations of our subsidiaries are affected by state and federal legislative and regulatory changes and by policies of various regulatory authorities, including, domestic monetary policies of the Board of Governors of the Federal Reserve System ("Federal Reserve"), United States fiscal policy, and capital adequacy and liquidity constraints imposed by federal and state regulatory agencies.
Supervision and Regulation
General. We are extensively regulated under federal and state law. These laws and regulations are generally intended to protect depositors and customers, not shareholders. To the extent that the following information describes statutory or regulatory provisions, it is qualified in its entirety by reference to the particular statute or regulation. Any change in applicable laws or regulations may have a material effect on our business and prospects. We cannot accurately predict the nature or the extent of the effects on our business and earnings that fiscal or monetary policies, or new federal or state legislation or regulation may have in the future. Umpqua is subject to the disclosure and other requirements of the Securities Act of 1933, as amended, and the Securities Exchange Act of 1934, as amended, and rules promulgated thereunder and administered by the Securities and Exchange Commission. As a listed company on NASDAQ, Umpqua is subject to NASDAQ rules for listed companies.
Holding Company Regulation. We are a registered financial holding company under the GLB Act, and are subject to the supervision of, and regulation by the Federal Reserve. As a financial holding company, we are examined by and file reports with the Federal Reserve. The Federal Reserve expects a bank holding company to serve as a source of financial and managerial strength to its subsidiary bank and, under appropriate circumstances, to commit resources to support the subsidiary bank.
Financial holding companies are bank holding companies that satisfy certain criteria and are permitted to engage in activities that traditional bank holding companies are not. The qualifications and permitted activities of financial holdings companies are described below under "Regulatory Structure of the Financial Services Industry."
Federal and State Bank Regulation. Umpqua Bank, as a state chartered bank with deposits insured by the FDIC, is primarily subject to the supervision and regulation of the Oregon Department of Consumer and Business Services Division of Finance and Corporate Securities ("DCBS"), the Washington Department of Financial Institutions ("DFI"), the California Department of Business Oversight ("DBO"), the Idaho Department of Finance Banking Section, the Nevada Division of Financial Institutions, the FDIC and the Consumer Financial Protection Bureau ("CFPB"). These agencies may prohibit the Bank from engaging in what they believe constitute unsafe or unsound banking practices. Our primary state regulator, DCBS, regularly examines the Bank or participates in joint examinations with the FDIC.
The CRA requires that, in connection with examinations of financial institutions within its jurisdiction, the FDIC evaluate the record of the financial institutions in meeting the credit needs of their local communities, including low- and moderate-income neighborhoods, consistent with the safe and sound operation of those institutions. These factors are also considered in evaluating mergers, acquisitions and applications to open a branch or new facility. A less than "Satisfactory" rating would result in the suspension of any growth of the Bank through acquisitions or opening de novo branches until the rating is improved. As of the most recent CRA examination, the Bank's CRA rating was "Satisfactory."
Banks are also subject to certain restrictions imposed by the Federal Reserve Act on extensions of credit to executive officers, directors, principal shareholders or any related interest of such persons. Extensions of credit must be made on substantially the same terms, including interest rates and collateral as, and follow credit underwriting procedures that are not less stringent than, those prevailing at the time for comparable transactions with persons not affiliated with the bank, and must not involve more than the normal risk of repayment or present other unfavorable features. Banks are also subject to certain lending limits and restrictions on overdrafts to such persons. A violation of these restrictions may result in the assessment of substantial civil monetary penalties on the affected bank or any officer, director, employee, agent or other person participating in the conduct of the affairs of that bank, the imposition of a cease and desist order, and other regulatory sanctions.
The Federal Reserve Act and related Regulation W limit the amount of certain loan and investment transactions between the Bank and its affiliates, require certain levels of collateral for such loans, and limit the amount of advances to third parties that may be collateralized by the securities of Umpqua or its subsidiaries. Regulation W requires that certain transactions between the Bank and its affiliates be on terms substantially the same, or at least as favorable to the Bank, as those prevailing at the time for comparable transactions with or involving nonaffiliated companies or, in the absence of comparable transactions, on terms and under circumstances, including credit standards, that in good faith would be offered to or would apply to nonaffiliated companies. Umpqua and its subsidiaries have adopted an Affiliate Transactions Policy and have entered into various affiliate agreements in compliance with Regulation W.
The Federal Reserve and the FDIC have adopted non-capital safety and soundness standards for institutions. These standards cover internal controls, information and internal audit systems, loan documentation, credit underwriting, interest rate exposure, asset growth, compensation, fees and benefits, and standards for asset quality, earnings and stock valuation. An institution that fails to meet these standards must develop a plan acceptable to the agency, specifying the steps that it will take to meet the standards. Failure to submit or implement such a plan may subject the institution to regulatory sanctions. We believe that the Bank is in compliance with these standards.
Federal Deposit Insurance. Substantially all deposits with Umpqua Bank are insured up to applicable limits by the Deposit Insurance Fund ("DIF") of the FDIC and are subject to deposit insurance assessments to maintain the DIF.
In October 2010, the FDIC adopted a new DIF restoration plan to ensure that the fund reserve ratio reaches 1.35% by September 30, 2020, as required by the Dodd-Frank Act. At least semi-annually, the FDIC will update its loss and income projections for the DIF and, if needed, increase or decrease assessment rates.
On February 7, 2011, the FDIC adopted a final rule modifying the risk-based assessment system from a domestic deposit base to a scorecard based assessment system, effective April 1, 2011. As of April 1, 2011, the Bank was categorized as a large institution as the Bank has more than $10 billion in assets. The initial base assessment rates range from 5 to 35 basis points. After potential adjustments related to unsecured debt and brokered deposit balances, the final total assessment rates range from 2.5 to 45 basis points. Initial base assessment rates for large institutions ranged from 5 to 35 basis points. The Bank's assessment rate for 2014 fell at the low end of this range. Further increases in the assessment rate could have a material adverse effect on our earnings, depending upon the amount of the increase.
The Dodd-Frank Wall Street Reform and Consumer Protection Act permanently raised the standard maximum federal deposit insurance amount from $100,000 to $250,000 per qualified account.
The FDIC may terminate the deposit insurance of any insured depository institution if it determines that the institution has engaged in or is engaging in unsafe and unsound banking practices, is in an unsafe or unsound condition or has violated any applicable law, regulation or order or any condition imposed in writing by, or pursuant to, any written agreement with the FDIC. The termination of deposit insurance for the Bank would have a material adverse effect on our financial condition and results of operations.
Dividends. Under the Oregon Bank Act and the Federal Deposit Insurance Corporation Improvement Act of 1991 ("FDICIA"), the Bank is subject to restrictions on the payment of cash dividends to its parent company. A bank may not pay cash dividends if that payment would reduce the amount of its capital below that necessary to meet minimum applicable regulatory capital requirements. In addition, under the Oregon Bank Act, the amount of the dividend paid by the Bank may not be greater than net unreserved retained earnings, after first deducting to the extent not already charged against earnings or reflected in a reserve, all bad debts, which are debts on which interest is unpaid and past due at least six months unless the debt is fully secured and in the process of collection; all other assets charged-off as required by Oregon bank regulators or a state or federal examiner; and all accrued expenses, interest and taxes of the Bank. In addition, state and federal regulatory authorities are authorized to prohibit banks and holding companies from paying dividends that would constitute an unsafe or unsound banking practice. The Federal Reserve has issued a policy statement on the payment of cash dividends by bank holding companies, which expresses the Federal Reserve's view that a bank holding company should pay cash dividends only to the extent that its net income for the past year is sufficient to cover both the cash dividends and a rate of earnings retention that is consistent with the holding company's capital needs, asset quality, and overall financial condition.
Capital Adequacy. The federal and state bank regulatory agencies use capital adequacy guidelines in their examination and regulation of holding companies and banks. If capital falls below the minimum levels established by these guidelines, a holding company or a bank may be denied approval to acquire or establish additional banks or non-bank businesses or to open new facilities.
The FDIC and Federal Reserve have adopted risk-based capital guidelines for holding companies and banks. The risk-based capital guidelines are designed to make regulatory capital requirements more sensitive to differences in risk profile among holding companies and banks, to account for off-balance sheet exposure and to minimize disincentives for holding liquid assets. Assets and off-balance sheet items are assigned to broad risk categories, each with appropriate weights. The resulting capital ratios represent capital as a percentage of total risk-weighted assets and off-balance sheet items. The capital adequacy guidelines limit the degree to which a holding company or bank may leverage its equity capital.
Federal regulations establish minimum requirements for the capital adequacy of depository institutions, such as the Bank. Banks with capital ratios below the required minimums are subject to certain administrative actions, including prompt corrective action, the termination of deposit insurance upon notice and hearing, or a temporary suspension of insurance without a hearing.
On July 2, 2013, federal banking regulators approved final rules that revise the regulatory capital rules to incorporate certain revisions by the Basel Committee on Banking Supervision to the Basel capital framework ("Basel III"). The phase-in period for the final rules will begin for the Company on January 1, 2015, with full compliance with the final rules entire requirement phased in on January 1, 2019.
The final rules, among other things, include a new common equity Tier 1 capital ("CET1") to risk-weighted assets ratio, including a capital conservation buffer, which will gradually increase from 4.5% on January 1, 2015 to 7.0% on January 1, 2019. The final rules also raise the minimum ratio of Tier 1 capital to risk-weighted assets from 4.0% to 6.0% on January 1, 2015 to 8.5% on January 1, 2019, as well as require a minimum leverage ratio of 4.0%.
The final rules also provide for a number of adjustments to and deductions from the new CET1. Under current capital standards, the effects of accumulated other comprehensive income items included in capital are excluded for the purposes of determining regulatory capital ratios. Under Basel III, the effects of certain accumulated other comprehensive items are not excluded; however, non-advanced approaches banking organizations, including the Company and the Bank, may choose to continue to exclude these items. The Company and Bank expect to make this election in order to avoid significant variations in the level of capital depending upon the impact of interest rate fluctuations on the fair value of the Company's securities portfolio. In addition, deductions include, for example, the requirement that mortgage servicing rights, certain deferred tax assets not dependent upon future taxable income and significant investments in non-consolidated financial entities be deducted from CET1 to the extent that any one such category exceeds 10% of CET1 or all such categories in the aggregate exceed 15% of CET1.
FDICIA requires federal banking regulators to take "prompt corrective action" with respect to a capital-deficient institution, including requiring a capital restoration plan and restricting certain growth activities of the institution. Umpqua could be required to guarantee any such capital restoration plan required of the Bank if the Bank became undercapitalized. Pursuant to FDICIA, regulations were adopted defining five capital levels: well capitalized, adequately capitalized, undercapitalized, severely undercapitalized and critically undercapitalized. Under the regulations, the Bank is considered "well capitalized" as of December 31, 2014.
Federal and State Regulation of Broker-Dealers. Umpqua Investments is a fully disclosed introducing broker-dealer clearing through First Clearing LLC. Umpqua Investments is regulated by the Financial Industry Regulatory Authority ("FINRA") and has deposits insured through the Securities Investors Protection Corp ("SIPC") as well as third party insurers. FINRA performs regular examinations of the Umpqua Investments that include reviews of policies, procedures, recordkeeping, trade practices, and customer protection as well as other inquiries.
SIPC protects client securities and cash up to $500,000, including $100,000 for cash with additional coverage provided through First Clearing for the remaining net equity balance in a brokerage account, if any. This coverage does not include losses in investment accounts.
Broker-Dealer and Related Regulatory Supervision. Umpqua Investments is a member of, and is subject to the regulatory supervision of, FINRA. Areas subject to FINRA oversight review include compliance with trading rules, financial reporting, investment suitability, and compliance with stock exchange rules and regulations.
Effects of Government Monetary Policy. Our earnings and growth are affected not only by general economic conditions, but also by the fiscal and monetary policies of the federal government, particularly the Federal Reserve. The Federal Reserve implements national monetary policy for such purposes as curbing inflation and combating recession, through its open market operations in U.S. Government securities, control of the discount rate applicable to borrowings from the Federal Reserve, and establishment of reserve requirements against certain deposits. These activities influence growth of bank loans, investments and deposits, and also affect interest rates charged on loans or paid on deposits. The nature and impact of future changes in monetary policies and their impact on us cannot be predicted with certainty.
Regulation of the Financial Services Industry. Federal laws and regulations governing banking and financial services underwent significant changes in recent years and we believe will continue to undergo significant changes in the future. From time to time, legislation is introduced in the United States Congress that contains proposals for altering the structure, regulation, and competitive relationships of the nation's financial institutions. If enacted into law, these proposals could increase or decrease the cost of doing business, limit or expand permissible activities, or affect the competitive balance among banks, savings associations, and other financial institutions. Whether or in what form any such legislation may be adopted or the extent to which our business might be affected thereby cannot be predicted.
The GLB Act, enacted in November 1999, repealed sections of the Banking Act of 1933, commonly referred to as the Glass-Steagall Act, that prohibited banks from engaging in securities activities, and prohibited securities firms from engaging in banking. The GLB Act created a new form of holding company, known as a financial holding company, that is permitted to acquire subsidiaries that are variously engaged in banking, securities underwriting and dealing, and insurance underwriting.
A bank holding company, if it meets specified requirements, may elect to become a financial holding company by filing a declaration with the Federal Reserve, and may thereafter provide its customers with a broader spectrum of products and services than a traditional bank holding company is permitted to do. A financial holding company may, through a subsidiary, engage in any activity that is deemed to be financial in nature and activities that are incidental or complementary to activities that are financial in nature. These activities include traditional banking services and activities previously permitted to bank holding companies under Federal Reserve regulations, but also include underwriting and dealing in securities, providing investment advisory services, underwriting and selling insurance, merchant banking (holding a portfolio of commercial businesses, regardless of the nature of the business, for investment), and arranging or facilitating financial transactions for third parties.
To qualify as a financial holding company, the bank holding company must be deemed to be well-capitalized and well-managed, as those terms are used by the Federal Reserve. In addition, each subsidiary bank of a bank holding company must also be well-capitalized and well-managed and be rated at least "satisfactory" under the CRA. A bank holding company that does not qualify, or has not chosen, to become a financial holding company must limit its activities to traditional banking activities and those non-banking activities the Federal Reserve has deemed to be permissible because they are closely related to the business of banking.
The GLB Act also includes provisions to protect consumer privacy by prohibiting financial services providers, whether or not affiliated with a bank, from disclosing non-public personal, financial information to unaffiliated parties without the consent of the customer, and by requiring annual disclosure of the provider's privacy policy.
The Riegle-Neal Interstate Banking and Branching Efficiency Act of 1994 ("Riegle-Neal Act"), which became effective in 1995, permits interstate banking and branching, which allows banks to expand nationwide through acquisition, consolidation or merger. Under this law, an adequately capitalized bank holding company may acquire banks in any state or merge banks across state lines if permitted by state law. Further, banks may establish and operate branches in any state subject to the restrictions of applicable state law. Under Oregon law, an out-of-state bank or bank holding company may merge with or acquire an Oregon state chartered bank or bank holding company upon receipt of approval from the Director of the Oregon Department of Consumer and Business Services. The Bank now has the ability to open additional de novo branches in the states of Oregon, California, Washington, Idaho, and Nevada.
Section 613 of the Dodd-Frank Act eliminated interstate branching restrictions that were implemented as part of the Riegle-Neal Act, and removed many restrictions on de novo interstate branching by national and state-chartered banks. The FDIC and the Office of the Comptroller of the Currency now have authority to approve applications by insured state nonmember banks and national banks, respectively, to establish de novo branches in states other than the bank's home state if "the law of the State in which the branch is located, or is to be located, would permit establishment of the branch, if the bank were a State bank chartered by such State." The enactment of this Section 613 may significantly increase interstate banking by community banks in western states, where barriers to entry were previously high.
Anti-Terrorism Legislation. The Uniting and Strengthening America by Providing Appropriate Tools Required to Intercept and Obstruct Terrorism Act ("USA Patriot Act"), enacted in 2001:
prohibits banks from providing correspondent accounts directly to foreign shell banks;
imposes due diligence requirements on banks opening or holding accounts for foreign financial institutions or wealthy foreign individuals;
requires financial institutions to establish an anti-money-laundering ("AML") compliance program; and
generally eliminates civil liability for persons who file suspicious activity reports.
The USA Patriot Act also increases governmental powers to investigate terrorism, including expanded government access to account records. The Department of the Treasury is empowered to administer and make rules to implement the Act, which to some degree, affects our record-keeping and reporting expenses. Should the Bank's AML compliance program be deemed insufficient by federal regulators, we would not be able to grow through acquiring other institutions or opening de novo branches.
Sarbanes-Oxley Act of 2002. The Sarbanes-Oxley Act of 2002 addresses public company corporate governance, auditing, accounting, executive compensation and enhanced and timely disclosure of corporate information.
The Sarbanes-Oxley Act represents significant federal involvement in matters traditionally left to state regulatory systems, such as the regulation of the accounting profession, and regulation of the relationship between a Board of Directors and management and between a Board of Directors and its committees.
The Sarbanes-Oxley Act provides for, among other things:
prohibition on personal loans by Umpqua to its directors and executive officers except loans made by the Bank in accordance with federal banking regulations;
independence requirements for Board audit committee members and our auditors;
certification of reports under the Securities Exchange Act of 1934 ("Exchange Act") by the chief executive officer, chief financial officer and principal accounting officer;
disclosure of off-balance sheet transactions;
expedited reporting of stock transactions by insiders; and
increased criminal penalties for violations of securities laws.
The Sarbanes-Oxley Act also requires:
management to establish, maintain, and evaluate disclosure controls and procedures;
management to report on its annual assessment of the effectiveness of internal controls over financial reporting;
our external auditor to attest to the effectiveness of internal controls over financial reporting.
The SEC has adopted regulations to implement various provisions of the Sarbanes-Oxley Act, including disclosures in periodic filings pursuant to the Exchange Act. Also, in response to the Sarbanes-Oxley Act, NASDAQ adopted new standards for listed companies.
The Dodd-Frank Wall Street Reform and Consumer Protection Act. On July 21, 2010, the Dodd-Frank Act was signed, which was a sweeping overhaul of financial industry regulation. Among other provisions, the Act:
Created a systemic-risk council of top regulators, the Financial Stability Oversight Council (FSOC), whose purpose is to identify risks and respond to emerging threats to the financial stability of the U.S. arising from large, interconnected bank holding companies or nonbank financial companies;
Gave the FDIC authority to unwind large failing financial firms. Treasury would supply funds to cover the up-front costs of winding down the failed firm, but the government would have to put a "repayment plan" in place. Regulators will recoup any losses incurred from the wind-down afterwards by assessing fees on financial firms with more than $50 billion in assets;
Directed the FDIC to base deposit-insurance assessments on assets minus tangible capital instead of on domestic deposits and requires the FDIC to increase premium rates to raise the Deposit Insurance Fund's ("DIF") minimum reserve ratio from 1.15% to 1.35% by September 30, 2020. Banks, like Umpqua, with consolidated assets greater than $10 billion would pay the increased premiums;
Permanently increased FDIC deposit-insurance coverage to $250,000, retroactive to January 1, 2008. The act also eliminated the 1.5% cap on the DIF reserve ratio and automatic dividends when the ratio exceeds 1.35%. The FDIC also has discretion on whether to provide dividends to DIF members;
Authorized banks to pay interest on business checking accounts;
Created the CFPB, housed under the Federal Reserve and led by a director appointed by the President and confirmed by the Senate. All existing consumer laws and regulations will be transferred to this agency and each existing regulatory agency will contribute their respective consumer regulatory and exam staffs to the CFPB;
Gave the CFPB the authority to write consumer protection rules for banks and nonbank financial firms offering consumer financial services or products and to ensure that consumers are protected from "unfair, deceptive, or abusive" acts or practices. The CFPB also now has authority to examine and enforce regulations for banks with greater than $10 billion in assets;
Authorized the CFPB to require banks to compile and provide reports relating to its consumer lending, marketing and other consumer business activities and to make that information available to the public if doing so "in the public interest";
Directed the Federal Reserve to set interchange fees for debit card transactions charged by banks with more than $10 billion in assets. The Federal Reserve must establish what it determines are reasonable fees by factoring in their transaction costs compared to those for checks;
Requires loan originators to retain 5% of any loan sold and securitized, unless it is a "qualified residential mortgage", which includes standard 30 and 15 year fixed rate loans. It also specifically exempts from risk retention FHA, VA, Farmer Mac and Rural Housing Service loans;
Adopted additional various mortgage lending and predatory lending provisions;
Required federal regulators jointly to prescribe regulations mandating that financial institutions with more than $1 billion in assets to disclose to their regulators their incentive compensation plans to permit the regulators to determine whether the plans provide executive officers, employees, directors or principal shareholders with excessive compensation, fees or benefits, or could lead to material financial loss to the institution;
Imposed a number of requirements related to executive compensation that apply to all public companies, such as prohibition of broker discretionary voting in connection with a shareholder vote on executive compensation; mandatory shareholder "say on pay" (every one to three years) and "say on golden parachutes"; and clawback of incentive compensation from current or former executive officers following any accounting restatement;
Established a modified version of the "Volcker Rule" and generally prohibits banks from engaging in proprietary trading or holding or obtaining an interest in a hedge fund or private equity fund, to the extent that it would exceed 3% of the bank's Tier 1 capital. A bank's interest in any single hedge fund or private equity fund may not exceed 3% of the assets of that fund.
Stress Testing and Capital Planning. Umpqua is subject to the annual Dodd-Frank Act capital stress testing (DFAST) requirements of the Federal Reserve and the FDIC. As part of the DFAST process, Umpqua will release certain results from stress testing exercises, generally in June of each year.
CFPB Regulation and Supervision. As noted above, the Dodd-Frank Act gives the CFPB authority to examine Umpqua and Umpqua Bank for compliance with a broad range of federal consumer financial laws and regulations, including the laws and regulations that relate to credit card, deposit, mortgage and other consumer financial products and services the Bank offers. In addition, the Dodd-Frank Act gives the CFPB broad authority to take corrective action against Umpqua and Umpqua Bank as it deems appropriate. The CFPB is authorized to issue regulations and take enforcement actions to prevent and remedy acts and practices relating to consumer financial products and services that it deems to be unfair, deceptive or abusive. The agency also has authority to impose new disclosure requirements for any consumer financial product or service. These authorities are in addition to the authority the CFPB assumed on July 21, 2011 under existing consumer financial law governing the provision of consumer financial products and services. The CFPB has concentrated much of its initial rulemaking efforts on a variety of mortgage related topics required under the Dodd-Frank Act, including ability-to-repay and qualified mortgage standards, mortgage servicing standards, loan originator compensation standards, high-cost mortgage requirements, appraisal and escrow standards and requirements for higher-priced mortgages.
In January 2014, new rules issued by the CFPB for mortgage origination and mortgage servicing became effective. The rules require lenders to conduct a reasonable and good faith determination at or before consummation of a residential mortgage loan that the borrower will have a reasonable ability to repay the loan. The regulations also define criteria for making Qualified Mortgages which entitle the lender and any assignee to either a conclusive or rebuttable presumption of compliance with the ability to repay rule. The new mortgage servicing rules include new standards for notices to consumers, loss mitigation procedures, and consumer requests for information. Both the origination and servicing rules create new private rights of action for consumers in the event of certain violations. In addition to the exercise of its rulemaking authority, the CFPB is continuing its ongoing examination and supervisory activities with respect to a number of consumer businesses and products.
Joint Agency Guidance on Incentive Compensation. On June 21, 2010, federal banking regulators issued final joint agency guidance on Sound Incentive Compensation Policies. This guidance applies to executive and non-executive incentive compensation plans administered by banks. The guidance says that incentive compensation programs must:
Provide employees incentives that appropriately balance risk and reward.
Be compatible with effective controls and risk- management; and
Be supported by strong corporate governance, including active and effective oversight by the board;
The Federal Reserve reviews, as part of the regular, risk-focused examination process, the incentive compensation arrangements of the Company and other banking organizations. The findings of the supervisory initiatives are included in reports of examination and any deficiencies will be incorporated into the Company's supervisory ratings, which can affect the Company's ability to make acquisitions and take other actions.
ITEM 1A. RISK FACTORS.
In addition to the other information set forth in this report, you should carefully consider the factors discussed below. These factors could materially adversely affect our business, financial condition, liquidity, results of operations and capital position, and could cause our actual results to differ materially from our historical results or the results contemplated by the forward-looking statements contained in this report.
Difficult market conditions have adversely affected and may continue to have an adverse effect on the financial services industry and on our business, financial condition and results of operations.
Our business and financial performance are vulnerable to weak economic conditions, primarily in the United States. The severe conditions from 2007 to 2009 had a significant negative impact on the financial services industry, and on Umpqua, including significant write-downs of asset values, bank failures and volatile financial markets. We have experienced moderate improvement in these conditions in the recent past, but not at a consistent pace. There is a risk that economic conditions will deteriorate or economic recovery is delayed. A worsening of conditions would likely exacerbate the adverse effects of the recent difficult market conditions on us and others in the financial institutions industry. In particular, we may face the following risks in connection with these events:
Increased regulation of our industry, including the continued implementation of regulations under the Dodd-Frank Act. Compliance with such regulation will increase our costs, reduce existing sources of revenue and may limit our ability to pursue business opportunities.
Our ability to assess the creditworthiness of our customers may be impaired if the models and approaches we use to select, manage, and underwrite our customers become less predictive of future performance.
The process we use to estimate losses inherent in our loan portfolio requires difficult, subjective, and complex judgments, including forecasts of economic conditions and how these economic predictions might impair the ability of our borrowers to repay their loans, which process may no longer be capable of accurate estimation and may, in turn, impact its reliability.
There may be downward pressure on our stock price.
We may face increased competition due to intensified consolidation of the financial services industry.
If market disruption and volatility worsen, there can be no assurance that we will not experience an adverse effect, which may be material, on our ability to access capital and on our business, financial condition and results of operations.
The majority of our assets are loans, which if not repaid would result in losses to the Bank.
The Bank, like other lenders, is subject to credit risk, which is the risk of losing principal or interest due to borrowers' failure to repay loans in accordance with their terms. Underwriting and documentation controls cannot mitigate all credit risk. A downturn in the economy or the real estate market in our market areas or a rapid increase in interest rates could have a negative effect on collateral values and borrowers' ability to repay. To the extent loans are not paid timely by borrowers, the loans are placed on non-accrual status, thereby reducing interest income. Further, under these circumstances, an additional provision for loan and lease losses or unfunded commitments may be required. See Management's Discussion and Analysis of Financial Condition and Results of Operations- "Allowance for Loan and Lease Losses and Reserve for Unfunded Commitments", "Provision for Loan and Lease Losses" and "Asset Quality and Non-Performing Assets".
A large percentage of our loan portfolio is secured by real estate, in particular commercial real estate. Deterioration in the real estate market or other segments of our loan portfolio would lead to additional losses, which could have a material adverse effect on our business, financial condition and results of operations.
As of December 31, 2014, approximately 80% of our total loan portfolio is secured by real estate, the majority of which is commercial real estate. Increases in commercial and consumer delinquency levels or declines in real estate market values would require increased net charge-offs and increases in the allowance for loan and lease losses, which could have a material adverse effect on our business, financial condition and results of operations and prospects.
The effects of the economic recession have been particularly severe in our primary market areas in the Pacific Northwest, California, and Nevada.
Substantially all of our loans are to businesses and individuals in California, Oregon, Washington, Idaho, and Nevada. The Pacific Northwest has had one of the nation's highest unemployment rates. A further deterioration in the economic conditions or a prolonged delay in economic recovery in our primary market areas could result in the following consequences, any of which could materially and adversely affect our business: loan delinquencies may increase; problem assets and foreclosures may increase putting further price pressures on valuations generally; demand for our products and services may decrease; low cost or noninterest bearing deposits may decrease; and collateral for loans made by us, especially real estate, may decline in value, in turn reducing customers' borrowing power, and reducing the value of assets and collateral associated with our existing loans.
The integration of Sterling may be more difficult, costly or time consuming than expected and the anticipated benefits and cost savings of the Merger may not be realized.
The success of the Merger, including anticipated benefits and cost savings, will depend, in part, on Umpqua's ability to successfully combine and integrate the businesses of Umpqua and Sterling in a manner that permits growth opportunities and does not materially disrupt the existing customer relations nor result in decreased revenues due to loss of customers. It is possible that the integration process could result in the loss of key employees, the disruption of either company's ongoing businesses or inconsistencies in standards, controls, procedures and policies that adversely affect the combined company's ability to maintain relationships with clients, customers, depositors and employees or to achieve the anticipated benefits and cost savings of the merger. The loss of key employees could adversely affect our ability to successfully conduct its business, which could have an adverse effect on our financial results and the value of its common stock. If we experience difficulties with the integration process, the anticipated benefits of the merger may not be realized fully or at all, or may take longer to realize than expected. As with any merger of financial institutions, there also may be business disruptions that cause us to lose customers. Integration efforts will also divert management attention and resources. In addition, the actual cost savings of the Merger upon completion of integration activities could be less than anticipated.
A rapid change in interest rates, or maintenance of rates at historically high or low levels for an extended period, could make it difficult to maintain our current interest income spread and could result in reduced earnings.
Our earnings are largely derived from net interest income, which is interest income and fees earned on loans and investments, less interest paid on deposits and other borrowings. Interest rates are highly sensitive to many factors that are beyond the control of our management, including general economic conditions and the policies of various governmental and regulatory authorities. The actions of the Federal Reserve influence the rates of interest that we charge on loans and that we pay on borrowings and interest-bearing deposits. We cannot predict the nature or timing of future changes in monetary, tax and other policies or the effects that they may have on our activities and financial results. As interest rates change, net interest income is affected. With fixed rate assets (such as fixed rate loans and most investment securities) and liabilities (such as certificates of deposit), the effect on net interest income depends on the cash flows associated with the maturity of the asset or liability. Asset/liability management policies may not be successfully implemented and from time to time our risk position is not balanced. An unanticipated rapid decrease or increase in interest rates could have an adverse effect on the spreads between the interest rates earned on assets and the rates of interest paid on liabilities, and therefore on the level of net interest income. For instance, any rapid increase in interest rates in the future could result in interest expense increasing faster than interest income because of fixed rate loans and longer-term investments. Historically low rates for an extended period of time result in reduced returns from the investment and loan portfolios. The current very low interest rate environment, which is expected to continue at least through mid-year 2015 based on statements by the Chairman of the Federal Reserve, could affect consumer and business behavior in ways that are adverse to us and negatively impact our ability to increase our net interest income. Further, substantially higher interest rates generally reduce loan demand and may result in slower loan growth than previously experienced. See Management's Discussion and Analysis of Financial Condition and Results of Operations-"Quantitative and Qualitative Disclosures about Market Risk".
Our merger with Sterling, given its size and scope, will likely make it difficult for us to engage in traditional merger and acquisition transactions in the near term.
The successful integration of our merger with Sterling is presently our top priority and it will take significant resources through the first half of 2015 to accomplish that goal. During this integration phase it is unlikely that we would receive regulatory approval to acquire another bank and our ability to engage in traditional merger and acquisition transactions will be constrained over the near term.
The benefits of our FDIC loss-sharing agreements may be reduced or eliminated.
In connection with Umpqua Bank's assumption of the banking operations of Evergreen Bank, Rainier Pacific Bank, and Nevada Security Bank, the Bank and the FDIC entered into Whole Bank Purchase and Assumption Agreements with Loss-Share (collectively, "Loss Share Agreements"). Our decisions regarding the fair value of assets acquired, including the FDIC loss-sharing assets, could be inaccurate which could materially and adversely affect our business, financial condition, results of operations, and future prospects.Management makes various assumptions and judgments about the collectability of the acquired loans, including the creditworthiness of borrowers and the value of the real estate and other assets serving as collateral for the repayment of secured loans. In FDIC-assisted acquisitions that include loss-sharing agreements, we record a loss-sharing asset that reflects our estimate of the timing and amount of future losses that are anticipated to occur in and used to value the acquired loan portfolio. In determining the size of the loss-sharing asset, we analyze the loan portfolio based on historical loss experience, volume and classification of loans, volume and trends in delinquencies and nonaccruals, local economic conditions, and other pertinent information.
If our assumptions relating to the timing or amount of expected losses are incorrect, our operating results could be negatively impacted. Increases in the amount of future losses in response to different economic conditions or adverse developments in the acquired loan portfolio may result in increased credit loss provisions. Changes in our estimate of the timing of those losses, specifically if those losses are to occur beyond the applicable loss-sharing periods, may result in impairments of the FDIC indemnification asset.
In addition, the non-single family Loss Share Agreements expire, by their terms on or before July 1, 2015. After expiration, we will no longer receive reimbursement from the FDIC for losses sustained in these acquired portfolios.
Our ability to obtain reimbursement under the loss-sharing agreements on covered assets depends on our compliance with the terms of the loss-sharing agreements.
Management must certify to the FDIC on a quarterly basis our compliance with the terms of the Loss share Agreements as a prerequisite to obtaining reimbursement from the FDIC for realized losses on covered assets. The required terms of the Loss Share Agreements are extensive and failure to comply with any of the guidelines could result in a specific asset or group of assets permanently losing their loss-sharing coverage. Additionally, management may decide to forgo loss-share coverage on certain assets to allow greater flexibility over the management of certain assets.
Under the terms of the FDIC loss-sharing agreements, the assignment or transfer of a loss-sharing agreement to another entity generally requires the written consent of the FDIC. No assurances can be given that we will manage the covered assets in such a way as to maintain loss-share coverage on all such assets.
Deterioration in the real estate market could result in loans that we have restructured to become delinquent and classified as non-accrual loans.
We restructured loans, primarily during the recent recession, in response to borrower financial difficulty, by providing modification of loan repayment terms. Loans are reported as restructured when we grant significant concessions to a borrower experiencing financial difficulties that we would not otherwise consider. Examples of such concessions include forgiveness of principal or accrued interest, extending loan maturity dates or providing a lower interest rate than would be normally available for a transaction of similar risk. In exchange for these concessions, at the time of restructure, we require additional collateral to bring the loan to value to at most 100%. A decline in the economic conditions in our general market areas and other factors affecting the specific borrower could adversely impact borrowers with restructured loans and cause borrowers to become delinquent or otherwise default or call into question their ability to repay full interest and principal in accordance with the restructured terms, which would result in the restructured loan being reclassified as a non-accrual loan.
Interest rate volatility and credit risk adjusted rate spreads may impact our financial assets and liabilities measured at fair value, particularly the fair value of our junior subordinated debentures.
The widening of the credit risk adjusted rate spreads on potential new issuances of junior subordinated debentures above our contractual spreads and reductions in three month LIBOR rates have contributed to the cumulative positive fair value adjustment in our junior subordinated debentures carried at fair value. Tightening of these credit risk adjusted rate spreads and interest rate volatility may result in recognizing negative fair value adjustments charged to earnings in the future.
The Dodd-Frank Act and other legislative and regulatory initiatives contain numerous provisions and requirements that could detrimentally affect the Company's business.
The Dodd-Frank Act and related regulations subject us and other financial institutions to additional restrictions, oversight, reporting obligations and costs, which could have an adverse impact on our business, financial condition, results of operations or the price of our common stock. In addition, this increased regulation of the financial services industry restricts the ability of firms within the industry to conduct business consistent with historical practices, including aspects such as compensation, interest rates, new and inconsistent consumer protection regulations and mortgage regulation, among others. Congress or state legislatures could also adopt laws reducing the amount that borrowers are otherwise contractually required to pay under existing loan contracts, require lenders to extend or restructure certain loans or limit foreclosure and collection remedies. Federal and state regulatory agencies also frequently adopt changes to their regulations or change the manner in which existing regulations are applied.
We cannot predict the substance or impact of pending or future legislation or regulation, or the application thereof. Compliance with such current and potential regulation and scrutiny could significantly increase our costs, impede the efficiency of our internal business processes, may require us to increase our regulatory capital and may limit our ability to pursue business opportunities in an efficient manner. In response, we may be required to or choose to raise additional capital, which could have a dilutive effect on the existing holders of our common stock and adversely affect the market price of our common stock.
We are subject to extensive regulation under federal and state laws. These laws and regulations are primarily intended to protect customers, depositors and the deposit insurance fund, rather than shareholders. The Bank is an Oregon state-chartered commercial bank whose primary regulator is the DCBS. The Bank is also subject to the supervision by and the regulations of the DFI, the DBO, the Idaho Department of Finance Banking Section, the Nevada Division of Financial Institutions, the FDIC, which insures bank deposits and the CFPB. Umpqua Investments is subject to extensive regulation by the SEC and the FINRA. Umpqua is subject to regulation and supervision by the Federal Reserve, the SEC and NASDAQ. Federal and state regulations may place banks and brokerage firms at a competitive disadvantage compared to less regulated competitors such as finance companies, credit unions, mortgage banking companies and leasing companies. There is also the possibility that laws could be enacted that would prohibit a company from controlling both an FDIC-insured bank and a broker dealer, or restrict their activities if under common ownership. If we receive less than satisfactory results on regulatory examinations, we could be restricted from making acquisitions, adding new stores, developing new lines of business, or otherwise continuing our growth strategy for a period of time. Future changes in federal and state banking and brokerage regulations could adversely affect our operating results and ability to continue to compete effectively.
We may be required to raise additional capital in the future, but that capital may not be available when it is needed, or it may only be available on unacceptable terms, which could adversely affect our financial condition and results of operations.
We are required by federal and state regulatory authorities to maintain adequate levels of capital to support our operations. Our ability to raise additional capital, if needed, will depend on conditions in the capital markets at that time, which are outside our control, and on our financial performance. Accordingly, we may not be able to raise additional capital, if needed, on terms acceptable to us. If we cannot raise additional capital when needed, our ability to further expand our operations and pursue our growth strategy could be materially impaired. We and the Bank are currently well capitalized under applicable regulatory guidelines. However, our business could be negatively affected if we or the Bank failed to remain well capitalized. For example, because Umpqua Bank is well capitalized and we otherwise qualify as a financial holding company, we are permitted to engage in a broader range of activities than are permitted to a bank holding company. Loss of financial holding company status could require that we cease these broader activities. The banking regulators are authorized (and sometimes required) to impose a wide range of requirements, conditions, and restrictions on banks, thrifts, and bank holding companies that fail to maintain adequate capital levels. Further the new capital requirements of the Basel III Rules will become applicable to us beginning January 1, 2015.
New rules will require increased capital and restrict TRUPS as a component of as Tier 1 Capital.
In June 2013, federal banking regulators jointly issued the Basel III Rules. The rules impose new capital requirements and implement Section 171 of the Dodd Frank Act. The new rules are to be phased in through 2019, beginning January 1, 2015. Among other things, the rules will require that we maintain a common equity Tier 1 capital ratio of 4.5%, a Tier 1 capital ratio of 6%, a total capital ratio of 8%, and a leverage ratio of 4%. In addition, we will have to maintain an additional capital conservation buffer of 2.5% of total risk weighted assets or be subject to limitations on dividends and other capital distributions, as well as limiting discretionary bonus payments to executive officers. The new rules also restrict trust preferred securities/junior subordinated debentures ("TRUPS") from comprising more than 25% of our Tier 1 capital. TRUPS now constitute approximately 20% of our Tier 1 capital. If an institution grows above $15 billion as a result of an acquisition, as we did in the 2014 with the Sterling merger, the combined trust preferred issuances will be phased out of Tier 1 and into Tier 2 capital (75% in 2015 and 100% in 2016). It is possible the Company may accelerate redemption of the existing junior subordinated debentures. This could result in adjustments to the fair value of these instruments including the acceleration of losses on junior subordinated debentures carried at fair value within non-interest income. The Company currently does not intend to redeem the junior subordinated debentures in order to support regulatory total capital levels. The new rules may require us to raise more common capital or other capital that qualifies as Tier 1 capital. The application of more stringent capital requirements could, among other things, result in lower returns on invested capital and result in regulatory actions if we were to be unable to comply with such requirements. But based on the current components and levels of our capital and assets, we believe that we will be in compliance with the new capital requirements.
Conditions in the financial markets may limit our access to additional funding to meet our liquidity needs.
Liquidity is essential to our business. An inability to raise funds through deposits, borrowings, the sale or pledging as collateral of loans and other assets could have a substantial negative effect on our liquidity. Our access to funding sources in amounts adequate to finance our activities could be impaired by factors that affect us specifically or the financial services industry in general. An adverse regulatory action against us could detrimentally impact our access to liquidity sources. Our ability to borrow could also be impaired by factors that are nonspecific to us, such as severe disruption of the financial markets or negative news and expectations about the prospects for the financial services industry as a whole as evidenced by turmoil in the domestic and worldwide credit markets.
Our wholesale funding sources may prove insufficient to support our future growth or an unexpected reduction in deposits.
We must maintain sufficient funds to respond to the needs of depositors and borrowers. As a part of our liquidity management, we use a number of funding sources in addition to core deposit growth and repayments and maturities of loans and investments. If we grow more rapidly than any increase in our deposit balances, we are likely to become more dependent on these sources, which include Federal Home Loan Bank advances, proceeds from the sale of loans and liquidity resources at the holding company. Our financial flexibility will be severely constrained if we are unable to maintain our access to funding or if adequate financing is not available to accommodate future growth at acceptable interest rates. If we are required to rely more heavily on more expensive funding sources to support future growth, our revenues may not increase proportionately to cover our costs, and our profitability would be adversely affected.
As a bank holding company that conducts substantially all of our operations through the Bank, our ability to pay dividends, repurchase our shares or to repay our indebtedness depends upon liquid assets held by the holding company and the results of operations of our subsidiaries.
The Company is a separate and distinct legal entity from our subsidiaries and it receives substantially all of its revenue from dividends paid from the Bank. There are legal limitations on the extent to which the Bank may extend credit, pay dividends or otherwise supply funds to, or engage in transactions with, us. Our inability to receive dividends from the Bank could adversely affect our business, financial condition, results of operations and prospects.
Our net income depends primarily upon the Bank's net interest income, which is the income that remains after deducting from total income generated by earning assets the expense attributable to the acquisition of the funds required to support earning assets (primarily interest paid on deposits). The amount of interest income is dependent on many factors including the volume of earning assets, the general level of interest rates, the dynamics of changes in interest rates and the levels of nonperforming loans. All of those factors affect the Bank's ability to pay dividends to the Company.
Various statutory provisions restrict the amount of dividends the Bank can pay to us without regulatory approval. The Bank may not pay cash dividends if that payment could reduce the amount of its capital below that necessary to meet the "adequately capitalized" level in accordance with regulatory capital requirements. It is also possible that, depending upon the financial condition of the Bank and other factors, regulatory authorities could conclude that payment of dividends or other payments, including payments to us, is an unsafe or unsound practice and impose restrictions or prohibit such payments. Under Oregon law, the Bank may not pay dividends in excess of unreserved retained earnings, deducting there from, to the extent not already charged against earnings or reflected in a reserve, the following: (1) all bad debts, which are debts on which interest is past due and unpaid for at least six months, unless the debt is fully secured and in the process of collection; (2) all other assets charged-off as required by Oregon bank regulators or a state or federal examiner; and (3) all accrued expenses, interest and taxes of the institution. The Federal Reserve has issued a policy statement on the payment of cash dividends by bank holding companies, which expresses the Federal Reserve's view that a bank holding company should pay cash dividends only to the extent that its net income for the past year is sufficient to cover both the cash dividends and a rate of earnings retention that is consistent with the holding company's capital needs, asset quality and overall financial condition.
A decline in the Company's stock price or expected future cash flows, or a material adverse change in our results of operations or prospects, could result in impairment of our goodwill.
From time to time, the Company's common stock has traded at a price below its book value, including goodwill and other intangible assets. A significant and sustained decline in our stock price and market capitalization, a significant decline in our expected future cash flows, a significant adverse change in the business climate or slower growth rates could result in impairment of our goodwill. If impairment was deemed to exist, a write down of goodwill would occur with a charge to earnings.
We have a gross deferred tax asset position of $423.3 million at December 31, 2014, and we are required to assess the recoverability of this asset on an ongoing basis.
Deferred tax assets are evaluated on a quarterly basis to determine if they are expected to be recoverable in the future. Our evaluation considers positive and negative evidence to assess whether it is more likely than not that a portion of the asset will not be realized. The risk of a valuation allowance increases if continuing operating losses are incurred. Future negative operating performance or other negative evidence may result in a valuation allowance being recorded against some or all of this amount. A valuation allowance on our deferred tax asset could have a material adverse impact on our capital and results of operations.
We are pursuing an aggressive growth strategy that is expected to include mergers and acquisitions, which could create integration risks.
Umpqua is among the fastest-growing community financial services organizations in the United States. Since 2000, we have completed the acquisition and integration of 12 other financial institutions. There is no assurance that future acquisitions will be successfully integrated. We continue to pursue traditional merger and acquisition transactions and to open new stores to continue our growth strategy. If we pursue our growth strategy too aggressively, or if factors beyond management's control divert attention away from our integration plans, we might not be able to realize some or all of the anticipated benefits. Moreover, we are dependent on the efforts of key personnel to achieve the synergies associated with our acquisitions. The loss of one or more of our key persons could have a material adverse effect upon our ability to achieve the anticipated benefits.
The financial services industry is highly competitive with respect to deposits, loans and products.
We face pricing competition for loans and deposits. We also face competition with respect to customer convenience, product lines, accessibility of service and service capabilities. Our most direct competition comes from other banks, brokerages, mortgage companies and savings institutions. We also face competition from credit unions, government-sponsored enterprises, mutual fund companies, insurance companies and other non-bank businesses. This significant competition in attracting and retaining deposits and making loans as well as in providing other financial services throughout our market area may impact future earnings and growth. Our success depends, in part, on the ability to adapt products and services to evolving industry standards. There is increasing pressure to provide products and services at lower prices. This can reduce net interest income and non-interest income from fee-based products and services. In addition, new technology-driven products and services are often introduced and adopted, which could require us to make substantial capital expenditures to modify or adapt existing products and services or develop new products and services. We may not be successful in introducing new products and services or those new products may not achieve market acceptance. We could lose business, be forced to price products and services on less advantageous terms to retain or attract clients, or be subject to cost increases. As a result, our business, financial condition or results of operations may be adversely affected.
Involvement in non-bank business creates risks associated with the securities industry.
Umpqua Investments' retail brokerage operations present special risks not borne by community banks that focus exclusively on community banking. For example, the brokerage industry is subject to fluctuations in the stock market that may have a significant adverse impact on transaction fees, customer activity and investment portfolio gains and losses. Likewise, additional or modified regulations may adversely affect Umpqua Investments' operations. Umpqua Investments is also dependent on a small number of established brokers, whose departure could result in the loss of a significant number of customer accounts. A significant decline in fees and commissions or trading losses suffered in the investment portfolio could adversely affect Umpqua Investments' income and potentially require the contribution of additional capital to support its operations. Umpqua Investments is subject to claim arbitration risk arising from customers who claim their investments were not suitable or that their portfolios were too actively traded. These risks increase when the market, as a whole, declines. The risks associated with retail brokerage may not be supported by the income generated by those operations. See Management's Discussion and Analysis of Financial Condition and Results of Operations-"Non-interest Income".
The value of the securities in our investment securities portfolio may be negatively affected by continued disruptions in securities markets.
The market for some of the investment securities held in our portfolio has become extremely volatile over the past three years. Volatile market conditions or deteriorating financial performance of the issuer or obligor may detrimentally affect the value of these securities. There can be no assurance that the declines in market value associated with these disruptions will not result in other-than-temporary or permanent impairments of these assets, which would lead to accounting charges that could have a material adverse effect on our net income and capital levels.
The volatility of our mortgage banking business can adversely affect earnings if our mitigating strategies are not successful.
Changes in interest rates greatly affect the mortgage banking business. One of the principal risks in this area is prepayment of mortgages and the consequent detrimental effect on the value of mortgage servicing rights. We may employ hedging strategies to mitigate this risk but if the hedging decisions and strategies are not successful, our net income could be adversely affected. See Management's Discussion and Analysis of Financial Condition and Results of Operations-"Mortgage Servicing Rights".
Our business is highly reliant on technology and our ability to manage the operational risks associated with technology.
Our business involves storing and processing sensitive consumer and business customer data. A cyber security breach may result in theft of such data or disruption of our transaction processing systems. We depend on internal systems and outsourced technology to support these data storage and processing operations. Our inability to use or access these information systems at critical points in time could unfavorably impact the timeliness and efficiency of our business operations. A material breach of customer data security may negatively impact our business reputation and cause a loss of customers, result in increased expense to contain the event and/or require that we provide credit monitoring services for affected customers, result in regulatory fines and sanctions and/or result in litigation. Cyber security risk management programs are expensive to maintain and will not protect the Company from all risks associated with maintaining the security of customer data and the Company's proprietary data from external and internal intrusions, disaster recovery and failures in the controls used by our vendors. In addition, Congress and the legislatures of states in which we operate regularly consider legislation that would impose more stringent data privacy requirements.
Our business is highly reliant on third party vendors and our ability to manage the operational risks associated with outsourcing those services.
We rely on third parties to provide services that are integral to our operations. These vendors provide services that support our operations, including the storage and processing of sensitive consumer and business customer data, as well as our sales efforts. A cyber security breach of a vendor's system may result in theft of our data or disruption of business processes. A material breach of customer data security at a service provider's site may negatively impact our business reputation and cause a loss of customers; result in increased expense to contain the event and/or require that we provide credit monitoring services for affected customers, result in regulatory fines and sanctions and/or result in litigation. In most cases, we will remain primarily liable to our customers for losses arising from a breach of a vendor's data security system. We rely on our outsourced service providers to implement and maintain prudent cyber security controls. We have procedures in place to assess a vendor's cyber security controls prior to establishing a contractual relationship and to periodically review assessments of those control systems; however, these procedures are not infallible and a vendor's system can be breached despite the procedures we employ. We have alliances with other companies that assist in our sales efforts. In our wealth management business, we have an alliance with Ferguson Wellman, a registered investment advisor to whom we refer customers for investment advice and asset management services. We cannot be sure that we will be able to maintain these relationships on favorable terms. In addition, some of our data processing services are provided by companies associated with our competitors. The loss of these vendor relationships could disrupt the services we provide to our customers and cause us to incur
significant expense in connection with replacing these services.
Store construction can disrupt banking activities and may not be completed on time or within budget, which could result in reduced earnings.
The Bank has, over the past several years, been transformed from a traditional community bank into a community-oriented financial services retailer. We build new stores as part of our de novo branching strategy, including our "Neighborhood Stores." We also continue to remodel acquired bank branches to resemble retail stores that include distinct physical areas or boutiques such as a "serious about service center," an "investment opportunity center" and a "computer cafe." Store construction involves significant expense and risks associated with locating store sites and delays in obtaining permits and completing construction. Remodeling involves significant expense, disrupts banking activities during the remodeling period, and presents a new look and feel to the banking services and products being offered. Financial constraints may delay remodeling projects. Customers may not react favorably to the construction-related activities or the remodeled look and feel. There are risks that construction or remodeling costs will exceed forecasted budgets and that there may be delays in completing the projects, which could cause disruption in those markets.
Damage to our brand and reputation could significantly harm our business and prospects.
Our brand and reputation are important assets. Our relationship with many of our customers is predicated upon our reputation as a high quality provider of financial services that adheres to the highest standards of ethics, service quality and regulatory compliance. We believe that our brand has been, and continues to be, well received in our industry, with current and potential customers, investors and employees. Our ability to attract and retain customers, investors and employees depends upon external perceptions of us. Damage to our reputation among existing and potential customers, investors and employees could cause significant harm to our business and prospects and may arise from numerous sources, including litigation or regulatory actions, failing to deliver minimum standards of service and quality, lending practices, inadequate protection of customer information, sales and marketing efforts, compliance failures, unethical behavior and the misconduct of employees. Adverse developments with respect to our industry may also, by association, negatively impact our reputation or result in greater regulatory or legislative scrutiny or litigation against us.
ITEM 1B. UNRESOLVED STAFF COMMENTS.
None.
ITEM 2. PROPERTIES.
The executive offices of Umpqua and Umpqua Investments are located at One SW Columbia Street in Portland, Oregon in office space that is leased. The Bank's headquarters, located in Roseburg, Oregon, is owned. At December 31, 2014, the Bank conducted community banking activities or operated Commercial Banking Centers at 385 locations, in California, Oregon and Washington along the I-5 corridor; in the San Francisco Bay area, Inland Foothills, Napa, and Coastal regions in California; in Bend and along the Pacific Coast of Oregon; in greater Seattle and Bellevue, Washington, and in Idaho and Reno, Nevada, of which 147 are owned and 238 are leased under various agreements. As of December 31, 2014, the Bank also operated 25 facilities for the purpose of administrative and other functions, such as back-office support, of which 3 are owned and 22 are leased. All facilities are in a good state of repair and appropriately designed for use as banking or administrative office facilities. As of December 31, 2014, Umpqua Investments leased four stand-alone offices from unrelated third parties, one stand-alone office from the Bank, and also leased space in nine Bank stores under lease agreements based on market rates.
ITEM 3. LEGAL PROCEEDINGS.
Due to the nature of our business, we are involved in legal proceedings that arise in the ordinary course of our business. While the outcome of these matters is currently not determinable, we do not expect that the ultimate costs to resolve these matters will have a material adverse effect on our consolidated financial position, results of operations, cash flows, or our ability to close the proposed Sterling merger.
In our Form 10-K for the period ending December 31, 2011, we initially reported on a class action lawsuit filed in the U.S. District Court for the Northern District of California against the Bank by Amber Hawthorne relating to overdraft fees and the posting order of point of sale and ACH items. In March 2014, the parties reached an agreement to settle the case and have executed a comprehensive written settlement agreement. On September 15, 2014, the court entered an order granting a motion for preliminary approval of the class settlement and held a final approval hearing on February 19, 2015. Settlement of this matter on the agreed terms will have no material adverse effect on the Company's consolidated financial position, results of operations or cash flows.
In our Form 10-K for the period ending December 31, 2013, we initially reported on two separate class action lawsuits filed in Spokane County, Washington, Superior Court against the Company and other defendants arising from the then-proposed Merger,
which the court consolidated. The consolidated litigation generally alleges that directors of Sterling breached their duties to the Sterling shareholders by approving the Merger, failing to take steps to maximize shareholder value, engaging in a flawed sales process, and agreeing to deal protection provisions in the Merger agreement that are alleged to unduly favor the Company. The Company is alleged to have aided and abetted the alleged breaches of duty. The consolidated litigation also alleges that the disclosures approved by the Sterling board in connection with the Merger and the vote thereon are false and misleading in various respects. As relief, the complaints sought to enjoin the Merger and seek, among other things, damages in an unspecified amount and payment of plaintiffs' attorneys' fees and costs. The defendants believe that the lawsuits are without merit. On January 16, 2014, the parties executed a Memorandum of Understanding (the "MOU") that contains the essential terms of a settlement and dismissal of the consolidated cases. The MOU does not call for the payment of any money damages, but required the defendants to make certain additional disclosures relating to the Merger and to pay the attorney fees, costs, and expenses of plaintiffs' counsel incurred in connection with the action. The agreed additional disclosures were made and included in the joint proxy statement/prospectus filed January 22, 2014. The MOU further provides that if the parties cannot agree on the amount of fees, costs, and expenses to be paid by the defendants to plaintiffs' counsel, such amount shall be decided by the court. There has been no significant activity in the cases since the MOU was executed. On September 26, 2014, the parties to the litigation filed a notice of settlement with the Court. The Court preliminarily approved the proposed settlement on December 5, 2014. The Court will consider final approval of the proposed settlement at a hearing scheduled for March 27, 2015.
The Company assumed, as successor-in-interest to Sterling, the defense of litigation matters pending against Sterling. Sterling previously reported that on December 11, 2009, a putative securities class action complaint captioned City of Roseville Employees' Retirement System v. Sterling Financial Corp., et al., No. CV 09-00368-EFS, was filed in the United States District Court for the Eastern District of Washington against Sterling and certain of its current and former officers. On June 18, 2010, lead plaintiff filed a consolidated complaint alleging that the defendants violated sections 10(b) and 20(a) of the Securities Exchange Act of 1934 and SEC Rule 10b-5 by making false and misleading statements concerning Sterling's business and financial results. Plaintiffs sought unspecified damages and attorneys' fees and costs. On August 30, 2010, Sterling moved to dismiss the Complaint, and the court granted the motion to dismiss without prejudice on August 5, 2013. On October 11, 2013, the lead plaintiff filed an amended consolidated complaint with the same defendants, class period, alleged violations, and relief sought. On January 24, 2014, Sterling moved to dismiss the amended consolidated complaint, and on September 17, 2014, the court entered an order dismissing the amended consolidated complaint in its entirety with no further leave to amend. On October 24, 2014, plaintiffs filed a Notice of Appeal to the U.S. Court of Appeals for the Ninth Circuit from the district court's order granting the motion to dismiss the amended consolidated complaint and appellant’s opening brief is due April 3, 2015.
ITEM 4. MINE SAFETY DISCLOSURES.
Not applicable
PART II
ITEM 5. MARKET FOR REGISTRANT'S COMMON EQUITY, RELATED STOCKHOLDER MATTERS AND ISSUER PURCHASES OF EQUITY SECURITIES.
(a) Our common stock is traded on The NASDAQ Global Select Market under the symbol "UMPQ." As of December 31, 2014, there were 400,000,000 common shares authorized for issuance. The following table presents the high and low sales prices of our common stock for each period, based on inter-dealer prices that do not include retail mark-ups, mark-downs or commissions, and cash dividends declared for each period:
|
| | | | | | | | | | | |
| Quarter Ended | High |
| | Low |
| | Cash Dividend Per Share |
|
| December 31, 2014 | $ | 17.98 |
| | $ | 14.94 |
| | $ | 0.15 |
|
| September 30, 2014 | $ | 18.39 |
| | $ | 16.22 |
| | $ | 0.15 |
|
| June 30, 2014 | $ | 19.36 |
| | $ | 19.00 |
| | $ | 0.15 |
|
| March 31, 2014 | $ | 19.60 |
| | $ | 16.50 |
| | $ | 0.15 |
|
| | | | | |
|
| December 31, 2013 | $ | 19.65 |
| | $ | 16.09 |
| | $ | 0.15 |
|
| September 30, 2013 | $ | 17.48 |
| | $ | 15.08 |
| | $ | 0.15 |
|
| June 30, 2013 | $ | 15.29 |
| | $ | 11.45 |
| | $ | 0.20 |
|
| March 31, 2013 | $ | 13.54 |
| | $ | 12.00 |
| | $ | 0.10 |
|
As of December 31, 2014, our common stock was held by approximately 5,255 shareholders of record, a number that does not include beneficial owners who hold shares in "street name", or shareholders from previously acquired companies that have not exchanged their stock. At December 31, 2014, a total of 807,000 stock options, 1,386,000 shares of restricted stock and 675,000 restricted stock units were outstanding.
The payment of future cash dividends is at the discretion of our Board of Directors and subject to a number of factors, including results of operations, general business conditions, growth, financial condition and other factors deemed relevant by the Board of Directors. Further, our ability to pay future cash dividends is subject to certain regulatory requirements and restrictions discussed in the Supervision and Regulation section in Item 1 above.
During 2014, Umpqua's Board of Directors approved a quarterly cash dividend of $0.15 per common share for each quarter. These dividends were made pursuant to our existing dividend policy and in consideration of, among other things, earnings, regulatory capital levels, the overall payout ratio and expected asset growth. We expect that the dividend rate will be reassessed on a quarterly basis by the Board of Directors in accordance with the dividend policy.
We have a dividend reinvestment plan that permits shareholder participants to purchase shares at the then-current market price in lieu of the receipt of cash dividends. Shares issued in connection with the dividend reinvestment plan are purchased in open market transactions.
Equity Compensation Plan Information
The following table sets forth information about equity compensation plans that provide for the award of securities or the grant of options to purchase securities to employees and directors of Umpqua and its subsidiaries and predecessors by merger that were in effect at December 31, 2014.
|
| | | | | | | | | | |
| (shares in thousands) | | | | | |
| | | Equity Compensation Plan Information |
| | | (A) | | (B) | | (C) |
| | | Number of securities | | | | Number of securities |
| | | to be issued | | Weighted average | | remaining available for future |
| | | upon exercise of | | exercise price of | | issuance under equity |
| | | outstanding options | | outstanding options, | | compensation plans excluding |
| Plan category | | warrants and rights | | warrants and rights (4) | | securities reflected in column (A) |
| Equity compensation plans | | | | | | |
| approved by security holders | | | | | | |
| 2013 Stock Incentive Plan (1) | | — |
| | $ | — |
| | 3,000 |
|
| 2003 Stock Incentive Plan (1) | | 708 |
| | $ | 17.64 |
| | — |
|
| 2007 Long Term Incentive Plan (1),(2) | | 25 |
| | $ | — |
| | — |
|
| Other (3) | | 787 |
| | $ | 12.71 |
| | — |
|
| Total | | 1,520 |
| | $ | 16.80 |
| | 3,000 |
|
| | |
| |
| |
|
| Equity compensation plans | |
| |
| |
|
| not approved by security holders | | — |
| | $ | — |
| | — |
|
| | |
| |
| |
|
| Total | | 1,520 |
| | $ | 16.80 |
| | 3,000 |
|
| |
| (1) | At the annual meeting on April 16, 2013, shareholders approved the Company's 2013 Incentive Plan (the "2013 Plan"), which, among other things, authorizes the issuance of equity awards to directors and employees and reserves 4,000,000 shares of the Company's common stock for issuance under the plan. With the adoption of the 2013 Plan, no additional awards will be issued from the 2003 Stock Incentive Plan or the 2007 Long Term Incentive Plan. Under the terms of the 2013 Plan, options and awards generally vest ratably over a period of three to five years, the exercise price of each option equals the market price of the Company's common stock on the date of the grant, and the maximum term is ten years. |
| |
| (2) | As of December 31, 2014, 25,000 restricted stock units are expected to vest as the performance-based targets were satisfied and there are no securities available for future issuance. |
| |
| (3) | Includes other Umpqua stock plans and stock plans assumed through previous mergers. |
| |
| (4) | Weighted average exercise price is based solely on securities with an exercise price. |
(b) Not applicable.
| |
| (c) | The Company's share repurchase plan, which was first approved by the Board and announced in August 2003, was amended on September 29, 2011 to increase the number of common shares available for repurchase under the plan to 15 million shares. The repurchase program was extended in April 2013 to run through June 2015. As of December 31, 2014, a total of 12.0 million shares remained available for repurchase. The Company did not repurchase any shares under the repurchase plan during 2014, repurchased 98,027 shares in 2013, and 512,280 shares under the repurchase plan in 2012. The timing and amount of future repurchases will depend upon the market price for our common stock, securities laws restricting repurchases, asset growth, earnings, and our capital plan. |
There were 161,568 and 438,136 shares tendered in connection with option exercises during the years ended December 31, 2014 and 2013, respectively. Restricted shares cancelled to pay withholding taxes totaled 107,131 and 48,514 shares during the years ended December 31, 2014 and 2013, respectively. There were 129,766 restricted stock units cancelled to pay withholding taxes during the years ended December 31, 2014 and none in 2013, respectively.
Stock Performance Graph
The following chart, which is furnished not filed, compares the yearly percentage changes in the cumulative shareholder return on our common stock during the five fiscal years ended December 31, 2014, with (i) the Total Return Index for NASDAQ Bank Stocks (ii) the Total Return Index for The Nasdaq Stock Market (U.S. Companies) and (iii) the Standard and Poor's 500. This comparison assumes $100.00 was invested on December 31, 2009, in our common stock and the comparison indices, and assumes the reinvestment of all cash dividends prior to any tax effect and retention of all stock dividends. Price information from December 31, 2009 to December 31, 2014, was obtained by using the NASDAQ closing prices as of the last trading day of each year.
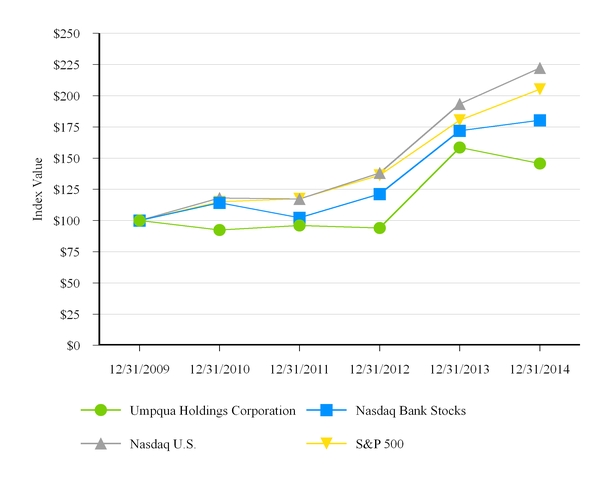
|
| | | | | | |
| | Period Ending |
| 12/31/2009 | 12/31/2010 | 12/31/2011 | 12/31/2012 | 12/31/2013 | 12/31/2014 |
| Umpqua Holdings Corporation | $100.00 | $92.32 | $96.12 | $93.93 | $158.45 | $145.76 |
| Nasdaq Bank Stocks | $100.00 | $114.16 | $102.17 | $121.26 | $171.86 | $180.31 |
| Nasdaq U.S. | $100.00 | $118.15 | $117.22 | $138.02 | $193.47 | $222.16 |
| S&P 500 | $100.00 | $115.06 | $117.49 | $136.30 | $180.44 | $205.14 |
ITEM 6. SELECTED FINANCIAL DATA.
Umpqua Holdings Corporation
Annual Financial Trends
|
| | | | | | | | | | | | | | | |
| (in thousands, except per share data) | 2014 | 2013 | 2012 | 2011 | 2010 |
| Interest income | $ | 822,521 |
| $ | 442,846 |
| $ | 456,085 |
| $ | 501,753 |
| $ | 488,596 |
|
| Interest expense | 48,693 |
| 37,881 |
| 48,849 |
| 73,301 |
| 93,812 |
|
| Net interest income | 773,828 |
| 404,965 |
| 407,236 |
| 428,452 |
| 394,784 |
|
| Provision for loan and lease losses | 40,241 |
| 10,716 |
| 29,201 |
| 62,361 |
| 118,819 |
|
| Non-interest income | 179,292 |
| 121,441 |
| 136,829 |
| 84,118 |
| 75,904 |
|
| Non-interest expense | 601,746 |
| 355,825 |
| 357,314 |
| 338,611 |
| 311,063 |
|
| Merger related expenses | 82,317 |
| 8,836 |
| 2,338 |
| 360 |
| 6,675 |
|
| Income before provision for income taxes | 228,816 |
| 151,029 |
| 155,212 |
| 111,238 |
| 34,131 |
|
| Provision for income taxes | 81,296 |
| 52,668 |
| 53,321 |
| 36,742 |
| 5,805 |
|
| Net income | 147,520 |
| 98,361 |
| 101,891 |
| 74,496 |
| 28,326 |
|
| Preferred stock dividends | — |
| — |
| — |
| — |
| 12,192 |
|
| Dividends and undistributed earnings allocated to participating securities | 484 |
| 788 |
| 682 |
| 356 |
| 67 |
|
| Net earnings available to common shareholders | $ | 147,036 |
| $ | 97,573 |
| $ | 101,209 |
| $ | 74,140 |
| $ | 16,067 |
|
| | | | | | |
| YEAR END | | | | | |
| Assets | $ | 22,613,274 |
| $ | 11,636,112 |
| $ | 11,795,443 |
| $ | 11,562,858 |
| $ | 11,668,710 |
|
| Earning assets | 19,370,349 |
| 10,267,981 |
| 10,465,505 |
| 10,263,923 |
| 10,374,131 |
|
Loans and leases (1) | 15,327,732 |
| 7,728,166 |
| 7,176,433 |
| 6,524,869 |
| 6,447,606 |
|
| Deposits | 16,892,099 |
| 9,117,660 |
| 9,379,275 |
| 9,236,690 |
| 9,433,805 |
|
| Term debt | 1,006,395 |
| 251,494 |
| 253,605 |
| 255,676 |
| 262,760 |
|
| Junior subordinated debentures, at fair value | 249,294 |
| 87,274 |
| 85,081 |
| 82,905 |
| 80,688 |
|
| Junior subordinated debentures, at amortized cost | 101,576 |
| 101,899 |
| 110,985 |
| 102,544 |
| 102,866 |
|
| Common shareholders' equity | 3,780,997 |
| 1,727,426 |
| 1,724,039 |
| 1,672,413 |
| 1,642,574 |
|
| Total shareholders' equity | 3,780,997 |
| 1,727,426 |
| 1,724,039 |
| 1,672,413 |
| 1,642,574 |
|
| Common shares outstanding | 220,161 |
| 111,973 |
| 111,890 |
| 112,165 |
| 114,537 |
|
| | | | | | |
| AVERAGE | | | | | |
| Assets | $ | 19,169,098 |
| $ | 11,507,688 |
| $ | 11,499,499 |
| $ | 11,600,435 |
| $ | 10,830,486 |
|
| Earning assets | 16,484,664 |
| 10,224,606 |
| 10,252,167 |
| 10,332,242 |
| 9,567,341 |
|
Loans and leases (1) | 13,003,762 |
| 7,367,602 |
| 6,707,194 |
| 6,430,797 |
| 6,465,021 |
|
| Deposits | 14,407,331 |
| 9,057,673 |
| 9,124,619 |
| 9,301,978 |
| 8,607,980 |
|
| Term debt | 815,017 |
| 252,546 |
| 254,601 |
| 257,496 |
| 261,170 |
|
| Junior subordinated debentures | 301,525 |
| 189,237 |
| 187,139 |
| 184,115 |
| 184,134 |
|
| Common shareholders' equity | 3,137,858 |
| 1,729,083 |
| 1,701,403 |
| 1,671,893 |
| 1,589,393 |
|
| Total shareholders' equity | 3,137,858 |
| 1,729,083 |
| 1,701,403 |
| 1,671,893 |
| 1,657,544 |
|
| Basic common shares outstanding | 186,550 |
| 111,938 |
| 111,935 |
| 114,220 |
| 107,922 |
|
| Diluted common shares outstanding | 187,544 |
| 112,176 |
| 112,151 |
| 114,409 |
| 108,153 |
|
| | | | | | |
| PER COMMON SHARE DATA | | | | | |
| Basic earnings | $ | 0.79 |
| $ | 0.87 |
| $ | 0.90 |
| $ | 0.65 |
| $ | 0.15 |
|
| Diluted earnings | 0.78 |
| 0.87 |
| 0.90 |
| 0.65 |
| 0.15 |
|
| Book value | 17.17 |
| 15.43 |
| 15.41 |
| 14.91 |
| 14.34 |
|
Tangible book value (2) | 8.80 |
| 8.49 |
| 9.28 |
| 8.87 |
| 8.39 |
|
| Cash dividends declared | 0.60 |
| 0.60 |
| 0.34 |
| 0.24 |
| 0.20 |
|
| | | | | | |
|
| | | | | | | | | | | | | | | |
| (dollars in thousands) | | | | | |
| | 2014 | 2013 | 2012 | 2011 | 2010 |
| PERFORMANCE RATIOS | | | | | |
Return on average assets (3) | 0.77 | % | 0.85 | % | 0.88 | % | 0.64 | % | 0.15 | % |
Return on average common shareholders' equity (4) | 4.69 | % | 5.64 | % | 5.95 | % | 4.43 | % | 1.01 | % |
Return on average tangible common shareholders' equity (5) | 9.16 | % | 9.78 | % | 9.87 | % | 7.47 | % | 1.76 | % |
Efficiency ratio (6) | 71.37 | % | 68.68 | % | 65.54 | % | 65.58 | % | 66.90 | % |
| Average common shareholders' equity to average assets | 16.37 | % | 15.03 | % | 14.80 | % | 14.41 | % | 14.68 | % |
Leverage ratio (7) | 10.99 | % | 10.90 | % | 11.44 | % | 10.91 | % | 10.56 | % |
Net interest margin (fully tax equivalent) (8) | 4.73 | % | 4.01 | % | 4.02 | % | 4.19 | % | 4.17 | % |
Non-interest income to total net revenue (9) | 18.81 | % | 23.07 | % | 25.15 | % | 16.41 | % | 16.13 | % |
Dividend payout ratio (10) | 75.95 | % | 68.97 | % | 37.78 | % | 36.92 | % | 133.33 | % |
| | | | | | |
| ASSET QUALITY | | | | | |
| Non-performing loans and leases | $ | 59,553 |
| $ | 35,321 |
| $ | 70,968 |
| $ | 91,383 |
| $ | 145,248 |
|
| Non-performing assets | 97,495 |
| 59,256 |
| 98,480 |
| 145,049 |
| 207,902 |
|
| Allowance for loan and lease losses | 116,167 |
| 95,085 |
| 103,666 |
| 107,288 |
| 104,642 |
|
| Net charge-offs | 19,159 |
| 19,297 |
| 32,823 |
| 59,715 |
| 121,834 |
|
| Non-performing loans and leases to loans and leases | 0.39 | % | 0.46 | % | 0.99 | % | 1.40 | % | 2.25 | % |
| Non-performing assets to total assets | 0.43 | % | 0.51 | % | 0.83 | % | 1.25 | % | 1.78 | % |
| Allowance for loan and lease | | | | | |
| losses to total loans and leases | 0.76 | % | 1.23 | % | 1.44 | % | 1.64 | % | 1.62 | % |
| Allowance for credit losses to loans and leases | 0.78 | % | 1.25 | % | 1.46 | % | 1.66 | % | 1.64 | % |
| Net charge-offs to average loans and leases | 0.15 | % | 0.26 | % | 0.49 | % | 0.93 | % | 1.88 | % |
| |
| (1) | Excludes loans held for sale |
| |
| (2) | Average common shareholders' equity less average intangible assets (excluding MSR) divided by shares outstanding at the end of the year. See Management's Discussion and Analysis of Financial Condition and Results of Operation"-"Results of Operations - Overview" for the reconciliation of non-GAAP financial measures, in Item 7 of this report. |
| |
| (3) | Net earnings available to common shareholders divided by average assets. |
| |
| (4) | Net earnings available to common shareholders divided by average common shareholders' equity. |
| |
| (5) | Net earnings available to common shareholders divided by average common shareholders' equity less average intangible assets. See Management's Discussion and Analysis of Financial Condition and Results of Operations-"Results of Operations - Overview" for the reconciliation of non-GAAP financial measures, in Item 7 of this report. |
| |
| (6) | Non-interest expense divided by the sum of net interest income (fully tax equivalent) and non-interest income. |
| |
| (7) | Tier 1 capital divided by leverage assets. Leverage assets are defined as quarterly average total assets, net of goodwill, intangibles and certain other items as required by the Federal Reserve. |
| |
| (8) | Net interest margin (fully tax equivalent) is calculated by dividing net interest income (fully tax equivalent) by average interest earnings assets. |
| |
| (9) | Non-interest income divided by the sum of non-interest revenue and net interest income. |
| |
| (10) | Dividends declared per common share divided by basic earnings per common share. |
ITEM 7. MANAGEMENT'S DISCUSSION AND ANALYSIS OF FINANCIAL CONDITION AND RESULTS OF OPERATIONS
FORWARD LOOKING STATEMENTS AND RISK FACTORS
See the discussion of forward-looking statements and risk factors in Part I Item 1 and Item 1A of this report.
EXECUTIVE OVERVIEW
Significant items for the year ended December 31, 2014 were as follows:
Financial Performance
Net earnings available to common shareholders per diluted common share were $0.78 for the year ended December 31, 2014, as compared to $0.87 for the year ended December 31, 2013. Operating earnings per diluted common share, defined as earnings available to common shareholders before net gains or losses on junior subordinated debentures carried at fair value, net of tax and merger related expenses, net of tax, divided by the same diluted share total used in determining diluted earnings per common share, were $1.08 for the year ended December 31, 2014, as compared to operating income per diluted common share of $0.94 for the year ended December 31, 2013. Operating income per diluted share is considered a "non-GAAP" financial measure. More information regarding this measurement and reconciliation to the comparable GAAP measurement is provided under the heading Results of Operations - Overview below.
Net interest margin, on a tax equivalent basis, was 4.73% for the year ended December 31, 2014, compared to 4.01% for the year ended December 31, 2013. The increase in net interest margin is primarily attributable to a higher yield on interest-earning assets due to the acquisitions of Sterling and of FinPac, as well as a lower cost of funds.
Residential mortgage banking revenue was $77.3 million for 2014, compared to $78.9 million for 2013. The decrease was the result of lower gain on sale margins, and a larger loss from the change in the fair value of the MSR asset, consistent with the decline in mortgage interest rates, partially offset by higher mortgage originations and servicing fees.
Total gross loans and leases were $15.3 billion as of December 31, 2014, an increase of $7.6 billion, or 98.3%, as compared to December 31, 2013. This increase is primarily the result of the merger with Sterling which added $7.1 billion of loans at acquisition.
Total deposits were $16.9 billion as of December 31, 2014, an increase of $7.8 billion, or 85.3%, as compared to December 31, 2013. The increase resulted primarily from the merger with Sterling which added $7.1 billion of deposits at acquisition.
Total consolidated assets were $22.6 billion as of December 31, 2014, as compared to $11.6 billion at December 31, 2013.
Credit Quality
Non-performing assets increased to $97.5 million, or 0.43% of total assets, as of December 31, 2014, as compared to $59.3 million, or 0.51% of total assets, as of December 31, 2013. Non-performing loans and leases increased to $59.6 million, or 0.39% of total loans and leases, as of December 31, 2014, as compared to $35.3 million, or 0.46% of total loans and leases as of December 31, 2013.
Net charge-offs on loans were $19.2 million for the year ended December 31, 2014, or 0.15% of average loans and leases, as compared to net charge-offs of $19.3 million, or 0.26% of average loans and leases, for the year ended December 31, 2013.
The provision for loan and lease losses was $40.2 million for 2014, as compared to $10.7 million recognized for 2013. The increase is due to new production of loans and leases during 2014, requiring a higher allowance for loan and lease losses.
Capital and Growth Initiatives
Total risk based capital increased to 15.2% as of December 31, 2014, compared to 14.7% as of December 31, 2013, primarily due to the effects of the Sterling merger.
Declared cash dividends of $0.60 per common share for 2014 and 2013.
Completed the Sterling merger in April 2014.
SUMMARY OF CRITICAL ACCOUNTING POLICIES
The SEC defines "critical accounting policies" as those that require application of management's most difficult, subjective or complex judgments, often as a result of the need to make estimates about the effect of matters that are inherently uncertain and may change in future periods. Our significant accounting policies are described in Note 1 in the Notes to Consolidated Financial Statements in Item 8 of this report. Not all of these significant accounting policies require management to make difficult, subjective or complex judgments or estimates. Management believes that the following policies would be considered critical under the SEC's definition.
Allowance for Loan and Lease Losses
(“ALLL”) Methodologyand Reserve for Unfunded Commitments
The Bank performs regular credit reviews of the loan and lease portfolio to determine the credit quality and adherence to underwriting standards. When loans and leases are originated, they are assigned a risk rating that is reassessed periodically during the term of the loan through the credit review process. The
Company’sBank's risk rating methodology assigns risk ratings ranging from 1 to 10, where a higher rating represents higher risk. The 10 risk rating categories are a primary factor in determining an appropriate amount for the allowance for loan and lease losses. The Bank has a management
ALLLAllowance for Loan and Lease Losses ("ALLL") Committee, which is responsible for, among other things, regularly reviewing the ALLL methodology, including loss factors, and ensuring that it is designed and applied in accordance with generally accepted accounting principles. The ALLL Committee reviews and approves loans and leases recommended for impaired status. The ALLL Committee also approves removing loans and leases from impaired status. The
Bank’sBank's Audit and Compliance Committee provides board oversight of the ALLL process and reviews and approves the ALLL methodology on a quarterly basis.
Each risk rating is assessed an inherent credit loss factor that determines the amount of the allowance for loan and lease losses provided for that group of loans and leases with similar risk rating. Credit loss factors may vary by region based on
management’smanagement's belief that there may ultimately be different credit loss rates experienced in each region.
Regular credit reviews of the portfolio also identify loans that are considered potentially impaired. Potentially impaired loans are referred to the ALLL Committee which reviews and approves designated loans as impaired. A loan is considered impaired when based on current information and events, we determine that we will probably not be able to collect all amounts due according to the loan contract, including scheduled interest payments. When we identify a loan as impaired, we measure the impairment using discounted cash flows, except when the sole remaining source of the repayment for the loan is the liquidation of the collateral. In these cases, we use the current fair value of the collateral, less selling costs, instead of discounted cash flows. If we determine that the value of the impaired loan is less than the recorded investment in the loan, we either recognize an impairment reserve as a specific component to be provided for in the allowance for loan and lease losses or charge-off the impaired balance on collateral dependent loans if it is determined that such amount represents a confirmed loss. The combination of the risk rating-based allowance component and the impairment reserve allowance component lead to an allocated allowance for loan and lease losses.
The Bank may also maintain an unallocated allowance amount to provide for other credit losses inherent in a loan and lease portfolio that may not have been contemplated in the credit loss factors. This unallocated amount generally comprises less than 10%5% of the allowance, but may be maintained at higher levels during times of deteriorating economic conditions characterized by falling real estate values. The unallocated amount is reviewed periodically based on trends in credit losses, the results of credit reviews and overall economic trends. As of December 31, 2011, the2014, there was no unallocated allowance amount represented 5%amount.
The reserve for unfunded commitments ("RUC") is established to absorb inherent losses associated with our commitment to lend funds, such as with a letter or line of credit. The adequacy of the
allowance.ALLL and RUC are monitored on a regular basis and are based on management's evaluation of numerous factors. These factors include the quality of the current loan portfolio; the trend in the loan portfolio's risk ratings; current economic conditions; loan concentrations; loan growth rates; past-due and non-performing trends; evaluation of specific loss estimates for all significant problem loans; historical charge-off and recovery experience; and other pertinent information.
Management believes that the ALLL was adequate as of December 31, 2011.2014. There is, however, no assurance that future loan losses will not exceed the levels provided for in the ALLL and could possibly result in additional charges to the provision for loan and lease losses. In addition, bank regulatory authorities, as part of their periodic examination of the Bank, may require additional charges to the provision for loan and lease losses in future periods if warranted as a result of their review. Approximately 80% of our total loan portfolio is secured by real estate, and a significant decline in real estate market values may require an increase in the allowance for loan and lease losses. The U.S. recession, the housing market downturn, and declining real estate values in our markets have negatively impacted aspects of our residential development, commercial real estate, commercial construction and commercial loan portfolios, and have led to an increase in non-performing loans and the allowance for loan and lease losses. A continued deterioration or a prolonged delay in economic recovery in our markets may adversely affect our loan portfolio and may lead to additional charges to the provision for loan and lease losses.EmployeesAs of December 31, 2011, we had a total of 2,255 full-time equivalent employees. None of the employees are subject to a collective bargaining agreement and management believes its relations with employees to be good. Umpqua Bank was named #69 onFortune magazine’s 2012 list of “100 Best Companies to Work For”, #25 on the 2011 list, #23 on the 2010 list, and #34 on the 2009 list. Information regarding employment agreements with our executive officers is contained in Item 11 below, which item is incorporated by reference to our proxy statement for the 2012 annual meeting of shareholders.
Government Policies
The operations of our subsidiaries are affected by state and federal legislative changes and by policies of various regulatory authorities. These policies include, for example, statutory maximum legal lending rates, domestic monetary policies of the Board of Governors of the Federal Reserve System, United States fiscal policy, and capital adequacy and liquidity constraints imposed by federal and state regulatory agencies. Congress enacted theEmergency Economic Stabilization Act of 2008 (“EESA”), which granted significant authority to the U.S. Department of the Treasury (the “Treasury”) to invest in financial institutions, guarantee debt, buy troubled assets and take other action designed to stabilize financial markets. In November 2008, the Company closed a transaction under the Capital Purchase Program (“CPP”) in which the Company issued 214,181 shares of cumulative preferred stock to the Treasury and issued a warrant to purchase 2,221,795 (reduced in 2009 to 1,110,898) shares of common stock at $14.46 per share in exchange for $214,181,000. Agreements executed in connection with the CPP transaction placed restrictions on compensation payable to senior executive officers and provided that the Company may not declare dividends that exceed $0.19 per common share per quarter without Treasury’s prior written consent. Federal and state governments have been actively responding to the financial market crisis that unfolded in 2008 and legislative and regulatory initiatives are expected to continue for the foreseeable future. In connection with the Company’s public offering in February 2010, Umpqua repurchased the preferred stock from the Treasury and the warrant in March 2010. See Note 22 of theNotes to the Consolidated Financial Statement in Item 8 below.
Supervision and Regulation
General. We are extensively regulated under federal and state law. These laws and regulations are generally intended to protect depositors and customers, not shareholders. To the extent that the following information describes statutory or regulatory provisions, it is qualified in its entirety by reference to the particular statute or regulation. Any change in applicable laws or regulations may have a material effect on our business and prospects. Our operations may be affected by legislative changes and by the policies of various regulatory authorities. We cannot accurately predict the nature or the extent of the effects on our business and earnings that fiscal or monetary policies, or new federal or state legislation may have in the future. Umpqua is subject to the disclosure and regulatory requirements of the Securities Act of 1933, as amended, and the Securities Exchange Act of 1934, as amended, both as administered by the Securities and Exchange Commission. As a listed company on NASDAQ, Umpqua is subject to NASDAQ rules for listed companies.
Holding Company Regulation. We are a registered financial holding company under the Gramm-Leach-Bliley Act of 1999 (the “GLB Act”), and are subject to the supervision of, and regulation by, the Board of Governors of the Federal Reserve System (the “Federal Reserve”). As a financial holding company, we are examined by and file reports with the Federal Reserve. The Federal Reserve expects a bank holding company to serve as a source of financial and managerial strength to its subsidiary bank and, under appropriate circumstances, to commit resources to support the subsidiary bank.
Financial holding companies are bank holding companies that satisfy certain criteria and are permitted to engage in activities that traditional bank holding companies are not. The qualifications and permitted activities of financial holdings companies are described below under “Regulatory Structure of the Financial Services Industry.”
Federal and State Bank Regulation. Umpqua Bank, as a state chartered bank with deposits insured by the FDIC, is primarily subject to the supervision and regulation of the Oregon Department of Consumer and Business Services Division of Finance and Corporate Securities, the Washington Department of Financial Institutions, the California Department of Financial Institutions, the Nevada Division of Financial Institutions , the FDIC and the Consumer Financial Protection Bureau (CFPB). These agencies may prohibit the Bank from engaging in what they believe constitute unsafe or unsound banking practices. Our primary state regulator (the State of Oregon) regularly examines the Bank or participates in joint examinations with the FDIC.
Umpqua Holdings Corporation
The Community Reinvestment Act (“CRA”) requires that, in connection with examinations of financial institutions within its jurisdiction, the FDIC evaluate the record of the financial institutions in meeting the credit needs of their local communities, including low- and moderate-income neighborhoods, consistent with the safe and sound operation of those institutions. These factors are also considered in evaluating mergers, acquisitions and applications to open a branch or new facility. A less than “Satisfactory” rating would result in the suspension of any growth of the Bank through acquisitions or opening de novo branches until the rating is improved. As of the most recent CRA examination in April 2010, the Bank’s CRA rating was “Satisfactory.”
Banks are also subject to certain restrictions imposed by the Federal Reserve Act on extensions of credit to executive officers, directors, principal shareholders or any related interest of such persons. Extensions of credit must be made on substantially the same terms, including interest rates and collateral as, and follow credit underwriting procedures that are not less stringent than, those prevailing at the time for comparable transactions with persons not affiliated with the bank, and must not involve more than the normal risk of repayment or present other unfavorable features. Banks are also subject to certain lending limits and restrictions on overdrafts to such persons. A violation of these restrictions may result in the assessment of substantial civil monetary penalties on the affected bank or any officer, director, employee, agent or other person participating in the conduct of the affairs of that bank, the imposition of a cease and desist order, and other regulatory sanctions.
The Federal Reserve Act and related Regulation W limit the amount of certain loan and investment transactions between the Bank and its affiliates, require certain levels of collateral for such loans, and limit the amount of advances to third parties that may be collateralized by the securities of Umpqua or its subsidiaries. Regulation W requires that certain transactions between the Bank and its affiliates be on terms substantially the same, or at least as favorable to the Bank, as those prevailing at the time for comparable transactions with or involving nonaffiliated companies or, in the absence of comparable transactions, on terms and under circumstances, including credit standards, that in good faith would be offered to or would apply to nonaffiliated companies. Umpqua and its subsidiaries have adopted an Affiliate Transactions Policy and have entered into various affiliate agreements in compliance with Regulation W.
The Federal Reserve and the FDIC have adopted non-capital safety and soundness standards for institutions. These standards cover internal controls, information and internal audit systems, loan documentation, credit underwriting, interest rate exposure, asset growth, compensation, fees and benefits, and standards for asset quality, earnings and stock valuation. An institution that fails to meet these standards must develop a plan acceptable to the agency, specifying the steps that it will take to meet the standards. Failure to submit or implement such a plan may subject the institution to regulatory sanctions. We believe that the Bank is in compliance with these standards.
Federal Deposit Insurance. Substantially all deposits with Umpqua Bank are insured up to applicable limits by the Deposit Insurance Fund (“DIF”) of the FDIC and are subject to deposit insurance assessments to maintain the DIF. The FDIC uses a risk-based assessment system that imposes insurance premiums based upon a bank’s capital level and supervisory ratings. The base assessment rates under the Federal Deposit Insurance Reform Act of 2005 (“Reform Act”), enacted in February 2006, ranged from $0.02 to $0.40 per $100 of deposits annually. The FDIC could increase or decrease the assessment rate schedule five basis points (annualized) higher or lower than the base rates in order to manage the DIF to prescribed statutory target levels. For 2007 the effective assessment amounts were $0.03 above the base rate amounts. Assessment rates for well managed, well capitalized institutions ranged from $0.05 to $0.07 per $100 of deposits annually. The Bank’s assessment rate for 2008 fell within this range. In 2007, the FDIC issued one-time assessment credits that could be used to offset this expense. The Bank’s credit was fully utilized in 2007 and covered the majority of that year’s assessment. The Bank did not have any remaining credit to offset assessments in 2008.
In December 2008, the FDIC adopted a rule that amended the system for risk-based assessments and changed assessment rates in attempt to restore targeted reserve ratios in the DIF. Effective January 1, 2009, the risk-based assessment rates were uniformly raised by seven basis points (annualized). On February 27, 2009, the FDIC further modified the risk-based assessment system, effective April 1, 2009, to effectively require larger risk institutions to pay a larger share of the assessment. Characteristics of larger risk institutions include a significant reliance on secured liabilities or brokered deposits, particularly when combined with rapid asset growth. The rule also provided incentives for institutions to hold long-term unsecured debt
and, for smaller institutions, high levels of Tier 1 capital. The initial base assessment rates range from $0.12 to $0.45 per $100 of deposits annually. After potential adjustments related to unsecured debt, secured liabilities and brokered deposit balances, the final total assessment rates range from $0.07 to $0.775 per $100 of deposits annually. Initial base assessment rates for well managed, well capitalized institutions ranged from $0.12 to $0.16 per $100 of deposits annually. The Bank’s assessment rate for 2010 fell within this range.
In October 2010, the FDIC adopted a new DIF restoration plan to ensure that the fund reserve ratio reaches 1.35% by September 30, 2020, as required by the Dodd-Frank Act. Under the new restoration plan, the FDIC will forego the uniform three-basis point increase in initial assessment rates schedules for January 1, 2011 and maintain the current schedule of assessment rates. At least semi-annually, the FDIC will update its loss and income projections for the DIF and, if needed, increase or decrease assessment rates. On February 7, 2011, the FDIC adopted a final rule modifying the risk-based assessment system from a domestic deposit base to a scorecard based assessment system, effective April 1, 2011. Effective as of April 1, 2011, the Bank was categorized as a large institution as the Bank has more than $10 billion in assets. The initial base assessment rates range from five to 35 basis points. After potential adjustments related to unsecured debt and brokered deposit balances, the final total assessment rates range from 2.5 to 45 basis points. Initial base assessment rates for large institutions ranged from five to 35 basis points. The Bank’s assessment rate for 2011 fell at the low end of this range. Further increases in the assessment rate could have a material adverse effect on our earnings, depending upon the amount of the increase.
In 2006, the Reform Act increased the deposit insurance limit for certain retirement plan deposit accounts from $100,000 to $250,000. The basic insurance limit for other deposits, including individuals, joint account holders, businesses, government entities, and trusts, remained at $100,000. The Reform Act also provided for the merger of the two deposit insurance funds administered by the FDIC, the Bank Insurance Fund (“BIF”) and the Savings Association Insurance Fund (“SAIF”), into the DIF. On October 3, 2008, the EESA temporarily raised the basic limit on federal deposit insurance coverage from $100,000 to $250,000 per depositor. The basic deposit insurance limit would have returned to $100,000 after December 31, 2009. On May 20, 2009, the Helping Families Save Their Homes Act extended the temporary increase in the standard maximum deposit insurance amount to $250,000 per depositor through December 31, 2013. The standard maximum deposit insurance amount would return to $100,000 on January 1, 2014. The Dodd-Frank Act permanently raises the current standard maximum federal deposit insurance amount from $100,000 to $250,000 per qualified account.
In November 2008, the FDIC approved the final ruling establishing the Transaction Account Guarantee Program (“TAGP”) as part of the Temporary Liquidity Guarantee Program (“TLGP”). Under this program, effective immediately and through December 31, 2009, all non-interest bearing transaction accounts became fully guaranteed by the FDIC for the entire amount in the account. This unlimited coverage also extended to NOW (interest bearing deposit accounts) earning an interest rate no greater than 0.50% and all IOLTAs (lawyers’ trust accounts). Coverage under the TAGP, funded through insurance premiums paid by participating financial institutions, was in addition to and separate from the additional coverage announced under EESA. In August 2009, the FDIC extended the TAGP portion of the TLGP through June 30, 2010. In June 2010, the FDIC extended the TAGP portion of the TLGP for an additional six months, from July 1, 2010 to December 31, 2010. The rule required that interest rates on qualifying NOW accounts offered by banks participating in the program be reduced to 0.25% from 0.50%. The rule provided for an additional extension of the program, without further rulemaking, for a period of time not to exceed December 31, 2011. Umpqua elected to participate in the TAGP program through the extended period. In July 2010, the Dodd-Frank Act, was enacted which provides for unlimited deposit insurance for noninterest bearing transactions accounts (excluding NOW, but including IOLTAs) beginning December 31, 2010 for a period of two years.
The FDIC may terminate the deposit insurance of any insured depository institution if it determines that the institution has engaged in or is engaging in unsafe and unsound banking practices, is in an unsafe or unsound condition or has violated any applicable law, regulation or order or any condition imposed in writing by, or pursuant to, any written agreement with the FDIC. The termination of deposit insurance for the Bank could have a material adverse effect on our financial condition and results of operations due to the fact that the Bank’s liquidity position would likely be affected by deposit withdrawal activity.
Umpqua Holdings Corporation
Dividends. Under the Oregon Bank Act and the Federal Deposit Insurance Corporation Improvement Act of 1991, the Bank is subject to restrictions on the payment of cash dividends to its parent company. A bank may not pay cash dividends if that payment would reduce the amount of its capital below that necessary to meet minimum applicable regulatory capital requirements. In addition, under the Oregon Bank Act, the amount of the dividend paid by the Bank may not be greater than net unreserved retained earnings, after first deducting to the extent not already charged against earnings or reflected in a reserve, all bad debts, which are debts on which interest is unpaid and past due at least six months unless the debt is fully secured and in the process of collection; all other assets charged-off as required by Oregon bank regulators or a state or federal examiner; and all accrued expenses, interest and taxes of the Bank. In addition, state and federal regulatory authorities are authorized to prohibit banks and holding companies from paying dividends that would constitute an unsafe or unsound banking practice. The Federal Reserve has issued a policy statement on the payment of cash dividends by bank holding companies, which expresses the Federal Reserve’s view that a bank holding company should pay cash dividends only to the extent that its net income for the past year is sufficient to cover both the cash dividends and a rate of earnings retention that is consistent with the holding company’s capital needs, asset quality and overall financial condition.
Capital Adequacy. The federal and state bank regulatory agencies use capital adequacy guidelines in their examination and regulation of holding companies and banks. If capital falls below the minimum levels established by these guidelines, a holding company or a bank may be denied approval to acquire or establish additional banks or non-bank businesses or to open new facilities.
The FDIC and Federal Reserve have adopted risk-based capital guidelines for holding companies and banks. The risk-based capital guidelines are designed to make regulatory capital requirements more sensitive to differences in risk profile among holding companies and banks, to account for off-balance sheet exposure and to minimize disincentives for holding liquid assets. Assets and off-balance sheet items are assigned to broad risk categories, each with appropriate weights. The resulting capital ratios represent capital as a percentage of total risk-weighted assets and off-balance sheet items. The capital adequacy guidelines limit the degree to which a holding company or bank may leverage its equity capital.
Federal regulations establish minimum requirements for the capital adequacy of depository institutions, such as the Bank. Banks with capital ratios below the required minimums are subject to certain administrative actions, including prompt corrective action, the termination of deposit insurance upon notice and hearing, or a temporary suspension of insurance without a hearing.
The Federal Deposit Insurance Corporation Improvement Act of 1991 (“FDICIA”) requires federal banking regulators to take “prompt corrective action” with respect to a capital-deficient institution, including requiring a capital restoration plan and restricting certain growth activities of the institution. Umpqua could be required to guarantee any such capital restoration plan required of the Bank if the Bank became undercapitalized. Pursuant to FDICIA, regulations were adopted defining five capital levels: well capitalized, adequately capitalized, undercapitalized, severely undercapitalized and critically undercapitalized. Under the regulations, the Bank is considered “well capitalized” as of December 31, 2011.
Federal and State Regulation of Broker-Dealers. Umpqua Investments, Inc. is a fully disclosed introducing broker-dealer clearing through First Clearing LLC. Umpqua Investments is regulated by the Financial Industry Regulatory Authority (“FINRA”) and has deposits insured through the Securities Investors Protection Corp (“SIPC”) as well as third party insurers. FINRA performs regular examinations of the firm that include reviews of policies, procedures, recordkeeping, trade practices, and customer protection as well as other inquiries.
SIPC protects client securities and cash up to $500,000, including $100,000 for cash with additional coverage provided through First Clearing for the remaining net equity balance in a brokerage account, if any. This coverage does not include losses in investment accounts.
Broker-Dealer and Related Regulatory Supervision. Umpqua Investments is a member of, and is subject to the regulatory supervision of, FINRA. Areas subject to this regulatory review include compliance with trading rules, financial reporting, investment suitability for clients, and compliance with stock exchange rules and regulations.
Effects of Government Monetary Policy. Our earnings and growth are affected not only by general economic conditions, but also by the fiscal and monetary policies of the federal government, particularly the Federal Reserve. The Federal Reserve
implements national monetary policy for such purposes as curbing inflation and combating recession, through its open market operations in U.S. Government securities, control of the discount rate applicable to borrowings from the Federal Reserve, and establishment of reserve requirements against certain deposits. These activities influence growth of bank loans, investments and deposits, and also affect interest rates charged on loans or paid on deposits. The nature and impact of future changes in monetary policies and their impact on us cannot be predicted with certainty.
Regulatory Structure of the Financial Services Industry. Federal laws and regulations governing banking and financial services underwent significant changes in recent years and are subject to significant changes in the future. From time to time, legislation is introduced in the United States Congress that contains proposals for altering the structure, regulation, and competitive relationships of the nation’s financial institutions. If enacted into law, these proposals could increase or decrease the cost of doing business, limit or expand permissible activities, or affect the competitive balance among banks, savings associations, and other financial institutions. Whether or in what form any such legislation may be adopted or the extent to which our business might be affected thereby cannot be predicted.
The GLB Act, enacted in November 1999, repealed sections of the Banking Act of 1933, commonly referred to as the Glass-Steagall Act, that prohibited banks from engaging in securities activities, and prohibited securities firms from engaging in banking. The GLB Act created a new form of holding company, known as a financial holding company, that is permitted to acquire subsidiaries that are variously engaged in banking, securities underwriting and dealing, and insurance underwriting.
A bank holding company, if it meets specified requirements, may elect to become a financial holding company by filing a declaration with the Federal Reserve, and may thereafter provide its customers with a broader spectrum of products and services than a traditional bank holding company is permitted to do. A financial holding company may, through a subsidiary, engage in any activity that is deemed to be financial in nature and activities that are incidental or complementary to activities that are financial in nature. These activities include traditional banking services and activities previously permitted to bank holding companies under Federal Reserve regulations, but also include underwriting and dealing in securities, providing investment advisory services, underwriting and selling insurance, merchant banking (holding a portfolio of commercial businesses, regardless of the nature of the business, for investment), and arranging or facilitating financial transactions for third parties.
To qualify as a financial holding company, the bank holding company must be deemed to be well-capitalized and well-managed, as those terms are used by the Federal Reserve. In addition, each subsidiary bank of a bank holding company must also be well-capitalized and well-managed and be rated at least “satisfactory” under the Community Reinvestment Act. A bank holding company that does not qualify, or has not chosen, to become a financial holding company must limit its activities to traditional banking activities and those non-banking activities the Federal Reserve has deemed to be permissible because they are closely related to the business of banking.
The GLB Act also includes provisions to protect consumer privacy by prohibiting financial services providers, whether or not affiliated with a bank, from disclosing non-public personal, financial information to unaffiliated parties without the consent of the customer, and by requiring annual disclosure of the provider’s privacy policy.
Legislation enacted by Congress in 1995 permits interstate banking and branching, which allows banks to expand nationwide through acquisition, consolidation or merger. Under this law, an adequately capitalized bank holding company may acquire banks in any state or merge banks across state lines if permitted by state law. Further, banks may establish and operate branches in any state subject to the restrictions of applicable state law. Under Oregon law, an out-of-state bank or bank holding company may merge with or acquire an Oregon state chartered bank or bank holding company if the Oregon bank, or in the case of a bank holding company, the subsidiary bank, has been in existence for a minimum of three years, and the law of the state in which the acquiring bank is located permits such merger. The Bank now has the ability to open additional de novo branches in the states of Oregon, California, Washington, and Nevada.
Section 613 of the Dodd-Frank Act eliminates interstate branching restrictions that were implemented as part of the Riegle-Neal Interstate Banking and Branching Efficiency Act of 1994, and removes many restrictions on de novo interstate branching by national and state-chartered banks. The FDIC and the OCC now have authority to approve applications by insured state
Umpqua Holdings Corporation
nonmember banks and national banks, respectively, to establish de novo branches in states other than the bank’s home state if “the law of the State in which the branch is located, or is to be located, would permit establishment of the branch, if the bank were a State bank chartered by such State.” The enactment of this section may significantly increase interstate banking by community banks in western states, where barriers to entry were previously high.
Anti-Terrorism Legislation. The Uniting and Strengthening America by Providing Appropriate Tools Required to Intercept and Obstruct Terrorism Act (“USA Patriot Act”), enacted in 2001:
prohibits banks from providing correspondent accounts directly to foreign shell banks;
imposes due diligence requirements on banks opening or holding accounts for foreign financial institutions or wealthy foreign individuals;
requires financial institutions to establish an anti-money-laundering (“AML”) compliance program; and
generally eliminates civil liability for persons who file suspicious activity reports.
The USA Patriot Act also increases governmental powers to investigate terrorism, including expanded government access to account records. The Department of the Treasury is empowered to administer and make rules to implement the Act, which to some degree, affects our record-keeping and reporting expenses. Should the Bank’s AML compliance program be deemed insufficient by federal regulators, we would not be able to grow through acquiring other institutions or opening de novo branches.
Sarbanes-Oxley Act of 2002. The Sarbanes-Oxley Act of 2002 addresses public company corporate governance, auditing, accounting, executive compensation and enhanced and timely disclosure of corporate information.
The Sarbanes-Oxley Act represents significant federal involvement in matters traditionally left to state regulatory systems, such as the regulation of the accounting profession, and regulation of the relationship between a Board of Directors and management and between a Board of Directors and its committees.
The Sarbanes-Oxley Act provides for, among other things:
prohibition on personal loans by Umpqua to its directors and executive officers except loans made by the Bank in accordance with federal banking regulations;
independence requirements for Board audit committee members and our auditors;
certification of Exchange Act reports by the chief executive officer, chief financial officer and principal accounting officer;
disclosure of off-balance sheet transactions;
expedited reporting of stock transactions by insiders; and
increased criminal penalties for violations of securities laws.
The Sarbanes-Oxley Act also requires:
management to establish, maintain and evaluate disclosure controls and procedures;
management to report on its annual assessment of the effectiveness of internal controls over financial reporting;
our external auditor to attest to the effectiveness of internal controls over financial reporting.
The SEC has adopted regulations to implement various provisions of the Sarbanes-Oxley Act, including disclosures in periodic filings pursuant to the Exchange Act. Also, in response to the Sarbanes-Oxley Act, NASDAQ adopted new standards for listed companies. In 2004, the Sarbanes-Oxley Act substantially increased our reporting and compliance expenses.
Emergency Economic Stabilization Act of 2008 (EESA). This act granted broad powers to the U.S. Treasury, the FDIC, and the Federal Reserve to stabilize the financial markets under the following programs:
the Capital Purchase Program allocated $250 billion to Treasury to purchase senior preferred shares and warrants to purchase commons stock from approved financial institutions;
the Troubled Asset Purchase Program allocated $250 billion to Treasury to purchase troubled assets from financial institutions, with Treasury to also receive securities issued by participating institutions;
the Temporary Liquidity Guaranty Program (“TLGP”) authorized the FDIC to insure newly issued senior unsecured debt and insure the total balance in non-interest bearing transactional deposit accounts of those institutions who elect to participate;
the Commercial Paper and Money Market Investor Funding Facilities authorized the Federal Reserve Bank of New York to purchase rated commercial paper from U.S. companies and to purchase money market instruments from U.S. money market mutual funds.
The Dodd-Frank Wall Street Reform and Consumer Protection Act. On July 21, 2010, President Obama signed the Dodd-Frank Act, which is a sweeping overhaul of financial industry regulation. In general, the Act:
Creates a systemic-risk council of top regulators, the Financial Stability Oversight Council (FSOC), whose purpose is to identify risks and respond to emerging threats to the financial stability of the U.S. arising from large, interconnected bank holding companies or nonbank financial companies;
Gives the FDIC authority to unwind large failing financial firms. Treasury would supply funds to cover the up-front costs of winding down the failed firm, but the government would have to put a “repayment plan” in place. Regulators would recoup any losses incurred from the wind-down afterwards by assessing fees on financial firms with more than $50 billion in assets;
Directs the FDIC to base deposit-insurance assessments on assets minus tangible capital instead of on domestic deposits and requires the FDIC to increase premium rates to raise the Deposit Insurance Fund’s (DIF) minimum reserve ratio from 1.15% to 1.35% by September 30, 2020. Banks, like Umpqua, with consolidated assets greater than $10 billion would pay the increased premiums;
Extends the FDIC’s Transaction Account Guarantee (TAG) program to December 31, 2012. There is no “opt-out” from the extension;
Permanently increases FDIC deposit-insurance coverage to $250,000, retroactive to January 1, 2008. The Act eliminates the 1.5% cap on the DIF reserve ratio and automatic dividends when the ratio exceeds 1.35%. Under the agreement, the FDIC would have discretion on whether to provide dividends to DIF members;
Authorizes banks to pay interest on business checking accounts, which is likely to significantly increase our interest expense;
Creates a new Consumer Financial Protection Bureau (CFPB), housed under the Federal Reserve and led by a director appointed by the President and confirmed by the Senate. All existing consumer laws and regulations will be transferred to this agency and each existing regulatory agency will contribute their respective consumer regulatory and exam staffs to the CFPB;
Grants to CFPB the authority to write consumer protection rules for banks and nonbank financial firms offering consumer financial services or products and to ensure that consumers are protected from “unfair, deceptive, or abusive” acts or practices. The CFPB also has authority to examine and enforce regulations for banks, like Umpqua, with greater than $10 billion in assets;
Authorizes the CFPB to require banks to compile and provide reports relating to its consumer lending, marketing and other consumer business activities and to make that information available to the public if it is “in the public interest”;
Umpqua Holdings Corporation
Directs the Federal Reserve to set interchange fees for debit card transactions charged by banks with more than $10 billion in assets. It must establish what it determines are reasonable fees by factoring in their transaction costs compared to those for checks;
Requires loan originators to retain 5% of any loan sold and securitized, unless it is a “qualified residential mortgage”, which includes standard 30 and 15 year fixed rate loans. It also specifically exempts from risk retention FHA, VA, Farmer Mac and Rural Housing Service loans;
Excludes the proceeds of trust preferred securities from Tier 1 capital except for trust preferred securities issued before May 19, 2010 by bank holding companies, like the Company, with less than $15 billion in assets at December 31, 2009;
Adopts various mortgage lending and predatory lending provisions;
Requires federal regulators jointly to prescribe regulations mandating that financial institutions with more than $1 billion in assets to disclose to their regulators their incentive compensation plans to permit the regulators to determine whether the plans provide executive officers, employees, directors or principal shareholders with excessive compensation, fees or benefits; or could lead to material financial loss to the institution;
Imposes a number of requirements related to executive compensation that apply to all public companies, such as prohibition of broker discretionary voting in connection with a shareholder vote on executive compensation; mandatory shareholder “say on pay” (every one to three years) and “say on golden parachutes”; and clawback of incentive compensation from current or former executive officers following any accounting restatement;
Establishes a modified version of the “Volcker Rule” and generally prohibits banks from engaging in proprietary trading or holding or obtaining an interest in a hedge fund or private equity fund, to the extent that it would exceed 3% of its Tier 1 capital. A bank’s interest in any single hedge fund or private equity fund may not exceed 3% of the assets of that fund.
ITEM 1A. RISK FACTORS.
In addition to the other information set forth in this report, you should carefully consider the factors discussed below. These factors could materially adversely affect our business, financial condition, liquidity, results of operations and capital position, and could cause our actual results to differ materially from our historical results or the results contemplated by the forward-looking statements contained in this report.
Difficult market conditions have adversely affected and may continue to have an adverse effect on our industry.
Since 2007, dramatic declines in the housing market, with falling home prices and increasing foreclosures and unemployment and under-employment have negatively impacted the credit performance of mortgage loans and resulted in significant write-downs of asset values by financial institutions, including government-sponsored entities as well as major commercial and investment banks. These write-downs have caused many financial institutions to seek additional capital, to merge with larger and stronger institutions and, in some cases, to fail. Reflecting concern about the stability of the financial markets generally and the strength of counterparties, many lenders and institutional investors have reduced or ceased providing funding to borrowers, including to other financial institutions. This market turmoil and tightening of credit have led to an increased level of commercial and consumer delinquencies, lack of consumer confidence, increased market volatility and widespread reduction of business activity generally. The resulting economic pressure on consumers and lack of confidence in the financial markets has adversely affected our business, financial condition and results of operations. We expect only moderate improvement in these conditions in the near future. A worsening of these conditions would likely exacerbate the adverse effects of these difficult market conditions on us and others in the financial institutions industry. In particular, we may face the following risks in connection with these events:
We face increased regulation of our industry, including as a result of the EESA, the American Recovery and Reinvestment Act of 2009 (the “ARRA”) and the Dodd-Frank Act. Compliance with such regulation will increase our costs, reduce existing sources of revenue and may limit our ability to pursue business opportunities.
Our ability to assess the creditworthiness of our customers may be impaired if the models and approaches we use to select, manage, and underwrite our customers become less predictive of future performance.
The process we use to estimate losses inherent in our loan portfolio requires difficult, subjective, and complex judgments, including forecasts of economic conditions and how these economic predictions might impair the ability of our borrowers to repay their loans, which process may no longer be capable of accurate estimation and may, in turn, impact its reliability.
We may be required to pay significantly higher Federal Deposit Insurance Corporation premiums in the future if losses further deplete the FDIC deposit insurance fund.
There may be downward pressure on our stock price.
Our ability to engage in routine funding transactions could be adversely affected by the actions and commercial soundness of other financial institutions and government sponsored entities.
We may face increased competition due to intensified consolidation of the financial services industry.
If current levels of market disruption and volatility continue or worsen, there can be no assurance that we will not experience an adverse effect, which may be material, on our ability to access capital and on our business, financial condition and results of operations.
The majority of our assets are loans, which if not repaid would result in losses to the Bank.
The Bank, like other lenders, is subject to credit risk, which is the risk of losing principal or interest due to borrowers’ failure to repay loans in accordance with their terms. Underwriting and documentation controls cannot mitigate all credit risk. A downturn in the economy or the real estate market in our market areas or a rapid increase in interest rates could have a negative effect on collateral values and borrowers’ ability to repay. To the extent loans are not paid timely by borrowers, the loans are placed on
Umpqua Holdings Corporation
non-accrual status, thereby reducing interest income. Further, under these circumstances, an additional provision for loan and lease losses or unfunded commitments may be required. See Management’s Discussion and Analysis of Financial Condition and Results of Operations—”Allowance for Loan and Lease Losses and Reserve for Unfunded Commitments”, “Provision for Loan and Lease Losses” and “Asset Quality and Non-Performing Assets”.
A large percentage of our loan portfolio is secured by real estate, in particular commercial real estate. Continued deterioration in the real estate market or other segments of our loan portfolio would lead to additional losses, which could have a material adverse effect on our business, financial condition and results of operations.
As of December 31, 2011, approximately 80% of our total loan portfolio is secured by real estate, the majority of which is commercial real estate. As a result of increased levels of commercial and consumer delinquencies and declining real estate values, since 2007 we have experienced elevated levels of net charge-offs and allowances for loan and lease reserves. Increases in commercial and consumer delinquency levels or continued declines in real estate market values would require increased net charge-offs and increases in the allowance for loan and lease losses, which could have a material adverse effect on our business, financial condition and results of operations and prospects.
Continued deterioration in the real estate market could result in loans that we have restructured to become delinquent and classified as non-accrual loans.
At December 31, 2011, impaired loans of $80.6 million were classified as performing restructured loans. We restructured the loans in response to borrower financial difficulty, and generally provided for a temporary modification of loan repayment terms. Loans are reported as restructured when we grant concessions to a borrower experiencing financial difficulties that we would not otherwise consider. Examples of such concessions include forgiveness of principal or accrued interest, extending the maturity dates or providing a lower interest rate than would be normally available for a transaction of similar risk. In exchange for these concessions, at the time of restructure, we require additional collateral to bring the loan to value to at most 100%. A further decline in the economic conditions in our general market areas or other factors could adversely impact borrowers with restructured loans and cause borrowers to become delinquent or otherwise default or call into question their ability to repay full interest and principal in accordance with the restructured terms, which would result in the restructured loan being reclassified as non-accrual.
The effects of the current economic recession have been particularly severe in our primary market areas in the Pacific Northwest, Northern California, and Nevada.
Substantially all of our loans are to businesses and individuals in Northern California, Oregon, Washington, and Nevada. The Pacific Northwest has one of the nation’s highest unemployment rates and major employers in Oregon and Washington have implemented substantial employee layoffs or scaled back growth plans. Severe declines in housing prices and property values have been particularly acute in our primary market areas. The States of California, Oregon, Washington, and Nevada continue to face fiscal challenges, the long-term effects of which on each State’s economy cannot be predicted. A further deterioration in the economic conditions or a prolonged delay in economic recovery in our primary market areas could result in the following consequences, any of which could materially and adversely affect our business: loan delinquencies may increase; problem assets and foreclosures may increase putting further price pressures on valuations generally; demand for our products and services may decrease; low cost or noninterest bearing deposits may decrease; and collateral for loans made by us, especially real estate, may decline in value, in turn reducing customers’ borrowing power, and reducing the value of assets and collateral associated with our existing loans.
The benefits of our FDIC loss-sharing agreements may be reduced or eliminated.
In connection with Umpqua Bank’s assumption of the banking operations of Evergreen Bank, Rainier Pacific Bank, and Nevada Security Bank, the Bank entered into Whole Bank Purchase and Assumption Agreements with Loss-Share. Our decisions regarding the fair value of assets acquired, including the FDIC loss-sharing assets, could be inaccurate which could materially and adversely affect our business, financial condition, results of operations, and future prospects. Management makes various assumptions and judgments about the collectability of the acquired loans, including the creditworthiness of borrowers and the value of the real estate and other assets serving as collateral for the repayment of secured loans. In FDIC-assisted acquisitions
that include loss-sharing agreements, we record a loss-sharing asset that reflects our estimate of the timing and amount of future losses that are anticipated to occur in and used to value the acquired loan portfolio. In determining the size of the loss-sharing asset, we analyze the loan portfolio based on historical loss experience, volume and classification of loans, volume and trends in delinquencies and nonaccruals, local economic conditions, and other pertinent information.
If our assumptions relating to the timing or amount of expected losses are incorrect, there could be a negative impact on our operating results. Increases in the amount of future losses in response to different economic conditions or adverse developments in the acquired loan portfolio may result in increased credit loss provisions. Changes in our estimate of the timing of those losses, specifically if those losses are to occur beyond the applicable loss-sharing periods, may result in impairments of the FDIC indemnification asset.
Our ability to obtain reimbursement under the loss-sharing agreements on covered assets depends on our compliance with the terms of the loss-sharing agreements.
Management must certify to the FDIC on a quarterly basis our compliance with the terms of the FDIC loss-sharing agreements as a prerequisite to obtaining reimbursement from the FDIC for realized losses on covered assets. The required terms of the agreements are extensive and failure to comply with any of the guidelines could result in a specific asset or group of assets permanently losing their loss-sharing coverage. Additionally, management may decide to forgo loss-share coverage on certain assets to allow greater flexibility over the management of certain assets. As of December 31, 2011, $641.9 million, or 5.6%, of the Company’s assets were covered by the aforementioned FDIC loss-sharing agreements.
Under the terms of the FDIC loss-sharing agreements, the assignment or transfer of a loss-sharing agreement to another entity generally requires the written consent of the FDIC. In addition, the Bank may not assign or otherwise transfer a loss-sharing agreement during its term without the prior written consent of the FDIC. No assurances can be given that we will manage the covered assets in such a way as to maintain loss-share coverage on all such assets.
Acquisition opportunities may not become available and increased competition may make it more difficult for us to acquire banks in traditional M&A transactions or to successfully bid on failed bank transactions.
Our near-term business strategy includes pursue the acquisition of banks within or in proximity to our geographic footprint that may be operating under capital constraints, regulatory pressure or other competitive disadvantages as well as analyzing and bidding on failing banks that the FDIC plans to place in receivership. Traditional merger and acquisition transactions have been infrequent in the past few years, but we expect that the volume may be increasing as banks work through their problem loan portfolios. However, many target banks may be valued at a discount to their book value, making transactions difficult to conclude. In addition, the FDIC may not place banks that meet our strategic objectives into receivership and the bidding process for failing banks has become very competitive. We may not be able to match or beat the bids of other acquirers unless we bid aggressively by increasing the premium paid on assumed deposits or reducing the discount bid on assets purchased, which could make the acquisition less beneficial to the financial performance of the Bank.
A rapid change in interest rates, or maintenance of rates at historically high or low levels for an extended period, could make it difficult to maintain our current interest income spread and could result in reduced earnings.
Our earnings are largely derived from net interest income, which is interest income and fees earned on loans and investments, less interest paid on deposits and other borrowings. Interest rates are highly sensitive to many factors that are beyond the control of our management, including general economic conditions and the policies of various governmental and regulatory authorities. As interest rates change, net interest income is affected. With fixed rate assets (such as fixed rate loans and most investment securities) and liabilities (such as certificates of deposit), the effect on net interest income depends on the cash flows associated with the maturity of the asset or liability. Asset/liability management policies may not be successfully implemented and from time to time our risk position is not balanced. An unanticipated rapid decrease or increase in interest rates could have an adverse effect on the spreads between the interest rates earned on assets and the rates of interest paid on liabilities, and therefore on the level of net interest income. For instance, any rapid increase in interest rates in the future could result in interest expense increasing faster than interest income because of fixed rate loans and longer-term investments. Historically low rates for an extended period of time result in reduced returns from the investment and loan portfolios. Further, substantially
Umpqua Holdings Corporation
higher interest rates generally reduce loan demand and may result in slower loan growth than previously experienced. See Management’s Discussion and Analysis of Financial Condition and Results of Operations—”Quantitative and Qualitative Disclosures about Market Risk”.
Interest rate volatility and credit risk adjusted rate spreads may impact our financial assets and liabilities measured at fair value, particularly the fair value of our junior subordinated debentures.
The widening of the credit risk adjusted rate spreads on potential new issuances of junior subordinated debentures above our contractual spreads and reductions in three month LIBOR rates have contributed to cumulative positive fair value adjustments in our junior subordinated debentures carried at fair value over the last three years. Tightening of these credit risk adjusted rate spreads and interest rate volatility may result in recognizing negative fair value adjustments charged to earnings in the future.
The Dodd-Frank Act and other recent legislative and regulatory initiatives contain numerous provisions and requirements that could detrimentally affect the Company’s business.
The Dodd-Frank Act and related regulations subject us and other financial institutions to additional restrictions, oversight, reporting obligations and costs, which could have an adverse impact on our business, financial condition, results of operations or the price of our common stock. In addition, this increased regulation of the financial services industry restricts the ability of firms within the industry to conduct business consistent with historical practices, including aspects such as compensation, interest rates, new and inconsistent consumer protection regulations and mortgage regulation, among others. Congress or state legislatures could also adopt laws reducing the amount that borrowers are otherwise contractually required to pay under existing loan contracts, require lenders to extend or restructure certain loans or limit foreclosure and collection remedies. Federal and state regulatory agencies also frequently adopt changes to their regulations or change the manner in which existing regulations are applied.
We cannot predict the substance or impact of pending or future legislation or regulation, or the application thereof. Compliance with such current and potential regulation and scrutiny will significantly increase our costs, impede the efficiency of our internal business processes, may require us to increase our regulatory capital and may limit our ability to pursue business opportunities in an efficient manner. In response, we may be required to or choose to raise additional capital, which could have a dilutive effect on the existing holders of our common stock and adversely affect the market price of our common stock.
We may be required to raise additional capital in the future, but that capital may not be available when it is needed, or it may only be available on unacceptable terms, which could adversely affect our financial condition and results of operations.
We are required by federal and state regulatory authorities to maintain adequate levels of capital to support our operations or to support future FDIC-assisted acquisitions. Our ability to raise additional capital, if needed, will depend on conditions in the capital markets at that time, which are outside our control, and on our financial performance. Accordingly, we may not be able to raise additional capital, if needed, on terms acceptable to us. If we cannot raise additional capital when needed, our ability to further expand our operations and pursue our growth strategy could be materially impaired.
Conditions in the financial markets may limit our access to additional funding to meet our liquidity needs.
Liquidity is essential to our business. An inability to raise funds through deposits, borrowings, the sale or pledging as collateral of loans and other assets could have a substantial negative effect on our liquidity. Our access to funding sources in amounts adequate to finance our activities could be impaired by factors that affect us specifically or the financial services industry in general. An adverse regulatory action against us could detrimentally impact our access to liquidity sources. Our ability to borrow could also be impaired by factors that are nonspecific to us, such as severe disruption of the financial markets or negative news and expectations about the prospects for the financial services industry as a whole as evidenced by turmoil in the domestic and worldwide credit markets.
Our wholesale funding sources may prove insufficient to support our future growth or an unexpected reduction in deposits.
We must maintain sufficient funds to respond to the needs of depositors and borrowers. As a part of our liquidity management, we use a number of funding sources in addition to core deposit growth and repayments and maturities of loans and investments. If we grow more rapidly than any increase in our deposit balances, we are likely to become more dependent on
these sources, which include Federal Home Loan Bank advances, proceeds from the sale of loans and liquidity resources at the holding company. Our financial flexibility will be severely constrained if we are unable to maintain our access to funding or if adequate financing is not available to accommodate future growth at acceptable interest rates. If we are required to rely more heavily on more expensive funding sources to support future growth, our revenues may not increase proportionately to cover our costs, and our profitability would be adversely affected.
As a bank holding company that conducts substantially all of our operations through Umpqua Bank, our banking subsidiary, our ability to pay dividends, repurchase our shares or to repay our indebtedness depends upon liquid assets held by the holding company and the results of operations of our subsidiaries.
Umpqua Holdings Corporation is a separate and distinct legal entity from our subsidiaries and it receives substantially all of its revenue from dividends paid from Umpqua Bank. There are legal limitations on the extent to which the Bank may extend credit, pay dividends or otherwise supply funds to, or engage in transactions with, us. Our inability to receive dividends from the Bank could adversely affect our business, financial condition, results of operations and prospects.
Our net income depends primarily upon Umpqua Bank’s net interest income, which is the income that remains after deducting from total income generated by earning assets the expense attributable to the acquisition of the funds required to support earning assets (primarily interest paid on deposits). The amount of interest income is dependent on many factors including the volume of earning assets, the general level of interest rates, the dynamics of changes in interest rates and the levels of nonperforming loans. All of those factors affect the Bank’s ability to pay dividends to the holding company.
Various statutory provisions restrict the amount of dividends the Bank can pay to us without regulatory approval. The Bank may not pay cash dividends if that payment could reduce the amount of its capital below that necessary to meet the “adequately capitalized” level in accordance with regulatory capital requirements. It is also possible that, depending upon the financial condition of the Bank and other factors, regulatory authorities could conclude that payment of dividends or other payments, including payments to us, is an unsafe or unsound practice and impose restrictions or prohibit such payments. Under Oregon law, the Bank may not pay dividends in excess of unreserved retained earnings, deducting there from, to the extent not already charged against earnings or reflected in a reserve, the following: (1) all bad debts, which are debts on which interest is past due and unpaid for at least six months, unless the debt is fully secured and in the process of collection; (2) all other assets charged-off as required by Oregon bank regulators or a state or federal examiner; and (3) all accrued expenses, interest and taxes of the institution. The Federal Reserve has issued a policy statement on the payment of cash dividends by bank holding companies, which expresses the Federal Reserve’s view that a bank holding company should pay cash dividends only to the extent that its net income for the past year is sufficient to cover both the cash dividends and a rate of earnings retention that is consistent with the holding company’s capital needs, asset quality and overall financial condition.
A significant decline in the company’s market value could result in an impairment of goodwill.
Recently, the Company’s common stock has been trading at a price below its book value, including goodwill and other intangible assets. The valuation of goodwill is estimated using discounted cash flows of forecasted earnings, estimated sales price based on recent observable market transactions and market capitalization based on current stock price. If impairment was deemed to exist, a write down of goodwill would occur with a charge to earnings. In the second quarter 2009, we recognized a goodwill impairment charge of $112.0 million related to our Community Banking operating segment. See Management’s Discussion and Analysis of Financial Condition and Results of Operations—“Goodwill and Other Intangible Assets”.
We have a gross deferred tax asset position of $124.3 million at December 31, 2011, and we are required to assess the recoverability of this asset on an ongoing basis.
Deferred tax assets are evaluated on a quarterly basis to determine if they are expected to be recoverable in the future. Our evaluation considers positive and negative evidence to assess whether it is more likely than not that a portion of the asset will not be realized. The risk of a valuation allowance increases if continuing operating losses are incurred. Future negative operating performance or other negative evidence may result in a valuation allowance being recorded against some or all of this amount. A valuation allowance on our deferred tax asset could have a material adverse impact on our capital and results of operations.
Umpqua Holdings Corporation
We are pursuing an aggressive growth strategy that is expected to include mergers and acquisitions, which could create integration risks.
Umpqua is among the fastest-growing community financial services organizations in the United States. Since 2000, we have completed the acquisition and integration of 10 other financial institutions. There is no assurance that future acquisitions will be successfully integrated. We have announced our intent to pursue FDIC-assisted acquisition opportunities, traditional M&A transactions, and to open new stores in Oregon, Washington and California to continue our growth strategy. If we pursue our growth strategy too aggressively, or if factors beyond management’s control divert attention away from our integration plans, we might not be able to realize some or all of the anticipated benefits. Moreover, we are dependent on the efforts of key personnel to achieve the synergies associated with our acquisitions. The loss of one or more of our key persons could have a material adverse effect upon our ability to achieve the anticipated benefits.
The financial services industry is highly competitive.
We face pricing competition for loans and deposits. We also face competition with respect to customer convenience, product lines, accessibility of service and service capabilities. Our most direct competition comes from other banks, brokerages, mortgage companies and savings institutions. We also face competition from credit unions, government-sponsored enterprises, mutual fund companies, insurance companies and other non-bank businesses. This significant competition in attracting and retaining deposits and making loans as well as in providing other financial services throughout our market area may impact future earnings and growth.
Involvement in non-bank business creates risks associated with the securities industry.
Umpqua Investments’ retail brokerage operations present special risks not borne by community banks that focus exclusively on community banking. For example, the brokerage industry is subject to fluctuations in the stock market that may have a significant adverse impact on transaction fees, customer activity and investment portfolio gains and losses. Likewise, additional or modified regulations may adversely affect Umpqua Investments’ operations. Umpqua Investments is also dependent on a small number of established brokers, whose departure could result in the loss of a significant number of customer accounts. A significant decline in fees and commissions or trading losses suffered in the investment portfolio could adversely affect Umpqua Investments’ income and potentially require the contribution of additional capital to support its operations. Umpqua Investments is subject to claim arbitration risk arising from customers who claim their investments were not suitable or that their portfolios were too actively traded. These risks increase when the market, as a whole, declines. The risks associated with retail brokerage may not be supported by the income generated by those operations. See Management’s Discussion and Analysis of Financial Condition and Results of Operations—”Non-interest Income”.
Our banking and brokerage operations are subject to extensive government regulation that is expected to become more burdensome, increase our costs and make us less competitive compared to financial services firms that are not subject to the same regulation.
We and our subsidiaries are subject to extensive regulation under federal and state laws. These laws and regulations are primarily intended to protect customers, depositors and the deposit insurance fund, rather than shareholders. The Bank is an Oregon state-chartered commercial bank whose primary regulator is the Oregon Division of Finance and Corporate Securities. The Bank is also subject to the supervision by and the regulations of the Washington Department of Financial Institutions, the California Department of Financial Institutions, the Nevada Division of Financial Institutions, the Federal Deposit Insurance Corporation (“FDIC”), which insures bank deposits and the Consumer Financial Protection Bureau. Umpqua Investments is subject to extensive regulation by the Securities and Exchange Commission (“SEC”) and the Financial Industry Regulatory Authority. Umpqua is subject to regulation and supervision by the Board of Governors of the Federal Reserve System, the SEC and NASDAQ. Federal and state regulations may place banks and brokerage firms at a competitive disadvantage compared to less regulated competitors such as finance companies, credit unions, mortgage banking companies and leasing companies. There is also the possibility that laws could be enacted that would prohibit a company from controlling both an FDIC-insured bank and a broker dealer, or restrict their activities if under common ownership. If we receive less than satisfactory results on regulatory examinations, we could be restricted from making acquisitions, adding new stores, developing new lines of business
or otherwise continuing our growth strategy for a period of time. Future changes in federal and state banking and brokerage regulations could adversely affect our operating results and ability to continue to compete effectively.
The value of the securities in our investment securities portfolio may be negatively affected by continued disruptions in securities markets.
The market for some of the investment securities held in our portfolio has become extremely volatile over the past three years. Volatile market conditions or deteriorating financial performance of the issuer or obligor may detrimentally affect the value of these securities. There can be no assurance that the declines in market value associated with these disruptions will not result in other-than-temporary or permanent impairments of these assets, which would lead to accounting charges that could have a material adverse effect on our net income and capital levels.
The volatility of our mortgage banking business can adversely affect earnings if our mitigating strategies are not successful.
Changes in interest rates greatly affect the mortgage banking business. One of the principal risks in this area is prepayment of mortgages and the consequent detrimental effect on the value of mortgage servicing rights (“MSR”). We may employ hedging strategies to mitigate this risk but if the hedging decisions and strategies are not successful, our net income could be adversely affected. See Management’s Discussion and Analysis of Financial Condition and Results of Operations—”Mortgage Servicing Rights”.
Our business is highly reliant on technology and our ability to manage the operational risks associated with technology.
Our business involves storing and processing sensitive consumer and business customer data. A cyber security breach may result in theft of such data or disruption of our transaction processing systems. We depend on internal systems and outsourced technology to support these data storage and processing operations. Our inability to use or access these information systems at critical points in time could unfavorably impact the timeliness and efficiency of our business operations. A material breach of customer data security may negatively impact our business reputation and cause a loss of customers, result in increased expense to contain the event and/or require that we provide credit monitoring services for affected customers, result in regulatory fines and sanctions and may result in class action litigation. Cyber security risk management programs are expensive to maintain and will not protect the Company from all risks associated with maintaining the security of customer data and the Company’s proprietary data from external and internal intrusions, disaster recovery and failures in the controls used by our vendors. In addition, Congress and the legislatures of states in which we operate regularly consider legislation that would impose more stringent data privacy requirements.
Our business is highly reliant on third party vendors and our ability to manage the operational risks associated with outsourcing those services.
We rely on third parties to provide services that are integral to our operations. These vendors provide services that support our operations, including the storage and processing of sensitive consumer and business customer data, as well as our sales efforts. A cyber security breach of a vendor’s system may result in theft of our data or disruption of business processes. A material breach of customer data security at a service provider’s site may negatively impact our business reputation and cause a loss of customers; result in increased expense to contain the event and/or require that we provide credit monitoring services for affected customers, result in regulatory fines and sanctions and may result in litigation. In most cases, we will remain primarily liable to our customers for losses arising from a breach of a vendor’s data security system. We rely on our outsourced service providers to implement and maintain prudent cyber security controls. We have procedures in place to assess a vendor’s cyber security controls prior to establishing a contractual relationship and to periodically review assessments of those control systems; however, these procedures are not infallible and a vendor’s system can be breached despite the procedures we employ. We have alliances with other companies that assist in our sales efforts. In our wealth management business, we have an alliance with Ferguson Wellman, a registered investment advisor to whom we refer customers for investment advice and asset management services. We cannot be sure that we will be able to maintain these relationships on favorable terms. In addition, some of our data processing services are provided by companies associated with our competitors. The loss of these vendor relationships could disrupt the services we provide to our customers and cause us to incur significant expense in connection with replacing these services.
Umpqua Holdings Corporation
Store construction can disrupt banking activities and may not be completed on time or within budget, which could result in reduced earnings.
The Bank has, over the past several years, been transformed from a traditional community bank into a community-oriented financial services retailer. We have announced plans to build new stores in Oregon, Washington and California as part of our de novo branching strategy. This includes our strategy of building “Neighborhood Stores.” We also continue to remodel acquired bank branches to resemble retail stores that include distinct physical areas or boutiques such as a “serious about service center,” an “investment opportunity center” and a “computer cafe.” Store construction involves significant expense and risks associated with locating store sites and delays in obtaining permits and completing construction. Remodeling involves significant expense, disrupts banking activities during the remodeling period, and presents a new look and feel to the banking services and products being offered. Financial constraints may delay remodeling projects. Customers may not react favorably to the construction-related activities or the remodeled look and feel. There are risks that construction or remodeling costs will exceed forecasted budgets and that there may be delays in completing the projects, which could cause disruption in those markets.
ITEM 1B. UNRESOLVED STAFF COMMENTS.
None.
ITEM 2. PROPERTIES.
The executive offices of Umpqua and Umpqua Investments are located at One SW Columbia Street in Portland, Oregon in office space that is leased. The Bank owns its main office located in Roseburg, Oregon. At December 31, 2011, the Bank conducted Community Banking activities or operated Commercial Banking Centers at 194 locations, in Northern California, Oregon and Washington along the I-5 corridor; in the San Francisco Bay area, Inland Foothills, Napa and Coastal regions in California; in Bend and along the Coast of Oregon; in greater Seattle and Bellevue, Washington, and in Reno, Nevada, of which 64 are owned and 130 are leased under various agreements. As of December 31, 2011, the Bank also operated 15 facilities for the purpose of administrative and other functions, such as back-office support, of which five are owned and 10 are leased. All facilities are in a good state of repair and appropriately designed for use as banking or administrative office facilities. As of December 31, 2011, Umpqua Investments leased three stand-alone offices from unrelated third parties, one stand-alone office from the Bank, and also leased space in eight Bank stores under lease agreements that are based on market rates.
Additional information with respect to owned premises and lease commitments is included in Notes 8 and 20, respectively, of theNotes to Consolidated Financial Statementsin Item 8 below.
ITEM 3. LEGAL PROCEEDINGS.
In our Form 10-Q for the period ending June 30, 2011, we initially reported on a putative stockholders derivative action filed in the U.S. District Court for the District of Oregon by Plumbers Local No. 137 Pension Fund and Laborers’ Local #231 Pension Fund naming Umpqua’s present directors, certain executive officers and PricewaterhouseCoopers LLP (PwC) as defendants and Umpqua as nominal party. On January 11, 2012, District Court Magistrate Judge, John V. Acosta, ruled on a motion to dismiss filed by Umpqua’s present directors and certain executive officers and issued findings and a recommendation that the case be dismissed without prejudice. Plaintiffs filed an Objection to those findings and recommendations and the case is pending resolution of those Objections.
On December 29, 2011, in the United States District Court for the Northern District of California-San Francisco Division (case no. 11-6700), Amber Hawthorne filed a class action lawsuit against Umpqua Bank on behalf of herself and a national class, including a sub-class of California residents seeking in excess of $5 million, plus punitive damages, alleging that Umpqua Bank engaged in unfair and deceptive practices by posting debit items in a high to low order to maximize overdraft fees, automatically enrolling customers in debit Overdraft Protection (“ODP”) programs before the Regulation E revisions, failing to adequately disclose posting order, manipulating posting to maximize ODP fees and failing to advise customers how to minimize fees. Plaintiff alleges claims for breach of contract, breach of the covenant of good faith and fair dealing, unconscionability, conversion, unjust enrichment, and a violation of California Business & Professions Code 17200 (for the California subclass). The
claims are in the initial stage of investigation but Umpqua believes that the claims are not supportable and are overstated and the Company intends to vigorously defend the case.
Due to the nature of our business, we are involved in legal proceedings that arise in the ordinary course of our business. While the outcome of these matters is currently not determinable, we do not expect that the ultimate costs to resolve these matters will have a material adverse effect on our consolidated financial position, results of operations, or cash flows.
See Note 20 (Legal Proceedings) for a discussion of the Company’s involvement in litigation pertaining to Visa, Inc.
ITEM 4. (REMOVED AND RESERVED)
Umpqua Holdings Corporation
PART II
ITEM 5. MARKET FOR REGISTRANT’S COMMON EQUITY, RELATED STOCKHOLDER MATTERS AND ISSUER PURCHASES OF EQUITY SECURITIES.
(a) Our Common Stock is traded on The NASDAQ Global Select Market under the symbol “UMPQ.” As of December 31, 2011, there were 200,000,000 common shares authorized for issuance. The following table presents the high and low sales prices of our common stock for each period, based on inter-dealer prices that do not include retail mark-ups, mark-downs or commissions, and cash dividends declared for each period:
| | | | | | | | | | | | |
| Quarter Ended | | High | | | Low | | | Cash Dividend
Per Share | |
December 31, 2011 | | $ | 12.83 | | | $ | 8.35 | | | $ | 0.07 | |
September 30, 2011 | | $ | 12.07 | | | $ | 8.10 | | | $ | 0.07 | |
June 30, 2011 | | $ | 12.10 | | | $ | 10.83 | | | $ | 0.05 | |
March 31, 2011 | | $ | 12.81 | | | $ | 10.40 | | | $ | 0.05 | |
| | | |
December 31, 2010 | | $ | 12.59 | | | $ | 10.42 | | | $ | 0.05 | |
September 30, 2010 | | $ | 13.15 | | | $ | 10.20 | | | $ | 0.05 | |
June 30, 2010 | | $ | 15.90 | | | $ | 11.34 | | | $ | 0.05 | |
March 31, 2010 | | $ | 14.24 | | | $ | 10.87 | | | $ | 0.05 | |
As of December 31, 2011, our common stock was held by approximately 4,754 shareholders of record, a number that does not include beneficial owners who hold shares in “street name”, or shareholders from previously acquired companies that have not exchanged their stock. At December 31, 2011, a total of 2.2 million stock options, 585,000 shares of restricted stock and 219,000 restricted stock units were outstanding. Additional information about stock options, restricted stock and restricted stock units is included in Note 22 of theNotes to Consolidated Financial Statementsin Item 8 below and in Item 12 below.
The payment of future cash dividends is at the discretion of our Board and subject to a number of factors, including results of operations, general business conditions, growth, financial condition and other factors deemed relevant by the Board of Directors. Further, our ability to pay future cash dividends is subject to certain regulatory requirements and restrictions discussed in theSupervision and Regulationsection in Item 1 above.
During 2011, Umpqua’s Board of Directors declared a quarterly cash dividend of $0.05 per common share for the first and second quarters and $0.07 per common share for the third and fourth quarters. These dividends were made pursuant to our existing dividend policy and in consideration of, among other things, earnings, regulatory capital levels, the overall payout ratio and expected asset growth. We expect that the dividend rate will be reassessed on a quarterly basis by the Board of Directors in accordance with the dividend policy.
We have a dividend reinvestment plan that permits shareholder participants to purchase shares at the then-current market price in lieu of the receipt of cash dividends. Shares issued in connection with the dividend reinvestment plan are purchased in open market transactions.
Equity Compensation Plan Information
The following table sets forth information about equity compensation plans that provide for the award of securities or the grant of options to purchase securities to employees and directors of Umpqua, its subsidiaries and its predecessors by merger that were in effect at December 31, 2011.
(shares in thousands)
| | | | | | | | | | | | |
| | | Equity Compensation Plan Information | |
| | | (A) | | | (B) | | | (C) | |
| Plan category | | Number of securities to be
issued upon exercise of
outstanding options,
warrants and rights | | | Weighted average exercise
price of outstanding
options, warrants and
rights(4) | | | Number of securities
remaining available for
future issuance under equity
compensation plans
excluding securities
reflected in column (A) | |
Equity compensation plans approved by security holders | | | | | | | | | | | | |
2003 Stock Incentive Plan(1) | | | 1,773 | | | $ | 15.09 | | | | 1,378 | |
2007 Long Term Incentive Plan(2) | | | 219 | | | | — | | | | 679 | |
Other(3) | | | 416 | | | $ | 11.95 | | | | — | |
| | | | | | | | | | | | |
Total | | | 2,408 | | | $ | 14.48 | | | | 2,057 | |
Equity compensation plans not approved by security holders | | | — | | | | — | | | | — | |
| | | | | | | | | | | | |
Total | | | 2,408 | | | $ | 14.48 | | | | 2,057 | |
| | | | | | | | | | | | |
| (1) | At Umpqua’s 2010 Annual Meeting, shareholders approved an amendment to the 2003 Stock Incentive Plan to make an additional two million shares of stock available for issuance through awards of incentive stock options, nonqualified stock options or restricted stock grants, provided awards of stock options and restricted stock grants under the 2003 Stock Incentive Plan, when added to options outstanding under all other plans, are limited to a maximum 10% of the outstanding shares on a fully diluted basis. The Plan’s termination date was extended to June 30, 2015. |
| (2) | At Umpqua’s 2007 Annual Meeting, shareholders approved a 2007 Long Term Incentive Plan. The plan authorized the issuance of one million shares of stock through awards of performance-based restricted stock unit grants to executive officers. Target grants of 65,000 and maximum grants of 114,000 were approved to be issued in 2009, and target grants of 60,000 and maximum grants of 105,000 were approved to be issued in 2011 under this plan. During 2009, 23,000 units vested and were released and 57,000 units forfeited upon the retirement of an executive. During 2010, 16,000 units vested and were released and 94,000 units forfeited upon the retirement of an executive. During 2011, 63,300 units vested and were released and 47,475 units forfeited. As of December 31, 2011, 212,000 restricted stock units are expected to vest if the current estimate of performance-based targets is satisfied, and would result in 685,000 securities available for future issuance. |
| (3) | Includes other Umpqua stock plans and stock plans assumed through previous mergers. |
| (4) | Weighted average exercise price is based solely on securities with an exercise price. |
Umpqua Holdings Corporation
(c) | The following table provides information about repurchases of common stock by the Company during the quarter ended December 31, 2011: |
| | | | | | | | | | | | | | | | |
| Period | | Total number
of Shares
Purchased(1) | | | Average Price
Paid per Share | | | Total Number of
Shares Purchased
as Part of Publicly
Announced Plan(2) | | | Maximum Number
of Remaining
Shares that May
be Purchased at
Period End under
the Plan | |
10/1/11 - 10/31/11 | | | 231 | | | $ | 8.73 | | | | 251,194 | | | | 14,748,806 | |
11/1/11 - 11/30/11 | | | 70 | | | $ | 12.14 | | | | 2,120,769 | | | | 12,628,037 | |
12/1/11 - 12/31/11 | | | — | | | $ | — | | | | 4,301 | | | | 12,623,736 | |
| | | | | | | | | | | | | | | | |
Total for quarter | | | 301 | | | $ | 9.52 | | | | 2,376,264 | | | | | |
(1) | Shares repurchased by the Company during the quarter consist of cancellation of 301 restricted shares to pay withholding taxes. There were no shares tendered in connection with option exercises and 2.4 million shares were repurchased pursuant to the Company’s publicly announced corporate stock repurchase plan described in (2) below. |
(2) | The Company’s share repurchase plan, which was first approved by the Board and announced in August 2003, was amended on September 29, 2011 to increase the number of common shares available for repurchase under the plan to 15 million shares. The repurchase program will run through June 2013. As of December 31, 2011, a total of 12.6 million shares remained available for repurchase. The Company repurchased 2.5 million shares in 2011 and no shares under the repurchase plan in 2010 or 2009. The timing and amount of future repurchases will depend upon the market price for our common stock, securities laws restricting repurchases, asset growth, earnings, and our capital plan. |
During the year ended December 31, 2011, there were 8,135 shares tendered in connection with option exercises. During the year ended December 31, 2010, there were 4,515 shares tendered in connection with option exercises. Restricted shares cancelled to pay withholding taxes totaled 23,158 and 12,443 shares during the years ended December 31, 2011 and 2010, respectively. Restricted stock units cancelled to pay withholding taxes totaled 22,349 during the year ended December 31, 2011. Restricted stock units cancelled to pay withholding taxes totaled 5,583 during the year ended December 31, 2010.
STOCK PERFORMANCE GRAPH
The following chart, which is furnished not filed, compares the yearly percentage changes in the cumulative shareholder return on our common stock during the five fiscal years ended December 31, 2011, with (i) the Total Return Index for NASDAQ Bank Stocks (ii) the Total Return Index for The Nasdaq Stock Market (U.S. Companies) and (iii) the Standard and Poor’s 500. This comparison assumes $100.00 was invested on December 31, 2006, in our common stock and the comparison indices, and assumes the reinvestment of all cash dividends prior to any tax effect and retention of all stock dividends. Price information from December 31, 2006 to December 31, 2011, was obtained by using the NASDAQ closing prices as of the last trading day of each year.
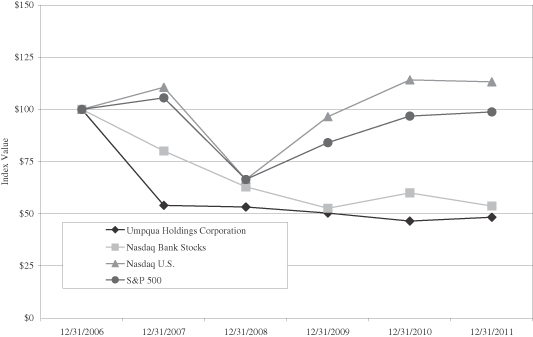
| | | | | | | | | | | | | | | | | | | | | | | | |
| | | Period Ending | |
| | 12/31/2006 | | | 12/31/2007 | | | 12/31/2008 | | | 12/31/2009 | | | 12/31/2010 | | | 12/31/2011 | |
Umpqua Holdings Corporation | | $ | 100.00 | | | $ | 54.01 | | | $ | 53.19 | | | $ | 50.28 | | | $ | 46.42 | | | $ | 48.33 | |
Nasdaq Bank Stocks | | $ | 100.00 | | | $ | 80.09 | | | $ | 62.84 | | | $ | 52.60 | | | $ | 60.04 | | | $ | 53.74 | |
Nasdaq U.S. | | $ | 100.00 | | | $ | 110.66 | | | $ | 66.42 | | | $ | 96.54 | | | $ | 114.06 | | | $ | 113.16 | |
S&P 500 | | $ | 100.00 | | | $ | 105.49 | | | $ | 66.46 | | | $ | 84.05 | | | $ | 96.71 | | | $ | 98.76 | |
Umpqua Holdings Corporation
ITEM 6. SELECTED FINANCIAL DATA.
Umpqua Holdings Corporation
Annual Financial Trends
(in thousands, except per share data)
| | | | | | | | | | | | | | | | | | | | |
| | | 2011 | | | 2010 | | | 2009 | | | 2008 | | | 2007 | |
Interest income | | $ | 501,753 | | | $ | 488,596 | | | $ | 423,732 | | | $ | 442,546 | | | $ | 488,392 | |
Interest expense | | | 73,301 | | | | 93,812 | | | | 103,024 | | | | 152,239 | | | | 202,438 | |
| | | | |
Net interest income | | | 428,452 | | | | 394,784 | | | | 320,708 | | | | 290,307 | | | | 285,954 | |
Provision for non-covered loan and lease losses | | | 46,220 | | | | 113,668 | | | | 209,124 | | | | 107,678 | | | | 41,730 | |
Provision for covered loan and lease losses | | | 16,141 | | | | 5,151 | | | | — | | | | — | | | | — | |
Non-interest income | | | 84,118 | | | | 75,904 | | | | 73,516 | | | | 107,118 | | | | 64,829 | |
Non-interest expense | | | 338,611 | | | | 311,063 | | | | 267,178 | | | | 215,588 | | | | 210,804 | |
Goodwill impairment | | | — | | | | — | | | | 111,952 | | | | 982 | | | | — | |
Merger related expenses | | | 360 | | | | 6,675 | | | | 273 | | | | — | | | | 3,318 | |
| | | | |
Income (loss) before provision for (benefit from) income taxes | | | 111,238 | | | | 34,131 | | | | (194,303 | ) | | | 73,177 | | | | 94,931 | |
Provision for (benefit from) income taxes | | | 36,742 | | | | 5,805 | | | | (40,937 | ) | | | 22,133 | | | | 31,663 | |
| | | | |
Net income (loss) | | | 74,496 | | | | 28,326 | | | | (153,366 | ) | | | 51,044 | | | | 63,268 | |
Preferred stock dividends | | | — | | | | 12,192 | | | | 12,866 | | | | 1,620 | | | | — | |
Dividends and undistributed earnings allocated to participating securities | | | 356 | | | | 67 | | | | 30 | | | | 154 | | | | 187 | |
| | | | |
Net earnings (loss) available to common shareholders | | $ | 74,140 | | | $ | 16,067 | | | $ | (166,262 | ) | | $ | 49,270 | | | $ | 63,081 | |
| | | | |
| | | | | |
YEAR END | | | | | | | | | | | | | | | | | | | | |
Assets | | $ | 11,563,355 | | | $ | 11,668,710 | | | $ | 9,381,372 | | | $ | 8,597,550 | | | $ | 8,340,053 | |
Earning assets | | | 10,263,923 | | | | 10,374,131 | | | | 8,344,203 | | | | 7,491,498 | | | | 7,146,841 | |
Non-covered loans and leases(1) | | | 5,888,098 | | | | 5,658,987 | | | | 5,999,267 | | | | 6,131,374 | | | | 6,055,635 | |
Covered loans and leases | | | 622,451 | | | | 785,898 | | | | — | | | | — | | | | — | |
Deposits | | | 9,236,690 | | | | 9,433,805 | | | | 7,440,434 | | | | 6,588,935 | | | | 6,589,326 | |
Term debt | | | 255,676 | | | | 262,760 | | | | 76,274 | | | | 206,531 | | | | 73,927 | |
Junior subordinated debentures, at fair value | | | 82,905 | | | | 80,688 | | | | 85,666 | | | | 92,520 | | | | 131,686 | |
Junior subordinated debentures, at amortized cost | | | 102,544 | | | | 102,866 | | | | 103,188 | | | | 103,655 | | | | 104,680 | |
Common shareholders’ equity | | | 1,672,413 | | | | 1,642,574 | | | | 1,362,182 | | | | 1,284,830 | | | | 1,239,938 | |
Total shareholders’ equity | | | 1,672,413 | | | | 1,642,574 | | | | 1,566,517 | | | | 1,487,008 | | | | 1,239,938 | |
Common shares outstanding | | | 112,165 | | | | 114,537 | | | | 86,786 | | | | 60,146 | | | | 59,980 | |
| | | | | |
AVERAGE | | | | | | | | | | | | | | | | | | | | |
Assets | | $ | 11,600,435 | | | $ | 10,830,486 | | | $ | 8,975,178 | | | $ | 8,342,005 | | | $ | 7,897,568 | |
Earning assets | | | 10,332,242 | | | | 9,567,341 | | | | 7,925,014 | | | | 7,215,001 | | | | 6,797,834 | |
Non-covered loans and leases(1) | | | 5,723,771 | | | | 5,783,452 | | | | 6,103,666 | | | | 6,118,540 | | | | 5,822,907 | |
Covered loans and leases | | | 707,026 | | | | 681,569 | | | | — | | | | — | | | | — | |
Deposits | | | 9,301,978 | | | | 8,607,980 | | | | 7,010,739 | | | | 6,459,576 | | | | 6,250,521 | |
Term debt | | | 257,496 | | | | 261,170 | | | | 129,814 | | | | 194,312 | | | | 57,479 | |
Junior subordinated debentures | | | 184,115 | | | | 184,134 | | | | 190,491 | | | | 226,349 | | | | 221,833 | |
Common shareholders’ equity | | | 1,671,893 | | | | 1,589,393 | | | | 1,315,953 | | | | 1,254,730 | | | | 1,222,628 | |
Total shareholders’ equity | | | 1,671,893 | | | | 1,657,544 | | | | 1,519,119 | | | | 1,281,220 | | | | 1,222,628 | |
Basic common shares outstanding | | | 114,220 | | | | 107,922 | | | | 70,399 | | | | 60,084 | | | | 59,828 | |
Diluted common shares outstanding | | | 114,409 | | | | 108,153 | | | | 70,399 | | | | 60,424 | | | | 60,404 | |
| | | | | |
PER COMMON SHARE DATA | | | | | | | | | | | | | | | | | | | | |
Basic earnings (loss) | | $ | 0.65 | | | $ | 0.15 | | | $ | (2.36 | ) | | $ | 0.82 | | | $ | 1.05 | |
Diluted earnings (loss) | | | 0.65 | | | | 0.15 | | | | (2.36 | ) | | | 0.82 | | | | 1.04 | |
Book value | | | 14.91 | | | | 14.34 | | | | 15.70 | | | | 21.36 | | | | 20.67 | |
Tangible book value(2) | | | 8.87 | | | | 8.39 | | | | 8.33 | | | | 8.76 | | | | 7.92 | |
Cash dividends declared | | | 0.24 | | | | 0.20 | | | | 0.20 | | | | 0.62 | | | | 0.74 | |
(dollars in thousands)
| | | | | | | | | | | | | | | | | | | | |
| | | 2011 | | | 2010 | | | 2009 | | | 2008 | | | 2007 | |
PERFORMANCE RATIOS | | | | | | | | | | | | | | | | | | | | |
Return on average assets(3) | | | 0.64% | | | | 0.15% | | | | -1.85% | | | | 0.59% | | | | 0.80% | |
Return on average common shareholders’ equity(4) | | | 4.43% | | | | 1.01% | | | | -12.63% | | | | 3.93% | | | | 5.16% | |
Return on average tangible common shareholders’ equity(5) | | | 7.47% | | | | 1.76% | | | | -26.91% | | | | 9.99% | | | | 13.05% | |
Efficiency ratio(6), (7) | | | 65.58% | | | | 66.90% | | | | 95.34% | | | | 54.08% | | | | 60.62% | |
Average common shareholders’ equity to average assets | | | 14.41% | | | | 14.68% | | | | 14.66% | | | | 15.04% | | | | 15.48% | |
Leverage ratio(8) | | | 10.91% | | | | 10.56% | | | | 12.79% | | | | 12.38% | | | | 9.24% | |
Net interest margin (fully tax equivalent)(9) | | | 4.19% | | | | 4.17% | | | | 4.09% | | | | 4.07% | | | | 4.24% | |
Non-interest revenue to total net revenue(10) | | | 16.41% | | | | 16.13% | | | | 18.65% | | | | 26.95% | | | | 18.48% | |
Dividend payout ratio(11) | | | 36.92% | | | | 133.33% | | | | -8.47% | | | | 75.61% | | | | 70.48% | |
| | | | | |
ASSET QUALITY | | | | | | | | | | | | | | | | | | | | |
Non-covered, non-performing loans | | $ | 91,383 | | | $ | 145,248 | | | $ | 199,027 | | | $ | 133,366 | | | $ | 91,099 | |
Non-covered, non-performing assets | | | 125,558 | | | | 178,039 | | | | 223,593 | | | | 161,264 | | | | 98,042 | |
Allowance for non-covered loan and lease losses | | | 92,968 | | | | 101,921 | | | | 107,657 | | | | 95,865 | | | | 84,904 | |
Net non-covered charge-offs | | | 55,173 | | | | 119,404 | | | | 197,332 | | | | 96,717 | | | | 21,994 | |
Non-covered, non-performing loans to non-covered loans and leases | | | 1.55% | | | | 2.57% | | | | 3.32% | | | | 2.18% | | | | 1.50% | |
Non-covered, non-performing assets to total assets | | | 1.09% | | | | 1.53% | | | | 2.38% | | | | 1.88% | | | | 1.18% | |
Allowance for non-covered loan and lease losses to total non-covered loans and leases | | | 1.58% | | | | 1.80% | | | | 1.79% | | | | 1.56% | | | | 1.40% | |
Allowance for non-covered credit losses to non-covered loans and leases | | | 1.59% | | | | 1.82% | | | | 1.81% | | | | 1.58% | | | | 1.42% | |
Net charge-offs to average non-covered loans and leases | | | 0.96% | | | | 2.06% | | | | 3.23% | | | | 1.58% | | | | 0.38% | |
(1) | Excludes loans held for sale |
(2) | Average common shareholders’ equity less average intangible assets (excluding MSR) divided by shares outstanding at the end of the year. See Management’s Discussion and Analysis of Financial Condition and Results of Operations—“Results of Operations – Overview” for the reconciliation of non-GAAP financial measures, in Item 7 of this report. |
(3) | Net earnings (loss) available to common shareholders divided by average assets. |
(4) | Net earnings (loss) available to common shareholders divided by average common shareholders’ equity. |
(5) | Net earnings (loss) available to common shareholders divided by average common shareholders’ equity less average intangible assets. See Management’s Discussion and Analysis of Financial Condition and Results of Operations—“Results of Operations – Overview” for the reconciliation of non-GAAP financial measures, in Item 7 of this report. |
(6) | Non-interest expense divided by the sum of net interest income (fully tax equivalent) and non-interest income. |
(7) | The efficiency ratio calculation includes goodwill impairment charges of $112.0 million and $1.0 million in 2009 and 2008, respectively. Goodwill impairment losses are a non-cash expense that have no direct effect on the Company’s or the Bank’s liquidity or capital ratios. |
(8) | Tier 1 capital divided by leverage assets. Leverage assets are defined as quarterly average total assets, net of goodwill, intangibles and certain other items as required by the Federal Reserve. |
(9) | Net interest margin (fully tax equivalent) is calculated by dividing net interest income (fully tax equivalent) by average interest earnings assets. |
(10) | Non-interest revenue divided by the sum of non-interest revenue and net interest income |
(11) | Dividends declared per common share divided by basic earnings per common share. |
Umpqua Holdings Corporation
ITEM 7. MANAGEMENT’S DISCUSSION AND ANALYSIS OF FINANCIAL CONDITION AND RESULTS OF OPERATIONS
FORWARD LOOKING STATEMENTS AND RISK FACTORS
See the discussion of forward-looking statements and risk factors in Part I Item 1 and Item 1A of this report.
EXECUTIVE OVERVIEW
Significant items for the year ended December 31, 2011 were as follows:
Financial Performance
| • | | Net earnings per diluted common share was $0.65 in 2011, as compared to net earnings of $0.15 per diluted common share earned in 2010. The increase in net earnings per diluted common share is principally attributed to reduced provision for loan and lease losses. Operating earnings per diluted common share, defined as earnings available to common shareholders before gains or losses on junior subordinated debentures carried at fair value, net of tax, bargain purchase gains on acquisitions, net of tax, merger related expenses, net of tax, and goodwill impairment divided by the same diluted share total used in determining diluted earnings per common share, was $0.66 in 2011, as compared to operating earnings per diluted common share of $0.12 in 2010. Operating earnings per diluted common share is considered a “non-GAAP” financial measure. More information regarding this measurement and reconciliation to the comparable GAAP measurement is provided under the headingResults of Operations—Overviewbelow.
|
| • | | Net interest margin, on a tax equivalent basis, increased to 4.19% in 2011 from 4.17% in 2010. The increase in net interest margin resulted from the increase in average covered loans and investment balances, increased covered loan yields, and declining costs of interest bearing deposits, partially offset by lower average non-covered loan balances, lower non-covered loan yields, and decreased investment yields. Excluding the impact of loan disposal gains and interest and fee reversals on non-accrual loans, our core net interest margin was 3.95% for 2011, as compared to core net interest margin of 3.92% for 2010. Core net interest margin is considered a “non-GAAP” financial measure. More information regarding this measurement and reconciliation to the comparable GAAP measurement is provided under the headingResults of Operations—Overviewbelow.
|
Mortgage banking revenue was $26.6 million in 2011, compared to $21.2 million in 2010. Closed mortgage volume increased 27% in the current year to a record $994.5 million due to an increase in purchase and refinancing activity, resulting from historically low mortgage interest rates.
We recorded loss of $2.2 million in the income statement representing the change in fair value on our junior subordinated debentures measured at fair value in 2011, compared to gains of $5.0 million in 2010.
Total gross non-covered loans and leases increased to $5.9 billion as of December 31, 2011, an increase of $229.1 million, or 4.0%, as compared to December 31, 2010. This increase is principally attributable to net loan originations of $336.9 million during the year offset by charge-offs of $65.1 million, transfers to non-covered other real estate owned of $47.4 million, and sales of non-covered loans of $11.2 million.
Total deposits were $9.2 billion as of December 31, 2011, a decrease of $197.1 million, or 2.1%, as compared to December 31, 2010, resulting from the run-off of higher priced deposits.
Total consolidated assets were $11.6 billion as of December 31, 2011, compared to $11.7 billion as of December 31, 2010, representing a decrease of $105.4 million or 0.9%.
Credit Quality
Non-covered, non-performing assets decreased to $125.6 million, or 1.09% of total assets, as of December 31, 2011, compared to $178.0 million, or 1.53% of total assets as of December 31, 2010. Non-covered, non-performing loans decreased to $91.4 million, or 1.55% of non-covered total loans, as of
| December 31, 2011, compared to $145.2 million, or 2.57% of total non-covered loans as of December 31, 2010. Non-covered, non-accrual loans have been written-down to their estimated net realizable values.
|
Net charge-offs were $55.2 million in 2011, or 0.96% of average non-covered loans and leases, as compared to net charge-offs of $119.4 million, or 2.06% of average non-covered loans and leases in 2010. The decrease in net charge-offs in the current year is consistent with the overall improving trends in credit quality indicators.
Provision for non-covered loan and lease losses in 2011 was $46.2 million as compared to $113.7 million in 2010. The decrease reflects continued improvement and stabilization of credit quality and the decline of non-performing loans outstanding.
Capital and Growth Initiatives
Total risk based capital ratio was 17.2% as of December 31, 2011, compared to 17.6% as of December 31, 2010, due to an increase in risk weighted assets primarily related to non-covered loans and $29.8 million of common stock repurchased.
Declared cash dividends of $0.05 per common share for the first and second quarters of the year and $0.07 per common share for the third and fourth quarters of 2011. In determining the amount of dividends to be paid, we consider capital preservation, expected asset growth, projected earnings and our overall dividend pay-out ratio.
Opened a new Commercial Banking Center in San Jose, California, and ten Community Banking stores in Portland, Oregon, Seattle, Washington, and northern California.
Launched our new Business Banking Division and expanded offerings from our Debt Capital Markets Group to provide additional products and services to our business and commercial customers.
SUMMARY OF CRITICAL ACCOUNTING POLICIES
The SEC defines “critical accounting policies” as those that require application of management’s most difficult, subjective or complex judgments, often as a result of the need to make estimates about the effect of matters that are inherently uncertain and may change in future periods. Our significant accounting policies are described in Note 1 in theNotes to Consolidated Financial Statements in Item 8 of this report. Not all of these critical accounting policies require management to make difficult, subjective or complex judgments or estimates. Management believes that the following policies would be considered critical under the SEC’s definition.
Allowance for Non-Covered Loan and Lease Losses and Reserve for Unfunded Commitments
The Bank performs regular credit reviews of the loan and lease portfolio to determine the credit quality and adherence to underwriting standards. When loans and leases are originated, they are assigned a risk rating that is reassessed periodically during the term of the loan through the credit review process. Consumer and residential loan portfolios are reviewed monthly for their performance as a pool of loans, since no single loan is individually significant or judged by its risk rating, size or potential risk of loss. In contrast, the monitoring process for the commercial and commercial real estate portfolios includes periodic reviews of individual loans with risk ratings assigned to each loan and performance judged on a loan by loan basis. The Company’s risk rating methodology assigns risk ratings ranging from 1 to 10, where a higher rating represents higher risk. The 10 risk rating categories are a primary factor in determining an appropriate amount for the allowance for loan and lease losses. The Bank has a management Allowance for Loan and Lease Losses (“ALLL”) Committee, which is responsible for, among other things, regularly reviewing the ALLL methodology, including loss factors, and ensuring that it is designed and applied in accordance with generally accepted accounting principles. The ALLL Committee reviews and approves loans and leases recommended for impaired status. The ALLL Committee also approves removing loans and leases from impaired status. The Bank’s Audit and Compliance Committee provides board oversight of the ALLL process and reviews and approves the ALLL methodology on a quarterly basis.
Umpqua Holdings Corporation
Each risk rating is assessed an inherent credit loss factor that determines the amount of the allowance for loan and lease losses provided for that group of loans and leases with similar risk rating. Credit loss factors may vary by region based on management’s belief that there may ultimately be different credit loss rates experienced in each region. Regular credit reviews of the portfolio also identify loans that are considered potentially impaired. Potentially impaired loans are referred to the ALLL Committee which reviews and approves designated loans as impaired. A loan is considered impaired when based on current information and events, we determine that we will probably not be able to collect all amounts due according to the loan contract, including scheduled interest payments. When we identify a loan as impaired, we measure the impairment using discounted cash flows, except when the sole remaining source of the repayment for the loan is the liquidation of the collateral for collateral dependent loans. A loan is considered collateral dependent if repayment of the loan is expected to be provided solely by the underlying collateral and there are no other available and reliable sources of repayment. In these cases, we use the current fair value of the collateral, less selling costs, instead of discounted cash flows. If we determine that the value of the impaired loan is less than the recorded investment in the loan, we either recognize an impairment reserve as a specific component to be provided for in the allowance for loan and lease losses or charge-off the impaired balance on collateral dependent loans if it is determined that such amount represents a confirmed loss. The combination of the risk rating-based allowance component and the impairment reserve allowance component lead to an allocated allowance for loan and lease losses.
The Bank may also maintain an unallocated allowance amount to provide for other credit losses inherent in a loan and lease portfolio that may not have been contemplated in the credit loss factors. This unallocated amount generally comprises less than 10% of the allowance, but may be maintained at higher levels during times of economic conditions characterized by falling real estate values. The unallocated amount is reviewed periodically based on trends in credit losses, the results of credit reviews and overall economic trends. As of December 31, 2011, the unallocated allowance amount represented 5% of the allowance.
The reserve for unfunded commitments (“RUC”) is established to absorb inherent losses associated with our commitment to lend funds, such as with a letter or line of credit. The adequacy of the ALLL and RUC are monitored on a regular basis and are based on management’s evaluation of numerous factors. These factors include the quality of the current loan portfolio; the trend in the loan portfolio’s risk ratings; current economic conditions; loan concentrations; loan growth rates; past-due and non-performing trends; evaluation of specific loss estimates for all significant problem loans; historical charge-off and recovery experience; and other pertinent information.
Management believes that the ALLL was adequate as of December 31, 2011. There is, however, no assurance that future loan losses will not exceed the levels provided for in the ALLL and could possibly result in additional charges to the provision for loan and lease losses. In addition, bank regulatory authorities, as part of their periodic examination of the Bank, may require additional charges to the provision for loan and lease losses in future periods if warranted as a result of their review. Approximately 80% of our loan portfolio is secured by real estate, and a significant decline in real estate market values may require an increase in the allowance for loan and lease losses.
Acquired Loans including Covered Loans and
FDIC Indemnification Asset
Loans acquired in an FDIC-assisted acquisition that are subject to a loss-share agreement are referred to as “covered loans” and reported separately in our statements of financial condition.
Acquired loans wereand leases are recorded at their fair value at the acquisition date. For purchased non-impaired loans, the difference between the fair value and unpaid principal balance of the loan at the acquisition date is amortized or accreted to interest income over the estimated life of the loans.
The acquired loans and purchase impaired loans are aggregated into pools based on individually evaluated common risk characteristics and aggregate expected cash flows were estimated for each pool. A pool is accounted for as a single asset with a single interest rate, cumulative loss rate and cash flow expectation. The cash flows expected to be received over the life of the pool were estimated by management with the assistance of a third party valuation specialist. These cash flows were input into
a FASB ASC 310-30,Loans and Debt Securities Acquired with Deteriorated Credit Quality (“ASC 310-30”), compliantan accounting loan system which calculates the carrying values of the pools and underlying loans, book yields, effective interest income and impairment, if any, based on actual and projected events. Default rates, loss severity, and prepayment speeds assumptions are periodically reassessed and updated within the accounting model to update our expectation of future cash flows. The excess of the cash flows expected to be collected over a
pool’spool's carrying value is considered to be the accretable yield and is recognized as interest income over the estimated life of the loan or pool using the
effective yield method. The accretable yield may change due to changes in the timing and amounts of expected cash flows. Changes in the accretable yield are disclosed quarterly.
Loans acquired in a FDIC-assisted acquisition that are subject to a loss-share agreement are referred to as "covered loans." The Company has elected to account for amounts receivable under the loss-share agreement as an indemnification
asset in accordance with FASB ASC 805,Business Combinations (“ASC 805”).asset. The FDIC indemnification asset is initially recorded at fair value, based on the discounted value of expected future cash flows under the loss-share agreement. The difference between the carrying value and the undiscounted cash flows the Company expects to collect from the FDIC will be accreted or amortized into non-interest income over the life of the FDIC indemnification asset, which is maintained at the loan pool level.
Residential Mortgage Servicing Rights
In accordance with FASB ASC 860, Transfers and Servicing (“ASC 860” ("MSR"). the
The Company determines its classes of servicing assets based on the asset type being serviced along with the methods used to manage the risk inherent in the servicing assets, which includes the market inputs used to value the servicing assets. The Company
elected to measuremeasures its residential mortgage servicing assets at fair value and
to reportreports changes in fair value through earnings. Fair value adjustments encompass market-driven valuation changes and the runoff in value that occurs from the passage of time, which are separately reported. Under the fair value method, the MSR is carried in the balance sheet at fair value and the changes in fair value are reported in earnings under the caption
residential mortgage banking revenue in the period in which the change occurs.
Retained mortgage servicing rights are measured at fair
valuevalues as of the date of sale. We use quoted market prices when available. Subsequent fair value measurements are determined using a discounted cash flow model. In order to determine the fair value of the MSR, the present value of expected
net future cash flows is estimated. Assumptions used include market discount rates, anticipated prepayment speeds, delinquency and foreclosure rates, and ancillary fee
income.income net of servicing costs. This model is periodically validated by an independent external model validation group. The model assumptions and the MSR fair value estimates are also compared to observable trades of similar portfolios as well as to MSR broker valuations and industry surveys, as available.
The expected life of the loan can vary from management’s estimates due to prepayments by borrowers, especially when rates fall. Prepayments in excess of management’s estimates would negatively impact the recorded value of the mortgage servicing rights. The value of the mortgage servicing rights is also dependent upon the discount rate used in the model, which we base on current market rates. Management reviews this rate on an ongoing basis based on current market rates. A significant increase in the discount rate would reduce the value of mortgage servicing rights. Additional information is included in Note 10 of theNotes to Consolidated Financial Statements.
Valuation of Goodwill and Intangible Assets
At December 31, 2011, we had $677.2 million in goodwill and other intangible assets as a result of business combinations.
Goodwill and other intangible assets with indefinite lives are not amortized but instead are periodically tested for impairment. Management performs an impairment analysis for the intangible assets with indefinite lives on an annual basis as of December 31. Additionally, goodwill and other intangible assets with indefinite lives are evaluated on an interim basis when events or circumstance indicate impairment potentially exists.
The Company performed a goodwill impairment analysis of the Community Banking reporting segment as of June 30, 2009, due to a decline in the Company’s market capitalization below the book value of equity and continued weakness in the banking industry. The Company engaged an independent valuation consultant to assist us in determining whether our goodwill asset was impaired. The valuation of the reporting unit was determined using discounted cash flows of forecasted earnings, estimated sales price multiples based on recent observable market transactions and market capitalization based on current stock price. The results of the Company’s and valuation specialist’s step one test indicated that the reporting unit’s fair value was less than its carrying value, and therefore the Company performed a step two analysis. In the step two analysis, we calculated the fair value for the reporting unit’s assets and liabilities, as well as its unrecognized identifiable intangible assets, such as the core deposit intangible and trade name, in order to determine the implied fair value of goodwill. Fair value adjustments to items on the balance sheet primarily related to investment securities held to maturity, loans, other real estate owned, Visa Class B common stock, deferred taxes, deposits, term debt, and junior subordinated debentures. Based on the
Umpqua Holdings Corporation
results of the step two analysis, the Company determined that the implied fair value of the goodwill was greater than its carrying amount on the Company’s balance sheet, and as a result, recognized a goodwill impairment loss of $112.0 million. This write-down of goodwill is a non-cash charge that did not affect the Company’s or the Bank’s liquidity or operations. In addition, because goodwill is excluded in the calculation of regulatory capital, the Company’s “well-capitalized” capital ratios were not affected by this charge.
The Company performed its annual goodwill impairment analysis of the Community Banking reporting segment as of December 31, 2011. In the first step of the goodwill impairment test the Company determined that the fair value of the Community Banking reporting unit exceeded its carrying amount. This determination is consistent with the events occurring after the Company recognized the $112.0 million impairment of goodwill in the second quarter of 2009. First, the market capitalization and estimated fair value of the Company increased significantly subsequent to the recognition of the impairment charge as the fair value of the Company’s stock increased 60% from June 30, 2009 to December 31, 2011. Secondly, the Company’s successful public common stock offerings in the third quarter of 2009 and first quarter of 2010 diluted the carrying value of the reporting unit’s book equity on a per share basis. The impairment analysis requires management to make subjective judgments. Events and factors that may significantly affect the estimates include, among others, competitive forces, customer behaviors and attrition, changes in revenue growth trends, cost structures, technology, changes in discount rates and specific industry and market conditions. There can be no assurance that changes in circumstances, estimates or assumption will notmay result in additional impairment of all, or some portion of, goodwill. Additional information
The Company performed its annual goodwill impairment analysis of the Community Banking reporting segment as of December 31, 2014. In the first step of the goodwill impairment test, the Company assessed qualitative factors to determine whether the existence of events and circumstances indicated that it is includedmore likely than not that the indefinite-lived intangible asset is impaired, and determined no factors indicated an impairment. Based on this analysis, no further testing was determined to be necessary.
Stock-based Compensation
We recognize expense in
Note 9 of theNotes to Consolidated Financial Statements.Stock-based Compensation
Consistent with the provisions of FASB ASC 718,Stock Compensation(“ASC 718”), we recognize expenseincome statement for the grant-date fair value of stock options and other equity-based forms of compensation issued to employees over the employees’employees' requisite service period (generally the vesting period). The requisite service period may be subject to performance conditions. The fair value of each option grant is estimated as of the grant date using the Black-Scholes option-pricing model.model or a Monte Carlo simulation pricing model, as required by the features of the grants. Management assumptions utilized at the time of grant impact the fair value of the option calculated under the Black-Scholes methodology,pricing model, and ultimately, the expense that will be recognized over the life of theexpected service period related to each option. Additional information is included in Note 1 of theNotes to Consolidated Financial Statements.
Fair Value
FASB ASC 820,
Fair Value Measurements and Disclosures, establishes a
A hierarchical disclosure framework associated with the level of pricing observability is utilized in measuring financial instruments at fair value. The degree of judgment utilized in measuring the fair value of financial instruments generally correlates to the level of pricing observability. Financial instruments with readily available active quoted prices or for which fair value can be measured from actively quoted prices generally will have a higher degree of pricing observability and a lesser degree of judgment utilized in measuring fair value. Conversely, financial instruments rarely traded or not quoted will generally have little or no pricing observability and a higher degree of judgment utilized in measuring fair value. Pricing observability is impacted by a number of factors, including the type of financial instrument, whether the financial instrument is new to the market and not yet established and the characteristics specific to the transaction. See
RECENT ACCOUNTING PRONOUNCEMENTS
Information regarding Recent Accounting Pronouncements is included in Note 241 of theNotes to Consolidated Financial Statements for additional information about the level of pricing transparency associated with financial instruments carried at fair value.RECENT ACCOUNTING PRONOUNCEMENTS
In April 2011, the FASB issued ASU No. 2011-02,A Creditor’s Determination of Whether a Restructuring is a Troubled Debt Restructuring. The Update provides additional guidance relating to when creditors should classify loan modifications as troubled debt restructurings. The ASU also ends the deferral issued in January 2010 of the disclosures about troubled debt restructurings required by ASU No. 2010-20. The provisions of ASU No. 2011-02 and the disclosure requirements of ASU No. 2010-20 are effective for the Company’s interim reporting period ending September 30, 2011. The guidance applies retrospectively to restructurings occurring on or after January 1, 2011. The adoption of this ASU did not have a material impact on the Company’s consolidated financial statements.Item 8 below
In April 2011, the FASB issued ASU No. 2011-03,Reconsideration of Effective Control for Repurchase Agreements. The Update amends existing guidance to remove from the assessment of effective control, the criterion requiring the transferor to have the ability to repurchase or redeem the financial assets on substantially the agreed terms, even in the event of default by the transferee and, as well, the collateral maintenance implementation guidance related to that criterion. ASU No. 2011-03 is effective for the Company’s reporting period beginning on or after December 15, 2011. The guidance applies prospectively to transactions or modification of existing transactions that occur on or after the effective date and early adoption is not permitted. The adoption of this ASU will not have a material impact on the Company’s consolidated financial statements.
In April 2011, the FASB issued ASU No. 2011-04,Amendments to Achieve Common Fair Value Measurement and Disclosure Requirements in U.S. GAAP and IFRSs. The Update amends existing guidance regarding the highest and best use and valuation premise by clarifying these concepts are only applicable to measuring the fair value of nonfinancial assets. The Update also clarifies that the fair value measurement of financial assets and financial liabilities which have offsetting market risks or counterparty credit risks that are managed on a portfolio basis, when several criteria are met, can be measured at the net risk position. Additional disclosures about Level 3 fair value measurements are required including a quantitative disclosure of the unobservable inputs and assumptions used in the measurement, a description of the valuation process in place, and discussion of the sensitivity of fair value changes in unobservable inputs and interrelationships about those inputs as well disclosure of the level of the fair value of items that are not measured at fair value in the financial statements but disclosure of fair value is required. The provisions of ASU No. 2011-04 are effective for the Company’s reporting period beginning after December 15, 2011 and should be applied prospectively. The adoption of this ASU is not expected to have a material impact on the Company’s consolidated financial statements.
In June 2011, the FASB issued ASU No. 2011-05,Presentation of Comprehensive Income. The Update amends current guidance to allow a company the option of presenting the total of comprehensive income, the components of net income, and the components of other comprehensive income either in a single continuous statement of comprehensive income or in two separate but consecutive statements. The provisions do not change the items that must be reported in other comprehensive income or when an item of other comprehensive must to reclassified to net income. The amendments do not change the option for a company to present components of other comprehensive income either net of related tax effects or before related tax effects, with one amount shown for the aggregate income tax expense (benefit) related to the total of other comprehensive income items. The amendments do not affect how earnings per share is calculated or presented. The provisions of ASU No. 2011-05 are effective for the Company’s reporting period beginning after December 15, 2011 and should be applied retrospectively. Early adoption is permitted and there are no required transition disclosures. In December 2011, the FASB issued ASU No. 2011-12,Deferral of the Effective Date for Amendments to the Presentation of Reclassifications of Items Out of Accumulated Other Comprehensive Income in Accounting Standards Update No. 2011-05. The ASU defers indefinitely the requirement to present reclassification adjustments and the effect of those reclassification adjustments on the face of the financial statements where net income is presented, by component of net income, and on the face of the financial statements where other comprehensive income is presented, by component of other comprehensive income. The Company is currently in the process of evaluating the Updates but does not expect either will have a material impact on the Company’s consolidated financial statements.
In September 2011, the FASB issued ASU No. 2011-08, Testing Goodwill for Impairment. With the Update, a company testing goodwill for impairment now has the option of performing a qualitative assessment before calculating the fair value of the reporting unit (the first step of goodwill impairment test). If, on the basis of qualitative factors, the fair value of the reporting unit is more likely than not greater than the carrying amount, a quantitative calculation would not be needed. Additionally, new examples of events and circumstances that an entity should consider in performing its qualitative assessment about whether to proceed to the first step of the goodwill impairment have been made to the guidance and replace the previous guidance for triggering events for interim impairment assessment. The amendments are effective for annual and interim goodwill impairment tests performed for fiscal years beginning after December 15, 2011. The adoption of this ASU will not have a material impact on the Company’s consolidated financial statements.
Umpqua Holdings Corporation
In December 2011, the FASB issued ASU No. 2011-11,Disclosures about Offsetting Assets and Liabilities. The update requires an entity to offset, and present as a single net amount, a recognized eligible asset and a recognized eligible liability when it has an unconditional and legally enforceable right of setoff and intends either to settle the asset and liability on a net basis or to realize the asset and settle the liability simultaneously. The ASU requires an entity to disclose information about offsetting and related arrangements to enable users of its financial statements to understand the effect of those arrangements on its financial position. The amendments are effective for annual and interim reporting periods beginning on or after January 1, 2013. The Company is currently in the process of evaluating the ASU but does not expect it will have a material impact on the Company’s consolidated financial statements.
RESULTS OF
OPERATIONS—OVERVIEWOPERATIONS-OVERVIEW
For the year ended December 31, 2011,2014, net earnings available to common shareholders was $74.1were $147.0 million, or $0.65$0.78 per diluted common share, as compared to net earnings available to common shareholders of $16.1$97.6 million, or $0.87 per diluted common share for the year ended December 31, 2013. The increase in net earnings available to common shareholders in 2014 is principally attributable to the merger with Sterling which increased net interest income. The increase in net interest income was offset by the increase in non-interest expense, including merger-related expenses, which are also attributable to the merger with Sterling.
For the year ended December 31, 2013, net earnings available to common shareholders were $97.6 million, or $0.87 per diluted common share, as compared to net earnings available to common shareholders of $101.2 million, or $0.15$0.90 per diluted common share for the year ended December 31, 2010.2012. The increasedecrease in net earnings available to common shareholders in 20112013 is principally attributable to increaseddecreased net interest income, decreased non-interest income, increased non-interest income, andexpense, partially offset by decreased provision for loan losses, partially offset by increased non-interest expense.For the year ended December 31, 2010, net earnings available to common shareholders was $16.1 million, or $0.15 per diluted common share, as compared to net loss available to common shareholders of $166.3 million, or $2.36 per diluted common share for the year ended December 31, 2009. The increase in net earnings available to common shareholders in 2010, as compared to 2009, is principally attributable to increased net interest income, increased non-interest income, decreased provision for loan losses, and decreased non-interest expense. Non-interest income for 2010 includes a bargain purchase gain on acquisition of $6.4 million relating to the acquisition of Evergreen. We assumed certain assets and liabilities of Evergreen, Rainier, and Nevada Security on January 22, 2010, February 26, 2010, and June 18, 2010, respectively, and the results of the acquired operations are included in our financial results starting on January 23, 2010, February 27, 2010, and June 19, 2010, respectively.
lease losses.
We recognizeUmpqua recognizes gains or losses on our junior subordinated debentures carried at fair value resulting from the estimated market credit risk adjusted spread and changes in interest rates that do not directly correlate with the Company’sCompany's operating performance. Also, we incurUmpqua incurs significant expenses related to the completion and integration of mergers and acquisitions. Additionally, we may recognize goodwill impairment losses that have no direct effect on the Company’sCompany's or the Bank’sBank's cash balances, liquidity, or regulatory capital ratios. Lastly, weUmpqua may recognize one-time bargain purchase gains on certain FDIC-assisted acquisitions that are not reflective of Umpqua’sUmpqua's on-going earnings power. Accordingly, management believes that our operating results are best measured on a comparative basis excluding the impact of gains or losses on junior subordinated debentures measured at fair value, net of tax, merger-related expenses, net of tax, and other charges related to business combinations such as goodwill impairment charges or bargain purchase gains, net of tax. We defineoperating earnings as earnings available to common shareholders before gains or losses on junior subordinated debentures carried at fair value, net of tax, bargain purchase gains on acquisitions, net of tax, merger related expenses, net of tax, and goodwill impairment, and we calculateoperating earnings per diluted share by dividing operating earnings by the same diluted share total used in determining diluted earnings per common share (see Note 25 of theNotes to Consolidated Financial Statementsin Item 8 below).share. Operating earnings and operating earnings per diluted share are considered “non-GAAP”"non-GAAP" financial measures. Although we believe the presentation of non-GAAP financial measures provides a better indication of our operating performance, readers of this report are urged to review the GAAP results as presented in theFinancial Statements and Supplementary Datain Item 8 below.
The following table presents aprovides the reconciliation of earnings available to common shareholders (GAAP) to operating earnings (loss)(non-GAAP), and operating earnings (loss) per diluted share to net earnings (loss) and net earnings (loss) per diluted common share (GAAP) to operating earnings per diluted share (non-GAAP) for the years ended December 31, 2011, 20102014, 2013, and 2009:2012:
Reconciliation of Operating Earnings (Loss) to Net (Loss) Earnings Available to Common Shareholders to Operating Earnings Years Ended December 31,(in thousands, except per share data)
| | | | | | | | | | | | |
| | | 2011 | | | 2010 | | | 2009 | |
Net earnings (loss) available to common shareholders | | $ | 74,140 | | | $ | 16,067 | | | $ | (166,262 | ) |
Net loss (gain) on junior subordinated debentures carried at fair value, net of tax (1) | | | 1,318 | | | | (2,988 | ) | | | (3,889 | ) |
Bargain purchase gain on acquisitions, net of tax(1) | | | — | | | | (3,862 | ) | | | — | |
Goodwill impairment | | | — | | | | — | | | | 111,952 | |
Merger-related expenses, net of tax(1) | | | 216 | | | | 4,005 | | | | 164 | |
| | | | |
Operating earnings (loss) | | $ | 75,674 | | | $ | 13,222 | | | $ | (58,035 | ) |
| | | | |
Per diluted common share: | | | | | | | | | | | | |
Net earnings (loss) available to common shareholders | | $ | 0.65 | | | $ | 0.15 | | | $ | (2.36 | ) |
Net loss (gain) on junior subordinated debentures carried at fair value, net of tax | | | 0.01 | | | | (0.03 | ) | | | (0.06 | ) |
Bargain purchase gain on acquisitions, net of tax | | | — | | | | (0.04 | ) | | | — | |
Goodwill impairment | | | — | | | | — | | | | 1.59 | |
Merger-related expenses, net of tax | | | — | | | | 0.04 | | | | 0.01 | |
| | | | |
Operating earnings (loss) | | $ | 0.66 | | | $ | 0.12 | | | $ | (0.82 | ) |
| | | | |
(1) | | | | | | | | | | | | | | | (in thousands, except per share data) | 2014 | | 2013 | | 2012 | | Net earnings available to common shareholders | $ | 147,036 |
| | $ | 97,573 |
| | $ | 101,209 |
| | Adjustments: | | | | | | | Net loss on junior subordinated debentures carried at fair value, net of tax (1) | 3,054 |
| | 1,318 |
| | 1,322 |
| | Merger-related expenses, net of tax (1) | 52,311 |
| | 6,820 |
| | 1,403 |
| | Operating earnings | $ | 202,401 |
| | $ | 105,711 |
| | $ | 103,934 |
| | Per diluted share: | | | | | | | Net earnings available to common shareholders | $ | 0.78 |
| | $ | 0.87 |
| | $ | 0.90 |
| | Adjustments: | | | | | | | Net loss on junior subordinated debentures carried at fair value, net of tax (1) | 0.02 |
| | 0.01 |
| | 0.01 |
| | Merger-related expenses, net of tax (1) | 0.28 |
| | 0.06 |
| | 0.02 |
| | Operating earnings | $ | 1.08 |
| | $ | 0.94 |
| | $ | 0.93 |
|
(1) Adjusted for income tax effect of pro forma operating earnings at 40%. |
Management believes core net interest income and core net interest margin are useful financial measures because they enable investors to evaluate the underlying growth or compression in these values excluding interest income adjustments related to credit quality. Management uses these measures to evaluate core net interest incometax effect of pro forma operating results exclusiveearnings of credit costs, in order to monitor our effectiveness in growing higher interest yielding assets and managing our cost of interest bearing liabilities over time. Core net interest income is calculated as net interest income, adjusting tax exempt interest income to its taxable equivalent, adding back interest and fee reversals related to new non-accrual loans during the period, and deducting the interest income gains recognized from loan disposition activities within covered loan pools. Core net interest margin is calculated by dividing annualized core net interest income by a period’s average interest earning assets. Core net interest income and core net interest margin are considered “non-GAAP” financial measures. Although we believe the presentation of non-GAAP financial measures provides a better indication of our operating performance, readers of this report are urged to review the GAAP results as presented in theFinancial Statements and Supplementary Datain Item 8 below.
Umpqua Holdings Corporation
The following table presents a reconciliation of net interest income to core net interest income and net interest margin to core net interest margin40% for years ended December 31, 2011, 2010 and 2009:
tax-deductible items.
Reconciliation of Net Interest Income to Core Net Interest Income and Net Interest Margin to Net Core Interest MarginYears Ended December 31,
(dollars in thousands)
| | | | | | | | | | | | |
| | | 2011 | | | 2010 | | | 2009 | |
Net interest income—tax equivalent basis(1) | | $ | 432,748 | | | $ | 399,054 | | | $ | 324,436 | |
Adjustments: | | | | | | | | | | | | |
Interest and fee reversals on non-accrual loans | | | 1,751 | | | | 3,259 | | | | 4,432 | |
Covered loan disposal gains | | | (26,327 | ) | | | (26,945 | ) | | | — | |
| | | | |
Core net interest income—tax equivalent basis(1) | | $ | 408,172 | | | $ | 375,368 | | | $ | 328,868 | |
| | | | |
Average interest earning assets | | $ | 10,332,242 | | | $ | 9,567,341 | | | $ | 7,925,014 | |
Net interest margin—consolidated(1) | | | 4.19% | | | | 4.17% | | | | 4.09% | |
Core net interest margin—consolidated(1) | | | 3.95% | | | | 3.92% | | | | 4.15% | |
(1) | Tax-exempt income has been adjusted to a tax equivalent basis at a 35% tax rate. The amount of such adjustment was an addition to recorded income of approximately $4.3 million, $4.3 million, and $3.7 million for the years ended 2011, 2010 and 2009, respectively. |
The following table presents the returns on average assets, average common shareholders’shareholders' equity and average tangible common shareholders’shareholders' equity for the years ended December 31, 2011, 20102014, 2013, and 2009.2012. For each of the yearsperiods presented, the table includes the calculated ratios based on reported net earnings (loss) available to common shareholders and operating earnings (loss)income as shown in the table above. Our return on average common shareholders’shareholders' equity is negatively impacted as athe result of capital required to support goodwill. To the extent this performance metric is used to compare our performance with other financial institutions that do not have merger-relatedmerger and acquisition-related intangible assets, we believe it beneficial to also consider the return on average tangible common tangible shareholders’shareholders' equity. The return on average tangible common tangible shareholders’shareholders' equity is calculated by dividing net earnings (loss) available to common shareholders by average common shareholders’shareholders' common equity less average goodwill and intangible assets, net (excluding MSRs). The return on average tangible common shareholders’shareholders' equity is considered a non-GAAP financial measure and should be viewed in conjunction with the return on average common shareholders’shareholders' equity.
Returns
Return on Average Assets, Common
Shareholders’Shareholders' Equity and Tangible Common
Shareholders’Shareholders' Equity
For the Years Ended December 31,
(dollars in thousands)
| | | | | | | | | | | | |
| | | 2011 | | | 2010 | | | 2009 | |
RETURNS ON AVERAGE ASSETS: | | | | | | | | | | | | |
Net earnings (loss) available to common shareholders | | | 0.64% | | | | 0.15% | | | | -1.85% | |
Operating earnings (loss) | | | 0.65% | | | | 0.12% | | | | -0.65% | |
| | | |
RETURNS ON AVERAGE COMMON SHAREHOLDERS’ EQUITY: | | | | | | | | | | | | |
Net earnings (loss) available to common shareholders | | | 4.43% | | | | 1.01% | | | | -12.63% | |
Operating earnings (loss) | | | 4.53% | | | | 0.83% | | | | -4.41% | |
| | | |
RETURNS ON AVERAGE TANGIBLE COMMON SHAREHOLDERS’ EQUITY: | | | | | | | | | | | | |
Net earnings (loss) available to common shareholders | | | 7.47% | | | | 1.76% | | | | -26.91% | |
Operating earnings (loss) | | | 7.63% | | | | 1.45% | | | | -9.39% | |
| | | |
CALCULATION OF AVERAGE TANGIBLE COMMON SHAREHOLDERS’ EQUITY: | | | | | | | | | | | | |
Average common shareholders’ equity | | $ | 1,671,893 | | | $ | 1,589,393 | | | $ | 1,315,953 | |
Less: average goodwill and other intangible assets, net | | | (679,588 | ) | | | (674,597 | ) | | | (698,223 | ) |
| | | | |
Average tangible common shareholders’ equity | | $ | 992,305 | | | $ | 914,796 | | | $ | 617,730 | |
| | | | |
|
| | | | | | | | | | | |
| (dollars in thousands) | 2014 | | 2013 | | 2012 |
| Returns on average assets: | | | | | |
| Net earnings available to common shareholders | 0.77 | % | | 0.85 | % | | 0.88 | % |
| Operating earnings | 1.06 | % | | 0.92 | % | | 0.90 | % |
| Returns on average common shareholders' equity: | | | | | |
| Net earnings available to common shareholders | 4.69 | % | | 5.64 | % | | 5.95 | % |
| Operating earnings | 6.45 | % | | 6.11 | % | | 6.11 | % |
| Returns on average tangible common shareholders' equity: | | | | | |
| Net earnings available to common shareholders | 9.16 | % | | 9.78 | % | | 9.87 | % |
| Operating earnings | 12.62 | % | | 10.60 | % | | 10.14 | % |
| Calculation of average common tangible shareholders' equity: | | | | | |
| Average common shareholders' equity | $ | 3,137,858 |
| | $ | 1,729,083 |
| | $ | 1,701,403 |
|
| Less: average goodwill and other intangible assets, net | (1,533,403 | ) | | (731,525 | ) | | (676,354 | ) |
| Average tangible common shareholders' equity | $ | 1,604,455 |
| | $ | 997,558 |
| | $ | 1,025,049 |
|
Additionally, management believes tangible common equity and the tangible common equity ratio are meaningful measures of capital adequacy. Umpqua believes the exclusion of certain intangible assets in the computation of tangible common equity and tangible common equity ratio provides a meaningful base for period-to-period and company-to-company comparisons, which management believes will assist investors in analyzing the operating results and capital of the Company. Tangible common equity is calculated as total shareholders’shareholders' equity less preferred stock and less goodwill and other intangible assets, net (excluding MSRs). In addition, tangible assets are total assets less goodwill and other intangible assets, net (excluding MSRs). The tangible common equity ratio is calculated as tangible common shareholders’shareholders' equity divided by tangible assets. The tangible common equity and tangible common equity ratio is considered a non-GAAP financial measure and should be viewed in conjunction with the total shareholders’shareholders' equity and the total shareholders’shareholders' equity ratio. The following table provides a reconciliation of ending shareholders’shareholders' equity (GAAP) to ending tangible common equity (non-GAAP), and ending assets (GAAP) to ending tangible assets (non-GAAP) as of December 31, 20112014 and December 31, 2010:2013
: Reconciliations of Total
Shareholders’Shareholders' Equity to Tangible Common
Shareholders’Shareholders' Equity and Total Assets to Tangible Assets
(dollars in thousands)
| | | | | | | | |
| | | 2011 | | | 2010 | |
Total shareholders’ equity | | $ | 1,672,413 | | | $ | 1,642,574 | |
Subtract: | | | | | | | | |
Goodwill and other intangible assets, net | | | 677,224 | | | | 681,969 | |
| | | | |
Tangible common shareholders’ equity | | $ | 995,189 | | | $ | 960,605 | |
| | | | |
Total assets | | $ | 11,563,355 | | | $ | 11,668,710 | |
Subtract: | | | | | | | | |
| | |
Goodwill and other intangible assets, net | | | 677,224 | | | | 681,969 | |
| | | | |
Tangible assets | | $ | 10,886,131 | | | $ | 10,986,741 | |
| | | | |
Tangible common equity ratio | | | 9.14% | | | | 8.74% | |
|
| | | | | | | |
| (dollars in thousands) | December 31, | | December 31, |
| | 2014 | | 2013 |
| Total shareholders' equity | $ | 3,780,997 |
| | $ | 1,727,426 |
|
| Subtract: | | | |
| Goodwill and other intangible assets, net | 1,842,958 |
| | 776,683 |
|
| Tangible common shareholders' equity | $ | 1,938,039 |
| | $ | 950,743 |
|
| Total assets | $ | 22,613,274 |
| | $ | 11,636,112 |
|
| Subtract: | | | |
| Goodwill and other intangible assets, net | 1,842,958 |
| | 776,683 |
|
| Tangible assets | $ | 20,770,316 |
| | $ | 10,859,429 |
|
| Tangible common equity ratio | 9.33 | % | | 8.75 | % |
Non-GAAP financial measures have inherent limitations, are not required to be uniformly applied, and are not audited. Although we believe these non-GAAP financial measure are frequently used by stakeholders in the evaluation of a company, they have limitations as analytical tools, and should not be considered in isolation or as a substitute for analyses of results as reported under GAAP.
Net interest income is the largest source of our operating income. Net interest income for 20112014 was $428.5$773.8 million, an increase of $33.7$368.9 million or 9% over 2010. Net interest income for 2010 was $394.8 million, an increase of $74.1 million, or 23% over 2009. The negative impact91.1% compared to net interest income of the reversal of interest income and fees on loans during the year was $1.7 millionsame period in 2011 and $3.3 million and $4.4 million in 2010 and 2009, respectively.2013. The increase in net interest income in 20112014 as compared to 20102013 is attributable to growthan increase in average interest-earning assets, primarily loans and investment securities, and an increase in net interest margin, partially offset by an increase in average deposits and other average interest-bearing liabilities.
Net interest income for 2013 was $405.0 million, a decrease of $2.3 million or 0.6% compared to the same period in 2012. The decrease in net interest income in 2013 as compared to 2012 is attributable to a decrease in outstanding average interest-earning assets, primarily
average covered loans and average investment securities,
increased covered loan yields, decreased cost of deposits and
investing excessa decrease in net interest
earning cash into the investment portfolio,margin, partially offset by
a decline in average non-covered loans outstanding, lower non-covered loan yields, lower investment yields, and increased average interest bearing deposit balances.The increase in net interest income in 2010 as compared to 2009 is attributable to growth in outstanding average interest-earning assets, primarily covered loans and investment securities, partially offset by a decline in non-covered loans outstanding. In addition to organic growth, the FDIC-assisted purchase and assumption of certain assets and liabilities of Evergreen, Rainier, and Nevada Security, which were completed on January 22, 2010, February 26, 2010, and June 18, 2010, respectively, contributed to an increase in interest earning assetsaverage loans and interest bearing liabilitiesleases and a decrease in 2010 over 2009.
Umpqua Holdings Corporation
interest-bearing liabilities.
The net interest margin (net interest income as a percentage of average interest earningsinterest-earning assets) on a fully tax-equivalenttax equivalent basis was 4.19%4.73% for 2011,the 2014, an increase of 272 basis points as compared to the same period in 2010.2013. The increase in net interest margin primarily resulted from the increase in loan yields, the increase in average loans and leases, offset by an increase in average covered loansdeposits and investment balances, a decrease in interest bearing cash, and a decrease in our interest expense to earning assets of 27 basis points due to declining costs of interest bearing deposits, partially offset by a decrease in average non-covered loan balances, and decline in investment yields.Loan disposal related activities within the covered loan portfolio, either through loans being paid off in full or transferred to other real estate owned (“OREO”), result in gains within covered loan interest incomeinterest-bearing liabilities. Partially contributing to the extent assets receivedincrease in satisfaction of debt (such as cash or the net realizable value of OREO received) exceeds the allocated carrying value of the loan disposed of from the pool. Loan disposal activities contributed $26.3 million of interest income for 2011, compared to $26.9 million of loan disposal gains recognized during 2010. While dispositions of covered loans positively impact net interest margin we recognizein 2014, as compared to
2013, is the continued reduction of the cost of interest-bearing liabilities, specifically time deposits. The total cost of interest-bearing liabilities for 2014 was 0.41%, representing a corresponding decrease of 10 basis points compared 2013. The cost of time deposits was 0.58% in 2014 compared to the change0.89% in FDIC indemnification asset at the incremental loss-sharing rate within other non-interest income.2013. The net interest margin on a fully tax-equivalent basis was 4.17%4.01% for 2010, an increase2013, a decrease of 81 basis points as compared to the same period in 2009.2012. The increasedecrease in net interest margin primarily resulted from the decline in loan yields, a decline in investment yields, and an increase in average coveredinterest bearing cash, offset by an increase in average loans and leases outstanding, increased yield ona decline in the covered loan portfolio as a resultcost of payoffs ahead of expectations,interest-bearing deposits, and a decrease in our interest expense to earning assetsaverage interest-bearing liabilities.
Our net interest income is affected by changes in the amount and mix of interest earningsinterest-earning assets and interest bearinginterest-bearing liabilities, as well as changes in the yields earned on interest earningsinterest-earning assets and rates paid on deposits and borrowed funds. The following table presents condensed average balance sheet information, together with interest income and yields on average interest earningsinterest-earning assets, and interest expense and rates paid on average interest bearinginterest-bearing liabilities for the years ended December 31, 2011, 20102014, 2013 and 2009:2012:
Average Rates and Balances(dollars in thousands)
| | | | | | | | | | | | | | | | | | | | | | | | | | | | | | | | | | | | |
| | | 2011 | | | 2010 | | | 2009 | |
| | | Average Balance | | | Interest Income
or Expense | | | Average
Yields or Rates | | | Average Balance | | | Interest Income
or Expense | | | Average Yields or Rates | | | Average Balance | | | Interest Income or Expense | | | Average Yields or Rates | |
INTEREST EARNING ASSETS: | | | | | | | | | | | | | | | | | | | | | | | | | | | | | | | | | | | | |
Non-covered loans and
leases(1) | | $ | 5,794,106 | | | $ | 319,702 | | | | 5.52% | | | $ | 5,828,637 | | | $ | 336,320 | | | | 5.77% | | | $ | 6,145,927 | | | $ | 355,195 | | | | 5.78% | |
Covered loans and leases | | | 707,026 | | | | 86,011 | | | | 12.17% | | | | 681,569 | | | | 73,812 | | | | 10.83% | | | | — | | | | — | | | | NA | |
Taxable securities | | | 2,968,501 | | | | 85,797 | | | | 2.89% | | | | 1,946,222 | | | | 67,402 | | | | 3.46% | | | | 1,386,960 | | | | 60,217 | | | | 4.34% | |
Non-taxable securities(2) | | | 224,085 | | | | 12,949 | | | | 5.78% | | | | 227,589 | | | | 13,109 | | | | 5.76% | | | | 198,641 | | | | 11,522 | | | | 5.80% | |
Temporary investments and interest bearing deposits | | | 638,524 | | | | 1,590 | | | | 0.25% | | | | 883,324 | | | | 2,223 | | | | 0.25% | | | | 193,486 | | | | 526 | | | | 0.27% | |
| | | | | | | | | | | | | | | | | | | | | | | | |
Total interest earning assets | | | 10,332,242 | | | | 506,049 | | | | 4.90% | | | | 9,567,341 | | | | 492,866 | | | | 5.15% | | | | 7,925,014 | | | | 427,460 | | | | 5.39% | |
Allowance for non-covered loan and lease losses | | | (96,748 | ) | | | | | | | | | | | (102,016 | ) | | | | | | | | | | | (96,916 | ) | | | | | | | | |
Other assets | | | 1,364,941 | | | | | | | | | | | | 1,365,161 | | | | | | | | | | | | 1,147,080 | | | | | | | | | |
| | | | | | | | | | | | | | | | | | | | | | | | | | | | | | | | | | | | |
Total assets | | $ | 11,600,435 | | | | | | | | | | | $ | 10,830,486 | | | | | | | | | | | $ | 8,975,178 | | | | | | | | | |
| | | | | | | | | | | | | | | | | | | | | | | | | | | | | | | | | | | | |
INTEREST BEARING LIABILITIES: | | | | | | | | | | | | | | | | | | | | | | | | | | | | | | | | | | | | |
Interest bearing checking and savings accounts | | $ | 4,765,091 | | | $ | 20,647 | | | | 0.43% | | | $ | 4,203,109 | | | $ | 31,632 | | | | 0.75% | | | $ | 3,333,088 | | | $ | 32,341 | | | | 0.97% | |
Time deposits | | | 2,754,533 | | | | 35,096 | | | | 1.27% | | | | 2,875,706 | | | | 44,609 | | | | 1.55% | | | | 2,358,697 | | | | 56,401 | | | | 2.39% | |
Securities sold under agreements to repurchase and federal funds purchased | | | 113,129 | | | | 539 | | | | 0.48% | | | | 54,696 | | | | 517 | | | | 0.95% | | | | 60,722 | | | | 680 | | | | 1.12% | |
Term debt | | | 257,496 | | | | 9,255 | | | | 3.59% | | | | 261,170 | | | | 9,229 | | | | 3.53% | | | | 129,814 | | | | 4,576 | | | | 3.53% | |
Junior subordinated debentures | | | 184,115 | | | | 7,764 | | | | 4.22% | | | | 184,134 | | | | 7,825 | | | | 4.25% | | | | 190,491 | | | | 9,026 | | | | 4.74% | |
| | | | | | | | | | | | | | | | | | | | | | | | |
Total interest bearing liabilities | | | 8,074,364 | | | | 73,301 | | | | 0.91% | | | | 7,578,815 | | | | 93,812 | | | | 1.24% | | | | 6,072,812 | | | | 103,024 | | | | 1.70% | |
Noninterest bearing deposits | | | 1,782,354 | | | | | | | | | | | | 1,529,165 | | | | | | | | | | | | 1,318,954 | | | | | | | | | |
Other liabilities | | | 71,824 | | | | | | | | | | | | 64,962 | | | | | | | | | | | | 64,293 | | | | | | | | | |
| | | | | | | | | | | | | | | | | | | | | | | | | | | | | | | | | | | | |
Total liabilities | | | 9,928,542 | | | | | | | | | | | | 9,172,942 | | | | | | | | | | | | 7,456,059 | | | | | | | | | |
Preferred equity | | | — | | | | | | | | | | | | 68,151 | | | | | | | | | | | | 203,166 | | | | | | | | | |
Common equity | | | 1,671,893 | | | | | | | | | | | | 1,589,393 | | | | | | | | | | | | 1,315,953 | | | | | | | | | |
| | | | | | | | | | | | | | | | | | | | | | | | | | | | | | | | | | | | |
Total shareholders’ equity | | | 1,671,893 | | | | | | | | | | | | 1,657,544 | | | | | | | | | | | | 1,519,119 | | | | | | | | | |
| | | | | | | | | | | | | | | | | | | | | | | | | | | | | | | | | | | | |
Total liabilities and shareholders’ equity | | $ | 11,600,435 | | | | | | | | | | | $ | 10,830,486 | | | | | | | | | | | $ | 8,975,178 | | | | | | | | | |
| | | | | | | | | | | | | | | | | | | | | | | | | | | | | | | | | | | | |
NET INTEREST INCOME(2) | | | | | | $ | 432,748 | | | | | | | | | | | $ | 399,054 | | | | | | | | | | | $ | 324,436 | | | | | |
| | | | | | | | | | | | | | | | | | | | | | | | | | | | | | | | | | | | |
NET INTEREST SPREAD | | | | | | | | | | | 3.99% | | | | | | | | | | | | 3.91% | | | | | | | | | | | | 3.69% | |
AVERAGE YIELD ON EARNING ASSETS(1), (2) | | | | | | | | | | | 4.90% | | | | | | | | | | | | 5.15% | | | | | | | | | | | | 5.39% | |
INTEREST EXPENSE TO EARNING ASSETS | | | | | | | | | | | 0.71% | | | | | | | | | | | | 0.98% | | | | | | | | | | | | 1.30% | |
| | | | | | | | | | | | | | | | | | | | | | | | | | | | | | | | |
NET INTEREST INCOME TO EARNING ASSETS OR NET INTEREST MARGIN(1), (2) | | | | | | | | | | | 4.19% | | | | | | | | | | | | 4.17% | | | | | | | | | | | | 4.09% | |
| | | | | | | | | | | | | | | | | | | | | | | | | | | | | | | | | | | | |
Umpqua Holdings Corporation
|
| | | | | | | | | | | | | | | | | | | | | | | | | | | | | | | | |
| (dollars in thousands) | 2014 | | 2013 | | 2012 |
| | | | Interest | | Average | | | | Interest | | Average | | | | Interest | | Average |
| | Average | | Income or | | Yields or | | Average | | Income or | | Yields or | | Average | | Income or | | Yields or |
| | Balance | | Expense | | Rates | | Balance | | Expense | | Rates | | Balance | | Expense | | Rates |
| INTEREST-EARNING ASSETS: | | | | | | | | | | | | | | | | | |
| Loans held for sale | $ | 205,580 |
| | $ | 8,337 |
| | 4.06 | % | | $ | 138,383 |
| | $ | 4,835 |
| | 3.49 | % | | $ | 178,403 |
| | $ | 6,634 |
| | 3.72 | % |
| Loans and leases (1) | 13,003,762 |
| | 755,466 |
| | 5.81 | % | | 7,367,602 |
| | 393,379 |
| | 5.34 | % | | 6,707,194 |
| | 380,178 |
| | 5.67 | % |
| Taxable securities | 2,072,936 |
| | 46,109 |
| | 2.22 | % | | 1,952,611 |
| | 34,398 |
| | 1.76 | % | | 2,743,672 |
| | 59,161 |
| | 2.16 | % |
| Non-taxable securities (2) | 301,535 |
| | 15,692 |
| | 5.20 | % | | 247,010 |
| | 13,477 |
| | 5.46 | % | | 258,816 |
| | 13,834 |
| | 5.34 | % |
| Temporary investments and interest-bearing deposits | 900,851 |
| | 2,264 |
| | 0.25 | % | | 519,000 |
| | 1,336 |
| | 0.26 | % | | 364,082 |
| | 928 |
| | 0.25 | % |
| Total interest earning assets | 16,484,664 |
| | 827,868 |
| | 5.02 | % | | 10,224,606 |
| | 447,425 |
| | 4.38 | % | | 10,252,167 |
| | 460,735 |
| | 4.49 | % |
| Allowance for loan and lease losses | (96,513 | ) | | | | | | (86,227 | ) | | | | | | (86,656 | ) | | | | |
| Other assets | 2,780,947 |
| | | | | | 1,369,309 |
| | | | | | 1,333,988 |
| | | | |
| Total assets | $ | 19,169,098 |
| | | | | | $ | 11,507,688 |
| | | | | | $ | 11,499,499 |
| | | | |
| INTEREST-BEARING LIABILITIES: | | | | | | | | | | | | | | | | | |
| Interest-bearing checking | $ | 1,721,452 |
| | $ | 950 |
| | 0.06 | % | | $ | 1,176,841 |
| | $ | 978 |
| | 0.08 | % | | $ | 1,112,394 |
| | $ | 1,980 |
| | 0.18 | % |
| Money market deposits | 5,255,622 |
| | 6,991 |
| | 0.13 | % | | 3,277,780 |
| | 3,485 |
| | 0.11 | % | | 3,447,806 |
| | 7,193 |
| | 0.21 | % |
| Savings deposits | 829,737 |
| | 426 |
| | 0.05 | % | | 521,387 |
| | 321 |
| | 0.06 | % | | 427,673 |
| | 291 |
| | 0.07 | % |
| Time deposits | 2,649,091 |
| | 15,448 |
| | 0.58 | % | | 1,796,669 |
| | 15,971 |
| | 0.89 | % | | 2,102,711 |
| | 21,669 |
| | 1.03 | % |
| Federal funds purchased and repurchase agreements | 303,358 |
| | 346 |
| | 0.11 | % | | 177,888 |
| | 141 |
| | 0.08 | % | | 142,363 |
| | 288 |
| | 0.20 | % |
| Term debt | 815,017 |
| | 12,793 |
| | 1.57 | % | | 252,546 |
| | 9,248 |
| | 3.66 | % | | 254,601 |
| | 9,279 |
| | 3.64 | % |
| Junior subordinated debentures | 301,525 |
| | 11,739 |
| | 3.89 | % | | 189,237 |
| | 7,737 |
| | 4.09 | % | | 187,139 |
| | 8,149 |
| | 4.35 | % |
| Total interest-bearing liabilities | 11,875,802 |
| | 48,693 |
| | 0.41 | % | | 7,392,348 |
| | 37,881 |
| | 0.51 | % | | 7,674,687 |
| | 48,849 |
| | 0.64 | % |
| Non-interest-bearing deposits | 3,951,429 |
| | | | | | 2,284,996 |
| | | | | | 2,034,035 |
| | | | |
| Other liabilities | 204,009 |
| | | | | | 101,261 |
| | | | | | 89,374 |
| | | | |
| Total liabilities | 16,031,240 |
| | | | | | 9,778,605 |
| | | | | | 9,798,096 |
| | | | |
| Common equity | 3,137,858 |
| | | | | | 1,729,083 |
| | | | | | 1,701,403 |
| | | | |
| Total liabilities and shareholders' equity | $ | 19,169,098 |
| | | | | | $ | 11,507,688 |
| | | | | | $ | 11,499,499 |
| | | | |
| NET INTEREST INCOME | | | $ | 779,175 |
| | | | | | $ | 409,544 |
| | | | | | $ | 411,886 |
| | |
| NET INTEREST SPREAD | | | | | 4.61 | % | | | | | | 3.87 | % | | |
| | |
| | 3.85 | % |
| AVERAGE YIELD ON EARNING ASSETS (1), (2) | | | | | 5.02 | % | | | | | | 4.38 | % | | |
| | |
| | 4.49 | % |
| INTEREST EXPENSE TO EARNING ASSETS | | | | | 0.30 | % | | | | | | 0.37 | % | | |
| | |
| | 0.47 | % |
| NET INTEREST INCOME TO EARNING ASSETS OR NET INTEREST MARGIN (1), (2) | | | | | 4.73 | % | | | | | | 4.01 | % | | |
| | |
| | 4.02 | % |
| |
| (1) | Non-covered, non-accrualNon-accrual loans and loans held for saleleases are included in the average balance. |
| |
| (2) | Tax-exempt income has been adjusted to a tax equivalent basis at a 35% tax rate. The amount of such adjustment was an addition to recorded income of approximately $4.3$5.3 million, $4.3$4.6 million, and $3.7$4.7 million for the years ended 2011, 20102014, 2013, and 2009,2012, respectively. |
The following table sets forth a summary of the changes in tax equivalent net interest income due to changes in average asset and liability balances (volume) and changes in average rates (rate) for 20112014 as compared to 20102013 and 20102013 compared to 2009.2012. Changes in tax equivalent interest income and expense, which are not attributable specifically to either volume or rate, are allocated proportionately between both variances.Rate/Volume Analysis
(in thousands)
| | | | | | | | | | | | | | | | | | | | | | | | |
| | | 2011 COMPARED TO 2010 | | | 2010 COMPARED TO 2009 | |
| | | INCREASE (DECREASE) IN INTEREST
INCOME AND EXPENSE DUE TO
CHANGES IN | | | INCREASE (DECREASE) IN INTEREST
INCOME AND EXPENSE DUE TO
CHANGES IN | |
| | |
| | |
| | VOLUME | | | RATE | | | TOTAL | | | VOLUME | | | RATE | | | TOTAL | |
INTEREST EARNING ASSETS: | | | | | | | | | | | | | | | | | | | | | | | | |
Non-covered loans and leases | | $ | (1,983 | ) | | $ | (14,635 | ) | | $ | (16,618 | ) | | $ | (18,309 | ) | | $ | (566 | ) | | $ | (18,875 | ) |
Covered loans and leases | | | 2,836 | | | | 9,363 | | | | 12,199 | | | | 73,812 | | | | — | | | | 73,812 | |
Taxable securities | | | 30,950 | | | | (12,555 | ) | | | 18,395 | | | | 21,009 | | | | (13,824 | ) | | | 7,185 | |
Non-taxable securities(1) | | | (203 | ) | | | 43 | | | | (160 | ) | | | 1,668 | | | | (81 | ) | | | 1,587 | |
Temporary investments and interest bearing deposits | | | (610 | ) | | | (23 | ) | | | (633 | ) | | | 1,739 | | | | (42 | ) | | | 1,697 | |
| | | | |
Total(1) | | | 30,990 | | | | (17,807 | ) | | | 13,183 | | | | 79,919 | | | | (14,513 | ) | | | 65,406 | |
INTEREST BEARING LIABILITIES: | | | | | | | | | | | | | | | | | | | | | | | | |
Interest bearing checking and savings accounts | | | 3,799 | | | | (14,784 | ) | | | (10,985 | ) | | | 7,424 | | | | (8,133 | ) | | | (709 | ) |
Time deposits | | | (1,816 | ) | | | (7,697 | ) | | | (9,513 | ) | | | 10,694 | | | | (22,486 | ) | | | (11,792 | ) |
Securities sold under agreements to repurchase and federal funds purchased | | | 365 | | | | (343 | ) | | | 22 | | | | (64 | ) | | | (99 | ) | | | (163 | ) |
Term debt | | | (131 | ) | | | 157 | | | | 26 | | | | 4,642 | | | | 11 | | | | 4,653 | |
Junior subordinated debentures | | | (1 | ) | | | (60 | ) | | | (61 | ) | | | (293 | ) | | | (908 | ) | | | (1,201 | ) |
| | | | |
Total | | | 2,216 | | | | (22,727 | ) | | | (20,511 | ) | | | 22,403 | | | | (31,615 | ) | | | (9,212 | ) |
| | | | |
Net increase in net interest income(1) | | $ | 28,774 | | | $ | 4,920 | | | $ | 33,694 | | | $ | 57,516 | | | $ | 17,102 | | | $ | 74,618 | |
| | | | |
|
| | | | | | | | | | | | | | | | | | | | | | | |
| (in thousands) | 2014 compared to 2013 | | 2013 compared to 2012 |
| | Increase (decrease) in interest income | | Increase (decrease) in interest income |
| | and expense due to changes in | | and expense due to changes in |
| | Volume | | Rate | | Total | | Volume | | Rate | | Total |
| INTEREST-EARNING ASSETS: | | | | | | | | | | | |
| Loans held for sale | $ | 2,631 |
| | $ | 871 |
| | $ | 3,502 |
| | $ | (1,417 | ) | | $ | (382 | ) | | $ | (1,799 | ) |
| Loans and leases | 324,701 |
| | 37,386 |
| | 362,087 |
| | 36,066 |
| | (22,865 | ) | | 13,201 |
|
| Taxable securities | 2,225 |
| | 9,486 |
| | 11,711 |
| | (15,148 | ) | | (9,615 | ) | | (24,763 | ) |
| Non-taxable securities (1) | 2,862 |
| | (647 | ) | | 2,215 |
| | (640 | ) | | 283 |
| | (357 | ) |
| Temporary investments and interest bearing deposits | 961 |
| | (33 | ) | | 928 |
| | 399 |
| | 9 |
| | 408 |
|
| Total (1) | 333,380 |
| | 47,063 |
| | 380,443 |
| | 19,260 |
| | (32,570 | ) | | (13,310 | ) |
| INTEREST-BEARING LIABILITIES: | | | | | | | | | | | |
| Interest bearing demand | 365 |
| | (393 | ) | | (28 | ) | | 109 |
| | (1,112 | ) | | (1,003 | ) |
| Money market | 2,476 |
| | 1,030 |
| | 3,506 |
| | (339 | ) | | (3,368 | ) | | (3,707 | ) |
| Savings | 165 |
| | (60 | ) | | 105 |
| | 60 |
| | (29 | ) | | 31 |
|
| Time deposits | 6,067 |
| | (6,590 | ) | | (523 | ) | | (2,931 | ) | | (2,768 | ) | | (5,699 | ) |
| Repurchase agreements and federal funds | 126 |
| | 79 |
| | 205 |
| | 59 |
| | (206 | ) | | (147 | ) |
| Term debt | 11,232 |
| | (7,687 | ) | | 3,545 |
| | (75 | ) | | 44 |
| | (31 | ) |
| Junior subordinated debentures | 4,388 |
| | (386 | ) | | 4,002 |
| | 91 |
| | (503 | ) | | (412 | ) |
| Total | 24,819 |
| | (14,007 | ) | | 10,812 |
| | (3,026 | ) | | (7,942 | ) | | (10,968 | ) |
| Net increase (decrease) in net interest income (1) | $ | 308,561 |
| | $ | 61,070 |
| | $ | 369,631 |
| | $ | 22,286 |
| | $ | (24,628 | ) | | $ | (2,342 | ) |
| |
| (1) | Tax exempt income has been adjusted to a tax equivalent basis at a 35% tax rate. |
PROVISION FOR LOAN AND LEASE LOSSES
The provision for non-covered loan and lease losses was $46.2$40.2 million for 2011,2014, as compared to $113.7$10.7 million for 20102013, and $209.1$29.2 million for 2009.2012. As a percentage of average outstanding loans and leases, the provision for loan and lease losses recorded for 20112014 was 0.81%0.31%, a decreasean increase of 11616 basis points from 20102013 and a decrease of 26229 basis points from 2009, respectively.2012.
The
decreaseincrease in the provision for loan and lease losses in
20112014 as compared to
20102013 and
2010 compared to 20092012 is principally attributable to
the declining levelsoriginations of
non-performingnew loans and
the decreases in net charge-offs during the periods. The decrease in the provisionleases by Sterling and FinPac lending teams. Net-charge offs for
loan and lease losses is also attributable2014 were $19.2 million compared to
a reduction in downgrades within the portfolio, an easing in the velocity of declining real estate values in our markets and the resulting impact on our commercial real estate and commercial construction portfolio and reflects continued improvement and stabilization of credit quality.$19.3 million for 2013.
The Company recognizes the charge-off of impairment reserves on impaired loans in the period they arise for collateral dependent loans. Therefore, the non-covered, non-accrual loans of $80.6$52.0 million as of December 31, 20112014 have already been written-down to their estimated fair value, less estimated costs to sell, and are expected to be resolved with no additional material loss, absent further decline in market prices. Depending on the characteristics
NON-INTEREST INCOME
The provision for non-covered loan and lease losses is based on management’s evaluation of inherent risks in the loan portfolio and a corresponding analysis of the allowance for loan and lease losses. Additional discussion on loan quality and the allowance for loan and lease losses is provided under the headingAsset Quality and Non-Performing Assetsbelow.The provision for covered loan and lease lossesNon-interest income for the year ended December 31, 20112014 was $16.1 million, compared to $5.2 million for 2010. Provisions for covered loan and leases are recognized subsequent to acquisition to the extent it is probable we will be unable to collect all cash flows expected at acquisition plus additional cash flows expected to be collected arising from changes in estimates after acquisition, considering both the timing and amount of those expected cash flows. Provisions may be required when determined losses of unpaid principal incurred exceed previous loss expectations to-date, or future cash flows previously expected to be collectible are no longer probable of collection. Provisions for covered loan and lease losses, including amounts advanced subsequent to acquisition, are not reflected in the allowance for non-covered loan and lease losses, rather as a valuation allowance netted against the carrying value of the covered loan and lease balance accounted for under ASC 310-30, in accordance with the guidance.
NON-INTEREST INCOME
Non-interest income in 2011 was $84.1$179.3 million, an increase of $8.2$57.9 million, or 11%47.6%, as compared to 2010.the same period in 2013. Non-interest income in 2010for 2013 was $75.9$121.4 million, an increasea decrease of $2.4$15.4 million, or 3%11.2%, as compared to 2009.2012. The following table presents the key components of non-interest income for years ended December 31, 2011, 20102014, 2013 and 2009:
2012:
Years Ended December 31,(dollars
|
| | | | | | | | | | | | | | | | | | | | | | | | | | | | | | |
| (in thousands) | | 2014 compared to 2013 | | 2013 compared to 2012 |
| | | | | | | Change | | Change | | | | | | Change | | Change |
| | | 2014 | | 2013 | | Amount | | Percent | | 2013 | | 2012 | | Amount | | Percent |
| Service charges on deposit accounts | | $ | 54,700 |
| | $ | 30,952 |
| | $ | 23,748 |
| | 77 | % | | $ | 30,952 |
| | $ | 28,299 |
| | $ | 2,653 |
| | 9 | % |
| Brokerage commissions and fees | | 18,133 |
| | 14,736 |
| | 3,397 |
| | 23 | % | | 14,736 |
| | 12,967 |
| | 1,769 |
| | 14 | % |
| Residential mortgage banking revenue, net | | 77,265 |
| | 78,885 |
| | (1,620 | ) | | (2 | )% | | 78,885 |
| | 84,216 |
| | (5,331 | ) | | (6 | )% |
| Gain on investment securities, net | | 2,904 |
| | 209 |
| | 2,695 |
| | nm |
| | 209 |
| | 3,868 |
| | (3,659 | ) | | (95 | )% |
| Gain on sale of loans | | 15,113 |
| | 2,744 |
| | 12,369 |
| | 18 | % | | 2,744 |
| | — |
| | 2,744 |
| | nm |
|
| Loss on junior subordinated debentures carried at fair value | | (5,090 | ) | | (2,197 | ) | | (2,893 | ) | | 132 | % | | (2,197 | ) | | (2,203 | ) | | 6 |
| | 0 | % |
| Change in FDIC indemnification asset | | (15,151 | ) | | (25,549 | ) | | 10,398 |
| | (41 | )% | | (25,549 | ) | | (15,234 | ) | | (10,315 | ) | | 68 | % |
| BOLI income | | 6,835 |
| | 3,035 |
| | 3,800 |
| | 125 | % | | 3,035 |
| | 2,708 |
| | 327 |
| | 12 | % |
| Other income | | 24,583 |
| | 18,626 |
| | 5,957 |
| | 86 | % | | 18,626 |
| | 22,208 |
| | (3,582 | ) | | (4 | )% |
| Total | | $ | 179,292 |
| | $ | 121,441 |
| | $ | 57,851 |
| | 48 | % | | $ | 121,441 |
| | $ | 136,829 |
| | $ | (15,388 | ) | | (11 | )% |
nm = not meaningful
The overall increase in thousands) | | | | | | | | | | | | | | | | | | | | | | | | | | | | | | | | |
| | | 2011 compared to 2010 | | | 2010 compared to 2009 | |
| | | 2011 | | | 2010 | | | Change Amount | | | Change Percent | | | 2010 | | | 2009 | | | Change Amount | | | Change Percent | |
Service charges on deposit accounts | | $ | 33,096 | | | $ | 34,874 | | | $ | (1,778 | ) | | | -5% | | | $ | 34,874 | | | $ | 32,957 | | | $ | 1,917 | | | | 6% | |
Brokerage commissions and fees | | | 12,787 | | | | 11,661 | | | | 1,126 | | | | 10% | | | | 11,661 | | | | 7,597 | | | | 4,064 | | | | 53% | |
Mortgage banking revenue, net | | | 26,550 | | | | 21,214 | | | | 5,336 | | | | 25% | | | | 21,214 | | | | 18,688 | | | | 2,526 | | | | 14% | |
Gain (loss) on investment securities, net | | | 7,376 | | | | 1,912 | | | | 5,464 | | | | 286% | | | | 1,912 | | | | (1,677 | ) | | | 3,589 | | | | -214% | |
(Loss) gain on junior subordinated debentures carried at fair value | | | (2,197 | ) | | | 4,980 | | | | (7,177 | ) | | | -144% | | | | 4,980 | | | | 6,482 | | | | (1,502 | ) | | | -23% | |
Bargain purchase gain on acquisition | | | — | | | | 6,437 | | | | (6,437 | ) | | | -100% | | | | 6,437 | | | | — | | | | 6,437 | | | | 100% | |
Change in FDIC indemnification asset | | | (6,168 | ) | | | (16,445 | ) | | | 10,277 | | | | -62% | | | | (16,445 | ) | | | — | | | | (16,445 | ) | | | 100% | |
Other income | | | 12,674 | | | | 11,271 | | | | 1,403 | | | | 12% | | | | 11,271 | | | | 9,469 | | | | 1,802 | | | | 19% | |
| | | | | | | | | | | | | | | | |
Total | | $ | 84,118 | | | $ | 75,904 | | | $ | 8,214 | | | | 11% | | | $ | 75,904 | | | $ | 73,516 | | | $ | 2,388 | | | | 3% | |
| | | | | | | | | | | | | | | | |
The decreasenon-interest income is primarily the result of the merger with Sterling in deposit service charges in 2011 compared to 2010 is principally attributable to reductions in non-sufficient funds and overdraft fee income from regulatory reform changes, which took place in the third quarter of 2010, offset by increases in ATM income and increased other deposit account service charges.April 2014. The increase in deposit service charges in 20102014 compared to 2009
2013 is principally attributable to increased non-sufficient funds and overdraft fee income due to higher average overdraft balances and due to increasedprimarily the result of the additional deposits brought on from Sterling. The increase in deposit service charges relatedin 2013 compared to 2012 is the deposits acquiredresult of the acquisition of Circle Bank in the Rainier, Evergreen and Nevada Security acquisitions, offset by reductions in non-sufficient funds and overdraft fee income from regulatory reform changes, which took place in the thirdfourth quarter of 2010.Umpqua Holdings Corporation
2012.
Brokerage commissions and fees in 20112014 increased 10%, primarilydue to the increase in managed account fees and new balances at Umpqua Investments. In 2014, assets under management at Umpqua Investments increased to $2.77 billion as compared to $2.60 billion at December 31, 2013. Brokerage commissions and fees in 2013 increased due to the increase in managed account fees at Umpqua Investments. In 2011,2013, assets under management at Umpqua Investments a part of the Wealth Management segment, increased to $2.09$2.60 billion as compared to $2.06$2.28 billion at December 31, 2010. Brokerage commissions2012.
Residential mortgage banking revenue for the year ended December 31, 2014 decreased due to lower gain on sale margins, and feeslosses related to the change in 2010 increased 53%fair value of MSR were higher in 2014 as compared to 2009 as a result of the increase in assets under management due to the new leadership’s ability to recruit new brokers in 2009.Mortgage banking revenue in 2011 increased due to an increase in purchase and refinancing activity, compared to 2010.2013. Closed mortgage volume for 2011sale for 2014 was $994.5 million,$2.1 billion, representing a 27%34% increase over 2010 production. Closed mortgage volumecompared to
2013 production of $1.6 billion. The gain on sale margin was 3.40% compared to 4.13% for 2010 was $785.4 million, representing a 4% increase over 2009 production. The continuing low2013. Higher prepayment speeds associated with the decline in mortgage interest rate environmentrates compared to the same period of the prior year has led to elevated levels of refinance activity, contributingcontributed to a $3.0$16.6 million decline in fair value on the mortgage servicing right (“MSR”)MSR asset in 2011,2014, compared to a $3.9$2.4 million declineincrease in fair value recognized in 2010.2013. As of December 31, 2011,2014, the Company serviced $2.0$11.6 billion of mortgage loans for others, and the related mortgage servicing right asset is valued at $18.2$117.3 million, or 0.90%1.01% of the total serviced portfolio principal balance. The net gain onIn connection with the sale of investment securities, we recognized in 2011 represents the realizeda gain on sale of investment securities of $7.7$2.9 million offset by an other-than-temporary impairment (“OTTI”) charge of $359,000.in 2014, compared to $209,000 for 2013 and $3.9 million for 2012. During the year,2014, the Company sold longer duration investment securities in orderto fund loan growth as well as to reduce the price risk of the securities portfolio and hedge the potential future adverse effects of rising interest rates on accumulated other comprehensive income if interest rates were to significantly increase in future periods. The net gain on investment securitiessignificantly.
A loss of $5.1 million was recognized in 2010 represents the realized gain on sale of investment securities of $2.3 million offset by an OTTI charge of $414,000. The net gain on investment securities recognized in 2009 represents an OTTI charge of $10.6 million, partially offset by the realized gain on sale of investment securities of $8.9 million. The OTTI charge recognized in earnings for all periods primarily related2014, compared to held to maturity non-agency collateralized mortgage obligations, and the amount recognized in earnings represents our estimate of the credit loss component of the total impairments. Additional discussion on the OTTI charges and gain on sale of investment securities are provided in Note 4 of theNotes to Consolidated Financial Statements and under the headingInvestment Securities.Aa loss of $2.2 million recognized in 2011 as compared to a gain of $5.0 million in 20102013, and 2012 respectively, which represents the change of fair value on the junior subordinated debentures recorded at fair value. Absent future changes to the significant inputs utilizedThe increase in the discounted cash flow model used to measureloss during 2014 was the result of the fair value of these instruments,election on the cumulative discount for each junior subordinated debenture will reverse over time, ultimately returning the carrying values of these instruments to their notional value at their expected redemption dates. This will result in recognizing losses on junior subordinated debentures carriedassumed in the Sterling merger, which the Company elected to account for at fair value on a quarterly basis within non-interest income. The decrease in the gain recognized from 2010 to the loss recognized in 2011 and the decrease in the gain recognized from 2009 to 2010 primarily resulted from the widening of the credit risk adjusted spread over the contractual rate of each junior subordinated debenture measured at fair value. Additional information on the junior subordinated debentures carried at fair value is included in Note 18 of theNotes to Consolidated Financial Statementsand under the headingJunior Subordinated Debentures.recurring basis.
A bargain purchase gain of $6.4 million recognized in 2010 represents the excess of the estimated fair value of the assets acquired over the estimated fair value of the liabilities assumed in the Evergreen acquisition. Additional information on the bargain purchase gain is included in Note 2 of theNotes to Consolidated Financial Statementsand under the headingBusiness Combinations.
The change in FDIC indemnification asset represents a change in cash flows expected to be recoverable under the loss-share agreements entered into with the FDIC in connection with the Evergreen, Rainier, and Nevada Security FDIC-assisted acquisitions. Additional information on
BOLI income increased to $6.8 million in 2014. The increase in 2014 as compared to 2013 and 2012 relates to the
FDIC indemnification asset is includedadditional BOLI acquired in
Note 7 of theNotes to Consolidated Financial Statementsand under the
headingCovered Assetsbelow.Sterling merger.
Other income in 2014 compared to 2013increased due to $15.1 million gain on loan sales, including portfolio and SBA loan sales. Other income in 2011 over 2010 by $1.42013 as compared to 2012 decreased primarily due to a $2.8 million primarily attributablereduction in debt capital market revenue from $9.9 million in 2012 to the initiation of an interest rate swap program with commercial banking customers to facilitate their risk management strategies,$7.1 million in 2013, partially offset by various non-recurring sundry recoveries recognized in 2010. Other income increased in 2010 over 2009 by $1.8 million, primarily attributable to various non-recurring sundry recoveries.from FinPac operations of $1.1 million.
Non-interest expense for 20112014 was $339.0$684.1 million, an increase of $319.4 million, or 87.6%, as compared to 2013. Non-interest expense for 2013 was $364.7 million, an increase of $21.2$5.0 million, or 7%1%, as compared to 2010. Non-interest expense for 2010 was $317.7 million, a decrease of $61.7 million or 16% compared to 2009.2012. The following table presents the key elements of non-interest expense for the years ended December 31, 2011, 20102014, 2013 and 2009.2012.
Years Ended December 31,
(dollars
|
| | | | | | | | | | | | | | | | | | | | | | | | | | | | | |
| (in thousands) | 2014 compared to 2013 | | 2013 compared to 2012 |
| | | | | | Change | | Change | | | | | | Change | | Change |
| | 2014 | | 2013 | | Amount | | Percent | | 2013 | | 2012 | | Amount | | Percent |
| Salaries and employee benefits | $ | 355,379 |
| | $ | 209,991 |
| | $ | 145,388 |
| | 69 | % | | $ | 209,991 |
| | $ | 200,946 |
| | $ | 9,045 |
| | 5 | % |
| Net occupancy and equipment | 111,263 |
| | 62,067 |
| | 49,196 |
| | 79 | % | | 62,067 |
| | 55,081 |
| | 6,986 |
| | 13 | % |
| Communications | 14,728 |
| | 11,974 |
| | 2,754 |
| | 23 | % | | 11,974 |
| | 11,573 |
| | 401 |
| | 3 | % |
| Marketing | 9,504 |
| | 6,062 |
| | 3,442 |
| | 57 | % | | 6,062 |
| | 5,064 |
| | 998 |
| | 20 | % |
| Services | 49,086 |
| | 25,483 |
| | 23,603 |
| | 93 | % | | 25,483 |
| | 25,823 |
| | (340 | ) | | (1 | )% |
| FDIC assessments | 10,998 |
| | 6,954 |
| | 4,044 |
| | 58 | % | | 6,954 |
| | 7,308 |
| | (354 | ) | | (5 | )% |
| Net loss on other real estate owned | 4,116 |
| | 1,248 |
| | 2,868 |
| | 230 | % | | 1,248 |
| | 12,655 |
| | (11,407 | ) | | (90 | )% |
| Intangible amortization | 10,207 |
| | 4,781 |
| | 5,426 |
| | 113 | % | | 4,781 |
| | 4,816 |
| | (35 | ) | | (1 | )% |
| Merger related expenses | 82,317 |
| | 8,836 |
| | 73,481 |
| | 832 | % | | 8,836 |
| | 2,338 |
| | 6,498 |
| | 278 | % |
| Other expenses | 36,465 |
| | 27,265 |
| | 9,200 |
| | 34 | % | | 27,265 |
| | 34,048 |
| | (6,783 | ) | | (20 | )% |
| Total | $ | 684,063 |
| | $ | 364,661 |
| | $ | 319,402 |
| | 88 | % | | $ | 364,661 |
| | $ | 359,652 |
| | $ | 5,009 |
| | 1 | % |
Salaries and employee benefits costs increased $145.4 million as compared to the same period prior year primarily as a result of an increase of full-time equivalent employees primarily from the merger with Sterling. The increase from 2012 to 2013 related to the increase in
thousands) | | | | | | | | | | | | | | | | | | | | | | | | | | | | | | | | |
| | | 2011 compared to 2010 | | | 2010 compared to 2009 | |
| | | 2011 | | | 2010 | | | Change Amount | | | Change Percent | | | 2010 | | | 2009 | | | Change Amount | | | Change Percent | |
Salaries and employee benefits | | $ | 179,480 | | | $ | 162,875 | | | $ | 16,605 | | | | 10% | | | $ | 162,875 | | | $ | 126,850 | | | $ | 36,025 | | | | 28% | |
Net occupancy and equipment | | | 51,284 | | | | 45,940 | | | | 5,344 | | | | 12% | | | | 45,940 | | | | 39,673 | | | | 6,267 | | | | 16% | |
Communications | | | 11,214 | | | | 10,464 | | | | 750 | | | | 7% | | | | 10,464 | | | | 7,671 | | | | 2,793 | | | | 36% | |
Marketing | | | 6,138 | | | | 6,225 | | | | (87 | ) | | | -1% | | | | 6,225 | | | | 4,529 | | | | 1,696 | | | | 37% | |
Services | | | 24,170 | | | | 22,576 | | | | 1,594 | | | | 7% | | | | 22,576 | | | | 21,918 | | | | 658 | | | | 3% | |
Supplies | | | 2,824 | | | | 3,998 | | | | (1,174 | ) | | | -29% | | | | 3,998 | | | | 3,257 | | | | 741 | | | | 23% | |
FDIC assessments | | | 10,768 | | | | 15,095 | | | | (4,327 | ) | | | -29% | | | | 15,095 | | | | 15,825 | | | | (730 | ) | | | -5% | |
Net loss on non-covered other real estate owned | | | 10,690 | | | | 8,097 | | | | 2,593 | | | | 32% | | | | 8,097 | | | | 23,204 | | | | (15,107 | ) | | | -65% | |
Net loss (gain) on covered other real estate owned | | | 7,481 | | | | (2,172 | ) | | | 9,653 | | | | -444% | | | | (2,172 | ) | | | — | | | | (2,172 | ) | | | NM | |
Intangible amortization and impairment | | | 4,948 | | | | 5,389 | | | | (441 | ) | | | -8% | | | | 5,389 | | | | 6,165 | | | | (776 | ) | | | -13% | |
Goodwill impairment | | | — | | | | — | | | | — | | | | — | | | | — | | | | 111,952 | | | | (111,952 | ) | | | NM | |
Merger related expenses | | | 360 | | | | 6,675 | | | | (6,315 | ) | | | NM | | | | 6,675 | | | | 273 | | | | 6,402 | | | | NM | |
Other expenses | | | 29,614 | | | | 32,576 | | | | (2,962 | ) | | | -9% | | | | 32,576 | | | | 18,086 | | | | 14,490 | | | | 80% | |
| | | | | | | | | | | | | | | | |
Total | | $ | 338,971 | | | $ | 317,738 | | | $ | 21,233 | | | | 7% | | | $ | 317,738 | | | $ | 379,403 | | | $ | (61,665 | ) | | | -16% | |
| | | | | | | | | | | | | | | | |
NM – Not meaningful
Management believes there are several categories of non-interest expense which are outside offull-time equivalent employees primarily from the control of the Company or depend on changes in market values, including FDIC deposit insurance assessments, gain or loss on other real estate owned, as well as infrequently occurring expenses such as merger related costsCircle and goodwill impairments. Excluding the impact of these non-controllable, valuation related or infrequently occurring items, non-interestFinPac acquisitions.
Net occupancy and equipment expense increased $19.6 million, or 7%, in 2011 over 2010. The increase primarily relates2014 as compared to increased salary and benefits expense relatedthe prior year due to mortgage and commercial banking loan production and the phase in costs related to ten newSterling merger adding additional stores, openedpartially offset by store consolidations that occurred in the second half of 2011. Excluding the impact of these non-controllable or infrequently occurring items, non-interest expense increased $61.9 million, or 27%, in 2010 over 2009, in line with the 24% growth in assets in 2010 and reflecting the additional costs of acquired institutions during that year.Of the $16.6 million2014. The increase in total salaries and employee benefits expense in 2011for 2013 as compared to 2010, approximately $8.4 million of the increase is due to mortgage and commercial banking production in the current year. The remainder primarily results from the increase in by 70 full-time equivalent employees throughout the Company to support growth initiatives. Of the $36.0 million increase in total salaries and employee benefits expense in 2010 compared to 2009, approximately $13.8 million of the increase is the2012 was a result of the FDIC-assisted acquisitionaddition of Rainier, Evergreen, and Nevada Security, respectively, $1.2 million is
4 stores, full phase in of the result of variable mortgage compensation based on increased volume and revenue, $724,000 is a result of reduced loan origination activity related to lower customer demand, resulting in a reduced offset to compensation expense for deferred loan costs. The remainder primarily resultssix locations from the increaseCircle acquisition, and $857,000 in employees (not through acquisition) by 108 in full-time equivalents in 2010.Umpqua Holdings Corporation
Net occupancy and equipment expense continuesrelated to increase primarily as a result of the growth in the number of our Company’s locations. The growth in 2011 is the result of the cost of the addition of ten de novo Community Banking locations, one Mortgage Office and an administrative facility in Hillsboro, Oregon. The growth in 2010 is the result of the cost of operating new locations through the FDIC-assisted acquisition of Rainier, Evergreen and Nevada Security, respectively, the addition of five de novo Community Banking locations, in Portland, Oregon, Seattle, Washington, and Santa Rosa, California, the opening of one new Commercial Banking Center in Walnut Creek, California and two Mortgage Offices in Tigard, Oregon, and Longview, Washington. Additionally, in 2010, we remodeled 48 stores, including locations acquired.
FinPac subsequent to acquisition.
Communications costs increased in 20112014 compared to 20102013, and in 2013 compared to 2012, primarily due to increased data processing cost as a result of the Company’sCompany's continued growth and expansion. Marketing and supplies expenses decreased asexpense increased in 2014 compared to 20102013 and 2012 due to cost containment efforts and a reduced spendcosts associated with FDIC assumptions and expansion into new markets in 2010.branding initiatives. Services expense increased asin 2014 compared to 2010 primarily2013 due to increased legal and professional fees. Communications, marketing and supplies fluctuated in 2010 as comparedcosts of services due to 2009the growth of the Bank as a result of normal operations and the FDIC assumptions.Sterling merger.
The decrease in FDIC assessments increased in 2011 as2014 compared to 2010 resulted from2013 due to the increase in the assets as a result of the Sterling merger. In 2013 compared to 2012, the decrease was a result of the adoption by the FDIC of a final rule whichthat changed the assessment rate and the assessment base (from a domestic deposit base to a scorecard based assessment system for banks with more than $10 billion in assets), effective in the second quarter of 2011. The decrease2011, resulting in FDIC assessments in 2010a lower assessment rate and base and decreased assessment to the Company.
In the year ended December 31, 2014, the Company recognized a net loss (which includes loss on sale and valuation adjustments) on OREO properties of $4.1 million, as compared to 2009 resulted from the one-time $4.0 million special assessment incurred in the second quarter of 2009, partially offset by the industry wide increase in the assessment rate, organic deposit growth, and deposit growth resulting from the FDIC-assisted acquisitions. Additional discussiona net loss on FDIC insurance assessments is provided in Item 1Business above, under the headingFederal Deposit Insurance.The economic downturn and depressed real estate values continued to detrimentally affect our loan portfolio and has led to a continued elevated level of foreclosures on related properties and movement of the properties into other real estate owned (“OREO”). In 2011, declines in the market values of these properties after foreclosure have resulted in additional losses on the sale of the properties or by valuation adjustments. As a result, during 2011, the Company recognized losses on sale of non-covered OREO of $1.7 million and non-covered valuation adjustments of $8.9 million and net gains on sale of covered OREO properties of $1.2 million and $12.7 million in the years ended December 31, 2013 and 2012, respectively. The increase in 2014 is primarily due a depressed valuation adjustments of covereda single OREO properties of $8.7 million. During 2010, the Company recognized losses on sale of non-covered OREO of $4.0 million and non-covered valuation adjustments of $4.1 million and net gains on sale of covered OREO properties of $4.1 million and valuation adjustments of covered OREO properties of $1.9 million. During 2009, the Company recognized losses on sale of non-covered OREO of $11.0 million and non-covered valuation adjustments of $12.2 million. Gains on sale of covered OREO represents proceeds received in excess of their estimated acquisition date fair values. As the estimated credit losses realized on these properties were less than originally anticipated at acquisition date, there is a corresponding decrease in non-interest income within the Change in FDIC indemnification asset line item representing the reduction of anticipated covered credit losses. Additional discussion regarding our procedures to determine and recognize valuation adjustments on other real estate owned is provided under the headingAsset Quality and Non-Performing Assetsbelow.
The decrease in intangible amortization in 2011 as compared to 2010 results primarily from the run-off of intangible assets from prior years completing their scheduled amortization. The decrease in intangible amortization in 2010 as compared to 2009 results primarily from an $804,000 impairment recognizedproperty in the fourth quarter of 2009 related to2014. The decrease in 2013 is primarily the merchant servicing portfolio obtained through a prior acquisition, partially offset by the run-offresult of intangible assets in 2009 that were amortized on an accelerated basis.
The goodwill impairment charge incurred in 2009 relates to the Community Banking operating segment. This charge primarily resulted from a decline in the fair valueimproving real estate values, allowing for better realization of the Community Banking reporting unit, which corresponded to the decline in the Company’s market capitalization and the banking industry in general, and its effect on the implied fair valuevalues of the goodwill. Discussion related to the goodwill impairment charge is provided in Note 9existing OREO properties.
We incur significant expenses in connection with the completion and integration of bank acquisitions that are not capitalizable.
Classification of expenses as merger-related is done in accordance with the provisions of a Board-approved policy. Thefollowing table presents the merger-related expenses by major category for the year ended December 31, 2011, 2010 and 2009. The merger-related expenses incurred in 2010 and 20112012 relate to the FDIC-assisted acquisitionsacquisition of Evergreen, Rainier, and Nevada Security. The merger-related expenses incurredCircle; in 20092013, primarily relate to the FDIC-assisted purchaseacquisition of FinPac and assumption of certain assetsthe merger with Sterling; and liabilities ofin 2014, primarily relate to the Bank of Clark County. We do not expect to incur any additional significant merger-related expenses in connectionmerger with the Evergreen, Rainier, Nevada Security, Bank of Clark County or any other previous acquisition.
Sterling.
Years Ended December 31,
(
|
| | | | | | | | | | | | |
| (in thousands) | | | | | | |
| | | 2014 | | 2013 | | 2012 |
| Personnel | | $ | 18,837 |
| | $ | 225 |
| | $ | 889 |
|
| Legal and professional | | 22,276 |
| | 5,648 |
| | 551 |
|
| Charitable contributions | | 10,000 |
| | 28 |
| | — |
|
| Investment banking fees | | 9,573 |
| | 2,042 |
| | — |
|
| Contract termination | | 10,378 |
| | 66 |
| | 593 |
|
| Communication | | 2,522 |
| | 49 |
| | 64 |
|
| Other | | 8,731 |
| | 778 |
| | 241 |
|
| Total merger-related expense | | $ | 82,317 |
| | $ | 8,836 |
| | $ | 2,338 |
|
Other non-interest expense increased in
thousands) | | | | | | | | | | | | |
| | | 2011 | | | 2010 | | | 2009 | |
Professional fees | | $ | 173 | | | $ | 2,984 | | | $ | 143 | |
Compensation and relocation | | | — | | | | 962 | | | | 39 | |
Communications | | | — | | | | 330 | | | | 61 | |
Premises and equipment | | | 82 | | | | 630 | | | | 2 | |
Travel | | | 11 | | | | 710 | | | | — | |
Other | | | 94 | | | | 1,059 | | | | 28 | |
| | | | |
Total | | $ | 360 | | | $ | 6,675 | | | $ | 273 | |
| | | | |
2014 as compared to 2013 due to increased costs of the additional stores and associates added from the Sterling merger. Other non-interest expense decreased in 2011 over 2010 primarily2013 as compared to 2012 as a result of non-recurring settlement costs recognized in 2010 partially offset by increased expenses related to problem covered and non-covered loans and covered and non-covered other real estate owned as well as various other growth initiatives underway. Other non-interest expense increased in 2010 over 2009 primarily as a result of expensesa decrease in loan and OREO workout related costs, partially offset by an increase due to problem coveredFinPac operations and non-covered loans and covered and non-covered other real estate owned as well as various other growth initiatives underway.
an FDIC loss sharing claw back liability expense recorded due to better than expected performance of the Evergreen Bank FDIC assisted acquisition.
Our consolidated effective tax rate as a percentage of pre-tax income for 20112014 was 33.0%35.5%, compared to 17.0%34.9% for 20102013 and 21.0%34.4% for 2009.2012. The effective tax rates were belowdiffered from the federal statutory rate of 35% and the apportioned state rate of 4.1%4.9% (net of the federal tax benefit) principally because of the non-deductible impairment loss on goodwill (for 2009),relative amount of income we earn in each state jurisdiction, non-taxable income arising from bank-owned life insurance, income on tax-exempt investment securities, nondeductible merger expenses and tax credits arising from low income housing investments, Business Energy tax credits and exemptions related to loans and hiring in designated enterprise zones. The income tax expense from income taxes in 2011 is a resultinvestments.
The composition of our investment securities portfolio reflects
management’smanagement's investment strategy of maintaining an appropriate level of liquidity while providing a relatively stable source of interest income. The investment securities portfolio also mitigates interest rate and credit risk inherent in the loan portfolio, while providing a vehicle for the investment of available funds, a source of liquidity (by pledging as collateral or through repurchase agreements) and collateral for certain public funds deposits.
Trading securities consist of securities held in inventory by Umpqua Investments for sale to its clients and securities invested in trust for the benefit of certain executives or former employees of acquired institutions as required by agreements. Trading securities were $2.3$10.0 million at December 31, 2011,2014, as compared to $3.0$6.0 million at December 31, 2010. The decrease is principally attributable to a decrease of $985,000 in Umpqua Investments’ inventory of trading securities, offset by increases in the fair market value of investments securities invested for the benefit of former employees and contributions made to supplemental retirement plans for the benefit of certain executives of $271,000.Umpqua Holdings Corporation
Investment securities available for sale increased $249.4 million to $3.2 billion as of December 31, 2011, as compared to December 31, 2010.2013
. This increase is principally attributable to trading securities acquired in the Sterling merger. Investment securities available for sale were $2.3 billion as of December 31, 2014 compared to $1.8 billion at December 31, 2013. The increase is due to investment securities acquired in the Sterling merger of $1.4 billion, purchases of $1.2 billion$363.1 million of investment securities available for sale, which were partiallyand an increase in fair value of investments securities available for sale of $31.2 million, offset by paydowns of $927.3 million$1.2 billion and amortization of net purchase price premiums of $36.1$20.8 million.
Investment securities held to maturity were $4.7$5.2 million as of December 31, 2011,2014 as compared to $4.8holdings of $5.6 million at December 31, 2010. This decrease is principally attributable to2013. The change primarily relates paydowns and maturities of investment securities held to maturity of $1.7 million, offset by purchases of $1.6 million.$741,000.
The following table presents the available for sale and held to maturity investment securities portfolio by major type as of December 31 for each of the last three years:
Summary of Investment Securities
As
|
| | | | | | | | | | | |
| (dollars in thousands) | December 31, |
| | 2014 | | 2013 | | 2012 |
| AVAILABLE FOR SALE | | | | | |
| U.S. Treasury and agencies | $ | 229 |
| | $ | 268 |
| | $ | 45,820 |
|
| Obligations of states and political subdivisions | 338,404 |
| | 235,205 |
| | 263,725 |
|
| Residential mortgage-backed securities and collateralized mortgage obligations | 1,957,852 |
| | 1,553,541 |
| | 2,313,376 |
|
| Other debt securities | — |
| | — |
| | 222 |
|
| Investments in mutual funds and other equity securities | 2,070 |
| | 1,964 |
| | 2,086 |
|
| | $ | 2,298,555 |
| | $ | 1,790,978 |
| | $ | 2,625,229 |
|
|
| | | | | | | | | | | |
| HELD TO MATURITY | | | | | |
| Obligations of states and political subdivisions | $ | — |
| | $ | — |
| | $ | 595 |
|
| Residential mortgage-backed securities and collateralized mortgage obligations | 5,088 |
| | 5,563 |
| | 3,946 |
|
| Other investment securities | 123 |
| | $ | — |
| | $ | — |
|
| | $ | 5,211 |
| | $ | 5,563 |
| | $ | 4,541 |
|
Table of December 31,(in thousands)
| | | | | | | | | | | | |
| | | December 31, | |
| | | 2011 | | | 2010 | | | 2009 | |
AVAILABLE FOR SALE: | | | | | | | | | | | | |
U.S. Treasury and agencies | | $ | 118,465 | | | $ | 118,789 | | | $ | 11,794 | |
Obligations of states and political subdivisions | | | 253,553 | | | | 216,726 | | | | 211,825 | |
Residential mortgage-backed securities and collateralized mortgage obligations | | | 2,794,355 | | | | 2,581,504 | | | | 1,569,849 | |
Other debt securities | | | 134 | | | | 152 | | | | 159 | |
Investments in mutual funds and other equity securities | | | 2,071 | | | | 2,009 | | | | 1,989 | |
| | | | |
| | $ | 3,168,578 | | | $ | 2,919,180 | | | $ | 1,795,616 | |
| | | | |
HELD TO MATURITY: | | | | | | | | | | | | |
Obligations of states and political subdivisions | | $ | 1,335 | | | $ | 2,370 | | | $ | 3,216 | |
Residential mortgage-backed securities and collateralized mortgage obligations | | | 3,379 | | | | 2,392 | | | | 2,845 | |
| | | | |
| | $ | 4,714 | | | $ | 4,762 | | | $ | 6,061 | |
| | | | |
Contents
The following table presents information regarding the amortized cost, fair value, average yield and maturity structure of the investment portfolio at December 31,
2011.2014.
Investment Securities Composition*
December 31,
2011(dollars in thousands)
| | | | | | | | | | | | |
| | | Amortized
Cost | | | Fair Value | | | Average
Yield | |
U.S. TREASURY AND AGENCIES | | | | | | | | | | | | |
One year or less | | $ | 71,668 | | | $ | 72,083 | | | | 1.14% | |
One to five years | | | 45,347 | | | | 46,134 | | | | 1.56% | |
Five to ten years | | | 217 | | | | 248 | | | | 3.68% | |
| | | | | | | | |
| | | 117,232 | | | | 118,465 | | | | 1.31% | |
OBLIGATIONS OF STATES AND POLITICAL SUBDIVISIONS | | | | | | | | | | | | |
One year or less | | | 21,276 | | | | 21,514 | | | | 5.45% | |
One to five years | | | 75,980 | | | | 80,535 | | | | 5.62% | |
Five to ten years | | | 138,081 | | | | 149,221 | | | | 5.71% | |
Over ten years | | | 3,300 | | | | 3,620 | | | | 7.96% | |
| | | | | | | | |
| | | 238,637 | | | | 254,890 | | | | 5.69% | |
OTHER DEBT SECURITIES | | | | | | | | | | | | |
Over ten years | | | 151 | | | | 134 | | | | 6.29% | |
| | | |
Serial maturities | | | 2,758,532 | | | | 2,797,777 | | | | 2.67% | |
| | | |
Other investment securities | | | 1,959 | | | | 2,071 | | | | 3.67% | |
| | | | | | | | |
Total securities | | $ | 3,116,511 | | | $ | 3,173,337 | | | | 2.86% | |
| | | | | | | | |
2014
|
| | | | | | | | | | |
| (dollars in thousands) | Amortized | | Fair | | Average |
| | Cost | | Value | | Yield |
| U.S. TREASURY AND AGENCIES | | | | | |
| One year or less | $ | — |
| | $ | — |
| | — | % |
| One to five years | 213 |
| | 229 |
| | 3.68 | % |
| | 213 |
| | 229 |
| | 3.68 | % |
| | | | | | |
| OBLIGATIONS OF STATES AND POLITICAL SUBDIVISIONS | | | | | |
| One year or less | 27,855 |
| | 28,203 |
| | 5.80 | % |
| One to five years | 215,987 |
| | 225,923 |
| | 5.65 | % |
| Five to ten years | 65,818 |
| | 68,051 |
| | 4.60 | % |
| Over ten years | 15,529 |
| | 16,227 |
| | 5.45 | % |
| | 325,189 |
| | 338,404 |
| | 5.44 | % |
| | | | | | |
| OTHER DEBT SECURITIES | | | | | |
| Serial maturities | 1,956,602 |
| | 1,963,283 |
| | 2.23 | % |
| | | | | | |
| Other investment securities | 2,139 |
| | 2,193 |
| | 2.21 | % |
| Total securities | $ | 2,284,143 |
| | $ | 2,304,109 |
| | 2.70 | % |
*Weighted average yields are stated on a federal tax-equivalent basis of 35%. Weighted average yields for available for sale investments have been calculated on an amortized cost basis.
The mortgage-related securities in
“Serial maturities”"Serial maturities" in the table above include both pooled mortgage-backed issues and high-quality collaterized mortgage obligation structures, with an average duration of
2.74.0 years. These mortgage-related securities provide yield spread to U.S. Treasury or agency securities; however, the cash flows arising from them can be volatile due to refinancing of the underlying mortgage loans.
The equity security in
“Other"Other investment
securities”securities" in the table above at December 31,
20112014 principally represents an investment in a Community Reinvestment Act investment fund comprised largely of mortgage-backed securities, although funds may also invest in municipal bonds, certificates of deposit, repurchase agreements, or securities issued by other investment companies.
We review investment securities on an ongoing basis for the presence of other-than-temporary impairment
(“OTTI”("OTTI") or permanent impairment, taking into consideration current market conditions, fair value in relationship to cost, extent and nature of the change in fair value, issuer rating changes and trends, whether we intend to sell a security or if it is likely that we will be required to sell the security before recovery of our amortized cost basis of the investment, which may be maturity, and other factors.
Prior to the second quarter of 2009, the Company would assess an OTTI or permanent impairment based on the nature of the decline and whether the Company had the ability and intent to hold the investments until a market price recovery. If the Company determined a security to be other-than-temporarily or permanently impaired, the full amount of impairment would be recognized through earnings in its entirety. New guidance related to the recognition and presentation of OTTI of debt securities became effective in the second quarter of 2009. Rather than asserting whether a company has the ability and intent to
Umpqua Holdings Corporation
hold an investment until a market price recovery, a company must consider whether they intend to sell a security or if it is likely that they would be required to sell the security before recovery of the amortized cost basis of the investment, which may be maturity.
For debt securities, if we intend to sell the security or it is likely that we will be required to sell the security before recovering its cost basis, the entire impairment loss would be recognized in earnings as an OTTI. If we do not intend to sell the security and it is not likely that we will be required to sell the security but we do not expect to recover the entire amortized cost basis of the security, only the portion of the impairment loss representing credit losses would be recognized in earnings. The credit loss on a security is measured as the difference between the amortized cost basis and the present value of the cash flows expected to be collected. Projected cash flows are discounted by the original or current effective interest rate depending on the nature of the security being measured for potential OTTI. The remaining impairment related to all other factors, the difference between the present value of the cash flows expected to be collected and fair value, is recognized as a charge to other comprehensive income (“OCI”). Impairment losses related to all other factors are presented as separate categories within OCI. For investment securities held to maturity, this amount is accreted over the remaining life of the debt security prospectively based on the amount and timing of future estimated cash flows. The accretion of the amount recorded in OCI increases the carrying value of the investment and does not affect earnings. If there is an indication of additional credit losses the security is reevaluated accordingly to the procedures described above.
Prior to the Company’s adoption of the new guidance related to the recognition and presentation of OTTI of debt securities which became effective in the second quarter of 2009, the Company recorded a $2.1 million OTTI charge in the three months ended March 31, 2009. This charge related to three non-agency collateralized mortgage obligations carried as held to maturity for which the default rates and loss severities of the underlying collateral and credit coverage ratios of the security indicated that it was probable that credit losses were expected to occur. Upon adoption of the new OTTI guidance in the second quarter of 2009, the Company analyzed these securities as well as other securities where OTTI had been previously recognized, and determined that as of the adoption date such losses were credit related. As such, there was no cumulative effect adjustment to the opening balance of retained earnings or a corresponding adjustment to accumulated OCI.
The following table presents the OTTI losses for the years ended December 31, 2011, 2010, and 2009.
| | | | | | | | | | | | | | | | | | | | | | | | |
| | | 2011 | | | 2010 | | | 2009 | |
| | | Held To
Maturity | | | Available
For Sale | | | Held To
Maturity | | | Available
For Sale | | | Held To
Maturity | | | Available
For Sale | |
Total other-than-temporary impairment losses | | $ | 190 | | | $ | — | | | $ | 93 | | | $ | — | | | $ | 12,317 | | | $ | 239 | |
Portion of other-than-temporary impairment losses transferred from (recognized in) other comprehensive income(1) | | | 169 | | | | — | | | | 321 | | | | — | | | | (1,983 | ) | | | — | |
| | | | |
Net impairment losses recognized in earnings(2) | | $ | 359 | | | $ | — | | | $ | 414 | | | $ | — | | | $ | 10,334 | | | $ | 239 | |
| | | | |
(1) | Represents other-than-temporary impairment losses related to all other factors. |
(2) | Represents other-than-temporary impairment losses related to credit losses. |
The OTTI recognized on investment securities held to maturity primarily relates to 29 non-agency collateralized mortgage obligations for all periods presented. Each of these securities holds various levels of credit subordination. The underlying mortgage loans of these securities were originated from 2003 through 2007. At origination, the weighted average loan-to-value of the underlying mortgages was 69%; the underlying borrowers had weighted average FICO scores of 731, and 59% were limited documentation loans. These securities were valued by third-party pricing services using matrix or model pricing methodologies and were corroborated by broker indicative bids. We estimated the cash flows of the underlying collateral for each security considering credit, interest and prepayment risk models that incorporate management’s estimate of projected key assumptions including prepayment rates, collateral default rates and loss severity. Assumptions utilized vary from security to security, and are influenced by factors such as loan interest rates, geographic location, borrower characteristics and vintage, and historical experience. We then used a third party to obtain information about the structure of each security, including
subordination and other credit enhancements, in order to determine how the underlying collateral cash flows will be distributed to each security issued in the structure. These cash flows were then discounted at the interest rate used to recognize interest income on each security. We review the actual collateral performance of these securities on a quarterly basis and update the inputs as appropriate to determine the projected cash flows.
The following table presents a summary of the significant inputs utilized to measure management’s estimate of the credit loss component on these non-agency residential collateralized mortgage obligations as of December 31, 2011 and 2010:
| | | | | | | | | | | | | | | | | | | | | | | | |
| | | 2011 | | | 2010 | |
| | | Range | | | Weighted
Average | | | Range | | | Weighted
Average | |
| | | Minimum | | | Maximum | | | | Minimum | | | Maximum | | |
Constant prepayment rate | | | 10.0% | | | | 20.0% | | | | 14.0% | | | | 5.0% | | | | 20.0% | | | | 14.9% | |
Collateral default rate | | | 5.0% | | | | 60.0% | | | | 22.6% | | | | 5.0% | | | | 15.0% | | | | 10.6% | |
Loss severity | | | 27.5% | | | | 50.0% | | | | 32.5% | | | | 25.0% | | | | 55.0% | | | | 37.9% | |
Gross unrealized losses in the available for sale investment portfolio was $4.0$11.9 million at December 31, 2011.2014. This consisted primarily of unrealized losses on residential mortgage-backed securities and collateralized mortgage obligations of $4.0 million.$11.1 million. The unrealized losses were primarily caused by interest rate increases subsequent to the purchase of the securities, and not credit quality. In the opinion of management, these securities are considered only temporarily impaired due to changes in market interest rates or the widening of market spreads subsequent to the initial purchase of the securities, and not due to concerns regarding the underlying credit of the issuers or the underlying collateral. Additional information about the investment securities portfolio is provided in Note 4
RESTRICTED EQUITY SECURITIES
Restricted equity securities were $32.6$119.3 million at December 31, 20112014 and $34.5$30.7 million at December 31, 2010.2013. The decrease of $1.9 millionincrease is attributable to stock redemption by the Federal Home Loan Bank (“FHLB”) of San Francisco. Of the $32.6 million at December 31, 2011, $28.6 million and $2.7 million represent the Bank’s investment in the Federal Home Loan Banks (“FHLB”("FHLB") of Seattle and San Francisco respectively.stock acquired from Sterling. Of the
$119.3 million at December 31, 2014, $117.9 million represent the Bank's investment in the FHLBs of Seattle and San Francisco. FHLB stock is carried at par and does not have a readily determinable fair value. Ownership of FHLB stock is restricted to the FHLB and member institutions, and can only be purchased and redeemed at par. The remaining restricted equity securities primarily represent investments in Pacific Coast Bankers’ Bancshares stock.Although as of December 31, 2011, the FHLB of Seattle complies with all of its regulatory requirements (including the risk-based capital requirement), it remains classified as “undercapitalized” by the Federal Housing Finance Agency (“Finance Agency”). Under Finance Agency regulations, a FHLB that fails to meet any regulatory capital requirement may not declare a dividend or redeem or repurchase capital stock in excess of what is required for members’ current loans.
Management periodically evaluates FHLB stock for other-than-temporary or permanent impairment. Management’s determination of whether these investments are impaired is based on its assessment of the ultimate recoverability of cost rather than by recognizing temporary declines in value. The determination of whether a decline affects the ultimate recoverability of the cost is influenced by criteria such as (1) the significance of any decline in net assets of the FHLB as compared to the capital stock amount of the FHLB and the length of time this situation has persisted, (2) the compliance with the minimum financial metrics required as part of the Consent Arrangement the bank has with the Finance Agency, (3) the impact of legislative and regulatory changes on institutions and, accordingly, the customer base of the FHLB, and (4) the liquidity position of the FHLB.
Moody’s Investors Services rating of the FHLB of Seattle as Aaa was confirmed in August 2011, but a negative outlook was assigned as Moody’s revised the rating outlook to negative for U.S. government debt and all issuers Moody’s considers directly-linked to the U.S. government. Standard and Poors’ rating is AA+, but it also issued a negative outlook with the action reflecting the downgrade of the long-term sovereign credit rating of the U.S. in 2011. Based on the above, the Company has determined there is not an other-than-temporary impairment on the FHLB stock investment as of December 31, 2011.
Umpqua Holdings Corporation
LOANS AND LEASES
Loans andNon-covered loans and leasesLeases, net
Total non-covered loans and leases outstanding at December 31, 20112014 were $5.9$15.3 billion, an increase of $229.1 million, or 4.0%, from$7.6 billion as compared to year-end 2010.2013. This increase is principally attributable to non-coveredloans and leases of $7.1 billion acquired in the Sterling merger, net loan and lease originations of $336.9$937.7 million, during the period and covered loans transferred to non-covered loans of $12.3 million,partially offset by charge-offs of $65.1$30.2 million, transfers to other real estate owned of $47.4$24.9 million, and sales of non-covered loans sold of $11.2 million.The Bank provides a wide variety of credit services to its customers, including construction loans, commercial lines of credit, secured and unsecured commercial loans, commercial real estate loans, residential mortgage loans, home equity credit lines, consumer loans and commercial leases. Loans are principally made on a secured basis to customers who reside, own property or operate businesses within$341.4 million during the Bank’s principal market area.
period.
The following table presents the composition of the
non-covered loan
and lease portfolio,
net of deferred fees and costs, as of December 31 for each of the last five years.
Non-covered
Loan
and Lease Portfolio Composition
As of December 31,
(dollars in thousands)
| | | | | | | | | | | | | | | | | | | | | | | | | | | | | | | | | | | | | | | | |
| | | 2011 | | | 2010 | | | 2009 | | | 2008 | | | 2007 | |
| | | Amount | | | Percentage | | | Amount | | | Percentage | | | Amount | | | Percentage | | | Amount | | | Percentage | | | Amount | | | Percentage | |
Commercial real estate | | $ | 3,813,434 | | | | 64.8% | | | $ | 3,879,102 | | | | 68.5% | | | $ | 4,115,593 | | | | 68.6% | | | $ | 4,139,289 | | | | 67.5% | | | $ | 4,187,819 | | | | 69.2% | |
Commercial | | | 1,458,765 | | | | 24.8% | | | | 1,256,872 | | | | 22.2% | | | | 1,390,491 | | | | 23.2% | | | | 1,503,400 | | | | 24.5% | | | | 1,438,505 | | | | 23.8% | |
Residential | | | 588,119 | | | | 10.0% | | | | 501,001 | | | | 8.9% | | | | 468,486 | | | | 7.8% | | | | 465,361 | | | | 7.6% | | | | 404,900 | | | | 6.6% | |
Consumer & other | | | 38,860 | | | | 0.6% | | | | 33,043 | | | | 0.6% | | | | 36,098 | | | | 0.6% | | | | 34,774 | | | | 0.6% | | | | 35,700 | | | | 0.6% | |
Deferred loan fees, net | | | (11,080 | ) | | | -0.2% | | | | (11,031 | ) | | | -0.2% | | | | (11,401 | ) | | | -0.2% | | | | (11,450 | ) | | | -0.2% | | | | (11,289 | ) | | | -0.2% | |
| | | | |
Total loans and leases | | $ | 5,888,098 | | | | 100.0% | | | $ | 5,658,987 | | | | 100.0% | | | $ | 5,999,267 | | | | 100.0% | | | $ | 6,131,374 | | | | 100.0% | | | $ | 6,055,635 | | | | 100.0% | |
| | | | |
|
| | | | | | | | | | | | | | | | | | | | | | | | | | | | | | | | | | |
| (dollars in thousands) | 2014 | | 2013 | | 2012 | | 2011 | | 2010 |
| | Amount | | Percentage | | Amount | | Percentage | | Amount | | Percentage | | Amount | | Percentage | | Amount | | Percentage |
| Commercial real estate, net | $ | 8,903,660 |
| | 58.1 | % | | $ | 4,630,155 |
| | 59.9 | % | | $ | 4,582,768 |
| | 63.9 | % | | $ | 4,308,889 |
| | 66.0 | % | | $ | 4,487,644 |
| | 69.6 | % |
| Commercial, net | 2,948,823 |
| | 19.2 | % | | 2,142,213 |
| | 27.7 | % | | 1,757,660 |
| | 24.5 | % | | 1,513,905 |
| | 23.2 | % | | 1,333,145 |
| | 20.7 | % |
| Residential, net | 3,086,213 |
| | 20.2 | % | | 903,423 |
| | 11.7 | % | | 792,367 |
| | 11.0 | % | | 655,055 |
| | 10.1 | % | | 582,674 |
| | 9.0 | % |
| Consumer & other, net | 389,036 |
| | 2.5 | % | | 52,375 |
| | 0.7 | % | | 43,638 |
| | 0.6 | % | | 47,020 |
| | 0.7 | % | | 44,143 |
| | 0.7 | % |
| Total loans and leases, net | $ | 15,327,732 |
| | 100.0 | % | | $ | 7,728,166 |
| | 100.0 | % | | $ | 7,176,433 |
| | 100.0 | % | | $ | 6,524,869 |
| | 100.0 | % | | $ | 6,447,606 |
| | 100.0 | % |
Loan and Lease Concentrations
The following table presents the concentration distribution of our
non-covered loan
and lease portfolio by major type:
Non-Covered Loan Concentrations
As
|
| | | | | | | | | | | | | |
(dollars in thousands) | December 31, 2014 | | December 31, 2013 |
| | Amount | | Percentage | | Amount | | Percentage |
| Commercial real estate | | | | | | | |
| Non-owner occupied term, net | $ | 3,290,610 |
| | 21.5 | % | | $ | 2,535,162 |
| | 32.8 | % |
| Owner occupied term, net | 2,633,864 |
| | 17.2 | % | | 1,309,400 |
| | 16.9 | % |
| Multifamily, net | 2,638,618 |
| | 17.2 | % | | 441,208 |
| | 5.7 | % |
| Construction & development, net | 258,722 |
| | 1.7 | % | | 248,686 |
| | 3.2 | % |
| Residential development, net | 81,846 |
| | 0.5 | % | | 95,699 |
| | 1.2 | % |
| Commercial | | | | | | | |
| Term, net | 1,102,987 |
| | 7.2 | % | | 786,564 |
| | 10.2 | % |
| LOC & other, net | 1,322,722 |
| | 8.6 | % | | 994,058 |
| | 12.9 | % |
| Leases and equipment finance, net | 523,114 |
| | 3.4 | % | | 361,591 |
| | 4.7 | % |
| Residential | | | | | | | |
| Mortgage, net | 2,233,735 |
| | 14.6 | % | | 619,517 |
| | 8.0 | % |
| Home equity loans & lines, net | 852,478 |
| | 5.6 | % | | 283,906 |
| | 3.7 | % |
| Consumer & other, net | 389,036 |
| | 2.5 | % | | 52,375 |
| | 0.7 | % |
| Total, net of deferred fees and costs | $ | 15,327,732 |
| | 100.0 | % | | $ | 7,728,166 |
| | 100.0 | % |
Maturities and
2010(dollarsSensitivities of Loans to Changes in thousands)
| | | | | | | | | | | | | | | | |
| | | 2011 | | | 2010 | |
| | | Amount | | | Percentage | | | Amount | | | Percentage | |
Commercial real estate | | | | | | | | | | | | | | | | |
Term & multifamily | | $ | 3,558,295 | | | | 60.5% | | | $ | 3,483,475 | | | | 61.6% | |
Construction & development | | | 165,066 | | | | 2.8% | | | | 247,814 | | | | 4.4% | |
Residential development | | | 90,073 | | | | 1.5% | | | | 147,813 | | | | 2.6% | |
Commercial | | | | | | | | | | | | | | | | |
Term | | | 625,766 | | | | 10.6% | | | | 509,453 | | | | 9.0% | |
LOC & other | | | 832,999 | | | | 14.1% | | | | 747,419 | | | | 13.2% | |
Residential | | | | | | | | | | | | | | | | |
Mortgage | | | 315,927 | | | | 5.4% | | | | 222,416 | | | | 3.9% | |
Home equity loans & lines | | | 272,192 | | | | 4.6% | | | | 278,585 | | | | 4.9% | |
Consumer & other | | | 38,860 | | | | 0.7% | | | | 33,043 | | | | 0.6% | |
Deferred loan fees, net | | | (11,080 | ) | | | -0.2% | | | | (11,031 | ) | | | -0.2% | |
| | | | |
Total | | $ | 5,888,098 | | | | 100.0% | | | $ | 5,658,987 | | | | 100.0% | |
| | | | |
Interest Rates
The following table presents the maturity distribution of our
non-covered loan portfolios and the sensitivity of these loans to changes in interest rates as of December 31,
2011:Maturities and Sensitivities of Non-covered Loans to Changes in Interest Rates
(in thousands)
| | | | | | | | | | | | | | | | | | | | | | | | |
| | | By Maturity | | | Loans Over One Year
by Rate Sensitivity | |
| | | One Year
or Less | | | One Through
Five Years | | | Over Five
Years | | | Total | | | Fixed
Rate | | | Floating
Rate | |
Commercial real estate | | $ | 406,360 | | | $ | 1,388,399 | | | $ | 2,018,675 | | | $ | 3,813,434 | | | $ | 707,080 | | | $ | 2,699,994 | |
Commercial(1) | | $ | 702,814 | | | $ | 468,393 | | | $ | 257,945 | | | $ | 1,429,152 | | | $ | 439,414 | | | $ | 286,924 | |
|
| | | | | | | | | | | | | | | | | | | | | | | |
| (in thousands) | | | | | | | | Loans Over One Year |
| | By Maturity | | by Rate Sensitivity |
| | One Year | | One Through | | Over Five | | | | Fixed | | Floating |
| | or Less | | Five Years | | Years | | Total | | Rate | | Rate |
| Commercial real estate | $ | 683,514 |
| | $ | 2,428,605 |
| | $ | 5,791,541 |
| | $ | 8,903,660 |
| | $ | 1,766,813 |
| | $ | 6,453,333 |
|
| Commercial (1) | $ | 1,135,218 |
| | $ | 744,491 |
| | $ | 546,000 |
| | $ | 2,425,709 |
| | $ | 589,902 |
| | $ | 700,589 |
|
| |
| (1) | Excludes the lease and equipment finance portfolio. |
In order to assist with understanding the concentrations and risks associated with our portfolio, we are providing several additional tables to provide details of the most significant classes of the Company’s non-covered loan portfolio. The classification of non-covered loan balances are presented in accordance with how management monitors and manages the risks of the non-covered loan portfolio, including how the Company applies its allowance for non-covered loan and lease losses methodology.
Umpqua Holdings Corporation
The following table presents a distribution of the non-covered commercial real estate term & multifamily portfolio by type and region as of December 31, 2011 and December 31, 2010.
Non-Covered Commercial Real Estate Term & Multifamily Portfolio by Type and Region
(in thousands)
| | | | | | | | | | | | | | | | | | | | | | | | | | | | | | | | |
| | | December 31, 2011 | | | | |
| | | Northwest
Oregon | | | Central
Oregon | | | Southern
Oregon | | | Washington | | | Greater
Sacramento | | | Northern
California | | | Total | | | December 31,
2010 | |
Non-owner occupied: | | | | | | | | | | | | | | | | | | | | | | | | | | | | | | | | |
Commercial building | | $ | 137,362 | | | $ | 4,938 | | | $ | 29,425 | | | $ | 51,557 | | | $ | 56,891 | | | $ | 127,825 | | | $ | 407,998 | | | $ | 390,783 | |
Medical office | | | 87,420 | | | | 217 | | | | 8,991 | | | | — | | | | 8,683 | | | | 15,614 | | | | 120,925 | | | | 112,856 | |
Professional office | | | 152,048 | | | | 4,980 | | | | 51,580 | | | | 19,961 | | | | 105,690 | | | | 59,489 | | | | 393,748 | | | | 417,969 | |
Storage | | | 40,786 | | | | 144 | | | | 15,899 | | | | 4,044 | | | | 11,261 | | | | 45,352 | | | | 117,486 | | | | 127,285 | |
Multi-family | | | 69,555 | | | | 485 | | | | 13,477 | | | | 9,721 | | | | 17,978 | | | | 40,599 | | | | 151,815 | | | | 116,591 | |
Resort | | | 124 | | | | — | | | | 666 | | | | — | | | | — | | | | 392 | | | | 1,182 | | | | 6,111 | |
Retail | | | 180,805 | | | | 6,040 | | | | 30,990 | | | | 12,309 | | | | 167,227 | | | | 64,638 | | | | 462,009 | | | | 468,482 | |
Residential | | | 28,773 | | | | 96 | | | | 7,711 | | | | 4,225 | | | | 4,534 | | | | 20,377 | | | | 65,716 | | | | 74,400 | |
Farmland & agricultural | | | 2,228 | | | | 11 | | | | — | | | | — | | | | — | | | | 16,324 | | | | 18,563 | | | | 23,966 | |
Apartments | | | 67,575 | | | | — | | | | 9,134 | | | | 15,557 | | | | 17,857 | | | | 15,833 | | | | 125,956 | | | | 114,797 | |
Assisted living | | | 111,688 | | | | — | | | | 56,978 | | | | 190 | | | | 10,310 | | | | 22,359 | | | | 201,525 | | | | 211,191 | |
Hotel & motel | | | 60,842 | | | | — | | | | 817 | | | | 690 | | | | 17,294 | | | | 41,804 | | | | 121,447 | | | | 129,593 | |
Industrial | | | 42,674 | | | | 2,301 | | | | 4,717 | | | | 5,339 | | | | 29,804 | | | | 22,006 | | | | 106,841 | | | | 92,237 | |
RV park | | | 33,425 | | | | — | | | | 18,934 | | | | — | | | | 3,023 | | | | 6,073 | | | | 61,455 | | | | 56,654 | |
Warehouse | | | 10,107 | | | | — | | | | — | | | | — | | | | 617 | | | | 2,196 | | | | 12,920 | | | | 13,115 | |
Other | | | 18,591 | | | | 245 | | | | 1,057 | | | | 302 | | | | 1,517 | | | | 4,621 | | | | 26,333 | | | | 43,635 | |
| | | | |
Total | | $ | 1,044,003 | | | $ | 19,457 | | | $ | 250,376 | | | $ | 123,895 | | | $ | 452,686 | | | $ | 505,502 | | | $ | 2,395,919 | | | $ | 2,399,665 | |
| | | | | | | | |
Owner occupied: | | | | | | | | | | | | | | | | | | | | | | | | | | | | | | | | |
Commercial building | | $ | 198,831 | | | $ | 2,925 | | | $ | 36,580 | | | $ | 21,835 | | | $ | 63,927 | | | $ | 130,793 | | | $ | 454,891 | | | $ | 389,809 | |
Medical office | | | 95,204 | | | | 3,593 | | | | 24,664 | | | | 930 | | | | 8,872 | | | | 26,623 | | | | 159,886 | | | | 149,151 | |
Professional office | | | 73,623 | | | | 2,190 | | | | 10,351 | | | | 2,197 | | | | 19,953 | | | | 21,008 | | | | 129,322 | | | | 115,673 | |
Storage | | | — | | | | — | | | | — | | | | — | | | | — | | | | — | | | | — | | | | — | |
Multi-family | | | 758 | | | | — | | | | 42 | | | | 3,740 | | | | — | | | | 134 | | | | 4,674 | | | | 4,143 | |
Resort | | | 8,730 | | | | — | | | | 4,201 | | | | — | | | | 2,771 | | | | 780 | | | | 16,482 | | | | 13,930 | |
Retail | | | 42,710 | | | | 620 | | | | 12,280 | | | | 3,568 | | | | 42,739 | | | | 49,647 | | | | 151,564 | | | | 159,941 | |
Residential | | | 3,709 | | | | 142 | | | | 2,146 | | | | — | | | | 771 | | | | 2,917 | | | | 9,685 | | | | 12,481 | |
Farmland & agricultural | | | 7,002 | | | | — | | | | 1,252 | | | | 1,825 | | | | — | | | | 51,936 | | | | 62,015 | | | | 58,347 | |
Apartments | | | 418 | | | | — | | | | 694 | | | | — | | | | — | | | | 29 | | | | 1,141 | | | | 2,405 | |
Assisted living | | | — | | | | — | | | | — | | | | — | | | | — | | | | — | | | | — | | | | — | |
Hotel & motel | | | — | | | | — | | | | — | | | | — | | | | — | | | | — | | | | — | | | | — | |
Industrial | | | 53,584 | | | | 637 | | | | 11,744 | | | | 7,280 | | | | 11,097 | | | | 35,361 | | | | 119,703 | | | | 122,584 | |
RV park | | | 663 | | | | — | | | | 951 | | | | — | | | | — | | | | 1,812 | | | | 3,426 | | | | 4,606 | |
Warehouse | | | 9,857 | | | | — | | | | 607 | | | | — | | | | — | | | | 6,489 | | | | 16,953 | | | | 17,956 | |
Other | | | 29,617 | | | | — | | | | 130 | | | | 943 | | | | — | | | | 1,944 | | | | 32,634 | | | | 32,784 | |
| | | | |
Total | | $ | 524,706 | | | $ | 10,107 | | | $ | 105,642 | | | $ | 42,318 | | | $ | 150,130 | | | $ | 329,473 | | | $ | 1,162,376 | | | $ | 1,083,810 | |
| | | | |
Total | | $ | 1,568,709 | | | $ | 29,564 | | | $ | 356,018 | | | $ | 166,213 | | | $ | 602,816 | | | $ | 834,975 | | | $ | 3,558,295 | | | $ | 3,483,475 | |
| | | | |
| | | | | | | | | | | | | | | | | | | | | | | | | | | | |
| | | December 31, 2010 | |
| | | Northwest
Oregon | | | Central
Oregon | | | Southern
Oregon | | | Washington | | | Greater
Sacramento | | | Northern
California | | | Total | |
Total non-owner occupied | | $ | 1,047,254 | | | $ | 22,688 | | | $ | 276,514 | | | $ | 110,451 | | | $ | 490,052 | | | $ | 452,706 | | | $ | 2,399,665 | |
Total owner occupied | | | 477,752 | | | | 13,117 | | | | 96,299 | | | | 33,451 | | | | 161,894 | | | | 301,297 | | | | 1,083,810 | |
| | | | |
Total | | $ | 1,525,006 | | | $ | 35,805 | | | $ | 372,813 | | | $ | 143,902 | | | $ | 651,946 | | | $ | 754,003 | | | $ | 3,483,475 | |
| | | | |
The following table presents a distribution of the non-covered term commercial real estate portfolio by type and year of origination as of December 31, 2011:
Non-Covered Commercial Real Estate Term & Multifamily Portfolio by Type and Year of Origination
(in thousands)
| | | | | | | | | | | | | | | | | | | | | | | | |
| | | Prior to
2001 | | | 2001 -
2005 | | | 2006 -
2007 | | | 2008 -
2009 | | | 2010 -
2011 | | | Total | |
Non-owner occupied: | | | | | | | | | | | | | | | | | | | | | | | | |
Commercial building | | $ | 8,000 | | | $ | 89,342 | | | $ | 80,574 | | | $ | 136,106 | | | $ | 93,976 | | | $ | 407,998 | |
Medical office | | | 2,516 | | | | 53,002 | | | | 12,393 | | | | 32,832 | | | | 20,182 | | | | 120,925 | |
Professional office | | | 11,909 | | | | 179,541 | | | | 57,218 | | | | 72,878 | | | | 72,202 | | | | 393,748 | |
Storage | | | 2,401 | | | | 44,234 | | | | 28,801 | | | | 18,754 | | | | 23,296 | | | | 117,486 | |
Multi-family | | | 2,701 | | | | 30,432 | | | | 24,269 | | | | 31,551 | | | | 62,862 | | | | 151,815 | |
Resort | | | 392 | | | | 124 | | | | — | | | | 666 | | | | — | | | | 1,182 | |
Retail | | | 12,269 | | | | 212,146 | | | | 110,638 | | | | 74,826 | | | | 52,130 | | | | 462,009 | |
Residential | | | 1,099 | | | | 10,953 | | | | 16,753 | | | | 16,574 | | | | 20,337 | | | | 65,716 | |
Farmland & agricultural | | | 1,310 | | | | 3,240 | | | | 1,304 | | | | 10,099 | | | | 2,610 | | | | 18,563 | |
Apartments | | | 911 | | | | 21,443 | | | | 20,694 | | | | 35,808 | | | | 47,100 | | | | 125,956 | |
Assisted living | | | 12,539 | | | | 70,761 | | | | 45,015 | | | | 41,645 | | | | 31,565 | | | | 201,525 | |
Hotel & motel | | | 16,235 | | | | 51,303 | | | | 12,200 | | | | 37,788 | | | | 3,921 | | | | 121,447 | |
Industrial | | | 2,510 | | | | 58,166 | | | | 11,396 | | | | 6,251 | | | | 28,518 | | | | 106,841 | |
RV park | | | 3,043 | | | | 19,540 | | | | 13,000 | | | | 11,087 | | | | 14,785 | | | | 61,455 | |
Warehouse | | | 987 | | | | 8,406 | | | | 3,527 | | | | — | | | | — | | | | 12,920 | |
Other | | | 67 | | | | 8,550 | | | | 10,046 | | | | 5,504 | | | | 2,166 | | | | 26,333 | |
| | | | |
Total | | $ | 78,889 | | | $ | 861,183 | | | $ | 447,828 | | | $ | 532,369 | | | $ | 475,650 | | | $ | 2,395,919 | |
Owner occupied: | | | | | | | | | | | | | | | | | | | | | | | | |
Commercial building | | $ | 14,206 | | | $ | 84,620 | | | $ | 112,144 | | | $ | 141,000 | | | $ | 102,921 | | | $ | 454,891 | |
Medical office | | | 3,474 | | | | 21,532 | | | | 25,308 | | | | 88,381 | | | | 21,191 | | | | 159,886 | |
Professional office | | | 3,914 | | | | 46,627 | | | | 30,724 | | | | 21,054 | | | | 27,003 | | | | 129,322 | |
Storage | | | — | | | | — | | | | — | | | | — | | | | — | | | | — | |
Multi-family | | | 158 | | | | 1,457 | | | | — | | | | — | | | | 3,059 | | | | 4,674 | |
Resort | | | 690 | | | | 9,603 | | | | — | | | | 2,841 | | | | 3,348 | | | | 16,482 | |
Retail | | | 7,391 | | | | 44,487 | | | | 69,090 | | | | 22,099 | | | | 8,497 | | | | 151,564 | |
Residential | | | 448 | | | | 4,500 | | | | 2,971 | | | | 1,033 | | | | 733 | | | | 9,685 | |
Farmland & agricultural | | | 2,555 | | | | 3,502 | | | | 11,441 | | | | 20,473 | | | | 24,044 | | | | 62,015 | |
Apartments | | | 29 | | | | — | | | | 694 | | | | — | | | | 418 | | | | 1,141 | |
Assisted living | | | — | | | | — | | | | — | | | | — | | | | — | | | | — | |
Hotel & motel | | | — | | | | — | | | | — | | | | — | | | | — | | | | — | |
Industrial | | | 3,597 | | | | 47,526 | | | | 14,767 | | | | 24,907 | | | | 28,906 | | | | 119,703 | |
RV park | | | 788 | | | | 1,190 | | | | 299 | | | | 144 | | | | 1,005 | | | | 3,426 | |
Warehouse | | | 103 | | | | 8,248 | | | | 3,193 | | | | 4,888 | | | | 521 | | | | 16,953 | |
Other | | | — | | | | 4,975 | | | | 25,690 | | | | 1,019 | | | | 950 | | | | 32,634 | |
| | | | |
Total | | $ | 37,353 | | | $ | 278,267 | | | $ | 296,321 | | | $ | 327,839 | | | $ | 222,596 | | | $ | 1,162,376 | |
| | | | |
Total | | $ | 116,242 | | | $ | 1,139,450 | | | $ | 744,149 | | | $ | 860,208 | | | $ | 698,246 | | | $ | 3,558,295 | |
| | | | |
Umpqua Holdings Corporation
The following table presents a distribution of the non-covered term commercial real estate portfolio by type and year of maturity as of December 31, 2011:
Non-Covered Commercial Real Estate Term & Multifamily Portfolio by Type and Year of Maturity
(in thousands)
| | | | | | | | | | | | | | | | | | | | | | | | | | | | |
| | | December 31, 2011 | |
| | | 2012 | | | 2013 | | | 2014 -
2015 | | | 2016 -
2017 | | | 2018 -
2022 | | | 2023 &
Later | | | Total | |
Non-owner | | | | | | | | | | | | | | | | | | | | | | | | | | | | |
Commercial building | | $ | 31,552 | | | $ | 33,706 | | | $ | 65,672 | | | $ | 87,428 | | | $ | 174,157 | | | $ | 15,483 | | | $ | 407,998 | |
Medical office | | | 10,510 | | | | 5,940 | | | | 10,610 | | | | 20,702 | | | | 62,425 | | | | 10,738 | | | | 120,925 | |
Professional office | | | 26,415 | | | | 54,669 | | | | 84,886 | | | | 92,952 | | | | 122,141 | | | | 12,685 | | | | 393,748 | |
Storage | | | 481 | | | | 17,367 | | | | 21,487 | | | | 22,705 | | | | 53,867 | | | | 1,579 | | | | 117,486 | |
Multi-family | | | 4,175 | | | | 6,733 | | | | 28,182 | | | | 22,799 | | | | 82,717 | | | | 7,209 | | | | 151,815 | |
Resort | | | — | | | | 666 | | | | 516 | | | | — | | | | — | | | | — | | | | 1,182 | |
Retail | | | 23,093 | | | | 38,843 | | | | 134,311 | | | | 132,076 | | | | 127,023 | | | | 6,663 | | | | 462,009 | |
Residential | | | 15,402 | | | | 7,411 | | | | 7,987 | | | | 10,649 | | | | 18,076 | | | | 6,191 | | | | 65,716 | |
Farmland & agricultural | | | 459 | | | | 1,172 | | | | 6,726 | | | | 2,123 | | | | 4,459 | | | | 3,624 | | | | 18,563 | |
Apartments | | | 4,456 | | | | 5,902 | | | | 22,338 | | | | 15,113 | | | | 76,330 | | | | 1,817 | | | | 125,956 | |
Assisted living | | | 27,420 | | | | 4,464 | | | | 31,014 | | | | 60,355 | | | | 76,167 | | | | 2,105 | | | | 201,525 | |
Hotel & motel | | | 7,399 | | | | 8,084 | | | | 37,476 | | | | 15,548 | | | | 40,438 | | | | 12,502 | | | | 121,447 | |
Industrial | | | 5,633 | | | | 6,529 | | | | 25,597 | | | | 31,537 | | | | 28,366 | | | | 9,179 | | | | 106,841 | |
RV park | | | 638 | | | | 4,202 | | | | 13,463 | | | | 10,057 | | | | 30,327 | | | | 2,768 | | | | 61,455 | |
Warehouse | | | 1,008 | | | | 4,352 | | | | 2,082 | | | | 1,188 | | | | 3,273 | | | | 1,017 | | | | 12,920 | |
Other | | | 3,964 | | | | 1,691 | | | | 4,349 | | | | 9,549 | | | | 3,143 | | | | 3,637 | | | | 26,333 | |
| | | | |
Total | | $ | 162,605 | | | $ | 201,731 | | | $ | 496,696 | | | $ | 534,781 | | | $ | 902,909 | | | $ | 97,197 | | | $ | 2,395,919 | |
Owner occupied: | | | | | | | | | | | | | | | | | | | | | | | | | | | | |
Commercial building | | $ | 16,781 | | | $ | 26,134 | | | $ | 46,190 | | | $ | 78,576 | | | $ | 230,720 | | | $ | 56,490 | | | $ | 454,891 | |
Medical office | | | 1,837 | | | | 363 | | | | 8,651 | | | | 14,648 | | | | 115,961 | | | | 18,426 | | | | 159,886 | |
Professional office | | | 3,122 | | | | 10,220 | | | | 18,919 | | | | 35,003 | | | | 55,337 | | | | 6,721 | | | | 129,322 | |
Storage | | | — | | | | — | | | | — | | | | — | | | | — | | | | — | | | | — | |
Multi-family | | | — | | | | 566 | | | | 891 | | | | 42 | | | | 3,175 | | | | — | | | | 4,674 | |
Resort | | | — | | | | 102 | | | | 3,461 | | | | 3,963 | | | | 4,856 | | | | 4,100 | | | | 16,482 | |
Retail | | | 9,829 | | | | 12,432 | | | | 29,313 | | | | 45,353 | | | | 47,035 | | | | 7,602 | | | | 151,564 | |
Residential | | | 1,025 | | | | 782 | | | | 4,314 | | | | 493 | | | | 1,236 | | | | 1,835 | | | | 9,685 | |
Farmland & agricultural | | | 3,568 | | | | 3,115 | | | | 11,435 | | | | 9,440 | | | | 27,824 | | | | 6,633 | | | | 62,015 | |
Apartments | | | — | | | | — | | | | 29 | | | | 694 | | | | 418 | | | | — | | | | 1,141 | |
Assisted living | | | — | | | | — | | | | — | | | | — | | | | — | | | | — | | | | — | |
Hotel & motel | | | — | | | | — | | | | — | | | | — | | | | — | | | | — | | | | — | |
Industrial | | | 5,847 | | | | 4,348 | | | | 21,116 | | | | 25,660 | | | | 56,738 | | | | 5,994 | | | | 119,703 | |
RV park | | | 82 | | | | 774 | | | | 1,123 | | | | 299 | | | | 299 | | | | 849 | | | | 3,426 | |
Warehouse | | | 874 | | | | — | | | | 6,876 | | | | 4,362 | | | | 4,673 | | | | 168 | | | | 16,953 | |
Other | | | 3,194 | | | | 754 | | | | 661 | | | | 3,514 | | | | 24,243 | | | | 268 | | | | 32,634 | |
| | | | |
Total | | $ | 46,159 | | | $ | 59,590 | | | $ | 152,979 | | | $ | 222,047 | | | $ | 572,515 | | | $ | 109,086 | | | $ | 1,162,376 | |
| | | | |
Total | | $ | 208,764 | | | $ | 261,321 | | | $ | 649,675 | | | $ | 756,828 | | | $ | 1,475,424 | | | $ | 206,283 | | | $ | 3,558,295 | |
| | | | |
The following table presents a distribution of the non-covered commercial real estate construction portfolio by type and region as of December 31, 2011 and December 31, 2010.
Non-Covered Commercial Real Estate Construction and Development Portfolio by Type and Region
(in thousands)
| | | | | | | | | | | | | | | | | | | | | | | | | | | | | | | | |
| | | December 31, 2011 | | | | |
| | | Northwest
Oregon | | | Central
Oregon | | | Southern
Oregon | | | Washington | | | Greater
Sacramento | | | Northern
California | | | Total | | | December 31,
2010 | |
Non-owner occupied: | | | | | | | | | | | | | | | | | | | | | | | | | | | | | | | | |
Commercial building | | $ | 7,408 | | | $ | — | | | $ | 2,705 | | | $ | 562 | | | $ | 11,166 | | | $ | 836 | | | $ | 22,677 | | | $ | 25,877 | |
Medical office | | | — | | | | — | | | | — | | | | — | | | | — | | | | — | | | | — | | | | 13,888 | |
Professional office | | | — | | | | — | | | | — | | | | — | | | | — | | | | 1,897 | | | | 1,897 | | | | 23,077 | |
Storage | | | 5,387 | | | | — | | | | — | | | | — | | | | — | | | | — | | | | 5,387 | | | | 8,447 | |
Multi-family | | | 4,990 | | | | — | | | | — | | | | 6,072 | | | | — | | | | — | | | | 11,062 | | | | 10,705 | |
Retail | | | 13,743 | | | | — | | | | — | | | | — | | | | 2,030 | | | | — | | | | 15,773 | | | | 13,498 | |
Residential | | | 18,958 | | | | — | | | | 5,154 | | | | 3,950 | | | | 19,853 | | | | 5,007 | | | | 52,922 | | | | 62,058 | |
Apartments | | | 24,637 | | | | — | | | | — | | | | — | | | | — | | | | — | | | | 24,637 | | | | 13,324 | |
Assisted living | | | — | | | | — | | | | — | | | | — | | | | 5,854 | | | | — | | | | 5,854 | | | | 20,389 | |
Hotel & motel | | | — | | | | — | | | | — | | | | — | | | | — | | | | — | | | | — | | | | 5,447 | |
Industrial | | | — | | | | — | | | | — | | | | — | | | | — | | | | — | | | | — | | | | — | |
Other | | | 87 | | | | — | | | | — | | | | — | | | | — | | | | 5,783 | | | | 5,870 | | | | 3,104 | |
| | | | |
Total | | $ | 75,210 | | | $ | — | | | $ | 7,859 | | | $ | 10,584 | | | $ | 38,903 | | | $ | 13,523 | | | $ | 146,079 | | | $ | 199,814 | |
Owner occupied: | | | | | | | | | | | | | | | | | | | | | | | | | | | | | | | | |
Commercial building | | $ | 5,443 | | | $ | — | | | $ | 1,087 | | | $ | — | | | $ | 575 | | | $ | 4,645 | | | $ | 11,750 | | | $ | 25,379 | |
Medical office | | | 430 | | | | — | | | | — | | | | — | | | | — | | | | — | | | | 430 | | | | 14,479 | |
Professional office | | | — | | | | — | | | | — | | | | — | | | | — | | | | — | | | | — | | | | — | |
Storage | | | — | | | | — | | | | — | | | | — | | | | — | | | | — | | | | — | | | | — | |
Multi-family | | | — | | | | — | | | | — | | | | — | | | | — | | | | — | | | | — | | | | — | |
Retail | | | — | | | | — | | | | — | | | | — | | | | — | | | | — | | | | — | | | | — | |
Residential | | | 1,455 | | | | — | | | | — | | | | — | | | | — | | | | 578 | | | | 2,033 | | | | 5,944 | |
Apartments | | | — | | | | — | | | | — | | | | — | | | | — | | | | — | | | | — | | | | — | |
Assisted living | | | — | | | | — | | | | — | | | | — | | | | — | | | | — | | | | — | | | | — | |
Hotel & motel | | | — | | | | — | | | | — | | | | — | | | | — | | | | — | | | | — | | | | — | |
Industrial | | | 2,521 | | | | — | | | | 71 | | | | — | | | | — | | | | — | | | | 2,592 | | | | 2,198 | |
Other | | | — | | | | — | | | | — | | | | — | | | | — | | | | 2,182 | | | | 2,182 | | | | — | |
| | | | |
Total | | $ | 9,849 | | | $ | — | | | $ | 1,158 | | | $ | — | | | $ | 575 | | | $ | 7,405 | | | $ | 18,987 | | | $ | 48,000 | |
Total | | $ | 85,059 | | | $ | — | | | $ | 9,017 | | | $ | 10,584 | | | $ | 39,478 | | | $ | 20,928 | | | $ | 165,066 | | | $ | 247,814 | |
| | | | |
| | | | | | | | | | | | | | | | | | | | | | | | | | | | |
| | | December 31, 2010 | |
| | | Northwest
Oregon | | | Central
Oregon | | | Southern
Oregon | | | Washington | | | Greater
Sacramento | | | Northern
California | | | Total | |
Total non-owner occupied | | $ | 99,309 | | | $ | 310 | | | $ | 8,357 | | | $ | 4,921 | | | $ | 61,897 | | | $ | 25,020 | | | $ | 199,814 | |
Total owner occupied | | | 34,592 | | | | — | | | | 243 | | | | — | | | | 584 | | | | 12,581 | | | | 48,000 | |
| | | | |
Total | | $ | 133,901 | | | $ | 310 | | | $ | 8,600 | | | $ | 4,921 | | | $ | 62,481 | | | $ | 37,601 | | | $ | 247,814 | |
| | | | |
Umpqua Holdings Corporation
The following table presents a distribution of the non-covered commercial loan portfolio (excluding leases) by type and region as of December 31, 2011 and December 31, 2010.
Commercial Loan Portfolio by Type and Region
(in thousands)
| | | | | | | | | | | | | | | | | | | | | | | | | | | | | | | | |
| | | December 31, 2011 | | | | |
| | Northwest
Oregon | | | Central
Oregon | | | Southern
Oregon | | | Washington | | | Greater
Sacramento | | | Northern
California | | | Total | | | December 31,
2010 | |
Commercial line of credit | | $ | 184,047 | | | $ | 530 | | | $ | 15,990 | | | $ | 12,377 | | | $ | 146,643 | | | $ | 112,920 | | | $ | 472,507 | | | $ | 372,319 | |
Asset-based line of credit | | | 143,684 | | | | 1,857 | | | | 15,941 | | | | 23,262 | | | | 11,123 | | | | 52,220 | | | | 248,087 | | | | 206,185 | |
Term loans | | | 154,282 | | | | 2,310 | | | | 20,640 | | | | 28,561 | | | | 79,406 | | | | 87,773 | | | | 372,972 | | | | 343,967 | |
Agricultural | | | 21,027 | | | | 148 | | | | 1,087 | | | | 1,917 | | | | 336 | | | | 67,363 | | | | 91,878 | | | | 83,332 | |
Municipal | | | 16,923 | | | | — | | | | 16,274 | | | | — | | | | 36,765 | | | | 3,585 | | | | 73,547 | | | | 71,994 | |
SBA | | | — | | | | — | | | | — | | | | — | | | | — | | | | 84,221 | | | | 84,221 | | | | 57,529 | |
Small business lending | | | 25,569 | | | | 1,246 | | | | 14,903 | | | | 5,452 | | | | 11,979 | | | | 25,504 | | | | 84,653 | | | | 89,090 | |
| | | | |
Total | | $ | 545,532 | | | $ | 6,091 | | | $ | 84,835 | | | $ | 71,569 | | | $ | 286,252 | | | $ | 433,586 | | | $ | 1,427,865 | | | $ | 1,224,416 | |
| | | | |
| | | | | | | | | | | | | | | | | | | | | | | | | | | | |
| | | December 31, 2010 | |
| | | Northwest
Oregon | | | Central
Oregon | | | Southern
Oregon | | | Washington | | | Greater
Sacramento | | | Northern
California | | | Total | |
Total | | $ | 448,158 | | | $ | 5,004 | | | $ | 77,343 | | | $ | 50,369 | | | $ | 293,369 | | | $ | 350,173 | | | $ | 1,224,416 | |
| | | | |
Covered Loans and Leases, Net
Total covered loans and leases outstanding at December 31, 2011 were $622.5 million, a decrease of $163.4 million as compared to year-end 2010. This decrease is principally attributable to net covered loan paydowns and maturities of $119.8 million, transfers to covered other real estate owned of $15.3 million, and covered loans transferred to non-covered loans of $12.3 million.
The following table presents the composition of the covered loan portfolio as of December 31 for 2011 and 2010.
Covered Loan Portfolio Composition
As of December 31,
(dollars in thousands)
| | | | | | | | | | | | | | | | |
| | | 2011 | | | 2010 | |
| | | Amount | | | Percentage | | | Amount | | | Percentage | |
Commercial real estate | | $ | 506,637 | | | | 79.4% | | | $ | 619,248 | | | | 78.5% | |
Commercial | | | 57,576 | | | | 9.1% | | | | 78,003 | | | | 9.9% | |
Residential | | | 64,588 | | | | 10.2% | | | | 80,504 | | | | 10.2% | |
Consumer & other | | | 7,970 | | | | 1.3% | | | | 10,864 | | | | 1.4% | |
| | | | |
Total | | | 636,771 | | | | 100.0% | | | | 788,619 | | | | 100.0% | |
| | | | | | | | | | | | | | | | |
Allowance for covered loans | | | (14,320 | ) | | | | | | | (2,721 | ) | | | | |
| | | | | | | | | | | | | | | | |
Total | | $ | 622,451 | | | | | | | $ | 785,898 | | | | | |
| | | | | | | | | | | | | | | | |
The following table presents the concentration distribution of our covered loan portfolio at December 31, 2011 and December 31, 2010.
Covered Loan and Leases Concentrations
(dollars in thousands)
| | | | | | | | | | | | | | | | |
| | | 2011 | | | 2010 | |
| | | Amount | | | Percentage | | | Amount | | | Percentage | |
Commercial real estate | | | | | | | | | | | | | | | | |
Term & multifamily | | $ | 474,054 | | | | 74.3% | | | $ | 569,642 | | | | 72.2% | |
Construction & development | | | 14,820 | | | | 2.3% | | | | 24,713 | | | | 3.1% | |
Residential development | | | 17,763 | | | | 2.8% | | | | 24,893 | | | | 3.2% | |
Commercial | | | | | | | | | | | | | | | | |
Term | | | 34,150 | | | | 5.4% | | | | 42,776 | | | | 5.4% | |
LOC & other | | | 23,426 | | | | 3.7% | | | | 35,227 | | | | 4.5% | |
Residential | | | | | | | | | | | | | | | | |
Mortgage | | | 35,503 | | | | 5.6% | | | | 44,824 | | | | 5.7% | |
Home equity loans & lines | | | 29,085 | | | | 4.6% | | | | 35,680 | | | | 4.5% | |
Consumer & other | | | 7,970 | | | | 1.3% | | | | 10,864 | | | | 1.4% | |
| | | | |
Total | | | 636,771 | | | | 100.0% | | | | 788,619 | | | | 100.0% | |
| | | | | | | | | | | | | | | | |
Allowance for covered loans | | | (14,320 | ) | | | | | | | (2,721 | ) | | | | |
| | | | | | | | | | | | | | | | |
Total | | $ | 622,451 | | | | | | | $ | 785,898 | | | | | |
| | | | | | | | | | | | | | | | |
The covered loans are subject to loss-sharing agreements with the FDIC. Under the terms of the Evergreen acquisition loss-sharing agreement, the FDIC will cover a substantial portion of any future losses on loans, related unfunded loan commitments, other real estate owned (“OREO”) and accrued interest on loans for up to 90 days. The FDIC will absorb 80% of losses and share in 80% of loss recoveries on the first $90.0 million on covered assets for Evergreen and absorb 95% of losses and share in 95% of loss recoveries exceeding $90.0 million, except for the Bank will incur losses up to $30.2 million before the loss-sharing will commence. The loss-sharing arrangements for non-single family residential and single family residential loans are in effect for 5 years and 10 years, respectively, and the loss recovery provisions are in effect for 8 years and 10 years, respectively, from the acquisition dates.
Under the terms of the Rainier loss-sharing agreement, the FDIC will cover a substantial portion of any future losses on loans, related unfunded loan commitments, OREO and accrued interest on loans for up to 90 days. The FDIC will absorb 80% of losses and share in 80% of loss recoveries on the first $95.0 million of losses on covered assets and absorb 95% of losses and share in 95% of loss recoveries exceeding $95.0 million. The loss-sharing arrangements for non-single family residential and single family residential loans are in effect for 5 years and 10 years, respectively, and the loss recovery provisions are in effect for 8 years and 10 years, respectively, from the acquisition dates.
Under the terms of the Nevada Security loss-sharing agreement, the FDIC will cover a substantial portion of any future losses on loans, related unfunded loan commitments, OREO and accrued interest on loans for up to 90 days. The FDIC will absorb 80% of losses and share in 80% of loss recoveries on all covered assets. The loss-sharing arrangements for non-single family residential and single family residential loans are in effect for 5 years and 10 years, respectively, and the loss recovery provisions are in effect for 8 years and 10 years, respectively, from the acquisition dates.
Discussion of and tables related to the covered loan segment is provided under the headingAsset Quality and Non-Performing Assets.
Umpqua Holdings Corporation
ASSET QUALITY AND NON-PERFORMING ASSETS
Non-Covered Loans and Leases
We manage asset quality and control credit risk through diversification of the non-covered loan portfolio and the application of policies designed to promote sound underwriting and loan monitoring practices. The Bank’s Credit Quality Group is charged with monitoring asset quality, establishing credit policies and procedures and enforcing the consistent application of these policies and procedures across the Bank. The provision for non-covered loan and lease losses charged to earnings is based upon management’s judgment of the amount necessary to maintain the allowance at a level adequate to absorb probable incurred losses. The amount of provision charge is dependent upon many factors, including loan growth, net charge-offs, changes in the composition of the non-covered loan portfolio, delinquencies, management’s assessment of loan portfolio quality, general economic conditions that can impact the value of collateral, and other trends. The evaluation of these factors is performed through an analysis of the adequacy of the allowance for loan and lease losses. Reviews of non-performing, past due non-covered loans and larger credits, designed to identify potential charges to the allowance for loan and lease losses, and to determine the adequacy of the allowance, are conducted on a quarterly basis. These reviews consider such factors as the financial strength of borrowers, the value of the applicable collateral, loan loss experience, estimated loan losses, growth in the loan portfolio, prevailing economic conditions and other factors. Additional information regarding the methodology used in determining the adequacy of the allowance for loan and lease losses is contained in Part I Item 1 of this report in the section titledLending and Credit Functions.
Non-covered, non-performing loans, which include non-covered, non-accrual loans and non-covered accruing loans past due over 90 days, totaled $91.4 million or 1.55% of total non-covered loans as of December 31, 2011, as compared to $145.2 million, or 2.57% of total non-covered loans, at December 31, 2010. Non-covered, non-performing assets, which include non-covered, non-performing loans and non-covered, foreclosed real estate (“other real estate owned”), totaled $125.6 million, or 1.09% of total assets as of December 31, 2011 compared with $178.0 million, or 1.53% of total assets as of December 31, 2010. The decrease in non-performing assets in 2011 is attributable to the improving economic environment, an easing in the velocity of declining real estate values in our markets and the resulting impact on our commercial real estate and commercial construction portfolio.
A loan is considered impaired when based on current information and events, we determine it is probable that we will not be able to collect all amounts due according to the loan contract, including scheduled interest payments. Generally, when loans are identified as impaired they are moved to our Special Assets Division. When we identify a loan as impaired, we measure the loan for potential impairment using discount cash flows, except when the sole remaining source of the repayment for the loan is the liquidation of the collateral. In these cases, we use the current fair value of collateral, less selling costs. The starting point for determining the fair value of collateral is through obtaining external appraisals. Generally, external appraisals are updated every six to nine months. We obtain appraisals from a pre-approved list of independent, third party, local appraisal firms. Approval and addition to the list is based on experience, reputation, character, consistency and knowledge of the respective real estate market. At a minimum, it is ascertained that the appraiser is: (a) currently licensed in the state in which the property is located, (b) is experienced in the appraisal of properties similar to the property being appraised, (c) is actively engaged in the appraisal work, (d) has knowledge of current real estate market conditions and financing trends, (e) is reputable, and (f) is not on Freddie Mac’s nor the Bank’s Exclusionary List of appraisers and brokers. In certain cases appraisals will be reviewed by our Real Estate Valuation Services group to ensure the quality of the appraisal and the expertise and independence of the appraiser. Upon receipt and review, an external appraisal is utilized to measure a loan for potential impairment. Our impairment analysis documents the date of the appraisal used in the analysis, whether the officer preparing the report deems it current, and, if not, allows for internal valuation adjustments with justification. Typical justified adjustments might include discounts for continued market deterioration subsequent to appraisal date, adjustments for the release of collateral contemplated in the appraisal, or the value of other collateral or consideration not contemplated in the appraisal. An appraisal over one year old in most cases will be considered stale dated and an updated or new appraisal will be required. Any adjustments from appraised value to net realizable value are detailed and justified in the impairment analysis, which is reviewed and approved by senior credit quality officers and the Company’s Allowance for Loan and Lease Losses (“ALLL”) Committee. Although an external appraisal is the
primary source to value collateral dependent loans, we may also utilize values obtained through purchase and sale agreements, negotiated short sales, broker price opinions, or the sales price of the note. These alternative sources of value are used only if deemed to be more representative of value based on updated information regarding collateral resolution. Impairment analyses are updated, reviewed and approved on a quarterly basis at or near the end of each reporting period. Appraisals or other alternative sources of value received subsequent to the reporting period, but prior to our filing of periodic reports, are considered and evaluated to ensure our periodic filings are materially correct and not misleading. Based on these processes, we do not believe there are significant time lapses for the recognition of additional loan loss provisions or charge-offs from the date they become known.
Non-covered loans are classified as non-accrual when collection of principal or interest is doubtful—generally if they are past due as to maturity or payment of principal or interest by 90 days or more—unless such non-covered loans are well-secured and in the process of collection. Additionally, all loans that are impaired are considered for non-accrual status. Non-covered loans placed on non-accrual will typically remain on non-accrual status until all principal and interest payments are brought current and the prospects for future payments in accordance with the loan agreement appear relatively certain.
Upon acquisition of real estate collateral, typically through the foreclosure process, we promptly begin to market the property for sale. If we do not begin to receive offers or indications of interest we will analyze the price and review market conditions to assess whether a lower price reflects the market value of the property and would enable us to sell the property. In addition, we update appraisals on other real estate owned property six to nine months after the most recent appraisal. Increases in valuation adjustments recorded in a period are primarily based on a) updated appraisals received during the period, or b) management’s authorization to reduce the selling price of the property during the period. Unless a current appraisal is available, an appraisal will be ordered prior to a loan moving to other real estate owned. Foreclosed properties held as other real estate owned are recorded at the lower of the recorded investment in the loan or market value of the property less expected selling costs. Non-covered other real estate owned at December 31, 2011 totaled $34.2 million and consisted of 63 properties.
Non-covered loans are reported as restructured when the Bank grants a concession(s) to a borrower experiencing financial difficulties that it would not otherwise consider. Examples of such concessions include a reduction in the loan rate, forgiveness of principal or accrued interest, extending the maturity date(s) or providing a lower interest rate than would be normally available for a transaction of similar risk. As a result of these concessions, restructured loans are impaired as the Bank will not collect all amounts due, both principal and interest, in accordance with the terms of the original loan agreement. Impairment reserves on non-collateral dependent restructured loans are measured by comparing the present value of expected future cash flows on the restructured loans discounted at the interest rate of the original loan agreement to the loan’s carrying value. These impairment reserves are recognized as a specific component to be provided for in the allowance for loan and lease losses.
The Company has written down impaired, non-covered non-accrual loans as of December 31, 2011 to their estimated net realizable value, based on disposition value, and expects resolution with no additional material loss, absent further decline in market prices.
Umpqua Holdings Corporation
The following table summarizes our
non-covered non-performing assets
as of December 31 for each of the last five years.Non-Covered, and restructured loans:
As of December 31,(dollars in thousands)
| | | | | | | | | | | | | | | | | | | | |
| | | 2011 | | | 2010 | | | 2009 | | | 2008 | | | 2007 | |
Non-covered loans on non-accrual status | | $ | 80,562 | | | $ | 138,177 | | | $ | 193,118 | | | $ | 127,914 | | | $ | 81,317 | |
Non-covered loans past due 90 days or more and accruing | | | 10,821 | | | | 7,071 | | | | 5,909 | | | | 5,452 | | | | 9,782 | |
| | | | |
Total non-covered non-performing loans | | | 91,383 | | | | 145,248 | | | | 199,027 | | | | 133,366 | | | | 91,099 | |
Non-covered other real estate owned | | | 34,175 | | | | 32,791 | | | | 24,566 | | | | 27,898 | | | | 6,943 | |
| | | | |
Total non-covered non-performing assets | | $ | 125,558 | | | $ | 178,039 | | | $ | 223,593 | | | $ | 161,264 | | | $ | 98,042 | |
| | | | |
Restructured loans(1) | | $ | 80,563 | | | $ | 84,441 | | | $ | 134,439 | | | $ | 23,540 | | | $ | — | |
| | | | |
Allowance for non-covered loan and lease losses | | $ | 92,968 | | | $ | 101,921 | | | $ | 107,657 | | | $ | 95,865 | | | $ | 84,904 | |
Reserve for unfunded commitments | | | 940 | | | | 818 | | | | 731 | | | | 983 | | | | 1,182 | |
| | | | |
Allowance for credit losses | | $ | 93,908 | | | $ | 102,739 | | | $ | 108,388 | | | $ | 96,848 | | | $ | 86,086 | |
| | | | |
Asset quality ratios: | | | | | | | | | | | | | | | | | | | | |
Non-covered non-performing assets to total assets | | | 1.09% | | | | 1.53% | | | | 2.38% | | | | 1.88% | | | | 1.18% | |
Non-covered non-performing loans to total non-covered loans | | | 1.55% | | | | 2.57% | | | | 3.32% | | | | 2.18% | | | | 1.50% | |
Allowance for non-covered loan losses to total non-covered loans | | | 1.58% | | | | 1.80% | | | | 1.79% | | | | 1.56% | | | | 1.40% | |
Allowance for non-covered credit losses to total non-covered loans | | | 1.59% | | | | 1.82% | | | | 1.81% | | | | 1.58% | | | | 1.42% | |
Allowance for non-covered credit losses to total non-covered non-performing loans | | | 103% | | | | 71% | | | | 54% | | | | 73% | | | | 94% | |
|
| | | | | | | | | | | | | | | | | | | |
| (in thousands) | 2014 | | 2013 | | 2012 | | 2011 | | 2010 |
| Loans and leases on non-accrual status | $ | 52,041 |
| | $ | 31,891 |
| | $ | 66,736 |
| | $ | 80,562 |
| | $ | 138,177 |
|
| Loans and leases past due 90 days or more and accruing | 7,512 |
| | 3,430 |
| | 4,232 |
| | 10,821 |
| | 7,071 |
|
| Total non-performing loans and leases | 59,553 |
| | 35,321 |
| | 70,968 |
| | 91,383 |
| | 145,248 |
|
| Other real estate owned | 37,942 |
| | 23,935 |
| | 27,512 |
| | 53,666 |
| | 62,654 |
|
| Total non-performing assets | $ | 97,495 |
| | $ | 59,256 |
| | $ | 98,480 |
| | $ | 145,049 |
| | $ | 207,902 |
|
Restructured loans (1) | $ | 54,836 |
| | $ | 68,791 |
| | $ | 70,602 |
| | $ | 80,563 |
| | $ | 84,441 |
|
| Allowance for loan and lease losses | $ | 116,167 |
| | $ | 95,085 |
| | $ | 103,666 |
| | $ | 107,288 |
| | $ | 104,642 |
|
| Reserve for unfunded commitments | 3,539 |
| | 1,436 |
| | 1,223 |
| | 940 |
| | 818 |
|
| Allowance for credit losses | $ | 119,706 |
| | $ | 96,521 |
| | $ | 104,889 |
| | $ | 108,228 |
| | $ | 105,460 |
|
| Asset quality ratios: | | | | | | | | | |
| Non-performing assets to total assets | 0.43 | % | | 0.51 | % | | 0.83 | % | | 1.25 | % | | 1.78 | % |
| Non-performing loans and leases to total loans and leases | 0.39 | % | | 0.46 | % | | 0.99 | % | | 1.40 | % | | 2.25 | % |
| Allowance for loan and lease losses to total loans and leases | 0.76 | % | | 1.23 | % | | 1.44 | % | | 1.64 | % | | 1.62 | % |
| Allowance for credit losses to total loans and leases | 0.78 | % | | 1.25 | % | | 1.46 | % | | 1.66 | % | | 1.64 | % |
| Allowance for credit losses to total non-performing loans and leases | 201 | % | | 273 | % | | 148 | % | | 118 | % | | 73 | % |
| |
| (1) | Represents accruing restructured loans performing according to their restructured terms. |
Non-performing loans and leases, which include non-accrual loans and leases and accruing loans and leases past due 90 days and over, totaled $59.6 million or 0.39% of total loans and leases as of December 31, 2014, as compared to $35.3 million, or 0.46% of total loans and leases, at December 31, 2013. Non-performing assets, which include non-performing loans and leases and OREO, totaled $97.5 million, or 0.43% of total assets as of December 31, 2014 compared with $59.3 million, or 0.51% of total assets as of December 31, 2013. The following tables summarize our non-coveredincrease in non-performing assets byin 2014 is attributable to the increased size of the loan type and regionlease portfolio, as the percentage of non-performing loans and leases as a percentage of total loans and leases has decreased from the prior periods.
Restructured Loans
At December 31, 20112014 and December 31, 2010:2013
Non-Covered, Non-Performing Assets by Type and Region(in thousands)
| | | | | | | | | | | | | | | | | | | | | | | | | | | | |
| | | December 31, 2011 | |
| | | Northwest Oregon | | | Central Oregon | | | Southern Oregon | | | Washington | | | Greater Sacramento | | | Northern California | | | Total | |
Loans on non-accrual status: | | | | | | | | | | | | | | | | | | | | | | | | | | | | |
Commercial real estate | | | | | | | | | | | | | | | | | | | | | | | | | | | | |
Term & multifamily | | $ | 27,183 | | | $ | 617 | | | $ | 2,286 | | | $ | 1,159 | | | $ | 7,494 | | | $ | 5,747 | | | $ | 44,486 | |
Construction & development | | | 921 | | | | — | | | | 568 | | | | — | | | | 1,859 | | | | — | | | | 3,348 | |
Residential development | | | 9,226 | | | | — | | | | — | | | | 4,172 | | | | 63 | | | | 2,375 | | | | 15,836 | |
Commercial | | | | | | | | | | | | | | | | | | | | | | | | | | | | |
Term | | | 724 | | | | 1,814 | | | | 239 | | | | 157 | | | | 1,462 | | | | 3,724 | | | | 8,120 | |
LOC & other | | | 5,457 | | | | 147 | | | | 95 | | | | 1,114 | | | | — | | | | 1,959 | | | | 8,772 | |
Residential | | | | | | | | | | | | | | | | | | | | | | | | | | | | |
Mortgage | | | — | | | | — | | | | — | | | | — | | | | — | | | | — | | | | — | |
Home equity loans & lines | | | — | | | | — | | | | — | | | | — | | | | — | | | | — | | | | — | |
Consumer & other | | | — | | | | — | | | | — | | | | — | | | | — | | | | — | | | | — | |
| | | | |
Total | | | 43,511 | | | | 2,578 | | | | 3,188 | | | | 6,602 | | | | 10,878 | | | | 13,805 | | | | 80,562 | |
Loans past due 90 days or more and accruing: | | | | | | | | | | | | | | | | | | | | | | | | | | | | |
Commercial real estate | | | | | | | | | | | | | | | | | | | | | | | | | | | | |
Term & multifamily | | $ | — | | | $ | — | | | $ | — | | | $ | — | | | $ | — | | | $ | — | | | $ | — | |
Construction & development | | | — | | | | — | | | | — | | | | — | | | | 575 | | | | — | | | | 575 | |
Residential development | | | — | | | | — | | | | — | | | | — | | | | — | | | | — | | | | — | |
Commercial | | | | | | | | | | | | | | | | | | | | | | | | | | | | |
Term | | | — | | | | — | | | | — | | | | — | | | | — | | | | 1,179 | | | | 1,179 | |
LOC & other | | | — | | | | — | | | | — | | | | — | | | | 47 | | | | 1,350 | | | | 1,397 | |
Residential | | | | | | | | | | | | | | | | | | | | | | | | | | | | |
Mortgage | | | 4,342 | | | | — | | | | — | | | | — | | | | — | | | | — | | | | 4,342 | |
Home equity loans & lines | | | 773 | | | | 200 | | | | 294 | | | | — | | | | 572 | | | | 810 | | | | 2,649 | |
Consumer & other | | | 475 | | | | — | | | | 155 | | | | 2 | | | | 6 | | | | 41 | | | | 679 | |
| | | | |
Total | | | 5,590 | | | | 200 | | | | 449 | | | | 2 | | | | 1,200 | | | | 3,380 | | | | 10,821 | |
| | | | |
Total non-performing loans | | | 49,101 | | | | 2,778 | | | | 3,637 | | | | 6,604 | | | | 12,078 | | | | 17,185 | | | | 91,383 | |
Other real estate owned: | | | | | | | | | | | | | | | | | | | | | | | | | | | | |
Commercial real estate | | | | | | | | | | | | | | | | | | | | | | | | | | | | |
Term & multifamily | | $ | 4,673 | | | $ | 140 | | | $ | 786 | | | $ | — | | | $ | 7,618 | | | $ | 2,700 | | | $ | 15,917 | |
Construction & development | | | 2,383 | | | | 400 | | | | — | | | | — | | | | 3,166 | | | | — | | | | 5,949 | |
Residential development | | | 1,487 | | | | 944 | | | | 1,457 | | | | 589 | | | | 3,494 | | | | 784 | | | | 8,755 | |
Commercial | | | | | | | | | | | | | | | | | | | | | | | | | | | | |
Term | | | — | | | | — | | | | — | | | | — | | | | — | | | | — | | | | — | |
LOC & other | | | 50 | | | | 306 | | | | — | | | | 521 | | | | — | | | | — | | | | 877 | |
Residential | | | | | | | | | | | | | | | | | | | | | | | | | | | | |
Mortgage | | | 2,099 | | | | — | | | | — | | | | — | | | | — | | | | — | | | | 2,099 | |
Home equity loans & lines | | | — | | | | — | | | | 212 | | | | — | | | | 366 | | | | — | | | | 578 | |
Consumer & other | | | — | | | | — | | | | — | | | | — | | | | — | | | | — | | | | — | |
| | | | |
Total other real estate owned | | | 10,692 | | | | 1,790 | | | | 2,455 | | | | 1,110 | | | | 14,644 | | | | 3,484 | | | | 34,175 | |
| | | | |
Total non-performing assets | | $ | 59,793 | | | $ | 4,568 | | | $ | 6,092 | | | $ | 7,714 | | | $ | 26,722 | | | $ | 20,669 | | | $ | 125,558 | |
| | | | |
Umpqua Holdings Corporation
| | | | | | | | | | | | | | | | | | | | | | | | | | | | |
| | | December 31, 2010 | |
| | | Northwest Oregon | | | Central Oregon | | | Southern Oregon | | | Washington | | | Greater Sacramento | | | Northern California | | | Total | |
Loans on non-accrual status: | | | | | | | | | | | | | | | | | | | | | | | | | | | | |
Commercial real estate | | | | | | | | | | | | | | | | | | | | | | | | | | | | |
Term & multifamily | | $ | 24,180 | | | $ | 4,816 | | | $ | 537 | | | $ | 1,898 | | | $ | 9,010 | | | $ | 8,721 | | | $ | 49,162 | |
Construction & development | | | 12,726 | | | | — | | | | 472 | | | | — | | | | 6,817 | | | | 109 | | | | 20,124 | |
Residential development | | | 10,191 | | | | 110 | | | | 2,122 | | | | 3,033 | | | | 10,761 | | | | 8,369 | | | | 34,586 | |
Commercial | | | | | | | | | | | | | | | | | | | | | | | | | | | | |
Term | | | 710 | | | | 1,679 | | | | 320 | | | | 373 | | | | 98 | | | | 3,092 | | | | 6,272 | |
LOC & other | | | 7,586 | | | | 878 | | | | 768 | | | | 6,830 | | | | 8,628 | | | | 3,343 | | | | 28,033 | |
Residential | | | | | | | | | | | | | | | | | | | | | | | | | | | | |
Mortgage | | | — | | | | — | | | | — | | | | — | | | | — | | | | — | | | | — | |
Home equity loans & lines | | | — | | | | — | | | | — | | | | — | | | | — | | | | — | | | | — | |
Consumer & other | | | — | | | | — | | | | — | | | | — | | | | — | | | | — | | | | — | |
| | | | |
Total | | | 55,393 | | | | 7,483 | | | | 4,219 | | | | 12,134 | | | | 35,314 | | | | 23,634 | | | | 138,177 | |
Loans past due 90 days or more and accruing: | | | | | | | | | | | | | | | | | | | | | | | | | | | | |
Commercial real estate | | | | | | | | | | | | | | | | | | | | | | | | | | | | |
Term & multifamily | | $ | 79 | | | $ | — | | | $ | — | | | $ | 176 | | | $ | 2,753 | | | $ | — | | | $ | 3,008 | |
Construction & development | | | — | | | | — | | | | — | | | | — | | | | — | | | | — | | | | — | |
Residential development | | | — | | | | — | | | | — | | | | — | | | | — | | | | — | | | | — | |
Commercial | | | — | | | | — | | | | — | | | | — | | | | — | | | | — | | | | | |
Term | | | — | | | | — | | | | — | | | | — | | | | — | | | | — | | | | — | |
LOC & other | | | — | | | | — | | | | — | | | | — | | | | — | | | | — | | | | — | |
Residential | | | — | | | | — | | | | — | | | | — | | | | — | | | | — | | | | | |
Mortgage | | | 2,925 | | | | — | | | | — | | | | — | | | | — | | | | — | | | | 2,925 | |
Home equity loans & lines | | | 73 | | | | — | | | | — | | | | — | | | | 159 | | | | — | | | | 232 | |
Consumer & other | | | 880 | | | | — | | | | — | | | | — | | | | 26 | | | | — | | | | 906 | |
| | | | |
Total | | | 3,957 | | | | — | | | | — | | | | 176 | | | | 2,938 | | | | — | | | | 7,071 | |
| | | | |
Total non-performing loans | | | 59,350 | | | | 7,483 | | | | 4,219 | | | | 12,310 | | | | 38,252 | | | | 23,634 | | | | 145,248 | |
Other real estate owned: | | | | | | | | | | | | | | | | | | | | | | | | | | | | |
Commercial real estate | | | | | | | | | | | | | | | | | | | | | | | | | | | | |
Term & multifamily | | $ | 5,396 | | | $ | — | | | $ | 1,656 | | | $ | — | | | $ | 3,091 | | | $ | 5,686 | | | $ | 15,829 | |
Construction & development | | | 3,443 | | | | 539 | | | | — | | | | 313 | | | | 4,392 | | | | — | | | | 8,687 | |
Residential development | | | 674 | | | | 1,844 | | | | 1,368 | | | | 112 | | | | — | | | | 1,118 | | | | 5,116 | |
Commercial | | | | | | | | | | | | | | | | | | | | | | | | | | | | |
Term | | | — | | | | — | | | | — | | | | — | | | | — | | | | — | | | | — | |
LOC & other | | | — | | | | — | | | | — | | | | — | | | | — | | | | — | | | | — | |
Residential | | | | | | | | | | | | | | | | | | | | | | | | | | | | |
Mortgage | | | 954 | | | | — | | | | — | | | | — | | | | — | | | | — | | | | 954 | |
Home equity loans & lines | | | — | | | | — | | | | — | | | | — | | | | — | | | | — | | | | — | |
Consumer & other | | | — | | | | — | | | | — | | | | — | | | | 481 | | | | 1,724 | | | | 2,205 | |
| | | | |
Total other real estate owned | | | 10,467 | | | | 2,383 | | | | 3,024 | | | | 425 | | | | 7,964 | | | | 8,528 | | | | 32,791 | |
| | | | |
Total non-performing assets | | $ | 69,817 | | | $ | 9,866 | | | $ | 7,243 | | | $ | 12,735 | | | $ | 46,216 | | | $ | 32,162 | | | $ | 178,039 | |
| | | | |
As of December 31, 2011, non-covered, non-performing assets of $125.6 million have been written down by 38%, or $76.3 million, from their current par balance of $201.9 million.
The Company is continually performing extensive reviews of our permanent commercial real estate portfolio, including stress testing. These reviews are being performed on both our non-owner and owner occupied credits. These reviews are being completed to verify leasing status, to ensure the accuracy of risk ratings, and to develop proactive action plans with borrowers on projects. The stress testing has been performed to determine the effect of rising cap rates, interest rates and vacancy rates, on this portfolio. Based on our analysis, the Company believes our lending teams are effectively managing the risks in this portfolio. There can be no assurance that any further declines in economic conditions, such as potential increases in retail or office vacancy rates, will exceed the projected assumptions utilized in the stress testing and may result in additional non-covered, non-performing loans in the future.
The following table summarizes our non-covered loans past due 30-89 days by loan type and by region as of December 31, 2011 and December 31, 2010. Loans past due 30-89 days have decreased 27% between the two periods.
Non-Covered Loans Past Due 30-89 Days by Type and Region
(in thousands)
| | | | | | | | | | | | | | | | | | | | | | | | | | | | |
| | | December 31, 2011 | |
| | | Northwest Oregon | | | Central Oregon | | | Southern Oregon | | | Washington | | | Greater Sacramento | | | Northern California | | | Total | |
Commercial real estate | | | | | | | | | | | | | | | | | | | | | | | | | | | | |
Term & multifamily | | $ | 1,721 | | | $ | — | | | $ | 1,029 | | | $ | — | | | $ | 6,867 | | | $ | 8,886 | | | $ | 18,503 | |
Construction & development | | | — | | | | — | | | | — | | | | 662 | | | | — | | | | — | | | | 662 | |
Residential development | | | — | | | | — | | | | — | | | | — | | | | 4,171 | | | | — | | | | 4,171 | |
Commercial | | | | | | | | | | | | | | | | | | | | | | | | | | | | |
Term | | | 760 | | | | — | | | | 166 | | | | — | | | | 461 | | | | 1,426 | | | | 2,813 | |
LOC & other | | | 141 | | | | — | | | | 98 | | | | — | | | | 5,616 | | | | 699 | | | | 6,554 | |
Residential | | | | | | | | | | | | | | | | | | | | | | | | | | | | |
Mortgage | | | 1,180 | | | | — | | | | — | | | | — | | | | — | | | | — | | | | 1,180 | |
Home equity loans & lines | | | 22 | | | | — | | | | 94 | | | | — | | | | — | | | | 567 | | | | 683 | |
Consumer & other | | | 578 | | | | — | | | | 36 | | | | 10 | | | | 4 | | | | 33 | | | | 661 | |
| | | | |
Total | | $ | 4,402 | | | $ | — | | | $ | 1,423 | | | $ | 672 | | | $ | 17,119 | | | $ | 11,611 | | | $ | 35,227 | |
| | | | |
| | | | | | | | | | | | | | | | | | | | | | | | | | | | |
| | | December 31, 2010 | |
| | | Northwest Oregon | �� | | Central Oregon | | | Southern Oregon | | | Washington | | | Greater Sacramento | | | Northern California | | | Total | |
Commercial real estate | | | | | | | | | | | | | | | | | | | | | | | | | | | | |
Term & multifamily | | $ | 6,636 | | | $ | 1,719 | | | $ | — | | | $ | — | | | $ | 5,524 | | | $ | 9,045 | | | $ | 22,924 | |
Construction & development | | | 373 | | | | — | | | | — | | | | — | | | | 8,525 | | | | — | | | | 8,898 | |
Residential development | | | — | | | | — | | | | — | | | | — | | | | 480 | | | | 160 | | | | 640 | |
Commercial | | | | | | | | | | | | | | | | | | | | | | | | | | | | |
Term | | | 354 | | | | — | | | | — | | | | 64 | | | | 868 | | | | 1,655 | | | | 2,941 | |
LOC & other | | | 1,542 | | | | — | | | | 17 | | | | 1,670 | | | | 1,291 | | | | 1,961 | | | | 6,481 | |
Residential | | | | | | | | | | | | | | | | | | | | | | | | | | | | |
Mortgage | | | 2,414 | | | | — | | | | — | | | | — | | | | — | | | | — | | | | 2,414 | |
Home equity loans & lines | | | 469 | | | | — | | | | — | | | | 200 | | | | 1,778 | | | | — | | | | 2,447 | |
Consumer & other | | | 1,339 | | | | — | | | | — | | | | 100 | | | | 32 | | | | 1 | | | | 1,472 | |
| | | | |
Total | | $ | 13,127 | | | $ | 1,719 | | | $ | 17 | | | $ | 2,034 | | | $ | 18,498 | | | $ | 12,822 | | | $ | 48,217 | |
| | | | |
Umpqua Holdings Corporation
Non-covered Restructured Loans
At December 31, 2011 and December 31, 2010, impaired loans of $80.6$54.8 million and $84.4$68.8 million were classified as non-covered performing restructured loans, respectively. The restructurings were granted in response to borrower financial difficulty, and generally provide for a temporaryby providing modification of loan repayment terms. The non-covered performing restructured loans on accrual status and two loans included in loans past due 30+ days and accruing represent principally the only impaired
loans accruing interest at each respective date.December 31, 2014. In order for a restructured loan to be considered performing and on accrual status, the loan’sloan's collateral coverage generally will be greater than or equal to 100% of the loan balance, the loan ismust be current on payments, and the borrower must either prefund an interest reserve or demonstrate the ability to make payments from a verified source of cash flow. The Company had obligations of $205,000 to lend additional funds on the restructured loansThere were $1.0 million available commitments for troubled debt restructurings outstanding as of December 31, 2011.2014
Residential Modification ProgramThe Bank’s modification program is designed to enable the Bank to work with its customers experiencing financial difficulty to maximize repayment. While the Bank has designed guidelines similar to the government sponsored Home Affordable Refinance Program (“HARP”) and Home Affordable Modification Program (“HAMP”), the bank participates in the programs only in the capacity as servicer on behalf of investor loans that have been sold.
A and B Note Workout Structures
The Bank performs A note/B note workout structures as a subset of the Bank’s troubled debt restructuring strategy. The amount of loans restructured using this structure was $21.4 million and $20.5 millionnone as of December 31, 2011 and December 31, 2010, respectively.
Under an A note/B note workout structure, the new A note is underwritten in accordance with customary troubled debt restructuring underwriting standards and is reasonably assured of full repayment while the B note is not. The B note is immediately charged off upon restructuring.
If the loan was on accrual prior to the troubled debt restructuring being documented with the loan legally bifurcated into an A note fully supporting accrual status and a B note or amount fully contractually forgiven and charged off, the A note may remain on accrual status. If the loan was on nonaccrual at the time the troubled debt restructuring was documented with the loan legally bifurcated into an A note fully supporting accrual status and a B note or amount contractually forgiven and fully charged off, the A note may be returned to accrual status, and risk rated accordingly, after a reasonable period of performance under the troubled debt restructuring terms. Six months of payment performance is generally required to return these loans to accrual status.
The A note will continue to be classified as a troubled debt restructuring and only may be removed from impaired status in years after the restructuring if (a) the restructuring agreement specifies an interest rate equal to or greater than the rate that the Bank was willing to accept at the time of the restructuring for a new loan with comparable risk and (b) the loan is not impaired based on the terms specified by the restructuring agreement.
The following tables summarize our non-covered performing restructured loans by loan type and region as of December 31, 2011 and December 31, 2010:
2013Non-Covered Restructured Loans by Type and Region.
(in thousands)
| | | | | | | | | | | | | | | | | | | | | | | | | | | | |
| | | December 31, 2011 | |
| | Northwest Oregon | | | Central Oregon | | | Southern Oregon | | | Washington | | | Greater Sacramento | | | Northern California | | | Total | |
Commercial real estate | | | | | | | | | | | | | | | | | | | | | | | | | | | | |
Term & multifamily | | $ | 10,148 | | | $ | — | | | $ | 5,243 | | | $ | — | | | $ | 4,618 | | | $ | 2,602 | | | $ | 22,611 | |
Construction & development | | | 8,967 | | | | — | | | | — | | | | — | | | | 8,171 | | | | 2,858 | | | | 19,996 | |
Residential development | | | 14,195 | | | | 943 | | | | — | | | | — | | | | 18,826 | | | | — | | | | 33,964 | |
Commercial | | | | | | | | | | | | | | | | | | | | | | | | | | | | |
Term | | | — | | | | — | | | | — | | | | — | | | | 3,191 | | | | 672 | | | | 3,863 | |
LOC & other | | | — | | | | — | | | | — | | | | — | | | | — | | | | — | | | | — | |
Residential | | | | | | | | | | | | | | | | | | | | | | | | | | | | |
Mortgage | | | — | | | | — | | | | — | | | | — | | | | — | | | | — | | | | — | |
Home equity loans & lines | | | — | | | | — | | | | — | | | | — | | | | — | | | | 129 | | | | 129 | |
Consumer & other | | | — | | | | — | | | | — | | | | — | | | | — | | | | — | | | | — | |
| | | | |
Total | | $ | 33,310 | | | $ | 943 | | | $ | 5,243 | | | $ | — | | | $ | 34,806 | | | $ | 6,261 | | | $ | 80,563 | |
| | | | |
| | | | | | | | | | | | | | | | | | | | | | | | | | | | |
| | | December 31, 2010 | |
| | | Northwest Oregon | | | Central Oregon | | | Southern Oregon | | | Washington | | | Greater Sacramento | | | Northern California | | | Total | |
| | | | | | | |
Commercial real estate | | | | | | | | | | | | | | | | | | | | | | | | | | | | |
Term & multifamily | | $ | 9,446 | | | $ | — | | | $ | 3,888 | | | $ | — | | | $ | 11,820 | | | $ | 3,543 | | | $ | 28,697 | |
Construction & development | | | — | | | | — | | | | — | | | | — | | | | 5,434 | | | | — | | | | 5,434 | |
Residential development | | | 22,277 | | | | — | | | | — | | | | 5,330 | | | | 21,322 | | | | — | | | | 48,929 | |
Commercial | | | | | | | | | | | | | | | | | | | | | | | | | | | | |
Term | | | — | | | | — | | | | — | | | | — | | | | — | | | | 904 | | | | 904 | |
LOC & other | | | — | | | | — | | | | — | | | | — | | | | — | | | | 298 | | | | 298 | |
Residential | | | | | | | | | | | | | | | | | | | | | | | | | | | | |
Mortgage | | | 179 | | | | — | | | | — | | | | — | | | | — | | | | — | | | | 179 | |
Home equity loans & lines | | | — | | | | — | | | | — | | | | — | | | | — | | | | — | | | | — | |
Consumer & other | | | — | | | | — | | | | — | | | | — | | | | — | | | | — | | | | — | |
| | | | |
Total | | $ | 31,902 | | | $ | — | | | $ | 3,888 | | | $ | 5,330 | | | $ | 38,576 | | | $ | 4,745 | | | $ | 84,441 | |
| | | | |
The following table presents a distribution of our non-covered performing restructured loans by year of maturity, according to the restructured terms, as of December 31, 2011:(in thousands)
| | | | |
| Year | | Amount | |
2012 | | $ | 57,555 | |
2013 | | | 4,134 | |
2014 | | �� | 2,949 | |
2015 | | | 4,517 | |
2016 | | | 10,736 | |
Thereafter | | | 672 | |
| | | | |
Total | | $ | 80,563 | |
| | | | |
Umpqua Holdings Corporation
The Bank has had a varying degree of success with different types of concessions. The following table presents the percentage of troubled debt restructurings, by type of concession, at December 31, 2011 that have performed and are expected to perform according to the troubled debt restructuring agreement:
| | | | |
| | December 31,
2011 | |
Rate
| | | 100% | |
Term
| | | 100% | |
Interest Only
| | | — | |
Payment
| | | 86% | |
Combination
| | | 80% | |
2014
A further decline in the economic conditions in our general market areas or other factors could adversely impact individual borrowers or the loan portfolio in general. Accordingly, there can be no assurance that loans will not become 90 days or more past due, become impaired or placed on non-accrual status, restructured or transferred to other real estate owned in the future. Additional information about the loan portfolio is provided in Note 5 of theNotes to Consolidated Financial Statementsin Item 8 below.: Covered Non-Performing Assets
Covered non-performing assets totaled $19.5 million, or 0.17% of total assets at December 31, 2011 as compared to $29.9 million, or 0.26% of total assets at December 31, 2010. These covered non-performing assets are subject to shared-loss agreements with the FDIC. The following tables summarize our covered non-performing assets by loan type as of December 31, 2011 and December 31, 2010:
| | | | | | | | | | | | | | | | |
| | | December 31, 2011 | |
| | Evergreen | | | Rainier | | | Nevada
Security | | | Total | |
Covered other real estate owned: | | | | | | | | | | | | | | | | |
Commercial real estate | | | | | | | | | | | | | | | | |
Term & multifamily | | $ | 914 | | | $ | 1,827 | | | $ | 8,525 | | | $ | 11,266 | |
Construction & development | | | 36 | | | | 1,053 | | | | 2,621 | | | | 3,710 | |
Residential development | | | 351 | | | | 2,359 | | | | 1,301 | | | | 4,011 | |
Commercial | | | | | | | | | | | | | | | | |
Term | | | — | | | | — | | | | 188 | | | | 188 | |
LOC & other | | | — | | | | — | | | | — | | | | — | |
Residential | | | | | | | | | | | | | | | | |
Mortgage | | | 69 | | | | 247 | | | | — | | | | 316 | |
Home equity loans & lines | | | — | | | | — | | | | — | | | | — | |
Consumer & other | | | — | | | | — | | | | — | | | | — | |
| | | | |
Total | | $ | 1,370 | | | $ | 5,486 | | | $ | 12,635 | | | $ | 19,491 | |
| | | | |
| | | | | | | | | | | | | | | | |
| | | December 31, 2010 | |
| | Evergreen | | | Rainier | | | Nevada
Security | | | Total | |
Covered other real estate owned: | | | | | | | | | | | | | | | | |
Commercial real estate | | | | | | | | | | | | | | | | |
Term & multifamily | | $ | 3,557 | | | $ | 210 | | | $ | 8,153 | | | $ | 11,920 | |
Construction & development | | | 596 | | | | — | | | | 2,161 | | | | 2,757 | |
Residential development | | | 2,421 | | | | 7,252 | | | | 5,198 | | | | 14,871 | |
Commercial | | | | | | | | | | | | | | | | |
Term | | | 315 | | | | — | | | | — | | | | 315 | |
LOC & other | | | — | | | | — | | | | — | | | | — | |
Residential | | | | | | | | | | | | | | | | |
Mortgage | | | — | | | | — | | | | — | | | | — | |
Home equity loans & lines | | | — | | | | — | | | | — | | | | — | |
Consumer & other | | | — | | | | — | | | | — | | | | — | |
| | | | |
Total | | $ | 6,889 | | | $ | 7,462 | | | $ | 15,512 | | | $ | 29,863 | |
| | | | |
Total Non-Performing Assets
The following tables summarize our total (including covered and non-covered) nonperforming assets at December 31:
| | | | | | | | | | | | | | | | | | | | |
| | | 2011 | | | 2010 | | | 2009 | | | 2008 | | | 2007 | |
Loans on non-accrual status | | $ | 80,562 | | | $ | 138,177 | | | $ | 193,118 | | | $ | 127,914 | | | $ | 81,317 | |
Loans past due 90 days or more and accruing | | | 10,821 | | | | 7,071 | | | | 5,909 | | | | 5,452 | | | | 9,782 | |
| | | | |
Total non-performing loans | | | 91,383 | | | | 145,248 | | | | 199,027 | | | | 133,366 | | | | 91,099 | |
Other real estate owned | | | 53,666 | | | | 62,654 | | | | 24,566 | | | | 27,898 | | | | 6,943 | |
| | | | |
Total non-performing assets | | $ | 145,049 | | | $ | 207,902 | | | $ | 223,593 | | | $ | 161,264 | | | $ | 98,042 | |
| | | | |
Asset quality ratios: | | | | | | | | | | | | | | | | | | | | |
Total non-performing assets to total assets | | | 1.25% | | | | 1.78% | | | | 2.38% | | | | 1.88% | | | | 1.18% | |
Total non-performing loans to total loans | | | 1.40% | | | | 2.25% | | | | 3.32% | | | | 2.18% | | | | 1.50% | |
|
| | | |
| (in thousands) | |
| Year | Amount |
| 2015 | $ | 38,601 |
|
| 2016 | 11,683 |
|
| 2017 | — |
|
| 2018 | 3,937 |
|
| 2019 | — |
|
| Thereafter | 615 |
|
| Total | $ | 54,836 |
|
ALLOWANCE FOR
NON-COVERED LOAN AND LEASE LOSSES AND RESERVE FOR UNFUNDED COMMITMENTS
The allowance for non-covered loan and lease losses (“ALLL”("ALLL") totaled $93.0 million and $101.9$116.2 million at December 31, 2011 and 2010, respectively.2014, an increase of $21.1 million from the $95.1 million at December 31, 2013. The decreaseincrease in the ALLL from the prior year-end results is principally attributable to a decrease in provision for non-coveredresult of loan and lease losses of a level below net charge-offs for the year and declining non-performing loans, as a resultgrowth, partially offset by improving credit quality characteristics of the improving conditionslease and loan portfolio.
The following table provides a summary of activity in the non-coveredALLL by major loan portfolios. Additional discussion ontype for each of the change in provisionfive years ended December 31:
Allowance for loan and lease losses is provided under the headingProvision for Loan and Lease Lossesabove. |
| | | | | | | | | | | | | | | | | | | |
| (in thousands) | 2014 | | 2013 | | 2012 | | 2011 | | 2010 |
| Balance, beginning of period | $ | 95,085 |
| | $ | 103,666 |
| | $ | 107,288 |
| | $ | 104,642 |
| | $ | 107,657 |
|
| Loans charged-off: | | | | | | | | | |
| Commercial real estate, net | (8,030 | ) | | (9,748 | ) | | (25,270 | ) | | (39,188 | ) | | (73,469 | ) |
| Commercial, net | (16,824 | ) | | (20,810 | ) | | (13,822 | ) | | (21,731 | ) | | (50,508 | ) |
| Residential, net | (1,855 | ) | | (3,655 | ) | | (5,878 | ) | | (7,990 | ) | | (5,168 | ) |
| Consumer & other, net | (3,469 | ) | | (1,285 | ) | | (2,158 | ) | | (2,828 | ) | | (2,061 | ) |
| Total loans charged-off | (30,178 | ) | | (35,498 | ) | | (47,128 | ) | | (71,737 | ) | | (131,206 | ) |
| Recoveries: | | | | | | | | | |
| Commercial real estate, net | 2,539 |
| | 4,436 |
| | 6,673 |
| | 7,254 |
| | 6,991 |
|
| Commercial, net | 6,744 |
| | 10,445 |
| | 6,089 |
| | 3,860 |
| | 1,581 |
|
| Residential, net | 462 |
| | 569 |
| | 999 |
| | 381 |
| | 334 |
|
| Consumer & other, net | 1,274 |
| | 751 |
| | 544 |
| | 527 |
| | 466 |
|
| Total recoveries | 11,019 |
| | 16,201 |
| | 14,305 |
| | 12,022 |
| | 9,372 |
|
| Net charge-offs | (19,159 | ) | | (19,297 | ) | | (32,823 | ) | | (59,715 | ) | | (121,834 | ) |
| Provision charged to operations | 40,241 |
| | 10,716 |
| | 29,201 |
| | 62,361 |
| | 118,819 |
|
| Balance, end of period | $ | 116,167 |
| | $ | 95,085 |
| | $ | 103,666 |
| | $ | 107,288 |
| | $ | 104,642 |
|
| As a percentage of average loans and leases: | | | | | | | | | |
| Net charge-offs | 0.15 | % | | 0.26 | % | | 0.49 | % | | 0.93 | % | | 1.88 | % |
| Provision for loan and lease losses | 0.31 | % | | 0.15 | % | | 0.44 | % | | 0.97 | % | | 1.84 | % |
| Recoveries as a percentage of charge-offs | 36.51 | % | | 45.64 | % | | 30.35 | % | | 16.76 | % | | 7.14 | % |
The unallocated portion of ALLL provides for coverage of credit losses inherent in the loan portfolio but not captured in the credit loss factors that are utilized in the risk rating-based component, or in the specific impairment reserve component of the allowance for loan and lease losses, and acknowledges the inherent imprecision of all loss prediction models. As of At both December 31, 2011, the2014 and December 31, 2013, there was no unallocated allowance amount represented 5% of the allowance for loan and lease losses, compared to 8% at December 31, 2010. The level in unallocated ALLL in the current year reflects management’s evaluation of the existing general business and economic conditions, and improving credit quality and collateral values of real estate in our markets as compared to 2010. The ALLL composition should not be interpreted as an indication of specific amounts or loan categories in which future charge-offs may occur.Umpqua Holdings Corporation
The following table provides a summary of activity in the ALLL by major loan type for each of the five years ended December 31:
Allowance for Non-covered Loan and Lease Losseslosses.
Years Ended December 31,
(dollars in thousands)
| | | | | | | | | | | | | | | | | | | | |
| | | 2011 | | | 2010 | | | 2009 | | | 2008 | | | 2007 | |
Balance at beginning of year | | $ | 101,921 | | | $ | 107,657 | | | $ | 95,865 | | | $ | 84,904 | | | $ | 60,090 | |
Loans charged off: | | | | | | | | | | | | | | | | | | | | |
Commercial real estate | | | (36,011 | ) | | | (71,030 | ) | | | (136,382 | ) | | | (82,919 | ) | | | (20,632 | ) |
Commercial | | | (21,071 | ) | | | (50,242 | ) | | | (57,932 | ) | | | (14,614 | ) | | | (2,208 | ) |
Residential | | | (6,333 | ) | | | (5,168 | ) | | | (4,331 | ) | | | (1,597 | ) | | | (547 | ) |
Consumer & other | | | (1,636 | ) | | | (2,061 | ) | | | (2,222 | ) | | | (1,922 | ) | | | (1,343 | ) |
| | | | |
Total loans charged off | | | (65,051 | ) | | | (128,501 | ) | | | (200,867 | ) | | | (101,052 | ) | | | (24,730 | ) |
Recoveries: | | | | | | | | | | | | | | | | | | | | |
Commercial real estate | | | 5,906 | | | | 6,980 | | | | 1,334 | | | | 2,571 | | | | 1,022 | |
Commercial | | | 3,348 | | | | 1,318 | | | | 1,549 | | | | 1,021 | | | | 819 | |
Residential | | | 239 | | | | 334 | | | | 126 | | | | 148 | | | | 241 | |
Consumer & other | | | 385 | | | | 465 | | | | 526 | | | | 595 | | | | 654 | |
| | | | |
Total recoveries | | | 9,878 | | | | 9,097 | | | | 3,535 | | | | 4,335 | | | | 2,736 | |
| | | | |
Net charge-offs | | | (55,173 | ) | | | (119,404 | ) | | | (197,332 | ) | | | (96,717 | ) | | | (21,994 | ) |
Addition incident to mergers | | | — | | | | — | | | | — | | | | — | | | | 5,078 | |
Provision charged to operations | | | 46,220 | | | | 113,668 | | | | 209,124 | | | | 107,678 | | | | 41,730 | |
| | | | |
Balance at end of year | | $ | 92,968 | | | $ | 101,921 | | | $ | 107,657 | | | $ | 95,865 | | | $ | 84,904 | |
| | | | |
Ratio of net charge-offs to average non-covered loans | | | 0.96% | | | | 2.06% | | | | 3.23% | | | | 1.58% | | | | 0.38% | |
Ratio of provision to average non-covered loans | | | 0.81% | | | | 1.97% | | | | 3.43% | | | | 1.76% | | | | 0.72% | |
Recoveries as a percentage of charge-offs | | | 15.19% | | | | 7.08% | | | | 1.76% | | | | 4.29% | | | | 11.06% | |
The following table sets forth the allocation of the allowance for
non-covered loan and lease losses and percent of loans
and leases in each category to total
non-covered loans
(excludingand leases, net of deferred
loan fees):fees, as of December 31:
Allowance for
Non-covered Loan and Lease Losses Composition
As of December 31,
(in thousands)
| | | | | | | | | | | | | | | | | | | | | | | | | | | | | | | | | | | | | | | | |
| | | 2011 | | | 2010 | | | 2009 | | | 2008 | | | 2007 | |
| | | Amount | | | % | | | Amount | | | % | | | Amount | | | % | | | Amount | | | % | | | Amount | | | % | |
Commercial real estate | | $ | 59,574 | | | | 64.8% | | | $ | 64,405 | | | | 68.5% | | | $ | 67,281 | | | | 68.6% | | | $ | 57,907 | | | | 67.5% | | | $ | 57,433 | | | | 69.2% | |
Commercial | | | 20,485 | | | | 24.8% | | | | 22,146 | | | | 22.2% | | | | 24,583 | | | | 23.2% | | | | 23,104 | | | | 24.5% | | | | 19,514 | | | | 23.8% | |
Residential | | | 7,625 | | | | 10.0% | | | | 5,926 | | | | 8.9% | | | | 5,811 | | | | 7.8% | | | | 5,778 | | | | 7.6% | | | | 3,406 | | | | 6.6% | |
Consumer & other | | | 867 | | | | 0.6% | | | | 803 | | | | 0.6% | | | | 455 | | | | 0.6% | | | | 484 | | | | 0.6% | | | | 504 | | | | 0.6% | |
Unallocated | | | 4,417 | | | | | | | | 8,641 | | | | | | | | 9,527 | | | | | | | | 8,592 | | | | | | | | 4,047 | | | | | |
| | | | | | | | | | | | | | | | | | | | | | | | | | | | | | | | | | | | | | | | |
Allowance for non-covered loan and lease losses | | $ | 92,968 | | | | | | | $ | 101,921 | | | | | | | $ | 107,657 | | | | | | | $ | 95,865 | | | | | | | $ | 84,904 | | | | | |
| | | | | | | | | | | | | | | | | | | | | | | | | | | | | | | | | | | | | | | | |
|
| | | | | | | | | | | | | | | | | | | | | | | | | | | | | | | | | | |
| (dollars in thousands) | 2014 | | 2013 | | 2012 | | 2011 | | 2010 |
| | Amount | | % | | Amount | | % | | Amount | | % | | Amount | | % | | Amount | | % |
| Commercial real estate, net | $ | 55,184 |
| | 58.1 | % | | $ | 59,538 |
| | 59.9 | % | | $ | 67,038 |
| | 63.9 | % | | $ | 68,513 |
| | 66.1 | % | | $ | 66,870 |
| | 69.6 | % |
| Commercial, net | 41,216 |
| | 19.2 | % | | 27,028 |
| | 27.7 | % | | 27,905 |
| | 24.5 | % | | 24,449 |
| | 23.2 | % | | 22,322 |
| | 20.7 | % |
| Residential, net | 15,922 |
| | 20.2 | % | | 7,487 |
| | 11.7 | % | | 7,729 |
| | 11.0 | % | | 8,616 |
| | 10.0 | % | | 5,982 |
| | 9.0 | % |
| Consumer & other, net | 3,845 |
| | 2.5 | % | | 1,032 |
| | 0.7 | % | | 994 |
| | 0.6 | % | | 1,293 |
| | 0.7 | % | | 827 |
| | 0.7 | % |
| Unallocated | — |
| | | | — |
| | | | — |
| | |
| | 4,417 |
| | |
| | 8,641 |
| | |
|
| Allowance for loan and lease losses | $ | 116,167 |
| | | | $ | 95,085 |
| | | | $ | 103,666 |
| | |
| | $ | 107,288 |
| | |
| | $ | 104,642 |
| | |
|
All impaired loans are individually evaluated for impairment. If the measurement of each impaired loans’ value is less thanAt December 31, 2014, the recorded investment in the loan, we recognize this impairment and adjust the carrying value of the loan to fair value through the allowance for loan and lease losses. This can be accomplished by charging-off the impaired portion of the loan or establishing a specific component within the allowance for loan and lease losses. If in management’s assessment the sources of repayment will not result in a reasonable probability that the carrying value of a loan can be recovered, the amount of a loan’s specific impairment is charged-off against the allowance for loan and lease losses. Prior to the second quarter of 2008, the Company established specific reserves within the allowance for loan and leases losses for loan impairments and recognized the charge-off of the impairment reserve when the loan was resolved, sold, or foreclosed and transferred to other real estate owned. Due to declining real estate values in our markets and the deterioration of the U.S. economy in general, it became increasingly likely that impairment reserves on collateral dependent loans, particularly those relating to real estate, would not be recoverable and represented a confirmed loss. As a result, beginning in the second quarter of 2008, the Company began recognizing the charge-off of impairment reserves on impaired loans in the period they arise for collateral dependent loans. This process has effectively accelerated the recognition of charge-offs recognized since the second quarter of 2008. The change in our assessment of the possible recoverability of our collateral dependent impaired loans’ carrying values has ultimately had no impact on our impairment valuation procedures or the amount of provision for loan and leases losses included within theConsolidated Statements of Operations. Impairment reserves on non-collateral dependent restructured loans are measured by comparing the present value of expected future cash flows on the restructured loans discounted at the interest rate of the original loan agreement to the loan’s carrying value. These impairment reserves are recognized as a specific component to be provided for in the allowance for loan and lease losses.At December 31, 2011, the recorded investment in non-covered loans classified as impaired totaled $166.3$102.6 million, with a corresponding valuation allowance (included in the allowance for loan and lease losses) of $3.8$1.4 million. The valuation allowance on impaired loans represents the impairment reserves on performing current and former restructured loans and nonaccrual loans and two loans included in loans past due 30+ days and accruing at loans. At December 31, 2011. At December 31, 2010,2013, the total recorded investment in impaired loans was $222.6$100.8 million, with a corresponding valuation allowance (included in the allowance for loan and lease losses) of $5.2$1.8 million. The valuation allowance on impaired loans represents the impairment reserves on performing current and former restructured loans and nonaccrual loans represent the only impaired loans accruing interest at December 31, 2010.
The majority of loan charge-offs in the current year relate to real estate related credits. In the current year we experienced decreased charge-offs in all categories except for residential. These charge-offs were largely driven by economic conditions coupled with falling real estate values in our markets. The majority of all charge-offs taken in the current year relate to borrowers that were directly affected by the housing market downturn or indirectly impacted from the contraction of real estate dependent businesses.
2013.
The following table presents a summary of activity in the reserve for unfunded commitments
(“RUC”("RUC"):
Summary of Reserve for Unfunded Commitments Activity
Years Ended December 31,(in thousands)
| | | | | | | | | | | | |
| | | 2011 | | | 2010 | | | 2009 | |
Balance at beginning of period | | $ | 818 | | | $ | 731 | | | $ | 983 | |
Net change to other expense: | | | | | | | | | | | | |
Commercial real estate | | | 26 | | | | (24 | ) | | | (94 | ) |
Commercial | | | 58 | | | | 91 | | | | (141 | ) |
Residential | | | 27 | | | | 14 | | | | (17 | ) |
Consumer & other | | | 11 | | | | 6 | | | | — | |
| | | | |
Total change to other expense | | | 122 | | | | 87 | | | | (252 | ) |
| | | | |
Balance at end of period | | $ | 940 | | | $ | 818 | | | $ | 731 | |
| | | | |
Umpqua Holdings Corporation
|
| | | | | | | | | | | |
(in thousands) | 2014 | | 2013 | | 2012 |
| Balance, beginning of period | $ | 1,436 |
| | $ | 1,223 |
| | $ | 940 |
|
| Net change to other expense | (1,863 | ) | | 213 |
| | 283 |
|
| Acquired reserve | 3,966 |
| | — |
| | — |
|
| Balance, end of period | $ | 3,539 |
| | $ | 1,436 |
| | $ | 1,223 |
|
We believe that the ALLL and RUC at December 31, 20112014 are sufficient to absorb losses inherent in the loan and lease portfolio and credit commitments outstanding as of that date respectively, based on the best information available. This assessment, based in part on historical levels of net charge-offs, loan and lease growth, and a detailed review of the quality of the loan and lease portfolio, involves uncertainty and judgment. Therefore, the adequacy of the ALLL and RUC cannot be determined with precision and may be subject to change in future periods. In addition, bank regulatory authorities, as part of their periodic examination of the Bank, may require additional charges to the provision for loan and lease losses in future periods if warranted as a result of their review.ALLOWANCE FOR COVERED LOAN AND LEASE LOSSES
The allowance for covered loan and lease losses (“ALLL”) totaled $14.3 million at December 31, 2011, an increase
Table of $11.6 million from the $2.7 million at December 31, 2010. The increase in the covered ALLL from the prior year end results from decreases in the amount and changes in the timing of expected cash flows attributable to credit deterioration on the acquired loans compared to those previously estimated, as measured on a pool basis. The following table summarizes activity related to the allowance for covered loan and lease losses by covered loan portfolio segment for the year ended December 31, 2011 and 2010, respectively:Allowance for Covered Loan and Lease Losses
(dollars in thousands)
| | | | | | | | |
| | | December 31,
2011 | | | December 31,
2010 | |
Balance at beginning of period | | $ | 2,721 | | | $ | — | |
Loans charged off: | | | | | | | | |
Commercial real estate | | | (3,177 | ) | | | (2,439 | ) |
Commercial | | | (660 | ) | | | (266 | ) |
Residential | | | (1,657 | ) | | | — | |
Consumer & other | | | (1,192 | ) | | | — | |
| | | | |
Total loans charged off | | | (6,686 | ) | | | (2,705 | ) |
Recoveries: | | | | | | | | |
Commercial real estate | | | 1,348 | | | | 11 | |
Commercial | | | 512 | | | | 263 | |
Residential | | | 142 | | | | — | |
Consumer & other | | | 142 | | | | 1 | |
| | | | |
Total recoveries | | | 2,144 | | | | 275 | |
| | | | |
Net charge-offs | | | (4,542 | ) | | | (2,430 | ) |
Covered provision charged to operations | | | 16,141 | | | | 5,151 | |
| | | | |
Balance at end of period | | $ | 14,320 | | | $ | 2,721 | |
| | | | |
As a percentage of average covered loans and leases: | | | | | | | | |
Net charge-offs | | | 0.64% | | | | 0.36% | |
Provision for covered loan and lease losses | | | 2.28% | | | | 0.76% | |
The following table sets forth the allocation of the allowance for covered loan and lease losses and percent of covered loans in each category to total loans as of December 31, 2011 and December 31, 2010:
Allowance for Covered Loan and Lease Losses Composition
(in thousands)
| | | | | | | | | | | | | | | | |
| | | 2011 | | | 2010 | |
| | | Amount | | | % | | | Amount | | | % | |
Commercial real estate | | $ | 8,939 | | | | 79.4% | | | $ | 2,465 | | | | 78.5% | |
Commercial | | | 3,964 | | | | 9.1% | | | | 176 | | | | 9.9% | |
Residential | | | 991 | | | | 10.2% | | | | 56 | | | | 10.2% | |
Consumer & other | | | 426 | | | | 1.3% | | | | 24 | | | | 1.4% | |
| | | | |
Allowance for covered loan and lease losses | | $ | 14,320 | | | | 100% | | | $ | 2,721 | | | | 100% | |
| | | | |
Contents
RESIDENTIAL MORTGAGE SERVICING RIGHTS
The following table presents the key elements of our residential mortgage servicing rights asset as of December 31, 2011, 20102014, 2013, and 2009:2012:
Summary of
Residential Mortgage Servicing Rights
Years Ended December 31,
(dollars
|
| | | | | | | | | | | |
| (in thousands) | 2014 | | 2013 | | 2012 |
| Balance, beginning of period | $ | 47,765 |
| | $ | 27,428 |
| | $ | 18,184 |
|
| Acquired/purchased MSR | 62,770 |
| | — |
| | — |
|
| Additions for new MSR capitalized | 23,311 |
| | 17,963 |
| | 17,710 |
|
| Changes in fair value: | | | | | |
| Due to changes in model inputs or assumptions(1) | (5,757 | ) | | 5,688 |
| | (4,651 | ) |
| Other(2) | (10,830 | ) | | (3,314 | ) | | (3,815 | ) |
| Balance, end of period | $ | 117,259 |
| | $ | 47,765 |
| | $ | 27,428 |
|
(1)Principally reflects changes in thousands) | | | | | | | | | | | | |
| | | 2011 | | | 2010 | | | 2009 | |
Balance, beginning of year | | $ | 14,454 | | | $ | 12,625 | | | $ | 8,205 | |
Additions for new mortgage servicing rights capitalized | | | 6,720 | | | | 5,645 | | | | 7,570 | |
Acquired mortgage servicing rights | | | — | | | | 62 | | | | — | |
Changes in fair value: | | | | | | | | | | | | |
Due to changes in model inputs or assumptions(1) | | | (858 | ) | | | (1,598 | ) | | | (3,469 | ) |
Other(2) | | | (2,132 | ) | | | (2,280 | ) | | | 319 | |
| | | | |
Balance, end of year | | $ | 18,184 | | | $ | 14,454 | | | $ | 12,625 | |
| | | | |
Balance of loans serviced for others | | $ | 2,009,849 | | | $ | 1,603,414 | | | $ | 1,277,832 | |
MSR as a percentage of serviced loans | | | 0.90% | | | | 0.90% | | | | 0.99% | |
(1) | Principally reflects changes in discount rates and prepayment speed assumptions, which are primarily affected by changes in interest rates. |
(2) | Represents changes due to collection/realization of expected cash flows over time. |
Mortgagediscount rates and prepayment speed assumptions, which are primarily affected by changes in interest rates.
(2) Represents changes due to collection/realization of expected cash flows over time.
Information related to our serviced loan portfolio as of December 31, 2014, 2013, and 2012 was as follows:
|
| | | | | | | | | | | |
| (dollars in thousands) | December 31, 2014 | | December 31, 2013 | | December 31, 2012 |
| Balance of loans serviced for others | $ | 11,590,310 |
| | $ | 4,362,499 |
| | $ | 3,162,080 |
|
| MSR as a percentage of serviced loans | 1.01 | % | | 1.09 | % | | 0.87 | % |
Residential mortgage servicing rights are adjusted to fair value quarterly with the change recorded in
residential mortgage banking revenue. The value of
residential mortgage servicing rights is impacted by market rates for mortgage loans. Historically low market rates can cause prepayments to increase as a result of refinancing activity. To the extent loans are prepaid sooner than estimated at the time servicing assets are originally recorded, it is possible that certain
residential mortgage servicing rights assets may decrease in value. Generally, the fair value of our
residential mortgage servicing rights will increase as market rates for mortgage loans rise and decrease if market rates fall.
Additional information about the Company’s mortgage servicing rights is provided in Note 10 of theNotes to Consolidated Financial Statementsin Item 8 below.
GOODWILL AND OTHER INTANGIBLE ASSETS
At December 31, 2011,2014, we had recognized goodwill of $656.1 million,$1.8 billion, as compared to $655.9$764.3 million at December 31, 2010. The goodwill2013. Goodwill is recorded in connection with acquisitionsbusiness combinations and represents the excess of the purchase price over the estimated fair value of the net assets acquired. Goodwill and other intangible assets with indefinite lives are not amortized but instead areUmpqua Holdings Corporation
periodically tested for impairment. Management evaluates goodwill and intangible assets with indefinite lives on an annual basisincreased in 2014 over 2013 as of December 31. Additionally, we perform impairment evaluations on an interim basis when events or circumstances indicate impairment potentially exists. A significant amount of judgment is involved in determining if an indicator of impairment has occurred. Such indicators may include, among others, a significant decline in our expected future cash flows; a sustained, significant decline in our stock price and market capitalization; a significant adverse change in legal factors or in the business climate; adverse action or assessment by a regulator; and unanticipated competition.
The goodwill impairment test involves a two-step process. The first step compares the fair value of a reporting unit (e.g. Wealth Management and Community Banking) to its carrying value. If the reporting unit’s fair value is less than its carrying value, the Company would be required to proceed to the second step. In the second step the Company calculates the implied fair valueresult of the reporting unit’s goodwill. The implied fair value of goodwill is determined in the same manner as goodwill recognized in a business combination. The estimated fair value of the Company is allocated to all of the Company’s assets and liabilities, including any unrecognized identifiable intangible assets, as if the Company had been acquired in a business combination and the estimated fair value of the reporting unit is the price paid to acquire it. The allocation process is performed only for purposes of determining the amount of goodwill impairment. No assets or liabilities are written up or down, nor are any additional unrecognized identifiable intangible assets recorded as a part of this process. Any excess of the estimated purchase price over the fair value of the reporting unit’s net assets represents the implied fair value of goodwill. If the carrying amount of the goodwill is greater than the implied fair value of that goodwill, an impairment loss would be recognized as a charge to earnings in an amount equal to that excess.
Substantially all of the Company’s goodwill is associated with our community banking operations. Due to a decline in the Company’s market capitalization below book value of equity and continued weakness in the banking industry, the Company performed a goodwill impairment evaluation of the Community Banking operating segment as of June 30, 2009. The Company engaged an independent valuation consultant to assist us in determining whether and to what extent our goodwill asset was impaired. We utilized a variety of valuation techniques to analyze and measure the estimated fair value of reporting units under both the income and market valuation approach. Under the income approach, the fair value of the reporting unit is determined by projecting future earnings for five years, utilizing a terminal value based on expected future growth rates, and applying a discount rate reflective of current market conditions. The estimation of forecasted earnings uses management’s best estimate of economic and market conditions over the projected periods and considers estimated growth rates in loans and deposits and future expected changes in net interest margins. Various market-based valuation approaches are utilized and include applying market price to earnings, core deposit premium, and tangible book value multiples as observed from relevant, comparable peer companies of the reporting unit. We also valued the reporting unit by applying an estimated control premium to the market capitalization. Weightings are assigned to each of the aforementioned model results, judgmentally allocated based on the observability and reliability of the inputs, to arrive at a final fair value estimate of the reporting unit. The results of the Company’s and valuation specialist’s step one impairment test indicated that the reporting unit’s fair value was less than its carrying value. As a result, the Company performed a step two analysis. The external valuation specialist assisted management’s analysis under step two of the goodwill impairment test. Under this approach, we calculated the fair value for the reporting unit’s assets and liabilities, as well as its unrecognized identifiable intangible assets, such as the core deposit intangible and trade name. Fair value adjustments to items on the balance sheet primarily related to investment securities held to maturity, loans, other real estate owned, Visa Class B common stock, deferred taxes, deposits, term debt, and junior subordinated debentures carried at amortized cost. The external valuation specialist assisted management to estimate the fair value of our unrecognized identifiable assets, such as the core deposit intangible and trade name.
The most significant fair value adjustment made in this analysis was to adjust the carrying value of the Company’s loans receivable portfolio to fair value. The fair value of the Company’s loan receivable portfolio at June 30, 2009 was estimated in a manner similar to methodology utilized as part of the Sterling merger.
At December 31, 20082013, we had recorded goodwill impairment evaluation. As part of the December 31, 2008 loan valuation, the loan portfolio was stratified into sixty-eight loan pools that shared common characteristics, namely loan type, payment terms, and whether the loans were performing or non-performing. Each loan pool was discounted at a rate that considers current market interest rates, credit risk, and assumed liquidity premiums required based upon the nature of the underlying pool. Due$764.3 million, as compared to the disruption in the financial markets experienced during 2008 andcontinuing through 2009, the liquidity premium reflects the reduction in demand in the secondary markets for all grades of non-conforming credit, including those that are performing. Liquidity premiums for individual loan categories generally ranged from 4.6% for performing loans to 30% for construction and non-performing loans. At December 31, 2008, the fair value of the overall loan portfolio was calculated to be at a 9% discount relative to its book value. The composition of the loan portfolio at June 30, 2009, including loan type and performance indicators, was substantially similar to the loan portfolio$668.2 million at December 31, 2008. At June 30, 2009,2012, with the fair value of the loan portfolio was estimated to be at a 12% discount relative to its carrying value. The additional discount is primarily attributedincrease due to the additional liquidity premium required as of the measurement date associated with the Company’s concentration of commercial real estate loans.
FinPac acquisition.
Other significant fair value adjustments utilized in this goodwill impairment analysis included the value of the core deposit intangible asset which was calculated as 0.53% of core deposits, and includes all deposits except certificates of deposit. The carrying value of other real estate owned was discounted by 25%, representing a liquidity adjustment given the current market conditions. The fair value of our trade name, which represents the competitive advantage associated with our brand recognition and ability to attract and retain relationships, was estimated to be $19.3 million. The fair value of our junior subordinated debentures carried at amortized cost was determined in a manner and utilized inputs, primarily the credit risk adjusted spread, consistent with our methodology for determining the fair value of junior subordinated debentures recorded at fair value. Information relating to our methodologies for estimating the fair value of financial instruments that were adjusted to fair value as part of this analysis, including the Visa Class B common stock, deposits, term debt, and junior subordinated debentures, is included in Note 24 of theNotes to Consolidated Financial Statements.At Based on the results of the step two analysis, the Company determined that the implied fair value of the goodwill was less than its carrying amount on the Company’s balance sheet, and as a result, we recognized a goodwill impairment loss of $112.0 million in the second quarter of 2009. This write-down of goodwill is a non-cash charge that does not affect the Company’s or the Bank’s liquidity or operations. In addition, because goodwill is excluded in the calculation of regulatory capital, the Company’s “well-capitalized” regulatory capital ratios are not affected by this charge.
The Company also conducted its annual evaluation of goodwill for impairment as of December 31, 2011. In the first step of the goodwill impairment test the Company determined that the fair value of the Community Banking reporting unit exceeded its carrying amount. This determination is consistent with the events occurring after the Company recognized the $112.0 million impairment of goodwill second quarter of 2009. First, the market capitalization and estimated fair value of the Company increased significantly subsequent to the recognition of the impairment charge as the fair value of the Company’s stock increased 60% from June 30, 2009 to December 31, 2011. Secondly, the Company’s successful public common stock offerings in the third quarter of 2009 and first quarter of 2010 diluted the carrying value of the reporting book equity on a per share basis, against which the fair value of the reporting unit is measured. The significant assumptions and methodology utilized to test for goodwill impairment as of December 31, 2011 were consistent with these used at December 31, 2010.
If the Company’s common stock price should significantly decline or continues to trade below book value per common share, or should general economic conditions deteriorate further or remain depressed for a prolonged period of time, particularly in the financial industry, the Company may be required to recognize additional impairment of all, or some portion of, its goodwill. It is possible that changes in circumstances, existing at the measurement date or at other times in the future, or changes in the numerous estimates associated with management’s judgments, assumptions and estimates made in assessing the fair value of our goodwill, such as valuation multiples, discount rates, or projected earnings, could result in an impairment charge in future periods. Additional impairment charges, if any, may be material to the Company’s results of operations and financial position. However, any potential future impairment charge will have no effect on the Company’s or the Bank’s cash balances, liquidity, or regulatory capital ratios.
The inputs management utilizes to estimate the fair value of a reporting unit in step one of the goodwill impairment test, and estimating the fair values of the underlying assets and liabilities of a reporting unit in the second step of the goodwill impairment test, require management to make significant judgments, assumptions and estimates where observable market may not readily exist. Such inputs include, but are not limited to, trading multiples from comparable transactions, control premiums, the value that may arise from synergies and other benefits that would accrue from control over an entity, and the appropriate
Umpqua Holdings Corporation
rates to discount projected cash flows. Additionally, there may be limited current market inputs to value certain assets or liabilities, particularly loans and junior subordinated debentures. These valuation inputs are considered to be Level 3 inputs.
Management will continue to monitor the relationship of the Company’s market capitalization to both its book value and tangible book value, which management attributes to both financial services industry-wide and Company specific factors, and to evaluate the carrying value of goodwill and other intangible assets.
The Company evaluated the Wealth Management reporting segment’s goodwill for impairment as of December 31, 2011. The first step of the goodwill impairment test indicated that the reporting unit’s fair value exceeded its carrying value. As of December 31, 2011, the ending carrying value of the Wealth Management segment’s goodwill was $2.7 million.
At December 31, 2011,2014, we had other intangible assets of $21.1$56.7 million, as compared to $26.1$12.4 million at December 31, 2010.2013. As part of a business acquisition, a portion of the purchase price is allocated to the other value of intangible assets such as the merchant servicing portfolio or core deposits, which includes all deposits except certificates of deposit. The value of these other intangible assets were determined by a third party based on the net present value of future cash flows for the merchant servicing portfolio and an analysis of the cost differential between the core deposits and alternative funding sources for the core deposit intangible. Intangible assets with definite useful lives are amortized to their estimated residual values over their respective estimated useful lives, and are also reviewed for impairment. We amortize other intangible assets on an accelerated or straight-line basis over an estimated ten to fifteen year life. In the fourth quarter of 2009, the Company recognized an $804,000 impairment related to the merchant servicing portfolio obtained through a prior acquisition. The remaining decrease in otherOther intangible assets resulted from scheduled amortization. No other impairment losses were recognizedincreased in 2014 over 2013 as a result of core deposit intangible recorded in connection with other intangible assets since their initial recognition.
Additional information regarding our accounting for goodwill and other intangible assets is includedthe Sterling merger. No impairment losses have been recognized in Notes 1, 2 and 9 of theNotes to Consolidated Financial Statementsin Item 8 below. periods presented.
Total deposits were $9.2$16.9 billion at December 31, 2011, a decrease2014, an increase of $197.1 million,$7.8 billion, or 2.1%85.3%, as compared to year-end 2010. Of the total change in deposit balances during the current year,2013 due to deposits from consumers and businesses decreased $231.6 million, and deposits from public entities increased $34.5 million. Although deposits have declined due to the run-offSterling merger.
The following table presents the deposit balances by major category as of December 31:DepositsAs of December 31,
(dollars in thousands)
| | | | | | | | | | | | | | | | |
| | | 2011 | | | 2010 | |
| | | Amount | | | Percentage | | | Amount | | | Percentage | |
Noninterest bearing | | $ | 1,913,121 | | | | 21% | | | $ | 1,616,687 | | | | 17% | |
Interest bearing demand | | | 993,579 | | | | 11% | | | | 927,224 | | | | 10% | |
Money market | | | 3,661,785 | | | | 39% | | | | 3,467,549 | | | | 37% | |
Savings | | | 386,528 | | | | 4% | | | | 349,696 | | | | 4% | |
Time, $100,000 and over | | | 1,629,505 | | | | 18% | | | | 2,191,055 | | | | 23% | |
Time less than $100,000 | | | 652,172 | | | | 7% | | | | 881,594 | | | | 9% | |
| | | | |
Total | | $ | 9,236,690 | | | | 100% | | | $ | 9,433,805 | | | | 100% | |
| | | | |
The following table presents the average amount of 2014 and average rate paid by major category as of December 31:
| | | | | | | | | | | | | | | | | | | | | | | | |
| | | 2011 | | | 2010 | | | 2009 | |
| | | Average | | | Average | | | Average | | | Average | | | Average | | | Average | |
| | | Deposits | | | Rate | | | Deposits | | | Rate | | | Deposits | | | Rate | |
Non-interest bearing | | $ | 1,782,354 | | | | 0.00% | | | $ | 1,529,165 | | | | 0.00% | | | $ | 1,318,954 | | | | 0.00% | |
Interest bearing demand | | | 903,721 | | | | 0.34% | | | | 941,637 | | | | 0.50% | | | | 798,760 | | | | 0.61% | |
Money market | | | 3,487,624 | | | | 0.49% | | | | 2,932,136 | | | | 0.90% | | | | 2,232,911 | | | | 1.20% | |
Savings | | | 373,746 | | | | 0.10% | | | | 329,336 | | | | 0.16% | | | | 301,417 | | | | 0.19% | |
Time | | | 2,754,533 | | | | 1.27% | | | | 2,875,706 | | | | 1.55% | | | | 2,358,697 | | | | 2.39% | |
| | | | |
Total | | $ | 9,301,978 | | | | | | | $ | 8,607,980 | | | | | | | $ | 7,010,739 | | | | | |
| | | | |
31, 2013:
Deposits
|
| | | | | | | | | | | | | | |
| (dollars in thousands) | | December 31, 2014 | | December 31, 2013 |
| | | Amount | | Percentage | | Amount | | Percentage |
| Non-interest bearing | | $ | 4,744,804 |
| | 28 | % | | $ | 2,436,477 |
| | 26 | % |
| Interest bearing demand | | 2,054,994 |
| | 12 | % | | 1,233,070 |
| | 14 | % |
| Money market | | 6,113,138 |
| | 36 | % | | 3,349,946 |
| | 37 | % |
| Savings | | 971,185 |
| | 6 | % | | 560,699 |
| | 6 | % |
| Time, $100,000 or greater | | 1,765,721 |
| | 10 | % | | 1,065,380 |
| | 12 | % |
| Time, less than $100,000 | | 1,242,257 |
| | 8 | % | | 472,088 |
| | 5 | % |
| Total | | $ | 16,892,099 |
| | 100 | % | | $ | 9,117,660 |
| | 100 | % |
The following table presents the scheduled maturities of time deposits of $100,000 and greater as of December 31,
2011:2014:
Maturities of Time Deposits of $100,000 and Greater
(in thousands)
| | | | |
Three months or less | | $ | 493,587 | |
Over three months through six months | | | 192,775 | |
Over six months through twelve months | | | 463,446 | |
Over twelve months | | | 479,697 | |
| | | | |
Time, $100,000 and over | | $ | 1,629,505 | |
| | | | |
|
| | | |
| (in thousands) | Amount |
| Three months or less | $ | 384,868 |
|
| Over three months through six months | 331,049 |
|
| Over six months through twelve months | 376,671 |
|
| Over twelve months | 673,133 |
|
| Time, $100,000 and over | $ | 1,765,721 |
|
The Company has an agreement with Promontory Interfinancial Network LLC (“Promontory”) that makes it possible to provide FDIC deposit insurance to balances in excess of current deposit insurance limits. Promontory’sbrokered deposits, including Certificate of Deposit Account Registry Service (“CDARS”("CDARS") uses a deposit-matching program to exchange Bank depositsincluded in excess of the current deposit insurance limits for excess balances at other participating banks, on a dollar-for-dollar basis, that would be fully insured at the Bank. This product istime and money market deposits. These products are designed to enhance our ability to attract and retain customers and increase deposits, by providing additional FDIC coverage to customers. CDARS deposits can be reciprocal or one-way. All of the Bank’s CDARS deposits are reciprocal. At December 31, 2011 and2014, the Company's brokered deposits, including CDARS, of $866.2 million compared to $580.4 million as of December 31, 2010,2013. The increase is primarily due to brokered deposits from the Company’s CDARS balances totaled $274.6 million and $323.2 million, respectively. Of these totals, at Sterling merger.
BORROWINGS
At December 31, 2011 and December 31, 2010, $258.3 million and $300.6 million, respectively, represented time deposits equal to or greater than $100,000 but were fully insured under current deposit insurance limits.The Dodd-Frank Act provides for unlimited deposit insurance for noninterest bearing transactions accounts, excluding NOW (interest bearing deposit accounts) and including all IOLTA (lawyers’ trust accounts)2014
, beginning December 31, 2010 for a period of two years. Also, the Dodd-Frank Act permanently raises the current standard maximum federal deposit insurance amount from $100,000 to $250,000 per qualified account.BORROWINGS
At December 31, 2011, the Bank had outstanding $124.6$313.3 million of securities sold under agreements to repurchase and no outstanding federal funds purchased balances. Additional information regardingThe Sterling securities sold under agreements to repurchase and federal funds purchased is provided in Notes 15 and 16 ofNotes to Consolidated Financial Statementsin Item 8 below. $584.7 million were paid off at the merger date.
At December 31, 2011, the
The Bank had outstanding term debt with a carrying value of $255.7 million$1.0 billion at December 31, 2014, primarily with the Federal Home Loan Bank (“FHLB”("FHLB"). Term debt outstanding as of December 31, 2011 decreased $7.12014 increased $754.9 million since December 31, 2010 primarily2013 as a result of repayment of FHLB borrowings. Management expects continued use of FHLB advances as a source of short and long-term funding.the Sterling merger adding $854.7 million, offset by maturity payoffs. Advances from the FHLB amounted to $245.0 million of the total term debt and are secured by investment securities and residential mortgage loans.loans secured by real estate. The FHLB advances have fixed contractualcoupon interest rates ranging from 4.46%0.41% to 4.72%7.10% and mature in 2016 and 2017.Umpqua Holdings Corporation
Additional information regarding term debt is provided in Note 17 ofNotes to Consolidated Financial Statementsin Item 8 below.2015 through 2030.
JUNIOR SUBORDINATED DEBENTURES
We had junior subordinated debentures with carrying values of $185.4$350.9 million and $183.6$189.2 million respectively, at December 31, 20112014 and 2010.At
December 31, 2011, approximately $219.6 million, or 95%2013, respectively. The increase is primarily due to the assumption of the total issued amount, had interest rates that are adjustable on a quarterly basis based on a spread over three month LIBOR. Interest expense for junior subordinated debentures decreased in 2011 as compared to 2010 and in 2010 as compared to 2009, primarily resulting from decreases in short-term market interest rates and LIBOR. Although increases in short-term market interest rates will increase the interest expense for junior subordinated debentures, we believe that other attributessecurities of our balance sheet will serve to mitigate the impact to net interest income on a consolidated basis.On January 1, 2007, the Company elected the fair value measurement option for certain pre-existing junior subordinated debentures of $97.9$156.2 million (the Umpqua Statutory Trusts). The remaining junior subordinated debentures as of the adoption date were acquired through business combinations and were measured at fair value at the time of acquisition. In 2007, the Company issued two series of trust preferred securities and elected to measure each instrument at fair value. Accounting for junior subordinated debentures originally issued by the Company at fair value enables us to more closely align our financial performance with the economic value of those liabilities. Additionally, we believe it improves our ability to manage the market and interest rate risks associated with the junior subordinated debentures. The junior subordinated debentures measured at fair value and amortized cost have been presented as separate line items on the balance sheet. The ending carrying (fair) value of the junior subordinated debentures measured at fair value represents the estimated amount that would be paid to transfer these liabilities in an orderly transaction amongst market participants under current market conditions as of the measurement date.
The significant inputs utilized in the estimation of fair value of these instruments are the credit risk adjusted spread and three month LIBOR. The credit risk adjusted spread represents the nonperformance risk of the liability, contemplating the inherent risk of the obligation. Generally, an increase in the credit risk adjusted spread and/or a decrease in the three month LIBOR will result in positive fair value adjustments. Conversely, a decrease in the credit risk adjusted spread and/or an increase in the three month LIBOR will result in negative fair value adjustments.
Through the first quarter of 2010 we obtained valuations from a third-party pricing service to assist with the estimation and determination of fair value of these liabilities. In these valuations, the credit risk adjusted interest spread for potential new issuances through the primary market and implied spreads of these instruments when traded as assets on the secondary market, were estimated to be significantly higher than the contractual spread of our junior subordinated debentures measured at fair value. The difference between these spreads has resulted in the cumulative gain in fair value, reducing the carrying value of these instruments as reported on our Condensed Consolidated Balance Sheets. In July 2010, the Dodd-Frank Act was signed into law which, among other things, limits the ability of certain bank holding companies to treat trust preferred security debt issuances as Tier 1 capital. This law may require many banks to raise new Tier 1 capital and is expected to effectively close the trust-preferred securities markets from offering new issuances in the future. As a result of this legislation, our third-party pricing service noted that they were no longer to able to provide reliable fair value estimates related to these liabilities given the absence of observable or comparable transactions in the market place in recent history or as anticipated into the future.
Due to inactivity in the junior subordinated debenture market and the inability to obtain observable quotes of our, or similar, junior subordinated debenture liabilities or the related trust preferred securities when traded as assets, we utilize an income approach valuation technique to determine the fair value of these liabilities using our estimation of market discount rate assumptions. The Company monitors activity in the trust preferred and related markets, to the extent available, changes related to the current and anticipated future interest rate environment, and considers our entity-specific creditworthiness, to validate the reasonableness of the credit risk adjusted spread and effective yield utilized in our discounted cash flow model. Regarding the activity in and condition of the junior subordinated debt market, we noted no observable changes in the current period as it
relates to companies comparable to our size and condition, in either the primary or secondary markets. Relating to the interest rate environment, we considered the change in slope and shape of the forward LIBOR swap curve in the current period, the affects of which did not result in a significant change in the fair value of these liabilities.
The Company’s specific credit risk is implicit in the credit risk adjusted spread used to determine the fair value of our junior subordinated debentures. As our Company is not specifically rated by any credit agency, it is difficult to specifically attribute changes in our estimate of the applicable credit risk adjusted spread to specific changes in our own creditworthiness versus changes in the market’s required return from similar companies. As a result, these considerations must be largely based off of qualitative considerations as we do not have a credit rating and we do not regularly issue senior or subordinated debt that would provide us an independent measure of the changes in how the market quantifies our perceived default risk.
On a quarterly basis we assess entity-specific qualitative considerations that if not mitigated or represents a material change from the prior reporting period may result in a change to the perceived creditworthiness and ultimately the estimated credit risk adjusted spread utilized to value these liabilities. Entity-specific considerations that positively impact our creditworthiness include: our strong capital position resulting from our successful public stock offerings in 2009 and 2010, that offers us flexibility to pursue business opportunities such as mergers and acquisitions, or expand our footprint and product offerings; having significant levelsSterling merger.
Table of on and off-balance sheet liquidity; being profitable (after excluding the one-time goodwill impairment charge recognized in 2009); and, having an experienced management team. However, these positive considerations are mitigated by significant risks and uncertainties that impact our creditworthiness and ability to maintain capital adequacy in the future. Specific risks and concerns include: given our concentration of loans secured by real estate in our loan portfolio, a continued and sustained deterioration of the real estate market may result in declines in the value of the underlying collateral and increased delinquencies that could result in an increased of charge-offs; despite recent improvement, our credit quality metrics remain negatively elevated since 2007 relative to historical standards; the continuation of current economic downturn that has been particularly severe in our primary markets could adversely affect our business; recent increased regulation facing our industry, such as the ESAA, ARRA and the Dodd-Frank Act, will increase the cost of compliance and restrict our ability to conduct business consistent with historical practices, and could negatively impact profitability; we have a significant amount of goodwill and other intangible assets that dilute our available tangible common equity; and the carrying value of certain material, recently recorded assets on our balance sheet, such as the FDIC loss-sharing indemnification asset, are highly reliant on management estimates, such as the timing or amount of losses that are estimated to be covered, and the assumed continued compliance with the provisions of the loss-share agreement. To the extent assumptions ultimately prove incorrect or should we consciously forego or unknowingly violate the guidelines of the agreement, an impairment of the asset may result which would reduce capital.Additionally, the Company periodically utilizes an external valuation firm to determine or validate the reasonableness of the assessments of inputs and factors that ultimately determines the estimate fair value of these liabilities. The extent we involve or engage these external third parties correlates to management’s assessment of the current subordinate debt market, how the current environment and market compares to the preceding quarter, and perceived changes in the Company’s own creditworthiness during the quarter. In periods of potential significant valuation changes and at year-end reporting periods we typically engage third parties to perform a full independent valuation of these liabilities. For periods where management has assessed the market and other factors impacting the underlying valuation assumptions of these liabilities, and has determined significant changes to the valuation of these liabilities in the current period are remote, the scope of the valuation specialist’s review is limited to a review the reasonableness of Management’s assessment of inputs. In the fourth quarter of 2011, the Company engaged an external valuation firm to prepare an independent valuation of our junior subordinated debentures measured at fair value and the results were consistent with the Company’s valuation.
Absent changes to the significant inputs utilized in the discounted cash flow model used to measure the fair value of these instruments at each reporting period, the cumulative discount for each junior subordinated debenture will reverse over time, ultimately returning the carrying values of these instruments to their notional values at their expected redemption dates, in a manner similar to the effective yield method as if these instruments were accounted for under the amortized cost method. For the year ended December 31, 2011, 2010, 2009, we recorded a loss of $2.2 million, a gain of $5.0 million, and a gain of $6.5
Umpqua Holdings Corporation
million, respectively, resulting from the change in fair value of the junior subordinated debentures recorded at fair value. Observable activity in the junior subordinated debenture and related markets in future periods may change the effective rate used to discount these liabilities, and could result in additional fair value adjustments (gains or losses on junior subordinated debentures measured at fair value) outside the expected periodic change in fair value had the fair value assumptions remained unchanged.
As noted above, the Dodd-Frank Act limits the ability of certain bank holding companies to treat trust preferred security debt issuances as Tier 1 capital. As the Company had less than $15 billion in assets at December 31, 2009, under the Dodd-Frank Act, the Company will be able to continue to include its existing trust preferred securities, less the common stock of the Trusts, in Tier 1 capital. At December 31, 2011, the Company’s restricted core capital elements were 18.4% of total core capital, net of goodwill and any associated deferred tax liability.
The contractual interest expense on junior subordinated debentures continues to be recorded on an accrual basis and is reported in interest expense. The junior subordinated debentures recorded at fair value of $82.9 million had contractual unpaid principal amounts of $134.0 million outstanding as of December 31, 2011. The junior subordinated debentures recorded at fair value of $80.7 million had contractual unpaid principal amounts of $134.0 million outstanding as of December 31, 2010.
Additional information regarding junior subordinated debentures measured at fair value is included in Note 24 of theNotes to Consolidated Financial Statements in Item 8 below.
All of the debentures issued to the Trusts, less the common stock of the Trusts, qualified as Tier 1 capital as of December 31, 2011, under guidance issued by the Board of Governors of the Federal Reserve System. Additional information regarding the terms of the junior subordinated debentures, including maturity/redemption dates, interest rates and the fair value election, is included in Note 18 of theNotes to Consolidated Financial Statements in Item 8 below.
Contents
The principal objective of our liquidity management program is to maintain the
Bank’sBank's ability to meet the day-to-day cash flow requirements of our customers who either wish to withdraw funds or to draw upon credit facilities to meet their cash needs.
We monitor the sources and uses of funds on a daily basis to maintain an acceptable liquidity position. One source of funds includes public deposits. Individual state laws require banks to collateralize public deposits, typically as a percentage of their public deposit balance in excess of FDIC insurance. Public deposits represent 10.9%11.7% and 11.0% of total deposits at December 31, 20112014 and 10.3% at December 31, 2010.2013, respectively. The amount of collateral required varies by state and may also vary by institution within each state, depending on the individual state’sstate's risk assessment of depository institutions. Changes in the pledging requirements for uninsured public deposits may require pledging additional collateral to secure these deposits, drawing on other sources of funds to finance the purchase of assets that would be available to be pledged to satisfy a pledging requirement, or could lead to the withdrawal of certain public deposits from the Bank. In addition to liquidity from core deposits and the repayments and maturities of loans and investment securities, the Bank can utilize established uncommitted federal funds lines of credit, sell securities under agreements to repurchase, borrow on a secured basis from the FHLB or issue brokered certificates of deposit. The Bank had available lines of credit with the FHLB totaling $1.8$4.7 billion at December 31, 20112014 subject to certain collateral requirements, namely the amount of pledged loans and investment securities. The Bank had available lines of credit with the Federal Reserve totaling $448.5$698.8 million subject to certain collateral requirements, namely the amount of certain pledged loans at December 31, 2011.loans. The Bank had uncommitted federal funds line of credit agreements with additional financial institutions totaling $135.0$455.0 million at December 31, 2011.2014. Availability of the lines is subject to federal funds balances available for loan and continued borrower eligibility. These lines are intended to support short-term liquidity needs, and the agreements may restrict the consecutive day usage. The Company is a separate entity from the Bank and must provide for its own liquidity. Substantially all of the Company’sCompany's revenues are obtained from dividends declared and paid by the Bank. In 2011, thereThere were $17.5$250.5 million of dividends paid by the Bank to the Company.Company in 2014. There are statutory and regulatory provisions that could limit the ability of the Bank to pay dividendsto the Company. We believe that such restrictions will not have an adverse impact on the ability of the Company to fund its quarterly cash dividend distributions to common shareholders when approved, and meet its ongoing cash obligations, which consist principally of debt service on the $230.1 million (issued amount) of outstanding junior subordinated debentures. As of
December 31, 2011,2014, the Company did not have any borrowing arrangements of its own.Additional discussion related to liquidity related risks given the current economic climate is provided in Item 1ARisk Factors above.
As disclosed in theConsolidatedStatements of Cash Flows in Item 8 of this report,, net cash provided by operating activities was $182.4$352.4 million during 2011. The2014, with the difference between cash provided by operating activities and net income largely consistedconsisting of non-cash items including a $46.2proceeds from the sale of loans held for sale of $2.3 billion, offset by originations of loans held for sale of $2.1 billion. This compares to net cash provided by operating activities of $411.9 million provisionduring 2013, with the difference between cash provided by operating activities and net income largely consisting of originations of loans held for non-covered loan and lease losses and a $16.1 million provisionsale of $1.6 billion, offset by proceeds from the sale of loans held for covered loan and lease losses. sale of $1.9 billion.
Net cash of $382.7$249.0 million usedprovided by investing activities during the 2014 consisted principally of proceeds from investment securities available for sale of $1.2 billion, proceeds from sale of loans and leases of $356.5 million, and net cash acquired of $116.9 million, partially offset by $937.7 million of net loan originations, $363.1 million of purchases of investment securities available for sale, net non-covered loan originationscash paid in divestiture of $327.0$127.6 million, $34.0 million ofand purchases of premises and equipment partially offsetof $62.2 million. This compares to net cash of $282.2 million provided by net proceeds from the FDIC indemnification assetinvesting activities during 2013, which consisted principally of $54.9 million, and proceeds from investment securities available for sale of $927.3 million, net covered loan paydowns of $119.8$803.9 million, proceeds from the sale of non-covered other real estate ownedloans and leases of $35.3 million, proceeds from the sale of covered other real estate owned of $17.6$60.3 million, and proceeds from the sale of loansother real estate owned of $11.2$26.5 million, partially offset by net loan and lease originations of $383.1 million, net cash paid in acquisition of $149.7 million, purchases of investment securities available for sale of $51.2 million, and purchases of premises and equipment of $34.0 million. The $205.0
Net cash of $213.4 million
provided by financing activities during 2014 primarily consisted of
$905.4 million increase in net deposits, partially offset by $496.3 million decrease in securities sold under agreements to repurchase, dividends paid on common stock of $99.2 million, and repayment of debt of $97.0 million. This compares to net cash
of $447.5 million used by financing activities
during 2013, which consisted primarily
consisted of
$196.1$261.2 million decrease in net deposits,
$29.8repayment of term debt of $211.7 million,
of retirement of common stock, $25.3$50.8 million of dividends paid on common stock, and
$5.0$9.4 million
repayment of
term debt,common stock repurchased, partially offset by
$50.8$87.8 million increase in net securities sold under agreements to repurchase.
Although we expect the
Bank’sBank's and the
Company’sCompany's liquidity positions to remain satisfactory during
2012,2015, it is possible that our deposit
growthbalances for
20122015 may not be maintained at previous levels due to pricing pressure or, in order to generate deposit growth, our pricing may need to be adjusted in a manner that results in increased interest expense on deposits.
OFF-BALANCE-SHEET ARRANGEMENTS
OFF-BALANCE-SHEET-ARRANGEMENTS
Information regarding Off-Balance-Sheet Arrangements is included in Note 2019 and Note 2120 of theNotes to Consolidated Financial Statements in Item 8 below.below.
The following table presents a summary of significant contractual obligations extending beyond one year as of December 31,
20112014 and maturing as indicated:
Future Contractual Obligations
As of December 31,
2011:(2014:
|
| | | | | | | | | | | | | | | | | | | | |
| (in thousands) | | Less than 1 Year | | 1 to 3 Years | | 3 to 5 Years | | More than 5 Years | | Total |
| Deposits (1) | | $ | 15,700,465 |
| | $ | 938,537 |
| | $ | 211,675 |
| | $ | 41,422 |
| | $ | 16,892,099 |
|
| Term debt | | 265,000 |
| | 680,016 |
| | 50,000 |
| | 5,646 |
| | 1,000,662 |
|
| Junior subordinated debentures (2) | | — |
| | — |
| | — |
| | 475,427 |
| | 475,427 |
|
| Operating leases | | 33,344 |
| | 53,585 |
| | 39,454 |
| | 57,720 |
| | 184,103 |
|
| Other long-term liabilities (3) | | 3,631 |
| | 7,398 |
| | 8,124 |
| | 57,910 |
| | 77,063 |
|
| Total contractual obligations | | $ | 16,002,440 |
| | $ | 1,679,536 |
| | $ | 309,253 |
| | $ | 638,125 |
| | $ | 18,629,354 |
|
(1) Deposits with indeterminate maturities, such as demand, savings and money market accounts, are reflected as obligations due in
thousands) | | | | | | | | | | | | | | | | | | | | |
| | | Less than 1
Year | | | 1 to 3
Years | | | 3 to 5
Years | | | More
than 5
Years | | | Total | |
Deposits (1) | | $ | 8,544,824 | | | $ | 514,983 | | | $ | 174,178 | | | $ | 2,705 | | | $ | 9,236,690 | |
Term debt | | | — | | | | — | | | | 190,016 | | | | 55,519 | | | | 245,535 | |
Junior subordinated debentures(2) | | | — | | | | — | | | | — | | | | 230,061 | | | | 230,061 | |
Operating leases | | | 15,695 | | | | 25,300 | | | | 17,726 | | | | 21,386 | | | | 80,107 | |
Other long-term liabilities(3) | | | 1,933 | | | | 3,359 | | | | 3,196 | | | | 34,112 | | | | 42,600 | |
| | | | |
Total contractual obligations | | $ | 8,562,452 | | | $ | 543,642 | | | $ | 385,116 | | | $ | 343,783 | | | $ | 9,834,993 | |
| | | | |
(1) | Deposits with indeterminate maturities, such as demand, savings and money market accounts, are reflected as obligations due in less than one year. |
(2) | Represents the issued amount of all junior subordinated debentures. |
(3) | Includes maximum payments related to employee benefit plans, assuming all future vesting conditions are met. Additional information about employee benefit plans is provided in Note 19 of theNotes to Consolidated Financial Statements in Item 8 below. |
Umpqua Holdings Corporation
less than one year.
(2) Represents the issued amount of all junior subordinated debentures.
(3) Includes maximum payments related to employee benefit plans, assuming all future vesting conditions are met. Additional information about employee benefit plans is provided in Note 18 of the Notes to Consolidated Financial Statements in Item 8 below.
The table above does not include interest payments or purchase accounting adjustments related to deposits, term debt or junior subordinated debentures.
As of December 31,
2011,2014, the Company has a liability for unrecognized tax benefits
relating to California tax incentives and temporary differences in the amount of
$717,000,$3.1 million, which includes accrued interest of
$167,000.$399,000. As the Company is not able to estimate the period in which this liability will be paid in the future, this amount is not included in the future contractual obligations table above.
CONCENTRATIONS OF CREDIT RISK
Information regarding Concentrations of Credit Risk is included in NotesNote 3, 5, and 2019 of theNotes to Consolidated Financial Statements.Statements in Item 8 below.
CAPITAL RESOURCES
Shareholders’
Shareholders' equity at December 31, 20112014 was $1.7$3.8 billion, an increase of $29.8 million, or 2%,$2.1 billion from December 31, 2010.2013. The increase in shareholders’shareholders' equity during 2011the year ended was principally due to shares issued in connection with the Sterling merger, net income of $74.5$147.5 million, comprehensive gain, net of tax, of $17.0 million offset by stock repurchases of $29.8 million and common stock dividends declared of $27.5 million.$115.8 million. The Federal Reserve Board has in place guidelines for risk-based capital requirements applicable to U.S. banks and bank/financial holding companies. These risk-based capital guidelines take into consideration risk factors, as defined by regulation, associated with various categories of assets, both on and off-balance sheet. Under the guidelines, capital strength is measured in two tiers, which are used in conjunction with risk-adjusted assets to determine the risk-based capital ratios. The guidelines require an 8% total risk-based capital ratio, of which 4% must be Tier
I1 capital. Our consolidated Tier
I1 capital, which consists of
shareholders’shareholders' equity and qualifying trust-preferred securities, less other comprehensive income, goodwill, other intangible assets, disallowed servicing assets and disallowed deferred tax assets, totaled
$1.2$2.3 billion at December 31,
2011.2014. Tier
II2 capital components include all, or a portion of, the allowance for loan and lease losses and the portion of trust preferred securities in excess of Tier
I1 statutory limits. The total of Tier
I1 capital plus Tier
II2 capital components is referred to as Total Risk-Based Capital, and was
$1.3$2.4 billion at December 31,
2011.2014. The percentage ratios, as calculated under the guidelines, were
15.91%14.44% and
17.16%15.20% for Tier
I1 and Total Risk-Based Capital, respectively, at December 31,
2011.2014. The Tier 1 and Total Risk-Based Capital ratios at December 31,
20102013 were
16.36%13.56% and
17.62%14.66%, respectively.
A minimum leverage ratio is required in addition to the risk-based capital standards and is defined as period-end
shareholders’shareholders' equity and qualifying trust preferred securities, less other comprehensive income, goodwill and deposit-based intangibles, divided by average assets as adjusted for goodwill and other intangible assets. Although a minimum leverage ratio of 4% is required for the highest-rated financial holding companies that are not undertaking significant expansion programs, the Federal Reserve Board may require a financial holding company to maintain a leverage ratio greater than 4% if it is experiencing or anticipating significant growth or is operating with less than well-diversified risks in the opinion of the Federal Reserve Board. The Federal Reserve Board uses the leverage and risk-based capital ratios to assess capital adequacy of banks and financial holding companies. Our consolidated leverage ratios at December 31,
20112014 and
20102013 were
10.91%10.99% and
10.56%10.90%, respectively. As of December 31,
2011,2014, the most recent notification from the FDIC categorized the Bank as
“well-capitalized”"well-capitalized" under the regulatory framework for prompt corrective action. There are no conditions or events since that notification that management believes have changed the
Bank’sBank's regulatory capital category.
On July 2, 2013, the federal banking regulators approved the final proposed rules that revise the regulatory capital rules to incorporate certain revisions by the Basel Committee on Banking Supervision to the Basel capital framework ("Basel III"). The phase-in period for the final rules will begin for the Company on January 1, 2015, with full compliance with the final rules entire requirement phased in on January 1, 2019.
The final rules, among other things, include a new common equity Tier 1 capital ("CET1") to risk-weighted assets ratio, including a capital conservation buffer, which will gradually increase from 4.5% on January 1, 2015 to 7.0% on January 1, 2019. The final rules also raise the minimum ratio of Tier 1 capital to risk-weighted assets from 4.0% to 6.0% on January 1, 2015 to 8.5% on January 1, 2019, as well as require a minimum leverage ratio of 4.0%.
Also, under the final rules, if an institution grows above $15 billion as a result of an acquisition, or organically grows above $15 billion and then makes an acquisition, the combined trust preferred security debt issuances would be phased out of Tier 1 and into Tier 2 capital (75% in 2015 and 100% in 2016). It is possible the Company may accelerate redemption of the existing junior subordinated debentures. This could result in adjustments to the fair value of these instruments including the acceleration of losses on junior subordinated debentures carried at fair value within non-interest income. The Company currently does not intend to redeem the junior subordinated debentures in order to support regulatory total capital levels.
The final rules also provide for a number of adjustments to and deductions from the new CET1. Under current capital standards, the effects of accumulated other comprehensive income items included in capital are excluded for the purposes of determining regulatory capital ratios. Under Basel III, the effects of certain accumulated other comprehensive items are not excluded; however, non-advanced approaches banking organizations, including the Company and the Bank, may make a one-time permanent election to continue to exclude these items. The Company and Bank expect to make this election in order to avoid significant variations in the level of capital depending upon the impact of interest rate fluctuations on the fair value of the Company's securities portfolio. In addition, deductions include, for example, the requirement that mortgage servicing rights, certain deferred tax assets not dependent upon future taxable income and significant investments in non-consolidated financial entities be deducted from CET1 to the extent that any one such category exceeds 10% of CET1 or all such categories in the aggregate exceed 15% of CET1. The Company and the Bank are currently evaluating the provisions of the final rules and expected impact.
During the year ended December 31, 2011,2014, the Company made no contributions to the Bank. At December 31, 2011,2014, all three of the capital ratios of the Bank exceeded the minimum ratios required by federal regulation. Management monitors these ratios on a regular basis to ensure that the Bank remains within regulatory guidelines. Further information regarding the actual and required capital ratios is provided in Note 23 of theNotes to Consolidated Financial Statements in Item 8 below.On February 3, 2010, the Company raised $303.6 million through a public offering by issuing 8,625,000 shares of the Company’s common stock, including 1,125,000 shares pursuant to the underwriters’ over-allotment option, at a share price of $11.00 per share and 18,975,000 depository shares, including 2,475,000 depository shares pursuant to the underwriter’s over-allotment option, also at a price of $11.00 per share. Fractional interests (1/100th) in each share of the Series B Common Stock
Equivalent were represented by the 18,975,000 depositary shares; as a result, each depositary share would convert into one share of common stock. The net proceeds to the Company after deducting underwriting discounts and commissions and offering expenses were $288.1 million. The net proceeds from the offering were used to redeem the preferred stock issued to the United States Department of the Treasury (“U.S. Treasury”) under the Troubled Asset Relief Program (“TARP”) Capital Purchase Program (“CPP”), to fund FDIC-assisted acquisition opportunities and for general corporate purposes.
On February 17, 2010, the Company redeemed all of the outstanding Fixed Rate Cumulative Perpetual Preferred Stock, Series A, issued to the U.S. Treasury under the TARP CPP for an aggregate purchase price of $214.2 million. As a result of the repurchase of the Series A preferred stock, the Company incurred a one-time deemed dividend of $9.7 million due to the accelerated amortization of the remaining issuance discount on the preferred stock.
On March 31, 2010, the Company repurchased the common stock warrant issued to the U.S. Treasury pursuant to the TARP CPP, for $4.5 million. The warrant repurchase, together with the Company’s redemption in February 2010 of the entire amount of Fixed Rate Cumulative Perpetual Preferred Stock, Series A, issued to the U.S. Treasury, represents full repayment of all TARP obligations and cancellation of all equity interests in the Company held by the U.S. Treasury.
On April 20, 2010, shareholders of the Company approved an amendment to the Company’s Restated Articles of Incorporation. The amendment, which became effective on April 21, 2010, increased the number of authorized shares of common stock to 200,000,000 (from 100,000,000). As a result of the effectiveness of the amendment, as of the close of business on April 21, 2010, the Company’s Series B Common Stock Equivalent preferred stock automatically converted into newly issued shares of common stock at a conversion rate of 100 shares of common stock for each share of Series B Common Stock Equivalent preferred stock. All shares of Series B Common Stock Equivalent preferred stock and representative depositary shares ceased to exist upon the conversion. Trading in the depositary shares on NASDAQ (ticker symbol “UMPQP”) ceased and the UMPQP symbol voluntarily delisted effective as of the close of business on April 21, 2010.
During
2011, Umpqua’s2014, Umpqua's Board of Directors
declaredapproved a
quarterly cash dividend of
$0.05 per common share for$0.15 in each of the
first and second quarters and $0.07 per common share for the third and fourthfour quarters. These dividends were made pursuant to our existing dividend policy and in consideration of, among other things, earnings, regulatory capital levels, the overall payout ratio and expected asset growth. We expect that the dividend rate will be reassessed on a quarterly basis by the Board of Directors in accordance with the dividend policy.
The payment of cash dividends is subject to regulatory limitations as described under theSupervision and Regulationsection of Part I of this report.There is no assurance that future cash dividends on common shares will be declared or increased. The following table presents cash dividends declared and dividend payout ratios (dividends declared per common share divided by basic earnings per common share) for the years ended December 31, 2011, 20102014, 2013 and 2009:2012:
Cash Dividends and Payout Ratios per Common Share
| | | | | | | | | | | | |
| | | 2011 | | | 2010 | | | 2009 | |
Dividend declared per common share | | $ | 0.24 | | | $ | 0.20 | | | $ | 0.20 | |
Dividend payout ratio | | | 37% | | | | 133% | | | | -8% | |
|
| | | | | | | | | | | |
| | 2014 | | 2013 | | 2012 |
| Dividend declared per common share | $ | 0.60 |
| | $ | 0.60 |
| | $ | 0.34 |
|
| Dividend payout ratio | 76 | % | | 69 | % | | 38 | % |
The Company’sCompany's share repurchase plan, which was first approved by the Board and announced in August 2003, was amended on September 29, 2011 to increase the number of common shares available for repurchase under the plan to 15 million shares. TheIn April 2013, the repurchase program willwas extended to run through June 2013.2015. As of December 31, 2011,2014, a total of 12.612.0 million shares remained available for repurchase. The Company repurchased 2.5 millionno shares under the repurchase plan in 2011.2014. The timing and amount of future repurchases will depend upon the market price for our common stock, securities laws restricting repurchases, asset growth, earnings, and our capital plan. In addition, our stock plans provide that option and award holders may pay for the exercise price and tax withholdings in part or whole by tendering previously held shares.Umpqua Holdings Corporation
ITEM 7A.QUANTITATIVE AND QUALITATIVEQUALITIATIVE DISCLOSURES ABOUT MARKET RISK Our market risk arises primarily from credit risk and interest rate risk inherent in our investment, lending and financing activities. To manage our credit risk, we rely on various controls, including our underwriting standards and loan policies, internal loan monitoring and periodic credit reviews as well as our allowance of loan and lease losses
(“ALLL”("ALLL") methodology, all of which are administered by the
Bank’sBank's Credit Quality Group or ALLL Committee. Additionally, the
Bank’s LoanCompany's Enterprise Risk and
InvestmentCredit Committee provides board oversight over the
Company’sCompany's loan
portfolio risk management functions, the Company's Finance and
Capital Committee provides board oversight over the Company's investment portfolio
and hedging risk management functions, and the
Bank’sBank's Audit and Compliance Committee provides board oversight of the ALLL process and reviews and approves the ALLL methodology.
Interest rate risk is the potential for loss resulting from adverse changes in the level of interest rates on the
Company’sCompany's net interest income. The absolute level and volatility of interest rates can have a significant impact on our profitability. The objective of interest rate risk management is to identify and manage the sensitivity of net interest income to changing interest rates to achieve our overall financial objectives. Based on economic conditions, asset quality and various other considerations, management establishes tolerance ranges for interest rate sensitivity and manages within these ranges. Net interest income and the fair value of financial instruments are greatly influenced by changes in the level of interest rates. We manage exposure to fluctuations in interest rates through policies that are established by the Asset/Liability Management Committee
(“ALCO”("ALCO"). The ALCO meets monthly and has responsibility for developing asset/liability management policy, formulating and implementing strategies to improve balance sheet positioning and earnings and reviewing interest rate sensitivity. The Board of
Directors’ LoanDirectors' Finance and
InvestmentCapital Committee provides oversight of the asset/liability management process, reviews the results of the interest rate risk analyses prepared for the ALCO and approves the asset/liability policy on an annual basis.
We measure our interest rate risk position on at least a quarterly basis using three methods: (i) gap analysis, (ii) net interest income simulation; and
(ii)(iii) economic value of equity (fair value of financial instruments) modeling. The results of these analyses are reviewed by ALCO and the
LoanFinance and
InvestmentCapital Committee quarterly. If hypothetical changes to interest rates cause changes to our simulated net interest income simulation or economic value of equity modeling outside of our pre-established internal limits, we may adjust
ourthe asset and liability size or mix in
ouran effort to bring our interest rate risk exposure within our established limits.
A gap analysis provides information about the volume and repricing characteristics and relationship between the amounts of interest-sensitive assets and interest-bearing liabilities at a particular point in time. An effective interest rate strategy attempts to match
how the volume of interest sensitive assets and interest bearing liabilities respond to changes in interest rates within an acceptable timeframe, thereby minimizing the impact of interest rate changes on net interest income.
InterestGap analysis measures interest rate sensitivity
is measuredat a point in time as the difference between the
estimated volumes of
assetsasset and
liabilities at a point in time that are subject toliability cash flows or repricing
atcharacteristics across various time horizons: immediate to three months, four to twelve months, one to five years, over five years, and on a cumulative basis. The differences are known as interest sensitivity gaps. The main focus of this interest rate management tool is the gap sensitivity identified as the cumulative one year gap. The table below sets forth interest sensitivity gaps for these different intervals as of December 31,
2011.2014.
Interest Sensitivity Gap
December 31, 2011
(in thousands)
| | | | | | | | | | | | | | | | | | | | | | | | |
| | | By Repricing Interval | | | | | | | |
| | 0-3 Months | | | 4-12
Months | | | 1-5 Years | | | Over 5
Years | | | Non-Rate- Sensitive | | | Total | |
ASSETS | | | | | | | | | | | | | | | | | | | | | | | | |
Interest bearing deposits | | $ | 445,954 | | | $ | — | | | $ | — | | | $ | — | | | $ | — | | | $ | 445,954 | |
Temporary Investments | | | 547 | | | | — | | | | — | | | | — | | | | — | | | | 547 | |
Trading account assets | | | 2,309 | | | | — | | | | — | | | | — | | | | — | | | | 2,309 | |
Securities held to maturity | | | 332,435 | | | | 843,002 | | | | 1,578,389 | | | | 254,941 | | | | 159,811 | | | | 3,168,578 | |
Securities available for sale | | | 1,304 | | | | 177 | | | | 908 | | | | 2,906 | | | | (581 | ) | | | 4,714 | |
Loans held for sale | | | 1,642 | | | | 5,927 | | | | 26,979 | | | | 64,143 | | | | — | | | | 98,691 | |
Non-covered loans and leases | | | 2,019,503 | | | | 1,104,417 | | | | 2,537,232 | | | | 142,991 | | | | 83,955 | | | | 5,888,098 | |
Covered loans and leases | | | 140,916 | | | | 170,263 | | | | 313,985 | | | | 20,737 | | | | (23,450 | ) | | | 622,451 | |
Non-interest earning assets | | | — | | | | — | | | | — | | | | — | | | | 1,332,013 | | | | 1,332,013 | |
| | | | |
Total assets | | | 2,944,610 | | | | 2,123,786 | | | | 4,457,493 | | | | 485,718 | | | | 1,551,748 | | | $ | 11,563,355 | |
| | | | | | | | | | | | | | | | | | | | | | | | |
| | | | | | |
LIABILITIES AND SHAREHOLDERS’ EQUITY | | | | | | | | | | | | | | | | | | | | | | | | |
Interest bearing demand deposits | | | 993,579 | | | | — | | | | — | | | | — | | | | — | | | $ | 993,579 | |
Savings and money market deposits | | | 4,048,313 | | | | — | | | | — | | | | — | | | | — | | | | 4,048,313 | |
Time deposits | | | 626,157 | | | | 962,967 | | | | 689,848 | | | | 2,705 | | | | — | | | | 2,281,677 | |
Securities sold under agreements to repurchase | | | 124,605 | | | | — | | | | — | | | | — | | | | — | | | | 124,605 | |
Term debt | | | 9 | | | | 26 | | | | 190,154 | | | | 55,346 | | | | 10,141 | | | | 255,676 | |
Junior subordinated debentures, at fair value | | | 134,024 | | | | | | | | | | | | | | | | (51,119 | ) | | | 82,905 | |
Junior subordinated debentures, at amortized cost | | | 85,572 | | | | — | | | | — | | | | 10,465 | | | | 6,507 | | | | 102,544 | |
Non-interest bearing liabilities and shareholders’ equity | | | — | | | | — | | | | — | | | | — | | | | 3,674,056 | | | | 3,674,056 | |
| | | | |
Total liabilities and shareholders’ equity | | | 6,012,259 | | | | 962,993 | | | | 880,002 | | | | 68,516 | | | | 3,639,585 | | | $ | 11,563,355 | |
| | | | | | | | |
Interest rate sensitivity gap | | | (3,067,649 | ) | | | 1,160,793 | | | | 3,577,491 | | | | 417,202 | | | | (2,087,837 | ) | | | | |
Cumulative interest rate sensitivity gap | | $ | (3,067,649 | ) | | $ | (1,906,856 | ) | | $ | 1,670,635 | | | $ | 2,087,837 | | | $ | — | | | | | |
| | | | | | | | |
Cumulative gap as a % of earning assets | | | -30.0% | | | | -18.6% | | | | 16.3% | | | | 20.4% | | | | | | | | | |
| | | | | | | | | | | | |
Umpqua Holdings Corporation
|
| | | | | | | | | | | | | | | | | | | |
| (in thousands) | By Estimated Cash Flow or Repricing Interval | | | |
| | 0-3 | 4-12 | 1-5 | Over 5 | Non-Rate- | | |
| | Months | Months | Years | Years | Sensitive | | Total |
| ASSETS | | | | | | | |
| Interest bearing deposits | $ | 1,322,214 |
| $ | — |
| $ | — |
| $ | — |
| $ | — |
| | $ | 1,322,214 |
|
| Temporary investments | 502 |
| — |
| — |
| — |
| — |
| | 502 |
|
| Trading account assets | 9,999 |
| — |
| — |
| — |
| — |
| | 9,999 |
|
| Securities held to maturity | 2,155 |
| 174 |
| 214 |
| 5,655 |
| (2,987 | ) | | 5,211 |
|
| Securities available for sale | 162,564 |
| 404,324 |
| 1,156,329 |
| 478,838 |
| 96,500 |
| | 2,298,555 |
|
| Loans held for sale | 274,176 |
| 69 |
| — |
| — |
| 12,557 |
| | 286,802 |
|
| Loans and leases | 4,538,582 |
| 2,077,013 |
| 7,219,512 |
| 1,569,155 |
| (76,530 | ) | | 15,327,732 |
|
| Non-interest earning assets | — |
| — |
| — |
| — |
| 3,362,259 |
| | 3,362,259 |
|
| Total assets | 6,310,192 |
| 2,481,580 |
| 8,376,055 |
| 2,053,648 |
| 3,391,799 |
| | $ | 22,613,274 |
|
| | | | | | | | |
| LIABILITIES AND SHAREHOLDERS' EQUITY | | | |
| Interest bearing demand deposits | $ | 2,054,994 |
| $ | — |
| $ | — |
| $ | — |
| $ | — |
| | $ | 2,054,994 |
|
| Money market deposits | 6,113,138 |
| — |
| — |
| — |
| — |
| | 6,113,138 |
|
| Savings deposits | 971,185 |
| — |
| — |
| — |
| — |
| | 971,185 |
|
| Time deposits | 631,332 |
| 1,215,403 |
| 1,127,410 |
| 33,833 |
| — |
| | 3,007,978 |
|
| Securities sold under agreements to repurchase | 313,321 |
| — |
| — |
| — |
| — |
| | 313,321 |
|
| Term debt | 40,009 |
| 225,029 |
| 730,171 |
| 5,453 |
| 5,733 |
| | 1,006,395 |
|
| Junior subordinated debentures, at fair value | 379,390 |
| | | | (130,096 | ) | | 249,294 |
|
| Junior subordinated debentures, at amortized cost | 85,572 |
| — |
| — |
| 10,465 |
| 5,539 |
| | 101,576 |
|
| Non-interest bearing liabilities and shareholders' equity | — |
| — |
| — |
| — |
| 8,795,393 |
| | 8,795,393 |
|
| Total liabilities and shareholders' equity | 10,588,941 |
| 1,440,432 |
| 1,857,581 |
| 49,751 |
| 8,676,569 |
| | 22,613,274 |
|
| | | | | | | | |
| Interest rate sensitivity gap | (4,278,749 | ) | 1,041,148 |
| 6,518,474 |
| 2,003,897 |
| (5,284,770 | ) | | |
| Cumulative interest rate sensitivity gap | $ | (4,278,749 | ) | $ | (3,237,601 | ) | $ | 3,280,873 |
| $ | 5,284,770 |
| $ | — |
| | |
| Cumulative gap as a % of earning assets | (22 | )% | (17 | )% | 17 | % | 27 | % | | | |
The gap table has inherent limitations and actual results may vary significantly from the results suggested by the gap table. The gap table is unable to incorporate certain balance sheet characteristics or factors. The gap table assumes a static balance sheet and looks at the repricing of existing assets and liabilities without consideration of new loans and deposits that reflect a more current interest rate environment. Changes in the mix of earning assets or supporting liabilities can either increase or decrease the net interest margin without affecting interest rate sensitivity. In addition, the interest rate spread between an asset and its supporting liability can vary significantly, while the timing of repricing for both the asset and the liability remains the same, thus impacting net interest income. This characteristic is referred to as basis risk and generally relates to the possibility that the repricing characteristics of short-term assets tied to the prime rate are different from those of short-term funding sources such as certificates of deposit. Varying interest rate environments can create unexpected changes in prepayment levels of assets and liabilities that are not reflected in the interest rate sensitivity analysis. These prepayments may have a significant impact on our net interest margin.
For example, unlike the net interest income simulation, the interest rate risk profile of certain deposit products and floating rate loans that have reached their floors cannot be captured effectively in a gap table. Although the table shows the amount of certain assets and liabilities scheduled to reprice in a given time frame, it does not reflect when or to what extent such repricings may actually occur. For example, interest-bearing checking, money market and savings deposits are shown to reprice in the first
3three months, but we may choose to reprice these deposits more slowly and incorporate only a portion of the movement in market rates based on market conditions at that time. Alternatively, a loan which has reached its floor may not reprice
upwards even though market interest rates
changeincrease causing such loan to act like a fixed rate loan regardless of its scheduled repricing date. The gap table as presented cannot factor in the flexibility we believe we have in repricing deposits or the floors on our loans.
Because of these factors, an interest sensitivity gap analysis may not provide an accurate
or complete assessment of our exposure to changes in interest rates. We believe the estimated effect of a change in interest rates is better reflected in our net interest income and
marketeconomic value of equity simulations.
Net Interest Income Simulation
Interest rate sensitivity is a function of the repricing characteristics of our interest earnings assets and interest bearing liabilities. These repricing characteristics are the time frames within which the interest bearing assets and liabilities are subject to change in interest rates either at replacement, repricing or maturity during the life of the instruments. Interest rate sensitivity management focuses on the maturity structure of assets and liabilities and their repricing characteristics during periods of changes in market interest rates.
Management utilizes an interest rate simulation model to estimate the sensitivity of net interest income to changes in market interest rates. This model is an interest rate risk management tool and the results are not necessarily an indication of our future net interest income. This model has inherent limitations and these results are based on a given set of rate changes and assumptions at one point in time. These estimates are based upon a number of assumptions for each scenario, including changes in the size or mix of the balance sheet, new volume rates for new balances, the rate of prepayments, and the correlation of pricing to changes in the interest rate environment. For example, for interest bearing deposit balances we may choose to reprice these balances more slowly and incorporate only a portion of the movement in market rates based on market conditions at that time.
Additionally, ourOur primary analysis assumes a static balance sheet, both in terms of the total size and mix of our balance sheet, meaning cash flows from the maturity or repricing of assets and liabilities are redeployed in the same instrument at modeled rates.
Additionally, our analysis assumes no lag in the change in the cost of funding sources relative to the change in market interest rates.
Changes that could vary significantly from our assumptions include loan and deposit growth or contraction, changes in the mix of our earning assets or funding sources, the performance of
covered loans accounted for under the expected cash flow method, and future asset/liability management decisions, all of which may have significant effects on our net interest income. Also, some of the assumptions made in the simulation model may not materialize and unanticipated events and circumstances
willmay occur. In addition, the simulation model does not take into account any future actions management could undertake to mitigate the impact of interest rate changes or the impact a change in interest rates may have on our credit risk profile, loan prepayment estimates and spread relationships, which can change regularly. Actions we could undertake include, but are not limited to, growing or contracting the balance sheet, changing the composition of the balance sheet, or changing our pricing strategies for loans or deposits.
The estimated impact on our net interest income over a time horizon of one year as of December 31,
2011 is2014, 2013, and 2012 are indicated in the table below. For the scenarios shown, the interest rate simulation assumes a parallel and sustained shift in market interest rates ratably over a twelve-month period and no change in the composition or size of the balance sheet. For example, the
“up"up 200 basis
points”points" scenario is based on a theoretical increase in market rates of 16.7 basis points per month for twelve months applied to the balance sheet of December 31 for each respective year.
Interest Rate Simulation Impact on Net Interest Income
As of December 31,
(dollars in thousands)
| | | | | | | | | | | | | | | | | | | | | | | | |
| | | 2011 | | | 2010 | | | 2009 | |
| | | Increase (Decrease) in Net Interest Income from Base Scenario | | | Percentage Change | | | Increase (Decrease) in Net Interest Income from Base Scenario | | | Percentage Change | | | Decrease in Net Interest Income from Base Scenario | | | Percentage Change | |
Up 300 basis points | | $ | 6,383 | | | | 1.6% | | | $ | 7,495 | | | | 2.0% | | | $ | (1,203 | ) | | | -0.4% | |
Up 200 basis points | | $ | 5,031 | | | | 1.3% | | | $ | 9,115 | | | | 2.4% | | | $ | (2,118 | ) | | | -0.6% | |
Up 100 basis points | | $ | 2,021 | | | | 0.5% | | | $ | 6,464 | | | | 1.7% | | | $ | (3,033 | ) | | | -0.9% | |
Down 100 basis points | | $ | (6,153 | ) | | | -1.5% | | | $ | (12,478 | ) | | | -3.3% | | | $ | (290 | ) | | | -0.1% | |
Down 200 basis points | | $ | (15,460 | ) | | | -3.9% | | | $ | (21,512 | ) | | | -5.7% | | | $ | (7,609 | ) | | | -2.2% | |
Down 300 basis points | | $ | (24,236 | ) | | | -6.1% | | | $ | (30,172 | ) | | | -8.0% | | | $ | (14,928 | ) | | | -4.4% | |
|
| | | | | | | | | |
| | | 2014 | | 2013 | | 2012 |
| Up 300 basis points | | 0.3 | % | | 0.8 | % | | 3.0 | % |
| Up 200 basis points | | 0.5 | % | | 0.8 | % | | 3.1 | % |
| Up 100 basis points | | 0.5 | % | | 0.6 | % | | 2.1 | % |
| Down 100 basis points | | (2.4 | )% | | (2.9 | )% | | (3.2 | )% |
| Down 200 basis points | | (5.2 | )% | | (6.8 | )% | | (5.6 | )% |
| Down 300 basis points | | (7.3 | )% | | (10.1 | )% | | (7.9 | )% |
Asset sensitivity indicates that in a rising interest rate environment a Company’sthe Company's net interest margin would increase and in decreasing interest rate environment a Company’sCompany's net interest margin would decrease. Liability sensitivity indicates that in a rising interest rate environment a Company’sCompany's net interest margin would decrease and in a decreasing interest rate environment a Company’sCompany's net interest margin would increase. For both December 31, 2011 and December 31, 2010,all years presented, we were “asset-sensitive” in both increased and decreased"asset-sensitive" meaning we expect our net interest income to increase as market interest rate scenarios, although therates increase. The relative level of asset sensitivity in 2011 declinedas of December 31, 2014 has decreased from the prior year. Atperiods presented as a result of the changes in composition of the balance sheet. In the decreasing interest rate environments we show a decline in net interest income as interest bearing assets re-price lower and deposits remain at or near their floors. It should be noted that although net interest income simulation results are presented through the down 300 basis points interest rate environments, we do not believe the down 200 and 300 basis point scenarios are plausible given the current level of interest rates.
Interest rate sensitivity in the first year of the net interest income simulation for increasing interest rate scenarios is negatively impacted by the cost of non-maturity deposit repricing immediately while interest earnings assets (primarily the loan and leases held for investment portfolio) reprice at a slower rate based upon the instrument level repricing characteristics (refer to the Interest Sensitivity Gap table above). As a result, interest sensitivity in increasing interest rates scenarios improves in subsequent years as these assets reprice. Management also prepares and reviews the longer term trends of the net interest income simulation to measure and monitor risk. This analysis assume the same rate shift over the first year of the scenario as described above, and holding steady thereafter. The estimated impact on our net interest income over the first and second year time horizons as it relates to our balance sheet as of December 31,
2009, we were “liability-sensitive”2014 is indicated in
an increased market interest rate scenario, and “asset-sensitive” in a decreased market interest rate scenario.the table below.
Interest Rate Simulation Impact on Net Interest Income
As of December 31, 2014
|
| | | | | | |
| | | Year 1 | | Year 2 |
| Up 300 basis points | | 0.3 | % | | 1.4 | % |
| Up 200 basis points | | 0.5 | % | | 1.5 | % |
| Up 100 basis points | | 0.5 | % | | 1.1 | % |
| Down 100 basis points | | (2.4 | )% | | (7.0 | )% |
| Down 200 basis points | | (5.2 | )% | | (15.5 | )% |
| Down 300 basis points | | (7.3 | )% | | (20.6 | )% |
In general, we view the net interest income model results as more relevant to the
Company’sCompany's current operating profile (a going concern), and we primarily manage our balance sheet based on this information.
Another interest rate sensitivity measure we utilize is the quantification of
marketeconomic value changes for all financial assets and liabilities, given an increase or decrease in market interest rates. This approach provides a longer-term view of interest rate risk, capturing all future expected cash flows. Assets and liabilities with option characteristics are measured based on different interest rate path valuations using statistical rate simulation techniques. The projections are by their nature forward-looking and therefore inherently uncertain, and include various assumptions regarding cash flows and discount rates.
Umpqua Holdings Corporation
The table below illustrates the effects of various instantaneous market interest rate changes on the fair values of financial assets and liabilities (excluding mortgage servicing rights) as compared to the corresponding carrying values and fair values:
Interest Rate Simulation Impact on Fair Value of Financial Assets and Liabilities
As of December 31,
(dollars in thousands)
| | | | | | | | | | | | | | | | |
| | | 2011 | | | 2010 | |
| | | Decrease
in Estimated Fair Value of Equity | | | Percentage Change | | | Increase (Decrease)
in Estimated Fair Value of Equity | | | Percentage Change | |
Up 300 basis points | | $ | (115,995 | ) | | | -6.0% | | | $ | (214,740 | ) | | | -9.3% | |
Up 200 basis points | | $ | (48,051 | ) | | | -2.5% | | | $ | (114,667 | ) | | | -5.0% | |
Up 100 basis points | | $ | (14,229 | ) | | | -0.7% | | | $ | (59,857 | ) | | | -2.6% | |
Down 100 basis points | | $ | (17,857 | ) | | | 0.0% | | | $ | (55,141 | ) | | | -2.4% | |
Down 200 basis points | | $ | 24,283 | | | | 1.3% | | | $ | (126,830 | ) | | | -5.5% | |
Down 300 basis points | | $ | 160,635 | | | | 8.3% | | | $ | (179,198 | ) | | | -7.8% | |
|
| | | | | | |
| | | 2014 | | 2013 |
| Up 300 basis points | | (4.8 | )% | | 1.3 | % |
| Up 200 basis points | | (2.2 | )% | | 1.1 | % |
| Up 100 basis points | | (0.4 | )% | | 0.6 | % |
| Down 100 basis points | | 7.8 | % | | 0.4 | % |
| Down 200 basis points | | 7.1 | % | | 1.8 | % |
| Down 300 basis points | | 6.6 | % | | 3.5 | % |
As of December 31,
2011,2014, our economic value of equity model indicates a liability sensitive
profile, suggestingprofile. This suggests a sudden or sustained increase in
market interest rates would result in a decrease in our estimated
marketeconomic value of equity.
Consistent with the results in the interest rate simulation impact on net interest income, ourOur overall sensitivity to market interest rate changes as of December 31,
20112014 has
decreasedincreased as compared to December 31,
2010.2013. As of December 31,
2011,2014, our estimated economic value of equity (fair value of financial assets and liabilities) exceeded our book value of equity. This result is primarily based on the
significant value placed on the
Company’sCompany's significant amount of noninterest bearing and low
cost interest bearing deposits and fixed rates or floors characteristics included in the
Company’sCompany's loan portfolio. While noninterest bearing deposits do not impact the net interest income simulation, the value of these deposits
havehas a significant impact on the economic value of equity model, particularly when market rates are assumed to rise.
IMPACT OF INFLATION AND CHANGING PRICES
A financial
institution’sinstitution's asset and liability structure is substantially different from that of an industrial firm in that primarily all assets and liabilities of a bank are monetary in nature, with relatively little investment in fixed assets or inventories. Inflation has an important impact on the growth of total assets and the resulting need to increase equity capital at higher than normal rates in order to maintain appropriate capital ratios. We believe that the impact of inflation on financial results depends on
management’smanagement's ability to react to changes in interest rates and, by such reaction, reduce the inflationary impact on performance. We have an asset/liability management program which attempts to manage interest rate sensitivity. In addition, periodic reviews of banking services and products are conducted to adjust pricing in view of current and expected costs.
Our financial statements included in Item 8 below have been prepared in accordance with accounting principles generally accepted in the United States, which requires us to measure financial position and operating results principally in terms of historic dollars. Changes in the relative value of money due to inflation or recession are generally not considered. The primary effect of inflation on our results of operations is through increased operating costs, such as compensation, occupancy and business development expenses. In
management’smanagement's opinion, changes in interest rates affect the financial condition of a financial institution to a far greater degree than changes in the rate of inflation. Although interest rates are greatly influenced by changes in the inflation rate, they do not necessarily change at the same rate or in the same magnitude as the inflation rate. Interest rates are highly sensitive to many factors that are beyond our control, including U.S. fiscal and monetary policy and general national and global economic conditions.
ITEM 8. FINANCIAL STATEMENTS AND SUPPLEMENTARY
DATA.Report of Independent Registered Public Accounting Firm
DATA
REPORT OF INDEPENDENT REGISTERED PUBLIC ACCOUNTING FIRM
To the Board of Directors and Shareholders
Umpqua Holdings Corporation and Subsidiaries
We have audited the accompanying consolidated balance sheets of Umpqua Holdings Corporation and Subsidiaries (the Company) as of December 31, 20112014 and 2010,2013, and the related consolidated statements of operations,income, comprehensive income, changes in shareholders’shareholders' equity, comprehensive income (loss), and cash flows for each of the three years in the three-year period ended December 31, 2011.2014. We also have audited the Company’sCompany's internal control over financial reporting as of December 31, 2011,2014, based on criteria established in Internal Control—Control - Integrated Framework (2013) issued by the Committee of Sponsoring Organizations of the Treadway Commission (COSO).Commission. The Company’sCompany's management is responsible for these financial statements, for maintaining effective internal control over financial reporting, and for its assessment of the effectiveness of internal control over financial reporting included in the accompanying Report of Management on Internal Control over Financial Reporting. Our responsibility is to express an opinion on these consolidated financial statements and an opinion on the effectiveness of the Company’sCompany's internal control over financial reporting based on our audits. We conducted our audits in accordance with
auditingthe standards of the Public Company Accounting Oversight Board (United States). Those standards require that we plan and perform the audits to obtain reasonable assurance about whether the
consolidated financial statements are free of material misstatement and whether effective internal control over financial reporting was maintained in all material respects. Our audits of the consolidated financial statements included examining, on a test basis, evidence supporting the amounts and disclosures in the consolidated financial statements, assessing the accounting principles used and significant estimates made by management
as well asand evaluating the overall consolidated financial statement presentation. Our audit of internal control over financial reporting included obtaining an understanding of internal control over financial reporting, assessing the risk that a material weakness exists, and testing and evaluating the design and operating effectiveness of internal control based on the assessed
risks.risk. Our audits also included performing such other procedures as we considered necessary in the circumstances. We believe that our audits provide a reasonable basis for our opinions.
A
company’scompany's internal control over financial reporting is a process designed to provide reasonable assurance regarding the reliability of financial reporting and the preparation of financial statements for external purposes in accordance with generally accepted accounting principles. A
company’scompany's internal control over financial reporting includes those policies and procedures that (1) pertain to the maintenance of records that, in reasonable detail, accurately and fairly reflect the transactions and dispositions of the assets of the company; (2) provide reasonable assurance that transactions are recorded as necessary to permit preparation of financial statements in accordance with generally accepted accounting principles, and that receipts and expenditures of the company are being made only in accordance with authorizations of management and directors of the company; and (3) provide reasonable assurance regarding prevention or timely detection of unauthorized acquisition, use, or disposition of the
company’scompany's assets that could have a material effect on the financial statements.
Because of its inherent limitations, internal control over financial reporting may not prevent or detect misstatements. Also, projections of any evaluation of effectiveness to future periods are subject to the risk that controls may become inadequate because of changes in conditions, or that the degree of compliance with the policies or procedures may deteriorate.
In our opinion, the consolidated financial statements referred to above present fairly, in all material respects, the consolidated financial position of Umpqua Holdings Corporation and Subsidiariessubsidiaries as of December 31, 20112014 and 2010,2013, and the consolidated results of their operations and their cash flows for each of the three years in the three-year period ended December 31, 2011,2014, in conformity with generally accepted accounting principles generally accepted in the United States of America. Also in our opinion, Umpqua Holdings Corporation and Subsidiaries maintained, in all material respects, effective internal control over financial reporting as of December 31, 2011,2014, based on criteria established in Internal Control—Control - Integrated Framework (2013) issued by the Committee of Sponsoring Organizations of the Treadway Commission (COSO).Commission.
February 17, 2012Umpqua Holdings Corporation
23, 2015
UMPQUA HOLDINGS CORPORATION AND SUBSIDIARIES
CONSOLIDATED BALANCE SHEETS
December 31, 20112014 and 2010(in thousands, except shares)
| | | | | | | | |
| | | December 31,
2011 | | | December 31,
2010 | |
ASSETS | | | | | | | | |
Cash and due from banks | | $ | 152,265 | | | $ | 111,946 | |
Interest bearing deposits | | | 445,954 | | | | 891,634 | |
Temporary investments | | | 547 | | | | 545 | |
| | | | |
Total cash and cash equivalents | | | 598,766 | | | | 1,004,125 | |
Investment securities | | | | | | | | |
Trading, at fair value | | | 2,309 | | | | 3,024 | |
Available for sale, at fair value | | | 3,168,578 | | | | 2,919,180 | |
Held to maturity, at amortized cost | | | 4,714 | | | | 4,762 | |
Loans held for sale | | | 98,691 | | | | 75,626 | |
Non-covered loans and leases | | | 5,888,098 | | | | 5,658,987 | |
Allowance for non-covered loan and lease losses | | | (92,968 | ) | | | (101,921 | ) |
| | | | |
Non-covered loans and leases, net | | | 5,795,130 | | | | 5,557,066 | |
Covered loans and leases, net of allowance of $14,320 and $2,721 | | | 622,451 | | | | 785,898 | |
Restricted equity securities | | | 32,581 | | | | 34,475 | |
Premises and equipment, net | | | 152,366 | | | | 136,599 | |
Goodwill and other intangible assets, net | | | 677,224 | | | | 681,969 | |
Mortgage servicing rights, at fair value | | | 18,184 | | | | 14,454 | |
Non-covered other real estate owned | | | 34,175 | | | | 32,791 | |
Covered other real estate owned | | | 19,491 | | | | 29,863 | |
FDIC indemnification asset | | | 91,089 | | | | 146,413 | |
Other assets | | | 247,606 | | | | 242,465 | |
| | | | |
Total assets | | $ | 11,563,355 | | | $ | 11,668,710 | |
| | | | |
LIABILITIES AND SHAREHOLDERS’ EQUITY | | | | | | | | |
Deposits | | | | | | | | |
Noninterest bearing | | $ | 1,913,121 | | | $ | 1,616,687 | |
Interest bearing | | | 7,323,569 | | | | 7,817,118 | |
| | | | |
Total deposits | | | 9,236,690 | | | | 9,433,805 | |
Securities sold under agreements to repurchase | | | 124,605 | | | | 73,759 | |
Term debt | | | 255,676 | | | | 262,760 | |
Junior subordinated debentures, at fair value | | | 82,905 | | | | 80,688 | |
Junior subordinated debentures, at amortized cost | | | 102,544 | | | | 102,866 | |
Other liabilities | | | 88,522 | | | | 72,258 | |
| | | | |
Total liabilities | | | 9,890,942 | | | | 10,026,136 | |
| | | | |
COMMITMENTS AND CONTINGENCIES (NOTE 20) | | | | | | | | |
| | |
SHAREHOLDERS’ EQUITY | | | | | | | | |
Common stock, no par value, 200,000,000 shares authorized; issued and outstanding: 112,164,891 in 2011 and 114,536,814 in 2010 | | | 1,514,913 | | | | 1,540,928 | |
Retained earnings | | | 123,726 | | | | 76,701 | |
Accumulated other comprehensive income | | | 33,774 | | | | 24,945 | |
| | | | |
Total shareholders’ equity | | | 1,672,413 | | | | 1,642,574 | |
| | | | |
Total liabilities and shareholders’ equity | | $ | 11,563,355 | | | $ | 11,668,710 | |
| | | | |
2013
|
| | | | | | | |
| (in thousands, except shares) | | | |
| | December 31, | | December 31, |
| | 2014 | | 2013 |
| ASSETS | | | |
| Cash and due from banks | $ | 282,455 |
| | $ | 178,685 |
|
| Interest bearing deposits | 1,322,214 |
| | 611,224 |
|
| Temporary investments | 502 |
| | 514 |
|
| Total cash and cash equivalents | 1,605,171 |
| | 790,423 |
|
| Investment securities | | | |
| Trading, at fair value | 9,999 |
| | 5,958 |
|
| Available for sale, at fair value | 2,298,555 |
| | 1,790,978 |
|
| Held to maturity, at amortized cost | 5,211 |
| | 5,563 |
|
| Loans held for sale, at fair value | 286,802 |
| | 104,664 |
|
| Loans and leases | 15,327,732 |
| | 7,728,166 |
|
| Allowance for loan and lease losses | (116,167 | ) | | (95,085 | ) |
| Net loans and leases | 15,211,565 |
| | 7,633,081 |
|
| Restricted equity securities | 119,334 |
| | 30,685 |
|
| Premises and equipment, net | 317,834 |
| | 177,680 |
|
| Goodwill | 1,786,225 |
| | 764,305 |
|
| Other intangible assets, net | 56,733 |
| | 12,378 |
|
| Residential mortgage servicing rights, at fair value | 117,259 |
| | 47,765 |
|
| Other real estate owned | 37,942 |
| | 23,935 |
|
| FDIC indemnification asset | 4,417 |
| | 23,174 |
|
| Bank owned life insurance | 294,296 |
| | 96,938 |
|
| Deferred tax asset, net | 229,520 |
| | 16,627 |
|
| Other assets | 232,411 |
| | 111,958 |
|
| Total assets | $ | 22,613,274 |
| | $ | 11,636,112 |
|
| LIABILITIES AND SHAREHOLDERS' EQUITY | | | |
| Deposits | | | |
| Noninterest bearing | $ | 4,744,804 |
| | $ | 2,436,477 |
|
| Interest bearing | 12,147,295 |
| | 6,681,183 |
|
| Total deposits | 16,892,099 |
| | 9,117,660 |
|
| Securities sold under agreements to repurchase | 313,321 |
| | 224,882 |
|
| Term debt | 1,006,395 |
| | 251,494 |
|
| Junior subordinated debentures, at fair value | 249,294 |
| | 87,274 |
|
| Junior subordinated debentures, at amortized cost | 101,576 |
| | 101,899 |
|
| Other liabilities | 269,592 |
| | 125,477 |
|
| Total liabilities | 18,832,277 |
| | 9,908,686 |
|
| COMMITMENTS AND CONTINGENCIES (NOTE 19) |
| |
|
| SHAREHOLDERS' EQUITY | | | |
| Common stock, no par value, shares authorized: 400,000,000 as of December 31, 2014 and 200,000,000 as of December 31, 2013; issued and outstanding: 220,161,120 in 2014 and 111,973,203 in 2013 | 3,519,316 |
| | 1,514,485 |
|
| Retained earnings | 249,613 |
| | 217,917 |
|
| Accumulated other comprehensive income (loss) | 12,068 |
| | (4,976 | ) |
| Total shareholders' equity | 3,780,997 |
| | 1,727,426 |
|
| Total liabilities and shareholders' equity | $ | 22,613,274 |
| | $ | 11,636,112 |
|
See notes to consolidated financial statements
UMPQUA HOLDINGS CORPORATION AND SUBSIDIARIES
CONSOLIDATED STATEMENTS OF
OPERATIONSINCOME
For the Years Ended December 31, 2011, 20102014, 2013 and 2009(in thousands, except per share amounts)
| | | | | | | | | | | | |
| | | 2011 | | | 2010 | | | 2009 | |
INTEREST INCOME | | | | | | | | | | | | |
Interest and fees on non-covered loans | | $ | 319,702 | | | $ | 336,320 | | | $ | 355,195 | |
Interest and fees on covered loans | | | 86,011 | | | | 73,812 | | | | — | |
Interest and dividends on investment securities | | | | | | | | | | | | |
Taxable | | | 85,785 | | | | 67,388 | | | | 60,195 | |
Exempt from federal income tax | | | 8,653 | | | | 8,839 | | | | 7,794 | |
Dividends | | | 12 | | | | 14 | | | | 22 | |
Interest on temporary investments and interest bearing deposits | | | 1,590 | | | | 2,223 | | | | 526 | |
| | | | |
Total interest income | | | 501,753 | | | | 488,596 | | | | 423,732 | |
| | | |
INTEREST EXPENSE | | | | | | | | | | | | |
Interest on deposits | | | 55,743 | | | | 76,241 | | | | 88,742 | |
Interest on securities sold under agreements to repurchase and federal funds purchased | | | 539 | | | | 517 | | | | 680 | |
Interest on term debt | | | 9,255 | | | | 9,229 | | | | 4,576 | |
Interest on junior subordinated debentures | | | 7,764 | | | | 7,825 | | | | 9,026 | |
| | | | |
Total interest expense | | | 73,301 | | | | 93,812 | | | | 103,024 | |
| | | | |
Net interest income | | | 428,452 | | | | 394,784 | | | | 320,708 | |
PROVISION FOR NON-COVERED LOAN AND LEASE LOSSES | | | 46,220 | | | | 113,668 | | | | 209,124 | |
PROVISION FOR COVERED LOAN AND LEASE LOSSES | | | 16,141 | | | | 5,151 | | | | — | |
| | | | |
Net interest income after provision for loan and lease losses | | | 366,091 | | | | 275,965 | | | | 111,584 | |
| | | |
NON-INTEREST INCOME | | | | | | | | | | | | |
Service charges on deposit accounts | | | 33,096 | | | | 34,874 | | | | 32,957 | |
Brokerage commissions and fees | | | 12,787 | | | | 11,661 | | | | 7,597 | |
Mortgage banking revenue, net | | | 26,550 | | | | 21,214 | | | | 18,688 | |
Gain (loss) on investment securities, net | | | | | | | | | | | | |
Gain on sale of investment securities, net | | | 7,735 | | | | 2,326 | | | | 8,896 | |
Total other-than-temporary impairment losses | | | (190 | ) | | | (93 | ) | | | (12,556 | ) |
Portion of other-than-temporary impairment losses (transferred from) recognized in other comprehensive income | | | (169 | ) | | | (321 | ) | | | 1,983 | |
| | | | |
Total gain (loss) on investment securities, net | | | 7,376 | | | | 1,912 | | | | (1,677 | ) |
(Loss) gain on junior subordinated debentures carried at fair value | | | (2,197 | ) | | | 4,980 | | | | 6,482 | |
Bargain purchase gain on acquisition | | | — | | | | 6,437 | | | | — | |
Change in FDIC indemnification asset | | | (6,168 | ) | | | (16,445 | ) | | | — | |
Other income | | | 12,674 | | | | 11,271 | | | | 9,469 | |
| | | | |
Total non-interest income | | | 84,118 | | | | 75,904 | | | | 73,516 | |
| | | |
NON-INTEREST EXPENSE | | | | | | | | | | | | |
Salaries and employee benefits | | | 179,480 | | | | 162,875 | | | | 126,850 | |
Net occupancy and equipment | | | 51,284 | | | | 45,940 | | | | 39,673 | |
Communications | | | 11,214 | | | | 10,464 | | | | 7,671 | |
Marketing | | | 6,138 | | | | 6,225 | | | | 4,529 | |
Services | | | 24,170 | | | | 22,576 | | | | 21,918 | |
Supplies | | | 2,824 | | | | 3,998 | | | | 3,257 | |
FDIC assessments | | | 10,768 | | | | 15,095 | | | | 15,825 | |
Net loss on non-covered other real estate owned | | | 10,690 | | | | 8,097 | | | | 23,204 | |
Net loss (gain) on covered other real estate owned | | | 7,481 | | | | (2,172 | ) | | | — | |
Intangible amortization and impairment | | | 4,948 | | | | 5,389 | | | | 6,165 | |
Goodwill impairment | | | — | | | | — | | | | 111,952 | |
Merger related expenses | | | 360 | | | | 6,675 | | | | 273 | |
Other expenses | | | 29,614 | | | | 32,576 | | | | 18,086 | |
| | | | |
Total non-interest expense | | | 338,971 | | | | 317,738 | | | | 379,403 | |
| | | |
Income (loss) before provision for (benefit from) income taxes | | | 111,238 | | | | 34,131 | | | | (194,303 | ) |
Provison for (benefit from) income taxes | | | 36,742 | | | | 5,805 | | | | (40,937 | ) |
| | | | |
Net income (loss) | | $ | 74,496 | | | $ | 28,326 | | | $ | (153,366 | ) |
| | | | |
Umpqua Holdings Corporation
2012 |
| | | | | | | | | | | | |
| (in thousands, except per share amounts) | | | | |
| | | 2014 | | 2013 | | 2012 |
| INTEREST INCOME | | | | | | |
| Interest and fees on loans and leases | | $ | 763,803 |
| | $ | 398,214 |
| | $ | 386,812 |
|
| Interest and dividends on investment securities: | | | | | | |
| Taxable | | 45,784 |
| | 34,146 |
| | 59,078 |
|
| Exempt from federal income tax | | 10,345 |
| | 8,898 |
| | 9,184 |
|
| Dividends | | 325 |
| | 252 |
| | 83 |
|
| Interest on temporary investments and interest bearing deposits | | 2,264 |
| | 1,336 |
| | 928 |
|
| Total interest income | | 822,521 |
| | 442,846 |
| | 456,085 |
|
| INTEREST EXPENSE | | | | | | |
| Interest on deposits | | 23,815 |
| | 20,755 |
| | 31,133 |
|
| Interest on securities sold under agreement to repurchase and federal funds purchased | | 346 |
| | 141 |
| | 288 |
|
| Interest on term debt | | 12,793 |
| | 9,248 |
| | 9,279 |
|
| Interest on junior subordinated debentures | | 11,739 |
| | 7,737 |
| | 8,149 |
|
| Total interest expense | | 48,693 |
| | 37,881 |
| | 48,849 |
|
| Net interest income | | 773,828 |
| | 404,965 |
| | 407,236 |
|
| PROVISION FOR LOAN AND LEASE LOSSES | | 40,241 |
| | 10,716 |
| | 29,201 |
|
| Net interest income after provision for loan and lease losses | | 733,587 |
| | 394,249 |
| | 378,035 |
|
| NON-INTEREST INCOME | | | | | | |
| Service charges on deposit accounts | | 54,700 |
| | 30,952 |
| | 28,299 |
|
| Brokerage commissions and fees | | 18,133 |
| | 14,736 |
| | 12,967 |
|
| Residential mortgage banking revenue, net | | 77,265 |
| | 78,885 |
| | 84,216 |
|
| Gain on investment securities, net | | 2,904 |
| | 209 |
| | 3,868 |
|
| Gain on loan sales | | 15,113 |
| | 2,744 |
| | — |
|
| Loss on junior subordinated debentures carried at fair value | | (5,090 | ) | | (2,197 | ) | | (2,203 | ) |
| Change in FDIC indemnification asset | | (15,151 | ) | | (25,549 | ) | | (15,234 | ) |
| BOLI income | | 6,835 |
| | 3,035 |
| | 2,708 |
|
| Other income | | 24,583 |
| | 18,626 |
| | 22,208 |
|
| Total non-interest income | | 179,292 |
| | 121,441 |
| | 136,829 |
|
| NON-INTEREST EXPENSE | | | | | | |
| Salaries and employee benefits | | 355,379 |
| | 209,991 |
| | 200,946 |
|
| Net occupancy and equipment | | 111,263 |
| | 62,067 |
| | 55,081 |
|
| Communications | | 14,728 |
| | 11,974 |
| | 11,573 |
|
| Marketing | | 9,504 |
| | 6,062 |
| | 5,064 |
|
| Services | | 49,086 |
| | 25,483 |
| | 25,823 |
|
| FDIC assessments | | 10,998 |
| | 6,954 |
| | 7,308 |
|
| Net loss on other real estate owned | | 4,116 |
| | 1,248 |
| | 12,655 |
|
| Intangible amortization | | 10,207 |
| | 4,781 |
| | 4,816 |
|
| Merger related expenses | | 82,317 |
| | 8,836 |
| | 2,338 |
|
| Other expenses | | 36,465 |
| | 27,265 |
| | 34,048 |
|
| Total non-interest expense | | 684,063 |
| | 364,661 |
| | 359,652 |
|
| Income before provision for income taxes | | 228,816 |
| | 151,029 |
| | 155,212 |
|
| Provision for income taxes | | 81,296 |
| | 52,668 |
| | 53,321 |
|
| Net income | | $ | 147,520 |
| | $ | 98,361 |
| | $ | 101,891 |
|
UMPQUA HOLDINGS CORPORATION AND SUBSIDIARIES
CONSOLIDATED STATEMENTS OF
OPERATIONSINCOME (Continued)
For the Years Ended December 31, 2011, 20102014, 2013 and 2009(in thousands, except per share amounts)
| | | | | | | | | | | | |
| | | 2011 | | | 2010 | | | 2009 | |
Net income (loss) | | $ | 74,496 | | | $ | 28,326 | | | $ | (153,366 | ) |
Preferred stock dividends | | | — | | | | 12,192 | | | | 12,866 | |
Dividends and undistributed earnings allocated to participating securities | | | 356 | | | | 67 | | | | 30 | |
| | | | |
Net earnings (loss) available to common shareholders | | $ | 74,140 | | | $ | 16,067 | | | $ | (166,262 | ) |
| | | | |
| | | |
Earnings (loss) per common share: | | | | | | | | | | | | |
Basic | | $ | 0.65 | | | $ | 0.15 | | | $ | (2.36 | ) |
Diluted | | $ | 0.65 | | | $ | 0.15 | | | $ | (2.36 | ) |
| | | |
Weighted average number of common shares outstanding: | | | | | | | | | | | | |
Basic | | | 114,220 | | | | 107,922 | | | | 70,399 | |
Diluted | | | 114,409 | | | | 108,153 | | | | 70,399 | |
|
| | | | | | | | | | | |
| (in thousands, except per share amounts) | | | | | |
| | 2014 | | 2013 | | 2012 |
| Net income | $ | 147,520 |
| | $ | 98,361 |
| | $ | 101,891 |
|
| Dividends and undistributed earnings allocated to participating securities | 484 |
| | 788 |
| | 682 |
|
| Net earnings available to common shareholders | $ | 147,036 |
| | $ | 97,573 |
| | $ | 101,209 |
|
| Earnings per common share: | | | | | |
| Basic | $0.79 | | $0.87 | | $0.90 |
| Diluted | $0.78 | | $0.87 | | $0.90 |
| Weighted average number of common shares outstanding: | | | | | |
| Basic | 186,550 |
| | 111,938 |
| | 111,935 |
|
| Diluted | 187,544 |
| | 112,176 |
| | 112,151 |
|
See notes to consolidated financial statements
UMPQUA HOLDINGS CORPORATION AND SUBSIDIARIES
CONSOLIDATED STATEMENTS OF
CHANGES IN SHAREHOLDERS’ EQUITYCOMPREHENSIVE INCOME
For the Years Ended December 31, 2011, 20102014, 2013 and 20092012 (in
thousands, except shares) | | | | | | | | | | | | | | | | | | | | | | | | |
| | | | | | Common Stock | | | | | | | | | | |
| | | Preferred
Stock | | | Shares | | | Amount | | | Retained
Earnings | | | Accumulated
Other Comprehensive
Income | | | Total | |
BALANCE AT JANUARY 1, 2009 | | $ | 202,178 | | | | 60,146,400 | | | $ | 1,005,820 | | | $ | 264,938 | | | $ | 14,072 | | | $ | 1,487,008 | |
Net loss | | | | | | | | | | | | | | | (153,366 | ) | | | | | | | (153,366 | ) |
Other comprehensive income, net of tax | | | | | | | | | | | | | | | | | | | 10,883 | | | | 10,883 | |
| | | | | | | | | | | | | | | | | | | | | | | | |
Comprehensive loss | | | | | | | | | | | | | | | | | | | | | | $ | (142,483 | ) |
| | | | | | | | | | | | | | | | | | | | | | | | |
Issuance of common stock | | | | | | | 26,538,461 | | | | 245,697 | | | | | | | | | | | | 245,697 | |
Stock-based compensation | | | | | | | | | | | 2,188 | | | | | | | | | | | | 2,188 | |
Stock repurchased and retired | | | | | | | (19,516 | ) | | | (174 | ) | | | | | | | | | | | (174 | ) |
Issuances of common stock under stock plans and related net tax deficiencies | | | | | | | 120,243 | | | | (243 | ) | | | | | | | | | | | (243 | ) |
Amortization of discount on preferred stock | | | 2,157 | | | | | | | | | | | | (2,157 | ) | | | | | | | — | |
Dividends declared on preferred stock | | | | | | | | | | | | | | | (10,739 | ) | | | | | | | (10,739 | ) |
Cash dividends on common stock ($0.20 per share) | | | | | | | | | | | | | | | (14,737 | ) | | | | | | | (14,737 | ) |
| | | | |
Balance at December 31, 2009 | | $ | 204,335 | | | | 86,785,588 | | | $ | 1,253,288 | | | $ | 83,939 | | | $ | 24,955 | | | $ | 1,566,517 | |
| | | | |
| | | | | | |
BALANCE AT JANUARY 1, 2010 | | $ | 204,335 | | | | 86,785,588 | | | $ | 1,253,288 | | | $ | 83,939 | | | $ | 24,955 | | | $ | 1,566,517 | |
Net income | | | | | | | | | | | | | | | 28,326 | | | | | | | | 28,326 | |
Other comprehensive (loss) income, net of tax | | | | | | | | | | | | | | | | | | | (10 | ) | | | (10 | ) |
| | | | | | | | | | | | | | | | | | | | | | | | |
Comprehensive income | | | | | | | | | | | | | | | | | | | | | | $ | 28,316 | |
| | | | | | | | | | | | | | | | | | | | | | | | |
Issuance of common stock | | | | | | | 8,625,000 | | | | 89,786 | | | | | | | | | | | | 89,786 | |
Stock-based compensation | | | | | | | | | | | 3,505 | | | | | | | | | | | | 3,505 | |
Stock repurchased and retired | | | | | | | (22,541 | ) | | | (284 | ) | | | | | | | | | | | (284 | ) |
Issuances of common stock under stock plans and related net tax benefit | | | | | | | 173,767 | | | | 844 | | | | | | | | | | | | 844 | |
Redemption of preferred stock issued to U.S. Treasury | | | (214,181 | ) | | | | | | | | | | | | | | | | | | | (214,181 | ) |
Issuance of preferred stock | | | 198,289 | | | | | | | | | | | | | | | | | | | | 198,289 | |
Conversion of preferred stock to common stock | | | (198,289 | ) | | | 18,975,000 | | | | 198,289 | | | | | | | | | | | | — | |
Amortization of discount on preferred stock | | | 9,846 | | | | | | | | | | | | (9,846 | ) | | | | | | | — | |
Dividends declared on preferred stock | | | | | | | | | | | | | | | (3,686 | ) | | | | | | | (3,686 | ) |
Repurchase of warrants issued to U.S. Treasury | | | | | | | | | | | (4,500 | ) | | | | | | | | | | | (4,500 | ) |
Cash dividends on common stock ($0.20 per share) | | | | | | | | | | | | | | | (22,032 | ) | | | | | | | (22,032 | ) |
| | | | |
Balance at December 31, 2010 | | $ | — | | | | 114,536,814 | | | $ | 1,540,928 | | | $ | 76,701 | | | $ | 24,945 | | | $ | 1,642,574 | |
| | | | |
| | | | | | |
BALANCE AT JANUARY 1, 2011 | | $ | — | | | | 114,536,814 | | | $ | 1,540,928 | | | $ | 76,701 | | | $ | 24,945 | | | $ | 1,642,574 | |
Net income | | | | | | | | | | | | | | | 74,496 | | | | | | | | 74,496 | |
Other comprehensive income, net of tax | | | | | | | | | | | | | | | | | | | 8,829 | | | | 8,829 | |
| | | | | | | | | | | | | | | | | | | | | | | | |
Comprehensive income | | | | | | | | | | | | | | | | | | | | | | $ | 83,325 | |
| | | | | | | | | | | | | | | | | | | | | | | | |
Stock-based compensation | | | | | | | | | | | 3,785 | | | | | | | | | | | | 3,785 | |
Stock repurchased and retired | | | | | | | (2,557,056 | ) | | | (29,754 | ) | | | | | | | | | | | (29,754 | ) |
Issuances of common stock under stock plans and related net tax deficiencies | | | | | | | 185,133 | | | | (46 | ) | | | | | | | | | | | (46 | ) |
Cash dividends on common stock ($0.24 per share) | | | | | | | | | | | | | | | (27,471 | ) | | | | | | | (27,471 | ) |
| | | | |
Balance at December 31, 2011 | | $ | — | | | | 112,164,891 | | | $ | 1,514,913 | | | $ | 123,726 | | | $ | 33,774 | | | $ | 1,672,413 | |
| | | | |
thousands)
|
| | | | | | | | | | | |
| | 2014 | | 2013 | | 2012 |
| Net income | $ | 147,520 |
| | $ | 98,361 |
| | $ | 101,891 |
|
| Available for sale securities: | | | | | |
| Unrealized gains (losses) arising during the period | 31,215 |
| | (48,755 | ) | | (12,004 | ) |
| Reclassification adjustment for net gains realized in earnings (net of tax expense $1,162, $84, and $1,609 in 2014, 2013, and 2012, respectively) | (1,742 | ) | | (125 | ) | | (2,414 | ) |
| Income tax (expense) benefit related to unrealized gains (losses) | (12,486 | ) | | 19,502 |
| | 4,802 |
|
| Net change in unrealized gains (losses) | 16,987 |
| | (29,378 | ) | | (9,616 | ) |
| Held to maturity securities: | | | | | |
| Reclassification adjustment for impairments realized in net income (net of tax benefit of $42 in 2012) | — |
| | — |
| | 62 |
|
| Accretion of unrealized losses related to factors other than credit to investment securities held to maturity (net of tax benefit of $37, $37, and $84 in 2014, 2013, and 2012, respectively) | 57 |
| | 56 |
| | 126 |
|
| Net change in unrealized losses related to factors other than credit | 57 |
| | 56 |
| | 188 |
|
| Other comprehensive income (loss), net of tax | 17,044 |
| | (29,322 | ) | | (9,428 | ) |
| Comprehensive income | $ | 164,564 |
| | $ | 69,039 |
| | $ | 92,463 |
|
See notes to consolidated financial statements
Umpqua Holdings Corporation
UMPQUA HOLDINGS CORPORATION AND SUBSIDIARIES
CONSOLIDATED STATEMENTS OF
COMPREHENSIVE INCOME (LOSS)CHANGES IN SHAREHOLDERS' EQUITY
For the Years Ended December 31, 2011, 20102014, 2013 and 2009(
2012
|
| | | | | | | | | | | | | | | | | | |
| (in thousands, except shares) | | | | | | | Accumulated | | |
| | | | | | Other | | |
| | Common Stock | | Retained | | Comprehensive | | |
| | Shares | | Amount | | Earnings | | Income (Loss) | | Total |
| BALANCE AT JANUARY 1, 2012 | 112,164,891 |
| | $ | 1,514,913 |
| | $ | 123,726 |
| | $ | 33,774 |
| | $ | 1,672,413 |
|
| Net income | | | | | 101,891 |
| | | | 101,891 |
|
| Other comprehensive loss, net of tax | | | | | | | (9,428 | ) | | (9,428 | ) |
| Stock-based compensation | | | 4,041 |
| | | | | | 4,041 |
|
| Stock repurchased and retired | (596,000 | ) | | (7,436 | ) | | | | | | (7,436 | ) |
| Issuances of common stock under stock plans | | | | | | | | | |
| and related net tax deficiencies | 321,068 |
| | 882 |
| | | | | | 882 |
|
| Cash dividends on common stock ($0.34 per share) | | | | | (38,324 | ) | | | | (38,324 | ) |
| Balance at December 31, 2012 | 111,889,959 |
| | $ | 1,512,400 |
| | $ | 187,293 |
| | $ | 24,346 |
| | $ | 1,724,039 |
|
| | | | | | | | | | |
| BALANCE AT JANUARY 1, 2013 | 111,889,959 |
| | $ | 1,512,400 |
| | $ | 187,293 |
| | $ | 24,346 |
| | $ | 1,724,039 |
|
| Net income | | | | | 98,361 |
| | | | 98,361 |
|
| Other comprehensive loss, net of tax | | | | | | | (29,322 | ) | | (29,322 | ) |
| Stock-based compensation | | | 5,017 |
| | | | | | 5,017 |
|
| Stock repurchased and retired | (584,677 | ) | | (9,360 | ) | | | | | | (9,360 | ) |
| Issuances of common stock under stock plans | | | | | | | | | |
| and related net tax benefit | 667,921 |
| | 6,428 |
| | | | | | 6,428 |
|
| Cash dividends on common stock ($0.60 per share) | | | | | (67,737 | ) | | | | (67,737 | ) |
| Balance at December 31, 2013 | 111,973,203 |
| | $ | 1,514,485 |
| | $ | 217,917 |
| | $ | (4,976 | ) | | $ | 1,727,426 |
|
| | | | | | | | | | |
| BALANCE AT JANUARY 1, 2014 | 111,973,203 |
| | $ | 1,514,485 |
| | $ | 217,917 |
| | $ | (4,976 | ) | | $ | 1,727,426 |
|
| Net income | | | | | 147,520 |
| | | | 147,520 |
|
| Other comprehensive income, net of tax | | | | | | | 17,044 |
| | 17,044 |
|
Stock issued in connection with merger (1) | 104,385,087 |
| | 1,989,030 |
| | | | | | 1,989,030 |
|
| Stock-based compensation | | | 15,292 |
| | | | | | 15,292 |
|
| Stock repurchased and retired | (403,828 | ) | | (7,183 | ) | | | | | | (7,183 | ) |
| Issuances of common stock under stock plans | | | | | | | | | |
and related net tax benefit (2) | 4,206,658 |
| | 7,692 |
| | | | | | 7,692 |
|
| Cash dividends on common stock ($0.60 per share) | | | | | (115,824 | ) | | | | (115,824 | ) |
| Balance at December 31, 2014 | 220,161,120 |
| | $ | 3,519,316 |
| | $ | 249,613 |
|
| $ | 12,068 |
| | $ | 3,780,997 |
|
(1) The amount of common stock issued in thousands) | | | | | | | | | | | | |
| | | 2011 | | | 2010 | | | 2009 | |
Net income (loss) | | $ | 74,496 | | | $ | 28,326 | | | $ | (153,366 | ) |
| | | | |
Available for sale securities: | | | | | | | | | | | | |
Unrealized gains arising during the year | | | 22,101 | | | | 1,305 | | | | 23,888 | |
Reclassification adjustment for gains realized in net income (net of tax expense of $3,094, $930, and $3,431 in 2011, 2010, and 2009, respectively) | | | (4,641 | ) | | | (1,396 | ) | | | (5,147 | ) |
Income tax expense related to unrealized gains | | | (8,840 | ) | | | (522 | ) | | | (9,555 | ) |
| | | | |
Net change in unrealized gains | | | 8,620 | | | | (613 | ) | | | 9,186 | |
| | | | |
Held to maturity securities: | | | | | | | | | | | | |
Reclassification adjustment for impairments realized in net income (net of tax benefit of $1,716 in 2009) | | | — | | | | — | | | | 2,574 | |
Amortization of unrealized losses on investment securities transferred to held to maturity (net of tax benefit of $70 in 2009) | | | — | | | | — | | | | 103 | |
| | | | |
Net change in unrealized losses on investment securities transferred to held to maturity | | | — | | | | — | | | | 2,677 | |
| | | | |
Unrealized (losses) gain related to factors other than credit (net of tax expense of $34 and $1,080 in 2011 and 2009, respectively and tax benefit of $150 in 2010) | | | (52 | ) | | | 225 | | | | (1,620 | ) |
Reclassification adjustment for impairments realized in net income (net of tax benefit of $108, $137 and $307 in 2011, 2010 and 2009, respectively) | | | 161 | | | | 205 | | | | 460 | |
Accretion of unrealized losses related to factors other than credit to investment securities held to maturity (net of tax benefit of $66, $115 and $120 in 2011, 2010 and 2009, respectively) | | | 100 | | | | 173 | | | | 180 | |
| | | | |
Net change in unrealized losses related to factors other than credit | | | 209 | | | | 603 | | | | (980 | ) |
| | | | |
Other comprehensive income (loss), net of tax | | | 8,829 | | | | (10 | ) | | | 10,883 | |
| | | | |
Comprehensive income (loss) | | $ | 83,325 | | | $ | 28,316 | | | $ | (142,483 | ) |
| | | | |
connection with the merger is net of $784,000 of issuance costs.
(2) The shares issued include 2,889,996 warrants exercised.
See notes to consolidated financial statements
UMPQUA HOLDINGS CORPORATION AND SUBSIDIARIES
CONSOLIDATED STATEMENTS OF CASH
FLOWSFLOW
For the Years Ended December 31, 2011, 20102014, 2013 and 2009(in thousands)
| | | | | | | | | | | | |
| | | 2011 | | | 2010 | | | 2009 | |
CASH FLOWS FROM OPERATING ACTIVITIES: | | | | | | | | | | | | |
Net income (loss) | | $ | 74,496 | | | $ | 28,326 | | | $ | (153,366 | ) |
Adjustments to reconcile net income (loss) to net cash provided by operating activities: | | | | | | | | | | | | |
Deferred income tax expense (benefit) | | | 2,000 | | | | 4,393 | | | | (18,360 | ) |
Amortization of investment premiums, net | | | 36,086 | | | | 20,464 | | | | 9,301 | |
Gain on sale of investment securities, net | | | (7,735 | ) | | | (2,326 | ) | | | (8,896 | ) |
Other-than-temporary impairment on investment securities available for sale | | | — | | | | — | | | | 239 | |
Other-than-temporary impairment on investment securities held to maturity | | | 359 | | | | 414 | | | | 10,334 | |
Loss on sale of non-covered other real estate owned | | | 1,743 | | | | 4,023 | | | | 10,957 | |
Gain on sale of covered other real estate owned | | | (1,228 | ) | | | (4,113 | ) | | | — | |
Valuation adjustment on non-covered other real estate owned | | | 8,947 | | | | 4,074 | | | | 12,247 | |
Valuation adjustment on covered other real estate owned | | | 8,709 | | | | 1,941 | | | | — | |
Provision for non-covered loan and lease losses | | | 46,220 | | | | 113,668 | | | | 209,124 | |
Provision for covered loan and lease losses | | | 16,141 | | | | 5,151 | | | | — | |
Bargain purchase gain on acquisition | | | — | | | | (6,437 | ) | | | — | |
Change in FDIC indemnification asset | | | 6,168 | | | | 16,445 | | | | — | |
Depreciation, amortization and accretion | | | 13,151 | | | | 9,199 | | | | 11,649 | |
Goodwill impairment | | | — | | | | — | | | | 111,952 | |
Increase in mortgage servicing rights | | | (6,720 | ) | | | (5,645 | ) | | | (7,570 | ) |
Change in mortgage servicing rights carried at fair value | | | 2,990 | | | | 3,878 | | | | 3,150 | |
Change in junior subordinated debentures carried at fair value | | | 2,217 | | | | (4,978 | ) | | | (6,854 | ) |
Stock-based compensation | | | 3,785 | | | | 3,505 | | | | 2,188 | |
Net decrease (increase) in trading account assets | | | 715 | | | | (751 | ) | | | (286 | ) |
Gain on sale of loans | | | (10,676 | ) | | | (10,923 | ) | | | (6,649 | ) |
Origination of loans held for sale | | | (821,744 | ) | | | (702,449 | ) | | | (682,535 | ) |
Proceeds from sales of loans held for sale | | | 809,355 | | | | 670,872 | | | | 677,598 | |
Excess tax benefits from the exercise of stock options | | | (6 | ) | | | (7 | ) | | | (1 | ) |
Change in other assets and liabilities | | | | | | | | | | | | |
Net (increase) decrease in other assets | | | (17,798 | ) | | | 47,011 | | | | (72,570 | ) |
Net increase (decrease) in other liabilities | | | 15,177 | | | | 2,914 | | | | (8,426 | ) |
| | | | |
Net cash provided by operating activities | | | 182,352 | | | | 198,649 | | | | 93,226 | |
| | | | |
| | | |
CASH FLOWS FROM INVESTING ACTIVITIES: | | | | | | | | | | | | |
Purchases of investment securities available for sale | | | (1,190,686 | ) | | | (1,498,224 | ) | | | (1,002,490 | ) |
Purchases of investment securities held to maturity | | | (1,573 | ) | | | — | | | | — | |
Proceeds from investment securities available for sale | | | 927,276 | | | | 408,670 | | | | 464,376 | |
Proceeds from investment securities held to maturity | | | 1,637 | | | | 1,675 | | | | 2,282 | |
Redemption of restricted equity securities | | | 1,894 | | | | 472 | | | | 1,280 | |
Net non-covered loan and lease (originations) paydowns | | | (327,032 | ) | | | 146,252 | | | | (121,257 | ) |
Net covered loan and lease paydowns | | | 119,772 | | | | 119,941 | | | | — | |
Proceeds from sales of loans | | | 11,185 | | | | 38,744 | | | | 12,519 | |
Proceeds from disposals of furniture and equipment | | | 921 | | | | 1,237 | | | | 270 | |
Purchases of premises and equipment | | | (33,974 | ) | | | (47,559 | ) | | | (11,239 | ) |
Net proceeds from FDIC indemnification asset | | | 54,881 | | | | 48,443 | | | | — | |
Proceeds from sales of non-covered other real estate owned | | | 35,340 | | | | 25,124 | | | | 26,167 | |
Proceeds from sales of covered other real estate owned | | | 17,615 | | | | 14,598 | | | | — | |
Proceeds from sale of acquired insurance portfolio | | | — | | | | 5,150 | | | | — | |
Cash acquired in merger, net of cash consideration paid | | | — | | | | 179,046 | | | | 178,905 | |
| | | | |
Net cash used by investing activities | | | (382,744 | ) | | | (556,431 | ) | | | (449,187 | ) |
| | | | |
Umpqua Holdings Corporation
UMPQUA HOLDINGS CORPORATION AND SUBSIDIARIES2012CONSOLIDATED STATEMENTS OF CASH FLOWS (Continued)
For the Years Ended December 31, 2011, 2010 and 2009
(in thousands)
| | | | | | | | | | | | |
| | | 2011 | | | 2010 | | | 2009 | |
CASH FLOWS FROM FINANCING ACTIVITIES: | | | | | | | | | | | | |
Net (decrease) increase in deposit liabilities | | $ | (196,063 | ) | | $ | 847,895 | | | $ | 667,610 | |
Net increase (decrease) in securities sold under agreements to repurchase | | | 50,846 | | | | 28,579 | | | | (2,408 | ) |
Repayment of term debt | | | (4,993 | ) | | | (165,789 | ) | | | (130,191 | ) |
Proceeds from issuance of preferred stock | | | — | | | | 198,289 | | | | — | |
Redemption of preferred stock | | | — | | | | (214,181 | ) | | | — | |
Repurchase of warrants issued to U.S. Treasury | | | — | | | | (4,500 | ) | | | — | |
Net proceeds from issuance of common stock | | | — | | | | 89,786 | | | | 245,697 | |
Dividends paid on preferred stock | | | — | | | | (3,686 | ) | | | (10,739 | ) |
Dividends paid on common stock | | | (25,317 | ) | | | (20,626 | ) | | | (13,399 | ) |
Excess tax benefits from the exercise of stock options | | | 6 | | | | 7 | | | | 1 | |
Proceeds from stock options exercised | | | 308 | | | | 1,004 | | | | 301 | |
Retirement of common stock | | | (29,754 | ) | | | (284 | ) | | | (174 | ) |
| | | | |
Net cash (used) provided by financing activities | | | (204,967 | ) | | | 756,494 | | | | 756,698 | |
| | | | |
Net (decrease) increase in cash and cash equivalents | | | (405,359 | ) | | | 398,712 | | | | 400,737 | |
Cash and cash equivalents, beginning of year | | | 1,004,125 | | | | 605,413 | | | | 204,676 | |
| | | | |
Cash and cash equivalents, end of year | | $ | 598,766 | | | $ | 1,004,125 | | | $ | 605,413 | |
| | | | |
| | | |
SUPPLEMENTAL DISCLOSURES OF CASH FLOW INFORMATION: | | | | | | | | | | | | |
Cash paid during the year for: | | | | | | | | | | | | |
Interest | | $ | 78,690 | | | $ | 99,556 | | | $ | 106,541 | |
Income taxes | | $ | 47,608 | | | $ | 285 | | | $ | 48 | |
| | | |
SUPPLEMENTAL DISCLOSURE OF NONCASH INVESTING AND FINANCING ACTIVITIES: | | | | | | | | | | | | |
Change in unrealized gains on investment securities available for sale, net of taxes | | $ | 8,620 | | | $ | (613 | ) | | $ | 9,186 | |
Change in unrealized loss on investment securities transferred to held to maturity, net of taxes | | $ | — | | | $ | — | | | $ | 2,677 | |
Change in unrealized losses on investment securities held to maturity related to factors other than credit, net of taxes | | $ | 209 | | | $ | 603 | | | $ | (980 | ) |
Cash dividend declared on common and preferred stock and payable after period-end | | $ | 7,890 | | | $ | 5,745 | | | $ | 4,346 | |
Transfer of non-covered loans to non-covered other real estate owned | | $ | 47,414 | | | $ | 41,491 | | | $ | 50,914 | |
Transfer of covered loans to covered other real estate owned | | $ | 15,271 | | | $ | 15,350 | | | $ | — | |
Transfer from FDIC indemnification asset to due from FDIC and other | | $ | 49,156 | | | $ | 84,660 | | | $ | — | |
Transfer of covered loans to non-covered loans | | $ | 12,263 | | | $ | — | | | $ | — | |
Receivable from sales of noncovered other real estate owned and loans | | $ | 1,100 | | | $ | 45 | | | $ | 4,875 | |
Receivable from sales of covered other real estate owned | | $ | 547 | | | $ | — | | | $ | — | |
Conversion of preferred stock to common stock | | $ | — | | | $ | 198,289 | | | $ | — | |
Acquisitions: | | | | | | | | | | | | |
Assets acquired | | $ | — | | | $ | 1,512,048 | | | $ | 4,978 | |
Liabilities assumed | | $ | — | | | $ | 1,505,611 | | | $ | 183,883 | |
|
| | | | | | | | | | | |
| (in thousands) | 2014 | | 2013 | | 2012 |
| CASH FLOWS FROM OPERATING ACTIVITIES: | | | | | |
| Net income | $ | 147,520 |
| | $ | 98,361 |
| | $ | 101,891 |
|
| Adjustments to reconcile net income to net cash provided by operating activities: | | | | | |
| Deferred income tax expense | 80,126 |
| | 7,748 |
| | 6,421 |
|
| Amortization of investment premiums, net | 20,822 |
| | 32,663 |
| | 45,082 |
|
| Gain on sale of investment securities, net | (2,904 | ) | | (209 | ) | | (4,023 | ) |
| Other-than-temporary impairment on investment securities held to maturity | — |
| | — |
| | 155 |
|
| (Gain) loss on sale of other real estate owned | (127 | ) | | (912 | ) | | 1,113 |
|
| Valuation adjustment on other real estate owned | 3,728 |
| | 2,160 |
| | 11,542 |
|
| Provision for loan and lease losses | 40,241 |
| | 10,716 |
| | 29,201 |
|
| Change in cash surrender value of bank owned life insurance | (9,713 | ) | | (4,280 | ) | | (3,145 | ) |
| Change in FDIC indemnification asset | 15,151 |
| | 25,549 |
| | 15,234 |
|
| Depreciation, amortization and accretion | 33,873 |
| | 18,267 |
| | 16,040 |
|
| Increase in residential mortgage servicing rights | (23,311 | ) | | (17,963 | ) | | (17,710 | ) |
| Change in residential mortgage servicing rights carried at fair value | 16,587 |
| | (2,374 | ) | | 8,466 |
|
| Change in junior subordinated debentures carried at fair value | 5,849 |
| | 2,193 |
| | 2,175 |
|
| Stock-based compensation | 15,292 |
| | 5,017 |
| | 4,041 |
|
| Net decrease (increase) in trading account assets | 452 |
| | (2,211 | ) | | (1,438 | ) |
| Gain on sale of loans | (93,294 | ) | | (65,644 | ) | | (91,945 | ) |
| Change in loans held for sale carried at fair value | (9,688 | ) | | 14,503 |
| | (13,965 | ) |
| Origination of loans held for sale | (2,146,829 | ) | | (1,599,683 | ) | | (1,987,262 | ) |
| Proceeds from sales of loans held for sale | 2,267,471 |
| | 1,863,548 |
| | 1,875,138 |
|
| Excess tax benefits from the exercise of stock options | (1,626 | ) | | (65 | ) | | (52 | ) |
| Change in other assets and liabilities: | | | | | |
| Net (increase) decrease in other assets | (45,874 | ) | | 32,129 |
| | 5,401 |
|
| Net increase (decrease) in other liabilities | 38,632 |
| | (7,589 | ) | | 22,255 |
|
| Net cash provided by operating activities | 352,378 |
| | 411,924 |
| | 24,615 |
|
| CASH FLOWS FROM INVESTING ACTIVITIES: | | | | | |
| Purchases of investment securities available for sale | (363,064 | ) | | (51,191 | ) | | (994,574 | ) |
| Purchases of investment securities held to maturity | — |
| | (2,126 | ) | | (931 | ) |
| Proceeds from investment securities available for sale | 1,238,676 |
| | 803,866 |
| | 1,481,600 |
|
| Proceeds from investment securities held to maturity | 741 |
| | 1,353 |
| | 1,304 |
|
| Redemption of restricted equity securities | 5,615 |
| | 2,758 |
| | 1,629 |
|
| Net loan and lease originations | (937,739 | ) | | (383,072 | ) | | (472,581 | ) |
| Proceeds from sales of loans | 356,464 |
| | 60,298 |
| | 14,242 |
|
| Proceeds from insurance settlement on loss of property | — |
| | 575 |
| | 1,425 |
|
| Proceeds from fee on termination of merger transaction | — |
| | — |
| | 1,600 |
|
| Proceeds from disposals of furniture and equipment | 4,135 |
| | 410 |
| | 2,029 |
|
| Proceeds from bank owned life insurance | 3,723 |
| | 1,173 |
| | 1,870 |
|
| Purchases of premises and equipment | (62,167 | ) | | (33,995 | ) | | (22,817 | ) |
| Net change in proceeds from FDIC indemnification asset | (2,667 | ) | | 5,332 |
| | 29,478 |
|
| Proceeds from sales of other real estate owned | 15,931 |
| | 26,522 |
| | 39,787 |
|
| Net cash paid in divestiture | (127,557 | ) | | — |
| | — |
|
| Net cash acquired (paid) in acquisition, net of consideration paid | 116,867 |
| | (149,658 | ) | | 39,328 |
|
| Net cash provided by investing activities | 248,958 |
| | 282,245 |
| | 123,389 |
|
| | | | | | |
|
| | | | | | | | | | | |
UMPQUA HOLDINGS CORPORATION AND SUBSIDIARIES
CONSOLIDATED STATEMENTS OF CASH FLOW (Continued) For the Years Ended December 31, 2014, 2013 and 2012 (in thousands) | | | | | |
| | | | | | |
| | 2014 | | 2013 | | 2012 |
| CASH FLOWS FROM FINANCING ACTIVITIES: | |
| | |
| | |
|
| Net increase (decrease) in deposit liabilities | 905,396 |
| | (261,184 | ) | | (107,445 | ) |
| Net (decrease) increase in securities sold under agreements to repurchase | (496,307 | ) | | 87,807 |
| | 12,470 |
|
| Repayment of term debt | (97,003 | ) | | (211,727 | ) | | (55,404 | ) |
| Repayment of junior subordinated debentures | — |
| | (8,764 | ) | | — |
|
| Dividends paid on common stock | (99,233 | ) | | (50,768 | ) | | (46,201 | ) |
| Excess tax benefits from stock based compensation | 1,626 |
| | 65 |
| | 52 |
|
| Proceeds from stock options exercised | 6,116 |
| | 6,398 |
| | 981 |
|
| Repurchases and retirement of common stock | (7,183 | ) | | (9,360 | ) | | (7,436 | ) |
| Net cash provided (used) by financing activities | 213,412 |
| | (447,533 | ) | | (202,983 | ) |
| Net increase (decrease) in cash and cash equivalents | 814,748 |
| | 246,636 |
| | (54,979 | ) |
| Cash and cash equivalents, beginning of period | 790,423 |
| | 543,787 |
| | 598,766 |
|
| Cash and cash equivalents, end of period | $ | 1,605,171 |
| | $ | 790,423 |
| | $ | 543,787 |
|
| | | | | | |
| SUPPLEMENTAL DISCLOSURES OF CASH FLOW INFORMATION: | |
| | |
| | |
|
| Cash paid during the period for: | |
| | |
| | |
|
| Interest | $ | 55,235 |
| | $ | 40,826 |
| | $ | 52,198 |
|
| Income taxes | $ | 7,098 |
| | $ | 41,993 |
| | $ | 44,350 |
|
| SUPPLEMENTAL DISCLOSURE OF NONCASH INVESTING AND FINANCING ACTIVITIES: | | | | | |
| Change in unrealized losses on investment securities available for sale, net of taxes | $ | 16,987 |
| | $ | (29,378 | ) | | $ | (9,616 | ) |
| Change in unrealized losses on investment securities held to maturity | |
| | |
| | |
| related to factors other than credit, net of taxes | $ | 57 |
| | $ | 56 |
| | $ | 188 |
|
| Cash dividend declared on common stock and payable after period-end | $ | 33,109 |
| | $ | 16,936 |
| | $ | — |
|
| Transfer of loans to other real estate owned | $ | 24,873 |
| | $ | 24,193 |
| | $ | 24,686 |
|
| Transfer from FDIC indemnification asset to due from FDIC and other | $ | 3,606 |
| | $ | 4,075 |
| | $ | 23,057 |
|
| Acquisitions: | | | | | |
| Assets acquired | $ | 9,877,572 |
| | $ | 376,071 |
| | $ | 317,751 |
|
| Liabilities assumed | $ | 8,767,025 |
| | $ | 219,961 |
| | $ | 317,751 |
|
See notes to consolidated financial statements
NOTES TO CONSOLIDATED FINANCIAL STATEMENTS
Note 1 – Significant Accounting Policies
Years Ended December 31, 2011, 2010 and 2009NOTE 1. SIGNIFICANT ACCOUNTING POLICIES
Nature of Operations—Umpqua-Umpqua Holdings Corporation (the “Company”"Company") is a financial holding company headquarteredwith headquarters in Portland, Oregon, that is engaged primarily in the business of commercial and retail banking and the delivery of retail brokerage services. The Company provides a wide range of banking, assetwealth management, mortgage banking and other financial services to corporate, institutional and individual customers through its wholly-owned banking subsidiary Umpqua Bank (the “Bank”"Bank"). The Company engages in the retail brokerage business through its wholly-owned subsidiary Umpqua Investments, Inc. (“("Umpqua Investments”Investments"). The Bank also has a wholly-owned subsidiary, Financial Pacific Leasing Inc., a commercial equipment leasing company. The Company and its subsidiaries are subject to regulation by certain federal and state agencies and undergo periodic examination by these regulatory agencies.
Basis of Financial Statement Presentation—The-The consolidated financial statements have been prepared in accordance with accounting principles generally accepted in the United States and with prevailing practices within the banking and securities industries. In preparing such financial statements, management is required to make certain estimates and judgments that affect the reported amounts of assets and liabilities and disclosure of contingent assets and liabilities as of the date of the balance sheet and the reported amounts of revenues and expenses for the reporting period. Actual results could differ significantly from those estimates. Material estimates that are particularly susceptible to significant change relate to the determination of the allowance for loan and lease losses, the valuation of mortgage servicing rights, the fair value of junior subordinated debentures, the valuation of covered loans and the FDIC indemnification asset, and the valuation of goodwill and other intangible assets. Consolidation—The-The accompanying consolidated financial statements include the accounts of the Company, the Bank and Umpqua Investments. All significant intercompany balances and transactions have been eliminated in consolidation. As of December 31, 2011,2014, the Company had 1425 wholly-owned trusts (“Trusts”("Trusts") that were formed to issue trust preferred securities and related common securities of the Trusts. The Company has not consolidated the accounts of the Trusts in its consolidated financial statements in accordance with Financial Accounting Standards Board Accounting Standards Codification (“FASB”) ASC 810, Consolidation (“ASC 810”).statements. As a result, the junior subordinated debentures issued by the Company to the Trusts are reflected on the Company’sCompany's consolidated balance sheet as junior subordinated debentures. Subsequent events—The-The Company has evaluated events and transactions subsequent to December 31, 20112014 for potential recognition or disclosure. Cash and Cash Equivalents—Cash-Cash and cash equivalents include cash and due from banks, and temporary investments which are federal funds sold and interest bearing balances due from other banks. Cash and cash equivalents generally have a maturity of 90 days or less at the time of purchase. Trading Account Securities—Debt-Debt and equity securities held for resale are classified as trading account securities and reported at fair value. Realized and unrealized gains or losses are recorded in non-interest income. Investment Securities—Debt-Debt securities are classified asheld to maturityif the Company has both the intent and ability to hold those securities to maturity regardless of changes in market conditions, liquidity needs or changes in general economic conditions. These securities are carried at cost adjusted for amortization of premium and accretion of discount, computed by the effective interest method over their contractual lives. Securities are classified asavailable for saleif the Company intends and has the ability to hold those securities for an indefinite period of time, but not necessarily to maturity. Any decision to sell a security classified as available for sale would be based on various factors, including significant movements in interest rates, changes in the maturity mix of assets and liabilities, liquidity needs, regulatory capital considerations and other similar factors. Securities available for sale are carried at fair value. Unrealized holding gains or losses are included in other comprehensive income as a separate component of shareholders’shareholders' equity, net of tax. Realized gains or losses, determined on the basis of the cost of specific securities sold, are included in earnings. Premiums and discounts are amortized or accreted over the life of the related investment security as an adjustment to yield using the effective interest method. Dividend and interest income are recognized when earned.Umpqua Holdings Corporation
Transfers of securities from available for sale to held to maturity are accounted for at fair value as of the date of the transfer. The difference between the fair value and
SubsidiariesPriorthe par value at the date of transfer is considered a premium or discount and is accounted for accordingly. Any unrealized gain or loss at the date of the transfer is reported in OCI, and is amortized over the remaining life of the security as an adjustment of yield in a manner consistent with the amortization of any premium or discount, and will offset or mitigate the effect on interest income of the amortization of the premium or discount for that held to maturity security.
We review investment securities on an ongoing basis for the second quarterpresence of 2009, the Company would assess an other-than-temporary impairment (“OTTI”("OTTI") or permanent impairment, based on thetaking into consideration current market conditions, fair value in relationship to cost, extent and nature of the declinechange in fair value, issuer rating changes and trends, whether the Company has the ability and intent to hold the investments until a market price recovery. If the Company determined a security to be other-than-temporarily or permanently impaired, the full amount of impairment would be recognized through earnings in its entirety. New guidance related to the recognition and presentation of OTTI of debt securities became effective in the second quarter of 2009. Rather than asserting whether a Company has the ability and intent to hold an investment until a market price recovery, a Company must consider whether it intendswe intend to sell a security or if it is likely that they wouldwe will be required to sell the security before recovery of theour amortized cost basis of the investment, which may be maturity.maturity, and other factors. For debt securities, if we intend to sell the security or it is likely that we will be required to sell the security before recovering its cost basis, the entire impairment loss would be recognized in earnings as an OTTI. If we do not intend to sell the security and it is not likely that we will be required to sell the security but we do not expect to recover the entire amortized cost basis of the security, only the portion of the impairment loss representing credit losses would be recognized in earnings. The credit loss on a security is measured as the difference between the amortized cost basis and the present value of the cash flows expected to be collected. Projected cash flows are discounted by the original or current effective interest rate depending on the nature of the security being measured for potential OTTI. The remaining impairment related to all other factors, the difference between the present value of the cash flows expected to be collected and fair value, is recognized as a charge to other comprehensive income (“OCI”("OCI"). Impairment losses related to all other factors are presented as separate categories within OCI. For investment securities held to maturity, this amount is accreted over the remaining life of the debt security prospectively based on the amount and timing of future estimated cash flows. The accretion of the OTTI amount recorded in OCI increaseswill increase the carrying value of the investment, and doeswould not affect earnings. If there is an indication of additional credit losses the security is re-evaluated accordingre-evaluated.
Loans Held for Sale-The Company has elected to the procedures described above. OTTI losses totaling $359,000, $414,000, and $10.6 million were recognized through earnings in the years ended December 31, 2011, 2010 and 2009, respectively, within total gain (loss) on investment securities, net.Transfers of securities from availableaccount for loans held for sale, to held to maturity are accounted forwhich is comprised of residential mortgage loans, at fair value. Fair value asis determined based on quoted secondary market prices for similar loans, including the implicit fair value of the dateembedded servicing rights. The change in fair value of the transfer. The difference betweenloans held for sale is primarily driven by changes in interest rates subsequent to loan funding and changes in the fair value andof related servicing asset, resulting in revaluation adjustments to the parrecorded fair value. The inputs used in the fair value at the date of transfer ismeasurements are considered a premium or discount and is accounted for accordingly. Any unrealized gain or loss at the dateLevel 2 inputs. The use of the transferfair value option allows the change in the fair value of loans to more effectively offset the change in the fair value of derivative instruments that are used as economic hedges to loans held for sale. Loan origination fees and direct origination costs are recognized immediately in net income in accordance with the fair value option accounting requirements. Interest income on loans held for sale is reportedincluded in OCI, interest income in the
Consolidated Statements of Income and is amortized over the remaining life of the security as an adjustment of yieldrecognized when earned. Loans held for sale are placed on nonaccrual in a manner consistent with the amortization of any premium or discount,loans. Acquired Loans and will offset or mitigate the effect on interest income of the amortization of the premium or discount for that held to maturity security.Leases
Loans Held for Sale—Loans held for sale includes mortgage-Purchased loans and leases are reportedrecorded at their fair value at the loweracquisition date. Credit discounts are included in the determination of cost or market value. Cost generally approximates market value, given the short duration of these assets. Gains orfair value; therefore, an allowance for loan and lease losses on the sale of loans that are held for sale are recognizedis not recorded at the time of the saleacquisition date. Acquired loans are evaluated upon acquisition and determined by the difference between net sale proceeds and the net book value of theclassified as either purchased impaired or purchased non-impaired. Purchased impaired loans less the estimated fair value of any retained mortgage servicing rights.Non-Covered Loans—Loans are stated at the amount of unpaid principal, net of unearned income and any deferred fees or costs. All discounts and premiums are recognized over the estimated life of the loan as yield adjustments. This estimated life is adjusted for prepayments.
Loans are classified asimpairedwhen, based on current information and events,reflect credit deterioration since origination such that it is probable at acquisition that the BankCompany will be unable to collect the scheduled payments of principal and interest when due, in accordance with the terms of the original loan agreement. The carrying value ofall contractually required payments.
Purchased impaired
loans is based on the present value of expected future cash flows (discounted at each loan’s effective interest rate) or, for collateral dependent loans, at fair value of the collateral, less selling costs. If the measurement of each impaired loans’ value is less than the recorded investment in the loan, we recognize this impairment and adjust the carrying value of the loan to fair value through the allowance for loan and lease losses. This can be accomplished by charging-off the impaired portion of the loan or establishing a specific component to be provided for in the allowance for loan and lease losses.Covered Loans—Loans acquired in a FDIC-assisted acquisition that are subject to a loss-share agreement are referred to as “covered loans” and reported separately in our consolidated balance sheets. Covered loans are reported exclusive of the expected cash flow reimbursements expected from the FDIC. Acquired loans are aggregated into pools based on individually evaluated common risk characteristics and aggregate expected cash flows were estimated for each pool. A pool is accounted
for as a single asset with a single interest rate, cumulative loss rate and cash flow expectation. The Company aggregated all ofrisk characteristics used to aggregate the purchased impaired loans acquired in the FDIC-assisted acquisitions into different pools based on common risk characteristics such asinclude risk rating, underlying collateral, type of interest rate (fixed or adjustable), types of amortization, loan purpose, and other similar factors. A loan will be removed from a pool of loans only if the loan is sold, foreclosed, or assets are received in full satisfaction of the loan, and will be removed from the pool at its carrying value. If an individual loan is removed from a pool of loans, the difference between its relative carrying amount and its cash, fair value of the collateral, or other assets received will be recognized in income immediately as interest income on loans and would not affect the effective yield used to recognize the accretable yield on the remaining pool. Loans originally placed into a performing pool are not reported individually as 30-89 days past due, non-performing (90+ days past due or nonaccrual), or accounted for as a troubled debt restructuring as the pool is the unit of accounting. Rather, these metrics related to the underlying loans within a performing pool will be considered in our ongoing assessment and estimates of future cash flows. If, at acquisition, the loans are collateral dependent and acquired primarily for the rewards of ownership of the underlying collateral, or if cash flows expected to be collected cannot be reasonably estimated, accrual of income is inappropriate.
The cash flows expected to be received over the life of the pool were estimated by
management with the assistance of a third party valuation specialist.management. These cash flows were input into a
FASB ASC 310-30,Loans and Debt Securities Acquired with Deteriorated Credit Quality (“ASC 310-30”) compliant loan accounting system which calculates the carrying values of the pools and underlying loans, book yields, effective interest income and impairment, if any, based on actual and projected events. Default rates, loss severity, and prepayment
speedsspeed assumptions will be periodically reassessed and updated within the accounting system to update our expectation of future cash flows. The excess of the cash flows expected to be collected over a
pool’spool's carrying value is considered to be the accretable yield and is recognized as interest income over the estimated life of the
loan or pool using the effective yield method. The accretable yield may change due to changes in the timing and amounts of expected cash flows. Changes in the accretable yield are disclosed quarterly.
The excess of the undiscounted contractual balances due over the cash flows expected to be collected is considered to be the nonaccretable difference. The nonaccretable difference represents our estimate of the credit losses expected to occur and was considered in determining the fair value of the loans as of the acquisition date. Subsequent to the acquisition date, any increases in expected cash flows over those expected at purchase date in excess of fair value are adjusted through
an increasea change to the accretable yield on a prospective basis. Any subsequent decreases in expected cash flows attributable to credit deterioration are recognized by recording a provision for
covered loan losses.
The coveredpurchased impaired loans acquired are and will continue to be subject to the Company’sCompany's internal and external credit review and monitoring. If credit deterioration is experienced subsequent to the initial acquisition fair value amount, such deterioration will be measured, and a provision for credit losses will be charged to earnings. These provisions will be mostly offset by an increase to the FDIC indemnification asset, and will be recognized in non-interest income.
The
coveredpurchased impaired loan portfolio also includes revolving lines of credit with funded and unfunded commitments. Balances outstanding at the time of acquisition are accounted for
under ASC 310-30.as purchased impaired. Any additional advances on these loans subsequent to the acquisition date are not accounted for
under ASC 310-30.as purchased impaired.
Based on the characteristics of loans acquired in a Federal Deposit Insurance Corporation ("FDIC") assisted transaction and the impact of associated loss-sharing arrangements, the Company determined that it was appropriate to apply the expected cash flows approach described above to all loans acquired in such transactions. Loans acquired in a FDIC-assisted acquisition that are subject to a loss-share agreement are referred to as "covered loans." Covered loans are reported exclusive of the expected cash flow reimbursements expected from the FDIC.
For purchased non-impaired loans, the difference between the fair value and unpaid principal balance of the loan at the acquisition date is amortized or accreted to interest income over the life of the loans.
For purchased leases and equipment finance loans, the difference in the cash flows expected to be collected over the initial allocation of fair value to the acquired leases and loans is accreted into interest income over their related term based on the effective interest method.
Originated Loans and Leases-Loans are stated at the amount of unpaid principal, net of unearned income and any deferred fees or costs. All discounts and premiums are recognized over the estimated life of the loan as yield adjustments. Leases are recorded at the amount of minimum future lease payments receivable and estimated residual value of the leased equipment, net of unearned income and any deferred fees. Initial direct costs related to lease originations are deferred as part of the investment in direct financing leases and amortized over their term using the effective interest method. Unearned lease income is amortized over their term using the effective interest method.
Loans are classified as impaired when, based on current information and events, it is probable that the Bank will be unable to collect the scheduled payments of principal and interest when due, in accordance with the terms of the original loan agreement. The carrying value of impaired loans is based on the present value of expected future cash flows (discounted at each loan's effective interest rate), estimated note sale price, or, for collateral dependent loans, at fair value of the collateral, less selling costs. If the measurement of each impaired loans' value is less than the recorded investment in the loan, we recognize this impairment and adjust the carrying value of the loan to fair value through the allowance for loan and lease losses. This can be accomplished by charging off the impaired portion of the loan or establishing a specific component to be provided for in the allowance for loan and lease losses.
FDIC Indemnification Asset—The-The Company has elected to accountaccounts for amounts receivable under the loss-share agreement as an indemnification asset in accordance with FASB ASC 805,Business Combinations.asset. The FDIC indemnification asset is initially recorded at fair value, based on the discounted value of expected future cash flows under the loss-share agreement. The difference between the present value and the undiscounted cash flows the Company expects to collect from the FDIC will be accreted into non-interest income over the life of the FDIC indemnification asset.
Subsequent to initial recognition, the FDIC indemnification asset is reviewed quarterly and adjusted for any changes in expected cash flows based on recent performance and expectations for future performance of the covered portfolio. These adjustments are measured on the same basis as the related covered loans, at a pool level, and covered other real estate owned. Generally, any increases in cash flow of the covered assets over those previously expected will result in prospective increases in the loan pool yield and amortization of the FDIC indemnification asset. Any decreases in cash flow of the covered assets under those previously expected will trigger impairments on the underlying loan pools and will result in a corresponding gain of the
Umpqua Holdings Corporation and Subsidiaries
FDIC indemnification asset. Increases and decreases to the FDIC indemnification asset are recorded as adjustments to non-interest income. The resulting carrying value of the indemnification asset represents the present value of amounts recoverable from the FDIC for future expected losses, and the amounts due from the FDIC for claims related to covered losses.
losses the Company has incurred less amounts due back to the FDIC relating to shared recoveries.
Income Recognition on Non-Covered, Non-Accrual and Impaired Loans—Non-covered loans,- Loans, including impaired non-covered loans, are classified as non-accrual if the collection of principal and interest is doubtful. Generally, this occurs when a non-covered loan is past due as to maturity or payment of principal or interest by 90 days or more, unless such non-covered loans are well-secured and in the process of collection. Generally, if a non-covered loan or portion thereof is partially charged-off, the non-covered loan is considered impaired and classified as non-accrual. Non-covered loansLoans that are less than 90 days past due may also be classified as non-accrual if repayment in full of principal and/or interest is in doubt.When
Generally, when a
non-covered loan is classified as non-accrual, all uncollected accrued interest is reversed to interest income and the accrual of interest income is terminated. Generally, any cash payments are applied as a reduction of principal outstanding. In cases where the future collectability of the principal balance in full is expected, interest income may be recognized on a cash basis. A
non-covered loan may be restored to accrual status when the
borrower’sborrower's financial condition improves so that full collection of future contractual payments is considered likely. For those
non-covered loans placed on non-accrual status due to payment delinquency,
thisreturn to accrual status will generally not occur until the borrower demonstrates repayment ability over a period of not less than six months.
Non-covered
Loans and leases are reported as past due when installment payments, interest payments, or maturity payments are past due based on contractual terms. All loans determined to be impaired are individually assessed for impairment except for homogeneous loans which are collectively evaluated for impairment. The specific factors considered in determining that a loan is impaired include borrower financial capacity, current economic, business and market conditions, collection efforts, collateral position and other factors deemed relevant. Generally, impaired loans are placed on non-accrual status and all cash receipts are applied to the principal balance. Continuation of accrual status and recognition of interest income on impaired loans is generally limited to performing restructured loans.
Loans are reported as restructured when the Bank grants a
more than insignificant concession(s) to a borrower experiencing financial difficulties that it would not otherwise consider. Examples of such concessions include forgiveness of principal or accrued interest, extending the maturity date or providing a lower interest rate than would be normally available for a transaction of similar risk. As a result of these concessions, restructured loans are impaired as the Bank will not collect all amounts due, both principal and interest, in accordance with the terms of the original loan agreement. Impairment reserves on non-collateral dependent restructured loans are measured by comparing the present value of expected future cash flows on the restructured loans discounted at the interest rate of the original loan agreement to the
loan’sloan's carrying value. These impairment reserves are recognized as a specific component to be provided for in the allowance for loan and lease losses.
The decision to classify a
non-covered loan as impaired is made by the
Bank’sBank's Allowance for Loan and Lease Losses
(“ALLL”("ALLL") Committee. The ALLL Committee meets regularly to review the status of all problem and potential problem loans. If the ALLL Committee concludes a loan is impaired but recovery of
the full principal and interest is expected, an impaired loan may remain on accrual status.
Allowance for Loan and Lease Losses—- The Bank performs regular credit reviews of the loan and lease portfolio to determine the credit quality of the portfolio and the adherence to underwriting standards. When loans and leases are originated, they are assigned a risk rating that is reassessed periodically during the term of the loan through the credit review process. The Company’sCompany's risk rating methodology assigns risk ratings ranging from 1 to 10, where a higher rating represents higher risk. The 10 risk rating categories are a primary factor in determining an appropriate amount for the allowance for loan and lease losses. The Bank has a management ALLL Committee, which is responsible for, among other things, regularly reviewing the ALLL methodology, including loss factors, and ensuring that it is designed and applied in accordance with generally accepted accounting principles. The ALLL Committee reviews and approves loans and leases recommended for impaired status. The ALLL Committee also approves removing loans and leases from impaired status. The Bank’sBank's Audit and Compliance Committee provides board oversight of the ALLL process and reviews and approves the ALLL methodology on a quarterly basis.Each risk rating is assessed an inherent credit loss factor that determines the amount of the allowance for loan and lease losses provided for that group of loans and leases with similar risk rating. Credit loss factors may vary by region based on management’s belief that there may ultimately be different credit loss rates experienced in each region.
Regular credit reviews of the portfolio also identify loans that are considered potentially impaired. Potentially impaired loans are referred to the ALLL Committee which reviews and approves designated loans as impaired. A loan is considered impaired when based on current information and events, we determine that we will
probablymore than likely not be able to collect all amounts due according to the loan contract, including scheduled interest payments. When we identify a loan as impaired, we measure the impairment
using discounted cash flows or estimated note sale price, except when the sole remaining source of the repayment for the loan is the liquidation of the collateral. In these cases, we use the current fair value of the collateral, less selling costs, instead of discounted cash flows. If we determine that the value of the impaired loan is less than the recorded investment in the loan, we either recognize this impairment reserve as a specific component to be provided for in the allowance for loan and lease losses or charge-off the impaired balance on collateral dependent loans if it is determined that such amount represents a confirmed loss. The combination of the risk rating-based allowance component and the impairment reserve allowance component lead to an allocated allowance for loan and lease losses.
The Bank may also maintain an unallocated allowance amount to provide for other credit losses inherent in a loan and lease portfolio that may not have been contemplated in the credit loss factors. This unallocated amount generally comprises less than 10%5% of the allowance, but may be maintained at higher levels during times of economic conditions characterized by falling real estate values. The unallocated amount is reviewed periodically based on trends in credit losses, the results of credit reviews and overall economic trends. As adjustments become necessary, they are reported in earnings in the periods in which they become known as a change in the provision for loan and lease losses and a corresponding charge to the allowance. Loans, or portions thereof, deemed uncollectible are charged to the allowance. Provisions for losses, and recoveries on loans previously charged-off, are added to the allowance.
The adequacy of the ALLL is monitored on a regular basis and is based on
management’smanagement's evaluation of numerous factors. These factors include the quality of the current loan portfolio; the trend in the loan
portfolio’sportfolio's risk ratings; current economic conditions; loan concentrations; loan growth rates; past-due and non-performing trends; evaluation of specific loss estimates for all significant problem loans; historical charge-off and recovery experience; and other pertinent information.
Management believes that the ALLL was adequate as of December 31, 2011.2014. There is, however, no assurance that future loan losses will not exceed the levels provided for in the ALLL and could possibly result in additional charges to the provision for loan and lease losses. In addition, bank regulatory authorities, as part of their periodic examination of the Bank, may require additional charges to the provision for loan and lease losses in future periods if warranted as a result of their review. Approximately 80% of our loan portfolio is secured by real estate, and a significant decline in real estate market values may require an increase in the allowance for loan and lease losses. The U.S. recession, the housing market downturn, and declining real estate values in our markets have negatively impacted aspects of our loan portfolio, and have led to an increase in non-performing loans, charge-offs, and the allowance for loan and lease losses. A continued deterioration or prolonged delay in economic recovery in our markets may adversely affect our loan portfolio and may lead to additional charges to the provision for loan and lease losses. Reserve for Unfunded Commitments—A-A reserve for unfunded commitments ("RUC") is maintained at a level that, in the opinion of management, is adequate to absorb probable losses associated with the Bank’sBank's commitment to lend funds under existing agreements such as letters or lines of credit. Management determines the adequacy of the reserve for unfunded commitments based upon reviews of individual credit facilities, current economic conditions, the risk characteristics of the various categories of commitments and other relevant factors. The reserve is based on estimates, and ultimate losses may vary from the current estimates. These estimates are evaluated on a regular basis and, as adjustments become necessary, they are reported in earnings in the periods in which they become known. Draws on unfunded commitments that are considered uncollectible at the time funds are advanced are charged to the allowance.allowance for loan and lease losses. Provisions for unfunded commitment losses and recoveries on loans commitments previously charged-off, are added to the reserve for unfunded commitments, which is included in theOther Liabilities section of the consolidated balance sheets. Loan Fees and Direct Loan Origination Costs—Loan-Loans held for investment origination and commitment fees and direct loan origination costs are deferred and recognized as an adjustment to the yield over the life of the relatedportfolio loans. Restricted Equity Securities—Restricted-Restricted equity securities were $32.6$119.3 million and $34.5$30.7 million at December 31, 20112014 and 2010,2013, respectively. Federal Home Loan Bank stock amounted to $31.3$117.9 million and $33.2$29.4 million of the total restricted securities as of December 31, 20112014 and 2010,2013, respectively. Federal Home Loan Bank stock represents the Bank’sBank's investment in theUmpqua Holdings Corporation and Subsidiaries
Federal Home Loan Banks of Seattle and San Francisco (“FHLB”("FHLB") stock and is carried at par value, which reasonably approximates its fair value. Management periodically evaluates FHLB stock for other-than-temporary or permanent impairment. Management’sManagement's determination of whether these investments are impaired is based on its assessment of the ultimate recoverability of cost rather than by recognizing temporary declines in value. The determination of whether a decline affects the ultimate recoverability of cost is influenced by criteria such as (1) the significance of any decline in net assets of the FHLB as compared to the capital stock amount for the FHLB and the length of time this situation has persisted, (2) commitments by the FHLB to make payments required by law or regulation and the level of such payments in relation to the operating performance of the FHLB, (3) the impact of legislative and regulatory changes on institutions and, accordingly, the customer base of the FHLB, and (4) the liquidity position of the FHLB.
Moody’s Investors Services rating of the FHLB of Seattle as Aaa was confirmed in August 2011, but a negative outlook was assigned as Moody’s revised the rating outlook to negative for U.S. government debt and all issuers Moody’s considers directly-linked to the U.S. government. Standard and Poors’ rating is AA+, but it also issued a negative outlook with the action reflecting the downgrade of the long-term sovereign credit rating of the U.S. in 2011. Based on the above, the Company has determined there is not an other-than-temporary impairment on the FHLB stock investment as of December 31, 2011.
As a member of the FHLB system, the Bank is required to maintain a minimum level of investment in FHLB stock based on specific percentages of its outstanding mortgages, total assets, or FHLB advances. At December 31, 2011,2014, the Bank’sBank's minimum required investment in FHLB stock was $10.5$56.1 million. The Bank may request redemption at par value of any stock in excess of the minimum required investment. Stock redemptions are at the discretion of the FHLB. The remaining restricted equity securities balance primarily represents an investment in Pacific Coast Bankers’Bankers' Bancshares stock. Premises and Equipment—Premises-Premises and equipment are stated at cost less accumulated depreciation and amortization. Depreciation is provided over the estimated useful life of equipment, generally three to ten years, on a straight-line or accelerated basis. Depreciation is provided over the estimated useful life of premises, up to 39 years, on a straight-line or accelerated basis. Generally, leasehold improvements are amortized over the life of the related lease, or the life of the related asset, whichever is shorter. Expenditures for major renovations and betterments of the Company’sCompany's premises and equipment are capitalized. Management reviews long-lived
and intangible assets any time that a change in circumstance indicates that the carrying amount of these assets may not be recoverable. Recoverability of these assets is determined by comparing the carrying value of the asset to the forecasted undiscounted cash flows of the operation associated with the asset. If the evaluation of the forecasted cash flows indicates that the carrying value of the asset is not recoverable, the asset is written down to fair value.
Goodwill and Other Intangibles—Intangible-Intangible assets are comprised of goodwill and other intangibles acquired in business combinations. Goodwill and intangible assets with indefinite useful lives are not amortized. Intangible assets with definite useful lives are amortized to their estimated residual values over their respective estimated useful lives, and also reviewed for impairment. Amortization of intangible assets is included in other non-interest expense in theConsolidated Statements of OperationsIncome. The Company performs a goodwill impairment analysis on an annual basis as of December 31. Additionally, the Company performs a goodwill impairment evaluation on an interim basis when events or circumstances indicate impairment potentially exists. A significant amount of judgment is involved in determining if an indicator of impairment has occurred. Such indicators may include, among others, a significant decline in our expected future cash flows; a sustained, significant decline in our stock price and market capitalization; a significant adverse change in legal factors or in the business climate; adverse action or assessment by a regulator; and unanticipated competition.
On at least an annual basis, we assess qualitative factors to determine whether it is necessary to perform a quantitative impairment test. The goodwillquantitative impairment test involves a two-step process. The first step compares the fair value of a reporting unit to its carrying
value. If the reporting
unit’sunit's fair value is less than its carrying value, the Company would be required to proceed to the second step. In the second step the Company calculates the implied fair value of the reporting
unit’sunit's goodwill. The implied fair value of goodwill is determined in the same manner as goodwill recognized in a business combination. The estimated fair value of the
Companyreporting unit is allocated to all of the
Company’sreporting unit's assets and liabilities, including any unrecognized identifiable intangible
assets, as if the Companyreporting unit had been acquired in a business combination and the estimated fair value of the reporting unit is the price paid to acquire it. The allocation process is performed only for purposes of determining the amount of goodwill impairment. No assets or liabilities are written up or down, nor are any additional unrecognized identifiable intangible assets recorded as a part of this process. Any excess of the estimated purchase price over the fair value of the reporting unit’sunit's net assets represents the implied fair value of goodwill. If the carrying amount of the goodwill is greater than the implied fair value of that goodwill, an impairment loss would be recognized as a charge to earnings in an amount equal to that excess.
Residential Mortgage Servicing Rights (“MSR”("MSR")—- The Company determines its classes of servicing assets based on the asset type being serviced along with the methods used to manage the risk inherent in the servicing assets, which includes the market inputs used to value the servicing assets. The Company measures its residential mortgage servicing assets at fair value and reports changes in fair value through earnings. Fair value adjustments that encompass market-driven valuation changes and the runoff in value that occurs from the passage of time, are each separately reported. Under the fair value method, the MSR is carried in the balance sheet at fair value and the changes in fair value are reported in earnings under the caption residential mortgage banking revenue in the period in which the change occurs. Retained
mortgage servicing rightsMSR are measured at fair value as of the date of sale.
We use quoted market prices when available. Subsequent fair value measurements are determined using a discounted cash flow model. In order to determine the fair value of the MSR, the present value of
net expected future cash flows is estimated. Assumptions used include market discount rates, anticipated prepayment speeds, delinquency and foreclosure rates, and ancillary fee
income.income net of servicing costs. This model is periodically validated by an independent external model validation group. The model assumptions and the MSR fair value estimates are also compared to observable trades of similar portfolios as well as to MSR broker valuations and industry surveys, as available.
Key assumptions used in measuring the fair value of MSR as of December 31 were as follows: | | | | | | | | | | | | |
| | | 2011 | | | 2010 | | | 2009 | |
Constant prepayment rate | | | 20.39% | | | | 18.54% | | | | 18.35% | |
Discount rate | | | 8.60% | | | | 8.62% | | | | 8.70% | |
Weighted average life (years) | | | 4.5 | | | | 4.5 | | | | 4.5 | |
The expected life of the loan can vary from
management’smanagement's estimates due to prepayments by borrowers, especially when rates fall. Prepayments in excess of
management’smanagement's estimates would negatively impact the recorded value of the
residential mortgage servicing rights. The value of the
residential mortgage servicing rights is also dependent upon the discount rate used in the model, which we base on current market rates. Management reviews this rate on an ongoing basis based on current market rates. A significant increase in the discount rate would reduce the value of
residential mortgage servicing rights.
SBA/USDA Loans Sales, Servicing, and Commercial Servicing—The Asset-The Bank, on a limited basis, sells or transfers loans, including the guaranteed portion of Small Business Administration (“SBA”("SBA") and Department of Agriculture (“USDA”("USDA") loans (with servicing retained) for cash proceeds equal to the principal amount of loans, as adjusted to yield interest to the investor based upon the current market rates. The Bank records ana servicing asset representing the right to service loans for others when it sells a loan and retains the servicing rights. The carryingservicing asset is recorded at fair value of loans is allocated between the loanupon sale, and the servicing rights, based on their relative fair values. The fair value of servicing rights is estimated by discounting estimated net future cash flows from servicing using discount rates that approximate current market rates and using estimated prepayment rates. TheSubsequent to initial recognition, the servicing rights are carried at the lower of amortized cost or fair market value, and are amortized in proportion to, and over the period of, the estimated net servicing income, assuming prepayments.income. For purposes of evaluating and measuring impairment, the fair value of Commercial and SBA servicing rights are based onmeasured using a discounted estimated net future cash flow methodology, current prepayment speeds and market discount rates.model as described above. Any impairment is measured as the amount by which the carrying value of servicing rights for a stratuman interest rate-stratum exceeds its fair value. The carrying value of SBA/USDA servicing rights at December 31, 2011 and 2010 were $666,000 and $721,000, respectively. No impairment charges were recorded for the years ended December 31, 2011, 2010 or 20092014, 2013 and 2012, related to SBA/USDAthese servicing assets. A premium over the adjusted carrying value is received upon the sale of the guaranteed portion of an SBA or USDA loan. The
Bank’sBank's investment in an SBA or USDA loan is allocated among the sold and retained portions of the loan based on the relative fair value of each portion at the time of loan origination, adjusted for payments and other activities. Because the portion
Umpqua Holdings Corporation and Subsidiaries
retained does not carry an SBA or USDA guarantee, part of the gain recognized on the sold portion of the loan may beis deferred and amortized as a yield enhancement on the retained portion in order to obtain a market equivalent yield.
Non-Covered Other Real Estate Owned—Non-covered other- Other real estate owned (“non-covered OREO”("OREO") represents real estate which the Bank has taken control of in partial or full satisfaction of loans. At the time of foreclosure, other real estate ownedOREO is recorded at the lower of the carrying amount of the loan or fair value less costs to sell the property, which becomes the property’sproperty's new basis. Any write-downs based on the asset’sasset's fair value at the date of acquisition are charged to the allowance for loan and lease losses. After foreclosure, management periodically performs valuations such that the real estate is carried at the lower of its new cost basis or fair value, net of estimated costs to sell. Subsequent valuation adjustments are recognized within net loss on non-covered OREO. Revenue and expenses from operations and subsequent adjustments to the carrying amount of the property are included in other non-interest expense in theConsolidated Statements of OperationsIncome.
In some instances, the Bank may make loans to facilitate the sales of other real estate owned. Management reviews all sales for which it is the lending institution
to determine if it meets the criteria to recognize the sale for
compliance with sales treatment under provisions established within FASB ASC 360-20,Real Estate Sales.accounting purposes. Any gains related to sales of other real estate owned may be deferred until the buyer has a sufficient initial and continuing investment in the property.
Covered Other Real Estate Owned—All OREO acquired in FDIC-assisted acquisitions that are subject to a FDIC loss-share agreement are referred to as “covered OREO” and reported separately in our statements of financial position. Covered OREO is reported exclusive of expected reimbursement cash flows from the FDIC. Foreclosed covered loan collateral is transferred into covered OREO at the collateral’s net realizable value, less selling costs.
Covered OREO was initially recorded at its estimated fair value on the acquisition date based on similar market comparable valuations less estimated selling costs.
Any subsequent valuation adjustments due to declines in fair value will be charged to non-interest expense, and will be mostly offset by non-interest income representing the corresponding increase to the FDIC indemnification asset for the offsetting loss reimbursement amount. Any recoveries of previous valuation adjustments will be credited to non-interest expense with a corresponding charge to non-interest income for the portion of the recovery that is due to the FDIC.
Income Taxes—Income-Income taxes are accounted for using the asset and liability method. Under this method a deferred tax asset or liability is determined based on the enacted tax rates which will be in effect when the differences between the financial statement carrying amounts and tax basis of existing assets and liabilities are expected to be reported in the Company’sCompany's income tax returns. The effect on deferred taxes of a change in tax rates is recognized in income in the period that includes the enactment date. Valuation allowances are established to reduce the net carrying amount of deferred tax assets if it is determined to be more likely than not, that all or some portion of the potential deferred tax asset will not be realized. Derivative Loan Commitments—TheDerivatives-The Bank enters into forward delivery contracts to sell residential mortgage loans or mortgage-backed securities to broker/dealers at specific prices and dates in order to hedge the interest rate risk in its portfolio of mortgage loans held for sale and its residential mortgage loan commitments. The commitments to originate mortgage loans held for sale and the related forward delivery contracts are considered derivatives. Effective in the second quarter of 2011, theThe Bank began executingalso executes interest rate swaps with commercial banking customers to facilitate their respective risk management strategies. Those interest rate swaps are simultaneously hedged by offsetting the interest rate swaps that the Bank executes with a third party, such that the Bank minimizes its net risk exposure. The Company considers all free-standing derivatives as economic hedges and recognizes allthese derivatives as either assets or liabilities in the balance sheet and requires measurement of those instruments at fair value through adjustments to accumulated other comprehensive income and/or current earnings, as appropriate.earnings. None of the Company’sCompany's derivatives are designated as hedging instruments. Rather, they are accounted for as free-standing derivatives, or economic hedges, and the Company reports changes in fair values of its derivatives in current period net income.The fair value of the derivative
residential mortgage loan commitments is estimated using the
net present value of expected future cash flows. Assumptions used include pull-through rate assumption based on historical information, current mortgage interest rates, the stage of completion of the underlying application and underwriting process,
direct origination costs yet to be incurred, the time remaining until the expiration of the derivative loan commitment, and the expected net future cash flows related to the associated servicing of the loan.
Operating Segments—- Public enterprises are required to report certain information about their operating segments in a complete set ofits financial statements to shareholders.statements. They are also required to report certain enterprise-wide information about the Company’sCompany's products and services, its activities in different geographic areas, and its reliance on major customers. The basis for determining the Company’sCompany's operating segments is the manner in which management operates the business. Management has identified threetwo primary business segments, Community Banking, Mortgage Banking, and Wealth Management. Prior to January 1, 2011, the Company reported Retail Brokerage, consisting of Umpqua Investments, as its own segment. Effective in 2011, the Company began reporting Umpqua Investments, Umpqua Private Bank, and Umpqua Financial Advisors under the Wealth Management segment. Umpqua Private Bank and Umpqua Financial Advisors do not meet the quantitative thresholds for reporting as separate segments and service the same customer base on Umpqua Investments.Home Lending. Share-Based Payment—The Company has two active stock-based compensation plans that provide for the granting of stock options and restricted stock to eligible employees and directors. In accordance with FASB ASC 718,Stock Compensation,we-We recognize in the income statement the grant-date fair value of stock options and other equity-based forms of compensation issued to employees over the employees’employees' requisite service period (generally the vesting period). The requisite service period may be subject to performance conditions.The Company’s 2003 Stock Incentive Plan provides for granting of stock options and restricted stock awards.
Stock options and restricted stock awards generally vest ratably over
5three to five years and are recognized as expense over that same period of time.
The exercise price of each option equals the market price of the Company's common stock on the date of the grant, and the maximum term is ten years.
The fair value of each
option grant is estimated as of the grant date using the Black-Scholes option-pricing model
using assumptions noted in the following table.or a Monte Carlo simulation pricing model. Expected volatility is based on the historical volatility of the price of the
Company’sCompany's common stock. The Company uses historical data to estimate option exercise and stock option forfeiture rates within the valuation model. The expected term of options granted is determined based on historical experience with similar options, giving consideration to the contractual terms and vesting schedules, and represents the period of time that options granted are expected to be outstanding. The expected dividend yield is based on dividend trends and the market value of the
Company’sCompany's common stock at the time of grant. The risk-free rate is based on the U.S. Treasury yield curve in effect at the time of grant corresponding to the estimated expected term of the options granted.
The following weighted average assumptions were used to determine the fair value of stock option grants as of the grant date to determine compensation cost for the years ended December 31, 2011, 2010 and 2009: | | | | | | | | | | | | |
| | | 2011 | | | 2010 | | | 2009 | |
Dividend yield | | | 2.79% | | | | 2.72% | | | | 2.23% | |
Expected life (years) | | | 7.1 | | | | 7.1 | | | | 7.3 | |
Expected volatility | | | 52% | | | | 52% | | | | 46% | |
Risk-free rate | | | 2.71% | | | | 2.69% | | | | 2.18% | |
Weighted average grant date fair value of options granted | | $ | 4.65 | | | $ | 5.24 | | | $ | 3.65 | |
The Company’s 2007 Long Term Incentive Plan provides for granting of restricted stock units for the benefit of certain executive officers.
Restricted stock unit grants
and certain restricted stock awards are subject to performance-based
and market-based vesting as well as other approved vesting
conditions. The current restricted stock units outstandingconditions and cliff vest
after three years based on
performance and servicethose conditions. Compensation expense is recognized over the service period to the extent restricted stock units are expected to vest.
Earnings per Share—According to the provisions of FASB ASC 260,Earnings Per Share, nonvested ("EPS")-Nonvested share-based payment awards that contain nonforfeitable rights to dividends or dividend equivalents are participating securities and are included in the computation of EPS pursuant to the two-class method. The two-class method is an earnings allocation formula that determines earnings per share for each class of common stock and participating security according to dividends declared (or accumulated) and participation rights in undistributed earnings. Certain of the Company’sCompany's nonvested restricted stock awards qualify as participating securities. Net income less any preferred dividends accumulated for the period (whether or not declared), is allocated between the common stock and participating securities pursuant to the two-class method, based on their rights to receive dividends, participate in earnings or absorb losses.Basic earnings per common share is computed by dividing net earnings available toUmpqua Holdings Corporation and Subsidiaries
common shareholders by the weighted average number of common shares outstanding during the period, excluding participating nonvested restricted shares.
Diluted earnings per common share is computed in a similar manner, except that first the denominator is increased to include the number of additional common shares that would have been outstanding if potentially dilutive common shares, excluding the participating securities, were issued using the treasury stock method. For all periods presented, warrants, stock options, certain restricted stock awards and restricted stock units are the only potentially dilutive non-participating instruments issued by the Company. For a portion of 2014, the Company had warrants that also were potentially dilutive. Next, we determine and include in diluted earnings per common share calculation the more dilutive effect of the participating securities using the treasury stock method or the two-class method. Undistributed losses are not allocated to the nonvested share-based payment awards (the participating securities) under the two-class method as the holders are not contractually obligated to share in the losses of the Company. Advertising expenses—Advertising costs are generally expensed as incurred.Fair Value Measurements—FASB ASC 820,- Fair Value Measurements and Disclosure, (“ASC 820”, defines fair value is defined as the price that would be received to sell an asset or paid to transfer a liability in an orderly transaction between market participants at the measurement date. ASC 820 establishesThere is a three-level hierarchy for disclosure of assets and liabilities recordedmeasured or disclosed at fair value. The classification of assets and liabilities within the hierarchy is based on whether the inputs to the valuation methodology used for measurement are observable or unobservable. Observable inputs reflect market-derived or market-based information obtained from independent sources, while unobservable inputs reflect our estimates about market data. In general, fair values determined by Level 1 inputs utilize quoted prices for identical assets or liabilities traded in active markets that the Company has the ability to access. Fair values determined by Level 2 inputs utilize inputs other than quoted prices included in Level 1 that are observable for the asset or liability, either directly or indirectly. Level 2 inputs include quoted prices for similar assets and liabilities in active markets, and inputs other than quoted prices that are observable for the asset or liability, such as interest rates and yield curves that are observable at commonly quoted intervals. Level 3 inputs are unobservable inputs for the asset or liability, and include situations where there is little, if any, market activity for the asset or liability. In certain cases, the inputs used to measure fair value may fall into different levels of the fair value hierarchy. In such cases, the level in the fair value hierarchy within which the fair value measurement in its entirety falls has been determined based on the lowest level input that is significant to the fair value measurement in its entirety. The Company’sCompany's assessment of the significance of a particular input to the fair value measurement in its entirety requires judgment, and considers factors specific to the asset or liability.
Recently Issued Accounting Pronouncements—-
In April 2011,July 2013, the FASB issued ASU No. 2011-02,A Creditor’s Determination2013-11, Income Taxes (Topic 740: Presentation of Whetheran Unrecognized Tax Benefit When a RestructuringNet Operating Loss Carryforward, a Similar Tax Loss, or a Tax Credit Carryforward Exists. ASU No. 2013-11 requires an entity to present an unrecognized tax benefit, or a portion of an unrecognized tax benefit, as a reduction to a deferred tax asset for a net operating loss carryforward, a similar tax loss, or a tax credit carryforward, except to the extent a net operating loss carryforward, a similar tax loss, or a tax credit carryforward is a Troubled Debt Restructuring. The Update provides additional guidance relating to when creditors should classify loan modifications as troubled debt restructurings. The ASU also endsnot available at the deferral issued in January 2010reporting date under the tax law of the disclosures about troubled debt restructurings required by ASU No. 2010-20. The provisionsapplicable jurisdiction to settle any additional income taxes that would result from the disallowance of ASU No. 2011-02a tax position or the tax law of the applicable jurisdiction does not require the entity to use, and the disclosure requirements of ASU No. 2010-20 are effectiveentity does not intend to use, the deferred tax asset for such purpose, the Company’s interim reporting period ending September 30, 2011. The guidance applies retrospectively to restructurings occurring on or after January 1, 2011. The adoption of this ASU did not have a material impact on the Company’s consolidated financial statements.In April 2011, the FASB issued ASU No. 2011-03,Reconsideration of Effective Control for Repurchase Agreements. The Update amends existing guidance to remove from the assessment of effective control, the criterion requiring the transferor to have the ability to repurchase or redeem the financial assets on substantially the agreed terms, even in the event of default by the transferee and, as well, the collateral maintenance implementation guidance related to that criterion. ASU No. 2011-03 is effective for the Company’s reporting period beginning on or after December 15, 2011. The guidance applies prospectively to transactions or modification of existing transactions that occur on or after the effective date and early adoption is not permitted. The adoption of this ASU will not have a material impact on the Company’s consolidated financial statements.
In April 2011, the FASB issued ASU No. 2011-04,Amendments to Achieve Common Fair Value Measurement and Disclosure Requirements in U.S. GAAP and IFRSs. The Update amends existing guidance regarding the highest and best use and valuation premise by clarifying these concepts are only applicable to measuring the fair value of nonfinancial assets. The Update also
clarifies that the fair value measurement of financial assets and financial liabilities which have offsetting market risks or counterparty credit risks that are managed on a portfolio basis, when several criteria are met, canunrecognized tax benefit should be measured at the net risk position. Additional disclosures about Level 3 fair value measurements are required including a quantitative disclosure of the unobservable inputs and assumptions used in the measurement, a description of the valuation process in place, and discussion of the sensitivity of fair value changes in unobservable inputs and interrelationships about those inputs as well disclosure of the level of the fair value of items that are not measured at fair valuepresented in the financial statements but disclosure of fair value is required. The provisions of ASU No. 2011-04 are effective for the Company’s reporting period beginning after December 15, 2011as a liability and should be applied prospectively. The adoption of this ASU is not expected to have a material impact on the Company’s consolidated financial statements.
In June 2011, the FASB issued ASU No. 2011-05,Presentation of Comprehensive Income. The Update amends current guidance to allow a company the option of presenting the total of comprehensive income, the components of net income, and the components of other comprehensive income either in a single continuous statement of comprehensive income or in two separate but consecutive statements. The provisions do not change the items that must be reported in other comprehensive income or when an item of other comprehensive must to reclassified to net income. The amendments do not change the option for a company to present components of other comprehensive income either net of related tax effects or before related tax effects, with one amount shown for the aggregate income tax expense (benefit) related to the total of other comprehensive income items. The amendments do not affect how earnings per share is calculated or presented. The provisions of ASU No. 2011-05 are effective for the Company’s reporting period beginning after December 15, 2011 and should be applied retrospectively. Early adoption is permitted and there are no required transition disclosures. In December 2011, the FASB issued ASU No. 2011-12,Deferral of the Effective Date for Amendments to the Presentation of Reclassifications of Items Out of Accumulated Other Comprehensive Income in Accounting Standards Update No. 2011-05. The ASU defers indefinitely the requirement to present reclassification adjustments and the effect of those reclassification adjustments on the face of the financial statements where net income is presented, by component of net income, and on the face of the financial statements where other comprehensive income is presented, by component of other comprehensive income. The Company is currently in the process of evaluating the Updates but does not expect either will have a material impact on the Company’s consolidated financial statements.
In September 2011, the FASB issued ASU No. 2011-08, Testing Goodwill for Impairment. With the Update, a company testing goodwill for impairment now has the option of performing a qualitative assessment before calculating the fair value of the reporting unit (the first step of goodwill impairment test). If, on the basis of qualitative factors, the fair value of the reporting unit is more likely than not greater than the carrying amount, a quantitative calculation would not be needed. Additionally,combined with deferred tax assets. No new examples of events and circumstances that an entity should consider in performing its qualitative assessment about whether to proceed to the first step of the goodwill impairment have been made to the guidance and replace the previous guidance for triggering events for interim impairment assessment. The amendmentsrecurring disclosures are effective for annual and interim goodwill impairment tests performed for fiscal years beginning after December 15, 2011. The adoption of this ASU will not have a material impact on the Company’s consolidated financial statements.
In December 2011, the FASB issued ASU No. 2011-11,Disclosures about Offsetting Assets and Liabilities. The update requires an entity to offset, and present as a single net amount, a recognized eligible asset and a recognized eligible liability when it has an unconditional and legally enforceable right of setoff and intends either to settle the asset and liability on a net basis or to realize the asset and settle the liability simultaneously. The ASU requires an entity to disclose information about offsetting and related arrangements to enable users of its financial statements to understand the effect of those arrangements on its financial position.required. The amendments are effective for annual and interim reporting periods beginning on or after January 1, 2013.December 15, 2013 and are to be applied prospectively to all unrecognized tax benefits that exist at the effective date. Retrospective application is permitted. The Company is currently in the processadoption of evaluating the ASU but doesNo. 2013-11 did not expect it will have a material impact on the Company’sCompany's consolidated financial statements.
In January 2014, the FASB issued ASU No. 2014-01, Investments - Equity Method and Joint Ventures (Topic 323): Accounting for Investments in Qualified Affordable Housing Projects. ASU 2014-04 permits an entity to make an accounting policy election to account for their investments in qualified affordable housing projects using the proportional amortization method if certain conditions are met. Under the proportional amortization method, an entity amortizes the initial cost of the investment in proportion to the tax credits and other tax benefits received and recognize the net investment performance in the income statement as a component of income tax expense (benefit). The amendments are effective for annual and interim reporting periods beginning on or after December 15, 2014 and should be applied prospectively. The Company is currently reviewing the requirements of ASU No. 2014-01, but does not expect the ASU to have a material impact on the Company's consolidated financial statements.
In January 2014, the FASB issued ASU No. 2014-04, Receivables -Troubled Debt Restructurings by Creditors (Subtopic 310-40): Reclassification of Residential Real Estate Collateralized Consumer Mortgage Loans upon Foreclosure. ASU 2014-04 clarifies that an in substance repossession or foreclosure occurs, and a creditor is considered to have received physical possession of residential real estate property collateralizing a consumer mortgage loan, upon either (1) the creditor obtaining legal title to the residential real estate property upon completion of a foreclosure or (2) the borrower conveying all interest in the residential real estate property to the creditor to satisfy that loan through completion of a deed in lieu of foreclosure or through a similar legal agreement. Additionally, the amendments require interim and annual disclosure of both (1) the amount of foreclosed residential real estate property held by the creditor and (2) the recorded investment in consumer mortgage loans collateralized by residential real estate property that are in the process of foreclosure according to local requirements of the applicable jurisdiction. The amendments are effective for annual and interim reporting periods beginning on or after December 15, 2014 and can be applied with a modified retrospective transition method or prospectively. The adoption of ASU No. 2014-04 is not expected to have a material impact on the Company's consolidated financial statements.
In May 2014, the FASB issued ASU No. 2014-09, Revenue from Contracts with Customers (Topic 606), which creates Topic 606 and supersedes Topic 605, Revenue Recognition. The core principle of Topic 606 is that an entity recognizes revenue to depict the transfer of promised goods or services to customers in an amount that reflects the consideration to which the entity expects to be entitled in exchange for those goods or services. In general, the new guidance requires companies to use more judgment and make more estimates than under current guidance, including identifying performance obligations in the contract, estimating the amount of variable consideration to include in the transaction price and allocating the transaction price to each separate performance obligation. The standard is effective for public entities for interim and annual periods beginning after December 15, 2016; early adoption is not permitted. For financial reporting purposes, the standard allows for either full retrospective adoption, meaning the standard is applied to all of the periods presented, or modified retrospective adoption, meaning the standard is applied only to the most current period presented in the financial statements with the cumulative effect of initially applying the standard recognized at the date of initial application. The Company is currently evaluating the provisions of ASU No. 2014-09 to determine the potential impact the new standard will have on the Company's consolidated financial statements.
In June 2014, the FASB issued ASU No. 2014-11, Transfers and Servicing (Topic 860): Repurchase-to-Maturity Transactions, Repurchase Financings, and Disclosures, which changes the accounting for repurchase-to-maturity transactions and repurchase financing arrangements. It also requires additional disclosures about repurchase agreements and other similar transactions. The new guidance aligns the accounting for repurchase-to-maturity transactions and repurchase agreements executed as a repurchase financing with the accounting for other typical repurchase agreements. Going forward, these transactions would all be accounted for as secured borrowings. The ASU also requires new and expanded disclosures. This ASU is effective for the first interim or annual period beginning after December 15, 2014. The adoption of ASU No. 2014-11 is not expected to have a material impact on the Company's consolidated financial statements.
In June 2014, the FASB issued ASU No. 2014-12, Compensation - Stock Compensation (Topic 718): Accounting for Share-Based Payments When the Terms of an Award Provide That a Performance Target Could Be Achieved after the Requisite Service Period. The ASU requires that a performance target that affects vesting and that could be achieved after the requisite service period be treated as a performance condition. A reporting entity should apply existing guidance in Topic 718, Compensation – Stock Compensation, as it relates to awards with performance conditions that affect vesting to account for such awards. The performance target should not be reflected in estimating the grant-date fair value of the award. Compensation cost should be recognized in the period in which it becomes probable that the performance target will be achieved and should represent the compensation cost attributable to the period(s) for which the requisite service has already been rendered. The amendments in this ASU can be applied prospectively or retrospectively and are effective for annual periods and interim periods within those annual periods beginning after December 15, 2015 with early adoption permitted. The Company is currently reviewing the requirements of ASU No. 2014-12, but does not expect the ASU to have a material impact on the Company's consolidated financial statements.
In August 2014, the FASB issued ASU No. 2014-14, Receivables -Troubled Debt Restructuring by Creditors (Subtopic 310-40): Classification of Certain Government-Guaranteed Mortgage Loans upon Foreclosure . Under certain government-sponsored loan guarantee programs, such as those offered by the Federal Housing Administration (FHA) and the Department of Veterans Affairs (VA), qualifying creditors can extend mortgage loans to borrowers with a guarantee that entitles the creditor to recover all or a portion of the unpaid principal balance from the government if the borrower defaults. The ASU requires a mortgage loan to be derecongized and a separate receivable to be recognized upon foreclosure. Additionally, the separate other receivable should be measured based on the amount of the loan balance (principal and interest) expected to be recovered from the guarantor upon foreclosure. This ASU is effective for annual periods and interim periods within those annual periods beginning after December 15, 2014 with early adoption permitted. The Company is currently reviewing the requirements of ASU No. 2014-14, but does not expect this ASU to have a material impact on the Company's consolidated financial statements.
In November 2014, the FASB issued ASU No. 2014-16, Derivatives and Hedging (Topic 815): Determining Whether the Host Contract in a Hybrid Financial Instrument Issued in the Form of a Share is More Akin to Debt or to Equity. The ASU clarifies how current guidance should be interpreted in evaluating the characteristics and risks of a host contract in a hybrid financial instrument issued in the form of a share. One criterion requires evaluating whether the nature of the host contract is more akin to debt or to equity and whether the economic characteristics and risks of the embedded derivative feature are "clearly and closely related" to the host contract. In making that evaluation, an issuer or investor must consider all terms and features in a hybrid financial instrument including the embedded derivative feature that is being evaluated for separate accounting or may consider all terms and features in the hybrid financial instrument except for the embedded derivative feature that is being evaluated for separate accounting. This ASU is effective for annual periods and interim periods within those annual periods beginning after December 15, 2015 with early adoption permitted. The Company is currently reviewing the requirements of ASU No. 2014-16.
In January 2015, the FASB issued ASU No. 2015-1, Income Statement —Extraordinary and Unusual Items (Subtopic 225-20). The objective of this ASU is to simplify the income statement presentation requirements in Subtopic 225-20 by eliminating the concept of extraordinary items. Extraordinary items are events and transactions that are distinguished by their unusual nature and by the infrequency of their occurrence. Eliminating the extraordinary classification simplifies income statement presentation by altogether removing the concept of extraordinary items from consideration. This ASU is effective for annual periods and interim periods within those annual periods beginning after December 15, 2015 with early adoption permitted. The Company does not expect this ASU to have a material impact on the Company's consolidated financial statements.
Reclassifications—- Certain amounts reported in prior years’years' financial statements have been reclassified to conform to the current presentation. The results of the reclassifications are not considered material and have no effect on previously reported net earnings (losses) available to common shareholders and earnings (losses) per common share. Note 2 – Business Combinations
Sterling Financial Corporation
As of the close of business on April 18, 2014, the Company completed its merger with Sterling Financial Corporation, a Washington corporation ("Sterling"). The results of Sterling's operations are included in the Company's financial results beginning April 19, 2014 and the combined company's banking operations are operating under the Umpqua
Holdings CorporationBank name and
SubsidiariesNOTE 2. BUSINESS COMBINATIONS
On January 22, 2010,brand.
The structure of the Washington Department of Financial Institutions closed EvergreenBank (“Evergreen”transaction was as follows:
Sterling merged with and into the Company (the "Merger" or the "Sterling Merger") with the Company as the surviving corporation in the Merger;
Immediately following the Merger, Sterling's wholly owned banking subsidiary, Sterling Savings Bank merged with and into the Bank (the "Bank Merger"), Seattle,with the Bank as the surviving bank in the Bank Merger;
Holders of shares of common stock of Sterling had the right to receive 1.671 shares of the Company's common stockand $2.18 in cash for each share of Sterling common stock.
Each outstanding warrant issued by Sterling converted into a warrant exercisable for 1.671 shares of the Company's common stockand $2.18 in cash for each warrant when exercised;
Each outstanding option to purchase a share of Sterling common stock converted into an option to purchase 1.7896 shares of Company's common stock, subject to vesting conditions; and
Each outstanding restricted stock unit in respect of Sterling common stock converted into a restricted stock unit in respect of 1.7896 shares the Company common stock, subject to vesting conditions.
A summary of the consideration paid, the assets acquired and liabilities assumed in the Merger are presented below:
|
| | | | | | |
| (in thousands) | | |
| | Sterling |
| | April 18, 2014 |
| Fair value of consideration to Sterling shareholders: | | |
| Cash paid | | $ | 136,200 |
|
| Liability recorded for warrants' cash payment per share | | 6,453 |
|
| Fair value of common shares issued | | 1,939,497 |
|
| Fair value of warrants, common stock options, and restricted stock exchanged | | 50,317 |
|
| Total consideration | | 2,132,467 |
|
| Fair value of assets acquired: | | |
| Cash and cash equivalents | $ | 253,067 |
| |
| Investment securities | 1,378,300 |
| |
| Loans held for sale | 214,911 |
| |
| Loans and leases | 7,123,168 |
| |
| Premises and equipment | 116,576 |
| |
| Residential mortgage servicing rights | 62,770 |
| |
| Other intangible assets | 54,562 |
| |
| Other real estate owned | 8,666 |
| |
| Bank owned life insurance | 193,246 |
| |
| Deferred tax asset | 299,847 |
| |
| Accrued interest receivable | 23,553 |
| |
| Other assets | 148,906 |
| |
| Total assets acquired | 9,877,572 |
| |
| Fair value of liabilities assumed: | | |
| Deposits | 7,086,052 |
| |
| Securities sold under agreements to repurchase | 584,746 |
| |
| Term debt | 854,737 |
| |
| Junior subordinated debentures | 156,171 |
| |
| Other liabilities | 85,319 |
| |
| Total liabilities assumed | $ | 8,767,025 |
| |
| Net assets acquired | | 1,110,547 |
|
| Goodwill | | $ | 1,021,920 |
|
Amounts recorded are estimates of fair value. The primary reason for the Merger was to continue the Company's growth strategy, including expanding our geographic footprint in markets throughout the West Coast. All of the goodwill recorded has been attributed to the Community Banking segment and reporting unit. The Community Banking segment will benefit from the cost saves and greater economy of scales to deliver financial solutions to its customers. None of the goodwill will be deductible for income tax purposes.
Subsequent to acquisition, the Company repaid securities sold under agreements to repurchase acquired of $500.0 million, funded through the sale of acquired investment securities in the second quarter of 2014. On June 20, 2014, the Company completed the required divestiture of six stores acquired in the Merger to another financial institution. The divestiture of the six stores included $211.5 million of deposits and $88.3 million of loans.
As of April 18, 2014, the unpaid principal balance on purchased non-impaired loans was $7.0 billion. The fair value of the purchased non-impaired loans was $6.7 billion, resulting in a discount of $230.5 million being recorded on these loans.
The following table presents the acquired purchased impaired loans as of the acquisition date:
|
| | | | |
| (in thousands) | | Purchased impaired |
| Contractually required principal and interest payments | | $ | 604,136 |
|
| Nonaccretable difference | | (95,614 | ) |
| Cash flows expected to be collected | | 508,522 |
|
| Accretable yield | | (110,757 | ) |
| Fair value of purchased impaired loans | | $ | 397,765 |
|
The operations of Sterling are included in our operating results beginning on April 19, 2014, and contributed the following net interest income, provision for loan losses, non-interest income and expense, income tax benefit, and net income for the year ended December 31, 2014.
|
| | | | |
| (in thousands) | | |
| | | Period from April 19, 2014 to |
| | | December 31, 2014 |
| Net interest income | | $ | 339,254 |
|
| Provision for loan losses | | 19,998 |
|
| Non-interest income | | 82,212 |
|
| Non-interest expense, excluding merger expense | | 227,007 |
|
| Merger related expense | | 73,255 |
|
| Income tax provision | | 36,473 |
|
| Net income | | $ | 64,733 |
|
The following table provides a breakout of Merger related expense for the year ended December 31, 2014.
|
| | | | |
| (in thousands) | | Year ended |
| | | December 31, 2014 |
| Personnel | | $ | 18,837 |
|
| Legal and professional | | 22,276 |
|
| Charitable contributions | | 10,000 |
|
| Investment banking fees | | 9,573 |
|
| Contract termination | | 10,378 |
|
| Communication | | 2,522 |
|
| Other | | 8,731 |
|
| Total Merger related expense | | $ | 82,317 |
|
The following table presents unaudited pro forma results of operations for the years ended December 31, 2014 and 2013, as if the Sterling Merger had occurred on January 1, 2013. The pro forma results have been prepared for comparative purposes only and are not necessarily indicative of the results that would have been obtained had the acquisition actually occurred on January 1, 2013. The pro forma results include the impact of certain acquisition accounting adjustments including accretion of loan discount, intangible assets amortization and deposit, borrowing premium accretion, and other reclasses of expenses between years. These adjustments increased pro forma net income by $82.4 million and $12.9 million for the years ended December 31, 2014 and 2013, respectively.
|
| | | | | | | | | |
| (in thousands, except per share data) | | Pro Forma | |
| | | Year Ended | |
| | | December 31, | |
| | | 2014 | | 2013 | |
| Net interest income | | $ | 910,715 |
| | $ | 873,972 |
| (1),(2),(3) |
| Provision for loan and lease losses | | 40,241 |
| | 10,716 |
| |
| Non-interest income | | 205,557 |
| | 242,609 |
| (4),(5),(6) |
| Non-interest expense | | 704,488 |
| | 802,371 |
| (7), (8) |
| Income before provision for income taxes | | 371,543 |
| | 303,494 |
| |
| Provision for income taxes | | 136,228 |
| | 98,603 |
| |
| Net income | | 235,315 |
| | 204,891 |
| |
| Dividends and undistributed earnings allocated to participating securities | | 484 |
| | 788 |
| |
| Net earnings available to common shareholders | | $ | 234,831 |
| | $ | 204,103 |
| |
| Earnings per share: | | | | | |
| Basic | | $ | 1.03 |
| | $ | 0.94 |
| |
| Diluted | | $ | 1.02 |
| | $ | 0.93 |
| |
| Average shares outstanding: | | | | | |
| Basic | | 227,807 |
| | 216,025 |
| |
| Diluted | | 229,690 |
| | 218,508 |
| |
(1) Includes $31.9 million and $127.5 million of incremental loan discount accretion for the years ended December 31, 2014 and 2013, respectively.
(2) Includes a reduction of interest income of $1.8 million and $6.6 million related to investment securities premiums amortization for the years ended December 31, 2014 and 2013, respectively.
(3) Includes a reduction of interest expense related to amortization of deposit and borrowing premium of $5.9 million and $22.1 million for the years ended December 31, 2014 and 2013, respectively.
(4) Includes a reduction of service charges on deposit of $1.7 million and $5.8 million as a result of passing the $10 billion asset threshold for the years ended December 31, 2014 and 2013, respectively.
(5) Includes a loss on junior subordinated debentures carried at fair value of $1.1 million and $3.9 million for the years ended December 31, 2014 and 2013, respectively.
(6) Includes the reversal of the $7.0 million loss on the required divestiture of six Sterling stores in connection with the Merger for the year ended December 31, 2014.
(7) Includes $2.1 million and $7.8 million of core deposit intangible amortization for the years ended ended December 31, 2014 and 2013, respectively.
(8) The year ended December 31, 2014 was adjusted to exclude $98.2 million of merger expenses. The year ended December 31, 2013 was adjusted to include these charges.
Financial Pacific Holding Corp.
On July 1, 2013, the Bank acquired Financial Pacific Holding Corp. ("FPHC") based in Federal Way, Washington, and appointedits subsidiary, Financial Pacific Leasing, Inc ("FinPac Leasing"), and its subsidiaries, Financial Pacific Funding, Inc. ("FPF"), Financial Pacific Funding II, Inc. ("FPF II") and Financial Pacific Funding III, Inc. ("FPF III"). As part of the Federal Deposit Insurancesame transaction, the Company acquired two related entities, FPC Leasing Corporation (“FDIC”("FPC") and Financial Pacific Reinsurance Co., Ltd. ("FPR"). FPHC, FinPac Leasing, FPF, FPF II, FPF III, FPC and FPR are collectively referred to herein as receiver. That same date, Umpqua Bank assumed"FinPac". FinPac provides business-essential commercial equipment leases to various industries throughout the bankingUnited States and Canada. It originates leases through its brokers, lessors, and direct marketing programs. The results of FinPac's operations are included in the consolidated financial statements as of EvergreenJuly 1, 2013.
The aggregate consideration for the FinPac purchase was $158.0 million. Of that amount, $156.1 was distributed in cash, and $1.9 million was exchanged for restricted shares of the Company stock. The restricted shares were issued from the FDIC underCompany's 2013
Incentive Plan pursuant to employment agreements between the Company and certain executives of FinPac, vest over a whole bank purchaseperiod of either two or three years, and assumption agreement with loss-sharing. Underwill be recognized over that time period within the termssalaries and employee benefits line item on the Consolidated Statements of Income. The structure of the loss-sharing agreement,transaction was as follows:
The Bank acquired all of the FDIC will coveroutstanding stock of FPHC, a substantialshell holding company, which was the sole shareholder of FinPac Leasing, the primary operating subsidiary of FinPac that engages in equipment leasing and financing activities. FinPac Leasing was also the sole shareholder of FPF, FPF II and FPF III, which are bankruptcy-remote entities that formerly served as lien holder for certain leases. FPF, FPF II and FPF III had no assets and have been dissolved. With the dissolution of FPHC, the Bank holds all of the outstanding stock of FinPac Leasing.
The Company acquired all of the outstanding stock of FPC, a Canadian leasing subsidiary, and FPR, a corporation organized in the Turks & Caicos Islands that reinsures a portion of any future lossesthe liability risk of each insurance policy that is issued by a third party insurance company on loans, related unfunded loan commitments, other real estate owned (“OREO”) and accrued interest on loans for upleased equipment when the lessee fails to 90 days. The FDIC will absorb 80% of losses and share in 80% of loss recoveriesmeet its contractual obligations under the lease or financing agreement to obtain insurance on the first $90.0 million on covered assets for Evergreen and absorb 95%leased equipment.
A summary of losses and share in 95% of loss recoveries exceeding $90.0 million, except the Bank will incur losses up to $30.2 million before the loss-sharing will commence. The loss-sharing arrangements for non-single family residential and single family residential loans are in effect for 5 years and 10 years, respectively,consideration paid, and the loss recovery provisions areassets acquired and liabilities assumed at their fair values, in effect for 8 years and 10 years, respectively, from the acquisition date. With this agreement, Umpqua Bank assumed six additional store locations in the greater Seattle, Washington market. Thisof FinPac are presented below. |
| | | | | | | |
| (in thousands) | FinPac |
| | July 1, 2013 |
| Fair value of consideration: | | | |
| Cash | | | $ | 156,110 |
|
| Fair value of assets acquired: | | | |
| Cash and equivalents | $ | 6,452 |
| | |
| Loans and leases, net | 264,336 |
| | |
| Premises and equipment | 491 |
| | |
| Other assets | 8,015 |
| | |
| Total assets acquired | $ | 279,294 |
| | |
| Fair value of liabilities assumed: | | | |
| Term debt | 211,204 |
| | |
| Other liabilities | 8,757 |
| | |
| Total liabilities assumed | $ | 219,961 |
| | |
| Net assets acquired | | | 59,333 |
|
| Goodwill | | | $ | 96,777 |
|
The acquisition
provides diversification, and a scalable platform that is consistent with
our community banking expansion
strategy and provides further opportunity to fill in our market presenceinitiatives that the Bank has completed over the last three years, including growth in the
greater Seattle, Washington market.On February 26, 2010, the Washington Department of Financial Institutions closed Rainier Pacific Bank (“Rainier”), Tacoma, Washingtonbusiness banking, agricultural lending and appointed the FDIC as receiver. That same date, Umpqua Bank assumed the banking operations of Rainier from the FDIC under a whole bank purchase and assumption agreement with loss-sharing. Under the termshome builder lending groups. The transaction leverages excess capital of the loss-sharing agreement, the FDIC will cover a substantial portion of any future losses on loans, related unfunded loan commitments, OREOCompany and accrued interest on loans for updeploys excess liquidity into significantly higher yielding assets, provides growth and diversification, and is anticipated to 90 days. The FDIC will absorb 80% of losses and share in 80% of loss recoveries on the first $95.0 million of losses on covered assets and absorb 95% of losses and share in 95% of loss recoveries exceeding $95.0 million. The loss-sharing arrangements for non-single family residential and single family residential loans are in effect for 5 years and 10 years, respectively, and the loss recovery provisions are in effect for 8 years and 10 years, respectively, from the acquisition dates. With this agreement, Umpqua Bank assumed 14 additional store locations in Pierce County and surrounding areas. This acquisition expands our presence in the south Puget Sound region of Washington State.
increase profitability. There is no tax deductible goodwill or other intangibles.
The operations of
Evergreen and RainierFinPac are included in our operating results from
January 23, 2010 and February 27, 2010, respectively,July 1, 2013, and added
combined revenue of
$46.2 million and $54.0$66.1 million, non-interest expense of
$25.3$15.9 million, and
$23.6 million, and earningsnet income of
$13.8 million and $11.0$18.7 million net of tax, for the
years ended December 31, 2011 and 2010, respectively. These operating results include a bargain purchase gain of $6.4 million for the year ended December 31,
2010, which is not indicative of future operating results. Evergreen’s and Rainiers’s2014. FinPac's results of operations prior to the acquisition are not included in our operating results.
Merger-relatedThere are $110,000 FinPac merger related expenses
of $92,000 and $4.4 million for the years ended December 31, 2011 and 2010 have been incurred in connection with these acquisitions and recognized in a separate line item on theCondensed Consolidated Statements of Operations.On June 18, 2010, the Nevada State Financial Institutions Division closed Nevada Security Bank (“Nevada Security”), Reno, Nevada and appointed the FDIC as receiver. That same date, Umpqua Bank assumed the banking operations of Nevada Security from the FDIC under a whole bank purchase and assumption agreement with loss-sharing. Under the terms of the loss-sharing agreement, the FDIC will cover a substantial portion of any future losses on loans, related unfunded loan commitments, OREO, and accrued interest on loans for up to 90 days. The FDIC will absorb 80% of losses and share in 80% of loss recoveries on all covered assets. The loss-sharing arrangements for non-single family residential and single family residential loans are in effect for 5 years and 10 years, respectively, and the loss recovery provisions are in effect for 8 years and 10 years, respectively, from the acquisition dates. With this agreement, Umpqua Bank now assumed five additional store locations, including three in Reno, Nevada, one in Incline Village, Nevada, and one in Roseville, California. This acquisition expands our presence into the State of Nevada.
The operations of Nevada Security are included in our operating results from June 19, 2010, and added revenue of $18.6 million and $15.1 million, non-interest expense of $11.3 million and $7.3 million, and earnings of $2.1 million and $1.3 million, net of tax, for the years ended December 31, 2011 and 2010, respectively. Nevada Security’s results of operations prior to the acquisition are not included in our operating results. Merger-related expenses of $101,000 and $1.7 million for the years ended December 31, 2011 and 2010 have been incurred in connection with the acquisition of Nevada Security and recognized as a separate line item on theCondensed Consolidated Statements of Operations.
We refer to the acquired loan portfolios and other real estate owned as “covered loans” and “covered other real estate owned”, respectively, and these are presented as separate line items in our consolidated balance sheet. Collectively these balances are referred to as “covered assets”.
The assets acquired and liabilities assumed from the Evergreen, Rainier, and Nevada Security acquisitions have been accounted for under the acquisition method of accounting. The assets and liabilities, both tangible and intangible, were recorded at their estimated fair values as of the acquisition dates. The fair values of the assets acquired and liabilities assumed were determined based on the requirements of the Fair Value Measurements and Disclosures topic of the Financial Accounting Standards Board Accounting Standards Codification (the “FASB ASC”). The terms of the agreements provide for the FDIC to indemnify the Bank against claims with respect to liabilities of Evergreen, Rainier, and Nevada Security not assumed by the Bank and certain other types of claims identified in the agreement. The application of the acquisition method of accounting resulted in the recognition of a bargain purchase gain of $6.4 million in the Evergreen acquisition, $35.8 million of goodwill in the Rainier acquisition and $10.4 million of goodwill in the Nevada Security acquisition.
A summary of the net assets (liabilities) received from the FDIC and the estimated fair value adjustments are presented below:
(in thousands)
| | | | | | | | | | | | |
| | | Evergreen | | | Rainier | | | Nevada Security | |
| | | January 22, 2010 | | | February 26, 2010 | | | June 18, 2010 | |
Cost basis net assets (liabilities) | | $ | 58,811 | | | $ | (50,295 | ) | | $ | 53,629 | |
Cash payment received from (paid to) the FDIC | | | — | | | | 59,351 | | | | (29,950 | ) |
Fair value adjustments: | | | | | | | | | | | | |
Loans | | | (117,449 | ) | | | (103,137 | ) | | | (112,975 | ) |
Other real estate owned | | | (2,422 | ) | | | (6,581 | ) | | | (17,939 | ) |
Other intangible assets | | | 440 | | | | 6,253 | | | | 322 | |
FDIC indemnification asset | | | 71,755 | | | | 76,603 | | | | 99,160 | |
Deposits | | | (1,023 | ) | | | (1,828 | ) | | | (1,950 | ) |
Term debt | | | (2,496 | ) | | | (13,035 | ) | | | — | |
Other | | | (1,179 | ) | | | (3,139 | ) | | | (690 | ) |
| | | | |
Bargain purchase gain (goodwill) | | $ | 6,437 | | | $ | (35,808 | ) | | $ | (10,393 | ) |
| | | | |
In FDIC-assisted transactions, only certain assets and liabilities are transferred to the acquirer and, depending on the nature and amount of the acquirer’s bid, the FDIC may be required to make a cash payment to the acquirer or the acquirer may be required to make payment to the FDIC.
In the Evergreen acquisition, cost basis net assets of $58.8 million were transferred to the Company. The bargain purchase gain represents the excess of the estimated fair value of the assets acquired over the estimated fair value of the liabilities assumed.
In the Rainier acquisition, cost basis net liabilities of $50.3 million and a cash payment received from the FDIC of $59.4 million were transferred to the Company. The goodwill represents the excess of the estimated fair value of the liabilities assumed over the estimated fair value of the assets acquired. Goodwill of $27.6 million and core deposit intangible assets of $1.1 million recognized are deductible for income tax purposes.
In the Nevada Security acquisition, cost basis net assets of $53.6 million were transferred to the Company and a cash payment of $30.0 million was made to the FDIC. The goodwill represents the excess of the estimated fair value of the liabilities assumed over the estimated fair value of the assets acquired. Goodwill of $36.8 million and core deposit intangible assets of $322,000 recognized are deductible for income tax purposes.
The Bank did not immediately acquire all the real estate, banking facilities, furniture or equipment of Evergreen, Rainier, or Nevada Security as part of the purchase and assumption agreements. Rather, the Bank was granted the option to purchase or lease the real estate and furniture and equipment from the FDIC. The term of this option expired 90 days from the acquisition
Umpqua Holdings Corporation and Subsidiaries
dates, unless extended by the FDIC. Acquisition costs of the real estate and furniture and equipment are based on current mutually agreed upon appraisals. Prior to the expiration of option term, Umpqua exercised the right to purchase approximately $344,000 of furniture and equipment for Evergreen, $26.3 million of real estate and furniture and equipment for Rainier, and $2.0 million of real estate, furniture and equipment for Nevada Security.
The statement of assets acquired and liabilities assumed at their estimated fair values of Evergreen, Rainier, and Nevada Security are presented below:
(in thousands)
| | | | | | | | | | | | |
| | | Evergreen | | | Rainier | | | Nevada Security | |
| | | January 22, 2010 | | | February 26, 2010 | | | June 18, 2010 | |
Assets Acquired: | | | | | | | | | | | | |
Cash and equivalents | | $ | 18,919 | | | $ | 94,067 | | | $ | 66,060 | |
Investment securities | | | 3,850 | | | | 26,478 | | | | 22,626 | |
Covered loans | | | 252,493 | | | | 458,340 | | | | 215,507 | |
Premises and equipment | | | — | | | | 17 | | | | 50 | |
Restricted equity securities | | | 3,073 | | | | 13,712 | | | | 2,951 | |
Goodwill | | | — | | | | 35,808 | | | | 10,393 | |
Other intangible assets | | | 440 | | | | 6,253 | | | | 322 | |
Mortgage servicing rights | | | — | | | | 62 | | | | — | |
Covered other real estate owned | | | 2,421 | | | | 6,580 | | | | 17,938 | |
FDIC indemnification asset | | | 71,755 | | | | 76,603 | | | | 99,160 | |
Other assets | | | 328 | | | | 3,254 | | | | 2,588 | |
| | | | |
Total assets acquired | | $ | 353,279 | | | $ | 721,174 | | | $ | 437,595 | |
| | | | |
Liabilities Assumed: | | | | | | | | | | | | |
Deposits | | $ | 285,775 | | | $ | 425,771 | | | $ | 437,299 | |
Term debt | | | 60,813 | | | | 293,191 | | | | — | |
Other liabilities | | | 254 | | | | 2,212 | | | | 296 | |
| | | | |
Total liabilities assumed | | | 346,842 | | | | 721,174 | | | | 437,595 | |
| | | | |
Net assets acquired/bargain purchase gain | | $ | 6,437 | | | $ | — | | | $ | — | |
| | | | |
Rainier’s assets and liabilities were significant at a level to require disclosure of one year of historical financial statements and related pro forma financial disclosure. However, given the pervasive nature of the loss-sharing agreement entered into with the FDIC, the historical information of Rainier is much less relevant for purposes of assessing the future operations of the combined entity. In addition, prior to closure Rainier had not completed an audit of their financial statements, and we determined that audited financial statements were not and would not be reasonably available for the year ended December 31, 2009. Given these considerations,2014. FinPac merger related expenses were $1.6 million for the Company requested, and received, relief from the Securities and Exchange Commission from submitting certain financial information of Rainier. The assets and liabilities of Evergreen and Nevada Security were not at a level that requires disclosure of historical or pro forma financial information.
The Company incurs significant expenses related to mergers that cannot be capitalized. Generally, these expenses begin to be recognized while due diligence is being conducted and continue until such time as all systems have been converted and operational functions become fully integrated. Merger-related expenses are presented as a line item on theConsolidated Statements of Operations.
The following table presents the key components of merger-related expense for yearsyear ended December 31, 2011, 20102013.
Leases acquired from FinPac are presented below as of acquisition date: |
| | | |
| (in thousands) | FinPac |
| | July 1, 2013 |
| Contractually required payments | $ | 350,403 |
|
| Purchase adjustment for credit | $ | (20,520 | ) |
| Balance of loans and leases, net | $ | 264,336 |
|
The following tables present unaudited pro forma results of operations for the year ended December 31, 2013 as if the acquisition of FinPac had occurred on January 1, 2013. The proforma results have been prepared for comparative purposes only and 2009. Substantially allare not necessarily indicative of the merger-related expenses incurred during 2010 were in connection withresults that would have been obtained had the FDIC-assisted purchase and assumption of Evergreen, Rainier, and Nevada Security. Substantially all ofacquisition actually occurred on January 1, 2013. The pro forma results include the merger-related expenses incurred during 2009 were in connection with the FDIC-assisted purchase and assumptionimpact of certain assetsacquisition accounting adjustments which reduced pro forma earnings available to common shareholders by $4.2 million for the year ended December 31, 2013.
|
| | | |
| (in thousands, except per share data) | Pro Forma |
| | Year ended |
| | December 31, 2013 |
| Net interest income | $ | 423,600 |
|
| Provision for loan and lease losses | 13,988 |
|
| Non-interest income | 122,753 |
|
| Non-interest expense | 373,181 |
|
| Income before provision for income taxes | 159,184 |
|
| Provision for income taxes | 55,879 |
|
| Net income | 103,305 |
|
| Dividends and undistributed earnings allocated to participating securities | 829 |
|
| Net earnings available to common shareholders | $ | 102,476 |
|
| Earnings per share: | |
| Basic | $ | 0.92 |
|
| Diluted | $ | 0.91 |
|
| Average shares outstanding: | |
| Basic | 111,938 |
|
| Diluted | 112,176 |
|
Note 3 – Cash and
liabilities of the Bank of Clark County.Due From Banks
Merger-Related Expense(in thousands)
| | | | | | | | | | | | |
| | | 2011 | | | 2010 | | | 2009 | |
Professional fees | | $ | 173 | | | $ | 2,984 | | | $ | 143 | |
Compensation and relocation | | | — | | | | 962 | | | | 39 | |
Communications | | | — | | | | 330 | | | | 61 | |
Premises and equipment | | | 82 | | | | 630 | | | | 2 | |
Travel | | | 11 | | | | 710 | | | | — | |
Other | | | 94 | | | | 1,059 | | | | 28 | |
| | | | |
Total | | $ | 360 | | | $ | 6,675 | | | $ | 273 | |
| | | | |
No additional merger-related expenses are expected in connection with the FDIC-assisted purchase and assumption of Evergreen, Rainier, and Nevada Security assumptions or any other prior acquisitions.
NOTE 3. CASH AND DUE FROM BANKS
The Bank is required to maintain an average reserve balance with the Federal Reserve Bank or maintain such reserve balance in the form of cash. The amount of required reserve balance at December 31, 20112014 and 20102013 was approximately $33.6$80.7 million and $31.8$27.2 million, respectively, and was met by holding cash and maintaining an average balance with the Federal Reserve Bank.
NOTE 4. INVESTMENT SECURITIESNote 4– Investment Securities
The following table presents the amortized costs, unrealized gains, unrealized losses and approximate fair values of investment securities at December 31, 2011 and 2010:December 31, 20112014(in thousands)
| | | | | | | | | | | | | | | | |
| | | Amortized
Cost | | | Unrealized
Gains | | | Unrealized
Losses | | | Fair Value | |
AVAILABLE FOR SALE: | | | | | | | | | | | | | | | | |
U.S. Treasury and agencies | | $ | 117,232 | | | $ | 1,234 | | | $ | (1 | ) | | $ | 118,465 | |
Obligations of states and political subdivisions | | | 237,302 | | | | 16,264 | | | | (13 | ) | | | 253,553 | |
Residential mortgage-backed securities and collateralized mortgage obligations | | | 2,755,153 | | | | 43,152 | | | | (3,950 | ) | | | 2,794,355 | |
Other debt securities | | | 151 | | | | — | | | | (17 | ) | | | 134 | |
Investments in mutual funds and other equity securities | | | 1,959 | | | | 112 | | | | — | | | | 2,071 | |
| | | | |
| | $ | 3,111,797 | | | $ | 60,762 | | | $ | (3,981 | ) | | $ | 3,168,578 | |
| | | | |
HELD TO MATURITY: | | | | | | | | | | | | | | | | |
Obligations of states and political subdivisions | | $ | 1,335 | | | $ | 2 | | | $ | — | | | $ | 1,337 | |
Residential mortgage-backed securities and collateralized mortgage obligations | | | 3,379 | | | | 120 | | | | (77 | ) | | | 3,422 | |
| | | | |
| | $ | 4,714 | | | $ | 122 | | | $ | (77 | ) | | $ | 4,759 | |
| | | | |
Umpqua Holdings Corporation and Subsidiaries
2013:
December 31, 20102014(in thousands)
| | | | | | | | | | | | | | | | |
| | | Amortized
Cost | | | Unrealized
Gains | | | Unrealized
Losses | | | Fair Value | |
AVAILABLE FOR SALE: | | | | | | | | | | | | | | | | |
U.S. Treasury and agencies | | $ | 117,551 | | | $ | 1,239 | | | $ | (1 | ) | | $ | 118,789 | |
Obligations of states and political subdivisions | | | 213,129 | | | | 4,985 | | | | (1,388 | ) | | | 216,726 | |
Residential mortgage-backed securities and collateralized mortgage obligations | | | 2,543,974 | | | | 57,506 | | | | (19,976 | ) | | | 2,581,504 | |
Other debt securities | | | 152 | | | | — | | | | — | | | | 152 | |
Investments in mutual funds and other equity securities | | | 1,959 | | | | 50 | | | | — | | | | 2,009 | |
| | | | |
| | $ | 2,876,765 | | | $ | 63,780 | | | $ | (21,365 | ) | | $ | 2,919,180 | |
| | | | |
HELD TO MATURITY: | | | | | | | | | | | | | | | | |
Obligations of states and political subdivisions | | $ | 2,370 | | | $ | 5 | | | $ | — | | | $ | 2,375 | |
Residential mortgage-backed securities and collateralized mortgage obligations | | | 2,392 | | | | 216 | | | | (209 | ) | | | 2,399 | |
| | | | |
| | $ | 4,762 | | | $ | 221 | | | $ | (209 | ) | | $ | 4,774 | |
| | | | |
|
| | | | | | | | | | | | | | | |
| (in thousands) | Amortized | | Unrealized | | Unrealized | | Fair |
| | Cost | | Gains | | Losses | | Value |
| AVAILABLE FOR SALE: | | | | | | | |
| U.S. Treasury and agencies | $ | 213 |
| | $ | 16 |
| | $ | — |
| | $ | 229 |
|
| Obligations of states and political subdivisions | 325,189 |
| | 14,056 |
| | (841 | ) | | 338,404 |
|
| Residential mortgage-backed securities and | | | | | | | |
| collateralized mortgage obligations | 1,951,514 |
| | 17,398 |
| | (11,060 | ) | | 1,957,852 |
|
| Investments in mutual funds and | | | | | | | |
| other equity securities | 2,016 |
| | 54 |
| | — |
| | 2,070 |
|
| | $ | 2,278,932 |
| | $ | 31,524 |
| | $ | (11,901 | ) | | $ | 2,298,555 |
|
| HELD TO MATURITY: | | | | | | | |
| Residential mortgage-backed securities and | | | | | | | |
| collateralized mortgage obligations | $ | 5,088 |
| | $ | 358 |
| | $ | (15 | ) | | $ | 5,431 |
|
| Other investment securities | 123 |
| | — |
| | — |
| | 123 |
|
| | $ | 5,211 |
| | $ | 358 |
| | $ | (15 | ) | | $ | 5,554 |
|
December 31, 2013
|
| | | | | | | | | | | | | | | |
| (in thousands) | Amortized | | Unrealized | | Unrealized | | Fair |
| | Cost | | Gains | | Losses | | Value |
| AVAILABLE FOR SALE: | | | | | | | |
| U.S. Treasury and agencies | $ | 249 |
| | $ | 20 |
| | $ | (1 | ) | | $ | 268 |
|
| Obligations of states and political subdivisions | 229,969 |
| | 7,811 |
| | (2,575 | ) | | 235,205 |
|
| Residential mortgage-backed securities and | | | | | | | |
| collateralized mortgage obligations | 1,567,001 |
| | 15,359 |
| | (28,819 | ) | | 1,553,541 |
|
| Investments in mutual funds and | | | | | | | |
| other equity securities | 1,959 |
| | 5 |
| | — |
| | 1,964 |
|
| | $ | 1,799,178 |
| | $ | 23,195 |
| | $ | (31,395 | ) | | $ | 1,790,978 |
|
| HELD TO MATURITY: | | | | | | | |
| Residential mortgage-backed securities and | | | | | | | |
| collateralized mortgage obligations | $ | 5,563 |
| | $ | 330 |
| | $ | (19 | ) | | $ | 5,874 |
|
| | $ | 5,563 |
| | $ | 330 |
| | $ | (19 | ) | | $ | 5,874 |
|
Investment securities that were in an unrealized loss position as of December 31, 20112014 and 2010December 31, 2013 are presented in the following tables, based on the length of time individual securities have been in an unrealized loss position. In the opinion of management, these securities are considered only temporarily impaired due to changes in market interest rates or the widening of market spreads subsequent to the initial purchase of the securities, and not due to concerns regarding the underlying credit of the issuers or the underlying collateral:collateral.
December 31, 20112014(in thousands)
| | | | | | | | | | | | | | | | | | | | | | | | |
| | | Less than 12 Months | | | 12 Months or Longer | | | Total | |
| | | Fair
Value | | | Unrealized
Losses | | | Fair
Value | | | Unrealized
Losses | | | Fair
Value | | | Unrealized
Losses | |
AVAILABLE FOR SALE: | | | | | | | | | | | | | | | | | | | | | | | | |
U.S. Treasury and agencies | | $ | — | | | $ | — | | | $ | 85 | | | $ | 1 | | | $ | 85 | | | $ | 1 | |
Obligations of states and political subdivisions | | | 516 | | | | 13 | | | | — | | | | — | | | | 516 | | | | 13 | |
Residential mortgage-backed securities and collateralized mortgage obligations | | | 489,475 | | | | 3,160 | | | | 52,222 | | | | 790 | | | | 541,697 | | | | 3,950 | |
Other debt securities | | | — | | | | — | | | | 134 | | | | 17 | | | | 134 | | | | 17 | |
| | | | |
Total temporarily impaired securities | | $ | 489,991 | | | $ | 3,173 | | | $ | 52,441 | | | $ | 808 | | | $ | 542,432 | | | $ | 3,981 | |
| | | | |
HELD TO MATURITY: | | | | | | | | | | | | | | | | | | | | | | | | |
Residential mortgage-backed securities and collateralized mortgage obligations | | $ | — | | | $ | — | | | $ | 602 | | | $ | 77 | | | $ | 602 | | | $ | 77 | |
| | | | |
Total temporarily impaired securities | | $ | — | | | $ | — | | | $ | 602 | | | $ | 77 | | | $ | 602 | | | $ | 77 | |
| | | | |
|
| | | | | | | | | | | | | | | | | | | | | | | |
| (in thousands) | Less than 12 Months | | 12 Months or Longer | | Total |
| | Fair | | Unrealized | | Fair | | Unrealized | | Fair | | Unrealized |
| | Value | | Losses | | Value | | Losses | | Value | | Losses |
| AVAILABLE FOR SALE: | |
| | |
| | |
| | |
| | |
| | |
|
| Obligations of states and political subdivisions | $ | 11,100 |
| | $ | 547 |
| | $ | 8,550 |
| | $ | 294 |
| | $ | 19,650 |
| | $ | 841 |
|
| Residential mortgage-backed securities and | | | | | | | | | | | |
| collateralized mortgage obligations | 220,577 |
| | 815 |
| | 495,096 |
| | 10,245 |
| | 715,673 |
| | 11,060 |
|
| Total temporarily impaired securities | $ | 231,677 |
| | $ | 1,362 |
| | $ | 503,646 |
| | $ | 10,539 |
| | $ | 735,323 |
| | $ | 11,901 |
|
| HELD TO MATURITY: | | | | | | | | | | | |
| Residential mortgage-backed securities and | | | | | | | | | | | |
| collateralized mortgage obligations | $ | 224 |
| | $ | 15 |
| | $ | — |
| | $ | — |
| | $ | 224 |
| | $ | 15 |
|
| Total temporarily impaired securities | $ | 224 |
| | $ | 15 |
| | $ | — |
| | $ | — |
| | $ | 224 |
| | $ | 15 |
|
December 31, 20102013(in thousands)
| | | | | | | | | | | | | | | | | | | | | | | | |
| | | Less than 12 Months | | | 12 Months or Longer | | | Total | |
| | | Fair
Value | | | Unrealized
Losses | | | Fair
Value | | | Unrealized
Losses | | | Fair
Value | | | Unrealized
Losses | |
AVAILABLE FOR SALE: | | | | | | | | | | | | | | | | | | | | | | | | |
U.S. Treasury and agencies | | $ | — | | | $ | — | | | $ | 110 | | | $ | 1 | | | $ | 110 | | | $ | 1 | |
Obligations of states and political subdivisions | | | 60,110 | | | | 1,366 | | | | 1,003 | | | | 22 | | | | 61,113 | | | | 1,388 | |
Residential mortgage-backed securities and collateralized mortgage obligations | | | 1,238,483 | | | | 19,968 | | | | 1,539 | | | | 8 | | | | 1,240,022 | | | | 19,976 | |
| | | | |
Total temporarily impaired securities | | $ | 1,298,593 | | | $ | 21,334 | | | $ | 2,652 | | | $ | 31 | | | $ | 1,301,245 | | | $ | 21,365 | |
| | | | |
HELD TO MATURITY: | | | | | | | | | | | | | | | | | | | | | | | | |
Residential mortgage-backed securities and collateralized mortgage obligations | | $ | — | | | $ | — | | | $ | 658 | | | $ | 209 | | | $ | 658 | | | $ | 209 | |
| | | | |
Total temporarily impaired securities | | $ | — | | | $ | — | | | $ | 658 | | | $ | 209 | | | $ | 658 | | | $ | 209 | |
| | | | |
The unrealized losses on investments in U.S. Treasury and agencies securities were caused by interest rate increases subsequent to the purchase of these securities. The contractual terms of these investments do not permit the issuer to settle the securities at a price less than par. Because the Bank does not intend to sell the securities in this class and it is not likely that the Bank will be required to sell these securities before recovery of their amortized cost bases, which may include holding each security until contractual maturity, the unrealized losses on these investments are not considered other-than-temporarily impaired.
|
| | | | | | | | | | | | | | | | | | | | | | | |
| (in thousands) | Less than 12 Months | | 12 Months or Longer | | Total |
| | Fair | | Unrealized | | Fair | | Unrealized | | Fair | | Unrealized |
| | Value | | Losses | | Value | | Losses | | Value | | Losses |
| AVAILABLE FOR SALE: | |
| | |
| | |
| | |
| | |
| | |
|
| U.S. Treasury and agencies | $ | — |
| | $ | — |
| | $ | 32 |
| | $ | 1 |
| | $ | 32 |
| | $ | 1 |
|
| Obligations of states and political subdivisions | 48,342 |
| | 2,575 |
| | — |
| | — |
| | 48,342 |
| | 2,575 |
|
| Residential mortgage-backed securities and | | | | | | | | | | | |
| collateralized mortgage obligations | 475,982 |
| | 15,951 |
| | 249,695 |
| | 12,868 |
| | 725,677 |
| | 28,819 |
|
| Total temporarily impaired securities | $ | 524,324 |
| | $ | 18,526 |
| | $ | 249,727 |
| | $ | 12,869 |
| | $ | 774,051 |
| | $ | 31,395 |
|
| HELD TO MATURITY: | | | | | | | | | | | |
| Residential mortgage-backed securities and | | | | | | | | | | | |
| collateralized mortgage obligations | $ | 156 |
| | $ | 19 |
| | $ | — |
| | $ | — |
| | $ | 156 |
| | $ | 19 |
|
| Total temporarily impaired securities | $ | 156 |
| | $ | 19 |
| | $ | — |
| | $ | — |
| | $ | 156 |
| | $ | 19 |
|
The unrealized losses on obligations of political subdivisions were caused by changes in market interest rates or the widening of market spreads subsequent to the initial purchase of these securities. Management monitors published credit ratings of these securities and no adverse ratings changes have occurred since the date of purchase of obligations of political subdivisions which are in an unrealized loss position as of December 31, 2011.2014. Because the decline in fair value is attributable to changes in interest rates or widening market spreads and not credit quality, and because the Bank does not intend to sell the securities in this class and it is not more likely than not that the Bank will be required to sell these securities before recovery of their amortized cost bases,basis, which may include holding each security until maturity, the unrealized losses on these investments are not considered other-than-temporarily impaired. All of the available for sale residential mortgage-backed securities and collateralized mortgage obligations portfolio in an unrealized loss position at December 31, 20112014 are issued or guaranteed by governmental agencies. The unrealized losses on residential mortgage-backed securities and collateralized mortgage obligations were caused by changes in market interest rates or the widening of market spreads subsequent to the initial purchase of these securities, and not concerns regarding the underlying credit of the issuers or the underlying collateral. It is expected that these securities will not be settled at a price less than the amortized cost of each investment. Because the decline in fair value is attributable to changes in interest rates or widening market spreads and not credit quality, and because the Bank does not intend to sell the securities in this class and it is not likely that the Bank will be required to sell these securities before recovery of their amortized cost bases,basis, which may include holding each security until contractual maturity, the unrealized losses on these investments are not considered other-than-temporarily impaired.We review investment securities on an ongoing basis for For the presence of other-than-temporary impairment (“OTTI”) or permanent impairment, taking into consideration current market conditions, fair value in relationship to cost, extent and nature of the decline in fair value, issuer rating changes and trends, whether we intend to sell a security or if it is likely that we will be required to sell the security before recovery of our amortized cost basis of the investment, which may be maturity, and other factors. For debt securities, if we intend to sell the security or it is likely that we will be required to sell the security before recovering its cost basis, the entire impairment loss would be recognized in earnings as an OTTI. If we do not intend to sell the security and it is not likely that we will be required to sell the security but we do not expect to recover the entire amortized cost basis of the security, only the portion of the impairment loss representing credit losses would be recognized in earnings. The credit loss on a security is measured as the difference between the amortized cost basis and the present value of the cash flows
Umpqua Holdings Corporation and Subsidiaries
expected to be collected. Projected cash flows are discounted by the original or current effective interest rate depending on the nature of the security being measured for potential OTTI. The remaining impairment related to all other factors, the difference between the present value of the cash flows expected to be collected and fair value, is recognized as a charge to other comprehensive income (“OCI”). Impairment losses related to all other factors are presented as separate categories within OCI. For investment securities held to maturity, this amount is accreted over the remaining life of the debt security prospectively based on the amount and timing of future estimated cash flows. The accretion of the OTTI amount recorded in OCI will increase the carrying value of the investment, and would not affect earnings. If there is an indication of additional credit losses, the security is re-evaluated accordingly to the procedures described above.
The following tables present the OTTI losses for the yearsyear ended December 31, 2011, 2010 and 2009.
(in thousands)
| | | | | | | | | | | | | | | | | | | | | | | | |
| | | 2011 | | | 2010 | | | 2009 | |
| | | Held To
Maturity | | | Available
For Sale | | | Held To
Maturity | | | Available
For Sale | | | Held To
Maturity | | | Available
For Sale | |
Total other-than-temporary impairment losses | | $ | 190 | | | $ | — | | | $ | 93 | | | $ | — | | | $ | 12,317 | | | $ | 239 | |
Portion of other-than-temporary impairment losses transferred from (recognized in) other comprehensive income(1) | | | 169 | | | | — | | | | 321 | | | | — | | | | (1,983 | ) | | | — | |
| | | | |
Net impairment losses recognized in earnings(2) | | $ | 359 | | | $ | — | | | $ | 414 | | | $ | — | | | $ | 10,334 | | | $ | 239 | |
| | | | |
(1) | Represents other-than-temporary2012, we recognized net impairment losses related to all other factors. |
(2) | Represents other-than-temporary impairment losses related to credit losses. |
New guidance related to the recognition and presentation of OTTI of debt securities became effective beginning in the second quarter of 2009. Rather than asserting whether a Company has the ability and intent to hold an investment until a market price recovery, a Company must consider whether they intend to sell a security or if it is likely that they would be required to sell the security before recovery of the amortized cost basis of the investment, which may be maturity. The $8.2 million in OTTI recognized on investment securities held to maturity subsequent to March 31, 2009 primarily relates to 29 non-agency residential collateralized mortgage obligations. Each of these securities holds various levels of credit subordination. The underlying mortgage loans of these securities were originated from 2003 through 2007. At origination, the weighted average loan-to-value of the underlying mortgages was 69%; the underlying borrowers had weighted average FICO scores of 731, and 59% were limited documentation loans. These securities are valued by third-party pricing services using matrix or model pricing methodologies and were corroborated by broker indicative bids. We estimate cash flows of the underlying collateral for each security considering credit, interest and prepayment risk models that incorporate management’s estimate of projected key assumptions including prepayment rates, collateral default rates and loss severity. Assumptions utilized vary from security to security, and are influenced by factors such as loan interest rates, geographic location, borrower characteristics and vintage, and historical experience. We then used a third party to obtain information about the structure of each security, including subordination and other credit enhancements, in order to determine how the underlying collateral cash flows will be distributed to each security issued in the structure. These cash flows are then discounted at the interest rate used to recognize interest income on each security. We review the actual collateral performance of these securities on a quarterly basis and update the inputs as appropriate to determine the projected cash flows. The following table presents a summary of the significant inputs utilized to measure management’s estimate of the credit loss component on these non-agency residential collateralized mortgage obligations as of December 31, 2011 and 2010:
| | | | | | | | | | | | | | | | | | | | | | | | |
| | | 2011 | | | 2010 | |
| | | Range | | | Weighted
Average | | | Range | | | Weighted
Average | |
| | | Minimum | | | Maximum | | | | Minimum | | | Maximum | | |
Constant prepayment rate | | | 10.0% | | | | 20.0% | | | | 14.0% | | | | 5.0% | | | | 20.0% | | | | 14.9% | |
Collateral default rate | | | 5.0% | | | | 60.0% | | | | 22.6% | | | | 5.0% | | | | 15.0% | | | | 10.6% | |
Loss severity | | | 27.5% | | | | 50.0% | | | | 32.5% | | | | 25.0% | | | | 55.0% | | | | 37.9% | |
In the second quarter of 2009 the Company recorded an OTTI charge of $239,000 related to an available for sale collateralized debt obligation that holds trust preferred securities. Management noted certain deferrals and defaults in the pool and believes the impairment represents credit loss in its entirety. Through December 31, 2011, no further OTTI charges have been recorded on available for sale securities.
The following table presents a roll forward of the credit loss component of held to maturity debt securities that have been written down for OTTI with the credit loss component recognized in earnings and the remainingof $155,000, while there were no impairment loss related to all other factors recognizedcharges in OCI for the years ended December 31, 2011 and 2010, respectively, since the adoption2014 or 2013.
Table of the revised guidance related to the recognition and presentation of OTTI of debt securities: | | | | | | | | |
| | | 2011 | | | 2010 | |
Balance, beginning of period | | $ | 12,778 | | | $ | 12,364 | |
Additions: | | | | | | | | |
Subsequent OTTI credit losses | | | 359 | | | | 414 | |
Reductions: | | | | | | | | |
Securities sold, matured or paid-off | | | (3,563 | ) | | | — | |
| | | | |
Balance, end of period | | $ | 9,574 | | | $ | 12,778 | |
| | | | |
Prior to the Company’s adoption of the new guidance related to the recognition and presentation of OTTI of debt securities which became effective in the second quarter of 2009, the Company would assess an OTTI or permanent impairment based on the nature of the decline and whether the Company had the ability and intent to hold the investments until a market price recovery. In the three months ended March 31, 2009, the Company recorded a $2.1 million OTTI charge. This charge related to three non-agency residential collateralized mortgage obligations carried as held to maturity for which the default rates and loss severities of the underlying collateral and credit coverage ratios of the security indicated that it was probable that credit losses were expected to occur. These securities were valued by third party pricing services using matrix or model pricing methodologies, and were corroborated by broker indicative bids. The remaining non-agency securities within residential mortgage-backed securities and collateralized mortgage obligations carried as held to maturity were specifically evaluated for OTTI, and the default rates and loss severities of the underlying collateral indicated that credit losses are not expected to occur. Upon adoption of the new OTTI guidance in the second quarter of 2009, the Company analyzed these securities as well as other securities where OTTI had been previously recognized, and determined that as of the adoption date such losses were credit related. As such, there was no cumulative effect adjustment to the opening balance of retained earnings or a corresponding adjustment to accumulated OCI.
Contents
The following table presents the maturities of investment securities at December 31, 2011:(in thousands)
| | | | | | | | | | | | | | | | |
| | | Available For Sale | | | Held To Maturity | |
| | | Amortized
Cost | | | Fair
Value | | | Amortized
Cost | | | Fair
Value | |
AMOUNTS MATURING IN: | | | | | | | | | | | | | | | | |
Three months or less | | $ | 22,142 | | | $ | 22,217 | | | $ | — | | | $ | — | |
Over three months through twelve months | | | 424,824 | | | | 429,396 | | | | 330 | | | | 331 | |
After one year through five years | | | 2,272,876 | | | | 2,310,113 | | | | 1,096 | | | | 1,155 | |
After five years through ten years | | | 310,639 | | | | 323,164 | | | | 1,023 | | | | 1,010 | |
After ten years | | | 79,357 | | | | 81,617 | | | | 2,265 | | | | 2,263 | |
Other investment securities | | | 1,959 | | | | 2,071 | | | | — | | | | — | |
| | | | |
| | $ | 3,111,797 | | | $ | 3,168,578 | | | $ | 4,714 | | | $ | 4,759 | |
| | | | |
Umpqua Holdings Corporation and Subsidiaries
2014
: |
| | | | | | | | | | | | | | | |
| (in thousands) | Available For Sale | | Held To Maturity |
| | Amortized | | Fair | | Amortized | | Fair |
| | Cost | | Value | | Cost | | Value |
| AMOUNTS MATURING IN: | | | | | | | |
| Three months or less | $ | 8,077 |
| | $ | 8,118 |
| | $ | — |
| | $ | — |
|
| Over three months through twelve months | 63,008 |
| | 63,755 |
| | 138 |
| | 200 |
|
| After one year through five years | 1,620,464 |
| | 1,639,949 |
| | 427 |
| | 655 |
|
| After five years through ten years | 514,770 |
| | 511,260 |
| | 271 |
| | 298 |
|
| After ten years | 70,597 |
| | 73,403 |
| | 4,252 |
| | 4,278 |
|
| Other investment securities | 2,016 |
| | 2,070 |
| | 123 |
| | 123 |
|
| | $ | 2,278,932 |
| | $ | 2,298,555 |
| | $ | 5,211 |
| | $ | 5,554 |
|
The amortized cost and fair value of collateralized mortgage obligations and mortgage-backed securities are presented by expected average life, rather than contractual maturity, in the preceding table. Expected maturities may differ from contractual maturities because borrowers have the right to prepay underlying loans without prepayment penalties.
The following table presents the gross realized gains and gross realized losses on the sale of securities available for sale for the years ended December 31, 2011, 20102014, 2013 and 2009:(in thousands)
| | | | | | | | | | | | | | | | | | | | | | | | |
| | | 2011 | | | 2010 | | | 2009 | |
| | | Gains | | | Losses | | | Gains | | | Losses | | | Gains | | | Losses | |
U.S. Treasury and agencies | | $ | — | | | $ | — | | | $ | — | | | $ | 1 | | | $ | — | | | $ | — | |
Obligations of states and political subdivisions | | | 8 | | | | — | | | | 3 | | | | 7 | | | | — | | | | 1 | |
Residential mortgage-backed securities and collateralized mortgage obligations | | | 8,544 | | | | 817 | | | | 2,331 | | | | — | | | | 9,409 | | | | 591 | |
| | | | |
| | $ | 8,552 | | | $ | 817 | | | $ | 2,334 | | | $ | 8 | | | $ | 9,409 | | | $ | 592 | |
| | | | |
|
| | | | | | | | | | | | | | | | | | | | | | | |
| (in thousands) | 2014 | | 2013 | | 2012 |
| | Gains | | Losses | | Gains | | Losses | | Gains | | Losses |
| U.S. Treasury and agencies | $ | — |
| | $ | — |
| | $ | — |
| | $ | — |
| | $ | 371 |
| | $ | — |
|
| Obligations of states and political subdivisions | 3 |
| | 1 |
| | 10 |
| | 1 |
| | 10 |
| | 1 |
|
| Residential mortgage-backed securities and | | | | | | | | | | | |
| collateralized mortgage obligations | 2,902 |
| | — |
| | — |
| | — |
| | 4,578 |
| | 953 |
|
| Other debt securities | — |
| | — |
| | 200 |
| | — |
| | 18 |
| | — |
|
| | $ | 2,905 |
| | $ | 1 |
| | $ | 210 |
| | $ | 1 |
| | $ | 4,977 |
| | $ | 954 |
|
The following table presents, as of December 31, 2011,2014, investment securities which were pledged to secure borrowings, and public deposits, and repurchase agreements as permitted or required by law:(in thousands)
| | | | | | | | |
| | | Amortized Cost | | | Fair Value | |
To Federal Home Loan Bank to secure borrowings | | $ | 183,909 | | | $ | 190,176 | |
To state and local governments to secure public deposits | | | 738,780 | | | | 759,019 | |
Other securities pledged | | | 191,740 | | | | 194,200 | |
| | | | |
Total pledged securities | | $ | 1,114,429 | | | $ | 1,143,395 | |
| | | | |
The carrying value
|
| | | | | | | |
| (in thousands) | Amortized | | Fair |
| | Cost | | Value |
| To Federal Home Loan Bank to secure borrowings | $ | 2,109 |
| | $ | 2,183 |
|
| To state and local governments to secure public deposits | 1,693,153 |
| | 1,706,717 |
|
| Other securities pledged principally to secure repurchase agreements | 474,380 |
| | 475,430 |
|
| Total pledged securities | $ | 2,169,642 |
| | $ | 2,184,330 |
|
Note 5– Loans and December 31, 2010 was $1.1 billion and $1.5 billion.Leases
NOTE 5. NON-COVERED LOANS AND LEASESThe following table presents the major types of non-covered loans recorded in the balance sheetsand leases as of December 31, 2014 and 2013:
|
| | | | | | | |
(in thousands) | December 31, | | December 31, |
| Non-Covered Loans | 2014 | | 2013 |
| Commercial real estate | | | |
| Non-owner occupied term, net | $ | 3,154,853 |
| | $ | 2,328,260 |
|
| Owner occupied term, net | 2,588,090 |
| | 1,259,583 |
|
| Multifamily, net | 2,611,308 |
| | 403,537 |
|
| Construction & development, net | 255,852 |
| | 245,231 |
|
| Residential development, net | 80,008 |
| | 88,413 |
|
| Commercial | | | |
| Term, net | 1,094,407 |
| | 770,845 |
|
| LOC & other, net | 1,316,980 |
| | 987,360 |
|
| Leases and equipment finance, net | 523,114 |
| | 361,591 |
|
| Residential | | | |
| Mortgage, net | 2,217,105 |
| | 597,201 |
|
| Home equity loans & lines, net | 835,981 |
| | 264,269 |
|
| Consumer & other, net | 385,523 |
| | 48,113 |
|
| Non-covered loans and leases, net of deferred fees and costs | $ | 15,063,221 |
| | $ | 7,354,403 |
|
| | | | |
| Covered Loans | | | |
| Commercial real estate | | | |
| Non-owner occupied term, net | $ | 135,757 |
| | $ | 206,902 |
|
| Owner occupied term, net | 45,774 |
| | 49,817 |
|
| Multifamily, net | 27,310 |
| | 37,671 |
|
| Construction & development, net | 2,870 |
| | 3,455 |
|
| Residential development, net | 1,838 |
| | 7,286 |
|
| Commercial | | | |
|
| Term, net | 8,580 |
| | 15,719 |
|
| LOC & other, net | 5,742 |
| | 6,698 |
|
| Leases and equipment finance, net | — |
| | — |
|
| Residential | | | |
|
| Mortgage, net | 16,630 |
| | 22,316 |
|
| Home equity loans & lines, net | 16,497 |
| | 19,637 |
|
| Consumer & other, net | 3,513 |
| | 4,262 |
|
| Covered loans, net of deferred fees and costs | 264,511 |
| | 373,763 |
|
| Total loans, net of deferred fees and costs | $ | 15,327,732 |
| | $ | 7,728,166 |
|
The loan balances are net of deferred fees and costs of $26.3 million and $495,000 as of December 31, 20112014 and 2010:(in thousands)
| | | | | | | | |
| | | 2011 | | | 2010 | |
Commercial real estate | | | | | | | | |
Term & multifamily | | $ | 3,558,295 | | | $ | 3,483,475 | |
Construction & development | | | 165,066 | | | | 247,814 | |
Residential development | | | 90,073 | | | | 147,813 | |
Commercial | | | | | | | | |
Term | | | 625,766 | | | | 509,453 | |
LOC & other | | | 832,999 | | | | 747,419 | |
Residential | | | | | | | | |
Mortgage | | | 315,927 | | | | 222,416 | |
Home equity loans & lines | | | 272,192 | | | | 278,585 | |
Consumer & other | | | 38,860 | | | | 33,043 | |
| | | | |
Total | | | 5,899,178 | | | | 5,670,018 | |
Deferred loan fees, net | | | (11,080 | ) | | | (11,031 | ) |
| | | | |
Total | | $ | 5,888,098 | | | $ | 5,658,987 | |
| | | | |
2011,2014, loans totaling $5.1$8.5 billion were pledged to secure borrowings and available lines of credit. Net loans include discounts on acquired loans of $236.6 million and $63.4 million as of December 31, 2014 and
NOTE 6. ALLOWANCE FOR NON-COVERED LOAN LOSS AND CREDIT QUALITY2013, respectively.
The Bank hasoutstanding contractual unpaid principal balance of purchased impaired loans, excluding acquisition accounting adjustments, was $770.9 million and $497.5 million at December 31, 2014 and 2013, respectively. The carrying balance of purchased impaired loans was $562.9 million and $358.7 million at December 31, 2014 and 2013, respectively.
The following table presents the changes in the accretable yield for purchased impaired loans for the year ended December 31, 2014, and 2013:
|
| | | | | | | | | | | | | | | | | | | | | | | |
| (in thousands) | Year ended |
| | December 31, 2014 |
| | Evergreen | | Rainer | | Nevada Security | | Circle | | Sterling | | Total |
| Balance, beginning of period | $ | 20,063 |
| | $ | 71,789 |
| | $ | 34,632 |
| | $ | 1,140 |
| | $ | — |
| | $ | 127,624 |
|
| Additions | — |
| | — |
| | — |
| | — |
| | 110,757 |
| | 110,757 |
|
| Accretion to interest income | (11,340 | ) | | (18,264 | ) | | (13,791 | ) | | (344 | ) | | (18,408 | ) | | (62,147 | ) |
| Disposals | (5,457 | ) | | (11,217 | ) | | (5,841 | ) | | — |
| | (9,951 | ) | | (32,466 | ) |
| Reclassifications from nonaccretable difference | 6,200 |
| | 7,681 |
| | 8,666 |
| | — |
| | 35,384 |
| | 57,931 |
|
| Balance, end of period | $ | 9,466 |
| | $ | 49,989 |
| | $ | 23,666 |
| | $ | 796 |
| | $ | 117,782 |
| | $ | 201,699 |
|
| | | | | | | | | | | | |
| | Year ended | | |
| | December 31, 2013 | | |
| | Evergreen | | Rainer | | Nevada Security | | Circle | | Total | | |
| Balance, beginning of period | $ | 34,567 |
| | $ | 102,468 |
| | $ | 46,353 |
| | $ | 770 |
| | $ | 184,158 |
| | |
| Additions | — |
| | — |
| | — |
| | — |
| | — |
| | |
| Accretion to interest income | (12,695 | ) | | (23,511 | ) | | (15,292 | ) | | (292 | ) | | (51,790 | ) | | |
| Disposals | (3,221 | ) | | (12,362 | ) | | (3,703 | ) | | (672 | ) | | (19,958 | ) | | |
| Reclassifications from nonaccretable difference | 1,412 |
| | 5,194 |
| | 7,274 |
| | 1,334 |
| | 15,214 |
| | |
| Balance, end of period | $ | 20,063 |
| | $ | 71,789 |
| | $ | 34,632 |
| | $ | 1,140 |
| | $ | 127,624 |
| | |
Loans acquired in a managementFDIC-assisted acquisition that are subject to a loss-share agreement are referred to as covered loans. Covered loans are reported exclusive of the cash flow reimbursements expected from the FDIC. The following table summarizes the activity related to the FDIC indemnification asset for the years ended December 31, 2014 and 2013:
|
| | | | | | | | |
| (in thousands) | | | |
| | | 2014 | | 2013 |
| Balance, beginning of period | | $ | 23,174 |
| | $ | 52,798 |
|
| Change in FDIC indemnification asset | | (15,151 | ) | | (25,549 | ) |
| Transfers to due from FDIC and other | | (3,606 | ) | | (4,075 | ) |
| Balance, end of period | | $ | 4,417 |
| | $ | 23,174 |
|
The following table presents the net investment in direct financing leases and loans, net as ofDecember 31, 2014 and 2013:
|
| | | | | | | |
| (in thousands) | December 31, | | December 31, |
| | 2014 | | 2013 |
| Minimum lease payments receivable | $ | 283,942 |
| | $ | 242,220 |
|
| Estimated guaranteed and unguaranteed residual value | 9,158 |
| | 8,455 |
|
| Initial direct costs - net of accumulated amortization | 9,140 |
| | 3,824 |
|
| Unearned income | (55,868 | ) | | (55,110 | ) |
| Equipment finance loans, including unamortized deferred fees and costs | 275,639 |
| | 151,721 |
|
| Interim lease receivables | — |
| | 6,752 |
|
| Accretable yield/purchase accounting adjustments | 1,103 |
| | 3,729 |
|
| Net investment in direct financing leases and loans | $ | 523,114 |
| | $ | 361,591 |
|
| | | | |
| Allowance for credit losses | (14,369 | ) | | (3,775 | ) |
| | | | |
| Net investment in direct financing leases and loans - net | $ | 508,745 |
| | $ | 357,816 |
|
The following table presents the scheduled minimum lease payments receivable, excluding equipment finance loans, as of December 31, 2014:
|
| | | |
| (in thousands) | |
| 2015 | $ | 109,411 |
|
| 2016 | 81,477 |
|
| 2017 | 53,075 |
|
| 2018 | 29,121 |
|
| 2019 | 8,954 |
|
| Thereafter | 1,904 |
|
| | $ | 283,942 |
|
Note 6– Allowance for Loan and Lease Losses (“ALLL”) Committee, which is responsible for, among other things, regularly reviewing the ALLL methodology, including loss factors,Loss and ensuring that it is designed and applied in accordance with generally accepted accounting principles. Credit Quality
The
ALLL Committee reviews and approves loans and leases recommended for impaired status. The ALLL Committee also approves removing loans and leases from impaired status. The Bank’s Audit and Compliance Committee provides board oversight of the ALLL process and reviews and approves the ALLL methodology on a quarterly basis.OurBank's methodology for assessing the appropriateness of the ALLLAllowance for Loan and Lease Loss consists of three key elements, which includeelements: 1) the formula allowance; 2) the specific allowance; and 3) the unallocated allowance. By incorporating these factors into a single allowance requirement analysis, we believe all risk-based activities within the loan portfolioand lease portfolios are simultaneously considered.
Formula Allowance
The Bank performs regular credit reviews of the loan and lease portfolio to determine the credit quality and adherence to underwriting standards.
When loans and leases are originated
or acquired, they are assigned a risk rating that is reassessed periodically during the term of the loan
or lease through the credit review process. The
Company’sBank's risk rating methodology assigns risk ratings ranging from 1 to 10, where a higher rating represents higher risk. The 10 risk rating categories are a primary factor in determining an appropriate amount for the formula allowance.
The formula allowance is calculated by applying risk factors to various segments of pools of outstanding
loans.loans and leases. Risk factors are assigned to each portfolio segment based on
management’smanagement's evaluation of the losses inherent within each segment. Segments or regions with greater risk of loss will therefore be assigned a higher risk factor.
Base risk—–The portfolio is segmented into loan categories, and these categories are assigned a Base Riskrisk factor based on an evaluation of the loss inherent within each segment. Extra
risk—risk – Additional risk factors provide for an additional allocation of ALLL based on the loan
and lease risk rating system and loan delinquency, and reflect the increased level of inherent losses associated with more adversely classified
loans.Umpqua Holdings Corporationloans and Subsidiaries
Changes to risk factors—leases.
Risk factors
are assigned at origination and may be changed periodically based on
management’smanagement's evaluation of the following factors: loss experience; changes in the level of non-performing
loans;loans and leases; regulatory exam results; changes in the level of adversely classified loans
(positive or negative);and leases; improvement or deterioration in local economic conditions; and any other factors deemed relevant.
Regular credit reviews of the portfolio
also identify loans that are considered potentially impaired. Potentially impaired loans are referred to the ALLL Committee which reviews and approves designated loans as impaired. A loan is considered impaired when, based on current information and events, we determine that we will probably not be able to collect all amounts due according to the loan contract, including scheduled interest payments. When we identify a loan as impaired, we measure the impairment using discounted cash flows
or estimated note sale price, except when the sole remaining source of the repayment for the loan is the liquidation of the collateral. In these cases, we use the current fair value of the collateral, less selling costs, instead of discounted cash flows. If we determine that the value of the impaired loan is less than the recorded investment in the loan, we either recognize an impairment reserve as a
Specific Allowancespecific allowance to be provided for in the allowance for loan and lease losses or charge-off the impaired balance on
collateral dependentcollateral-dependent loans if it is determined that such amount represents a confirmed loss. Loans determined to be impaired with a specific allowance are excluded from the formula allowance so as not to double-count the loss exposure. The non-accrual impaired loans as of
period endperiod-end have already been partially
charged offcharged-off to their estimated net realizable value, and are expected to be resolved over the coming quarters with no additional material loss, absent further decline in market prices.
The combination of the formula allowance component and the specific allowance component
representrepresents the allocated allowance for loan and lease losses.
Unallocated Allowance
The Bank may also maintain an unallocated allowance amount to provide for other credit losses inherent in a loan and lease portfolio that may not have been contemplated in the credit loss factors. This unallocated amount generally comprises less than 10% of the allowance, but may be maintained at higher levels during times of deteriorating economic conditions characterized by falling real estate values. The unallocated amount is reviewed quarterly with consideration of factors including, but not limited to:
Changes in lending policies and procedures, including changes in underwriting standards and collection, charge-off, and recovery practices not considered elsewhere in estimating credit losses;
Changes in international, national, regional, and local economic and business conditions and developments that affect the collectability of the portfolio, including the condition of various market segments;
Changes in the nature and volume of the portfolio and in the terms of loans;
Changes in the experience and ability of lending management and other relevant staff;
Changes in the volume and severity of past due loans, the volume of nonaccrual loans, and the volume and severity of adversely classified or graded loans;
Changes in the quality of the institution’s loan review system;
Changes in the value of underlying collateral for collateral-depending loans;
The existence and effect of any concentrations of credit, and changes in the level of such concentrations;
The effect of other external factors such as competition and legal and regulatory requirements on the level of estimated credit losses in the institutions’ existing portfolio.
These factors are evaluated through a management survey of the Chief Credit Officer, Chief Lending Officers, Special Asset Manager, and Credit Review Manager. The survey requests responses to evaluate current changes in the nine qualitative
factors. This information is then incorporated into our understanding of the reasonableness of the formula factors and our evaluation of the unallocated portion of the ALLL.
Management believes that the ALLL was adequate as of December 31, 2011.2014. There is, however, no assurance that future loan and lease losses will not exceed the levels provided for in the ALLL and could possibly result in additional charges to the provision for loan and lease losses. In addition, bank regulatory authorities, as part of their periodic examination of the Bank, may require additional charges to the provision for loan and lease losses in future periods if warranted as a result of their review. Approximately 80% of our loan portfolio is secured by real estate, and a significant decline in real estate market values may require an increase in the allowance for loan and lease losses.
The
U.S. recession, the housing market downturn, and declining real estate values in our markets have negatively impacted aspects of our loan portfolio. A continued deterioration in our markets may adversely affect our loan portfolio and may lead to additional charges to the provision for loan and lease losses.The reserve for unfunded commitments (“RUC”)RUC is established to absorb inherent losses associated with our commitment to lend funds, such as with a letter or line of credit. The adequacy of the ALLL and RUC are monitored on a regular basis and are based on management’smanagement's evaluation of numerous factors. For each portfolio segment, theseThese factors include:
Theinclude the quality of the current loan portfolio;
The the trend in the loan portfolio’sportfolio's risk ratings;
Current current economic conditions;
Loan loan concentrations;
Past-due past-due and non-performing trends;
Evaluation evaluation of specific loss estimates for all significant problem loans;
Historical short (one year), medium (three year), historical charge-off and long-term charge-off rates;
recovery experience; and other pertinent information.Peer comparison loss rates.
There have been no significant changes to the Bank’sBank's methodology or policies in the periods presented.
Activity in the
Non-Covered Allowance for Loan and Lease Losses
The following table summarizes activity related to the allowance for non-covered loan and lease losses by non-covered loan and lease portfolio segment for the years endedDecember 31, 20112014 and 2010:(in thousands)
| | | | | | | | | | | | | | | | | | | | | | | | |
| | | December 31, 2011 | |
| | | Commercial
Real Estate | | | Commercial | | | Residential | | | Consumer
& Other | | | Unallocated | | | Total | |
Balance, beginning of period | | $ | 64,405 | | | $ | 22,146 | | | $ | 5,926 | | | $ | 803 | | | $ | 8,641 | | | $ | 101,921 | |
Charge-offs | | | (36,011 | ) | | | (21,071 | ) | | | (6,333 | ) | | | (1,636 | ) | | | — | | | | (65,051 | ) |
Recoveries | | | 5,906 | | | | 3,348 | | | | 239 | | | | 385 | | | | — | | | | 9,878 | |
Provision | | | 25,274 | | | | 16,062 | | | | 7,793 | | | | 1,315 | | | | (4,224 | ) | | | 46,220 | |
| | | | |
Balance, end of period | | $ | 59,574 | | | $ | 20,485 | | | $ | 7,625 | | | $ | 867 | | | $ | 4,417 | | | $ | 92,968 | |
| | | | |
Umpqua Holdings Corporation and Subsidiaries
| | | | | | | | | | | | | | | | | | | | | | | | |
| | | December 31, 2010 | |
| | | Commercial
Real Estate | | | Commercial | | | Residential | | | Consumer
& Other | | | Unallocated | | | Total | |
Balance, beginning of period | | $ | 67,281 | | | $ | 24,583 | | | $ | 5,811 | | | $ | 455 | | | $ | 9,527 | | | $ | 107,657 | |
Charge-offs | | | (71,030 | ) | | | (50,242 | ) | | | (5,168 | ) | | | (2,061 | ) | | | — | | | | (128,501 | ) |
Recoveries | | | 6,980 | | | | 1,318 | | | | 334 | | | | 465 | | | | — | | | | 9,097 | |
Provision | | | 61,174 | | | | 46,487 | | | | 4,949 | | | | 1,944 | | | | (886 | ) | | | 113,668 | |
| | | | |
Balance, end of period | | $ | 64,405 | | | $ | 22,146 | | | $ | 5,926 | | | $ | 803 | | | $ | 8,641 | | | $ | 101,921 | |
| | | | |
|
| | | | | | | | | | | | | | | | | | | |
| (in thousands) | December 31, 2014 |
| | Commercial | | | | | | Consumer | | |
| | Real Estate | | Commercial | | Residential | | & Other | | Total |
| Balance, beginning of period | $ | 59,538 |
| | $ | 27,028 |
| | $ | 7,487 |
| | $ | 1,032 |
| | $ | 95,085 |
|
| Charge-offs | (8,030 | ) | | (16,824 | ) | | (1,855 | ) | | (3,469 | ) | | (30,178 | ) |
| Recoveries | 2,539 |
| | 6,744 |
| | 462 |
| | 1,274 |
| | 11,019 |
|
| Provision | 1,137 |
| | 24,268 |
| | 9,828 |
| | 5,008 |
| | 40,241 |
|
| Balance, end of period | $ | 55,184 |
| | $ | 41,216 |
| | $ | 15,922 |
| | $ | 3,845 |
| | $ | 116,167 |
|
| | | | | | | | | | |
| | December 31, 2013 |
| | Commercial | | | | | | Consumer | | |
| | Real Estate | | Commercial | | Residential | | & Other | | Total |
| Balance, beginning of period | $ | 67,038 |
| | $ | 27,905 |
| | $ | 7,729 |
| | $ | 994 |
| | $ | 103,666 |
|
| Charge-offs | (9,748 | ) | | (20,810 | ) | | (3,655 | ) | | (1,285 | ) | | (35,498 | ) |
| Recoveries | 4,436 |
| | 10,445 |
| | 569 |
| | 751 |
| | 16,201 |
|
| Provision (recapture) | (2,188 | ) | | 9,488 |
| | 2,844 |
| | 572 |
| | 10,716 |
|
| Balance, end of period | $ | 59,538 |
| | $ | 27,028 |
| | $ | 7,487 |
| | $ | 1,032 |
| | $ | 95,085 |
|
The following table presents the allowance and recorded investment in non-covered loans and leases by portfolio segment and balances individually or collectively evaluated for impairment as of December 31, 20112014 and 2010, respectively:(in thousands)
| | | | | | | | | | | | | | | | | | | | | | | | |
| | | December 31, 2011 | |
| | | Commercial
Real Estate | | | Commercial | | | Residential | | | Consumer
& Other | | | Unallocated | | | Total | |
Allowance for non-covered loans and leases: | | | | | | | | | | | | | | | | | | | | | | | | |
Collectively evaluated for impairment | | $ | 58,402 | | | $ | 17,877 | | | $ | 7,621 | | | $ | 867 | | | $ | 4,417 | | | $ | 89,184 | |
Individually evaluated for impairment | | | 1,172 | | | | 2,608 | | | | 4 | | | | — | | | | — | | | | 3,784 | |
| | | | |
Total | | $ | 59,574 | | | $ | 20,485 | | | $ | 7,625 | | | $ | 867 | | | $ | 4,417 | | | $ | 92,968 | |
| | | | |
Non-covered loans and leases: | | | | | | | | | | | | | | | | | | | | | | | | |
Collectively evaluated for impairment | | $ | 3,673,455 | | | $ | 1,432,594 | | | $ | 587,990 | | | $ | 38,860 | | | | | | | $ | 5,732,899 | |
Individually evaluated for impairment | | | 139,979 | | | | 26,171 | | | | 129 | | | | — | | | | | | | | 166,279 | |
| | | | |
Total | | $ | 3,813,434 | | | $ | 1,458,765 | | | $ | 588,119 | | | $ | 38,860 | | | | | | | $ | 5,899,178 | |
| | | | |
| | | | | | | | | | | | | | | | | | | | | | | | |
| | | December 31, 2010 | |
| | | Commercial
Real Estate | | | Commercial | | | Residential | | | Consumer
& Other | | | Unallocated | | | Total | |
Allowance for non-covered loans and leases: | | | | | | | | | | | | | | | | | | | | | | | | |
Collectively evaluated for impairment | | $ | 61,885 | | | $ | 19,435 | | | $ | 5,918 | | | $ | 803 | | | $ | 8,641 | | | $ | 96,682 | |
Individually evaluated for impairment | | | 2,520 | | | | 2,711 | | | | 8 | | | | — | | | | — | | | | 5,239 | |
| | | | |
Total | | $ | 64,405 | | | $ | 22,146 | | | $ | 5,926 | | | $ | 803 | | | $ | 8,641 | | | $ | 101,921 | |
| | | | |
Non-covered loans and leases: | | | | | | | | | | | | | | | | | | | | | | | | |
Collectively evaluated for impairment | | $ | 3,692,169 | | | $ | 1,221,365 | | | $ | 500,822 | | | $ | 33,043 | | | | | | | $ | 5,447,399 | |
Individually evaluated for impairment | | | 186,933 | | | | 35,507 | | | | 179 | | | | — | | | | | | | | 222,619 | |
| | | | |
Total | | $ | 3,879,102 | | | $ | 1,256,872 | | | $ | 501,001 | | | $ | 33,043 | | | | | | | $ | 5,670,018 | |
| | | | |
(1) | The gross non-covered loan and lease balance excludes deferred loans fees of $11.1 million and $11.0 million for the years ended December 31, 2011 and 2010, respectively. |
2013: |
| | | | | | | | | | | | | | | | | | | |
| (in thousands) | December 31, 2014 |
| | Commercial | | | | | | Consumer | | |
| | Real Estate | | Commercial | | Residential | | & Other | | Total |
| Allowance for loans and leases: |
| Collectively evaluated for impairment | $ | 49,243 |
| | $ | 38,201 |
| | $ | 15,858 |
| | $ | 3,118 |
| | $ | 106,420 |
|
| Individually evaluated for impairment | 1,088 |
| | 320 |
| | — |
| | — |
| | 1,408 |
|
| Loans acquired with deteriorated credit quality | 4,853 |
| | 2,695 |
| | 64 |
| | 727 |
| | 8,339 |
|
| Total | $ | 55,184 |
| | $ | 41,216 |
| | $ | 15,922 |
| | $ | 3,845 |
| | $ | 116,167 |
|
| Loans and leases: | | | | | | | | | |
| Collectively evaluated for impairment | $ | 8,374,716 |
| | $ | 2,884,388 |
| | $ | 3,084,633 |
| | $ | 318,572 |
| | $ | 14,662,309 |
|
| Individually evaluated for impairment | 69,636 |
| | 32,936 |
| | — |
| | — |
| | 102,572 |
|
| Loans acquired with deteriorated credit quality | 459,308 |
| | 31,499 |
| | 1,580 |
| | 70,464 |
| | 562,851 |
|
| Total | $ | 8,903,660 |
| | $ | 2,948,823 |
| | $ | 3,086,213 |
| | $ | 389,036 |
| | $ | 15,327,732 |
|
|
| | | | | | | | | | | | | | | | | | | |
| (in thousands) | December 31, 2013 |
| | Commercial | | | | | | Consumer | | |
| | Real Estate | | Commercial | | Residential | | & Other | | Total |
| Allowance for loans and leases: |
| Collectively evaluated for impairment | $ | 51,758 |
| | $ | 24,303 |
| | $ | 6,878 |
| | $ | 914 |
| | $ | 83,853 |
|
| Individually evaluated for impairment | 1,785 |
| | 12 |
| | — |
| | — |
| | 1,797 |
|
| Loans acquired with deteriorated credit quality | 5,995 |
| | 2,713 |
| | 609 |
| | 118 |
| | 9,435 |
|
| Total | $ | 59,538 |
| | $ | 27,028 |
| | $ | 7,487 |
| | $ | 1,032 |
| | $ | 95,085 |
|
| Loans and leases: | | | | | | | | |
| Collectively evaluated for impairment | $ | 4,236,643 |
| | $ | 2,114,929 |
| | $ | 866,463 |
| | $ | 50,636 |
| | $ | 7,268,671 |
|
| Individually evaluated for impairment | 89,280 |
| | 11,503 |
| | — |
| | — |
| | 100,783 |
|
| Loans acquired with deteriorated credit quality | 304,232 |
| | 15,781 |
| | 36,960 |
| | 1,739 |
| | 358,712 |
|
| Total | $ | 4,630,155 |
| | $ | 2,142,213 |
| | $ | 903,423 |
| | $ | 52,375 |
| | $ | 7,728,166 |
|
Summary of Reserve for Unfunded Commitments Activity
The following table presents a summary of activity in the reserve for unfunded commitments (“RUC”)RUC and unfunded commitments at for the years endedDecember 31, 20112014 and 2010:(in thousands)
| | | | | | | | | | | | | | | | | | | | |
| | | December 31, 2011 | |
| | | Commercial
Real Estate | | | Commercial | | | Residential | | | Consumer
& Other | | | Total | |
Balance, beginning of period | | $ | 33 | | | $ | 575 | | | $ | 158 | | | $ | 52 | | | $ | 818 | |
Net change to other expense | | | 26 | | | | 58 | | | | 27 | | | | 11 | | | | 122 | |
| | | | |
Balance, end of period | | $ | 59 | | | $ | 633 | | | $ | 185 | | | $ | 63 | | | $ | 940 | |
| | | | |
| | | | | | | | | | | | | | | | | | | | |
| | | December 31, 2010 | |
| | | Commercial
Real Estate | | | Commercial | | | Residential | | | Consumer
& Other | | | Total | |
Balance, beginning of period | | $ | 57 | | | $ | 484 | | | $ | 144 | | | $ | 46 | | | $ | 731 | |
Net change to other expense | | | (24 | ) | | | 91 | | | | 14 | | | | 6 | | | | 87 | |
| | | | |
Balance, end of period | | $ | 33 | | | $ | 575 | | | $ | 158 | | | $ | 52 | | | $ | 818 | |
| | | | |
| | | | | | | | | | | | | | | | | | | | |
| | | Commercial
Real Estate | | | Commercial | | | Residential | | | Consumer
& Other | | | Total | |
Unfunded commitments: | | | | | | | | | | | | | | | | | | | | |
December 31, 2011 | | $ | 58,013 | | | $ | 605,001 | | | $ | 233,990 | | | $ | 47,577 | | | $ | 944,581 | |
December 31, 2010 | | $ | 33,326 | | | $ | 548,920 | | | $ | 210,574 | | | $ | 45,556 | | | $ | 838,376 | |
Non-Covered 2013:
|
| | | | | | | |
| (in thousands) | December 31, 2014 | | December 31, 2013 |
| Balance, beginning of period | $ | 1,436 |
| | $ | 1,223 |
|
| Net change to other expense | (1,863 | ) | | 213 |
|
| Acquired reserve | 3,966 |
| | — |
|
| Balance, end of period | $ | 3,539 |
| | $ | 1,436 |
|
|
| | | | |
| (in thousands) | | |
| | | Total |
| Unfunded loan and lease commitments: | | |
| December 31, 2014 | | $ | 3,000,505 |
|
| December 31, 2013 | | $ | 1,638,446 |
|
Loans
Soldand leases sold
In the course of managing the loan and lease portfolio, at certain times, management may decide to sell loans prior to resolution.and leases. The following table summarizes non-covered loans and leases sold by loan portfolio during the years endedDecember 31:(In thousands)
| | | | | | | | |
| | | 2011 | | | 2010 | |
Commercial Real Estate | | | | | | | | |
Term & multifamily | | $ | 7,143 | | | $ | 8,848 | |
Construction & development | | | 28 | | | | 4,686 | |
Residential development | | | 1,123 | | | | 15,255 | |
Commercial | | | | | | | | |
Term | | | 151 | | | | 9,915 | |
LOC & other | | | 2,740 | | | | 40 | |
| | | | |
Total | | $ | 11,185 | | | $ | 38,744 | |
| | | | |
31, 2014
and 2013: |
| | | | | | | |
| (in thousands) | 2014 | | 2013 |
| Commercial real estate | | | |
| Non-owner occupied term | $ | 15,500 |
| | $ | 4,039 |
|
| Owner occupied term | 87,385 |
| | 3,738 |
|
| Multifamily | 60,508 |
| | — |
|
| Construction & development | 566 |
| | 3,515 |
|
| Residential development | 800 |
| | 363 |
|
| Commercial | | | |
| Term | 30,497 |
| | 47,635 |
|
| LOC & other | 6,061 |
| | — |
|
| Residential | | | |
| Mortgage | 108,246 |
| | 1,008 |
|
| Home equity loans & lines | 24,445 |
| | — |
|
| Consumer & other | 7,344 |
| | — |
|
| Total | $ | 341,352 |
| | $ | 60,298 |
|
Asset Quality and Non-Performing Loans
and Leases
We manage asset quality and control credit risk through diversification of the
non-covered loan
and lease portfolio and the application of policies designed to promote sound underwriting and loan
and lease monitoring practices. The
Bank’sBank's Credit Quality
GroupAdministration is charged with monitoring asset quality, establishing credit policies and procedures and enforcing the consistent application of these policies and procedures across the Bank. Reviews of non-performing, past due
non-covered loans
and leases and larger credits, designed to identify potential charges to the allowance for loan and lease losses, and to determine the adequacy of the allowance, are conducted on an ongoing basis. These reviews consider such factors as the financial strength of borrowers, the value of the applicable collateral, loan
and lease loss experience, estimated loan
and lease losses, growth in the loan
and lease portfolio, prevailing economic conditions and other factors.
Umpqua Holdings Corporation and Subsidiaries
A loan is considered impaired when, based on current information and events, we determine it is probable that we will not be able to collect all amounts due according to the loan contract, including scheduled interest payments. Generally, when loans are identified as impaired, they are moved to ourthe Special Assets Division.Department. When we identify a loan as impaired, we measure the loan for potential impairment using discounted cash flows, except when the sole remaining source of the repayment for the loan is the liquidation of the collateral. In these cases, we will use the current fair value of collateral, less selling costs. The starting point for determining the fair value of collateral is through obtaining external appraisals. Generally, external appraisals are updated every six to nine12 months. We obtain appraisals from a pre-approved list of independent, third party, local appraisal firms. Approval and addition to the list is based on experience, reputation, character, consistency and knowledge of the respective real estate market. At a minimum, it is ascertained that the appraiser is: (a) currently licensed in the state in which the property is located, (b) is experienced in the appraisal of properties similar to the property being appraised, (c) is actively engaged in the appraisal work, (d) has knowledge of current real estate market conditions and financing trends, (e) is reputable, and (f) is not on Freddie Mac’s norMac's or the Bank’sBank's Exclusionary List of appraisers and brokers. In certain cases appraisals will be reviewed by our Real Estate Valuation Services group to ensure the quality of the appraisal and the expertise and independence of the appraiser. Upon receipt and review, an external appraisal is utilized to measure a loan for potential impairment. Our impairment analysis documents the date of the appraisal used in the analysis, whether the officer preparing the report deems it current, and, if not, allows for internal valuation adjustments with justification. Typical justified adjustments might include discounts for continued market deterioration subsequent to appraisal date, adjustments for the release of collateral contemplated in the appraisal, or the value of other collateral or consideration not contemplated in the appraisal. An appraisal over one year old in most cases will be considered stale dated and an updated or new appraisal will be required. Any adjustments from appraised value to net realizable value are detailed and justified in the impairment analysis, which is reviewed and approved by senior credit quality officers and the Company’s Allowance for Loan and Lease Losses (“ALLL”)Bank's ALLL Committee. Although an external appraisal is the primary source to value collateral dependentcollateral-dependent loans, we may also utilize values obtained through purchase and sale agreements, negotiated short sales, broker price opinions, or the sales price of the note. These alternative sources of value are used only if deemed to be more representative of value based on updated information regarding collateral resolution. Impairment analyses are updated, reviewed and approved on a quarterly basis at or near the end of each reporting period. Appraisals or other alternative sources of value received subsequent to the reporting
period, but prior to our filing of periodic reports, are considered and evaluated to ensure our periodic filings are materially correct and not misleading. Based on these processes, we do not believe there are significant time lapses for the recognition of additional loan loss provisions or charge-offs from the date they become known.
Loans are classified as non-accrual when collection of principal or interest is doubtful—generally if they are past due as to maturity or payment of principal or interest by 90 days or more—unless such loans are well-secured and in the process of collection. Additionally, all loans that are impaired are considered for non-accrual status. Loans placed on non-accrual will typically remain on non-accrual status until all principal and interest payments are brought current and the prospects for future payments in accordance with the loan agreement appear relatively certain.
Loans are reported as restructured when the
The Bank grants a concession(s) to a borrower experiencing financial difficulties that it would not otherwise consider. Examples of such concessions include a reduction in the loan rate, forgiveness of principal or accrued interest, extending the maturity date or providing a lower interest rate than would be normally available for a transaction of similar risk. As a result of these concessions, restructured loans are impaired as the Bank will not collect all amounts due, both principal and interest, in accordance with the terms of the original loan agreement. Impairment reserves on non-collateral dependent restructured loans are measured by comparing the present value of expected future cash flows on the restructured loans discounted at the interest rate of the original loan agreement to the loan’s carrying value. These impairment reserves are recognized as a specific component to be provided for in the allowance for loan and lease losses.Loans are reported as past due when installment payments, interest payments, or maturity payments are past due based on contractual terms. All loans determined to be impaired are individually assessed for impairment except for impaired consumer loans which are collectively evaluated for impairment in accordance with FASB ASC 450,Contingencies (“ASC 450”). The specific factors considered in determining that a loan is impaired include borrower financial capacity, current economic, business and market conditions, collection efforts, collateral position and other factors deemed relevant. Generally, impaired
loans are placed on non-accrual status and all cash receipts are applied to the principal balance. Continuation of accrual status and recognition of interest income is generally limited to performing restructured loans.
The Company has written down impaired, non-accrual loans as of
December 31, 20112014 to their estimated net realizable value, generally based on disposition value, and expects resolution with no additional material loss, absent further decline in market prices. Non-Covered Non-Accrual Loans and Leases and Loans and Leases Past DueThe following table summarizes our non-covered, non-accrual loans and leases and loans and leases past due by loan and lease class as of December 31, 20112014 and December 31, 2010:(in thousands)
| | | | | | | | | | | | | | | | | | | | | | | | | | | | |
| | | December 31, 2011 | |
| | 30-59 Days Past Due | | | 60-89 Days Past Due | | | Greater Than 90 Days and Accruing | | | Total Past Due | | | Nonaccrual | | | Current | | | Total Non-
covered Loans and Leases | |
Commercial real estate | | | | | | | | | | | | | | | | | | | | | | | | | | | | |
Term & multifamily | | $ | 7,319 | | | $ | 11,184 | | | $ | — | | | $ | 18,503 | | | $ | 44,486 | | | $ | 3,495,306 | | | $ | 3,558,295 | |
Construction & development | | | — | | | | 662 | | | | 575 | | | | 1,237 | | | | 3,348 | | | | 160,481 | | | | 165,066 | |
Residential development | | | 4,171 | | | | — | | | | — | | | | 4,171 | | | | 15,836 | | | | 70,066 | | | | 90,073 | |
Commercial | | | | | | | | | | | | | | | | | | | | | | | | | | | | |
Term | | | 2,075 | | | | 738 | | | | 1,179 | | | | 3,992 | | | | 8,120 | | | | 613,654 | | | | 625,766 | |
LOC & other | | | 5,435 | | | | 1,697 | | | | 1,397 | | | | 8,529 | | | | 8,772 | | | | 815,698 | | | | 832,999 | |
Residential | | | | | | | | | | | | | | | | | | | | | | | | | | | | |
Mortgage | | | 215 | | | | 965 | | | | 4,343 | | | | 5,523 | | | | — | | | | 310,404 | | | | 315,927 | |
Home equity loans & lines | | | 492 | | | | 191 | | | | 2,648 | | | | 3,331 | | | | — | | | | 268,861 | | | | 272,192 | |
Consumer & other | | | 67 | | | | 16 | | | | 679 | | | | 762 | | | | — | | | | 38,098 | | | | 38,860 | |
| | | | |
Total | | $ | 19,774 | | | $ | 15,453 | | | $ | 10,821 | | | $ | 46,048 | | | $ | 80,562 | | | $ | 5,772,568 | | | $ | 5,899,178 | |
| | | | | | | | |
Deferred loan fees, net | | | | | | | | | | | | | | | | | | | | | | | | | | | (11,080 | ) |
| | | | | | | | | | | | | | | | | | | | | | | | | | | | |
Total | | | | | | | | | | | | | | | | | | | | | | | | | | $ | 5,888,098 | |
| | | | | | | | | | | | | | | | | | | | | | | | |
Umpqua Holdings Corporation and Subsidiaries
| | | | | | | | | | | | | | | | | | | | | | | | | | | | |
| | | December 31, 2010 | |
| | | 30-59 Days Past Due | | | 60-89 Days Past Due | | | Greater Than 90 Days and Accruing | | | Total Past Due | | | Nonaccrual | | | Current | | | Total Non-
covered Loans and Leases | |
Commercial real estate | | | | | | | | | | | | | | | | | | | | | | | | | | | | |
Term & multifamily | | $ | 14,596 | | | $ | 8,328 | | | $ | 3,008 | | | $ | 25,932 | | | $ | 49,162 | | | $ | 3,408,381 | | | $ | 3,483,475 | |
Construction & development | | | 2,172 | | | | 6,726 | | | | — | | | | 8,898 | | | | 20,124 | | | | 218,792 | | | | 247,814 | |
Residential development | | | 640 | | | | — | | | | — | | | | 640 | | | | 34,586 | | | | 112,587 | | | | 147,813 | |
Commercial | | | | | | | | | | | | | | | | | | | | | | | | | | | | |
Term | | | 2,010 | | | | 932 | | | | — | | | | 2,942 | | | | 6,271 | | | | 500,240 | | | | 509,453 | |
LOC & other | | | 5,939 | | | | 1,418 | | | | 18 | | | | 7,375 | | | | 28,034 | | | | 712,010 | | | | 747,419 | |
Residential | | | | | | | | | | | | | | | | | | | | | | | | | | | | |
Mortgage | | | 1,314 | | | | 1,101 | | | | 3,372 | | | | 5,787 | | | | — | | | | 216,629 | | | | 222,416 | |
Home equity loans & lines | | | 1,096 | | | | 1,351 | | | | 232 | | | | 2,679 | | | | — | | | | 275,906 | | | | 278,585 | |
Consumer & other | | | 361 | | | | 233 | | | | 441 | | | | 1,035 | | | | — | | | | 32,008 | | | | 33,043 | |
| | | | |
Total | | $ | 28,128 | | | $ | 20,089 | | | $ | 7,071 | | | $ | 55,288 | | | $ | 138,177 | | | $ | 5,476,553 | | | $ | 5,670,018 | |
| | | | | | | | |
Deferred loan fees, net | | | | | | | | | | | | | | | | | | | | | | | | | | | (11,031 | ) |
| | | | | | | | | | | | | | | | | | | | | | | | | | | | |
Total | | | | | | | | | | | | | | | | | | | | | | | | | | $ | 5,658,987 | |
| | | | | | | | | | | | | | | | | | | | | | | | |
2013
Non-covered Impaired Loans: The following table summarizes our non-covered
|
| | | | | | | | | | | | | | | | | | | | | | | | | | | |
| (in thousands) | December 31, 2014 |
| | Greater Than | | 60 to 89 | | Greater Than | | | | | | | | Total |
| | 30 to 59 Days | | Days | | 90 Days and | | Total | | Non- | | Current & | | Loans |
| | Past Due | | Past Due | | Accruing | | Past Due | | accrual | | Other (1) | | and Leases |
| Commercial real estate | |
| | |
| | |
| | |
| | |
| | |
| | |
|
| Non-owner occupied term, net | $ | 452 |
| | $ | — |
| | $ | 283 |
| | $ | 735 |
| | $ | 8,957 |
| | $ | 3,280,918 |
| | $ | 3,290,610 |
|
| Owner occupied term, net | 2,304 |
| | 347 |
| | — |
| | 2,651 |
| | 8,292 |
| | 2,622,921 |
| | 2,633,864 |
|
| Multifamily, net | — |
| | 512 |
| | — |
| | 512 |
| | 300 |
| | 2,637,806 |
| | 2,638,618 |
|
| Construction & development, net | 1,091 |
| | — |
| | — |
| | 1,091 |
| | — |
| | 257,631 |
| | 258,722 |
|
| Residential development, net | 6,155 |
| | — |
| | — |
| | 6,155 |
| | — |
| | 75,691 |
| | 81,846 |
|
| Commercial | | | | | | | | | | | | | |
| Term, net | 1,098 |
| | 242 |
| | 3 |
| | 1,343 |
| | 19,097 |
| | 1,082,547 |
| | 1,102,987 |
|
| LOC & other, net | 1,637 |
| | 1,155 |
| | 1,223 |
| | 4,015 |
| | 8,825 |
| | 1,309,882 |
| | 1,322,722 |
|
| Leases and equipment finance, net | 1,482 |
| | 1,695 |
| | 695 |
| | 3,872 |
| | 5,084 |
| | 514,158 |
| | 523,114 |
|
| Residential | | | | | | | | | | | | | |
| Mortgage, net | 8 |
| | 1,224 |
| | 4,289 |
| | 5,521 |
| | 655 |
| | 2,227,559 |
| | 2,233,735 |
|
| Home equity loans & lines, net | 1,924 |
| | 702 |
| | 749 |
| | 3,375 |
| | 615 |
| | 848,488 |
| | 852,478 |
|
| Consumer & other, net | 2,133 |
| | 498 |
| | 270 |
| | 2,901 |
| | 216 |
| | 385,919 |
| | 389,036 |
|
| Total, net of deferred fees and costs | $ | 18,284 |
| | $ | 6,375 |
| | $ | 7,512 |
| | $ | 32,171 |
| | $ | 52,041 |
| | $ | 15,243,520 |
| | $ | 15,327,732 |
|
(1) Other includes purchased credit impaired loans
by loan class as of
December 31, 2011 and December 31, 2010:(in thousands)
| | | | | | | | | | | | | | | | | | | | |
| | | 2011 | |
| | | Unpaid
Principal
Balance | | | Recorded
Investment | | | Related
Allowance | | | Average
Recorded
Investment | | | Interest
Income
Recognized | |
With no related allowance recorded | | | | | | | | | | | | | | | | | | | | |
Commercial real estate | | | | | | | | | | | | | | | | | | | | |
Term & multifamily | | $ | 54,673 | | | $ | 47,344 | | | $ | — | | | $ | 50,459 | | | $ | — | |
Construction & development | | | 22,553 | | | | 17,744 | | | | — | | | | 21,498 | | | | — | |
Residential development | | | 30,575 | | | | 23,212 | | | | — | | | | 33,864 | | | | — | |
Commercial | | | | | | | | | | | | | | | | | | | | |
Term | | | 14,205 | | | | 11,311 | | | | — | | | | 9,339 | | | | — | |
LOC & other | | | 23,132 | | | | 9,034 | | | | — | | | | 16,121 | | | | — | |
Residential | | | | | | | | | | | | | | | | | | | | |
Mortgage | | | — | | | | — | | | | — | | | | — | | | | — | |
Home equity loans & lines | | | — | | | | — | | | | — | | | | — | | | | — | |
Consumer & other | | | — | | | | — | | | | — | | | | — | | | | — | |
With an allowance recorded | | | | | | | | | | | | | | | | | | | | |
Commercial real estate | | | | | | | | | | | | | | | | | | | | |
Term & multifamily | | | 22,611 | | | | 13,105 | | | | 557 | | | | 18,792 | | | | 894 | |
Construction & development | | | 3,762 | | | | 12,248 | | | | 151 | | | | 6,560 | | | | 798 | |
Residential development | | | 26,326 | | | | 26,326 | | | | 464 | | | | 32,810 | | | | 1,120 | |
Commercial | | | | | | | | | | | | | | | | | | | | |
Term | | | 1,851 | | | | 1,851 | | | | 608 | | | | 627 | | | | 140 | |
LOC & other | | | 3,975 | | | | 3,975 | | | | 2,000 | | | | 3,642 | | | | — | |
Residential | | | | | | | | | | | | | | | | | | | | |
Mortgage | | | — | | | | — | | | | — | | | | 143 | | | | — | |
Home equity loans & lines | | | 129 | | | | 129 | | | | 4 | | | | 52 | | | | 3 | |
Consumer & other | | | — | | | | — | | | | — | | | | — | | | | — | |
Total | | | | | | | | | | | | | | | | | | | | |
Commercial Real Estate | | $ | 160,500 | | | $ | 139,979 | | | $ | 1,172 | | | $ | 163,983 | | | $ | 2,812 | |
Commercial | | | 43,163 | | | | 26,171 | | | | 2,608 | | | | 29,729 | | | | 140 | |
Residential | | | 129 | | | | 129 | | | | 4 | | | | 195 | | | | 3 | |
Consumer & Other | | | — | | | | — | | | | — | | | | — | | | | — | |
| | | | |
Total | | $ | 203,792 | | | $ | 166,279 | | | $ | 3,784 | | | $ | 193,907 | | | $ | 2,955 | |
| | | | |
Umpqua Holdings Corporation and Subsidiaries
| | | | | | | | | | | | | | | | | | | | |
| | | 2010 | |
| | | Unpaid Principal Balance | | | Recorded Investment | | | Related Allowance | | | Average Recorded Investment | | | Interest Income Recognized | |
| | | | | |
| | | | | |
With no related allowance recorded | | | | | | | | | | | | | | | | | | | | |
Commercial real estate | | | | | | | | | | | | | | | | | | | | |
Term & multifamily | | $ | 62,605 | | | $ | 49,790 | | | $ | — | | | $ | 56,003 | | | $ | — | |
Construction & development | | | 33,091 | | | | 25,558 | | | | — | | | | 27,588 | | | | — | |
Residential development | | | 63,859 | | | | 39,011 | | | | — | | | | 37,603 | | | | — | |
Commercial | | | | | | | | | | | | | | | | | | | | |
Term | | | 8,024 | | | | 6,969 | | | | — | | | | 9,420 | | | | — | |
LOC & other | | | 56,046 | | | | 19,814 | | | | — | | | | 38,215 | | | | — | |
Residential | | | | | | | | | | | | | | | | | | | | |
Mortgage | | | — | | | | — | | | | — | | | | — | | | | — | |
Home equity loans & lines | | | — | | | | — | | | | — | | | | — | | | | — | |
Consumer & other | | | — | | | | — | | | | — | | | | — | | | | — | |
With an allowance recorded | | | | | | | | | | | | | | | | | | | | |
Commercial real estate | | | | | | | | | | | | | | | | | | | | |
Term & multifamily | | | 29,926 | | | | 28,070 | | | | 1,614 | | | | 28,518 | | | | 823 | |
Construction & development | | | — | | | | — | | | | — | | | | 1,706 | | | | 38 | |
Residential development | | | 46,059 | | | | 44,504 | | | | 906 | | | | 54,607 | | | | 1,474 | |
Commercial | | | | | | | | | | | | | | | | | | | | |
Term | | | 205 | | | | 205 | | | | 9 | | | | 402 | | | | 48 | |
LOC & other | | | 9,878 | | | | 8,519 | | | | 2,702 | | | | 1,884 | | | | 14 | |
Residential | | | | | | | | | | | | | | | | | | | | |
Mortgage | | | 179 | | | | 179 | | | | 8 | | | | 3,750 | | | | 6 | |
Home equity loans & lines | | | — | | | | — | | | | — | | | | 21 | | | | — | |
Consumer & other | | | — | | | | — | | | | — | | | | — | | | | — | |
Total | | | | | | | | | | | | | | | | | | | | |
Commercial Real Estate | | $ | 235,540 | | | $ | 186,933 | | | $ | 2,520 | | | $ | 206,025 | | | $ | 2,335 | |
Commercial | | | 74,153 | | | | 35,507 | | | | 2,711 | | | | 49,921 | | | | 62 | |
Residential | | | 179 | | | | 179 | | | | 8 | | | | 3,771 | | | | 6 | |
Consumer & Other | | | — | | | | — | | | | — | | | | — | | | | — | |
| | | | |
Total | | $ | 309,872 | | | $ | 222,619 | | | $ | 5,239 | | | $ | 259,717 | | | $ | 2,403 | |
| | | | |
$562.9 million.
|
| | | | | | | | | | | | | | | | | | | | | | | | | | | |
| (in thousands) | December 31, 2013 |
| | Greater Than | | 60 to 89 | | Greater Than | | | | | | | | Total |
| | 30 to 59 Days | | Days | | 90 Days and | | Total | | Non- | | Current & | | Loans |
| | Past Due | | Past Due | | Accruing | | Past Due | | accrual | | Other (1) | | and Leases |
| Commercial real estate | |
| | |
| | |
| | |
| | |
| | |
| | |
|
| Non-owner occupied term, net | $ | 3,618 |
| | $ | 352 |
| | $ | — |
| | $ | 3,970 |
| | $ | 9,193 |
| | $ | 2,521,999 |
| | $ | 2,535,162 |
|
| Owner occupied term, net | 1,320 |
| | 340 |
| | 610 |
| | 2,270 |
| | 6,204 |
| | 1,300,926 |
| | 1,309,400 |
|
| Multifamily, net | — |
| | — |
| | — |
| | — |
| | 935 |
| | 440,273 |
| | 441,208 |
|
| Construction & development, net | — |
| | — |
| | — |
| | — |
| | — |
| | 248,686 |
| | 248,686 |
|
| Residential development, net | — |
| | — |
| | — |
| | — |
| | 2,801 |
| | 92,898 |
| | 95,699 |
|
| Commercial | | | | | |
| | | | | | | |
|
| Term, net | 901 |
| | 1,436 |
| | — |
| | 2,337 |
| | 8,723 |
| | 775,504 |
| | 786,564 |
|
| LOC & other, net | 619 |
| | 224 |
| | — |
| | 843 |
| | 1,222 |
| | 991,993 |
| | 994,058 |
|
| Leases and equipment finance, net | 2,202 |
| | 1,706 |
| | 517 |
| | 4,425 |
| | 2,813 |
| | 354,353 |
| | 361,591 |
|
| Residential | | | | | | | | | | | | |
|
| Mortgage, net | 1,050 |
| | 342 |
| | 2,070 |
| | 3,462 |
| | — |
| | 616,055 |
| | 619,517 |
|
| Home equity loans & lines, net | 473 |
| | 563 |
| | 160 |
| | 1,196 |
| | — |
| | 282,710 |
| | 283,906 |
|
| Consumer & other, net | 69 |
| | 75 |
| | 73 |
| | 217 |
| | — |
| | 52,158 |
| | 52,375 |
|
| Total, net of deferred fees and costs | $ | 10,252 |
| | $ | 5,038 |
| | $ | 3,430 |
| | $ | 18,720 |
| | $ | 31,891 |
| | $ | 7,677,555 |
| | $ | 7,728,166 |
|
(1) Other includes purchased credit impaired loans of $358.7 million.
Impaired Loans
Loans with no related allowance reported generally represent non-accrual loans. The CompanyBank recognizes the charge-off of impairment reserves on impaired loans in the period it arises for collateral dependent loans. Therefore, the non-accrual loans as of December 31, 20112014 have already been written-down to their estimated net realizable value, based on disposition value and are expected to be resolved with no additional material loss, absent further decline in market prices. The valuationspecific allowance on impaired loans primarily represents the impairment reserves on performing restructured loans, and is measured by comparing the present value of expected future cash flows on the restructured loans discounted at the interest rate of the original loan agreement to the loan’sloan's carrying value.At December 31, 2011 and 2010, non-covered impaired loans of $80.6 million and $84.4 million were classified as accruing restructured loans, respectively. The restructurings were granted in response to borrower financial difficulty, and generally provide for a temporary modification of loan repayment terms. The restructured loans on accrual status and two loans included in loans past due 30+ days and accruing represent the only impaired loans accruing interest at December 31, 2011. Theeach respective date represent certain restructured loans on accrual status represent the only impaired loans accruing interest at December 31, 2010.status. In order for a restructured loan to be considered for accrual status, the loan’s collateral coverage generally will be greater than or equal to 100% of the loan balance, the loan is current on payments, and the borrower must either prefund an interest reserve or demonstrate the ability to make payments from a verified source of cash flow.
The Company had obligations of $205,000 to lend additional fundsfollowing table summarizes our impaired loans, including average recorded investment and interest income recognized on the restructuredimpaired loans, as of December 31, 2011.Forby loan class for the years ended
December 31, 2011, 20102014 and 2009, interest income2013:
|
| | | | | | | | | | | | | | | |
| (in thousands) | December 31, 2014 |
| | Unpaid | | Recorded Investment | | |
| | Principal | | Without | | With | | Related |
| | Balance | | Allowance | | Allowance | | Allowance |
| Commercial real estate | | | | | | | |
| Non-owner occupied term, net | $ | 42,793 |
| | $ | 16,916 |
| | $ | 22,190 |
| | $ | 502 |
|
| Owner occupied term, net | 16,339 |
| | 8,290 |
| | 7,655 |
| | 364 |
|
| Multifamily, net | 4,040 |
| | 300 |
| | 3,519 |
| | 49 |
|
| Construction & development, net | 2,655 |
| | — |
| | 1,091 |
| | 7 |
|
| Residential development, net | 9,670 |
| | — |
| | 9,675 |
| | 166 |
|
| Commercial | | | | | | | |
| Term, net | 31,733 |
| | 18,701 |
| | 256 |
| | 12 |
|
| LOC & other, net | 18,761 |
| | 8,575 |
| | 5,404 |
| | 308 |
|
| Residential | | | | | | | |
| Mortgage, net | — |
| | — |
| | — |
| | — |
|
| Home equity loans & lines, net | 626 |
| | — |
| | — |
| | — |
|
| Consumer & other, net | 152 |
| | — |
| | — |
| | — |
|
| Total, net of deferred fees and costs | $ | 126,769 |
| | $ | 52,782 |
| | $ | 49,790 |
| | $ | 1,408 |
|
|
| | | | | | | | | | | | | | | |
| (in thousands) | December 31, 2013 |
| | Unpaid | | Recorded Investment | | |
| | Principal | | Without | | With | | Related |
| | Balance | | Allowance | | Allowance | | Allowance |
| Commercial real estate | | | | | | | |
| Non-owner occupied term, net | $ | 50,602 |
| | $ | 18,285 |
| | $ | 31,362 |
| | $ | 928 |
|
| Owner occupied term, net | 11,876 |
| | 6,204 |
| | 5,202 |
| | 198 |
|
| Multifamily, net | 1,416 |
| | 935 |
| | — |
| | — |
|
| Construction & development, net | 10,609 |
| | 8,498 |
| | 1,091 |
| | 11 |
|
| Residential development, net | 22,513 |
| | 5,776 |
| | 11,927 |
| | 648 |
|
| Commercial | | | | | | | |
| Term, net | 22,750 |
| | 8,723 |
| | 300 |
| | 8 |
|
| LOC & other, net | 7,144 |
| | 1,222 |
| | 1,258 |
| | 4 |
|
| Residential | | | | | | | |
| Mortgage, net | — |
| | — |
| | — |
| | — |
|
| Home equity loans & lines, net | — |
| | — |
| | — |
| | — |
|
| Consumer & other, net | — |
| | — |
| | — |
| | — |
|
| Total, net of deferred fees and costs | $ | 126,910 |
| | $ | 49,643 |
| | $ | 51,140 |
| | $ | 1,797 |
|
|
| | | | | | | | | | | | | | | |
| (in thousands) | December 31, 2014 | | December 31, 2013 |
| | Average | | Interest | | Average | | Interest |
| | Recorded | | Income | | Recorded | | Income |
| | Investment | | Recognized | | Investment | | Recognized |
| Commercial real estate | | | | | | | |
| Non-owner occupied term, net | $ | 50,589 |
| | $ | 1,619 |
| | $ | 63,274 |
| | $ | 1,512 |
|
| Owner occupied term, net | 12,781 |
| | 282 |
| | 7,462 |
| | 205 |
|
| Multifamily, net | 2,954 |
| | 145 |
| | 765 |
| | — |
|
| Construction & development, net | 6,156 |
| | 44 |
| | 13,919 |
| | 484 |
|
| Residential development, net | 13,237 |
| | 463 |
| | 22,351 |
| | 644 |
|
| Commercial | | | | | | | |
| Term, net | 15,401 |
| | 15 |
| | 11,955 |
| | 17 |
|
| LOC & other, net | 5,138 |
| | — |
| | 4,008 |
| | 51 |
|
| Residential | | | | | | | |
| Mortgage, net | — |
| | — |
| | 153 |
| | — |
|
| Home equity loans & lines, net | — |
| | — |
| | 95 |
| | — |
|
| Consumer & other, net | 26 |
| | — |
| | 1 |
| | — |
|
| Total, net of deferred fees and costs | $ | 106,282 |
| | $ | 2,568 |
| | $ | 123,983 |
| | $ | 2,913 |
|
The impaired loans for which these interest income amounts were recognized primarily relate to accruing restructured loans.
Non-covered
Credit Quality Indicators
As previously noted, the
Company’sBank's risk rating methodology assigns risk ratings ranging from 1 to 10, where a higher rating represents higher risk. The Bank differentiates its lending portfolios into homogeneous loans
(generally consumer loans)and leases and non-homogeneous loans
(generally all non-consumer loans).and leases. The 10 risk rating categories can be generally described by the following groupings for non-homogeneous
loans:loans and leases:
Minimal Risk—A minimal risk loan or lease, risk rated 1, is to a borrower of the highest quality. The borrower has an unquestioned ability to produce consistent profits and service all obligations and can absorb severe market disturbances with little or no difficulty. Low Risk—A low risk loan or lease, risk rated 2, is similar in characteristics to a minimal risk loan. Margins may be smaller or protective elements may be subject to greater fluctuation. The borrower will have a strong demonstrated ability to produce profits, provide ample debt service coverage and to absorb market disturbances. Modest Risk—A modest risk loan or lease, risk rated 3, is a desirable loan or lease with excellent sources of repayment and no currently identifiable risk ofassociated with collection. The borrower exhibits a very strong capacity to repay the credit in accordance with the repayment agreement. The borrower may be susceptible to economic cycles, but will have reserves to weather these cycles. Average Risk—An average risk loan or lease, risk rated 4, is an attractive loan or lease with sound sources of repayment and no material collection or repayment weakness evident. The borrower has an acceptable capacity to pay in accordance with the agreement. The borrower is susceptible to economic cycles and more efficient competition, but should have modest reserves sufficient to survive all but the most severe downturns or major setbacks. Acceptable Risk—An acceptable risk loan or lease, risk rated 5, is a loan or lease with lower than average, but still acceptable credit risk. These borrowers may have higher leverage, less certain but viable repayment sources, have limited financial reserves and may possess weaknesses that can be adequately mitigated through collateral, structural or credit enhancement. The borrower is susceptible to economic cycles and is less resilient to negative market forces or financial events. Reserves may be insufficient to survive a modest downturn.
Watch—A watch loan or lease, risk rated 6, is still pass-rated, but represents the lowest level of acceptable risk due to an emerging risk element or declining performance trend. Watch ratings are expected to be temporary, with issues resolved or manifested to the extent that a higher or lower rating would be appropriate. The borrower should have a plausible plan, with reasonable certainty of success, to correct the problems in a short period of time. Borrowers rated Watch are characterized by elements of uncertainty, such as: Borrower may be experiencing declining operating trends, strained cash flows
Special Mention—A special mention loan or less-than anticipated performance. Cash flow should still be adequate to cover debt service, and the negative trends should be identified as being of a short-term or temporary nature.
The borrower may have experienced a minor, unexpected covenant violation.
Companies who may be experiencing tight working capital or have a cash cushion deficiency.
Loans may also be a Watch if financial information is late, there is a documentation deficiency, the borrower has experienced unexpected management turnover, or if they face industry issues that, when combined with performance factors create uncertainty in their future ability to perform.
Delinquent payments, increasing and material overdraft activity, request for bulge and/or out-of-formula advances may be an indicator of inadequate working capital and may suggest a lower rating.
Umpqua Holdings Corporation and Subsidiaries
Failure of the intended repayment source to materialize as expected, or renewal of a loan (other than cash/marketable security secured or lines of credit) without reduction are possible indicators of a Watch or worse risk rating.
Special Mention—A Special Mention loan,lease, risk rated 7, has potential weaknesses that deserve management’smanagement's close attention. If left uncorrected, these potential weaknesses may result in deterioration of the repayment prospects for the asset or the institutionsinstitution's credit position at some future date. They contain unfavorable characteristics and are generally undesirable. Loans and leases in this category are currently protected but are potentially weak and constitute an undue and unwarranted credit risk, but not to the point of a Substandardsubstandard classification. A Special Mentionspecial mention loan or lease has potential weaknesses, which if not checked or corrected, weaken the asset or inadequately protect the Bank’sBank's position at some future date. Such weaknesses include:
Performance is poor or significantly less than expected. There may be a temporary debt-servicing deficiency or inadequate working capital as evidenced by a cash cushion deficiency, but not to the extent that repayment is compromised. Material violation of financial covenants is common.
Loans with unresolved material issues that significantly cloud the debt service outlook, even though a debt servicing deficiency does not currently exist.
Modest underperformance or deviation from plan for real estate loans where absorption of rental/sales units is necessary to properly service the debt as structured. Depth of support for interest carry provided by owner/guarantors may mitigate and provide for improved rating.
This rating may be assigned when a loan officer is unable to supervise the credit properly, an inadequate loan agreement, an inability to control collateral, failure to obtain proper documentation, or any other deviation from prudent lending practices.
Unlike a Substandard credit, there should be a reasonable expectation that these temporary issues will be corrected within the normal course of business, rather than liquidation of assets, and in a reasonable period of time.
Substandard—A substandard asset, risk rated 8, is inadequately protected by the current sound worth and paying capacity of the obligor or of the collateral pledged, if any. Assets so classified must have a well-defined weakness or weaknesses that jeopardize the liquidation of the debt. They are characterized by the distinct possibility that the Bank will sustain some loss if the deficiencies are not corrected. Loss potential, while existing in the aggregate amount of substandard assets, does not have to exist in individual assets classified substandard. Loans and leases are classified as Substandardsubstandard when they have unsatisfactory characteristics causing unacceptable levels of risk. A substandard loan or lease normally has one or more well-defined weaknesses that could jeopardize repayment of the debt. The likely need to liquidate assets to correct the problem, rather than repayment from successful operations is the key distinction between Special Mentionspecial mention and Substandard. The following are examples of well-defined weaknesses:substandard.
Doubtful—Loans or trends are of a magnitude to jeopardize current and future payments with no immediate relief. A loss is not presently expected, however the outlook is sufficiently uncertain to preclude ruling out the possibility.
Borrower has been unable to adjust to prolonged and unfavorable industry or economic trends.
Material underperformance or deviation from plan for real estate loans where absorption of rental/sales units is necessary to properly service the debt and risk is not mitigated by willingness and capacity of owner/guarantor to support interest payments.
Management character or honesty has become suspect. This includes instances where the borrower has become uncooperative.
Due to unprofitable or unsuccessful business operations, some form of restructuring of the business, including liquidation of assets, has become the primary source of loan repayment. Cash flow has deteriorated, or been
| diverted, to the point that sale of collateral is now the Bank’s primary source of repayment (unless this was the original source of repayment). If the collateral is under the Bank’s control and is cash or other liquid, highly marketable securities and properly margined, then a more appropriate rating might be Special Mention or Watch.
|
The borrower is bankrupt, or for any other reason, future repayment is dependent on court action.
There is material, uncorrectable faulty documentation or materially suspect financial information.
Doubtful—Loansleases classified as doubtful, risk rated 9, have all the weaknesses inherent in one classified substandard with the added characteristic that the weaknesses make collection or liquidation in full, on the basis of currently existing facts, conditions and values, highly questionable and improbable. The possibility of loss is extremely high, but because of certain important and reasonably specific pending factors, which may work towards strengthening of the asset, classification as a loss (and immediate charge-off) is deferred until more exact status may be determined. Pending factors include proposed merger, acquisition, liquidation procedures, capital injection, and perfection of liens on additional collateral and refinancing plans. In certain circumstances, a Doubtfuldoubtful rating will be temporary, while the Bank is awaiting an updated collateral valuation. In these cases, once the collateral is valued and appropriate margin applied, the remaining un-collateralized portion will be charged off.charged-off. The remaining balance, properly margined, may then be upgraded to Substandard,substandard, however must remain on non-accrual.
Loss—Loans or leases classified as loss, risk rated 10, are considered un-collectible and of such little value that the continuance as an active Bank asset is not warranted. This rating does not mean that the loan or lease has no recovery or salvage value, but rather that the loan or lease should be charged offcharged-off now, even though partial or full recovery may be possible in the future. Impaired—Impaired—Loans are classified as impairedwhen, based on current information and events, it is probable that the Bank will be unable to collect the scheduled payments of principal and interest when due, in accordance with the terms of the original loan agreement, without unreasonable delay. This generally includes all loans classified as non-accrual and troubled debt restructurings. Impaired loans are risk rated for internal and regulatory rating purposes, but presented separately for clarification.Homogeneous loans and leases are not risk rated until they are greater than 30 days past due, and risk rating is based primarily on the past due status of the loan.loan or lease. The risk rating categories can be generally described by the following groupings for commercial and commercial real estate homogeneous loans:loans and leases:
Special Mention—A homogeneous special mention loan or lease, risk rated 7, is 30-59greater than 30 to 59 days past due from the required payment date at month-end. Substandard—A homogeneous substandard loan or lease, risk rated 8, is 60-11960 to 89 days past due from the required payment date at month-end. Doubtful—A homogeneous doubtful loan or lease, risk rated 9, is 120-14990 to 179 days past due from the required payment date at month-end. Loss—A homogeneous loss loan or lease, risk rated 10, is 150180 days and more past due from the required payment date. These loans are generally charged-off in the month in which the 150-180 day time period elapses. The risk rating categories can be generally described by the following groupings for residential and consumer and other homogeneous loans:
Special Mention—A homogeneous retail special mention loan, risk rated 7, is 30-89greater than 30 to 89 days past due from the required payment date at month-end. Substandard—A homogeneous retail substandard loan, risk rated 8, is an open-end loan 90-18090 to 180 days past due from the required payment date at month-end or a closed-end loan 90-12090 to 120 days past due from the required payment date at month-end.Umpqua Holdings Corporation and Subsidiaries
Loss—A homogeneous retail loss loan, risk rated 10, is a closed-end loan that becomes past due 120 cumulative days or an open-end retail loan that becomes past due 180 cumulative days from the contractual due date. These loans are generally charged-off in the month in which the 120-120 or 180-day180 day period elapses.
The following table summarizes our internal risk rating by loan and lease class for the non-covered loan and lease portfolio as of December 30, 2011 and December 31, 2010:(in thousands)
| | | | | | | | | | | | | | | | | | | | | | | | | | | | |
| | | December 31, 2011 | |
| | | Pass/Watch | | | Special Mention | | | Substandard | | | Doubtful | | | Loss | | | Impaired | | | Total | |
Commercial real estate | | | | | | | | | | | | | | | | | | | | | | | | | | | | |
Term & multifamily | | $ | 3,075,452 | | | $ | 275,475 | | | $ | 146,919 | | | $ | — | | | $ | — | | | $ | 60,449 | | | $ | 3,558,295 | |
Construction & development | | | 102,786 | | | | 19,946 | | | | 12,342 | | | | — | | | | — | | | | 29,992 | | | | 165,066 | |
Residential development | | | 25,062 | | | | 6,740 | | | | 8,733 | | | | — | | | | — | | | | 49,538 | | | | 90,073 | |
Commercial | | | | | | | | | | | | | | | | | | | | | | | | | | | | |
Term | | | 586,365 | | | | 16,631 | | | | 9,608 | | | | — | | | | — | | | | 13,162 | | | | 625,766 | |
LOC & other | | | 775,233 | | | | 22,051 | | | | 22,706 | | | | — | | | | — | | | | 13,009 | | | | 832,999 | |
Residential | | | | | | | | | | | | | | | | | | | | | | | | | | | | |
Mortgage | | | 309,478 | | | | 2,106 | | | | 296 | | | | — | | | | 4,047 | | | | — | | | | 315,927 | |
Home equity loans & lines | | | 268,731 | | | | 683 | | | | 773 | | | | — | | | | 1,876 | | | | 129 | | | | 272,192 | |
Consumer & other | | | 38,098 | | | | 82 | | | | 254 | | | | — | | | | 426 | | | | — | | | | 38,860 | |
| | | | |
Total | | $ | 5,181,205 | | | $ | 343,714 | | | $ | 201,631 | | | $ | — | | | $ | 6,349 | | | $ | 166,279 | | | $ | 5,899,178 | |
| | | | | | | | |
Deferred loan fees, net | | | | | | | | | | | | | | | | | | | | | | | | | | | (11,080 | ) |
| | | | | | | | | | | | | | | | | | | | | | | | | | | | |
Total | | | | | | | | | | | | | | | | | | | | | | | | | | $ | 5,888,098 | |
| | | | | | | | | | | | | | | | | | | | | | | | | | | | |
| |
| | | December 31, 2010 | |
| | | Pass/Watch | | | Special Mention | | | Substandard | | | Doubtful | | | Loss | | | Impaired | | | Total | |
Commercial real estate | | | | | | | | | | | | | | | | | | | | | | | | | | | | |
Term & multifamily | | $ | 2,978,116 | | | $ | 314,094 | | | $ | 113,405 | | | $ | — | | | $ | — | | | $ | 77,860 | | | $ | 3,483,475 | |
Construction & development | | | 145,108 | | | | 25,295 | | | | 51,853 | | | | — | | | | — | | | | 25,558 | | | | 247,814 | |
Residential development | | | 27,428 | | | | 13,764 | | | | 23,106 | | | | — | | | | — | | | | 83,515 | | | | 147,813 | |
Commercial | | | | | | | | | | | | | | | | | | | | | | | | | | | | |
Term | | | 472,512 | | | | 17,658 | | | | 12,109 | | | | — | | | | — | | | | 7,174 | | | | 509,453 | |
LOC & other | | | 646,163 | | | | 30,761 | | | | 42,162 | | | | — | | | | — | | | | 28,333 | | | | 747,419 | |
Residential | | | | | | | | | | | | | | | | | | | | | | | | | | | | |
Mortgage | | | 216,899 | | | | 2,414 | | | | 786 | | | | — | | | | 2,138 | | | | 179 | | | | 222,416 | |
Home equity loans & lines | | | 275,906 | | | | 2,447 | | | | 125 | | | | — | | | | 107 | | | | — | | | | 278,585 | |
Consumer & other | | | 32,008 | | | | 595 | | | | 29 | | | | — | | | | 411 | | | | — | | | | 33,043 | |
| | | | |
Total | | $ | 4,794,140 | | | $ | 407,028 | | | $ | 243,575 | | | $ | — | | | $ | 2,656 | | | $ | 222,619 | | | $ | 5,670,018 | |
| | | | | | | | |
Deferred loan fees, net | | | | | | | | | | | | | | | | | | | | | | | | | | | (11,031 | ) |
| | | | | | | | | | | | | | | | | | | | | | | | | | | | |
Total | | | | | | | | | | | | | | | | | | | | | | | | | | $ | 5,658,987 | |
| | | | | | | | | | | | | | | | | | | | | | | | | | | | |
2014
and December 31, 2013: |
| | | | | | | | | | | | | | | | | | | | | | | | | | | |
(in thousands) | December 31, 2014 |
| | Pass/Watch | | Special Mention | | Substandard | | Doubtful | | Loss | | Impaired (1) | | Total |
| | | | | | | | | | | | | | |
| Commercial real estate | | | | | | | | | | | | | |
| Non-owner occupied term, net | $ | 3,027,777 |
| | $ | 99,556 |
| | $ | 123,350 |
| | $ | 821 |
| | $ | — |
| | $ | 39,106 |
| | $ | 3,290,610 |
|
| Owner occupied term, net | 2,475,944 |
| | 58,425 |
| | 81,567 |
| | 309 |
| | 1,674 |
| | 15,945 |
| | 2,633,864 |
|
| Multifamily, net | 2,610,039 |
| | 9,583 |
| | 15,177 |
| | — |
| | — |
| | 3,819 |
| | 2,638,618 |
|
| Construction & development, net | 248,547 |
| | 4,081 |
| | 5,003 |
| | — |
| | — |
| | 1,091 |
| | 258,722 |
|
| Residential development, net | 68,789 |
| | 963 |
| | 2,419 |
| | — |
| | — |
| | 9,675 |
| | 81,846 |
|
| Commercial | | | | | | | | | | | | | |
| Term, net | 1,055,728 |
| | 12,661 |
| | 15,219 |
| | 198 |
| | 224 |
| | 18,957 |
| | 1,102,987 |
|
| LOC & other, net | 1,281,628 |
| | 17,665 |
| | 9,082 |
| | 280 |
| | 88 |
| | 13,979 |
| | 1,322,722 |
|
| Leases and equipment finance, net | 513,104 |
| | 2,554 |
| | 3,809 |
| | 3,255 |
| | 392 |
| | — |
| | 523,114 |
|
| Residential | | | | | | | | | | | | | |
| Mortgage, net | 2,215,956 |
| | 2,330 |
| | 4,497 |
| | — |
| | 10,952 |
| | — |
| | 2,233,735 |
|
| Home equity loans & lines, net | 846,277 |
| | 3,271 |
| | 1,079 |
| | — |
| | 1,851 |
| | — |
| | 852,478 |
|
| Consumer & other, net | 385,754 |
| | 2,717 |
| | 198 |
| | — |
| | 367 |
| | — |
| | 389,036 |
|
| Total, net of deferred fees and costs | $ | 14,729,543 |
| | $ | 213,806 |
| | $ | 261,400 |
| | $ | 4,863 |
| | $ | 15,548 |
| | $ | 102,572 |
| | $ | 15,327,732 |
|
(1) The percentage of non-covered impaired loans classified as pass/watch, special mention, substandard, doubtful, and loss was 3.8%5.6%, 96.0%15.1%, 77.9%, 0.1%, and 0.2%1.3% respectively, as of December 31, 2014.
|
| | | | | | | | | | | | | | | | | | | | | | | | | | | |
| (in thousands) | December 31, 2013 |
| | Pass/Watch | | Special Mention | | Substandard | | Doubtful | | Loss | | Impaired (1) | | Total |
| Commercial real estate | | | | | | | | | | | | | |
| Non-owner occupied term, net | $ | 2,207,603 |
| | $ | 135,005 |
| | $ | 142,907 |
| | $ | — |
| | $ | — |
| | $ | 49,647 |
| | $ | 2,535,162 |
|
| Owner occupied term, net | 1,213,321 |
| | 31,071 |
| | 53,181 |
| | 421 |
| | — |
| | 11,406 |
| | 1,309,400 |
|
| Multifamily, net | 409,626 |
| | 8,213 |
| | 22,434 |
| | — |
| | — |
| | 935 |
| | 441,208 |
|
| Construction & development, net | 231,380 |
| | 2,054 |
| | 5,663 |
| | — |
| | — |
| | 9,589 |
| | 248,686 |
|
| Residential development, net | 67,513 |
| | 2,060 |
| | 8,329 |
| | 94 |
| | — |
| | 17,703 |
| | 95,699 |
|
| Commercial | | | | | | | | | | | | |
|
|
| Term, net | 722,723 |
| | 26,548 |
| | 27,983 |
| | 287 |
| | — |
| | 9,023 |
| | 786,564 |
|
| LOC & other, net | 955,826 |
| | 25,222 |
| | 10,530 |
| | — |
| | — |
| | 2,480 |
| | 994,058 |
|
| Leases and equipment finance, net | 351,971 |
| | 4,585 |
| | 1,706 |
| | 2,996 |
| | 333 |
| | — |
| | 361,591 |
|
| Residential | | | | | | | | | | | | |
|
|
| Mortgage, net | 616,039 |
| | 1,405 |
| | 743 |
| | — |
| | 1,330 |
| | — |
| | 619,517 |
|
| Home equity loans & lines, net | 282,490 |
| | 1,038 |
| | 242 |
| | — |
| | 136 |
| | — |
| | 283,906 |
|
| Consumer & other, net | 52,157 |
| | 144 |
| | 33 |
| | — |
| | 41 |
| | — |
| | 52,375 |
|
| Total, net of deferred fees and costs | $ | 7,110,649 |
| | $ | 237,345 |
| | $ | 273,751 |
| | $ | 3,798 |
| | $ | 1,840 |
| | $ | 100,783 |
| | $ | 7,728,166 |
|
(1) The percentage of classified as pass/watch, special mention, and substandard was 6.4%, 3.7%, and 89.9%, respectively, as of December 31, 2011.2013.
Troubled Debt Restructurings
At December 31, 20112014 and December 31, 2010, non-covered2013, impaired loans of $80.6$54.8 million and $84.4$68.8 million were classified as accruing restructured loans, respectively. The restructurings were granted in response to borrower financial difficulty, and generally provide for a temporary modification of loan repayment terms. The restructured loans on accrual status and two loans included in loans past due 30+ days and accruing represent the only impaired loans accruing interest. In order for a restructured loan to be considered for accrual status, the loan’sloan's collateral coverage generally will be greater than or equal to 100% of the loan balance, the loan is current on payments, and the borrower must either prefund an interest reserve or demonstrate the ability to make payments from a verified source of cash flow.Impaired restructured loans carry a specific allowance calculated and the allowance on impaired restructured loans is calculated consistently across the portfolios.
As a result of adopting the amendments in Accounting Standards Update No. 2011-02, the Company reassessed all restructurings that occurred on or after the beginning of the current fiscal year (January 1, 2011) for identification as troubled debt restructurings. The Company identified as troubled debt restructurings certain receivables for which the allowance for credit losses had previously been measured under a general allowance for credit losses methodology. Upon identifying those receivables as troubled debt restructurings, the Company identified them as impaired under the guidance in Section 310-10-35. The amendments in Accounting Standards Update No. 2011-02 require prospective application of the impairment measurement guidance in Section 310-10-35 for those receivables newly identified as impaired. At the end of the first year of adoption (December 31, 2011), the recorded investment in receivables for which the allowance for credit losses was previously measured under a general allowance for credit losses methodology and are now impaired under Section 310-10-35 was $5.4
There were $1.0 million and there was no allowance for credit losses associated with those receivables, on the basis of a current evaluation of loss. In evaluating concessions made during the year, the Company frequently obtained adequate compensation for concessions made. As a result, few loans qualified as troubled debt restructuring under the new definitions outlined in Section 310-10-35.Available
available commitments for non-covered troubled debt restructurings outstanding as of December 31, 2011 totaled $205,000. As2014 and none as of December 2010, no available commitments were outstanding on non-covered troubled debt restructurings.31, 2013
. The following tables present non-covered troubled debt restructurings by accrual versus non-accrual status and by loan class as of December 31, 20112014 and 2010:(in thousands)
| | | | | | | | | | | | |
| | | December 31, 2011 | |
| | | Accrual
Status | | | Non-Accrual
Status | | | Total
Modifications | |
Commercial real estate | | | | | | | | | | | | |
Term & multifamily | | $ | 22,611 | | | $ | 21,951 | | | $ | 44,562 | |
Construction & development | | | 19,996 | | | | 921 | | | | 20,917 | |
Residential development | | | 33,964 | | | | 11,969 | | | | 45,933 | |
Commercial | | | | | | | | | | | | |
Term | | | 3,863 | | | | 1,762 | | | | 5,625 | |
LOC & other | | | — | | | | 6,973 | | | | 6,973 | |
Residential | | | | | | | | | | | | |
Mortgage | | | — | | | | — | | | | — | |
Home equity loans & lines | | | 129 | | | | — | | | | 129 | |
Consumer & other | | | — | | | | — | | | | — | |
| | | | |
Total | | $ | 80,563 | | | $ | 43,576 | | | $ | 124,139 | |
| | | | |
Umpqua Holdings Corporation and Subsidiaries
| | | | | | | | | | | | |
| | | December 31, 2010 | |
| | | Accrual
Status | | | Non-Accrual
Status | | | Total
Modifications | |
Commercial real estate | | | | | | | | | | | | |
Term & multifamily | | $ | 28,697 | | | $ | 3,185 | | | $ | 31,882 | |
Construction & development | | | 5,434 | | | | — | | | | 5,434 | |
Residential development | | | 48,929 | | | | 8,036 | | | | 56,965 | |
Commercial | | | | | | | | | | | | |
Term | | | 904 | | | | 725 | | | | 1,629 | |
LOC & other | | | 298 | | | | 11,040 | | | | 11,338 | |
Residential | | | | | | | | | | | | |
Mortgage | | | 179 | | | | — | | | | 179 | |
Home equity loans & lines | | | — | | | | — | | | | — | |
Consumer & other | | | — | | | | — | | | | — | |
| | | | |
Total | | $ | 84,441 | | | $ | 22,986 | | | $ | 107,427 | |
| | | | |
|
| | | | | | | | | | | |
| (in thousands) | December 31, 2014 |
| | Accrual | | Non-Accrual | | Total |
| | Status | | Status | | Modifications |
| Commercial real estate, net | $ | 48,817 |
| | $ | 2,319 |
| | $ | 51,136 |
|
| Commercial, net | 5,404 |
| | 9,541 |
| | 14,945 |
|
| Residential, net | 615 |
| | — |
| | 615 |
|
| Total, net of deferred fees and costs | $ | 54,836 |
| | $ | 11,860 |
| | $ | 66,696 |
|
|
| | | | | | | | | | | |
| (in thousands) | December 31, 2013 |
| | Accrual | | Non-Accrual | | Total |
| | Status | | Status | | Modifications |
| Commercial real estate, net | $ | 67,060 |
| | $ | 2,196 |
| | $ | 69,256 |
|
| Commercial, net | 1,258 |
| | 2,603 |
| | 3,861 |
|
| Residential, net | 473 |
| | — |
| | 473 |
|
| Total, net of deferred fees and costs | $ | 68,791 |
| | $ | 4,799 |
| | $ | 73,590 |
|
The
Bank’sBank's policy is that loans placed on non-accrual will typically remain on non-accrual status until all principal and interest payments are brought current and the prospect for future payment in accordance with the loan agreement
appearappears relatively certain. The
Bank’sBank's policy generally refers to six months of payment performance as sufficient to warrant a return to accrual status.
The types
Rate Modification—A modification in which the interest rate is modified.Term Modification—A modification in which the maturity date, timing of payments, or frequency of payments is changed.
Interest Only Modification—A modification in which the loan is converted to interest only payments for a period of time.
Payment Modification—A modification in which the payment amount is changed, other than an interest only modification described above.
Combination Modification—Any other type of modification, including the use of multiple types of modifications.
The following tables present newly non-covered restructured loans that occurred during the years endedDecember 31, 20112014 and 2010, respectively:
| | | | | | | | | | | | | | | | | | | | | | | | |
| | | 2011 | |
| | | Rate Modifications | | | Term
Modifications | | | Interest Only
Modifications | | | Payment
Modifications | | | Combination
Modifications | | | Total
Modifications | |
Commercial real estate | | | | | | | | | | | | | | | | | | | | | | | | |
Term & multifamily | | $ | — | | | $ | — | | | $ | — | | | $ | — | | | $ | 34,943 | | | $ | 34,943 | |
Construction & development | | | — | | | | — | | | | — | | | | — | | | | 13,760 | | | | 13,760 | |
Residential development | | | 279 | | | | 354 | | | | — | | | | — | | | | 9,090 | | | | 9,723 | |
Commercial | | | | | | | | | | | | | | | | | | | | | | | | |
Term | | | — | | | | — | | | | — | | | | 70 | | | | 5,311 | | | | 5,381 | |
LOC & other | | | — | | | | — | | | | — | | | | — | | | | 4,050 | | | | 4,050 | |
Residential | | | | | | | | | | | | | | | | | | | | | | | | |
Mortgage | | | — | | | | — | | | | — | | | | — | | | | — | | | | — | |
Home equity loans & lines | | | — | | | | 130 | | | | — | | | | — | | | | — | | | | 130 | |
Consumer & other | | | — | | | | — | | | | — | | | | — | | | | — | | | | — | |
| | | | |
Total | | $ | 279 | | | $ | 484 | | | $ | — | | | $ | 70 | | | $ | 67,154 | | | $ | 67,987 | |
| | | | |
| | | | | | | | | | | | | | | | | | | | | | | | |
| (in thousands) | | | | | | | | | | | | | | | | | | | | | | | | |
| | | 2010 | |
| | | Rate
Modifications | | | Term
Modifications | | | Interest Only
Modifications | | | Payment
Modifications | | | Combination
Modifications | | | Total
Modifications | |
Commercial real estate | | | | | | | | | | | | | | | | | | | | | | | | |
Term & multifamily | | $ | — | | | $ | — | | | $ | — | | | $ | — | | | $ | 13,018 | | | $ | 13,018 | |
Construction & development | | | — | | | | — | | | | — | | | | — | | | | 5,534 | | | | 5,534 | |
Residential development | | | — | | | | 1,459 | | | | — | | | | — | | | | 3,691 | | | | 5,150 | |
Commercial | | | | | | | | | | | | | | | | | | | | | | | | |
Term | | | — | | | | — | | | | — | | | | — | | | | — | | | | — | |
LOC & other | | | — | | | | 1,371 | | | | — | | | | — | | | | — | | | | 1,371 | |
Residential | | | | | | | | | | | | | | | | | | | | | | | | |
Mortgage | | | — | | | | — | | | | — | | | | — | | | | — | | | | — | |
Home equity loans & lines | | | — | | | | — | | | | — | | | | — | | | | — | | | | — | |
Consumer & other | | | — | | | | — | | | | — | | | | — | | | | — | | | | — | |
| | | | |
Total | | $ | — | | | $ | 2,830 | | | $ | — | | | $ | — | | | $ | 22,243 | | | $ | 25,073 | |
| | | | |
2013:
|
| | | | | | | | | | | | | | | | | | | | | | | |
| (in thousands) | December 31, 2014 |
| | Rate | | Term | | Interest Only | | Payment | | Combination | | Total |
| | Modifications | | Modifications | | Modifications | | Modifications | | Modifications | | Modifications |
| Commercial real estate, net | $ | — |
| | $ | 2,332 |
| | $ | — |
| | $ | — |
| | $ | 3,519 |
| | $ | 5,851 |
|
| Commercial, net | — |
| | 8,359 |
| | — |
| | — |
| | 5,410 |
| | 13,769 |
|
| Residential, net | — |
| | — |
| | — |
| | — |
| | 138 |
| | 138 |
|
| Consumer & other, net | — |
| | — |
| | — |
| | — |
| | — |
| | — |
|
| Total, net of deferred fees and costs | $ | — |
| | $ | 10,691 |
| | $ | — |
| | $ | — |
| | $ | 9,067 |
| | $ | 19,758 |
|
| | | | | | | | | | | | |
| | December 31, 2013 |
| | Rate | | Term | | Interest Only | | Payment | | Combination | | |
| | Modifications | | Modifications | | Modifications | | Modifications | | Modifications | | Total |
| Commercial real estate, net | $ | — |
| | $ | — |
| | $ | 4,291 |
| | $ | — |
| | $ | — |
| | $ | 4,291 |
|
| Commercial, net | — |
| | — |
| | — |
| | — |
| | 4,040 |
| | 4,040 |
|
| Residential, net | — |
| | — |
| | — |
| | — |
| | 478 |
| | 478 |
|
| Consumer & other, net | — |
| | — |
| | — |
| | — |
| | — |
| | — |
|
| Total, net of deferred fees and costs | $ | — |
| | $ | — |
| | $ | 4,291 |
| | $ | — |
| | $ | 4,518 |
| | $ | 8,809 |
|
For the periods presented in the tables above, the outstanding recorded investment was the same pre and post modification.
The following tables represent
There were no financing receivables modified as troubled debt restructurings within the previous 12 months for which there was a payment default during the yearsyear end December 31, 2014. There were $1.8 million of commercial financing receivables modified as troubled debt restructurings within the previous 12 months for which there was a payment default during the year ended December 31, 20112013.
Note 7–Premises and
2010, respectively:(in thousands)
| | | | | | | | |
| | | 2011 | | | 2010 | |
Commercial real estate | | | | | | | | |
Term & multifamily | | $ | 9,642 | | | $ | 5,553 | |
Construction & development | | | — | | | | — | |
Residential development | | | 1,767 | | | | — | |
Commercial | | | | | | | | |
Term | | | 140 | | | | 661 | |
LOC & other | | | — | | | | — | |
Residential | | | | | | | | |
Mortgage | | | — | | | | 944 | |
Home equity loans & lines | | | — | | | | — | |
Consumer & other | | | — | | | | — | |
| | | | |
Total | | $ | 11,549 | | | $ | 7,158 | |
| | | | |
Equipment
NOTE 7. COVERED ASSETS AND INDEMNIFICATION ASSETCovered Loans
Loans acquired in a FDIC-assisted acquisition that are subject to a loss-share agreement are referred to as “covered loans” and reported separately in our statements of financial condition. Covered loans are reported exclusive of the expected cash flow reimbursements expected from the FDIC.
Acquired loans are valued as of acquisition date in accordance with ASC 805. Loans purchased with evidence of credit deterioration since origination for which it is probable that all contractually required payments will not be collected are accounted for under FASB ASC 310-30,Loans and Debt Securities Acquired with Deteriorated Credit Quality. Because of the significant fair value discounts associated with the acquired portfolios, the concentration of real estate related loans (to finance
Umpqua Holdings Corporation and Subsidiaries
or secured by real estate collateral) and the decline in real estate values in the regions serviced, and after considering the underwriting standards of the acquired originating bank, the Company elected to account for all acquired loans under ASC 310-30. Under ASC 805 and ASC 310-30, loans are to be recorded at fair value at acquisition date, factoring in credit losses expected to be incurred over the life of the loan. Accordingly, an allowance for loan losses is not carried over or recorded as of the acquisition date. We have aggregated the acquired loans into various loan pools based on multiple layers of common risk characteristics for the purpose of determining their respective fair values as of their acquisition dates, and for applying the subsequent recognition and measurement provisions for income accretion and impairment testing.
Acquired loans were first segregated between those designated as performing versus those designated as non-performing. In this application, ‘performing’ and ‘non-performing’ loans were defined in accordance with the scoping requirements of ASC 310-30, that is the ‘non-performing’ loans individually exhibited evidence of deteriorated credit quality since origination for which it is probable that we will not be able to collect all contractually required payments receivable. Our Credit Quality and Credit Review teams identified these non-performing credits on a loan-by-loan basis during the due diligence process. Generally, identified non-performing loans tended to be risk rated substandard or worse on the acquired institution’s books. Collectively, the non-performing loans would be considered the ‘classic’ application of ASC 310-30. The remaining performing notes were accounted for under ASC 310-30 by analogy due to the significant fair value discounts associated with the pools resulting from the underwriting standards of the acquired bank (that often contributed to the bank’s failure), the concentration of loans for the purpose of, and collateralized by, real estate, and the general economic condition of the regions each acquired bank serviced. We deem analogizing all loans to ASC 310-30 acceptable as a significant component of the fair value discount applied to each loan pool is attributed to estimated credit losses that are anticipated to occur over the life of each respective loan pool.
Once notes were separated based on their expected future performance, they were further segregated based on specific loan types (purpose/collateral) and then their principal cash flow and interest rate characteristics. The most significant loan type categories utilized (in no particular order) were commercial residential development, commercial construction, farmland, 1st lien single family mortgages, 2nd lien single family loans, single family revolving lines of credit, multifamily mortgages, owner occupied commercial real estate, non-owner occupied commercial real estate, commercial loans, commercial lines of credit, consumer installment loans, and consumer lines of credit. Next, groups of loans were segregated based on repayment characteristics, specifically whether the notes’ principal balances were amortizing or interest-only. Lastly, loans were separated by various interest rate characteristics, such as whether the interest rate was fixed or variable. For those loans whose interest rates were variable, they were also segregated by their underlying indices (e.g. PRIME, Federal Home Loan Bank, or constant maturity treasury) and whether or not there were interest rate floors.
The following table presents the number of pools, number of loans and acquired unpaid principal balance, by performing (“analogized 310-30”), non-performing (“classic 310-30”) and in total, separately for each institution acquired in 2010.
(dollars in millions)
| | | | | | | | | | | | |
| | | Evergreen | | | Rainier | | | Nevada Security | |
| | | January 22, 2010 | | | February 26, 2010 | | | June 18, 2010 | |
Performing loans (“Analogized ASC 310-30”): | | | | | | | | | | | | |
Number of Pools | | | 15 | | | | 19 | | | | 19 | |
Number of Loans | | | 1,263 | | | | 3,647 | | | | 402 | |
Acquired Unpaid Principal Balance | | $ | 247.9 | | | $ | 516.9 | | | $ | 224.2 | |
Non-performing loans (“Classic ASC 310-30”): | | | | | | | | | | | | |
Number of Pools | | | 8 | | | | 10 | | | | 9 | |
Number of Loans | | | 127 | | | | 39 | | | | 106 | |
Acquired Unpaid Principal Balance | | $ | 120.6 | | | $ | 44.5 | | | $ | 103.4 | |
Total Portfolio | | | | | | | | | | | | |
Number of Pools | | | 23 | | | | 29 | | | | 28 | |
Number of Loans | | | 1,390 | | | | 3,686 | | | | 508 | |
Acquired Unpaid Principal Balance | | $ | 368.5 | | | $ | 561.4 | | | $ | 327.6 | |
The fair value of each loan pool was computed by discounting the expected cash flows at their estimated market discount rate. Cash flows expected to be collected at acquisition date were estimated by applying certain key assumptions to each loan pool, such as credit loss rates, prepayment speeds, and resolution terms related to nonperforming loans, against the contractual cash flows of the underlying loans. Credit loss estimates for each pool were determined by considering factors such as, underlying collateral types, collateral locations, estimated collateral values, and credit quality indicators such as risk ratings. Market discount rates were determined using a buildup approach which included assumptions with respect to funding cost and funding mix, a market participant’s required rate of return on equity capital, servicing costs and a liquidity premium.
The following table reflects the estimated fair value of the acquired loans at the acquisition dates:
(in thousands)
| | | | | | | | | | | | | | | | |
| | | Evergreen | | | Rainier | | | Nevada Security | | | | |
| | | January 22, 2010 | | | February 26, 2010 | | | June 18, 2010 | | | Total | |
Commercial real estate | | | | | | | | | | | | | | | | |
Term & multifamily | | $ | 141,076 | | | $ | 331,869 | | | $ | 154,119 | | | $ | 627,064 | |
Construction & development | | | 18,832 | | | | 562 | | | | 9,481 | | | | 28,875 | |
Residential development | | | 16,219 | | | | 10,340 | | | | 15,641 | | | | 42,200 | |
Commercial | | | | | | | | | | | | | | | | |
Term | | | 27,272 | | | | 14,850 | | | | 18,257 | | | | 60,379 | |
LOC & other | | | 23,965 | | | | 18,169 | | | | 11,408 | | | | 53,542 | |
Residential | | | | | | | | | | | | | | | | |
Mortgage | | | 11,886 | | | | 39,897 | | | | 1,539 | | | | 53,322 | |
Home equity loans & lines | | | 8,308 | | | | 31,029 | | | | 4,421 | | | | 43,758 | |
Consumer & other | | | 4,935 | | | | 11,624 | | | | 641 | | | | 17,200 | |
| | | | |
Total | | $ | 252,493 | | | $ | 458,340 | | | $ | 215,507 | | | $ | 926,340 | |
| | | | |
In estimating the fair value of the covered loans at the acquisition date, we (a) calculated the contractual amount and timing of undiscounted principal and interest payments and (b) estimated the amount and timing of undiscounted expected principal and interest payments. The difference between these two amounts represents the nonaccretable difference. On the acquisition date, the amount by which the undiscounted expected cash flows exceed the estimated fair value of the acquired loans is the “accretable yield”. The accretable yield is then measured at each financial reporting date and represents the difference between the remaining undiscounted expected cash flows and the current carrying value of the loans.
The following table presents a reconciliation of the undiscounted contractual cash flows, nonaccretable difference, accretable yield, and fair value of covered loans for each respective acquired loan portfolio at the acquisition dates:
(in thousands)
| | | | | | | | | | | | | | | | |
| | | Evergreen | | | Rainier | | | Nevada Security | | | | |
| | | January 22, 2010 | | | February 26, 2010 | | | June 18, 2010 | | | Total | |
Undiscounted contractual cash flows | | $ | 498,216 | | | $ | 821,972 | | | $ | 396,134 | | | $ | 1,716,322 | |
Undiscounted cash flows not expected to be collected (nonaccretable difference) | | | (124,131 | ) | | | (125,774 | ) | | | (115,021 | ) | | | (364,926 | ) |
| | | | |
Undiscounted cash flows expected to be collected | | | 374,085 | | | | 696,198 | | | | 281,113 | | | | 1,351,396 | |
Accretable yield at acquisition | | | (121,592 | ) | | | (237,858 | ) | | | (65,606 | ) | | | (425,056 | ) |
| | | | |
Estimated fair value of loans acquired at acquisition | | $ | 252,493 | | | $ | 458,340 | | | $ | 215,507 | | | $ | 926,340 | |
| | | | |
The covered loan portfolio also includes revolving lines of credit with funded and unfunded commitments. Balances outstanding at the time of acquisition are included in the loan pools and are accounted for under ASC 310-30. Any additional
Umpqua Holdings Corporation and Subsidiaries
advances on these loans subsequent to the acquisition date may or may not be covered depending on the nature of the disbursement and the terms of each respective loss-sharing agreement, and are not accounted for under ASC 310-30.
The covered loans acquired are and will continue to be subject to the Company’s internal and external credit review and monitoring. To the extent there is experienced or projected credit deterioration on the acquired loan pools subsequent to amounts estimated at the previous remeasurement date, this deterioration will be measured, and a provision for credit losses will be charged to earnings. Additionally, provision for credit losses will be recorded on advances on covered loans subsequent to acquisition date in a manner consistent with the allowance for non-covered loan and lease losses. These provisions will be mostly offset by an increase to the FDIC indemnification asset, which is recognized in non-interest income.
Covered Loans
The following table presents the major types of covered loans as of December 31, 2011 and 2010:
(in thousands)
| | | | | | | | | | | | | | | | |
| | | 2011 | |
| | | Evergreen | | | Rainier | | | Nevada Security | | | Total | |
Commercial real estate | | | | | | | | | | | | | | | | |
Term & multifamily | | $ | 99,346 | | | $ | 248,206 | | | $ | 126,502 | | | $ | 474,054 | |
Construction & development | | | 7,241 | | | | 711 | | | | 6,868 | | | | 14,820 | |
Residential development | | | 7,809 | | | | 227 | | | | 9,727 | | | | 17,763 | |
Commercial | | | | | | | | | | | | | | | | |
Term | | | 14,911 | | | | 5,807 | | | | 13,432 | | | | 34,150 | |
LOC & other | | | 8,776 | | | | 8,854 | | | | 5,796 | | | | 23,426 | |
Residential | | | | | | | | | | | | | | | | |
Mortgage | | | 6,320 | | | | 27,320 | | | | 1,863 | | | | 35,503 | |
Home equity loans & lines | | | 4,660 | | | | 21,055 | | | | 3,370 | | | | 29,085 | |
Consumer & other | | | 2,394 | | | | 5,541 | | | | 35 | | | | 7,970 | |
| | | | |
Total | | $ | 151,457 | | | $ | 317,721 | | | $ | 167,593 | | | | 636,771 | |
| | | | | | | | |
Allowance for covered loans | | | | | | | | | | | | | | | (14,320 | ) |
| | | | | | | | | | | | | | | | |
Total | | | | | | | | | | | | | | $ | 622,451 | |
| | | | | | | | | | | | | | | | |
| |
| | | 2010 | |
| | | Evergreen | | | Rainier | | | Nevada Security | | | Total | |
Commercial real estate | | | | | | | | | | | | | | | | |
Term & multifamily | | $ | 124,743 | | | $ | 303,585 | | | $ | 141,314 | | | $ | 569,642 | |
Construction & development | | | 14,470 | | | | 854 | | | | 9,389 | | | | 24,713 | |
Residential development | | | 11,024 | | | | 2,497 | | | | 11,372 | | | | 24,893 | |
Commercial | | | | | | | | | | | | | | | | |
Term | | | 18,895 | | | | 10,881 | | | | 13,000 | | | | 42,776 | |
LOC & other | | | 11,876 | | | | 14,320 | | | | 9,031 | | | | 35,227 | |
Residential | | | | | | | | | | | | | | | | |
Mortgage | | | 8,129 | | | | 35,026 | | | | 1,669 | | | | 44,824 | |
Home equity loans & lines | | | 6,740 | | | | 25,214 | | | | 3,726 | | | | 35,680 | |
Consumer & other | | | 2,793 | | | | 8,071 | | | | — | | | | 10,864 | |
| | | | |
Total | | $ | 198,670 | | | $ | 400,448 | | | $ | 189,501 | | | | 788,619 | |
| | | | | | | | |
Allowance for covered loans | | | | | | | | | | | | | | | (2,721 | ) |
| | | | | | | | | | | | | | | | |
Total | | | | | | | | | | | | | | $ | 785,898 | |
| | | | | | | | | | | | | | | | |
The outstanding contractual unpaid principal balance, excluding purchase accounting adjustments, at December 31, 2011 was $209.5 million, $379.0 million and $260.2 million, for Evergreen, Rainier, and Nevada Security, respectively, as compared to $286.6 million, $481.7 million and $295.4 million, for Evergreen, Rainier, and Nevada Security, respectively, at December 31, 2010.
In estimating the fair value of the covered loans at the acquisition date, we (a) calculated the contractual amount and timing of undiscounted principal and interest payments and (b) estimated the amount and timing of undiscounted expected principal and interest payments. The difference between these two amounts represents the nonaccretable difference.
On the acquisition date, the amount by which the undiscounted expected cash flows exceed the estimated fair value of the acquired loans is the “accretable yield”. The accretable yield is then measured at each financial reporting date and represents the difference between the remaining undiscounted expected cash flows and the current carrying value of the loans.
The following table presents the changes in the accretable yield for the years ended December 31, 2011 and 2010 for each respective acquired loan portfolio:
| | | | | | | | | | | | | | | | |
| | | 2011 | |
| | | Evergreen | | | Rainier | | | Nevada Security | | | Total | |
Balance, beginning of period | | $ | 90,770 | | | $ | 172,614 | | | $ | 73,515 | | | $ | 336,899 | |
Accretion to interest income | | | (26,240 | ) | | | (35,382 | ) | | | (22,580 | ) | | | (84,202 | ) |
Disposals | | | (10,575 | ) | | | (19,893 | ) | | | (4,595 | ) | | | (35,063 | ) |
Reclassifications from nonaccretable difference | | | 2,524 | | | | 2,994 | | | | 14,681 | | | | 20,199 | |
| | | | |
Balance, end of period | | $ | 56,479 | | | $ | 120,333 | | | $ | 61,021 | | | $ | 237,833 | |
| | | | |
| |
| | | 2010 | |
| | | Evergreen | | | Rainier | | | Nevada Security | | | Total | |
Balance, beginning of period | | $ | — | | | $ | — | | | $ | — | | | $ | — | |
Additions resulting from acquisitions | | | 121,592 | | | | 237,858 | | | | 65,606 | | | | 425,056 | |
Accretion to interest income | | | (29,060 | ) | | | (32,979 | ) | | | (10,978 | ) | | | (73,017 | ) |
Disposals | | | (6,572 | ) | | | (12,830 | ) | | | (2,376 | ) | | | (21,778 | ) |
Reclassifications (to)/from nonaccretable difference | | | 4,810 | | | | (19,435 | ) | | | 21,263 | | | | 6,638 | |
| | | | |
Balance, end of period | | $ | 90,770 | | | $ | 172,614 | | | $ | 73,515 | | | $ | 336,899 | |
| | | | |
The estimated fair value of the loan portfolios and expected credit losses continued to be based on a weighted average pool-level basis. However, the undiscounted contractual cash flows estimate was refined to be based off of the underlying individual loans and resulted in a reduction in the undiscounted contractual cash flows and a corresponding decrease in accretable yield. As these acquisitions occurred in the first quarter of 2010, the Company elected to reflect these changes, beginning in the second quarter of 2010, in the reclassification to nonaccretable difference line item of the accretable yield reconciliation, rather than adjust the acquisition date balance disclosure as the estimated fair values did not change. The updated initial cash flows did not have a material impact on or result in retrospective adjustments to the Company’s consolidated financial statements.
Umpqua Holdings Corporation and Subsidiaries
Allowance for Covered Loan and Lease Losses
The following table summarizes activity related to the allowance for covered loan and lease losses by covered loan portfolio segment for the years ended December 31, 2011 and 2010, respectively:
(in thousands)
| | | | | | | | | | | | | | | | | | | | |
| | | December 31, 2011 | |
| | | Commercial
Real Estate | | | Commercial | | | Residential | | | Consumer
& Other | | | Total | |
Balance, beginning of period | | $ | 2,465 | | | $ | 176 | | | $ | 56 | | | $ | 24 | | | $ | 2,721 | |
Charge-offs | | | (3,177 | ) | | | (660 | ) | | | (1,657 | ) | | | (1,192 | ) | | | (6,686 | ) |
Recoveries | | | 1,348 | | | | 512 | | | | 142 | | | | 142 | | | | 2,144 | |
Provision | | | 8,303 | | | | 3,936 | | | | 2,450 | | | | 1,452 | | | | 16,141 | |
| | | | |
Balance, end of period | | $ | 8,939 | | | $ | 3,964 | | | $ | 991 | | | $ | 426 | | | $ | 14,320 | |
| | | | |
| | | | | | | | | | | | | | | | | | | | |
| | | December 31, 2010 | |
| | | Commercial
Real Estate | | | Commercial | | | Residential | | | Consumer
& Other | | | Total | |
Balance, beginning of period | | $ | — | | | $ | — | | | $ | — | | | $ | — | | | $ | — | |
Charge-offs | | | (2,439 | ) | | | (266 | ) | | | — | | | | — | | | | (2,705 | ) |
Recoveries | | | 11 | | | | 263 | | | | — | | | | 1 | | | | 275 | |
Provision | | | 4,893 | | | | 179 | | | | 56 | | | | 23 | | | | 5,151 | |
| | | | |
Balance, end of period | | $ | 2,465 | | | $ | 176 | | | $ | 56 | | | $ | 24 | | | $ | 2,721 | |
| | | | |
The following table presents the allowance and recorded investment in covered loans by portfolio segment as of December 31, 2011 and 2010:
(in thousands)
| | | | | | | | | | | | | | | | | | | | |
| | | December 31, 2011 | |
| | | Commercial
Real Estate | | | Commercial | | | Residential | | | Consumer
& Other | | | Total | |
Allowance for covered loans and leases: | | | | | | | | | | | | | | | | | | | | |
Loans acquired with deteriorated credit quality(1) | | $ | 8,491 | | | $ | 3,366 | | | $ | 955 | | | $ | 395 | | | $ | 13,207 | |
Collectively evaluated for impairment(2) | | | 448 | | | | 598 | | | | 36 | | | | 31 | | | | 1,113 | |
| | | | |
Total | | $ | 8,939 | | | $ | 3,964 | | | $ | 991 | | | $ | 426 | | | $ | 14,320 | |
| | | | |
Covered loans and leases: | | | | | | | | | | | | | | | | | | | | |
Loans acquired with deteriorated credit quality(1) | | $ | 503,575 | | | $ | 39,427 | | | $ | 59,980 | | | $ | 5,410 | | | $ | 608,392 | |
Collectively evaluated for impairment(2) | | | 3,062 | | | | 18,149 | | | | 4,608 | | | | 2,560 | | | | 28,379 | |
| | | | |
Total | | $ | 506,637 | | | $ | 57,576 | | | $ | 64,588 | | | $ | 7,970 | | | $ | 636,771 | |
| | | | |
| | | | | | | | | | | | | | | | | | | | |
| | | December 31, 2010 | |
| | | Commercial
Real Estate | | | Commercial | | | Residential | | | Consumer
& Other | | | Total | |
Allowance for covered loans and leases: | | | | | | | | | | | | | | | | | | | | |
Loans acquired with deteriorated credit quality(1) | | $ | 2,345 | | | $ | — | | | $ | — | | | $ | — | | | $ | 2,345 | |
Collectively evaluated for impairment | | | 120 | | | | 176 | | | | 56 | | | | 24 | | | | 376 | |
| | | | |
Total | | $ | 2,465 | | | $ | 176 | | | $ | 56 | | | $ | 24 | | | $ | 2,721 | |
| | | | |
Covered loans and leases: | | | | | | | | | | | | | | | | | | | | |
Loans acquired with deteriorated credit quality(1) | | $ | 614,361 | | | $ | 63,252 | | | $ | 72,650 | | | $ | 8,610 | | | $ | 758,873 | |
Collectively evaluated for impairment | | | 4,887 | | | | 14,751 | | | | 7,854 | | | | 2,254 | | | | 29,746 | |
| | | | |
Total | | $ | 619,248 | | | $ | 78,003 | | | $ | 80,504 | | | $ | 10,864 | | | $ | 788,619 | |
| | | | |
(1) | In accordance with ASC 310-30, the valuation allowance is netted against the carrying value of the covered loan and lease balance. |
(2) | The allowance on covered loan and lease losses includes an allowance on covered loan advances on acquired loans subsequent to acquisition. |
The valuation allowance on covered loans was reduced by recaptured provision of $3.5 million and none for the years ended December 31, 2011 and 2010, respectively.
Covered Credit Quality Indicators
Covered loans are risk rated in a manner consistent with non-covered loans. As previously noted, the Company’s risk rating methodology assigns risk ratings ranging from 1 to 10, where a higher rating represents higher risk. The 10 risk rating groupings are described fully in Note 6. The below table includes both loans acquired with deteriorated credit quality accounted for under ASC 310-30 and covered loan advances on acquired loans subsequent to acquisition.
The following table summarizes our internal risk rating grouping by class of covered loans, net as of December 31, 2011 and 2010:
(in thousands)
| | | | | | | | | | | | | | | | | | | | | | | | |
| | | December 31, 2011 | |
| | | Pass/Watch | | | Special Mention | | | Substandard | | | Doubtful | | | Loss | | | Total | |
Commercial real estate | | | | | | | | | | | | | | | | | | | | | | | | |
Term & multifamily | | $ | 329,273 | | | $ | 58,610 | | | $ | 68,521 | | | $ | 12,343 | | | $ | — | | | $ | 468,747 | |
Construction & development | | | 1,552 | | | | 1,410 | | | | 6,733 | | | | 3,410 | | | | — | | | | 13,105 | |
Residential development | | | 1,187 | | | | 405 | | | | 8,394 | | | | 5,808 | | | | — | | | | 15,794 | |
Commercial | | | | | | | | | | | | | | | | | | | | | | | | |
Term | | | 18,006 | | | | 1,661 | | | | 8,244 | | | | 3,228 | | | | — | | | | 31,139 | |
LOC & other | | | 13,605 | | | | 2,756 | | | | 5,607 | | | | 556 | | | | — | | | | 22,524 | |
Residential | | | | | | | | | | | | | | | | | | | | | | | | |
Mortgage | | | 35,233 | | | | — | | | | — | | | | — | | | | — | | | | 35,233 | |
Home equity loans & lines | | | 28,223 | | | | — | | | | 143 | | | | — | | | | — | | | | 28,366 | |
Consumer & other | | | 7,543 | | | | — | | | | — | | | | — | | | | — | | | | 7,543 | |
| | | | |
Total | | $ | 434,622 | | | $ | 64,842 | | | $ | 97,642 | | | $ | 25,345 | | | $ | — | | | $ | 622,451 | |
| | | | |
Umpqua Holdings Corporation and Subsidiaries
| | | | | | | | | | | | | | | | | | | | | | | | |
| | | December 31, 2010 | |
| | | Pass/Watch | | | Special Mention | | | Substandard | | | Doubtful | | | Loss | | | Total | |
Commercial real estate | | | | | | | | | | | | | | | | | | | | | | | | |
Term & multifamily | | $ | 485,238 | | | $ | 32,150 | | | $ | 44,833 | | | $ | 7,421 | | | $ | — | | | $ | 569,642 | |
Construction & development | | | 6,155 | | | | 3,799 | | | | 7,640 | | | | 4,841 | | | | — | | | | 22,435 | |
Residential development | | | 6,625 | | | | 1,322 | | | | 12,907 | | | | 3,852 | | | | — | | | | 24,706 | |
Commercial | | | | | | | | | | | | | | | | | | | | | | | | |
Term | | | 31,760 | | | | 2,119 | | | | 7,087 | | | | 1,634 | | | | — | | | | 42,600 | |
LOC & other | | | 22,960 | | | | 4,246 | | | | 7,183 | | | | 838 | | | | — | | | | 35,227 | |
Residential | | | | | | | | | | | | | | | | | | | | | | | | |
Mortgage | | | 44,524 | | | | — | | | | 300 | | | | — | | | | — | | | | 44,824 | |
Home equity loans & lines | | | 34,998 | | | | — | | | | 627 | | | | — | | | | — | | | | 35,625 | |
Consumer & other | | | 10,827 | | | | — | | | | 12 | | | | — | | | | — | | | | 10,839 | |
| | | | |
Total | | $ | 643,087 | | | $ | 43,636 | | | $ | 80,589 | | | $ | 18,586 | | | $ | — | | | $ | 785,898 | |
| | | | |
Covered Other Real Estate Owned
All other real estate owned (“OREO”) acquired in FDIC-assisted acquisitions that are subject to a FDIC loss-share agreement are referred to as “covered OREO” and reported separately in our statements of financial position. Covered OREO is reported exclusive of expected reimbursement cash flows from the FDIC. Foreclosed covered loan collateral is transferred into covered OREO at the collateral’s net realizable value, less selling costs.
Covered OREO was initially recorded at its estimated fair value on the acquisition date based on similar market comparable valuations less estimated selling costs. Any subsequent valuation adjustments due to declines in fair value will be charged to non-interest expense, and will be mostly offset by non-interest income representing the corresponding increase to the FDIC indemnification asset for the offsetting loss reimbursement amount. Any recoveries of previous valuation adjustments will be credited to non-interest expense with a corresponding charge to non-interest income for the portion of the recovery that is due to the FDIC.
The following table summarizes the activity related to the covered OREO for the years ended December 31, 2011 and 2010:
(in thousands)
| | | | | | | | |
| | | 2011 | | | 2010 | |
Balance, beginning of period | | $ | 29,863 | | | $ | — | |
Acquisition | | | — | | | | 26,939 | |
Additions to covered OREO | | | 15,271 | | | | 15,350 | |
Dispositions of covered OREO | | | (16,934 | ) | | | (10,485 | ) |
Valuation adjustments in the period | | | (8,709 | ) | | | (1,941 | ) |
| | | | |
Balance, end of period | | $ | 19,491 | | | $ | 29,863 | |
| | | | |
FDIC Indemnification Asset
The Company has elected to account for amounts receivable under the loss-share agreement as an indemnification asset in accordance with FASB ASC 805,Business Combinations. The FDIC indemnification asset is initially recorded at fair value, based on the discounted value of expected future cash flows under the loss-share agreement. The difference between the present value and the undiscounted cash flows the Company expects to collect from the FDIC will be accreted into non-interest income over the life of the FDIC indemnification asset.
Subsequent to initial recognition, the FDIC indemnification asset is reviewed quarterly and adjusted for any changes in expected cash flows based on recent performance and expectations for future performance of the covered assets. These adjustments are measured on the same basis as the related covered loans and covered other real estate owned. Any increases
in cash flow of the covered assets over those expected will reduce the FDIC indemnification asset and any decreases in cash flow of the covered assets under those expected will increase the FDIC indemnification asset. Increases and decreases to the FDIC indemnification asset are recorded as adjustments to non-interest income. The resulting carrying value of the indemnification asset represents the amounts recoverable from the FDIC for future expected losses, and the amounts due from the FDIC for claims related to covered losses the Company have incurred less amounts due back to the FDIC relating to shared recoveries.
The following table summarizes the activity related to the FDIC indemnification asset for each respective acquired portfolio for the years ended December 31, 2011 and 2010:
(in thousands)
| | | | | | | | | | | | | | | | |
| | | 2011 | |
| | | Evergreen | | | Rainier | | | Nevada Security | | | Total | |
Balance, beginning of period | | $ | 40,606 | | | $ | 43,726 | | | $ | 62,081 | | | $ | 146,413 | |
Change in FDIC indemnification asset | | | 1,357 | | | | (7,343 | ) | | | (182 | ) | | | (6,168 | ) |
Transfers to due from FDIC | | | (13,416 | ) | | | (8,111 | ) | | | (27,629 | ) | | | (49,156 | ) |
| | | | |
Balance, end of period | | $ | 28,547 | | | $ | 28,272 | | | $ | 34,270 | | | $ | 91,089 | |
| | | | |
| |
| | | 2010 | |
| | | Evergreen | | | Rainier | | | Nevada Security | | | Total | |
Balance, beginning of period | | $ | — | | | $ | — | | | $ | — | | | $ | — | |
Acquisitions | | | 71,755 | | | | 76,603 | | | | 99,160 | | | | 247,518 | |
Change in FDIC indemnification asset | | | (12,864 | ) | | | (7,045 | ) | | | 3,464 | | | | (16,445 | ) |
Transfers to due from FDIC | | | (18,285 | ) | | | (25,832 | ) | | | (40,543 | ) | | | (84,660 | ) |
| | | | |
Balance, end of period | | $ | 40,606 | | | $ | 43,726 | | | $ | 62,081 | | | $ | 146,413 | |
| | | | |
NOTE 8. PREMISES AND EQUIPMENT
The following table presents the major components of premises and equipment at December 31, 20112014 and 2010:
(in thousands)
| | | | | | | | |
| | | 2011 | | | 2010 | |
Land | | $ | 24,855 | | | $ | 23,174 | |
Buildings and improvements | | | 127,028 | | | | 115,807 | |
Furniture, fixtures and equipment | | | 108,599 | | | | 95,909 | |
Construction in progress | | | 10,360 | | | | 4,471 | |
| | | | |
Total premises and equipment | | | 270,842 | | | | 239,361 | |
Less: Accumulated depreciation and amortization | | | (118,476 | ) | | | (102,762 | ) |
| | | | |
Premises and equipment, net | | $ | 152,366 | | | $ | 136,599 | |
| | | | |
2013:
|
| | | | | | | | | |
| (in thousands) | | | | | Estimated useful life |
| | 2014 | | 2013 | |
| Land | $ | 46,415 |
| | $ | 26,438 |
| | |
| Buildings and improvements | 218,326 |
| | 153,771 |
| | 7-39 years |
| Furniture, fixtures and equipment | 173,034 |
| | 131,691 |
| | 4-20 years |
| Construction in progress | 32,313 |
| | 13,172 |
| | |
| Total premises and equipment | 470,088 |
| | 325,072 |
| | |
| Less: Accumulated depreciation and amortization | (152,254 | ) | | (147,392 | ) | | |
| Premises and equipment, net | $ | 317,834 |
| | $ | 177,680 |
| | |
Depreciation expense totaled $16.5$36.9 million $14.4, $20.5 million and $12.8$17.6 million for the years ended December 31, 2011, 20102014, 2013 and 2009,2012, respectively.Umpqua’s
Umpqua's subsidiaries have entered into a number of non-cancelable lease agreements with respect to premises and equipment. See Note
2019 for more information regarding rental expense, net of rent income, and minimum annual rental commitments under non-cancelable lease agreements.
Umpqua Holdings Corporation
Note 8–Goodwill and
SubsidiariesOther Intangible Assets
NOTE 9. GOODWILL AND OTHER INTANGIBLE ASSETSThe following table summarizes the changes in the Company’sCompany's goodwill and other intangible assets for the years ended December 31, 2008, 2009, 2010,2012, 2013 and 2011. Goodwill is reflected by operating segment; all other intangible assets are related to the Community Banking segment.
(in thousands)
| | | | | | | | | | | | | | | | | | | | | | | | |
| | | Goodwill | |
| | | Community Banking | | | Wealth Management | |
| | | Gross | | | Accumulated
Impairment | | | Total | | | Gross | | | Accumulated
Impairment | | | Total | |
Balance, December 31, 2008 | | $ | 719,336 | | | $ | — | | | $ | 719,336 | | | $ | 3,697 | | | $ | (982 | ) | | $ | 2,715 | |
Reductions | | | (81 | ) | | | — | | | | (81 | ) | | | — | | | | — | | | | — | |
Impairment | | | — | | | | (111,952 | ) | | | (111,952 | ) | | | — | | | | — | | | | — | |
| | | | | | | | |
Balance, December 31, 2009 | | | 719,255 | | | | (111,952 | ) | | | 607,303 | | | | 3,697 | | | | (982 | ) | | | 2,715 | |
Net additions | | | 45,954 | | | | — | | | | 45,954 | | | | — | | | | — | | | | — | |
Reductions | | | (96 | ) | | | — | | | | (96 | ) | | | — | | | | — | | | | — | |
| | | | | | | | |
Balance, December 31, 2010 | | | 765,113 | | | | (111,952 | ) | | | 653,161 | | | | 3,697 | | | | (982 | ) | | | 2,715 | |
Net additions | | | 247 | | | | — | | | | 247 | | | | — | | | | — | | | | — | |
Reductions | | | (44 | ) | | | — | | | | (44 | ) | | | — | | | | — | | | | — | |
| | | | | | | | |
Balance, December 31, 2011 | | $ | 765,316 | | | $ | (111,952 | ) | | $ | 653,364 | | | $ | 3,697 | | | $ | (982 | ) | | $ | 2,715 | |
| | | | | | | | |
| | | | |
| | | Other Intangible Assets | | | | | | | | | | |
| | | Gross | | | Accumulated
Amortization | | | Net | | | | | | | | | | |
Balance, December 31, 2008 | | $ | 56,213 | | | $ | (20,432 | ) | | $ | 35,781 | | | | | | | | | | | | | |
Impairment | | | — | | | | (804 | ) | | | (804 | ) | | | | | | | | | | | | |
Amortization | | | — | | | | (5,361 | ) | | | (5,361 | ) | | | | | | | | | | | | |
| | | | | | | | | | | | | | | | |
Balance, December 31, 2009 | | | 56,213 | | | | (26,597 | ) | | | 29,616 | | | | | | | | | | | | | |
Net additions | | | 7,016 | | | | — | | | | 7,016 | | | | | | | | | | | | | |
Reductions | | | (5,150 | ) | | | — | | | | (5,150 | ) | | | | | | | | | | | | |
Amortization | | | — | | | | (5,389 | ) | | | (5,389 | ) | | | | | | | | | | | | |
| | | | | | | | | | | | | | | | |
Balance, December 31, 2010 | | | 58,079 | | | | (31,986 | ) | | | 26,093 | | | | | | | | | | | | | |
Net additions | | | — | | | | — | | | | — | | | | | | | | | | | | | |
Amortization | | | — | | | | (4,948 | ) | | | (4,948 | ) | | | | | | | | | | | | |
| | | | | | | | | | | | | | | | |
Balance, December 31, 2011 | | $ | 58,079 | | | $ | (36,934 | ) | | $ | 21,145 | | | | | | | | | | | | | |
| | | | | | | | | | | | | | | | |
2014.
|
| | | | | | | | | | | |
| (in thousands) | Goodwill |
| | Community Banking |
| | | | Accumulated | | |
| | Gross | | Impairment | | Total |
| Balance, December 31, 2011 | $ | 769,013 |
| | $ | (112,934 | ) | | $ | 656,079 |
|
| Net additions | 12,545 |
| | — |
| | 12,545 |
|
| Reductions | (452 | ) | | — |
| | (452 | ) |
| Balance, December 31, 2012 | 781,106 |
| | (112,934 | ) | | 668,172 |
|
| Net additions | 96,777 |
| | — |
| | 96,777 |
|
| Reductions | (644 | ) | | — |
| | (644 | ) |
| Balance, December 31, 2013 | 877,239 |
| | (112,934 | ) | | 764,305 |
|
| Net additions | 1,021,920 |
| | — |
| | 1,021,920 |
|
| Reductions | — |
| | — |
| | — |
|
| Balance, December 31, 2014 | $ | 1,899,159 |
| | $ | (112,934 | ) | | $ | 1,786,225 |
|
| | | | | | |
| | Other Intangible Assets |
| | | | Accumulated | | |
| | Gross | | Amortization | | Net |
| Balance, December 31, 2011 | $ | 58,079 |
| | $ | (36,934 | ) | | $ | 21,145 |
|
| Net additions | 830 |
| | — |
| | 830 |
|
| Amortization | — |
| | (4,816 | ) | | (4,816 | ) |
| Balance, December 31, 2012 | 58,909 |
| | (41,750 | ) | | 17,159 |
|
| Net additions | — |
| | — |
| | — |
|
| Amortization | — |
| | (4,781 | ) | | (4,781 | ) |
| Balance, December 31, 2013 | 58,909 |
| | (46,531 | ) | | 12,378 |
|
| Net additions | 54,562 |
| | — |
| | 54,562 |
|
| Amortization | — |
| | (10,207 | ) | | (10,207 | ) |
| Balance, December 31, 2014 | $ | 113,471 |
| | $ | (56,738 | ) | | $ | 56,733 |
|
Goodwill additions in 2011 relate to purchase accounting adjustments finalized relating to the Rainier acquisition. The 2010 goodwill additions2014, 2013, and 2012 relate to the RainierSterling merger, FinPac acquisition, and Nevada Security acquisitions and represent the excess of the total purchase price paid over the fair values of the assets acquired, net of the fair values of liabilities assumed.Circle acquisition, respectively. Additional information on the acquisition and purchase price allocation is provided in Note 2. The reductionsreduction to goodwill include decreasesin 2013 of $44,000, $96,000, and $81,000$644,000 relates to acquistion accounting adjustments. The reduction to goodwill in 2011, 2010, and 2009, respectively,2012 of $452,000 is due to the recognition of tax benefits upon exercise of fully vested acquired stock options. Intangible additions in
20102014 and 2012 relate to the
Evergreen, Rainier,Sterling merger and
Nevada Security acquisitions and represent core deposits, which includes all deposits except certificates of deposit, and an insurance related customer relationship, which was sold in the second quarter of 2010 for the same value recorded in the purchase price allocation. The values of the core deposit intangible assets were determined by an analysis of the cost differential between the core deposits and alternative funding sources. The value of the insurance related customer relationship was determined based on market indicators. Intangible assets with definiteuseful lives are amortized to their estimated residual values over their respective estimated useful lives, and are also reviewed for impairment. We amortize other intangible assets on an accelerated or straight-line basis over an estimated ten to fifteen year life.Circle acquisition, respectively. No impairment losses separate from the scheduled amortization have been recognized in the periods presented.
The Company performed a goodwill impairment analysis of the Community Banking operating segment as of June 30, 2009, due to a decline in the Company’s market capitalization below book value of equity and continued weakness in the banking industry. The Company engaged an independent valuation consultant to assist us in determining whether and to what extent our goodwill asset was impaired. The results of the Company’s and valuation specialist’s step one impairment test indicated that the reporting unit’s fair value was less than its carrying value, and therefore the Company performed a step two analysis. As part of the second step of the goodwill impairment analysis, we calculated the fair value of the reporting unit’s assets and liabilities, as well as its unrecognized identifiable intangible assets, such as the core deposit intangible and trade name. Fair value adjustments to items on the balance sheet primarily related to investment securities held to maturity, loans, other real estate owned, Visa Class B common stock, deferred taxes, deposits, term debt, and junior subordinated debentures carried at amortized cost. The external valuation specialist assisted management to estimate the fair value of our unrecognized identifiable assets, such as the core deposit intangible and trade name.
The most significant fair value adjustment made in this analysis was to adjust the carrying value of the Company’s loans receivable portfolio to fair value. The fair value of the Company’s loan receivable portfolio at June 30, 2009 was estimated in a manner similar to methodology utilized as part of the December 31, 2008 goodwill impairment evaluation. As part of the December 31, 2008 loan valuation, the loan portfolio was stratified into sixty-eight loan pools that shared common characteristics, namely loan type, payment terms, and whether the loans were performing or non-performing. Each loan pool was discounted at a rate that considers current market interest rates, credit risk, and assumed liquidity premiums required based upon the nature of the underlying pool. Due to the disruption in the financial markets experienced during 2008 and continuing through 2009, the liquidity premium reflects the reduction in demand in the secondary markets for all grades of non-conforming credit, including those that are performing. Liquidity premiums for individual loan categories generally ranged from 4.6% for performing loans to 30% for construction and non-performing loans. At December 31, 2008, the fair value of the overall loan portfolio was calculated to be at a 9% discount relative to its book value. The composition of the loan portfolio at June 30, 2009, including loan type and performance indicators, was substantially similar to the loan portfolio at December 31, 2008. At June 30, 2009, the fair value of the loan portfolio was estimated to be at a 12% discount relative to its carrying value. The additional discount is primarily attributed to the additional liquidity premium required as of the measurement date associated with the Company’s concentration of commercial real estate loans.
Other significant fair value adjustments utilized in this goodwill impairment analysis included the value of the core deposit intangible asset which was calculated as 0.53% of core deposits, and includes all deposits except certificates of deposit. The carrying value of other real estate owned was discounted by 25%, representing a liquidity adjustment given the current market conditions. The fair value of our trade name, which represents the competitive advantage associated with our brand recognition and ability to attract and retain relationships, was estimated to be $19.3 million. The fair value of our junior subordinated debentures carried at amortized cost was determined in a manner and utilized inputs, primarily the credit risk adjusted spread, consistent with our methodology for determining the fair value of junior subordinated debentures recorded at fair value.
Based on the results of the step two analysis, the Company determined that the implied fair value of the goodwill was less than its carrying amount on the Company’s balance sheet, and as a result, recognized a goodwill impairment loss of $112.0 million in the second quarter of 2009. This write-down of goodwill was a non-cash charge that did not affect the Company’s or the Bank’s liquidity or operations. In addition, because goodwill is excluded in the calculation of regulatory capital, the Company’s “well-capitalized” capital ratios were not affected by this charge.
The Company conducted its annual evaluation of goodwill for impairment at both December 31, 20112014 and 2010,2013, respectively. At both dates, in the first step of the goodwill impairment test, the Company determined that the fair value of the Community Banking reporting unit exceeded its carrying amount. This determination is consistent with the events occurring after the Company recognized the $112.0 million impairment of goodwill in the second quarter of 2009. First, the market capitalization and estimated fair value of the Company increased significantly subsequent to the recognition of the impairment charge, as theUmpqua Holdings Corporation and Subsidiaries
fair value of the Company’s stock increased 60% from June 30, 2009 to December 31, 2011. Secondly, the Company’s successful public common stock offerings in the third quarter of 2009 and first quarter of 2010 diluted the carrying value of the reporting unit’s book equity on a per share basis, against which the fair value of the reporting unit is measured. The significant assumptions and methodology utilized to test for goodwill impairment as of
December 31, 20112014 were consistent with those used at December 31, 2010.If the Company’s common stock price should significantly decline or continues to trade below book value per common share, or should general economic conditions deteriorate further or remain depressed for a prolonged period2013
.
Table of time, particularly in the financial industry, the Company may be required to recognize additional impairment of all, or some portion of, its goodwill. It is possible that changes in circumstances, existing at the measurement date or at other times in the future, or changes in the numerous estimates associated with management’s judgments, assumptions and estimates made in assessing the fair value of our goodwill, such as valuation multiples, discount rates, or projected earnings, could result in an impairment charge in future periods. Additional impairment charges, if any, may be material to the Company’s results of operations and financial position. However, any potential future impairment charge will have no effect on the Company’s or the Bank’s cash balances, liquidity, or regulatory capital ratios.The inputs management utilizes to estimate the fair value of a reporting unit in step one of the goodwill impairment test, and estimating the fair values of the underlying assets and liabilities of a reporting unit in the second step of the goodwill impairment test, require management to make significant judgments, assumptions and estimates where observable market may not readily exist. Such inputs include, but are not limited to, trading multiples from comparable transactions, control premiums, the value that may arise from synergies and other benefits that would accrue from control over an entity, and the appropriate rates to discount projected cash flows. Additionally, there may be limited current market inputs to value certain assets or liabilities, particularly loans and junior subordinated debentures. These valuation inputs are considered to be Level 3 inputs.
Management will continue to monitor the relationship of the Company’s market capitalization to both its book value and tangible book value, which management attributes to both financial services industry-wide and Company specific factors, and to evaluate the carrying value of goodwill and other intangible assets.
The Company evaluated the Wealth Management reporting segment’s goodwill for impairment as of December 31, 2011. The first step of the goodwill impairment test indicated that the reporting unit’s fair value exceeded its carrying value, therefore, no additional impairment was recognized.
In 2009, the Company recognized an $804,000 impairment related to the merchant servicing portfolio as a result of a decrease in the actual and expected future cash flows related to the income stream. Additional information on intangible assets related to acquisitions is provided in Note 2.
Contents
The table below presents the forecasted amortization expense for intangible assets acquired in all mergers:(in thousands)
| | | | |
| Year | | Expected
Amortization | |
2012 | | $ | 4,795 | |
2013 | | | 4,623 | |
2014 | | | 4,403 | |
2015 | | | 4,182 | |
2016 | | | 2,433 | |
Thereafter | | | 709 | |
| | | | |
| | $ | 21,145 | |
| | | | |
|
| | | |
| (in thousands) | Expected |
|
| Year | Amortization |
|
| 2015 | $ | 11,225 |
|
| 2016 | 8,622 |
|
| 2017 | 6,756 |
|
| 2018 | 6,166 |
|
| 2019 | 5,618 |
|
| Thereafter | 18,346 |
|
| | $ | 56,733 |
|
NOTE 10. MORTGAGE SERVICING RIGHTSNote 9– Residential Mortgage Servicing Rights
The following table presents the changes in the Company’sCompany's residential mortgage servicing rights (“MSR”("MSR") for the years ended December 31, 2011, 20102014, 2013 and 2009:(in thousands)
| | | | | | | | | | | | |
| | | 2011 | | | 2010 | | | 2009 | |
Balance, beginning of year | | $ | 14,454 | | | $ | 12,625 | | | $ | 8,205 | |
Additions for new mortgage servicing rights capitalized | | | 6,720 | | | | 5,645 | | | | 7,570 | |
Acquired mortgage servicing rights | | | — | | | | 62 | | | | — | |
Changes in fair value: | | | | | | | | | | | | |
Due to changes in model inputs or assumptions(1) | | | (858 | ) | | | (1,598 | ) | | | (3,469 | ) |
Other(2) | | | (2,132 | ) | | | (2,280 | ) | | | 319 | |
| | | | |
Balance, end of year | | $ | 18,184 | | | $ | 14,454 | | | $ | 12,625 | |
| | | | |
Balance of loans serviced for others | | $ | 2,009,849 | | | $ | 1,603,414 | | | $ | 1,277,832 | |
MSR as a percentage of serviced loans | | | 0.90% | | | | 0.90% | | | | 0.99% | |
|
| | | | | | | | | | | |
| (in thousands) | 2014 | | 2013 | | 2012 |
| Balance, beginning of period | $ | 47,765 |
| | $ | 27,428 |
| | $ | 18,184 |
|
| Acquired/purchased MSR | 62,770 |
| | — |
| | — |
|
| Additions for new MSR capitalized | 23,311 |
| | 17,963 |
| | 17,710 |
|
| Changes in fair value: | | | | | |
Due to changes in model inputs or assumptions(1) | (5,757 | ) | | 5,688 |
| | (4,651 | ) |
Other(2) | (10,830 | ) | | (3,314 | ) | | (3,815 | ) |
| Balance, end of period | $ | 117,259 |
| | $ | 47,765 |
| | $ | 27,428 |
|
| |
| (1) | Principally reflects changes in discount rates and prepayment speed assumptions, which are primarily affected by changes in interest rates. |
| |
| (2) | Represents changes due to collection/realization of expected cash flows over time. |
Information related to our serviced loan portfolio as of December 31, 2014, 2013 and 2012 is as follows:
|
| | | | | | | | | | | |
| (dollars in thousands) | December 31, 2014 | | December 31, 2013 | | December 31, 2012 |
| Balance of loans serviced for others | $ | 11,590,310 |
| | $ | 4,362,499 |
| | $ | 3,162,080 |
|
| MSR as a percentage of serviced loans | 1.01 | % | | 1.09 | % | | 0.87 | % |
The amount of contractually specified servicing fees, late fees and ancillary fees earned, recorded in residential mortgage banking revenue on theConsolidated Statements of OperationsIncome, were $4.7was $20.8 million, $3.9$10.4 million, and $3.0$6.6 million respectively, for the years ended December 31, 2011, 2010,2014, 2013 and 2009.2012.
Key assumptions used in measuring the fair value of MSR as of December 31 were as follows:
|
| | | | | | | | |
| | 2014 | | 2013 | | 2012 |
| Constant prepayment rate | 12.39 | % | | 12.74 | % | | 21.39 | % |
| Discount rate | 9.17 | % | | 8.69 | % | | 8.65 | % |
| Weighted average life (years) | 6.4 |
| | 6.0 |
| | 4.7 |
|
NOTE 11. NON-COVERED OTHER REAL ESTATE OWNED, NETA sensitivity analysis of the current fair value to changes in discount and prepayment speed assumptions as of December 31, 2014 and December 31, 2013 is as follows:
|
| | | | | | | |
| | December 31, 2014 | | December 31, 2013 |
| Constant prepayment rate | | | |
| Effect on fair value of a 10% adverse change | $ | (4,965 | ) | | $ | (2,255 | ) |
| Effect on fair value of a 20% adverse change | $ | (9,547 | ) | | $ | (4,323 | ) |
| | | | |
| Discount rate | | | |
| Effect on fair value of a 100 basis point adverse change | $ | (4,539 | ) | | $ | (1,832 | ) |
| Effect on fair value of a 200 basis point adverse change | $ | (8,771 | ) | | $ | (3,534 | ) |
The sensitivity analysis presents the hypothetical effect on fair value of the MSR. The effect of such hypothetical change in assumptions generally cannot be extrapolated because the relationship of the change in an assumption to the change in fair value is not linear. Additionally, in the analysis, the impact of an adverse change in one assumption is calculated independent of any impact on other assumptions. In reality, changes in one assumption may change another assumption.
Note 10– Other Real Estate Owned, Net
The following table presents the changes in other real estate owned (“OREO”("OREO"), net of valuation allowance, for the years ended December 31, 2011, 20102014, 2013 and 2009:(in thousands)
| | | | | | | | | | | | |
| | | 2011 | | | 2010 | | | 2009 | |
Balance, beginning of period | | $ | 32,791 | | | $ | 24,566 | | | $ | 27,898 | |
Additions to OREO | | | 47,414 | | | | 41,491 | | | | 50,914 | |
Dispositions of OREO | | | (37,083 | ) | | | (29,192 | ) | | | (41,999 | ) |
Valuation adjustments in the period | | | (8,947 | ) | | | (4,074 | ) | | | (12,247 | ) |
| | | | |
Balance, end of period | | $ | 34,175 | | | $ | 32,791 | | | $ | 24,566 | |
| | | | |
OREO properties are recorded at the lower of the recorded investment in the loan (prior to foreclosure) or the fair market value of the property less expected selling costs. 2012:
|
| | | | | | | | | | | |
| (in thousands) | 2014 | | 2013 | | 2012 |
| Balance, beginning of period | $ | 23,935 |
| | $ | 27,512 |
| | $ | 53,666 |
|
| Additions to OREO due to acquisition | 8,666 |
| | — |
| | 1,602 |
|
| Additions to OREO | 24,873 |
| | 24,193 |
| | 24,686 |
|
| Dispositions of OREO | (15,804 | ) | | (25,610 | ) | | (40,900 | ) |
| Valuation adjustments in the period | (3,728 | ) | | (2,160 | ) | | (11,542 | ) |
| Balance, end of period | $ | 37,942 |
| | $ | 23,935 |
| | $ | 27,512 |
|
The Company recognized valuation allowances of $5.1$3.7 million, $2.4$1.0 million, and $11.4$1.8 million on its non-covered OREO balances as of December 31, 2011, 20102014, 2013 and 2009,2012, respectively. Valuation allowances on non-covered OREO balances are based on updated appraisals of the underlying properties as received during a period or management’smanagement's authorization to reduce the selling price of a property during the period.Umpqua Holdings Corporation and Subsidiaries
Note 11 - Other Assets
NOTE 12. OTHER ASSETSOther assets consisted of the following at December 31, 20112014 and 2010:
(in thousands)
| | | | | | | | |
| | | 2011 | | | 2010 | |
Cash surrender value of life insurance policies | | $ | 92,555 | | | $ | 90,161 | |
Accrued interest receivable | | | 30,617 | | | | 30,307 | |
Due from FDIC | | | 26,510 | | | | 36,461 | |
Prepaid FDIC deposit assessment | | | 18,739 | | | | 29,369 | |
Income taxes receivable | | | 14,715 | | | | 516 | |
Equity method investments | | | 12,400 | | | | 8,377 | |
Derivative assets | | | 7,955 | | | | 1,060 | |
Investment in unconsolidated Trusts | | | 6,934 | | | | 6,933 | |
Deferred tax assets, net | | | — | | | | 9,649 | |
Other | | | 37,181 | | | | 29,632 | |
| | | | |
Total | | $ | 247,606 | | | $ | 242,465 | |
| | | | |
The amount due from the FDIC relates to the FDIC-assisted acquisitions2013:
|
| | | | | | | |
| (in thousands) | 2014 | | 2013 |
| Accrued interest receivable | $ | 48,343 |
| | $ | 23,720 |
|
| Prepaid expenses | 44,031 |
| | 8,301 |
|
| Derivative assets | 29,210 |
| | 17,921 |
|
| Income taxes receivable | 18,663 |
| | 15,665 |
|
| Equity method investments | 16,604 |
| | 13,783 |
|
| Investment in unconsolidated Trusts | 14,296 |
| | 6,933 |
|
| Commercial servicing asset | 9,329 |
| | 575 |
|
| Other | 51,935 |
| | 25,060 |
|
| Total | $ | 232,411 |
| | $ | 111,958 |
|
The Company invests in limited partnerships that operate qualified affordable housing projects to receive tax benefits in the form of tax deductions from operating losses and tax credits. The Company accounts for the investments under the equity method. The Company’sCompany's remaining capital commitments to these partnerships at December 31, 20112014 and 20102013 were approximately $6.9$5.3 million and $1.9$1.4 million, respectively. Such amounts are included in other liabilities on the consolidated balance sheets.Also see
Note 18 for information on the Company’s investment in Trusts and Note 21 for information on the Company’s derivatives.12
NOTE 13. INCOME TAXES– Income Taxes The following table presents the components of income tax expense (benefit) attributable to continuing operations included in theConsolidated Statements of OperationsIncome for the years ended December 31:(in thousands)
| | | | | | | | | | | | |
| | | Current | | | Deferred | | | Total | |
YEAR ENDED DECEMBER 31, 2011: | | | | | | | | | | | | |
Federal | | $ | 29,932 | | | $ | (40 | ) | | $ | 29,892 | |
State | | | 4,810 | | | | 2,040 | | | | 6,850 | |
| | | | |
| | $ | 34,742 | | | $ | 2,000 | | | $ | 36,742 | |
| | | | |
YEAR ENDED DECEMBER 31, 2010: | | | | | | | | | | | | |
Federal | | $ | (1,714 | ) | | $ | 6,364 | | | $ | 4,650 | |
State | | | 3,126 | | | | (1,971 | ) | | | 1,155 | |
| | | | |
| | $ | 1,412 | | | $ | 4,393 | | | $ | 5,805 | |
| | | | |
YEAR ENDED DECEMBER 31, 2009: | | | | | | | | | | | | |
Federal | | $ | (24,339 | ) | | $ | (7,471 | ) | | $ | (31,810 | ) |
State | | | 1,762 | | | | (10,889 | ) | | | (9,127 | ) |
| | | | |
| | $ | (22,577 | ) | | $ | (18,360 | ) | | $ | (40,937 | ) |
| | | | |
|
| | | | | | | | | | | |
| (in thousands) | Current | | Deferred | | Total |
| YEAR ENDED DECEMBER 31, 2014: | | | | | |
| Federal | $ | 125 |
| | $ | 70,673 |
| | $ | 70,798 |
|
| State | 1,045 |
| | 9,453 |
| | 10,498 |
|
| | $ | 1,170 |
| | $ | 80,126 |
| | $ | 81,296 |
|
| YEAR ENDED DECEMBER 31, 2013: | | | | | |
| Federal | $ | 36,733 |
| | $ | 7,459 |
| | $ | 44,192 |
|
| State | 8,187 |
| | 289 |
| | 8,476 |
|
| | $ | 44,920 |
| | $ | 7,748 |
| | $ | 52,668 |
|
| YEAR ENDED DECEMBER 31, 2012: | | | | | |
| Federal | $ | 44,268 |
| | $ | (426 | ) | | $ | 43,842 |
|
| State | 2,632 |
| | 6,847 |
| | 9,479 |
|
| | $ | 46,900 |
| | $ | 6,421 |
| | $ | 53,321 |
|
The following table presents a reconciliation of income taxes computed at the Federal statutory rate to the actual effective rate for the years ended December 31:
| | | | | | | | | | | | |
| | | 2011 | | | 2010 | | | 2009 | |
Statutory Federal income tax rate | | | 35.0% | | | | 35.0% | | | | 35.0% | |
Goodwill impairment | | | — | | | | — | | | | -20.0% | |
State tax, net of Federal income tax | | | 3.8% | | | | 2.5% | | | | 2.9% | |
Tax-exempt income | | | -3.7% | | | | -13.6% | | | | 2.2% | |
Tax credits | | | -1.5% | | | | -5.5% | | | | 1.0% | |
Other | | | -0.6% | | | | -1.4% | | | | -0.1% | |
| | | | |
Effective income tax rate | | | 33.0% | | | | 17.0% | | | | 21.0% | |
| | | | |
|
| | | | | | | | |
| | 2014 | | 2013 | | 2012 |
| Statutory Federal income tax rate | 35.0 | % | | 35.0 | % | | 35.0 | % |
| State tax, net of Federal income tax | 3.5 | % | | 4.4 | % | | 4.4 | % |
| Tax-exempt income | (2.5 | )% | | (3.2 | )% | | (3.0 | )% |
| Tax credits | (0.8 | )% | | (1.8 | )% | | (1.1 | )% |
| Nondeductible merger expenses | 1.2 | % | | 1.0 | % | | 0.1 | % |
| BOLI | (1.6 | )% | | (0.8 | )% | | (0.9 | )% |
| Other | 0.7 | % | | 0.3 | % | | (0.1 | )% |
| Effective income tax rate | 35.5 | % | | 34.9 | % | | 34.4 | % |
The following table reflects the effects of temporary differences that give rise to the components of the net deferred tax (liabilities) assets (recorded in other liabilities or/and other assetsrecorded on the consolidated balance sheets)sheets as of December 31:(in thousands)
| | | | | | | | |
| | | 2011 | | | 2010 | |
DEFERRED TAX ASSETS: | | | | | | | | |
Covered loans | | $ | 38,812 | | | $ | 49,334 | |
Allowance for loan and lease losses | | | 36,221 | | | | 41,084 | |
Accrued severance and deferred compensation | | | 10,976 | | | | 10,690 | |
Tax credits | | | 6,815 | | | | 13,289 | |
Non-covered other real estate owned | | | 6,566 | | | | 3,741 | |
Covered other real estate owned | | | 6,284 | | | | 8,132 | |
Non-covered loans | | | 2,607 | | | | 3,401 | |
Discount on trust preferred securities | | | 2,535 | | | | 2,753 | |
Basis differences of stock and securities | | | 2,335 | | | | 2,998 | |
Net operating loss carryforwards | | | 1,291 | | | | 8,897 | |
Other | | | 9,826 | | | | 7,719 | |
| | | | |
Total gross deferred tax assets | | | 124,268 | | | | 152,038 | |
DEFERRED TAX LIABILITIES: | | | | | | | | |
FDIC indemnification asset | | | 45,817 | | | | 73,719 | |
Unrealized gain on investment securities | | | 22,713 | | | | 16,966 | |
Fair market value adjustment on junior subordinated debentures | | | 20,099 | | | | 20,801 | |
Premises and equipment depreciation | | | 8,789 | | | | 5,581 | |
Mortgage servicing rights | | | 7,058 | | | | 5,782 | |
Deferred loan fees | | | 4,983 | | | | 4,297 | |
Intangibles | | | 4,928 | | | | 5,228 | |
Leased assets | | | 4,251 | | | | 4,879 | |
Other | | | 6,063 | | | | 5,136 | |
| | | | |
Total gross deferred tax liabilities | | | 124,701 | | | | 142,389 | |
| | | | |
Net deferred tax (liabilities) assets | | $ | (433 | ) | | $ | 9,649 | |
| | | | |
|
| | | | | | | |
| (in thousands) | 2014 | | 2013 |
| DEFERRED TAX ASSETS: | | | |
| Net operating loss carryforwards | $ | 197,227 |
| | $ | 37 |
|
| Loan discount | 78,508 |
| | 1,802 |
|
| Allowance for loan and lease losses | 41,133 |
| | 33,665 |
|
| Accrued severance and deferred compensation | 28,216 |
| | 13,442 |
|
| Tax credits | 21,966 |
| | 5,716 |
|
| Non-accrual loans | 13,225 |
| | 5,760 |
|
| Covered loans | 10,949 |
| | 16,788 |
|
| Unrealized loss on investment securities | — |
| | 3,304 |
|
| Accrued bonuses | 7,222 |
| | 4,337 |
|
| Other | 24,876 |
| | 13,547 |
|
| Total gross deferred tax assets | 423,322 |
| | 98,398 |
|
| | | | |
| DEFERRED TAX LIABILITIES: | | | |
| Fair market value adjustment on preferred securities | 50,549 |
| | 18,649 |
|
| Residential mortgage servicing rights | 48,496 |
| | 18,855 |
|
| FHLB Dividends | 16,452 |
| | 1,233 |
|
| Intangibles | 15,074 |
| | 5,633 |
|
| Prepaid expenses | 14,911 |
| | 2,683 |
|
| Unrealized gain on investment securities | 13,546 |
| | — |
|
| Deferred loan fees | 12,091 |
| | 7,525 |
|
| Premises and equipment depreciation | 8,180 |
| | 7,447 |
|
| Other | 11,137 |
| | 19,695 |
|
| Total gross deferred tax liabilities | 190,436 |
| | 81,720 |
|
| | | | |
| Valuation allowance | (3,366 | ) | | (51 | ) |
| | | | |
| Net deferred tax assets | $ | 229,520 |
| | $ | 16,627 |
|
The Company acquired a $276.8 million net deferred tax asset before purchase accounting adjustments in the Merger, including $238.4 million of federal and state NOL and tax credit carry-forwards. The Merger triggered an "ownership change" as defined in Section 382 of the Internal Revenue Service Code ("Section 382"). As a result of being subject to Section 382, the Company will be limited in the amount of NOL carry-forwards that can be used annually to offset future taxable income. The Company believes it is more likely than not that it will be able to fully realize the benefit of its federal NOL carry-forwards. The Company also believes that it is more likely than not that the benefit from certain state NOL and tax credit carry-forwards will not be realized and therefore has provided a valuation allowance of $3.4 million as of December 31, 2014 on the deferred tax assets relating to these state NOL and tax credit carry-forwards. The Company also determined that it is not required to establish a valuation allowance for theon deferred tax assets of $42,000 and $51,000 at December 31, 2014 and 2013, respectively, primarily relating to Canadian net operating losses that may not be able to be utilized in the future. The Company has determined that no other valuation allowance for the remaining deferred tax assets is required as management believes it is more likely than not that the remaining gross deferred tax assets of $124.3$420.0 million and $152.0$98.3 million at December 31, 20112014 and 2010,2013, respectively, will be realized principally through carry-back to taxable income in prior years and future reversals of existing taxable temporary differences. Management further believes that future taxable income will be sufficient to realize the benefits of temporary deductible differences that cannot be realized through carry-back to prior years or through the reversal of future temporary taxable differences.Umpqua Holdings Corporation and Subsidiaries
The tax credits consist
entirely of state tax credits of
$6.8$8.9 million and
$8.9$5.7 million at December 31,
20112014 and
2010,2013, respectively, and
none and $4.3 million of federal low income housing
and alternative minimum tax credits
of $13.0 million and none at December 31,
20112014 and
2010,2013, respectively. The state tax credits
comprised primarily of State of Oregon Business Energy Tax Credits (“BETC”), will be utilized to offset future state income taxes. Most of the state tax credits benefit a five-year period, with an eight-year carry-forward allowed. Federal low income housing credits have a twenty-year carry
forward. Management believes, based uponforward and the
Company’s historical performance, that the deferredalternative minimum tax
assets relating to these tax credits
will be realized in the normal course of operations, and, accordingly, management has not reduced these deferred tax assets by a valuation allowance.The Company has California state net operating loss carry forwards of $1.3 million at both December 31, 2011 and 2010. The California state net operating losses may be carried forward twenty years. Management believes, based upon the Company’s historical performance, that the deferred tax assets relating to federal and state net operating losses will be realized in the normal course of operations, and, accordingly, management has not reduced these deferred tax assets by a valuation allowance.
indefinitely.
The Company and its subsidiaries file income tax returns in the U.S. federal jurisdiction, as well as the Oregonmajority of states and California state jurisdictions. Except for the California amended returns of an acquired institution for the tax years 2001, 2002, and 2003, and only as it relates to the net interest deduction taken on these amended returns, theCanada. The Company is no longer subject to U.S. federal or Oregonand other state tax authorities examinations for years before 2010, except in California for years before 2005 and for Canadian tax authority examinations for years before 2008 and California state tax authority examinations for years before 2004. 2012.
The
Internal Revenue Service concluded an examination of the Company’s U.S. income tax returns for 2006 through 2008 in 2010. The results of these examinations had no significant impact on the Company’s financial statements.In accordance with the provisions of FASB ASC 740,Income Taxes, (“ASC 740”), relating to the accounting for uncertainty in income taxes, the Company periodically reviews its income tax positions based on tax laws and regulations and financial reporting considerations, and records adjustments as appropriate. This review takes into consideration the status of current taxing authorities’authorities' examinations of the Company’sCompany's tax returns, recent positions taken by the taxing authorities on similar transactions, if any, and the overall tax environment.
The Company recorded a reduction in its liability for unrecognized tax benefits relating to California tax incentives and temporary differences in the amount of $39,000 and $1.7 million during 2011 and 2010, respectively.
The Company had gross unrecognized tax benefits recorded as of December 31, 2011 and 2010 in the amounts of $550,000$2.7 million and $589,000,$602,000 recorded as of December 31, 2014 and 2013, respectively. The 2014 amounts includes $2.0 million assumed in the merger. If recognized the unrecognized tax benefit would impactreduce the 20112014 annual effective tax rate by 0.3%1%. During 2011, theThe Company recognized a benefitaccrued $206,000 and $24,000 of $4,000 in interest related to unrecognized tax benefits primarily due to the reductions of its liability for unrecognized tax benefits during 2014 and 2013, respectively. The 2014 amount includes $128,000 assumed in the same period. During 2010, the Company accrued $194,000 of interest related toSterling merger. Interest on unrecognized tax benefits which is reported by the Company as a component as of tax expense. As of December 31, 20112014 and 2010,2013, the accrued interest related to unrecognized tax benefits is $167,000$399,000 and $171,000,$193,000, respectively.
Detailed below is a reconciliation of the Company’sCompany's unrecognized tax benefits, gross of any related tax benefits, for the years ended December 31, 20112014 and 2010,2013, respectively:(in thousands)
| | | | | | | | |
| | | 2011 | | | 2010 | |
Balance, beginning of period | | $ | 589 | | | $ | 2,263 | |
Changes based on tax positions related to prior years | | | — | | | | (1,674 | ) |
Reductions for tax positions of prior years | | | (39 | ) | | | — | |
| | | | |
Balance, end of period | | $ | 550 | | | $ | 589 | |
| | | | |
|
| | | | | | | |
| (in thousands) | 2014 | | 2013 |
| Balance, beginning of period | $ | 602 |
| | $ | 598 |
|
| Effectively settled positions | (86 | ) | | 4 |
|
| Changes for tax positions of current year | 146 |
| | — |
|
| Changes for tax positions of prior years/assumed in merger | 2,009 |
| | — |
|
| Balance, end of period | $ | 2,671 |
| | $ | 602 |
|
NOTE 14. INTEREST BEARING DEPOSITSNote 13– Interest Bearing Deposits
The following table presents the major types of interest bearing deposits at December 31,
20112014 and
2010:(in thousands)
| | | | | | | | |
| | | 2011 | | | 2010 | |
Interest bearing demand | | $ | 993,579 | | | $ | 927,224 | |
Money market | | | 3,661,785 | | | | 3,467,549 | |
Savings | | | 386,528 | | | | 349,696 | |
Time, $100,000 and over | | | 1,629,505 | | | | 2,191,055 | |
Time less than $100,000 | | | 652,172 | | | | 881,594 | |
| | | | |
Total interest bearing deposits | | $ | 7,323,569 | | | $ | 7,817,118 | |
| | | | |
The following table presents interest expense for each deposit type for the years ended2013:
|
| | | | | | | |
| (in thousands) | 2014 | | 2013 |
| Interest bearing demand | $ | 2,054,994 |
| | $ | 1,233,070 |
|
| Money market | 6,113,138 |
| | 3,349,946 |
|
| Savings | 971,185 |
| | 560,699 |
|
| Time, $100,000 and over | 1,765,721 |
| | 1,065,380 |
|
| Time less than $100,000 | 1,242,257 |
| | 472,088 |
|
| Total interest bearing deposits | $ | 12,147,295 |
| | $ | 6,681,183 |
|
As of December 31, 2011, 20102014 and 2009:(in thousands)
| | | | | | | | | | | | |
| | | 2011 | | | 2010 | | | 2009 | |
Interest bearing demand | | $ | 3,056 | | | $ | 4,677 | | | $ | 4,884 | |
Money market | | | 17,236 | | | | 26,412 | | | | 26,885 | |
Savings | | | 356 | | | | 543 | | | | 572 | |
Time, $100,000 and over | | | 25,771 | | | | 31,735 | | | | 36,070 | |
Other time less than $100,000 | | | 9,324 | | | | 12,874 | | | | 20,331 | |
| | | | |
Total interest on deposits | | $ | 55,743 | | | $ | 76,241 | | | $ | 88,742 | |
| | | | |
2013, the Company had time deposits of $859.7 million and $496.3 million, respectively, that meet or exceed the FDIC insurance limit. The following table presents the scheduled maturities of time deposits as of December 31, 2011:
(in thousands)
| | | | |
| Year | | Amount | |
2012 | | $ | 1,589,811 | |
2013 | | | 469,152 | |
2014 | | | 45,831 | |
2015 | | | 37,493 | |
2016 | | | 136,685 | |
Thereafter | | | 2,705 | |
| | | | |
Total time deposits | | $ | 2,281,677 | |
| | | | |
2014:
|
| | | |
| (in thousands) | |
| Year | Amount |
| 2015 | $ | 1,816,344 |
|
| 2016 | 777,978 |
|
| 2017 | 160,559 |
|
| 2018 | 67,849 |
|
| 2019 | 143,826 |
|
| Thereafter | 41,422 |
|
| Total time deposits | $ | 3,007,978 |
|
The following table presents the remaining maturities of time deposits of $100,000 or more as of December 31,
2011:(in thousands)
| | | | |
| Year | | Amount | |
Three months or less | | $ | 493,587 | |
Over three months through six months | | | 192,775 | |
Over six months through twelve months | | | 463,446 | |
Over twelve months | | | 479,697 | |
| | | | |
Time, $100,000 and over | | $ | 1,629,505 | |
| | | | |
Umpqua Holdings Corporation and Subsidiaries
2014:
|
| | | |
| (in thousands) | Amount |
| Three months or less | $ | 384,868 |
|
| Over three months through six months | 331,049 |
|
| Over six months through twelve months | 376,671 |
|
| Over twelve months | 673,133 |
|
| Time, $100,000 and over | $ | 1,765,721 |
|
NOTE 15. SECURITIES SOLD UNDER AGREEMENTS TO REPURCHASENote 14– Securities Sold Under Agreements To Repurchase
The following table presents information regarding securities sold under agreements to repurchase at December 31, 20112014 and 2010:(dollars in thousands)
| | | | | | | | | | | | | | | | |
| | | Repurchase
Amount | | | Weighted
Average
Interest
Rate | | | Carrying
Value of
Underlying
Assets | | | Market
Value of
Underlying
Assets | |
December 31, 2011 | | $ | 124,605 | | | | 0.35% | | | $ | 129,810 | | | $ | 129,810 | |
December 31, 2010 | | $ | 73,759 | | | | 0.66% | | | $ | 75,305 | | | $ | 75,305 | |
|
| | | | | | | | | | | | | | |
| (dollars in thousands) | | | Weighted | | Carrying | | Market |
| | | | Average | | Value of | | Value of |
| | Repurchase | | Interest | | Underlying | | Underlying |
| | Amount | | Rate | | Assets | | Assets |
| December 31, 2014 | $ | 313,321 |
| | 0.04 | % | | $ | 411,569 |
| | $ | 411,569 |
|
| December 31, 2013 | $ | 224,882 |
| | 0.07 | % | | $ | 229,439 |
| | $ | 229,439 |
|
The securities underlying agreements to repurchase entered into by the Bank are for the same securities originally sold, with a one-day maturity. In all cases, the Bank maintains control over the securities. Securities sold under agreements to repurchase averaged approximately $113.1$189.5 million $54.7, $177.9 million, and $60.7$142.4 million for the years ended December 31, 2011, 20102014, 2013 and 2009,2012, respectively. The maximum amount outstanding at any month end for the years ended December 31, 2011, 20102014, 2013 and 20092012, was $148.2$313.3 million $73.8, $233.8 million, and $64.3$166.3 million, respectively. Investment securities are pledged as collateral in an amount equal to or greater than the repurchase agreements.
NOTE 16. FEDERAL FUNDS PURCHASEDNote 15– Federal Funds Purchased
At December 31, 20112014 and 2010,2013, the Company had no outstanding federal funds purchased balances. The Bank had available lines of credit with the FHLB totaling $1.8$4.7 billion at December 31, 2011.2014. The Bank had available lines of credit with the Federal Reserve totaling $448.5$698.8 million subject to certain collateral requirements, namely the amount of certain pledged loans at December 31, 2011.2014. The Bank had uncommitted federal funds line of credit agreements with additional financial institutions totaling $135.0$455.0 million at December 31, 2011.2014. At December 31, 2011,2014, the lines of credit had interest rates ranging from 0.3% to 3.0%1.0%. Availability of the lines is subject to federal funds balances available for loan and continued borrower eligibility and are reviewed and renewed periodically throughout the year. These lines are intended to support short-term liquidity needs, and the agreements may restrict consecutive day usage.
NOTE 17. TERM DEBT16– Term Debt
The Bank had outstanding secured advances from the FHLB and other creditors at December 31, 20112014 and 20102013 with carrying values of $255.7$1.0 billion and $251.5 million, and $262.8 million, respectively. The following table summarizes the future contractual maturities of borrowed funds (excluding the remaining unamortizedas of December 31, 2014: |
| | | | |
| (in thousands) | | |
| Year | Amount | |
| 2015 | $ | 265,000 |
| |
| 2016 | 525,016 |
| |
| 2017 | 155,000 |
| |
| 2018 | 50,000 |
| |
| 2019 | — |
| |
| Thereafter | 5,646 |
| |
| Total borrowed funds | $ | 1,000,662 |
| (1) |
(1) Amount shows contractual borrowings, excluding purchase accounting adjustments relating to the Rainier acquisition of $10.1 million) as of December 31, 2011:(dollars in thousands)
| | | | |
| Year | | Amount | |
2012 | | $ | — | |
2013 | | | — | |
2014 | | | — | |
2015 | | | — | |
2016 | | | 190,016 | |
Thereafter | | | 55,519 | |
| | | | |
Total borrowed funds | | $ | 245,535 | |
| | | | |
adjustments.
The maximum amount outstanding from the FHLB under term advances at month end during 20112014 was $1.1 billion and 2010during 2013 was $250.0 million and $355.2 million, respectively.$245.0 million. The average balance outstanding on FHLB term advances during 20112014 was $842.1 million and 2010during 2013 was $245.8 and $247.5 million, respectively.$245.0 million. The average contractual interest rate on the borrowings (excluding the accretion of purchase accounting adjustments) was 1.6% in 2014 and 4.6% in 2011 and 4.4% in 2010.2013. The FHLB requires the Bank to maintain a required level of investment in FHLB and sufficient collateral to qualify for notes. The Bank has pledged as collateral for these notes all FHLB stock, all funds on deposit with the FHLB, and its investments and commercial real estate portfolios, accounts, general intangibles, equipment and other property in which a security interest can be granted by the Bank to the FHLB.
NOTE 18. JUNIOR SUBORDINATED DEBENTURESNote 17The following– Junior Subordinated Debentures
Following is information about the Company’sCompany's wholly-owned trusts (“Trusts”("Trusts") as of December 31, 2011:(dollars in thousands)
| | | | | | | | | | | | | | | | | | | | | | | | | | | | |
| | | | | | Issued
Amount | | | Carrying
Value (1) | | | Rate (2) | | | Effective
Rate (3) | | | Maturity Date | | | Redemption
Date | |
| Trust Name | | Issue Date | | | | | | | |
AT FAIR VALUE: | | | | | | | | | | | | | | | | | | | | | | | | | | | | |
Umpqua Statutory Trust II | | | October 2002 | | | $ | 20,619 | | | $ | 14,166 | | | | Floating | (4) | | | 5.50% | | | | October 2032 | | | | October 2007 | |
Umpqua Statutory Trust III | | | October 2002 | | | | 30,928 | | | | 21,476 | | | | Floating | (5) | | | 5.62% | | | | November 2032 | | | | November 2007 | |
Umpqua Statutory Trust IV | | | December 2003 | | | | 10,310 | | | | 6,641 | | | | Floating | (6) | | | 5.05% | | | | January 2034 | | | | January 2009 | |
Umpqua Statutory Trust V | | | December 2003 | | | | 10,310 | | | | 6,625 | | | | Floating | (6) | | | 5.31% | | | | March 2034 | | | | March 2009 | |
Umpqua Master Trust I | | | August 2007 | | | | 41,238 | | | | 21,134 | | | | Floating | (7) | | | 3.70% | | | | September 2037 | | | | September 2012 | |
Umpqua Master Trust IB | | | September 2007 | | | | 20,619 | | | | 12,863 | | | | Floating | (8) | | | 5.28% | | | | December 2037 | | | | December 2012 | |
| | | | | | | | | | | | | | | | | | | | | | | | |
| | | | | | | 134,024 | | | | 82,905 | | | | | | | | | | | | | | | | | |
| | | | | | | | | | | | | | | | | | | | | | | | |
AT AMORTIZED COST: | | | | | | | | | | | | | | | | | | | | | | | | | | | | |
HB Capital Trust I | | | March 2000 | | | | 5,310 | | | | 6,329 | | | | 10.875% | | | | 8.24% | | | | March 2030 | | | | March 2010 | |
Humboldt Bancorp Statutory Trust I | | | February 2001 | | | | 5,155 | | | | 5,897 | | | | 10.200% | | | | 8.26% | | | | February 2031 | | | | February 2011 | |
Humboldt Bancorp Statutory Trust II | | | December 2001 | | | | 10,310 | | | | 11,378 | | | | Floating | (9) | | | 3.29% | | | | December 2031 | | | | December 2006 | |
Humboldt Bancorp Staututory Trust III | | | September 2003 | | | | 27,836 | | | | 30,605 | | | | Floating | (10) | | | 2.76% | | | | September 2033 | | | | September 2008 | |
CIB Capital Trust | | | November 2002 | | | | 10,310 | | | | 11,219 | | | | Floating | (5) | | | 3.20% | | | | November 2032 | | | | November 2007 | |
Western Sierra Statutory Trust I | | | July 2001 | | | | 6,186 | | | | 6,186 | | | | Floating | (11) | | | 4.01% | | | | July 2031 | | | | July 2006 | |
Western Sierra Statutory Trust II | | | December 2001 | | | | 10,310 | | | | 10,310 | | | | Floating | (9) | | | 4.15% | | | | December 2031 | | | | December 2006 | |
Western Sierra Statutory Trust III | | | September 2003 | | | | 10,310 | | | | 10,310 | | | | Floating | (12) | | | 3.30% | | | | September 2033 | | | | September 2008 | |
Western Sierra Statutory Trust IV | | | September 2003 | | | | 10,310 | | | | 10,310 | | | | Floating | (12) | | | 3.30% | | | | September 2033 | | | | September 2008 | |
| | | | | | | | | | | | | | | | | | | | | | | | |
| | | | | | | 96,037 | | | | 102,544 | | | | | | | | | | | | | | | | | |
| | | | | | | | | | | | | | | | | | | | | | | | |
| | | Total | | | $ | 230,061 | | | $ | 185,449 | | | | | | | | | | | | | | | | | |
| | | | | | | | | | | | | | | | | | | | | | | | |
|
| | | | | | | | | | | | | | | | |
| (dollars in thousands) | | | | | | | | | | | | |
| Trust Name | | Issue Date | | Issued Amount | | Carrying Value (1) | | Rate (2) | | Effective Rate (3) | | Maturity Date |
| AT FAIR VALUE: | | | | | | | | | | | | |
| Umpqua Statutory Trust II | | October 2002 | | $ | 20,619 |
| | $ | 15,108 |
| | Floating rate, LIBOR plus 3.35%, adjusted quarterly | | 4.89% | | October 2032 |
| Umpqua Statutory Trust III | | October 2002 | | 30,928 |
| | 22,852 |
| | Floating rate, LIBOR plus 3.45%, adjusted quarterly | | 4.98% | | November 2032 |
| Umpqua Statutory Trust IV | | December 2003 | | 10,310 |
| | 7,147 |
| | Floating rate, LIBOR plus 2.85%, adjusted quarterly | | 4.44% | | January 2034 |
| Umpqua Statutory Trust V | | December 2003 | | 10,310 |
| | 7,124 |
| | Floating rate, LIBOR plus 2.85%, adjusted quarterly | | 4.48% | | March 2034 |
| Umpqua Master Trust I | | August 2007 | | 41,238 |
| | 23,480 |
| | Floating rate, LIBOR plus 1.35%, adjusted quarterly | | 2.79% | | September 2037 |
| Umpqua Master Trust IB | | September 2007 | | 20,619 |
| | 13,761 |
| | Floating rate, LIBOR plus 2.75%, adjusted quarterly | | 4.48% | | December 2037 |
| Sterling Capital Trust III | | April 2003 | | 14,433 |
| | 11,121 |
| | Floating rate, LIBOR plus 3.25%, adjusted quarterly | | 4.53% | | April 2033 |
| Sterling Capital Trust IV | | May 2003 | | 10,310 |
| | 7,858 |
| | Floating rate, LIBOR plus 3.15%, adjusted quarterly | | 4.44% | | May 2033 |
| Sterling Capital Statutory Trust V | | May 2003 | | 20,619 |
| | 15,776 |
| | Floating rate, LIBOR plus 3.25%, adjusted quarterly | | 4.55% | | June 2033 |
| Sterling Capital Trust VI | | June 2003 | | 10,310 |
| | 7,836 |
| | Floating rate, LIBOR plus 3.20%, adjusted quarterly | | 4.52% | | September 2033 |
| Sterling Capital Trust VII | | June 2006 | | 56,702 |
| | 33,447 |
| | Floating rate, LIBOR plus 1.53%, adjusted quarterly | | 2.98% | | June 2036 |
| Sterling Capital Trust VIII | | September 2006 | | 51,547 |
| | 30,754 |
| | Floating rate, LIBOR plus 1.63%, adjusted quarterly | | 3.12% | | December 2036 |
| Sterling Capital Trust IX | | July 2007 | | 46,392 |
| | 26,555 |
| | Floating rate, LIBOR plus 1.40%, adjusted quarterly | | 2.86% | | October 2037 |
| Lynnwood Financial Statutory Trust I | | March 2003 | | 9,279 |
| | 7,019 |
| | Floating rate, LIBOR plus 3.15%, adjusted quarterly | | 4.48% | | March 2033 |
| Lynnwood Financial Statutory Trust II | | June 2005 | | 10,310 |
| | 6,407 |
| | Floating rate, LIBOR plus 1.80%, adjusted quarterly | | 3.27% | | June 2035 |
| Klamath First Capital Trust I | | July 2001 | | 15,464 |
| | 13,049 |
| | Floating rate, LIBOR plus 3.75%, adjusted semiannually | | 4.84% | | July 2031 |
| | | | | 379,390 |
| | 249,294 |
| | | | | | |
| AT AMORTIZED COST: | | | | | | | | | | | | |
| HB Capital Trust I | | March 2000 | | 5,310 |
| | 6,161 |
| | 10.875% | | 8.46% | | March 2030 |
| Humboldt Bancorp Statutory Trust I | | February 2001 | | 5,155 |
| | 5,780 |
| | 10.200% | | 8.42% | | February 2031 |
| Humboldt Bancorp Statutory Trust II | | December 2001 | | 10,310 |
| | 11,217 |
| | Floating rate, LIBOR plus 3.60%, adjusted quarterly | | 3.05% | | December 2031 |
| Humboldt Bancorp Statutory Trust III | | September 2003 | | 27,836 |
| | 30,214 |
| | Floating rate, LIBOR plus 2.95%, adjusted quarterly | | 2.51% | | September 2033 |
| CIB Capital Trust | | November 2002 | | 10,310 |
| | 11,088 |
| | Floating rate, LIBOR plus 3.45%, adjusted quarterly | | 3.03% | | November 2032 |
| Western Sierra Statutory Trust I | | July 2001 | | 6,186 |
| | 6,186 |
| | Floating rate, LIBOR plus 3.58%, adjusted quarterly | | 3.82% | | July 2031 |
| Western Sierra Statutory Trust II | | December 2001 | | 10,310 |
| | 10,310 |
| | Floating rate, LIBOR plus 3.60%, adjusted quarterly | | 3.84% | | December 2031 |
| Western Sierra Statutory Trust III | | September 2003 | | 10,310 |
| | 10,310 |
| | Floating rate, LIBOR plus 2.90%, adjusted quarterly | | 3.13% | | September 2033 |
| Western Sierra Statutory Trust IV | | September 2003 | | 10,310 |
| | 10,310 |
| | Floating rate, LIBOR plus 2.90%, adjusted quarterly | | 3.13% | | September 2033 |
| | | | | 96,037 |
| | 101,576 |
| | | | | | |
| | | Total | | $ | 475,427 |
| | $ | 350,870 |
| | | | | | |
| |
| (1) | Includes purchaseacquisition accounting adjustments, net of accumulated amortization, for junior subordinated debentures assumed in connection with previous mergers as well as fair value adjustments related to trusts recorded at fair value. |
| |
| (2) | Contractual interest rate of junior subordinated debentures. |
| |
| (3) | Effective interest rate based upon the carrying value as of December 2011.31, 2014. |
(4) | Rate based on LIBOR plus 3.35%, adjusted quarterly. |
(5) | Rate based on LIBOR plus 3.45%, adjusted quarterly. |
(6) | Rate based on LIBOR plus 2.85%, adjusted quarterly. |
(7) | Rate based on LIBOR plus 1.35%, adjusted quarterly. |
(8) | Rate based on LIBOR plus 2.75%, adjusted quarterly. |
(9) | Rate based on LIBOR plus 3.60%, adjusted quarterly. |
(10) | Rate based on LIBOR plus 2.95%, adjusted quarterly. |
(11) | Rate based on LIBOR plus 3.58%, adjusted quarterly. |
(12) | Rate based on LIBOR plus 2.90%, adjusted quarterly. |
Umpqua Holdings Corporation and Subsidiaries
The Trusts are reflected as junior subordinated debentures in the Consolidated Balance Sheets.Sheets. The common stock issued by the Trusts is recorded in other assets in the Consolidated Balance Sheets, and totaled $6.9$14.3 million and $6.9 million at December 31, 20112014 and 2010, respectively.On January 1, 2007,
$6.9 million at December 31, 2013. As of December 31, 2014, all of the junior subordinated debentures were redeemable at par, at their applicable quarterly or semiannual interest payment dates.
The Company selected the fair value measurement option for junior subordinated debentures originally issued by the Company (the Umpqua Statutory Trusts) and for junior subordinated debentures acquired from Sterling. Refer to Note 23 for discussion of the rational for election of fair value and the approach used to fair value the selected junior subordinated debentures.
Absent changes to the significant inputs utilized in the discounted cash flow model used to measure the fair value of these instruments, the discounts will reverse over time in a manner similar to the effective interest rate method as if these instruments were accounted for under the amortized cost method. Losses recorded resulting from the change in the fair value of these instruments were $5.1 million for the year ended December 31, 2014 and $2.2 million, for the years ended December 31,2013 and 2012, respectively.
Note 18– Employee Benefit Plans
Employee Savings Plan-Substantially all of the Bank's and Umpqua Investments' employees are eligible to participate in the Umpqua Bank 401(k) and Profit Sharing Plan (the "Umpqua 401(k) Plan"), a defined contribution and profit sharing plan sponsored by the Company. Employees may elect to have a portion of their salary contributed to the plan in conformity with Section 401(k) of the Internal Revenue Code. At the discretion of the Company's Board of Directors, the Company may elect to make matching and/or profit sharing contributions to the Umpqua 401(k) Plan based on profits of the Bank. The Company's contributions charged to expense amounted to $5.0 million, $3.8 million, and $3.0 million for the years ended December 31, 2014, 2013 and 2012, respectively.
Supplemental Retirement Plan-The Company has established the Umpqua Holdings Corporation Deferred Compensation & Supplemental Retirement Plan (the "DC/SRP"), a nonqualified deferred compensation plan to help supplement the retirement income of certain pre-existinghighly compensated executives selected by resolution of the Company's Board of Directors. The DC/SRP has two components, a supplemental retirement plan ("SRP") and a deferred compensation plan ("DCP"). The Company may make discretionary contributions to the SRP. For the years ended December 31, 2014, 2013 and 2012, the Company's matching contribution charged to expense for these supplemental plans totaled $140,000, $123,000, and $116,000, respectively. The SRP plan balances at December 31, 2014 and 2013 were $812,000 and $678,000, respectively, and are recorded in other liabilities. Under the DCP, eligible officers may elect to defer up to 50% of their salary into a plan account. The DCP plan balance was $3.9 million and $2.1 million at December 31, 2014 and 2013, respectively.
Salary Continuation Plans-The Bank sponsors various salary continuation plans for the CEO and certain retired employees. These plans are unfunded, and provide for the payment of a specified amount on a monthly basis for a specified period (generally 10 to 20 years) after retirement. In the event of a participant employee's death prior to or during retirement, the Bank is obligated to pay to the designated beneficiary the benefits set forth under the plan. At December 31, 2014 and 2013, liabilities recorded for the estimated present value of future salary continuation plan benefits totaled $42.9 million and $19.0 million, respectively, and are recorded in other liabilities. For the years ended December 31, 2014, 2013 and 2012, expense recorded for the salary continuation plan benefits totaled $2.9 million, $849,000, and $2.5 million, respectively.
Deferred Compensation Plans and Rabbi Trusts-The Bank from time to time adopts deferred compensation plans that provide certain key executives with the option to defer a portion of their compensation. In connection with prior acquisitions, the Bank assumed liability for certain deferred compensation plans for key employees, retired employees and directors. Subsequent to the effective date of the acquisitions, no additional contributions were made to these plans. At December 31, 2014 and 2013, liabilities recorded in connection with deferred compensation plan benefits totaled $5.6 million and $1.9 million, respectively, and are recorded in other liabilities.
The Bank has established and sponsors, for some deferred compensation plans assumed in connection with prior mergers, irrevocable trusts commonly referred to as "Rabbi Trusts." The trust assets (generally cash and trading assets) are consolidated in the Company's balance sheets and the associated liability (which equals the related asset balances) is included in other liabilities. The asset and liability balances related to these trusts as of December 31, 2014 and 2013 were $5.6 million and $3.9 million, respectively.
The Bank has purchased, or acquired through mergers, life insurance policies in connection with the implementation of certain executive supplemental income, salary continuation and deferred compensation retirement plans. These policies provide protection against the adverse financial effects that could result from the death of a key employee and provide tax-exempt income to offset expenses associated with the plans. It is the Bank's intent to hold these policies as a long-term investment. However, there will be an income tax impact if the Bank chooses to surrender certain policies. Although the lives of individual current or former management-level employees are insured, the Bank is the owner and sole or partial beneficiary. At December 31, 2014 and 2013, the cash surrender
value of these policies was $294.3 million and $96.9 million, respectively. At December 31, 2014 and 2013, the Bank also had liabilities for post-retirement benefits payable to other partial beneficiaries under some of these life insurance policies of $6.2 million and $1.8 million, respectively. The Bank is exposed to credit risk to the extent an insurance company is unable to fulfill its financial obligations under a policy. In order to mitigate this risk, the Bank uses a variety of insurance companies and regularly monitors their financial condition.
Note 19 – Commitments and Contingencies
Lease Commitments — The Bank leases 286 sites under non-cancelable operating leases. The leases contain various provisions for increases in rental rates, based either on changes in the published Consumer Price Index or a predetermined escalation schedule. Substantially all of the leases provide the Company with the option to extend the lease term one or more times following expiration of the initial term.
Rent expense for the years ended December 31, 2014, 2013 and 2012 was $33.1 million, $19.1 million, and $17.3 million. Rent expense was offset by rent income for the years ended December 31, 2014, 2013 and 2012 of $512,000, $785,000 and $1.0 million.
The following table sets forth, as of December 31, 2014, the future minimum lease payments under non-cancelable operating leases and future minimum income receivable under non-cancelable operating subleases:
|
| | | | | | | |
| (in thousands) | Lease | | Sublease |
| | Payments | | Income |
| 2015 | $ | 33,344 |
| | $ | 647 |
|
| 2016 | 28,876 |
| | 455 |
|
| 2017 | 24,709 |
| | 254 |
|
| 2018 | 21,170 |
| | 80 |
|
| 2019 | 18,284 |
| | 13 |
|
| Thereafter | 57,720 |
| | 3 |
|
| Total | $ | 184,103 |
| | $ | 1,452 |
|
Financial Instruments with Off-Balance-Sheet Risk — The Company's financial statements do not reflect various commitments and contingent liabilities that arise in the normal course of the Bank's business and involve elements of credit, liquidity, and interest rate risk.
The following table presents a summary of the Bank's commitments and contingent liabilities:
|
| | | |
| (in thousands) | As of December 31, 2014 |
| Commitments to extend credit | $ | 2,942,042 |
|
| Commitments to extend overdrafts | $ | 944,855 |
|
| Forward sales commitments | $ | 400,988 |
|
| Commitments to originate loans held for sale | $ | 213,051 |
|
| Standby letters of credit | $ | 58,463 |
|
The Bank is a party to financial instruments with off-balance-sheet credit risk in the normal course of business to meet the financing needs of its customers. These financial instruments include commitments to extend credit, standby letters of credit and financial guarantees. Those instruments involve elements of credit and interest-rate risk similar to the risk involved in on-balance sheet items recognized in the Consolidated Balance Sheets. The contract or notional amounts of those instruments reflect the extent of the Bank's involvement in particular classes of financial instruments.
The Bank's exposure to credit loss in the event of nonperformance by the other party to the financial instrument for commitments to extend credit and standby letters of credit, and financial guarantees written, is represented by the contractual notional amount of those instruments. The Bank uses the same credit policies in making commitments and conditional obligations as it does for on-balance-sheet instruments.
Commitments to extend credit are agreements to lend to a customer as long as there is no violation of any covenant or condition established in the applicable contract. Commitments generally have fixed expiration dates or other termination clauses and may require payment of a fee. Since many of the commitments are expected to expire without being drawn upon, the total commitment
amounts do not necessarily represent future cash requirements. While most standby letters of credit are not utilized, a significant portion of such utilization is on an immediate payment basis. The Bank evaluates each customer's creditworthiness on a case-by-case basis. The amount of collateral obtained, if it is deemed necessary by the Bank upon extension of credit, is based on management's credit evaluation of the counterparty. Collateral varies but may include cash, accounts receivable, inventory, premises and equipment and income-producing commercial properties.
Standby letters of credit and financial guarantees written are conditional commitments issued by the Bank to guarantee the performance of a customer to a third party. These guarantees are primarily issued to support public and private borrowing arrangements, including international trade finance, commercial paper, bond financing and similar transactions. The credit risk involved in issuing letters of credit is essentially the same as that involved in extending loan facilities to customers. The Bank holds cash, marketable securities, or real estate as collateral supporting those commitments for which collateral is deemed necessary. The Bank was not required to perform on any financial guarantees in connection with standby letters of credit during the year ended December 31, 2014 or December 31, 2013. At December 31, 2014, approximately $49.5 million of standby letters of credit expire within one year, and $9.0 million expire thereafter. Upon issuance, the Bank recognizes a liability equivalent to the amount of fees received from the customer for these standby letter of credit commitments. Fees are recognized ratably over the term of the standby letter of credit. The estimated fair value of guarantees associated with standby letters of credit was $1.4 million as of December 31, 2014.
Residential mortgage loans sold into the secondary market are sold with limited recourse against the Company, meaning that the Company may be obligated to repurchase or otherwise reimburse the investor for incurred losses on any loans that suffer an early payment default, are not underwritten in accordance with investor guidelines or are determined to have pre-closing borrower misrepresentations. As of December 31, 2014, the Company had a residential mortgage loan repurchase reserve liability of $3.4 million.
Legal Proceedings—The Bank owns 483,806 shares of Class B common stock of Visa Inc. which are convertible into Class A common stock at a conversion ratio of 0.4121 per Class A share. As of December 31, 2014, the value of the Class A shares was $262.20 per share. Utilizing the conversion ratio, the value of unredeemed Class A equivalent shares owned by the Bank was $52.3 million as of December 31, 2014, and has not been reflected in the accompanying financial statements. The shares of Visa Inc. Class B common stock are restricted and may not be transferred. Visa member banks are required to fund an escrow account to cover settlements, resolution of pending litigation and related claims. If the funds in the escrow account are insufficient to settle all the covered litigation, Visa Inc. may sell additional Class A shares and use the proceeds to settle litigation, thereby reducing the conversion ratio. If funds remain in the escrow account after all litigation is settled, the Class B conversion ratio will be increased to reflect that surplus.
On July 13, 2012, Visa, Inc. announced that it had entered into a memorandum of understanding obligating it to enter into a settlement agreement to resolve the multi-district interchange litigation brought by the class plaintiffs in the matter styled In re Payment Card Interchange Fee and Merchant Discount Antitrust Litigation, Case No. 5-MD-1720 (JG) (JO) in the U.S. District Court for the Eastern District of New York. The claims originally were brought by a class of U.S. retailers in 2005. The settlement was approved by the Court on December 13, 2013, and Visa's share of the settlement to be paid is estimated at $4.4 billion. However, the December 13, 2013, decision of the Court is currently being appealed, thus the ultimate effect of this settlement on the value of the Bank's Class B common stock is unknown at this time.
In the ordinary course of business, various claims and lawsuits are brought by and against the Company and its subsidiaries, including the Bank and Umpqua Investments. In the opinion of management, there is no pending or threatened proceeding in which an adverse decision could result in a material adverse change in the Company's consolidated financial condition or results of operations.
Concentrations of Credit Risk—The Bank grants real estate mortgage, real estate construction, commercial, agricultural and installment loans and leases to customers throughout Oregon, Washington, California, Idaho, and Nevada. In management's judgment, a concentration exists in real estate-related loans, which representedapproximately 80% and 74%of the Bank's loan and lease portfolio at December 31, 2014 and December 31, 2013. Commercial realestate concentrations are managed toassure wide geographic and business diversity. Although management believes such concentrations have no more than the normal risk of collectability, a substantial decline in the economy in general, material increases in interest rates, changes in tax policies, tightening credit or refinancing markets, or a decline in real estate values in the Bank's primary market areas in particular, could have an adverse impact on the repayment of these loans. Personal and business incomes, proceeds from the sale of real property, or proceeds from refinancing, represent the primary sources of repaymentfor a majority of these loans.
The Bank recognizes the credit risks inherent in dealing with other depository institutions. Accordingly, to prevent excessive exposure to any single correspondent, the Bank has established general standards for selecting correspondent banks as well as internal limits for allowable exposure to any single correspondent. In addition, the Bank has an investment policy that sets forth limitations that apply to all investments with respect to credit rating and concentrations with an issuer.
Note 20– Derivatives
The Bank may use derivatives to hedge the risk of changes in the fair values of interest rate lock commitments, residential mortgage loans held for sale, and residential mortgage servicing rights. None of the Company's derivatives are designated as hedging instruments. Rather, they are accounted for as free-standing derivatives, or economic hedges, with changes in the fair value of the derivatives reported in income. The Company primarily utilizes forward interest rate contracts in its derivative risk management strategy.
The Bank enters into forward delivery contracts to sell residential mortgage loans or mortgage-backed securities to broker/dealers at specific prices and dates in order to hedge the interest rate risk in its portfolio of mortgage loans held for sale and its residential mortgage loan commitments. Credit risk associated with forward contracts is limited to the replacement cost of those forward contracts in a gain position. There were no counterparty default losses on forward contracts in 2014, 2013, and 2012. Market risk with respect to forward contracts arises principally from changes in the value of contractual positions due to changes in interest rates. The Bank limits its exposure to market risk by monitoring differences between commitments to customers and forward contracts with broker/dealers. In the event the Company has forward delivery contract commitments in excess of available mortgage loans, the Company completes the transaction by either paying or receiving a fee to or from the broker/dealer equal to the increase or decrease in the market value of the forward contract. At December 31, 2014, the Bank had commitments to originate mortgage loans held for sale totaling $213.1 million and forward sales commitments of $401.0 million.
The Bank's mortgage banking derivative instruments do not have specific credit risk-related contingent features. The forward sales commitments do have contingent features that may require transferring collateral to the broker/dealers upon their request. However, this amount would be limited to the net unsecured loss exposure at such point in time and would not materially affect the Company's liquidity or results of operations.
The Bank executes interest rate swaps with commercial banking customers to facilitate their respective risk management strategies. Those interest rate swaps are simultaneously hedged by offsetting the interest rate swaps that the Bank executes with a third party, such that the Bank minimizes its net risk exposure. As of December 31, 2014, the Bank had 302 interest rate swaps with an aggregate notional amount of $1.4 billion related to this program. As of December 31, 2013, the Bank had 254 interest rate swaps with an aggregate notional amount of $1.3 billion related to this program.
In connection with the interest rate swap program with commercial customers, the Bank has agreements with its derivative counterparties that contain a provision where if the Bank defaults on any of its indebtedness, including default where repayment of the indebtedness has not been accelerated by the lender, then the Bank could also be declared in default on its derivative obligations. The Bank also has agreements with its derivative counterparties that contain a provision where if the Bank fails to maintain its status as a well/adequately capitalized institution, then the counterparty could terminate the derivative positions and the Bank would be required to settle its obligations under the agreements. Similarly, the Bank could be required to settle its obligations under certain of its agreements if specific regulatory events occur, such as if the Bank were issued a prompt corrective action directive or a cease and desist order, or if certain regulatory ratios fall below specified levels. If the Bank had breached any of these provisions at December 31, 2014, it could have been required to settle its obligations under the agreements at the termination value.
As of December 31, 2014 and 2013, the termination value of derivatives in a net liability position, which includes accrued interest but excludes any adjustment for nonperformance risk, related to these agreements was $29.0 million and $12.1 million, respectively. The Bank has collateral posting requirements for initial or variation margins with its clearing members and clearing houses and has been required to post collateral against its obligations under these agreements of $43.5 million and $13.0 million as of December 31, 2014 and 2013, respectively.
The fair value of the interest rate swaps is determined using the market standard methodology of netting the discounted future fixed cash receipts (or payments) and the discounted expected variable cash payments (or receipts). The variable cash payments (or receipts) are based on the expectation of future interest rates (forward curves) derived from observed market interest rate curves. In addition, to comply with the provisions of ASC 820, the Bank incorporates credit valuation adjustments ("CVA") to appropriately reflect nonperformance risk in the fair value measurements of its derivatives. The CVA is calculated by determining the total expected exposure of the derivatives (which incorporates both the current and potential future exposure) and then applying the counterparties' credit spreads to the exposure. For derivatives with two-way exposure, specifically, the Bank's interest rate swaps, the counterparty's credit spread is applied to the Bank's exposure to the counterparty, and the Bank's own credit spread is applied to the counterparty's exposure to the Bank, and the net CVA is reflected in the Bank's derivative valuations. The total expected exposure of a derivative is derived using market-observable inputs, such as yield curves and volatilities. For the Bank's own credit spread and for counterparties having publicly available credit information, the credit spreads over LIBOR used in the calculations represent implied credit default swap spreads obtained from a third party credit data provider. For counterparties without publicly available credit information, which are primarily commercial banking customers, the credit spreads over LIBOR used in the calculations are estimated by the Bank based
on current market conditions, including consideration of current borrowing spreads for similar customers and transactions, review of existing collateralization or other credit enhancements, and changes in credit sector and entity-specific credit information. In adjusting the fair value of its derivative contracts for the effect of nonperformance risk, the Bank has considered the impact of netting and any applicable credit enhancements. The Company made an accounting policy election to use the exception commonly referred to as the "portfolio exception" with respect to measuring counterparty credit risk for its interest rate swap derivative instruments that are subject to master netting agreements with commercial banking customers that are hedged with offsetting interest rate swaps with third parties.
The following tables summarize the types of derivatives, separately by assets and liabilities and the fair values of such derivatives as of December 31, 2014 and December 31, 2013:
|
| | | | | | | | | | | | | | | | |
| (in thousands) | | Asset Derivatives | | Liability Derivatives |
| Derivatives not designated | | December 31, | | December 31, | | December 31, | | December 31, |
| as hedging instrument | | 2014 | | 2013 | | 2014 | | 2013 |
| Interest rate lock commitments | | $ | 2,867 |
| | $ | 706 |
| | $ | — |
| | $ | — |
|
| Interest rate forward sales commitments | | 16 |
| | 1,250 |
| | 2,627 |
| | 6 |
|
| Interest rate swaps | | 26,327 |
| | 15,965 |
| | 28,158 |
| | 14,556 |
|
| Total | | $ | 29,210 |
| | $ | 17,921 |
| | $ | 30,785 |
| | $ | 14,562 |
|
The following table summarizes the types of derivatives and the gains (losses) recorded during the 2014, 2013, and 2012:
|
| | | | | | | | | | | | |
| (in thousands) | | | | |
| Derivatives not designated | | December 31, |
| as hedging instrument | | 2014 | | 2013 | | 2012 |
| Interest rate lock commitments | | $ | 2,000 |
| | $ | (772 | ) | | $ | (271 | ) |
| Interest rate forward sales commitments | | (23,463 | ) | | 13,225 |
| | (21,281 | ) |
| Interest rate swaps | | (3,232 | ) | | 1,243 |
| | 336 |
|
| Total | | $ | (24,695 | ) | | $ | 13,696 |
| | $ | (21,216 | ) |
The bank incorporates credit valuation adjustment ("CVA") to appropriately reflect nonperformance risk in the fair value measurement of its derivatives. As of December 31, 2014 and 2013, the net CVA increased the settlement values of the Bank's net derivative assets by $1.9 million and $1.4 million, respectively. The gains (losses) above on the interest rate swaps relate to CVAs. Various factors impact changes in the CVA over time, including changes in the credit spreads of the parties to the contracts, as well as changes in market rates and volatilities, which affect the total expected exposure of the derivative instruments.
The following table summarizes the derivatives that have a right of offset as of December 31, 2014 and December 31, 2013:
|
| | | | | | | | | | | | | | | | | | | | | | | | |
| (in thousands) | | | | | | | | Gross Amounts Not Offset in the Statement of Financial Position | | |
| | | Gross Amounts of Recognized Assets/Liabilities | | Gross Amounts Offset in the Statement of Financial Position | | Net Amounts of Assets/Liabilities presented in the Statement of Financial Position | | Financial Instruments | | Collateral Posted | | Net Amount |
| December 31, 2014 | | | | | | | | | | | | |
| Derivative Assets | | | | | | | | | | | | |
| Interest rate swaps | | $ | 26,327 |
| | $ | — |
| | $ | 26,327 |
| | $ | (131 | ) | | $ | — |
| | $ | 26,196 |
|
| Derivative Liabilities | | | | | | | | | | | | |
| Interest rate swaps | | $ | 28,158 |
| | $ | — |
| | $ | 28,158 |
| | $ | (131 | ) | | $ | (28,027 | ) | | $ | — |
|
| | | | | | | | | | | | | |
| December 31, 2013 | | | | | | | | | | | | |
| Derivative Assets | | | | | | | | | | | | |
| Interest rate swaps | | $ | 15,965 |
| | $ | — |
| | $ | 15,965 |
| | $ | (4,852 | ) | | $ | (2,207 | ) | | $ | 8,906 |
|
| Derivative Liabilities | | | | | | | | | | | | |
| Interest rate swaps | | $ | 14,556 |
| | $ | — |
| | $ | 14,556 |
| | $ | (4,852 | ) | | $ | (9,704 | ) | | $ | — |
|
As of December 31, 2014, the Company had $43.5 million of collateral pledged with counterparties, $28.0 million was pledge against interest rate swap derivative liabilities and $15.5 million was held by counterparties as required margin.
Note 21– Stock Compensation and Share Repurchase Plan
On April 18, 2014, the Company completed the Merger with Sterling. The details of the conversion of Sterling common stock, stock options, and restricted stock units are included in Note 2. The conversion resulted in the issuance of 104,385,087 shares of common stock, 994,214 restricted stock units, and 439,921 stock options granted. Additionally, the 2,960,238 outstanding Sterling warrants were converted into warrants exercisable to receive 1.671 shares of Umpqua stock per warrant, with an exercise price of $12.88 as of the merger date. In November 2014, the warrants were net exercised in full for 2,889,896 shares and $6.6 million. As of December 31, 2014, the warrants were no longer outstanding.
At a special meeting on February 25, 2014, the Company's shareholders approved an amendment to the Company's articles of incorporation, effective on April 18, 2014, increasing the number of authorized shares of common stock to 400,000,000.
At the annual meeting on April 16, 2013, shareholders approved the Company's 2013 Incentive Plan (the "2013 Plan"), which,
among other things, authorizes the issuance of equity awards to directors and employees and reserves 4,000,000 shares of the
Company's common stock for issuance under the plan. With the adoption of the 2013 Plan, no additional awards will be issued from the 2003 Stock Incentive Plan or the 2007 Long Term Incentive Plan.
Stock-Based Compensation
The compensation cost related to stock options, restricted stock and restricted stock units (included in salaries and employee benefits) was $12.5 million, $5.0 million and $4.0 million for the years ended December 31, 2014, 2013, and 2012, respectively. The total income tax benefit recognized related to stock-based compensation was $4.8 million, $1.9 million and $1.6 million for the years ended December 31, 2014, 2013, and 2012, respectively. During the year ended December 31, 2014, vesting was accelerated for certain restricted stock units and stock options issued in connection with the Sterling Merger, resulting in $2.8 million of accelerated compensation expense which was recorded in merger related expense.
As of December 31, 2014, there was $320,000 of total unrecognized compensation cost related to nonvested stock options which is expected to be recognized over a weighted-average period of 1.63 years. As of December 31, 2014, there was $10.5 million of total unrecognized compensation cost related to nonvested restricted stock awards which is expected to be recognized over a weighted-average period of 1.25 years. As of December 31, 2014, there was $8.3 million of total unrecognized compensation cost related to nonvested restricted stock units which is expected to be recognized over a weighted-average period of 2.29 years, assuming the current expectation of performance conditions are met.
Stock Options
The following table summarizes information about stock option activity for the years ended December 31, 2014, 2013 and 2012:
|
| | | | | | | | | | | | | | | | | | | | |
| (shares in thousands) | 2014 | | 2013 | | 2012 |
| | | | | | | | | | | | |
| | Options | | Weighted-Avg | | Options | | Weighted-Avg | | Options | | Weighted-Avg |
| | Outstanding | | Exercise Price | | Outstanding | | Exercise Price | | Outstanding | | Exercise Price |
| Balance, beginning of period | 981 |
| | $ | 16.17 |
| | 1,850 |
| | $ | 15.37 |
| | 2,151 |
| | $ | 14.48 |
|
| Granted/assumed | 440 |
| | $ | 12.12 |
| | — |
| | $ | — |
| | 20 |
| | $ | 11.98 |
|
| Exercised | (572 | ) | | $ | 11.93 |
| | (515 | ) | | $ | 12.42 |
| | (174 | ) | | $ | 5.63 |
|
| Forfeited/expired | (42 | ) | | $ | 19.28 |
| | (354 | ) | | $ | 17.46 |
| | (147 | ) | | $ | 13.45 |
|
| Balance, end of period | 807 |
| | $ | 16.80 |
| | 981 |
| | $ | 16.17 |
| | 1,850 |
| | $ | 15.37 |
|
| Options exercisable, end of period | 676 |
| | $ | 17.71 |
| | 627 |
| | $ | 18.86 |
| | 1,263 |
| | $ | 17.11 |
|
| | | | | | | | | | | | |
The following table summarizes information about outstanding stock options issued under all plans as of December 31, 2014:
|
| | | | | | | | | | | | | | | |
| (shares in thousands) | Options Outstanding | | Options Exercisable |
| | | | Weighted Avg. | | | | | | |
| | | | Remaining | | | | | | |
| Range of | Options | | Contractual Life | | Weighted Avg. | | Options | | Weighted Avg. |
| Exercise Prices | Outstanding | | (Years) | | Exercise Price | | Exercisable | | Exercise Price |
| $4.58 to $11.89 | 258 |
| | 5.08 | | $ | 10.96 |
| | 223 |
| | $ | 10.81 |
|
| $11.98 to $15.50 | 240 |
| | 6.34 | | $ | 13.23 |
| | 144 |
| | $ | 13.90 |
|
| $21.22 to $24.71 | 234 |
| | 0.09 | | $ | 23.67 |
| | 234 |
| | $ | 23.67 |
|
| $26.12 to $28.43 | 75 |
| | 1.83 | | $ | 26.89 |
| | 75 |
| | $ | 26.89 |
|
| | 807 |
| | 3.67 | | $ | 16.80 |
| | 676 |
| | $ | 17.71 |
|
The total intrinsic value (which is the amount by which the stock price exceeds the exercise price) of both options outstanding and options exercisable as of December 31, 2014, was $2.5 million for both options outstanding and options exercisable.
The weighted average remaining contractual term of options exercisable was 3.7 years as of December 31, 2014.
The total intrinsic value of options exercised was $3.1 million, $2.3 million, and $1.2 million, in the years ended December 31, 2014, 2013 and 2012, respectively.
During the years ended December 31, 2014, 2013 and 2012, the amount of cash received from the exercise of stock options was $4.6 million, $159,000, and $831,000 and total consideration was $3.1 million, $6.4 million, and $981,000, respectively.
The fair value of each option grant is estimated as of the grant date using the Black-Scholes option-pricing model. In 2014, there were stock options assumed in the Sterling merger, however, no additional stock options were granted. There were no stock options granted in 2013. The following weighted average assumptions were used to determine the fair value at the acquisition date of stock option grants assumed from the Sterling merger during the year ended December 31, 2014 and at grant date for stock option grants for the year ended December 31, 2012:
|
| | | | | | | | | |
| | 2014 | | 2013 | | 2012 |
| Dividend yield | 3.25 | % | | n/a | | 3.90 | % |
| Expected life (years) | 6.8 |
| | n/a | | 7.4 |
|
| Expected volatility | 31 | % | | n/a | | 53 | % |
| Risk-free rate | 0.91 | % | | n/a | | 1.27 | % |
| Weighted average fair value of options on date of grant | $ | 3.22 |
| | n/a | | $ | 4.39 |
|
The above items for 2013 are n/a as no stock options were granted in 2013.
Restricted Shares
The Company grants restricted stock periodically for the benefit of employees and directors. Restricted shares issued prior to 2011 generally vest on an annual basis over five years. Restricted shares issued since 2011 generally vest over a three years period, subject to time or time plus performance vesting conditions. The following table summarizes information about nonvested restricted share activity for the year ended December 31:
|
| | | | | | | | | | | | | | | | | | | | |
| (shares in thousands) | 2014 | | 2013 | | 2012 |
| | | | Weighted | | | | Weighted | | | | Weighted |
| | Restricted | | Average Grant | | Restricted | | Average Grant | | Restricted | | Average Grant |
| | Shares Outstanding | | Date Fair Value | | Shares Outstanding | | Date Fair Value | | Shares Outstanding | | Date Fair Value |
| Balance, beginning of period | 992 |
| | $ | 12.79 |
| | 763 |
| | $ | 12.39 |
| | 585 |
| | $ | 12.98 |
|
| Granted | 839 |
| | $ | 17.33 |
| | 467 |
| | $ | 13.04 |
| | 369 |
| | $ | 11.80 |
|
| Vested/released | (399 | ) | | $ | 12.42 |
| | (153 | ) | | $ | 12.17 |
| | (147 | ) | | $ | 13.50 |
|
| Forfeited/expired | (46 | ) | | $ | 12.99 |
| | (85 | ) | | $ | 11.74 |
| | (44 | ) | | $ | 11.52 |
|
| Balance, end of period | 1,386 |
| | $ | 15.39 |
| | 992 |
| | $ | 12.79 |
| | 763 |
| | $ | 12.39 |
|
The total fair value of restricted shares vested was $7.1 million, $2.0 million, and $1.9 million, for the years ended December 31, 2014, 2013 and 2012, respectively.
Restricted Stock Units
The Company granted restricted stock units as a part of the 2007 Long Term Incentive Plan for the benefit of certain executive officers. Restricted stock unit grants are subject to performance-based vesting as well as other approved vesting conditions. The total number of restricted stock units granted represents the maximum number of restricted stock units eligible to vest based upon the performance and service conditions set forth in the grant agreements.
The following table summarizes information about nonvested restricted shares outstanding at December 31:
|
| | | | | | | | | | | | | | | | | | | | |
| (shares in thousands) | 2014 | | 2013 | | 2012 |
| | | | Weighted | | | | Weighted | | | | Weighted |
| | Restricted | | Average | | Restricted | | Average | | Restricted | | Average |
| | Stock Units | | Grant Date | | Stock Units | | Grant Date | | Stock Units | | Grant Date |
| | Outstanding | | Fair Value | | Outstanding | | Fair Value | | Outstanding | | Fair Value |
| Balance, beginning of period | 95 |
| | $ | 10.41 |
| | 130 |
| | $ | 10.41 |
| | 219 |
| | $ | 9.17 |
|
| Assumed | 994 |
| | $ | 18.58 |
| | — |
| | $ | — |
| | 25 |
| | $ | 10.39 |
|
| Released | (342 | ) | | $ | 16.91 |
| | — |
| | $ | — |
| | — |
| | $ | — |
|
| Forfeited/expired | (72 | ) | | $ | 18.58 |
| | (35 | ) | | $ | 10.42 |
| | (114 | ) | | $ | 8.01 |
|
| Balance, end of period | 675 |
| | $ | 18.03 |
| | 95 |
| | $ | 10.41 |
| | 130 |
| | $ | 10.41 |
|
The total fair value of restricted stock units vested and released was $4.8 million for the year ended December 31, 2014 and none for the years ended December 31, 2013 and 2012.
For the years ended December 31, 2014, 2013 and 2012, the Company received income tax benefits of $6.3 million, $1.7 million, and $1.2 million, respectively, related to the exercise of non-qualified employee stock options, disqualifying dispositions in the exercise of incentive stock options, the vesting of restricted shares and the vesting of restricted stock units.
For the years ended December 31, 2014, 2013 and 2012, the Company had a net tax benefit of $1.2 million and $148,000 and net tax deficiencies (tax deficiency resulting from tax deductions less than the compensation cost recognized) of $59,000, respectively. Only cash flows from gross excess tax benefits are classified as financing cash flows.
Share Repurchase Plan- The Company's share repurchase plan, which was first approved by the Board and announced in August 2003, was amended on September 29, 2011 to increase the number of common shares available for repurchase under the plan to 15 million shares. In April 2013, the repurchase program was extended to run through June 2015. As of December 31, 2014, a total of 12.0 million shares remained available for repurchase. The Company did not repurchase any shares under the repurchase plan in 2014, and repurchased 98,027 shares under the repurchase plan in 2013, and 512,280 shares under the repurchase plan in 2012. The timing and amount of future repurchases will depend upon the market price for our common stock, securities laws restricting repurchases, asset growth, earnings, and our capital plan.
We also have certain stock option and restricted stock plans which provide for the payment of the option exercise price or withholding taxes by tendering previously owned or recently vested shares. During the years ended December 31, 2014 and 2013, there were 161,568 and 438,136 shares tendered in connection with option exercises, respectively. Restricted shares cancelled to pay withholding taxes totaled 107,131 and 48,514 shares during the years ended December 31, 2014 and 2013, respectively. There were 129,766 restricted stock units cancelled to pay withholding taxes for the years ended December 31, 2014 and none in 2013.
Note 22– Regulatory Capital
The Company is subject to various regulatory capital requirements administered by the federal banking agencies. Failure to meet minimum capital requirements can initiate certain mandatory and possible additional discretionary actions by regulators that, if undertaken, could have a material effect on the Company's financial statements. Under capital adequacy guidelines, the Company must meet specific capital guidelines that involve quantitative measures of the Company's assets, liabilities, and certain off balance sheet items as calculated under regulatory accounting practices. The Company's capital amounts and classifications are also subject to qualitative judgments by the regulators about risk components, asset risk weighting, and other factors.
Quantitative measures established by regulation to ensure capital adequacy require the Company to maintain minimum amounts and ratios (set forth in the table below) of total and Tier 1 capital to risk-weighted assets (as defined in the regulations), and of Tier 1 capital to average assets (as defined in the regulations). Management believes, as of December 31, 2014, that the Company meets all capital adequacy requirements to which it is subject.
The Company's capital amounts and ratios as of December 31, 2014 and December 31, 2013 are presented in the following table: |
| | | | | | | | | | | | | | | | | | | | |
| (dollars in thousands) | | | | | For Capital | | To be Well |
| | Actual | | Adequacy purposes | | Capitalized |
| | Amount | | Ratio | | Amount | | Ratio | | Amount | | Ratio |
| As of December 31, 2014 | | | | | | | | | | | |
| Total Capital | | | | | | | | | | | |
| (to Risk Weighted Assets) | | | | | | | | | | | |
| Consolidated | $ | 2,391,267 |
| | 15.20 | % | | $ | 1,258,198 |
| | 8.00 | % | | $ | 1,572,747 |
| | 10.00 | % |
| Umpqua Bank | $ | 2,181,776 |
| | 13.90 | % | | $ | 1,255,819 |
| | 8.00 | % | | $ | 1,569,774 |
| | 10.00 | % |
| Tier 1 Capital | | | | | | | | | | | |
| (to Risk Weighted Assets) | | | | | | | | | | | |
| Consolidated | $ | 2,271,563 |
| | 14.44 | % | | $ | 629,099 |
| | 4.00 | % | | $ | 943,648 |
| | 6.00 | % |
| Umpqua Bank | $ | 2,062,151 |
| | 13.14 | % | | $ | 627,910 |
| | 4.00 | % | | $ | 941,864 |
| | 6.00 | % |
| Tier 1 Capital | | | | | | | | | | | |
| (to Average Assets) | | | | | | | | | | | |
| Consolidated | $ | 2,271,563 |
| | 10.99 | % | | $ | 827,128 |
| | 4.00 | % | | $ | 1,033,910 |
| | 5.00 | % |
| Umpqua Bank | $ | 2,062,151 |
| | 9.96 | % | | $ | 828,061 |
| | 4.00 | % | | $ | 1,035,076 |
| | 5.00 | % |
| As of December 31, 2013 | | | | | | | | | | | |
| Total Capital | | | | | | | | | | | |
| (to Risk Weighted Assets) | | | | | | | | | | | |
| Consolidated | $ | 1,279,586 |
| | 14.66 | % | | $ | 698,273 |
| | 8.00 | % | | $ | 872,842 |
| | 10.00 | % |
| Umpqua Bank | $ | 1,177,782 |
| | 13.51 | % | | $ | 697,428 |
| | 8.00 | % | | $ | 871,785 |
| | 10.00 | % |
| Tier 1 Capital | | | | | | | | | | | |
| (to Risk Weighted Assets) | | | | | | | | | | | |
| Consolidated | $ | 1,183,061 |
| | 13.56 | % | | $ | 348,986 |
| | 4.00 | % | | $ | 523,478 |
| | 6.00 | % |
| Umpqua Bank | $ | 1,081,282 |
| | 12.40 | % | | $ | 348,801 |
| | 4.00 | % | | $ | 523,201 |
| | 6.00 | % |
| Tier 1 Capital | | | | | | | | | | | |
| (to Average Assets) | | | | | | | | | | | |
| Consolidated | $ | 1,183,061 |
| | 10.90 | % | | $ | 434,151 |
| | 4.00 | % | | $ | 542,689 |
| | 5.00 | % |
| Umpqua Bank | $ | 1,081,282 |
| | 9.97 | % | | $ | 433,814 |
| | 4.00 | % | | $ | 542,268 |
| | 5.00 | % |
The Company is a registered financial holding company under the Gramm-Leach-Bliley Act of 1999 (the "GLB Act"), and is subject to the supervision of, and regulation by, the Board of Governors of the Federal Reserve System (the "Federal Reserve"). The Bank is an Oregon state chartered bank with deposits insured by the Federal Deposit Insurance Corporation ("FDIC"), and is subject to the supervision and regulation of the FDIC and the Director of the Oregon Department of Consumer and Business Services, administered through the Division of Finance and Corporate Securities, as well as to the supervision and regulation of the California, Washington, Idaho, and Nevada banking regulators. As of December 31, 2014 , the most recent notification from the FDIC categorized the Bank as "well-capitalized" under the regulatory framework for prompt corrective action. There are no conditions or events since that notification that management believes have changed the Bank's regulatory capital category.
On July 2, 2013, the federal banking regulators approved the final proposed rules that revise the regulatory capital rules to incorporate certain revisions by the Basel Committee on Banking Supervision to the Basel capital framework ("Basel III"). The phase-in period for the final rules will begin for the Company on January 1, 2015, with full compliance with the final rules entire requirement phased in on January 1, 2019.
The final rules, among other things, include a new common equity Tier 1 capital ("CET1") to risk-weighted assets ratio, including a capital conservation buffer, which will gradually increase from 4.5% on January 1, 2015 to 7.0% on January 1, 2019. The final rules also raise the minimum ratio of Tier 1 capital to risk-weighted assets from 4.0% to 6.0% on January 1, 2015 to 8.5% on January 1, 2019, as well as require a minimum leverage ratio of 4.0%.
Under the final rule, consistent with Section 171 of the Dodd-Frank Act, bank holding companies with less than $15 billion assets as of December 31, 2009 will be grandfathered and may continue to include these instruments in Tier 1 capital, subject to certain
restrictions. However, if an institution grows above $15 billion as a result of an acquisition (including our closed merger with Sterling), the combined trust preferred issuances must be phased out of Tier 1 and into Tier 2 capital (75% in 2015 and 100% in 2016). It is possible the Company may accelerate redemption of the existing junior subordinated debentures. This could result in adjustments to the carrying value of these instruments, including the acceleration of losses on junior subordinated debentures carried at fair value within non-interest income. The Company currently does not intend to redeem the junior subordinated debentures in order to support regulatory total capital levels.
The final rules also provide for a number of adjustments to and deductions from the new CET1. Under current capital standards, the effects of accumulated other comprehensive income items included in capital are excluded for the purposes of determining regulatory capital ratios. Under Basel III, the effects of certain accumulated other comprehensive items are not excluded; however, non-advanced approaches banking organizations, including the Company and the Bank, may make a one-time permanent election to continue to exclude these items. The Company and Bank expect to make this election in order to avoid significant variations in the level of capital depending upon the impact of interest rate fluctuations on the fair value of the Company's securities portfolio. In addition, deductions include, for example, the requirement that mortgage servicing rights, certain deferred tax assets not dependent upon future taxable income and significant investments in non-consolidated financial entities be deducted from CET1 to the extent that any one such category exceeds 10% of CET1 or all such categories in the aggregate exceed 15% of CET1. The Company and the Bank are currently evaluating the provisions of the final rules and expected impact.
Note 23– Fair Value Measurement
The following table presents estimated fair values of the Company's financial instruments as of December 31, 2014 and December 31, 2013, whether or not recognized or recorded at fair value in the Consolidated Balance Sheets:
|
| | | | | | | | | | | | | | | | | |
| (in thousands) | | | December 31, 2014 | | December 31, 2013 |
| | | | Carrying | | Fair | | Carrying | | Fair |
| | Level | | Value | | Value | | Value | | Value |
| FINANCIAL ASSETS: | | | | | | | | | |
| Cash and cash equivalents | 1 | | $ | 1,605,171 |
| | $ | 1,605,171 |
| | $ | 790,423 |
| | $ | 790,423 |
|
| Trading securities | 1,2 | | 9,999 |
| | 9,999 |
| | 5,958 |
| | 5,958 |
|
| Investment securities available for sale | 2 | | 2,298,555 |
| | 2,298,555 |
| | 1,790,978 |
| | 1,790,978 |
|
| Investment securities held to maturity | 3 | | 5,211 |
| | 5,554 |
| | 5,563 |
| | 5,874 |
|
| Loans held for sale, at fair value | 2 | | 286,802 |
| | 286,802 |
| | 104,664 |
| | 104,664 |
|
| Loans and leases, net | 3 | | 15,211,565 |
| | 15,252,083 |
| | 7,633,081 |
| | 7,660,151 |
|
| Restricted equity securities | 1 | | 119,334 |
| | 119,334 |
| | 30,685 |
| | 30,685 |
|
| Residential mortgage servicing rights | 3 | | 117,259 |
| | 117,259 |
| | 47,765 |
| | 47,765 |
|
| Bank owned life insurance assets | 1 | | 294,296 |
| | 294,296 |
| | 96,938 |
| | 96,938 |
|
| FDIC indemnification asset | 3 | | 4,417 |
| | 2,058 |
| | 23,174 |
| | 6,001 |
|
| Derivatives | 2,3 | | 29,210 |
| | 29,210 |
| | 17,921 |
| | 17,921 |
|
| Visa Class B common stock | 3 | | — |
| | 49,663 |
| | — |
| | 41,700 |
|
| FINANCIAL LIABILITIES: | | | | | | | | | |
| Deposits | 1,2 | | $ | 16,892,099 |
| | $ | 16,893,890 |
| | $ | 9,117,660 |
| | $ | 9,125,832 |
|
| Securities sold under agreements to repurchase | 2 | | 313,321 |
| | 313,321 |
| | 224,882 |
| | 224,882 |
|
| Term debt | 2 | | 1,006,395 |
| | 1,018,948 |
| | 251,494 |
| | 270,004 |
|
| Junior subordinated debentures, at fair value | 3 | | 249,294 |
| | 249,294 |
| | 87,274 |
| | 87,274 |
|
| Junior subordinated debentures, at amortized cost | 3 | | 101,576 |
| | 73,840 |
| | 101,899 |
| | 72,009 |
|
| Derivatives | 2 | | 30,785 |
| | 30,785 |
| | 14,562 |
| | 14,562 |
|
Fair Value of Assets and Liabilities Measured on a Recurring Basis
The following tables present information about the Company's assets and liabilities measured at fair value on a recurring basis as of December 31, 2014 and December 31, 2013:
|
| | | | | | | | | | | | | | | |
| (in thousands) | December 31, 2014 |
| Description | Total | | Level 1 | | Level 2 | | Level 3 |
| Trading securities | | | | | | | |
| Obligations of states and political subdivisions | $ | 124 |
| | $ | — |
| | $ | 124 |
| | $ | — |
|
| Equity securities | 5,283 |
| | 5,283 |
| | — |
| | — |
|
Other investments securities(1) | 4,592 |
| | — |
| | 4,592 |
| | — |
|
| Investment securities available for sale | | | | | | | |
| U.S. Treasury and agencies | 229 |
| | — |
| | 229 |
| | — |
|
| Obligations of states and political subdivisions | 338,404 |
| | — |
| | 338,404 |
| | — |
|
| Residential mortgage-backed securities and | | | | | | | |
| collateralized mortgage obligations | 1,957,852 |
| | — |
| | 1,957,852 |
| | — |
|
| Investments in mutual funds and other equity securities | 2,070 |
| | — |
| | 2,070 |
| | — |
|
| Loans held for sale, at fair value | 286,802 |
| | | | 286,802 |
| | |
| Residential mortgage servicing rights, at fair value | 117,259 |
| | — |
| | — |
| | 117,259 |
|
| Derivatives | | | | | | | |
| Interest rate lock commitments | 2,867 |
| | — |
| | — |
| | 2,867 |
|
| Interest rate forward sales commitments | 16 |
| | — |
| | 16 |
| | — |
|
| Interest rate swaps | 26,327 |
| | — |
| | 26,327 |
| | — |
|
| Total assets measured at fair value | $ | 2,741,825 |
| | $ | 5,283 |
| | $ | 2,616,416 |
| | $ | 120,126 |
|
| Junior subordinated debentures, at fair value | $ | 249,294 |
| | $ | — |
| | $ | — |
| | $ | 249,294 |
|
| Derivatives | | | | | | | |
| Interest rate forward sales commitments | 2,627 |
| | — |
| | 2,627 |
| | — |
|
| Interest rate swaps | 28,158 |
| | — |
| | 28,158 |
| | — |
|
| Total liabilities measured at fair value | $ | 280,079 |
| | $ | — |
| | $ | 30,785 |
| | $ | 249,294 |
|
|
| | | | | | | | | | | | | | | |
(in thousands) | December 31, 2013 |
| Description | Total | | Level 1 | | Level 2 | | Level 3 |
| Trading securities | | | | | | | |
| Obligations of states and political subdivisions | $ | 2,366 |
| | $ | — |
| | $ | 2,366 |
| | $ | — |
|
| Equity securities | 3,498 |
| | 3,498 |
| | — |
| | — |
|
Other investments securities(1) | 94 |
| | — |
| | 94 |
| | — |
|
| Investment securities available for sale | | | | | | | |
| U.S. Treasury and agencies | 268 |
| | — |
| | 268 |
| | — |
|
| Obligations of states and political subdivisions | 235,205 |
| | — |
| | 235,205 |
| | — |
|
| Residential mortgage-backed securities and | | | | | | | |
| collateralized mortgage obligations | 1,553,541 |
| | — |
| | 1,553,541 |
| | — |
|
| Investments in mutual funds and other equity securities | 1,964 |
| | — |
| | 1,964 |
| | — |
|
| Loans held for sale, at fair value | 104,664 |
| | | | 104,664 |
| | |
| Residential mortgage servicing rights, at fair value | 47,765 |
| | — |
| | — |
| | 47,765 |
|
| Derivatives | | | | | | | |
| Interest rate lock commitments | 706 |
| | — |
| | — |
| | 706 |
|
| Interest rate forward sales commitments | 1,250 |
| | — |
| | 1,250 |
| | — |
|
| Interest rate swaps | 15,965 |
| | — |
| | 15,965 |
| | — |
|
| Total assets measured at fair value | $ | 1,967,286 |
| | $ | 3,498 |
| | $ | 1,915,317 |
| | $ | 48,471 |
|
| Junior subordinated debentures, at fair value | $ | 87,274 |
| | $ | — |
| | $ | — |
| | $ | 87,274 |
|
| Derivatives | | | | | | | |
| Interest rate forward sales commitments | 6 |
| | — |
| | 6 |
| | — |
|
| Interest rate swaps | 14,556 |
| | — |
| | 14,556 |
| | — |
|
| Total liabilities measured at fair value | $ | 101,836 |
| | $ | — |
| | $ | 14,562 |
| | $ | 87,274 |
|
| |
| (1) | Principally represents U.S. Treasury and agencies or residential mortgage-backed securities issued or guaranteed by governmental agencies. |
The following methods were used to estimate the fair value of each class of financial instrument above:
Cash and Cash Equivalents - For short-term instruments, including cash and due from banks, and interest bearing deposits with banks, the carrying amount is a reasonable estimate of fair value.
Securities - Fair values for investment securities are based on quoted market prices when available or through the use of alternative approaches, such as matrix or model pricing, or broker indicative bids, when market quotes are not readily accessible or available. Management periodically reviews the pricing information received from the third-party pricing service and compares it to secondary pricing service, evaluating significant price variances between services to determine an appropriate estimate of fair value to report.
Loans Held for Sale - Fair value is determined based on quoted secondary market prices for similar loans, including the implicit fair value of embedded servicing rights.
Loans and Leases - Fair values are estimated for portfolios of loans with similar financial characteristics. Loans are segregated by type, including commercial, real estate and consumer loans. Each loan category is further segregated by fixed and adjustable rate loans. The fair value of loans is calculated by discounting expected cash flows at rates which similar loans are currently being made. These amounts are discounted further by embedded probable losses expected to be realized in the portfolio.
Restricted Equity Securities - The carrying value of restricted equity securities approximates fair value as the shares can only be redeemed by the issuing institution at par.
Residential Mortgage Servicing Rights- The fair value of MSR is estimated using a discounted cash flow model. Assumptions used include market discount rates, anticipated prepayment speeds, delinquency and foreclosure rates, and ancillary fee income net of servicing costs. This model is periodically validated by an independent external model validation group. The model assumptions and the MSR fair value estimates are also compared to observable trades of similar portfolios as well as to MSR broker valuations and
industry surveys, as available. Management believes the significant inputs utilized are indicative of those that would be used by market participants.
Bank Owned Life Insurance Assets - Fair values of insurance policies owned are based on the insurance contract's cash surrender value.
FDIC Indemnification Asset - The FDIC indemnification asset is calculated as the expected future cash flows under the loss-share agreement discounted by a rate reflective of the creditworthiness of the FDIC as would be required from the market.
Visa Class B Common Stock - The fair value of Visa Class B common stock is estimated by applying a 5% discount to the value of the unredeemed Class A equivalent shares. The discount primarily represents the risk related to the further potential reduction of the conversion ratio between Class B and Class A shares and a liquidity risk premium.
Deposits - The fair value of deposits with no stated maturity, such as non-interest bearing deposits, savings and interest checking accounts, and money market accounts, is equal to the amount payable on demand. The fair value of certificates of deposit is based on the discounted value of contractual cash flows. The discount rate is estimated using the rates currently offered for deposits of similar remaining maturities.
Securities Sold under Agreements to Repurchase - For short-term instruments, including securities sold under agreements to repurchase and federal funds purchased, the carrying amount is a reasonable estimate of fair value.
Term Debt - The fair value of medium term notes is calculated based on the discounted value of the contractual cash flows using current rates at which such borrowings can currently be obtained.
Junior Subordinated Debentures - The fair value of junior subordinated debentures is estimated using an income approach valuation technique. The significant inputs utilized in the estimation of fair value of these instruments are the credit risk adjusted spread and three month LIBOR. The credit risk adjusted spread represents the nonperformance risk of the liability, contemplating the inherent risk of the obligation. The Company periodically utilizes an external valuation firm to determine or validate the reasonableness of inputs and factors that are used to determine the fair value. The ending carrying (fair) value of the junior subordinated debentures measured at fair value represents the estimated amount that would be paid to transfer these liabilities in an orderly transaction amongst market participants. Due to credit concerns in the capital markets and inactivity in the trust preferred markets that have limited the observability of market spreads, we have classified this as a Level 3 fair value measure.
Derivative Instruments - The fair value of the interest rate lock commitments and forward sales commitments are estimated using quoted or published market prices for similar instruments, adjusted for factors such as pull-through rate assumptions based on historical information, where appropriate. The pull-through rate assumptions are considered Level 3 valuation inputs and are significant to the interest rate lock commitment valuation; as such, the interest rate lock commitment derivatives are classified as Level 3. The fair value of the interest rate swaps is determined using a discounted cash flow technique incorporating credit valuation adjustments to reflect nonperformance risk in the measurement of fair value. Although the Bank has determined that the majority of the inputs used to value its interest rate swap derivatives fall within Level 2 of the fair value hierarchy, the CVA associated with its derivatives utilize Level 3 inputs, such as estimates of current credit spreads to evaluate the likelihood of default by itself and its counterparties. However, as of December 31, 2014, the Bank has assessed the significance of the impact of the CVA on the overall valuation of its interest rate swap positions and has determined that the CVA are not significant to the overall valuation of its interest rate swap derivatives. As a result, the Bank has classified its interest rate swap derivative valuations in Level 2 of the fair value hierarchy.
Assets and Liabilities Measured at Fair Value Using Significant Unobservable Inputs (Level 3)
The following table provides a description of the valuation technique, significant unobservable input, and qualitative information about the unobservable inputs for the Company's assets and liabilities classified as Level 3 and measured at fair value on a recurring basis at December 31, 2014:
|
| | | | | | |
| Financial Instrument | | Valuation Technique | | Unobservable Input | | Weighted Average (Range) |
| Residential mortgage servicing rights | | Discounted cash flow | | | | |
| | | | Constant Prepayment Rate | | 12.39% |
| | | | Discount Rate | | 9.17% |
| Interest rate lock commitment | | Internal Pricing Model | | | | |
| | | | Pull-through rate | | 83.9% |
| Junior subordinated debentures | | Discounted cash flow | | | | |
| | | | Credit Spread | | 6.18% |
Generally, any significant increases in the constant prepayment rate and discount rate utilized in the fair value measurement of the residential mortgage servicing rights will result in negative fair value adjustments (and a decrease in the fair value measurement). Conversely, a decrease in the constant prepayment rate and discount rate will result in a positive fair value adjustment (and increase in the fair value measurement).
An increase in the pull-through rate utilized in the fair value measurement of the interest rate lock commitment derivative will result in positive fair value adjustments (and an increase in the fair value measurement.) Conversely, a decrease in the pull-through rate will result in a negative fair value adjustment (and a decrease in the fair value measurement.)
Management believes that the credit risk adjusted spread utilized in the fair value measurement of the junior subordinated debentures carried at fair value is indicative of the nonperformance risk premium a willing market participant would require under current market conditions, that is, the inactive market. Management attributes the change in fair value of the junior subordinated debentures during the period to market changes in the nonperformance expectations and pricing of this type of debt, and not as a result of changes to our entity-specific credit risk. The widening of the credit risk adjusted spread above the Company's contractual spreads has primarily contributed to the positive fair value adjustments. Future contractions in the credit risk adjusted spread relative to the spread currently utilized to measure the Company's junior subordinated debentures at fair value as of December 31, 2014, or the passage of time, will result in negative fair value adjustments. Generally, an increase in the credit risk adjusted spread and/or a decrease in the three month LIBOR swap curve will result in positive fair value adjustments (and decrease the fair value measurement). Conversely, a decrease in the credit risk adjusted spread and/or an increase in the three month LIBOR swap curve will result in negative fair value adjustments (and increase the fair value measurement).
The following table provides a reconciliation of assets and liabilities measured at fair value using significant unobservable inputs (Level 3) on a recurring basis during the years ended December 31, 2014 and 2013.
|
| | | | | | | | | | | | | | | | | | | | | | | | |
(in thousands) | | Beginning Balance | | Change included in earnings | | Purchases and issuances | | Sales and settlements | | Ending
Balance | | Net change in
unrealized gains
or (losses) relating
to items held at
end of period |
| 2014 | | | | | | | | | | | | |
| Residential mortgage servicing rights, at fair value | | $ | 47,765 |
| | $ | (16,587 | ) | | $ | 86,081 |
| | $ | — |
| | $ | 117,259 |
| | $ | (13,430 | ) |
| Interest rate lock commitment | | 706 |
| | (3,716 | ) | | 28,350 |
| | (22,473 | ) | | 2,867 |
| | 2,867 |
|
| Junior subordinated debentures, at fair value | | 87,274 |
| | 12,303 |
| | 156,840 |
| | (7,123 | ) | | 249,294 |
| | 12,303 |
|
| | | | | | | | | | | | | |
| 2013 | | |
| | |
| | |
| | |
| | |
| | |
|
| Residential mortgage servicing rights, at fair value | | $ | 27,428 |
| | $ | 2,374 |
| | $ | 17,963 |
| | $ | — |
| | $ | 47,765 |
| | $ | (2,376 | ) |
| Interest rate lock commitment | | 1,478 |
| | (1,478 | ) | | 62,560 |
| | (61,854 | ) | | 706 |
| | 706 |
|
| Junior subordinated debentures, at fair value | | 85,081 |
| | 6,090 |
| | — |
| | (3,897 | ) | | 87,274 |
| | 6,090 |
|
Gains (losses) on residential MSR carried at fair value are recorded in residential mortgage banking revenue within other non-interest income. Gains (losses) on interest rate lock commitments carried at fair value are recorded in residential mortgage banking revenue within other non-interest income. Gains (losses) on junior subordinated debentures carried at fair value are recorded within other non-interest income. The contractual interest expense on the junior subordinated debentures is recorded on an accrual basis as interest on junior subordinated debentures within interest expense. Settlements related to the junior subordinated debentures represent the payment of accrued interest that is embedded in the fair value of these liabilities.
Additionally, from time to time, certain assets are measured at fair value on a nonrecurring basis. These adjustments to fair value generally result from the application of lower-of-cost-or-market accounting or write-downs of individual assets due to impairment.
Fair Value of Assets and Liabilities Measured at Fair Value on a Nonrecurring Basis
The following table presents information about the Company's assets and liabilities measured at fair value on a nonrecurring basis for which a nonrecurring change in fair value has been recorded during the reporting period. The amounts disclosed below represent the fair values at the time the nonrecurring fair value measurements were made, and not necessarily the fair value as of the dates reported upon. |
| | | | | | | | | | | | | | | |
| (in thousands) | December 31, 2014 |
| | Total | | Level 1 | | Level 2 | | Level 3 |
| Loans and leases | $ | 14,720 |
| | $ | — |
| | $ | — |
| | $ | 14,720 |
|
| Other real estate owned | 12,741 |
| | — |
| | — |
| | 12,741 |
|
| | $ | 27,461 |
| | $ | — |
| | $ | — |
| | $ | 27,461 |
|
|
| | | | | | | | | | | | | | | |
| (in thousands) | December 31, 2013 |
| | Total | | Level 1 | | Level 2 | | Level 3 |
| Loans and leases | $ | 20,421 |
| | $ | — |
| | $ | — |
| | $ | 20,421 |
|
| Other real estate owned | 4,756 |
| | — |
| | — |
| | 4,756 |
|
| | $ | 25,177 |
| | $ | — |
| | $ | — |
| | $ | 25,177 |
|
The following table presents the losses resulting from nonrecurring fair value adjustments for the years ended December 31, 2014, 2013 and 2012:
|
| | | | | | | | | | | |
| (in thousands) | 2014 | | 2013 | | 2012 |
| Investment securities, held to maturity | | | | | |
| Residential mortgage-backed securities | | | | | |
| and collateralized mortgage obligations | $ | — |
| | $ | — |
| | $ | 155 |
|
| Loans and leases | 10,265 |
| | 27,171 |
| | 37,897 |
|
| Other real estate owned | 3,728 |
| | 2,160 |
| | 11,542 |
|
| Total loss from nonrecurring measurements | $ | 13,993 |
| | $ | 29,331 |
| | $ | 49,594 |
|
The following provides a description of the valuation technique and inputs for the Company’s assets and liabilities classified as Level 3 and measured at fair value on a nonrecurring basis at December 31, 2013. Unobservable inputs and qualitative information about the unobservable inputs are not presented as the fair value is determined by third-party information. The loans and leases amount above represents impaired, collateral dependent loans that have been adjusted to fair value. When we identify a collateral dependent loan as impaired, we measure the impairment using the current fair value of the collateral, less selling costs. Depending on the characteristics of a loan, the fair value of collateral is generally estimated by obtaining external appraisals. If we determine that the value of the impaired loan is less than the recorded investment in the loan, we recognize this impairment and adjust the carrying value of the loan to fair value through the allowance for loan and lease losses. The loss represents charge-offs or impairments on collateral dependent loans for fair value adjustments based on the fair value of collateral. The carrying value of loans fully charged-off is zero.
The other real estate owned amount above represents impaired real estate that has been adjusted to fair value. Other real estate owned represents real estate which the Bank has taken control of in partial or full satisfaction of loans. At the time of foreclosure, other real estate owned is recorded at the lower of the carrying amount of the loan or fair value less costs to sell, which becomes the property's new basis. Any write-downs based on the asset's fair value at the date of acquisition are charged to the allowance for loan and lease losses. After foreclosure, management periodically performs valuations such that the real estate is carried at the lower of its new cost basis or fair value, net of estimated costs to sell. Fair value adjustments on other real estate owned are recognized within net loss on real estate owned. The loss represents impairments on other real estate owned for fair value adjustments based on the fair value of the real estate.
Fair Value Option
The following table presents the difference between the aggregate fair value and the aggregate unpaid principal balance of loans held for sale accounted for under the fair value option as of December 31, 2014 and December 31, 2013:
|
| | | | | | | | | | | | | | | | | | | | | | | |
| | | | | | | | | | | | |
| (in thousands) | December 31, 2014 | | December 31, 2013 |
| | | | | | Fair Value | | | | | | Fair Value |
| | | | Aggregate | | Less Aggregate | | | | Aggregate | | Less Aggregate |
| | | | Unpaid | | Unpaid | | | | Unpaid | | Unpaid |
| | Fair | | Principal | | Principal | | Fair | | Principal | | Principal |
| | Value | | Balance | | Balance | | Value | | Balance | | Balance |
| Loans held for sale | $ | 286,802 |
| | $ | 274,245 |
| | $ | 12,557 |
| | $ | 104,664 |
| | $ | 101,795 |
| | $ | 2,869 |
|
Residential mortgage loans held for sale accounted for under the fair value option are measured initially at fair value with subsequent changes in fair value recognized in earnings. Gains and losses from such changes in fair value are reported as a component of residential mortgage banking revenue, net in the Consolidated Statements of Income. For the years ended December 31, 2014, 2013 and 2012 the Company recorded a net increase of $6.4 million, a net decrease of $14.5 million, and a net increase of $14.0 million, respectively, representing the change in fair value reflected in earnings.
There were nononaccrual mortgage loans held for sale or mortgage loans held for sale 90 days or more past due and still accruing interest as of December 31, 2014 and December 31, 2013, respectively.
The Company selected the fair value measurement option for existing junior subordinated debentures (the Umpqua Statutory Trusts). and for junior subordinated debentures acquired from Sterling. The remaining junior subordinated debentures as of the adoption date were acquired through previous business combinations and were measured at fair value at the time of acquisition. In 2007, the Company issued two seriesacquisition and subsequently measured at amortized cost.
Accounting for the
selected junior subordinated debentures
originally issued by the Company at fair value enables us to more closely align our financial performance with the economic value of those liabilities. Additionally, we believe it improves our ability to manage the market and interest rate risks associated with the junior subordinated debentures. The junior subordinated debentures measured at fair value and amortized cost are presented as separate line items on the balance sheet. The ending carrying (fair) value of the junior subordinated debentures measured at fair value represents the estimated amount that would be paid to transfer these liabilities in an orderly transaction amongst market participants under current market conditions as of the measurement date.
The significant inputs utilized in the estimation of fair value of these instruments are the credit risk adjusted spread and three month LIBOR. The credit risk adjusted spread represents the nonperformance risk of the liability, contemplating the inherent risk of the obligation. Generally, an increase in the credit risk adjusted spread and/or a decrease in the three month LIBOR will result in positive fair value adjustments. Conversely, a decrease in the credit risk adjusted spread and/or an increase in the three month LIBOR will result in negative fair value adjustments.
Through the first quarter of 2010 we obtained valuations from a third-party pricing service to assist with the estimation and determination of fair value of these liabilities. In these valuations, the credit risk adjusted interest spread for potential new issuances through the primary market and implied spreads of these instruments when traded as assets on the secondary market, were estimated to be significantly higher than the contractual spread of our junior subordinated debentures measured at fair value. The difference between these spreads has resulted in the cumulative gain in fair value, reducing the carrying value of these instruments as reported on our Consolidated Balance Sheets. In July 2010, the Dodd-Frank Act was signed into law which, among other things, limits the ability of certain bank holding companies to treat trust preferred security debt issuances as Tier 1 capital. This law may require many banks to raise new Tier 1 capital and is expected to effectively close the trust-preferred securities markets from offering new issuances in the future. As a result of this legislation, our third-party pricing service noted that they were no longer to able to provide reliable fair value estimates related to these liabilities given the absence of observable or comparable transactions in the market place in recent history or as anticipated into the future.
Due to inactivity in the junior subordinated debenture market and the
inability to obtainlack of observable quotes of our, or similar, junior subordinated debenture liabilities or the related trust preferred securities when traded as assets, we utilize an income approach valuation technique to determine the fair value of these liabilities using our estimation of market discount rate assumptions. The Company monitors activity in the trust preferred and related markets, to the extent available, changes related to the current and anticipated future interest rate environment, and considers our entity-specific creditworthiness, to validate the reasonableness of the credit risk adjusted spread and effective yield utilized in our discounted cash flow model. Regarding the activity in and condition of the junior subordinated debt market, we noted no observable changes in the current period as it relates to companies comparable to our size and condition, in either the primary or secondary markets. Relating to the interest rate environment, we considered the change in slope and shape of the forward LIBOR swap curve in the current period, the
affectseffects of which did not result in a significant change in the fair value of these liabilities.
The Company’s specific credit risk is implicit in the credit risk adjusted spread used to determine the fair value of our junior subordinated debentures. As our Company is not specifically rated by any credit agency, it is difficult to specifically attribute changes in our estimate of the applicable credit risk adjusted spread to specific changes in our own creditworthiness versus changes in the market’s required return from similar companies. As a result, these considerations must be largely based off of qualitative considerations as we do not have a credit rating and we do not regularly issue senior or subordinated debt that would provide us an independent measure of the changes in how the market quantifies our perceived default risk.
On a quarterly basis we assess entity-specific qualitative considerations that if not mitigated or represents a material change from the prior reporting period may result in a change to the perceived creditworthiness and ultimately the estimated credit risk adjusted spread utilized to value these liabilities. Entity-specific considerations that positively impact our creditworthiness include: our strong capital position resulting from our successful public stock offerings in 2009 and 2010, that offers us flexibility to pursue business opportunities such as mergers and acquisitions, or expand our footprint and product offerings; having significant levels of on and off-balance sheet liquidity; being profitable (after excluding the one-time goodwill impairment charge recognized in 2009); and, having an experienced management team. However, these positive considerations are mitigated by significant risks and uncertainties that impact our creditworthiness and ability to maintain capital adequacy in the future. Specific risks and concerns include: given our concentration of loans secured by real estate in our loan portfolio, a continued and sustained deterioration of the real estate market may result in declines in the value of the underlying collateral and increased delinquencies that could result in an increased of charge-offs; despite recent improvement, our credit quality metrics remain negatively elevated since 2007 relative to historical standards; the continuation of current economic downturn that has been particularly severe in our primary markets could adversely affect our business; recent increased regulation facing our industry, such as the Emergency Economic Stabilization Act of 2008, the American Recovery and Reinvestment Act of 2009 and the Dodd-Frank Act, will increase the cost of compliance and restrict our ability to conduct business consistent with historical practices, and could negatively impact profitability; we have a significant amount of goodwill and other intangible assets that dilute our available tangible common equity; and the carrying value of certain material, recently recorded assets on our balance sheet, such as the FDIC loss-sharing indemnification asset, are highly reliant on management estimates, such as the timing or amount of losses that are estimated to be covered, and the assumed continued compliance with the provisions of the loss-share agreement. To the extent assumptions ultimately prove incorrect or should we consciously forego or unknowingly violate the guidelines of the agreement, an impairment of the asset may result which would reduce capital.
Additionally, the Company periodically utilizes an external valuation firm to determine or validate the reasonableness of the assessments of inputs and factors that ultimately determines the estimate fair value of these liabilities. The extent we involve or engage these external third parties correlates to management’s assessment of the current subordinate debt market, how the current environment and market compares to the preceding quarter, and perceived changes in the Company’s own creditworthiness during the quarter. In periods of potential significant valuation changes and at year-end reporting periods we typically engage third parties to perform a full independent valuation of these liabilities. For periods where management has assessed the market and other factors impacting the underlying valuation assumptions of these liabilities, and has determined significant changes to the valuation of these liabilities in the current period are remote, the scope of the valuation specialist’s review is limited to a review the reasonableness of Management’s assessment of inputs. In the fourth quarter of 2011, the Company engaged an external valuation firm to prepare an independent valuation of our junior subordinated debentures measured at fair value and the results were consistent with the Company’s valuation.
Absent changes to the significant inputs utilized in the discounted cash flow model used to measure the fair value of these instruments at each reporting period, the cumulative discount for each junior subordinated debenture will reverse over time, ultimately returning the carrying values of these instruments to their notional values at their expected redemption dates, in a manner similar to the effective yield method as if these instruments were accounted for under the amortized cost method. This will result in recognizing losses on junior subordinated debentures carried at fair value on a quarterly basis within non-interest income. For the years ended December 31, 2011 and 2010, we recorded a loss of $2.2 million and a gain $5.0 million, respectively, resulting from the change in fair value of the junior subordinated debentures recorded at fair value. Observable activity in the junior subordinated debenture and related markets in future periods may change the effective rate used to discount these liabilities, and could result in additional fair value adjustments (gains or losses on junior subordinated debentures measured at fair value) outside the expected periodic change in fair value had the fair value assumptions remained unchanged.
As noted above, the Dodd-Frank Act limits the ability of certain bank holding companies to treat trust preferred security debt issuances as Tier 1 capital. As the Company had less than $15 billion in assets at December 31, 2009, under the Dodd-Frank Act, the Company will be able to continue to include its existing trust preferred securities, less the common stock of the Trusts, in Tier 1 capital. At December 31, 2011, the Company’s restricted core capital elements were 18.41% of total core capital, net of goodwill and any associated deferred tax liability.
Umpqua Holdings Corporation and Subsidiaries
NOTE 19. EMPLOYEE BENEFIT PLANSNote 24Employee Savings Plan—Substantially all of the Bank’s and Umpqua Investments’ employees are eligible to participate in the Umpqua Bank 401(k) and Profit Sharing Plan (the “Umpqua 401(k) Plan”), a defined contribution and profit sharing plan sponsored by the Company. Employees may elect to have a portion of their salary contributed to the plan in conformity with Section 401(k) of the Internal Revenue Code. At the discretion of the Company’s Board of Directors, the Company may elect to make matching and/or profit sharing contributions to the Umpqua 401(k) Plan based on profits of the Bank. The Company’s contributions under the plan charged to expense amounted to $2.7 million, $2.2 million, and $2.1 million for the years ended December 31, 2011, 2010 and 2009, respectively.
Supplemental Retirement Plan—The Company has established the Umpqua Holdings Corporation Deferred Compensation & Supplemental Retirement Plan (the “DC/SRP”), a nonqualified deferred compensation plan to help supplement the retirement income of certain highly compensated executives selected by resolution of the Company’s Board of Directors. The DC/SRP has two components, a supplemental retirement plan (“SRP”) and a deferred compensation plan (“DCP”). The Company may make discretionary contributions to the SRP. For the years ended December 31, 2011, 2010 and 2009, the Company’s matching contribution charged to expense for these supplemental plans totaled $96,000, $56,000, and $6,000, respectively. The plan balances at December 31, 2011 and 2010 were $530,000 and $387,000, respectively, and are recorded in other liabilities. Under the DCP, eligible officers may elect to defer up to 50% of their salary into a plan account. The plan balance was $532,000 and $300,000 at December 31, 2011 and 2010, respectively.
Salary Continuation Plans—The Bank sponsors various salary continuation plans for the CEO and certain retired employees. These plans are unfunded, and provide for the payment of a specified amount on a monthly basis for a specified period (generally 10 to 20 years) after retirement. In the event of a participant employee’s death prior to or during retirement, the Bank is obligated to pay to the designated beneficiary the benefits set forth under the plan. At December 31, 2011 and 2010, liabilities recorded for the estimated present value of future salary continuation plan benefits totaled $16.9 million and $16.3 million, respectively, and are recorded in other liabilities. For the years ended December 31, 2011, 2010 and 2009, expense recorded for the salary continuation plan benefits totaled $1.8 million, $1.8 million, and $1.8 million, respectively.
Deferred Compensation Plans and Rabbi Trusts—The Bank from time to time adopts deferred compensation plans that provide certain key executives with the option to defer a portion of their compensation. In connection with prior acquisitions, the Bank assumed liability for certain deferred compensation plans for key employees, retired employees and directors. Subsequent to the effective date of the acquisitions, no additional contributions were made to these plans. At December 31, 2011 and 2010, liabilities recorded in connection with deferred compensation plan benefits totaled $2.5 million and $3.0 million, respectively, and are recorded in other liabilities.
The Bank has established and sponsors, for some deferred compensation plans assumed in connection with prior mergers, irrevocable trusts commonly referred to as “Rabbi Trusts.” The trust assets (generally cash and trading assets) are consolidated in the Company’s balance sheets and the associated liability (which equals the related asset balances) is included in other liabilities. The asset and liability balances related to these trusts as of December 31, 2011 and 2010 were $1.3 million and $1.5 million, respectively.
The Bank has purchased, or acquired through mergers, life insurance policies in connection with the implementation of certain executive supplemental income, salary continuation and deferred compensation retirement plans. These policies provide protection against the adverse financial effects that could result from the death of a key employee and provide tax-exempt income to offset expenses associated with the plans. It is the Bank’s intent to hold these policies as a long-term investment. However, there will be an income tax impact if the Bank chooses to surrender certain policies. Although the lives of individual current or former management-level employees are insured, the Bank is the owner and sole or partial beneficiary. At December 31, 2011 and 2010, the cash surrender value of these policies was $92.6 million and $90.2 million, respectively. At December 31, 2011 and 2010, the Bank also had liabilities for post-retirement benefits payable to other partial beneficiaries under some of these life insurance policies of $1.5 million and $1.4 million, respectively. The Bank is exposed to credit risk to the extent an insurance company is unable to fulfill its financial obligations under a policy. In order to mitigate this risk, the Bank uses a variety of insurance companies and regularly monitors their financial condition.
NOTE 20. COMMITMENTS AND CONTINGENCIES
Lease Commitments—The Company leases 142 sites under non-cancelable operating leases. The leases contain various provisions for increases in rental rates, based either on changes in the published Consumer Price Index or a predetermined escalation schedule. Substantially all of the leases provide the Company with the option to extend the lease term one or more times following expiration of the initial term.
Rent expense for the years ended December 31, 2011, 2010 and 2009 was $16.6 million, $15.3 million, and $13.0 million, respectively. Rent expense was offset by rent income of $1.0 million, $1.0 million, and $555,000 for the years ended December 31, 2011, 2010 and 2009, respectively.
The following table sets forth, as of December 31, 2011, the future minimum lease payments under non-cancelable operating leases and future minimum income receivable under non-cancelable operating subleases:
(in thousands)
| | | | | | | | |
| | | Lease
Payments | | | Sublease
Income | |
2012 | | $ | 15,695 | | | $ | 1,019 | |
2013 | | | 13,444 | | | | 696 | |
2014 | | | 11,856 | | | | 514 | |
2015 | | | 10,002 | | | | 421 | |
2016 | | | 7,724 | | | | 260 | |
Thereafter | | | 21,386 | | | | 802 | |
| | | | |
Total | | $ | 80,107 | | | $ | 3,712 | |
| | | | |
Financial Instruments with Off-Balance-Sheet Risk—The Company’s financial statements do not reflect various commitments and contingent liabilities that arise in the normal course of the Bank’s business and involve elements of credit, liquidity and interest rate risk. The following table presents a summary of the Bank’s commitments and contingent liabilities:
(in thousands)
| | | | |
| | | As of December 31, 2011 | |
Commitments to extend credit | | $ | 1,222,920 | |
Commitments to extend overdrafts | | $ | 226,749 | |
Forward sales commitments | | $ | 182,671 | |
Commitments to originate loans held for sale | | $ | 143,512 | |
Standby letters of credit | | $ | 61,316 | |
The Bank is a party to financial instruments with off-balance-sheet credit risk in the normal course of business to meet the financing needs of its customers. These financial instruments include commitments to extend credit, standby letters of credit and financial guarantees. Those instruments involve elements of credit and interest-rate risk similar to the amounts recognized in the consolidated balance sheets. The contract or notional amounts of those instruments reflect the extent of the Bank’s involvement in particular classes of financial instruments.
The Bank’s exposure to credit loss in the event of nonperformance by the other party to the financial instrument for commitments to extend credit and standby letters of credit, and financial guarantees written, is represented by the contractual notional amount of those instruments. The Bank uses the same credit policies in making commitments and conditional obligations as it does for on-balance-sheet instruments.
Commitments to extend credit are agreements to lend to a customer as long as there is no violation of any covenant or condition established in the contract. Commitments generally have fixed expiration dates or other termination clauses and may require payment of a fee. Since many of the commitments are expected to expire without being drawn upon, the total commitment amounts do not necessarily represent future cash requirements. While most standby letters of credit are not
Umpqua Holdings Corporation and Subsidiaries
utilized, a significant portion of such utilization is on an immediate payment basis. The Bank evaluates each customer’s creditworthiness on a case-by-case basis. The amount of collateral obtained, if it is deemed necessary by the Bank upon extension of credit, is based on management’s credit evaluation of the counterparty. Collateral varies but may include cash, accounts receivable, inventory, premises and equipment and income-producing commercial properties.
Standby letters of credit and financial guarantees written are conditional commitments issued by the Bank to guarantee the performance of a customer to a third party. These guarantees are primarily issued to support public and private borrowing arrangements, including international trade finance, commercial paper, bond financing and similar transactions. The credit risk involved in issuing letters of credit is essentially the same as that involved in extending loan facilities to customers. The Bank holds cash, marketable securities, or real estate as collateral supporting those commitments for which collateral is deemed necessary. The Bank has not been required to perform on any financial guarantees but did incur losses of $110,000 in connection with standby letters of credit during the year ended December 31, 2011 and no losses in connection with standby letters of credit during the year ended December 31, 2010. The Bank has not been required to perform on any financial guarantees but did incur losses of $23,000 in connection with standby letters of credit during the year ended December 31, 2009. At December 31, 2011, approximately $31.5 million of standby letters of credit expire within one year, and $29.8 million expire thereafter. Upon issuance, the Company recognizes a liability equivalent to the amount of fees received from the customer for these standby letter of credit commitments. Fees are recognized ratably over the term of the standby letter of credit. The fair value of guarantees associated with standby letters of credit was $254,000 as of December 31, 2011.
At December 31, 2011 and 2010, the reserve for unfunded commitments, which is included in other liabilities on the consolidated balance sheet, was $940,000 and $818,000, respectively. The adequacy of the reserve for unfunded commitments is reviewed on a quarterly basis, based upon changes in the amounts of commitments, loss experience, and economic conditions.
Mortgage loans sold to investors may be sold with servicing rights retained, for which the Bank makes only standard legal representations and warranties as to meeting certain underwriting and collateral documentation standards. In the past two years, the Bank has had to repurchase fewer than 10 loans due to deficiencies in underwriting or loan documentation and has not realized significant losses related to these repurchases. Management believes that any liabilities that may result from such recourse provisions are not significant.
Legal Proceedings—The Bank owns 468,659 shares of Class B common stock of Visa Inc. which are convertible into Class A common stock at a conversion ratio of 0.4254 per Class A share. As of December 31, 2011, the value of the Class A shares was $101.53 per share. Utilizing the conversion ratio, the value of unredeemed Class A equivalent shares owned by the Company was $20.2 million as of December 31, 2011, and has not been reflected in the accompanying financial statements. The shares of Visa Class B common stock are restricted and may not be transferred until the later of (1) three years from the date of the initial public offering or (2) the period of time necessary to resolve the covered litigation. Visa Member Banks are required to fund an escrow account to cover settlements, resolution of pending litigation and related claims. If the funds in the escrow account are insufficient to settle all the covered litigation, Visa may sell additional Class A shares, use the proceeds to settle litigation, and further reduce the conversion ratio. If funds remain in the escrow account after all litigation is settled, the Class B conversion ratio will be increased to reflect that surplus.
In the ordinary course of business, various claims and lawsuits are brought by and against the Company, the Bank and Umpqua Investments. In the opinion of management, there is no pending or threatened proceeding in which an adverse decision could result in a material adverse change in the Company’s consolidated financial condition or results of operations.
Concentrations of Credit Risk—The Company grants real estate mortgage, real estate construction, commercial, agricultural and installment loans and leases to customers throughout Oregon, Washington, California and Nevada. In management’s judgment, a concentration exists in real estate-related loans, which represented approximately 80% and 82%, respectively, of the Company’s loan and lease portfolio at December 31, 2011 and 2010. Commercial real estate concentrations are managed to assure wide geographic and business diversity. Although management believes such concentrations have no more than the normal risk of collectability, a substantial decline in the economy in general, material increases in interest rates, changes in tax
policies, tightening credit or refinancing markets, or a decline in real estate values in the Company’s primary market areas in particular and aspects of our commercial real estate, commercial construction and commercial loan portfolios, could have an adverse impact on the repayment of these loans. Personal and business incomes, proceeds from the sale of real property, or proceeds from refinancing, represent the primary sources of repayment for a majority of these loans.
The Bank recognizes the credit risks inherent in dealing with other depository institutions. Accordingly, to prevent excessive exposure to any single correspondent, the Bank has established general standards for selecting correspondent banks as well as internal limits for allowable exposure to any single correspondent. In addition, the Bank has an investment policy that sets forth limitations that apply to all investments with respect to credit rating and concentrations per issuer.
NOTE 21. DERIVATIVES
The Company may use derivatives to hedge the risk of changes in the fair values of interest rate lock commitments, residential mortgage loans held for sale, and mortgage servicing rights. None of the Company’s derivatives are designated as hedging instruments. Rather, they are accounted for as free-standing derivatives, or economic hedges, with changes in the fair value of the derivatives reported in income. The Company primarily utilizes forward interest rate contracts in its derivative risk management strategy.
The Bank enters into forward delivery contracts to sell residential mortgage loans or mortgage-backed securities to broker/dealers at specific prices and dates (“MBS TBAs”) in order to hedge the interest rate risk in its portfolio of mortgage loans held for sale and its residential mortgage loan commitments. Credit risk associated with forward contracts is limited to the replacement cost of those forward contracts in a gain position. There were no counterparty default losses on forward contracts in 2011, 2010 or 2009. Market risk with respect to forward contracts arises principally from changes in the value of contractual positions due to changes in interest rates. The Bank limits its exposure to market risk by monitoring differences between commitments to customers and forward contracts with broker/dealers. In the event the Company has forward delivery contract commitments in excess of available mortgage loans, the Company completes the transaction by either paying or receiving a fee to or from the broker/dealer equal to the increase or decrease in the market value of the forward contract. At December 31, 2011, the Bank had commitments to originate mortgage loans held for sale totaling $143.5 million and forward sales commitments of $182.7 million.
The Company’s mortgage banking derivative instruments do not have specific credit risk-related contingent features. The forward sales commitments do have contingent features that may require transferring collateral to the broker/dealers upon their request. However, this amount would be limited to the net unsecured loss exposure at such point in time and would not materially affect the Company’s liquidity or results of operations.
Effective in the second quarter of 2011, the Bank began executing interest rate swaps with commercial banking customers to facilitate their respective risk management strategies. Those interest rate swaps are simultaneously hedged by offsetting the interest rate swaps that the Bank executes with a third party, such that the Bank minimizes its net risk exposure. As of December 31, 2011, the Bank had 38 interest rate swaps with an aggregate notional amount of $194.3 million related to this program.
In connection with the interest rate swap program with commercial customers, the Bank has agreements with its derivative counterparties that contain a provision where if the Bank defaults on any of its indebtedness, including default where repayment of the indebtedness has not been accelerated by the lender, then the Bank could also be declared in default on its derivative obligations.
The Bank also has agreements with its derivative counterparties that contain a provision where if the Bank fails to maintain its status as a well/adequately capitalized institution, then the counterparty could terminate the derivative positions and the Bank would be required to settle its obligations under the agreements. Similarly, the Bank could be required to settle its obligations under certain of its agreements if specific regulatory events occur, such as if the Bank were issued a prompt corrective action directive or a cease and desist order, or if certain regulatory ratios fall below specified levels.
Umpqua Holdings Corporation and Subsidiaries
As of December 31, 2011, the termination value of derivatives in a net liability position, which includes accrued interest but excludes any adjustment for nonperformance risk, related to these agreements was $6.6 million. The Bank has minimum collateral posting thresholds with certain of its derivative counterparties, and has been required to post collateral against its obligations under these agreements of $5.8 million as of December 31, 2011. If the Bank had breached any of these provisions at December 31, 2011, it could have been required to settle its obligations under the agreements at the termination value.
The following tables summarize the types of derivatives, separately by assets and liabilities, their locations on theConsolidated Balance Sheets, and the fair values of such derivatives as of December 31, 2011 and 2010:
(in thousands)
| | | | | | | | | | | | | | | | | | |
Derivatives not designated as hedging instrument | | Balance Sheet Location | | Asset Derivatives | | | Liability Derivatives | |
| | | December 31, 2011 | | | December 31, 2010 | | | December 31, 2011 | | | December 31, 2010 | |
Interest rate lock commitments | | Other assets/Other liabilities | | $ | 1,752 | | | $ | 306 | | | $ | 3 | | | $ | 170 | |
Interest rate forward sales commitments | | Other assets/Other liabilities | | | — | | | | 754 | | | | 90 | | | | 191 | |
Interest rate swaps | | Other assets/Other liabilities | | | 6,203 | | | | — | | | | 6,416 | | | | — | |
| | | | | | |
Total | | | | $ | 7,955 | | | $ | 1,060 | | | $ | 6,509 | | | $ | 361 | |
| | | | | | |
The following table summarizes the types of derivatives, their location on theConsolidated Statements of Operations, and the losses recorded in 2011, 2010 and 2009:
(in thousands)
| | | | | | | | | | | | | | |
Derivatives not designated as hedging instrument | | Income Statement Location | | 2011 | | | 2010 | | | 2009 | |
Interest rate lock commitments | | Mortgage banking revenue | | $ | 1,613 | | | $ | 146 | | | $ | (1,176 | ) |
Interest rate forward sales commitments | | Mortgage banking revenue | | | (10,579 | ) | | | (3,034 | ) | | | (255 | ) |
Interest rate swaps | | Other income | | | (187 | ) | | | — | | | | — | |
| | | | | | |
Total | | | | $ | (9,153 | ) | | $ | (2,888 | ) | | $ | (1,431 | ) |
| | | | | | |
| | | | | | | | | | | | | | |
NOTE 22. SHAREHOLDERS’ EQUITY
On February 3, 2010, the Company raised $303.6 million through a public offering by issuing 8,625,000 shares of the Company’s common stock, including 1,125,000 shares pursuant to the underwriters’ over-allotment option, at a share price of $11.00 per share and 18,975,000 depository shares, including 2,475,000 depository shares pursuant to the underwriter’s over-allotment option, also at a price of $11.00 per share. Fractional interests (1/100th) in each share of the Series B– Earnings Per Common Stock Equivalent were represented by the 18,975,000 depositary shares; as a result, each depository share would convert into one share of common stock. The net proceeds to the Company after deducting underwriting discounts and commissions and offering expenses were $288.1 million. The net proceeds from the offering were used to redeem the preferred stock issued to the United States Department of the Treasury (U.S. Treasury) under the Troubled Asset Relief Program (“TARP”) Capital Purchase Program (“CPP”), to fund FDIC-assisted acquisition opportunities and for general corporate purposes.
On February 17, 2010, the Company redeemed all of the outstanding Fixed Rate Cumulative Perpetual Preferred Stock, Series A, issued to the U.S. Treasury under the TARP CPP for an aggregate purchase price of $214.2 million. As a result of the repurchase of the Series A preferred stock, the Company incurred a one-time deemed dividend of $9.8 million due to the accelerated amortization of the remaining issuance discount on the preferred stock.
On March 31, 2010, the Company repurchased the common stock warrant issued to the U.S. Treasury pursuant to the TARP CPP, for $4.5 million. The warrant repurchase, together with the Company’s redemption in February 2010 of the entire amount of Fixed Rate Cumulative Perpetual Preferred Stock, Series A, issued to the U.S. Treasury, represents full repayment of all TARP obligations and cancellation of all equity interests in the Company held by the U.S. Treasury.
On April 20, 2010, shareholders of the Company approved an amendment to the Company’s Restated Articles of Incorporation. The amendment, which became effective on April 21, 2010, increased the number of authorized shares of common stock to 200,000,000 (from 100,000,000). As a result of the effectiveness of the amendment, as of the close of business on April 21, 2010, the Company’s Series B Common Stock Equivalent preferred stock automatically converted into newly issued shares of common stock at a conversion rate of 100 shares of common stock for each share of Series B Common Stock Equivalent preferred stock. All shares of Series B Common Stock Equivalent preferred stock and representative depositary shares ceased to exist upon the conversion. Trading in the depositary shares on NASDAQ (ticker symbol “UMPQP”) ceased and the UMPQP symbol voluntarily delisted effective as of the close of business on April 21, 2010.
The Company has 4,000,000 shares of no par value preferred stock authorized and available to be issued. As of December 31, 2011 and 2010, there was no preferred stock outstanding.
Share
Stock Plans—The Company’s 2007 Long Term Incentive Plan (“2007 LTI Plan”) authorizes the award of up to 1 million restricted stock unit grants, which are subject to performance-based vesting as well as other approved vesting conditions. The Company’s 2003 Stock Incentive Plan (“2003 Plan”) provides for grants of up to 4 million shares. The 2003 Plan terminates June 30, 2015, but it may be extended with the approval of the board and shareholders. The 2003 Plan further provides that no grants may be issued if existing options and subsequent grants under the 2003 Plan exceed 10% of the Company’s outstanding shares on a diluted basis. Under the terms of the 2003 Plan, options and awards generally vest ratably over a period of five years, the exercise price of each option equals the market price of the Company’s common stock on the date of the grant, and the maximum term is ten years.The Company has options outstanding under two prior plans adopted in 1995 and 2000, respectively. With the adoption of the 2003 Plan, no additional grants can be issued under the previous plans. The Company also assumed various plans in connection with mergers and acquisitions but does not make grants under those plans.
On June 17, 2011, the Company’s Compensation Committee modified restricted stock awards and option grants that were originally issued to fourteen executive officers on January 31, 2011, as follows:
Added performance vesting conditions linking total shareholder return, compared to the return of a regional bank stock total return index;
Awards will cliff vest after three years instead of time vest over a four year period, but only to the extent that the performance conditions are met; and
The modified grants will vest in whole or in part only if total shareholder return achieves specified targets, subject to prorated vesting upon death, disability, qualifying retirement, termination for good reason or a change of control.
As a result of the modification, there was no incremental compensation cost.
Umpqua Holdings Corporation and Subsidiaries
The following table summarizes information about stock option activity for the years ended December 31, 2011, 2010 and 2009:
(shares in thousands)
| | | | | | | | | | | | | | | | | | | | | | | | |
| | | 2011 | | | 2010 | | | 2009 | |
| | | Options Outstanding | | | Weighted Avg. Exercise Price | | | Options Outstanding | | | Weighted Avg. Exercise Price | | | Options Outstanding | | | Weighted Avg. Exercise Price | |
| | | | | | |
Balance, beginning of year | | | 2,067 | | | $ | 14.82 | | | | 1,763 | | | $ | 15.05 | | | | 1,819 | | | $ | 15.66 | |
Granted | | | 237 | | | $ | 11.01 | | | | 450 | | | $ | 12.39 | | | | 229 | | | $ | 9.34 | |
Exercised | | | (40 | ) | | $ | 7.67 | | | | (112 | ) | | $ | 8.97 | | | | (51 | ) | | $ | 5.93 | |
Forfeited/expired | | | (113 | ) | | $ | 15.72 | | | | (34 | ) | | $ | 13.83 | | | | (234 | ) | | $ | 16.20 | |
| | | | | | | | | | | | | | | | | | | | | | | | |
Balance, end of year | | | 2,151 | | | $ | 14.48 | | | | 2,067 | | | $ | 14.82 | | | | 1,763 | | | $ | 15.05 | |
| | | | | | | | | | | | | | | | | | | | | | | | |
Options exercisable,end of year | | | 1,334 | | | $ | 16.13 | | | | 1,217 | | | $ | 16.65 | | | | 1,071 | | | $ | 15.90 | |
| | | | | | | | | | | | | | | | | | | | | | | | |
The following table summarizes information about outstanding stock options issued under all plans as of December 31, 2011:
(shares in thousands)
| | | | | | | | | | | | | | | | | | | | |
Range of Exercise Prices | | Options Outstanding | | | Options Exercisable | |
| | Options Outstanding | | | Weighted Avg. Remaining Contractual Life (Years) | | | Weighted Avg. Exercise Price | | | Options Exercisable | | | Weighted Avg. Exercise Price | |
$4.58 to $10.97 | | | 599 | | | | 7.0 | | | $ | 8.76 | | | | 255 | | | $ | 6.51 | |
$11.26 to $12.87 | | | 560 | | | | 7.9 | | | $ | 12.11 | | | | 188 | | | $ | 11.95 | |
$13.34 to $19.31 | | | 602 | | | | 3.4 | | | $ | 16.13 | | | | 502 | | | $ | 16.34 | |
$20.03 to $28.43 | | | 390 | | | | 3.4 | | | $ | 24.14 | | | | 389 | | | $ | 24.14 | |
| | | | | | | | | | | | | | | | | | | | |
| | | 2,151 | | | | 5.6 | | | $ | 14.48 | | | | 1,334 | | | $ | 16.13 | |
| | | | | | | | | | | | | | | | | | | | |
The compensation cost related to stock options, including costs related to unvested options assumed in connection with acquisitions, that has been charged against income (included in salaries and employee benefits) was $1.2 million, $861,000, and $1.4 million for the years ended December 31, 2011, 2010 and 2009, respectively. The total income tax benefit recognized in the income statement related to stock options was $463,000, $344,000, and $541,000 for the years ended December 31, 2011, 2010 and 2009, respectively. The total intrinsic value (which is the amount by which the stock price exceeds the exercise price) of both options outstanding and options exercisable as of December 31, 2011, was $2.4 million and $1.6 million, respectively. The weighted average remaining contractual term of options exercisable was 4.3 years as of December 31, 2011. The total intrinsic value of options exercised was $147,000, $420,000, and $220,000, in the years ended December 31, 2011, 2010 and 2009, respectively. During the years ended December 31, 2011, 2010 and 2009, the amount of cash received from the exercise of stock options was $309,000, $1.0 million, and $301,000, respectively. As of December 31, 2011, there was $2.7 million of total unrecognized compensation cost related to nonvested stock options which is expected to be recognized over a weighted-average period of 2.4 years.
The Company grants restricted stock awards periodically as a part of the 2003 Plan for the benefit of employees. Restricted shares issued generally vest on an annual basis over five years. A deferred restricted stock award was granted to an executive in 2007 and is now fully vested. The Company will issue certificates for the vested award within the seventh month following termination of the executive’s employment. The following table summarizes information about nonvested restricted shares outstanding at December 31:
(shares in thousands)
| | | | | | | | | | | | | | | | | | | | | | | | |
| | | 2011 | | | 2010 | | | 2009 | |
| | | Restricted Shares Outstanding | | | Average Grant Date Fair Value | | | Restricted Shares Outstanding | | | Average Grant Date Fair Value | | | Restricted Shares Outstanding | | | Average Grant Date Fair Value | |
| | | | | | |
| | | | | | |
Balance, beginning of year | | | 401 | | | $ | 15.29 | | | | 187 | | | $ | 21.46 | | | | 216 | | | $ | 23.42 | |
Granted | | | 282 | | | $ | 11.02 | | | | 274 | | | $ | 12.16 | | | | 26 | | | $ | 9.83 | |
Released | | | (82 | ) | | $ | 17.58 | | | | (46 | ) | | $ | 22.23 | | | | (46 | ) | | $ | 23.81 | |
Forfeited/expired | | | (16 | ) | | $ | 12.91 | | | | (14 | ) | | $ | 13.32 | | | | (9 | ) | | $ | 22.85 | |
| | | | | | | | | | | | | | | | | | | | | | | | |
Balance, end of year | | | 585 | | | $ | 12.98 | | | | 401 | | | $ | 15.29 | | | | 187 | | | $ | 21.46 | |
| | | | | | | | | | | | | | | | | | | | | | | | |
The compensation cost related to restricted stock awards that has been charged against income (included in salaries and employee benefits) was $2.3 million, $1.9 million, and $1.4 million for the years ended December 31, 2011, 2010 and 2009, respectively. The total income tax benefit recognized in the income statement related to restricted stock awards was $899,000, $746,000, and $548,000 for the years ended December 31, 2011, 2010 and 2009, respectively. The total fair value of restricted shares vested was $919,000, $571,000, and $445,000, for the years ended December 31, 2011, 2010 and 2009, respectively. As of December 31, 2011, there was $3.7 million of total unrecognized compensation cost related to nonvested restricted stock awards which is expected to be recognized over a weighted-average period of 2.4 years.
The Company grants restricted stock units as a part of the 2007 Long Term Incentive Plan for the benefit of certain executive officers. Restricted stock unit grants are subject to performance-based vesting as well as other approved vesting conditions. In the first quarter of 2008, 2009 and 2011, restricted stock units were granted to executives that cliff vest after three years based on performance and service conditions. The total number of restricted stock units granted represents the maximum number of restricted stock units eligible to vest based upon the performance and service conditions set forth in the grant agreements. The following table summarizes information about restricted stock units outstanding at December 31:
(shares in thousands)
| | | | | | | | | | | | | | | | | | | | | | | | |
| | | 2011 | | | 2010 | | | 2009 | |
| | | Restricted Stock Units Outstanding | | | Weighted Average Grant Date Fair Value | | | Restricted Stock Units Outstanding | | | Weighted Average Grant Date Fair Value | | | Restricted Stock Units Outstanding | | | Weighted Average Grant Date Fair Value | |
| | | | | | |
| | | | | | |
Balance, beginning of year | | | 225 | | | $ | 11.13 | | | | 335 | | | $ | 15.54 | | | | 301 | | | $ | 19.48 | |
Granted | | | 105 | | | $ | 10.42 | | | | — | | | $ | — | | | | 114 | | | $ | 8.01 | |
Released | | | (63 | ) | | $ | 14.33 | | | | (16 | ) | | $ | 24.52 | | | | (23 | ) | | $ | 21.33 | |
Forfeited/expired | | | (48 | ) | | $ | 14.33 | | | | (94 | ) | | $ | 24.52 | | | | (57 | ) | | $ | 18.98 | |
| | | | | | | | | | | | | | | | | | | | | | | | |
Balance, end of year | | | 219 | | | $ | 9.17 | | | | 225 | | | $ | 11.13 | | | | 335 | | | $ | 15.54 | |
| | | | | | | | | | | | | | | | | | | | | | | | |
The compensation cost related to restricted stock units that has been charged against income (included in salaries and employee benefits) was $391,000 and $778,000 for the years ended December 31, 2011 and 2010, respectively. For the year ended December 31, 2009, the Company recorded a reversal of compensation cost of $539,000 related to restricted stock units
Umpqua Holdings Corporation and Subsidiaries
that has been credited to salaries and employee benefits expense. The total income tax benefit recognized in the income statement related to restricted stock units was $156,000 and $311,000 for the years ended December 31, 2011 and 2010, respectively. The total income tax expense recognized in the income statement related to restricted stock units was $215,000 for the year ended December 31, 2009. The total fair value of restricted stock units vested and released was $677,000, $213,000, and $186,000 for the years ended December 31, 2011, 2010 and 2009, respectively. As of December 31, 2011, there was $772,000 of total unrecognized compensation cost related to nonvested restricted stock units which is expected to be recognized over a weighted-average period of 1.1 years, assuming the current expectation of performance conditions are met.
For the years ended December 31, 2011, 2010 and 2009, the Company received income tax benefits of $694,000, $406,000, and $326,000, respectively, related to the exercise of non-qualified employee stock options, disqualifying dispositions in the exercise of incentive stock options, the vesting of restricted shares and the vesting of restricted stock units. For the year ended December 31, 2011, the Company had net tax deficiencies (tax deficiency resulting from tax deductions less than the compensation cost recognized) of $261,000, compared to net tax deficiencies of $216,000 and $369,000 for the years ended December 31, 2010 and 2009, respectively. Only cash flows from gross excess tax benefits are classified as financing cash flows.
Share Repurchase Plan—The Company’s share repurchase plan, which was first approved by the Board and announced in August 2003, was amended on September 29, 2011 to increase the number of common shares available for repurchase under the plan to 15 million shares. The repurchase program will run through June 2013. As of December 31, 2011, a total of 12.6 million shares remained available for repurchase. The Company repurchased 2.5 million shares under the repurchase plan in 2011 and no shares in 2010. The timing and amount of future repurchases will depend upon the market price for our common stock, securities laws restricting repurchases, asset growth, earnings, and our capital plan.
We also have certain stock option and restricted stock plans which provide for the payment of the option exercise price or withholding taxes by tendering previously owned or recently vested shares. During the years ended December 31, 2011 and 2010, there were 8,135 and 4,515 shares tendered in connection with option exercises, respectively. Restricted shares cancelled to pay withholding taxes totaled 23,158 and 12,443 shares during the years ended December 31, 2011 and 2010, respectively. Restricted stock units cancelled to pay withholding taxes totaled 22,439 and 5,583 during the years ended December 31, 2011 and 2010, respectively.
NOTE 23. REGULATORY CAPITAL
The Company is subject to various regulatory capital requirements administered by the federal banking agencies. Failure to meet minimum capital requirements can initiate certain mandatory and possible additional discretionary actions by regulators that, if undertaken, could have a material effect on the Company’s financial statements. Under capital adequacy guidelines, the Company must meet specific capital guidelines that involve quantitative measures of the Company’s assets, liabilities, and certain off balance sheet items as calculated under regulatory accounting practices. The Company’s capital amounts and classifications are also subject to qualitative judgments by the regulators about risk components, asset risk weighting, and other factors.
Quantitative measures established by regulation to ensure capital adequacy require the Company to maintain minimum amounts and ratios (set forth in the table below) of total and Tier 1 capital to risk-weighted assets (as defined in the regulations), and of Tier 1 capital to average assets (as defined in the regulations). Management believes, as of December 31, 2011, that the Company meets all capital adequacy requirements to which it is subject.
The Company’s capital amounts and ratios as of December 31, 2011 and 2010 are presented in the following table:
(dollars in thousands)
| | | | | | | | | | | | | | | | | | | | | | | | |
| | | Actual | | | For Capital
Adequacy
purposes | | | To be Well
Capitalized | |
| | | |
| | | Amount | | | Ratio | | | Amount | | | Ratio | | | Amount | | | Ratio | |
AS OF DECEMBER 31, 2011: | | | | | | | | | | | | | | | | | | | | | | | | |
Total Capital | | | | | | | | | | | | | | | | | | | | | | | | |
(to Risk Weighted Assets) | | | | | | | | | | | | | | | | | | | | | | | | |
Consolidated | | $ | 1,287,560 | | | | 17.16% | | | $ | 600,261 | | | | 8.00% | | | $ | 750,326 | | | | 10.00% | |
Umpqua Bank | | $ | 1,163,611 | | | | 15.53% | | | $ | 599,413 | | | | 8.00% | | | $ | 749,267 | | | | 10.00% | |
Tier I Capital | | | | | | | | | | | | | | | | | | | | | | | | |
(to Risk Weighted Assets) | | | | | | | | | | | | | | | | | | | | | | | | |
Consolidated | | $ | 1,193,740 | | | | 15.91% | | | $ | 300,123 | | | | 4.00% | | | $ | 450,185 | | | | 6.00% | |
Umpqua Bank | | $ | 1,069,914 | | | | 14.28% | | | $ | 299,696 | | | | 4.00% | | | $ | 449,544 | | | | 6.00% | |
Tier I Capital | | | | | | | | | | | | | | | | | | | | | | | | |
(to Average Assets) | | | | | | | | | | | | | | | | | | | | | | | | |
Consolidated | | $ | 1,193,740 | | | | 10.91% | | | $ | 437,668 | | | | 4.00% | | | $ | 547,085 | | | | 5.00% | |
Umpqua Bank | | $ | 1,069,914 | | | | 9.78% | | | $ | 437,593 | | | | 4.00% | | | $ | 546,991 | | | | 5.00% | |
| | | | | | | | | | | | | | | | | | | | | | | | |
| | | Actual | | | For Capital
Adequacy
purposes | | | To be Well
Capitalized | |
| | | |
| | | Amount | | | Ratio | | | Amount | | | Ratio | | | Amount | | | Ratio | |
AS OF DECEMBER 31, 2010: | | | | | | | | | | | | | | | | | | | | | | | | |
Total Capital | | | | | | | | | | | | | | | | | | | | | | | | |
(to Risk Weighted Assets) | | | | | | | | | | | | | | | | | | | | | | | | |
Consolidated | | $ | 1,253,333 | | | | 17.62% | | | $ | 569,050 | | | | 8.00% | | | $ | 711,313 | | | | 10.00% | |
Umpqua Bank | | $ | 1,085,839 | | | | 15.27% | | | $ | 568,874 | | | | 8.00% | | | $ | 711,093 | | | | 10.00% | |
Tier I Capital | | | | | | | | | | | | | | | | | | | | | | | | |
(to Risk Weighted Assets) | | | | | | | | | | | | | | | | | | | | | | | | |
Consolidated | | $ | 1,164,226 | | | | 16.36% | | | $ | 284,652 | | | | 4.00% | | | $ | 426,978 | | | | 6.00% | |
Umpqua Bank | | $ | 996,798 | | | | 14.02% | | | $ | 284,393 | | | | 4.00% | | | $ | 426,590 | | | | 6.00% | |
Tier I Capital | | | | | | | | | | | | | | | | | | | | | | | | |
(to Average Assets) | | | | | | | | | | | | | | | | | | | | | | | | |
Consolidated | | $ | 1,164,226 | | | | 10.56% | | | $ | 440,995 | | | | 4.00% | | | $ | 551,243 | | | | 5.00% | |
Umpqua Bank | | $ | 996,798 | | | | 9.04% | | | $ | 441,061 | | | | 4.00% | | | $ | 551,326 | | | | 5.00% | |
The Company is a registered financial holding company under the Gramm-Leach-Bliley Act of 1999 (the “GLB Act”), and is subject to the supervision of, and regulation by, the Board of Governors of the Federal Reserve System (the “Federal Reserve”). The Bank is an Oregon state chartered bank with deposits insured by the Federal Deposit Insurance Corporation (“FDIC”), and is subject to the supervision and regulation of the Director of the Oregon Department of Consumer and Business Services, administered through the Division of Finance and Corporate Securities, and to the supervision and regulation of the California Department of Financial Institutions, the Washington Department of Financial Institutions and the FDIC. As of December 31, 2011, the most recent notification from the FDIC categorized the Bank as “well-capitalized” under the regulatory framework for prompt corrective action. The Company is not subject to the regulatory framework for prompt corrective action. There are no conditions or events since that notification that management believes have changed the Bank’s regulatory capital category.
Umpqua Holdings Corporation and Subsidiaries
NOTE 24. FAIR VALUES
The following table presents estimated fair values of the Company’s financial instruments as of December 31, 2011 and December 31, 2010, whether or not recognized or recorded at fair value in theConsolidated Balance Sheets:
(in thousands)
| | | | | | | | | | | | | | | | |
| | | 2011 | | | 2010 | |
| | | Carrying
Value | | | Fair Value | | | Carrying
Value | | | Fair Value | |
FINANCIAL ASSETS: | | | | | | | | | | | | | | | | |
Cash and cash equivalents | | $ | 598,766 | | | $ | 598,766 | | | $ | 1,004,125 | | | $ | 1,004,125 | |
Trading securities | | | 2,309 | | | | 2,309 | | | | 3,024 | | | | 3,024 | |
Securities available for sale | | | 3,168,578 | | | | 3,168,578 | | | | 2,919,180 | | | | 2,919,180 | |
Securities held to maturity | | | 4,714 | | | | 4,759 | | | | 4,762 | | | | 4,774 | |
Loans held for sale | | | 98,691 | | | | 98,691 | | | | 75,626 | | | | 75,626 | |
Non-covered loans and leases, net | | | 5,795,130 | | | | 5,816,714 | | | | 5,557,066 | | | | 5,767,506 | |
Covered loans and leases | | | 622,451 | | | | 722,295 | | | | 785,898 | | | | 893,682 | |
Restricted equity securities | | | 32,581 | | | | 32,581 | | | | 34,475 | | | | 34,475 | |
Mortgage servicing rights | | | 18,184 | | | | 18,184 | | | | 14,454 | | | | 14,454 | |
Bank owned life insurance assets | | | 92,555 | | | | 92,555 | | | | 90,161 | | | | 90,161 | |
FDIC indemnification asset | | | 91,089 | | | | 47,008 | | | | 146,413 | | | | 90,011 | |
Derivatives | | | 7,955 | | | | 7,955 | | | | 1,060 | | | | 1,060 | |
Visa Class B common stock | | | — | | | | 19,230 | | | | — | | | | 15,987 | |
| | | | |
FINANCIAL LIABILITIES: | | | | | | | | | | | | | | | | |
Deposits | | $ | 9,236,690 | | | $ | 9,260,327 | | | $ | 9,433,805 | | | $ | 9,464,406 | |
Securities sold under agreement to repurchase | | | 124,605 | | | | 124,605 | | | | 73,759 | | | | 73,759 | |
Term debt | | | 255,676 | | | | 284,911 | | | | 262,760 | | | | 282,127 | |
Junior subordinated debentures, at fair value | | | 82,905 | | | | 82,905 | | | | 80,688 | | | | 80,688 | |
Junior subordinated debentures, at amortized cost | | | 102,544 | | | | 68,698 | | | | 102,866 | | | | 65,771 | |
Derivatives | | | 6,509 | | | | 6,509 | | | | 361 | | | | 361 | |
The following table presents information about the Company’s assets and liabilities measured at fair value on a recurring basis at December 31, 2011 and 2010:
(in thousands)
| | | | | | | | | | | | | | | | |
| | | Fair Value at December 31, 2011 | |
| Description | | Total | | | Level 1 | | | Level 2 | | | Level 3 | |
Trading securities | | | | | | | | | | | | | | | | |
Obligations of states and political subdivisions | | $ | 296 | | | $ | 296 | | | $ | — | | | $ | — | |
Equity securities | | | 1,918 | | | | 1,918 | | | | — | | | | — | |
Other investments securities(1) | | | 95 | | | | 95 | | | | — | | | | — | |
Available for sale securities | | | | | | | | | | | | | | | | |
U.S. Treasury and agencies | | | 118,465 | | | | — | | | | 118,465 | | | | — | |
Obligations of states and political subdivisions | | | 253,553 | | | | — | | | | 253,553 | | | | — | |
Residential mortgage-backed securities and collateralized mortgage obligations | | | 2,794,355 | | | | — | | | | 2,794,355 | | | | — | |
Other debt securities | | | 134 | | | | — | | | | 134 | | | | — | |
Investments in mutual funds and other equity securities | | | 2,071 | | | | — | | | | 2,071 | | | | — | |
Mortgage servicing rights, at fair value | | | 18,184 | | | | — | | | | — | | | | 18,184 | |
Derivatives | | | 7,955 | | | | — | | | | 7,955 | | | | — | |
| | | | |
Total assets measured at fair value | | $ | 3,197,026 | | | $ | 2,309 | | | $ | 3,176,533 | | | $ | 18,184 | |
| | | | |
Junior subordinated debentures, at fair value | | $ | 82,905 | | | $ | — | | | $ | — | | | $ | 82,905 | |
Derivatives | | | 6,509 | | | | — | | | | 6,509 | | | | — | |
| | | | |
Total liabilities measured at fair value | | $ | 89,414 | | | $ | — | | | $ | 6,509 | | | $ | 82,905 | |
| | | | |
| | | | | | | | | | | | | | | | |
| | | Fair Value at December 31, 2010 | |
| Description | | Total | | | Level 1 | | | Level 2 | | | Level 3 | |
Trading securities | | | | | | | | | | | | | | | | |
Obligations of states and political subdivisions | | $ | 1,282 | | | $ | 1,282 | | | $ | — | | | $ | — | |
Equity securities | | | 1,645 | | | | 1,645 | | | | — | | | | — | |
Other investments securities(1) | | | 97 | | | | 97 | | | | — | | | | — | |
Available for sale securities | | | | | | | | | | | | | | | | |
U.S. Treasury and agencies | | | 118,789 | | | | — | | | | 118,789 | | | | — | |
Obligations of states and political subdivisions | | | 216,726 | | | | — | | | | 216,726 | | | | — | |
Residential mortgage-backed securities and collateralized mortgage obligations | | | 2,581,504 | | | | — | | | | 2,581,504 | | | | — | |
Other debt securities | | | 152 | | | | — | | | | 152 | | | | — | |
Investments in mutual funds and other equity securities | | | 2,009 | | | | — | | | | 2,009 | | | | — | |
Mortgage servicing rights, at fair value | | | 14,454 | | | | — | | | | — | | | | 14,454 | |
Derivatives | | | 1,060 | | | | — | | | | 1,060 | | | | — | |
| | | | |
Total assets measured at fair value | | $ | 2,937,718 | | | $ | 3,024 | | | $ | 2,920,240 | | | $ | 14,454 | |
| | | | |
Junior subordinated debentures, at fair value | | $ | 80,688 | | | $ | — | | | $ | — | | | $ | 80,688 | |
Derivatives | | | 361 | | | | — | | | | 361 | | | | — | |
| | | | |
Total liabilities measured at fair value | | $ | 81,049 | | | $ | — | | | $ | 361 | | | $ | 80,688 | |
| | | | |
Umpqua Holdings Corporation and Subsidiaries
��
(1) | Principally represents U.S. Treasury and agencies or residential mortgage-backed securities issued or guaranteed by governmental agencies. |
The following methods and assumptions were used to estimate the fair value of each class of financial instrument for which it is practicable to estimate that value:
Cash and Cash Equivalents—For short-term instruments, including cash and due from banks, and interest bearing deposits with banks, the carrying amount is a reasonable estimate of fair value.
Securities—Fair values for investment securities are primarily measured using information from a third-party pricing service. The pricing service uses evaluated pricing models based on market data. In the event that limited or less transparent information is provided by the third-party pricing service, fair value is estimated using secondary pricing services or non-binding third-party broker quotes. Management periodically reviews the pricing information received from the third-party pricing service and compares it to secondary pricing service, evaluating significant price variances between services to determine an appropriate estimate of fair value to report.
Loans Held For Sale—For loans held for sale, carrying value approximates fair value.
Non-covered Loans and Leases, net—Fair values are estimated for portfolios of loans and leases with similar financial characteristics. Loans are segregated by type, including commercial, real estate and consumer loans. Each loan category is further segregated by fixed and variable rate. For variable rate loans, carrying value approximates fair value. Effective in the second quarter of 2010, the fair value of fixed rate loans is calculated by discounting contractual cash flows at rates which similar loans are currently being made. These amounts are discounted further by embedded probable losses expected to be realized in the portfolio.
Covered Loans and leases, net—Covered loans and leases are initially measured at their estimated fair value on their date of acquisition as described in Note 7. Subsequent to acquisition, the fair value of covered loans is measured using the same methodology as that of non-covered loans.
Restricted Equity Securities—The carrying value of restricted equity securities approximates fair value as the shares can only be redeemed by the issuing institution at par.
Mortgage Servicing Rights—The fair value of mortgage servicing rights is estimated using a discounted cash flow model. Assumptions used include market discount rates, anticipated prepayment speeds, delinquency and foreclosure rates, and ancillary fee income. This model is periodically validated by an independent external model validation group. The model assumptions and the MSR fair value estimates are also compared to observable trades of similar portfolios as well as to MSR broker valuations and industry surveys, as available. Due to the limited observability of all significant inputs utilized in the valuation model, particularly the discount rate and projected constant prepayment rate, and how changes in these assumptions could potentially impact the ending valuation of this asset, as well as the lack of readily available quotes or observable trades of similar assets in the current period, we classify this as a Level 3 fair value measure. Management believes the significant inputs utilized are indicative of those that would be used by market participants.
Bank Owned Life Insurance Assets—Fair values of insurance policies owned are based on the insurance contract’s cash surrender value.
FDIC Indemnification Asset—The FDIC indemnification asset is calculated as the expected future cash flows under the loss-share agreement discounted by a rate reflective of the creditworthiness of the FDIC as would be required from the market.
Deposits—The fair value of deposits with no stated maturity, such as non-interest bearing deposits, savings and interest checking accounts, and money market accounts, is equal to the amount payable on demand as of December 31, 2011 and 2010. The fair value of certificates of deposit is based on the discounted value of contractual cash flows. The discount rate is estimated using the rates currently offered for deposits of similar remaining maturities.
Securities Sold under Agreements to Repurchase—For short-term instruments, including securities sold under agreements to repurchase, the carrying amount is a reasonable estimate of fair value.
Term Debt—The fair value of medium term notes is calculated based on the discounted value of the contractual cash flows using current rates at which such borrowings can currently be obtained.
Junior Subordinated Debentures—The fair value of junior subordinated debentures is estimated using an income approach valuation technique. The ending carrying (fair) value of the junior subordinated debentures measured at fair value represents the estimated amount that would be paid to transfer these liabilities in an orderly transaction amongst market participants. Due to credit concerns in the capital markets and inactivity in the trust preferred markets that have limited the observability of market spreads, we have classified this as a Level 3 fair value measure.
Derivative Instruments—The fair value of the derivative instruments is estimated using quoted or published market prices for similar instruments, adjusted for factors such as pull-through rate assumptions based on historical information, where appropriate.
Visa Class B Common Stock—The fair value of Visa Class B common stock is estimated by applying a 5% discount to the value of the unredeemed Class A equivalent shares. The discount primarily represents the risk related to the further potential reduction of the conversion ratio between Class B and Class A shares and a liquidity risk premium.
The following table provides a reconciliation of assets and liabilities measured at fair value using significant unobservable inputs (Level 3) on a recurring basis during the years ended December 31, 2011 and 2010.
(in thousands)
| | | | | | | | | | | | | | | | | | | | | | | | |
| | | Beginning
Balance | | | Change
included in
earnings | | | Issuances | | | Settlements | | | Ending
Balance | | | Net change in
unrealized gains
or losses relating
to items held at
end of period | |
2011 | | | | | | | | | | | | | | | | | | | | | | | | |
Mortgage servicing rights | | $ | 14,454 | | | $ | (2,990 | ) | | $ | 6,720 | | | $ | — | | | $ | 18,184 | | | $ | (961 | ) |
Junior subordinated debentures | | | 80,688 | | | | 6,134 | | | | — | | | | (3,917 | ) | | | 82,905 | | | | 6,134 | |
2010 | | | | | | | | | | | | | | | | | | | | | | | | |
Mortgage servicing rights | | $ | 12,625 | | | $ | (3,878 | ) | | $ | 5,707 | | | $ | — | | | $ | 14,454 | | | $ | (1,965 | ) |
Junior subordinated debentures | | | 85,666 | | | | (1,004 | ) | | | — | | | | (3,974 | ) | | | 80,688 | | | | (1,004 | ) |
Losses on mortgage servicing rights carried at fair value are recorded in mortgage banking revenue within other non-interest income. Gains (losses) on junior subordinated debentures carried at fair value are recorded within other non-interest income. The contractual interest expense on the junior subordinated debentures is recorded on an accrual basis as interest on junior subordinated debentures within interest expense. Settlements related to the junior subordinated debentures represent the payment of accrued interest that is embedded in the fair value of these liabilities.
Management believes that the credit risk adjusted spread being utilized is indicative of the nonperformance risk premium a willing market participant would require under current market conditions, that is, the inactive market. Management attributes the change in fair value of the junior subordinated debentures during the period to market changes in the nonperformance expectations and pricing of this type of debt, and not as a result of changes to our entity-specific credit risk. Future contractions in the credit risk adjusted the Company’s contractual spreads has primarily contributed to the positive fair value adjustments in 2010. Generally, an increase in the credit risk adjusted spread and/or a decrease in the three month LIBOR swap curve will result in positive fair value adjustments. Conversely, a decrease in the credit risk adjusted spread and/or an increase in the three month LIBOR swap curve will result in negative fair value adjustments.
Additionally, from time to time, certain assets are measured at fair value on a nonrecurring basis. These adjustments to fair value generally result from the application of lower-of-cost-or-market accounting or write-downs of individual assets due to impairment. The following table presents information about the Company’s assets and liabilities measured at fair value on a nonrecurring basis for which a nonrecurring change in fair value has been recorded during the years ended December 31, 2011 and 2010. The amounts disclosed below represent the fair values at the time the nonrecurring fair value measurements were made, and not necessarily the fair value as of the dates reported upon.
Umpqua Holdings Corporation and Subsidiaries
(in thousands)
| | | | | | | | | | | | | | | | |
| | | December 31, 2011 | |
| | | | |
| Description | | Total | | | Level 1 | | | Level 2 | | | Level 3 | |
Investment securities, held to maturity | | | | | | | | | | | | | | | | |
Residential mortgage-backed securities and collateralized mortgage obligations | | $ | 487 | | | $ | — | | | $ | — | | | $ | 487 | |
Non-covered loans and leases | | | 53,847 | | | | — | | | | — | | | | 53,847 | |
Non-covered other real estate owned | | | 11,321 | | | | — | | | | — | | | | 11,321 | |
Covered other real estate owned | | | 12,561 | | | | — | | | | — | | | | 12,561 | |
| | | | | | | | | | | | | | | | |
| | $ | 78,216 | | | $ | — | | | $ | — | | | $ | 78,216 | |
| | | | |
| |
| | | December 31, 2010 | |
| | | | |
| Description | | Total | | | Level 1 | | | Level 2 | | | Level 3 | |
Investment securities, held to maturity | | | | | | | | | | | | | | | | |
Residential mortgage-backed securities and collateralized mortgage obligations | | $ | 1,226 | | | $ | — | | | $ | — | | | $ | 1,226 | |
Non-covered loans and leases | | | 74,639 | | | | — | | | | — | | | | 74,639 | |
Non-covered other real estate owned | | | 7,958 | | | | — | | | | — | | | | 7,958 | |
Covered other real estate owned | | | 8,708 | | | | — | | | | — | | | | 8,708 | |
| | | | |
| | $ | 92,531 | | | $ | — | | | $ | — | | | $ | 92,531 | |
| | | | |
The following table presents the losses resulting from nonrecurring fair value adjustments for the years ended December 31, 2011, 2010 and 2009:
(in thousands)
| | | | | | | | | | | | |
| | | 2011 | | | 2010 | | | 2009 | |
Investment securities, held to maturity | | | | | | | | | | | | |
Residential mortgage-backed securities and collateralized mortgage obligations | | $ | 359 | | | $ | 414 | | | $ | 10,334 | |
Non-covered loans and leases | | | 51,883 | | | | 119,240 | | | | 185,810 | |
Goodwill | | | — | | | | — | | | | 111,952 | |
Other intangible assets, net | | | — | | | | — | | | | 804 | |
Non-covered other real estate owned | | | 8,947 | | | | 4,074 | | | | 12,247 | |
Covered other real estate owned | | | 8,709 | | | | 1,941 | | | | — | |
| | | | |
Total loss from nonrecurring measurements | | $ | 69,898 | | | $ | 125,669 | | | $ | 321,147 | |
| | | | |
The investment securities held to maturity above relate to non-agency collateralized mortgage obligations where other-than-temporary impairment (“OTTI”) has been identified and the investments have been adjusted to fair value. The fair value of these investments securities were obtained from third-party pricing services using matrix or model pricing methodologies and were corroborated by broker indicative bids. While we do not expect to recover the entire amortized cost basis of these securities, as we as we do not intend to sell these securities and it is not likely that we will be required to sell these securities before maturity, only the credit loss component of the impairment is recognized in earnings. The credit loss on a security is measured as the difference between the amortized cost basis and the present value of the cash flows expected to be collected. The remaining impairment loss related to all other factors, the difference between the present value of the cash flows expected to be collected and fair value, is recognized as a charge to a separate component other comprehensive income (“OCI”). We estimate the cash flows of the underlying collateral within each security considering credit, interest and prepayment risk models that incorporate management’s estimate of projected key assumptions including prepayment rates, collateral default rates and
loss severity. Assumptions utilized vary from security to security, and are influenced by factors such as loan interest rates, geographic location, borrower characteristics and vintage, and historical experience. We then use a third party to obtain information about the structure of each security, including subordination and other credit enhancements, in order to determine how the underlying collateral cash flows will be distributed to each security issued in the structure. These cash flows are then discounted at the interest rate used to recognize interest income on each security.
The non-covered loans and leases amount above represents impaired, collateral dependent loans that have been adjusted to fair value. When we identify a collateral dependent loan as impaired, we measure the impairment using the current fair value of the collateral, less selling costs. Depending on the characteristics of a loan, the fair value of collateral is generally estimated by obtaining external appraisals. If we determine that the value of the impaired loan is less than the recorded investment in the loan, we recognize this impairment and adjust the carrying value of the loan to fair value through the allowance for loan and lease losses. The loss represents charge-offs or impairments on collateral dependent loans for fair value adjustments based on the fair value of collateral. The carrying value of loans fully charged-off is zero.
The goodwill amount above represents goodwill that has been adjusted to fair value. The impairment charge recognized in 2009 relates to the Community Banking reporting segment. The Company engaged an independent valuation consultant to assist the Company in estimating the fair value of the Community Banking reporting unit for step one of the goodwill impairment test. We utilized a variety of valuation techniques to analyze and measure the estimated fair value of the reporting unit under both the income and market valuation approach. Under the income approach, the fair value of the reporting unit is determined by projecting future earnings for five years, utilizing a terminal value based on expected future growth rates, and applying a discount rate reflective of current market conditions. The estimation of forecasted earnings uses management’s best estimates of economic and market conditions over the projected periods and considers estimated growth rates in loans and deposits and future expected changes in net interest margins. Various market-based valuation approaches are utilized and include applying market price to earnings, core deposit premium, and tangible book value multiples as observed from relevant, comparable peer companies of the reporting unit. We also valued the reporting unit by applying an estimated control premium to the market capitalization. Weightings are assigned to each of the aforementioned model results, judgmentally allocated based on the observability and reliability of the inputs, to arrive at a final fair value estimate of the reporting unit. Because the step one analysis indicated that the implied fair value of goodwill was likely lower than the carrying amount, we completed step two of the goodwill impairment test. In step two of the goodwill impairment test, we calculated the fair value for the reporting unit’s assets and liabilities, as well as its unrecognized identifiable intangible assets, such as the core deposit intangible and trade name, in order to determine the implied fair value of goodwill. Fair value adjustments to items on the balance sheet primarily related to investment securities held to maturity, loans, other real estate owned, Visa Class B common stock, deferred taxes, deposits, term debt, and junior subordinated debentures carried at amortized cost. The external valuation specialist assisted management to estimate the fair value of our unrecognized identifiable assets, such as the core deposit intangible and trade name. Information relating to our methodologies for estimating the fair value of financial instruments is described above. Through this process, the Company determined that the implied fair value of the reporting unit’s goodwill was less than its carrying amount, and as a result, we recognized a goodwill impairment charge equal to that deficit.
The other intangible asset, net, amount above represents a merchant servicing portfolio income stream that has been adjusted to fair value. The impairment charge is a result of a decrease in the actual and expected future cash flows related to the income stream. The fair value of the merchant servicing portfolio was determined using an income approach (discounted cash flow model). Future cash flows were estimated based on actual historical experience and consideration of future expectations, including the discount revenue rates, offsetting operating expenses, growth and attrition rates, as well as other factors, discounted at a 14% discount rate.
The non-covered and covered other real estate owned amount above represents impaired real estate that has been adjusted to fair value. Non-covered other real estate owned represents real estate which the Bank has taken control of in partial or full satisfaction of loans. At the time of foreclosure, other real estate owned is recorded at the lower of the carrying amount of the loan or fair value less costs to sell, which becomes the property’s new basis. Any write-downs based on the asset’s fair value at the date of acquisition are charged to the allowance for loan and lease losses. After foreclosure, management periodically
Umpqua Holdings Corporation and Subsidiaries
performs valuations such that the real estate is carried at the lower of its new cost basis or fair value, net of estimated costs to sell. Fair value adjustments on other real estate owned are recognized within net loss on real estate owned. The loss represents impairments on non-covered other real estate owned for fair value adjustments based on the fair value of the real estate.
NOTE 25. EARNINGS PER COMMON SHARE
The following is a computation of basic and diluted earnings per common share for the years ended December 31, 2011, 20102014, 2013 and 2009:
(in thousands, except per share data)
| | | | | | | | | | | | |
| | | 2011 | | | 2010 | | | 2009 | |
NUMERATORS: | | | | | | | | | | | | |
Net income (loss) | | $ | 74,496 | | | $ | 28,326 | | | $ | (153,366 | ) |
Preferred stock dividends | | | — | | | | 12,192 | | | | 12,866 | |
Dividends and undistributed earnings allocated to participating securities(1) | | | 356 | | | | 67 | | | | 30 | |
| | | | |
Net earnings (loss) available to common shareholders | | $ | 74,140 | | | $ | 16,067 | | | $ | (166,262 | ) |
| | | | |
DENOMINATORS: | | | | | | | | | | | | |
Weighted average number of common shares outstanding—basic | | | 114,220 | | | | 107,922 | | | | 70,399 | |
Effect of potentially dilutive common shares(2) | | | 189 | | | | 231 | | | | — | |
| | | | |
Weighted average number of common shares outstanding—diluted | | | 114,409 | | | | 108,153 | | | | 70,399 | |
| | | | |
EARNINGS (LOSS) PER COMMON SHARE: | | | | | | | | | | | | |
Basic | | $ | 0.65 | | | $ | 0.15 | | | $ | (2.36 | ) |
Diluted | | $ | 0.65 | | | $ | 0.15 | | | $ | (2.36 | ) |
|
| | | | | | | | | | | |
(in thousands, except per share data) | 2014 | | 2013 | | 2012 |
| NUMERATORS: | | | | | |
| Net income | $ | 147,520 |
| | $ | 98,361 |
| | $ | 101,891 |
|
| Less: | | | | | |
Dividends and undistributed earnings allocated to participating securities (1) | 484 |
| | 788 |
| | 682 |
|
| Net earnings available to common shareholders | $ | 147,036 |
| | $ | 97,573 |
| | $ | 101,209 |
|
| DENOMINATORS: | | | | | |
| Weighted average number of common shares outstanding - basic | 186,550 |
| | 111,938 |
| | 111,935 |
|
Effect of potentially dilutive common shares (2) | 994 |
| | 238 |
| | 216 |
|
| Weighted average number of common shares outstanding - diluted | 187,544 |
| | 112,176 |
| | 112,151 |
|
| EARNINGS PER COMMON SHARE: | | | | | |
| Basic | $ | 0.79 |
| | $ | 0.87 |
| | $ | 0.90 |
|
| Diluted | $ | 0.78 |
| | $ | 0.87 |
| | $ | 0.90 |
|
| |
| (1) | Represents dividends paid and undistributed earnings allocated to nonvested restricted stock awards. |
| |
| (2) | Represents the effect of the assumed exercise of warrants, assumed exercise of stock options, vesting of non-participating restricted shares, and vesting of restricted stock units, based on the treasury stock method. |
The following table presents the weighted average outstanding non-participating securities that were not included in the computation of diluted earnings per common share because their effect would be anti-dilutive for the years ended December 31, 2011, 20102014, 2013 and 2009:(in thousands)
| | | | | | | | | | | | |
| | | 2011 | | | 2010 | | | 2009 | |
Stock options | | | 1,815 | | | | 1,450 | | | | 1,826 | |
CPP warrant | | | — | | | | 274 | | | | 1,811 | |
Non-participating, nonvested restricted shares | | | — | | | | 9 | | | | 17 | |
Restricted stock units | | | — | | | | — | | | | 100 | |
| | | | |
| | | 1,815 | | | | 1,733 | | | | 3,754 | |
| | | | |
In the fourth quarter
2012. |
| | | | | | | | |
| (in thousands) | 2014 | | 2013 | | 2012 |
| Stock options | 443 |
| | 669 |
| | 1,306 |
|
NOTE 26. OPERATING SEGMENTSNote 25– Segment Information
The Company operates threetwo primary segments: Community Banking Mortgage Banking and Wealth Management.Home Lending. The Community Banking segment’ssegment's principal business focus is the offering of loan and deposit products to its business and retail customers in its primary market areas. As of December 31, 2011,2014, the Community Banking segment operates 194operated 385 locations throughout Oregon, Northern California, Washington, Idaho, and Nevada. The
Mortgage BankingHome Lending segment, which operates as a division of the Bank, originates, sells and services residential mortgage loans.
The
In the second quarter of 2014, the Company combined its Wealth Management segment
consists ofinto the
operations of Umpqua Investments, which offers a full range of retail brokerage services and products to its clients who consist primarily of individual investors, and Umpqua Private Bank, which serves high net worth individuals with liquid investable assets and provides customized financial solutions and offerings, and Umpqua Financial Advisors. The Company accounts for intercompany fees and services between Umpqua Investments and the Bank at estimated fair value according to regulatory requirements for services provided. Intercompany items relate primarily to management services, referral fees and deposit rebates.Prior to January 1, 2011, the Company reported Retail Brokerage, consisting of Umpqua Investments,Community Banking segment as its own segment. Effective in 2011, the Company began reporting Umpqua Investments, Umpqua Private Bank, and Umpqua Financial Advisors under the Wealth Management no longer met the definition of an operating segment. Umpqua Private Bank and Umpqua Financial Advisors do not meet the quantitative thresholdsThe segment results for reporting as separate segments and service the same customer base as Umpqua Investments. As a result of the change in reportable segment, priorcomparable periods have been adjusted inmodified to reflect the financial information below.
current period presentation.
Summarized financial information concerning the
Company’sCompany's reportable segments and the reconciliation to the consolidated financial results is shown in the following tables:
|
| | | | | | | | | | | |
| Year Ended December 31, 2014 | | | | | |
(in thousands) | Community | | Home | | |
| | Banking | | Lending | | Consolidated |
| Interest income | $ | 755,374 |
| | $ | 67,147 |
| | $ | 822,521 |
|
| Interest expense | 43,077 |
| | 5,616 |
| | 48,693 |
|
| Net interest income | 712,297 |
| | 61,531 |
| | 773,828 |
|
| Provision for loan and lease losses | 40,241 |
| | — |
| | 40,241 |
|
| Non-interest income | 91,295 |
| | 87,997 |
| | 179,292 |
|
| Non-interest expense | 615,275 |
| | 68,788 |
| | 684,063 |
|
| Income before income taxes | 148,076 |
| | 80,740 |
| | 228,816 |
|
| Provision for income taxes | 52,683 |
| | 28,613 |
| | 81,296 |
|
| Net income | 95,393 |
| | 52,127 |
| | 147,520 |
|
| Dividends and undistributed earnings allocated | | | | | |
| to participating securities | 484 |
| | — |
| | 484 |
|
| Net earnings available to common shareholders | $ | 94,909 |
| | $ | 52,127 |
| | $ | 147,036 |
|
| | | | | | |
| Total assets | $ | 20,098,560 |
| | $ | 2,514,714 |
| | $ | 22,613,274 |
|
| Total loans and leases | $ | 13,181,463 |
| | $ | 2,146,269 |
| | $ | 15,327,732 |
|
| Total deposits | $ | 16,850,682 |
| | $ | 41,417 |
| | $ | 16,892,099 |
|
|
| | | | | | | | | | | |
| Year Ended December 31, 2013 | | | | | |
| (in thousands) | Community | | Home | | |
| | Banking | | Lending | | Consolidated |
| Interest income | $ | 420,854 |
| | $ | 21,992 |
| | $ | 442,846 |
|
| Interest expense | 35,367 |
| | 2,514 |
| | 37,881 |
|
| Net interest income | 385,487 |
| | 19,478 |
| | 404,965 |
|
| Provision for loan and lease losses | 10,716 |
| | — |
| | 10,716 |
|
| Non-interest income | 42,102 |
| | 79,339 |
| | 121,441 |
|
| Non-interest expense | 325,743 |
| | 38,918 |
| | 364,661 |
|
| Income before income taxes | 91,130 |
| | 59,899 |
| | 151,029 |
|
| Provision for income taxes | 28,708 |
| | 23,960 |
| | 52,668 |
|
| Net income | 62,422 |
| | 35,939 |
| | 98,361 |
|
| Dividends and undistributed earnings allocated | | | | | |
| to participating securities | 788 |
| | — |
| | 788 |
|
| Net earnings available to common shareholders | $ | 61,634 |
| | $ | 35,939 |
| | $ | 97,573 |
|
| | | | | | |
| Total assets | $ | 10,949,050 |
| | $ | 687,062 |
| | $ | 11,636,112 |
|
| Total loans and leases | $ | 7,196,137 |
| | $ | 532,029 |
| | $ | 7,728,166 |
|
| Total deposits | $ | 9,090,959 |
| | $ | 26,701 |
| | $ | 9,117,660 |
|
|
| | | | | | | | | | | |
| Year Ended December 31, 2012 | | | | | |
| (in thousands) | Community | | Home | | |
| | Banking | | Lending | | Consolidated |
| Interest income | $ | 435,814 |
| | $ | 20,271 |
| | $ | 456,085 |
|
| Interest expense | 46,105 |
| | 2,744 |
| | 48,849 |
|
| Net interest income | 389,709 |
| | 17,527 |
| | 407,236 |
|
| Provision for loan and lease losses | 29,201 |
| | — |
| | 29,201 |
|
| Non-interest income | 52,031 |
| | 84,798 |
| | 136,829 |
|
| Non-interest expense | 322,197 |
| | 37,455 |
| | 359,652 |
|
| Income before income taxes | 90,342 |
| | 64,870 |
| | 155,212 |
|
| Provision for income taxes | 27,373 |
| | 25,948 |
| | 53,321 |
|
| Net income | 62,969 |
| | 38,922 |
| | 101,891 |
|
| Dividends and undistributed earnings allocated | | | | | |
| to participating securities | 682 |
| | — |
| | 682 |
|
| Net earnings available to common shareholders | $ | 62,287 |
| | $ | 38,922 |
| | $ | 101,209 |
|
| | | | | | |
| Total assets | $ | 11,075,366 |
| | $ | 720,077 |
| | $ | 11,795,443 |
|
| Total loans and leases | $ | 6,806,199 |
| | $ | 370,234 |
| | $ | 7,176,433 |
|
| Total deposits | $ | 9,350,900 |
| | $ | 28,375 |
| | $ | 9,379,275 |
|
Year Ended December 31, 2011Note 26(in thousands)
| | | | | | | | | | | | | | | | |
| | | Community
Banking | | | Wealth
Management | | | Mortgage
Banking | | | Consolidated | |
Interest income | | $ | 474,167 | | | $ | 13,362 | | | $ | 14,224 | | | $ | 501,753 | |
Interest expense | | | 68,751 | | | | 2,067 | | | | 2,483 | | | | 73,301 | |
| | | | |
Net interest income | | | 405,416 | | | | 11,295 | | | | 11,741 | | | | 428,452 | |
Provision for non-covered loan and lease losses | | | 46,220 | | | | — | | | | — | | | | 46,220 | |
Provision for covered loan and lease losses | | | 16,141 | | | | — | | | | — | | | | 16,141 | |
Non-interest income | | | 43,282 | | | | 13,963 | | | | 26,873 | | | | 84,118 | |
Non-interest expense | | | 302,883 | | | | 15,630 | | | | 20,458 | | | | 338,971 | |
| | | | |
Income before provision for income taxes | | | 83,454 | | | | 9,628 | | | | 18,156 | | | | 111,238 | |
Provision for income taxes | | | 26,023 | | | | 3,457 | | | | 7,262 | | | | 36,742 | |
| | | | |
Net income | | | 57,431 | | | | 6,171 | | | | 10,894 | | | | 74,496 | |
Dividends and undistributed earnings allocated to participating
securities | | | 356 | | | | — | | | | — | | | | 356 | |
| | | | |
Net earnings available to common shareholders | | $ | 57,075 | | | $ | 6,171 | | | $ | 10,894 | | | $ | 74,140 | |
| | | | |
Total assets | | $ | 11,086,493 | | | $ | 53,044 | | | $ | 423,818 | | | $ | 11,563,355 | |
Total loans (covered and non-covered) | | $ | 6,171,368 | | | $ | 38,810 | | | $ | 300,371 | | | $ | 6,510,549 | |
Total deposits | | $ | 8,830,353 | | | $ | 390,992 | | | $ | 15,345 | | | $ | 9,236,690 | |
Umpqua Holdings Corporation and Subsidiaries
Year Ended December 31, 2010– Related Party Transactions
(in thousands)
| | | | | | | | | | | | | | | | |
| | | Community | | | Wealth | | | Mortgage | | | | |
| | | Banking | | | Management | | | Banking | | | Consolidated | |
Interest income | | $ | 466,054 | | | $ | 9,978 | | | $ | 12,564 | | | $ | 488,596 | |
Interest expense | | | 89,622 | | | | 1,435 | | | | 2,755 | | | | 93,812 | |
| | | | |
Net interest income | | | 376,432 | | | | 8,543 | | | | 9,809 | | | | 394,784 | |
Provision for non-covered loan and lease losses | | | 113,668 | | | | — | | | | — | | | | 113,668 | |
Provision for covered loan and lease losses | | | 5,151 | | | | — | | | | — | | | | 5,151 | |
Non-interest income | | | 41,534 | | | | 12,967 | | | | 21,403 | | | | 75,904 | |
Non-interest expense | | | 286,629 | | | | 15,503 | | | | 15,606 | | | | 317,738 | |
| | | | |
Income before (benefit from) provision for income taxes | | | 12,518 | | | | 6,007 | | | | 15,606 | | | | 34,131 | |
(Benefit from) provision for income taxes | | | (2,342 | ) | | | 1,905 | | | | 6,242 | | | | 5,805 | |
| | | | |
Net income | | | 14,860 | | | | 4,102 | | | | 9,364 | | | | 28,326 | |
Preferred stock dividends | | | 12,192 | | | | — | | | | — | | | | 12,192 | |
Dividends and undistributed earnings allocated to participating securities | | | 67 | | | | — | | | | — | | | | 67 | |
| | | | |
Net earnings available to common shareholders | | $ | 2,601 | | | $ | 4,102 | | | $ | 9,364 | | | $ | 16,067 | |
| | | | |
Total assets | | $ | 11,314,681 | | | $ | 37,757 | | | $ | 316,272 | | | $ | 11,668,710 | |
Total loans (covered and non-covered) | | $ | 6,198,532 | | | $ | 23,631 | | | $ | 222,722 | | | $ | 6,444,885 | |
Total deposits | | $ | 9,160,058 | | | $ | 262,148 | | | $ | 11,599 | | | $ | 9,433,805 | |
Year Ended December 31, 2009
(in thousands)
| | | | | | | | | | | | | | | | |
| | | Community | | | Wealth | | | Mortgage | | | | |
| | | Banking | | | Management | | | Banking | | | Consolidated | |
Interest income | | $ | 406,460 | | | $ | 4,467 | | | $ | 12,805 | | | $ | 423,732 | |
Interest expense | | | 99,382 | | | | 1 | | | | 3,641 | | | | 103,024 | |
| | | | |
Net interest income | | | 307,078 | | | | 4,466 | | | | 9,164 | | | | 320,708 | |
Provision for loan and lease losses | | | 209,124 | | | | — | | | | — | | | | 209,124 | |
Non-interest income | | | 45,280 | | | | 9,344 | | | | 18,892 | | | | 73,516 | |
Non-interest expense | | | 352,290 | | | | 12,910 | | | | 14,203 | | | | 379,403 | |
| | | | |
(Loss) income before (benefit from) provision for income taxes | | | (209,056 | ) | | | 900 | | | | 13,853 | | | | (194,303 | ) |
(Benefit from) provision for income taxes | | | (46,383 | ) | | | (95 | ) | | | 5,541 | | | | (40,937 | ) |
| | | | |
Net (loss) income | | | (162,673 | ) | | | 995 | | | | 8,312 | | | | (153,366 | ) |
Preferred stock dividends | | | 12,866 | | | | — | | | | — | | | | 12,866 | |
Dividends and undistributed earnings allocated to participating securities | | | 30 | | | | — | | | | — | | | | 30 | |
| | | | |
Net (loss) earnings available to common shareholders | | $ | (175,569 | ) | | $ | 995 | | | $ | 8,312 | | | $ | (166,262 | ) |
| | | | |
Total assets | | $ | 9,109,542 | | | $ | 31,196 | | | $ | 240,634 | | | $ | 9,381,372 | |
Total loans (covered and non-covered) | | $ | 5,789,730 | | | $ | 17,484 | | | $ | 192,053 | | | $ | 5,999,267 | |
Total deposits | | $ | 7,432,549 | | | $ | 98 | | | $ | 7,787 | | | $ | 7,440,434 | |
NOTE 27. RELATED PARTY TRANSACTIONS
In the ordinary course of business, the Bank has made loans to its directors and executive officers (and their associated and affiliated companies). All such loans have been made
on the same terms as those prevailing at the time of origination to other borrowers.in accordance with regulatory requirements.
The following table presents a summary of aggregate activity involving related party borrowers for the years ended December 31, 2011, 20102014, 2013 and 2009:(in thousands)
| | | | | | | | | | | | |
| | | 2011 | | | 2010 | | | 2009 | |
Loans outstanding at beginning of year | | $ | 9,264 | | | $ | 12,301 | | | $ | 13,968 | |
New loans and advances | | | 10,041 | | | | 1,409 | | | | 1,819 | |
Less loan repayments | | | (7,060 | ) | | | (3,467 | ) | | | (3,471 | ) |
Reclassification(1) | | | — | | | | (979 | ) | | | (15 | ) |
| | | | |
Loans outstanding at end of year | | $ | 12,245 | | | $ | 9,264 | | | $ | 12,301 | |
| | | | |
(1) | Represents loans that were once considered related party but are no longer considered related party, or loans that were not related party that subsequently became related party loans. |
2012: |
| | | | | | | | | | | | |
| (in thousands) | | 2014 | | 2013 | | 2012 |
| Loans outstanding at beginning of year | | $ | 13,307 |
| | $ | 12,272 |
| | $ | 12,245 |
|
| New loans and advances | | 11,392 |
| | 3,584 |
| | 2,697 |
|
| Less loan repayments | | (2,490 | ) | | (2,213 | ) | | (2,113 | ) |
Reclassification (1) | | (2,491 | ) | | (336 | ) | | (557 | ) |
| Loans outstanding at end of year | | $ | 19,718 |
| | $ | 13,307 |
| | $ | 12,272 |
|
(1) Represents loans that were once considered related party but are no longer considered related party, or loans that were not related party that subsequently became related party loans.
At December 31, 20112014 and 20102013 deposits of related parties amounted to $18.9$13.7 million and $14.7$15.3 million, respectively. NOTE 28. PARENT COMPANY FINANCIAL STATEMENTSNote 27– Parent Company Financial Statements
December 31,(in thousands)
| | | | | | | | |
| | | 2011 | | | 2010 | |
ASSETS | | | | | | | | |
Non-interest bearing deposits with subsidiary banks | | $ | 82,133 | | | $ | 128,450 | |
Investments in: | | | | | | | | |
Bank subsidiary | | | 1,772,003 | | | | 1,695,914 | |
Nonbank subsidiaries | | | 24,486 | | | | 20,560 | |
Receivable from nonbank subsidiary | | | — | | | | 8 | |
Other assets | | | 5,713 | | | | 1,782 | |
| | | | |
Total assets | | $ | 1,884,335 | | | $ | 1,846,714 | |
| | | | |
| | |
LIABILITIES AND SHAREHOLDERS’ EQUITY | | | | | | | | |
Payable to bank subsidiary | | $ | 32 | | | $ | 26 | |
Other liabilities | | | 26,441 | | | | 20,560 | |
Junior subordinated debentures, at fair value | | | 82,905 | | | | 80,688 | |
Junior subordinated debentures, at amortized cost | | | 102,544 | | | | 102,866 | |
| | | | |
Total liabilities | | | 211,922 | | | | 204,140 | |
Shareholders’ equity | | | 1,672,413 | | | | 1,642,574 | |
| | | | |
Total liabilities and shareholders’ equity | | $ | 1,884,335 | | | $ | 1,846,714 | |
| | | | |
Umpqua Holdings Corporation and Subsidiaries
|
| | | | | | | |
| (in thousands) | 2014 | | 2013 |
| ASSETS | | | |
| Non-interest bearing deposits with subsidiary banks | $ | 102,102 |
| | $ | 72,679 |
|
| Investments in: | | | |
| Bank subsidiary | 4,054,288 |
| | 1,847,168 |
|
| Nonbank subsidiaries | 38,776 |
| | 29,193 |
|
| Other assets | 4,079 |
| | 1,590 |
|
| Total assets | $ | 4,199,245 |
| | $ | 1,950,630 |
|
| | | | |
| LIABILITIES AND SHAREHOLDERS' EQUITY | | | |
| Payable to bank subsidiary | $ | 33 |
| | $ | 93 |
|
| Other liabilities | 67,345 |
| | 33,938 |
|
| Junior subordinated debentures, at fair value | 249,294 |
| | 87,274 |
|
| Junior subordinated debentures, at amortized cost | 101,576 |
| | 101,899 |
|
| Total liabilities | 418,248 |
| | 223,204 |
|
| Shareholders' equity | 3,780,997 |
| | 1,727,426 |
|
| Total liabilities and shareholders' equity | $ | 4,199,245 |
| | $ | 1,950,630 |
|
Condensed Statements of
OperationsIncome
Year Ended December 31,
(in thousands)
| | | | | | | | | | | | |
| | | 2011 | | | 2010 | | | 2009 | |
INCOME | | | | | | | | | | | | |
Dividends from subsidiaries | | $ | 17,743 | | | $ | 245 | | | $ | 18,306 | |
Other income | | | (2,127 | ) | | | 5,081 | | | | 6,656 | |
| | | | |
Total income | | | 15,616 | | | | 5,326 | | | | 24,962 | |
| | | |
EXPENSES | | | | | | | | | | | | |
Management fees paid to subsidiaries | | | 469 | | | | 291 | | | | 305 | |
Other expenses | | | 9,072 | | | | 9,116 | | | | 10,079 | |
| | | | |
Total expenses | | | 9,541 | | | | 9,407 | | | | 10,384 | |
| | | | |
Income (loss) before income tax benefit and equity in undistributed earnings of subsidiaries | | | 6,075 | | | | (4,081 | ) | | | 14,578 | |
Income tax benefit | | | (4,325 | ) | | | (1,594 | ) | | | (1,677 | ) |
| | | | |
Net income (loss) before equity in undistributed earnings of subsidiaries | | | 10,400 | | | | (2,487 | ) | | | 16,255 | |
Equity in (distributions in excess) undistributed earnings of subsidiaries | | | 64,096 | | | | 30,813 | | | | (169,621 | ) |
| | | | |
Net income (loss) | | | 74,496 | | | | 28,326 | | | | (153,366 | ) |
Preferred stock dividends | | | — | | | | 12,192 | | | | 12,866 | |
Dividends and undistributed earnings allocated to participating securities | | | 356 | | | | 67 | | | | 30 | |
| | | | |
Net earnings (loss) available to common shareholders | | $ | 74,140 | | | $ | 16,067 | | | $ | (166,262 | ) |
| | | | |
|
| | | | | | | | | | | |
| (in thousands) | 2014 | | 2013 | | 2012 |
| INCOME | | | | | |
| Dividends from subsidiaries | $ | 250,848 |
| | $ | 62,241 |
| | $ | 78,755 |
|
| Other income | (5,196 | ) | | (2,321 | ) | | (2,174 | ) |
| Total income | 245,652 |
| | 59,920 |
| | 76,581 |
|
| | | | | | |
| EXPENSES | | | | | |
| Management fees paid to subsidiaries | 533 |
| | 501 |
| | 459 |
|
| Other expenses | 12,966 |
| | 8,885 |
| | 9,189 |
|
| Total expenses | 13,499 |
| | 9,386 |
| | 9,648 |
|
| | | | | | |
| Income before income tax benefit and equity in undistributed | | | | | |
| earnings of subsidiaries | 232,153 |
| | 50,534 |
| | 66,933 |
|
| Income tax benefit | (7,336 | ) | | (4,446 | ) | | (4,904 | ) |
| Net income before equity in undistributed earnings of subsidiaries | 239,489 |
| | 54,980 |
| | 71,837 |
|
| Equity in undistributed earnings of subsidiaries | (91,969 | ) | | 43,381 |
| | 30,054 |
|
| Net income | 147,520 |
| | 98,361 |
| | 101,891 |
|
| Dividends and undistributed earnings allocated to participating securities | 484 |
| | 788 |
| | 682 |
|
| Net earnings available to common shareholders | $ | 147,036 |
| | $ | 97,573 |
| | $ | 101,209 |
|
Condensed Statements of Cash Flows
Year Ended December 31,
(in thousands)
| | | | | | | | | | | | |
| | | 2011 | | | 2010 | | | 2009 | |
OPERATING ACTIVITIES: | | | | | | | | | | | | |
Net income (loss) | | $ | 74,496 | | | $ | 28,326 | | | $ | (153,366 | ) |
Adjustment to reconcile net income (loss) to net cash provided by operating activities: | | | | | | | | | | | | |
(Distributions in excess) equity in undistributed earnings of subsidiaries | | | (64,096 | ) | | | (30,813 | ) | | | 169,621 | |
Gain on sale of investment securities | | | — | | | | — | | | | (79 | ) |
Depreciation, amortization and accretion | | | (322 | ) | | | (322 | ) | | | (467 | ) |
Change in fair value of junior subordinated debentures | | | 2,217 | | | | (4,978 | ) | | | (6,854 | ) |
Net (increase) decrease in other assets | | | (3,933 | ) | | | 3,717 | | | | (637 | ) |
Net increase (decrease) in other liabilities | | | 3,736 | | | | (1,930 | ) | | | 1,523 | |
| | | | |
Net cash provided (used) by operating activities | | | 12,098 | | | | (6,000 | ) | | | 9,741 | |
| | | |
INVESTING ACTIVITIES: | | | | | | | | | | | | |
Investment in subsidiaries | | | (3,668 | ) | | | (126,500 | ) | | | (87,000 | ) |
Proceeds from investment securities held to maturity | | | — | | | | — | | | | 229 | |
Net decrease (increase) in receivables from nonbank subsidiaries | | | 8 | | | | (8 | ) | | | — | |
| | | | |
Net cash used by investing activities | | | (3,660 | ) | | | (126,508 | ) | | | (86,771 | ) |
| | | |
FINANCING ACTIVITIES: | | | | | | | | | | | | |
Net increase (decrease) in payables to subsidiaries | | | 7 | | | | (34 | ) | | | 53 | |
Proceeds from issuance of preferred stock | | | — | | | | 198,289 | | | | — | |
Redemption of preferred stock | | | — | | | | (214,181 | ) | | | — | |
Redemption of warrants | | | — | | | | (4,500 | ) | | | — | |
Net proceeds from issuance of common stock | | | — | | | | 89,786 | | | | 245,697 | |
Dividends paid on preferred stock | | | — | | | | (3,686 | ) | | | (10,739 | ) |
Dividends paid on common stock | | | (25,317 | ) | | | (20,626 | ) | | | (13,399 | ) |
Stock repurchased | | | (29,754 | ) | | | (284 | ) | | | (174 | ) |
Proceeds from exercise of stock options | | | 309 | | | | 1,004 | | | | 301 | |
| | | | |
Net cash (used) provided by financing activities | | | (54,755 | ) | | | 45,768 | | | | 221,739 | |
Change in cash and cash equivalents | | | (46,317 | ) | | | (86,740 | ) | | | 144,709 | |
Cash and cash equivalents, beginning of year | | | 128,450 | | | | 215,190 | | | | 70,481 | |
| | | | |
Cash and cash equivalents, end of year | | $ | 82,133 | | | $ | 128,450 | | | $ | 215,190 | |
| | | | |
Umpqua Holdings Corporation and Subsidiaries
|
| | | | | | | | | | | |
| (in thousands) | 2014 | | 2013 | | 2012 |
| OPERATING ACTIVITIES: | | | | | |
| Net income | $ | 147,520 |
| | $ | 98,361 |
| | $ | 101,891 |
|
| Adjustment to reconcile net income to net cash | | | | | |
| provided by operating activities: | | | | | |
| Equity in undistributed earnings of subsidiaries | 91,969 |
| | (43,381 | ) | | (30,054 | ) |
| Depreciation, amortization and accretion | (322 | ) | | (322 | ) | | (322 | ) |
| Change in fair value of junior subordinated debentures | 5,849 |
| | 2,193 |
| | 2,182 |
|
| Net (increase) decrease in other assets | (6,020 | ) | | (92 | ) | | 4,925 |
|
| Net (decrease) increase in other liabilities | (8,708 | ) | | (1,361 | ) | | (1,184 | ) |
| Net cash provided by operating activities | 230,288 |
| | 55,398 |
| | 77,438 |
|
| | | | | | |
| INVESTING ACTIVITIES: | | | | | |
| Investment in subsidiaries | 6 |
| | (2,928 | ) | | (24,970 | ) |
| Acquisitions | (102,143 | ) | | — |
| | 419 |
|
| Net cash used by investing activities | (102,137 | ) | | (2,928 | ) | | (24,551 | ) |
| | | | | | |
| FINANCING ACTIVITIES: | | | | | |
| Net (decrease) increase in payables to subsidiaries | (4 | ) | | (8,448 | ) | | 17 |
|
| Dividends paid on common stock | (99,233 | ) | | (50,767 | ) | | (46,201 | ) |
| Stock repurchased | (7,183 | ) | | (9,356 | ) | | (7,433 | ) |
| Proceeds from exercise of stock options | 7,692 |
| | 6,397 |
| | 980 |
|
| Net cash used by financing activities | (98,728 | ) | | (62,174 | ) | | (52,637 | ) |
| | | | | | |
| Change in cash and cash equivalents | 29,423 |
| | (9,704 | ) | | 250 |
|
| Cash and cash equivalents, beginning of year | 72,679 |
| | 82,383 |
| | 82,133 |
|
| Cash and cash equivalents, end of year | $ | 102,102 |
| | $ | 72,679 |
| | $ | 82,383 |
|
NOTE 29. QUARTERLY FINANCIAL INFORMATIONNote 28– Quarterly Financial Information (Unaudited)
The following tables present the summary results for the eight quarters ending December 31,
2011:2011
(in thousands, except per share information)
| | | | | | | | | | | | | | | | | | | | |
| | | 2011 | |
| | | December 31 | | | September 30 | | | June 30 | | | March 31 | | | Four Quarters | |
Interest income | | $ | 121,917 | | | $ | 126,527 | | | $ | 128,417 | | | $ | 124,892 | | | $ | 501,753 | |
Interest expense | | | 15,262 | | | | 18,993 | | | | 19,056 | | | | 19,990 | | | | 73,301 | |
| | | | |
Net interest income | | | 106,655 | | | | 107,534 | | | | 109,361 | | | | 104,902 | | | | 428,452 | |
Provision for non-covered loan and lease losses | | | 6,642 | | | | 9,089 | | | | 15,459 | | | | 15,030 | | | | 46,220 | |
Provision for covered loan and lease losses | | | 698 | | | | 4,420 | | | | 3,755 | | | | 7,268 | | | | 16,141 | |
Non-interest income | | | 18,128 | | | | 24,778 | | | | 19,627 | | | | 21,585 | | | | 84,118 | |
Non-interest expense | | | 85,339 | | | | 86,224 | | | | 83,207 | | | | 84,201 | | | | 338,971 | |
| | | | |
Income before provision for income taxes | | | 32,104 | | | | 32,579 | | | | 26,567 | | | | 19,988 | | | | 111,238 | |
Provision for income taxes | | | 10,722 | | | | 10,717 | | | | 8,782 | | | | 6,521 | | | | 36,742 | |
| | | | |
Net income | | | 21,382 | | | | 21,862 | | | | 17,785 | | | | 13,467 | | | | 74,496 | |
Dividends and undistributed earnings allocated to participating securities | | | 103 | | | | 105 | | | | 86 | | | | 62 | | | | 356 | |
| | | | |
Net earnings available to common shareholders | | $ | 21,279 | | | $ | 21,757 | | | $ | 17,699 | | | $ | 13,405 | | | $ | 74,140 | |
| | | | |
Basic earnings per common share | | $ | 0.19 | | | $ | 0.19 | | | $ | 0.15 | | | $ | 0.12 | | | | | |
Diluted earnings per common share | | $ | 0.19 | | | $ | 0.19 | | | $ | 0.15 | | | $ | 0.12 | | | | | |
Cash dividends declared per common share | | $ | 0.07 | | | $ | 0.07 | | | $ | 0.05 | | | $ | 0.05 | | | | | |
2010
(in thousands, except per share information)
| | | | | | | | | | | | | | | | | | | | |
| | | 2010 | |
| | | December 31 | | | September 30 | | | June 30 | | | March 31 | | | Four Quarters | |
Interest income | | $ | 130,677 | | | $ | 132,946 | | | $ | 115,604 | | | $ | 109,369 | | | $ | 488,596 | |
Interest expense | | | 23,562 | | | | 24,629 | | | | 23,304 | | | | 22,317 | | | | 93,812 | |
| | | | |
Net interest income | | | 107,115 | | | | 108,317 | | | | 92,300 | | | | 87,052 | | | | 394,784 | |
Provision for non-covered loan and lease losses | | | 17,567 | | | | 24,228 | | | | 29,767 | | | | 42,106 | | | | 113,668 | |
Provision for covered loan and lease losses | | | 4,484 | | | | 667 | | | | — | | | | — | | | | 5,151 | |
Non-interest income | | | 15,161 | | | | 12,133 | | | | 18,563 | | | | 30,047 | | | | 75,904 | |
Non-interest expense | | | 87,864 | | | | 85,170 | | | | 74,833 | | | | 69,871 | | | | 317,738 | |
| | | | |
Income before provision for (benefit from) income taxes | | | 12,361 | | | | 10,385 | | | | 6,263 | | | | 5,122 | | | | 34,131 | |
Provision for (benefit from) income taxes | | | 4,203 | | | | 2,194 | | | | 2,800 | | | | (3,392 | ) | | | 5,805 | |
| | | | |
Net income | | | 8,158 | | | | 8,191 | | | | 3,463 | | | | 8,514 | | | | 28,326 | |
Preferred stock dividends | | | — | | | | — | | | | — | | | | 12,192 | | | | 12,192 | |
Dividends and undistributed earnings allocated to participating securities | | | 18 | | | | 18 | | | | 16 | | | | 15 | | | | 67 | |
| | | | |
Net earnings (loss) available to common shareholders | | $ | 8,140 | | | $ | 8,173 | | | $ | 3,447 | | | $ | (3,693 | ) | | $ | 16,067 | |
| | | | |
Basic earnings (loss) per common share | | $ | 0.07 | | | $ | 0.07 | | | $ | 0.03 | | | $ | (0.04 | ) | | | | |
Diluted earnings (loss) per common share | | $ | 0.07 | | | $ | 0.07 | | | $ | 0.03 | | | $ | (0.04 | ) | | | | |
Cash dividends declared per common share | | $ | 0.05 | | | $ | 0.05 | | | $ | 0.05 | | | $ | 0.05 | | | | | |
Umpqua Holdings Corporation
2014:
|
| | | | | | | | | | | | | | | | | | | |
| (in thousands, except per share information) | 2014 |
| | | | | | | | | | Four |
| | December 31 | | September 30 | | June 30 | | March 31 | | Quarters |
| Interest income | $ | 242,151 |
| | $ | 239,523 |
| | $ | 224,967 |
| | $ | 115,880 |
| | $ | 822,521 |
|
| Interest expense | 14,136 |
| | 13,807 |
| | 12,708 |
| | 8,042 |
| | 48,693 |
|
| Net interest income | 228,015 |
| | 225,716 |
| | 212,259 |
| | 107,838 |
| | 773,828 |
|
| Provision for loan and lease losses | 5,241 |
| | 14,333 |
| | 14,696 |
| | 5,971 |
| | 40,241 |
|
| Non-interest income | 49,832 |
| | 61,924 |
| | 44,529 |
| | 23,007 |
| | 179,292 |
|
| Non-interest expense | 190,856 |
| | 182,558 |
| | 214,131 |
| | 96,518 |
| | 684,063 |
|
| Income before provision for income taxes | 81,750 |
| | 90,749 |
| | 27,961 |
| | 28,356 |
| | 228,816 |
|
| Provision for income taxes | 29,204 |
| | 31,760 |
| | 10,740 |
| | 9,592 |
| | 81,296 |
|
| Net income | 52,546 |
| | 58,989 |
| | 17,221 |
| | 18,764 |
| | 147,520 |
|
| Dividends and undistributed earnings allocated | | | | | | | | | |
| to participating securities | 146 |
| | 142 |
| | 83 |
| | 113 |
| | 484 |
|
| Net earnings available to common shareholders | $ | 52,400 |
| | $ | 58,847 |
| | $ | 17,138 |
| | $ | 18,651 |
| | $ | 147,036 |
|
| | | | | | | | | | |
| Basic earnings per common share | $ | 0.24 |
| | $ | 0.27 |
| | $ | 0.09 |
| | $ | 0.17 |
| | |
| Diluted earnings per common share | $ | 0.24 |
| | $ | 0.27 |
| | $ | 0.09 |
| | $ | 0.17 |
| | |
| Cash dividends declared per common share | $ | 0.15 |
| | $ | 0.15 |
| | $ | 0.15 |
| | $ | 0.15 |
| | |
|
| | | | | | | | | | | | | | | | | | | |
| (in thousands, except per share information) | 2013 |
| | | | | | | | | | Four |
| | December 31 | | September 30 | | June 30 | | March 31 | | Quarters |
| Interest income | $ | 118,538 |
| | $ | 115,960 |
| | $ | 104,015 |
| | $ | 104,333 |
| | $ | 442,846 |
|
| Interest expense | 8,464 |
| | 9,151 |
| | 10,122 |
| | 10,144 |
| | 37,881 |
|
| Net interest income | 110,074 |
| | 106,809 |
| | 93,893 |
| | 94,189 |
| | 404,965 |
|
| Provision for (recapture of) loan and lease losses | 2,471 |
| | 1,104 |
| | (79 | ) | | 7,220 |
| | 10,716 |
|
| Non-interest income | 26,785 |
| | 26,144 |
| | 34,497 |
| | 34,015 |
| | 121,441 |
|
| Non-interest expense | 95,364 |
| | 95,604 |
| | 87,931 |
| | 85,762 |
| | 364,661 |
|
| Income before provision for income taxes | 39,024 |
| | 36,245 |
| | 40,538 |
| | 35,222 |
| | 151,029 |
|
| Provision for income taxes | 13,754 |
| | 12,768 |
| | 14,285 |
| | 11,861 |
| | 52,668 |
|
| Net income | 25,270 |
| | 23,477 |
| | 26,253 |
| | 23,361 |
| | 98,361 |
|
| Dividends and undistributed earnings allocated | | | | | | | | | |
| to participating securities | 212 |
| | 196 |
| | 197 |
| | 183 |
| | 788 |
|
| Net earnings available to common shareholders | $ | 25,058 |
| | $ | 23,281 |
| | $ | 26,056 |
| | $ | 23,178 |
| | $ | 97,573 |
|
| | | | | | | | | | |
| Basic earnings per common share | $ | 0.22 |
| | $ | 0.21 |
| | $ | 0.23 |
| | $ | 0.21 |
| | |
| Diluted earnings per common share | $ | 0.22 |
| | $ | 0.21 |
| | $ | 0.23 |
| | $ | 0.21 |
| | |
| Cash dividends declared per common share | $ | 0.15 |
| | $ | 0.15 |
| | $ | 0.20 |
| | $ | 0.10 |
| | |
ITEM 9. CHANGES IN AND DISAGREEMENTS WITH ACCOUNTANTS ON ACCOUNTING AND FINANCIAL DISCLOSURE.
ITEM 9A. CONTROLS AND PROCEDURES.
On a quarterly basis, we carry out an evaluation, under the supervision and with the participation of our management, including our Chief Executive Officer, Principal Financial Officer and Principal Accounting Officer, of the effectiveness of the design and operation of our disclosure controls and procedures pursuant to Rule 13a-15(b) under the Securities Exchange Act of 1934. As of December 31, 2011,2014, our management, including our Chief Executive Officer, Principal Financial Officer, and Principal Accounting Officer, concluded that our disclosure controls and procedures arewere effective in timely alerting them to material information relating to us that is required to be included in our periodic SEC filings. Although we change and improve our internal controls over financial reporting on an ongoing basis, we do not believe that any such changes occurred in the fourth quarter 20112014 that materially affected or are reasonably likely to materially affect our internal control over financial reporting.
REPORT OF MANAGEMENT ON INTERNAL CONTROL OVER FINANCIAL REPORTING
The management of Umpqua Holdings Corporation is responsible for establishing and maintaining adequate internal control over financial reporting as defined in Rule 13a-15(f) under the Securities Exchange Act of 1934. The
Company’sCompany's internal control system is designed to provide reasonable assurance to our management and Board of Directors regarding the reliability of financial reporting and the preparation of financial statements for external purposes in accordance with generally accepted accounting principles. The
Company’sCompany's internal control over financial reporting includes those policies and procedures that:
Pertain to the maintenance of records that, in reasonable detail, accurately and fairly reflect the transactions and dispositions of the Company’sCompany's assets;
Provide reasonable assurance that transactions are recorded as necessary to permit preparation of financial statements in accordance with generally accepted accounting principles, and that receipts and expenditures of the company are being made only in accordance with the authorizations of management and directors of the Company; and
Provide reasonable assurance regarding prevention or timely detection of unauthorized acquisition, use or disposition of the Company’sCompany's assets that could have a material effect on the financial statements.
Because of its inherent limitations, internal control over financial reporting may not prevent or detect misstatements. Also projections of any evaluation of effectiveness to future periods are subject to the risk that controls may become inadequate because of changes in conditions, or that the degree of compliance with the policies or procedures may deteriorate.
Management assessed the effectiveness of the Company’sCompany's internal control over financial reporting as of December 31, 2011.2014. In making this assessment, we used the criteria set forth by the Committee of Sponsoring Organizations of the Treadway Commission (COSO) in Internal Control —- Integrated Framework. Based on our assessment and those criteria, we believe that, as of December 31, 2011,2014, the Company maintained effective internal control over financial reporting. The Company’sCompany's registered public accounting firm has audited the Company’sCompany's consolidated financial statements and the effectiveness of our internal control over financial reporting as of and for the year ended December 31, 20112014 that are included in this annual report and issued their Report of Independent Registered Public Accounting Firm, appearing under Item 8. The attestation report expresses an unqualified opinion on the effectiveness of the Company’sCompany's internal controls over financial reporting as of December 31, 2011.2014
. February 17, 201223, 2015
ITEM 9B. OTHER INFORMATION.
None.
Disclosure pursuant to Section 13(r) of the Securities Exchange Act of 1934
Pursuant to Section 13(r) of the Securities Exchange Act of 1934, the Company may be required to disclose in our annual or quarterly reports to the SEC, whether the Company or any of our "affiliates" knowingly engaged in activities, transactions or dealings relating to Iran or with certain individuals or entities targeted by U.S. economic sanctions. Disclosure is generally required even where the activities, transactions or dealings were conducted in compliance with applicable law. Because the SEC defines the term "affiliate" broadly, it includes any entity under common "control" with us (and the term "control" is also construed broadly by the Securities and Exchange Commission).
During 2014, neither the Company nor its subsidiaries engaged in any reportable transactions with Iran or with persons or entities related to Iran.
The Company reported information regarding activities of deemed affiliates of the Company’s former affiliate Warburg Pincus LLC (“WP”) in Quarterly Reports on Form 10-Q filed on August 5 and November 7, 2014. During the fourth quarter of 2014, none of the Company, its subsidiaries or affiliates engaged in any reportable transactions with Iran or with persons or entities related to Iran. During the year ended December 31, 2014, affiliates of WP beneficially owned more than 10% of our outstanding common stock. Accordingly, WP and its affiliates may have been deemed to be an "affiliate" of the Company, as the term is defined in SEC Rule 12b-2, until WP’s sale of shares of our common stock on or about August 12, 2014. Since that transaction, and as of December 31, 2014, WP and its affiliates were no longer deemed to be "affiliates" of the Company.
The description of the activities below has been provided to the Company by WP and was included in the Company Form 10-Q filed November 7, 2014. Affiliates of WP: (i) beneficially owned more than 10% of our outstanding common stock during the year ended December 31, 2014 (until August 12, 2014), and (ii) beneficially owned more than 10% of the equity interests of, and had the right to designate members of the board of directors of Endurance International Group ("EIG") and Santander Asset Management Investment Holdings Limited ("SAMIH"). EIG and SAMIH may, through WP, have been deemed to be under common "control" with the Company under SEC rules; however, this statement is not meant to be an admission that common control existed during the year ended December 31, 2014.
The disclosure below relates solely to activities conducted by EIG and SAMIH and its non-U.S. affiliates that may have been deemed to be under common "control" with the Company until August 12, 2014. The disclosure does not relate to any activities conducted by the Company or by WP and does not involve the Company's or WP's management. The Company has not had any involvement in or control over WP or the disclosed activities of EIG. Neither the Company nor WP has had any involvement in or control over the disclosed activities of SAMIH, and neither the Company nor WP has independently verified or participated in the preparation of the disclosure. Neither the Company nor WP is representing to the accuracy or completeness of the disclosure nor does the Company or WP undertake any obligation to correct or update it.
As to EIG, the Company understands that EIG's affiliates intend to disclose in their next annual or quarterly SEC report that: "On or around September 26, 2014, during a routine compliance scan of new and existing subscriber accounts, EIG or its affiliates discovered that Seyed Mahmoud Mohaddes ("Mohaddes") was named as the account contact for a subscriber account (the "Subscriber Account"). Previously, on July 2, 2013, before Mohaddes had been designated as an SDN, the billing information for the Subscriber Account was updated to include Mohaddes. On September 16, 2013, the Office of Foreign Assets Control ("OFAC") designated Mohaddes as a Specially Designated National ("SDN"), pursuant to 31 C.F.R. Part 560.304. EIG discovered Mohaddes when its routine compliance scan identified an attempt on or around September 26, 2014 to add Mohaddes, an SDN, as the account contact to the Subscriber Account. EIG blocked the Subscriber Account that day and reported the domain name registered to the Subscriber Account to OFAC as potentially the property of a SDN, subject to blocking pursuant to Executive Order 13599. Since September 16, 2013, when Mohaddes was added to the SDN list, charges in the total amount of $120.35 were made to the Subscriber Account for web hosting and domain privacy services. EIG ceased billing for the Subscriber Account. To date, EIG has not received any correspondence from OFAC regarding this matter."
"On July 10, 2014, OFAC designated each of Stars Group Holding ("Stars"), and Teleserve Plus SAL ("Teleserve"), as SDNs under Executive Order 13224, and their property became subject to blocking pursuant to the Global Terrorism Sanctions Regulations, 31 C.F.R. Part 594. On July 15, 2014, as part of EIG's compliance review processes, they discovered that the domain names associated with each of Stars and Teleserve (the "Stars/Teleserve Domain Names") were registered through our platform. EIG immediately took steps to suspend and lock the Stars/Teleserve Domain Names to prevent them from being transferred or resolving to a website, and they promptly reported the Domain Names as potentially blocked property to OFAC. EIG did not generate any revenue from the Stars/Teleserve Domain Names since they were added to the SDN list on July 10, 2014. To date, EIG has not received any correspondence from OFAC regarding the matter."
"On July 15, 2014 during a compliance scan of all domain names on one of its platforms, EIG identified the domain name Kahanetzadak.com (the "Domain Name"), which was listed as an AKA of the entity Kahane Chai which operates as the American Friends of the United Yeshiva and was designated as a SDN on November 2, 2001 pursuant to Executive Order 13224. Since the Domain Name was transferred into one of EIG's reseller's customer's account, there was no direct financial transaction between EIG and the registered owner of the Domain Name. The Domain name was suspended upon discovering it on their platform, and EIG will be reporting the Domain Name to OFAC as potentially the property of a SDN."
As to SAMIH, the Company understands that SAMIH's affiliates intend to disclose in their next annual or quarterly SEC report that: "an Iranian national, resident in the U.K., who is currently designated by the U.S. under the Iranian Financial Sanctions Regulations and the Weapons of Mass Destruction Proliferators Sanctions Regulations ("NPWMD sanctions program"), holds a mortgage and two investment accounts with Santander Asset Management UK Limited. No further drawdown has been made (or would be permitted) under this mortgage although Santander UK continues to receive repayment installments. In the nine months ended September 30, 2014, total revenue in connection with the mortgage was approximately £1,800 and net profits were negligible relative to the overall profits of Santander UK. The same Iranian national also holds two investment accounts with Santander Asset Management UK Limited. The accounts have remained frozen for the nine months ended September 30, 2014. The investment returns are being automatically reinvested, and no disbursements have been made to the customer. In the nine months ended September 30, 2014, the total revenue for the Santander Group in connection with the investment accounts was £190 and net profits were negligible relative to the overall profits of Banco Santander, S.A."
"In addition, during the third quarter 2014, Santander UK identified two additional customers: a UK national designated by the U.S. under the NPWMD sanctions program who holds a business account, where no transaction have taken place. Such account is in the process of being closed. No revenue or profit has been generated. A second UK national designated by the U.S. for reasons of terrorism held a personal current account and a personal credit card account in the third quarter 2014, both of which have now been closed. Although transactions have taken place on the current account during the reportable period, revenue and profits generated were negligible. No transactions have taken place on the credit card."
ITEM 10. DIRECTORS, EXECUTIVE OFFICERS AND CORPORATE GOVERNANCE
The response to this item is incorporated by reference to Umpqua’sUmpqua's Proxy Statement for the 20122015 annual meeting of shareholders under the captions “Annual"Annual Meeting Business”Business"- “Item"Item 1, Election of Directors”Directors", “Information"Information About Executive Officers”Officers", “Corporate"Corporate Governance Overview”Overview" and “Section"Section 16(a) Beneficial Ownership Reporting Compliance.”"
ITEM 11. EXECUTIVE COMPENSATION.
The response to this item is incorporated by reference to the Proxy Statement, under the caption “Compensation Discussion and Analysis.”
ITEM 12. SECURITY OWNERSHIP OF CERTAIN BENEFICIAL OWNERS AND MANAGEMENT AND RELATED STOCKHOLDER MATTERS
The response to this item is set forth in Part II, Item 5, “Equity Compensation Plan Information” and is incorporated by reference to the Proxy Statement, under the caption “Security Ownership of Management and Others.”
ITEM 13. CERTAIN RELATIONSHIPS AND RELATED TRANSACTIONS AND DIRECTOR INDEPENDENCE
The response to this item is incorporated by reference to the Proxy Statement, under the captions “Annual Meeting Business-"Director Compensation, "Compensation Discussion and Analysis," "Compensation Committee Report," and "Compensation Tables."
ITEM 12. SECURITY OWNERSHIP OF CERTAIN BENEFICIAL OWNERS AND MANAGEMENT AND RELATED STOCKHOLDER MATTERS
The response to this item is set forth in Part II, Item
1, Election5, "Equity Compensation Plan Information" of
Directors”this Annual Report on Form 10-K, and
“Related Party Transactions.”is incorporated by reference to the Proxy Statement, under the caption "Security Ownership of Management and Others."
ITEM
14. PRINCIPAL ACCOUNTING FEES13. CERTAIN RELATIONSHIPS AND
SERVICES.RELATED TRANSACTIONS AND DIRECTOR INDEPENDENCE
The response to this item is incorporated by reference to the Proxy Statement, under the captions "Annual Meeting Business- Item 1, Election of Directors" and "Related Party Transactions."
ITEM 14. PRINCIPAL ACCOUNTING FEES AND SERVICES.
The response to this item is incorporated by reference to the Proxy Statement, Item 2-Ratification of Auditor Appointment under the caption
“Independent"Item 2. Ratification (Non-Binding) of Auditor Appointment - Independent Registered Public Accounting Firm.
”Umpqua Holdings Corporation
"
ITEM 15. EXHIBITS AND FINANCIAL STATEMENT SCHEDULES.
(a) | |
| (1) | Financial Statements: |
The consolidated financial statements are included as Item 8 of this Form 10-K.
| |
| (2) | Financial Statement Schedules: |
All schedules have been omitted because the information is not required, not applicable, not present in amounts sufficient to require submission of the schedule, or is included in the financial statements or notes thereto.
| |
| (3) | The exhibits filed as part of this report and exhibits incorporated herein by reference to other documents are listed on the Index of Exhibits to this annual report on Form 10-K on sequential page 186.10-K. |
Pursuant to the requirements of Section 13 or 15(d) of the Securities Exchange Act of 1934, Umpqua Holdings Corporation has duly caused this Form 10-K to be signed on its behalf by the undersigned, thereunto duly authorized on February
17, 2012.23, 2015.
UMPQUA HOLDINGS CORPORATION (Registrant) |
| | | |
| /s/ Raymond P. Davis | February 23, 2015 |
| | | | Date: February 17, 2012 |
| Raymond P. Davis, President and Chief Executive Officer | | | | |
Pursuant to the requirements of the Securities Exchange Act of 1934, this report has been signed below by the following persons on behalf of the Registrant in the capacities and on the dates indicated.
| | | | |
Signature | | Title | | Date |
| | |
/s/ Raymond P. Davis
Raymond P. Davis
| | President, Chief Executive Officer
and Director
(Principal Executive Officer)
| | February 17, 2012 |
| | |
/s/ Ronald L. Farnsworth
Ronald L. Farnsworth
| | Executive Vice President, Chief Financial Officer
(Principal Financial Officer)
| | February 17, 2012 |
| | |
/s/ Neal T. McLaughlin
Neal T. McLaughlin
| | Executive Vice President, Treasurer (Principal Accounting Officer) | | February 17, 2012 |
| | |
/s/ Allyn C. Ford
Allyn C. Ford
| | Director | | February 17, 2012 |
| | |
/s/ Peggy Y. Fowler
Peggy Y. Fowler
| | Director | | February 17, 2012 |
| | |
/s/ Stephen M. Gambee
Stephen M. Gambee
| | Director | | February 17, 2012 |
| | |
/s/ Jose R. Hermocillo
Jose R. Hermocillo
| | Director | | February 17, 2012 |
| | |
/s/ William A. Lansing
William A. Lansing
| | Director | | February 17, 2012 |
| | |
/s/ Luis F. Machuca
Luis F. Machuca
| | Director | | February 17, 2012 |
| | |
/s/ Diane D. Miller
Diane D. Miller
| | Director | | February 17, 2012 |
Umpqua Holdings Corporation
| | | | |
Signature | | Title | | Date |
| | |
/s/ Dudley R. Slater
Dudley R. Slater
| | Director | | February 17, 2012 |
| | |
/s/ Bryan L. Timm
Bryan L. Timm
| | Director | | February 17, 2012 |
| | |
/s/ Hilliard C. Terry, III
Hilliard C. Terry, III
| | Director | | February 17, 2012 |
| | |
/s/ Frank R. J. Whittaker
Frank R. J. Whittaker
| | Director | | February 17, 2012 |
EXHIBIT INDEX
| | | | |
| | |
Exhibit | | | | |
3.1 | Signature | Title | Date |
| /s/ Raymond P. Davis | President, Chief Executive Officer and Director | February 23, 2015 |
| Raymond P. Davis | (Principal Executive Officer) | |
| | (a) | |
| /s/ Ronald L. Farnsworth | Executive Vice President, Chief Financial Officer | February 23, 2015 |
| Ronald L. Farnsworth | (Principal Financial Officer) | |
| | | |
| /s/ Neal T. McLaughlin | Executive Vice President, Treasurer | February 23, 2015 |
| Neal T. McLaughlin | (Principal Accounting Officer) | |
| | | |
| /s/ Ellen R.M. Boyer | Director | February 23, 2015 |
| Ellen R.M. Boyer | | |
| | | |
| /s/ Robert C. Donegan | Director | February 23, 2015 |
| Robert C. Donegan | | |
| | | |
| /s/ C. Webb Edwards | Director | February 23, 2015 |
| C. Webb Edwards | | |
| | | |
| /s/ Peggy Y. Fowler | Director | February 23, 2015 |
| Peggy Y. Fowler | | |
| | | |
| /s/ Stephen M. Gambee | Director | February 23, 2015 |
| Stephen M. Gambee | | |
| | | |
| /s/ James S. Greene | Director | February 23, 2015 |
| James S. Greene | | |
| | | |
| /s/ Luis F. Machuca | Director | February 23, 2015 |
| Luis F. Machuca | | |
| | | |
| /s/ Maria M. Pope | Director | February 23, 2015 |
| Maria M. Pope | | |
| | | |
| /s/ Susan F. Stevens | Director | February 23, 2015 |
| Susan F. Stevens | | |
| | | |
| /s/ Hilliard C. Terry, III | Director | February 23, 2015 |
| Hilliard C. Terry, III | | |
| | | |
| /s/ Bryan L. Timm | Director | February 23, 2015 |
| Bryan L. Timm | | |
| | | |
EXHIBIT INDEX
|
| | |
Exhibit # | Description | Location |
| | |
| 3.1 | Restated Articles of Incorporation, with designation of Fixed Rate Cumulative Perpetual Preferred Stock, Series A and designation of Series B Common Stock Equivalent preferred stock |
3.2 | | (b) | | Bylaws, as amended |
4.1 | | (c) | | Specimen Common Stock Certificate |
4.2 | | (d) | | Amended and Restated Declaration of Trust for Umpqua Master Trust I, dated August 9, 2007 |
4.3 | | (e) | | Indenture, dated August 9, 2007, by and between Umpqua Holdings Corporation and LaSalle Bank National Association |
4.4 | | (f) | | Series A Guarantee Agreement, dated August 9, 2007, by and between Umpqua Holdings Corporation and LaSalle Bank National Association |
4.5 | | (g) | | Series B Guarantee Agreement, dated September 6, 2007, by and between Umpqua Holdings Corporation and LaSalle Bank National Association |
4.6 | | (h) | | Series B Supplement pursuant to Amended and Restated Declaration of Trust dated August 9, 2007 |
10.1** | | (i) | | Third Restated Supplemental Executive Retirement Plan effective April 16, 2008 between the Company and Raymond P. Davis |
10.2** | | (j) | | Employment Agreement dated July 1, 2003, between the Company and Raymond P. Davis |
10.3** | | (k) | | Umpqua Holdings Corporation 2005 Performance-Based Executive Incentive Plan |
10.4** | | (l) | | 2003 Stock Incentive Plan, as amended, effective March 5, 2007 |
10.5** | | (m) | | 2007 Long Term Incentive Plan effective March 5, 2007 |
10.6** | | (n) | | Employment Agreement with Brad Copeland dated March 10, 2006 |
10.7** | | (o) | | Employment Agreement with Kelly J. Johnson dated January 15, 2009 |
10.8** | | (p) | | Employment Agreement with Colin Eccles dated January 21, 2009 |
10.9** | | (q) | | Form of Employment Agreement with Ronald L. Farnsworth, Steven L. Philpott and Neal T. McLaughlin, each dated March 5, 2008 |
10.10** | | (r) | | Form of Long Term Incentive Restricted Stock Unit Agreement |
10.11** | | (s) | | Split-Dollar Insurance Agreement dated April 16, 2008 between the Company and Raymond P. Davis |
10.12** | | (t)
| | Form of First Amendment to Employment Agreement effective September 16, 2008 between the Company and Brad Copeland and between the Company and Barbara Baker |
10.14** | | (u)
| | Employment Agreement dated effective March 21, 2010 between the Company and Cort O’Haver |
10.15** | | (v)
| | Employment Agreement dated effective June 1, 2010 between the Company and Mark Wardlow |
10.16** | | (w)
| | Employment Agreement dated effective November 15, 2010 between the Company and Ulderico (Rick) Calero, Jr. |
10.17** | | (x)
| | Form of Amendment No. 1 to Nonqualified Stock Option Agreements between Company and Executive Officers that were originally issued January 31, 2011 |
10.18** | | (y)
| | Form of Amendment No. 1 to Restricted Stock Agreements between the Company and Executive Officers that were originally issued January 31, 2011 |
12 | | Ratio of Earnings to Fixed Charges |
21.1 | | Subsidiaries of the Registrant |
23.1 | | Consent of Independent Registered Public Accounting Firm – Moss Adams LLP |
31.1 | | Certification of Chief Executive Officer under Section 302 of the Sarbanes-Oxley Act of 2002 |
31.2 | | Certification of Chief Financial Officer under Section 302 of the Sarbanes-Oxley Act of 2002 |
31.3 | | Certification of Principal Accounting Officer under Section 302 of the Sarbanes-Oxley Act of 2002 |
32 | | Certification of Chief Executive Officer, Chief Financial Officer and Principal Accounting Officer pursuant to Section 906 of the Sarbanes-Oxley Act of 2002 |
Umpqua Holdings Corporation
101.INS | XBRL Instance Document * |
101.SCH | XBRL Taxonomy Extension Schema Document * |
101.CAL | XBRL Taxonomy Extension Calculation Linkbase Document * |
101.DEF | XBRL Taxonomy Extension Definition Linkbase Document * |
101.LAB | XBRL Taxonomy Extension Label Linkbase Document * |
101.PRE | XBRL Taxonomy Extension Presentation Linkbase Document * |
* | Pursuant to Rule 406T of Regulation S-T, these interactive data files are deemed not filed or part of a registration statement or prospectus for purposes of Sections 11 or 12 of the Securities Act of 1933, as amended, or Section 18 of the Securities and Exchange Act of 1934, as amended and otherwise are not subject to liability under those sections. |
** | Indicates compensatory plan or arrangement |
(a) | Incorporated by reference to Exhibit 3.1 to Form 10-Q filed May 7, 20102014
|
(b) | | |
| 3.2 | Bylaws, as amended | Incorporated by reference to Exhibit 3.2 to Form 8-K filed April 22, 2008 |
(c) | | |
| 4.1 | Specimen Common Stock Certificate | Incorporated by reference to Exhibit 4 to the Registration Statement on Form S-8 (No. 333-77259) filed with the SEC on April 28, 1999 |
(d) | Incorporated by reference | |
| 4.2 | The Company agrees to Exhibit 4.1furnish upon request to Form 8-K filed August 10, 2007the Commission a copy of each instrument defining the rights of holders of senior and subordinated debt of the Company. | |
(e) | Incorporated by reference to Exhibit 4.2 to Form 8-K filed August 10, 2007 | |
(f)10.1** | Incorporated by reference to Exhibit 4.3 to Form 8-K filed August 10, 2007 |
(g) | Incorporated by reference to Exhibit 4.3 to Form 8-K filed September 7, 2007 |
(h) | Incorporated by reference to Exhibit 4.4 to Form 8-K filed September 7, 2007 |
(i)Third Restated Supplemental Executive Retirement Plan effective April 16, 2008 between the Company and Raymond P. Davis | Incorporated by reference to Exhibit 99.1 to Form 8-K/A filed April 22, 2008 |
(j) | | |
| 10.2** | Employment Agreement dated July 1, 2003, between the Company and Raymond P. Davis | Incorporated by reference to Exhibit 10.4 to Form 10-Q filed August 14, 2003 |
(k) | Incorporated by reference to Appendix B to Form DEF 14A filed | |
| 10.3** | 2003 Stock Incentive Plan, as amended, effective March 31, 2005 |
(l)5, 2007 | Incorporated by reference to Appendix A to Form DEF 14A filed March 14, 2007 |
(m) | Incorporated by reference to Appendix B to | |
| 10.4** | Form DEF 14A filed March 14, 2007 |
(n) | Incorporated by reference to Exhibit 10.2 to Form 8-K filed March 21, 2006 |
(o) | Incorporate by reference to Exhibit 10.7 to Form 10-K filed February 19, 2010 |
(p) | Incorporated by reference to Exhibit 10.8 to Form 10-K filed February 19, 2010 |
(q)of Employment Agreement with executive officers Farnsworth, and McLaughlin | Incorporated by reference to Exhibit 99.1 to Form 8-K filed March 7, 2008 |
(r) | | |
| 10.5** | Form of Long Term Incentive Restricted Stock Unit Agreement | Incorporated by reference to Exhibit 10.4 to Form 10-Q filed August 3, 2007 |
(s) | | |
| 10.6** | Split-Dollar Insurance Agreement dated April 16, 2008 between the Company and Raymond P. Davis | Incorporated by reference to Exhibit 99.2 to Form 8-K filed April 22, 2008 |
(t) | | |
| 10.7** | Form of First Amendment to form of Employment Agreement with executive officers Farnsworth and McLaughlin | Incorporated by reference to Exhibit 99.1 to Form 8-K filed October 8, 2008January 14, 2013 |
(u) | | |
| 10.8** | Employment Agreement dated effective March 21, 2010 between the Company and Cort O'Haver | Incorporated by reference to Exhibit 10.1 to Form 10-Q filed November 4, 2010 |
(v) | | |
| 10.9** | First Amendment to Employment Agreement with Cort O’Haver dated effective December 1, 2014 | Filed herewith |
| | |
| 10.10** | Employment Agreement dated effective June 1, 2010 between the Company and Mark Wardlow | Incorporated by reference to Exhibit 10.2 to Form 10-Q filed November 4, 2010 |
(w) | | |
| 10.11** | Umpqua Holdings Corporation 2013 Incentive Plan, effective December 14, 2012 | Incorporated by reference to Appendix A to DEF 14A filed February 25, 2013 |
| | |
| 10.12** | Form of Restricted Stock Award Agreement under 2013 Incentive Plan (Service Vesting) | Incorporated by reference to Exhibit 99.1 to Form 8-K filed February 4, 2011January 31, 2014 |
(x) | | |
| 10.13** | Form of Restricted Stock Award Agreement under 2013 Incentive Plan (Performance Vesting) | Incorporated by reference to Exhibit 99.1 to Form 8-K filed January 31, 2014 |
| | |
| 10.14** | Form of Restricted Stock Award Agreement under 2013 Incentive Plan (162(m) Performance Vesting) | Incorporated by reference to Exhibit 99.1 to Form 8-K filed January 31, 2014 |
| | |
| 10.15** | Employment Agreement, dated September 11, 2013, by and between the Company and J. Gregory Seibly | Incorporated by reference to Exhibit 10.3 to Form S-4 filed November 15, 2013 (Registration No. 333-192346) |
| | |
| 10.16** | First Amendment to Employment Agreement with J. Gregory Seibly | Incorporated by reference to Exhibit 10.1 to Form 8-K10-Q filed June 20, 2011August 5, 2014 |
| | |
| 10.17** | Employment Agreement, dated September 11, 2013, by and between the Company and Ezra Eckhardt | Filed herewith |
(y) |
| | |
Exhibit # | Description | Location |
| | |
| 10.18** | First Amendment to Employment Agreement with Ezra Eckhardt | Incorporated by reference to Exhibit 10.2 to Form 8-K10-Q filed June 20, 2011August 5, 2014 |
| | |
| 10.19** | Sterling Financial Corporation 2010 Long-Term Incentive Plan | Incorporated by reference to Exhibit 99.1 to the Registration Statement on Form S-8 of Sterling Financial Corporation filed December 9, 2010 |
| | |
| 12.0 | Ratio of Earnings to Fixed Charges | Filed herewith |
| | |
| 21.1 | Subsidiaries of the Registrant | Filed herewith |
| | |
| 23.1 | Consent of Independent Registered Public Accounting Firm - Moss Adams LLP | Filed herewith |
| | |
| 31.1 | Certification of Chief Executive Officer under Section 302 of the Sarbanes-Oxley Act of 2002 | Filed herewith |
| | |
| 31.2 | Certification of Chief Financial Officer under Section 302 of the Sarbanes-Oxley Act of 2002 | Filed herewith |
| | |
| 31.3 | Certification of Principal Accounting Officer under Section 302 of the Sarbanes-Oxley Act of 2002 | Filed herewith |
| | |
| 32 | Certification of Chief Executive Officer, Principal Financial Officer and Principal Accounting Officer pursuant to Section 906 of the Sarbanes-Oxley Act of 2002 | Filed herewith |
| | |
187
101.INS XBRL Instance Document *
101.SCH XBRL Taxonomy Extension Schema Document *
101.CAL XBRL Taxonomy Extension Calculation Linkbase Document *
101.DEF XBRL Taxonomy Extension Definition Linkbase Document *
101.LAB XBRL Taxonomy Extension Label Linkbase Document *
101.PRE XBRL Taxonomy Extension Presentation Linkbase Document *
* Pursuant to Rule 406T of Regulation S-T, these interactive data files are deemed not filed or part of a registration statement or prospectus for purposes of Sections 11 or 12 of the Securities Act of 1933, as amended, or Section 18 of the Securities and Exchange Act of 1934, as amended and otherwise are not subject to liability under those sections.
**Indicates compensatory plan or arrangement