SECURITIES AND EXCHANGE COMMISSION
(Mark One)
x |
| |
| ý | ANNUAL REPORT PURSUANT TO SECTION 13 OR 15(d) OF THE SECURITIES EXCHANGE ACT OF 1934 |
For the fiscal year ended December 31, 20112014 |
| |
| ¨ | TRANSITION REPORT PURSUANT TO SECTION 13 OR 15(d) OF THE SECURITIES EXCHANGE ACT OF 1934 |
For the transition period from to
Commission File No. 1-8968
ANADARKO PETROLEUM CORPORATION
(Exact name of registrant as specified in its charter)
|
| | |
| Delaware | | 76-0146568 |
| (State or other jurisdiction of incorporation or organization) | | (I.R.S. Employer Identification No.) |
1201 Lake Robbins Drive, The Woodlands, Texas 77380-1046
(Address of principal executive offices)
Registrant’s telephone number, including area code(832) 636-1000 Securities registered pursuant to Section 12(b) of the Act:
| |
| | |
| Title of each class | | | | Name of each exchange on which registered |
| Common Stock, par value $0.10 per share | | | | New York Stock Exchange |
Securities registered pursuant to Section 12(g) of the Act:Act: None Indicate by check mark if the registrant is a well-known seasoned issuer, as defined in Rule 405 of the Securities Act. Yes xý No ¨ Indicate by check mark if the registrant is not required to file reports pursuant to Section 13 or Section 15(d) of the Act. Yes ¨ No xý Indicate by check mark whether the registrant (1) has filed all reports required to be filed by Section 13 or 15(d) of the Securities Exchange Act of 1934 during the preceding 12 months (or for such shorter period that the registrant was required to file such reports), and (2) has been subject to such filing requirements for the past 90 days. Yes xý No ¨ Indicate by check mark whether the registrant has submitted electronically and posted on its corporate Web site,website, if any, every Interactive Data File required to be submitted and posted pursuant to Rule 405 of Regulation S-T (§232.405 of this chapter) during the preceding 12 months (or for such shorter period that the registrant was required to submit and post such files). Yes xý No ¨ Indicate by check mark if disclosure of delinquent filers pursuant to Item 405 of Regulation S-K (§229.405 of this chapter) is not contained herein, and will not be contained, to the best of the registrant’s knowledge, in definitive proxy or information statements incorporated by reference in Part III of this Form 10-K or any amendment to this Form 10-K. x¨ Indicate by check mark whether the registrant is a large accelerated filer, an accelerated filer, a non-accelerated filer, or a smaller reporting company. See the definitions of “large accelerated filer,” “accelerated filer,” and “smaller reporting company” in Rule 12b-2 of the Exchange Act.
| | | | | | |
Large accelerated filer x
| | Accelerated filer ¨ | | Non-accelerated filer ¨
| | Smaller reporting company ¨ |
Large accelerated filer ý Accelerated filer ¨ Non-accelerated filer ¨ Smaller reporting company ¨
Indicate by check mark whether the registrant is a shell company (as defined in Rule 12b-2 of the Act). Yes ¨ No xý The aggregate market value of the Company’s common stock held by non-affiliates of the registrant on June 30,
20112014, was
$38.1$55.3 billion based on the closing price as reported on the New York Stock Exchange.
The number of shares outstanding of the Company’s common stock at January 31, 2012,30, 2015, is shown below: |
| | |
| Title of Class | | Number of Shares Outstanding |
| Common Stock, par value $0.10 per share | | 498,427,854506,650,285 |
| | |
Part of
Form 10-K
| | Documents Incorporated By Reference |
Part III
| | Portions of the Proxy Statement for the Annual Meeting of Stockholders of Anadarko Petroleum Corporation to be held May 15, 2012 (to be filed with the Securities and Exchange Commission prior to April 5, 2012).
|
Documents Incorporated By Reference
Portions of the Proxy Statement for the Annual Meeting of Stockholders of Anadarko Petroleum Corporation to be held May 12, 2015 (to be filed with the Securities and Exchange Commission prior to April 2, 2015), are incorporated by reference into Part III of this Form 10-K.
Items 1 and 2. Business and Properties
Anadarko Petroleum Corporation is among the world’s largest independent exploration and production companies, with over 2.5approximately 2.9 billion barrels of oil equivalent (BOE) of proved reserves at December 31, 2011.2014. Anadarko’s mission is to deliver a competitive and sustainable rate of return to shareholders by exploring for,developing, acquiring, and developingexploring for oil and natural-gas resources vital to the world’s health and welfare. Anadarko’s asset portfolio is aimed at delivering long-term value to stakeholders by combining a large inventory of development opportunities in the United StatesU.S. onshore with high-potential worldwide offshore exploration and development activities. Anadarko’s asset portfolio includes
positions inU.S. onshore resource plays in the Rocky Mountains
region,area, the southern United States,
and the Appalachian
basin.basin, and Alaska. The Company is also among the largest independent producers in the deepwater Gulf of Mexico, and has
productionexploration and
explorationproduction activities worldwide, including
positionsactivities in
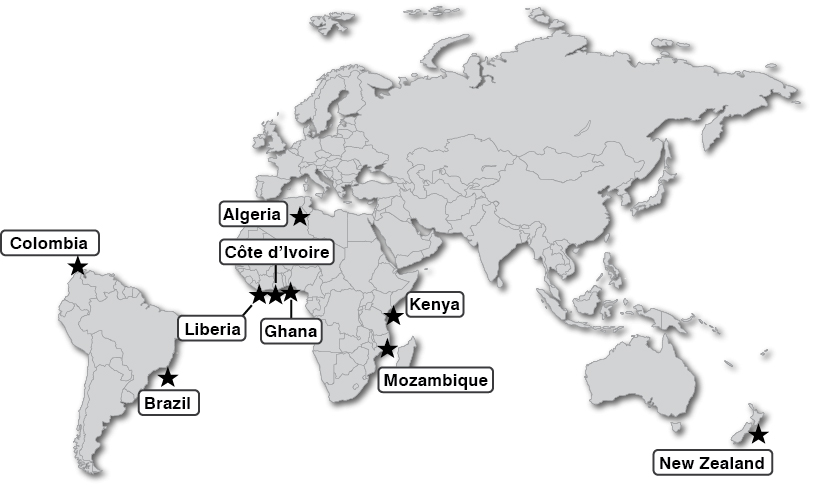
high-potential basins located in EastMozambique, Algeria, Ghana, Brazil, Colombia, Côte d’Ivoire, Kenya, Liberia, New Zealand, and
West Africa, Algeria, China, Alaska, and New Zealand.other countries.
Anadarko is committed to producing energy in a manner that protects the environment and public health. Anadarko’s focus is to deliver resources to the world while upholding the Company’s core values of integrity and trust, servant leadership,
commercial focus, people and passion,
commercial focus, and open communication in all business activities.
Anadarko’s
primary business segments are managed separately due to distinct operational differences and unique technology,
and distribution, and marketing requirements. The Company’s three reporting segments are as follows:
Oil and gas exploration and production—This segment explores for and produces natural gas, crude oil, condensate, and natural gas liquids (NGLs)., and plans for the development and operation of the Company’s liquefied natural gas (LNG) project.
Midstream—This segment providesengages in gathering, processing, treating, and transportation services totransporting Anadarko and third-party oil, natural-gas, and natural-gas producers.NGLs production. The Company owns and operates gathering, processing, treating, and transportation systems in the United States.States for natural gas, oil, and NGLs.
Marketing—This segment sells much of Anadarko’s oil, natural-gas, and NGLs production, as well as productionthird-party purchased from third parties.volumes. The Company actively markets oil, natural gas, and NGLs in the United States,States; oil and actively markets oilNGLs internationally; and the anticipated LNG production from Algeria, China, and Ghana.Mozambique.
Unless the context otherwise requires, the terms “Anadarko” or “Company” refer to Anadarko Petroleum Corporation and its consolidated subsidiaries. This Annual Report on Form 10-K and the documents incorporated herein by reference contain forward-looking statements based on expectations, estimates, and projections as of the date of this filing. These statements by their nature are subject to risks, uncertainties, and assumptions and are influenced by various factors. As a consequence, actual results may differ materially from those expressed in the forward-looking statements. See Risk Factors under Item 1A of this Form 10-K.
Available Information The Company’s corporate headquarters is located at 1201 Lake Robbins Drive, The Woodlands, Texas 77380-1046, and its telephone number is (832) 636-1000.Available Information The Company files or furnishes Annual Reports on Form 10-K, Quarterly Reports on Form 10-Q, Current Reports on Form 8-K, registration statements, or any amendments thereto, and other itemsreports and filings with the Securities and Exchange Commission (SEC). Anadarko provides access free of charge to all of these SEC filings, as soon as reasonably practicable after filing or furnishing, by selecting SEC Filings on its website located at www.anadarko.com/Investor/Pages/SECFilings.aspx.www.anadarko.com. The Company will also make available to any stockholder, without charge, printed copies of its Annual Report on Form 10-K as filed with the SEC. For copies of this report or any other filing, please contact Anadarko Petroleum Corporation, Investor Relations, Department, P.O. Box 1330, Houston, Texas 77251-1330 or call (832) 636-1216.
In addition,investor@anadarko.com, or complete an information request on the Company’s website at www.anadarko.com, by selecting Investors/Shareholder Resources/Shareholder Services.
The public may read and copy any materials Anadarko files with the SEC at the SEC’s Public
ReferenceReading Room at 100 F Street, N.E., Washington, DC 20549. The public may obtain information on the operation of the Public
ReferenceReading Room by calling the SEC at 1-800-SEC-0330. The SEC maintains
an Internet site (www.sec.gov)a website at www.sec.gov that contains reports, proxy and information statements, and other information regarding issuers, like Anadarko, that file electronically with the SEC.
OIL AND GAS PROPERTIES AND ACTIVITIES
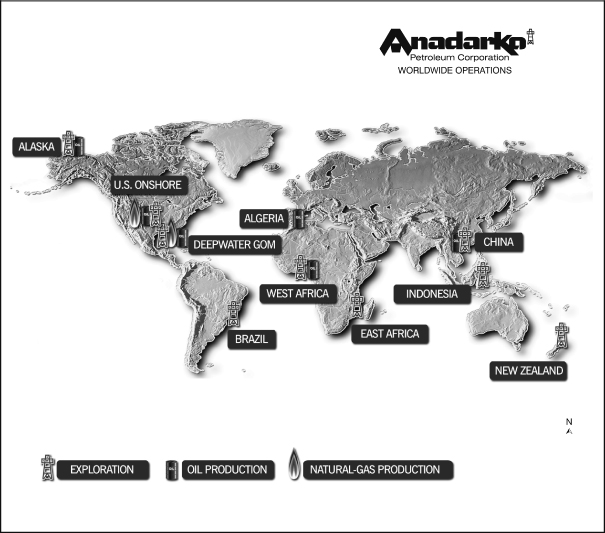
The map below illustrates the locations of Anadarko’s oil and natural-gas exploration and production operations.
United States
Overview OverviewAnadarko’s U.S. operations in the United States include oil and natural-gas exploration and production onshore in the Lower 48 states, onshore Alaska, and the deepwater Gulf of Mexico.Mexico, and onshore Alaska. The Company’s U.S. operations in the United States accounted for 87%89% of total sales volumes during 20112014 and 90%92% of total proved reserves at year-end 2011.
OnshoreIn 2011, the Company’s shale plays delivered a year-over-year sales-volume increase of almost 200%2014. Shale volumes now account for slightly more than 10% of the Company total sales volumes, which is up from less than one percent two years ago. Shales also represent about five percent of Anadarko’s total proved reserves.
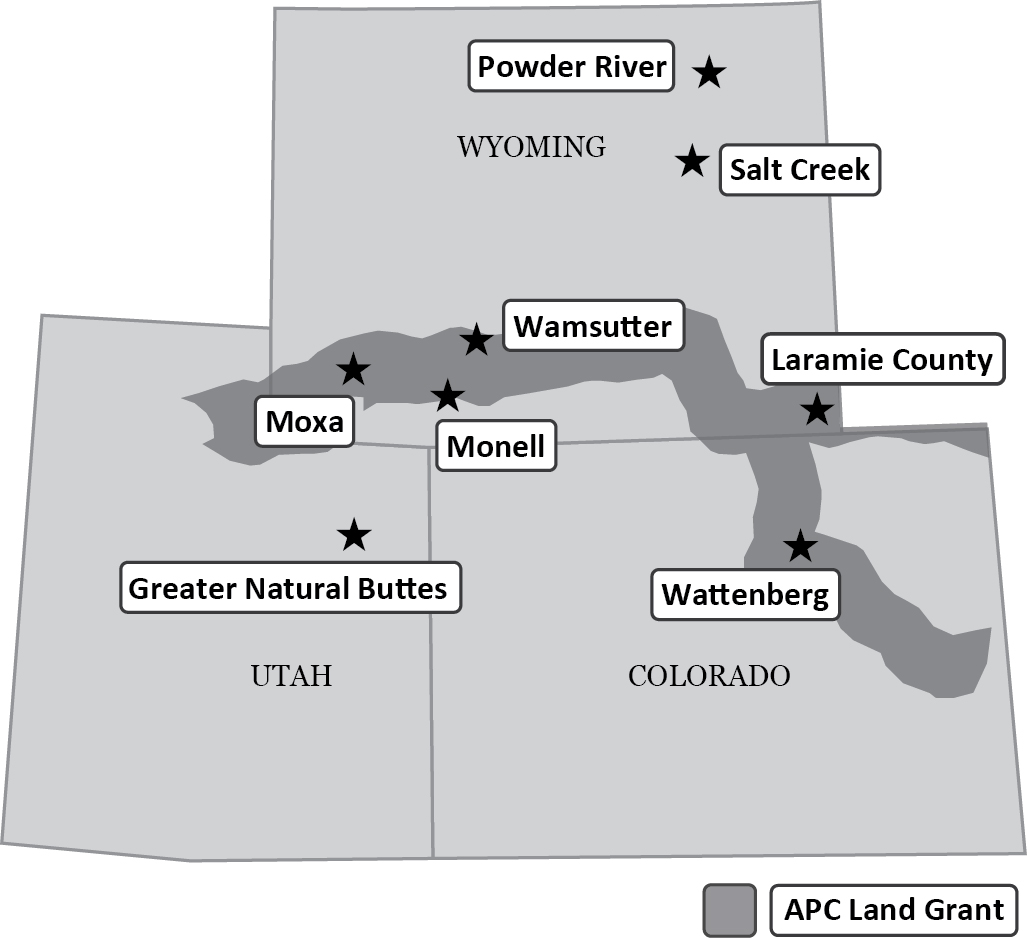
Rocky Mountains RegionAnadarko’s Rocky Mountains Region (Rockies) properties areinclude oil and natural-gas plays located in Colorado, Utah, and Wyoming and are a combination of oil and natural-gas plays, with significant growth and capital investment in areas that offer higher liquids yields (liquids-rich areas). Anadarkowhere the Company operates approximately 14,30014,500 wells and hasowns an interest in approximately 9,500 non-operated wells in the Rockies.8,000 nonoperated wells. Anadarko operates fractured carbonate/fractured-carbonate/shale reservoirs, tight gastight-gas assets, and coalbed methanecoalbed-methane (CBM) natural-gas assets, as well asand enhanced oil recovery (EOR) projects within the region. The Company also has fee ownership of mineral rights under approximately 8eight million acres that passespass through Colorado, and Wyoming, and into Utah (Land(known as the Land Grant). Management considers the Land Grant a significant competitive advantage tofor Anadarko becauseas it enhances the Company’s economic returns from production on Land Grant acreage, offers liquids-rich drilling opportunities for the Company without expiration, and allows the Company to capture incremental royalty revenue from third-party activity inon Land Grant acreage. The Company also believes its liquids-rich reservoirs, strong well performance, low development and operating costs, and large expandable midstream infrastructure each provide tangible benefits to the area. Company.
Activities in the Rockies continue toprimarily focus on expanding the existing fields to increase production and adding proved reserves through horizontal drilling, infill drilling, and down-spacing operations, re-completions, and re-fracture stimulations of existing wells. During 2011, totaloperations. The Company focused its 2014 capital investments in areas that offer high liquids yields (liquids-rich areas), which resulted in significant oil production growth. In 2014, total-year Rockies sales volumes in the Rockies increased 10% over 2010,2013, with an 18%a 45% or 49 thousand barrels of oil equivalent per day (MBOE/d) increase in liquids volumes. In 2011, theThe Company drilled 1,029569 wells and completed 487 wells in the Rockies andduring 2014. The Company plans to acceleratecontinue its drilling program in 2015, focusing on the regionWattenberg field.
Wattenberg Anadarko operates approximately 5,800 vertical wells and 750 horizontal wells in 2012.In 2011, the Company was dedicated to the development of new horizontal opportunities in the Niobrara and other formations in the Denver-Julesburg basin, which includes the Wattenberg field. The field contains the Niobrara is aand Codell formations, which are naturally fractured carbonate formationformations that holdshold liquids and natural gas. During 2011,2014, the Company drilled 33Company’s drilling program focused entirely on horizontal wellsdevelopment, drilling 369 horizontal wells. Sales volumes in the Wattenberg field focusing on liquids-rich areas in the Niobrara and Codell formations. The Company also drilled 17 horizontal wells in the Denver-Julesburg basin (outside the Wattenberg field) and the Powder River basin as part of the horizontal program.
The Wattenberg field is a liquids-rich area where Anadarko operates over 5,300 wells. During 2011, the Company drilled 433 vertical/directional wells in the Wattenberg field and increased sales volumes 19%55% compared to 2010,2013, with a year-over-year 32% increaseincreases of 69% in oil volumes and 79% in total liquids volumes. Horizontal drilling results in the Wattenberg field have showncontinue to be strong, initial production rates with average liquids yields of approximately 70%. The Company has also identified 1,200 to 2,700 future potential drilling locations in the Niobrara and Codell sandstoneeconomics that provide substantial opportunity for expanding Anadarko’s activity in these formations. The competitive advantage providedare enhanced by mineral ownership in the Land Grant mineral interest, a consolidated core acreage position, and recent enhancements in infrastructure and takeaway capacity.
Major facility and takeaway expansions occurred in 2014. The Lancaster cryogenic plant and Front Range Pipeline (FRP) were commissioned in 2014. The Lancaster cryogenic plant resulted in a field-wide increase in NGLs recoveries and the
liquids-rich reservoirs, strong well performance, low development costs, and expandable midstream infrastructure each provide tangible benefitsFRP resulted in access to the
Company and position itpremium Mt. Belvieu NGLs market. Gas processing capacity is expected to
accelerate its horizontal drilling programincrease in mid-2015 with the addition of Lancaster II, which is a second 300 million cubic feet per day (MMcf/d) cryogenic processing facility currently under construction. The White Cliffs pipeline expansion was completed in the
Wattenberg field. The Company plans to increasethird quarter of 2014, providing additional oil transportation capacity for the region. Management believes that Anadarko is well-positioned with its
activityoil and NGLs export capacity, which includes transport by
deploying seven horizontal rigspipeline, rail, and
drilling approximately 160 horizontal wells in 2012.truck.
Greater Natural ButtesThe Greater Natural Buttes area in eastern Utah is one of the Company’s major tight gas assets, where the Company is focusing on liquids-rich areas.tight-gas assets. The Company utilizes both refrigeration and cryogenic processing facilities in this area to extract natural-gas liquidsNGLs from the gasnatural-gas stream.
The Company operates over 2,200approximately 2,800 wells in the Greater Natural Buttes area and drilled 288133 wells in 2011, and increased year-over-year sales volumes from2014. The Company operated the area by 23%.field at a reduced activity level for the majority of 2014 due to capital allocation to higher-margin projects.
Powder River Deep The Company drilled 10 horizontal wells in the Powder River basin during 2014 as part of a multi-objective horizontal exploration program targeting oil opportunities. The Company has identified more than 6,000 potential locationsseen encouraging results in the Greater Natural Buttes area for future developmentNiobrara and Turner formations. Anadarko controls over 350,000 acres of deep mineral rights within the Powder River basin.
Coalbed Methane Properties Anadarko operates approximately 2,300 CBM wells and owns an interest in the Mesaverde formation. Many of these locations are infill drilling opportunities focused on down-spacing from 40-acre well density to 10-acre well density. Anadarko drilled and completed the lower Mesaverde Blackhawk interval in 56 new developmentapproximately 2,500 nonoperated CBM wells during 2011. This is a capital-efficient program with incremental development costs of approximately $0.50 per-Mcf equivalent. The Company’s other tight-gas assets in the Rockies, areprimarily located in the Greater GreenPowder River areabasin in Wyoming.Wyoming and the Helper and Clawson fields in Utah. Anadarko is expandingcontrols over 640,000 acres of shallow rights within the cryogenic facilities at its Chipeta plant to increase contracted cryogenic processing capacity to 500 MMcf/d by the third quarter of 2012. This expansion is expected to result in an incremental gross recovery of over 15,000 barrels of NGLs per day.Anadarko also operates multiple CBM properties in the Rockies.Powder River basin. CBM is natural gas that is generated and stored within coal seams. To produce CBM, water is extracted from the coal seam, resulting in reduced pressure and the release of natural gas, which flows to the wellhead. Anadarko’s primary CBM properties are locatedThe Company operated the field at a reduced activity level in the Powder River basin2014 due to capital allocation to higher-margin projects.
Salt Creek and Atlantic Rim areas in Wyoming and the Helper and Clawson fields in Utah. Anadarko operates approximately 4,000 low-cost CBM wells and has an interest in approximately 4,500 non-operated CBM wells in the Rockies. In 2011, Anadarko reduced development activity in its CBM program asMonell During 2014, the Company continued to allocatethe development of its capital spending toward its liquids-rich opportunities. A reductionRockies EOR assets in CBM development activity is expected to continuethe Salt Creek and Monell fields in 2012 as a result of low natural-gas prices.Wyoming. The Company’s EOR operations increase the amount ofuse carbon dioxide (CO
2) to stimulate oil that can be producedproduction from mature reservoirs after primary and water-flood recovery methods have been completed. During 2011,Significant gains in production were achieved in this area due to the Company continued to pursueCompany’s ongoing development of its Rockies EOR assets at the Monell and Salt Creek fieldsprograms, with oil production rising 10% in Wyoming. Monell field development is near completion with a small drilling program scheduled to finish edge-pattern development, and some minor infrastructure investments planned for 2012 to enhance carbon dioxide flooding operations. Throughout 2012,2014. In 2015, the Company plans to progresscontinue the tertiary recovery operations atmanagement of these fields to enhance CO2 flooding operations. In 2012, the Company entered into a carried-interest arrangement where a third party agreed to fund $400 million of development costs in exchange for a 23% interest in the Company’s EOR development in the Salt Creek whichfield in Wyoming. The funding commitment was completed in 2014.
Laramie County, Wyoming Anadarko holds ownership in more than 100,000 mineral-interest acres in this emerging liquids-rich play, targeting the Niobrara and Codell formations in the northern DJ Basin. In 2014, the Company has been continuously implementing since 2003.participated in more than 70 nonoperated wells testing the Niobrara and Codell formations. Early results from wells drilled in 2014 are encouraging, as results from the 19 nonoperated wells that are currently producing remain strong with initial 30-day net production averaging approximately 1,000 barrels of oil equivalent per day (BOE/d).
Greater Green River Basin Anadarko operates over 1,400 wells in the Wamsutter and Moxa fields, which are primarily dry-gas assets. The Company also carries a nonoperated position in 2,600 wells between the two fields. Much of this producing area is in the Land Grant, which improves the economics of projects in the area.
In late 2013, Anadarko acquired additional working interests and became the operator in the Moxa field, increasing the Company’s net production by approximately 6,500 BOE/d. In 2014, additional value was realized through reduction in the decline rates and decreasing operating costs.
In January 2014, Anadarko sold its interest in the Pinedale/Jonah assets in Wyoming for $581 million.
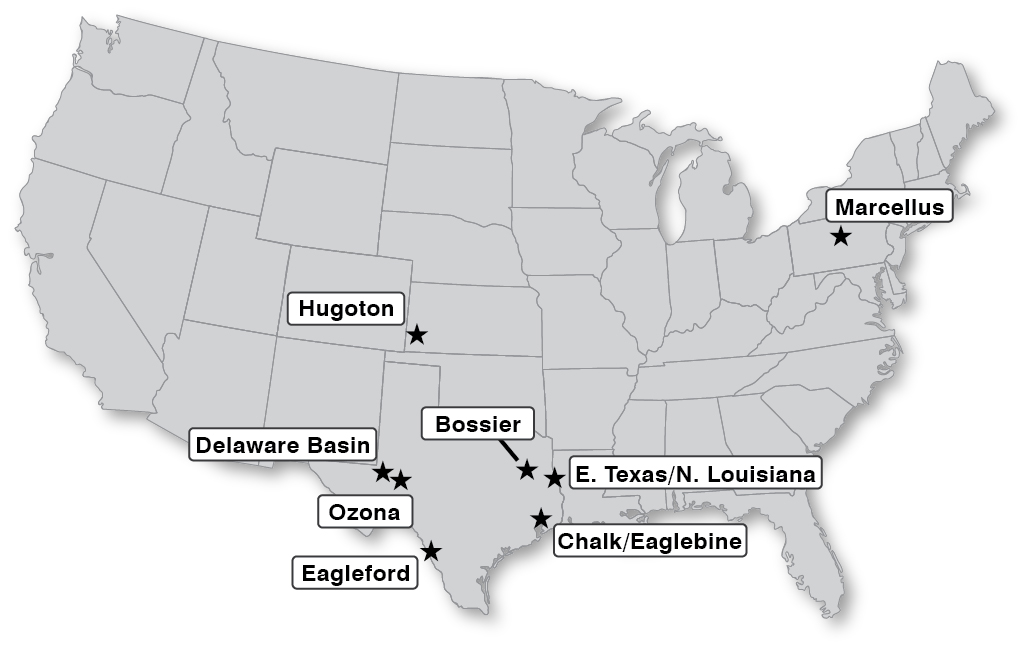
Southern and Appalachia Region Anadarko’s Southern and Appalachia Region properties are primarily located in Texas, Pennsylvania, Louisiana, Kansas, and Ohio.Kansas. The region includes the Eagleford shale in South Texas, the Delaware basin in West Texas, the Marcellus shale in north-central Pennsylvania, and the Haynesville shale in East Texas and Louisiana. Operations in these areas are focused on finding and developing both natural gas and liquids from shales, tight sands, and fractured-reservoir plays. During 2014, the Company continued to focus on liquids-rich opportunities across the region by expanding drilling activity in the emerging Wolfcamp shale play in the Delaware basin and other shale plays, while continuing its existing liquids-rich projects in the Eagleford shale, Delaware basin, and East Texas/North Louisiana plays. The Company has reduced costs and benefited from improved cycle-time efficiencies in both drilling and completion operations across all operating areas in the region.
In 2014, total-year sales volumes in the Southern and Appalachia Region increased 16% over 2013, with a 33% increase in liquids volumes. The Company drilled 589 operated horizontal wells and brought 730 wells online in 2014. In 2015, the Company expects to continue its horizontal drilling program, focusing on the Texas assets.
Eagleford The Eagleford shale development in South Texas consists of approximately 357,000 gross acres and over 1,100 producing wells. The Company drilled 393 wells, completed 388 wells, and brought 385 wells online generating 47% sales volume growth year over year.Anadarko entered 2014 with 10 drilling rigs and reduced the rig count to eight by the end of 2014 due to outstanding drilling performance. To facilitate additional completion activities, water infrastructure was expanded in 2014, increasing capacity by 75 thousand barrels per day (MBbls/d). The Company continues to test concepts for additional recovery across its acreage position and completed successful tests on two upper-Eagleford shale wells.
Delaware Basin Anadarko holds an interest in approximately 705,000 net acres in shale and other emerging-growth plays throughout the Southern and Appalachia Region. These plays include the Eagleford/Pearsall shales in southwest Texas, the Marcellus shale in north-central Pennsylvania, the Bone Spring formation and Avalon shale in the Delaware basin of West Texas, the Haynesville shale in East Texas and Louisiana, and the Utica shale in eastern Ohio. Anadarko also has tight gas and/or fractured-reservoir operations in the Bossier, Haley, Carthage, Chalk, South Texas and Ozona areas in Texas, and the Hugoton area in southern Kansas.In 2011, the Company drilled 442 wells and completed 364 wells in the Southern and Appalachia Region. Over 97% of the operated wells were drilled horizontally. By utilizing modernized drilling rigs and experienced crews, the region continued to experience improved drilling efficiencies in every area with respect to cycle times, while also drilling longer lateral lengths. Due to lower natural-gas prices, the Company is focusing its drilling activity in liquids-rich areas, such as the Eagleford shale and the Bone Spring and Avalon formations.
The Eagleford shale continues to be one of the Company’s most economic plays, capable of generating returns in excess of 100%. In the first quarter of 2011, Anadarko entered into a joint-venture agreement that conveyed 33.3% of the Company’s Eagleford and Pearsall shale assets to a third party. The third party acquired 96,000 net acres (80,000 acres within the Eagleford shale and the underlying Pearsall shale rights, and an additional 16,000 acres limited to Pearsall shale rights only) in exchange for funding $1.6 billion of Anadarko’s future drilling costs. The funding began in the second quarter of 2011 and covered $500 million of the Company’s 2011 development costs. The funding covers 90% of Anadarko’s development costs in subsequent years up to a $650 million annual limit. Based on expected activity, the third-party funding is expected to be fully utilized in the second half of 2013. Anadarko currently holds approximately 405,500 gross and 193,000 net acres with an average working interest of approximately 49% in this area. During 2011, the Company operated an average of nine rigs, which spud 228 horizontal wells and completed 197 wells. The Company began the year producing 14,300 net (27,000 gross) barrels of oil equivalent per day (BOE/d) and ended the year at over 27,400 net (77,000 gross) BOE/d, after completing over 3,200 fracturing stages during the year.
In the Appalachian basin, where the Marcellus shale is being developed, 134 operated horizontal wells were spud and 73 wells were completed utilizing a fleet that averaged seven rigs for the year. Anadarko also participated in 148 new horizontal wells and 135 completions as a non-operating partner in the area. Anadarko has a joint-venture agreement that permits a third party to participate with the Company as a 32.5% partner in the Company’s Marcellus shale assets in exchange for funding $1.4 billion of Anadarko’s drilling costs. The third party funded 100% of the Company’s 2010 development costs and 90% of these costs in 2011. The third party will continue to fund 90% of the development costs until the funding commitment is exhausted, which is anticipated to occur in 2012. Anadarko’s production in the area increased from a net 2010 year-end exit rate of 84 million cubic feet per day (MMcf/d) of natural gas to a net year-end exit rate of 230 MMcf/d.
During 2011, the Company accumulated over 370,000600,000 gross acres in the prospective liquids-rich area of the eastern Ohio Utica shale in the AppalachianDelaware basin. Two Utica horizontal pilot wells reached total depth in the fourth quarter of 2011 and Anadarko plans to accelerate the pilot and testing program in 2012.
Anadarko owns 330,000 net acres in the Delaware basin, which has seen significantAnadarko’s 2014 drilling activity primarily targetingtargeted the liquids-rich Bone Spring formation, the Avalon shale, and Avalon shale.the developing Wolfcamp shale play. In 2011,2014, Anadarko spud 50 operated wells, participated in 27 non-operated wells, and completed 54drilled 97 operated wells and 27 non-operated wellsparticipated in 43 nonoperated wells. Significant infrastructure was added, which increased NGLs sales volumes by 82% over 2013. In addition, in November 2014, Western Gas Partners, LP (WES), a consolidated subsidiary of the Company, acquired Nuevo Midstream, LLC (Nuevo), which has gathering and processing assets located in the area. Drilling and well performance continue to improve with well tests producing in excess of 2,000 BOE/d.Delaware basin. The Company had four rigsone operated rig drilling in the Bone Spring formation, and one operated rig drilling in the Avalon shale, and eight operated rigs drilling in the Wolfcamp shale at year-end 2011.
Alaska2014.
The successful Wolfcamp shale delineation program continues to deliver encouraging results across the majority of Anadarko’s oilacreage position. Anadarko is testing multiple zones within the Wolfcamp shale and natural-gas productionseveral development concepts including multi-well pads, extended laterals, and developmenthorizontal well spacing for increased efficiency. The Company has identified thousands of potential drilling locations in the Wolfcamp formations that are expected to provide substantial opportunity for Anadarko’s continued activity in Alaskathe basin.
Eaglebine Anadarko holds 156,000 gross acres in the Eaglebine shale in Southeast Texas, most of which is concentrated primarily on the North Slope. Development activityheld by existing Austin Chalk production. In 2014, Anadarko continued at the Colville River Unit through 2011to delineate and develop this acreage with eight wells drilled.a one-rig drilling program. In 2012,September 2014, the Company anticipates participatingentered into a carried-interest arrangement requiring a third party to fund $442 million of Anadarko’s capital costs in exchange for a 34% working interest in the Eaglebine development. Anadarko will remain the operator with an average post-transaction working interest of approximately 12 development wells51%. This transaction allows the Company to develop this oil opportunity while further enhancing Anadarko’s capital efficiency and the sanctioningflexibility. At December 31, 2014, $22 million of the Alpine West satellite development.total $442 million obligation had been funded.
East Texas/North Louisiana Anadarko holds 293,000 gross acres in East Texas/North Louisiana. Anadarko increased its capital program in the East Texas Carthage area in 2014, targeting a liquids-rich area in the Haynesville shale. In 2014, Anadarko operated six rigs and drilled 52 wells in the Haynesville and Cotton Valley formations. The Company increased sales volumes from the area by 10% year over year.
Marcellus The Company holds 654,000 gross acres in the Marcellus shale of the Appalachian basin. During the year, 24 operated horizontal wells were drilled using one rig. Anadarko also participated in drilling an additional 78 nonoperated horizontal wells in 2014. The Company’s production in Marcellus continued to improve with sales volumes increasing 12% over 2013.
Gulf of MexicoIn the Gulf of Mexico, Anadarko owns an average 64%61% working interest in 487394 blocks. The Company operates seven active floating platforms and holds interests in 3423 producing fields, and is infields. During 2014, the process of delineating and developing six additional fields in the area.Following a period of significantly reduced activity as a resultCompany advanced development of the drilling moratorium in 2010, during 2011, the Company resumedLucius and Heidelberg projects and continued an active deepwater explorationdevelopment and appraisal program in the Gulf of Mexico and is continuingas it continues to take advantage of its existing infrastructure to accelerate resource development activities at reduced costs. Anadarko made its
The following includes the significant development, exploration, and appraisal activity in the Gulf of Mexico during 2014.
Development
Lucius The Company realized first post-moratorium deepwater discoveryproduction at the Cheyenne East prospect, which is being developed as a tieback to the Independence Hub (IHUB)Anadarko-operated Lucius Spar in January 2015, bringing on three wells initially and isramping up production with an additional three wells expected to produce 60 MMcf/come online during the first quarter of 2015. The successful Lucius project was developed with production startup only three years from sanction and five years from discovery. The 80-MBbls/d spar resides in Keathley Canyon Block 875 with a water depth of natural gas. First production from this well is expected by March 2012. 7,100 feet.
A carried-interest arrangement with a third party, entered into in 2012, provided funding forthe substantial majority of Anadarko’s development capital commitment through first production. Following the carried-interest arrangement and 2014 equity re-determination, the Company holds a 23.8% working interest in Lucius.
Heidelberg The Company also completed a workover at the Spiderman IHUB well, resulting in natural-gas production at a rate in excess of 90 MMcf/d. In 4.5 years since first production, aggregate IHUB production surpassed one trillion cubic feet (Tcf) in early 2012. In Green Canyon Block 903, the Heidelberg appraisal well (44% operated working interest) began drilling in October 2011, and was declared successful in February 2012. The Company plans to sidetrack the well to evaluate the down-dip extent of the field.During 2011, Anadarko continuedcontinues to advance the Lucius field development. The unitization agreement for the Anadarko-operated Lucius fieldHeidelberg development project, which was signedsanctioned during the second quarter of 2011,2013. The construction of the 80-MBbls/d spar is progressing on schedule with anticipated start-up in 2016. At December 31, 2014, fabrication of the main topsides module was more than 70% complete and ahead of schedule.
In 2013, the Lucius project was sanctioned duringCompany entered into a carried-interest arrangement requiring a third party to fund $860 million of capital costs in exchange for a 12.75% working interest in the project. The carry obligation is expected to cover the substantial majority of the Company’s expected future capital costs through first production. At December 31, 2014, $386 million of the $860 million obligation had been funded. Anadarko holds a 31.5% working interest in Heidelberg. Development drilling commenced in late 2014 on two development wells.
Caesar/Tonga At Caesar/Tonga (33.75% working interest), the Company successfully completed a fourth development well (GC 727#2) in the first quarter of 2011 with first production expected in 2014. A production-handling agreement to process natural gas from the Hadrian South field at the Lucius facility was executed with the Hadrian South co-venturers,2014, and will add additional value to the Lucius development. The Company completed a successful well test at Lucius, which showed that the well is capableproducing 10 MBbls/d of flowing in excessoil. Anadarko is currently completing a fifth development well (GC 683#2), which is expected to come online during the first quarter of 15,000 barrels per day (Bbls/d)2015.
K2 At K2 (41.8% working interest), the GC 562 #5 infill well found 210 feet of oil pay in the Miocene, and that the main pay intervals are well connected. Lucius will be developed withis being sidetracked for a truss spar floating production facility withsubsequent completion. The well is expected to come online in the capacity to produce in excesssecond half of 80,000 Bbls/d of oil and 450 MMcf/d of natural gas. The spar is currently under construction and will be2015.
Constitution At Constitution (100% working interest), the largest of Anadarko’s operated spars. The Company plans to have an activeexecuted a successful platform drilling program in 2014, where the area beginning in 2012, with plans to drill its Spartacus prospect during the year.Anadarko continued advancing its development project at Caesar/Tonga. The CompanyA1 well was sidetracked, completed, and tested three wells that each demonstrated facility-constrained flow rates of approximately 15,000 Bbls/brought online producing 3 MBbls/d of oil. First production is expected by mid-2012.
During 2011,
Vito In 2014, Anadarko participatedsold its 18.67% working interest in the drillingnonoperated Vito deepwater development, along with several surrounding exploration blocks, for $500 million.
Exploration
Three exploration wells were drilled in the Gulf of the Coronado #1Mexico during 2014. The Deep Nansen exploration well (15%(35% working interest), located targeted Lower Tertiary-aged sediments in Walker Ridge Block 143.a large, four-way structure beneath Anadarko’s Nansen field and found non-commercial quantities of hydrocarbons and the well was plugged and abandoned. The evidence of a working petroleum system is being incorporated into potential future activity on the surrounding leasehold. The Bimini exploration well (50% working interest) was drilled in Garden Banks close to existing infrastructure at the Anadarko-operated Power Play field and near the Conger field and Baldpate Platform. The well spud in October 2011tested a subsalt Miocene prospect and was plugged and abandoned as a result of unanticipated geopressure inabandoned. The K2 development well was drilled deeper to test the shallow section. At year-end 2011, seismic was being reviewed to determine a new well location. In June 2011,Wilcox potential beneath the Kakuna #1 subsalt exploration well spud. Anadarko has an option to acquire a 6.25% interest or an overriding royalty interest in the well, which is locatedexisting field in Green Canyon Block 505, northand did not find commercial quantities of hydrocarbons in the Company’s Caesar/Tonga development. In addition,Wilcox objective. The K2 well will be sidetracked and completed in a field pay interval. Also, the Vito NEYeti exploration well (37.5% nonoperated working interest) was spud prior to year end. The well will test a Miocene sub-salt three-way closure in Walker Ridge.
Appraisal
Shenandoah Basin The Company spud the Shenandoah-3 well, its second appraisal well (20% non-operated working interest), locatedat the Shenandoah discovery, in Mississippi Canyon Block 940, spud in early 2012 and will test the northeast flank of the Vito discovery.Due to the drilling moratorium, Anadarko redeployed its deepwater rigs to other parts of the world but retained theEnsco 8500 under a long-term contract for operations in the Gulf of Mexico. The Gulf of Mexico has regained momentum and the Bureau of Safety and Environmental Enforcement (BSEE) is approving drilling permits, which has prompted Anadarko to execute contracts for theEnsco 8505 rig, with delivery scheduled for the second quarter of 20122014. The well finished drilling at the end of 2014 and found approximately 50% (1,470 feet) more of theEnsco 8506 rig, with delivery same reservoir sands 1,500 feet down-dip and 2.3 miles east of the Shenandoah-2 well, which encountered over 1,000 feet of net oil pay in excellent quality Lower Tertiary-aged sands. The Shenandoah-3 well confirmed the sand depositional environment, lateral sand continuity, excellent reservoir qualities, and down-dip thickening. The well also enabled the projection of oil-water contacts based on pressure data and reduced the uncertainty of the resource range. Planning is underway for the next appraisal well, which the Company expects to spud in the fourthsecond quarter of 2012. Both2015.
An appraisal well at theEnsco 8500 Coronado discovery (35% working interest) reached total depth during the second quarter of 2014 and did not find theEnsco 8505 are shared rig contracts between Anadarko Lower Miocene objective and other Gulfwas plugged and abandoned.
During the third quarter of Mexico operators. Also,2014, theTransocean Spirit rig, currently first appraisal well of the Yucatan discovery (25% working interest) was drilled down-dip of the original discovery, and found approximately 57 gross feet of pay in West Africa, will be mobilized toLower Tertiary oil-bearing sands. The Yucatan discovery is located approximately three miles south of the Gulf of Mexico in the latter part of 2012 to service the Company’sShenandoah discovery.
AlaskaAnadarko’s nonoperated oil development projects and exploration activities in the Gulf of Mexico. Anadarko expects exploration and appraisal activities to return to pre-moratorium levels in 2012. In addition, Anadarko signed long-term lease agreements for two new-build state-of-the-art drillships. TheOcean BlackHawk is expected to be delivered in late 2013 and theOcean BlackHornet is expected to be delivered in early 2014. These rigs are dual-activity and dual blowout-prevention rigs, reflecting Anadarko’s focus on continuing to enhance operational efficiency.International
Overview The Company’s international oil and natural-gas production and development activity in Alaska is concentrated on the North Slope. Infrastructure construction began in 2013 on the Alpine West satellite development, a 15-to-20-well extension of the Alpine field. Drilling at Alpine West is scheduled to commence in mid-2015 with production anticipated to come online in late 2015 or early 2016.
International
Overview Anadarko’s international operations are located primarilyinclude oil, natural-gas, and NGLs production and development in Mozambique, Algeria, Ghana, and China.Ghana. The Company also has exploration acreage in Brazil, Colombia, Côte d’Ivoire, Ghana, Mozambique, Brazil,Kenya, Liberia, Sierra Leone, Kenya, Cote d’Ivoire,Mozambique, New Zealand, Indonesia, and other countries. International locations accounted for 13%11% of Anadarko’s total sales volumes and 27%21% of sales revenues during 2011, as well as 10%2014, and 8% of total proved reserves at year-end 2011. Anadarko drilled 33 wells in international areas in 2011, which included natural-gas discoveries in Mozambique and oil discoveries in Ghana.2014. In 2012,2015, the Company expects to drillfocus its exploration and appraisal activity in East Africa, Côte d’Ivoire, and Colombia.
Mozambique Anadarko operates two blocks (one onshore and one offshore) totaling approximately 25 development5.3 million gross acres at December 31, 2014. From a construction, finance, and 25 exploration wells at various international locations.marketing perspective, the Company is positioned to commence project execution and deliver first cargoes in the expected 2019 timeframe; however, the pace of this project is dependent upon securing necessary approvals from the government of Mozambique.
Development In February 2014, the Company sold a 10% working interest in Offshore Area 1 in Mozambique for $2.64 billion. Anadarko remains the operator of Offshore Area 1 with a working interest of 26.5%.
During 2014, the Company obtained reserves certification from a third party indicating sufficient volumes to support an initial LNG development. The Environmental Impact Assessment was approved by the government of Mozambique. The Company completed front-end engineering and design (FEED) for the onshore liquefaction facilities and the offshore gathering infrastructure and is in the process of selecting the contractor groups for construction. Anadarko and its partners reached non-binding Heads of Agreements for long-term LNG sales to buyers in Asian markets covering in excess of eight million metric tonnes per annum. In December 2014, the Mozambique government published a Decree Law that is sufficient to continue progressing project finance, marketing, and construction and operation of an LNG project. This legislation marks a critical step toward establishing a project-wide legal and contractual framework that delivers a level of fiscal stability enabling continued equity investments by the Company and potential access to significant limited-recourse project finance capital.
Exploration In the Offshore Area 1, the Tubarão Tigre-1 exploration well was drilled approximately 37 miles south of the Orca-1 discovery well and encountered more than 92 feet of net gas pay in Paleocene sands. The Ouriço do Mar exploration well was drilled 22.5 miles south of the Orca-1 discovery well and tested the potential down-dip extent of the Paleocene reservoirs found in the Orca and Tubarão Tigre discoveries. The well was plugged and abandoned during the third quarter of 2014. Appraisal of the Orca discovery continued with the drilling of three appraisal wells. During the first quarter of 2014, the Orca-2 well encountered 151 feet of Paleocene reservoir sand with the top 26 feet being charged, establishing the gas/water contact for the discovery. The rig moved to the Orca-3 location and encountered 102 net feet of natural-gas pay in the Paleocene. The Orca-4 well reached total depth during the fourth quarter of 2014 encountering natural-gas pay in two reservoirs. At the end of 2014, the rig was located at Tubarão Tigre-2 drilling the first appraisal well associated with the Tubarão Tigre discovery. Data from these wells will be used to further delineate the size of the resource and determine future appraisal activity for the Orca and Tubarão Tigre discoveries.
In the Onshore Rovuma (35.7% working interest), the Anadarko-operated Tembo-1 well completed drilling at the end of the fourth quarter in 2014. The well encountered gas and condensate in one of the Cretaceous reservoirs and post-drill evaluations are underway to determine if additional exploration is warranted within the prospect area. A rig has been mobilized to the second well in the program, Kifaru, which will test Miocene, Oligocene, and Paleocene gas targets near the future LNG facility site.
Algeria Anadarko is engaged in production and development and production activitiesoperations in Algeria’s Sahara Desert in Blocks 404 and 208. Currently, all production is from fields located in Block 404,208, which produce through the Hassi Berkine South and Ourhoud Central Production Facilities (CPF). The El Merk project progressed to approximately 88% overall completion at December 31, 2011, and remains on target for initial production in 2012 with significant gross volumes expected at the facility near the end of 2012. The percentage of overall completion captures the progress of ongoing construction work at the El Merk CPF and associated infrastructure such as offsite facilities, export pipelines, and power transmission lines. During 2011, 16 development wells were drilled in Blocks 404 and 208. The Company expects 2012 development drilling activity to be similar to 2011 levels, with continued focus on El Merk drilling.Contracts and Partners Since October 1989, the Company’s operations in Algeria have beenare governed by a Production Sharing Agreement (PSA) between Anadarko, two thirdother parties, and Sonatrach, the national oil and gas company of Algeria. Anadarko’s interest in the PSA for Blocks 404 and 208 is 50% before participation at the exploitation stage by Sonatrach. The Company has two partners, each with a 25% interest, also prior to participation by Sonatrach. Under the terms of the PSA, oil reserves that are discovered, developed, and produced are shared by Sonatrach, Anadarko, and the remaining two partners. Sonatrach is responsible for 51%24.5% of the development and production costs Anadarko is responsible for 24.5%,these blocks. The Company produces oil through the Hassi Berkine South and its two partners are each responsible for 12.25%. Anadarko and its partners have completed the exploration program on BlocksOurhoud central processing facilities (CPF) in Block 404 and 208oil, condensate, and now participate onlyNGLs through the El Merk CPF in development activity onBlock 208. Gross production through these blocks. Anadarkofacilities averaged more than 383 MBbls/d in 2014, and its joint-venture partners funded Sonatrach’s sharea quarterly net production record of exploration costs and are entitled to recover these exploration costs from production during the development phase.
Exceptional Profits Tax In July 2006, the Algerian parliament approved legislation establishing an exceptional profits tax on foreign companies’ Algerian oil production. In December 2006, regulations regarding this legislation were issued. These regulations provide for an exceptional profits tax imposed on gross production at rates of taxation ranging from 5% to 50% based on average daily production volumes for each calendar month in which the price of Brent crude averages over $30 per barrel. Exceptional profits tax applies to the full value of production rather than to the amount in excess of $30 per barrel.
In response to the Algerian government’s impositionapproximately 75 MBOE/d was achieved as all of the exceptional profits tax,fields at the Company notified Sonatrach of its disagreement with the collection of the exceptional profits tax.El Merk CPF were increased to full oil production rates. The Company believes that the PSA provides fiscal stability through several provisions that require Sonatrach to pay all taxes and royalties. To facilitate discussions between the partiesdrilled nine development wells in an effort to resolve the dispute, in October 2007 the Company initiated a conciliation proceeding on the exceptional profits tax as provided in the PSA. The Conciliation Board issued its non-binding recommendation in November 2008. In February 2009, the Company initiated arbitration against Sonatrach with regard to the exceptional profits tax by submitting a notice of arbitration to Sonatrach. The arbitration hearing on the merits of the claims presented by Anadarko took place in June 2011 and the Company anticipates the issuance of the arbitration panel’s decision in the near term. Any decision issued by the arbitration panel is binding on the parties.
2014.
Ghana Anadarko’s explorationproduction and development activities in Ghana are located offshore in the West Cape Three Points Block and the Deepwater Tano Block.
The Jubilee field (27% nonoperated unit interest), which spans both the West Cape Three Points Block and the Deepwater Tano Block, averaged gross production of 102 MBbls/d of oil in 2014. In December 2010, 3.5 years following discovery, the Companyfourth quarter of 2014, a pipeline tie-in was completed and its partners achieved first oilnatural-gas exports commenced from the Jubilee field.field to an onshore gas processing plant. The natural-gas exports are being delivered to satisfy a commitment established in conjunction with the Jubilee development plan and are expected to allow increases in future oil production rates. The Company and its partners completed executionare evaluating options to further expand the oil throughput capacity of the Phase 1 development program and tied back 17 wells to the floating production, storage, and offloading vessel (FPSO) atand expect to submit a full-field development plan for the Jubilee field. field to the government of Ghana in 2015.
The gross oilJubilee J-24 development well was drilled deeper to evaluate the Mahogany sands below the Jubilee reservoirs. Additional appraisal work was completed in 2014 in the Mahogany and Akasa fields and the data is under evaluation.
In 2013, development commenced on the Tweneboa/Enyenra/Ntomme (TEN) project (19% nonoperated working interest). The project will use an 80-MBbls/d-capacity FPSO for production levelfrom subsea wells. Significant progress was made during 2014, including engineering design completion, the successful dry-docking of the FPSO, and drilling of the first nine wells. The project was approximately 70,000 Bbls/d50% complete at year-end 2011 from eight producing wells. Completion issues required a side-track2014 and remains on budget and on schedule for first production in 2016.
ChinaIn August 2014, the Company sold its Chinese subsidiary for $1.075 billion.
Index to Financial StatementsDuring 2011, the Company participated in 10 exploration and appraisal wells outside the Jubilee field, including the Akasa #1 discovery well in the West Cape Three Points Block (32% non-operated interest), two Teak discovery wells, and one Teak appraisal well to the Teak #1 discovery. The successful Teak appraisal well confirmed a northern extension of the discovery. The Company also participated in two successful Enyenra appraisal wells in the Deepwater Tano Block (18% non-operated working interest) and an additional appraisal of the Tweneboa discovery. A drillstem test (DST) conducted on the Tweneboa #2 well in the bottom oil leg of the reservoir and the DST performed at the Tweneboa #4 well confirmed the connectivity of the two wells. The Ntomme #2 was spud in late 2011 and reached total depth in 2012. This successful appraisal well tested the same targets discovered in the Tweneboa #3ST well and encountered oil pay in excellent-quality sandstone reservoirs. In 2012, the Company plans to participate in up to four exploration and appraisal wells in Ghana.
The Company and its partners anticipate declaration of commerciality for the Tweneboa/Enyenra/Ntomme field complex located in the Deepwater Tano Block during the second half of 2012 following completion of the appraisal program. In the West Cape Three Points Block, stand-alone FPSO and Jubilee tie-back development options are being evaluated to maximize the resource value from the Teak and Akasa discoveries.
Mozambique Anadarko operates two blocks (one onshore and one offshore) in Mozambique totaling approximately six million gross acres. In 2011, the Company drilled two natural-gas discoveries (Tubarão and Camarão) and two successful appraisal wells (Barquentine #2 and Barquentine #3) in the Offshore Area 1 of the Rovuma basin where Anadarko holds a 36.5% working interest. In 2012, the Lagosta #2 and Lagosta #3 appraisal wells successfully appraised discoveries at Lagosta and Camarão. To date, the Company has eight successful wells in the complex, including the Windjammer, Lagosta, Barquentine and Camarão discoveries. As a result, the Company and its partners are continuing to advance a liquefied natural gas (LNG) development, which is being designed to consist of an initial two 5-million-tonne-per-annum trains. Anadarko plans to construct a flexible offshore production system to collect gas from the wells located approximately 35 miles (56 kilometers) offshore, which will deliver gas to the liquefaction plant onshore. Pre-FEED (front-end engineering and design) activities are complete and the Company expects to begin FEED work around the middle of 2012. The Company expects to reach a final investment decision at approximately year-end 2013, with first cargo sales targeted for late 2018.BrazilAlso during 2011, Anadarko acquired two new 3D seismic datasets which have led to a growing number of high-potential prospects in other areas of the Offshore Area 1. Early in 2012, Anadarko mobilized a second deepwater drillship to Mozambique to accelerate the planned exploration and appraisal activities, which include an extensive reservoir testing program and up to seven exploration and appraisal wells in 2012.
ChinaAnadarko’s development and production activities in China are located offshore in Bohai Bay. Development drilling was ongoing throughout 2011, and Anadarko drilled 19 wells during the year including eight side-tracks of low oil-rate/high water-cut producers. The majority of the wells were drilled from the platform expansion decks, which were installed as part of an initiative to sustain continued plateau production. An exploration well in the South China Sea is expected to spud in mid-2012. Consistent with the terms of the Petroleum Contract, the Company is preparing to transfer operatorship of the Bohai Bay development to China National Offshore Oil Corporation at the end of 2012.
BrazilAnadarko holds exploration interests in approximately 750,000300,000 gross acres in sixtwo offshore blocks located offshore Brazil in the Campos basin. At the Wahoo discovery, the Company is evaluating commercialization options by performing pre-FEED and Espírito Santo basins. In these areas,FEED studies.
Colombia During 2014, Anadarko drilled two appraisal wells in 2011. In Block BM-C-32 (33% non-operatedwas the high bidder on the COL1, COL 6, and COL 7 blocks. At December 31, 2014, Anadarko controls the exclusive rights to explore or conduct technical evaluation activities on nine blocks, totaling 16 million acres. The COL 1, COL 2, COL 6, and COL 7 blocks are operated at 100% working interest)interest and the remaining blocks are operated at a 50% working interest.
Two initial prospects have been selected for the 2015 exploration drilling program. The Calasu prospect is a large four-way structure on the north end of the Fuerte Norte block. It has multiple targets and success would reduce the risk of several adjacent structures on the block. The Kronos prospect is located in the Campos basin,Fuerte Sur block and will test a large structure associated with the successful Itaipu #2 pre-saltfrontal area of a large thrust complex. As with Calasu, success would reduce the risk of multiple prospects. The two-well program commenced in early 2015.
Côte d’Ivoire Anadarko owns an operated working interest in five offshore blocks totaling approximately 1.3 million acres, including CI-515 and CI-516 each with a 45% working interest, CI-103 with a 65% working interest, and CI-528 and CI-529 each with a 90% working interest.
The Company continued appraisal of the Cretaceous Paon discovery in Block CI-103, where the discovery well encountered 100 feet of net pay. The Paon-3AR was drilled 3.7 miles down-dip to the discovery well and encountered more than 94 feet of pay. The well established a fluidan oil/water contact and appears to have successfully extendedbe in communication with the accumulation 394Paon-1X discovery. As a result of the success, the drilling of the Paon-4A was accelerated. The well, located six miles east of the Paon-3AR, penetrated over 37 feet downdip fromof pay in the Itaipu discovery well, which is located four miles totarget section and defined the northwest. The appraisal well significantly increases the arealeastern extent of the Itaipu field. Inreservoir. During 2014, Anadarko became operator of the block and farmed down a portion of the working interest for a carry on the appraisal activities. Based on the successful drilling program to date, the partnership and the government are currently discussing additional appraisal drilling activity for 2015, which would include a drillstem test.
The Morue prospect in Block BM-C-29 (50% working interest),CI-516 was drilled and encountered a small accumulation of oil in the Ituana appraisal wellwell-developed sands in the targeted interval, and was plugged and abandoned in 2012. as non-commercial.
The
Company is reviewing the results of the well as part of the evaluation of the Ituana post-salt discovery. Anadarko expects to drill up to four exploration and appraisal wells in Brazil during 2012, including the Wahoo #4 appraisal well in Block BM-C-30 (30% operated working interest).During 2011, the Company began marketing its Brazilian properties and a sale is possible in 2012 subject to receiving acceptable pricing and terms and obtaining regulatory approval.
Liberia The Company currently operates four blocks in offshore Liberia totaling approximately 3.3 million exploration acres in the Liberian basin. Multiple Cretaceous stratigraphic leads, similar to the Jubilee Mahogany fan, have been identified on these blocks. The Montserrado wellSaumon prospect was drilled in 2011 on Block LB-15CI-515 during 2014. The well reached total depth and encountered good-quality, water-bearing sands in the main objective and 27 net feet of pay in a secondary objective.did not find hydrocarbons. The well was plugged and abandonedabandoned.
Kenya Anadarko owns and operates a 45% working interest in five offshore deepwater blocks, encompassing approximately 5.6 million gross acres. An exploration well is currently planned to test a large four-way structure at the results are being incorporated intoMlima prospect in Block L-11B during 2015.
Liberia Two exploration wells were drilled in Block LB-10 (50% working interest) during 2014. The Anadarko-operated Iroko and Timbo wells both encountered non-commercial quantities of oil in their primary targets and were plugged and abandoned. Post-well evaluation is underway to determine the Company’s geologic data for future exploration inremaining prospectivity of the Liberian basin. Plans for 2012 include the incorporationblock. Anadarko completed a farm down prior to drilling, which covered a majority of the drilling results intocosts for these two wells.
New Zealand Anadarko controls the 3D seismicexclusive rights to explore or conduct technical evaluation activities on Blocks 15, 16, and 17, as well as the evaluationfour blocks totaling 42 million acres, of the newly acquired 3D seismicwhich 6.1 million acres are owned under exploration licenses. Anadarko operates a 45% working interest in the LB-10 Block.Sierra Leone Anadarko operatesCanterbury basin block and has a 55% participating100% working interest in Block SL-07B-11 in offshore Sierra Leone encompassing approximately 1.2two Pegasus basin blocks. In the 36 million gross acres. Multiple Upper Cretaceous fan-type prospects have been identifiedacre New Caledonia basin block, Anadarko controls a 25% nonoperated working interest. The Caravel prospect reached its total-depth objective in the lightly explored Liberian basin. The Jupiter #1 well, spudCanterbury basin block and was plugged and abandoned, having encountered natural gas shows and high-quality reservoir in the fourth quarter of 2011, targeted a large Cretaceous fan channel complex similar to the Enyenra and Tweneboa discoveries in Ghana. In 2012, the Jupiter #1 discovery well encountered hydrocarbon pay and has been preserved for possible re-entry, as the area will likely require additional evaluation. The Mercury #2 well, which will be drilled subsequent to Jupiter #1, will appraise the Mercury #1 discovery well that was announced as a discovery in 2010.
Kenya Anadarko operates and has a 50% participating interest in five deepwater blocks offshore Kenya encompassing approximately 7.5 million gross acres. The Company has completed 2D and 3Dprimary objective. A seismic programs and evaluationacquisition is currently taking place with potential drilling possible in late 2012 or early 2013.
Côte d’Ivoire During 2011, Anadarko and its partners began interpreting new 3D seismic data on two deepwater exploration blocks totaling approximately 850,000 gross acres offshore Côte d’Ivoire. Multiple Upper Cretaceous fan-type prospects have been identifiedplanned during 2015 on the 2D and 3D seismic. The Kosrou #1 well, spud in January 2012 on Block CI 105 (50% operated interest), has multiple targets within a large Cretaceous fan located south and east of the Company’s 2009 South Grand Lahou-1X well, which encountered thin sands with shows in the target. The Paon prospect located on Block CI 103 (40% non-operated interest) will be drilled following the Kosrou well. The geology on the block appears similar to that of the Jubilee, Enyenra, and Tweneboa discoveries in Ghana. In 2012, Anadarko purchased approximately 500,000 gross acres in Blocks CI 515 and CI 516 (45% operated interest).block.
New Zealand Anadarko operates approximately 11.5 million exploration acres in the Taranaki and Canterbury basins in New Zealand. A 3D seismic survey of approximately 1,100 square miles was completed on the Taranaki Block in 2011, and a 2D seismic survey of approximately 2,400 miles was acquired over the Canterbury Blocks. Two exploration wells, one on each block, are planned for late 2012 subject to rig availability.OtherIndonesia Anadarko has participating interests in approximately 3.4 million gross exploration acres in Indonesia through a combination of one operated and two non-operated Production Sharing Contracts. In 2012, the Company began marketing its Indonesian properties for sale.
Other Anadarko also has exploration projects in other overseas, new-venture areas including Morocco, Tunisia and South Africa.
Estimates of proved reserves volumes owned at year end, net of third-party royalty interests, are presented in
billionbillions of cubic feet (Bcf), at a pressure base of 14.73 pounds per square inch for natural gas and in millions of barrels (MMBbls) for oil, condensate, and NGLs. Total volumes are presented in millions of barrels of oil equivalent (MMBOE). For this computation, one barrel is the equivalent of 6,000 cubic feet of natural gas. Shrinkage associated with NGLs has been deducted from the natural-gas
reservereserves volumes.
Proved reserves are estimated based on the average beginning-of-month prices during the 12-month period for the respective year.
Disclosures by geographic area include
the United States and International. The International geographic area
includesconsists of proved reserves located in Algeria
Ghana, and
China,Ghana, which by country and in total represents less than 15% of the Company’s total proved reserves.
The Company sold its Chinese subsidiary during 2014.
Summary of Proved Reserves
|
| | | | | | | | | | | |
| | Natural Gas (Bcf) | | Oil and Condensate (MMBbls) | | NGLs (MMBbls) | | Total (MMBOE) |
| December 31, 2014 | | | | | | | |
| Proved | | | | | | | |
| Developed | | | | | | | |
| United States | 6,635 |
| | 352 |
| | 304 |
| | 1,762 |
|
| International | 27 |
| | 190 |
| | 13 |
| | 207 |
|
| Undeveloped | | | | | | | |
| United States | 2,033 |
| | 352 |
| | 162 |
| | 853 |
|
| International | 4 |
| | 35 |
| | — |
| | 36 |
|
| Total proved | 8,699 |
| | 929 |
| | 479 |
| | 2,858 |
|
| | | | | | | | |
| December 31, 2013 | | | | | | | |
| Proved | | | | | | | |
| Developed | | | | | | | |
| United States | 7,120 |
| | 347 |
| | 268 |
| | 1,801 |
|
| International | — |
| | 202 |
| | — |
| | 202 |
|
| Undeveloped | | | | | | | |
| United States | 2,085 |
| | 245 |
| | 127 |
| | 720 |
|
| International | — |
| | 57 |
| | 12 |
| | 69 |
|
| Total proved | 9,205 |
| | 851 |
| | 407 |
| | 2,792 |
|
| | | | | | | | |
| December 31, 2012 | | | | | | | |
| Proved | | | | | | | |
| Developed | | | | | | | |
| United States | 6,445 |
| | 318 |
| | 283 |
| | 1,675 |
|
| International | — |
| | 208 |
| | — |
| | 208 |
|
| Undeveloped | | | | | | | |
| United States | 1,884 |
| | 193 |
| | 110 |
| | 617 |
|
| International | — |
| | 48 |
| | 12 |
| | 60 |
|
| Total proved | 8,329 |
| | 767 |
| | 405 |
| | 2,560 |
|
The Company’s year-end | | | | | | | | | | | | | | | | |
| | | Natural Gas
(Bcf) | | | Oil and
Condensate
(MMBbls) | | | NGLs
(MMBbls) | | | Total
(MMBOE) | |
As of December 31, 2011 | | | | | | | | | | | | | | | | |
Proved | | | | | | | | | | | | | | | | |
Developed | | | | | | | | | | | | | | | | |
United States | | | 6,113 | | | | 352 | | | | 267 | | | | 1,638 | |
International | | | — | | | | 173 | | | | — | | | | 173 | |
Undeveloped | | | | | | | | | | | | | | | | |
United States | | | 2,252 | | | | 184 | | | | 94 | | | | 653 | |
International | | | — | | | | 62 | | | | 13 | | | | 75 | |
| | | | | | | | | | | | | | | | |
Total proved | | | 8,365 | | | | 771 | | | | 374 | | | | 2,539 | |
| | | | | | | | | | | | | | | | |
| | | | |
As of December 31, 2010 | | | | | | | | | | | | | | | | |
Proved | | | | | | | | | | | | | | | | |
Developed | | | | | | | | | | | | | | | | |
United States | | | 5,982 | | | | 303 | | | | 222 | | | | 1,523 | |
International | | | — | | | | 150 | | | | — | | | | 150 | |
Undeveloped | | | | | | | | | | | | | | | | |
United States | | | 2,135 | | | | 195 | | | | 85 | | | | 635 | |
International | | | — | | | | 101 | | | | 13 | | | | 114 | |
| | | | | | | | | | | | | | | | |
Total proved | | | 8,117 | | | | 749 | | | | 320 | | | | 2,422 | |
| | | | | | | | | | | | | | | | |
| | | | |
As of December 31, 2009 | | | | | | | | | | | | | | | | |
Proved | | | | | | | | | | | | | | | | |
Developed | | | | | | | | | | | | | | | | |
United States | | | 5,884 | | | | 300 | | | | 199 | | | | 1,480 | |
International | | | — | | | | 144 | | | | — | | | | 144 | |
Undeveloped | | | | | | | | | | | | | | | | |
United States | | | 1,880 | | | | 200 | | | | 61 | | | | 574 | |
International | | | — | | | | 89 | | | | 17 | | | | 106 | |
| | | | | | | | | | | | | | | | |
Total proved | | | 7,764 | | | | 733 | | | | 277 | | | | 2,304 | |
| | | | | | | | | | | | | | | | |
2014 proved reserves product mix was comparable to the last two years with 51% natural gas, 33% oil and condensate, and 16% NGLs.
Anadarko is focused on growth and profitability, and reserves was 55% natural gas, 30%replacement is a key to growth. Future profitability partially depends on commodity prices and the cost of finding and developing oil and condensate,gas reserves. Reserves growth can be achieved through successful exploration and 15% NGLs; compared to a year-end 2010 product mixdevelopment drilling, improved recovery, or acquisition of 56% natural gas, 31% oil and condensate, and 13% NGLs; and a year-end 2009 product mix of 56% natural gas, 32% oil and condensate, and 12% NGLs.producing properties.
|
| | | | | | | | |
| MMBOE | 2014 | | 2013 | | 2012 |
| Proved Reserves | | | | | |
| January 1 | 2,792 |
| | 2,560 |
| | 2,539 |
|
| Reserves additions and revisions | | | | | |
| Discoveries and extensions | 63 |
| | 145 |
| | 82 |
|
Infill-drilling additions (1) | 577 |
| | 410 |
| | 383 |
|
| Drilling-related reserves additions and revisions | 640 |
| | 555 |
| | 465 |
|
Other non-price-related revisions (1) | (137 | ) | | (40 | ) | | (31 | ) |
| Net organic reserves additions | 503 |
| | 515 |
| | 434 |
|
| Acquisition of proved reserves in place | — |
| | 36 |
| | 4 |
|
Price-related revisions (1) | (1 | ) | | (23 | ) | | (68 | ) |
| Total reserves additions and revisions | 502 |
| | 528 |
| | 370 |
|
| Sales in place | (124 | ) | | (12 | ) | | (81 | ) |
| Production | (312 | ) | | (284 | ) | | (268 | ) |
| December 31 | 2,858 |
| | 2,792 |
| | 2,560 |
|
| Proved Developed Reserves | | | | | |
| January 1 | 2,003 |
| | 1,883 |
| | 1,811 |
|
| December 31 | 1,969 |
| | 2,003 |
| | 1,883 |
|
| |
(1) | Combined and reported as revisions of prior estimates in the Company’s Supplemental Information under Item 8 of this Form 10-K. Reserves bookings related to infill drilling additions are treated as positive revisions. Other non-price-related revisions in 2014 are driven by a reduction of 116 MMBOE in the Wattenberg area primarily associated with the optimization of horizontal drilling locations and the discontinuation of vertical well workover plans. |
The Company’s estimates of proved developed reserves, proved undeveloped reserves (PUDs), and total proved reserves at December 31, 2011, 2010,2014, 2013, and 2009,2012, and changes in proved reserves during the last three years are presented in theSupplemental Information on Oil and Gas Exploration and Production Activities (Supplemental Information)under Item 8 of this Form 10-K.The Company has not filed information with a federal authority or agency with respect to its estimated total proved reserves at December 31, 2011. Annually, Anadarko reports gross proved reserves of operated properties in the United States to the U.S. Department of Energy; these reported reserves are derived from the same data used to estimate and report proved reserves in this Form 10-K.
Also presented in theSupplemental Information are the Company’s estimates of future net cash flows and discounted future net cash flows from proved reserves. SeeOperating Results andCritical Accounting Estimates under Item 7 of this Form 10-K for additional information on the Company’s proved reserves.
The Company has not yet filed information with a federal authority or agency with respect to its estimated total proved reserves at December 31, 2014. Annually, Anadarko reports gross proved reserves for U.S.-operated properties to the U.S. Department of Energy. These reported reserves are derived from the same database used to estimate and report proved reserves in this Form 10-K.
Changes in PUDs Significant changes Changes to PUDs occurring during 20112014 are summarized in the table below. Revisions of prior estimates reflect Anadarko’s ongoing evaluation of its asset portfolio and include updates to prior PUDs, the addition of new PUDs associated with current development plans, revisions to prior PUDs, revisions to infill drilling development plans, as well as the transfer of PUDs to unproved reserve categories due to development plan changes, and the impact of changes in development plans during the period. These PUDseconomic conditions, including changes reflect the ongoing evaluation of Anadarko’s asset portfolio and alignment with current-year changes to development plans.in commodity prices. The Company’s year-end development plans and associated PUDs are consistent with SEC guidelines for PUDs development within five years unless specific circumstances warrant a longer development time horizon. | |
| | |
MMBOE | | | | |
PUDs at December 31, 2010
| | | 749 | |
PUDs at January 1, 2014 | 789 |
|
| Revisions of prior estimates | 333 | | 60 |
|
Extensions, discoveries, and other additions | 32 | | 112 |
|
Conversion to developed | (210 | | (171 | ) |
Sales | (55 | | (22 | ) |
| | | | |
PUDs at December 31, 2011 2014 | 889 | | 728 | |
| | | |
|
Revisions In 2014, PUD revisions of 333 MMBOE were primarily related to successful infill drilling in large onshore areas such as Wattenberg in the Rockies and the Eagleford shale in the Southern and Appalachia Region, partially offset by decreases primarily due to development plan updates.
Extensions, Discoveries, and Other AdditionsDuring 2014, Anadarko added 32 MMBOE of PUDs Conversionthrough extensions, discoveries, and other additions, primarily as a result of successful drilling in the Marcellus and Wolfcamp shale plays in the Southern and Appalachia Region.
Conversions In 2011,2014, the Company converted 171210 MMBOE, or 23%27% of the total year-end 20102013 PUDs, to developed status. Approximately 58%73% of PUDsPUD conversions occurred in U.S. onshore U.S. assets, 26%16% in international assets, and the remaining 16%11% in Gulf of Mexico assets.The majority of PUDs conversions occurred as a result of ongoing development activities
Development activity in the
Rockies andU.S. onshore assets resulted in the
liquids-rich areasconversion of
80 MMBOE in the Southern and Appalachia
Region. Approximately 96Region and 72 MMBOE
of PUDs were converted to developed reserves in
these areas. Thethe Rockies. Ongoing development activity in the Company’s Algerian assets resulted in the conversion of
an additional 4534 MMBOE
of PUDs occurred in
the international areas, most of which are associated with completed production wells in the El Merk project of Algeria where the overall project was approximately 88% complete at December 31, 2011. Another 26 MMBOE of PUDs converted to developed reserves2014. The remaining PUD conversions were associated with
ongoing development
projects in
the Caesar/Tonga project in the U.S.various Gulf of Mexico
where three completed wells are awaiting tie-back to production facilities. The remaining converted PUDs were a result of development activity in Alaska.fields.
Anadarko spent $900 million associated with the development of$1.6 billion to develop PUDs in 2011.2014, of which approximately 74% related to U.S. onshore assets, 13% related to Gulf of Mexico assets, and 13% related to international assets.
In 2013, the Company converted 183 MMBOE, or 27% of the total year-end 2012 PUDs, to developed status. Approximately 68%85% of total 2011 PUDs conversion capitalPUD conversions occurred in U.S. onshore assets, 11% in international assets, and the remaining 4% in Gulf of Mexico assets. Anadarko spent $1.0 billion on PUD development in 2013, of which approximately 70% related to domestic development programs in the Rockies and the Southern and Appalachia Regions. Approximately 12% related to the development of the Caesar/Tonga and Lucius projects in the Gulf of Mexico, and 10%Regions, 25% related to development of international projects, and the El Merk project in Algeria. The remaining 10% of 2011 PUDs development spending was associated with5% related to Alaska and other internationalGulf of Mexico development projects.
Index to Financial StatementsIn 2010, the Company converted 103 MMBOE, or 15% of the total year-end 2009 PUDs to developed status. Approximately 65% of PUDs conversions occurred in onshore U.S. assets, 24% in international assets, and the remaining 11% in Gulf of Mexico assets. Anadarko spent $1.5 billion associated with the development of PUDs in 2010. Approximately 58% of total 2010 PUDs capital related to two major development projects, El Merk in Algeria and Jubilee in Ghana, and 29% related to domestic development programs in the Rockies and the Southern and Appalachia Regions. The remaining 13% of 2010 PUDs development spending was associated with Gulf of Mexico, Alaska, and other international development projects.
Development Plans The Company annually reviews all PUDs to ensure an appropriate plan for development exists. Typically, U.S. onshore U.S. PUDs are converted to developed reserves within five years of the initial proved reserves booking. Projectsbooking, but projects such as EOR, arctic development, deepwater development, and international programs may take longer than five years.longer. All of the Company’s U.S. onshore U.S. PUDs at December 31, 2014, were scheduled to be developed within five years, at December 31, 2011, with the exception of the Salt Creek EOR project, the annual development of which is limited by CO2 supply contract terms andCO2 supply.
At December 31, 2014, the
amount of work that can be physically completed.The Company had 10139 MMBOE of pre-2007pre-2010 PUDs that remain undeveloped five years or more after initial disclosure as PUDs.remained undeveloped. Approximately 50%51% of these PUDs are locatedassociated with Gulf of Mexico opportunities where longer development times are a result of delays associated with operating in Algeria and are being developed according to an Algerian government-approved plan. Nearly all of the Algerian PUDs area deepwater environment, including delays associated with the El Merk development project located in Block 208 inand adoption of enhanced safety procedures and other regulatory changes following the Berkine basin. Site preparation was initiated in 2008 and construction of the El Merk CPF is continuing. As of year-end 2011, 85 wells have been drilled in the El Merk fields and drilling is continuing in 2012. The Reservoir Development Plan includes a total of 141 wells for full development. The overall El Merk project, including future drilling commitments, was approximately 88% complete at December 31, 2011. First oil production from the El Merk fields is expected to occur in 2012.
Deepwater Horizon event.
Another 42%33% of the Company’s pre-2007pre-2010 PUDs are associated with the Salt Creek EOR single-development project located in the Rockies. Since 2003, Anadarko has invested an average of $65$90 million per year to develop various phases of the Salt Creek integrated EOR project and will continue significantsimilar spending levels in the future to complete the development. All of thefuture.
The remaining
pre-2007pre-2010 PUDs are associated with
Gulf of Mexico opportunities wherethe El Merk development
timing is influenced by seasonal restrictionsproject and are being developed according to an Algerian government-approved plan. Anadarko and its partners achieved initial oil production in 2013 and the
depletion of reserves from existing completions. The Company expects to complete these opportunities overEl Merk facility reached maximum allowable oil production rates in 2014 when all the
next three years.fields were brought online and the facility became fully operational.
Technologies Used in Proved ReserveReserves Estimation The Company’s 20112014 proved reserves additions were based on estimates generated through the integration of pertinentrelevant geological, engineering, and production data, utilizingusing technologies that have been demonstrated in the field to yield repeatable and consistent results as defined in the SEC regulations. Data used in these integrated assessments included information obtained directly from the subsurface through wellbores, such as well logs, reservoir core samples, fluid samples, static and dynamic pressure information, production test data, and surveillance and performance information. The data utilizedused also included subsurface information obtained through indirect measurements such as seismic data. The tools used to interpret the data included proprietary and commercially available seismic processing software and commercially available reservoir modeling and simulation software. Reservoir parameters from analogous reservoirs were used to increase the quality of and confidence in the reserves estimates when available. The method or combination of methods used to estimate the reserves of each reservoir was based on the unique circumstances of each reservoir and the dataset available at the time of the estimate.
Internal Controls over Reserves EstimationAnadarko’s estimates of proved reserves and associated future net cash flows were made solely by the Company’s engineers and are the responsibility of management. The Company requires that reserves estimates be made by qualified reserves estimators (QREs), as defined by the Society of Petroleum Engineers’ standards. The QREs are assigned to specific assets within the Company’s regions. The QREs interact with engineering, land, and geoscience personnel to obtain the necessary data for projecting future production, net cash flows, and ultimate recoverable reserves. Management within each region approves the QREs’ reservereserves estimates. All QREs receive ongoing education on the fundamentals of SEC definitions and reserves reporting through the Company’s reserves manual and internal training programs administered by the Corporate Reserves Group (CRG). The CRG ensures confidence in the Company’s reserves estimates by maintaining internal policies for estimating and recording reserves in compliance with applicable SEC definitions and guidance. Compliance with the SEC reserves guidelines is the primary responsibility of Anadarko’s CRG.
The CRG is managed through the Company’s finance department, which is separate from its operating regions, and is responsible for overseeing internal reserves reviews and approving the Company’s
reservereserves estimates. The
Director–ReservesDirector-Reserves Administration and the Corporate Reserves Manager manage the CRG and report to the
Director–CorporateVP-Corporate Planning. The
Director–CorporateVP-Corporate Planning reports to the Company’s
SeniorExecutive Vice President, Finance and Chief Financial Officer, who in turn reports to the
Chairman, President, and Chief Executive Officer. The
AuditGovernance and Risk Committee of the Company’s Board of Directors meets with management, members of the CRG, and the Company’s independent petroleum consultants, Miller and Lents, Ltd. (M&L), to discuss
the results of procedures and methods reviews as discussed below, as well as other matters and policies related to reserves.
The Company’s principal engineer, who is primarily responsible for overseeing the preparation of proved reserves estimates, has over
2528 years of experience in the oil and gas industry, including over
1114 years as either a reserves
evaluatorestimator or manager.
FurtherHis further professional qualifications include a degree in petroleum engineering, extensive internal and external reserves training, and asset evaluation and management.
The principal engineer is a member of the Society of Petroleum Evaluation Engineers and the Society of Petroleum Engineers, where he has been a member for over 28 years. In addition,
the principal engineerhe is an active participant in industry reserves seminars
and professional industry
groups, and has been a member of the Society of Petroleum Engineers for over 25 years.groups.
Third-Party Procedures and Methods ReviewReviews M&L reviewed the procedures and methods used by Anadarko’s staff in preparing its internalthe Company’s estimates of proved reserves and future net cash flows at December 31, 2011.2014. The purpose of the review was to determine thatif the procedures and methods used by Anadarko to estimate its proved reserves are effective and in accordance with the definitions contained in SEC regulations. The procedures and methods reviewreviews by M&L was awere limited reviewreviews of Anadarko’s procedures and methods and doesdo not constitute a complete review, audit, independent estimate, or confirmation of the reasonableness of Anadarko’s estimates of proved reserves and future net cash flows. The review consisted of 17reviews covered 16 fields whichthat included major assets in the United States and Africa, and encompassed approximately 85%88% of the Company’s estimates of proved reserves and associated future net cash flows at December 31, 2011.2014. In each review, Anadarko’s technical staff presented M&L with an overview of the data, methods, and assumptions used in estimating its reserves. The data presented included pertinent seismic information, geologic maps, well logs, production tests, material balance calculations, reservoir simulation models, well performance data, operating procedures, and relevant economic criteria. Management’s intent in retaining M&L to review its procedures and methods is to provide objective third-party input on the Company’s procedures and methods and to gather industry information applicable to reserves estimation and reporting processes.
Sales Volumes, Prices, and Production Costs
The Company’s sales volumes were 308 MMBOE for 2014, 285 MMBOE for 2013, and 268 MMBOE for 2012. Production costs are costs to operate and maintain the Company’s wells, related equipment, and supporting facilities, including the cost of labor, well service and repair, location maintenance, power and fuel, gathering, processing, transportation, other taxes, and production-related general and administrative costs. Additional information on volumes, prices, and production costs is contained in Financial Results under Item 7 of this Form 10-K. Additional detail regarding production costs is contained in the Supplemental Information under Item 8 of this Form 10-K. Information on major customers is contained in Note 20—Segment Information in the Notes to Consolidated Financial Statements under Item 8 of this Form 10-K. The following table provides the Company’s annual sales volumes, average sales prices, and average production costs per BOE for each of the last three years. The Company’s sales volumes for 2011, 2010, and 2009 were 248 MMBOE, 235 MMBOE, and 220 MMBOE, respectively. Production costs are costs to operate and maintain the Company’s wells and related equipment and include the cost of labor, well service and repair, location maintenance, power and fuel, transportation, other taxes, and production-related general and administrative costs. Additional information on volumes, prices and production costs is contained inFinancial Resultsunder Item 7 of this Form 10-K. Additional detail regarding production costs is contained in theSupplemental Informationunder Item 8 of this Form 10-K.years: | | | | | | | | | | | | | | | | | | | | | | | | | | | | | | | | |
| | | Sales Volumes | | | Average Sales Prices(1) | | | | |
| | | Natural
Gas
(Bcf) | | | Oil and
Condensate
(MMBbls) | | | NGLs
(MMBbls) | | | Barrels of
Oil
Equivalent
(MMBOE) | | | Natural
Gas
(Per Mcf) | | | Oil and
Condensate
(Per Bbl) | | | NGLs
(Per Bbl) | | | Average
Production
Costs(2)
(Per BOE) | |
2011 | | | | | | | | | | | | | | | | | | | | | | | | | | | | | | | | |
United States | | | | | | | | | | | | | | | | | | | | | | | | | | | | | | | | |
Greater Natural Buttes | | | 135 | | | | 1 | | | | 4 | | | | 27 | | | | $ 3.58 | | | | $ 84.29 | | | | $ 52.04 | | | | $ 9.54 | |
Other United States | | | 717 | | | | 47 | | | | 23 | | | | 190 | | | | 3.93 | | | | 97.93 | | | | 54.28 | | | | 9.48 | |
| | | | | | | | | | | | | | | | | | | | | | | | | | | | | | | | |
Total United States | | | 852 | | | | 48 | | | | 27 | | | | 217 | | | | 3.87 | | | | 97.70 | | | | 53.95 | | | | 9.50 | |
| | | | | | | | | | | | | | | | | | | | | | | | | | | | | | | | |
International | | | — | | | | 31 | | | | — | | | | 31 | | | | — | | | | 109.20 | | | | — | | | | 9.98 | |
| | | | | | | | | | | | | | | | | | | | | | | | | | | | | | | | |
Total | | | 852 | | | | 79 | | | | 27 | | | | 248 | | | | 3.87 | | | | 102.24 | | | | 53.95 | | | | 9.55 | |
| | | | | | | | | | | | | | | | | | | | | | | | | | | | | | | | |
2010 | | | | | | | | | | | | | | | | | | | | | | | | | | | | | | | | |
United States | | | | | | | | | | | | | | | | | | | | | | | | | | | | | | | | |
Greater Natural Buttes | | | 107 | | | | 1 | | | | 4 | | | | 23 | | | | $ 3.92 | | | | $ 66.50 | | | | $ 39.08 | | | | $ 9.65 | |
Other United States | | | 722 | | | | 47 | | | | 19 | | | | 186 | | | | 4.15 | | | | 75.08 | | | | 43.84 | | | | 8.56 | |
| | | | | | | | | | | | | | | | | | | | | | | | | | | | | | | | |
Total United States | | | 829 | | | | 48 | | | | 23 | | | | 209 | | | | 4.12 | | | | 74.96 | | | | 43.07 | | | | 8.68 | |
| | | | | | | | | | | | | | | | | | | | | | | | | | | | | | | | |
International | | | — | | | | 26 | | | | — | | | | 26 | | | | — | | | | 78.52 | | | | — | | | | 7.56 | |
| | | | | | | | | | | | | | | | | | | | | | | | | | | | | | | | |
Total | | | 829 | | | | 74 | | | | 23 | | | | 235 | | | | 4.12 | | | | 76.22 | | | | 43.07 | | | | 8.56 | |
| | | | | | | | | | | | | | | | | | | | | | | | | | | | | | | | |
2009 | | | | | | | | | | | | | | | | | | | | | | | | | | | | | | | | |
United States | | | | | | | | | | | | | | | | | | | | | | | | | | | | | | | | |
Greater Natural Buttes | | | 100 | | | | 1 | | | | 3 | | | | 21 | | | | $ 3.13 | | | | $ 48.84 | | | | $ 33.68 | | | | $ 9.43 | |
Other United States | | | 709 | | | | 43 | | | | 14 | | | | 175 | | | | 3.68 | | | | 58.75 | | | | 31.00 | | | | 8.50 | |
| | | | | | | | | | | | | | | | | | | | | | | | | | | | | | | | |
Total United States | | | 809 | | | | 44 | | | | 17 | | | | 196 | | | | 3.61 | | | | 58.56 | | | | 31.42 | | | | 8.59 | |
| | | | | | | | | | | | | | | | | | | | | | | | | | | | | | | | |
International | | | — | | | | 24 | | | | — | | | | 24 | | | | — | | | | 59.01 | | | | — | | | | 6.01 | |
| | | | | | | | | | | | | | | | | | | | | | | | | | | | | | | | |
Total | | | 809 | | | | 68 | | | | 17 | | | | 220 | | | | 3.61 | | | | 58.72 | | | | 31.42 | | | | 8.30 | |
| | | | | | | | | | | | | | | | | | | | | | | | | | | | | | | | |
Bcf—billion cubic feet
|
| | | | | | | | | | | | | | | | | | | | | | | | | | | |
| | Sales Volumes | | Average Sales Prices (1) | | Average Production Costs (2) (Per BOE) |
| | Natural Gas (Bcf) | | Oil and Condensate (MMBbls) | | NGLs (MMBbls) | | Barrels of Oil Equivalent (MMBOE) | | Natural Gas (Per Mcf) | | Oil and Condensate (Per Bbl) | | NGLs (Per Bbl) | |
| 2014 |
| | | | | | | | | | | | | | |
| United States | | | | | | | | | | | | | | | |
| Greater Natural Buttes | 154 |
| | 1 |
| | 4 |
| | 31 |
| | $ | 3.93 |
| | $ | 81.74 |
| | $ | 39.16 |
| | $ | 10.30 |
|
| Wattenberg | 125 |
| | 27 |
| | 13 |
| | 62 |
| | 4.19 |
| | 87.76 |
| | 36.46 |
| | 8.00 |
|
| Other United States | 666 |
| | 46 |
| | 26 |
| | 182 |
| | 4.08 |
| | 88.29 |
| | 34.29 |
| | 9.28 |
|
| Total United States | 945 |
| | 74 |
| | 43 |
| | 275 |
| | 4.07 |
| | 87.99 |
| | 35.48 |
| | 9.11 |
|
| International | — |
| | 32 |
| | 1 |
| | 33 |
| | — |
| | 99.79 |
| | 56.16 |
| | 8.22 |
|
| Total | 945 |
| | 106 |
| | 44 |
| | 308 |
| | 4.07 |
| | 91.58 |
| | 36.01 |
| | 9.01 |
|
| 2013 | | | | | | | | | | | | | | | |
| United States | | | | | | | | | | | | | | | |
| Greater Natural Buttes | 168 |
| | 1 |
| | 4 |
| | 33 |
| | $ | 3.12 |
| | $ | 87.46 |
| | $ | 41.79 |
| | $ | 9.59 |
|
| Wattenberg | 102 |
| | 16 |
| | 6 |
| | 40 |
| | 3.75 |
| | 94.27 |
| | 41.75 |
| | 8.55 |
|
| Other United States | 698 |
| | 41 |
| | 23 |
| | 179 |
| | 3.56 |
| | 98.38 |
| | 36.14 |
| | 8.72 |
|
| Total United States | 968 |
| | 58 |
| | 33 |
| | 252 |
| | 3.50 |
| | 97.02 |
| | 37.97 |
| | 8.81 |
|
| International | — |
| | 33 |
| | — |
| | 33 |
| | — |
| | 109.15 |
| | — |
| | 9.96 |
|
| Total | 968 |
| | 91 |
| | 33 |
| | 285 |
| | 3.50 |
| | 101.41 |
| | 37.97 |
| | 8.94 |
|
| 2012 | | | | | | | | | | | | | | | |
| United States | | | | | | | | | | | | | | | |
| Greater Natural Buttes | 163 |
| | 1 |
| | 5 |
| | 33 |
| | $ | 2.26 |
| | $ | 81.34 |
| | $ | 40.43 |
| | $ | 8.75 |
|
| Wattenberg | 95 |
| | 12 |
| | 5 |
| | 33 |
| | 3.00 |
| | 92.16 |
| | 40.72 |
| | 8.05 |
|
| Other United States | 655 |
| | 42 |
| | 20 |
| | 171 |
| | 2.73 |
| | 99.36 |
| | 40.37 |
| | 8.76 |
|
| Total United States | 913 |
| | 55 |
| | 30 |
| | 237 |
| | 2.68 |
| | 97.46 |
| | 40.44 |
| | 8.66 |
|
| International | — |
| | 31 |
| | — |
| | 31 |
| | — |
| | 111.11 |
| | — |
| | 10.89 |
|
| Total | 913 |
| | 86 |
| | 30 |
| | 268 |
| | 2.68 |
| | 102.35 |
| | 40.44 |
| | 8.92 |
|
_______________________________________________________________________________
| |
(1) | Excludes the impact of commodity derivatives. |
| |
(2) | Excludes ad valorem and severance taxes. |
The Company sells crude oil and natural gas under a variety of contractual agreements, some of which specify the delivery of fixed and determinable quantities. At December 31, 2011,2014, Anadarko was contractually committed to deliver approximately 775874 Bcf of natural gas to various customers in the United States through 2021.2031. These contracts have various expiration dates with approximately 50%45% of the Company’s current commitment to be delivered in 2012,2015, and 85%70% by 2016.2019. At December 31, 2011,2014, Anadarko also was also contractually committed to deliver approximately 89 MMBbls of crude oil to ports in Algeria and Ghana through 2012.2015. The Company expects to fulfill these delivery commitments with existing proved developed and proved undeveloped reserves.
Drilling ProgramThe Company’s 2011 drilling program focused on proven and emerging oil and natural-gas basins in the United States (onshore and deepwater Gulf of Mexico) and various international locations. Exploration activity in 2011 consisted of 224 gross completed wells, which included 216 onshore U.S. wells, three offshore Gulf of Mexico wells, and five international wells. Development activity in 2011 consisted of 1,843 gross completed wells, which included 1,813 onshore U.S. wells, two offshore Gulf of Mexico wells, and 28 international wells.
Drilling Statistics
The following table shows the number of oil and gas wells that completed drilling in each of the last three years.
| | | 000000 | | | | 000000 | | | | 000000 | | | | 000000 | | | | 000000 | | | | 000000 | | | | 000000 | |
| | | Net Exploratory | | | Net Development | | | | |
| | | Productive | | | Dry Holes | | | Total | | | Productive | | | Dry Holes | | | Total | | | Total | |
2011 | | | | | | | | | | | | | | | | | | | | | | | | | | | | |
United States | | | 79.0 | | | | 2.2 | | | | 81.2 | | | | 1,169.6 | | | | 6.3 | | | | 1,175.9 | | | | 1,257.1 | |
International | | | 0.5 | | | | 1.2 | | | | 1.7 | | | | 6.8 | | | | 0.2 | | | | 7.0 | | | | 8.7 | |
| | | | | | | | | | | | | | | | | | | | | | | | | | | | |
Total | | | 79.5 | | | | 3.4 | | | | 82.9 | | | | 1,176.4 | | | | 6.5 | | | | 1,182.9 | | | | 1,265.8 | |
| | | | | | | | | | | | | | | | | | | | | | | | | | | | |
2010 | | | | | | | | | | | | | | | | | | | | | | | | | | | | |
United States | | | 84.3 | | | | 1.2 | | | | 85.5 | | | | 1,027.9 | | | | 3.6 | | | | 1,031.5 | | | | 1,117.0 | |
International | | | — | | | | 3.6 | | | | 3.6 | | | | 11.2 | | | | — | | | | 11.2 | | | | 14.8 | |
| | | | | | | | | | | | | | | | | | | | | | | | | | | | |
Total | | | 84.3 | | | | 4.8 | | | | 89.1 | | | | 1,039.1 | | | | 3.6 | | | | 1,042.7 | | | | 1,131.8 | |
| | | | | | | | | | | | | | | | | | | | | | | | | | | | |
2009 | | | | | | | | | | | | | | | | | | | | | | | | | | | | |
United States | | | 30.6 | | | | 5.0 | | | | 35.6 | | | | 587.2 | | | | 7.3 | | | | 594.5 | | | | 630.1 | |
International | | | — | | | | 3.3 | | | | 3.3 | | | | 10.7 | | | | — | | | | 10.7 | | | | 14.0 | |
| | | | | | | | | | | | | | | | | | | | | | | | | | | | |
Total | | | 30.6 | | | | 8.3 | | | | 38.9 | | | | 597.9 | | | | 7.3 | | | | 605.2 | | | | 644.1 | |
| | | | | | | | | | | | | | | | | | | | | | | | | | | | |
The following table shows the number of wells in the process of drilling or in active completion stages and the number of wells suspended or waiting on completion at December 31, 2011.
| | | | | | | | | | | | | | | | | | | | |
| | | Wells in the process
of drilling or
in active completion | | Wells suspended or
waiting on completion |
| | | Exploration | | Development | | Exploration | | Development |
United States | | | | | | | | | | | | | | | | | | | | |
Gross | | | | 39 | | | | | 286 | | | | | 172 | | | | | 346 | |
Net | | | | 14.0 | | | | | 204.7 | | | | | 65.5 | | | | | 206.4 | |
International | | | | | | | | | | | | | | | | | | | | |
Gross | | | | 5 | | | | | 2 | | | | | 34 | | | | | — | |
Net | | | | 1.6 | | | | | 0.3 | | | | | 11.3 | | | | | — | |
Total | | | | | | | | | | | | | | | | | | | | |
Gross | | | | 44 | | | | | 288 | | | | | 206 | | | | | 346 | |
Net | | | | 15.6 | | | | | 205.0 | | | | | 76.8 | | | | | 206.4 | |
Productive Wells
At December 31, 2011, the Company’s ownership interest in productive wells was as follows:
| | | | | | | | | | |
| | | Oil Wells(1) | | Gas Wells(1) |
United States | | | | | | | | | | |
Gross | | | | 4,220 | | | | | 28,550 | |
Net | | | | 3,292.4 | | | | | 17,777.7 | |
International | | | | | | | | | | |
Gross | | | | 338 | | | | | — | |
Net | | | | 85.7 | | | | | — | |
Total | | | | | | | | | | |
Gross | | | | 4,558 | | | | | 28,550 | |
Net | | | | 3,378.1 | | | | | 17,777.7 | |
(1) | Includes wells containing multiple completions as follows:
|
| | | | | | | | | | |
Gross | | | | 380 | | | | | 2,395 | |
Net | | | | 347.4 | | | | | 1,899.1 | |
The following schedule shows the developed lease, undeveloped lease, and fee mineral acres in which Anadarko held interests at December 31, 2011. | | | 00000 | | | | 00000 | | | | 00000 | | | | 00000 | | | | 00000 | | | | 00000 | | | | 00000 | | | | 00000 | |
| | | Developed
Lease | | | Undeveloped
Lease | | | Fee Minerals | | | Total | |
| thousands of acres | | Gross | | | Net | | | Gross | | | Net | | | Gross | | | Net | | | Gross | | | Net | |
United States | | | | | | | | | | | | | | | | | | | | | | | | | | | | | | | | |
Onshore | | | 5,041 | | | | 2,977 | | | | 6,134 | | | | 2,776 | | | | 10,231 | | | | 8,373 | | | | 21,406 | | | | 14,126 | |
Offshore | | | 340 | | | | 167 | | | | 2,403 | | | | 1,645 | | | | — | | | | — | | | | 2,743 | | | | 1,812 | |
| | | | | | | | | | | | | | | | | | | | | | | | | | | | | | | | |
Total United States | | | 5,381 | | | | 3,144 | | | | 8,537 | | | | 4,421 | | | | 10,231 | | | | 8,373 | | | | 24,149 | | | | 15,938 | |
| | | | | | | | | | | | | | | | | | | | | | | | | | | | | | | | |
International | | | 362 | | | | 88 | | | | 38,205 | | | | 19,160 | | | | — | | | | — | | | | 38,567 | | | | 19,248 | |
| | | | | | | | | | | | | | | | | | | | | | | | | | | | | | | | |
Total | | | 5,743 | | | | 3,232 | | | | 46,742 | | | | 23,581 | | | | 10,231 | | | | 8,373 | | | | 62,716 | | | | 35,186 | |
| | | | | | | | | | | | | | | | | | | | | | | | | | | | | | | | |
2014
: |
| | | | | | | | | | | | | | | | | | | | | | | |
| | Developed Lease | | Undeveloped Lease | | Fee Mineral | | Total |
| thousands of acres | Gross | | Net | | Gross | | Net | | Gross | | Net | | Gross | | Net |
| United States | | | | | | | | | | | | | | | |
| Onshore | 5,069 |
| | 3,314 |
| | 5,203 |
| | 2,140 |
| | 10,313 |
| | 8,472 |
| | 20,585 |
| | 13,926 |
|
| Offshore | 293 |
| | 139 |
| | 2,079 |
| | 1,401 |
| | — |
| | — |
| | 2,372 |
| | 1,540 |
|
| Total United States | 5,362 |
| | 3,453 |
| | 7,282 |
| | 3,541 |
| | 10,313 |
| | 8,472 |
| | 22,957 |
| | 15,466 |
|
| International | 499 |
| | 113 |
| | 56,725 |
| | 39,328 |
| | — |
| | — |
| | 57,224 |
| | 39,441 |
|
| Total | 5,861 |
| | 3,566 |
| | 64,007 |
| | 42,869 |
| | 10,313 |
| | 8,472 |
| | 80,181 |
| | 54,907 |
|
At December 31,
2011,2014, the Company had approximately
1326 million net undeveloped lease acres scheduled to expire by December 31,
2012,2015, if the Company does not establish production or take any other action to extend the terms. The Company plans to continue the terms of many of these licenses and concession areas through operational or administrative actions and does not expect a significant portion of the Company’s net acreage position to expire before such actions occur.
Drilling Program
The Company’s 2014 drilling program focused on proven and emerging oil and natural-gas basins in the United States (onshore and deepwater Gulf of Mexico) and various international locations. Exploration activity in 2014 consisted of 88 gross completed wells, which included 71 U.S. onshore wells, five Gulf of Mexico wells, and 12 international wells. Development activity in 2014 consisted of 1,268 gross completed wells, which included 1,264 U.S. onshore wells and four Gulf of Mexico wells.
Drilling Statistics
The following shows the number of oil and gas wells that completed drilling in each of the last three years:
|
| | | | | | | | | | | | | | | | | | | | |
| | Net Exploratory | | Net Development | | Total |
| Productive | | Dry Holes | | Total | | Productive | | Dry Holes | | Total | |
| 2014 | | | | | | | | | | | | | |
| United States | 35.6 |
| | 1.6 |
| | 37.2 |
| | 811.4 |
| | 6.0 |
| | 817.4 |
| | 854.6 |
|
| International | 0.9 |
| | 4.5 |
| | 5.4 |
| | — |
| | — |
| | — |
| | 5.4 |
|
| Total | 36.5 |
| | 6.1 |
| | 42.6 |
| | 811.4 |
| | 6.0 |
| | 817.4 |
| | 860.0 |
|
| 2013 | | | | | | | | | | | | | |
| United States | 62.9 |
| | 1.4 |
| | 64.3 |
| | 879.3 |
| | 3.3 |
| | 882.6 |
| | 946.9 |
|
| International | 0.2 |
| | 3.5 |
| | 3.7 |
| | 5.4 |
| | — |
| | 5.4 |
| | 9.1 |
|
| Total | 63.1 |
| | 4.9 |
| | 68.0 |
| | 884.7 |
| | 3.3 |
| | 888.0 |
| | 956.0 |
|
| 2012 | | | | | | | | | | | | | |
| United States | 79.5 |
| | 1.0 |
| | 80.5 |
| | 923.7 |
| | 11.3 |
| | 935.0 |
| | 1,015.5 |
|
| International | 0.5 |
| | 3.0 |
| | 3.5 |
| | 2.1 |
| | — |
| | 2.1 |
| | 5.6 |
|
| Total | 80.0 |
| | 4.0 |
| | 84.0 |
| | 925.8 |
| | 11.3 |
| | 937.1 |
| | 1,021.1 |
|
The following shows the number of wells in the process of drilling or in active completion stages and the number of wells suspended or waiting on completion at December 31, 2014:
|
| | | | | | | | | | | |
| | Wells in the process of drilling or in active completion | | Wells suspended or waiting on completion (1) |
| | Exploration | | Development | | Exploration | | Development |
| United States | | | | | | | |
| Gross | 7 |
| | 186 |
| | 60 |
| | 861 |
|
| Net | 3.8 |
| | 118.6 |
| | 28.2 |
| | 557.9 |
|
| International | | | | | | | |
| Gross | 2 |
| | — |
| | 57 |
| | 19 |
|
| Net | 0.9 |
| | — |
| | 17.8 |
| | 4.2 |
|
| Total | | | | | | | |
| Gross | 9 |
| | 186 |
| | 117 |
| | 880 |
|
| Net | 4.7 |
| | 118.6 |
| | 46.0 |
| | 562.1 |
|
_______________________________________________________________________________
| |
(1) | Wells suspended or waiting on completion include exploration and development wells where drilling has occurred, but the wells are awaiting the completion of hydraulic fracturing or other completion activities or the resumption of drilling in the future. |
Productive Wells
At December 31, 2014, the Company’s ownership interest in productive wells was as follows:
|
| | | | | |
| | Oil Wells (1) | | Gas Wells (1) |
| United States | | | |
| Gross | 4,611 |
| | 28,200 |
|
| Net | 3,157.9 |
| | 19,271.8 |
|
| International | | | |
| Gross | 201 |
| | 4 |
|
| Net | 36.1 |
| | 1.0 |
|
| Total | | | |
| Gross | 4,812 |
| | 28,204 |
|
| Net | 3,194.0 |
| | 19,272.8 |
|
| |
(1) | Includes wells containing multiple completions as follows: |
|
| | | | | |
| Gross | 245 |
| | 2,862 |
|
| Net | 216.8 |
| | 2,401.4 |
|
MIDSTREAM PROPERTIES AND ACTIVITIES
Anadarko invests in and operates midstream (gathering, processing, treating, and transportation) assets to complement its operations in regions where the Company has oil and natural-gas production. Through ownership and operation of these facilities, the Company is better ableimproves its ability to manage costs, controlcontrols the timing of bringing on new production, and enhanceenhances the value received for gathering, processing, treating, and transporting the Company’s production. In addition, Anadarko’s midstream business also provides services to third-party customers, including major and independent producers. Anadarko generates revenues from its midstream activities through a variety of agreementscontract structures, including fixed-fee, percent-of-proceeds, and keep-whole agreements. Anadarko’s midstream activities include WES, which is a publicly traded limited partnership formed by Anadarko to own, operate, acquire, and develop midstream assets. WES’s general partner interest is owned by Western Gas Equity Partners, LP (WGP), a publicly traded consolidated subsidiary formed to own substantially all of the partnership interests in WES previously owned by Anadarko. At
December 31, 2014, Anadarko’s ownership interest in WGP consisted of an 88.3% limited partner interest and the entire non-economic general partner interest. At December 31, 2014, WGP’s ownership interest in WES consisted of a 34.9% limited partner interest, the entire 1.8% general partner interest, and all of the WES incentive distribution rights. At December 31, 2014, Anadarko also owned an 8.3% limited partner interest in WES through other subsidiaries. At the end of 2011,2014, Anadarko had 3141 gathering systems and 2538 processing and treating plants located throughout major onshore producing basins in Wyoming, Colorado, Utah, New Mexico, Kansas, Oklahoma, Pennsylvania, and Texas. In 2011,2014, the focus of theCompany’s midstream activity was the Company’sconcentrated in liquids-rich growth areas such as Wattenberg, Greater Natural Buttes, Wattenberg,the Delaware basin, and the Eagleford shale, and East Texas/North Louisiana plays, as well as growth in the Marcellus shale dry-gas play. In 2012,2015, the Company plans to continue to focus its midstream investments in these areas, as well ascore areas.
Wattenberg The Company is constructing a second 300-MMcf/d train at its Lancaster cryogenic processing plant, with completion expected in the prospective liquids-rich Utica shale playsecond quarter of 2015. The plant will support the increasing production from horizontal drilling in Ohio.In Greater Natural Buttes, gatheringthe Niobrara development, helping to relieve processing constraints and compressionimprove recoveries of NGLs in the basin. Three new compressor stations are scheduled to come online in the first quarter of 2015 with a total capacity of 70120 MMcf/d was added in 2011 andd. In addition, the Company is constructing a second cryogenic processing trainCentral Oil Stabilization Facility (COSF) with a capacityan expected completion date of 300 MMcf/d at the Chipeta processing complex.mid-year 2015. The new train is expected to commence operations by the third quarter of 2012.
In the Wattenberg area, the Company acquired an additional 93% interestCOSF will stabilize oil in a 195 MMcf/d processing facility from a third party in May 2011 that positions the Company to realize the additional economics associated with the NGL uplift from its natural-gas production that was previously shared withcentralized location and will reduce equipment and installation cost at each well pad. Initial planned throughput for the facility owner. The Company operates and owns a 100% interest in the Wattenberg Plant. The Company plans to expand cryogenic processing capacity with the additionis 125 MBbls/d.
The Company participates in two long-haul NGL pipeline joint ventures, FRP and Texas Express Pipeline (TEP), which provide access to the
Eagleford shale, gas-gathering capacityGulf Coast NGLs market. The FRP, which is connected to the Company’s Lancaster processing facility, was
expanded from 100 MMcf/dplaced in
2010 to 225 MMcf/d in 2011 with plans to further expand system capacity to 500 MMcf/d by the end of 2013. A new Company-operated cryogenic processing plant in the Eagleford shale with capacity of 200 MMcf/d is scheduled to be operationalservice in the first quarter of
2013.2014. The
Eagleford oil-gathering system was placed in service in 2011 with an initialFRP extends 435 miles, providing 150 MBbls/d (expandable to 230 MBbls/d) of NGLs takeaway capacity
from Weld County, Colorado to Skellytown, Texas. In Skellytown, the FRP connects to other pipelines including the TEP. The TEP extends 593 miles providing 280 MBbls/d (expandable to 400 MBbls/d) of
30,000 Bbls/d. The Company plans to expand theNGLs takeaway capacity to
100,000 Bbls/d by the end of 2013. In addition, the first phase of a crude-oil pipeline, with an initial capacity of 100,000 Bbls/d, was placed in service. The oil pipeline replaces truck-based sales and provides price uplift on Anadarko’s oil by reducing aggregate transportation costs.In the Marcellus shale, Anadarko’s gas-gathering capacity increased from 180 MMcf/d in 2010 to 500 MMcf/d in 2011. The Company plans to add an additional 500 MMcf/d of capacity in 2012.
During 2011, Anadarko and its partners agreed to design and construct a new NGL pipeline that will originate from Skellytown, Texas and extend approximately 580 miles to NGLNGLs fractionation and storage facilities in Mont Belvieu, Texas. The new Texas Express Pipeline (TEP) will help Anadarko maximizeCompany has ownership interests of 33% in the valueFRP, 20% in the TEP, and 25% in two NGLs fractionators at Mont Belvieu.
In July 2014, construction of the Company’s production by providing additionalsecond pipeline for the White Cliffs Pipeline system was completed and placed in service. This 526-mile dual pipeline system now provides 150 MBbls/d of oil takeaway capacity from Platteville, Colorado to Cushing, Oklahoma. The Company and enhancing accessits joint-venture partners are currently expanding the existing pipeline system to over 200 MBbls/d. The expansion project is scheduled to be completed in mid-2015.
Greater Natural Buttes Chipeta’s total processing capacity (cryogenic and refrigeration) is approximately one billion cubic feet per day with cryogenic processing capacity exceeding 600 MMcf/d. Chipeta’s third-party pipeline interconnect has added over 100 MMcf/d of natural-gas supply to the Gulf Coast NGL market. Initial capacity on TEP will be approximately 280,000 Bbls/d that can be readily expanded to approximately 400,000 Bbls/d. Subject to regulatory approvals, the pipeline is expected to begin serviceplant. Optimization projects, including several pipeline-freeze mitigation projects in the gathering system, have continued to improve the Company’s reliability and efficiency.
Wyoming During the second quarterhalf of 2013.Western Gas Partners, LP (WES), a consolidated subsidiary of Anadarko, is a publicly traded limited partnership formed by Anadarko2014, the Company connected five third-party well locations to own, operate, acquire, and develop midstream assets. Inthe Patrick Draw plant. Initial deliveries are expected in the first quarter of 2011,2015. The Company also constructed a 10-mile pipeline in the Barricade unit to gather and deliver the incremental third-party gas to the Company’s Patrick Draw plant for processing. Also, gathering connections and expansions in 2014 increased throughput of the Hilight plant by about 40%.
Delaware Basin In 2014, the Company expanded its midstream infrastructure for Bone Spring, Wolfcamp, and Avalon production in the Delaware basin of West Texas, installing a total of 127 miles of oil and gas gathering lines. Also, significant progress was made towards expanding three central production facilities that will add 30 MBbls/d of capacity upon completion in early 2015. Substantial progress was made on a new CGF with a capacity of 24 MMcf/d, which will be completed in early 2015. The Company entered into a joint-venture agreement with a third party to construct a new 200-MMcf/d cryogenic plant located in Loving County, Texas. The new plant will be operated by the third party.
In November 2014, WES acquired Nuevo, which owns and operates gathering and processing assets located in the Delaware basin. Following the acquisition, WES changed the name of Nuevo to Delaware Basin Midstream, LLC (DBM). The assets include a 300-MMcf/d cryogenic gas processing facilityplant. WES is preparing to construct an additional 200-MMcf/d cryogenic unit (Train IV) and relatedprogress payments have been made towards the construction of another cryogenic unit (Train V), with both expected to come online in 2016.
Eagleford In the Eagleford shale, Anadarko continued the expansion of its infield gathering systems insystem with (i) the Wattenberg area from a third party. At December 31, 2011, Anadarko held a 43.3% limited partner interest in WES,installation of two new field gas compression facilities, (ii) the addition of incremental compression at Stumberg and Catarina Ranch compressor stations, and the Maverick main central delivery point compression facilities, as well as three other existing field compression facilities, (iii) the entire 2% general partner interestcompletion of approximately 90 miles of gathering pipelines and incentive distribution rights.lateral that connected more than 20 central production facilities, and (iv) enhancements at the main oil-handling facility that increased its reliability and capabilities. The 200-MMcf/d Brasada natural-gas cryogenic processing plant completed its first full year of operations and remains at or near capacity.
East Texas/North Louisiana In East Texas, the Company continued to expand its midstream infrastructure for Cotton Valley Taylor and Haynesville production in 2014. The high-pressure Haynesville gathering system, and related water and condensate infrastructure, was expanded in the Carthage area to handle the continued growth associated with the liquids-rich Haynesville natural-gas production. Additionally, Anadarko has secured access to 430 MMcf/d of firm-processing capacity for the Company’s current and future development in East Texas.
Marcellus In the Marcellus shale, Anadarko continued to expand its gathering system in Lycoming County, Pennsylvania. In 2014, the Company connected 44 Anadarko-operated wells and constructed 52 miles of new pipeline. The Seely West trunk line, completed in December 2014, connects the COP 356/357 gathering system and Larry’s Creek gathering system to the Seely gathering system and alleviates the need to use third parties to gather natural gas.
Springfield In September 2014, the Company sold the Springfield gathering system located in East Texas to a third party.
San Juan In April 2014, the Company sold the San Juan gathering system located in New Mexico, Colorado, and Utah along with the San Juan River gas processing plant located in New Mexico to a third party.
The following
table provides information regarding the Company’s midstream assets by geographic
regions. | | 0000000 | | | 0000000 | | | | 0000000 | | | | 0000000 | |
Area | | Asset Type | | Miles of
Gathering
Pipelines | | | Total
Horsepower | | | 2011
Average
Throughput
(MMcf/d) | |
Rocky Mountains | | Gathering, Processing, and Treating | | | 9,700 | | | | 1,088,200 | | | | 3,500 | |
Mid-Continent and other | | Gathering | | | 2,500 | | | | 105,100 | | | | 200 | |
Texas | | Gathering and Treating | | | 2,200 | | | | 168,700 | | | | 700 | |
| | | | | | | | | | | | | | |
Total | | | | | 14,400 | | | | 1,362,000 | | | | 4,400 | |
| | | | | | | | | | | | | | |
regions:
|
| | | | | | | | | | | |
| Area | | Asset Type | | Miles of Gathering Pipelines | | Total Horsepower | | 2014 Average Net Throughput (MMcf/d) |
| Rocky Mountains | | Gathering, processing, and treating | | 11,900 |
| | 1,244,100 |
| | 3,800 |
|
| Texas | | Gathering, processing, and treating | | 3,600 |
| | 248,400 |
| | 1,100 |
|
| Mid-Continent and other | | Gathering | | 3,300 |
| | 392,200 |
| | 1,100 |
|
| Total | | | | 18,800 |
| | 1,884,700 |
| | 6,000 |
|
The Company’s marketing segment actively manages Anadarko’s natural-gas,
crude-oil,oil, condensate, and NGLs
sales, as well as the Company’s anticipated LNG sales. In marketing its production, the Company attempts to minimize market-related shut-ins, maximize realized prices, and manage credit-risk exposure. The Company’s sales of natural gas,
crude oil, condensate, and NGLs are generally made at market prices for those products at the time of sale. The Company also purchases natural gas,
crude oil, condensate, and NGLs from third parties, primarily near Anadarko’s production areas, to aggregate volumes
and better positionso that the Company
is positioned to fully
utilizeuse transportation,
storage and
storagefractionation capacity,
attract creditworthy customers, facilitate efforts to maximize prices received, and minimize balancing issues with customers and pipelines during operational disruptions.
The Company sells natural gasits products under a variety of contractscontract structures including indexed, fixed-price, and cost-escalation-based agreements. The Company also engages in limited trading activities for the purpose of generating profits from exposure to changes in market prices of natural gas, crude oil, condensate, and NGLs. The Company does not engage in market-making practices and limits its marketing activities to natural-gas, crude-oil,oil, NGLs, and NGLsLNG commodity contracts. The Company’s marketing riskmarketing-risk position is typically a net short position (reflecting agreements to sell natural gas, crude oil, and NGLs in the future for specific prices) that is offset by the Company’s natural long position as a producer (reflecting ownership of underlying natural-gas and crude-oiloil reserves). SeeEnergy PriceCommodity-Price Riskunder Item 7A of this Form 10-K.
Natural Gas Natural gas continues to fulfill a significant portion of North America’s energy needs and the Company believes the importance of natural gas will continue to increase. Anadarko markets its natural-gas production to maximize its value and to reduce the inherent risks of physical commodity markets. Anadarko’s marketing segment offers supply-assurance and limited risk-management services at competitive prices, as well as other services that are tailored to its customers’ needs. The Company may also receive a service fee related to the level of reliability and service required by the customer.The Company controls natural-gas firm transportationfirm-transportation capacity that ensures access to downstream markets, which enables the Company to maximize its natural-gas production. This transportation capacity also provides the opportunity to capture incremental value when price differentials between physical locations exist. The Company also stores natural gas in contracted storage facilities to minimize operational disruptions to its ongoing operations and to take advantage of seasonal price differentials. Normally, the Company will have forward contracts in place (physical-delivery or financial derivative instruments) to sell stored natural gas at a fixed price.
Crude Oil, Condensate, and NGLs Anadarko’s crude-oil,oil, condensate, and NGLs revenues are derived from production in the United States, Algeria, China, and Ghana. Most of the Company’s U.S. crude-oiloil and NGLs production is sold under contracts with prices based on market indices, adjusted for location, quality, and transportation. OilProduct from Algeria is sold by tanker as Saharan Blend, condensate, refrigerated propane, and refrigerated butane to customers primarily in the Mediterranean area. Saharan Blend is high-quality crude that provides refiners large quantities of premium products such as gasoline, diesel, and jet and diesel fuel. Oil from China is sold by tanker as Cao Fei Dian (CFD) Blend to customers primarily in the Far East markets. CFD Blend is a heavy sour crude oil which is sold into both the prime fuels refining market and the market for the heavy fuel oil blend stock. Oil from Ghana is sold by tanker as Jubilee Crude Oil to customers around the world. Jubilee Crude Oil is high-quality crude that provides refiners large quantities of premium products such as gasoline, diesel, and jet and diesel fuel. ThePrior to the Company also purchases and sells third-party-produced crudedivesting its subsidiary in August 2014, oil condensate, and NGLsfrom China was sold by tanker as Cao Fei Dian Blend to customers primarily in the Company’s domestic and international market areas, and utilizes contracted NGLs storage facilities to capture market opportunities and reduce fractionation and downstream infrastructure disruptions.Far East markets.
The oil and gas business is highly competitive in the exploration for and acquisition of reserves and in the gathering and marketing of oil and gas production. The Company’s competitors include national oil companies, major oil and gas companies, independent oil and gas companies, individual producers, gas marketers, and major pipeline companies, as well as participants in other industries supplying energy and fuel to consumers.
For additional information on operations by segment, seeNote 20—Segment Informationin theNotes to Consolidated Financial Statements under Item 8 of this Form 10-K.For10-K and for additional information on risk associated with international operations, seeRisk Factors under Item 1A of this Form 10-K.
The Company had approximately 4,8006,100 employees at December 31, 2011.2014
.
REGULATORY
MATTERS,AND ENVIRONMENTAL
AND ADDITIONAL FACTORS AFFECTING BUSINESSMATTERS
Environmental and Occupational Health and Safety Regulations
Anadarko’s business operations are subject to numerous international,
provincial, federal,
regional, state,
tribal, and local environmental and occupational health and safety laws and
regulations pertaining to the release, emission, or discharge of materials into the environment; the generation, storage, transportation, handling, and disposal of materials (including solid and hazardous wastes); the workplace health and safety of employees; or otherwise relating to the prevention, mitigation, or remediation of pollution, or the preservation or protection of natural resources, wildlife, or the environment.regulations. The more significant of these existing environmental and occupational health and safety laws and regulations include the following U.S. laws and regulations, as amended from time to time:
the U.S. Clean Air Act, which restricts the emission of air pollutants from many sources and imposes various pre-construction, monitoring, and reporting requirements.requirements
Thethe U.S. Federal Water Pollution Control Act, also known as the federal Clean Water Act (CWA), which regulates discharges of pollutants from facilities to state and federal waters.
watersThethe U.S. Oil Pollution Act of 1990 (OPA), which subjects owners and operators of vessels, onshore facilities, and pipelines, as well as lessees or permittees of areas in which offshore facilities are located, to strict liability for removal costs and damages arising from an oil spill in waters of the United States.
StatesU.S. Department of the Interior (DOI) regulations, which relate to offshore oil and natural-gas operations in U.S. waters and impose liability for the cost of pollution cleanup resulting from operations, as well as potential liability for pollution damages.
damagesThethe Comprehensive Environmental Response, Compensation and Liability Act of 1980, a remedial statute thatwhich imposes strict liability on generators, transporters, and arrangers of hazardous substances at sites where hazardous substance releases have occurred or are threatening to occur.
occurThethe U.S. Resource Conservation and Recovery Act, which governs the generation, treatment, storage, transport, and disposal of solid wastes, including hazardous wastes.
wastesThethe U.S. Federal Safe Drinking Water Act, which ensures the quality of the nation’s public drinking water through adoption of drinking water standards and controlling the injection of waste fluids into below-ground formations that may adversely affect drinking water sources.
sourcesThethe U.S. Emergency Planning and Community Right-to-Know Act, which requires facilities to implement a safety hazard communication program and disseminate information on chemical inventories to employees, as well as local emergency planning committees, and response departments.
departments on toxic chemical uses and inventoriesThethe U.S. Occupational Safety and Health Act, which establishes workplace standards for the protection of the health and safety of employees, including the implementation of hazard communications programs designed to inform employees about hazardous substances in the workplace, potential harmful effects of these substances, and appropriate control measures.
measuresThe National Environmental Policy Act, which requires federal agencies, including the DOI, to evaluate major agency actions having the potential to significantly impact the environment and which may require the preparation of Environmental Assessments and more detailed Environmental Impact Statements that may be made available for public review and comment.
The Endangered Species Act, which restricts activities that may affect federally identified endangered and threatened species or their habitats through the implementation of operating restrictions or a temporary, seasonal, or permanent ban in affected areas.
areas
The Marine Mammal Protection Act, which ensures the protection of marine mammals through the prohibition, with certain exceptions, of the taking of marine mammals in U.S. waters and by U.S. citizens on the high seas and which may require the implementation of operating restrictions or a temporary, seasonal, or permanent ban in affected areas.
The Migratory Bird Treaty Act, which implements various treaties and conventions between the United States and certain other nations for the protection of migratory birds and, pursuant to which the taking, killing or possessing of migratory birds is unlawful without a permit, thereby potentially requiring the implementation of operating restrictions or a temporary, seasonal, or permanent ban in affected areas.
These laws and their implementing regulations, as well as state counterparts, generally restrict the level of pollutants emitted to ambient air, discharges to surface water, and disposals or other releases to surface and below-ground soils and ground water. Failure to comply with these laws and regulations may result in the assessment of sanctions, including administrative, civil, and criminal penalties; the imposition of investigatory, remedial, and corrective action obligations or the incurrence of capital expenditures; the occurrence of delays in the development of projects; and the issuance of injunctions restricting or prohibiting some or all of the Company’s activities in a particular area. Compliance with theseSee Risk Factors under Item 1A of this Form 10-K for further discussion on hydraulic fracturing, ozone standards, climate change, including methane or other greenhouse gas emissions, and other regulations relating to environmental protection. The ultimate financial impact arising from environmental laws and regulations also, in most cases, requiresis neither clearly known nor determinable as new or amended permits that may contain new or more stringent technological standards, or limits on emissions, discharges, disposals, or other releases in association with new or modified operations. Application for these permits can require an applicantsuch as air emission standards and water quality standards, continue to collect substantial information in connection with the application process, which can be expensive and time-consuming. In addition, there can be delays associated with public notice and comment periods required priorevolve.
Many states and foreign countries where the Company operates also have, or are developing, similar environmental laws, regulations, or analogous controls governing many of these same types of activities. While the legal requirements may be similar in form, in some cases the actual implementation of these requirements may impose additional, or more stringent, conditions or controls that can significantly alter or delay the development of a project or substantially increase the cost of doing business.
Anadarko is also subject to certain laws and regulations relating to environmental remediation obligations associated with current and past operations.
Federal and state occupational safety and health laws require the Company to organize information about materials, some of which may be hazardous or toxic, that are used, released or produced in Anadarko’s operations. Certain portions of this information must be provided to employees, state and local governmental authorities and responders, and local citizens. The Company is also subject to the safety hazard communication requirements and reporting obligations set forth in federal workplace standards.
There have been several regulatory and governmental initiatives to restrict the hydraulic-fracturing process, which could have an adverse impact on our completion or production activities. The U.S. Environmental Protection Agency (EPA) has asserted federal regulatory authority pursuant to the Safe Drinking Water Act over certain hydraulic-fracturing practices notwithstanding the existence of current oil and gas regulations adopted at the state level. Moreover, the EPA has commenced a study of the potential environmental effects of hydraulic fracturing on drinking water and groundwater, with final results expected to be available by 2014. The EPA has also announced plans to propose effluent limitations for the treatment and discharge of wastewater resulting from hydraulic-fracturing activities by 2014. Certain other governmental reviews are either underway or being proposed that focus on environmental aspects of hydraulic-fracturing practices, including evaluations by the U.S. Department of Energy and the DOI, and coordination of an administration-wide review of these practices by the White House Council on Environmental Quality. Congress is currently considering, and has from time to time in the past considered, bills that would regulate hydraulic fracturing and/or require public disclosure of chemicals used in the hydraulic-fracturing process. A number of states, including states in which we operate, have adopted or are considering legal requirements that could impose more stringent permitting, public disclosure, and well-construction requirements on hydraulic-fracturing activities.
The ultimate financial impact arising from environmental laws and regulations is neither clearly known nor determinable as new standards, such as air emission standards and water quality standards, continue to evolve. However, In addition, environmental laws and regulations, including those that may arise to address concerns about global climate changepotential air and the threat of adversewater impacts, to groundwater arising from hydraulic-fracturing activities, are expected to continue to have an increasing impact on the Company’s operations in the United States and in other countries in which Anadarko operates. Notable areas of potential impacts include air emission monitoring, compliance, mitigation, and remediation obligations in the United States.
The Company has reviewed its potential responsibilities under both OPA and CWA as they relate to the Deepwater Horizon events.
OPA imposes joint and several liability on the responsible parties for all cleanup and response costs, natural resource damages, and other damages such as lost revenues, damages to real or personal property, damages to subsistence users of natural resources, and lost profits and earning capacity. While OPA requires that a responsible party pay for all cleanup and response costs, it currently limits liability for damages to $75 million, exclusive of response and remediation expenses (for which there is no cap), except in cases of gross negligence, willful misconduct, or the violation of an applicable federal safety, construction, or operating regulation. The federal government may take legislative or other action to increase or eliminate, perhaps even retroactively, the liability cap. As for damages to natural resources, the government may recover damages for injury to, loss of, destruction of, or loss of use of natural resources which may include the costs to repair, replace, or restore those or like resources. The CWA governs discharges into waters of the United States and provides for penalties in the event of unauthorized discharges into those waters. Under the CWA, these include, among other penalties, civil penalties that may be assessed in an amount up to $1,100 per barrel of oil discharged. In cases of gross negligence or willful misconduct, such civil penalties that may be sought by the EPA are increased to not more than $4,300 per barrel of oil discharged.As of the date of filing this Form 10-K with the SEC, no penalties or fines have been assessed by the federal government against the Company under OPA, CWA, and other similar local, state and federal environmental legislation related to the Deepwater Horizon events. However, in December 2010, the U.S. Department of Justice, (DOJ), on behalf of the federal agencies involved in the spill response,United States, filed a civil lawsuit in the U.S. District Court for the Eastern District ofin New Orleans, Louisiana, against several parties, including the Company, seeking (i) an assessment of civil penalties under the CWA in an amount to be determined by the court, and (ii) a declaratory judgment that such parties are jointly and severally liable without limitation under OPA for all removal costs and damages resulting from the Deepwater Horizon events. In October 2011, the Company and BP entered into a settlement agreement, mutual releases, and agreement to indemnify, relating to the Deepwater Horizon events (Settlement Agreement), pursuant to which BP has fully indemnified Anadarko against all claims, causes of action, losses, costs, expenses, liabilities, damages, or judgments of any kind arising out of the Deepwater Horizon events and related damage claims arising under OPA. Under the Settlement Agreement, BP does not indemnify the Company against penalties or fines that may be assessed against the Company as a result of the Deepwater Horizon events, including for example, under the CWA. For additional information, seeNote 2—17—Contingencies—Deepwater Horizon Events in theNotes to Consolidated Financial Statements under Item 8 of this Form 10-K. The Company has made and will continue to make operating and capital expenditures, some of which may be material, to comply with environmental and occupational health and safety laws and regulations. These are necessary business costs in the Company’s operations and in the oil and natural-gas industry. Although the Company is not fully insured against all environmental and occupational health and safety risks, and the Company’s insurance does not cover any penalties or fines that may be issued by a governmental authority, it maintains insurance coverage that it believes is sufficient based on the Company’s assessment of insurable risks and consistent with insurance coverage held by other similarly situated industry participants. Nevertheless, it is possible that other developments, such as stricter and more comprehensive environmental and occupational health and safety laws and regulations, as well as claims for damages to property or persons resulting from the Company’s operations, could result in substantial costs and liabilities, including administrative, civil, and criminal penalties, to Anadarko. The Company believes that it is in material compliance with existing environmental and occupational health and safety regulations. Further, the Company believes that the cost of maintaining compliance with these existing laws and regulations will not have a material adverse effect on its business, financial
position,condition, results of operations, or cash flows, but new or more
stringently applied or enforced existing laws and regulations could increase the cost of doing business, and such increases could be material.
Domestically, the Company is
requiredsubject to
complycompliance with
BSEEthe federal Bureau of Safety and Environmental Enforcement (BSEE) regulations, which,
among other standards, require every owner or operator of a U.S. offshore lease to prepare and submit for approval an oil spill-response plan prior to conducting any offshore operations. The submitted plan is required to provide a detailed description of actions to be taken in the event of a spill, identify contracted spill-response equipment, materials and trained personnel, and stipulate the time necessary to deploy identified resources in the event of a spill. The
Company has filed the information that describes the Company’s ability to deploy surface and subsea containment resources to adequately and promptly respond to a blowout or other loss of well control. The BSEE regulations may be amended, resulting in changes to the amount and type of spill-response resources to which an owner or operator must maintain ready access. Accordingly, resources available to the Company may change
in order to satisfy any new regulatory requirements, or to adapt to changes in the Company’s operations.
Anadarko has in place and maintains both Regional (Central and Western Gulf of Mexico) and Sub-Regional (Eastern Gulf of Mexico) Oil Spill-Response Plans (Plans) for the Company’s Gulf of Mexico operations.
These plansThe Plans detail procedures for a rapid and effective response to spill events that may occur as a result of Anadarko’s operations. The Plans are reviewed at least annually and updated as necessary. Drills are conducted at least annually to test the effectiveness of the Plans and include the participation of spill-response contractors, representatives of Clean Gulf Associates (CGA, a not-for-profit association of production and pipeline companies operating in the Gulf of
Mexico)Mexico contractually engaged by the Company for such matters), and representatives of relevant governmental agencies. The Plans must be approved by the BSEE.
As part of the Company’s oil spill-response preparedness, and as set forth in the Plans, Anadarko maintains membership in CGA, and has an employee representative on the executive committee of CGA. CGA was created to provide a means of effectively staging response equipment and to provide effective spill-response capability for its member companies operating in the Gulf of Mexico.
CGA equipment includes one High Volume Open Sea Skimmer System (HOSS) barge, four 46-footand capabilities include skimming vessels, one 56-foot skimming vessel, three Marco skimmers, and two Egmopol skimmers. In addition, CGA equipment also consists of:
Nine Fast Response Units;
Three Foilex skim packages;
Two 4-drum skimmers (Magnum 100);
Two 2-drum skimmers (TDS 118);
Eleven sets of Koseq skimming arms;
Two Aqua Guard Triton RBS;
Four oil storage barges, (249 barrels);
Ten tanks (100 barrels, primary); and
Nine tanks (100 barrels, secondary).
Auto boom, beach boom and fire boom are currently available through CGA. CGA also has a stockpile of Corexit 9500 dispersant spray system through Airborne Support Inc. (ASI), a wildlife rehabilitation trailer, and bird scare guns. CGA currently has one X-band radar installed on the HOSS Barge.dispersants, among others. CGA has ordered three 95–foot fast response vessels and is scheduledexecuted a support contract with T&T Marine to receive delivery on or about the end of the second quarter of 2012.
The CGA coordinatescoordinate bareboat charters withand provides for expanded response support. T&T Marine Spill Response Corporation (MSRC). MSRC is responsible for inspecting, maintaining, storing, and calling out CGA equipment. MSRCT&T Marine has positioned CGA’s equipment and materials in a ready state at various staging areas around the Gulf of Mexico.
MSRC T&T Marine also handles the maintenance and mobilization of CGA non-marine equipment. MSRCT&T Marine has service contracts in place with domestic environmental contractors as well as with other companies that provide support services during the execution of spill-response activities. In the event of a spill, MSRC will activate these contracts as necessary to provide additional resources or support services requested by CGA. In addition, CGA maintains a service contract with ASI, which provides aircraft and dispersant capabilities for CGA member companies.
As of December 2, 2011,
Anadarko
becameis also a member of the Marine Preservation Association, which provides full access to the
MSRCMarine Spill Response Corporation (MSRC) cooperative including the Deep Blue enhanced Gulf of Mexico Response capability. In the event of a spill, MSRC stands ready to mobilize all of its equipment and
materials, including those from CGA.materials. MSRC has a fleet of
15 dedicated Responder Class Oil Spill-Response Vessels (OSRVs), designed and built specifically to recover spilled oil.
Each OSRV is approximately 210 feet long, has temporary storage for recovered oil, and has the ability to separate oil and water aboard the vessels using two oil-water separation systems. To enable the OSRV to sustain cleanup operations, recovered oil is transferred into other vessels or barges.MSRC has equipment housed for the Atlantic Region, the Gulf of Mexico Region, the California Region, and the Pacific Northwest Region. Their equipment includes skimmers, OSRVs, fast response vessels, barges, storage bladders, work boats, ocean boom, and dispersant.
The Company has also entered into a contractual commitment to access subsea intervention, containment, capture, and shut-in capacity for deepwater exploration wells. Marine Well Containment Company (MWCC) is open to all oil and gas operators in the Gulf of Mexico Regionand provides members access to oil spill-response equipment and services on a per-well fee basis. Anadarko has an employee representative on the executive committee of MWCC and this employee currently serves as its Chair. MWCC members have access to a totalcontainment system that is planned for use in deepwater depths of 61 skimmersup to 10,000 feet with an Effective Daily Recovery Capacitycontainment capacity of 449,108 barrels. The following equipment was available100 MBbls/d of liquids and flare capability for 200 MMcf/d of natural gas.
Anadarko retains geospatial and satellite imagery services through the
various regions at December 31, 2011:Fifteen Responder Class OSRVs;
Twenty-nine smaller OSRVs;
Five Fast Response Vessels;
Nineteen offshore barges;
Fifty-one shallow water barges (non self-propelled);
Fifty-one shallow water push boats;
Seventeen shallow water barges (self-propelled);
Seventy-one towable storage bladders;
Three towable storage barges (non self-propelled);
Twenty-three fastanks (900 barrels);
Six mini towable storage bladders;
Seven small skimming vessels;
One small Oil Spill-Response Barge;
Fifteen storage tanks/bladders;
275,734 feetMDA Corporation (MDA) to provide coverage over the Company’s Gulf of ocean boom;
103,159 gallonsMexico operations. MDA owns and maintains two radar satellites, which provide all-weather surveillance and imagery available to assist in identifying areas of Corexit 9500 dispersant;concern on the surface waters of the Gulf of Mexico. The Company has agreements with Waste Management, Inc. and
1,500 gallons Clean Harbors to assist in the proper disposal of Corexit 9527 dispersant.
Asproperly monitor the effectiveness of December 31, 2011, Anadarko will no longer maintainthe dispersant application and the health of the ecosystem. The Company also has agreements with Scientific and Environmental Associates, Inc. (SEA) for assistance with surface-dispersant applications. SEA is a retainer-based service contract with National Response Corporation. These services have been superseded by the MSRC contractscientific support consulting firm providing subject matter experts, and are available as a commercial service should the extraordinary case arise.
is renowned for its expertise in surface-dispersion applications and efficacy monitoring.
Anadarko has emergency and oil spill-response plans in place for each of its exploration and operational activities around the globe. Each plan satisfies the requirements of
the relevant local or national authority, describes the actions the Company will take in the event of an incident, is subject to drills at least annually, and includes reference to external resources that may become necessary in the event of an incident. Included in these external resources is the Company’s contract with Oil Spill Response Limited
(OSR)(OSRL), a global emergency and oil spill-response organization headquartered in London.
OSR maintains specialized equipment in a ready state for deployment in the event such equipment is needed by one of its members. OSR is mainly available for response internationally, but its equipment is registered with the U.S. Coast Guard for domestic use if needed.OSR
OSRL has
two Herculesan aircraft
located in the United Kingdom and Singapore, available for dispersant application or equipment transport.
The aircraft have a three-hour callback time. The Hercules can transport two to three pre-packaged equipment loads, or one Aerial Dispersant Delivery System (ADDS) Pack. OSR has 3 ADDS Packs; one in the United Kingdom, one in Bahrain, and one in Singapore. If additional aircraft are needed, OSR retains an aircraft broker so that an aircraft can be chartered. For international operations, the majority of equipment will be air freighted. Fast response trailers are available, if within the United Kingdom.OSROSRL also has a number of active recovery boom systems, and a range of booms that can be used for offshore, nearshore, or shoreline responses. Offshore boom is stored in the United Kingdom, Bahrain, and Singapore. Fireboom systems have been delivered and a team is trained to operate the system. A variety of nearshore boom exists for spill containment.
Additionally OSR can provideIn addition, OSRL provides a range of communications equipment, safety equipment, transfer pumps, dispersant application systems, temporary storage equipment, power packs and generators, small inflatable vessels, rigid inflatable boats, work boats, and Fast Response Vessels. Oleophilic, weir, and mechanical skimmers provide the ability to recover a range of oil types. OSROSRL also has a wide range of oiled wildlife equipment in conjunction with the Sea Alarm Foundation.
The Company has also entered into contractual commitments to access subsea intervention, containment, capture, and shut-in capacity (Containment) for deepwater exploration wells. CGA has contracted with Helix Energy Solutions Group (Helix), on behalf of its membership, for the provision of these Containment assets, which will initially provide processing capacity of 45,000 Bbls/d of oil, 60,000 Bbls/d of liquids, and flaring of 80 MMcf/d of natural gas from the vessel HP-1, and burning 10,000 Bbls/d of oil from the vessel Q4000. The system, known as the Helix Fast Response System, currently operates at up to 8,000 feet of sea water depth, and is rated at a 10,000 psi shut-in capability. Member operators are considering various capacity expansion options.
In addition, during 2011, the Company became an investing member in the Marine Well Containment Company (MWCC), which is open to all oil and gas operators in the U.S. Gulf of Mexico and provides members access to oil spill-response equipment and services on a per-well fee basis. Anadarko has an employee representative on the Executive Committee of MWCC and this employee currently serves as its Chair. MWCC members have access to an interim containment system that includes a 15-kpsi capping stack and dispersant capability. The interim containment system is engineered to operate in deepwater depths of up to 10,000 feet, and has the capacity to contain 60 MBbls/d of liquids and flare 120 MMcf/d of natural gas. The DOI has reviewed the functional specifications of the MWCC interim containment system, and DOI input was included in the final specifications.
MWCC members also expect to have access to an expanded containment system that is planned for use in deepwater depths of up to 10,000 feet with containment capacity of 100 MBbls/d of liquids and flare capability for 200 MMcf/d of natural gas. The expanded system is planned to include a 15-kpsi subsea containment assembly with three rams stack, dedicated capture vessels, and a dispersant injection system. The expanded containment system may also be further expanded with additional capture vessels, modified tankers, drill ships, and extended well-test vessels, all of which may process, store, and offload oil to shuttle tankers, which may then take the oil to shore for further processing. This expanded containment system is on schedule for delivery in 2012.
In addition to Anadarko’s membership in or access to CGA, MSRC,
OSR, Helix,OSRL, and MWCC, the Company
is also participatingparticipates in industry-wide task forces, which are currently studying improvements in both gaining access to and controlling blowouts in subsea environments. Two such task forces are the Subsea Well Control and Containment Task Force, and the Oil Spill Task Force.
As is customary in the oil and gas industry,
only a preliminary title review is conducted at the time properties believed to be suitable for drilling operations are acquired by the Company. Prior to the commencement of drilling operations,
a thorough title
examinationexaminations of the drill site tract
isare conducted
by third-party attorneys and curative work is performed with respect to significant defects, if any, before proceeding with operations. Anadarko believes the title to its leasehold properties is good, defensible, and customary with practices in the oil and gas industry, subject to such exceptions that, in the opinion of legal counsel for the Company, do not materially detract from the use of such properties.
Leasehold properties owned by the Company are subject to royalty, overriding royalty, and other outstanding interests customary in the industry. The properties may be subject to burdens such as liens incident to operating agreements, current taxes, development obligations under oil and gas leases and other encumbrances, easements, and restrictions. Anadarko does not believe any of these burdens will materially interfere with its use of these properties.
EXECUTIVE OFFICERS OF THE REGISTRANT
|
| | | | |
Name | | Age as of
February 21,
2012at January 31, 2015
| | Position |
James T. Hackett
R. A. Walker | | 5857 | | Chairman, of the BoardPresident and Chief Executive Officer |
R. A. Walker
Robert P. Daniels | | 5556 | | Executive Vice President, International and Chief Operating OfficerDeepwater Exploration |
Robert P. Daniels G. Gwin | | 5351 | | Senior Vice President, Worldwide Exploration |
Robert G. Gwin
| | 48 | | SeniorExecutive Vice President, Finance and Chief Financial Officer |
James J. Kleckner | | 57 | | Executive Vice President, International and Deepwater Operations |
| Charles A. Meloy | | 51 | | Senior Vice President, Worldwide Operations |
Robert K. Reeves
| | 54 | | SeniorExecutive Vice President, U.S. Onshore Exploration and Production |
| Robert K. Reeves | | 57 | | Executive Vice President, General Counsel and Chief Administrative Officer |
M. Cathy Douglas | | 5558 | | Senior Vice President, and Chief Accounting Officer and Controller |
On February 21, 2012, Anadarko announced the transition of
Mr.
Hackett from Chairman and Chief Executive Officer to Executive Chairman effective May 15, 2012. Mr. HackettWalker was named
Chief Executive Officer in December 2003 and assumed the additional role of Chairman of the Board
of the Company in
January 2006. He also served as President from December 2003May 2013, in addition to
February 2010. Prior to joining Anadarko, Mr. Hackett served as President and Chief Operating Officerthe role of
Devon Energy Corporation following its merger with Ocean Energy, Inc. in April 2003. He served as President and Chief Executive Officer
and director, both of
Ocean Energy, Inc. from March 1999 to April 2003which he assumed in May 2012, and
as Chairman of the
Board from January 2000 to April 2003. He currently serves as a director of Fluor Corporation, Bunge Limited, and The Welch Foundation.On February 21, 2012, Anadarko announced the appointment of Mr. Walker as Chief Executive Officer of Anadarko effective May 15, 2012. He will continue as President. Mr. Walker was named Chief Operating Officer in March 2009 and assumed the additional role of President, which he assumed in February 2010. He previously served as Chief Operating Officer from March 2009 until his appointment as Chief Executive Officer. He served as Senior Vice President, Finance and Chief Financial Officer from September 2005 until his appointmentMarch 2009. From August 2007 until March 2013, he served as Chief Operating Officer. Priordirector of Western Gas Holdings, LLC (WGH), the general partner of WES, and served as its Chairman of the Board from August 2007 to joining Anadarko,September 2009. Mr. Walker served as Managing Director fora director of Western Gas Equity Holdings, LLC (WGEH), the Global Energy Groupgeneral partner of UBS Investment BankWGP, from 2003 to 2005.September 2012 until March 2013. Mr. Walker served as a director of Temple-Inland Inc. from November 2008 to February 2012 and has served as a director of CenterPoint Energy, Inc. since April 2010. Since August 2007, he has also served2010 and as a director of Western Gas Holdings, LLC, the general partner of WES, and served as the general partner’s Chairman of the Board from August 2007 to September 2009.
Corporation since April 2013.
Mr. Daniels was named
Executive Vice President, International and Deepwater Exploration in May 2013 and previously served as Senior Vice President, International and Deepwater Exploration since July 2012. Prior to these positions, he served as Senior Vice President, Worldwide Exploration
insince December
2006. Prior to this position, he2006 and served as Senior Vice President, Exploration and Production since May
2004 and prior2004. Prior to that position, he served as Vice President, Canada since July 2001. Mr. Daniels also served in various managerial roles in the Exploration Department for Anadarko Algeria Company, LLC. He has worked for the Company since 1985.
Mr. Gwin was named
Executive Vice President, Finance and Chief Financial Officer in May 2013 and previously served as Senior Vice President, Finance and Chief Financial Officer
insince March 2009 and
previously had served as Senior Vice President since March 2008. He also
serveshas served as Chairman of the Board of
Western Gas Holdings, LLC, the general partner of WES,WGH since October 2009 and as a director since August 2007.
Additionally, Mr. Gwin
alsohas served as Chairman of the Board of WGEH since September 2012, and served as President of
Western Gas Holdings, LLCWGH from August 2007 to September 2009 and as Chief Executive Officer of
Western Gas Holdings, LLCWGH from August 2007 to January 2010. He joined Anadarko in January 2006 as Vice President, Finance and Treasurer and served in that capacity until March 2008.
Prior to joining Anadarko, he served as President and CEO of Prosoft Learning Corporation from November 2002 to November 2004 and as Chairman from November 2002 to February 2006. Previously, Mr. Gwin spent 10 years at Prudential Capital Group in merchant banking roles of increasing responsibility, including serving as Managing Director with responsibility for the firm’s energy investments worldwide. He has served as
a directorChairman of
LyondellBassellthe Board of LyondellBasell Industries N.V. since
August 2013 and as a director since May
2010.2011.
Mr. Kleckner was named Executive Vice President, International and Deepwater Operations in May 2013. Prior to this position, he served as Vice President, Operations for the Rockies region since May 2007. Mr. Kleckner joined Anadarko upon the acquisition of Kerr-McGee Corporation in August 2006. He has held positions of increasing responsibility with Anadarko and Kerr-McGee Corporation, including management roles in the North Sea, South America, China, the Gulf of Mexico and U.S. onshore. Prior to joining Kerr-McGee Corporation, Mr. Kleckner was in the oil and natural-gas industry with Oryx Energy Company and its predecessor, Sun Oil Company.
Mr. Meloy was named
Executive Vice President, U.S. Onshore Exploration and Production in May 2013 and previously served as Senior Vice President, U.S. Onshore Exploration and Production since July 2012. Prior to this position, he served as Senior Vice President, Worldwide Operations
insince December 2006 and served as Senior Vice President, Gulf of Mexico and International Operations since the acquisition of Kerr-McGee
Corporation in August 2006. Prior to joining Anadarko, he served Kerr-McGee
Corporation as Vice President of Exploration and Production from 2005 to 2006, Vice President of Gulf of Mexico Exploration, Production and Development from 2004 to 2005, Vice President and Managing Director of Kerr-McGee North Sea (U.K.) Limited from 2002 to 2004 and Vice President of Gulf of Mexico
Deep WaterDeepwater from 2000 to 2002.
Prior to joining Kerr-McGee Corporation, Mr. Meloy was in the oil and natural-gas industry with Oryx Energy Company and its predecessor, Sun Oil Company. Mr. Meloy has served as a director of
Western Gas Holdings, LLCWGH since February
2009.2009 and as a director of WGEH since September 2012.
Mr. Reeves was named
Executive Vice President, General Counsel and Chief Administrative Officer in May 2013 and previously served as Senior Vice President, General Counsel and Chief Administrative Officer
insince February
2007 and2007. He also served as Chief Compliance Officer from July 2012 to May 2013. He served as Corporate Secretary from February 2007 to August 2008. He previously served as Senior Vice President, Corporate Affairs & Law and Chief Governance Officer since 2004. Prior to joining Anadarko, he served as Executive Vice President, Administration and General Counsel of North Sea New Ventures from 2003 to 2004, and as Executive Vice President, General Counsel and Secretary of Ocean Energy, Inc. and its predecessor companies from 1997 to 2003. He has served as a director of Key Energy Services, Inc., a publicly traded oilfield services company, since October 2007,
as a director of WGH since August 2007 and as a director of
Western Gas Holdings, LLCWGEH since
August 2007.September 2012.
Ms. Douglas was named
Senior Vice President, Chief Accounting Officer and Controller in May 2013. Prior to this position, she served as Vice President and Chief Accounting Officer
insince November 2008 and served as Corporate Controller from September 2007 to March
2009.2009 and from March 2013 to May 2013. She served as Assistant Controller from July 2006 to September 2007. She also served as Director, Accounting, Policy and Coordination from October 2006 to September 2007 and Financial Reporting and Policy Manager from January 2003 to October 2006. Ms. Douglas joined Anadarko in 1979.
Officers of Anadarko are elected
each year at
an organizationalthe first meeting of the Board of Directors following the annual meeting of stockholders,
the next of which is expected to occur on May
15, 2012,12, 2015, and hold office until their successors are duly elected and
shall have qualified. There are no family relationships between any directors or executive officers of Anadarko.
CAUTIONARY STATEMENT ABOUT FORWARD-LOOKING STATEMENTS
Unless the context otherwise requires, the terms “Anadarko” and “Company” refer to Anadarko Petroleum Corporation and its consolidated subsidiaries. The Company has made in this report, and may from time to time
otherwise make in other public filings, press releases, and management discussions, forward-looking statements within the meaning of Section 27A of the Securities Act of 1933,
as amended, and Section 21E of the Securities Exchange Act of 1934,
as amended, concerning the Company’s operations, economic performance, and financial condition. These forward-looking statements include,
among other things, information concerning future production and reserves, schedules, plans, timing of development, contributions from oil and gas properties, marketing and midstream activities, and also include those statements preceded by, followed by, or that otherwise include the words “may,” “could,” “believes,” “expects,” “anticipates,” “intends,” “estimates,” “projects,” “target,” “goal,” “plans,” “objective,” “should,
” “would,” “will,” “potential,” “continue,” “forecast,” “future,” “likely,” “outlook,” or similar expressions or variations on such expressions. For such statements, the Company claims the protection of the safe harbor for forward-looking statements contained in the Private Securities Litigation Reform Act of 1995. Although the Company believes that the expectations reflected in such forward-looking statements are reasonable, it can give no assurance that such expectations will
prove to be
correct.realized. Anadarko undertakes no obligation to publicly update or revise any forward-looking statements whether as a result of new information, future events, or otherwise.
These forward-looking statements involve risk and uncertainties. Important factors that could cause actual results to differ materially from the Company’s expectations include, but are not limited to, the following risks and uncertainties:
| • | | the Company’s assumptions about the energy market;
|
| • | | the availability of capital resources, capital expenditures, and other contractual obligations;
|
| • | | the supply and demand for, the price of, and the commercializing and transporting of natural gas, crude oil, natural gas liquids (NGLs), and other products or services;
|
| • | | volatility in the commodity-futures market;
|
| • | | the availability of goods and services;
|
| • | | future processing volumes and pipeline throughput;
|
| • | | general economic conditions, either internationally or nationally or in the jurisdictions in which the Company or its subsidiaries are doing business;
|
| • | | legislative or regulatory changes, including retroactive royalty or production tax regimes; hydraulic-fracturing regulation; deepwater drilling and permitting regulations; derivatives reform; changes in state, federal, and foreign income taxes; environmental regulation; environmental risks; and liability under federal, state, foreign, and local environmental laws and regulations;
|
| • | | the ability of BP Exploration & Production Inc. (BP) to meet its indemnification obligations to the Company for, among other things, damage claims arising under the Oil Pollution Act of 1990 (OPA), claims for natural resource damages (NRD) and associated damage-assessment costs, and any claims arising under the Operating Agreement (OA) for the Macondo well, as well as the ability of BP
|
the Company’s assumptions about energy markets
production and sales volume levels
reserves levels
operating results
competitive conditions
technology
availability of capital resources, levels of capital expenditures, and other contractual obligations
supply and demand for, the price of, and the commercialization and transporting of natural gas, oil, natural gas liquids (NGLs), and other products or services
volatility in the commodity-futures market
weather
inflation
availability of goods and services, including unexpected changes in costs
drilling risks
processing volumes and pipeline throughput
general economic conditions, either nationally, internationally, or in the jurisdictions in which the Company or its subsidiaries are doing business
the Company’s inability to timely obtain or maintain permits or other governmental approvals, including those necessary for drilling and/or development projects
legislative or regulatory changes, including changes relating to hydraulic fracturing; retroactive royalty or production tax regimes; deepwater drilling and permitting regulations; derivatives reform; changes in state, federal, and foreign income taxes; environmental regulation; environmental risks; and liability under federal, state, foreign, and local environmental laws and regulations
Index to Financial Statements | Corporation North America Inc. (BPCNA) and BP p.l.c. to satisfy their guarantees of such indemnification obligations;
|
| • | | the impact of remaining claims related to the Deepwater Horizon events, including, but not limited to, fines, penalties, and punitive damages for which the Company is not indemnified by BP;
|
| • | | the legislative and regulatory changes that may impact the Company’s Gulf of Mexico and international offshore operations;
|
| • | | the impact of future regulations on the Company’s ability to fully resume drilling operations in the Gulf of Mexico;
|
| • | | current and potential legal proceedings, environmental or other obligations related to or arising from Tronox Incorporated (Tronox);
|
| • | | civil or political unrest in a region or country;
|
| • | | the creditworthiness and performance of the Company’s counterparties, including financial institutions, operating partners, and other parties;
|
| • | | volatility in the securities, capital, or credit markets;
|
| • | | the Company’s ability to successfully monetize select assets, repay its debt, and the impact of changes in the Company’s credit ratings;
|
| • | | disruptions in international crude oil cargo shipping activities;
|
| • | | electronic, cyber, and physical security breaches;
|
| • | | the supply and demand, technological, political, and commercial conditions associated with long-term development and production projects in domestic and international locations;
|
| • | | the outcome of proceedings related to the Algerian exceptional profits tax; and
|
| • | | other factors discussed below and elsewhere in this Form 10-K, and in the Company’s other public filings, press releases, and discussions with Company management.
|
the ability of BP Exploration & Production Inc. (BP) to meet its indemnification obligations to the Company for Deepwater Horizon events, including, among other things, damage claims arising under the Oil Pollution Act of 1990 (OPA), claims for natural resource damages (NRD) and associated damage-assessment costs, and any claims arising under the Operating Agreement (OA) for the Macondo well, as well as the ability of BP Corporation North America Inc. (BPCNA) and BP p.l.c. to satisfy their guarantees of such indemnification obligations
the impact of remaining claims related to the Deepwater Horizon events, including, but not limited to, fines, penalties, and punitive damages against the Company, for which it is not indemnified by BP
civil or political unrest or acts of terrorism in a region or country
the creditworthiness and performance of the Company’s counterparties, including financial institutions, operating partners, and other parties
volatility in the securities, capital, or credit markets and related risks such as general credit, liquidity, and interest-rate risk
the Company’s ability to successfully monetize select assets, repay its debt, and the impact of changes in the Company’s credit ratings
disruptions in international oil, NGLs, and condensate cargo shipping activities
physical, digital, internal, and external security breaches
supply and demand, technological, political, governmental, and commercial conditions associated with long-term development and production projects in domestic and international locations
other factors discussed below and elsewhere in this Form 10-K, and in the Company’s other public filings, press releases, and discussions with Company management
RISK FACTORS
We may be subject to claims and liabilities relating to the Deepwater Horizon events that are not covered by BP’s indemnification obligations under our Settlement Agreement with BP, or that result in losses to the Company, notwithstanding BP’s indemnification against such losses, as a result of BP’s inability to satisfy its indemnification obligations under the Settlement Agreement and BPCNA’s and BP
p.l.c’sp.l.c.’s inability to satisfy their guarantees of BP’s indemnification obligations.
In October 2011, the Company and BP entered into a settlement agreement, mutual releases, and agreement to indemnify relating to the Deepwater Horizon events (Settlement Agreement). Pursuant to the Settlement Agreement, the Company
paid $4.0 billion and transferred its interest in the Macondo well and the Lease to BP, and BP accepted this consideration in full satisfaction of its claims against Anadarko for $6.1 billion of invoices issued through the settlement date as well as for potential reimbursements of subsequent costs incurredis fully indemnified by BP
related to the Deepwater Horizon events, including costs under the OA.Under the Settlement Agreement, BP fully indemnified Anadarko against all claims, causes of action, losses, costs, expenses, liabilities, damages, or judgments of any kind arising out of the Deepwater Horizon events, related damage claims arising under OPA, NRD claims and associated damage-assessmentassessment costs, and any claims arising under the OA. This indemnification is guaranteed by BPCNA and, in the event that the net worth of BPCNA declines below an agreed-uponagreed-on amount, BP p.l.c. has agreed to become the sole guarantor.
Any failure or inability on the part of BP to satisfy its indemnification obligations under the Settlement Agreement, or on the part of BPCNA or BP p.l.c. to satisfy their respective guarantee obligations, could subject us to significant monetary liability beyond the terms of the Settlement Agreement, which could have a material adverse effect on our business, prospects, results of operations, financial condition, and liquidity. In November 2012, BP settled all criminal and securities claims brought by the United States against BP, with BP agreeing to pay $4.0 billion over five years to the U.S. Department of Justice with respect to the criminal claims and further agreeing to pay another $525 million over three years to the Securities and Exchange Commission (SEC) with respect to the securities claims. In addition, in September 2014, the U.S. District Court in New Orleans, Louisiana (Louisiana District Court) issued its Findings of Fact and Conclusions of Law in the first phase of the Deepwater Horizon trial. The Louisiana District Court found that BP is liable under general maritime law for the blowout, explosion, and oil spill and apportioned 67% of the fault to BP. BP is challenging certain of the Louisiana District Court’s findings.
Furthermore, in certain instances we may be required to recognize a liability for amounts for which we are indemnified in advance of or in connection with recognizing a receivable from BP for the related indemnity
payment. Any such liability recognition without collection of the offsetting receivable could adversely impact our results of operations, our financial condition, and our ability to make borrowings.
Under the Settlement Agreement, BP does not indemnify the Company against
finespenalties and
penalties,fines, punitive damages, shareholder derivative or
securitysecurities laws claims, or certain other claims. The adverse resolution of any current or future proceeding related to the Deepwater Horizon events for which we are not indemnified by BP could subject us to significant monetary liability, which could have a material adverse effect on our business, prospects, results of operations, financial condition, and liquidity.
The additional deepwater drilling laws and regulations, delays in the processing and approval of drilling permits and exploration and oil spill-response plans, and other related developments arising after the deepwater drilling moratorium in the Gulf of Mexico may have a material adverse effect on our business, financial condition, or results of operations.
In May and July 2010, the Bureau of Ocean Energy Management, Regulation and Enforcement (BOEMRE), previously known as the Minerals Management Service, an agency of the Department of the Interior (DOI), issued directives requiring lessees and operators of federal oil and gas leases in the Outer Continental Shelf (OCS) regions of the Gulf of Mexico and Pacific Ocean to cease drilling all new deepwater wells, including wellbore sidetracks and bypasses, but excluding workovers, completions, plugging and abandonment, or production, through November 30, 2010 (Moratorium). Anadarko ceased all drilling operations in the Gulf of Mexico in accordance with the Moratorium, which resulted in the suspension of operations of two operated deepwater wells (Lucius and Nansen) and one non-operated deepwater well (Vito). The Moratorium was lifted effective October 12, 2010.
Between mid-May 2010 and mid-October 2010, part of which time the Moratorium was in place, the BOEMRE issued a series of rules and Notices to Lessees and Operators (NTLs) imposing new regulatory safety and performance requirements and permitting procedures for new wells to be drilled in federal waters of the OCS. The new regulatory requirements include the following:
Environmental NTL, which imposes new and more stringent requirements for documenting the environmental impacts potentially associated with the drilling of a new offshore well and significantly increases oil spill response requirements.
Compliance and Review NTL, which imposes requirements for operators to secure independent reviews of well design, construction and flow intervention processes, and also requires certifications of compliance from senior corporate officers.
Drilling Safety Rule, which prescribes tighter cementing and casing practices, imposes standards for the use of drilling fluids to maintain well bore integrity, and enhances oversight requirements relating to blowout preventers and related components, including shear and pipe rams.
Workplace Safety Rule, which requires operators to have a comprehensive safety and environmental management system (SEMS) in order to reduce human and organizational errors as root causes of work-related accidents and offshore spills. The BOEMRE subsequently issued a proposed rulemaking in 2011 that would amend the Workplace Safety Rule by requiring the imposition of certain added safety procedures to a company’s SEMS not covered by the original rule (including, by way of example, procedures to authorize any and all employees on an offshore facility authority to stop work when witnessing any activity that poses a threat of danger to an individual, property, or the environment) and revising existing obligations that a company’s SEMS be audited by requiring the use of an independent third-party auditor who is pre-approved by the agency to perform the auditing task.
In addition, the BOEMRE issued an NTL effective October 15, 2010, that established a more stringent regiment for the timely decommissioning of what is known as “idle iron”—wells, platforms, and pipelines that are no longer producing or serving exploration or support functions related to an operator’s lease—in the Gulf of Mexico. This NTL establishes more stringent standards for the deadlines by which idle iron must be decommissioned, the result of which is that Anadarko anticipates incurring costs to plug, abandon, or decommission wells and facilities on a more expedited basis than it might otherwise, absent this NTL.
The federal government may issue further safety and environmental laws and regulations regarding operations in the Gulf of Mexico. These additional rules and regulations, delays in the processing and approval of drilling permits and exploration, development, and oil spill-response plans, as a result of the new laws and regulations, the split of the BOEMRE into two new federal bureaus, and possible additional regulatory initiatives could adversely affect and further delay new drilling and ongoing development efforts in the Gulf of Mexico. Among other adverse impacts, these additional measures could delay or disrupt our operations, result in increased costs and limit activities in certain areas of the Gulf of Mexico. We cannot predict with any certainty the full impact of any new laws or regulations on our drilling operations in the Gulf of Mexico.
In addition to the drilling restrictions and new safety and permitting measures already issued and the possibility of new safety and environmental laws and regulations in the future, there have been discussions by government and private constituencies to amend existing laws such that exploration and production operators in the Gulf of Mexico would have to demonstrate or otherwise have available greater financial resources in order to conduct operations. For example, legislation has been discussed that could require companies operating in the Gulf of Mexico to establish and maintain a higher level of financial responsibility under its Certificate of Financial Responsibility, a certificate required by the OPA which evidences a company’s financial ability to pay for cleanup and damages caused by oil spills. There have also been discussions regarding the establishment of a new industry mutual insurance fund in which companies would be required to participate and which would be available to pay for consequential damages arising from an oil spill.
Other governments may also adopt safety, environmental or other laws and regulations that would adversely impact our offshore developments in other areas of the world, including offshore Brazil, New Zealand, West Africa, Mozambique, and Southeast Asia. Additional U.S. or foreign government laws or regulations would likely increase the costs associated with the offshore operations of our drilling contractors. As a result, our drilling contractors may seek to pass increased operating costs to us through higher day-rate charges or through cost escalation provisions in existing contracts.
In addition to increased governmental regulation, insurance costs may increase across the energy industry and certain insurance coverage may be subject to reduced availability or not available on economically reasonable terms, if at all. In particular, the events in the Gulf of Mexico relating to the Macondo well may make it increasingly difficult to obtain offshore property damage, well control, and similar insurance coverage. The potential increased costs and risks associated with offshore development may also result in certain current participants allocating resources away from offshore development and discourage potential new participants from undertaking offshore development activities. Accordingly, we may encounter increased difficulty identifying suitable partners willing to participate in our offshore drilling projects and prospects.
Further, the deepwater Gulf of Mexico (as well as international deepwater locations) lacks the degree of physical and oilfield service infrastructure present in shallower waters. Therefore, it may be difficult for us to quickly or effectively execute any contingency plans related to future events similar to the Macondo well oil spill.
The matters described above, individually or in the aggregate, could have a material adverse effect on our business, prospects, results of operations, financial condition, and liquidity.
We are, and in the future may become, involved in legal proceedings related to Tronox and, as a result, may incur substantial costs in connection with those proceedings.
In January 2009, Tronox Incorporated (Tronox), a former subsidiary of Kerr-McGee Corporation (Kerr-McGee), which is a current subsidiary of Anadarko, and certain of Tronox’s subsidiaries filed voluntary petitions for relief under Chapter 11 of the U.S. Bankruptcy Code (the Bankruptcy) in the U.S. Bankruptcy Court for the Southern District of New York (Bankruptcy Court). Subsequently, in May 2009, Tronox and certain of its affiliates filed a lawsuit against Anadarko and Kerr-McGee asserting a number of claims, including claims for actual and constructive fraudulent conveyance (Adversary Proceeding). Tronox alleges, among other things, that it was insolvent or undercapitalized at the time it was spun off from Kerr-McGee and seeks, among other things, to recover damages, including interest, in excess of $14.5 billion from Kerr-McGee and Anadarko, as well as litigation fees and costs. An adverse resolution of any proceedings related to Tronox could subject us to significant monetary damages and other penalties, which could have a material adverse effect on our business, prospects, results of operations, financial condition, and liquidity.
For additional information regarding the nature and status of these and other material legal proceedings, seeNote 16—Contingencies—Tronox Litigation in theNotes to Consolidated Financial Statementsunder Item 8 of this Form 10-K.
Oil, natural-gas, and NGLs prices are volatile. A substantial or extended decline in the price of these commodities could adversely affect our financial condition and results of operations.
Prices for oil, natural gas, and NGLs can fluctuate widely.
For example, daily settlement prices for New York Mercantile Exchange (NYMEX) West Texas Intermediate oil ranged from a high of $107.26 per barrel to a low of $53.27 per barrel during 2014. Daily settlement prices for NYMEX Henry Hub natural gas ranged from a high of $6.15 per million British thermal units (MMBtu) to a low of $2.89 per MMBtu during 2014. Our revenues, operating results,
cash flows from operations, capital budget, and future growth rates are highly dependent on the prices we receive for our oil, natural gas, and NGLs.
Historically, theThe markets for oil, natural gas, and NGLs have been volatile
historically and may continue to be volatile in the future.
For example, market prices for natural gas in the United States have declined substantially from 2008 price levels, and the rapid development of shale plays throughout North America has contributed significantly to this trend. Factors influencing the prices of oil, natural gas, and NGLs are beyond our control. These factors include, but are not limited to, the following:
domestic and worldwide supply of, and demand for, oil, natural gas, and NGLs;NGLs
volatile trading patterns in the commodity-futures markets;
marketsthe cost of exploring for, developing, producing, transporting, and marketing oil, natural gas, and NGLs;
NGLslevel of global oil and natural-gas inventories
weather conditions;conditions
the potential U.S. exports of liquefied natural gas, oil, condensate, or NGLs
ability of the members of the Organization of the Petroleum Exporting Countries (OPEC) and other producing nations to agree to and maintain production levels;levels
the worldwide military and political environment, civil and political unrest in Africa and the Middle East, uncertainty or instability resulting from the escalation or additional outbreak of armed hostilities, or further acts of terrorism in the United States or elsewhere;
elsewherethe effect of worldwide energy conservation and environmental protection efforts;
effortsthe price and availability of alternative and competing fuels;
fuelsthe price and level of foreign imports of oil, natural gas, and NGLs;
NGLsdomestic and foreign governmental laws, regulations, and taxes;
taxesthe proximity to, and capacity of, natural-gas pipelines and other transportation facilities; and
facilitiesgeneral economic conditions worldwide.
worldwide
The long-term effect of these and other factors on the prices of oil, natural gas, and NGLs
areis uncertain. Prolonged or substantial declines in these commodity prices may have the following effects on our business:
adversely affecting our financial condition, liquidity, ability to finance planned capital expenditures, and results of operations;operations
reducing the amount of oil, natural gas, and NGLs that we can produce economically;
economicallycausing us to delay or postpone some of our capital projects;
projects
reducing our revenues, operating income, or cash flows;flows
reducing the amounts of our estimated proved oil, natural-gas, and natural-gas reserves;
NGLs reservesreducing the carrying value of our oil and natural-gas properties;
propertiesreducing the standardized measure of discounted future net cash flows relating to oil, natural-gas, and natural-gas reserves; and
NGLs reserveslimiting our access to, or increasing the cost of, sources of capital, such as equity and long-term debt.
debt
Our domestic operations are subject to governmental risks that may impact our operations.
Our domestic operations have been, and at times in the future may be, affected by political developments and are subject to complex federal,
provincial, regional, state, tribal, local, and other laws and regulations such as restrictions on production, permitting, changes in taxes, deductions, royalties and other amounts payable to governments or governmental agencies, price or gathering-rate controls, hydraulic fracturing, and environmental protection regulations.
In order toTo conduct our operations in compliance with these laws and regulations, we must obtain and maintain numerous permits, approvals, and certificates from various federal,
provincial, regional, state, tribal, and local governmental authorities. We may incur substantial costs
in order to maintain compliance with these existing laws and regulations.
In addition, ourOur costs of compliance may increase if existing laws, including environmental and tax laws and regulations, are revised or reinterpreted, or if new laws and regulations become applicable to our operations. For example,
Congress, from time to time,
legislation has
considered adopting legislationbeen proposed that could adversely affect our business, financial condition, results of operations, or cash flows related to the following:
| • | | Climate Change. Congress has considered climate-change legislation that would seek to reduceOzone Standards. In December 2014, the U.S. Environmental Protection Agency (EPA) published proposed regulations to revise the National Ambient Air Quality Standard for ozone, recommending a standard between 65 to 70 parts per billion (ppb) for both the 8-hour primary and secondary standards protective of public health and public welfare. The current primary and secondary ozone standards are set at 75 ppb. The EPA is also taking comments on whether a 60 ppb standard should be established for the primary standard or whether the existing 75 ppb standard should be retained. If adopted, compliance with such regulations may require the Company to install new equipment to further control emissions and may also cause permitting delays. The EPA currently expects to issue a final rule by October 1, 2015. Reduction of Methane Emissions. In January 2015, the Obama Administration announced that the EPA is expected to propose in the summer of 2015 and finalize in 2016 new regulations that will regulate methane emissions from the oil and gas sector. The Obama Administration seeks to reduce methane emissions from new and modified infrastructure and equipment in the oil and gas sector, including the drilling of new wells, by up to 45% from 2012 levels by 2025. Climate Change. A number of green-house gases (GHGs) through establishment of a “cap-and-trade” plan. It is not possible at this time to predict whether or when Congress may re-introduce or act on climate-change legislation. The U.S. Environmental Protection Agency (EPA) has made findings that emissions of GHGs present a danger to public health and the environment and, based on these findings, has adopted regulations that restrict emissions of GHGs under existing provisions of the federal Clean Air Act, including one that requires a reduction in emissions of GHGs from motor vehicles and another that requires certain construction and operating permit reviews for GHG emissions from certain large stationary sources. In addition, the EPA has adopted rules requiring the monitoring and reporting of GHGs from certain sources, including, among others, onshore and offshore oil and natural-gas production facilities, which includes certain of our operations, on an annual basis. We are monitoring GHG emissions from our operations in accordance with the GHG emissions reporting rule and believe that our monitoring activities are in substantial compliance with applicable reporting obligations.
|
| • | | Taxes. The U.S. President’s Fiscal Year 2013 Budget Proposal includes provisions that would, if enacted, make significant changes to U.S. tax laws. These changes include, but are not limited to, (i) eliminating the immediate deduction for intangible drilling and development costs, (ii) eliminating the deduction from income for domestic production activities relating to oil and natural-gas exploration and development, and (iii) implementing certain international tax reforms.
|
Federal, state and local legislativeregional efforts exist that are aimed at tracking or reducing greenhouse gas (GHG) emissions. In addition, the EPA has determined that GHG emissions present a danger to public health and regulatory initiatives relatingthe environment and has adopted regulations that restrict emissions of GHGs under existing provisions of the Clean Air Act. Also, certain of our operations are subject to EPA rules requiring the monitoring and annual reporting of GHG emissions from specified onshore and offshore production sources. We may be required to install “best available control technology” to limit emissions of GHGs from any new or significantly modified facilities that we may seek to construct in the future if they would otherwise emit large volumes of GHGs together with other criteria pollutants.
Deficit Reduction or Tax Reform. Congress may undertake significant deficit reduction or comprehensive tax reform in the coming year. Proposals include provisions that would, if enacted, (i) eliminate the immediate deduction for intangible drilling and development costs, (ii) eliminate the manufacturing deduction for oil and gas qualified production activities, and (iii) eliminate accelerated depreciation for tangible property.
Changes in laws or regulations regarding hydraulic fracturing
as well as governmental reviewsor other oil and gas operations could increase our costs of
such activities could result in increased costs,doing business, impose additional operating restrictions or delays, and adversely affect our production.
Hydraulic fracturing is an essential and common practice used to stimulate production of natural gas and/orand oil from dense subsurface rock formations such as shales that generally exist between 4,000 and 14,000 feet below ground.shales. We routinely apply hydraulic-fracturing techniques in many of our U.S. onshore oil and natural-gas drilling and completion programs. The process involves the injection of water, sand, and additives under pressure into a targeted subsurface formation. The waterformation to fracture the surrounding rock and pressure create fractures in the rock formations, which are held open by the grains of sand, enabling the oil or natural gas to flow to the wellbore. The processstimulate production.
Hydraulic fracturing is
typically regulated by state oil and natural-gas
commissions; however, the EPA, recentlycommissions. However, several federal agencies have also asserted
federal regulatory authority over certain
hydraulic-fracturing activities involving diesel underaspects of the
Safe Drinking Waterprocess. For example, the EPA has issued final Clean Air Act
regulations governing performance standards for the oil and
has begun the process of drafting guidance documents related to this newly asserted regulatory authority. In November 2011, the EPAgas industry; announced its intent to
developpropose in early 2015 effluent limit guidelines that wastewater from shale gas extraction operations must meet before discharging to a treatment plant; and
issue regulations under theissued in May 2014 a prepublication of its Advance Notice of Proposed Rulemaking regarding Toxic Substances Control Act
to require companies to disclose information regardingreporting of the
chemicalschemical substances and mixtures used in hydraulic fracturing.
In February 2012,Also, in May 2013, the
DOI released draft regulations governingBureau of Land Management issued a revised proposed rule containing disclosure requirements and other mandates for hydraulic fracturing on federal
lands and
Indian oil and gas leasesthe agency is expected to
require disclosure of information regarding the chemicals usedpromulgate a final rule in
hydraulic fracturing, advance approval for well-stimulation activities, mechanical integrity testing of casing, and monitoring of well-stimulation operations. In addition, Congress,early 2015. Also, from time to time,
legislation has
considered adopting legislation intendedbeen introduced, but not enacted, in Congress to provide for federal regulation of hydraulic fracturing and to require disclosure
of the chemicals used in the hydraulic-fracturingfracturing process. In the event that a new, federal level of legal restrictions relating to the hydraulic-fracturing process areis adopted in areas where we currently or in the future plan to operate, we may incur additional costs to comply with such federal requirements that may be significant in nature, and also could become subject to additional permitting requirements and experience added delays or curtailment in the pursuit of exploration, development, or production activities.
Certain states in which we operate, including Colorado, Pennsylvania, Louisiana, Texas, and Wyoming, have adopted, and other states are considering adopting, regulations that could impose new or more stringent permitting, disclosure,
and additionalor well-construction requirements on hydraulic-fracturing
operations. For example, Texas adopted a law in June 2011 requiring disclosure to the Railroad Commission of Texas and the public of certain information regarding the components used in the hydraulic-fracturing process.operations or prohibit these operations completely. In addition to state laws, local land use restrictions, such as city ordinances, may restrict or prohibit drilling in general and/or hydraulic fracturing in particular.
We believe that we follow applicable standard industry practices and legal requirementsFor example, in exchange for
groundwater protection in ourthe withdrawal of several initiatives relating to hydraulic fracturing
activities. Nonetheless,and other oil and gas operations proposed for inclusion on the Colorado state ballot in
November 2014, the governor of Colorado created the Task Force on State and Local Regulation of Oil and Gas Operations (Task Force) in September 2014 to make recommendations to the state legislature regarding the responsible development of Colorado’s oil and gas resources. Although it is early in the process, it is possible that, as a result of the Task Force’s recommendations, Colorado could adopt new policies or legislation relating to oil and natural-gas operations, including measures that would give local governments in Colorado greater authority to limit hydraulic fracturing and other oil and natural-gas operations or require greater distances between well sites and occupied structures. In the event state or local restrictions
or prohibitions are adopted in areas where we
are currently conducting, orconduct operations, such as the Wattenberg field in
the future plan to conduct operations,Colorado, we may incur
additionalsignificant costs to comply with such requirements
thator we may
be significant in nature, experience delays or curtailment in the pursuit of exploration, development, or production activities, and
perhapspossibly be limited or precluded in the drilling of wells or in the amounts that we are ultimately able to produce from our reserves.
There Such costs, delays, restrictions, or prohibitions could have a material adverse effect on our business, prospects, results of operations, financial condition, and liquidity.
In addition to asserting regulatory authority, a number of federal entities are
also certain governmental reviews either underwayanalyzing, or
being proposedhave been requested to review, a variety of environmental issues associated with hydraulic fracturing. In April 2012, President Obama issued an executive order that
focusestablished a working group for the purpose of coordinating policy, information sharing, and planning among federal agencies and offices regarding “unconventional natural-gas production,” including hydraulic fracturing. In December 2012, the EPA issued an initial progress report on
environmental aspects of hydraulic-fracturing practices. The White House Council on Environmental Quality is coordinating an administration-wide review of hydraulic-fracturing practices, and a committee of the U.S. House of Representatives has conducted an investigation of hydraulic-fracturing practices. The EPA has commenced a study
begun in 2011 of the potential environmental effects of hydraulic fracturing on drinking water and groundwater, with
initial resultsa draft final report expected to be
available by late 2012issued for peer review and
final results by 2014. Moreover, the EPA is developing effluent limitations for the treatmentcomment in early 2015. These studies and
discharge of wastewater resulting from hydraulic-fracturing activities and plans to propose these standards by 2014. In addition, the U.S. Department of Energy is conducting an investigation into practices the agency could recommend to better protect the environment from drilling using hydraulic-fracturing completion methods. Also, the DOI is considering disclosure requirementsinitiatives, or
other mandates for hydraulic fracturing on federal lands. These ongoing or proposedany future studies, depending on
their degree of pursuit and any meaningful results obtained, could spur
initiativesefforts to further regulate hydraulic
fracturing under the Safe Drinking Water Act or other regulatory mechanisms.The adoptionfracturing.
Table of derivatives legislation by the U.S. Congress could have an adverse effect on the Company’s ability to use derivative instruments to reduce the effect of commodity price, interest rate, and other risks associated with its business.The Dodd-Frank Wall Street Reform and Consumer Protection Act (HR 4173), signed into law in 2010, establishes, among other provisions, federal oversight and regulation of the over-the-counter derivatives market and entities, such as the Company, that participate in that market. The new legislation required the Commodities Futures Trading Commission (CFTC) and the Securities and Exchange Commission (SEC) to promulgate rules and regulations implementing the new legislation within 360 days from the date of enactment. In July 2011, the CFTC granted temporary exemptive relief from certain swap regulation provisions of the legislation until December 21, 2011, or until the agency finalized the corresponding rules. In December 2011, the CFTC extended the potential latest expiration date of the exemptive relief to July 16, 2012. In its rulemaking under the new legislation, the CFTC has issued a final rule on position limits for certain futures and option contracts in the major energy markets and for swaps that are their economic equivalents. Certainbona fide hedging transactions or positions are exempt from these position limits. It is not possible at this time to predict when the CFTC will finalize other regulations, including critical rulemaking on the definition of “swap”, “swap dealer” and “major swap participant.” Depending on the Company’s classification, the financial reform legislation may require the Company to comply with margin requirements and with certain clearing and trade-execution requirements in connection with its derivative activities. The financial reform legislation may also require the counterparties to the Company’s derivative instruments to spin off some of their derivatives activities to separate entities, which may not be as creditworthy as the current
Contents
Index to Financial Statementscounterparties. The new legislation and any new regulations could significantly increase the cost of derivative contracts (including through requirements to post collateral which could adversely affect our available liquidity), materially alter the terms of derivative contracts, reduce the availability of derivatives to protect against risks the Company encounters, reduce the Company’s ability to monetize or restructure its existing derivative contracts, and increase the Company’s exposure to less creditworthy counterparties. If the Company reduces its use of derivatives as a result of the legislation and regulations, the Company’s results of operations may become more volatile and its cash flows may be less predictable, which could adversely affect the Company’s ability to plan for and fund capital expenditures. Finally, the legislation was intended, in part, to reduce the volatility of oil and natural-gas prices, which some legislators attributed to speculative trading in derivatives and commodity instruments related to oil and natural gas. The Company’s revenues could therefore be adversely affected if a consequence of the legislation and regulations is to lower commodity prices. Any of these consequences could have a material adverse effect on the Company’s consolidated financial position, results of operations, or cash flows.
Our debt and other financial commitments may limit our financial and operating flexibility.
Our total debt was $15.2$15.1 billion at December 31, 2011.2014. We also have various commitments for leases, drilling contracts, derivative contracts, firm transportation, and purchase obligations for services and products. Our financial commitments could have important consequences to our business including, but not limited to:to, the following: increasing our vulnerability to general adverse economic and industry conditions;conditions
limiting our ability to fund future working capital and capital expenditures, to engage in future acquisitions or development activities, or to otherwise fully realize the value of our assets and opportunities fully because of the need to dedicate a substantial portion of our cash flows from operations to payments on our debt or to comply with any restrictive terms of our debt;
debtlimiting our flexibility in planning for, or reacting to, changes in the industry in which we operate; and
operateplacing us at a competitive disadvantage compared to our competitors that have less debt and/or fewer financial commitments.
commitments
Additionally, the credit
agreementagreements governing our
$3.0 billion five-year senior
securedunsecured revolving credit facility
($5.0and our $2.0 billion
Facility) contains364-day senior unsecured revolving credit facility contain a number of
customary covenants,
that impose operatingincluding a financial covenant requiring maintenance of a consolidated indebtedness to total capitalization ratio of no greater than 65%, and
financial constraintslimitations on
the Company, including restrictions on our ability to:incur additional indebtedness;
sell assets;certain secured indebtedness, sale-and-leaseback transactions, and
Provisions of the $5.0 billion Facility also require us to maintain specified financial covenants as further described inLiquidity mergers and Capital Resources under Item 7 of this Form 10-K.other fundamental changes. Our ability to meet such covenants may be affected by events beyond our control.
A downgrade in our credit rating could negatively impact our cost of and ability to access capital.
As of December 31, 2011,2014, our long-term debt was rated “BBB-”“BBB” with a stable outlook by Standard and Poor’s (S&P), “BBB-” with a negativepositive outlook by Fitch Ratings (Fitch), and “Ba1” and under review for upgrade“Baa3” with a positive outlook by Moody’s Investors Service (Moody’s). In February 2015, Moody’s raised our long-term debt rating to “Baa2” and changed the outlook to stable. Although we are not aware of any current plans of S&P, Fitch, or Moody’s to lower their respective ratings on our debt, we cannot be assured that our credit ratings maywill not be subject to future downgrades.downgraded. A downgrade in our credit ratings could negatively impact our cost of capital or our ability to effectively execute aspects of our strategy. If weour credit ratings were to be downgraded, it could be difficult for usaffect our ability to raise debt in the public debt markets and the cost of that new debt could be much higher than our outstanding debt. In addition, a downgrade could affect the Company’s requirements to provide financial assurance of its performance undercertain contractual arrangements and derivative agreements. SeeNote 10—11—Derivative Instruments in theNotes to Consolidated Financial Statementsunder Item 8 of this Form 10-K.
Our proved reserves are estimates. Any material inaccuracies in our
reservereserves estimates or assumptions underlying our
reservereserves estimates could cause the quantities and net present value of our reserves to be overstated or understated.
There are numerous uncertainties inherent in estimating quantities of proved reserves, including many factors beyond our control that could cause the quantities and net present value of our reserves to be overstated or understated. The
reservereserves information included or incorporated by reference in this report represents estimates prepared by our internal engineers. The procedures and methods for estimating the reserves by our internal engineers were reviewed by independent petroleum consultants; however, no
reservereserves audit was conducted by these consultants. Estimation of reserves is not an exact science. Estimates of economically recoverable oil and natural-gas reserves and of future net cash flows depend on a number of variable factors and assumptions, any of which may cause actual results to vary considerably from these
estimates, such as:estimates. These factors and assumptions may include, but are not limited to, the following:historical production from an area compared with production from similar producing areas;areas
assumed effects of regulation by governmental agencies and court rulings;
rulingsassumptions concerning future oil and natural-gas prices, future operating costs, and capital expenditures; and
expendituresestimates of future severance and excise taxes, workover costs, and remedial costs.
costs
Estimates of reserves based on risk of recovery and estimates of expected future net cash flows prepared by different engineers, or by the same engineers at different times, may vary substantially. Actual production, revenues, and expenditures with respect to our reserves will likely vary from estimates, and the variance may be material. The discounted cash flows included in this report should not be construed as the fair value of the estimated oil, natural-gas, and NGLs reserves attributable to our properties.
For the December 31, 2011, 2010, and 2009 reserves, in accordance with SEC requirements, theThe estimated discounted future net cash flows from proved reserves are based on
average 12-month sales prices using the average beginning-of-month
price, while reservesprices during the 12-month period for
all periods prior to December 31, 2009, are based on year-end sales prices.the respective year. Actual future prices and costs may differ materially from the SEC regulation-compliant prices used for purposes of estimating future discounted net cash flows from proved reserves.
Failure to replace reserves may negatively affect our business.
Our future success depends
uponon our ability to find, develop, or acquire additional oil and natural-gas reserves that are economically recoverable. Our proved reserves generally decline when reserves are produced, unless we conduct successful exploration or development activities,
or acquire properties containing proved reserves, or both. We may be unable to find, develop, or acquire additional reserves on an economic basis. Furthermore, if oil and natural-gas prices increase, our costs for finding or acquiring additional reserves could also increase.
Poor general
Certain of our undeveloped leasehold acreage is subject to leases that will expire over the next several years unless production is established on units containing the acreage.
A portion of our leasehold acreage is currently undeveloped. Unless production in sufficient quantities is established on units containing certain of these leases during their terms, the leases will expire. If our leases expire, we will lose our right to develop the related properties. Our drilling plans for these areas are subject to change based on various factors: drilling results, oil and natural-gas prices, the availability and cost of capital, drilling and production costs, availability of drilling services and equipment, gathering system and pipeline transportation constraints, and regulatory approvals.
Future economic, business, or industry conditions may have a material adverse effect on our results of operations, liquidity, and financial condition.
During the last few years, concerns over inflation,
potential default on U.S. debt, energy costs, geopolitical issues, the availability and cost of credit,
the U.S. mortgage market,and uncertainties with regard to European sovereign debt,
and a declining real estate market in the United States have contributed to increased economic uncertainty and diminished expectations for the global economy. Concerns about global economic
conditionsgrowth have had a significant adverse impact on global financial markets and commodity prices.
If the economic recovery in the United States or abroad remains prolonged,Continued concerns could cause demand for petroleum products
couldto diminish or stagnate, which could impact the price at which we can sell our oil, natural gas, and
NGLs,NGLs; affect
the ability of our
vendors’, suppliers’vendors, suppliers, and
customers’ ability customers to continue operations,operations; and ultimately adversely impact our results of operations, liquidity, and financial condition.
Our results of operations could be adversely affected by goodwill impairments.
As a result of mergers and acquisitions, we havehad approximately $5.6 billion of goodwill on our Consolidated Balance Sheet.Sheet at December 31, 2014. Goodwill must be tested at least annually for impairment, and more frequently when circumstances indicate likely impairment. Goodwill is considered impaired to the extent that its carrying amount exceeds its implied fair value. Various factors could lead to an impairment of goodwill, such as the Company’s inability to replace the value of its depleting asset base, difficulty or potential delays in obtaining drilling permits, or other adverse events, such as lower sustained oil and natural-gas prices, which could reduce the fair value of the associated reporting unit. An impairment of goodwill could have a substantial negative effect on our profitability.
We are subject to complex laws and regulations relating to environmental protection that can adversely affect the cost, manner, and feasibility of doing business.
Our operations and properties are subject to numerous federal,
provincial, regional, state, tribal, local, and foreign laws and regulations
governing the release of pollutants or otherwise relating to environmental
protection from the time projects commence until abandonment.protection. These laws and regulations govern
the following, among other things:
the amounts and types of substances and materials that may be released;
the issuance of permits in connection with exploration, drilling, production, and midstream activities;
activitiesthe protection of endangered species;
speciesthe releaseamounts and types of emissions;
emissions and dischargesthe dischargegeneration, management, and disposition of generated waste materials;
materialsoffshore oil and gas operations;
operations and decommissioning of abandoned facilitiesthe reclamation and abandonment of wells and facility sites; and
sitesthe remediation of contaminated sites.
sites
In addition, these laws and regulations may impose substantial liabilities for our failure to comply or for any contamination resulting from our operations.operations, including the assessment of administrative, civil, and criminal penalties; the imposition of investigatory, remedial, and corrective action obligations or the incurrence of capital expenditures; the occurrence of delays in the development of projects; and the issuance of injunctions restricting or prohibiting some or all of our activities in a particular area. Future environmental laws and regulations, such as the restriction against emission of pollutants from previously unregulated activities or the designation of previously unprotected species as threatened or endangered in areas where we operate, such as the sage grouse, may negatively impact our industry.operations. The cost of satisfying these requirements may have an adverse effect on our financial condition, results of operations, or cash flows or could result in limitations on our exploration and production activities, which could have an adverse impact on our ability to develop and produce our reserves. For a description of certain environmental proceedings in which we are involved, seeLegal Proceedings under Item 3 and Note 16—17—Contingenciesand Note 2—Deepwater Horizon Eventsin theNotes to Consolidated Financial Statementsunder Item 8 of this Form 10-K.
We are vulnerable to risks associated with our offshore operations that could negatively impact our operations and financial results.
We conduct offshore operations in the Gulf of Mexico,
Mozambique, Ghana,
Mozambique, Brazil,
China,Colombia, Côte d’Ivoire, Kenya, Liberia, New Zealand, and other countries. Our operations and financial results could be significantly impacted by conditions in some of these areas because we are vulnerable to certain unique risks associated with operating offshore, including those relating
to:to the following:hurricanes and other adverse weather conditions;conditions
oil fieldoilfield service costs and availability;
availabilitycompliance with environmental and other laws and regulations;
regulations
terrorist attacks, such as piracy;
piracyremediation and other costs and regulatory changes resulting from oil spills or releases of hazardous materials; and
materialsfailure of equipment or facilities.
facilities
In addition, we conduct some of our exploration in deep waters (greater than 1,000 feet) where operations
and decommissioning activities are more difficult and costly than in shallower waters. The deep waters in the Gulf of Mexico, as well as international deepwater locations, lack the physical and oilfield service infrastructure present in its shallower waters. As a result, deepwater operations may require significant time between a discovery and the time that we can market our production, thereby increasing the risk involved with these operations.
Further, production of reserves from reservoirs in the Gulf of Mexico generally declines more rapidly than from reservoirs in many other producing regions of the world. This results in recovery of a relatively higher percentage of reserves from properties in the Gulf of Mexico during the initial few years of production and, as a result, our
reservereserves replacement needs from new prospects may be greater there than for our operations elsewhere. Also, our revenues and return on capital will depend significantly on prices prevailing during these relatively short production periods.
Additional domestic and international deepwater drilling laws, regulations, and other restrictions; delays in the processing and approval of drilling permits and exploration and oil spill-response plans; and other related developments may have a material adverse effect on our business, financial condition, or results of operations.
In response to the Deepwater Horizon incident in the Gulf of Mexico in April 2010, the Bureau of Ocean Energy Management and the Bureau of Safety and Environmental Enforcement, each agencies of the U.S. Department of the Interior, imposed new and more stringent permitting procedures and regulatory safety and performance requirements for new wells to be drilled in federal waters. Compliance with these new and more stringent rules and regulations, in addition to uncertainties or inconsistencies in current decisions and rulings by governmental agencies, delays in the processing and approval of drilling permits and exploration, development, and oil spill-response plans, and possible additional regulatory initiatives could adversely affect or delay new drilling and ongoing development efforts. Among other adverse impacts, these additional measures could delay or disrupt our operations, increase the risk of expired leases due to the time required to develop new technology, result in increased supplemental bonding and costs, and limit activities in certain areas, or cause us to incur penalties, fines, or shut-in production at one or more of our facilities. If similar material spill events were to occur in the future, the United States or other countries could elect to again issue directives to temporarily cease drilling activities and, in any event, may from time to time issue further safety and environmental laws and regulations regarding offshore oil and gas exploration and development. We cannot predict with any certainty the full impact of any new laws or regulations on our drilling operations or on the cost or availability of insurance to cover the risks associated with such operations.
Further, the deepwater Gulf of Mexico (as well as international deepwater locations) lacks the degree of physical and oilfield service infrastructure present in shallower waters. Therefore, despite the Company’s oil spill-response capabilities, it may be difficult for us to quickly or effectively execute any contingency plans related to future events similar to the Deepwater Horizon incident.
The matters described above, individually or in the aggregate, could have a material adverse effect on our business, prospects, results of operations, financial condition, and liquidity.
We operate in
otherforeign countries and are subject to political, economic, and other uncertainties.
Our operations outside the United States are based primarily in Algeria, Brazil,
China, CoteColombia, Côte d’Ivoire, Ghana,
Indonesia,Kenya, Liberia, Mozambique,
Sierra Leone, and New Zealand. As a result, we face political and economic risks and other uncertainties with respect to our international operations. These risks may include
the following, among other things:
loss of revenue, property, and equipment or delays in operations as a result of hazards such as expropriation, war, piracy, acts of terrorism, insurrection, civil unrest, and other political risks;risks, including tension and confrontations among political parties
transparency issues in general and, more specifically, the U.S. Foreign Corrupt Practices Act, the U.K. Bribery Act, and other anti-corruption compliance issues;
laws and issuesincreases in taxes and governmental royalties;
royaltiesunilateral renegotiation of contracts by governmental entities;
entitiesredefinition of international boundaries or boundary disputes;
disputesdifficulties enforcing our rights against a governmental agency because of the doctrine of sovereign immunity and foreign sovereignty over international operations;
operationschanges in laws and policies governing operations of foreign-based companies;
companies
foreign-exchange restrictions; andrestrictions
international monetary fluctuations and changes in the relative value of the U.S. dollar as compared to the currencies of other countries in which we conduct business.
business
For example,
in 2006, the Algerian parliament approved legislation establishing an exceptional profits tax on foreign companies’ Algerian oil production and issued regulations implementing this legislation. In response to the Algerian government’s imposition of the exceptional profits tax, we notified Sonatrach of our disagreement with the collection of the exceptional profits tax. In February 2009, we initiated arbitration against Sonatrach with regard to the exceptional profits tax. The arbitration hearing related to Anadarko’s dispute regarding the imposition of the Algerian exceptional profits tax was held in June 2011. Any decision issued by the arbitration panel is binding on the parties. For additional information, seeNote 17—Other Taxes in theNotes to Consolidated Financial Statements under Item 8 of this Form 10-K.In addition, Ghana and CoteCôte d’Ivoire are currently engaged in a dispute regarding the international maritime and land boundaries between the two countries. As a result, CoteCôte d’Ivoire claims to be entitled to the maritime area which covers a portion of the Deepwater Tano Block where we are currently conducting
exploration and appraisal activities.developing the TEN complex. In the event CoteCôte d’Ivoire is successful in its maritime border claims, our operations in the blockthis development could be materially impacted.
Recently, outbreaks Also, Venezuela and Guyana are in a dispute regarding their maritime and land borders in which the two countries have initiated a dialogue. We are unable to ascertain the full impact of this border dispute on future operations in Guyana.
Outbreaks of civil and political unrest
and acts of terrorism have occurred in
several countries in
Europe, Africa, and the Middle East, including countries where we conduct
operations, such as Algeria and Cote d’Ivoire. As exhibited by the events in Tunisia, Egypt, and Libya, these outbreaks have resulted in the established governing body being overthrown.operations. Continued or escalated civil and political unrest
and acts of terrorism in the countries in which we operate could result in our curtailing operations. In the event that countries in which we operate experience
civil or political
unrest or
civil unrest,acts of terrorism, especially in events where such unrest leads to an unseating of the established government, our operations in such
countrycountries could be materially impaired.
Our international operations may also be adversely affected,
directly or indirectly, by laws,
policies, and
policiesregulations of the United States affecting foreign trade and
taxation.taxation, including U.S. trade sanctions.
Realization of any of the factors listed above could materially and adversely affect
ourthe Company’s financial
position,condition, results of operations, or cash flows.
Our commodity-price risk-management and trading activities may prevent us from fully benefiting from price increases and may expose us to other risks.
To the extent that we engage in commodity-price risk-management activities to protect our cash flows from commodity-price declines, we may be prevented from realizing the full benefits of price increases above the levels of the derivative instruments used to manage price risk. In addition, our commodity-price risk-management and trading activities may expose us to the risk of financial loss in certain circumstances, including instances in
which:which the following occur:our production is less than the hedged volumes;notional volumes
there is a widening of price basis differentials occurs between delivery points for our production and the delivery point assumed in the hedge arrangement;
derivative arrangementthe counterparties to our hedging or other price-risk management contracts fail to perform under those arrangements; or
arrangementsa sudden unexpected event materially impacts oil, natural-gas, or NGLs prices
The enactment of derivatives legislation, and natural-gas prices.the promulgation of regulations pursuant thereto, could have an adverse effect on the Company’s ability to use derivative instruments to reduce the effect of commodity-price, interest-rate, and other risks associated with its business.
The Dodd-Frank Wall Street Reform and Consumer Protection Act (Dodd-Frank Act), enacted in 2010, requires the Commodities Futures Trading Commission (CFTC) and the SEC to promulgate rules and regulations establishing federal oversight and regulation of the over-the-counter derivatives market and entities that participate in that market including swap clearing and trade execution requirements. While many rules and regulations have been promulgated and are already in effect, other rules and regulations, including the proposed margin rules, position limits, and commodity clearing requirements, remain to be finalized or effectuated, and therefore, the impact of those rules and regulations on us is uncertain at this time.
New or modified rules, regulations, or legal requirements may increase the cost and impact the availability to our counterparties of their hedging and swap positions that they can make available to us, and may further require the counterparties to our derivative instruments to spin off some of their derivative activities to separate entities, which may not be as creditworthy as the current counterparties. In addition, for uncleared swaps, the CFTC or federal banking regulators may require end-users to enter into credit risksupport documentation or post margin collateral. Any changes in the regulations of financial institutionsswaps may result in certain market participants deciding to curtail or cease their derivative activities.
The Dodd-Frank Act, and the rules promulgated thereunder, could (i) significantly increase the cost, or decrease the liquidity, of energy-related derivatives we use to hedge against commodity-price fluctuations (including through requirements to post collateral), (ii) materially alter the terms of derivative contracts, (iii) reduce the availability of derivatives to protect against risks we encounter, and (iv) increase our exposure to less creditworthy counterparties. If we reduce our use of derivatives as a result of the Dodd-Frank Act and applicable rules and regulations, our cash flow may become more volatile and less predictable, which could adversely affect our ability to plan for and fund capital expenditures.
In addition, the European Union and other non-U.S. jurisdictions are implementing regulations with respect to the derivatives market. To the extent the Company transacts with counterparties in foreign jurisdictions, it may become subject to such regulations. At this time, the impact of such regulations is not clear.
Deterioration in the credit or equity markets could adversely affect us.
We have exposure to different
counterparties, andcounterparties. For example, we have entered into transactions with counterparties in the financial services industry, including commercial banks, investment banks, insurance companies, investment funds, and other institutions. These transactions expose us to credit risk in the event of default by our counterparty. Deterioration in the credit markets may impact the credit ratings of our current and potential counterparties and affect their ability to fulfill existing obligations to us and their willingness to enter into future transactions with us. We have exposure to these financial institutions through our derivative transactions. In addition, if any lender under our credit facility is unable to fund its commitment, our liquidity will be reduced by an amount up to the aggregate amount of such lender’s commitment under our credit facility.
Moreover, to the extent that purchasers of the Company’s production rely on access to the credit or equity markets to fund their operations, there is a risk that those purchasers could default in their contractual obligations to the Company if such purchasers were unable to access the credit or equity markets for an extended period of time.
We are not insured against all of the operating risks to which our business is exposed.
Our business is subject to all of the operating risks normally associated with the exploration for and production, gathering, processing, and transportation of oil and gas, including
blowouts,blowouts; cratering and
fire,fire; environmental hazards, such as gas leaks, oil spills, pipeline and vessel ruptures, and releases of chemicals or other hazardous substances, any of which could result in damage to, or destruction of, oil and natural-gas wells or formations, production facilities, and other
property, as well asproperty; pollution or other environmental damage; and injury to persons. For protection against financial loss resulting from these operating hazards, we maintain insurance coverage, including insurance coverage for certain physical damage, blowout/
loss of control of a well, comprehensive general liability, aviation liability, and worker’s compensation and employer’s liability. However, our insurance coverage may not be sufficient to cover us against 100% of potential losses arising as a result of the foregoing, and for certain risks, such as political risk,
business interruption, war, terrorism, and piracy, for which we have limited or no coverage. In addition, we are not insured against all risks in all aspects of our business, such as hurricanes. The occurrence of a significant event against which we are not fully insured could have a material adverse effect on our consolidated financial position,condition, results of operations, or cash flows.
Material differences between the estimated and actual timing of critical events may affect the completion of and commencement of production from development projects.
We are involved in several large development
projects.projects and the completion of those projects may be delayed beyond our anticipated completion dates. Key factors that may affect the timing and outcome of such projects
include:include the following:project approvals by joint-venture partners;partners
timely issuance of permits and licenses by governmental agencies;
agencies or legislative and other governmental approvalsweather conditions;
conditionsavailability of personnel;
qualified personnelcivil and political environment of, and existing infrastructure in, the country or region in which the project is located
manufacturing and delivery schedules of critical equipment; andequipment
commercial arrangements for pipelines and related equipment to transport and market hydrocarbons.
hydrocarbons
Delays and differences between estimated and actual timing of critical events may affect the forward-looking statements related to large development projects and could have a material adverse effect on our results of operations.
The oil and gas exploration and production industry is very competitive, and some of our exploration and production competitors have greater financial and other resources than we do.
The oil and gas business is highly competitive in the search for and acquisition of reserves and in the gathering and marketing of oil and gas production. Our competitors include national oil companies, major oil and gas companies, independent oil and gas companies, individual producers, gas marketers, and major pipeline companies, as well as participants in other industries supplying energy and fuel to consumers. Some of our competitors may have greater and more diverse resources
uponon which to draw than we do. If we are not successful in our competition for oil and gas reserves or in our marketing of production, our financial condition and results of operations may be adversely affected.
The high cost or unavailability of drilling rigs, equipment, supplies, personnel, and other
oil fieldoilfield services could adversely affect our ability to execute our exploration and development plans on a timely basis and within our budget, which could have a material adverse effect on our business, financial condition, or results of operations.
Our industry is cyclical and, from time to time, there is a shortage of drilling rigs, equipment, supplies, or qualified personnel. During these periods, the costs of rigs, equipment, supplies, and personnel are substantially greater and their availability to us may be limited. Additionally, these services may not be available on commercially reasonable terms. The high cost or unavailability of drilling rigs, equipment, supplies, personnel, and other
oil fieldoilfield services could adversely affect our ability to execute our exploration and development plans on a timely basis and within our budget, which could have a material adverse effect on our business, financial condition, or results of operations.
Our drilling activities may not be productive.
Drilling for oil and natural gas involves numerous risks, including the risk that we will not encounter commercially productive oil or natural-gas reservoirs. The costs of drilling, completing, and operating wells are often uncertain, and drilling operations may be curtailed, delayed, or canceled as a result of a variety of factors,
including:including the following:unexpected drilling conditions;conditions
pressure or irregularities in formations;
formationsequipment failures or accidents;
accidentsfires, explosions, blowouts, and surface cratering;
crateringmarine risks such as capsizing, collisions, and hurricanes;
hurricanesdifficulty identifying and retaining qualified personnel
title problems;problems
other adverse weather conditions; and
conditionsshortages or delays in the delivery of equipment.
equipment
Certain of our future drilling activities may not be successful and, if unsuccessful, this failure could have an adverse effect on our future results of operations and financial condition. While all drilling, whether developmental or exploratory, involves these risks, exploratory drilling involves greater risks of dry holes or failure to find commercial quantities of hydrocarbons. Because of the percentage of our capital budget devoted to high-risk exploratory projects, it is likely that we will continue to experience significant exploration and dry hole expenses.
We have limited
controlinfluence over the activities on properties we do not operate.
Other companies operate some of the properties in which we have an interest. We have limited ability to influence
or control the operation or future development of these
non-operatednonoperated properties or the amount of capital expenditures that we are required to fund with respect to them. Our dependence on the operator and other working interest owners for these projects and our limited ability to influence
or control the operation and future development of these properties could materially adversely affect the realization of our targeted returns on capital,
and lead to unexpected future
costs.costs, or adversely affect the timing of activities.
Our ability to sell our
oil, natural gas, and
oilNGLs production could be materially harmed if we fail to obtain adequate services such as transportation.
The marketability of our production depends in part on the availability, proximity, and capacity of pipeline facilities and tanker transportation. If any pipelines or tankers become unavailable, we would, to the extent possible, be required to find a suitable alternative to transport the oil, natural gas, and oil,NGLs, which could increase our costs and/or reduce the revenues we might obtain from the sale of the oil and gas.
Our business could be negatively affected by security threats, including cybersecurity threats, and other disruptions.
As an oil and gas
producer, we face various security threats, including cybersecurity threats such as attempts to gain unauthorized access to sensitive information or to render data or systems unusable; threats to the security of our facilities and
oil.infrastructure or third-party facilities and infrastructure, such as processing plants and pipelines; and threats from terrorist acts. Our implementation of various procedures and controls to monitor and mitigate security threats and to increase security for our information, facilities, and infrastructure may result in increased costs. Moreover, there can be no assurance that such procedures and controls will be sufficient to prevent security breaches from occurring. Cybersecurity attacks in particular are becoming more sophisticated and include, but are not limited to, malicious software, attempts to gain unauthorized access to data and systems, and other electronic security breaches that could lead to disruptions in critical systems, unauthorized release of confidential or otherwise protected information, and corruption of data, which could have an adverse effect on our reputation, financial condition, results of operations, or cash flows.
While we have experienced cybersecurity attacks, we have not suffered any material losses relating to such attacks; however, there is no assurance that we will not suffer such losses in the future. In addition, as cybersecurity threats continue to evolve, we may be required to expend additional resources to continue to modify or enhance our protective measures or to investigate or remediate any cybersecurity vulnerabilities.
Provisions in our corporate documents and Delaware law could delay or prevent a change of control of Anadarko, even if that change would be beneficial to our stockholders.
Our restated certificate of incorporation and by-laws contain provisions that may make a change of control of Anadarko difficult, even if it may be beneficial to our stockholders, including provisions governing the nomination and removal of
directors;directors, the prohibition of stockholder action by written consent and regulation of stockholders’ ability to bring matters for action before annual stockholder
meetings;meetings, and the authorization given to our Board of Directors to issue and set the terms of preferred stock.
In addition, Section 203 of the Delaware General Corporation Law imposes restrictions on mergers and other business combinations between us and any holder of 15% or more of our outstanding common stock.
We may reduce or cease to pay dividends on our common stock.
We can provide no assurance that we will continue to pay dividends at the current rate or at all. The amount of cash dividends, if any, to be paid in the future will depend on actions taken by our Board of Directors, as well as, our financial condition, results of operations, cash flows, levels of capital and exploration expenditures, future business prospects, expected liquidity needs, and other related matters that our Board of Directors deems relevant.
The loss of key members of our management team, or difficulty attracting and retaining experienced technical personnel, could reduce our competitiveness and prospects for future success.
The successful implementation of our strategies and handling of other issues integral to our future success will depend, in part, on our experienced management team. The loss of key members of our management team could have an adverse effect on our business. We do not carry key man insurance. Our exploratory drilling success and the success of other activities integral to our operations will depend, in part, on our ability to attract and retain experienced explorationists, engineers, and other professionals. Competition for such professionals is intense. If we cannot retain our technical personnel or attract additional experienced technical personnel, our ability to compete could be harmed.
Item 1B. Unresolved Staff Comments
The Company has no unresolved SEC staff comments that have been outstanding greater than 180 days from December 31, 2011.
None.
Item 3. Legal Proceedings
GENERALGENERAL The Company is a defendant in a number of lawsuits and is involved in governmental proceedings and regulatory controls arising in the ordinary course of business, including, but not limited to, personal injury claims,claims; title disputes,disputes; tax disputes; royalty claims,claims; contract claims, oil-fieldclaims; contamination claims relating to oil and gas production, transportation, and processing; and environmental claims, including claims involving assets owned by predecessorsacquired companies and claims involving assets previously sold to third parties and no longer a part of acquired companies.the Company’s current operations. Anadarko is also subject to various environmental-remediation and reclamation obligations arising from federal, state, and local laws and regulations. While the ultimate outcome and impact on the Company cannot be predicted with certainty, after consideration of recorded expense and liability accruals, management believes that the resolution of pending proceedings will not have a material adverse effect on the Company’s consolidated financial position,condition, results of operations, or cash flows.
SeeNote 2—Deepwater Horizon Events
In September 2013, Anadarko received a Notice of Proposed Penalty Assessment from the Bureau of Safety and Environmental Enforcement (BSEE) as the result of an incident that occurred in February 2012 relating to a drilling rig in the Gulf of Mexico. In the notice, BSEE alleged several violations of certain offshore operational requirements. Anadarko disputed many of the allegations and in October 2014 received a Revised Final Reviewing Officer’s Decision from BSEE for a penalty of $70,000.
In June 2014, the EPA alleged that Anadarko was not in compliance with a consent decree entered into by the U.S. District Court for the District of Colorado on March 27, 2008 to resolve certain Clean Air Act violations in Colorado and Utah. Specifically, the EPA alleged violations of the consent decree at three of Anadarko’s compressor station facilities located in Utah. In November 2014, Anadarko entered into a joint stipulation with the EPA and agreed to pay a penalty of $599,000.
WGR Operating, LP, a wholly owned subsidiary of the Company, is currently in negotiations with the EPA concerning enforcement for alleged noncompliance with the leak detection and repair requirements of the Clean Air Act at its Granger, Wyoming facilities. Although management cannot predict the outcome of settlement discussions, it is likely a resolution of this matter will result in a fine or penalty in excess of $100,000.
See Note 17—Contingencies in the Notes to Consolidated Financial Statementsunder Item 8 of this Form 10-K, which is incorporated herein by reference, for a discussion of legal proceedings related to the Deepwater Horizon events.SeeNote 16—Contingencies—Tronox Litigationin theNotes to Consolidated Financial Statements under Item 8 of this Form 10-K, which is incorporated herein by reference, for a discussion of other material legal proceedings to which the Company is a party.
Item 4. Mine Safety Disclosures
Item 5. Market for Registrant’s Common Equity, Related Stockholder Matters and Issuer Purchases of
Equity Securities
| |
| Item 5. | Market for Registrant’s Common Equity, Related Stockholder Matters and Issuer Purchases of Equity Securities |
MARKET INFORMATION, HOLDERS, AND DIVIDENDS
As of
At January 31, 2012,30, 2015, there were approximately 13,70011,400 holders of record holders of Anadarko common stock. The common stock of Anadarko is traded on the New York Stock Exchange. The following shows information regarding the market price of and dividends declared and paid on the Company’s common stock by quarter for 20112014 and 2010. | | | 0000 | | | | 0000 | | | | 0000 | | | | 0000 | |
| | | First
Quarter | | | Second
Quarter | | | Third
Quarter | | | Fourth
Quarter | |
2011 | | | | | | | | | | | | | | | | |
Market Price | | | | | | | | | | | | | | | | |
High | | $ | 84.00 | | | $ | 85.50 | | | $ | 85.25 | | | $ | 84.42 | |
Low | | $ | 73.02 | | | $ | 68.67 | | | $ | 63.03 | | | $ | 57.11 | |
Dividends | | $ | 0.09 | | | $ | 0.09 | | | $ | 0.09 | | | $ | 0.09 | |
2010 | | | | | | | | | | | | | | | | |
Market Price | | | | | | | | | | | | | | | | |
High | | $ | 73.89 | | | $ | 75.07 | | | $ | 58.42 | | | $ | 78.98 | |
Low | | $ | 60.75 | | | $ | 34.54 | | | $ | 36.06 | | | $ | 55.65 | |
Dividends | | $ | 0.09 | | | $ | 0.09 | | | $ | 0.09 | | | $ | 0.09 | |
|
| | | | | | | | | | | | | | | |
| | First Quarter | | Second Quarter | | Third Quarter | | Fourth Quarter |
| 2014 | | | | | | | |
| Market Price | | | | | | | |
| High | $ | 86.86 |
| | $ | 112.06 |
| | $ | 113.51 |
| | $ | 102.68 |
|
| Low | $ | 77.80 |
| | $ | 84.54 |
| | $ | 100.40 |
| | $ | 71.00 |
|
| Dividends | $ | 0.18 |
| | $ | 0.27 |
| | $ | 0.27 |
| | $ | 0.27 |
|
| 2013 | | | | | | | |
| Market Price | | | | | | | |
| High | $ | 89.20 |
| | $ | 92.18 |
| | $ | 96.75 |
| | $ | 98.47 |
|
| Low | $ | 74.73 |
| | $ | 78.30 |
| | $ | 86.08 |
| | $ | 73.60 |
|
| Dividends | $ | 0.09 |
| | $ | 0.09 |
| | $ | 0.18 |
| | $ | 0.18 |
|
The amount of future common stock dividends will depend on earnings, financial condition, capital requirements, the effect a dividend payment would have on the Company’s compliance with its financial covenants, and other factors, and will be determined by the Board of Directors on a quarterly basis. For additional information, seeLiquidity and Capital Resources—Uses of Cash—Common Stock Dividends and Distributions to Noncontrolling Interest Ownersunder Item 7 of this Form 10-K.
SECURITIES AUTHORIZED FOR ISSUANCE UNDER EQUITY COMPENSATION PLANS
The following table sets forth information with respect to the equity compensation plans available to directors, officers, and employees of the Company at December 31, 2011. | | | 15,474,224 | | | | 15,474,224 | | | | 15,474,224 | |
Plan Category | | (a)
Number of securities
to be issued upon
exercise of
outstanding options,
warrants, and rights | | | (b)
Weighted-average
exercise price of
outstanding
options, warrants,
and rights | | | (c)
Number of securities
remaining available
for future issuance
under equity
compensation plans
(excluding securities
reflected in column(a)) | |
Equity compensation plans approved by security holders | | | 9,868,589 | | | $ | 55.27 | | | | 15,474,224 | |
Equity compensation plans not approved by security holders | | | — | | | | — | | | | — | |
| | | | | | | | | | | | |
Total | | | 9,868,589 | | | $ | 55.27 | | | | 15,474,224 | |
| | | | | | | | | | | | |
2014
: |
| | | | | | | | | | |
| Plan Category | | (a) Number of securities to be issued upon exercise of outstanding options, warrants, and rights | | (b) Weighted-average exercise price of outstanding options, warrants, and rights | | (c) Number of securities remaining available for future issuance under equity compensation plans (excluding securities reflected in column(a)) |
Equity compensation plans approved by security holders | | 6,791,018 |
| | $ | 69.96 |
| | 21,169,470 |
|
Equity compensation plans not approved by security holders | | — |
| | — |
| | — |
|
| Total | | 6,791,018 |
| | $ | 69.96 |
| | 21,169,470 |
|
PURCHASES OF EQUITY SECURITIES BY THE ISSUER AND AFFILIATED PERSONS
The following sets forth information with respect to repurchases made by the Company of its shares of common stock during the fourth quarter of 2011. | | | 124,306 | | | | 124,306 | | | | 124,306 | | | | 124,306 | |
Period | | Total
number of
shares
purchased(1) | | | Average
price paid
per share | | | Total number of
shares purchased
as part of publicly
announced plans
or programs | | | Approximate dollar
value of shares that
may yet be
purchased under the
plans or programs | |
October 1-31 | | | 175 | | | $ | 63.05 | | | | — | | | | | |
November 1-30 | | | 83,614 | | | $ | 78.47 | | | | — | | | | | |
December 1-31 | | | 40,517 | | | $ | 80.38 | | | | — | | | | | |
| | | | | | | | | | | | | | | | |
Fourth Quarter 2011 | | | 124,306 | | | $ | 79.07 | | | | — | | | $ | — | |
| | | | | | | | | | | | | | | | |
|
| | | | | | | | | | | | | | |
| Period | | Total number of shares purchased (1) | | Average price paid per share | | Total number of shares purchased as part of publicly announced plans or programs | | Approximate dollar value of shares that may yet be purchased under the plans or programs |
| October | | 14,821 |
| | $ | 92.69 |
| | — |
| | |
| November | | 79,151 |
| | $ | 92.83 |
| | — |
| | |
| December | | 2,084 |
| | $ | 77.60 |
| | — |
| | |
| Fourth Quarter 2014 | | 96,056 |
| | $ | 92.48 |
| | — |
| | $ | — |
|
_______________________________________________________________________________
| |
(1) | During the fourth quarter of 2011,2014, all purchased shares related to stock received by the Company for the payment of withholding taxes due on employee stock plan share issuances. |
For additional information, seeNote 14—15—Share-Based Compensation in theNotes to Consolidated Financial Statements under Item 8 of this Form 10-K.
The following performance graph and related information shall not be deemed “soliciting material” or to be “filed” with the SEC, nor shall information be incorporated by reference into any future filing under the Securities Act of 1933 or Securities Exchange Act of 1934, each as amended, except to the extent that the Company specifically incorporates it by reference into such filing.
The following graph compares the cumulative five-year total return to stockholders
onof Anadarko’s common stock relative to the cumulative total returns of the S&P 500 index and a peer group of 11 companies. The companies included in the peer group are Apache Corporation; Chevron Corporation; ConocoPhillips; Devon Energy Corporation; EOG Resources, Inc.; Hess Corporation; Marathon Oil Corporation;
Murphy Oil Corporation; Noble Energy, Inc.; Occidental Petroleum Corporation;
and Pioneer Natural Resources
Company; and Plains Exploration and Production Company.
Comparison of 5-Year Cumulative Total Return Among
Anadarko Petroleum Corporation, the S&P 500 Index,
and a Peer Group
Copyright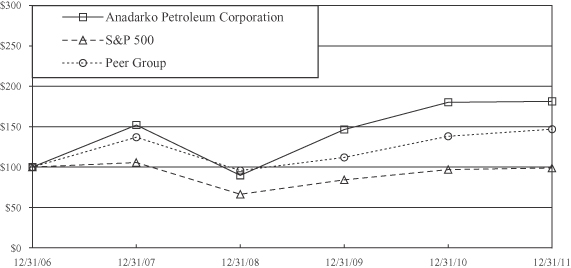
© 2015 S&P, a division of The McGraw-Hill Companies Inc. All rights reserved.
An investment of $100 (with reinvestment of all dividends) is assumed to have been made in the Company’s common stock, in the indexS&P 500 Index, and in the peer group on December 31, 2006,2009, and its relative performance is tracked through December 31, 2011. | | | 0000000 | | | | 0000000 | | | | 0000000 | | | | 0000000 | | | | 0000000 | | | | 0000000 | |
| Fiscal Year Ended December 31 | | 2006 | | | 2007 | | | 2008 | | | 2009 | | | 2010 | | | 2011 | |
Anadarko Petroleum Corporation | | $ | 100.00 | | | $ | 152.04 | | | $ | 89.83 | | | $ | 146.59 | | | $ | 179.98 | | | $ | 181.24 | |
S&P 500 | | | 100.00 | | | | 105.49 | | | | 66.46 | | | | 84.05 | | | | 96.71 | | | | 98.75 | |
Peer Group | | | 100.00 | | | | 137.07 | | | | 95.49 | | | | 112.00 | | | | 138.00 | | | | 147.01 | |
2014.
|
| | | | | | | | | | | | | | | | | | | | | | | |
| Fiscal Year Ended December 31 | 2009 | | 2010 | | 2011 | | 2012 | | 2013 | | 2014 |
| Anadarko Petroleum Corporation | $ | 100.00 |
| | $ | 122.78 |
| | $ | 123.64 |
| | $ | 120.97 |
| | $ | 129.92 |
| | $ | 136.59 |
|
| S&P 500 | 100.00 |
| | 115.06 |
| | 117.49 |
| | 136.30 |
| | 180.44 |
| | 205.14 |
|
| Peer Group | 100.00 |
| | 123.66 |
| | 130.54 |
| | 133.12 |
| | 167.31 |
| | 154.38 |
|
Item 6. Selected Financial Data
| | | | | | | | | | | | | | | | | | | | |
| | | Summary Financial Information(1) | |
| millions except per-share amounts | | 2011 | | | 2010 | | | 2009 | | | 2008 | | | 2007 | |
Sales Revenues | | $ | 13,882 | | | $ | 10,842 | | | $ | 8,210 | | | $ | 14,079 | | | $ | 11,656 | |
Gains (Losses) on Divestitures and Other, net | | | 85 | | | | 142 | | | | 133 | | | | 1,083 | | | | 4,760 | |
Reversal of Accrual for DWRRA Dispute | | | — | | | | — | | | | 657 | | | | — | | | | — | |
| | | | | | | | | | | | | | | | | | | | |
Total Revenues and Other | | | 13,967 | | | | 10,984 | | | | 9,000 | | | | 15,162 | | | | 16,416 | |
Deepwater Horizon settlement and related costs | | | 3,930 | | | | 15 | | | | — | | | | — | | | | — | |
Operating Income (Loss) | | | (1,870 | ) | | | 1,769 | | | | 377 | | | | 5,601 | | | | 7,871 | |
Income (Loss) from Continuing Operations | | | (2,568 | ) | | | 821 | | | | (103 | ) | | | 3,220 | | | | 3,767 | |
Income from Discontinued Operations, net of taxes | | | — | | | | — | | | | — | | | | 63 | | | | 11 | |
Net Income (Loss) Attributable to Common Stockholders | | | (2,649 | ) | | | 761 | | | | (135 | ) | | | 3,260 | | | | 3,778 | |
Per Common Share (amounts attributable to common stockholders): | | | | | | | | | | | | | | | | | | | | |
Income (Loss) from Continuing Operations—Basic | | $ | (5.32 | ) | | $ | 1.53 | | | $ | (0.28 | ) | | $ | 6.79 | | | $ | 8.01 | |
Income (Loss) from Continuing Operations—Diluted | | $ | (5.32 | ) | | $ | 1.52 | | | $ | (0.28 | ) | | $ | 6.78 | | | $ | 7.99 | |
Income from Discontinued Operations—Basic | | $ | — | | | $ | — | | | $ | — | | | $ | 0.13 | | | $ | 0.02 | |
Income from Discontinued Operations—Diluted | | $ | — | | | $ | — | | | $ | — | | | $ | 0.13 | | | $ | 0.02 | |
Net Income (Loss)—Basic | | $ | (5.32 | ) | | $ | 1.53 | | | $ | (0.28 | ) | | $ | 6.92 | | | $ | 8.03 | |
Net Income (Loss)—Diluted | | $ | (5.32 | ) | | $ | 1.52 | | | $ | (0.28 | ) | | $ | 6.91 | | | $ | 8.01 | |
Dividends | | $ | 0.36 | | | $ | 0.36 | | | $ | 0.36 | | | $ | 0.36 | | | $ | 0.36 | |
Average Number of Common Shares Outstanding—Basic | | | 498 | | | | 495 | | | | 480 | | | | 465 | | | | 465 | |
Average Number of Common Shares Outstanding—Diluted | | | 498 | | | | 497 | | | | 480 | | | | 466 | | | | 467 | |
Cash Provided by Operating Activities—Continuing Operations | | $ | 2,505 | | | $ | 5,247 | | | $ | 3,926 | | | $ | 6,447 | | | $ | 2,766 | |
Cash Provided by (Used in) Operating Activities—Discontinued Operations | | | — | | | | — | | | | — | | | | (5 | ) | | | 134 | |
Net Cash Provided by Operating Activities | | | 2,505 | | | | 5,247 | | | | 3,926 | | | | 6,442 | | | | 2,900 | |
Capital Expenditures | | $ | 6,553 | | | $ | 5,169 | | | $ | 4,558 | | | $ | 4,881 | | | $ | 3,990 | |
Current Debt | | $ | 170 | | | $ | 291 | | | $ | — | | | $ | 1,472 | | | $ | 1,396 | |
Long-term Debt | | | 15,060 | | | | 12,722 | | | | 11,149 | | | | 9,128 | | | | 11,151 | |
Midstream Subsidiary Note Payable to a Related Party | | | — | | | | — | | | | 1,599 | | | | 1,739 | | | | 2,200 | |
Total Debt | | $ | 15,230 | | | $ | 13,013 | | | $ | 12,748 | | | $ | 12,339 | | | $ | 14,747 | |
Total Stockholders’ Equity | | | 18,105 | | | | 20,684 | | | | 19,928 | | | | 18,795 | | | | 16,364 | |
Total Assets | | $ | 51,779 | | | $ | 51,559 | | | $ | 50,123 | | | $ | 48,923 | | | $ | 48,451 | |
Annual Sales Volumes: | | | | | | | | | | | | | | | | | | | | |
Natural Gas (Bcf) | | | 852 | | | | 829 | | | | 809 | | | | 750 | | | | 698 | |
Oil and Condensate (MMBbls) | | | 79 | | | | 74 | | | | 68 | | | | 67 | | | | 79 | |
Natural Gas Liquids (MMBbls) | | | 27 | | | | 23 | | | | 17 | | | | 14 | | | | 16 | |
Total (MMBOE)(2) | | | 248 | | | | 235 | | | | 220 | | | | 206 | | | | 211 | |
Average Daily Sales Volumes: | | | | | | | | | | | | | | | | | | | | |
Natural Gas (MMcf/d) | | | 2,334 | | | | 2,272 | | | | 2,217 | | | | 2,049 | | | | 1,912 | |
Oil and Condensate (MBbls/d) | | | 217 | | | | 201 | | | | 187 | | | | 182 | | | | 215 | |
Natural Gas Liquids (MBbls/d) | | | 74 | | | | 63 | | | | 47 | | | | 39 | | | | 43 | |
Total (MBOE/d) | | | 680 | | | | 643 | | | | 604 | | | | 563 | | | | 577 | |
Proved Reserves: | | | | | | | | | | | | | | | | | | | | |
Natural-Gas Reserves (Tcf) | | | 8.4 | | | | 8.1 | | | | 7.8 | | | | 8.1 | | | | 8.5 | |
Oil and Condensate Reserves (MMBbls) | | | 771 | | | | 749 | | | | 733 | | | | 709 | | | | 843 | |
Natural-Gas Liquids Reserves (MMBbls) | | | 374 | | | | 320 | | | | 277 | | | | 217 | | | | 171 | |
Total Proved Reserves (MMBOE) | | | 2,539 | | | | 2,422 | | | | 2,304 | | | | 2,277 | | | | 2,431 | |
Number of Employees | | | 4,800 | | | | 4,400 | | | | 4,300 | | | | 4,300 | | | | 4,000 | |
|
| | | | | | | | | | | | | | | | | | | |
| | Summary Financial Information (1) |
| millions except per-share amounts | 2014 | | 2013 | | 2012 | | 2011 | | 2010 |
| Sales Revenues | $ | 16,375 |
| | $ | 14,867 |
| | $ | 13,307 |
| | $ | 13,882 |
| | $ | 10,842 |
|
| Gains (Losses) on Divestitures and Other, net | 2,095 |
| | (286 | ) | | 104 |
| | 85 |
| | 142 |
|
| Total Revenues and Other | 18,470 |
| | 14,581 |
| | 13,411 |
| | 13,967 |
| | 10,984 |
|
| Algeria Exceptional Profits Tax Settlement | — |
| | 33 |
| | (1,797 | ) | | — |
| | — |
|
| Deepwater Horizon Settlement and Related Costs | 97 |
| | 15 |
| | 18 |
| | 3,930 |
| | 15 |
|
| Operating Income (Loss) | 5,403 |
| | 3,333 |
| | 3,727 |
| | (1,870 | ) | | 1,769 |
|
| Tronox-related Contingent Loss | 4,360 |
| | 850 |
| | (250 | ) | | 250 |
| | — |
|
| Income (Loss) | (1,563 | ) | | 941 |
| | 2,445 |
| | (2,568 | ) | | 821 |
|
| Net Income (Loss) Attributable to Common Stockholders | (1,750 | ) | | 801 |
| | 2,391 |
| | (2,649 | ) | | 761 |
|
| Per Common Share (amounts attributable to common stockholders) | | | | | | | | | |
| Net Income (Loss)—Basic | $ | (3.47 | ) | | $ | 1.58 |
| | $ | 4.76 |
| | $ | (5.32 | ) | | $ | 1.53 |
|
| Net Income (Loss)—Diluted | $ | (3.47 | ) | | $ | 1.58 |
| | $ | 4.74 |
| | $ | (5.32 | ) | | $ | 1.52 |
|
| Dividends | $ | 0.99 |
| | $ | 0.54 |
| | $ | 0.36 |
| | $ | 0.36 |
| | $ | 0.36 |
|
| Average Number of Common Shares Outstanding—Basic | 506 |
| | 502 |
| | 500 |
| | 498 |
| | 495 |
|
| Average Number of Common Shares Outstanding—Diluted | 506 |
| | 505 |
| | 502 |
| | 498 |
| | 497 |
|
| Cash Provided by Operating Activities | 8,466 |
| | 8,888 |
| | 8,339 |
| | 2,505 |
| | 5,247 |
|
| Capital Expenditures | $ | 9,256 |
| | $ | 8,523 |
| | $ | 7,311 |
| | $ | 6,553 |
| | $ | 5,169 |
|
| Current Portion of Long-term Debt | $ | — |
| | $ | 500 |
| | $ | — |
| | $ | 170 |
| | $ | 291 |
|
| Long-term Debt | 15,092 |
| | 13,065 |
| | 13,269 |
| | 15,060 |
| | 12,722 |
|
| Total Debt | $ | 15,092 |
| | $ | 13,565 |
| | $ | 13,269 |
| | $ | 15,230 |
| | $ | 13,013 |
|
| Total Stockholders’ Equity | 19,725 |
| | 21,857 |
| | 20,629 |
| | 18,105 |
| | 20,684 |
|
| Total Assets | $ | 61,689 |
| | $ | 55,781 |
| | $ | 52,589 |
| | $ | 51,779 |
| | $ | 51,559 |
|
| Annual Sales Volumes | | | | | | | | | |
| Natural Gas (Bcf) | 945 |
| | 968 |
| | 913 |
| | 852 |
| | 829 |
|
| Oil and Condensate (MMBbls) | 106 |
| | 91 |
| | 86 |
| | 79 |
| | 74 |
|
| Natural Gas Liquids (MMBbls) | 44 |
| | 33 |
| | 30 |
| | 27 |
| | 23 |
|
Total (MMBOE)(2) | 308 |
| | 285 |
| | 268 |
| | 248 |
| | 235 |
|
| Average Daily Sales Volumes | | | | | | | | | |
| Natural Gas (MMcf/d) | 2,589 |
| | 2,652 |
| | 2,495 |
| | 2,334 |
| | 2,272 |
|
| Oil and Condensate (MBbls/d) | 292 |
| | 248 |
| | 233 |
| | 217 |
| | 201 |
|
| Natural Gas Liquids (MBbls/d) | 119 |
| | 91 |
| | 83 |
| | 74 |
| | 63 |
|
| Total (MBOE/d) | 843 |
| | 781 |
| | 732 |
| | 680 |
| | 643 |
|
| Proved Reserves | | | | | | | | | |
| Natural-gas Reserves (Tcf) | 8.7 |
| | 9.2 |
| | 8.3 |
| | 8.4 |
| | 8.1 |
|
| Oil and Condensate Reserves (MMBbls) | 929 |
| | 851 |
| | 767 |
| | 771 |
| | 749 |
|
| Natural-gas Liquids Reserves (MMBbls) | 479 |
| | 407 |
| | 405 |
| | 374 |
| | 320 |
|
| Total Proved Reserves (MMBOE) | 2,858 |
| | 2,792 |
| | 2,560 |
| | 2,539 |
| | 2,422 |
|
| Number of Employees | 6,100 |
| | 5,700 |
| | 5,200 |
| | 4,800 |
| | 4,400 |
|
| |
(1) | Consolidated for Anadarko and its subsidiaries. Certain amounts for prior years have been reclassified to conform to the current presentation. |
| |
(2) | Natural gas is converted to equivalent barrels at the rate of 6,000 cubic feet of gas per barrel. |
|
| | |
| Table of Measures | | |
Bcf—Billion cubic feet | | MBbls/d—Thousand barrels per day |
MMBbls—Million barrels | | MBOE/d—Thousand barrels of oil equivalent per day |
MMBOE—Million barrels of oil equivalent | | Tcf—Trillion cubic feet |
MMcf/d—Million cubic feet per day | | |
Item 7. Management’s Discussion and Analysis of Financial Condition and Results of Operations
The following discussion should be read together with theConsolidated Financial Statements and theNotes to Consolidated Financial Statements, which are included in this report in Item 8, and the information set forth inRisk Factors under Item 1A. Unless the context otherwise requires, the terms “Anadarko” and “Company” refer to Anadarko Petroleum Corporation and its consolidated subsidiaries.
Anadarko achievedmet or exceeded its key operational objectives in 2011 by increasing2014. The Company increased sales volumes per day by approximately 6% year-over-year8% over 2013 and adding 392added 502 million barrels of oil equivalent (BOE)(MMBOE) of proved reserves. Additionally, theThe Company continued its offshore exploration and appraisal drilling successended 2014 with an approximate 80% success rate for wells completed in 2011. Anadarko ended 2011 with $2.7$7.4 billion of cash on hand, and $2.1 billion available underfull availability of its five-year $5.0 billion senior secured revolving credit facility maturing in September 2015 ($5.0 billion Facility), as well as additionaland access to credit and capital markets as needed.
In January 2015, the Company paid $5.2 billion after the settlement agreement resolving all claims asserted in the Tronox Adversary Proceeding became effective and replaced the $5.0 billion Facility with two new unsecured credit facilities. The Company paid the settlement using cash on hand and borrowings. Management believes that the Company is positioned
to continue to satisfy its operational objectives and capital commitments with cash on hand, available borrowing capacity, and cash flows from operations.
Anadarko’s mission is to deliver a competitive and sustainable rate of return to shareholders by
exploring for,developing, acquiring, and
developingexploring for oil and natural-gas resources vital to the world’s health and welfare. Anadarko employs the following strategy to achieve this mission:
identify and commercialize resources;
explore in high-potential, proven basins;
basinsidentify and commercialize resources
employ a global business development approach; andapproach
ensure financial discipline and flexibility.
flexibilityDeveloping a portfolio of primarily unconventional resources provides the Company a stable base of capital-efficient, predictable, and repeatable development opportunities which, in turn, positions the Company for consistent growth at competitive rates.
Exploring in high-potential, proven, and emerging basins worldwide provides the Company with growth opportunities. Anadarko’s exploration success has created value by
expanding itsincreasing future resource potential, while providing the flexibility to
managemitigate risk by monetizing discoveries.
Developing a portfolio of primarily unconventional resources provides the Company a stable base of capital-efficient and predictable development opportunities that, in turn, positions the Company for consistent growth at competitive rates.
Anadarko’s global business development approach transfers core skills across the globe to assist in the discovery and development of world-class resources that are accretive to the Company’s performance. These resources help form an optimized global portfolio where both surface and subsurface risks are actively managed.
A strong balance sheet is essential for the development of the Company’s assets, and Anadarko is committed to disciplined
investmentsinvestment in its businesses to
efficiently manage
through commodity price cycles. Maintaining financial discipline enables the Company to capitalize on the
flexibility ofopportunities afforded by its global portfolio, while allowing the Company to pursue new strategic growth opportunities.
Deepwater Horizon SettlementSignificant 2014 operating and IndemnityIn October 2011, the Company and BP Exploration & Production Inc. (BP) entered into a settlement agreement, mutual releases, and agreement to indemnify, relating to the Deepwater Horizon events (Settlement Agreement). Pursuant to the Settlement Agreement, the Company paid $4.0 billion and transferred its interest in the Macondo well and the Mississippi Canyon Block 252 lease (Lease) to BP, and BP accepted this consideration in full satisfaction of its claims against Anadarko for $6.1 billion of invoices issued through the settlement date as well as for potential reimbursements of subsequent costs incurred by BP related to the Deepwater Horizon events, including costs under the Operating Agreement (OA). In addition, BP fully indemnified Anadarko against all claims, causes of action, losses, costs, expenses, liabilities, damages, or judgments of any kind arising out of the Deepwater Horizon events, related damage claims arising under the Oil Pollution Act of 1990 (OPA), claims for natural resource damages (NRD) and associated damage-assessment costs, and any claims arising under the OA. This indemnification is guaranteed by BP Corporation North America Inc. (BPCNA) and, in the event that the net worth of BPCNA declines below an agreed-upon amount, BP p.l.c. has agreed to become the sole guarantor. Under the Settlement Agreement, BP does not indemnify the Company against fines and penalties, punitive damages, shareholder, derivative, or security laws claims, or certain other claims. The Company believes that costs associated with any non-indemnified items, individually or in the aggregate, will not materially impact the Company’s consolidated financial position, results of operations, or cash flows. Refer to Note 2—Deepwater Horizon Eventsin the Notes to Consolidated Financial Statements under Item 8 of this Form 10-K for discussion and analysis of these events.
Operating Highlights
Significant 2011 operating highlightsactivities include the following:
Anadarko’s total-yearfull-year sales volumes were 248 MMBOE, representing a 6% increase over 2010.
Anadarko achieved liquids sales volumes of 106 MMBOE, representing a 10% increase over 2010.
The Company achieved an approximate 80% success rate from offshore exploration and appraisal drilling completed in 2011.
United States Onshore
The Company’s Rocky Mountains Region (Rockies) achieved total-year sales volumes of 303averaged 843 thousand barrels of oil equivalent per day (MBOE/d), representing an 8% increase over 2013.
Anadarko’s liquids sales volumes were 411 thousand barrels per day (MBbls/d), representing a 21% increase over 2013, primarily due to increased sales volumes in the Wattenberg field, the Eagleford shale, and the Delaware basin.
The Company’s overall sales product mix increased to 49% liquids in 2014 compared to 43% in 2013.
Anadarko and Kerr-McGee Corporation and certain of its subsidiaries entered into a settlement agreement resolving all claims asserted in the Tronox Adversary Proceeding resulting in a payment of $5.2 billion, including interest, in January 2015. See Note 17—Contingencies—Tronox Litigation in the Notes to Consolidated Financial Statements under Item 8 of this Form 10-K.
U.S. Onshore
The Rocky Mountains Region (Rockies) full-year sales volumes averaged 361 MBOE/d, representing a 10% increase over 2010.2013, primarily from the Wattenberg field.
The Company’s Southern and Appalachia Region achieved total-yearfull-year sales volumes of 146averaged 298 MBOE/d, representing a 17%16% increase over 2010,2013, primarily due to increased drilling infrom the Marcellus and Eagleford shales, the Delaware basin, and Marcellus shales.
The Company entered into a joint-venture agreement that requires a third-party joint-venture partner to fund up to $1.6 billion of Anadarko’s future capital costs in exchange for a one-third interest in Anadarko’s Eagleford shale assets.
The Company increased its ownership interest in a natural-gas processing plant (Wattenberg Plant), located in northeast Colorado, by acquiring an additional 93% interest for $576 million. The Company operates and owns a 100% interest in the Wattenberg Plant.
East Texas/North Louisiana horizontal development.Western Gas Partners, LP (WES), a consolidated subsidiary of the Company, acquired a natural-gasNuevo Midstream, LLC (Nuevo), which owns and operates gathering and processing plant and related gathering systems (Platte Valley),assets located in northeast Colorado,the Delaware basin in West Texas, for $302 million.
$1.554 billion. Following the acquisition, WES changed the name of Nuevo to Delaware Basin Midstream, LLC (DBM).Anadarko has accumulated over 370,000 gross acresThe Company entered into a carried-interest arrangement that requires a third party to fund $442 million of Anadarko’s capital costs in exchange for a 34% working interest in the prospective liquids-rich areaEaglebine development, located in Southeast Texas.
The Company sold its interest in the Pinedale/Jonah assets in Wyoming for $581 million.
Gulf of Mexico
Gulf of Mexico full-year sales volumes averaged 83 MBOE/d, representing a 14% decrease from 2013, primarily due to natural production declines.
Anadarko’s Lucius development project in the eastern Ohio Utica shale.deepwater Gulf of Mexico was completed with first oil achieved in January 2015.
The Company sold its interest in the nonoperated Vito deepwater development, along with several surrounding exploration blocks in the Gulf of Mexico, for $500 million, recognizing a gain of $237 million.
International
International full-year sales volumes averaged 92 MBOE/d, representing a 2% increase from 2013, primarily due to increased sales volumes at El Merk in Algeria.
Anadarko sold a 10% working interest in Offshore Area 1 in Mozambique for $2.64 billion, recognizing a gain of $1.5 billion.
Anadarko sold its Chinese subsidiary for $1.075 billion, recognizing a gain of $510 million.
The Tweneboa/Enyenra/Ntomme (TEN) project in Ghana was approximately 50% complete and nine development wells had been drilled at year end 2014. First oil is expected in 2016.
The Company’s Gulf of Mexico total-year sales volumes were 131 MBOE/d, representing a 15% decrease from 2010.
FinancialAnadarko and its partners finalized a unitization agreement to develop the Lucius field, which was sanctioned in December 2011. Anadarko will operate the unit and has a 35% working interest in the field.
The Company received drilling permits for one development well and two exploration appraisal wells, including the Cheyenne East well, Anadarko’s first deepwater discovery since the deepwater drilling moratorium.
International
The Company’s International total-year sales volumes were 85 MBOE/d, representing a 20% increase from 2010.
The Company completed drilling five successful exploration wells; three in Ghana and two in Mozambique.
The Company completed drilling seven successful appraisal wells; four in Ghana, two in Mozambique, and one in Brazil.
Financial Highlights
Significant 2011 financial highlights include the following:
Anadarko’s net loss attributable to common stockholders for 2011, including2014 totaled $1.8 billion, which included a $4.360 billion contingent loss related to the effectTronox Adversary Proceeding and $836 million of the $4.0 billion payment made as a resultimpairment expense primarily related to certain U.S. onshore and Gulf of the Settlement Agreement, totaled $2.6 billion compared to net income of $761 million in 2010.
Mexico properties.The Company generated $2.5$8.5 billion of cash flowsflow from operations including the effect of the $4.0 billion payment required by the Settlement Agreement, compared to $5.2 billion in 20102014 and ended the year2014 with $2.7$7.4 billion of cash on hand.
Anadarko increased the quarterly dividend paid to its common stockholders from $0.18 per share to $0.27 per share.
The Company repaid $775 million of Senior Notes that matured in 2014.
Anadarko entered into an agreement with a financial institution$3.0 billion five-year senior unsecured revolving credit facility, which is expandable to provide up to $400 million of letters of$4.0 billion, and a $2.0 billion 364-day senior unsecured revolving credit (LOC Facility) which loweredfacility. These facilities (collectively, the Company’s cost to issue letters of credit.
The Company amended itsNew Credit Facilities) replaced the $5.0 billion Facility upon satisfaction of certain conditions, including the January 2015 settlement payment related to reduce maintenance coststhe Tronox Adversary Proceeding.
Anadarko issued $625 million aggregate principal amount of 3.450% Senior Notes due 2024 and to lower interest rates under the facility by 125 basis points on borrowings and 30 basis points on undrawn amounts.
Anadarko modified and extended swap maturity dates from October 2011 to June 2014 for certain$625 million aggregate principal amount of its interest-rate swaps with an aggregate notional principal of $1.85 billion to better align the swap portfolio with the anticipated timing of future debt issuances.
4.500% Senior Notes due 2044.The Company impairedsold approximately 6 million Western Gas Equity Partners, LP (WGP) common units to the public, raising net proceeds of $335 million.
WES entered into a five-year $1.2 billion, expandable to $1.5 billion, senior unsecured revolving credit facility maturing in February 2019 (RCF), which amended and restated its then-existing $800 million senior unsecured revolving credit facility.
WES completed public offerings of oil$100 million aggregate principal amount of 2.600% Senior Notes due 2018 and gas reporting segment properties and $458$400 million aggregate principal amount of midstream reporting segment properties.5.450% Senior Notes due 2044.
The Company restructured 500,000 MMBtu/dWES issued approximately 10 million common units to the public, raising total net proceeds of natural-gas three-way collar positions into fixed-price commodity swap positions for one million MMBtu/d with an average price of $4.69 per MMBtu.
$691 million.The Company received $419 million in contingent consideration related to its 2008 divestiture of its interest in the Peregrino field offshore Brazil.
Gulf of Mexico Deepwater Drilling UpdateIn July and August 2011, the Bureau of Ocean Energy Management, Regulation and Enforcement, an agency of the Department of the Interior (DOI), issued drilling permits to Anadarko for the Heidelberg appraisal well, the Cheyenne East exploration well near the Independence Hub facility, and a development well in the Nansen field. Anadarko received a drilling permit for the Spartacus prospect in 2012 and is awaiting additional DOI approvals for other exploration plans and drilling permits. SeeNote 16—Contingencies—Deepwater Drilling Moratorium and Other Related Mattersin the Notes to Consolidated Financial Statements under Item 8 of this Form 10-K for additional information on the moratorium.
The following discussion pertains to Anadarko’s results of operations, financial condition, and changes in financial condition. Any increases or decreases “for the year ended December 31, 2011”2014,” refer to the comparison of the year ended December 31, 2011,2014, to the year ended December 31, 2010.2013. Similarly, any increases or decreases “for the year ended December 31, 2010”2013,” refer to the comparison of the year ended December 31, 2010,2013, to the year ended December 31, 2009.2012. The primary factors that affect the Company’s results of operations include commodity prices for natural gas, crude oil, and natural gas liquids (NGLs); sales volumes; the Company’s ability to discover additional oil and natural-gas reserves; the cost of finding such reserves; and operating costs.
RESULTS OF OPERATIONS
Selected Data
| | | | | | | | | | | | |
| millions except per-share amounts and percentages | | 2011 | | | 2010 | | | 2009 | |
Financial Results | | | | | | | | | | | | |
Oil and condensate, natural-gas, and NGLs sales | | $ | 12,834 | | | $ | 10,009 | | | $ | 7,482 | |
Gathering, processing, and marketing sales | | | 1,048 | | | | 833 | | | | 728 | |
Gains (losses) on divestitures and other, net | | | 85 | | | | 142 | | | | 133 | |
Reversal of accrual for DWRRA dispute | | | — | | | | — | | | | 657 | |
| | | | | | | | | | | | |
Total revenues and other | | | 13,967 | | | | 10,984 | | | | 9,000 | |
Costs and expenses(1) | | | 15,837 | | | | 9,215 | | | | 8,623 | |
Other (income) expense | | | 254 | | | | 128 | | | | 485 | |
Income tax expense (benefit) | | | (856 | ) | | | 820 | | | | (5 | ) |
Net income (loss) attributable to common stockholders | | $ | (2,649 | ) | | $ | 761 | | | $ | (135 | ) |
Net income (loss) per common share attributable to common stockholders—diluted | | $ | (5.32 | ) | | $ | 1.52 | | | $ | (0.28 | ) |
Average number of common shares outstanding—diluted | | | 498 | | | | 497 | | | | 480 | |
| | | | | | | | | | | | |
Operating Results | | | | | | | | | | | | |
Adjusted EBITDAX(2) | | $ | 8,560 | | | $ | 7,241 | | | $ | 6,033 | |
Total proved reserves (MMBOE) | | | 2,539 | | | | 2,422 | | | | 2,304 | |
Annual sales volumes (MMBOE) | | | 248 | | | | 235 | | | | 220 | |
| | | | | | | | | | | | |
Capital Resources and Liquidity | | | | | | | | | | | | |
Cash provided by operating activities | | $ | 2,505 | | | $ | 5,247 | | | $ | 3,926 | |
Capital expenditures | | | 6,553 | | | | 5,169 | | | | 4,558 | |
Total debt | | | 15,230 | | | | 13,013 | | | | 12,748 | |
Stockholders’ equity | | $ | 18,105 | | | $ | 20,684 | | | $ | 19,928 | |
Debt to total capitalization ratio | | | 45.7% | | | | 38.6% | | | | 39.0% | |
MMBOE—millions of barrels of oil equivalent
|
| | | | | | | | | | | |
| millions except per-share amounts and percentages | 2014 | | 2013 | | 2012 |
| Financial Results | | | | | |
| Natural-gas, oil and condensate, and NGLs sales | $ | 15,169 |
| | $ | 13,828 |
| | $ | 12,396 |
|
| Gathering, processing, and marketing sales | 1,206 |
| | 1,039 |
| | 911 |
|
| Gains (losses) on divestitures and other, net | 2,095 |
| | (286 | ) | | 104 |
|
| Total revenues and other | 18,470 |
| | 14,581 |
| | 13,411 |
|
Costs and expenses (1) | 13,067 |
| | 11,248 |
| | 9,684 |
|
Other (income) expense (2) | 5,349 |
| | 1,227 |
| | 162 |
|
| Income tax expense (benefit) | 1,617 |
| | 1,165 |
| | 1,120 |
|
| Net income (loss) attributable to common stockholders | $ | (1,750 | ) | | $ | 801 |
| | $ | 2,391 |
|
Net income (loss) per common share attributable to common stockholders—diluted | $ | (3.47 | ) | | $ | 1.58 |
| | $ | 4.74 |
|
| Average number of common shares outstanding—diluted | 506 |
| | 505 |
| | 502 |
|
| | | | | | |
| Operating Results | | | | | |
Adjusted EBITDAX (3) | $ | 12,721 |
| | $ | 9,403 |
| | $ | 8,966 |
|
| Total proved reserves (MMBOE) | 2,858 |
| | 2,792 |
| | 2,560 |
|
| Annual sales volumes (MMBOE) | 308 |
| | 285 |
| | 268 |
|
| | | | | | |
| Capital Resources and Liquidity | | | | | |
| Cash provided by operating activities | $ | 8,466 |
| | $ | 8,888 |
| | $ | 8,339 |
|
| Capital expenditures | 9,256 |
| | 8,523 |
| | 7,311 |
|
| Total debt | 15,092 |
| | 13,565 |
| | 13,269 |
|
| Total equity | $ | 22,318 |
| | $ | 23,650 |
| | $ | 21,882 |
|
| Debt to total capitalization ratio | 40.3 | % | | 36.5 | % | | 37.7 | % |
_______________________________________________________________________________
| |
(1) | Includes Deepwater Horizon settlement anda credit of $1.8 billion in 2012 for previously recognized expenses related coststo the favorable resolution of $3.9 billion and $15 million in 2011 and 2010, respectively. the Algeria exceptional profits tax dispute. |
| |
(2) | Includes Tronox-related contingent loss of $4.360 billion in 2014, $850 million in 2013, and reversal of the 2011 Tronox-related contingent loss $(250) million in 2012. |
| |
(3) | SeeOperating Results—Segment Analysis—Adjusted EBITDAX for a description of Adjusted EBITDAX, which is not a U.S. Generally Accepted Accounting Principles (GAAP) measure, and for a reconciliation of Adjusted EBITDAX to income (loss) before income taxes, which is the most directly comparable financial measure presented in accordance with GAAP. |
FINANCIAL RESULTS
Net Income (Loss) Attributable to Common Stockholders
|
| | | | | | | | | | | | | | | |
| millions | Natural Gas | | Oil and Condensate | | NGLs | | Total |
| 2013 sales revenues | $ | 3,388 |
| | $ | 9,178 |
| | $ | 1,262 |
| | $ | 13,828 |
|
| Changes associated with prices | 540 |
| | (1,046 | ) | | (86 | ) | | (592 | ) |
| Changes associated with sales volumes | (79 | ) | | 1,616 |
| | 396 |
| | 1,933 |
|
| 2014 sales revenues | $ | 3,849 |
| | $ | 9,748 |
| | $ | 1,572 |
| | $ | 15,169 |
|
| Increase/(Decrease) vs. 2013 | 14 | % | | 6 | % | | 25 | % | | 10 | % |
| | | | | | | | |
| 2012 sales revenues | $ | 2,444 |
| | $ | 8,728 |
| | $ | 1,224 |
| | $ | 12,396 |
|
| Changes associated with prices | 798 |
| | (85 | ) | | (82 | ) | | 631 |
|
| Changes associated with sales volumes | 146 |
| | 535 |
| | 120 |
| | 801 |
|
| 2013 sales revenues | $ | 3,388 |
| | $ | 9,178 |
| | $ | 1,262 |
| | $ | 13,828 |
|
| Increase/(Decrease) vs. 2012 | 39 | % | | 5 | % | | 3 | % | | 12 | % |
Anadarko’s
net loss attributable to common stockholders for 2011 totaled $2.6 billion, or $5.32 per share (diluted), compared to net income attributable to common stockholders for 2010 of $761 million, or $1.52 per share (diluted). Anadarko’s net loss attributable to common stockholders in 2009 was $135 million, or $0.28 per share (diluted). Anadarko’s net loss for 2011 included the effect of the $4.0 billion Settlement Agreement with BP related to the Deepwater Horizon events.Sales Revenues and Volumes
| | | | | | | | | | | | | | | | | | | | | | | | | |
| millions except percentages | | 2011 | | Inc/(Dec)
vs. 2010 | | 2010 | | Inc/(Dec)
vs. 2009 | | 2009 |
Sales Revenues | | | | | | | | | | | | | | | | | | | | | | | | | |
Natural-gas sales | | | $ | 3,300 | | | | | (4 | )% | | | $ | 3,420 | | | | | 17 | % | | | $ | 2,924 | |
Oil and condensate sales | | | | 8,072 | | | | | 44 | | | | | 5,592 | | | | | 39 | | | | | 4,022 | |
Natural-gas liquids sales | | | | 1,462 | | | | | 47 | | | | | 997 | | | | | 86 | | | | | 536 | |
| | | | | | | | | | | | | | | | | | | | | | | | | |
Total | | | $ | 12,834 | | | | | 28 | | | | $ | 10,009 | | | | | 34 | | | | $ | 7,482 | |
| | | | | | | | | | | | | | | | | | | | | | | | | |
Anadarko’s total sales revenues increased for the year ended December 31, 2011, increased2014, primarily due to higher prices for crude oil and NGLs as well as increased liquidssales volumes and higher average natural-gas prices, partially offset by lower average oil and NGLs prices and slightly lower natural-gas prices.sales volumes. Total sales revenues increased for the year ended December 31, 2010, increased2013, primarily due to higher commoditysales volumes for all products and higher average natural-gas prices, partially offset by lower average oil and increased sales volumes.
| | | 000000 | | | | 000000 | | | | 000000 | | | | 000000 | |
| millions | | Natural
Gas | | | Oil and
Condensate | | | NGLs | | | Total | |
2009 sales revenues | | $ | 2,924 | | | $ | 4,022 | | | $ | 536 | | | $ | 7,482 | |
Changes associated with prices | | | 424 | | | | 1,284 | | | | 269 | | | | 1,977 | |
Changes associated with sales volumes | | | 72 | | | | 286 | | | | 192 | | | | 550 | |
| | | | | | | | | | | | | | | | |
2010 sales revenues | | $ | 3,420 | | | $ | 5,592 | | | $ | 997 | | | $ | 10,009 | |
Changes associated with prices | | | (214 | ) | | | 2,055 | | | | 295 | | | | 2,136 | |
Changes associated with sales volumes | | | 94 | | | | 425 | | | | 170 | | | | 689 | |
| | | | | | | | | | | | | | | | |
2011 sales revenues | | $ | 3,300 | | | $ | 8,072 | | | $ | 1,462 | | | $ | 12,834 | |
| | | | | | | | | | | | | | | | |
NGLs prices.
The following table provides Anadarko’s sales volumes for the years ended December 31, 2011, 2010,2014, 2013, and 2009. | | | | | | | | | | | | | | | | | | | | | | | | | |
| Sales Volumes | | 2011 | | Inc/(Dec)
vs. 2010 | | 2010 | | Inc/(Dec)
vs. 2009 | | 2009 |
Barrels of Oil Equivalent
(MMBOE except percentages) | | | | | | | | | | | | | | | | | | | | | | | | | |
United States | | | | 217 | | | | | 4 | % | | | | 209 | | | | | 7 | % | | | | 196 | |
International | | | | 31 | | | | | 20 | | | | | 26 | | | | | 7 | | | | | 24 | |
| | | | | | | | | | | | | | | | | | | | | | | | | |
Total | | | | 248 | | | | | 6 | | | | | 235 | | | | | 7 | | | | | 220 | |
| | | | | | | | | | | | | | | | | | | | | | | | | |
| | | | | |
Barrels of Oil Equivalent per Day
(MBOE/d except percentages) | | | | | | | | | | | | | | | | | | | | | | | | | |
United States | | | | 595 | | | | | 4 | % | | | | 572 | | | | | 7 | % | | | | 537 | |
International | | | | 85 | | | | | 20 | | | | | 71 | | | | | 7 | | | | | 67 | |
| | | | | | | | | | | | | | | | | | | | | | | | | |
Total | | | | 680 | | | | | 6 | | | | | 643 | | | | | 7 | | | | | 604 | |
| | | | | | | | | | | | | | | | | | | | | | | | | |
|
| | | | | | | | | | | | | | |
| | 2014 | | Inc/(Dec)
vs. 2013 | | 2013 | | Inc/(Dec)
vs. 2012 | | 2012 |
| Barrels of Oil Equivalent | | | | | | | | | |
| (MMBOE except percentages) | | | | | | | | | |
| United States | 275 |
| | 9 | % | | 252 |
| | 6 | % | | 237 |
|
| International | 33 |
| | 2 |
| | 33 |
| | 7 |
| | 31 |
|
| Total barrels of oil equivalent | 308 |
| | 8 |
| | 285 |
| | 6 |
| | 268 |
|
| Barrels of Oil Equivalent per Day | | | | | | | | | |
| (MBOE/d except percentages) | | | | | | | | | |
| United States | 751 |
| | 9 | % | | 691 |
| | 7 | % | | 648 |
|
| International | 92 |
| | 2 |
| | 90 |
| | 7 |
| | 84 |
|
| Total barrels of oil equivalent per day | 843 |
| | 8 |
| | 781 |
| | 7 |
| | 732 |
|
Sales volumes represent actual production volumes adjusted for changes in commodity inventories.inventories and natural-gas production volumes provided to a certain government entity to satisfy a commitment established in conjunction with the development plan. Anadarko employs marketing strategies to minimize market-related shut-ins, maximize realized prices, and manage credit-risk exposure. For additional information, seeNote 10—11—Derivative Instrumentsin theNotes to Consolidated Financial Statementsunder Item 8 of this Form 10-K and Other (Income) Expense—(Gains) Losses on Commodity Derivatives, net.net. Production of natural gas, crude oil, and NGLs is usually not affected by seasonal swings in demand.
Natural-Gas Sales Volumes, Average Prices, and Revenues
| | | | | | | | | | | | | | | | | | | | | | | | | |
| | | 2011 | | Inc/(Dec)
vs. 2010 | | 2010 | | Inc/(Dec)
vs. 2009 | | 2009 |
United States | | | | | | | | | | | | | | | | | | | | | | | | | |
Sales volumes—Bcf | | | | 852 | | | | | 3 | % | | | | 829 | | | | | 2 | % | | | | 809 | |
MMcf/d | | | | 2,334 | | | | | 3 | | | | | 2,272 | | | | | 2 | | | | | 2,217 | |
Price per Mcf | | | $ | 3.87 | | | | | (6 | ) | | | $ | 4.12 | | | | | 14 | | | | $ | 3.61 | |
Natural-gas sales revenues (millions) | | | $ | 3,300 | | | | | (4 | ) | | | $ | 3,420 | | | | | 17 | | | | $ | 2,924 | |
|
| | | | | | | | | | | | | | | | | |
| | 2014 | | Inc/(Dec)
vs. 2013 | | 2013 | | Inc/(Dec)
vs. 2012 | | 2012 |
| United States | | | | | | | | | |
| Sales volumes—Bcf | 945 |
| | (2 | )% | | 968 |
| | 6 | % | | 913 |
|
| MMcf/d | 2,589 |
| | (2 | ) | | 2,652 |
| | 6 |
| | 2,495 |
|
| Price per Mcf | $ | 4.07 |
| | 16 |
| | $ | 3.50 |
| | 31 |
| | $ | 2.68 |
|
| Natural-gas sales revenues (millions) | $ | 3,849 |
| | 14 |
| | $ | 3,388 |
| | 39 |
| | $ | 2,444 |
|
_______________________________________________________________________________
MMcf/d—million cubic feet per day
Mcf—thousand cubic feet
Natural-Gas Sales Volumes
2014 vs. 2013 The Company’s natural-gas sales volumes decreased by 63 MMcf/d.
Sales volumes decreased by 90 MMcf/d in the Rockies primarily due to the sale of the Company’s Pinedale/Jonah assets in January 2014 and natural production declines in the Powder River basin and Greater Natural Buttes. These decreases were partially offset by higher sales volumes in the Wattenberg field due to increased horizontal drilling.
Sales volumes decreased by 67 MMcf/d in the Gulf of Mexico primarily due to natural production declines.
Sales volumes for the Southern and Appalachia Region increased by 94 MMcf/d primarily due to infrastructure expansions that allowed the Company to bring wells online in the Marcellus and Eagleford shales, as well as continued horizontal drilling in the liquids-rich East Texas/North Louisiana horizontal development.
2013 vs. 2012 The Company’s natural-gas sales volumes increased 62by 157 MMcf/d for the year ended December 31, 2011, primarily due tod.
Sales volumes increased sales volumes in the Rockies of 84by 246 MMcf/d resulting from increased drilling in the Greater Natural Buttes area and the Wattenberg field, as well as increased sales volumes in the Southern and Appalachia Region of 66 MMcf/d, primarily relateddue to increasedhorizontal drilling and infrastructure expansions in the Eagleford and Marcellus shale. These increases were partially offsetshales, as well as new wells drilled in the liquids-rich East Texas/North Louisiana horizontal development.
Sales volumes decreased by lower sales volumes47 MMcf/d in the Gulf of Mexico of 86primarily due to natural production declines.
Sales volumes for the Rockies decreased by 42 MMcf/d primarily due to
2010 price-related royalty relief, which did not apply for 2011, as well asa natural production
declines.The Company’s natural-gas sales volumes increased 55 MMcf/d fordecline in the year ended December 31, 2010, primarily due to increasedPowder River basin, partially offset by higher sales volumes in the Rockies of 61 MMcf/d, resulting from increased drilling in Greater Natural Buttes and the Greater Green River basins, as well as increased sales volumes in the Southern and Appalachia Region of 12 MMcf/d, associated with increased drilling in the Eagleford, Haynesville and Marcellus shales. These increases were partially offset by lower sales volumes in the Gulf of Mexico of 18 MMcf/dWattenberg field due to natural production declines.
increased horizontal drilling.
Natural-Gas Prices
2014 vs. 2013 The average natural-gas price Anadarko received decreased for the year ended December 31, 2011,increased primarily due to low industry natural-gas storage levels as a result of colder than average winter temperatures and the industry’s supply growing at a faster pace thanassociated high residential heating demand in 2011. early 2014. In addition, natural-gas prices increased as a result of higher industrial natural-gas demand, reduced natural-gas imports from Canada, and continued strength in exports to Mexico.
2013 vs. 2012 Anadarko’s average natural-gas price received increased foras higher-than-normal residential and commercial demand early in 2013 reduced overall industry natural-gas storage below the year ended December 31, 2010, primarily dueprevious year’s record levels. Natural-gas prices were further supported by higher demand in the fourth quarter of 2013, a reduction in natural-gas imports from Canada, and continued strength in exports to an increase in demand.Crude-OilMexico.
Oil and Condensate Sales Volumes, Average Prices, and Revenues
| | | | | | | | | | | | | | | | | | | | | | | | | |
| | | 2011 | | Inc/(Dec)
vs. 2010 | | 2010 | | Inc/(Dec)
vs. 2009 | | 2009 |
United States | | | | | | | | | | | | | | | | | | | | | | | | | |
Sales volumes—MMBbls | | | | 48 | | | | | 1 | % | | | | 48 | | | | | 7 | % | | | | 44 | |
MBbls/d | | | | 132 | | | | | 1 | | | | | 130 | | | | | 7 | | | | | 120 | |
Price per barrel | | | $ | 97.70 | | | | | 30 | | | | $ | 74.96 | | | | | 28 | | | | $ | 58.56 | |
| | | | | |
International | | | | | | | | | | | | | | | | | | | | | | | | | |
Sales volumes—MMBbls | | | | 31 | | | | | 20 | % | | | | 26 | | | | | 7 | % | | | | 24 | |
MBbls/d | | | | 85 | | | | | 20 | | | | | 71 | | | | | 7 | | | | | 67 | |
Price per barrel | | | $ | 109.20 | | | | | 39 | | | | $ | 78.52 | | | | | 33 | | | | $ | 59.01 | |
| | | | | |
Total | | | | | | | | | | | | | | | | | | | | | | | | | |
Sales volumes—MMBbls | | | | 79 | | | | | 8 | % | | | | 74 | | | | | 7 | % | | | | 68 | |
MBbls/d | | | | 217 | | | | | 8 | | | | | 201 | | | | | 7 | | | | | 187 | |
Total price per barrel | | | $ | 102.24 | | | | | 34 | | | | $ | 76.22 | | | | | 30 | | | | $ | 58.72 | |
Oil and condensate sales revenues (millions) | | | $ | 8,072 | | | | | 44 | | | | $ | 5,592 | | | | | 39 | | | | $ | 4,022 | |
|
| | | | | | | | | | | | | | | | | |
| | 2014 | | Inc/(Dec)
vs. 2013 | | 2013 | | Inc/(Dec)
vs. 2012 | | 2012 |
| United States | | | | | | | | | |
| Sales volumes—MMBbls | 74 |
| | 28 | % | | 58 |
| | 6 | % | | 55 |
|
| MBbls/d | 203 |
| | 28 |
| | 158 |
| | 6 |
| | 149 |
|
| Price per barrel | $ | 87.99 |
| | (9 | ) | | $ | 97.02 |
| | — |
| | $ | 97.46 |
|
| International | | | | | | | | | |
| Sales volumes—MMBbls | 32 |
| | (1 | )% | | 33 |
| | 7 | % | | 31 |
|
| MBbls/d | 89 |
| | (1 | ) | | 90 |
| | 7 |
| | 84 |
|
| Price per barrel | $ | 99.79 |
| | (9 | ) | | $ | 109.15 |
| | (2 | ) | | $ | 111.11 |
|
| Total | | | | | | | | | |
| Sales volumes—MMBbls | 106 |
| | 18 | % | | 91 |
| | 6 | % | | 86 |
|
| MBbls/d | 292 |
| | 18 |
| | 248 |
| | 6 |
| | 233 |
|
| Price per barrel | $ | 91.58 |
| | (10 | ) | | $ | 101.41 |
| | (1 | ) | | $ | 102.35 |
|
| Oil and condensate sales revenues (millions) | $ | 9,748 |
| | 6 |
| | $ | 9,178 |
| | 5 |
| | $ | 8,728 |
|
_______________________________________________________________________________
MMBbls—million barrels
MBbls/d—thousand barrels per day
Oil and Condensate Sales Volumes
2014 vs. 2013 Anadarko’s crude-oiloil and condensate sales volumes increased 16by 44 MBbls/d.
Sales volumes for the Rockies increased by 33 MBbls/d for the year ended December 31, 2011. This increase primarily resulted from an additional 15 MBbls/d in Ghana, where the Company’s first lifting occurred in the first quarter of 2011. Increased drilling in the Wattenberg field leddue to a 5increased horizontal drilling.
Sales volumes for the Southern and Appalachia Region increased by 15 MBbls/d, sales-volume improvement in the Rockies. Additionally,primarily as a result of increased activityhorizontal drilling and 2013 infrastructure expansion in the Eagleford shale and Bone Spring formation increased horizontal drilling in the Delaware basin.
International sales volumes from those areasdecreased by approximately 170%, contributing to an 81 MBbls/d sales-volume increaseprimarily due to lower sales volumes in China as a result of maintenance downtime and the Southernsale of the Company’s Chinese subsidiary and Appalachian Region. Partially offsetting these increases was a 9 MBbls/d sales-volume declinethe timing of liftings in Ghana, partially offset by higher sales volumes in Algeria from additional facilities and wells brought online at El Merk.
Sales volumes in the Gulf of Mexico
principally causeddecreased by
downtime for repairs at the Company’s Constitution spar and a third-party oil pipeline in 2011, as well as1 MBbls/d primarily due to natural production declines.
2013 vs. 2012 Anadarko’s crude-oiloil and condensate sales volumes increased 14by 15 MBbls/d.
Sales volumes for the Rockies increased by 15 MBbls/d primarily in the Wattenberg field due to increased horizontal drilling.
Sales volumes for the year ended December 31, 2010. This increase was partiallySouthern and Appalachia Region increased by 6 MBbls/d, as a result of horizontal drilling and infrastructure expansions in the Eagleford shale.
International sales volumes increased by 6 MBbls/d primarily in Ghana as a result of enhanced production due to higher salessuccessful acid stimulations and additional Phase 1A Jubilee wells brought online, as well as timing of cargo liftings.
Sales volumes of 5 MBbls/d in the Gulf of Mexico as repairs to third-party downstream infrastructure that was damaged in the 2008 hurricane season was completed during the third quarter of 2009. In addition, crude-oil sales volumes increased 4decreased by 10 MBbls/d in the Southern and Appalachia Regionprimarily due to a shift in focus from drilling in dry-gas areas to drilling in liquids-rich areasnatural production declines.
Oil and 3 MBbls/d in the Rockies due to realizing a full year of operations from anCondensate Prices
2014 vs. 2013 Anadarko’s average oil pipeline that was placed in service in mid-2009, as well as a shift in focus to liquids-rich areas. Also, Algerian crude-oil sales volumes increased 3 MBbls/d due to the timing of cargo liftings.The average crude-oil price Anadarko received increased for the year ended December 31, 2011,decreased as a result of increaseda global oversupply and reduced oil demand as well as supply disruptions and unrestresulting from continued economic weakness particularly in the Middle East and North Africa. The average crude-oil price realized by the Company was enhanced by the widening differential between West Texas Intermediate and Brent crude, as approximately 70% of Anadarko’s 2011 crude-oil sales volumes were based on prices that are either directly indexed to, or highly correlated to, Brent crude. late 2014.
2013 vs. 2012 Anadarko’s average crude-oiloil price increased for the year ended December 31, 2010, primarilyreceived decreased due to increased global demand.slightly lower international oil prices in 2013.
Natural-Gas Liquids Sales Volumes, Average Prices, and Revenues
|
| | | | | | | | | | | | | | | | | |
| | 2014 | | Inc/(Dec)
vs. 2013 | | 2013 | | Inc/(Dec)
vs. 2012 | | 2012 |
| United States | | �� | | | | | | | |
| Sales volumes—MMBbls | 43 |
| | 28 | % | | 33 |
| | 10 | % | | 30 |
|
| MBbls/d | 116 |
| | 28 |
| | 91 |
| | 10 |
| | 83 |
|
| Price per barrel | $ | 35.48 |
| | (7 | ) | | $ | 37.97 |
| | (6 | ) | | $ | 40.44 |
|
| International | | | | | | | | | |
| Sales volumes—MMBbls | 1 |
| | NM |
| | — |
| | NM |
| | — |
|
| MBbls/d | 3 |
| | NM |
| | — |
| | NM |
| | — |
|
| Price per barrel | $ | 56.16 |
| | NM |
| | $ | — |
| | NM |
| | $ | — |
|
| Total | | | | | | | | | |
| Sales volumes—MMBbls | 44 |
| | 31 | % | | 33 |
| | 10 | % | | 30 |
|
| MBbls/d | 119 |
| | 31 |
| | 91 |
| | 10 |
| | 83 |
|
| Price per barrel | $ | 36.01 |
| | (5 | ) | | $ | 37.97 |
| | (6 | ) | | $ | 40.44 |
|
| Natural-gas liquids sales revenues (millions) | $ | 1,572 |
| | 25 |
| | $ | 1,262 |
| | 3 |
| | $ | 1,224 |
|
| | | | | | | | | | | | | | | | | | | | | | | | | |
| | | 2011 | | Inc/(Dec)
vs. 2010 | | 2010 | | Inc/(Dec)
vs. 2009 | | 2009 |
United States | | | | | | | | | | | | | | | | | | | | | | | | | |
Sales volumes—MMBbls | | | | 27 | | | | | 17 | % | | | | 23 | | | | | 36 | % | | | | 17 | |
MBbls/d | | | | 74 | | | | | 17 | | | | | 63 | | | | | 36 | | | | | 47 | |
Price per barrel | | | $ | 53.95 | | | | | 25 | | | | $ | 43.07 | | | | | 37 | | | | $ | 31.42 | |
Natural-gas liquids sales revenues (millions) | | | $ | 1,462 | | | | | 47 | | | | $ | 997 | | | | | 86 | | | | $ | 536 | |
NM—not meaningful
NGLs Sales Volumes
NGLs sales represent revenues from the sale of products derived from the processing of Anadarko’s natural-gas production.
2014 vs. 2013 The Company’s NGLs sales volumes increased by 1128 MBbls/d.
Sales volumes in the Rockies increased by 16 MBbls/d primarily in the Wattenberg field due to increased horizontal drilling and the Lancaster plant coming online in April 2014.
Sales volumes for the year ended December 31, 2011,Southern and Appalachia Region increased by 10 MBbls/d primarily as a result of increased horizontal drilling and 2013 infrastructure expansion in the Eagleford shale.
International sales volumes increased by 3 MBbls/d due to the commencement of NGLs sales in 2014 from the Company’s
increased focus on liquids-rich areas, expanded horizontal drilling programsEl Merk facility in
the Wattenberg field, and increases related to the Wattenberg Plant acquisition.Algeria.
2013 vs. 2012 Anadarko’s NGLs sales volumes increased 168 MBbls/d.
Sales volumes for the Southern and Appalachia Region increased by 12 MBbls/d foras a result of increased horizontal drilling and infrastructure expansion in the year ended December 31, 2010. The increasedEagleford shale and horizontal drilling in the liquids-rich East Texas/North Louisiana horizontal development.
Sales volumes primarily related to operations in the Rockies where an additional natural-gas processing train was brought online latedecreased by 2 MBbls/d primarily due to ethane rejection in 2013.
Sales volumes in the
second quarterGulf of
2009. Additionally, improved recoveries in the Rockies resulted from new processing agreements entered into late in 2009.TheMexico decreased by 2 MBbls/d due to natural production declines.
NGLs Sales Prices
2014 vs. 2013 Anadarko’s average NGLs price received decreased primarily due to lower prices for butanes and natural gasoline resulting from higher industry production levels and related declines in oil prices.
2013 vs. 2012 Anadarko’s average NGLs price received decreased primarily due to lower prices for ethane and butanes as a result of higher U.S. inventory and production levels.
Gathering, Processing, and Marketing Margin
|
| | | | | | | | | | | | | | | | | |
| millions except percentages | 2014 |
| Inc/(Dec)
vs. 2013 |
| 2013 |
| Inc/(Dec)
vs. 2012 |
| 2012 |
| Gathering, processing, and marketing sales | $ | 1,206 |
|
| 16 | % |
| $ | 1,039 |
|
| 14 | % |
| $ | 911 |
|
| Gathering, processing, and marketing expense | 1,030 |
|
| 19 |
|
| 869 |
|
| 14 |
|
| 763 |
|
| Total gathering, processing, and marketing, net | $ | 176 |
|
| 4 |
|
| $ | 170 |
|
| 15 |
|
| $ | 148 |
|
Gathering and processing sales includes revenue from the sale of NGLs and remaining residue gas extracted from natural gas purchased from third parties and processed by Anadarko, as well as fee revenue earned by providing gathering, processing, compression, and treating services to third parties. Marketing sales include the margin earned from purchasing and selling third-party oil and natural gas. Gathering, processing, and marketing expense includes the cost of third-party natural gas purchased and processed by Anadarko, as well as other operating and transportation expenses related to the Company’s costs to perform gathering, processing, and marketing activities.
2014 vs. 2013 Gathering, processing, and marketing, net increased for the years ended December 31, 2011 and 2010,by $6 million primarily due to higher crude-oilgathering and processing revenue associated with higher volumes, increased natural-gas prices, and sustained global petrochemical demand.Gathering, Processing,increased infrastructure, partially offset by higher processing and Marketing Margin
| | | | | | | | | | | | | | | | | | | | | | | | | |
| millions except percentages | | 2011 | | Inc/(Dec)
vs. 2010 | | 2010 | | Inc/(Dec)
vs. 2009 | | 2009 |
Gathering, processing, and marketing sales | | | $ | 1,048 | | | | | 26 | % | | | $ | 833 | | | | | 14 | % | | | $ | 728 | |
Gathering, processing, and marketing expenses | | | | 791 | | | | | 29 | | | | | 615 | | | | | — | | | | | 617 | |
| | | | | | | | | | | | | | | | | | | | | | | | | |
Margin | | | $ | 257 | | | | | 18 | | | | $ | 218 | | | | | 96 | | | | $ | 111 | |
| | | | | | | | | | | | | | | | | | | | | | | | | |
Fortransportation expenses due to the year ended December 31, 2011, the gathering,increased volumes.
2013 vs. 2012 Gathering, processing, and marketing, marginnet increased $39 million. This increase was primarily due to increased natural-gas processing margins from higher NGLs prices and volumes, lower prices for natural-gas purchases, and favorable impacts attributable to 2011 asset acquisitions. These increases were partially offset by lower margins associated with natural-gas sales from inventory.For the year ended December 31, 2010, the gathering, processing, and marketing margin increased $107 million. The increase was$22 million primarily due to higher margins associated with natural-gas sales from inventory andgathering revenue as a result of increased NGLs volumes and prices. These increases werehigher marketing margins, partially offset by the absenceincreased transportation expenses due to increased third-party volumes and increased demand fees.
Gains (Losses) on Divestitures and Other, net
|
| | | | | | | | | | | | | | | | | |
| millions except percentages | 2014 | | Inc/(Dec)
vs. 2013 | | 2013 | | Inc/(Dec)
vs. 2012 | | 2012 |
| Gains (losses) on divestitures | $ | 1,891 |
| | NM |
| | $ | (470 | ) | | NM |
| | $ | (71 | ) |
| Other | 204 |
| | 11 | % | | 184 |
| | 5 | % | | 175 |
|
| Total gains (losses) on divestitures and other, net | $ | 2,095 |
| | NM |
| | $ | (286 | ) | | NM |
| | $ | 104 |
|
Gains (losses) on divestitures and other, net includes gains (losses) on divestitures and other operating revenues including minerals sales, earnings from equity investments, and other revenues.
2014
The Company recognized a gain of $1.5 billion related to its divestiture of a 10% working interest in 2011 includedOffshore Area 1 in Mozambique for sales proceeds of $2.64 billion.
The Company recognized a gain of $510 million associated with the divestiture of its Chinese subsidiary for sales proceeds of $1.075 billion.
The Company recognized a gain of $237 million associated with the divestiture of its interest in the nonoperated Vito deepwater development, along with several surrounding exploration blocks in the Gulf of Mexico, for sales proceeds of $500 million.
The Company recognized gains on divestitures of $127 million for certain oil and gas properties in the United States.
During the fourth quarter of 2014, Anadarko considered certain U.S. onshore oil and gas assets to be held for sale and recognized a $456 million loss. At December 31, 2014, these assets were no longer considered held for sale as the volatility in the current commodity-price environment reduced the probability that these assets would be sold within the next year.
2013
The Company recognized losses on assets held for sale of $422$704 million, asprimarily associated with the loss of value of the Pinedale/Jonah assets in Wyoming, which were sold in January 2014 for sale proceeds of $581 million.
The Company began marketing certain onshore domestic propertiesdivested its interest in a soda ash joint venture for sales proceeds of $310 million, recognizing a gain of $140 million, while retaining its royalty interest in soda ash mined by the joint venture from the Company’s Land Grant. Additional consideration may also be received based on future revenue of the joint venture.
The Company recognized gains on divestitures of $94 million for certain oil and gas
exploration and production reporting segment and the midstream reporting segment in order to redirect its operating activities and capital investment to other areas. These assets were impaired to fair value. SeeNote 4—Divestitures and Assets Held for Sale in theNotes to Consolidated Financial Statements under Item 8 of this Form 10-K. Also included is a loss of $76 million related to the effective termination of natural-gas processing contracts between the Company and the previous owner of the Wattenberg Plant that occurred in connection with the Company’s purchase of the plant. The loss represents the aggregate amount by which the Company’s contracts with the previous owner of the Wattenberg Plant were unfavorable as compared to current market transactions for the same or similar services at the date of the Company’s acquisition of the plant. These losseswere partially offset by a gain of $419 million related to the receipt and final settlement of contingent consideration related to the Company’s 2008 divestiture of its interestproperties in the Peregrino field offshore Brazil. GainsUnited States.
2012
The Company recognized losses of $71 million on
divestitures also include the recognition of a $21 million gain from the acquisition-date fair-value remeasurement of the Company’s pre-acquisition 7% equity interest in the Wattenberg Plant.Gains on divestitures in 2010 were $29 million and related primarily to the divestiture of onshore U.S.certain oil and gas properties. Gains on divestitures in 2009 were $44 million,properties, primarily related to the sale of oil and gas properties in Qatar.
Indonesia.
Reversal of AccrualSee Note 2—Acquisitions, Divestitures, and Assets Held for DWRRA DisputeSaleIn January 2006, the DOI issued an order (2006 Order) to Kerr-McGee Oil and Gas Corporation (KMOG), a subsidiary of Kerr-McGee Corporation (Kerr-McGee), to pay oil and gas royalties and accrued interest on KMOG’s deepwater Gulf of Mexico production associated with eight 1996, 1997, and 2000 leases, for which KMOG considered royalties to be suspended under the Deepwater Royalty Relief Act (DWRRA). KMOG successfully appealed the 2006 Order, and the DOI’s petition for a writ of certiorari with the U.S. Supreme Court was denied on October 5, 2009.
In 2009, based on the U.S. Supreme Court’s denial of the DOI’s petition for review by the court, Anadarko reversed its $657 million liability for accrued royalties on leases listed in the 2006 Order, similar orders to pay issued in 2008 and 2009, and other deepwater Gulf of Mexico leases with similar price-threshold provisions. In addition, the Company reversed its $78 million accrued liability for interest on these unpaid royalty amounts. Effective October 1, 2009, the Company ceased accruing liabilities for royalties and interest costs for deepwater Gulf of Mexico leases that have royalties suspended under the DWRRA. For more information on the DWRRA dispute, seeNote 16—Contingencies—Deepwater Royalty Relief Act in theNotes to Consolidated Financial Statements under Item 8 of this Form 10-K.
Costs and Expenses
| | | | | | | | | | | | | | | | | | | | | | | | | |
| millions except percentages | | 2011 | | Inc/(Dec)
vs. 2010 | | 2010 | | Inc/(Dec)
vs. 2009 | | 2009 |
Oil and gas operating | | | $ | 993 | | | | | 20 | % | | | $ | 830 | | | | | (3 | )% | | | $ | 859 | |
Oil and gas transportation and other | | | | 891 | | | | | 9 | | | | | 816 | | | | | 23 | | | | | 664 | |
Exploration | | | | 1,076 | | | | | 10 | | | | | 974 | | | | | (12 | ) | | | | 1,107 | |
For the year ended December 31, 2011, oil and gas operating expenses increased by $163 million primarily due to (i) increased workovers and related freight costs of $47 million primarily in the Gulf of Mexico and the Rockies, (ii) $36 million related to increased joint-venture activity primarily in the Rockies, Bone Spring and Marcellus shale in the Southern and Appalachia Region, and in Alaska, (iii) operating costs of $34 million resulting from the start of production in Ghana, and (iv) higher surface maintenance costs of $10 million primarily in the Rockies. For the year ended December 31, 2010, oil and gas operating expenses decreased primarily due to decreased workover costs of $28 million in the Gulf of Mexico as a result of the moratorium and associated delays in obtaining drilling permits.
For the year ended December 31, 2011, oil and gas transportation and other expenses increased $75 million due to higher volumes, higher natural-gas processing fees that rise with increases in NGLs prices, and increased costs attributable to growth in U.S. onshore plays. These increases were partially offset by the 2010 expensing of amounts attributable to drilling rig lease payments made for rigs that sat idle during the moratorium, as well as rig termination fees incurred in 2010 related to deepwater drilling rigs in the Gulf of Mexico. For the year ended December 31, 2010, oil and gas transportation and other expenses increased due to higher gas gathering and transportation costs of $77 million and $45 million, primarily attributable to increased production in the Rockies and the Southern and Appalachia Region, respectively, and the expensing of $27 million of drilling rig lease payments and $19 million of rig termination fees as discussed above. Partially offsetting this increase in oil and gas transportation and other expenses was $29 million of drilling rig contract termination fees incurred in 2009 as a result of low 2009 commodity prices.
Exploration expense increased $102 million for the year ended December 31, 2011, due to $143 million of higher geological and geophysical expense, primarily associated with increased seismic purchases in the Rockies, Gulf of Mexico, the Marcellus shale, Indonesia, Liberia, and East Africa. These additional expenses were partially offset by $48 million of lower dry hole expense, primarily in the Gulf of Mexico. Exploration expense decreased $133 million for the year ended December 31, 2010, primarily due to a $128 million decline in dry hole expense in the United States, and lower exit costs of $15 million in various international locations, partially offset by higher dry hole expense of $26 million in various other international locations, including Brazil, Ghana, and Mozambique. Exploration expense for 2010 included a $46 million increase related to the Macondo well in the Gulf of Mexico.
| | | | | | | | | | | | | | | | | | | | | | | | | |
| millions except percentages | | 2011 | | Inc/(Dec)
vs. 2010 | | 2010 | | Inc/(Dec)
vs. 2009 | | 2009 |
General and administrative | | | $ | 1,060 | | | | | 10 | % | | | $ | 967 | | | | | (2 | )% | | | $ | 983 | |
Depreciation, depletion, and amortization | | | | 3,830 | | | | | 3 | | | | | 3,714 | | | | | 5 | | | | | 3,532 | |
Other taxes | | | | 1,492 | | | | | 40 | | | | | 1,068 | | | | | 43 | | | | | 746 | |
Impairments | | | | 1,774 | | | | | NM | | | | | 216 | | | | | 88 | | | | | 115 | |
Deepwater Horizon settlement and related costs | | | | 3,930 | | | | | NM | | | | | 15 | | | | | NM | | | | | — | |
NM—not meaningful
For the year ended December 31, 2011, general and administrative (G&A) expense increased by $93 million primarily due to higher employee-related costs of $67 million primarily from operational expansions and changes in pension discount rates; higher legal, consulting, and other expenses of $51 million related to ongoing litigation and other matters; and increased insurance costs of $9 million related to higher industry-specific rates as a result of the Deepwater Horizon events. These increased costs are partially offset by a gain of $46 million from the financial settlement stemming from Tronox’s rejection of the Master Separation Agreement (MSA) discussed inNote 16—Contingencies—Tronox Litigationin the Notes to Consolidated Financial Statements under Item 8 of this Form 10-K. For the year ended December 31, 2010, G&A expense decreased due to lower bonus plan expense of $67 million, offset by higher legal and consulting fees of $41 million primarily due to costs associated with the Tronox bankruptcy, and higher employee-related costs.
For the year ended December 31, 2011, depreciation, depletion, and amortization (DD&A) expense increased by $116 million primarily attributable to higher sales volumes, partially offset by a lower average DD&A rate, largely the result of an $89 million DD&A expense that was taken in 2010 associated with depleted fields in the Gulf of Mexico. For the year ended December 31, 2010, DD&A increased $182 million primarily due to higher sales volumes and $89 million associated with the Gulf of Mexico, as discussed above, partially offset by a lower average DD&A rate attributable to reserve increases in the Marcellus shale and the Eagleford shale.
For the year ended December 31, 2011, other taxes increased by $424 million primarily due to higher crude-oil prices and total sales volumes, resulting in increased Algerian exceptional profits tax of $172 million, increased U.S. production and severance taxes of $152 million, and increased Chinese windfall profits tax of $55 million. Additionally, ad valorem taxes increased by $46 million in 2011 due to higher assessed property values. For the year ended December 31, 2010, other taxes increased $322 million primarily due to higher commodity prices and total sales volumes, resulting in increased Algerian exceptional profits tax of $129 million, increased U.S. production and severance taxes of $118 million, and increased Chinese windfall profits tax of $44 million. In addition, higher assessed property values increased ad valorem taxes by $30 million. Refer toNote 17—Other Taxes in theNotes to Consolidated Financial Statements under Item 8 of this Form 10-K for additional information on the Algerian exceptional profits tax.assets held for sale.
Costs and Expenses
|
| | | | | | | | | | | | | | | | | |
| | 2014 | | Inc/(Dec)
vs. 2013 | | 2013 | | Inc/(Dec)
vs. 2012 | | 2012 |
| Oil and gas operating (millions) | $ | 1,171 |
| | 7 | % | | $ | 1,092 |
| | 12 | % | | $ | 976 |
|
| Oil and gas operating—per BOE | 3.81 |
| | (1 | ) | | 3.83 |
| | 5 |
| | 3.65 |
|
| Oil and gas transportation and other (millions) | 1,184 |
| | 16 |
| | 1,022 |
| | 7 |
| | 955 |
|
| Oil and gas transportation and other—per BOE | 3.85 |
| | 7 |
| | 3.59 |
| | 1 |
| | 3.57 |
|
_______________________________________________________________________________
BOE—barrels of oil equivalent
Oil and Gas Operating Expenses
Impairment2014 vs. 2013 Oil and gas operating expense increased by $79 million primarily due to higher costs associated with increased sales volumes in the Rockies and the Southern and Appalachia Region and increased activity in the Gulf of $1.8 billion forMexico. These increases were partially offset by lower expenses due to the year ended December 31, 2011, included $1.2 billionsales of the Company’s Pinedale/Jonah assets and its China subsidiary. The related costs per BOE decreased by $0.02 due to increased sales volumes, partially offset by the higher costs.
2013 vs. 2012 Oil and gas operating expenses increased by $116 million primarily due to increased workovers in the Gulf of Mexico, Rockies, and Southern and Appalachia Region; higher expenses in Algeria associated with the start of El Merk production in 2013; and increased costs associated with increased activity in the Rockies and Southern and Appalachia Region. Oil and gas operating expenses per BOE increased by $0.18 primarily due to these higher costs, partially offset by increased sales volumes.
Oil and Gas Transportation and Other Expenses
2014 vs. 2013 Oil and gas transportation and other expenses increased by $162 million primarily due to higher gas-gathering and transportation costs primarily attributable to higher volumes related to the growth in the Company’s U.S. onshore asset base. Oil and gas transportation and other expenses per BOE increased by $0.26 with the higher costs partially offset by increased sales volumes.
2013 vs. 2012 Oil and gas transportation and other expenses increased by $67 million primarily due to higher gas-gathering and transportation costs primarily attributable to higher volumes related to the growth in the Company’s U.S. onshore asset base. Oil and gas transportation and other expenses per BOE increased by $0.02, with the higher costs partially offset by increased sales volumes.
|
| | | | | | | | | | | |
| millions | 2014 | | 2013 | | 2012 |
| Exploration Expense | | | | | |
| Dry hole expense | $ | 762 |
| | $ | 556 |
| | $ | 440 |
|
| Impairments of unproved properties | 483 |
| | 308 |
| | 1,104 |
|
| Geological and geophysical expense | 168 |
| | 208 |
| | 151 |
|
| Exploration overhead and other | 226 |
| | 257 |
| | 251 |
|
| Total exploration expense | $ | 1,639 |
| | $ | 1,329 |
| | $ | 1,946 |
|
2014 vs. 2013 Exploration expense increased by $310 million.
Dry hole expense increased by $206 million primarily due to unsuccessful drilling activities expensed in 2014 associated with wells in the Gulf of Mexico, the Rockies, and Mozambique, compared to unsuccessful drilling activities expensed in 2013 associated with wells in Kenya, Sierra Leone, and Côte d’Ivoire.
Impairments of unproved properties increased by $175 million primarily due to 2014 impairments in the Gulf of Mexico due to lower oil prices, reduction of reserves, and the expiration of certain leases; and impairments in Sierra Leone and certain U.S. onshore oil and gas exploration and production reporting segment properties locatedas a result of changes in the United States, $458Company’s drilling plans. Impairments for 2013 included China, Brazil, and a U.S. onshore property as a result of changes in the Company’s drilling plans.
Geological and geophysical expense decreased by $40 million for midstream reporting segmentdue to lower seismic purchases in the Gulf of Mexico during 2014.
2013 vs. 2012 Exploration expense decreased by $617 million.
Impairments of unproved properties and $91decreased by $796 million primarily due to 2012 impairments of $721 million related to Powder River coalbed methane properties primarily as a result of lower natural-gas prices and $124 million related to a Gulf of Mexico natural-gas property that the Company did not expect to develop under the forecasted natural-gas price environment.
Dry hole expense increased by $116 million primarily due to unsuccessful drilling activities expensed in 2013 associated with wells in the Gulf of Mexico, Sierra Leone, Kenya, Côte d’Ivoire, and New Zealand, compared to unsuccessful drilling activities expensed in 2012 associated with wells in Brazil, Sierra Leone, the Gulf of Mexico, Ghana, and Côte d’Ivoire.
Geological and geophysical expense increased by $57 million primarily due to 2013 seismic purchases in Colombia and the Gulf of Mexico.
|
| | | | | | | | | | | | | | | | | |
| millions except percentages | 2014 | | Inc/(Dec)
vs. 2013 | | 2013 | | Inc/(Dec)
vs. 2012 | | 2012 |
| General and administrative | $ | 1,316 |
| | 21 | % | | $ | 1,090 |
| | (13 | )% | | $ | 1,246 |
|
| Depreciation, depletion, and amortization | 4,550 |
| | 16 |
| | 3,927 |
| | (1 | ) | | 3,964 |
|
| Other taxes | 1,244 |
| | 16 |
| | 1,077 |
| | (12 | ) | | 1,224 |
|
| Impairments | 836 |
| | 5 |
| | 794 |
| | 104 |
| | 389 |
|
General and Administrative Expenses (G&A)
2014 vs. 2013 G&A expense increased by $226 million primarily due to higher employee-related expenses of $152 million primarily associated with increased headcount and higher bonus plan expense. In addition, G&A expense increased due to higher legal expenses of $38 million primarily related to the third-party reimbursement of legal expenses associated with the Algeria exceptional profits tax settlement received in 2013 and legal fees related to Tronox, as well as higher consulting fees of $15 million.
2013 vs. 2012 G&A expense decreased by $156 million due to reduced legal-related expenses of $101 million and lower employee-related expenses of $60 million. The reduced legal-related expenses primarily related to lower 2013 Tronox legal expenses and the 2013 third-party reimbursement of the Company’s investmentlegal expenses associated with the Algeria exceptional profits tax settlement. The lower employee-related expenses primarily related to the 2012 expense associated with Unit Appreciation Rights (UARs), partially offset by higher 2013 employee-related expenses associated with operational expansions. The UARs were awarded in Venezuelan assets. Impairmentprior years to certain officers of the general partner of WES, a consolidated subsidiary of Anadarko, pursuant to the Western Gas Holdings, LLC (WGH) Equity Incentive Plan. This expense related to the change in fair value of $952the UARs upon the initial public offering (IPO) of WGP.
Depreciation, Depletion, and Amortization (DD&A)
2014 vs. 2013 DD&A expense increased by $623 million primarily due to higher sales volumes in 2014, increased asset retirement costs for wells in the Gulf of Mexico, and increased costs associated with additional gathering and processing facilities.
2013 vs. 2012 DD&A expense decreased by $37 million primarily due to accelerated expense in 2012 associated with the depletion of fields in the Gulf of Mexico, partially offset by higher sales volumes in 2013.
Other Taxes
2014 vs. 2013 Other taxes increased by $167 million.
Algerian exceptional profits taxes increased by $128 million attributable to higher oil sales volumes and the commencement of NGLs sales in 2014.
U.S. onshore ad valorem taxes increased by $85 million attributable to increased activity related to U.S. onshore properties.
Chinese windfall profits tax decreased by $47 million resulting from maintenance downtime in the first half of 2014 and the sale of the Company’s Chinese subsidiary in August 2014.
2013 vs. 2012 Other taxes decreased by $147 million.
Algerian exceptional profits taxes decreased by $116 million due to a lower Algeria effective tax rate resulting from the resolution of the Algeria exceptional profits tax dispute and lower oil prices.
Lower sales volumes and oil prices resulted in a $33 million decrease in U.S. production and severance taxes primarily in Alaska.
Impairments
2014
The Company recognized impairments of $545 million related to certain U.S. onshore oil and gas properties and $446 million for associated midstream properties was triggered by lower natural-gas prices. Impairment expense also included $162$276 million related to reserves revisions for certain oil and gas properties in the Gulf of Mexico properties, and $100 million related to onshore propertiesthat were impaired primarily due to changes in projected cash flows, which resulted from the Company’s intent to divest the properties. All of these assets were impaired to fair value. Further declineslower forecasted natural-gas and oil prices.
Declines in commodity prices or negative reserves revisions could result in additional price-related impairments.impairments in future periods. SeeNote 5—Impairments in the Notes to Consolidated Financial Statements under Item 8 of this Form 10-K for additional information on impairments and Risk Factors under Item 1A of this Form 10-K for further discussion on the risks associated with oil, natural-gas, and NGLs prices. Impairment expense
2013
The Company recognized $562 million due to a reduction in estimated future net cash flows and downward revisions of reserves for certain Gulf of Mexico properties resulting from changes to the year ended December 31, 2010, included $145Company’s development plans.
The Company recognized $142 million for certain U.S. onshore oil and gas properties and $49 million for related midstream assets due to downward revisions of reserves resulting from changes to the Company’s development plans.
The Company recognized $30 million for certain midstream properties due to a reduction in estimated future cash flows and $11 million related to the Company’s Venezuelan cost-method investment due to declines in estimated recoverable value.
2012
The Company recognized $363 million related to oil and gas exploration and production reporting segment properties located in the United States. The properties in the United States include $114These impairments included $259 million related to lower natural-gas prices, $79 million related to downward reserves revisions for a productionGulf of Mexico property that was near the end of its economic life, and $25 million for a platform included in the oilGulf of Mexico.
The Company recognized impairments of $13 million related to midstream properties and gas exploration and production reporting segment that remains idle with no immediate plan for use, and for which a limited market exists. The platform was impaired to its estimated fair value of $25 million. Impairments for the year ended December 31, 2010, also included $61$13 million related to the Company’s investmentVenezuelan cost-method investment.
|
| | | | | | | | | | | |
| millions | 2014 | | 2013 | | 2012 |
| Algeria exceptional profits tax settlement | $ | — |
| | $ | 33 |
| | $ | (1,797 | ) |
| Deepwater Horizon settlement and related costs | 97 |
| | 15 |
| | 18 |
|
Algeria Exceptional Profits Tax Settlement
In March 2012, Anadarko and Sonatrach resolved the exceptional profits tax dispute. The resolution provided for delivery to the Company of oil valued at $1.7 billion and the elimination of $62 million of previously recorded and unpaid transportation charges. The Company recognized a $1.8 billion credit in
Venezuelan assets thatthe Costs and Expenses section of the Consolidated Statement of Income for 2012 to reflect the effect of this agreement for previously recorded expenses. During 2013, the Company revised its estimate of income tax expense related to the elimination of previously recorded and unpaid transportation charges and recognized a $33 million unfavorable adjustment to the settlement, which was
impaired to its estimated fair value.For the year endedoffset by an equivalent income tax benefit also recognized in 2013. At December 31, 2011,2013, the Company had collected all of the $1.7 billion associated with the Algeria exceptional profits tax receivable.
Deepwater Horizon Settlement and Related Costs
During 2014, the Company recorded a $90 million expense and contingent liability associated with a civil penalty under the Clean Water Act (CWA) related to the Deepwater Horizon event-related claims. In addition, Deepwater Horizon settlement and related costs included a $4.0 billion expense for the Company’s cash payment made to BP pursuant to the Settlement Agreement, as well as $93 million of legal expenses and other related costs associated with the Deepwater Horizon events. These amounts were partially offset by a $163 million gain recognizedevents for 2014, 2013, and 2012. Refer to Note 17—Contingencies—Deepwater Horizon Events in the fourth quarter for insurance recoveries associated with the Deepwater Horizon events. Legal expenses of $15 million related to the Deepwater Horizon events for 2010, previously recorded to general and administrative expense, were reclassified to Deepwater Horizon settlement and related costs. Although Anadarko has been indemnified by BP for certain costs, the Company may be required to recognize a liability for amounts in advance of or in connection with recognizing a receivable from BP for the related indemnity payment. In all circumstances, however, the Company expects that any additional indemnified liability that may be recognized by the Company will be subsequently recovered from BP itself or through the guarantees of BPCNA or BP p.l.c. Additionally, as part of the Settlement Agreement, BP has agreed that, to the extent it receives value in the future from claims that it has asserted or could assert against third parties arising from or relating to the Deepwater Horizon events, it will make cash payments (not to exceed $1.0 billion in the aggregate) to Anadarko, on a current and continuing basis, equal to 12.5% of the aggregate value received by BP in excess of $1.5 billion. Any payments received by the Company pursuant to this arrangement will be accounted for as a reimbursement of the $4.0 billion payment made to BP as part of the Settlement Agreement. Refer toNote 2—Deepwater Horizon Events in theNotes to Consolidated Financial Statements under Item 8 of this Form 10-K for additional information.discussion and analysis of these events.
Other (Income) Expense
|
| | | | | | | | | | | | | | | | | |
| millions except percentages | 2014 | | Inc/(Dec)
vs. 2013 | | 2013 | | Inc/(Dec)
vs. 2012 | | 2012 |
| Interest Expense | | | | | | | | | |
| Current debt, long-term debt, and other | $ | 973 |
| | 3 | % | | $ | 949 |
| | (1 | )% | | $ | 963 |
|
| Capitalized interest | (201 | ) | | 24 |
| | (263 | ) | | (19 | ) | | (221 | ) |
| Total interest expense | $ | 772 |
| | 13 |
| | $ | 686 |
| | (8 | ) | | $ | 742 |
|
2014 vs. 2013 | | | | | | | | | | | | | | | | | | | | | | | | | |
| millions except percentages | | 2011 | | Inc/(Dec)
vs. 2010 | | 2010 | | Inc/(Dec)
vs. 2009 | | 2009 |
Interest Expense | | | | | | | | | | | | | | | | | | | | | | | | | |
Current debt, long-term debt, and other | | | $ | 986 | | | | | 13 | % | | | $ | 871 | | | | | 13 | % | | | $ | 773 | |
(Gain) loss on early debt retirements and commitment termination | | | | — | | | | | (100 | ) | | | | 112 | | | | | NM | | | | | (2 | ) |
Capitalized interest | | | | (147 | ) | | | | (15 | ) | | | | (128 | ) | | | | (86 | ) | | | | (69 | ) |
| | | | | | | | | | | | | | | | | | | | | | | | | |
Interest expense | | | $ | 839 | | | | | (2 | ) | | | $ | 855 | | | | | 22 | | | | $ | 702 | |
| | | | | | | | | | | | | | | | | | | | | | | | | |
Anadarko’s interest expense increased by $86 million primarily due to a decrease in capitalized interest of $62 million related to lower construction-in-progress balances for the Mozambique liquefied natural gas project and the completion of certain U.S. pipeline projects in late 2013 and early 2014. In addition, interest expense increased $13 million due to increased long-term debt outstanding during 2014. For additional information, see Liquidity and Capital Resources and Interest-Rate Risk under Item 7A of this Form 10-K.
2013 vs. 2012 Anadarko’s interest expense decreased for the year ended December 31, 2011,by $56 million primarily due to $19 million of increasedan increase in capitalized interest of $42 million related to higher construction-in-progress balances for long-term capital projects. Additionally, 2011 interest expense was lower due to items that occurred in 2010 with no similar expense in 2011, including $86decreased by $31 million associated with losses on early debt retirements, $17 million of commitment and structuring costs associated withas a contemplated term-loan facility, and $9 million related to unamortized debt issuance costs recognized with the retirementresult of the Midstream Subsidiary Note Payable to a Related Party. These items were partially offset by $48 million from a higher averagerepayment of outstanding debt balance and weighted-average interest rate on outstanding debt, $29 million related to interest on capital lease obligations incurred in 2011, $24 million attributable to increased amortization of debt-issuance and credit-facility origination costs, and $20 million of higher fees on issued letters of credit and credit-facility commitment fees. Anadarko’s interest expense increased for the year ended December 31, 2010, primarily due to the reversal of $78 million in 2009 for previously accrued interest expense related to the DWRRA dispute. In addition, $86 million of losses on early retirements of debt, $17 million of commitment and structuring costs, and $9 million of expensed unamortized debt issuance costs, discussed above, were incurred in 2010. The Company also incurred $12 million of amortized debt issuance costsborrowings during 2012 associated with the $5.0 billion Facility. These increasesdecreases were partially offset by increases in capitalized$18 million of interest of $59 million due to higher construction-in-progress balancesexpense for outstanding borrowings primarily related to long-term capital projects. For additional information, see LiquidityWES’s 4.000% Senior Notes due 2022, which were issued during 2012.
|
| | | | | | | | | | | |
| millions | 2014 | | 2013 | | 2012 |
| (Gains) Losses on Derivatives, net | | | | | |
| (Gains) losses on commodity derivatives, net | $ | (589 | ) | | $ | 141 |
| | $ | (387 | ) |
| (Gains) losses on interest-rate and other derivatives, net | 786 |
| | (539 | ) | | 61 |
|
| Total (gains) losses on derivatives, net | $ | 197 |
| | $ | (398 | ) | | $ | (326 | ) |
(Gains) losses on derivatives, net represents the changes in fair value of the Company’s derivative instruments as a result of changes in commodity prices and Capital Resources—Uses of Cash—Debt Retirements and Repayments, andInterest-Rate Risk under Item 7A of this Form 10-K. | | | | | | | | | | | | | | | | | | | | | | | | | |
| millions except percentages | | 2011 | | Inc/(Dec)
vs. 2010 | | 2010 | | Inc/(Dec)
vs. 2009 | | 2009 |
(Gains) Losses on Commodity Derivatives, net | | | | | | | | | | | | | | | | | | | | | | | | | |
Realized (gains) losses | | | | | | | | | | | | | | | | | | | | | | | | | |
Natural gas | | | $ | (288 | ) | | | | (44 | )% | | | $ | (513 | ) | | | | 85 | % | | | $ | (277 | ) |
Oil and condensate | | | | 61 | | | | | NM | | | | | 15 | | | | | (130 | ) | | | | (50 | ) |
Natural gas liquids | | | | 1 | | | | | NM | | | | | — | | | | | — | | | | | — | |
| | | | | | | | | | | | | | | | | | | | | | | | | |
Total realized (gains) losses | | | | (226 | ) | | | | (55 | ) | | | | (498 | ) | | | | 52 | | | | | (327 | ) |
| | | | | | | | | | | | | | | | | | | | | | | | | |
Unrealized (gains) losses | | | | | | | | | | | | | | | | | | | | | | | | | |
Natural gas | | | | (192 | ) | | | | (46 | ) | | | | (353 | ) | | | | 180 | | | | | 444 | |
Oil and condensate | | | | (140 | ) | | | | NM | | | | | (42 | ) | | | | 114 | | | | | 291 | |
Natural gas liquids | | | | (4 | ) | | | | NM | | | | | — | | | | | — | | | | | — | |
| | | | | | | | | | | | | | | | | | | | | | | | | |
Total unrealized (gains) losses | | | | (336 | ) | | | | (15 | ) | | | | (395 | ) | | | | 154 | | | | | 735 | |
| | | | | | | | | | | | | | | | | | | | | | | | | |
Total (gains) losses on commodity derivatives, net | | | $ | (562 | ) | | | | (37 | ) | | | $ | (893 | ) | | | | NM | | | | $ | 408 | |
| | | | | | | | | | | | | | | | | | | | | | | | | |
The Companyinterest rates. Anadarko enters into commodity derivatives to manage the risk of a decreasechanges in the market prices for its anticipated sales of production. The change in (gains) losses on commodity derivatives, net includes the impact of derivatives entered into or settled and price changes related to positions open at December 31 of each year. For additional information on (gains) losses on commodity derivatives, seeNote 10—Derivative Instrumentsin theNotes to Consolidated Financial Statementsunder Item 8 of this Form 10-K.
| | | | | | | | | | | | | | | | | | | | |
| millions except percentages | | 2011 | | | Inc/(Dec)
vs. 2010 | | | 2010 | | | Inc/(Dec)
vs. 2009 | | | 2009 | |
(Gains) Losses on Other Derivatives, net | | | | | | | | | | | | | | | | | | | | |
Realized (gains) losses—interest-rate
derivatives and other | | $ | 59 | | | | NM | | | $ | — | | | | (100 | )% | | $ | (525 | ) |
Unrealized (gains) losses—interest-rate
derivatives and other | | | 964 | | | | NM | | | | 285 | | | | NM | | | | (57 | ) |
| | | | | | | | | | | | | | | | | | | | |
Total (gains) losses on other derivatives, net | | $ | 1,023 | | | | NM | | | $ | 285 | | | | (149 | ) | | $ | (582 | ) |
| | | | | | | | | | | | | | | | | | | | |
In addition, Anadarko enters into interest-rate swaps to fix or float interest rates on existing or anticipated indebtedness to manage exposure to interest-rate changes. In 2008 and 2009, Anadarko entered into interest-rate swap contracts as a fixed-rate payor to mitigate interest-rate risk associated with anticipated debt issuances. In 2009, the Company revised the swap contract terms to increase the weighted-average interest rate of the swap portfolio, and realized a $552 million gain. In 2011, the Company extended the swap maturity dates from October 2011 to June 2014 for interest-rate swaps with an aggregate notional principal amount of $1.85 billion. In connection with these extensions, the swap interest rates were also adjusted. In addition, interest-rate swap agreements with an aggregate notional principal amount of $150 million were settled for a loss of $57 million in October 2011. For additional information, seeNote 10—11—Derivative Instrumentsin theNotes to Consolidated Financial Statementsunder Item 8 of this Form 10-K.
| | | | | | | | | | | | | | | | | | | | |
| millions except percentages | | 2011 | | | Inc/(Dec)
vs. 2010 | | | 2010 | | | Inc/(Dec)
vs. 2009 | | | 2009 | |
Other (Income) Expense, net | | | | | | | | | | | | | | | | | | | | |
Interest income | | $ | (21 | ) | | | 62 | % | | $ | (13 | ) | | | (32 | )% | | $ | (19 | ) |
Other | | | 275 | | | | NM | | | | (106 | ) | | | NM | | | | (24 | ) |
| | | | | | | | | | | | | | | | | | | | |
Total other (income) expense, net | | $ | 254 | | | | NM | | | $ | (119 | ) | | | 177 | | | $ | (43 | ) |
| | | | | | | | | | | | | | | | | | | | |
|
| | | | | | | | | | | | | | | | | |
| millions except percentages | 2014 |
| Inc/(Dec)
vs. 2013 |
| 2013 |
| Inc/(Dec)
vs. 2012 |
| 2012 |
| Other (Income) Expense, net |
|
|
|
|
|
|
|
|
|
| Interest income | $ | (26 | ) |
| 37 | % |
| $ | (19 | ) |
| 19 | % |
| $ | (16 | ) |
| Other | 46 |
|
| 57 |
|
| 108 |
|
| NM |
|
| 12 |
|
| Total other (income) expense, net | $ | 20 |
|
| 78 |
|
| $ | 89 |
|
| NM |
|
| $ | (4 | ) |
Total other income decreased $3732014 vs. 2013 In 2013, as a result of a Chapter 11 bankruptcy declaration by a third party, the U.S. Department of the Interior ordered Anadarko to perform the decommissioning of a production facility and related wells, which were previously sold to the third party. During 2013, the Company accrued costs of $117 million forto decommission the year ended December 31, 2011, primarily duefacility and related wells. During 2014, the Company recognized a $22 million increase in the estimated decommissioning costs. Anadarko completed decommissioning of the production facility in 2014 and expects to complete decommissioning of the wells in 2015. Also, as a result of a prior acquisition, the Company recognized a restoration liability of $50 million in 2013 with respect to a landfill located in California for which the Company was notified that it is a potentially responsible party. In the second quarter of 2013, the Company reversed the $56 million tax indemnification liability associated with the 2006 sale of the Company’s Canadian subsidiary. The indemnity was reversed as a result of certain changes to Canadian tax laws.
2013 vs. 2012 During 2013, the Company recognized a decommissioning charge of $117 million and a restoration liability of $50 million, partially offset by the 2013 reversal of the $56 million tax indemnification liability associated with the 2006 sale of the Company’s Canadian subsidiary.
|
| | | | | | | | | | | |
| millions | 2014 | | 2013 | | 2012 |
| Tronox-related contingent loss | $ | 4,360 |
| | $ | 850 |
| | $ | (250 | ) |
In April 2014, Anadarko and Kerr-McGee Corporation and certain of its subsidiaries (collectively, Kerr-McGee) entered into a settlement agreement for $5.15 billion resolving all claims asserted in the Tronox Adversary Proceeding. Anadarko recognized Tronox-related contingent losses of $4.3 billion in 2014, $850 million in 2013, and reversed $250 million in 2012 associated with the Tronox-related contingent loss recognized in 2011,2011. In addition, Anadarko recognized settlement-related interest expense of $60 million during 2014. An aggregate Tronox-related contingent liability of $5.2 billion was included on the 2010 reversal of the $95 million reimbursement obligation to Tronox described below, and $20 million due to unfavorable exchange-rate changes applicable to foreign currency purchased in anticipation of funding future expenditures on major development projects and foreign currency held in escrow as ofCompany’s Consolidated Balance Sheet at December 31, 2011, pending final determination of the Company’s Brazilian tax liability from its 2008 divestiture of the Peregrino field offshore Brazil. The Brazilian tax matter is currently being considered by the Brazilian courts, and2014. In January 2015, the Company expects this litigation to be resolved withinpaid $5.2 billion after the next 18 to 24 months. An unfavorable decision may require the Company to record an additional tax liability in its consolidated financial statements.settlement agreement became effective. SeeNote 16—17—Contingencies—Tronox Litigationin theNotes to Consolidated Financial Statements under Item 8 of this Form 10-K for additional information regarding Tronox litigation.10-K.
Income Tax Expense
|
| | | | | | | | | | | |
| millions except percentages | 2014 | | 2013 | | 2012 |
| Income tax expense (benefit) | $ | 1,617 |
| | $ | 1,165 |
| | $ | 1,120 |
|
| Effective tax rate | 2,994 | % | | 55 | % | | 31 | % |
2014 The increase from the reversal of the $95 million reimbursement obligation to Tronox as a result of the cancellation of the MSA by Tronox that occurred as part of Tronox’s bankruptcy proceedings. Under the terms of the MSA entered into between Kerr-McGee and Tronox, a former subsidiary of Kerr-McGee that held Kerr-McGee’s chemical business, Kerr-McGee agreed to reimburse Tronox for 50% of certain qualifying environmental-remediation costs incurred and paid by Tronox and its subsidiaries before November 28, 2012, subject to certain limitations and conditions. The reimbursement obligation under the MSA35% U.S. federal statutory rate was limited to a maximum aggregate reimbursement of $100 million. The reversal of this liability in 2010 was partially offset by $54 million of unfavorable changes in foreign-currency exchange rates primarily attributable to cash denominatednet changes in Brazilian currency helduncertain tax positions related to the settlement agreement associated with the Tronox Adversary Proceeding, changes in escrow.Income Tax Expense
| | | | | | | | | | | | | | | |
| millions except percentages | | 2011 | | 2010 | | 2009 |
Income tax expense (benefit) | | | $ | (856 | ) | | | $ | 820 | | | | $ | (5 | ) |
Effective tax rate | | | | 25 | % | | | | 50 | % | | | | 5 | % |
The Company reported a loss before income taxes for the year ended December 31, 2011. As a result, items that ordinarily increase or decreaseother uncertain tax positions, the tax impact from foreign operations, Algerian exceptional profits taxes, and the non-deductible contingent CWA-penalty accrual. For additional information on income tax rates, see
Note 18—Income Taxes in the Notes to Consolidated Financial Statements under Item 8 of this Form 10-K. In 2013, the Company recognized a deferred tax benefit of $274 million related to the $850 million loss with respect to the Tronox-related contingent liability. In 2014, the Company recognized an additional deferred tax benefit of $316 million related to the additional $4.360 billion loss with respect to the Tronox-related contingent liability. See Note 17—Contingencies—Tronox Litigation in the Notes to Consolidated Financial Statements under Item 8 of this Form 10-K.
2013 The increase from the 35% U.S. federal statutory rate will havewas primarily attributable to the opposite effect. tax impact from foreign operations, non-deductible Algerian exceptional profits tax, and deferred tax adjustments.
2012 The decrease from the 35% U.S. federal statutory rate for the year ended December 31, 2011, was primarily attributable to the following:tax expense associated with the accrualnon-taxable resolution of the AlgerianAlgeria exceptional profits tax which is non-deductible for Algerian income tax purposes;
U.S. tax on foreign income inclusions and distributions;
foreign tax rate differential and valuation allowances; and
items resulting from business acquisitions and other items.
These amounts weredispute. This amount was partially offset by the following:
U.S. income tax benefits associated withimpact from foreign lossesoperations and the restructuring of foreign operations; and
state income tax benefits.
The increase from the 35% U.S. federal statutory rate for the year ended December 31, 2010, was primarily attributable to the following:
tax expense associated with the accrual of thenon-deductible Algerian exceptional profits tax;
tax.U.S. tax on foreign income inclusions and distributions;
foreign tax rate differential and valuation allowances; and
the unfavorable resolution of uncertain tax positions.
These amounts were partially offset by the following:
U.S. income tax impact from losses and restructuring of foreign operations; and
the federal manufacturing deduction and other items.
The decrease from the 35% U.S. federal statutory rate for the year ended December 31, 2009, was primarily attributable to the following:
tax expense associated with the accrual of the Algerian exceptional profits tax;
foreign tax rate differential and valuation allowances; and
U.S. tax on foreign income inclusions and distributions.
These amounts were partially offset by the following:
benefits associated with changes in uncertain tax positions;
state income taxes, including a change in the state income tax rate expected to be in effect at the time the Company’s deferred state income tax liability is expected to be settled or realized; and
U.S. income tax impact from losses and restructuring of foreign operations and other items.
For additional information on income tax rates, seeNote 18—Income Taxes in theNotes to Consolidated Financial Statements under Item 8 of this Form 10-K.
Net Income Attributable to Noncontrolling Interests
For the years ended December 31, 2011, 2010, and 2009, theThe Company’s net income attributable to noncontrolling interests of $81$187 million $60for the year ended December 31, 2014, $140 million for 2013, and $32$54 million respectively, primarilyfor 2012, was related to the public ownership interests in Western Gas Partners, LP (WES), a consolidated subsidiary of the Company.WES and WGP. Public ownership of WES was 54.7%55% at December 31, 2014, 51.5%56.4% at December 31, 2013, and 43.2%51.8% at year-end 2011, 2010,December 31, 2012. In December 2012, WGP completed its IPO of approximately 20 million common units representing limited partner interests in WGP at a price of $22.00 per common unit. During 2014, Anadarko sold approximately 6 million WGP common units to the public, raising net proceeds of $335 million. Public ownership of WGP was 11.7% at December 31, 2014, and 2009, respectively.was 9% at December 31, 2013 and 2012. SeeNote 8—9—Noncontrolling Interestsin theNotes to Consolidated Financial Statementsunder Item 8 of this Form 10-K.
Segment Analysis—Adjusted EBITDAX To assess the performance of Anadarko’s reportingoperating segments, the chief operating decision maker analyzes Adjusted EBITDAX. The Company defines Adjusted EBITDAX as income (loss) before income taxes,taxes; exploration expense; DD&A; impairments; interest expense, exploration expense, DD&A, impairments, Deepwater Horizon settlement and related costs, and unrealizedexpense; total (gains) losses on derivatives, net, less net cash from settlement of commodity derivatives; and certain items not related to the Company’s normal operations, less net income attributable to noncontrolling interests (Adjusted EBITDAX).interests. During the periods presented, items not related to the Company’s normal operations included Deepwater Horizon settlement and related costs, Algeria exceptional profits tax settlement, Tronox-related contingent loss, and certain other nonoperating items included in other (income) expense, net. The Company’s definition of Adjusted EBITDAX, which is not a GAAP measure, excludes interest expense to allow for assessment of segment operating results without regard to Anadarko’s financing methods or capital structure. Adjusted EBITDAX also excludes exploration expense as it is not an indicator of operating efficiency for a given reporting period. However, exploration expense is monitored by management as part of costs incurred in exploration and development activities. Similarly, DD&A and impairments are excluded from Adjusted EBITDAX as a measure of segment operating performance because capital expenditures are evaluated at the time capital costs are incurred. Anadarko’s definition of Adjusted EBITDAX also excludes Deepwater Horizon settlement and related costs as these costs are outside the normal operationsinterest expense to allow for assessment of the Company. SeeNote 2—Deepwater Horizon Events in the Notessegment operating results without regard to Consolidated Financial Statements under Item 8 of this Form 10-K. Finally, unrealizedAnadarko’s financing methods or capital structure. Total (gains) losses on derivatives, net, less net cash from settlement of commodity derivatives are excluded from Adjusted EBITDAX because unrealizedthese (gains) losses on derivatives are not considered to be a measure of asset operating performance. Finally, net income attributable to noncontrolling interests is excluded from the Company’s measure of Adjusted EBITDAX because it represents earnings that are not attributable to the Company’s common stockholders.
Management believes that the presentation of Adjusted EBITDAX provides information useful in assessing the Company’s financial condition and results of operations and that Adjusted EBITDAX is a widely accepted financial indicator of a company’s ability to incur and service debt, fund capital expenditures, and make distributions to stockholders.
Adjusted EBITDAX as defined by Anadarko may not be comparable to similarly titled measures used by other companies. Therefore, Anadarko’s consolidated Adjusted EBITDAXcompanies and should be considered in conjunction with net income (loss) attributable to common stockholders and other performance measures prepared in accordance with GAAP, such as operating income or cash flows from operating activities. Adjusted EBITDAX has important limitations as an analytical tool because it excludes certain items that affect net income (loss) attributable to common stockholders and net cash provided by operating activities. Adjusted EBITDAX should not be considered in isolation or as a substitute for an analysis of Anadarko’s results as reported under GAAP. Below is a reconciliation of consolidated Adjusted EBITDAX to income (loss) before income taxes, and consolidated Adjusted EBITDAX by reporting segment.
Adjusted EBITDAX
| | | | | | | | | | | | | | | | | | | | |
| millions except percentages | | 2011 | | | Inc/(Dec)
vs. 2010 | | | 2010 | | | Inc/(Dec)
vs. 2009 | | | 2009 | |
Income (loss) before income taxes | | $ | (3,424 | ) | | | NM | | | $ | 1,641 | | | | NM | | | $ | (108 | ) |
Exploration expense | | | 1,076 | | | | 10 | % | | | 974 | | | | (12 | )% | | | 1,107 | |
DD&A | | | 3,830 | | | | 3 | | | | 3,714 | | | | 5 | | | | 3,532 | |
Impairments | | | 1,774 | | | | NM | | | | 216 | | | | 88 | | | | 115 | |
Deepwater Horizon settlement
and related costs(1) | | | 3,930 | | | | NM | | | | 15 | | | | NM | | | | — | |
Interest expense | | | 839 | | | | (2 | ) | | | 855 | | | | 22 | | | | 702 | |
Unrealized (gains) losses on derivative instruments, net(2) | | | 616 | | | | NM | | | | (114 | ) | | | (116 | ) | | | 717 | |
Less: Net income attributable to noncontrolling interests | | | 81 | | | | 35 | | | | 60 | | | | 88 | | | | 32 | |
| | | | | | | | | | | | | | | | | | | | |
Consolidated Adjusted EBITDAX | | $ | 8,560 | | | | 18 | | | $ | 7,241 | | | | 20 | | | $ | 6,033 | |
| | | | | | | | | | | | | | | | | | | | |
Adjusted EBITDAX by segment | | | | | | | | | | | | | | | | | | | | |
Oil and gas exploration and production | | $ | 8,787 | | | | 29 | | | $ | 6,786 | | | | 23 | | | $ | 5,524 | |
Midstream | | | 419 | | | | 36 | | | | 308 | | | | 17 | | | | 263 | |
Marketing | | | (63 | ) | | | NM | | | | 4 | | | | 104 | | | | (110 | ) |
Other and intersegment eliminations | | | (583 | ) | | | NM | | | | 143 | | | | (60 | ) | | | 356 | |
(1) | In 2011, the Company revised the definition of Adjusted EBITDAX to exclude the Deepwater Horizon settlement and related costs. The prior periods have been adjusted to reflect this change.
|
(2) | In 2010, the Company revised the definition of Adjusted EBITDAX to exclude the impact of unrealized (gains) losses on derivatives, net. The prior periods have been adjusted to reflect this change.
|
|
| | | | | | | | | | | | | | | | | |
| millions except percentages | 2014 | | Inc/(Dec)
vs. 2013 | | 2013 | | Inc/(Dec)
vs. 2012 | | 2012 |
| Income (loss) before income taxes | $ | 54 |
| | (97 | )% | | $ | 2,106 |
| | (41 | )% | | $ | 3,565 |
|
| Exploration expense | 1,639 |
| | 23 |
| | 1,329 |
| | (32 | ) | | 1,946 |
|
| DD&A | 4,550 |
| | 16 |
| | 3,927 |
| | (1 | ) | | 3,964 |
|
| Impairments | 836 |
| | 5 |
| | 794 |
| | 104 |
| | 389 |
|
| Interest expense | 772 |
| | 13 |
| | 686 |
| | (8 | ) | | 742 |
|
Total (gains) losses on derivatives, net, less net cash received in settlement of commodity derivatives | 578 |
| | NM |
| | (307 | ) | | (169 | ) | | 443 |
|
| Deepwater Horizon settlement and related costs | 97 |
| | NM |
| | 15 |
| | (17 | ) | | 18 |
|
| Algeria exceptional profits tax settlement | — |
| | (100 | ) | | 33 |
| | 102 |
| | (1,797 | ) |
| Tronox-related contingent loss | 4,360 |
| | NM |
| | 850 |
| | NM |
| | (250 | ) |
| Certain other nonoperating items | 22 |
| | (80 | ) | | 110 |
| | NM |
| | — |
|
Less net income attributable to noncontrolling interests | 187 |
| | 34 |
| | 140 |
| | 159 |
| | 54 |
|
| Consolidated Adjusted EBITDAX | $ | 12,721 |
| | 35 |
| | $ | 9,403 |
| | 5 |
| | $ | 8,966 |
|
| | | | | | | | | | |
| Adjusted EBITDAX by segment | | | | | | | | | |
| Oil and gas exploration and production | $ | 12,505 |
| | 35 |
| | $ | 9,238 |
| | 9 |
| | $ | 8,500 |
|
| Midstream | 660 |
| | 30 |
| | 508 |
| | 7 |
| | 474 |
|
| Marketing | (219 | ) | | (75 | ) | | (125 | ) | | (20 | ) | | (104 | ) |
| Other and intersegment eliminations | (225 | ) | | (3 | ) | | (218 | ) | | NM |
| | 96 |
|
Oil and Gas Exploration and Production
2014 vs. 2013 The increase in Adjusted EBITDAX for the year ended December 31, 2011, was primarily due to thenet gains on divestitures, higher crude-oilsales volumes for oil and NGLs, prices and higher sales volumes.natural-gas prices. These increases were partially offset by lower natural-gasoil prices, and increased operatinghigher oil and gas transportation expenses primarilyand other taxes, which increased as a result of higher sales volumes and crude-oil prices. volumes.
2013 vs. 2012 The increase in Adjusted EBITDAX for the year ended December 31, 2010, was primarily due to the impact of higher commodity prices and higher sales volumes for all products and higher natural-gas prices, partially offset by lower oil and NGLs prices and losses on divestitures primarily related to the 2009 reversal of amounts previously accruedPinedale/Jonah assets in connection with the DWRRA dispute.Wyoming.
Midstream
2014 vs. 2013 The increase in Adjusted EBITDAX for the year ended December 31, 2011, resulted from increased marginswas primarily due to higher NGLsgathering and processing revenue associated with higher volumes and increased natural-gas prices, and volumes, lower prices for natural-gas purchases, and margins provided by 2011 asset acquisitions. Also contributing to the increase was the recognition of a $21 million gain from the acquisition-date fair-value remeasurement of the Company’s pre-acquisition 7% equity interest in the Wattenberg Plant. These increases were partially offset by losses relatedhigher processing expenses primarily due to midstream assets held for sale. For the year ended December 31, 2010, theincreased volumes.
2013 vs. 2012 The increase in Adjusted EBITDAX resultedwas primarily from an increase in revenue due to higher prices and NGLs volumes, which impacted revenues earned under the Company’s percent-of-proceeds and keep-whole contracts. These increases were reduced by higher costgathering revenue as a result of product relatedincreased volumes.
Marketing Marketing earnings primarily represent the margin earned on sales of natural gas, oil, and NGLs purchased from third parties.
2014 vs. 2013 The decrease in Adjusted EBITDAX for the year ended December 31, 2011, resulted primarily from lower marketing margins and higher transportation expenses.
2013 vs. 2012 The decrease in Adjusted EBITDAX resulted from higher transportation expenses due to increased third-party volumes and increased demand fees, partially offset by higher margins primarily associated with natural-gas sales from inventory and an increase in transportation expense related to new transportation agreements effective January 2011. The increase in Adjusted EBITDAX for the year ended December 31, 2010, was primarily due to higher margins associated with natural-gas sales from inventory, and lower transportation costs due to lower firm transportation amortization as a result of asset impairments in 2009.NGLs sales.
Other and Intersegment Eliminations
Other and intersegment eliminations consistconsists primarily of corporate costs, realized gains and losses on derivatives, and income from hard minerals investments and royalties. royalties, and net cash received in settlement of commodity derivatives.
2014 vs. 2013 The decreaseAdjusted EBITDAX in 2014 was relatively flat compared to the prior year.
2013 vs. 2012 The increase in Adjusted EBITDAX for the year ended December 31, 2011, was primarily due to lower realized gains ona decrease in net cash received in settlement of commodity derivatives in 2011, realized losses on interest rate swaps2013, partially offset by 2012 expense associated with the change in 2011, $250 million Tronox-related contingent loss in 2011, exchange-rate changes applicable to foreign currency, and the 2010 reversalfair value of the remaining $95 million reimbursement obligation that was provided by Kerr-McGeegeneral partner UARs in connection with the WGP IPO. The UARs were awarded in prior years to Tronoxcertain officers of the general partner of WES, pursuant to the terms of the MSA. SeeNote 16—Contingencies—Tronox Litigationin the Notes to Consolidated Financial Statements under Item 8 of this Form 10-K for additional information. The decrease in Adjusted EBITDAX for the year ended December 31, 2010, was primarily due to realized gains on interest-rate swaps in 2009, partially offset by increased realized gains on commodity derivatives in 2010 and the reversal of the $95 million liability related to the reimbursement obligation discussed above.WGH Equity Incentive Plan.
Proved Reserves Anadarko is focused on growth and profitability, and reserves replacement is a key to growth. Future profitability partially depends on commodity prices and the cost of finding and developing oil and gas reserves. Reserves growth can be achieved through successful exploration and development drilling, improved recovery, or acquisition of producing properties.Additional For reserves information, is contained insee Oil and Gas Properties and Activities—Proved Reserves under Items 1 and 2 of this Form 10-K and theSupplemental Information on Oil and Gas Exploration and Production Activities (Supplemental Information)under Item 8 of this Form 10-K.
| | | 00000 | | | | 00000 | | | | 00000 | |
| MMBOE | | 2011 | | | 2010 | | | 2009 | |
Proved Reserves | | | | | | | | | | | | |
Beginning of year | | | 2,422 | | | | 2,304 | | | | 2,277 | |
Reserves additions and revisions | | | | | | | | | | | | |
Discoveries and extensions | | | 174 | | | | 83 | | | | 70 | |
Infill-drilling additions(1) | | | 203 | | | | 312 | | | | 125 | |
| | | | | | | | | | | | |
Drilling-related reserves additions and revisions | | | 377 | | | | 395 | | | | 195 | |
Other non-price-related revisions(1) | | | 7 | | | | (66 | ) | | | 87 | |
Acquisition of proved reserves in place | | | — | | | | 1 | | | | 32 | |
Price-related revisions(1) | | | 8 | | | | 29 | | | | (39 | ) |
| | | | | | | | | | | | |
Total reserves additions and revisions | | | 392 | | | | 359 | | | | 275 | |
Sales in place | | | (29 | ) | | | (6 | ) | | | (24 | ) |
Production | | | (246 | ) | | | (235 | ) | | | (224 | ) |
| | | | | | | | | | | | |
End of year | | | 2,539 | | | | 2,422 | | | | 2,304 | |
| | | | | | | | | | | | |
Proved Developed Reserves | | | | | | | | | | | | |
Beginning of year | | | 1,673 | | | | 1,624 | | | | 1,600 | |
| | | | | | | | | | | | |
End of year | | | 1,811 | | | | 1,673 | | | | 1,624 | |
| | | | | | | | | | | | |
(1) | Combined and reported as revisions of prior estimates in the Company’sSupplemental Information under Item 8 of this Form 10-K.
|
Proved Reserve Additions and Revisions During 2011, the Company added 392 MMBOE
Table of proved reserves as a result of additions (purchases in place, discoveries, and extensions) and revisions. The Company expects the majority of future reserves growth to come from revisions associated with infill drilling (reserves bookings related to infill wells are treated as positive revisions), extensions of current fields, new discoveries onshore United States and in the deep waters of the Gulf of Mexico, successful exploration in international growth areas, and purchases of properties in strategic areas.Additions During 2011, Anadarko added 174 MMBOE of proved reserves primarily as a result of successful domestic drilling in the Marcellus and Eagleford shale areas and the Gulf of Mexico. Although shale plays represent only about 5% of the Company’s total proved reserves, growth in the shale plays contributed 119 MMBOE of total additions. The Company had no material acquisitions of proved reserves in place in 2011. During 2010, Anadarko added 83 MMBOE of proved reserves primarily as a result of successful drilling in the United States. Shale plays represented about 2% of the Company’s total proved reserves at year-end 2010, but contributed 45 MMBOE of additions. During 2009, Anadarko added 70 MMBOE of proved reserves primarily as a result of successful drilling. The Company also acquired 32 MMBOE of proved reserves in place related to onshore domestic assets in 2009.
Contents
Index to Financial StatementsRevisions Total revisions in 2011 were 218 MMBOE or 9% of the beginning-of-year reserves base. The revisions included an increase of 203 MMBOE related to the continuation of successful infill drilling in large onshore areas, including the Greater Natural Buttes, Wattenberg, and Pinedale fields, 182 MMBOE of positive revisions to prior estimates and 8 MMBOE associated with higher oil prices. These positive revisions were partially offset by the transfer of 175 MMBOE of proved reserves to unproved categories primarily as a result of changes to development plans and economic conditions experienced during 2011. Total revisions in 2010 were 275 MMBOE or 12% of the beginning-of-year reserves base. The revisions included an increase of 312 MMBOE related to successful infill drilling in large onshore areas, 77 MMBOE of revisions to prior estimates, and 29 MMBOE associated with higher oil and gas prices. These positive revisions were partially offset by the transfer of 143 MMBOE of PUDs to unproved categories as a result of changes to development plans during 2010. Total revisions in 2009 were 173 MMBOE or 8% of the beginning-of-year reserves base. The revisions included an increase of 125 MMBOE related to successful infill drilling in large onshore areas and 87 MMBOE of revisions to prior estimates. The 2009 revisions also included a decrease of 39 MMBOE caused by lower natural-gas prices.
Sales in Place In 2011, the Company sold U.S. properties containing 7 MMBOE of proved developed reserves and 22 MMBOE of proved undeveloped reserves. This included a sale of working interest in the Maverick basin as well as sales of assets in South Texas and Alaska. In 2010, the Company sold properties located in the United States and Egypt that held 5 MMBOE of proved developed reserves and 1 MMBOE of proved undeveloped reserves. In 2009, the Company sold properties located primarily in the Rockies, which accounted for 14 MMBOE of developed properties and 10 MMBOE of undeveloped properties.
Discounted Future Net Cash Flows At December 31, 2011, the discounted estimated future net cash flows (at 10%) from Anadarko’s proved reserves was $26.5 billion (measured in accordance with the regulations of the Securities and Exchange Commission (SEC) and the Financial Accounting Standards Board (FASB)). This amount was calculated based on the 12-month average beginning-of-month prices for the year, held flat for the life of the reserves, adjusted for any contractual provisions. The increase of $5.0 billion or 23% in 2011 compared to 2010 is primarily due to an increase in liquids prices and positive revisions of previous reserves estimates. SeeSupplemental Information under Item 8 of this Form 10-K.
The present value of future net cash flows does not purport to be an estimate of the fair value of Anadarko’s proved reserves. An estimate of fair value would also take into account, among other things, anticipated changes in future prices and costs, the expected recovery of reserves in excess of proved reserves and a discount factor more representative of the time value of money and the risks inherent in producing oil and natural gas.
LIQUIDITY AND CAPITAL RESOURCES
OverviewOverview Anadarko generates cash needed to fund capital expenditures, debt-service obligations, and dividend payments primarily from operating activities, and enters into debt and equity transactions to maintain theits desired capital structure and to finance acquisition opportunities. Liquidity may also be enhancedThe Company has a variety of funding sources available, including cash on hand, an asset portfolio that provides ongoing cash-flow-generating capacity, opportunities for liquidity enhancement through asset divestitures and joint venturesjoint-venture arrangements that reduce future capital expenditures.
Consistentexpenditures, commercial paper, and the Company’s New Credit Facilities. In addition, as of January 2014, an effective registration statement is available to Anadarko covering the sale of up to 40 million WGP common units. These common units were issued to Anadarko in connection with this approach,WGP’s IPO in December 2012. During 2014, the Company sold 6 million WGP common units and at December 31, 2014, the Company had 34 million units available for sale.
During 2014, the primary source for funding of capital investments was cash flows from operating activities were the primary source for capital investment funding during 2011.activities. The Company continuously monitors its liquidity needs, coordinates its capital expenditure program with its expected cash flows and projected debt-repayment schedule, and evaluates available funding alternatives in light of current and expected conditions. At December 31, 2011, the Company2014, Anadarko had outstanding borrowings of $2.5 billion at a rate of 1.79% under the $5.0 billion Facility. These borrowings were used to fund a portion of the Company’s $4.0 billion payment to BP pursuant to the Settlement Agreement. The Company plans to repay these borrowings with a portion of the proceeds from the monetization of certain assets, potentially including onshore domestic properties, Indonesian properties, and its Brazilian subsidiary.At December 31, 2011, Anadarko’sno scheduled 2012 debt maturities were $170 million. In addition,during the next year. Anadarko’s Zero-Coupon Senior Notes due 2036 (Zero Coupons) can be put to the Company in October 2012,of each year, in whole or in part, for the then-accreted value, which will be $796 million at the next put date in October 2015. The Zero Coupons are classified as discussed below. Thelong-term debt on the Company’s Consolidated Balance Sheets, as the Company has a variety of funding sources availablethe ability and intent to satisfyrefinance these obligations including cashusing long-term debt. See
Note 12—Debt and Interest Expense in the Notes to Consolidated Financial Statements under Item 8 of this Form 10-K for additional information on hand, an asset portfolio that provides ongoing cash-flow-generating capacity, opportunities for liquidity enhancement through divestitures and joint-venture arrangements, and remaining available capacity under the $5.0Zero Coupons. Anadarko’s scheduled 2016 debt maturities are $1.8 billion, Facility. exclusive of the Zero Coupons. Management believes that the Company’s liquidity position, asset portfolio, and
continued strong operating and financial performance provide the necessary financial flexibility to fund
the Company’s current
and long-term operations.
Tronox Adversary Proceeding Settlement Payment In April 2014, Anadarko and Kerr-McGee entered into a settlement agreement to resolve all claims asserted in the Tronox Adversary Proceeding for $5.15 billion. In addition, the Company agreed to pay interest on the above amount from April 3, 2014, through the payment of the settlement, with an annual interest rate of 1.5% for the first 180 days and 1.5% plus the one-month LIBOR thereafter. In January 2015, the Company paid $5.2 billion after the settlement agreement became effective. See Note 17—Contingencies—Tronox Litigation in the Notes to Consolidated Financial Statements under Item 8 of this Form 10-K.
Revolving Credit Facility Borrowings underFacilities and Commercial Paper Program During 2014, the Company maintained the $5.0 billion Facility bear interest, at the Company’s election, at (i) the London Interbank Offered Rate (LIBOR) plus a margin ranging from 1.25% to 2.50%, based on the Company’s credit rating, or (ii) the greatest of (a) the JPMorgan Chase Bank, N.A. prime rate, (b) the Federal Funds Effective Rate plus 0.50%, or (c) one-month LIBOR plus 1%, plusmaturing in each case, an applicable margin ranging from 0.25% to 1.50%.September 2015. Obligations incurred under the $5.0 billion Facility, as well as obligations Anadarko has to lenders or their affiliates pursuant to certain derivative instruments as discussed inNote 10—11—Derivative Instruments in theNotes to Consolidated Financial Statements under Item 8 of this Form 10-K, arewere guaranteed by certain of the Company’s wholly owned domestic subsidiaries, and arewere secured by a perfected first-priority security interest in certain exploration and production assets located in the United States and 65% of the capital stock of certain wholly owned foreign subsidiaries. TheDuring 2014, the Company had available borrowing capacity of $2.1 billion at year-end 2011 ($5.0 billion maximum capacity, less $2.5 billion ofno outstanding borrowings under the $5.0 billion Facility.
In June 2014, Anadarko entered into a $3.0 billion five-year senior unsecured revolving credit facility (Five-Year Facility), which is expandable to $4.0 billion, and
$400 milliona $2.0 billion 364-day senior unsecured revolving credit facility (364-Day Facility). The New Credit Facilities replaced the $5.0 billion Facility upon satisfaction of
letter-of-credit capacity maintained pursuantcertain conditions, including the January 2015 settlement payment related to the
Tronox Adversary Proceeding. Under the New Credit Facilities, the Company’s derivative counterparties no longer maintain security interests in any of the Company’s assets. As a result, the Company may be required from time to time to post collateral of cash or letters of credit based on the negotiated terms of the
LOC Facility discussed below).During 2011,individual derivative agreements.
In January 2015, the Company entered into the LOC Facility. Compensating balances deposited with the financial institution provide for reduced feesborrowed $1.5 billion under the LOC364-Day Facility. These compensating balances may be withdrawnBorrowings under the New Credit Facilities generally bear interest under one of two rate options, at any time, resultingAnadarko’s election, using either LIBOR (or Euro Interbank Offered Rate in higher fees. Cashthe case of borrowings under the Five-Year Facility denominated in Euro) or an alternate base rate, in each case plus an applicable margin ranging from 0.00% to 1.65% for the Five-Year Facility and cash equivalents includes $328 million of demand deposits serving as compensating balances0.00% to 1.675% for outstanding letters ofthe 364-Day Facility. The applicable margin will vary depending on Anadarko’s credit at December 31, 2011. The LOC Facility requiresratings.
In January 2015, the Company
initiated a commercial paper program, which allows a maximum of $3.0 billion of unsecured commercial paper notes. The maturities of the commercial paper notes vary, but may not exceed 397 days. The commercial paper notes are sold under customary terms in the commercial paper market and are issued either at a discounted price to
maintaintheir principal face value or will bear interest at varying interest rates on a
senior debt revolving credit facility with minimum commitments of at least $1.0 billionfixed or floating basis. Such discounted price or interest amounts are dependent on market conditions and the
availabilityratings assigned to
issue lettersthe commercial paper program by credit rating agencies at the time of
creditissuance of
at least $400 million.the commercial paper notes.
Financial Covenants The $5.0 billion Facility containscontained various customary covenants with which Anadarko musthad to comply, including, but not limited to, limitations on incurrence of indebtedness, liens on assets, and asset sales. Anadarko iswas also required to maintain, at the end of each quarter, (i) a Consolidated Leverage Ratio of no more than 4.5 to 1.0 (relative to Consolidated EBITDAX for the most recent period of four calendar quarters), (ii) a ratio of Current Assets to Current Liabilities of no less than 1.0 to 1.0, and (iii) a Collateral Coverage Ratio of no less than 1.75 to 1.0, in each case, as defined in the $5.0 billion Facility. The Collateral Coverage Ratio iswas the ratio of an annually redetermined value of pledged assets to outstanding loans under the $5.0 billion Facility. Additionally, to borrow from the $5.0 billion Facility, the Collateral Coverage Ratio musthad to be no less than 1.75 to 1.0 after giving pro forma effect to the requested borrowing. At December 31, 2011, the Company was in compliance with all applicable covenants, and there were no restrictions on its ability to utilize the available capacity of the $5.0 billion Facility. The covenants contained in certain of the Company’s credit agreements provide for a maximum
Anadarko debt-to-capitalization ratio of 67%. The covenants do not specifically restrict the payment of dividends; however, the impact of dividends paid on the Company’s debt-to-capitalization ratio must be considered
in order to ensure covenant compliance. At December 31,
2011,2014, Anadarko was in compliance with all financial covenants.
Zero-Coupon Notes In
The New Credit Facilities contain certain customary affirmative and negative covenants, including a 2006 private offering, Anadarko received $500 millionfinancial covenant requiring maintenance of loan proceeds upon issuing the Zero Coupons. The Zero Coupons mature in October 2036a consolidated indebtedness to total capitalization ratio of no greater than 65%, and have an aggregate principal amount due at maturitylimitations on certain secured indebtedness, sale-and-leaseback transactions, and mergers and other fundamental changes.
Index to Financial StatementsThe Company considers its cash-flow-generating capacity and access to additional liquidity sufficient to continue to satisfy the Company’s debt-service and other obligations, including the potential early repayment of the outstanding Zero Coupons.
WES Funding Sources WES, a Anadarko’s consolidated subsidiary, of the Company, primarilyWES, uses cash flows from operations to fund ongoing operations (including capital investments in the ordinary course of business), service its debt, and make distributions to its equity holders. As needed, WES supplements cash generated from its operating activities with proceeds from debt or equity issuances or borrowings under its five-year $1.2 billion senior unsecured revolving credit facility (RCF).
In February 2014, WES entered into the RCF, which amended and restated its then-existing $800 million senior unsecured revolving credit
facility maturingfacility. The RCF matures in
March 2016 (RCF).During 2011, WES entered into its RCF which amendedFebruary 2019 and restated its $450 million senior unsecured revolving credit facility.is expandable to a maximum of $1.5 billion. Borrowings under the RCF bear interest at (i) LIBOR plus an applicable margin ranging from 1.30%0.975% to 1.90%1.45%, depending on WES’s credit rating, or (ii) the greatest of (a) the Wells Fargo Bank, National Association prime rate, (b) the Federal Funds Effective Rate plus 0.50%, or (c) one-month LIBOR plus 1%, plus, in each case, an applicable margin ranging from 0.30%0.00% to 0.90%0.45%. At December 31, 2011,2014, WES was in compliance with all covenants contained in theits RCF, had no outstanding borrowings under theits RCF of $510 million at an interest rate of 1.47%, and had the entire $800available borrowing capacity of approximately $677 million ($1.2 billion capacity, less $510 million of RCF borrowing capacity available. SeeFinancing Activities below.
outstanding borrowings and $13 million of outstanding letters of credit).
In August 2014, WES filed a registration statement with the Securities and Exchange Commission authorizing the issuance of up to an aggregate of $500 million of common units, in amounts, at prices, and on terms to be determined by market conditions and other factors at the time of the offerings.
Insurance Coverage and Other Indemnities Anadarko maintains property and casualty insurance that includes coverage for physical damage to the Company’s properties, blowout/control of a well, restoration and redrill, sudden and accidental pollution, third-party liability, workers’ compensation and employers’ liability, and other risks. Anadarko’s insurance coverage includes deductibles that must be met prior to recovery. Additionally, the Company’s insurance is subject to exclusions and limitations, and there is no assurance that such coverage will adequately protect the Company against liability or loss from all potential consequences and damages. The Company’s current insurance coverage
which was obtained subsequent to the Deepwater Horizon events, includes
(a) $400 million per occurrence from Oil Insurance Limited (OIL) for physical damage to Anadarko’s properties on a replacement cost
basis; $750 million for an offshorebasis, blowout/control of
a well,
restoration and redrill, and
sudden and accidental pollution; (b) $700 million per occurrence from the commercial markets for the items described in item (a) above, which is in excess of the OIL coverage and which follows the form of OIL coverage with certain exceptions; (c) $400 million from the commercial markets, which scales to Anadarko’s working interest, for third-party liabilities including sudden and accidental pollution
from an offshore blowout ($75 million for onshore);and aviation liability; and (d) $275 million for aircraft
liability; and $675 million for third-party liabilities (including sudden and accidental pollution). The Company’s total limit is approximately $1.425 billion (which is reduced proportionallyliability (in addition to the
Company’s participating interestthird-party liability limits described in
a venture except for the $750 million portion dealing with an offshore blowout, whichitem (c) above). Anadarko does not
reduce below a 50% participating interest subject to certain reporting requirements) for the negative environmental impacts of an offshore blowout. There is currently nocarry significant coverage for loss of production income from any
of the Company’s facilities or for
physical damage to the Company’s properties, blowout/control of a well, or restoration and redrill to the extent these itemsany losses that result from the effects of a named windstorm.
Anadarko’s property and casualty insurance policies renew in June of each year, with the next renewals scheduled for June 2012. At that time, the Company may not be able to secure similar coverage for the same costs, if at all. Future insurance coverage costs for the oil and gas industry could increase and may include higher deductibles or retentions. In addition, some forms of insurance may become unavailable in the future or unavailable on terms that the Company considers economically acceptable.
The Company’s service agreements, including drilling contracts, generally indemnify Anadarko for injuries and death to employees of the service provider and subcontractors hired by the service provider as well as for property damage suffered by the service provider and its contractors. Also, these service agreements generally indemnify Anadarko for pollution originating from the equipment of any contractors or subcontractors hired by the service provider.
Following is a discussion of significant sources and uses of cash flows for the three-year period ended December 31, 2011.2014. Forward-looking information related to the Company’s liquidity and capital resources is discussed inOutlook that follows.
Operating ActivitiesAnadarko’s cash flows from operating activities in 20112014 was $2.5$8.5 billion compared to $5.2$8.9 billion in 20102013 and $3.9$8.3 billion in 2009.2012. Cash flows from operating activities for 20112014 decreased primarilyyear over year due to $730 million of cash received in 2013 associated with the $4.0 billionAlgeria exceptional profits tax settlement, a $520 million income tax payment to BP related toin 2014 associated with the Settlement Agreement. Also contributing to the decline wereCompany’s divestiture of a 10% working interest in Offshore Area 1 in Mozambique, lower average oil and NGLs prices, lower natural-gas prices, increasedvolumes, higher operating expenses, primarily due to other taxes (which increased as a result of higher sales volumes and commodity prices), and the unfavorable impact of changes in working capital items. These decreases were partiallysubstantially offset by higher crude-oilaverage natural-gas prices, higher sales volumes for oil and NGLs, prices and higher sales volumes.net cash received in settlement of commodity derivative instruments. Cash flows from operating activities for 20102013 increased year over year primarily due to higher commodity prices, higher sales volumes, higher average natural-gas prices, and the favorable impact of changes in working capital items. These increases were partially offset by lower average oil and NGLs prices and a decrease in cash collected in 2013 associated with the Algeria exceptional profits tax receivable. One of the primary sources of variability in the Company’s cash flows from operating activities is fluctuation in commodity prices,
the impact of which Anadarko partially mitigates by entering into commodity derivatives. Sales-volume changes also impact cash flow, but
historically have not been as volatile as commodity prices. Anadarko’s
long-term cash flows from operating activities
is dependent on commodity prices, sales volumes,are also impacted by the costs
required forrelated to continued operations and debt service.
Investing ActivitiesDuring 2011, 2010, and 2009, Anadarko received pretax sales proceeds related to property divestiture transactions of $555$5.0 billion in 2014, $567 million $70in 2013, and $657 million in 2012. The increase in 2014 was primarily related to the Company’s divestitures of a 10% working interest in Offshore Area 1 in Mozambique for $2.64 billion, its Chinese subsidiary for $1.075 billion, its interest in the Pinedale/Jonah assets in Wyoming for $581 million, and $176 million before income taxes, respectively, related toits interest in the nonoperated Vito deepwater development, along with several property divestiture transactions.surrounding exploration blocks in the Gulf of Mexico, for $500 million.
Financing ActivitiesDuring 2011, Anadarko borrowed $2.5 billion at a rate of 1.79% under the $5.0 billion Facility to fund a portion of the $4.0 billion payment to BP associated with the Settlement Agreement (seeDeepwater Horizon Settlement Costs below). In 2011, WES, a2014, Anadarko’s consolidated subsidiary, of Anadarko,WES, borrowed $320 million$1.2 billion under its RCF primarily to partially fund a third-party asset acquisitionits acquisitions of DBM and $250Anadarko’s interests in Texas Express Pipeline LLC, Texas Express Gathering LLC, and Front Range Pipeline LLC and for other general partnership purposes, including the funding of capital expenditures. During 2014, WES completed public offerings of $100 million under its RCFaggregate principal amount of 2.600% Senior Notes due 2018 and $400 million aggregate principal amount of 5.450% Senior Notes due 2044. These proceeds were used to repay the senior unsecured term loan (Term Loan) as discussed inUses of Cash. Also, during 2011,borrowings under WES’s RCF and for general partnership purposes. During 2014, WES issued approximately 10 million common units to the public, raising total net proceeds of $328$691 million. The proceeds were used to partially fund a portion of its DBM acquisition. WES used all the capacity to issue units under the $125 million continuous offering program as of the end of the third quarter of 2014.
During 2014, Anadarko sold approximately 6 million WGP common units to the public, raising net proceeds of $335 million. Also, during 2014, Anadarko completed public offerings of $625 million aggregate principal amount of 3.450% Senior Notes due 2024 and $625 million aggregate principal amount of 4.500% Senior Notes due 2044. These proceeds were used for general corporate purposes.
During 2013, WES borrowed $710 million under its RCF, primarily to fund the 2013 acquisitions of an interest in certain gas-gathering systems located in the Marcellus shale in north-central Pennsylvania and an intrastate pipeline in southwestern Wyoming, and for other general partnership purposes, including the funding of capital expenditures. During 2013, WES also issued approximately 12 million common units to the public, including the $125 million continuous offering program. These offerings raised net proceeds of $725 million, which
waswere primarily used to repay outstanding RCF borrowings and for other general partnership
purposes. In addition, during 2011,purposes, including funding of WES’s capital expenditures. Also in 2013, WES completed a public offering of
$500$250 million aggregate principal amount of
5.375%2.600% Senior Notes due
2021,2018, with net proceeds from the offering used to repay
amounts then outstanding
borrowings under its RCF.
During
2010, the Company received net proceeds of $2.7 billion related to the issuance of $2.8 billion in aggregate principal amount of senior notes and used the net proceeds, combined with cash on hand, to redeem $3.0 billion aggregate principal amount of 2011 and 2012,
debt maturities. SeeUses of Cash for further information about debt repayments.In connection with entering into the $5.0 billion Facility in 2010 the Company paid upfront underwriting, structuring, arrangement, and other costs totaling $172 million.
During 2010, WES borrowed a total of $670$374 million under its Term Loan and RCF, primarily to fund the acquisition of certain midstream assets from Anadarko. Also during 2012, WES alsocompleted a public offering of $670 million aggregate principal amount of 4.000% Senior Notes due 2022 and issued approximately 13five million common units in two 2010to the public, offerings, realizingraising net proceeds of $338 million, which$212 million. Proceeds from these public offerings were used to repay a portion of outstanding RCF borrowings.
During 2009, Anadarko raised $2.0 billionborrowings and for other general partnership purposes, including the funding of capital expenditures.
In December 2012, WGP completed its IPO of approximately 20 million common units representing limited partner interests in
connection with the public offeringWGP at a price of
senior notes and an additional $1.3 billion in connection with the public offering$22.00 per common unit, for net proceeds of
30 million shares of common stock. Proceeds from the offerings$411 million. The proceeds were used
by WGP to
fund the retirement of outstanding Floating Rate Notespurchase common and
general partner units in WES, and were in turn used by WES for general
corporate purposes.partnership purposes, including the funding of WES capital expenditures.
Anadarko invests significant capital to
develop, acquire,
and explore
and developfor oil and natural-gas resources and
to expand its midstream
infrastructure, in additioninfrastructure. The Company also uses cash to
fundingfund ongoing operating costs,
including interest cost and taxes, makingcapital contributions to equity investments, debt repayments, and
paying dividendsdistributions to its shareholders.
Capital ExpendituresThe following table presents the Company’s capital expenditures by category.category: | | | 00000 | | | | 00000 | | | | 00000 | |
| millions | | 2011 | | | 2010 | | | 2009 | |
Property Acquisitions | | | | | | | | | | | | |
Exploration | | $ | 647 | | | $ | 519 | | | $ | 279 | |
Development | | | — | | | | 22 | | | | 266 | |
Exploration | | | 1,469 | | | | 1,278 | | | | 1,229 | |
Development | | | 3,525 | | | | 3,267 | | | | 2,886 | |
| | | | | | | | | | | | |
Total oil and gas costs incurred(1) | | | 5,641 | | | | 5,086 | | | | 4,660 | |
Less: Corporate acquisitions and non-cash property exchanges | | | (17 | ) | | | (37 | ) | | | (284 | ) |
Less: Asset retirement costs | | | (148 | ) | | | (86 | ) | | | (63 | ) |
Less: Geological and geophysical, exploration overhead, delay rentals expenses, and other expenses | | | (450 | ) | | | (291 | ) | | | (312 | ) |
| | | | | | | | | | | | |
Total oil and gas capital expenditures | | | 5,026 | | | | 4,672 | | | | 4,001 | |
Gathering, processing, and marketing and other(2) | | | 1,527 | | | | 497 | | | | 557 | |
| | | | | | | | | | | | |
Total capital expenditures(1) | | $ | 6,553 | | | $ | 5,169 | | | $ | 4,558 | |
| | | | | | | | | | | | |
|
| | | | | | | | | | | |
| millions | 2014 | | 2013 | | 2012 |
| Property acquisitions | | | | | |
| Exploration | $ | 283 |
| | $ | 327 |
| | $ | 239 |
|
| Development | 3 |
| | 324 |
| | — |
|
| Exploration | 1,711 |
| | 1,970 |
| | 2,064 |
|
| Development | 6,715 |
| | 4,865 |
| | 4,064 |
|
Total oil and gas costs incurred (1) | 8,712 |
| | 7,486 |
| | 6,367 |
|
| Less corporate acquisitions and non-cash property transactions | (1 | ) | | 6 |
| | 32 |
|
| Less asset retirement costs | 347 |
| | 180 |
| | 98 |
|
| Less geological and geophysical, exploration overhead, delay rentals expenses, and other expenses | 543 |
| | 430 |
| | 401 |
|
| Total oil and gas capital expenditures | 7,823 |
| | 6,870 |
| | 5,836 |
|
Gathering, processing, and marketing and other (2) | 1,433 |
| | 1,653 |
| | 1,475 |
|
Total capital expenditures (1) | $ | 9,256 |
| | $ | 8,523 |
| | $ | 7,311 |
|
_______________________________________________________________________________
| |
(1) | Oil and gas costs incurred represent costs related to finding and developing oil and gas reserves. Costs associated with activities of the Company’s midstream and marketing reporting segments, LNG facilities costs, and other corporate activities are not included in oil and gas costs incurred. Capital expenditures represent additions to property and equipment excluding corporate acquisitions and non-cash property exchanges,transactions and asset retirement costs. Capital expenditures and costs incurred are presented on an accrual basis. Additions to properties and equipment and dry hole costs on the Consolidated Statements of Cash Flows include certain adjustments that give effect to the timing of actual cash payments in order to provide a cash-basis presentation. |
| |
(2) | Includes WES capital expenditures of $439$696 million $81in 2014, $792 million in 2013, and $32$529 million for 2011, 2010, and 2009, respectively.in 2012. |
The Company’s capital spendingexpenditures increased 27%by 9% for the year ended December 31, 2011. Anadarko increased its ownership interest in the Wattenberg Plant to 100% by acquiring an additional 93% interest for $576 million in May 2011. Also, during the first quarter of 2011, WES acquired Platte Valley from a third party for $302 million. These acquisitions, along with future expansion plans, align Anadarko’s natural-gas processing capacity with the Company’s anticipated production growth in the Rockies. In addition, these acquisitions position the Company to improve field recoveries and realize operational cost efficiencies. The increase to capital expenditures was also2014, due to increased development drilling costsprimarily in the Wattenberg field of $258$663 million and in the Eagleford shale of $546 million and to a spar lease buyout of $110 million in the Gulf of Mexico. The increase in the Eagleford shale was primarily due to the 2013 development drilling being funded by a third party as a result of a carried-interest agreement that was fully funded in June 2013. These 2014 increases were partially offset by 2013 acquisitions of certain oil and gas properties and related assets in the Moxa area of Wyoming for $310 million, primarily relatedrepresenting the fair value of the oil and gas properties acquired, and the acquisition of a 33.75% interest in gas-gathering systems located in the Marcellus shale in north-central Pennsylvania from a third party by WES for $135 million.
In the third quarter of
$1912014, the Company entered into a carried-interest arrangement that requires a third party to fund $442 million
primarily resulting from exploration drillingof Anadarko’s capital costs in
Ghana.exchange for a 34% working interest in the Eaglebine development, located in Southeast Texas. The third-party funding is expected to cover Anadarko’s future capital costs in the development through 2016. At December 31, 2014, $22 million of the total $442 million obligation had been funded.
The Company’s capital spending increased 13%by 17% for the year ended December 31, 2010, primarily2013, due to an increase in exploration lease acquisitions onshore and offshore United States, higher development drilling onshore and increased expendituresoffshore in the United States and acquisitions of oil and gas development properties and domestic onshore plants and gathering systems. In 2013, Anadarko exchanged certain oil and gas properties in the Wattenberg field with a third party to enhance the Company’s core acreage position, in which $106 million of capital was incurred. Also in 2013, Anadarko acquired certain oil and gas properties and related assets in the Moxa area of Wyoming for $310 million, primarily representing the fair value of the oil and gas properties acquired. In 2013, WES acquired a 33.75% interest in gas-gathering systems for $135 million and an intrastate pipeline in southwestern Wyoming for $28 million. These increases were offset by lower capital spending associated with decreased exploration drilling in West Africa and U.S. onshore and lower capital requirements to Anadarko related to construction in Algeria. development projects as a result of the carried-interest arrangements discussed below.
In early 2009,2013, the Company began focusingentered into a carried-interest arrangement that requires a third party to fund $860 million of Anadarko’s capital costs in exchange for a 12.75% working interest in the Heidelberg development, located in the Gulf of Mexico. The third-party funding is expected to cover the substantial majority of Anadarko’s expected future capital costs through first production, which is expected to occur by mid-2016. At December 31, 2014, $386 million of the total $860 million obligation had been funded.
In the third quarter of 2012, the Company entered into a carried-interest arrangement that required a third party to fund $556 million of Anadarko’s capital costs in exchange for a 7.2% working interest in the Lucius development, located in the Gulf of Mexico. During the second quarter of 2014, as dictated by the Unitization and Participation Agreement, the working interests of all partners in the Lucius development were recalculated. As a result, Anadarko’s working interest in the Lucius development was reduced from 27.8% to 23.8% and its capital
investments toward areasexpenditures were reduced by $44 million due to the re-determination. In addition, the working interest of the third party that participated in the carried-interest arrangement was reduced from 7.2% to 6.2%, which resulted in a reduction in the funding commitment from $556 million to $476 million. The funding commitment, which was fully funded during the second quarter of 2014, covered the substantial majority of the Company’s
portfolio that have a higher liquids component and infrastructure advantages that enable Anadarko to extract higher-value liquids and access premium markets.SeeOutlook below for information regarding sources of cash used to fund capital expenditures for 2012.
Deepwater Horizon Settlement CostsIn October 2011, the Company and BP entered into the Settlement Agreement related to the Deepwater Horizon events. The Company paid $4.0 billion and transferred its interestcosts through first production, which occurred in the Macondo well and Lease to BP. Refer toNote 2—Deepwater Horizon Events in the Notes to Consolidated Financial Statements under Item 8fourth quarter of this Form 10-K for additional information.
2014.
Pension Contributions During the year ended December 31, 2011,2014, the Company made contributions of $301$106 million to its funded pension plans, $10$15 million to its unfunded pension plans, and $17$15 million to its unfunded other postretirement benefit plans, which are included in Operating Activities in the Consolidated Statement of Cash Flows. Contributions to the funded pension plans decreased in 2014 as a result of favorable asset returns in 2013. Contributions made to the unfunded pension plans in 2014 were lower as a result of higher funding in 2013 related to the retirement of the Company’s former Chief Executive Officer. The Company expects to contribute $5 million to its funded pension plans, $24 million to its unfunded pension plans, and $16 million to its unfunded other postretirement benefit plans in 2015.
During 2013, the Company made contributions of $123 million to its funded pension plans, $37 million to its unfunded pension plans, and $14 million to its unfunded other postretirement benefit plans. The increase in contributions to the funded pension plans during 2011in 2013 resulted from lowera decrease in the discount rates comparedused for funding purposes.
During 2012, the Company made contributions of $101 million to its funded pension plans, $6 million to its unfunded pension plans, and $19 million to its unfunded other postretirement benefit plans. The decrease in contributions to the prior measurement period,funded pension plans in 2012 resulted from an increase in the discount rates used for funding purposes.
Investments During 2014, the Company made capital contributions of $167 million related to equity investments, which increasedare included in Other—net under Investing Activities in the pension liabilityConsolidated Statement of Cash Flows. These contributions were primarily associated with joint ventures for a gas processing plant, marine well containment, and pipelines. The Company made capital contributions related to equity investments of $396 million in 2013, which were primarily associated with joint ventures to build the corresponding funding target.Front Range Pipeline, the Texas Express Pipeline, and two fractionation trains in Mont Belvieu. The Company made capital contributions related to equity investments of $205 million in 2012.
Debt Retirements and Repayments During 2011,2014, Anadarko repaid $775 million of Senior Notes that matured during 2014. Also, WES repaid $619$650 million of borrowings under its RCF and a $250 million Term Loan primarily fromwith proceeds from public debt and equity offerings, as discussed inSources of Cash. In addition,Cash. During 2013, WES repaid $710 million of borrowings under its RCF with proceeds from debt and equity offerings. During 2012, the Company repaid $285the entire $2.5 billion of borrowings under its $5.0 billion Facility, and retired $131 million principal amount of 6.875%6.125% Senior Notes that matured in September 2011.March 2012 and $39 million of 5.000% Senior Notes that matured in October 2012. In 2010, the Company used $1.6 billion to repay the Midstream Subsidiary Note and $1.5 billion, including $86 million for early-tender premiums, to redeem senior notes scheduled to mature in 2011 and 2012. The repayments were funded with proceeds from new borrowings, as well as cash on hand. Also in 2010,addition, WES repaid $371$374 million outstandingof borrowings under its RCF primarily from proceeds related to its public offerings discussed inSources of Cash.RCF.
In 2009, using a portion of proceeds from new debt issuances, the Company repaid an aggregate principal amount of $1.6 billion of debt, including $1.4 billion in aggregate principal amount of Floating-Rate Notes due in 2009.
For additional information on the Company’s debt instruments, such as transactions during the period, years of maturity, and interest rates, seeNote 12—Debt and Interest Expense in theNotes to Consolidated Financial Statementsunder Item 8 of this Form 10-K.
Common Stock Dividends and Distributions to Noncontrolling WES Interest Owners In 2011, 2010, and 2009, Anadarko paid $181 million, $180 million, and $176 million, respectively, in dividends to its common stockholders (nine centsof $505 million in 2014, $274 million in 2013, and $181 million in 2012. The Company increased the quarterly dividend paid to common stockholders from $0.09 per share to $0.18 per quarter).share during the third quarter of 2013. During the second quarter of 2014, Anadarko increased the quarterly dividend paid to common stockholders from $0.18 per share to $0.27 per share. Anadarko has paid a dividend to its common stockholders quarterly since becoming an independenta public company in 1986. The amount of future dividends paid to Anadarko common stockholders will be determined by the Board of Directors on a quarterly basis and will depend on earnings, financial conditions, capital requirements, the effect a dividend payment would have on the Company’s compliance with relevant financial covenants, and other factors.Anadarko’s consolidated subsidiary,
WES distributed to its unitholders, other than Anadarko, an aggregate of $72$175 million $42in 2014, $130 million in 2013, and $26$100 million during 2011, 2010, and 2009, respectively.in 2012. WES has made quarterly distributions to its unitholders since its initial public offeringIPO in the second quarter of 2008 and has increased its distribution from $0.30 per common unit for the third quarter of 2008 to $0.44$0.70 per common unit for the fourth quarter of 2011.Other During 2011,2014 (paid in February 2015). WGP distributed to its unitholders, other than Anadarko, an aggregate of $24 million during 2014 and $12 million in 2013. WGP declared a cash distribution of $0.31250 per unit for the Company and its partnersfourth quarter of 2014 (to be paid in the Jubilee project in Ghana purchased the FPSO. The Company’s cash contribution was $108 million.February 2015).
Outlook
Oil, natural-gas, and NGLs prices can have significant price fluctuations. The Company’s revenues, operating results, cash flows from operations, capital spending, and future growth rates are highly dependent on the prices the Company receives for oil, natural gas, and NGLs. During 2014, New York Mercantile Exchange West Texas Intermediate oil prices ranged from a high of $107.26 per barrel to a low of $53.27 per barrel at the end of 2014. The duration and magnitude of the decline in oil prices cannot be predicted.
The Company has a deep portfolio of investment opportunities and the financial strength and operational flexibility to move capital spending from areas focused on near-term production growth to areas focused on longer-term growth where anticipated returns are less sensitive to spot oil and natural-gas prices. The recent decline in oil prices may result in the Company significantly reducing its capital expenditures in 2015 versus 2014. The Company will continue to evaluate the oil and natural-gas price environments and may adjust its capital spending plans as prices fluctuate while maintaining the appropriate liquidity and financial flexibility.
OutlookThe Company is committed to the execution of its worldwide exploration, appraisal, and development programs. The Company currently plans to allocate approximately 65% of its 2015 capital spending to development activities, 15% to exploration activities, and 20% to gas-gathering and processing activities and other business activities. The Company currently expects its 2015 capital spending by area to be approximately 55% for the U.S. onshore region and Alaska, 10% for the Gulf of Mexico, 20% for Midstream and other, and 15% for International.
Anadarko believes that its cash on hand,
available borrowing capacity, and expected level of operating cash flows will be sufficient to fund the Company’s projected operational and capital programs for
2012, while continuing2015 and continue to meet its other
current obligations. The Company’s cash on hand is available for
use. If capital expenditures exceed operating cash flowsuse and
cash on hand, additional funding would likelycould be supplemented, as needed,
through borrowings under the $5.0 billion Facility, which provides available borrowing capacity of $2.1 billion ($5.0 billion maximum capacity, less $2.5 billion of outstanding borrowings and $400 million of letter-of-credit capacity maintained pursuant to the terms of the LOC Facility). The Company currently does not consider European sovereign debt events to pose significant risk to the Company’s ability to accesswith available borrowing capacity under the
$5.0 billion Facility.New Credit Facilities and the commercial paper program. The Company may also enter into
joint-venturecarried-interest arrangements
andwith third parties to fund certain capital expenditures, execute asset divestitures,
and sell a portion of the WGP common units that it owns in order to supplement cash flow.
The Company is marketing certain onshore domestic properties, Indonesian properties, and its Brazilian subsidiary, in order to redirect its operating activities and capital investment to other areas and to repay borrowings under the $5.0 billion Facility.The Company continuously monitors its liquidity needs, coordinates its capital expenditure program with its expected cash flows and projected debt-repayment schedule, and evaluates available funding alternatives in light of current and expected conditions. In order toTo reduce commodity-price risk and increase the predictability of 20122015 cash flows, Anadarko entered into strategic derivative positions, which cover a portion of its anticipated natural-gas and crude-oil sales volumes for 2012 and 2013.2015. For details of derivative positions at December 31, 2011,2014, seeNote 10—11—Derivative Instruments in theNotes to Consolidated Financial Statements under Item 8 of this Form 10-K. In 2012, the Company entered into fixed-price swaps consisting of 60 MBbls/d at an average price of $107.20. The Company also entered into three-way collars for 45 MBbls/d, consisting of a sold call at $126, a purchased put at $105, and a sold put at $85, and for 15 MBbls/d, consisting of a sold call at $115, a purchased put at $95, and a sold put at $75.After the Company entered into the Settlement Agreement with BP in October 2011, the various credit rating agencies each reviewed the credit ratings assigned to Anadarko. Moody’s Investors Services placed the Company’s senior unsecured credit rating under review for upgrade. Standard & Poor’s affirmed its rating and revised its outlook from negative to stable. Fitch Ratings made no change to its rating or outlook. Any changes to the Company’s credit ratings could affect the Company’s requirement to provide financial assurance of its performance under certain contractual arrangements and derivative agreements, as well as the Company’s cost of future borrowing and ability to access capital markets.
In the first quarter of 2011, the Company entered into a joint-venture agreement that requires a third-party partner to fund approximately $1.6 billion of Anadarko’s future capital costs in the Eagleford shale, located in southwest Texas, in exchange for a one-third interest in Anadarko’s Eagleford shale assets. The funding began in the second quarter of 2011 and covered $500 million of the Company’s 2011 development costs. The funding covers 90% of Anadarko’s development costs in subsequent years up to a $650 million annual limit. Based on expected activity, the third-party funding is expected to be fully utilized in the second half of 2013. At December 31, 2011, the Company had received $500 million of the total $1.6 billion funding obligation.
In the first quarter of 2010, the Company entered into a joint-venture agreement whereby a third-party partner agreed to fund up to $1.5 billion of Anadarko’s share of future acquisition, drilling, completion, equipment, and other capital expenditures to earn a 32.5% interest in Anadarko’s Marcellus shale assets, primarily located in north-central Pennsylvania. At December 31, 2011, the Company had received $1.0 billion of the total $1.5 billion funding obligation.
Off-Balance Sheet
Off-Balance-Sheet Arrangements
Anadarko may enter into off-balance sheetoff-balance-sheet arrangements and transactions that can give rise to material off-balance sheetoff-balance-sheet obligations. The Company’s material off-balance sheetoff-balance-sheet arrangements and transactions include operating lease arrangements and undrawn letters of credit. ThereIn addition, the Company enters into other contractual agreements in the normal course of business for processing, treating, transportation, and storage of natural gas, oil, and NGLs, as well as for other oil and gas activities as discussed below in Obligations and Commitments. Other than the items discussed above, there are no other transactions, arrangements, or other relationships with unconsolidated entities or other persons that are reasonably likely to materially affect Anadarko’s liquidity or availability of or requirements for capital resources. SeeObligations and Commitments for more information regarding off-balance sheet arrangements.
Obligations and Commitments
The following is a summary of the Company’s obligations at December 31, 2011. | | | 0000000 | | | | 0000000 | | | | 0000000 | | | | 0000000 | | | | 0000000 | |
| | | Obligations by Period | |
| millions | | 2012 | | | 2013-2014 | | | 2015-2016 | | | 2017 and
beyond | | | Total | |
Total debt | | | | | | | | | | | | | | | | | | | | |
Principal—current borrowings | | | $ 170 | | | $ | — | | | $ | — | | | | $ — | | | | $ 170 | |
Principal—long-term borrowings(1) | | | — | | | | 775 | | | | 4,250 | | | | 11,757 | | | | 16,782 | |
Investee entities’ debt(2) | | | — | | | | — | | | | — | | | | 2,853 | | | | 2,853 | |
Interest on borrowings | | | 877 | | | | 1,722 | | | | 1,569 | | | | 8,118 | | | | 12,286 | |
Investee entities’ interest(2) | | | 46 | | | | 158 | | | | 258 | | | | 4,123 | | | | 4,585 | |
Operating leases | | | | | | | | | | | | | | | | | | | | |
Drilling rig commitments | | | 573 | | | | 943 | | | | 829 | | | | 599 | | | | 2,944 | |
Production platforms | | | 46 | | | | 106 | | | | 80 | | | | 168 | | | | 400 | |
Other | | | 77 | | | | 104 | | | | 52 | | | | 45 | | | | 278 | |
Asset retirement obligations | | | 32 | | | | 526 | | | | 90 | | | | 1,120 | | | | 1,768 | |
Midstream and marketing activities | | | 393 | | | | 840 | | | | 783 | | | | 1,547 | | | | 3,563 | |
Oil and gas activities | | | 1,172 | | | | 916 | | | | 550 | | | | 551 | | | | 3,189 | |
Derivative liabilities(3) | | | 421 | | | | 826 | | | | 2 | | | | — | | | | 1,249 | |
Uncertain tax positions, interest, and penalties(4) | | | 18 | | | | 21 | | | | 10 | | | | — | | | | 49 | |
Environmental liabilities | | | 20 | | | | 8 | | | | 3 | | | | 61 | | | | 92 | |
| | | | | | | | | | | | | | | | | | | | |
Total(5) | | | $ 3,845 | | | $ | 6,945 | | | $ | 8,476 | | | | $ 30,942 | | | | $ 50,208 | |
| | | | | | | | | | | | | | | | | | | | |
|
| | | | | | | | | | | | | | | | | | | |
| | Obligations by Period (1) |
| millions | 2015 | | 2016-2017 | | 2018-2019 | | 2020 and beyond | | Total |
| Total debt | | | | | | | | | |
Principal—long-term borrowings (2) | $ | — |
| | $ | 3,750 |
| | $ | 1,874 |
| | $ | 11,063 |
| | $ | 16,687 |
|
| Principal—capital lease obligation | — |
| | — |
| | 1 |
| | 20 |
| | 21 |
|
Investee entities’ debt (3) | — |
| | — |
| | — |
| | 2,853 |
| | 2,853 |
|
| Interest on borrowings | 876 |
| | 1,647 |
| | 1,219 |
| | 7,907 |
| | 11,649 |
|
| Interest on capital lease obligations | 2 |
| | 3 |
| | 3 |
| | 15 |
| | 23 |
|
Investee entities’ interest (3) | 41 |
| | 152 |
| | 199 |
| | 2,574 |
| | 2,966 |
|
| Operating leases | | | | | | | | | |
| Drilling rig commitments | 939 |
| | 1,310 |
| | 460 |
| | 28 |
| | 2,737 |
|
| Production platforms | 33 |
| | 43 |
| | 43 |
| | 51 |
| | 170 |
|
| Other | 50 |
| | 72 |
| | 24 |
| | 8 |
| | 154 |
|
| Asset retirement obligations | 258 |
| | 413 |
| | 180 |
| | 1,202 |
| | 2,053 |
|
| Midstream and marketing activities | 930 |
| | 1,904 |
| | 1,775 |
| | 2,656 |
| | 7,265 |
|
| Oil and gas activities | 1,295 |
| | 1,059 |
| | 426 |
| | 400 |
| | 3,180 |
|
Derivative liabilities (4) | 43 |
| | 1,200 |
| | — |
| | — |
| | 1,243 |
|
Uncertain tax positions, interest, and penalties (5) | 123 |
| | 193 |
| | 5 |
| | 11 |
| | 332 |
|
| Environmental liabilities | 20 |
| | 19 |
| | 9 |
| | 78 |
| | 126 |
|
| Other | 40 |
| | 222 |
| | — |
| | — |
| | 262 |
|
| Total | $ | 4,650 |
| | $ | 11,987 |
| | $ | 6,218 |
| | $ | 28,866 |
| | $ | 51,721 |
|
_______________________________________________________________________________
| |
(1) | Represents
This table does not include the Tronox-related contingent liability, other litigation-related contingent liabilities, or the Company’s pension and postretirement benefit obligations. See Note 17—Contingencies—Tronox Litigation and Note 21—Pension Plans, Other Postretirement Benefits, and Defined-Contribution Plans in the Notes to Consolidated Financial Statements under Item 8 of this Form 10-K. |
| |
(2) | Includes the fully accreted principal amount of the Zero Coupons of approximately $2.4 billion as coming due after 2016.2019. While the Zero Coupons do not mature until 2036, the holder has the right to put the outstanding Zero Coupons can be put to the Company each October, beginning in 2012 atwhole or in part, for the then-accreted value.value. The Company could be required to repurchase the outstanding Zero Coupons at $682$796 million in October 2012.2015 (the next potential put date). |
| |
(2)(3)
| Anadarko has legal right of setoff and intends to net-settle its obligations under each of the notes payable to the investees with the distributable value of its interest in the corresponding investee. Accordingly, the investments and the obligations are presented net on the Consolidated Balance Sheets in other long-term liabilities—other for all periods presented. These notes payable provide for a variable rate of interest, reset quarterly. Therefore, future interest payments presented in the table above are estimated using the forward LIBOR rate curve. Further, the above table does not reflect the preferred return that Anadarko receives on its investment in these entities, which is also LIBOR-based, but with a lower margin than the margin on the associated notes payable. SeeNote 9—10—Equity-Method Investments in theNotes to Consolidated Financial Statements under Item 8 of this Form 10-K. |
| |
(3)(4)
| Represents Anadarko’s gross derivative liability after taking into account the impacts of netting margin and collateral balances deposited with counterparties. SeeNote 10—11—Derivative Instrumentsin theNotes to Consolidated Financial Statementsunder Item 8 of this Form 10-K. |
| |
(4)(5)
| SeeNote 18—Income Taxesin theNotes to Consolidated Financial Statementsunder Item 8 of this Form 10-K. |
(5)
| This table does not include the Company’s pension or postretirement benefit obligations. SeeNote 21—Pension Plans, Other Postretirement Benefits, and Defined-Contribution Plans in theNotes to Consolidated Financial Statements under Item 8 of this Form 10-K.
|
Operating Leases Operating lease obligations include approximately $2.7$2.5 billion related to sixseven offshore drilling vessels and $217$208 million related to certain contracts for U.S. onshore U.S. drilling rigs. Anadarko continues to managemanages its access to rigs in order to executesupport the execution of its drilling strategy over the next several years. Lease payments associated with successfulthe drilling of exploratory wells and development wells, net of amounts billed to partners, arewill initially be capitalized as a component of oil and gas properties. SeeNote 16—Contingencies—Deepwater Drilling Moratoriumproperties, and Other Related Matterseither depreciated or impaired in future periods or written off as exploration expense. At December 31, 2014, the Notes to Consolidated Financial Statements under Item 8 of this Form 10-K for additional information on drilling rigs.
The Company had $678$324 million in various commitments under non-cancelable operating lease agreements for production platforms and equipment, buildings, facilities, compressors, and aircraft.
For additional information, seeNote 15—16—Commitmentsin theNotes to Consolidated Financial Statementsunder Item 8 of this Form 10-K.
Asset Retirement Obligations Anadarko is obligated to fund the costs of disposing of long-lived assets upon their abandonment. The majority of Anadarko’s asset retirement obligations (AROs) relate to the plugging of wells and the related abandonment of oil and gas properties. The Company’s AROs are recorded at estimated fair value, measured by reference to the expected future cash outflows required to satisfy the retirement obligation discounted at the Company’s credit-adjusted risk-free interest rate. Revisions to estimated AROs can result from changes in retirement cost estimates, revisions to estimated inflation rates, and changes in the estimated timing of abandonment.
Midstream and Marketing Activities Anadarko has entered into various processing, transportation, storage, and purchase agreements in order to access markets and provide flexibility for the sale ofto sell its natural gas, crude oil, and NGLs in certain areas.
Oil and Gas Activities At December 31, 2014, Anadarko hashad various long-term contractual commitments pertaining to exploration, development, and production activities that extend beyond 2011.2014. The Company has work-related commitments for, among other things, drilling wells, obtaining and processing seismic data, and fulfilling rig commitments. The preceding table includes long-term drilling and work-related commitments of $3.2 billion, comprised of $2.7approximately $2.0 billion related to the United States and $500 million$1.2 billion related to international locations.
Environmental Liabilities Anadarko is subject to various environmental-remediation and reclamation obligations arising from federal, state, and local laws and regulations. At December 31, 2011,2014, the Company’s balance sheetConsolidated Balance Sheet included a $92$126 million liability for remediation and reclamation obligations, most of which relate to companies acquired by Anadarko.obligations. The Company continually monitors the liability recorded and theongoing remediation and reclamation process,activities, and believes the amount recorded is appropriate. For additional information on environmental issues, seeRisk Factors under Item 1A of this Form 10-K.For additional information on contracts, obligations, and arrangements the Company enters into from time
CRITICAL ACCOUNTING ESTIMATES
In preparing
The preparation of financial statements in accordance with GAAP in the United States requires management makesto make informed judgments and estimates that affect the reported amounts of assets, liabilities, revenues, and liabilities asexpenses. See Note 1—Summary of Significant Accounting Policies in the Notes to Consolidated Financial Statements under Item 8 of this Form 10-K for discussion of the date of the financial statements and the reported amounts of revenues and expenses during the periods reported. Management evaluates its estimates and related assumptions regularly, including those related to the value of properties and equipment; proved reserves; goodwill; intangible assets; asset retirement obligations; litigation reserves; environmental liabilities; pension assets, liabilities, and costs; income taxes; and fair values.Company’s significant accounting policies. Changes in facts and circumstances or additional information may result in revised estimates, and actual results may differ from these estimates. Management considers the following to be its most critical accounting estimates that involve judgment. The selection, development, and developmentdisclosure of these estimates is discussed with the Company’s Audit Committee.Oil and Gas Activities
Anadarko applies the successful efforts method of accounting to account for its oil and gas activities. Under this method, acquisition costs and the costs associated with drilling exploratory wells are capitalized pending the determination of proved oil and gas reserves. Exploration geological and geophysical costs and other costs of carrying properties such as delay rentals are expensed as incurred.
Acquisition Costs
Acquisition costs of unproved properties are periodically assessed for impairment and are transferred to proved oil and gas properties to the extent the costs are associated with successful exploration activities.
Significant undeveloped leases are assessed individually for impairment, based on the Company’s current exploration plans, and a valuation allowance is provided if impairment is indicated. Significant undeveloped leasehold costs are assessed for impairment at a lease level or resource play (for example, the Greater Natural Buttes area in the Rockies), while leasehold acquisition costs associated with prospective areas that have limited or no previous exploratory drilling are generally assessed for impairment by major prospect area. Unproved oil and gas properties with individually insignificant lease acquisition costs are amortized on a group basis (thereby establishing a valuation allowance) over the average lease term at rates that provide for full amortization of unsuccessful leases upon lease expiration or abandonment. Costs of expired or abandoned leases are charged against the valuation allowance, while costs of productive leases are transferred to proved oil and gas properties. Costs of maintaining and retaining unproved properties, as well as amortization of individually insignificant leases and impairment of unsuccessful leases, are included in exploration expense.
A majority of the Company’s unproved property costs are associated with properties acquired in the Kerr-McGee and Western acquisitions in 2006 and to which proved developed producing reserves are also attributed. Generally, economic recovery of unproved reserves in such areas is not yet supported by actual production or conclusive formation tests, but may be confirmed by the Company’s continuing exploration and development programs.
Another portion of the Company’s unproved property costs are associated with the Land Grant acreage, where the Company owns mineral interests in perpetuity and plans to continue to explore and evaluate the acreage.
A change in the Company’s expected future plans for exploration and development could cause an impairment of the Company’s unproved property.
Exploratory Costs
Under the successful efforts method of accounting, exploratory costs associated with a well discovering hydrocarbons are initially capitalized, or suspended, pending determination of whether proved reserves can be attributed to the area as a result of drilling. At the end of each quarter, management reviews the status of all suspended exploratory drilling costs in light of ongoing exploration activities, which includes, for example, analyzing whether the Company is making sufficient progress in its ongoing exploration and appraisal efforts or, in the case of discoveries requiring government sanctioning, analyzing whether development negotiations are underway or proceeding as planned. If management determines that future appraisal drilling or development activities are unlikely to occur, associated suspended exploratory drilling costs are expensed in that period. Therefore, at any point in time, the Company may have capitalized costs on its Consolidated Balance Sheets associated with exploratory wells that may be charged to exploration expense in a future period.
Anadarko estimates its proved oil and gas reserves
as definedaccording to the definition of proved reserves provided by the
SECSecurities and Exchange Commission and the
FASB.Financial Accounting Standards Board (FASB). This definition includes
crude oil, natural gas, and NGLs that geological and engineering data demonstrate with reasonable certainty to be economically producible in future periods from known reservoirs under existing economic conditions, operating methods, government regulations, etc.
, i.e., at (at prices and costs as of the date the estimates are
made.made). Prices include consideration of price changes provided only by contractual arrangements, and do not include adjustments based
uponon expected future conditions.
The Company’s estimates of proved reserves are made using available geological and reservoir data, as well as production performance data. These estimates are reviewed annually by internal reservoir engineers and revised, either upward or downward, as warranted by additional data. Revisions are necessary due to changes in, among other things, reservoir performance, prices, economic conditions, and governmental restrictions, as well as changes in the expected recovery associated with infill drilling. Decreases in prices, for example, may cause a reduction in some proved reserves due to reaching economic limits earlier.at an earlier projected date.
The quantities of estimated proved oil and gas reserves are a significant component of DD&A. A material adverse change in the estimated volumes of proved reserves could have a negative impact on DD&A and could result in property impairments.
If the estimates of proved reserves used in the unit-of-production calculations had been lower by five percent across all calculations, DD&A in 2014 would have increased by approximately $210 million.
Exploratory Costs
Under the successful efforts method of accounting, exploratory costs associated with a well discovering hydrocarbons are initially capitalized, or suspended, pending a determination as to whether a commercially sufficient quantity of proved reserves can be attributed to the area as a result of drilling. At the end of each quarter, management reviews the status of all suspended exploratory drilling costs in light of ongoing exploration activities, in particular, whether the Company is making sufficient progress in its ongoing exploration and appraisal efforts or, in the case of discoveries requiring government sanctioning, analyzing whether development negotiations are underway and proceeding as planned. If management determines that future appraisal drilling or development activities are unlikely to occur, associated suspended exploratory well costs are expensed. Therefore, at any point in time, the Company may have capitalized costs on its Consolidated Balance Sheets associated with exploratory wells that may be charged to exploration expense in future periods. See Note 6—Suspended Exploratory Well Costs in the Notes to Consolidated Financial Statements under Item 8 of this Form 10-K for additional information.
The Company estimates fair value for
derivatives, long-lived assets for impairment testing, reporting units for goodwill impairment testing
when necessary, assets and liabilities acquired in a business combination or exchanged in non-monetary transactions,
guarantees, pension plan assets,
and initial measurements of
AROs, and financial instruments that require fair-value disclosure, including cash and cash equivalents, accounts receivable, accounts payable and debt.AROs. When the Company is required to measure fair value and there is not a market-observable price for the asset or liability or
a market-observable price for a similar asset or liability, the Company
utilizesuses the cost, income, or market valuation
approachapproaches depending on the quality of information available to support management’s assumptions. The cost approach is based on management’s best estimate of the current asset replacement cost. The income approach is based
uponon management’s best assumptions regarding expectations of projected cash flows, and discounts the expected cash flows using a commensurate risk-adjusted discount rate. The market approach is based on management’s best assumptions regarding prices and other relevant information from market transactions involving comparable assets. Such evaluations involve significant judgment and the results are based on expected future events or conditions, such as sales prices, estimates of future oil and gas production or throughput, development and operating costs and the timing thereof, future net cash flows, economic and regulatory climates, and other factors, most of which are often outside of management’s control. However, assumptions used reflect a market participant’s view of long-term prices, costs, and other factors, and are consistent with assumptions used in the Company’s business plans and investment decisions.
Business Combinations
Accounting
Property Impairments
When circumstances indicate that proved oil and gas properties may be impaired, the expected undiscounted future net cash flows of the asset group are compared to the carrying amount of the asset. If the expected undiscounted future net cash flows, based on our estimate of future oil and natural-gas prices, operating costs, anticipated production from proved reserves and other relevant data, are lower than the carrying amount, the carrying amount is reduced to fair value. Fair value estimates require significant judgment and oil and natural-gas prices are a significant component of the fair-value estimate. Prices have exhibited significant volatility in the past, and the Company expects that volatility to continue in the future.
A long-lived asset other than unproved oil and gas property is evaluated for potential impairment whenever events or changes in circumstances indicate that its carrying value may be greater than its undiscounted future net cash flows. Impairment, if any, is measured as the excess of an asset’s carrying amount over its estimated fair value. The Company uses a variety of fair-value measurement techniques as discussed below when market information for the
acquisition of a business requires thesame or similar assets
and liabilities of the acquired business to be recorded at fair value. Deferred taxes are recorded for any differences between asset and liability fair value and the tax basis of acquired assets and liabilities. Any excess of the purchase price over the amounts assigned to the identifiable assets and liabilities is recorded as goodwill.does not exist.
Goodwill
At December 31, 2011, the Company had $5.6 billion of goodwill, including $335 million as a result of the Wattenberg Plant acquisition. SeeNote 3—Acquisitionsin the Notes to Consolidated Financial Statements under Item 8 of this Form 10-K for further discussion of the Wattenberg Plant acquisition. Impairments
The Company tests goodwill for impairment annually at October 1, or more
oftenfrequently as
facts and circumstances
warrant.dictate. The first step in assessing whether an impairment of goodwill is necessary is
an optional qualitative assessment to
comparedetermine the
likelihood of whether the fair value of the reporting unit is greater than its carrying amount. If the Company concludes that fair value of the reporting unit more than likely exceeds the related carrying amount, then goodwill is not impaired and further testing is not necessary. If the qualitative assessment is not performed or indicates fair value of the reporting unit may be less than its carrying amount, the Company compares the estimated fair value of the reporting unit to which goodwill is assigned to the carrying amount of the associated net assets,
including goodwill, and
goodwill. A reporting unitdetermines whether impairment is
an operating segment or a component that is one level below an operating segment.necessary.
Because quoted market prices for the Company’s reporting units are not available, management
must applyapplies judgment in determining the estimated fair value of reporting units for purposes of performing goodwill impairment
tests.tests, when such tests are necessary. Management uses all available information to make these fair-value estimates, including the present values of expected future cash flows using discount rates commensurate with the risks associated with the assets and
observedobservable for the oil and gas exploration and production reporting unit,
control premiums and market multiples of earnings before interest, taxes, depreciation, and amortization (EBITDA) for the gathering and processing and transportation reporting units.
In estimating the fair value of its oil and gas exploration and production reporting unit, the Company assumes production profiles utilizedused in its estimation of reserves that are disclosed in the Company’s supplemental oil and gas disclosures, market prices based on the forward price curve for oil and gas at the test date (adjusted for location and quality differentials), capital and operating costs consistent with pricing and expected inflation rates, and discount rates that management believes a market participant would utilizeuse based upon the risks inherent in Anadarko’s operations.Management also includes control premium assumptions based on observable market information regarding how a market participant would value the oil and gas exploration and reporting unit as a whole rather than as individual properties that are part of an oil and gas portfolio. For the Company’s other gathering and processing, WES gathering and processing, and
WES transportation reporting units, the Company estimates fair value by applying an estimated multiple to projected
2012 EBITDA. The Company considered observable transactions in the market and trading multiples for peers in determining an appropriate multiple to apply against the Company’s projected EBITDA for these reporting units.
A lower fair-value estimate in the future for any of these reporting units could result in impairment of goodwill. Factors that could trigger a lower fair-value estimate include
sustained pricecommodity-price declines, cost increases, regulatory or political environment changes, and other changes in market conditions such as decreased prices in market-based transactions for similar assets, as well as difficulty or potential delays in obtaining drilling permits or other unanticipated events.
Based on the most recent goodwill impairment tests, the Company concluded that the fair value of each reporting unit substantially exceeded the carrying value of the related reporting unit. Therefore, no impairment was indicated.
Environmental Obligations and Other Contingencies
Management makes judgments and estimates in accordance with applicable accounting rules when it establishes reservesliabilities for environmental remediation, litigation, and other contingent matters. Provisions for such mattersEstimates of litigation-related liabilities are charged to expense when it is probable that a liability is incurredbased on the facts and reasonable estimatescircumstances of the individual case and on information currently available to the Company. The extent of information available varies based on the status of the litigation and the Company’s evaluation of the claim and legal arguments. In future periods, a number of factors could significantly change the Company’s estimate of litigation-related liabilities including discovery activities, briefings filed with the relevant court, rulings from the court in the process or at the conclusion of any trial, and similar cases involving other plaintiffs and defendants that may set or change legal precedent. As events unfold throughout the litigation process, the Company evaluates the available information and may consult with third-party legal counsel to determine whether liability canaccruals should be made. established or adjusted.
Estimates of environmental liabilities are based on a variety of matters, including, but not limited to, the stage of investigation, the stage of the remedial design, evaluation of existing remediation technologies, and presently enacted laws and regulations. In future periods, a number of factors could significantly change the Company’s estimate of environmental-remediation costs, such as changes in laws and regulations, changes in the interpretation or administration of laws and regulations, revisions to the remedial design, unanticipated construction problems, identification of additional areas or volumes of contaminated soil and groundwater, and changes in costs of labor, equipment, and technology. Consequently, it is not possible for management to reliably estimate the amount and timing of all future expenditures
that could arise related to environmental or other contingent matters and actual costs may vary significantly from the Company’s estimates. The Company’s in-house legal counsel and environmental personnel regularly assess
these contingent liabilities and, in certain circumstances,
consultsconsult with third-party legal counsel or consultants to assist in
formingthe evaluation of the Company’s
conclusion.liability for these contingencies.
Index to Financial StatementsImpairment of Long-Lived Assets
A long-lived asset other than unproved oil and gas property is evaluated for potential impairment whenever events or changes in circumstances indicate that its carrying value may be greater than its future net undiscounted cash flows. Impairment, if any, is measured as the excess of an asset’s carrying amount over its estimated fair value. The Company utilizes a variety of fair-value measurement techniques when market information for the same or similar assets does not exist.
Derivative Instruments
All derivative instruments, other than those that satisfy specific exceptions, are recorded at fair value. If market quotes are not available to estimate fair value, management’s best estimate of fair value is based on the quoted market price of derivatives with similar characteristics or determined through industry-standard valuation techniques.
The Company’s derivative instruments are either exchange-traded or transacted in an over-the-counter market. Valuation is determined by reference to readily available public data for similar instruments. Option fair values are measured using the Black-Scholes option-pricing model and verified by comparing a sample to market quotes for similar options. Unrealized gains or losses on derivatives are recorded to current earnings.
The amount of income taxes recorded by the Company requires interpretations of complex rules and regulations of various tax jurisdictions throughout the world. The Company has recognized deferred tax assets and liabilities for temporary differences, operating losses, and
tax credittax-credit carryforwards. The Company routinely assesses the realizability of its deferred tax assets
by analyzing the reversal periods of available net operating loss carryforwards and
reduces suchcredit carryforwards, temporary differences in tax assets
by a valuation allowance ifand liabilities, the availability of tax planning strategies, and estimates of future taxable income and other factors. Estimates of future taxable income are based on assumptions of oil and gas reserves and selling prices that are consistent with the Company’s internal business forecasts. If the Company concludes that it is more likely than not that some
portion or all of the deferred tax assets will not be
realized.realized, the tax asset is reduced by a valuation allowance. The Company routinely assesses potential uncertain tax positions and, if required, establishes accruals for such amounts. The accruals for deferred tax assets and liabilities, including deferred state income tax assets and liabilities, are subject to significant judgment by management and are reviewed and adjusted routinely based on changes in facts and circumstances. Although management considers its tax accruals adequate, material changes in these accruals may occur in the future, based on the progress of ongoing tax audits, changes in legislation, and resolution of pending tax matters.
RECENT ACCOUNTING DEVELOPMENTS
Benefit Plan ObligationsSee The Company has non-contributory U.S. defined-benefit pension plans, including both qualified and supplemental plans, and a foreign contributory defined-benefit pension plan. The Company also provides certain health care and life insurance benefits for certain retired employees. DeterminationNote 1—Summary of the benefit obligations for the Company’s defined-benefit pension and postretirement plans impacts the recorded amounts for such obligations on the balance sheet and the amount of benefit expense recorded to the income statement.
Significant Accounting for pension and other postretirement benefit obligations involves many assumptions, the most significant of which are the discount rate used to measure the present value of plan benefit obligations, the expected long-term rate of return on plan assets (for funded pension plans), the rate of future increases in compensation levels of participating employees, and the future level of health care costs.
The Company amortizes prior service costs and credits on a straight-line basis over the average remaining service period of employees expected to receive benefits under each plan. Actuarial gains and losses that exceed 10% of the greater of the projected benefit obligation and the market-related value of assets are amortized over the average remaining service period of participating employees expected to receive benefits under each plan.
PoliciesDiscount rate
Accumulated and projected benefit obligations are measured as the present value of future cash payments. The Company discounts those cash payments using a discount rate that reflects the weighted average of market-observed yields for select high quality (AA-rated) fixed-income securities with cash flows that correspond to the expected amounts and timing of benefit payments. Discount-rate selection for measurements prior to December 31, 2011, was based on a similar cash-flow-matching analysis, although, instead of using a portfolio of select high quality fixed-income securities to determine the effective settlement rate for a given plan obligation, the Company relied primarily on a published yield curve derived from market-observed yields for a universe of high quality bonds. Both methods are acceptable and result in a discount-rate assumption that represents an estimate of the interest rate at which the pension and other postretirement benefit obligations could effectively be settled on the measurement date. However, the Company believes a discount rate reflecting yields for high-quality fixed-income securities better corresponds to the Company’s expectations as to the amount and timing of its benefit payments. Assumed rates of compensation increases for active participants vary by age group. The weighted-average assumed rate (weighted by the plan-level benefit obligation) used to measure the Company’s December 31, 2011 pension benefit obligations was 4.50%, and the weighted-average discount-rate assumption for other postretirement benefit obligations, which are longer in duration, was 4.75%.
Expected long-term rate of return
The expected long-term rate of return on plan assets assumption was determined using the year-end 2011 pension investment balances by asset class and expected long-term asset allocation. The expected return for each asset class reflects capital-market projections formulated using a forward-looking building-block approach, while also taking into account historical return trends and current market conditions. Equity returns generally reflect long-term expectations of real earnings growth, dividend yield, and inflation. Returns on fixed-income securities are generally developed based on expected inflation, real bond yield, and risk spread (as appropriate), adjusted for the expected effect that changing yields have on the rate of return. Other asset class returns are derived from their relationship to the equity and fixed income markets. Because the assumption reflects the Company’s expectation of average annualized return over a long time horizon, generally, it is not expected to be significantly revised from year to year, even though actual rates of investment return from year to year often experience significant volatility.
To measure the net periodic pension cost for its funded pension plans, Anadarko assumed an average long-term rate of return of 7.0%. A variation in this assumption of 25 basis points would have changed the measure of 2011 net periodic pension cost by approximately $3 million pretax, with higher investment return assumption resulting in lower recognized expense.
Rate of compensation increases
The Company’s rate of compensation increases assumption is based on its long-term plans for compensation increases specific to covered employee groups and expected economic conditions. The assumed rate of salary increases includes the effects of merit increases, promotions, and general labor cost inflation within the oil and gas industry. The benefit obligations at December 31, 2011, reflect assumed rates of long-term compensation increases for active participants that vary by age group, with the resulting weighted-average rate (weighted by the plan-level benefit obligation) of 4.5%.
Health care cost trend rate
The health care cost trend assumptions are developed based on historical cost data, the near-term outlook and an assessment of likely long-term trends. A 9% annual rate of increase in the per-capita cost of covered health care benefits was assumed for 2012, decreasing graduallyNotes to 5% in 2018 and beyond.
RECENT ACCOUNTING DEVELOPMENTS
In 2011, the FASB issued an Accounting Standards Update (ASU) that permits an initial assessment of qualitative factors to determine whether it is more likely than not that the fair value of a reporting unit is less than its carrying amount for goodwill impairment testing purposes. Thus, determining a reporting unit’s fair value is not required unless, as a result of a qualitative assessment, it is more likely than not that the fair value of the reporting unit is less than its carrying amount. This ASU is effective for periods beginning after December 15, 2011. Adoption under Item 8 of this ASU will have no impact onForm 10-K for discussion of recent accounting developments affecting the Company’s consolidated financial statements.
| Company.
Item 7A. Quantitative and Qualitative Disclosures About Market Risk
| and Qualitative Disclosures About Market Risk |
The Company’s primary market risks are attributable to fluctuations in energy prices and interest rates. In addition, foreign-currency exchange-rate risk exists due to anticipated foreign-currency denominatedforeign-currency-denominated payments and receipts. These risks can affect revenues and cash flows from operating, investing, and financing activities. The Company’s risk-management policies provide for the use of derivative instruments to manage these risks. The types of commodity derivative instruments utilizedused by the Company include futures, swaps, options, and fixed-price physical-delivery contracts. The volume of commodity derivatives entered into by the Company is governed by risk-management policies and may vary from year to year. Both exchange and over-the-counter traded commodity derivative instruments may be subject to margin depositmargin-deposit requirements, and the Company may be required from time to time to deposit cash or provide letters of credit with exchange brokers or counterparties in order to satisfy these margin requirements.
For information regarding the Company’s accounting policies and additional information relatedrelating to the Company’s derivative and financial instruments, seeNote 1—Summary of Significant Accounting Policiesand Note 10—11—Derivative Instruments in theNotes to Consolidated Financial Statements under Item 8 of this Form 10-K.
COMMODITY PRICECOMMODITY-PRICE RISK The Company’s most significant market risk relates to prices for natural gas, crude oil, and NGLs. Management expects energy prices to remain volatile and unpredictable. As energy prices decline or rise significantly, revenues and cash flows are likewise affected. In addition, a non-cash write-down of the Company’s oil and gas properties or goodwill may be required if commodity prices experience a significant and sustained decline. Below is a sensitivity analysis for the Company’s commodity-price-related derivative instruments.
Derivative Instruments Held for Non-Trading Purposes The Company had derivative instruments in place to reduce the price risk associated with future production of 662356 Bcf of natural gas at year-end 2011. The Company hadDecember 31, 2014, with a net derivative asset position of $619$228 million on these derivative instruments at December 31, 2011.. Based on actual derivative contractual volumes, a 10% increase in underlying commoditynatural-gas prices would reduce the fair value of these derivatives by $140$60 million, while a 10% decrease in underlying commoditynatural-gas prices would increase the fair value of these derivatives by $134 million.$52 million. However, any realized derivative gaincash received or losspaid to settle these derivatives would be substantially offset by a decrease or increase, respectively, in the actualrealized sales value of production covered byequivalent production. In 2014, the derivative instruments.Company terminated or offset then-existing 2015 oil three-way collars with a notional volume of 25 MBbls/d due to lower oil prices, resulting in a cash receipt of $126 million.
Derivative Instruments Held for Trading Purposes The At December 31, 2014, the Company had a net derivative asset position of $43$28 million (gains of $87 million and losses of $44$28 million) on outstanding derivative instruments entered into for trading purposes at December 31, 2011.purposes. Based on actual derivative contractual volumes, a 10% increase or decrease in underlying commodity prices would not materially impact the Company’s gains or losses on these derivative instruments.
For additional information regarding the Company’s marketing and trading portfolio, seeMarketing Activities under Items 1 and 2 of this Form 10-K.
INTEREST-RATE RISK The Company’s $2.5 billion of Any borrowings under its $5.0 billion Facilitythe New Credit Facilities, the WES RCF, and the commercial paper program are subject to variable interest rates. The remaining reported balance of Anadarko’s long-term debt inon the Company’s Consolidated Balance Sheets was atis subject to fixed interest rates. The Company’s $2.9 billion of LIBOR-based obligations, which are presented on the Company’s Consolidated Balance Sheets net of preferred investments in two non-controlled entities, on the Company’s Consolidated Balance Sheets, give rise to minimal net interest-rate risk exposure because coupons on the related preferred investments are also LIBOR-based. SeeNote 9—Investments in theNotes to Consolidated Financial Statements under Item 8 of this Form 10-K. A 10% increase in LIBOR would not materially impact the Company’s interest cost on fixed-rate debt already outstanding, but would affect the fair value of outstanding debt, as well as interest cost associated with future debt issuances.fixed-rate debt. At December 31, 2011,2014, the Company had a net derivative liability position of $1.2$1.2 billion related to interest-rate swaps. A 10% increase or decrease(decrease) in the three-month LIBOR interest-rate curve would increase or decrease, respectively,(decrease) the aggregate fair value of outstanding interest-rate swap agreements by approximately $116 million.$104 million. However, any change in the interest-rate derivative gain or loss wouldcould be substantially offset by an increase or decrease, respectively, inactual borrowing costs associated with any future debt issuances or borrowings under the New Credit Facilities and the Company’s borrowings under its $5.0 billion Facility.commercial paper program. For a summary of the Company’s openoutstanding interest-rate derivative positions, seeNote 10—11—Derivative Instruments in theNotes to Consolidated Financial Statements under Item 8 of this Form 10-K.
FOREIGN-CURRENCY EXCHANGE-RATE RISK Anadarko’s operating revenues are realized in U.S. dollars, and the predominant portion of Anadarko’s capital and operating expenditures are U.S. dollar denominated.U.S.-dollar-denominated. Exposure to foreign-currency risk generally arises in connection with project-specific contractual arrangements and other commitments. Near-term foreign-currency-denominated expenditures are primarily in euros, Brazilian reais, and British pounds sterling.sterling, Mozambican meticais, and Colombian pesos. Management periodically enters into various risk-management transactions to mitigate a portion of its exposure to foreign-currency exchange-rate risk.With respect to international oil and gas development projects, Anadarko is a party to contracts containing remaining commitments extending through November 2012 that are impacted by euro-to-U.S. dollar exchange rates. To manage euro exchange-rate risk relative to euro-denominated commitments, the Company held approximately €98 million, or $127 million, cash and cash equivalents and also held euro-U.S. dollar collars during 2011. Euro purchases mitigate the Company’s exposure to fluctuations in the euro-to-U.S. dollar exchange rate inherent in its existing capital expenditure commitments.
The Company also has risk related to exchange-rate changes applicable to cash held in escrow pending final determination of the Company’s Brazilian tax liability for its 2008 divestiture of the Peregrino field offshore Brazil.Brazil, which is currently under consideration by the Brazilian courts. See Note 17—Contingencies—Other Litigation in the Notes to Consolidated Financial Statements under Item 8 of this Form 10-K. At December 31, 2011,2014, cash of $182$128 million was held in escrow. A 10% increase or decrease in the foreign-currency exchange rate would not materially impact the Company’s gain or loss related to foreign currency.
Item 8. Financial Statements and Supplementary Data
ANADARKO PETROLEUM CORPORATION
INDEX TO CONSOLIDATED FINANCIAL STATEMENTS | | |
| |
| | Page |
Page | |
| |
| |
| | 83 | |
| |
| |
| | 83 | |
| |
| |
| | 84 | |
| |
| |
| | 86 | |
| |
| |
| | 87 | |
| |
| |
| | 88 | |
| |
| |
| | 89 | |
| |
| |
| | 90 | |
| |
| |
| | 91 | |
| |
| |
| | 144 | |
| |
| | | 156 | |
ANADARKO PETROLEUM CORPORATION
Management prepared, and is responsible for, the Consolidated Financial Statements and the other information appearing in this annual report. The Consolidated Financial Statements present fairly the Company’s financial
position,condition, results of operations and cash flows in conformity with accounting principles generally accepted in the United States. In preparing its Consolidated Financial Statements, the Company includes amounts that are based on estimates and judgments that Management believes are reasonable under the circumstances. The Company’s financial statements have been audited by KPMG LLP, an independent registered public accounting firm appointed by the Audit Committee of the Board of Directors. Management has made available to KPMG LLP all of the Company’s financial records and related data, as well as the minutes of the stockholders’ and Directors’ meetings.
MANAGEMENT’S ASSESSMENT OF INTERNAL CONTROL OVER FINANCIAL REPORTING
Management is responsible for establishing and maintaining adequate internal control over financial reporting. Anadarko’s internal control system was designed to provide reasonable assurance to the Company’s Management and Directors regarding the preparation and fair presentation of published financial statements.
Because of its inherent limitations, internal control over financial reporting may not prevent or detect misstatements. Also, projections of any evaluation of effectiveness to future periods are subject to the risk that controls may become inadequate because of changes in conditions, or that the degree of compliance with the policies or procedures may deteriorate.
Management assessed the effectiveness of the Company’s internal control over financial reporting as of December 31, 2011.2014. This assessment was based on criteria established in the Internal Control—Integrated Framework (2013) issued by the Committee of Sponsoring Organizations of the Treadway Commission (COSO). Based on our assessment, we believe that as of December 31, 2011,2014, the Company’s internal control over financial reporting was effective based on those criteria. The Company acquired Nuevo Midstream, LLC in November 2014 and management excluded from its assessment of the effectiveness of the Company’s internal control over financial reporting as of December 31, 2014, Nuevo Midstream, LLC’s internal control over financial reporting associated with total assets of $1.6 billion and total revenues of $12.5 million included in the consolidated financial statements of Anadarko Petroleum Corporation and subsidiaries as of and for the year ended December 31, 2014. KPMG LLP has issued an attestation report on the Company’s internal control over financial reporting as of December 31, 2011./s/ JAMES T. HACKETT
James T. Hackett
Chairman and Chief Executive Officer
/s/ ROBERT G. GWIN
Robert G. Gwin
Senior Vice President, Finance and Chief Financial
Officer
February 21, 2012
2014
. |
|
| /s/ R. A. WALKER |
R. A. Walker Chairman, President and Chief Executive Officer |
|
|
| /s/ ROBERT G. GWIN |
Robert G. Gwin Executive Vice President, Finance and Chief Financial Officer |
|
| February 20, 2015 |
Report of Independent Registered Public Accounting Firm
The Board of Directors and Stockholders
Anadarko Petroleum Corporation:
We have audited Anadarko Petroleum Corporation’s internal control over financial reporting as of December 31, 2011,2014, based on criteria established inInternal Control —– Integrated Framework (2013) issued by the Committee of Sponsoring Organizations of the Treadway Commission (COSO).Anadarko Petroleum Corporation’s management is responsible for maintaining effective internal control over financial reporting and for its assessment of the effectiveness of internal control over financial reporting, included in the accompanyingManagement’s Assessment of Internal Control over Financial Reporting. Our responsibility is to express an opinion on the Company’s internal control over financial reporting based on our audit.
We conducted our audit in accordance with the standards of the Public Company Accounting Oversight Board (United States). Those standards require that we plan and perform the audit to obtain reasonable assurance about whether effective internal control over financial reporting was maintained in all material respects. Our audit included obtaining an understanding of internal control over financial reporting, assessing the risk that a material weakness exists, and testing and evaluating the design and operating effectiveness of internal control based on the assessed risk. Our audit also included performing such other procedures as we considered necessary in the circumstances. We believe that our audit provides a reasonable basis for our opinion.
A company’s internal control over financial reporting is a process designed to provide reasonable assurance regarding the reliability of financial reporting and the preparation of financial statements for external purposes in accordance with generally accepted accounting principles. A company’s internal control over financial reporting includes those policies and procedures that (1) pertain to the maintenance of records that, in reasonable detail, accurately and fairly reflect the transactions and dispositions of the assets of the company; (2) provide reasonable assurance that transactions are recorded as necessary to permit preparation of financial statements in accordance with generally accepted accounting principles, and that receipts and expenditures of the company are being made only in accordance with authorizations of management and directors of the company; and (3) provide reasonable assurance regarding prevention or timely detection of unauthorized acquisition, use, or disposition of the company’s assets that could have a material effect on the financial statements.
Because of its inherent limitations, internal control over financial reporting may not prevent or detect misstatements. Also, projections of any evaluation of effectiveness to future periods are subject to the risk that controls may become inadequate because of changes in conditions, or that the degree of compliance with the policies or procedures may deteriorate.
In our opinion, Anadarko Petroleum Corporation maintained, in all material respects, effective internal control over financial reporting as of December 31, 2011,2014, based on criteria established inInternal Control —– Integrated Framework(2013) issued by the Committee of Sponsoring Organizations of the Treadway Commission (COSO). Anadarko Petroleum Corporation acquired Nuevo Midstream, LLC in November 2014 and management excluded from its assessment of the effectiveness of Anadarko Petroleum Corporation’s internal control over financial reporting as of December 31, 2014, Nuevo Midstream, LLC’s internal control over financial reporting associated with total assets of $1.6 billion and total revenues of $12.5 million included in the consolidated financial statements of Anadarko Petroleum Corporation and subsidiaries as of and for the year ended December 31, 2014. Our audit of internal control over financial reporting of Anadarko Petroleum Corporation also excluded an evaluation of the internal control over financial reporting of Nuevo Midstream, LLC.
We also have audited, in accordance with the standards of the Public Company Accounting Oversight Board (United States), the consolidated balance sheets of Anadarko Petroleum Corporation and subsidiaries as of December 31, 20112014 and 2010,2013, and the related consolidated statements of income, comprehensive income, equity, and cash flows for each of the years in the three-year period ended December 31, 2011,2014, and our report dated February 21, 201220, 2015 expressed an unqualified opinion on those consolidated financial statements./s/ KPMG LLP
Houston, Texas
February 21, 2012
|
|
| /s/ KPMG LLP |
|
| Houston, Texas |
| February 20, 2015 |
Report of Independent Registered Public Accounting Firm
The Board of Directors and Stockholders
Anadarko Petroleum Corporation:
We have audited the accompanying consolidated balance sheets of Anadarko Petroleum Corporation and subsidiaries as of December 31,
20112014 and
2010,2013, and the related consolidated statements of income, comprehensive income, equity, and cash flows for each of the years in the
three-yearthree–year period ended December 31,
2011.2014. These consolidated financial statements are the responsibility of the Company’s management. Our responsibility is to express an opinion on these consolidated financial statements based on our audits.
We conducted our audits in accordance with the standards of the Public Company Accounting Oversight Board (United States). Those standards require that we plan and perform the audit to obtain reasonable assurance about whether the financial statements are free of material misstatement. An audit includes examining, on a test basis, evidence supporting the amounts and disclosures in the financial statements. An audit also includes assessing the accounting principles used and significant estimates made by management, as well as evaluating the overall financial statement presentation. We believe that our audits provide a reasonable basis for our opinion.
In our opinion, the consolidated financial statements referred to above present fairly, in all material respects, the financial position of Anadarko Petroleum Corporation and subsidiaries as of December 31,
20112014 and
2010,2013, and the results of their operations and their cash flows for each of the years in the
three-yearthree–year period ended December 31,
2011,2014, in conformity with U.S. generally accepted accounting principles.
We also have audited, in accordance with the standards of the Public Company Accounting Oversight Board (United States), Anadarko Petroleum Corporation’s internal control over financial reporting as of December 31, 2011,2014, based on criteria established inInternal Control —– Integrated Framework(2013) issued by the Committee of Sponsoring Organizations of the Treadway Commission (COSO), and our report dated February 21, 201220, 2015 expressed an unqualified opinion on the effectiveness of the Company’s internal control over financial reporting./s/ KPMG LLP
Houston, Texas
February 21, 2012
|
|
| /s/ KPMG LLP |
|
| Houston, Texas |
| February 20, 2015 |
ANADARKO PETROLEUM CORPORATION
CONSOLIDATED STATEMENTS OF INCOME | | | 0000000 | | | | 0000000 | | | | 0000000 | |
| | | Years Ended December 31, | |
| millions except per-share amounts | | 2011 | | | 2010 | | | 2009 | |
Revenues and Other | | | | | | | | | | | | |
Natural-gas sales | | $ | 3,300 | | | $ | 3,420 | | | $ | 2,924 | |
Oil and condensate sales | | | 8,072 | | | | 5,592 | | | | 4,022 | |
Natural-gas liquids sales | | | 1,462 | | | | 997 | | | | 536 | |
Gathering, processing, and marketing sales | | | 1,048 | | | | 833 | | | | 728 | |
Gains (losses) on divestitures and other, net | | | 85 | | | | 142 | | | | 133 | |
Reversal of accrual for Deepwater Royalty Relief Act dispute | | | — | | | | — | | | | 657 | |
| | | | | | | | | | | | |
Total | | | 13,967 | | | | 10,984 | | | | 9,000 | |
| | | | | | | | | | | | |
Costs and Expenses | | | | | | | | | | | | |
Oil and gas operating | | | 993 | | | | 830 | | | | 859 | |
Oil and gas transportation and other | | | 891 | | | | 816 | | | | 664 | |
Exploration | | | 1,076 | | | | 974 | | | | 1,107 | |
Gathering, processing, and marketing | | | 791 | | | | 615 | | | | 617 | |
General and administrative | | | 1,060 | | | | 967 | | | | 983 | |
Depreciation, depletion, and amortization | | | 3,830 | | | | 3,714 | | | | 3,532 | |
Other taxes | | | 1,492 | | | | 1,068 | | | | 746 | |
Impairments | | | 1,774 | | | | 216 | | | | 115 | |
Deepwater Horizon settlement and related costs | | | 3,930 | | | | 15 | | | | — | |
| | | | | | | | | | | | |
Total | | | 15,837 | | | | 9,215 | | | | 8,623 | |
| | | | | | | | | | | | |
Operating Income (Loss) | | | (1,870 | ) | | | 1,769 | | | | 377 | |
Other (Income) Expense | | | | | | | | | | | | |
Interest expense | | | 839 | | | | 855 | | | | 702 | |
(Gains) losses on commodity derivatives, net | | | (562 | ) | | | (893 | ) | | | 408 | |
(Gains) losses on other derivatives, net | | | 1,023 | | | | 285 | | | | (582 | ) |
Other (income) expense, net | | | 254 | | | | (119 | ) | | | (43 | ) |
| | | | | | | | | | | | |
Total | | | 1,554 | | | | 128 | | | | 485 | |
| | | | | | | | | | | | |
Income (Loss) Before Income Taxes | | | (3,424 | ) | | | 1,641 | | | | (108 | ) |
Income Tax Expense (Benefit) | | | (856 | ) | | | 820 | | | | (5 | ) |
| | | | | | | | | | | | |
Net Income (Loss) | | | (2,568 | ) | | | 821 | | | | (103 | ) |
Net Income Attributable to Noncontrolling Interests | | | 81 | | | | 60 | | | | 32 | |
| | | | | | | | | | | | |
Net Income (Loss) Attributable to Common Stockholders | | $ | (2,649 | ) | | $ | 761 | | | $ | (135 | ) |
| | | | | | | | | | | | |
| | | |
Per Common Share: | | | | | | | | | | | | |
Net income (loss) attributable to common stockholders—basic | | $ | (5.32 | ) | | $ | 1.53 | | | $ | (0.28 | ) |
Net income (loss) attributable to common stockholders—diluted | | $ | (5.32 | ) | | $ | 1.52 | | | $ | (0.28 | ) |
Average Number of Common Shares Outstanding—Basic | | | 498 | | | | 495 | | | | 480 | |
| | | | | | | | | | | | |
Average Number of Common Shares Outstanding—Diluted | | | 498 | | | | 497 | | | | 480 | |
| | | | | | | | | | | | |
Dividends (per Common Share) | | $ | 0.36 | | | $ | 0.36 | | | $ | 0.36 | |
|
| | | | | | | | | | | |
| | Years Ended December 31, |
| millions except per-share amounts | 2014 | | 2013 | | 2012 |
| Revenues and Other | | | | | |
| Natural-gas sales | $ | 3,849 |
| | $ | 3,388 |
| | $ | 2,444 |
|
| Oil and condensate sales | 9,748 |
| | 9,178 |
| | 8,728 |
|
| Natural-gas liquids sales | 1,572 |
| | 1,262 |
| | 1,224 |
|
| Gathering, processing, and marketing sales | 1,206 |
| | 1,039 |
| | 911 |
|
| Gains (losses) on divestitures and other, net | 2,095 |
| | (286 | ) | | 104 |
|
| Total | 18,470 |
| | 14,581 |
| | 13,411 |
|
| Costs and Expenses | | | | | |
| Oil and gas operating | 1,171 |
| | 1,092 |
| | 976 |
|
| Oil and gas transportation and other | 1,184 |
| | 1,022 |
| | 955 |
|
| Exploration | 1,639 |
| | 1,329 |
| | 1,946 |
|
| Gathering, processing, and marketing | 1,030 |
| | 869 |
| | 763 |
|
| General and administrative | 1,316 |
| | 1,090 |
| | 1,246 |
|
| Depreciation, depletion, and amortization | 4,550 |
| | 3,927 |
| | 3,964 |
|
| Other taxes | 1,244 |
| | 1,077 |
| | 1,224 |
|
| Impairments | 836 |
| | 794 |
| | 389 |
|
| Algeria exceptional profits tax settlement | — |
| | 33 |
| | (1,797 | ) |
| Deepwater Horizon settlement and related costs | 97 |
| | 15 |
| | 18 |
|
| Total | 13,067 |
| | 11,248 |
| | 9,684 |
|
| Operating Income (Loss) | 5,403 |
| | 3,333 |
| | 3,727 |
|
| Other (Income) Expense | | | | | |
| Interest expense | 772 |
| | 686 |
| | 742 |
|
| (Gains) losses on derivatives, net | 197 |
| | (398 | ) | | (326 | ) |
| Other (income) expense, net | 20 |
| | 89 |
| | (4 | ) |
| Tronox-related contingent loss | 4,360 |
| | 850 |
| | (250 | ) |
| Total | 5,349 |
| | 1,227 |
| | 162 |
|
| Income (Loss) Before Income Taxes | 54 |
| | 2,106 |
| | 3,565 |
|
| Income tax expense (benefit) | 1,617 |
| | 1,165 |
| | 1,120 |
|
| Net Income (Loss) | (1,563 | ) | | 941 |
| | 2,445 |
|
| Net income attributable to noncontrolling interests | 187 |
| | 140 |
| | 54 |
|
| Net Income (Loss) Attributable to Common Stockholders | $ | (1,750 | ) | | $ | 801 |
| | $ | 2,391 |
|
| | | | | | |
| Per Common Share | | | | | |
| Net income (loss) attributable to common stockholders—basic | $ | (3.47 | ) | | $ | 1.58 |
| | $ | 4.76 |
|
| Net income (loss) attributable to common stockholders—diluted | $ | (3.47 | ) | | $ | 1.58 |
| | $ | 4.74 |
|
| Average Number of Common Shares Outstanding—Basic | 506 |
| | 502 |
| | 500 |
|
| Average Number of Common Shares Outstanding—Diluted | 506 |
| | 505 |
| | 502 |
|
| Dividends (per Common Share) | $ | 0.99 |
| | $ | 0.54 |
| | $ | 0.36 |
|
See accompanying Notes to Consolidated Financial Statements.
88
ANADARKO PETROLEUM CORPORATION
CONSOLIDATED STATEMENTS OF COMPREHENSIVE INCOME | | | 000000 | | | | 000000 | | | | 000000 | |
| | | Years Ended December 31, | |
| millions | | 2011 | | | 2010 | | | 2009 | |
Net Income (Loss) | | $ | (2,568 | ) | | $ | 821 | | | $ | (103 | ) |
| | | |
Other Comprehensive Income (Loss), net of taxes | | | | | | | | | | | | |
Reclassification of previously deferred derivative losses to net income(1) | | | 10 | | | | 17 | | | | 22 | |
Adjustments for pension and other postretirement plans: | | | | | | | | | | | | |
Net gain (loss) incurred during period(2) | | | (136 | ) | | | (91 | ) | | | (131 | ) |
Prior service credit (cost) incurred during period(3) | | | 7 | | | | (4 | ) | | | — | |
Amortization of net actuarial loss and prior service cost to net periodic benefit cost(4) | | | 56 | | | | 41 | | | | 37 | |
| | | | | | | | | | | | |
Total adjustments for pension and other postretirement plans | | | (73 | ) | | | (54 | ) | | | (94 | ) |
Other | | | — | | | | — | | | | 1 | |
| | | | | | | | | | | | |
Total | | | (63 | ) | | | (37 | ) | | | (71 | ) |
| | | | | | | | | | | | |
| | | |
Comprehensive Income (Loss) | | | (2,631 | ) | | | 784 | | | | (174 | ) |
Comprehensive Income Attributable to Noncontrolling Interests | | | 81 | | | | 60 | | | | 32 | |
| | | | | | | | | | | | |
Comprehensive Income (Loss) Attributable to Common Stockholders | | $ | (2,712 | ) | | $ | 724 | | | $ | (206 | ) |
| | | | | | | | | | | | |
(1) | Net of income tax benefit (expense) of $(5) million, $(9) million, and $(12) million for the years ended December 31, 2011, 2010, and 2009, respectively.
|
(2) | Net of income tax benefit (expense) of $77 million, $52 million, and $74 million for the years ended December 31, 2011, 2010, and 2009, respectively.
|
(3) | Net of income tax benefit (expense) of $(5) million and $2 million for the years ended December 31, 2011 and 2010, respectively.
|
(4) | Net of income tax benefit (expense) of $(31) million, $(23) million, and $(21) million for the years ended December 31, 2011, 2010, and 2009, respectively.
|
|
| | | | | | | | | | | |
| | Years Ended December 31, |
| millions | 2014 | | 2013 | | 2012 |
| Net Income (Loss) | $ | (1,563 | ) | | $ | 941 |
| | $ | 2,445 |
|
| Other Comprehensive Income (Loss) | | | | | |
| Adjustments for derivative instruments | | | | | |
Reclassification of previously deferred derivative losses to (gains) losses on derivatives, net | 9 |
| | 11 |
| | 12 |
|
Income taxes on reclassification of previously deferred derivative losses to (gains) losses on derivatives, net | (3 | ) | | (4 | ) | | (4 | ) |
| Total adjustments for derivative instruments, net of taxes | 6 |
| | 7 |
| | 8 |
|
| Adjustments for pension and other postretirement plans | | | | | |
| Net gain (loss) incurred during period | (405 | ) | | 416 |
| | (155 | ) |
| Income taxes on net gain (loss) incurred during period | 149 |
| | (152 | ) | | 56 |
|
Amortization of net actuarial (gain) loss to general and administrative expense | 27 |
| | 132 |
| | 93 |
|
Income taxes on amortization of net actuarial (gain) loss to general and administrative expense | (9 | ) | | (49 | ) | | (32 | ) |
Amortization of net prior service (credit) cost to general and administrative expense | — |
| | 1 |
| | 2 |
|
| Total adjustments for pension and other postretirement plans, net of taxes | (238 | ) | | 348 |
| | (36 | ) |
| Total | (232 | ) | | 355 |
| | (28 | ) |
| Comprehensive Income (Loss) | (1,795 | ) | | 1,296 |
| | 2,417 |
|
| Comprehensive income attributable to noncontrolling interests | 187 |
| | 140 |
| | 54 |
|
| Comprehensive Income (Loss) Attributable to Common Stockholders | $ | (1,982 | ) | | $ | 1,156 |
| | $ | 2,363 |
|
See accompanying Notes to Consolidated Financial Statements.
89
ANADARKO PETROLEUM CORPORATION
CONSOLIDATED BALANCE SHEETS | | | | | | | | |
| | | December 31, | |
| millions | | 2011 | | | 2010 | |
ASSETS | | | | | | | | |
Current Assets | | | | | | | | |
Cash and cash equivalents | | $ | 2,697 | | | $ | 3,680 | |
Accounts receivable, net of allowance: | | | | | | | | |
Customers | | | 1,269 | | | | 1,032 | |
Others | | | 1,990 | | | | 1,391 | |
Other current assets | | | 975 | | | | 572 | |
| | | | | | | | |
Total | | | 6,931 | | | | 6,675 | |
| | | | | | | | |
Properties and Equipment | | | | | | | | |
Cost | | | 60,081 | | | | 54,815 | |
Less accumulated depreciation, depletion, and amortization | | | 22,580 | | | | 16,858 | |
| | | | | | | | |
Net properties and equipment | | | 37,501 | | | | 37,957 | |
Other Assets | | | 1,516 | | | | 1,616 | |
Goodwill and Other Intangible Assets | | | 5,831 | | | | 5,311 | |
| | | | | | | | |
Total Assets | | $ | 51,779 | | | $ | 51,559 | |
| | | | | | | | |
| | |
LIABILITIES AND EQUITY | | | | | | | | |
Current Liabilities | | | | | | | | |
Accounts payable | | $ | 3,299 | | | $ | 2,726 | |
Accrued expenses | | | 1,430 | | | | 1,097 | |
Current portion of long-term debt | | | 170 | | | | 291 | |
| | | | | | | | |
Total | | | 4,899 | | | | 4,114 | |
| | | | | | | | |
Long-term Debt | | | 15,060 | | | | 12,722 | |
Other Long-term Liabilities | | | | | | | | |
Deferred income taxes | | | 8,479 | | | | 9,861 | |
Asset retirement obligations | | | 1,737 | | | | 1,529 | |
Other | | | 2,621 | | | | 1,894 | |
| | | | | | | | |
Total | | | 12,837 | | | | 13,284 | |
| | | | | | | | |
| | |
Equity | | | | | | | | |
Stockholders’ equity | | | | | | | | |
Common stock, par value $0.10 per share
(1.0 billion shares authorized, 516.0 million and 513.3 million shares
issued as of December 31, 2011 and 2010, respectively) | | | 51 | | | | 51 | |
Paid-in capital | | | 7,851 | | | | 7,496 | |
Retained earnings | | | 11,619 | | | | 14,449 | |
Treasury stock (17.6 million and 17.1 million shares as of
December 31, 2011 and 2010, respectively) | | | (804 | ) | | | (763 | ) |
Accumulated other comprehensive income (loss) | | | (612 | ) | | | (549 | ) |
| | | | | | | | |
Total Stockholders’ Equity | | | 18,105 | | | | 20,684 | |
Noncontrolling interests | | | 878 | | | | 755 | |
| | | | | | | | |
Total Equity | | | 18,983 | | | | 21,439 | |
| | | | | | | | |
Total Liabilities and Equity | | $ | 51,779 | | | $ | 51,559 | |
| | | | | | | | |
|
| | | | | | | |
| | December 31, |
| millions | 2014 | | 2013 |
| ASSETS | | | |
| Current Assets | | | |
| Cash and cash equivalents | $ | 7,369 |
| | $ | 3,698 |
|
| Accounts receivable (net of allowance of $7 million and $5 million) | | | |
| Customers | 1,118 |
| | 1,481 |
|
| Others | 1,409 |
| | 1,241 |
|
| Other current assets | 1,325 |
| | 688 |
|
| Total | 11,221 |
| | 7,108 |
|
| Properties and Equipment | | | |
| Cost | 75,107 |
| | 71,244 |
|
| Less accumulated depreciation, depletion, and amortization | 33,518 |
| | 30,315 |
|
| Net properties and equipment | 41,589 |
| | 40,929 |
|
| Other Assets | 2,310 |
| | 2,082 |
|
| Goodwill and Other Intangible Assets | 6,569 |
| | 5,662 |
|
| Total Assets | $ | 61,689 |
| �� | $ | 55,781 |
|
| | | | |
| LIABILITIES AND EQUITY | | | |
| Current Liabilities | | | |
| Accounts payable | $ | 3,683 |
| | $ | 3,530 |
|
| Current asset retirement obligations | 257 |
| | 409 |
|
| Accrued expenses | 994 |
| | 1,264 |
|
| Current portion of long-term debt | — |
| | 500 |
|
| Deepwater Horizon settlement and related costs | 90 |
| | — |
|
| Tronox-related contingent liability | 5,210 |
| | — |
|
| Total | 10,234 |
| | 5,703 |
|
| Long-term Debt | 15,092 |
| | 13,065 |
|
| Other Long-term Liabilities | | | |
| Deferred income taxes | 9,249 |
| | 9,245 |
|
| Asset retirement obligations | 1,796 |
| | 1,613 |
|
| Tronox-related contingent liability | — |
| | 850 |
|
| Other | 3,000 |
| | 1,655 |
|
| Total | 14,045 |
| | 13,363 |
|
| | | | |
| Equity | | | |
| Stockholders’ equity | | | |
Common stock, par value $0.10 per share
(1.0 billion shares authorized, 525.9 million and 522.5 million shares issued) | 52 |
| | 52 |
|
| Paid-in capital | 9,005 |
| | 8,629 |
|
| Retained earnings | 12,125 |
| | 14,356 |
|
| Treasury stock (19.3 million and 18.8 million shares) | (940 | ) | | (895 | ) |
| Accumulated other comprehensive income (loss) | (517 | ) | | (285 | ) |
| Total Stockholders’ Equity | 19,725 |
| | 21,857 |
|
| Noncontrolling interests | 2,593 |
| | 1,793 |
|
| Total Equity | 22,318 |
| | 23,650 |
|
| Total Liabilities and Equity | $ | 61,689 |
| | $ | 55,781 |
|
See accompanying Notes to Consolidated Financial Statements.
90
ANADARKO PETROLEUM CORPORATION
CONSOLIDATED STATEMENTS OF EQUITY | | | 00000000 | | | | 00000000 | | | | 00000000 | | | | 00000000 | | | | 00000000 | | | | 00000000 | | | | 00000000 | |
| | | Total Stockholders’ Equity | | | | | | | |
| | | Common
Stock | | | Paid-in
Capital | | | Retained
Earnings | | | Treasury
Stock | | | Accumulated
Other
Comprehensive
Income (Loss) | | | Non-
controlling
Interests | | | Total
Equity | |
millions | | | | | | | | | | | | | | | | | | | | | | | | | | | | |
Balance at December 31, 2008 | | $ | 47 | | | $ | 5,696 | | | $ | 14,179 | | | $ | (686 | ) | | $ | (441 | ) | | $ | 361 | | | $ | 19,156 | |
Net income (loss) | | | — | | | | — | | | | (135 | ) | | | — | | | | — | | | | 32 | | | | (103 | ) |
Common stock issued | | | 3 | | | | 1,547 | | | | — | | | | — | | | | — | | | | — | | | | 1,550 | |
Dividends—common | | | — | | | | — | | | | (176 | ) | | | — | | | | — | | | | — | | | | (176 | ) |
Repurchase of common stock | | | — | | | | — | | | | — | | | | (35 | ) | | | — | | | | — | | | | (35 | ) |
Sale of subsidiary units(1) | | | — | | | | — | | | | — | | | | — | | | | — | | | | 115 | | | | 115 | |
Contributions from (distributions to) noncontrolling interest owners and other, net | | | — | | | | — | | | | — | | | | — | | | | — | | | | (21 | ) | | | (21 | ) |
Reclassification of previously deferred derivative losses to net income | | | — | | | | — | | | | — | | | | — | | | | 22 | | | | — | | | | 22 | |
Adjustments for pension and other postretirement plans | | | — | | | | — | | | | — | | | | — | | | | (94 | ) | | | — | | | | (94 | ) |
Other | | | — | | | | — | | | | — | | | | — | | | | 1 | | | | — | | | | 1 | |
| | | | | | | | | | | | | | | | | | | | | | | | | | | | |
Balance at December 31, 2009 | | | 50 | | | | 7,243 | | | | 13,868 | | | | (721 | ) | | | (512 | ) | | | 487 | | | | 20,415 | |
Net income (loss) | | | — | | | | — | | | | 761 | | | | — | | | | — | | | | 60 | | | | 821 | |
Common stock issued | | | 1 | | | | 253 | | | | — | | | | — | | | | — | | | | — | | | | 254 | |
Dividends—common | | | — | | | | — | | | | (180 | ) | | | — | | | | — | | | | — | | | | (180 | ) |
Repurchase of common stock | | | — | | | | — | | | | — | | | | (42 | ) | | | — | | | | — | | | | (42 | ) |
Sale of subsidiary units(1) | | | — | | | | — | | | | — | | | | — | | | | — | | | | 295 | | | | 295 | |
Contributions from (distributions to) noncontrolling interest owners and other, net | | | — | | | | — | | | | — | | | | — | | | | — | | | | (87 | ) | | | (87 | ) |
Reclassification of previously deferred derivative losses to net income | | | — | | | | — | | | | — | | | | — | | | | 17 | | | | — | | | | 17 | |
Adjustments for pension and other postretirement plans | | | — | | | | — | | | | — | | | | — | | | | (54 | ) | | | — | | | | (54 | ) |
| | | | | | | | | | | | | | | | | | | | | | | | | | | | |
Balance at December 31, 2010 | | | 51 | | | | 7,496 | | | | 14,449 | | | | (763 | ) | | | (549 | ) | | | 755 | | | | 21,439 | |
Net income (loss) | | | — | | | | — | | | | (2,649 | ) | | | — | | | | — | | | | 81 | | | | (2,568 | ) |
Common stock issued | | | — | | | | 161 | | | | — | | | | — | | | | — | | | | — | | | | 161 | |
Dividends—common | | | — | | | | — | | | | (181 | ) | | | — | | | | — | | | | — | | | | (181 | ) |
Repurchase of common stock | | | — | | | | — | | | | — | | | | (41 | ) | | | — | | | | — | | | | (41 | ) |
Sale of subsidiary units(1) | | | — | | | | 32 | | | | — | | | | — | | | | — | | | | 269 | | | | 301 | |
Conversion of subordinated limited partner units to common units(2) | | | — | | | | 162 | | | | — | | | | — | | | | — | | | | (162 | ) | | | — | |
Contributions from (distributions to) noncontrolling interest owners and other, net | | | — | | | | — | | | | — | | | | — | | | | — | | | | (65 | ) | | | (65 | ) |
Reclassification of previously deferred derivative losses to net income | | | — | | | | — | | | | — | | | | — | | | | 10 | | | | — | | | | 10 | |
Adjustments for pension and other postretirement plans | | | — | | | | — | | | | — | | | | — | | | | (73 | ) | | | — | | | | (73 | ) |
| | | | | | | | | | | | | | | | | | | | | | | | | | | | |
Balance at December 31, 2011 | | $ | 51 | | | $ | 7,851 | | | $ | 11,619 | | | $ | (804 | ) | | $ | (612 | ) | | $ | 878 | | | $ | 18,983 | |
| | | | | | | | | | | | | | | | | | | | | | | | | | | | |
(1) | Paid-in capital and noncontrolling interests includes $18 million and $9 million, respectively, of tax associated with subsidiary equity transactions for the year ended December 31, 2011. Noncontrolling interests includes $43 million and $5 million of tax associated with subsidiary equity transactions for the years ended December 31, 2010 and 2009, respectively.
|
(2) | Includes $82 million of tax associated with subsidiary equity transactions that occurred prior to the conversion of subordinated limited partner units to common units.
|
|
| | | | | | | | | | | | | | | | | | | | | | | | | | | |
| | Total Stockholders’ Equity | | | | |
| millions | Common Stock | | Paid-in Capital | | Retained Earnings | | Treasury Stock | | Accumulated Other Comprehensive Income (Loss) | | Non- controlling Interests | | Total Equity |
| Balance at December 31, 2011 | $ | 51 |
| | $ | 7,851 |
| | $ | 11,619 |
| | $ | (804 | ) | | $ | (612 | ) | | $ | 878 |
| | $ | 18,983 |
|
| Net income (loss) | — |
| | — |
| | 2,391 |
| | — |
| | — |
| | 54 |
| | 2,445 |
|
| Common stock issued | — |
| | 249 |
| | — |
| | — |
| | — |
| | — |
| | 249 |
|
| Dividends—common stock | — |
| | — |
| | (181 | ) | | — |
| | — |
| | — |
| | (181 | ) |
| Repurchase of common stock | — |
| | — |
| | — |
| | (37 | ) | | — |
| | — |
| | (37 | ) |
| Subsidiary equity transactions | — |
| | 130 |
| | — |
| | — |
| | — |
| | 417 |
| | 547 |
|
| Distributions to noncontrolling interest owners | — |
| | — |
| | — |
| | — |
| | — |
| | (112 | ) | | (112 | ) |
| Contributions from noncontrolling interest owners | — |
| | — |
| | — |
| | — |
| | — |
| | 16 |
| | 16 |
|
Reclassification of previously deferred derivative losses to (gains) losses on derivatives, net | — |
| | — |
| | — |
| | — |
| | 8 |
| | — |
| | 8 |
|
Adjustments for pension and other postretirement plans | — |
| | — |
| | — |
| | — |
| | (36 | ) | | — |
| | (36 | ) |
| Balance at December 31, 2012 | 51 |
| | 8,230 |
| | 13,829 |
| | (841 | ) | | (640 | ) | | 1,253 |
| | 21,882 |
|
| Net income (loss) | — |
| | — |
| | 801 |
| | — |
| | — |
| | 140 |
| | 941 |
|
| Common stock issued | 1 |
| | 292 |
| | — |
| | — |
| | — |
| | — |
| | 293 |
|
| Dividends—common stock | — |
| | — |
| | (274 | ) | | — |
| | — |
| | — |
| | (274 | ) |
| Repurchase of common stock | — |
| | — |
| | — |
| | (54 | ) | | — |
| | — |
| | (54 | ) |
| Subsidiary equity transactions | — |
| | 107 |
| | — |
| | — |
| | — |
| | 554 |
| | 661 |
|
| Distributions to noncontrolling interest owners | — |
| | — |
| | — |
| | — |
| | — |
| | (156 | ) | | (156 | ) |
| Contributions from noncontrolling interest owners | — |
| | — |
| | — |
| | — |
| | — |
| | 2 |
| | 2 |
|
Reclassification of previously deferred derivative losses to (gains) losses on derivatives, net | — |
| | — |
| | — |
| | — |
| | 7 |
| | — |
| | 7 |
|
Adjustments for pension and other postretirement plans | — |
| | — |
| | — |
| | — |
| | 348 |
| | — |
| | 348 |
|
| Balance at December 31, 2013 | 52 |
| | 8,629 |
| | 14,356 |
| | (895 | ) | | (285 | ) | | 1,793 |
| | 23,650 |
|
| Net income (loss) | — |
| | — |
| | (1,750 | ) | | — |
| | — |
| | 187 |
| | (1,563 | ) |
| Common stock issued | — |
| | 286 |
| | — |
| | — |
| | — |
| | — |
| | 286 |
|
| Dividends—common stock | — |
| | — |
| | (505 | ) | | — |
| | — |
| | — |
| | (505 | ) |
| Repurchase of common stock | — |
| | — |
| | — |
| | (45 | ) | | — |
| | — |
| | (45 | ) |
| Subsidiary equity transactions | — |
| | 90 |
| | 24 |
| | — |
| | — |
| | 829 |
| | 943 |
|
| Distributions to noncontrolling interest owners | — |
| | — |
| | — |
| | — |
| | — |
| | (216 | ) | | (216 | ) |
Reclassification of previously deferred derivative losses to (gains) losses on derivatives, net | — |
| | — |
| | — |
| | — |
| | 6 |
| | — |
| | 6 |
|
Adjustments for pension and other postretirement plans | — |
| | — |
| | — |
| | — |
| | (238 | ) | | — |
| | (238 | ) |
| Balance at December 31, 2014 | $ | 52 |
| | $ | 9,005 |
| | $ | 12,125 |
| | $ | (940 | ) | | $ | (517 | ) | | $ | 2,593 |
| | $ | 22,318 |
|
See accompanying Notes to Consolidated Financial Statements.
91
ANADARKO PETROLEUM CORPORATION
CONSOLIDATED STATEMENTS OF CASH FLOWS | | | 000000 | | | | 000000 | | | | 000000 | |
| | | Years Ended December 31, | |
| millions | | 2011 | | | 2010 | | | 2009 | |
Cash Flows from Operating Activities | | | | | | | | | | | | |
Net income (loss) | | $ | (2,568 | ) | | $ | 821 | | | $ | (103 | ) |
Adjustments to reconcile net income (loss) to net cash provided by | | | | | | | | | | | | |
operating activities: | | | | | | | | | | | | |
Depreciation, depletion, and amortization | | | 3,830 | | | | 3,714 | | | | 3,532 | |
Deferred income taxes | | | (1,461 | ) | | | (123 | ) | | | (165 | ) |
Dry hole expense and impairments of unproved properties | | | 625 | | | | 682 | | | | 780 | |
Impairments | | | 1,774 | | | | 216 | | | | 115 | |
(Gains) losses on divestitures, net | | | (22 | ) | | | (29 | ) | | | (44 | ) |
Unrealized (gains) losses on derivatives, net | | | 616 | | | | (114 | ) | | | 717 | |
Reversal of accrual for Deepwater Royalty Relief Act dispute | | | — | | | | — | | | | (657 | ) |
Other | | | 454 | | | | 213 | | | | 183 | |
Changes in assets and liabilities: | | | | | | | | | | | | |
(Increase) decrease in accounts receivable | | | (989 | ) | | | (172 | ) | | | (290 | ) |
Increase (decrease) in accounts payable and accrued expenses | | | 287 | | | | (157 | ) | | | 269 | |
Other items—net | | | (41 | ) | | | 196 | | | | (411 | ) |
| | | | | | | | | | | | |
Net cash provided by (used in) operating activities | | | 2,505 | | | | 5,247 | | | | 3,926 | |
| | | | | | | | | | | | |
Cash Flows from Investing Activities | | | | | | | | | | | | |
Additions to properties and equipment and dry hole costs | | | (5,650 | ) | | | (5,008 | ) | | | (4,352 | ) |
Acquisition of midstream businesses | | | (802 | ) | | | — | | | | — | |
Divestitures of properties and equipment and other assets | | | 555 | | | | 70 | | | | 176 | |
Other—net | | | (78 | ) | | | (26 | ) | | | (60 | ) |
| | | | | | | | | | | | |
Net cash provided by (used in) investing activities | | | (5,975 | ) | | | (4,964 | ) | | | (4,236 | ) |
| | | | | | | | | | | | |
Cash Flows from Financing Activities | | | | | | | | | | | | |
Borrowings, net of issuance costs | | | 3,551 | | | | 3,198 | | | | 1,975 | |
Repayments of debt | | | (1,154 | ) | | | (1,879 | ) | | | (1,470 | ) |
Repayment of midstream subsidiary note payable to a related party | | | — | | | | (1,599 | ) | | | (140 | ) |
Repayment of capital lease obligation | | | (108 | ) | | | — | | | | — | |
Increase (decrease) in accounts payable, banks | | | 149 | | | | 7 | | | | (139 | ) |
Dividends paid | | | (181 | ) | | | (180 | ) | | | (176 | ) |
Repurchase of common stock | | | (41 | ) | | | (42 | ) | | | (35 | ) |
Issuance of common stock, including tax benefit on stock option exercises | | | 30 | | | | 107 | | | | 1,372 | |
Sale of subsidiary units | | | 328 | | | | 338 | | | | 120 | |
Distributions to noncontrolling interest owners | | | (82 | ) | | | (48 | ) | | | (29 | ) |
Other financing activities | | | 18 | | | | (24 | ) | | | 3 | |
| | | | | | | | | | | | |
Net cash provided by (used in) financing activities | | | 2,510 | | | | (122 | ) | | | 1,481 | |
| | | | | | | | | | | | |
Effect of Exchange Rate Changes on Cash | | | (23 | ) | | | (12 | ) | | | — | |
| | | | | | | | | | | | |
Net Increase (Decrease) in Cash and Cash Equivalents | | | (983 | ) | | | 149 | | | | 1,171 | |
Cash and Cash Equivalents at Beginning of Period | | | 3,680 | | | | 3,531 | | | | 2,360 | |
| | | | | | | | | | | | |
Cash and Cash Equivalents at End of Period | | $ | 2,697 | | | $ | 3,680 | | | $ | 3,531 | |
| | | | | | | | | | | | |
|
| | | | | | | | | | | |
| | Years Ended December 31, |
| millions | 2014 | | 2013 | | 2012 |
| Cash Flows from Operating Activities | | | | | |
| Net income (loss) | $ | (1,563 | ) | | $ | 941 |
| | $ | 2,445 |
|
Adjustments to reconcile net income (loss) to net cash provided by operating activities | | | | | |
| Depreciation, depletion, and amortization | 4,550 |
| | 3,927 |
| | 3,964 |
|
| Deferred income taxes | (105 | ) | | 90 |
| | 164 |
|
| Dry hole expense and impairments of unproved properties | 1,245 |
| | 864 |
| | 1,544 |
|
| Impairments | 836 |
| | 794 |
| | 389 |
|
| (Gains) losses on divestitures, net | (1,891 | ) | | 470 |
| | 71 |
|
| Total (gains) losses on derivatives, net | 207 |
| | (392 | ) | | (308 | ) |
Operating portion of net cash received (paid) in settlement of derivative instruments | 371 |
| | 85 |
| | 685 |
|
| Other | 327 |
| | 246 |
| | 232 |
|
| Changes in assets and liabilities | | | | | |
| Deepwater Horizon settlement and related costs | 90 |
| | (2 | ) | | 24 |
|
| Algeria exceptional profits tax settlement | — |
| | 730 |
| | (791 | ) |
| Tronox-related contingent loss | 4,360 |
| | 850 |
| | (250 | ) |
| (Increase) decrease in accounts receivable | 103 |
| | (11 | ) | | 520 |
|
| Increase (decrease) in accounts payable and accrued expenses | 7 |
| | 150 |
| | (476 | ) |
| Other items—net | (71 | ) | | 146 |
| | 126 |
|
| Net cash provided by (used in) operating activities | 8,466 |
| | 8,888 |
| | 8,339 |
|
| Cash Flows from Investing Activities | | | | | |
| Additions to properties and equipment and dry hole costs | (9,508 | ) | | (7,721 | ) | | (7,242 | ) |
| Acquisition of businesses | (1,527 | ) | | (473 | ) | | — |
|
| Divestitures of properties and equipment and other assets | 4,968 |
| | 567 |
| | 657 |
|
| Other—net | (405 | ) | | (589 | ) | | (284 | ) |
| Net cash provided by (used in) investing activities | (6,472 | ) | | (8,216 | ) | | (6,869 | ) |
| Cash Flows from Financing Activities | | | | | |
| Borrowings, net of issuance costs | 2,879 |
| | 958 |
| | 1,042 |
|
| Repayments of debt | (1,425 | ) | | (710 | ) | | (3,044 | ) |
| Financing portion of net cash paid in settlement of derivative instruments | (222 | ) | | — |
| | — |
|
| Increase (decrease) in outstanding checks | 62 |
| | (13 | ) | | (69 | ) |
| Dividends paid | (505 | ) | | (274 | ) | | (181 | ) |
| Repurchase of common stock | (45 | ) | | (54 | ) | | (37 | ) |
Issuance of common stock, including tax benefit on share-based compensation awards | 121 |
| | 146 |
| | 103 |
|
| Sale of subsidiary units | 1,026 |
| | 724 |
| | 623 |
|
| Distributions to noncontrolling interest owners | (216 | ) | | (156 | ) | | (112 | ) |
| Contributions from noncontrolling interest owners | — |
| | 2 |
| | 16 |
|
| Net cash provided by (used in) financing activities | 1,675 |
| | 623 |
| | (1,659 | ) |
| Effect of Exchange Rate Changes on Cash | 2 |
| | (68 | ) | | (37 | ) |
| Net Increase (Decrease) in Cash and Cash Equivalents | 3,671 |
| | 1,227 |
| | (226 | ) |
| Cash and Cash Equivalents at Beginning of Period | 3,698 |
| | 2,471 |
| | 2,697 |
|
| Cash and Cash Equivalents at End of Period | $ | 7,369 |
| | $ | 3,698 |
| | $ | 2,471 |
|
See accompanying Notes to Consolidated Financial Statements.
92
ANADARKO PETROLEUM CORPORATION
NOTES TO CONSOLIDATED FINANCIAL STATEMENTS
YEARS ENDED DECEMBER 31,
2011, 2010,2014, 2013, AND
20092012
1. Summary of Significant Accounting Policies
GeneralGeneral Anadarko Petroleum Corporation is engaged in the exploration, development, production, and marketing of natural gas, crude oil, condensate, and natural gas liquids (NGLs), and anticipated production of liquefied natural gas (LNG). In addition, the Company engages in the gathering, processing, and treating, of natural gas, and the transporting of natural gas, crude oil, and NGLs. The Company also participates in the hard mineralshard-minerals business through its ownership of non-operated joint ventures and royalty arrangements. Unless the context otherwise requires, the terms “Anadarko” and “Company” refer to Anadarko Petroleum Corporation and its consolidated subsidiaries.
Basis of Presentation The Consolidated Financial Statements have been prepared in conformity with accounting principles generally accepted in the United States. The Consolidated Financial Statements include the accounts of Anadarko and entities in which it holds a controlling interest. All intercompany transactions have been eliminated. Undivided interests in oil and natural-gas exploration and production joint ventures are consolidated on a proportionate basis. Investments in non-controlled entities, over which Anadarko has the ability to exercise significant influence over operating and financial policies, are accounted for using the equity method. In applying the equity method of accounting, the investments are initially recognized at cost, and subsequently adjusted for the Company’s proportionate share of earnings, and losses, and distributions. Other investments are carried at original cost. Investments accounted for using the equity-equity method and cost-methodcost method are reported as a component of other assets. Certain prior-period amounts have been reclassified to conform to the current-year presentation.
Use of Estimates In preparing The preparation of financial statements in accordance with generally accepted accounting principles generally accepted in the United States (GAAP) requires management makesto make informed judgments and estimates that affect the reported amounts of assets, liabilities, revenues, and expenses. Management evaluates its estimates and related assumptions regularly, including those related to proved reserves; the value of properties and equipment; proved reserves; goodwill; intangible assets; asset retirement obligations; litigation reserves;liabilities; environmental liabilities; pension assets, liabilities, and costs; income taxes; and fair values. Changes in facts and circumstances or additional information may result in revised estimates, and actual results may differ from these estimates.
Fair Value Fair value is defined as the price that would be received to sell an asset or the price paid to transfer a liability in an orderly transaction between market participants at the measurement date. Inputs used in determining fair value are characterized according to a hierarchy that prioritizes those inputs based on the degree to which they are observable. The three input levels of the fair-value hierarchy are as follows:
Level 1—Inputs represent quoted prices in active markets for identical assets or liabilities (for example, exchange-traded commodity derivatives).
Level 2—Inputs other than quoted prices included within Level 1 that are observable for the asset or liability, either directly or indirectly (for example, quoted market prices for similar assets or liabilities in active markets or quoted market prices for identical assets or liabilities in markets not considered to be active, inputs other than quoted prices that are observable for the asset or liability, or market-corroborated inputs).
Level 3—Inputs that are not observable from objective sources, such as the Company’s internally developed assumptions used in pricing an asset or liability (for example, an estimate of future cash flows used in the Company’s internally developed present value of future cash flows model that underlies the fair-value measurement).ANADARKO PETROLEUM CORPORATION
NOTES TO CONSOLIDATED FINANCIAL STATEMENTS
YEARS ENDED DECEMBER 31, 2011, 2010, AND 2009
1. Summary of Significant Accounting Policies (Continued)
In determining fair value, the Company
utilizesuses observable market data when available, or models that incorporate observable market data. In addition to market information, the Company incorporates transaction-specific details that, in management’s judgment, market participants would take into account in measuring fair value.
ANADARKO PETROLEUM CORPORATION
NOTES TO CONSOLIDATED FINANCIAL STATEMENTS
YEARS ENDED DECEMBER 31, 2014, 2013, AND 2012
1. Summary of Significant Accounting Policies (Continued)
In arriving at fair-value estimates, the Company
utilizes the mostuses relevant observable inputs available for the valuation technique employed. If a fair-value measurement reflects inputs at multiple levels within the hierarchy, the fair-value measurement is characterized based on the lowest level of input that is significant to the fair-value measurement. For Anadarko, recurring fair-value measurements are performed for interest-rate derivatives, commodity derivatives, and investments in trading securities.
The carrying amount of cash and cash equivalents, accounts receivable, and accounts payable reported on the Consolidated Balance Sheets approximates fair value. The fair value of debt is the estimated amount the Company would have to pay to repurchase its debt, including any premium or discount attributable to the difference between the stated interest rate and market interest rate of interest at each balance sheet date. Debt fair values, as disclosed inNote 12—Debt and Interest Expense, are based on quoted market prices for identical instruments, if available, or based on valuations of similar debt instruments. Non-financial assets and liabilities initially measured at fair value include certain assets and liabilities acquired in a business combination or through a non-monetary exchange transaction, intangible assets, goodwill, asset retirement obligations, exit or disposal costs, and capital lease assets where the present value of lease payments is greater than the fair value of the leased asset.
Revenues The Company’s natural gas is sold primarily to interstate and intrastate natural-gas pipelines, direct end-users, industrial users, local distribution companies, and natural-gas marketers. Oil and condensate are sold primarily to marketers, gatherers, and refiners. NGLs are sold primarily to direct end-users, refiners, and marketers. In 2011, 2010, and 2009, there were no sales to individual customers that exceeded 10% of the Company’s total sales revenues. The Company recognizes sales revenues for natural gas, oil and condensate, and NGLs based on the amount of each product sold to purchasers when delivery to the purchaser has occurred and title has transferred. This occurs when product has been delivered to a pipeline or
when a tanker lifting has occurred. The Company follows the sales method of accounting for natural-gas production imbalances. If the Company’s sales volumes for a well exceed the Company’s proportionate share of production from the well, a liability is recognized to the extent that the Company’s share of estimated remaining recoverable reserves from the well is insufficient to satisfy this imbalance. No receivables are recorded for those wells on which the Company has taken less than its proportionate share of production.
The Company enters into buy/sell arrangements for a portion of its crude-oil production. Under these arrangements, barrels are sold at prevailing market prices at a location, and in an additional transaction entered into in contemplation of the sale transaction with the same third party, barrels are re-purchased at a different location at the market prices prevailing at that location. The barrels are then sold at prevailing market prices at the re-purchase location. These arrangements are often required by private transporters. In these transactions, the re-purchase price is more than the original sales price with the difference representing a transportation fee. Other buy/sell arrangements are entered in order to shift the ultimate sales point of the Company’s production to a more liquid location, thereby avoiding potential marketing fees and other market-price reductions. In these transactions, the sales price in the field and the re-purchase price are each at prevailing market prices at the respective locations. Anadarko uses buy/sell arrangements in its marketing and trading activities and reports these transactions in the Consolidated Statements of Income on a net basis.
Anadarko provides gathering, processing, treating, and
transportationtransporting services pursuant to a variety of contracts. Under these arrangements, the Company receives fees, or retains a percentage of products or a percentage of the proceeds from the sale of products and recognizes revenue at the time the services are performed or product is sold. These revenues are included in gathering, processing, and marketing
sales.ANADARKO PETROLEUM CORPORATION
NOTES TO CONSOLIDATED FINANCIAL STATEMENTS
YEARS ENDED DECEMBER 31, 2011, 2010, AND 2009
1. Summary of Significant Accounting Policies (Continued)
Income.
Marketing margins related to the Company’s production are included in natural-gas sales, oil and condensate sales, and NGLs sales. Marketing margins related to sales of commodities purchased from third parties
as well as realized and
unrealized gains and losses on derivatives related to such marketing activities are included in gathering, processing, and marketing
sales.sales in the Consolidated Statements of Income.
The Company enters into buy/sell arrangements related to the transportation of a portion of its oil production. Under these arrangements, barrels are sold to a third party at a location-based contract price and subsequently repurchased by the Company at a downstream location. The difference in value between the sale and purchase price represents the transportation fee from the lease or certain gathering locations to more liquid markets. These arrangements are often required by private transporters. These transactions are reported on a net basis and included in oil and gas transportation in the Consolidated Statements of Income.
Cash Equivalents The Company considers all highly liquid investments with a maturity of three months or less when purchased to be cash equivalents.
ANADARKO PETROLEUM CORPORATION
NOTES TO CONSOLIDATED FINANCIAL STATEMENTS
YEARS ENDED DECEMBER 31, 2014, 2013, AND 2012
1. Summary of Significant Accounting Policies (Continued)
Accounts Receivable and Allowance for Uncollectible Accounts The Company conducts credit analyses of customers prior to making any sales to new customers or increasing credit for existing customers. Based on these analyses, the Company may require a standby letter of credit or a financial guarantee. The Company charges uncollectible accounts receivable against the allowance for uncollectible accounts when it determines collection will no longer be pursued. At December 31, 2011 and 2010, accounts receivable are shown net of allowance for uncollectible accounts of $6 million and $9 million, respectively.
Inventories Commodity inventories are stated at the lower of average cost or market.
Properties and Equipment Properties and equipment are stated at cost less accumulated depreciation, depletion, and amortization expense (DD&A). Costs of improvements that appreciably improve the efficiency or productive capacity of existing properties or extend their lives are capitalized. Maintenance and repairs are expensed as incurred. Upon retirement or sale, the cost of properties and equipment, net of the related accumulated DD&A, is removed and, if appropriate, gain or loss is recognized in gains (losses) on divestitures and other, net.
Oil and Gas Properties The Company applies the successful efforts method of accounting for oil and gas properties. Exploration costs such as exploratory geological and geophysical costs, delay rentals, and exploration overhead are charged against earnings as incurred. If an exploratory well provides evidence to justify potential completion as a producing well, drilling costs associated with the well are initially capitalized, or suspended, pending a determination as to whether a commercially sufficient quantity of proved reserves can be attributed to the area as a result of drilling. This determination may take longer than one year in certain areas (generally in deepwater and international locations) depending on, among other things, the amount of hydrocarbons discovered, the outcome of planned geological and engineering studies, the need for additional appraisal drilling activities to determine whether the discovery is sufficient to support an economic development plan, and government sanctioning of development activities in certain international locations. At the end of each quarter, management reviews the status of all suspended exploratory drillingwell costs in light of ongoing exploration activities—in particular, whether the Company is making sufficient progress in its ongoing exploration and appraisal efforts or, in the case of discoveries requiring government sanctioning, whether development negotiations are underway and proceeding as planned. If management determines that future appraisal drilling or development activities are unlikely to occur, associated suspended exploratory drillingwell costs are expensed. Acquisition costs of unproved properties are periodically assessed for impairment and are transferred to proved oil and gas properties to the extent the costs are associated with successful exploration activities. Significant undeveloped leases are assessed individually for impairment, based on the Company’s current exploration plans, and a valuation allowance is provided if impairment is indicated. Unproved oil and gas properties with individually insignificant lease acquisition costs are amortized on a group basis (thereby establishing a valuation allowance) over the average
lease terms
of the leases, at rates that provide for full amortization of unsuccessful leases upon lease expiration or abandonment. Costs of expired or abandoned leases are charged against the valuation allowance, while costs of productive leases are transferred to proved oil and gas properties. Costs of maintaining and retaining unproved properties, as well as amortization of individually insignificant leases and impairment of unsuccessful leases, are included in exploration
expense.expense in the Consolidated Statements of Income.
ANADARKO PETROLEUM CORPORATION
NOTES TO CONSOLIDATED FINANCIAL STATEMENTS
YEARS ENDED DECEMBER 31,
2011, 2010,2014, 2013, AND
20092012
1. Summary of Significant Accounting Policies (Continued)
Capitalized Interest For significant projects, interest is capitalized as part of the historical cost of developing and constructing assets. Significant oil and gas investments in unproved properties, significant exploration and development projects for which DD&A isthat have not currently recognized, and exploration orcommenced production, significant midstream development activities that are in progress, and investments in equity method affiliates that are undergoing the construction of assets that have not commenced principle operations qualify for interest capitalization. Interest is capitalized until the asset is ready for service. Capitalized interest is determined by multiplying the Company’s weighted-average borrowing cost on debt by the average amount of qualifying costs incurred. Once an asset subject to interest capitalization is completed and placed in service, the associated capitalized interest is expensed through depreciation or impairment. See Note 12—Debt and Interest Expense.
Asset Retirement Obligations Asset retirement obligations (AROs) associated with the retirement of tangible long-lived assets are recognized as liabilities with an increase to the carrying amounts of the related long-lived assets in the period incurred. The cost of the tangible asset, including the asset retirement cost, is depreciated over the useful life of the asset. AROs are recorded at estimated fair value, measured by reference to the expected future cash outflows required to satisfy the retirement obligations discounted at the Company’s credit-adjusted risk-free interest rate. Accretion expense is recognized over time as the discounted liabilities are accreted to their expected settlement value. If estimated future costs of AROs change, an adjustment is recorded to both the asset retirement obligation and the long-lived asset. Revisions to estimated AROs can result from changes in retirement cost estimates, revisions to estimated inflation rates, and changes in the estimated timing of abandonment. See Note 7—Asset Retirement Obligations.
Impairments Properties and equipment net of salvage value, are reviewed for impairment at the lowest level for which identifiable cash flows are independent of cash flows from other assets, and when facts and circumstances indicate that net book values may not be recoverable. In performing this review, an undiscounted cash flow test is performed onat the impairment unit.lowest level for which identifiable cash flows are independent of cash flows from other assets. If the sum of the undiscounted future net cash flows is less than the net book value of the property, an impairment loss is recognized for the excess, if any, of the property’s net book value over its estimated fair value. See Note 5—Impairments.
Depreciation, Depletion, and Amortization Costs of drilling and equipping successful wells, costs to construct or acquire facilities other than offshore platforms, associated asset retirement costs, and capital lease assets used in oil and gas activities are depreciated using the unit-of-production (UOP) method based on total estimated proved developed oil and gas reserves. Costs of acquiring proved properties, including leasehold acquisition costs transferred from unproved properties and costs to construct or acquire offshore platforms and associated asset retirement costs, are depleted using the UOP method based on total estimated proved developed and undeveloped reserves. Mineral properties are also depleted using the UOP method. All other properties are stated at historical acquisition cost, net of impairments, and are depreciated using the straight-line method over the useful lives of the assets, which range from 3 to 15 years for furniture and equipment, up to 40 years for buildings, and up to 47 years for gathering facilities.
Goodwill and Other Intangible Assets Goodwill is subject to annual impairment testing at October 1 (or more frequent testing as circumstances dictate). Anadarko has allocated goodwill to fourthe following reporting units: oil and gas exploration and production;production, other gathering and processing;processing, Western Gas Partners, LP (WES) gathering and processing;processing, and WES transportation. Changes in goodwill may result from, among other things, impairments, future acquisitions, or future divestitures. SeeNote 7—8—Goodwill and Other Intangible Assets.Assets.
Other intangible assets represent contractual rights obtained in connection with business combinations that had favorable contractual terms relative to market at the acquisition date.date as well as customer-related intangible assets, including customer relationships established by acquired contracts. Other intangible assets are amortized over their estimated useful lives and are assessed for impairment whenever impairment indicators are present. SeeNote 7—8—Goodwill and Other Intangible Assets.Assets.
ANADARKO PETROLEUM CORPORATION
NOTES TO CONSOLIDATED FINANCIAL STATEMENTS
YEARS ENDED DECEMBER 31,
2011, 2010,2014, 2013, AND
20092012
1. Summary of Significant Accounting Policies (Continued)
Derivative Instruments Anadarko uses derivative instruments to manage its exposure to cash-flow variability from commodity-price and interest-rate risk. All derivatives that do not satisfy the normal purchases and sales exception criteriaDerivatives are carried on the balance sheet at fair value and are included in other current assets, other assets, accrued expenses, or other long-term liabilities, depending on the derivative position and the expected timing of settlement.settlement, unless they satisfy the normal purchases and sales exception criteria. Where the Company has the contractual right and intends to net settle, derivative assets and liabilities are reported on a net basis. Realized and unrealized gainsGains and losses on derivative instruments are recognized on a current basis.currently in earnings. Net derivative losses attributable to derivatives previously subject to hedge accounting reside in accumulated other comprehensive income and will be reclassified to earnings in future periods as the economic transactions to which the derivatives relate affect earnings. SeeNote 10—11—Derivative Instruments.
Accounts Payable Included in accounts Accounts payable included liabilities of $388 millionat December 31, 20112014, and 2010, are liabilities of $408$326 million and $259 million, respectively, at December 31, 2013, representing the amount by which checks issued, but not presented to the Company’s banks for collection, exceedexceeded balances in applicable bank accounts. Changes in these liabilities are reflected in cash flows from financing activities.
Legal Contingencies The Company is subject to legal proceedings, claims, and liabilities that arise in the ordinary course of its business. Except for legal contingencies acquired in a business combination, which are recorded at fair value at the time of acquisition, the Company accrues losses associated with legal claims when such losses are probable and reasonably estimable. If the Company determines that a loss is probable and cannot estimate a specific amount for that loss, but can estimate a range of loss, the best estimate within the range is accrued. If no amount within the range is a better estimate than any other, the minimum amount of the range is accrued. Estimates are adjusted as additional information becomes available or circumstances change. Legal defense costs associated with loss contingencies are expensed in the period incurred. SeeNote 2—Deepwater Horizon Events andNote 16—17—Contingencies.
Environmental Contingencies The Company is subject to various environmental-remediation and reclamation obligations arising from federal, state, and local laws and regulations. Except for environmental contingencies acquired in a business combination, which are recorded at fair value at the time of acquisition, the Company accrues losses associated with environmental obligations when such losses are probable and can be reasonably estimated.estimable. Accruals for estimated environmental losses are recognized no later than at the time the remediation feasibility study, or the evaluation of response options, is complete. These accruals are adjusted as additional information becomes available or as circumstances change. Future environmental expenditures are not discounted to their present value. Recoveries of environmental costs from other parties are recorded separately as assets at their undiscounted value when receipt of such recoveries is probable. SeeNote 2—Deepwater Horizon Events andNote 16—17—Contingencies.
Pension Plans, Other Postretirement Benefits, and Defined-Contribution Plans The Company measures pension plan assets at fair value. Defined-benefit plan obligations and costs are actuarially determined, incorporating the use of various assumptions. Critical assumptions for pension and other postretirement plans include the discount rate, the expected long-term rate of return on plan assets (for funded pension plans), the rate of future compensation increases, and the health care cost trend rate.rate (for postretirement plans). Other assumptions involve demographic factors such as retirement age, mortality, and turnover. The Company evaluates and updates its actuarial assumptions at least annually. The Company amortizes prior service costs and credits(credits) on a straight-line basis over the average remaining service period of employees expected to receive benefits under each plan. Actuarial gains and losses that exceed 10% of the greater of the projected benefit obligation and the market-related value of assets are amortized over the average remaining service period of participating employees expected to receive benefits under each plan. SeeNote 21—Pension Plans, Other Postretirement Benefits, and Defined-Contribution Plans.
ANADARKO PETROLEUM CORPORATION
NOTES TO CONSOLIDATED FINANCIAL STATEMENTS
YEARS ENDED DECEMBER 31, 2014, 2013, AND 2012
1. Summary of Significant Accounting Policies (Continued)
Noncontrolling Interests Noncontrolling interests represent third-party ownership in the net assets of the Company’s consolidated subsidiaries and are presented as a component of equity. Changes in Anadarko’s ownership interests in subsidiaries that do not result in deconsolidation are recognized in equity. SeeNote 8—9—Noncontrolling Interests.
ANADARKO PETROLEUM CORPORATIONNOTES TO CONSOLIDATED FINANCIAL STATEMENTS
YEARS ENDED DECEMBER 31, 2011, 2010, AND 2009
1. Summary of Significant Accounting Policies (Continued)
Income Taxes The Company files various U.S. federal, state, and foreign income tax returns. Deferred federal, state, and foreign income taxes are provided on temporary differences between the financial statement carrying amounts of assets and liabilities and their respective tax bases.basis. The Company routinely assesses the realizability of its deferred tax assets. If the Company concludes that it is it more likely than not that some of the deferred tax assets will not be realized, the tax asset is reduced by a valuation allowance. The Company recognizes a tax benefit from an uncertain tax position when it is more likely than not that the position will be sustained upon examination, based on the technical merits of the position. The tax benefit recorded is equal to the largest amount that is greater than 50% likely to be realized through final settlement with a taxing authority. Interest and penalties related to unrecognized tax benefits are recognized in income tax expense (benefit). The Company uses the flow-through method to account for its investment tax credits. SeeNote 18—Income Taxes.
Share-Based Compensation The Company accounts for share-based compensation at fair value. The Company grants equity-classified awards including stock options and non-vested equity shares (restricted stock awards and units). The Company may also grantsgrant equity-classified and liability-classified awards based on a comparison of the Company’s total shareholder return (TSR) to the TSR of a predetermined group of peer companies (performance units). The fair value of stock option awards is determined
on the date of grant using the Black-Scholes option-pricing model. Restricted stock awards and units are valued using the market price of Anadarko common
stock on the grant date.stock. For
equity- and liability-classified performance units,other share-based compensation awards, fair value is determined using a Monte Carlo simulation or
discounted cash flowdiscounted-cash-flow methodology.
The Company records compensation cost, net of estimated forfeitures, for share-based compensation awards over the requisite service period. As each award of stock options or equity shares vests, anperiod using the straight-line method. An adjustment is made to compensation cost for any difference between the estimated forfeitures and the actual forfeitures related to the vested awards. For equity-classified share-based awards that contain service conditions, compensation cost is recorded using the straight-line method. If the requisite service period is satisfied, compensation cost is not adjusted. For liability-classified performance units,awards, expense is recognized overbased on the requisite performance periodgrant-date fair value. For liability-classified share-based compensation awards, expense is recognized for those awards expected to ultimately be paid. The amount of expense reported for liability-classified awards is adjusted throughout the performance period for fair-value changes so that the expense recognized for each award is equivalent to the amount to be paid. SeeNote 14—15—Share-Based Compensation.
Earnings Per Share The Company’s basic earnings per share (EPS) is computed based on the average number of shares of common stock outstanding for the period and includeincludes the effect of any participating securities as appropriate. Diluted EPS includes the effect of the Company’s outstanding stock options, restricted stock awards, restricted stock units, and performance-based stock awards, if the inclusion of these items is dilutive. SeeNote 13—Stockholders’ Equity.
Recently Issued Accounting Standards Not Yet Adopted In 2011, the The Financial Accounting Standards Board (FASB) issued an Accounting Standards Update (ASU) 2014-09, Revenue from Contracts with Customers. This ASU supersedes the revenue recognition requirements in Topic 605, Revenue Recognition, and industry-specific guidance in Subtopic 932-605, Extractive Activities—Oil and Gas—Revenue Recognition, and requires an entity to recognize revenue when it transfers promised goods or services to customers in an amount that permits an initial assessment of qualitative factorsreflects the consideration the entity expects to determine whether it is more likely than not that the fair value of a reporting unit is less than its carrying amountbe entitled to in exchange for goodwill impairment testing purposes. Thus, determining a reporting unit’s fair value is not required unless, as a result of a qualitative assessment, it is more likely than not that the fair value of the reporting unit is less than its carrying amount.those goods or services. This ASU is effective for annual and interim periods beginning after December 15, 2011. Adoptionin 2017 and is required to be adopted using one of two retrospective application methods, with no early adoption permitted. The Company is currently evaluating the impact of the adoption of this ASU will haveon its consolidated financial statements.
ANADARKO PETROLEUM CORPORATION
NOTES TO CONSOLIDATED FINANCIAL STATEMENTS
YEARS ENDED DECEMBER 31, 2014, 2013, AND 2012
1. Summary of Significant Accounting Policies (Continued)
ASU 2014-08, Reporting Discontinued Operations and Disclosures of Disposals of Components of an Entity, changes the criteria for reporting discontinued operations and requires additional disclosures, both for discontinued operations and for individually significant dispositions and assets classified as held for sale not qualifying as discontinued operations. This ASU is effective beginning in 2015, with early adoption permitted for disposals or for assets classified as held for sale not reported in previously issued financial statements. Anadarko early adopted this ASU on a prospective basis in the first quarter of 2014 with no material impact on the Company’s consolidated financial statements. ASU 2013-11, Presentation of an Unrecognized Tax Benefit When a Net Operating Loss Carryforward, a Similar Tax Loss, or a Tax Credit Carryforward Exists, requires that an unrecognized tax benefit or a portion of an unrecognized tax benefit be presented in the financial statements as a reduction to a deferred tax asset, except in certain circumstances. This ASU is effective for annual and interim periods beginning in 2014. See Note 18—Income Taxes.
2. Acquisitions, Divestitures, and Assets Held for Sale
Acquisitions In November 2014, WES acquired Nuevo Midstream, LLC (Nuevo), which owns and operates gathering and processing assets in the Delaware basin in West Texas, for $1.554 billion. Following the acquisition, WES changed the name of Nuevo to Delaware Basin Midstream, LLC (DBM). This acquisition constitutes a business combination and was accounted for using the acquisition method of accounting. This acquisition aligns the Company’s gas gathering and processing capacity with future industry production growth plans in the Delaware basin. The following summarizes the preliminary fair value of assets acquired and liabilities assumed at the acquisition date, pending the acquired entity’s final financial statements:
|
| | | | |
| millions | | |
| Current assets | | $ | 46 |
|
| Properties and equipment | | 441 |
|
| Other intangible assets | | 836 |
|
| Accounts payable | | (13 | ) |
| Accrued expenses | | (25 | ) |
| Deferred income taxes | | (1 | ) |
| Asset retirement obligations | | (9 | ) |
| Goodwill | | 279 |
|
| Total assets acquired and liabilities assumed | | $ | 1,554 |
|
Fair-value measurements of assets acquired and liabilities assumed are based on inputs that are not observable in the market and thus represent Level 3 inputs. The fair value of properties and equipment is based on market and cost approaches. Intangible assets consist of customer contracts, the fair value of which was determined using an income approach. Deferred tax assets (liabilities) represent the tax effects of differences in the tax basis and acquisition-date fair values of assets acquired and liabilities assumed. All of the goodwill related to this acquisition is amortizable for tax purposes. The assets acquired and liabilities assumed are included within the midstream reporting segment.
Results of operations attributable to this acquisition are included in the Company’s Consolidated Statements of Income from the date acquired. The amounts of revenue and earnings included in the Company’s Consolidated Statement of Income for the year ended December 31, 2014, and the amounts of revenue and earnings that would have been recognized had the acquisition occurred on January 1, 2014, are not material to the Company’s Consolidated Statements of Income.
ANADARKO PETROLEUM CORPORATION
NOTES TO CONSOLIDATED FINANCIAL STATEMENTS
YEARS ENDED DECEMBER 31,
2011, 2010,2014, 2013, AND
20092012
2. Acquisitions, Divestitures, and Assets Held for Sale (Continued)
There were no other material acquisitions made during 2014. The following summarizes acquisitions made during 2013:
|
| | | | | | | |
| millions, except percentages | Percentage Acquired | | Cash Paid | |
| Certain oil and gas properties and related assets in the Moxa area of Wyoming | 100 | % | | $ | 310 |
| (1) |
| Gas-gathering systems in the Marcellus shale in north-central Pennsylvania | 33.75 | % | | 135 |
| |
Joint venture formed to design, construct, and own two fractionators located in Mont Belvieu, Texas | 25 | % | | 78 |
| |
| Intrastate pipeline in southwestern Wyoming | 100 | % | | 28 |
| |
| |
(1) | Includes $306 million that represents the fair value of the oil and gas properties acquired. |
Divestitures and Assets Held for Sale The following summarizes the proceeds received and gains (losses) recognized on divestitures for the years ended December 31:
|
| | | | | | | | | | | |
| millions | 2014 | | 2013 | | 2012 |
| Proceeds received | $ | 4,968 |
| | $ | 567 |
| | $ | 657 |
|
| Gains (losses) on divestitures, net | 1,891 |
| | (470 | ) | | (71 | ) |
Divestitures The 2014 proceeds and net gains were primarily related to assets included in the oil and gas exploration and production reporting segment. The Company sold a 10% working interest in Offshore Area 1 in Mozambique for $2.64 billion, recognizing a gain of $1.5 billion. In addition, the Company sold its Chinese subsidiary for $1.075 billion, recognizing a gain of $510 million; sold its interest in the nonoperated Vito deepwater development, along with several surrounding exploration blocks in the Gulf of Mexico, for $500 million, recognizing a gain of $237 million; and sold its interest in the Pinedale/Jonah assets in Wyoming for $581 million. These gains were partially offset by losses of $456 million discussed under Assets Held for Sale below.
The 2013 sales proceeds were primarily related to the Company’s divestiture of its interests in a soda ash joint venture and certain U.S. onshore and Indonesian oil and gas properties. Net losses were primarily related to the Company’s sale of the Pinedale/Jonah assets discussed under Assets Held for Sale below, partially offset by the Company’s divestiture of its interests in the soda ash joint venture and certain U.S. oil and gas properties. The 2012 sales proceeds were primarily related to U.S. oil and gas properties and net losses were primarily related to Indonesian oil and gas properties.
ANADARKO PETROLEUM CORPORATION
NOTES TO CONSOLIDATED FINANCIAL STATEMENTS
YEARS ENDED DECEMBER 31, 2014, 2013, AND 2012
2. Acquisitions, Divestitures, and Assets Held for Sale (Continued)
Assets Held for Sale During the fourth quarter of 2014, Anadarko considered certain U.S. onshore assets from the oil and gas exploration and production reporting segment to be held for sale. These assets were remeasured to their fair value using a market approach and Level 2 fair-value measurement, and the Company recognized a loss of $456 million. Gains and losses on assets held for sale are included in gains (losses) on divestitures and other, net in the Company’s Consolidated Statements of Income. Volatility in the current commodity-price environment has reduced the probability that the assets will be sold within one year and the assets are therefore no longer considered held for sale at December 31, 2014. At December 31, 2014, the balances of assets and liabilities associated with assets held for sale were not material.
During the fourth quarter of 2013, the Company began marketing certain other domestic properties from the oil and gas exploration and production reporting segment to redirect its operating activities and capital investments to other areas. These assets were remeasured to their fair value using a market approach and Level 2 fair-value measurement. In 2013, the Company recognized losses of $704 million primarily related to the sale of the Pinedale/Jonah assets in Wyoming, which closed in 2014. At December 31, 2013, the Company’s Consolidated Balance Sheets included long-term assets of $616 million and long-term liabilities of $27 million associated with assets held for sale.
Property Exchange In 2013, the Company exchanged certain oil and gas properties in the Wattenberg field with a third party. The properties exchanged were measured at the Company’s historical net cost with no gain or loss recognized. Anadarko paid $106 million in cash as part of the exchange, which is included as an addition to properties and equipment on the Company’s Consolidated Statement of Cash Flows.
3. Inventories
The following summarizes the major classes of inventories included in other current assets at December 31:
|
| | | | | | | |
| millions | 2014 | | 2013 |
| Oil | $ | 133 |
| | $ | 88 |
|
| Natural gas | 27 |
| | 43 |
|
| NGLs | 83 |
| | 79 |
|
| Total inventories | $ | 243 |
| | $ | 210 |
|
4. Properties and Equipment
The following summarizes the cost of properties and equipment by segment at December 31:
|
| | | | | | | |
| millions | 2014 | | 2013 |
Oil and gas exploration and production (1) | $ | 63,674 |
| | $ | 61,302 |
|
| Midstream | 8,647 |
| | 7,285 |
|
| Marketing | — |
| | 9 |
|
| Other | 2,786 |
| | 2,648 |
|
| Total properties and equipment | $ | 75,107 |
| | $ | 71,244 |
|
| |
(1) | Includes costs associated with unproved properties of $5.1 billion at December 31, 2014, and $6.9 billion at December 31, 2013. |
ANADARKO PETROLEUM CORPORATION
NOTES TO CONSOLIDATED FINANCIAL STATEMENTS
YEARS ENDED DECEMBER 31, 2014, 2013, AND 2012
5. Impairments
The following summarizes impairments by segment for the years ended December 31:
|
| | | | | | | | | | | |
| millions | 2014 | | 2013 | | 2012 |
| Oil and gas exploration and production | | | | | |
| Long-lived assets held for use | | | | | |
| U.S. onshore properties | $ | 545 |
| | $ | 142 |
| | $ | 259 |
|
| Gulf of Mexico properties | 276 |
| | 562 |
| | 104 |
|
| Cost-method investment | 3 |
| | 11 |
| | 13 |
|
| Midstream | | | | | |
| Long-lived assets held for use | 12 |
| | 79 |
| | 13 |
|
| Total impairments | $ | 836 |
| | $ | 794 |
| | $ | 389 |
|
In 2014, certain U.S. onshore and Gulf of Mexico oil and gas properties were impaired primarily due to lower forecasted natural-gas and oil prices. While the Company’s other U.S. onshore oil and gas properties indicated no impairment at December 31, 2014, it is reasonably possible the estimate of undiscounted cash flows related to certain of these properties may change in the near term due to declines in commodity prices and could result in additional property impairments.
In 2013, certain Gulf of Mexico properties were impaired due to a reduction in estimated future net cash flows and downward revisions of reserves resulting from changes to the Company’s development plans. Also in 2013, certain U.S. onshore properties and related midstream assets were impaired due to downward revisions of reserves resulting from changes to the Company’s development plans. In addition, a midstream property was impaired during 2013 due to a reduction in estimated future cash flows. In 2012, certain U.S. onshore and midstream properties were impaired primarily due to lower natural-gas prices and Gulf of Mexico properties were impaired primarily as a result of downward reserves revisions for a property that was near the end of its economic life. Impairments of the Company’s Venezuelan cost-method investment were due to declines in estimated recoverable value.
The following summarizes the post-impairment fair value of the above-described assets, which was measured using the income approach and Level 3 inputs:
|
| | | | | | | | |
| millions | | 2014 | | 2013 |
| Long-lived assets held for use | | $ | 731 |
| | $ | 548 |
|
Cost-method investment (1) | | 32 |
| | 32 |
|
| |
(1) | This represents the Company’s after-tax net investment. |
Impairments of Unproved Properties Impairments of unproved properties are included in exploration expense in the Company’s Consolidated Statements of Income. In 2012, the Company recognized a $721 million impairment of unproved Powder River coalbed methane properties primarily due to lower natural-gas prices. Also in 2012, the Company recognized a $124 million impairment of an unproved Gulf of Mexico natural-gas property that the Company did not expect to develop under the forecasted natural-gas price environment.
ANADARKO PETROLEUM CORPORATION
NOTES TO CONSOLIDATED FINANCIAL STATEMENTS
YEARS ENDED DECEMBER 31, 2014, 2013, AND 2012
6. Suspended Exploratory Well Costs
The following summarizes the changes in suspended exploratory well costs at December 31 for each of the last three years. Additions pending the determination of proved reserves excludes amounts capitalized and subsequently charged to expense within the same year.
|
| | | | | | | | | | | |
| millions | 2014 | | 2013 | | 2012 |
| Balance at January 1 | $ | 2,232 |
| | $ | 2,062 |
| | $ | 1,353 |
|
| Additions pending the determination of proved reserves | 421 |
| | 848 |
| | 960 |
|
Divestitures (1) | (913 | ) | | (48 | ) | | — |
|
| Reclassifications to proved properties | (100 | ) | | (507 | ) | | (129 | ) |
| Charges to exploration expense | (118 | ) | | (123 | ) | | (122 | ) |
| Balance at December 31 | $ | 1,522 |
| | $ | 2,232 |
| | $ | 2,062 |
|
| |
(1) | Includes $(744) million related to the Company’s sale of a 10% working interest in Offshore Area 1 in Mozambique during 2014. |
The following summarizes an aging of suspended exploratory well costs by geographic area and the year the costs were suspended at December 31, 2014:
|
| | | | | | | | | | | | | | | | | | | |
| | | | Year Costs Incurred(1) |
| millions | Total | | 2014 | | 2013 | | 2012 | | 2011 and prior |
| United States—Onshore | $ | 164 |
| | $ | 131 |
| | $ | 17 |
| | $ | 5 |
| | $ | 11 |
|
| United States—Offshore | 314 |
| | 78 |
| | 80 |
| | 63 |
| | 93 |
|
| International | 1,044 |
| | 179 |
| | 271 |
| | 184 |
| | 410 |
|
| | $ | 1,522 |
| | $ | 388 |
| | $ | 368 |
| | $ | 252 |
| | $ | 514 |
|
| |
(1) | Excludes additions subsequently reclassified to proved properties within the same year. |
Suspended exploratory well costs capitalized for a period greater than one year after completion of drilling were associated with 24 projects at December 31, 2014, primarily located in Brazil, Ghana, and the Gulf of Mexico. Project costs suspended for longer than one year were primarily suspended pending the completion of economic evaluations including, but not limited to, results of additional appraisal drilling, well-test analysis, additional geological and geophysical data, facilities and infrastructure development options, development plan approval, and permitting. Projects with suspended exploratory well costs are those identified by management as exhibiting sufficient quantities of hydrocarbons to justify potential development and where management is actively pursuing efforts to assess whether reserves can be attributed to these projects. If additional information becomes available that raises substantial doubt as to the economic or operational viability of any of these projects, the associated costs will be expensed at that time.
ANADARKO PETROLEUM CORPORATION
NOTES TO CONSOLIDATED FINANCIAL STATEMENTS
YEARS ENDED DECEMBER 31, 2014, 2013, AND 2012
7. Asset Retirement Obligations
The majority of Anadarko’s AROs relate to the plugging of wells and the related abandonment of oil and gas properties. Revisions in estimated liabilities during the period relate primarily to changes in estimates of asset retirement costs and include, but are not limited to, revisions of estimated inflation rates, changes in property lives, and the expected timing of settlement. The following summarizes changes in the Company’s AROs during 2014 and 2013:
|
| | | | | | | |
| millions | 2014 | | 2013 |
| Carrying amount of asset retirement obligations at January 1 | $ | 2,022 |
| | $ | 1,885 |
|
| Liabilities incurred | 119 |
| | 182 |
|
| Property dispositions | (70 | ) | | (76 | ) |
| Liabilities settled | (443 | ) | | (162 | ) |
| Accretion expense | 93 |
| | 110 |
|
| Revisions in estimated liabilities | 332 |
| | 83 |
|
| Carrying amount of asset retirement obligations at December 31 | $ | 2,053 |
| | $ | 2,022 |
|
8. Goodwill and Other Intangible Assets
Goodwill The Company’s 2014 annual impairment assessment of goodwill indicated no impairment. Procedures were also performed in the fourth quarter of 2014 to review any changes in circumstances subsequent to the annual test, including changes in commodity prices. These procedures also indicated no impairment. At December 31, 2014, the Company had $5.6 billion of goodwill allocated to the following reporting units: $5.1 billion to oil and gas exploration and production, $69 million to other gathering and processing, $379 million to WES gathering and processing, and $5 million to WES transportation.
Significant declines in commodity prices, difficulties or potential delays in obtaining drilling permits, or other unanticipated events could result in further goodwill impairment tests in the near term, the results of which may have a material adverse impact on the Company’s results of operations.
Other Intangible Assets Intangible assets and associated amortization expense were as follows:
|
| | | | | | | | | | | | | | | |
| millions | Gross Carrying Amount | | Accumulated Amortization | | Net Carrying Amount | | Amortization Expense |
| December 31, 2014 | | | | | | | |
| Offshore platform leases | $ | 33 |
| | $ | (29 | ) | | $ | 4 |
| | $ | — |
|
| Customer contracts | 1,004 |
| | (15 | ) | | 989 |
| | 6 |
|
| | $ | 1,037 |
| | $ | (44 | ) | | $ | 993 |
| | $ | 6 |
|
| December 31, 2013 | | | | | | | |
| Offshore platform leases | $ | 60 |
| | $ | (50 | ) | | $ | 10 |
| | $ | 3 |
|
| Customer contracts | 169 |
| | (9 | ) | | 160 |
| | 4 |
|
| | $ | 229 |
| | $ | (59 | ) | | $ | 170 |
| | $ | 7 |
|
Customer contract intangible assets are primarily related to WES’s DBM acquisition in 2014. These contracts are being amortized over 30 years. See Note 2—Acquisitions, Divestitures, and Assets Held for Sale. The annual aggregate amortization expense for intangible assets is expected to be $31 million each of the next five years.
ANADARKO PETROLEUM CORPORATION
NOTES TO CONSOLIDATED FINANCIAL STATEMENTS
YEARS ENDED DECEMBER 31, 2014, 2013, AND 2012
9. Noncontrolling Interests
In December 2012, Western Gas Equity Partners, LP (WGP), a publicly traded consolidated subsidiary formed to own substantially all of the partnership interests in WES previously owned by Anadarko, completed its initial public offering (IPO) of approximately 20 million common units representing limited partner interests in WGP at a price of $22.00 per common unit, for net proceeds of $411 million. During 2014, Anadarko sold approximately six million WGP common units to the public, raising net proceeds of $335 million. At December 31, 2014, Anadarko’s ownership interest in WGP consisted of an 88.3% limited partner interest and the entire non-economic general partner interest. The remaining 11.7% limited partner interest in WGP was owned by the public.
WES, a publicly traded consolidated subsidiary, is a limited partnership formed by Anadarko to own, operate, acquire, and develop midstream assets. WES issued approximately 10 million common units to the public raising net proceeds of $691 million in 2014, approximately 12 million common units to the public raising net proceeds of $725 million in 2013, and approximately 5 million common units to the public raising net proceeds of $212 million in 2012. In addition, WES issued 11 million Class C units to Anadarko in 2014 to partially fund the DBM acquisition. These units will receive distributions in the form of additional Class C units until the end of 2017. At December 31, 2014, WGP’s ownership interest in WES consisted of a 34.9% limited partner interest, the entire 1.8% general partner interest, and all of the WES incentive distribution rights. At December 31, 2014, Anadarko also owned an 8.3% limited partner interest in WES through other subsidiaries’ ownership of common and Class C units. The remaining 55% limited partner interest in WES was owned by the public.
10. Equity-Method Investments
In 2007, Anadarko contributed certain of its oil and gas properties and gathering and processing assets, with an aggregate fair value of $2.9 billion at the time of the contribution, to newly formed unconsolidated entities in exchange for noncontrolling mandatorily redeemable London Interbank Offered Rate (LIBOR) based preferred interests in those entities. The common equity of the investee entities is 95% owned by third parties that also maintain control over the assets. Subsequent to their formation, the investee entities loaned Anadarko an aggregate of $2.9 billion. The Company accounts for its investment in these entities using the equity method of accounting. The carrying amount of these investments was $2.8 billion and the carrying amount of notes payable to affiliates was $2.9 billion at December 31, 2014. Anadarko has legal right of setoff and intends to net settle its obligations under each of the notes payable to the investees with the distributable value of its interest in the corresponding investee. Accordingly, the investments and the obligations are presented net on the Consolidated Balance Sheets in other long-term liabilities—other for all periods presented.
Interest on the notes issued by Anadarko is variable, based on LIBOR, plus a spread that fluctuates with Anadarko’s credit rating. The applicable interest rate was 1.24% at December 31, 2014 and December 31, 2013. The note payable agreement contains a covenant that provides for a maximum Anadarko debt-to-capital ratio of 67%. Anadarko was in compliance with this covenant at December 31, 2014. Other (income) expense, net includes interest expense on the notes payable of $36 million in 2014, $37 million in 2013, and $42 million in 2012, and equity earnings from Anadarko’s investments in the investee entities of $(45) million in 2014, $(42) million in 2013, and $(43) million in 2012.
ANADARKO PETROLEUM CORPORATION
NOTES TO CONSOLIDATED FINANCIAL STATEMENTS
YEARS ENDED DECEMBER 31, 2014, 2013, AND 2012
11. Derivative Instruments
Objective and Strategy The Company uses derivative instruments to manage its exposure to cash-flow variability from commodity-price and interest-rate risks. Futures, swaps, and options are used to manage exposure to commodity-price risk inherent in the Company’s oil and natural-gas production and natural-gas processing operations (Oil and Natural-Gas Production/Processing Derivative Activities). Futures contracts and commodity-price swap agreements are used to fix the price of expected future oil and natural-gas sales at major industry trading locations, such as Henry Hub, Louisiana for natural gas and Cushing, Oklahoma or Sullom Voe, Scotland for oil. Basis swaps are periodically used to fix or float the price differential between product prices at one market location versus another. Options are used to establish a floor price, a ceiling price, or a floor and a ceiling price (collar) for expected future oil and natural-gas sales. Derivative instruments are also used to manage commodity-price risk inherent in customer price requirements and to fix margins on the future sale of natural gas and NGLs from the Company’s leased storage facilities (Marketing and Trading Derivative Activities).
Interest-rate swaps are used to fix or float interest rates on existing or anticipated indebtedness. The purpose of these instruments is to manage the Company’s existing or anticipated exposure to interest-rate changes. The fair value of the Company’s current interest-rate swap portfolio increases (decreases) when interest rates increase (decrease).
The Company does not apply hedge accounting to any of its derivative instruments. As a result, gains and losses associated with derivative instruments are recognized currently in earnings. Net derivative losses attributable to derivatives previously subject to hedge accounting reside in accumulated other comprehensive income (loss) and are reclassified to earnings as the transactions to which the derivatives relate are recognized in earnings. See Note 14—Accumulated Other Comprehensive Income (Loss).
Oil and Natural-Gas Production/Processing Derivative Activities The natural-gas prices listed below are New York Mercantile Exchange (NYMEX) Henry Hub prices. The following is a summary of the Company’s derivative instruments related to natural-gas production/processing derivative activities at December 31, 2014:
|
| | | | |
| | | 2015 Settlement |
| Natural Gas | | |
| Three-Way Collars (thousand MMBtu/d) | | 635 |
|
| Average price per MMBtu | | |
| Ceiling sold price (call) | | $ | 4.76 |
|
| Floor purchased price (put) | | $ | 3.75 |
|
| Floor sold price (put) | | $ | 2.75 |
|
Extendable Fixed-Price Contracts (thousand MMBtu/d) (1) | | 170 |
|
| Average price per MMBtu | | $ | 4.17 |
|
| |
(1) | The extendable fixed-price contracts have a contract term of January 2015 to December 2015 with an option for the counterparty to extend the contract term to December 2016 at the same price. |
MMBtu—million British thermal units
MMBtu/d—million British thermal units per day
A three-way collar is a combination of three options: a sold call, a purchased put, and a sold put. The sold call establishes the maximum price that the Company will receive for the contracted commodity volumes. The purchased put establishes the minimum price that the Company will receive for the contracted volumes unless the market price for the commodity falls below the sold put strike price, at which point the minimum price equals the reference price (e.g., NYMEX) plus the excess of the purchased put strike price over the sold put strike price.
In 2014, the Company terminated or offset then-existing 2015 oil three-way collars with a notional volume of 25 thousand barrels per day due to lower oil prices, resulting in a cash receipt of $126 million.
ANADARKO PETROLEUM CORPORATION
NOTES TO CONSOLIDATED FINANCIAL STATEMENTS
YEARS ENDED DECEMBER 31, 2014, 2013, AND 2012
11. Derivative Instruments (Continued)
Marketing and Trading Derivative Activities The Company had financial derivative transactions with notional volumes of natural gas totaling 6 billion cubic feet (Bcf) at December 31, 2014, and 16 Bcf at December 31, 2013, that were entered into to mitigate commodity-price risk related to fixed-price purchase and sales contracts and storage activity.
Interest-Rate Derivatives Anadarko has outstanding interest-rate swap contracts to manage interest-rate risk associated with anticipated debt issuances. The Company has locked in a fixed interest rate in exchange for a floating interest rate indexed to the three-month LIBOR. These swap instruments include a provision that requires both the termination of the swaps and cash settlement in full at the start of the reference period.
To align the interest-rate swap portfolio with anticipated future debt financing, in 2014 the Company extended the reference-period start dates from June 2014 to September 2016 and adjusted the related fixed interest rates for interest-rate swaps with an aggregate notional principal amount of $1.1 billion, and in 2012 the Company extended the reference-period start dates from October 2012 to September 2016 and adjusted the related fixed interest rates for interest-rate swap agreements with an aggregate notional principal amount of $800 million. In addition, in anticipation of the July 2014 issuance of an aggregate $1.25 billion of Senior Notes, interest-rate swap agreements with an aggregate notional principal amount of $750 million were settled in 2014, resulting in a cash payment of $222 million. Interest-rate swap agreements with an aggregate notional principal amount of $200 million were also settled in October 2012, resulting in a cash payment of $64 million.
Derivative settlements are classified as cash flows from operating activities unless the derivatives contain an other-than-insignificant financing element, in which case the settlements are classified as cash flows from financing activities. As a result of prior extensions of reference-period start dates without settlement of the related interest-rate derivative obligations, the interest-rate derivatives in the Company’s portfolio contain an other-than-insignificant financing element and, therefore settlements related to these extended interest-rate derivatives are classified as cash flows from financing activities.
The Company had the following outstanding interest-rate swaps at December 31, 2014:
|
| | | | | | | | | |
| millions except percentages | | Reference Period | | Weighted-Average |
| Notional Principal Amount | | Start | | End | | Interest Rate |
| $ | 50 |
| | | September 2016 | | September 2026 | | 5.91% |
| $ | 1,850 |
| | | September 2016 | | September 2046 | | 6.05% |
ANADARKO PETROLEUM CORPORATION
NOTES TO CONSOLIDATED FINANCIAL STATEMENTS
YEARS ENDED DECEMBER 31, 2014, 2013, AND 2012
11. Derivative Instruments (Continued)
Effect of Derivative Instruments—Balance Sheet The following summarizes the fair value of the Company’s derivative instruments at December 31:
|
| | | | | | | | | | | | | | | | |
| millions | | Gross Derivative Assets | | Gross Derivative Liabilities |
| Balance Sheet Classification | | 2014 | | 2013 | | 2014 | | 2013 |
| Commodity derivatives | | | | | | | | |
| Other current assets | | $ | 421 |
| | $ | 181 |
| | $ | (118 | ) | | $ | (102 | ) |
| Other assets | | 1 |
| | 89 |
| | — |
| | (66 | ) |
| Accrued expenses | | 71 |
| | 106 |
| | (114 | ) | | (149 | ) |
| Other liabilities | | — |
| | 4 |
| | (6 | ) | | (15 | ) |
| | | 493 |
| | 380 |
| | (238 | ) | | (332 | ) |
| Interest-rate and other derivatives | | | | | | | | |
| Accrued expenses | | — |
| | — |
| | — |
| | (480 | ) |
| Other liabilities | | — |
| | — |
| | (1,217 | ) | | (174 | ) |
| | | — |
| | — |
| | (1,217 | ) | | (654 | ) |
| Total derivatives | | $ | 493 |
| | $ | 380 |
| | $ | (1,455 | ) | | $ | (986 | ) |
Effect of Derivative Instruments—Statement of Income The following summarizes gains and losses related to derivative instruments:
|
| | | | | | | | | | | | |
| millions | | | | | | |
| Classification of (Gain) Loss Recognized | | 2014 | | 2013 | | 2012 |
| Commodity derivatives | | | | | | |
Gathering, processing, and marketing sales (1) | | $ | 10 |
| | $ | 6 |
| | $ | 18 |
|
| (Gains) losses on derivatives, net | | (589 | ) | | 141 |
| | (387 | ) |
| Interest-rate and other derivatives | | | | | | |
| (Gains) losses on derivatives, net | | 786 |
| | (539 | ) | | 61 |
|
| Total (gains) losses on derivatives, net | | $ | 207 |
| | $ | (392 | ) | | $ | (308 | ) |
| |
(1) | Represents the effect of Marketing and Trading Derivative Activities. |
ANADARKO PETROLEUM CORPORATION
NOTES TO CONSOLIDATED FINANCIAL STATEMENTS
YEARS ENDED DECEMBER 31, 2014, 2013, AND 2012
11. Derivative Instruments (Continued)
Credit-Risk Considerations The financial integrity of exchange-traded contracts, which are subject to nominal credit risk, is assured by NYMEX or IntercontinentalExchange, Inc. through systems of financial safeguards and transaction guarantees. Over-the-counter traded swaps, options, and futures contracts expose the Company to counterparty credit risk. The Company monitors the creditworthiness of its counterparties, establishes credit limits according to the Company’s credit policies and guidelines, and assesses the impact on fair value of its counterparties’ creditworthiness. The Company has the ability to require cash collateral or letters of credit to mitigate its credit-risk exposure. The Company has netting agreements with financial institutions that permit net settlement of gross commodity derivative assets against gross commodity derivative liabilities, and routinely exercises its contractual right to offset gains and losses when settling with derivative counterparties.
In addition, the Company has setoff agreements with certain financial institutions that may be exercised in the event of default and provide for contract termination and net settlement across derivative types. At December 31, 2014, $289 million of the Company’s $1.455 billion gross derivative liability balance, and at December 31, 2013, $76 million of the Company’s $986 million gross derivative liability balance would have been eligible for setoff against the Company’s gross derivative asset balance in the event of default. Other than in the event of default, the Company does not net settle across derivative types.
The Company’s derivative instruments are subject to individually negotiated credit provisions that may require collateral of cash or letters of credit depending on the derivative’s valuation versus negotiated credit thresholds. These credit thresholds may also require full or partial collateralization or immediate settlement of the Company’s obligations if certain credit-risk-related provisions are triggered, such as if the Company’s credit rating from major credit rating agencies declined to below investment grade. However, most of the Company’s derivative counterparties maintained secured positions at December 31, 2014, with respect to the Company’s derivative liabilities under the Company’s $5.0 billion senior secured revolving credit facility ($5.0 billion Facility). In January 2015, the Company’s $5.0 billion Facility was replaced by new unsecured facilities under which the Company’s derivative counterparties no longer maintain security interests in any of the Company’s assets. As a result, the Company may be required from time to time to post collateral of cash or letters of credit based on the negotiated terms of the individual derivative agreements. For information on the Company’s revolving credit facilities, see Note 12—Debt and Interest Expense—Anadarko Revolving Credit Facilities and Commercial Paper Program.
The aggregate fair value of unsecured derivative instruments with credit-risk-related contingent features for which a net liability position existed was $97 million (net of collateral) at December 31, 2014, and $42 million at December 31, 2013. The current portion of these amounts was included in accrued expenses and the long-term portion of these amounts was included in other long-term liabilities—other on the Company’s Consolidated Balance Sheets.
ANADARKO PETROLEUM CORPORATION
NOTES TO CONSOLIDATED FINANCIAL STATEMENTS
YEARS ENDED DECEMBER 31, 2014, 2013, AND 2012
11. Derivative Instruments (Continued)
Fair Value Valuations of physical-delivery purchase and sale agreements, over-the-counter financial swaps, and commodity option collars are based on similar transactions observable in active markets and industry-standard models that primarily rely on market-observable inputs. Inputs used to estimate fair value in industry-standard models are categorized as Level 2 inputs because substantially all assumptions and inputs are observable in active markets throughout the full term of the instruments. Inputs used to estimate the fair value of swaps and options include market-price curves; contract terms and prices; credit-risk adjustments; and, for Black-Scholes option valuations, discount factors and implied market volatility.
The following summarizes the fair value of the Company’s derivative assets and liabilities, by input level within the fair-value hierarchy:
|
| | | | | | | | | | | | | | | | | | | | | | | |
| millions | Level 1 | | Level 2 | | Level 3 | | Netting (1) | | Collateral | | Total |
| December 31, 2014 | | | | | | | | | | | |
| Assets | | | | | | | | | | | |
| Commodity derivatives | | | | | | | | | | | |
| Financial institutions | $ | — |
| | $ | 471 |
| | $ | — |
| | $ | (187 | ) | | $ | (13 | ) | | $ | 271 |
|
| Other counterparties | — |
| | 22 |
| | — |
| | (2 | ) | | — |
| | 20 |
|
| Total derivative assets | $ | — |
| | $ | 493 |
| | $ | — |
| | $ | (189 | ) | | $ | (13 | ) | | $ | 291 |
|
| Liabilities | | | | | | | | | | | |
| Commodity derivatives | | | | | | | | | | | |
| Financial institutions | $ | — |
| | $ | (234 | ) | | $ | — |
| | $ | 187 |
| | $ | 23 |
| | $ | (24 | ) |
| Other counterparties | — |
| | (4 | ) | | — |
| | 2 |
| | — |
| | (2 | ) |
| Interest-rate and other derivatives | — |
| | (1,217 | ) | | — |
| | — |
| | — |
| | (1,217 | ) |
| Total derivative liabilities | $ | — |
| | $ | (1,455 | ) | | $ | — |
| | $ | 189 |
| | $ | 23 |
| | $ | (1,243 | ) |
| | | | | | | | | | | | |
| | | | | | | | | | | | |
| December 31, 2013 | | | | | | | | | | | |
| Assets | | | | | | | | | | | |
| Commodity derivatives | | | | | | | | | | | |
| Financial institutions | $ | — |
| | $ | 211 |
| | $ | — |
| | $ | (153 | ) | | $ | — |
| | $ | 58 |
|
| Other counterparties | — |
| | 169 |
| | — |
| | (126 | ) | | — |
| | 43 |
|
| Total derivative assets | $ | — |
| | $ | 380 |
| | $ | — |
| | $ | (279 | ) | | $ | — |
| | $ | 101 |
|
| Liabilities | | | | | | | | | | | |
| Commodity derivatives | | | | | | | | | | | |
| Financial institutions | $ | — |
| | $ | (200 | ) | | $ | — |
| | $ | 153 |
| | $ | 7 |
| | $ | (40 | ) |
| Other counterparties | — |
| | (132 | ) | | — |
| | 126 |
| | — |
| | (6 | ) |
| Interest-rate and other derivatives | — |
| | (654 | ) | | — |
| | — |
| | — |
| | (654 | ) |
| Total derivative liabilities | $ | — |
| | $ | (986 | ) | | $ | — |
| | $ | 279 |
| | $ | 7 |
| | $ | (700 | ) |
| |
(1) | Represents the impact of netting commodity derivative assets and liabilities with counterparties where the Company has the contractual right and intends to net settle. |
ANADARKO PETROLEUM CORPORATION
NOTES TO CONSOLIDATED FINANCIAL STATEMENTS
YEARS ENDED DECEMBER 31, 2014, 2013, AND 2012
12. Debt and Interest Expense
Debt The Company’s outstanding debt is senior unsecured, except for borrowings, if any, under the $5.0 billion Facility. See Note 10—Equity-Method Investments for disclosure regarding Anadarko’s notes payable related to its ownership of certain noncontrolling mandatorily redeemable interests that are not included in the Company’s reported debt balance and do not affect consolidated interest expense. The following summarizes the Company’s outstanding debt:
|
| | | | | | | |
| | December 31, |
| millions | 2014 | | 2013 |
| 5.750% Senior Notes due 2014 | $ | — |
| | $ | 275 |
|
| 7.625% Senior Notes due 2014 | — |
| | 500 |
|
| 5.950% Senior Notes due 2016 | 1,750 |
| | 1,750 |
|
| 6.375% Senior Notes due 2017 | 2,000 |
| | 2,000 |
|
| 7.050% Debentures due 2018 | 114 |
| | 114 |
|
| WES 2.600% Senior Notes due 2018 | 350 |
| | 250 |
|
| 6.950% Senior Notes due 2019 | 300 |
| | 300 |
|
| 8.700% Senior Notes due 2019 | 600 |
| | 600 |
|
| WES 5.375% Senior Notes due 2021 | 500 |
| | 500 |
|
| WES 4.000% Senior Notes due 2022 | 670 |
| | 670 |
|
| 3.450% Senior Notes due 2024 | 625 |
| | — |
|
| 6.950% Senior Notes due 2024 | 650 |
| | 650 |
|
| 7.500% Debentures due 2026 | 112 |
| | 112 |
|
| 7.000% Debentures due 2027 | 54 |
| | 54 |
|
| 7.125% Debentures due 2027 | 150 |
| | 150 |
|
| 6.625% Debentures due 2028 | 17 |
| | 17 |
|
| 7.150% Debentures due 2028 | 235 |
| | 235 |
|
| 7.200% Debentures due 2029 | 135 |
| | 135 |
|
| 7.950% Debentures due 2029 | 117 |
| | 117 |
|
| 7.500% Senior Notes due 2031 | 900 |
| | 900 |
|
| 7.875% Senior Notes due 2031 | 500 |
| | 500 |
|
| Zero-Coupon Senior Notes due 2036 | 2,360 |
| | 2,360 |
|
| 6.450% Senior Notes due 2036 | 1,750 |
| | 1,750 |
|
| 7.950% Senior Notes due 2039 | 325 |
| | 325 |
|
| 6.200% Senior Notes due 2040 | 750 |
| | 750 |
|
| 4.500% Senior Notes due 2044 | 625 |
| | — |
|
| WES 5.450% Senior Notes due 2044 | 400 |
| | — |
|
| 7.730% Debentures due 2096 | 61 |
| | 61 |
|
| 7.500% Debentures due 2096 | 78 |
| | 78 |
|
| 7.250% Debentures due 2096 | 49 |
| | 49 |
|
| WES revolving credit facility | 510 |
| | — |
|
| Total debt at face value | $ | 16,687 |
| | $ | 15,202 |
|
Net unamortized discounts and premiums (1) | (1,616 | ) | | (1,645 | ) |
| Total borrowings | $ | 15,071 |
| | $ | 13,557 |
|
| Capital lease obligation | 21 |
| | 8 |
|
| Less current portion of long-term debt | — |
| | 500 |
|
| Total long-term debt | $ | 15,092 |
| | $ | 13,065 |
|
| |
(1) | Unamortized discounts and premiums are amortized over the term of the related debt. |
ANADARKO PETROLEUM CORPORATION
NOTES TO CONSOLIDATED FINANCIAL STATEMENTS
YEARS ENDED DECEMBER 31, 2014, 2013, AND 2012
12. Debt and Interest Expense (Continued)
In a 2006 private offering, Anadarko received $500 million of loan proceeds upon issuing the Zero-Coupon Senior Notes due 2036 (Zero Coupons). The Zero Coupons mature in 2036 and have an aggregate principal amount due at maturity of approximately $2.4 billion, reflecting a yield to maturity of 5.24%. The Zero Coupons can be put to the Company in October of each year, in whole or in part, for the then-accreted value of the outstanding Zero Coupons. The accreted value of the outstanding Zero Coupons was $765 million at December 31, 2014. Anadarko’s Zero Coupons are classified as long-term debt on the Company’s Consolidated Balance Sheets, as the Company has the ability and intent to refinance these obligations using long-term debt.
Fair Value The Company uses a market approach to determine the fair value of its fixed-rate debt using observable market data, which results in a Level 2 fair-value measurement. The carrying amount of floating-rate debt approximates fair value as the interest rates are variable and reflective of market rates. The estimated fair value of the Company’s total borrowings was $17.4 billion at December 31, 2014, and $15.3 billion at December 31, 2013.
Debt Activity The following summarizes the Company’s debt activity during 2014 and 2013:
|
| | | | | |
| millions | Carrying Value | | Description |
| Balance at December 31, 2012 | $ | 13,269 |
| | |
| Issuances | 250 |
| | WES 2.600% Senior Notes due 2018 |
| Borrowings | 710 |
| | WES revolving credit facility |
| Repayments | (710 | ) | | WES revolving credit facility |
| Other, net | 38 |
| | Amortization of debt discounts and premiums |
| Balance at December 31, 2013 | $ | 13,557 |
| | |
| Issuances | 101 |
| | WES 2.600% Senior Notes due 2018 |
| | 394 |
| | WES 5.450% Senior Notes due 2044 |
| | 624 |
| | 3.450% Senior Notes due 2024 |
| | 621 |
| | 4.500% Senior Notes due 2044 |
| Borrowings | 1,160 |
| | WES revolving credit facility |
| Repayments | (500 | ) | | 7.625% Senior Notes due 2014 |
| | (275 | ) | | 5.750% Senior Notes due 2014 |
| | (650 | ) | | WES revolving credit facility |
| Other, net | 39 |
| | Amortization of debt discounts and premiums |
| Balance at December 31, 2014 | $ | 15,071 |
| | |
ANADARKO PETROLEUM CORPORATION
NOTES TO CONSOLIDATED FINANCIAL STATEMENTS
YEARS ENDED DECEMBER 31, 2014, 2013, AND 2012
12. Debt and Interest Expense (Continued)
Anadarko Revolving Credit Facilities and Commercial Paper Program During 2014, the Company maintained the $5.0 billion Facility maturing in September 2015. Obligations incurred under the $5.0 billion Facility, as well as obligations Anadarko had to lenders or their affiliates pursuant to certain derivative instruments that were supported by the $5.0 billion Facility as discussed in Note 11—Derivative Instruments, were guaranteed by certain of the Company’s wholly owned domestic subsidiaries, and were secured by a perfected first-priority security interest in certain exploration and production assets located in the United States and 65% of the capital stock of certain wholly owned foreign subsidiaries. During 2014, the Company had no outstanding borrowings under the $5.0 billion Facility.
In June 2014, Anadarko entered into a $3.0 billion five-year senior unsecured revolving credit facility (Five-Year Facility), which is expandable to $4.0 billion, and a $2.0 billion 364-day senior unsecured revolving credit facility (364-Day Facility). The new facilities (collectively, the New Credit Facilities) replaced the $5.0 billion Facility upon satisfaction of certain conditions, including the January 2015 settlement payment related to the Tronox Adversary Proceeding. For additional information, see Note 17—Contingencies—Tronox Litigation.
In January 2015, the Company borrowed $1.5 billion under the 364-Day Facility. Borrowings under the New Credit Facilities generally bear interest under one of two rate options, at Anadarko’s election, using either LIBOR (or Euro Interbank Offered Rate in the case of borrowings under the Five-Year Facility denominated in Euro) or an alternate base rate, in each case plus an applicable margin ranging from 0.00% to 1.65% for the Five-Year Facility and 0.00% to 1.675% for the 364-Day Facility. The applicable margin will vary depending on Anadarko’s credit ratings.
The New Credit Facilities contain certain customary affirmative and negative covenants, including a financial covenant requiring maintenance of a consolidated indebtedness to total capitalization ratio of no greater than 65%, and limitations on certain secured indebtedness, sale-and-leaseback transactions, and mergers and other fundamental changes.
In January 2015, the Company initiated a commercial paper program, which allows a maximum of $3.0 billion of unsecured commercial paper notes. The maturities of the commercial paper notes vary, but may not exceed 397 days. The commercial paper notes are sold under customary terms in the commercial paper market and are issued either at a discounted price to their principal face value or will bear interest at varying interest rates on a fixed or floating basis. Such discounted price or interest amounts are dependent on market conditions and the ratings assigned to the commercial paper program by credit rating agencies at the time of issuance of the commercial paper notes.
WES Borrowings In February 2014, WES amended and restated its then-existing $800 million senior unsecured revolving credit facility by entering into a five-year, $1.2 billion senior unsecured revolving credit facility maturing in February 2019 (RCF), which is expandable to a maximum of $1.5 billion. Borrowings under the RCF bear interest at LIBOR plus an applicable margin ranging from 0.975% to 1.45% depending on WES’s credit rating, or the greatest of (i) rates at a margin above the one-month LIBOR, (ii) the federal funds rate, or (iii) prime rates offered by certain designated banks. At December 31, 2014, WES was in compliance with all covenants contained in its RCF, had outstanding borrowings under its RCF of $510 million at an interest rate of 1.47%, and had available borrowing capacity of approximately $677 million ($1.2 billion capacity, less $510 million of outstanding borrowings and $13 million of outstanding letters of credit).
ANADARKO PETROLEUM CORPORATION
NOTES TO CONSOLIDATED FINANCIAL STATEMENTS
YEARS ENDED DECEMBER 31, 2014, 2013, AND 2012
12. Debt and Interest Expense (Continued)
Scheduled Maturities Total principal amount of debt maturities for the five years ending December 31, 2019, excluding the potential repayment of the outstanding Zero Coupons that may be put by the holder to the Company annually, were as follows:
|
| | | |
| millions | Principal Amount of Debt Maturities |
| 2015 | $ | — |
|
| 2016 | 1,750 |
|
| 2017 | 2,000 |
|
| 2018 | 464 |
|
| 2019 | 1,410 |
|
Interest Expense The following summarizes interest expense for the years ended December 31:
|
| | | | | | | | | | | |
| millions | 2014 | | 2013 | | 2012 |
| Debt and other | $ | 973 |
| | $ | 949 |
| | $ | 963 |
|
| Capitalized interest | (201 | ) | | (263 | ) | | (221 | ) |
| Total interest expense | $ | 772 |
| | $ | 686 |
| | $ | 742 |
|
ANADARKO PETROLEUM CORPORATION
NOTES TO CONSOLIDATED FINANCIAL STATEMENTS
YEARS ENDED DECEMBER 31, 2014, 2013, AND 2012
13. Stockholders’ Equity
Common Stock The following summarizes the changes in the Company’s outstanding shares of common stock:
|
| | | | | | | | |
| millions | 2014 | | 2013 | | 2012 |
| Shares of common stock issued | | | | | |
| Shares at January 1 | 523 |
| | 519 |
| | 516 |
|
| Exercise of stock options | 2 |
| | 2 |
| | 1 |
|
| Issuance of restricted stock | 1 |
| | 2 |
| | 2 |
|
| Shares at December 31 | 526 |
| | 523 |
| | 519 |
|
| Shares of common stock held in treasury | | | | | |
| Shares at January 1 | 19 |
| | 18 |
| | 18 |
|
| Shares received for restricted stock vested and options exercised | — |
| | 1 |
| | — |
|
| Shares at December 31 | 19 |
| | 19 |
| | 18 |
|
| Shares of common stock outstanding at December 31 | 507 |
| | 504 |
| | 501 |
|
The following provides a reconciliation between basic and diluted EPS attributable to common stockholders for the years ended December 31:
|
| | | | | | | | | | | |
| millions except per-share amounts | 2014 | | 2013 | | 2012 |
| Net income (loss) | | | | | |
| Net income (loss) attributable to common stockholders | $ | (1,750 | ) | | $ | 801 |
| | $ | 2,391 |
|
| Less distributions on participating securities | 4 |
| | 2 |
| | 1 |
|
| Less undistributed income allocated to participating securities | — |
| | 4 |
| | 14 |
|
| Basic | $ | (1,754 | ) | | $ | 795 |
| | $ | 2,376 |
|
| Diluted | $ | (1,754 | ) | | $ | 795 |
| | $ | 2,376 |
|
| Shares | | | | | |
| Average number of common shares outstanding—basic | 506 |
| | 502 |
| | 500 |
|
| Dilutive effect of stock options | — |
| | 3 |
| | 2 |
|
| Average number of common shares outstanding—diluted | 506 |
| | 505 |
| | 502 |
|
Excluded (1) | 11 |
| | 4 |
| | 6 |
|
| Net income (loss) per common share | | | | | |
| Basic | $ | (3.47 | ) | | $ | 1.58 |
| | $ | 4.76 |
|
| Diluted | $ | (3.47 | ) | | $ | 1.58 |
| | $ | 4.74 |
|
| | | | | | |
| Dividends per common share | $ | 0.99 |
| | $ | 0.54 |
| | $ | 0.36 |
|
| |
(1) | Inclusion of certain shares would have had an anti-dilutive effect. |
ANADARKO PETROLEUM CORPORATION
NOTES TO CONSOLIDATED FINANCIAL STATEMENTS
YEARS ENDED DECEMBER 31, 2014, 2013, AND 2012
14. Accumulated Other Comprehensive Income (Loss)
The following summarizes the after-tax changes in the balances of accumulated other comprehensive income (loss):
|
| | | | | | | | | | | |
| millions | Interest-rate Derivatives Previously Subject to Hedge Accounting | | Pension and Other Postretirement Plans | | Total |
| Balance at December 31, 2013 | $ | (54 | ) | | $ | (231 | ) | | $ | (285 | ) |
Other comprehensive income (loss), before reclassifications | — |
| | (256 | ) | | (256 | ) |
| Reclassifications to Consolidated Statement of Income | 6 |
| | 18 |
| | 24 |
|
| Net other comprehensive income (loss) | 6 |
| | (238 | ) | | (232 | ) |
| Balance at December 31, 2014 | $ | (48 | ) | | $ | (469 | ) | | $ | (517 | ) |
15. Share-Based Compensation
At December 31, 2014, 21 million shares of the 31 million shares of Anadarko common stock originally authorized for awards under active share-based compensation plans remained available for future issuance. The Company generally issues new shares to satisfy awards under employee share-based payment plans. The number of shares available is reduced by awards granted. The following summarizes share-based compensation expense for the years ended December 31:
|
| | | | | | | | | | | |
| millions | 2014 | | 2013 | | 2012 |
| Restricted stock | $ | 144 |
| | $ | 122 |
| | $ | 103 |
|
| Stock options | 21 |
| | 27 |
| | 43 |
|
| Other equity-classified awards | 1 |
| | 1 |
| | 1 |
|
| Value creation plan | 136 |
| | — |
| | (2 | ) |
| Performance-based unit awards | 23 |
| | 4 |
| | 8 |
|
| Other performance-based awards | — |
| | — |
| | 165 |
|
| Other liability-classified awards | — |
| | 1 |
| | 2 |
|
| Pretax compensation expense | $ | 325 |
| | $ | 155 |
| | $ | 320 |
|
| Income tax benefit | $ | 120 |
| | $ | 57 |
| | $ | 117 |
|
Cash flows from financing activities included excess tax benefits related to share-based compensation of $22 million in 2014, $11 million in 2013, and $51 million in 2012. Cash received from stock option exercises was $99 million in 2014, $135 million in 2013, and $52 million in 2012.
ANADARKO PETROLEUM CORPORATION
NOTES TO CONSOLIDATED FINANCIAL STATEMENTS
YEARS ENDED DECEMBER 31, 2014, 2013, AND 2012
15. Share-Based Compensation (Continued)
Equity-Classified Awards
Restricted Stock Certain employees may be granted restricted stock in the form of restricted stock awards or restricted stock units. Restricted stock is subject to forfeiture restrictions and cannot be sold, transferred, or disposed of during the restriction period. The holders of restricted stock awards have the same rights as a stockholder of the Company with respect to such shares, including the right to vote and receive dividends or other distributions paid with respect to the shares. A restricted stock unit is equivalent to a restricted stock award except that unit holders do not have the right to vote. Restricted stock vests over service periods ranging from the date of grant up to three years and is not considered issued and outstanding until vested.
Non-employee directors are granted deferred shares, which are also considered restricted stock, that are held in a grantor trust by the Company until payable. Non-employee directors may receive these shares in a lump-sum payment or in annual installments.
The following summarizes the Company’s restricted stock activity:
|
| | | | | | |
| | Shares (millions) | | Weighted- Average Grant-Date Fair Value (per share) |
| Non-vested at January 1, 2014 | 3.22 |
| | $ | 82.53 |
|
| Granted | 2.05 |
| | $ | 87.42 |
|
| Vested | (1.52 | ) | | $ | 82.35 |
|
| Forfeited | (0.15 | ) | | $ | 84.49 |
|
| Non-vested at December 31, 2014 | 3.60 |
| | $ | 85.31 |
|
The weighted-average grant-date fair value per share of restricted stock granted was $84.17 during 2013 and $79.97 during 2012. The total fair value of restricted shares vested was $132 million during 2014, $110 million during 2013, and $105 million during 2012, based on the market price at the vesting date. At December 31, 2014, total unrecognized compensation cost related to restricted stock of $199 million is expected to be recognized over a weighted-average remaining service period of 1.9 years.
ANADARKO PETROLEUM CORPORATION
NOTES TO CONSOLIDATED FINANCIAL STATEMENTS
YEARS ENDED DECEMBER 31, 2014, 2013, AND 2012
15. Share-Based Compensation (Continued)
Stock Options Certain employees may be granted nonqualified options to purchase shares of Anadarko common stock with an exercise price equal to, or greater than, the fair market value of Anadarko common stock on the date of grant. These stock options generally vest over three years from the date of grant and terminate at the earlier of the date of exercise or seven years from the date of grant.
The fair value of stock option awards is determined using the Black-Scholes option-pricing model with the following assumptions:
Expected life—Based on historical exercise behavior.
Volatility—Based on an average of historical volatility over the expected life of an option and the 12-month average implied volatility.
Risk-free interest rates—Based on the U.S. Treasury rate over the expected life of an option.
Dividend yield—Based on a 12-month average dividend yield, taking into account the Company’s expected dividend policy over the expected life of an option.
Expected forfeiture—Based on historical forfeiture experience.
The Company used the following weighted-average assumptions to estimate the fair value of stock options granted:
|
| | | | | | | | | | | | | | |
| | 2014 | | 2013 | | 2012 |
| Weighted-average grant-date fair value | $ | 23.55 | | | $ | 26.27 | | | $ | 25.84 | |
| Assumptions | | | | | | | | |
| Expected option life—years | 4.9 | | | 4.8 | | | 4.9 | |
| Volatility | 29.9 | % | | 33.9 | % | | 44.2 | % |
| Risk-free interest rate | 1.6 | % | | 1.3 | % | | 0.7 | % |
| Dividend yield | 1.1 | % | | 0.8 | % | | 0.5 | % |
The following summarizes the Company’s stock option activity:
|
| | | | | | | | | | | | |
| | Shares (millions) | | Weighted- Average Exercise Price (per share) | | Weighted- Average Remaining Contractual Term (years) | | Aggregate Intrinsic Value (millions) |
| Outstanding at January 1, 2014 | 7.72 |
| | $ | 63.30 |
| | | | |
| Granted | 0.95 |
| | $ | 93.34 |
| | | | |
Exercised (1) | (1.85 | ) | | $ | 54.03 |
| | | | |
| Forfeited or expired | (0.03 | ) | | $ | 76.00 |
| | | | |
| Outstanding at December 31, 2014 | 6.79 |
| | $ | 69.96 |
| | 3.56 | | $ | 104.3 |
|
| Vested or expected to vest at December 31, 2014 | 6.73 |
| | $ | 69.79 |
| | 3.54 | | $ | 104.2 |
|
| Exercisable at December 31, 2014 | 4.99 |
| | $ | 62.91 |
| | 2.60 | | $ | 101.1 |
|
| |
(1) | The total intrinsic value of stock options exercised was $88 million during 2014, $80 million during 2013, and $49 million during 2012, based on the difference between the market price at the exercise date and the exercise price. |
At December 31, 2014, total unrecognized compensation cost related to stock options of $40 million is expected to be recognized over a weighted-average remaining service period of 2.2 years.
ANADARKO PETROLEUM CORPORATION
NOTES TO CONSOLIDATED FINANCIAL STATEMENTS
YEARS ENDED DECEMBER 31, 2014, 2013, AND 2012
15. Share-Based Compensation (Continued)
Liability-Classified Awards
Value Creation Plan As a part of its employee compensation program, the Company offers an incentive compensation program that provides non-officer employees the opportunity to earn cash bonus awards based on the Company’s TSR for the year, compared to the TSR of a predetermined group of peer companies. The Company paid zero during 2014 and 2013 related to the plan and $24 million during 2012. At December 31, 2014, the Company had $137 million outstanding liability attributable to the 2014 performance period.
Performance-Based Unit Awards Certain officers of the Company were provided Performance Unit Award Agreements with two- and three-year performance periods. The vesting of these units is based on comparing the Company’s TSR to the TSR of a predetermined group of peer companies over the specified performance period. Each performance unit represents the value of one share of the Company’s common stock. At the end of each performance period, the value of the vested performance units, if any, is paid in cash. The Company paid $12 million related to vested performance units in 2014, $15 million in 2013, and $37 million in 2012. At December 31, 2014, the Company’s liability under Performance Unit Award Agreements was $26 million, with total unrecognized compensation cost related to these awards of $43 million expected to be recognized over a weighted-average remaining performance period of 2.2 years.
Other Performance-Based AwardsPrior to 2011, certain officers of the general partner of WES were awarded general partner Unit Appreciation Rights (UARs) pursuant to the Western Gas Holdings, LLC Equity Incentive Plan. The fair value of the UARs was determined based on the fair value of WES’s general partner, as determined by the WGP IPO price. The Company paid $203 million related to the UARs upon the WGP IPO in 2012 in settlement of obligations related to all awards then outstanding.
ANADARKO PETROLEUM CORPORATION
NOTES TO CONSOLIDATED FINANCIAL STATEMENTS
YEARS ENDED DECEMBER 31, 2014, 2013, AND 2012
16. Commitments
Operating Leases At December 31, 2014, the Company had $2.7 billion in long-term drilling rig commitments that satisfy operating lease criteria. The Company also had $324 million of various commitments under non-cancelable operating lease agreements for production platforms and equipment, buildings, facilities, compressors, and aircraft. These operating leases expire at various dates through 2026. Certain of these operating leases contain residual value guarantees at the end of the lease term, totaling $53 million at December 31, 2014. No liability has been accrued for residual value guarantees. In addition, these operating leases include options to purchase the leased property during or at the end of the lease term for the fair market value or other specified amount at that time. The following summarizes future minimum lease payments under operating leases at December 31, 2014:
|
| | | |
| millions | |
| 2015 | $ | 1,022 |
|
| 2016 | 833 |
|
| 2017 | 592 |
|
| 2018 | 324 |
|
| 2019 | 203 |
|
| Later years | 87 |
|
| Total future minimum lease payments | $ | 3,061 |
|
Anadarko has entered into various agreements to secure drilling rigs necessary to support the execution of its drilling plans over the next several years. The table of future minimum lease payments above includes $2.5 billion related to seven offshore drilling vessels and $208 million related to certain contracts for U.S. onshore drilling rigs. Lease payments associated with the drilling of exploratory wells and development wells, net of amounts billed to partners, will initially be capitalized as a component of oil and gas properties, and either depreciated or impaired in future periods or written off as exploration expense.
Total rent expense, net of sublease income and amounts capitalized, amounted to $85 million in 2014, $119 million in 2013, and $136 million in 2012. Total rent expense includes contingent rent expense related to transportation and processing fees of $22 million in 2014, $24 million in 2013, and $28 million in 2012.
Other Commitments In the normal course of business, the Company enters into other contractual agreements for processing, treating, transportation, and storage of natural gas, oil, and NGLs, as well as for other oil and gas activities. These agreements expire at various dates through 2036. At December 31, 2014, aggregate future payments under these contracts totaled $10.4 billion, of which $2.2 billion is expected to be paid in 2015, $1.6 billion in 2016, $1.3 billion in 2017, $1.2 billion in 2018, $1.0 billion in 2019, and $3.1 billion thereafter.
ANADARKO PETROLEUM CORPORATION
NOTES TO CONSOLIDATED FINANCIAL STATEMENTS
YEARS ENDED DECEMBER 31, 2014, 2013, AND 2012
17. Contingencies
Litigation The Company is a defendant in a number of lawsuits, is involved in governmental proceedings, and is subject to regulatory controls arising in the ordinary course of business, including, but not limited to, personal injury claims; property damage claims; title disputes; tax disputes; royalty claims; contract claims; contamination claims relating to oil and gas production, transportation, and processing; and environmental claims, including claims involving assets owned by acquired companies and claims involving assets previously sold to third parties and no longer a part of the Company’s current operations. The Company’s Consolidated Balance Sheets include liabilities of $5.3 billion at December 31, 2014, and $854 million at December 31, 2013, for litigation-related contingencies. Anadarko is also subject to various environmental-remediation and reclamation obligations arising from federal, state, and local laws and regulations. While the ultimate outcome and impact on the Company cannot be predicted with certainty, after consideration of recorded expense and liability accruals, management believes that the resolution of pending proceedings will not have a material adverse effect on the Company’s consolidated financial condition, results of operations, or cash flows.
Tronox Litigation On November 28, 2005, Tronox Incorporated (Tronox), at the time a subsidiary of Kerr-McGee Corporation, completed an IPO and was subsequently spun-off from Kerr-McGee Corporation. In August 2006, Anadarko acquired all of the stock of Kerr-McGee Corporation. In January 2009, Tronox and certain of Tronox’s subsidiaries filed voluntary petitions for relief under Chapter 11 of the U.S. Bankruptcy Code in the U.S. Bankruptcy Court for the Southern District of New York (Bankruptcy Court), which is the court that presided over the Adversary Proceeding (defined below). In May 2009, Tronox and certain of its affiliates filed a lawsuit against Anadarko and Kerr-McGee Corporation and certain of its subsidiaries (collectively, Kerr-McGee) asserting several claims, including claims for actual and constructive fraudulent conveyance (Adversary Proceeding). Tronox alleged, among other things, that it was insolvent or undercapitalized at the date of its IPO and sought, among other things, to recover damages in excess of $18.85 billion from Kerr-McGee and Anadarko, as well as interest and attorneys’ fees and costs. In accordance with Tronox’s Bankruptcy Court-approved Plan of Reorganization (Plan), the Adversary Proceeding was pursued by a litigation trust (Litigation Trust). Pursuant to the Plan, the Litigation Trust was “deemed substituted” for the Tronox plaintiffs in the Adversary Proceeding. For purposes of this Form 10-K, references to “Tronox” after February 2011 refer to the Litigation Trust.
The U.S. government intervened in the Adversary Proceeding, and in May 2009 asserted separate claims against Anadarko and Kerr-McGee under the Federal Debt Collection Procedures Act (FDCPA Complaint). The Litigation Trust and the U.S. government agreed that the recovery of damages under the Adversary Proceeding, if any, would cover both the Adversary Proceeding and the FDCPA Complaint.
Liability Accrual On April 3, 2014, Anadarko and Kerr-McGee entered into a settlement agreement with the Litigation Trust and the U.S. government (in its capacity as plaintiff-intervenor and acting for and on behalf of certain U.S. government agencies) to resolve all claims asserted in the Adversary Proceeding and FDCPA Complaint for $5.15 billion, which represents principal of approximately $3.98 billion plus 6% interest from the filing of the Adversary Proceeding on May 12, 2009, through April 3, 2014. In addition, the Company agreed to pay interest on the above amount from April 3, 2014, through the payment of the settlement, with an annual interest rate of 1.5% for the first 180 days and 1.5% plus the one-month LIBOR thereafter. Under the terms of the settlement agreement, the Litigation Trust, Anadarko, and Kerr-McGee agreed to mutually release all claims that were or could have been asserted in the Adversary Proceeding. The U.S. government (representing federal agencies that filed claims in the Tronox bankruptcy), Anadarko, and Kerr-McGee also provided covenants not to sue each other with respect to certain claims and causes of action. The U.S. government also provided contribution protection from third-party claims seeking reimbursement from Anadarko and certain of its affiliates for the sites identified in the settlement agreement. In January 2015, the Company paid $5.2 billion after the settlement agreement became effective.
ANADARKO PETROLEUM CORPORATION
NOTES TO CONSOLIDATED FINANCIAL STATEMENTS
YEARS ENDED DECEMBER 31, 2014, 2013, AND 2012
17. Contingencies (Continued)
Anadarko recognized Tronox-related contingent losses of $850 million in the fourth quarter of 2013 and $4.3 billion in the first quarter of 2014. In addition, Anadarko recognized settlement-related interest expense of $60 million, included in Tronox-related contingent loss in the Company’s Consolidated Statement of Income, during the year ended December 31, 2014, for an aggregate $5.2 billion Tronox-related contingent liability on the Company’s Consolidated Balance Sheet at December 31, 2014. For information on the tax effects of the Tronox settlement agreement, see Note 18—Income Taxes.
Deepwater Horizon EventsBackground, Settlement, and BP Indemnification In April 2010, the Macondo well in the Gulf of Mexico in which Anadarko held a 25% non-operating leasehold interest, discovered hydrocarbon accumulations. During suspension operations, the well blew out and an explosion occurred on theDeepwater Horizon drilling rig, and the drilling rig sank, resulting in the release of hydrocarbons into the Gulf of Mexico. Eleven people lost their lives in the explosion and subsequent fire, and others sustained personal injuries.an oil spill. The Macondo well was plugged on September 19, 2010.operated by BP Exploration &and Production Inc. (BP), the operator of Mississippi Canyon Block 252 in which the Macondo well is located (Lease), is funding claims and coordinating cleanup efforts.Anadarko held a
25% nonoperated interest. In October 2011, the Company and BP entered into a settlement agreement, mutual releases, and agreement to indemnify relating to the Deepwater Horizon events (Settlement Agreement). Pursuant to the Settlement Agreement,, under which the Company paid $4.0$4.0 billion in cash and transferred its interest in the Macondo well and the LeaseMississippi Canyon Block 252 (Lease) to BP, and BP accepted this consideration in full satisfaction of its claims against Anadarko for $6.1 billion of invoices issued through the settlement date as well for potential reimbursements of subsequent costs incurred by BP relatedBP. Pursuant to the Deepwater Horizon events, including costs underSettlement Agreement, the Operating Agreement (OA). In addition, BPCompany is fully indemnified Anadarkoby BP against all claims, causes of action, losses, costs, expenses, liabilities, damages, or judgments of any kind arising out of the Deepwater Horizon events, related damage claims arising under the Oil Pollution Act of 1990 (OPA), claims for natural resource damages (NRD) and associated damage-assessmentassessment costs, and any claims arising under the OA.Operating Agreement with BP (OA). This indemnification is guaranteed by BP Corporation North America Inc. (BPCNA) and, in the event that the net worth of BPCNA declines below an agreed-upon amount, BP p.l.c. has agreed to become the sole guarantor. Under the Settlement Agreement, BP does not indemnify the Company against finespenalties and penalties,fines, punitive damages, shareholder derivative or securitysecurities laws claims, or certain other claims. The Company believes that costs associated with non-indemnified items, individually or in the aggregate, will not materially impact the Company’s consolidated financial position, results of operations, or cash flows.
Liability Accrual The $4.0 billion settlement amount was expensed in the third quarter of 2011, and payment was remitted to BP in November 2011 in accordance with the Settlement Agreement. Below is a discussion of the Company’s current analysis, under applicable accounting guidance, of its potential liability for (i) amounts invoiced by BP under the OA (OA Liabilities), (ii) OPA-related environmental costs, and (iii) other contingent liabilities. Accounting rules require loss recognition whereApplicable accounting guidance requires the Company to accrue a potential lossliability if both (a) it is considered probable that a liability has been incurred and (b) the amount of that liability can be reasonably estimated. The Company is fully indemnified by BP against OPA damage claims, NRD claims and assessment costs, and other potential liabilities. The Company may be required to recognize a liability for these amounts in advance of or in connection with recognizing a receivable from BP for the related indemnity payment. In all circumstances, however, the Company expects that any additional indemnified liability that may be recognized by the Company will be subsequently recovered from BP itself or through the guarantees of BPCNA or BP p.l.c. The Company has not recorded a liability for any costs that are subject to indemnification by BP.
OA LiabilitiesPursuant to the Settlement Agreement, all amounts deemed by BP to have been due under the OA, as well as all future amounts that otherwise would be invoiced to Anadarko under the OA, have been satisfied.
OPA-Related Environmental CostsBP, Anadarko, and other parties, including parties that do not own an interest in the Lease, such as the drilling contractor, have received correspondence from the U.S. Coast Guard (USCG) referencing their identification as a “responsible party or guarantor” (RP) under OPA. Under OPA, RPs, including Anadarko, may be jointly and severally liable for costs of well control, spill response, and containment and removal of hydrocarbons, as well as other costs and damage claims related to the spill and spill cleanup. The USCG’s identification of Anadarko as an RP arises as a result of Anadarko’s status as a co-lessee in the Lease.ANADARKO PETROLEUM CORPORATION
NOTES TO CONSOLIDATED FINANCIAL STATEMENTS
YEARS ENDED DECEMBER 31, 2011, 2010, AND 2009
2. Deepwater Horizon Events (Continued)
Applicable accounting guidance requires the Company to accrue an environmental liability if it is both probable that a liability is incurred and the amount of the liability can be reasonably estimated.
Under accounting guidance applicable to environmental liabilities, a liability is presumed probable if the entity is both identified as an RP and associated with the environmental event. The Company’s co-lessee status in the Lease at the time of the event and the subsequent identification and treatment of the Company as an RP satisfies these standards and therefore establishes the presumption that the Company’s potential environmental liabilities related to the Deepwater Horizon events are probable. Given that such liabilities are probable, the Company must separately assess and estimate the Company’s allocable share
ANADARKO PETROLEUM CORPORATION
NOTES TO CONSOLIDATED FINANCIAL STATEMENTS
YEARS ENDED DECEMBER 31, 2014, 2013, AND 2012
17. Contingencies (Continued)
As BP funds OPA-related environmental costs, any potential joint and several liability for these costs is satisfied for all RPs, including Anadarko. This bears significance in that once these costs are funded by BP, such costs are no longer analyzed as OPA-related environmental costs, but
instead are
instead analyzed as OA Liabilities. As discussed above, Anadarko has
agreedsettled its OA Liabilities with
BP to settle its current and future OA Liabilities.BP. Thus, potential liability to the Company for OPA-related environmental costs can
arise only
arise where BP does not, or otherwise is unable to, fund all of the OPA-related environmental costs. Under this scenario, the joint and several nature of the liability for these costs could cause the Company to recognize a liability for OPA-related environmental costs. However, the Company is fully indemnified by BP against these costs (including guarantees by BPCNA or BP p.l.c.).
Gross OPA-Related Environmental Cost Estimate In prior periods through the fourth quarter of 2011, the Company provided an estimated range of gross OPA-related environmental costs for all identified RPs. This estimate was comprised of spill-response costs and OPA damage claims and was derived from cost information received by the Company from BP. The Company no longer receives Deepwater Horizon-related cost and claims data from BP. Accordingly, the OPA-related environmental cost estimate included in BP’s public releases is the best data available to the Company. Based on information included in BP p.l.c.’s public release on February 7, 2012, the range of3, 2015, gross OPA-related environmental costs isare estimated to be $6.0$11.0 billion to $10.0 billion,, excluding (i) amounts BP has already funded, which constitute settled OA Liabilities; (ii) amounts that in BP’s view cannot reasonably be estimated, which include NRD claims and other litigation damages; and (iii) non-OPA-related fines and penalties that may be assessed against Anadarko, including assessments under the Clean Water Act (CWA).; and (iv) estimated state and local governmental claims, which BP no longer publicly discloses and, as a result, Anadarko cannot estimate. Actual gross OPA-related environmental costs may vary from those estimated by BP p.l.c. in its public releases, perhaps materially from the above estimate.
Allocable Share of Gross OPA-Related Environmental Costs Under applicable accounting guidance, the Company is required to estimate its allocable share of gross OPA-related environmental costs. To date, BP has paid all Deepwater Horizon event-related costs, which satisfies the Company’s potential liability for these costs. Additionally, BP has repeatedly stated publicly and in prior congressional testimony that it will continue to pay these costs. BP’s funding and public commentary has continued subsequent to the release of BP’s own investigation report, the National Commission on the BP Deepwater Horizon Oil Spill and Offshore Drilling’s final report, and the Deepwater Horizon Joint Investigation Team final report, which the Company considers to be significant positive indications in assessing the likelihood of BP continuing to fund all of these costs. Based on BP’s stated intent to continue funding these costs, the Company’s assessment of BP’s financial ability to continue funding these costs, and the impact of BP’s settlements with both of its OA partners, the Company believes the likelihood of BP not continuing to satisfy these claims to be remote. Accordingly, the Company considers zero to be its allocable share of gross OPA-related environmental costs and, consistent with applicable accounting guidance, has not recorded a liability for these amounts.
ANADARKO PETROLEUM CORPORATION
NOTES TO CONSOLIDATED FINANCIAL STATEMENTS
YEARS ENDED DECEMBER 31, 2011, 2010,2014, 2013, AND 20092012
17. Contingencies2. Deepwater Horizon Events (Continued)
Other ContingenciesPenalties and Fines These costs include amounts that may be assessed as a result of potential civil and/or criminal penalties under various federal, state, and/or local statutes and/or regulations as a result of the Deepwater Horizon events, including, for example, the CWA, the Outer Continental Shelf Lands Act, the Migratory Bird Treaty Act, and possibly other federal, state, and local laws. The foregoing does not represent an exhaustive list of statutes and regulations that potentially could trigger a penalty or fine assessment against the Company.
To date, no penalties or fines have been assessed against the Company. However, onin December 15, 2010, the U.S. Department of Justice (DOJ), on behalf of the United States, filed a civil lawsuit in the U.S. District Court in New Orleans, Louisiana (Louisiana District Court) against several parties, including Anadarko Petroleum Corporation and Anadarko E&Pthe Company, LP (AE&P), a subsidiary of Anadarko, seeking an assessment of civil penalties under the CWA in an amount to be determined by the Louisiana District Court. In February 2012, the Louisiana District Court entered a declaratory judgment that, as a partial owner of the Macondo well, Anadarko is liable for civil penalties under Section 311 of the CWA. The DOJ complaint seeks separatedeclaratory judgment, which was affirmed in June 2014 by the U.S. Court of Appeals for the Fifth Circuit (Fifth Circuit), addresses liability only, and does not address the amount of any civil penalty. The assessment of a civil penalty assessments against both Anadarko Petroleum Corporation and AE&P (based onwill follow a temporary interestbench trial, which began in January 2015.
In July 2014, Anadarko filed a motion for rehearing with the Fifth Circuit requesting that AE&P at one time held in the Lease). In April 2011,full court sit to reconsider Anadarko’s appeal concerning that portion of the Company moved to dismiss AE&P from the DOJ lawsuit because the effective date of AE&P’s transfer of its interest in the Lease toFebruary 2012 declaratory judgment which found Anadarko Petroleum Corporation pre-dated the Deepwater Horizon events. In December 2011, the United States movedliable for partial summary judgment against, among others, Anadarko Petroleum Corporation and AE&P for a declaration of liability forcivil penalties under the CWA. In September 2014, Anadarko Petroleum Corporationfiled a letter notifying the Fifth Circuit that the Louisiana District Court issued Findings of Fact and AE&P opposedConclusions of Law in the United States’ motionfirst phase of the Deepwater Horizon trial (Phase I Findings and cross-movedConclusions), which included facts that contradict certain key facts assumed by the Fifth Circuit panel in its June 2014 decision. In January 2015, the Fifth Circuit denied the petition for summary judgment forfull court reconsideration with six of the thirteen participating justices filing a declaration of non-liability for CWA penalties. The Court heard oral arguments on these anddissent.
Applicable accounting guidance requires the other parties’ motions in January 2012 and has taken the motions under advisement. The Company currently believesto accrue a liability if it is probable that AE&P willa liability has been incurred and the amount of the liability can be reasonably estimated. The Louisiana District Court’s declaratory judgment in February 2012 satisfies the requirement that a liability arising from the future assessment of a civil penalty against Anadarko is probable. In an effort to resolve this matter, the Company made a settlement offer to the DOJ in July 2014 of $90 million and recorded a contingent liability for this amount at June 30, 2014. The Company subsequently engaged in further discussions regarding settlement, but the parties have not be found liablebeen able to reach agreement on either the amount of, or the terms and conditions governing, a settlement. The Company’s settlement offer of $90 million remains outstanding and the Company remains open to resolving the matter through settlement discussions. The Company believes that $90 million under a settlement scenario is a better estimate of loss at this time than any other amount. Based on the above accounting guidance, the Company’s contingent liability for CWA penalties uponand fines remains $90 million at December 31, 2014. However, the presentationCompany may ultimately incur a liability related to CWA penalties in excess of evidence. the current accrued liability.
The
Company believes the outcomeactual amount of
this decision will not have a material impact on Anadarko’s potential liability.Although Anadarko is named in the DOJ civil lawsuit, its status as a defendant does not mean that Anadarko will be liable for a CWA penalty in that action. First,is subject to uncertainty, including whether the Company haswill be able to reach a defense to liability undersettlement with the CWA based on the location from which the discharge occurred. If the court finds that the discharge of hydrocarbons came from the vessel (which includes the riser pipe), the Company may not be liable under the CWA because it neither owned nor operated theDeepwater Horizon drilling rig. Second, because CWA penalties, in practice, are generally assessed on a party-specific basis and take into account several factors including the party’s degree of fault, the Company considers its lack of direct involvement in the operation of the drilling rig and the spill itself significant in concluding that losses from CWA penalty assessments are not probable. This view was reinforced byDOJ or will await the Louisiana District Court’s decision that dismissed all negligence claims againstopinion following the Company based on the court’s finding that the Company did not exercise operational control over the events that led to the oil spill. Accordingly, the Company does not consider a liability for CWA penalties to be probable and, therefore, has not recorded a liability for potential CWA penalties. The February 2012 financial settlement of CWA penalties by the other non-operating partner (February 2012 Settlement) did not affect the Company’s current conclusion regarding the likelihood of loss attributable to CWA penalties. The Company does not believe that the February 2012 Settlement impacts the Company’s valid defenses.
In addition to concluding that any liability for CWA penalties is not probable, the Company currently cannot estimate the amount of any potential penalty.bench trial. The CWA sets forth subjective criteria to be considered by the court in assessing the magnitude of any CWA penalty, including the degree of fault of the owner. In the Phase I and historyII trials (defined below) and again for the penalty phase trial in January 2015, the Louisiana District Court ruled that no evidence of prior violations, which influence CWA penalty assessments. Thus, as a result ofAnadarko’s alleged culpability or fault may be presented. In addition, in its Phase I Findings and Conclusions, the Louisiana District Court did not allocate any fault to Anadarko. Given the subjective nature of the CWA criteria used to determine penalty assessments and the Louisiana District Court’s prior rulings related to culpability and allocation of fault, the Company currently cannot reasonably estimate the amount of any such penalty. The Company does not consider the financial terms of the February 2012 Settlementpenalty to be indicativeassessed or determine a reasonable range of any potential loss that ultimately may be borneif the matter is resolved by the Company. The Company lacks insight into the content of the February 2012 Settlement discussions, retains legal counsel separate from the other non-operating party, and was not involved in any manner with respect to the February 2012 Settlement.
ANADARKO PETROLEUM CORPORATION
NOTES TO CONSOLIDATED FINANCIAL STATEMENTS
YEARS ENDED DECEMBER 31, 2011, 2010, AND 2009
2. Deepwater Horizon Events (Continued)
GivenLouisiana District Court following trial. However, given the Company’s lack of direct operational involvement in the event, as recently confirmed by the Louisiana District Court,Court’s rulings excluding any evidence of Anadarko’s alleged culpability or fault, the Phase I Findings and Conclusions that did not allocate any fault to Anadarko, and the subjective criteria of the CWA, the Company believes that its potential exposureany CWA penalties assessed to CWA penaltiesit will not materially impact the Company’s consolidated financial position,condition, results of operations, or cash flows.
ANADARKO PETROLEUM CORPORATION
NOTES TO CONSOLIDATED FINANCIAL STATEMENTS
YEARS ENDED DECEMBER 31, 2014, 2013, AND 2012
17. Contingencies (Continued)
Events or factors that could assist the Company in estimating the amount of settlement or potential civil penalty or a range of potential loss related to such penalty include (i) an assessment by the DOJ, (ii) a ruling by a court of competent jurisdiction, or (iii) substantive settlement negotiations between the Company and the DOJ.
As discussed below, numerous Deepwater Horizon event-related civil lawsuits have been filed against BP and other parties, including the Company. Certain state and local governments appealed, or provided indication of a likely appeal of, the Louisiana District Court’s decision that only federal law, and not state law, applies to Deepwater Horizon event-related claims. For example, eleven Louisiana Parish District Attorneys appealed that decision to the Fifth Circuit. In February 2014, the Fifth Circuit denied the appeal and upheld the Louisiana District Court’s decision. In October 2014, the United States Supreme Court denied the Parish District Attorneys’ petition to review the case. While that denial ends further appeal of that decision by the eleven Parish District Attorneys, any other party subject to the decision who has not yet appealed, including private parties who opted out of the BP settlement, the states, and other local governments, may do so after obtaining a final judgment on their damages claims. If any further appeal is taken and is successful, state and/or local laws and regulations could become sources of penalties or fines against the Company.
Natural Resource Damages This category includes future damage claims that may be made by federal and/or state natural resource trustee agencies at the completion of injury assessments and restoration planning. Natural resources generally include land, fish, water, air, wildlife, and other such resources belonging to, managed by, held in trust by, or otherwise controlled by, the federal, state, or local government. The NRD-assessment process is led by government agencies that act as trustees of natural resources on behalf of the public. Government agencies involved in the process include the Department of Commerce, the Department of the Interior (DOI), and the Department of Defense. These governmental departments, along with the five affected states – Alabama, Florida, Louisiana, Mississippi, and Texas – are referred to as the “Co-Trustees.” The Co-Trustees continue to conduct injury assessment and restoration planning.
The DOJ civil lawsuit filed against BP, the Company, and others seeks unspecified damages for injury to federal natural resources. Not all of the Co-Trustees were a party to this lawsuit; however, during the second quarter of 2011, the states of Alabama and Louisiana each filed NRD-related state law claims against the Company in the Louisiana District Court.
The Court heard oral arguments on these and other parties’ motions in September 2011. In November 2011,
after ruling that only federal law applies, the
Louisiana District Court dismissed all the NRD-related state law claims asserted against the Company by the states of Alabama and Louisiana.
TheseIn April 2013, the states
have subsequently appealedof Texas and Mississippi filed NRD-related state law claims against the
Court’s decision.Company, which were consolidated in the federal Multidistrict Litigation (MDL) action before the Louisiana District Court discussed below and are stayed until further order of the Louisiana District Court.
NRD claims are generally sought after the damage assessment and restoration planning is completed, which may take several years. Thus, the Company remains unable to reasonably estimate the magnitude of any NRD claim. The Company anticipates that BP will satisfy any NRD claim, which eliminates any potential liability to Anadarko for such costs. In the event any NRD damage claim is made directly against Anadarko, the Company is fully indemnified by BP against such claims (including guarantees by BPCNA or BP
p.l.c)p.l.c.).
Civil Litigation Damage Claims Numerous Deepwater Horizon event-related civil lawsuits have been filed against BP and other parties, including the Company by, among others, fishing, boating, and shrimping enterprises and industry groups; restaurants; commercial and residential property owners; certain rig workers or their families; the StateStates of Alabama, Louisiana, Texas, and Mississippi, and several of itstheir political subdivisions; the DOJ; environmental non-governmental organizations; the State of Louisiana and certain of its political subdivisions; and certain Mexican states. Many of the lawsuits filed assert various claims of negligence, gross negligence, and violations of several federal and state laws and regulations, including, among others, OPA; the Comprehensive Environmental Response, Compensation, and Liability Act; the Clean Air Act; the CWA; and the Endangered Species Act; or challenge existing permits for operations in the Gulf of Mexico. Generally, the plaintiffs are seeking actual damages, punitive damages, declaratory judgment, and/or injunctive relief.In August 2010, the U.S. Judicial Panel on Multidistrict Litigation created Multidistrict Litigation No. 2179 (MDL)
ANADARKO PETROLEUM CORPORATION
NOTES TO CONSOLIDATED FINANCIAL STATEMENTS
YEARS ENDED DECEMBER 31, 2014, 2013, AND 2012
17. Contingencies (Continued)
This litigation
filed inhas been consolidated into a federal
court involving Deepwater Horizon event-related claims. FederalMDL action pending before Judge Carl Barbier
presides over this MDL in the Louisiana District Court.
TheIn March 2012, BP and the Plaintiffs’ Steering Committee (PSC) entered into a settlement agreement to resolve a substantial majority of the economic loss and medical claims stemming from the Deepwater Horizon events, which the Louisiana District Court
hasapproved in orders issued
a number of case-management orders that establish a schedule for procedural matters, discovery,in December 2012 and
trial of certain of the MDL cases. The parties to the MDL are actively engaged in discovery. In May 2011, September 2011, and November 2011, Judge Barbier heard oral arguments on the numerous motions to dismiss filed by the multiple defendants named in this litigation. While a number of the motions remain pending, Judge Barbier has dismissed all maritime and state law claims filed against the Company seeking damages for economic loss. All negligence claims filed against the Company have been dismissed based upon Judge Barbier’s finding that the Company did not exercise operational controlANADARKO PETROLEUM CORPORATION
NOTES TO CONSOLIDATED FINANCIAL STATEMENTS
YEARS ENDED DECEMBER 31, 2011, 2010, AND 2009
2. Deepwater Horizon Events (Continued)
over the events that led to the oil spill. In a separate order, Judge Barbier reached similar findings and dismissed all claims against the Company filed by private plaintiffs alleging personal injury caused by exposure to oil, fumes or other contaminants from the blowout or the chemical dispersants used during the post-spill cleanup operations. Judge Barbier further found that federal law exclusively applies to claims for property damage and economic loss and dismissed all state law claims against the Company asserting liability for such damages and losses.January 2013. Only OPA claims asserted seeking economic loss damages against the Company remain. In addition, other than those who previously appealed unsuccessfully, certain state and local governments have provided indication of a likely appeal of the Louisiana District Court’s decision that only federal law, and not state law, applies to Deepwater Horizon event-related claims. Certain Mexican states also have appealed the dismissal of their claims against BP, the Company, and others. The Company, pursuant to the Settlement Agreement, is fully indemnified by BP against losses arising as a result of claims for damages, irrespective of whether such OPA claims.
The Louisiana District Court has scheduled a February 2012 trial in Transocean’s Limitation of Liability case in the MDL. This trial is to be the first phase of a three-phase trial, each phase designed to address different issues. claims are based on federal (including OPA) or state law.
The first phase of the trial is to determine certain liability issuesin the MDL (Phase I) commenced in February 2013. The PSC, BP, BP America Production Company (BPAP), BP p.l.c., the United States, state and the liability allocation among the parties alleged to be involved in or liable for the Deepwater Horizon events. In April 2011, the Company filed its answer in this Limitation of Liability case and cross-claimed against affiliates of BP and Transocean Ltd. (Transocean),local governments, Halliburton Energy Services, Inc. (Halliburton), Cameron International Corporation (Cameron), and other third-party defendants.certain subsidiaries of Transocean Halliburton, and Cameron subsequently filed cross-claims againstLtd. (Transocean) participated in Phase I. Anadarko was excused from participation in Phase I. The issues tried in Phase I included the Company. In November 2011, the Court dismissed all cross-claims against the Company. Under the Settlement Agreement, a mutual release of all claims, including claims that were the subject of cross-claims made by the Company against BP, was agreed to by the Company and BP. The Company has also assigned all rights, title, and interest to all claims that have been or could be asserted against third parties, including cross-claims filed against third-party defendants, to BP, with the exception of rights to claims the Company may assert under its insurance policies.Lawsuits seeking to place limitations on the oil and gas industry’s operations in the Gulf of Mexico, including thosecause of the Company, have also been filed outsideblowout and all related events leading up to April 22, 2010, the date the
Deepwater Horizon sank, as well as allocation of the MDL by non-governmental organizations against various governmental agencies. These cases are filed infault. In September 2014, the Louisiana District Court the U.S.issued its Phase I Findings and Conclusions. The Louisiana District CourtsCourt found that BP and BPAP, Transocean, and Halliburton, but not Anadarko, are each liable under general maritime law for the Southernblowout, explosion, and oil spill. The court determined that BP’s and BPAP’s conduct was reckless and that both Transocean’s and Halliburton’s conduct was negligent. The Louisiana District Court apportioned 67% of the fault to BP and BPAP, 30% to Transocean, and 3% to Halliburton. No fault was allocated to Anadarko. BP is challenging certain of the Louisiana District Court’s findings. The second phase of trial (Phase II) began in September 2013 and in November 2013 the parties rested their Phase II cases. The issues tried in Phase II included spill-source control and quantification of the spill for the period from April 20, 2010, until the well was capped. The Company, the PSC, BP, BPAP, BP p.l.c., the United States, state and local governments, Halliburton, and Transocean participated in Phase II of the trial. In January 2015, the Louisiana District Court issued its Phase II Findings of Fact and Conclusions of Law. The Louisiana District Court found that, for purposes of calculating the maximum possible civil penalty under the CWA, 3.19 million barrels of oil were discharged into the Gulf of Mexico.
The penalty phase of the trial began in January 2015. Post-trial briefs are due in March and April 2015. The trial included Anadarko, BP, and the United States, and will assess findings and penalties under the CWA. In March 2014, the Louisiana District Court ruled that no evidence of Anadarko’s alleged culpability or fault could be presented during the penalty phase trial.
The State of Alabama
previously brought actions against the Company and other parties for claims arising from the Deepwater Horizon event, including claims for penalties and fines under state environmental laws, which were subsequently dismissed by the Louisiana District Court. The Louisiana District Court has selected this case as its test case for valuing the damages sought by states for claims under federal laws arising from the Deepwater Horizon event. Trial is set for November 2015 and the
parties are conducting discovery. The Louisiana District
Court’s previous rulings apply to Alabama’s claims, including the court’s decision that only federal law, and not state law, applies; its decision allocating fault and liability among BP and BPAP, Transocean, and Halliburton; and its orders precluding evidence of
Columbia, and inalleged culpability by Anadarko, leaving only damages to be decided. The Company, pursuant to the
U.S. CourtSettlement Agreement, is fully indemnified by BP against losses arising as a result of
Appealsclaims for
the Fifth Circuit.damages.
ANADARKO PETROLEUM CORPORATION
NOTES TO CONSOLIDATED FINANCIAL STATEMENTS
YEARS ENDED DECEMBER 31, 2014, 2013, AND 2012
17. Contingencies (Continued)
Two separate
class actionclass-action complaints were filed in June and August 2010, in the
U.S.New York District Court
for the Southern District of New York (New York District Court) on behalf of purported purchasers of the Company’s stock between June
9,12, 2009, and June
12,9, 2010, against Anadarko and certain of its officers.
The consolidated action was subsequently transferred to the U.S. District Court for the Southern District of Texas - Houston Division (Texas District Court). The complaints allege causes of action arising pursuant to the Securities Exchange Act of 1934 for purported misstatements and omissions regarding, among other things, the Company’s liability related to the Deepwater Horizon events. The plaintiffs seek an unspecified amount of compensatory damages, including interest thereon, as well as litigation fees and costs. In
November 2010,March 2014, the
New Yorkparties reached a settlement in this matter, which was approved by the Texas District Court
consolidated the two cases and appointedin September 2014. The
Pension Trust Fund for Operating Engineers and Employees’ Retirement System of the Government of the Virgin Islands (Virgin Islands Group) to act as Lead Plaintiff. In January 2011, the Lead Plaintiff filed its Consolidated Amended Complaint. Prior to filing its Consolidated Amended Complaint, the Lead Plaintiff requested leave from the New York District Court to transfer this lawsuit to the U.S. District Court for the Southern District of Texas. The Company opposes the Lead Plaintiff’s request to transfer the case to the District Court for the Southern District of Texas. The parties have submitted briefs to the New York District Court concerning the transfer of venue issue. In March 2011, the Company moved to dismiss the Consolidated Amended Complaint of the Lead Plaintiff, and in April 2011, the Lead Plaintiff filed its opposition to the motion to dismiss. The motion to transfer and motion to dismiss remain under advisement of the New York District Court.Also in June 2010, a shareholder derivative petitionsettlement was filed in the 152nd Judicial District Court of Harris County, Texas (Harris County District Court),directly funded by a shareholder of the Company against Anadarko (as a nominal defendant), certain of its officers, and current and certain former directors. The petition alleged breaches of fiduciary duties, unjust enrichment, and waste of corporate assets in connection with the Deepwater Horizon events. The plaintiffs sought certain changes to the Company’s governance and internal procedures, disgorgement of profits, and reimbursement of litigation fees and costs. In November 2010, the Harris County District Court granted Anadarko’s
insurers.
ANADARKO PETROLEUM CORPORATIONNOTES TO CONSOLIDATED FINANCIAL STATEMENTS
YEARS ENDED DECEMBER 31, 2011, 2010, AND 2009
2. Deepwater Horizon Events (Continued)
Motion to Dismiss for Lack of Jurisdiction and Special Exceptions, and granted the plaintiffs 120 days to file an Amended Petition. In March 2011, the plaintiffs filed an Amended Petition. The Company filed Special Exceptions and a Motion to Dismiss the Amended Petition in April 2011. In June 2011, the Harris County District Court heard oral arguments on these matters and granted the motion to dismiss. The time for the plaintiffs to appeal has expired.
In November 2011, the Company’s Board of Directors received a letter from a purported shareholder demanding that the Board investigate, address, remedy, and commence derivative proceedings against certain officers and directors for their alleged breach of fiduciary duty related to Deepwater Horizon events. The Board has considered this demand and will respond in due course.
Given the early stages of these proceedings, the Company currently cannot assess the probability of losses, or reasonably estimate a range of any potential losses, related to ongoing proceedings. The Company intends to vigorously defend itself, its officers, and its directors in all proceedings, and will avail itself of any and all indemnities provided by BP against civil damages.
Remaining Liability Outlook It is reasonably possible that the Company may recognize additional Deepwater Horizon event-related liabilities for potential fines and penalties shareholder claims, and certain other claims not covered by the indemnification provisions of the Settlement Agreement; however, the Company does not believe that any potential liability attributable to the foregoing items, individually or in the aggregate, will have a material impact on the Company’s consolidated financial position,condition, results of operations, or cash flows.
The Company will continue to monitor This assessment takes into account certain qualitative factors, including the MDLsubjective and other legal proceedingsfault-based nature of CWA penalties, the Company’s indemnification by BP against certain damage claims as discussed above as well as federal investigations related to the Deepwater Horizon events, including the investigation by the U.S. Chemical Safety Board. The Company cannot predict the nature of evidence that may be discovered during the course of legal proceedings and investigations, the timing of discovery, or the timing of completion of any legal proceedings or investigations.
BP’s creditworthiness.
Although the Company is fully indemnified by BP against OPA damage claims, NRD claims and assessment costs, and certain other potential liabilities, the Company may be required to recognize a liability for these amounts in advance of or in connection with recognizing a receivable from BP for the related indemnity payment. In all circumstances, however, the Company expects that any additional indemnified liability that may be recognized by the Company will be subsequently recovered from BP itself or through the guarantees of BPCNA or BP p.l.c.
Insurance and Other Recoveries The Company carries insurance to protect against potential financial losses. During the fourth quarter of 2011, the Company recorded a gain of $163 million for insurance proceeds related to Deepwater Horizon events. This amount is included in Deepwater Horizon settlement and related costs in the Company’s Consolidated Statement of Income for the year ended December 31, 2011. The Company also carries directors’ and officers’ insurance which covers certain risks associated with certain of the above-described legal proceedings.
As part of the Settlement Agreement, BP has agreed that, to the extent it receives value in the future from claims that it has asserted or could assert against third parties arising from or relating to the Deepwater Horizon events, it will make cash payments (not to exceed $1.0 billion in the aggregate) to Anadarko, on a current and continuing basis, of 12.5% of the aggregate value received by BP in excess of $1.5 billion. Any payments received by the Company pursuant to this arrangement will be accounted for as a reimbursement of the $4.0 billion payment made by the Company to BP as part of the Settlement Agreement.
ANADARKO PETROLEUM CORPORATION
NOTES TO CONSOLIDATED FINANCIAL STATEMENTS
YEARS ENDED DECEMBER 31, 2011, 2010, AND 2009
3. Acquisitions
In May 2011, Anadarko increased its ownership interest in a natural-gas processing plant (Wattenberg Plant), located in northeast Colorado, by acquiring an additional 93% interest for $576 million. Anadarko operates and owns a 100% interest in the Wattenberg Plant.
In February 2011, WES, a consolidated subsidiary of the Company, acquired a natural-gas processing plant and related gathering systems (Platte Valley), located in northeast Colorado, for $302 million.
These acquisitions, along with future expansion plans, align Anadarko’s natural-gas processing capacity with the Company’s anticipated production growth in the Rocky Mountains Region (Rockies). In addition, these acquisitions position the Company to improve field recoveries and realize operational cost efficiencies.
The Wattenberg Plant and Platte Valley acquisitions constitute business combinations and were accounted for using the acquisition method. The following summarizes the preliminary fair value of assets acquired and liabilities assumed at the acquisition dates:
| | | | |
millions | | | | |
Properties and equipment | | $ | 298 | |
Intangible assets | | | 165 | |
Deferred income taxes | | | 31 | |
Other assets | | | 4 | |
Other liabilities | | | (21 | ) |
Goodwill | | | 362 | |
| | | | |
Total assets acquired and liabilities assumed | | | 839 | |
| | | | |
Less: Fair value of Anadarko’s pre-acquisition 7% equity interest in the Wattenberg Plant | | | 37 | |
| | | | |
Acquisition of midstream businesses | | | 802 | |
| | | | |
Loss on Anadarko’s preexisting contracts with the previous Wattenberg Plant owner | | | 76 | |
| | | | |
Total consideration paid | | $ | 878 | |
| | | | |
All fair-value measurements of assets acquired and liabilities assumed are based on inputs that are not observable in the market and thus represent Level 3 inputs. The fair value of acquired properties and equipment is based on market and cost approaches. Intangible assets consist of customer contracts, the fair value of which was determined using an income approach. Deferred tax assets represent the tax effects of differences in the tax basis and acquisition-date fair values of assets acquired and liabilities assumed. Liabilities assumed include asset retirement obligations existing at the date of acquisition, and are valued consistent with the Company’s policy for estimating such obligations.
Assets acquired and liabilities assumed are included within the midstream reporting segment, except for $335 million of goodwill and a portion of the related deferred tax asset recognized in connection with the Wattenberg Plant acquisition, which are included in the oil and gas exploration and production reporting segment. Goodwill of $469 million related to the Wattenberg Plant acquisition is amortizable for tax purposes.
Goodwill from these acquisitions is included in the oil and gas exploration and production reporting segment and the midstream reporting segment based on the increase in fair value to each of the respective reporting segments. The increase in fair value to these reporting segments is derived from improved NGLs volume retention from equity production and the alignment of Company-controlled natural-gas processing capacity with future production growth plans in the Rockies. SeeNote 7—Goodwill and Other Intangible Assets.
Prior to the Wattenberg Plant acquisition, the Company was party to natural-gas processing contracts with the previous Wattenberg Plant owner. As a result of the acquisition, these preexisting contracts were terminated, causing the Company to recognize a $76 million loss, which is included in gains (losses) on divestitures and other, net in the Consolidated Statement of Income for the year ended December 31, 2011. This loss represents the aggregate amount by which the contracts were unfavorable as compared to current market transactions for the same or similar services at the date the Company acquired the Wattenberg Plant.
ANADARKO PETROLEUM CORPORATION
NOTES TO CONSOLIDATED FINANCIAL STATEMENTS
YEARS ENDED DECEMBER 31, 2011, 2010, AND 2009
3. Acquisitions (Continued)
The Company also recognized a gain of $21 million from the acquisition-date fair-value remeasurement of its pre-acquisition 7% equity interest in the Wattenberg Plant. The gain is included in gains (losses) on divestitures and other, net in the Consolidated Statement of Income for the year ended December 31, 2011.
Results of operations attributable to the Wattenberg Plant and Platte Valley acquisitions are included in the Company’s Consolidated Statements of Income from the dates acquired. The amounts of revenue and earnings included in the Company’s Consolidated Statement of Income for the year ended December 31, 2011, and the amounts of revenue and earnings that would have been recognized had the acquisitions occurred on January 1, 2010, are not material to the Company’s Consolidated Statements of Income.
4. Divestitures and Assets Held for Sale
In 2011, the Company received $419 million in satisfaction of the contingent consideration related to the 2008 divestiture of its interest in the Peregrino field offshore Brazil. The Company also recognized losses on assets held for sale of $422 million during 2011 as the Company began marketing certain onshore domestic properties from both the oil and gas exploration and production reporting segment and the midstream reporting segment in order to redirect its operating activities and capital investment to other areas. Losses on assets held for sale consist of $390 million related to oil and gas exploration and production reporting segment properties and $32 million related to midstream reporting segment properties. These assets were impaired to fair value, estimated using Level 2 and Level 3 fair-value inputs. At December 31, 2011, net properties and equipment, goodwill and other intangible assets, and other long-term liabilities on the Company’s Consolidated Balance Sheets included $320 million, $38 million, and $75 million, respectively, associated with assets held for sale.
In 2010, proceeds from divestitures of $70 million and net gains on divestitures of $29 million are primarily related to U.S. onshore oil and gas properties. During 2009, the Company closed several unrelated property divestiture transactions, realizing proceeds of $176 million and net gains on divestitures of $44 million. The 2009 gains included $29 million related to divestitures of certain oil and gas properties in Qatar.
5. Inventories
The major classes of inventories, included in other current assets as of December 31, are as follows:
| | | 00000000 | | | | 00000000 | |
| millions | | 2011 | | | 2010 | |
Crude oil | | $ | 103 | | | $ | 126 | |
Natural gas | | | 49 | | | | 64 | |
NGLs | | | 59 | | | | 61 | |
| | | | | | | | |
Total | | $ | 211 | | | $ | 251 | |
| | | | | | | | |
6. Properties and Equipment
A summary of the cost of properties and equipment by segment as of December 31, are as follows:
| | | 00000000 | | | | 00000000 | |
| millions | | 2011 | | | 2010 | |
Oil and gas exploration and production(1) | | $ | 52,711 | | | $ | 48,328 | |
Midstream | | | 4,837 | | | | 4,060 | |
Marketing | | | 9 | | | | 9 | |
Other | | | 2,524 | | | | 2,418 | |
| | | | | | | | |
Total | | $ | 60,081 | | | $ | 54,815 | |
| | | | | | | | |
(1) | Includes costs associated with unproved properties of $8.3 billion and $9.8 billion at December 31, 2011 and 2010, respectively.
|
ANADARKO PETROLEUM CORPORATION
NOTES TO CONSOLIDATED FINANCIAL STATEMENTS
YEARS ENDED DECEMBER 31, 2011, 2010, AND 2009
6. Properties and Equipment (Continued)
During 2011, the Company recognized impairments of $1.7 billion related to long-lived assets. These impairments include $1.2 billion and $458 million related to U.S. properties included in the oil and gas exploration and production and midstream reporting segment, respectively. These impairments were primarily due to decreases in natural-gas prices. All of these assets were impaired to fair value, estimated using Level 3 fair-value inputs. Impairments and depreciation reduced the net book value of assets impaired during 2011 to $688 million at December 31, 2011.
During 2010, the Company recognized impairments of $147 million related to long-lived assets. These impairments include $114 million related to a production platform included in the oil and gas exploration and production reporting segment that remains idle with no immediate plan for use, and for which a limited market exists. Other long-lived assets included in the oil and gas exploration and production reporting segment were impaired by $31 million, which were primarily located in the Southern and Appalachia Region. These assets were impaired to fair value, which was estimated using Level 3 inputs. Impairments and depreciation reduced the net book value of assets impaired during 2010 to $51 million at December 31, 2010.
During 2009, the Company recognized impairments of $41 million related to long-lived assets, including $22 million related to the oil and gas exploration and production reporting segment triggered by the economic and commodity price environment, $7 million associated with certain gathering and processing facilities in the midstream reporting segment due to reduced operating activity, and $12 million related to a liquefied natural gas facility site, included in the marketing reporting segment. These assets were impaired to fair value, which was estimated using Level 3 inputs. Impairments and depreciation reduced the net book value of assets impaired in 2009 to $26 million at December 31, 2009.
Suspended Exploratory Drilling Costs The following presents the amount of suspended exploratory drilling costs at December 31 for each of the last three years, and changes to those amounts during the years then ended. The following excludes amounts for new projects capitalized and subsequently reclassified to proved oil and gas properties or charged to expense within the same year.
| | | 000000 | | | | 000000 | | | | 000000 | |
| millions | | 2011 | | | 2010 | | | 2009 | |
Balance at January 1 | | $ | 935 | | | $ | 579 | | | $ | 279 | |
Additions pending the determination of proved reserves | | | 572 | | | | 491 | | | | 483 | |
Reclassifications to proved properties | | | (116 | ) | | | (106 | ) | | | (120 | ) |
Charges to exploration expense | | | (38 | ) | | | (29 | ) | | | (63 | ) |
| | | | | | | | | | | | |
Balance at December 31 | | $ | 1,353 | | | $ | 935 | | | $ | 579 | |
| | | | | | | | | | | | |
The following presents suspended exploratory drilling costs by geographic area and by year of origination at December 31, 2011.
| | | 000000 | | | | 000000 | | | | 000000 | | | | 000000 | |
| | | | | | Year Costs
Incurred | |
| millions | | Total | | | 2011 | | | 2010 | | | 2009 and
prior | |
United States—Onshore | | $ | 110 | | | $ | 96 | | | $ | 4 | | | $ | 10 | |
United States—Offshore | | | 233 | | | | (5 | ) | | | 60 | | | | 178 | |
International | | | 1,010 | | | | 468 | | | | 312 | | | | 230 | |
| | | | | | | | | | | | | | | | |
| | $ | 1,353 | | | $ | 559 | | | $ | 376 | | | $ | 418 | |
| | | | | | | | | | | | | | | | |
ANADARKO PETROLEUM CORPORATION
NOTES TO CONSOLIDATED FINANCIAL STATEMENTS
YEARS ENDED DECEMBER 31, 2011, 2010, AND 2009
6. Properties and Equipment (Continued)
Suspended exploratory drilling costs capitalized for a period greater than one year after completion of drilling at December 31, 2011, were $794 million and were associated with 20 projects, primarily located in the Gulf of Mexico, Brazil, Ghana, Sierra Leone, and Mozambique. All project costs suspended for longer than one year were primarily suspended pending the completion of economic evaluations including, but not limited to, results of additional appraisal drilling, facilities, infrastructure, well-test analysis, additional geological and geophysical data, development plan approval, and permitting. Management believes projects with suspended exploratory drilling costs exhibit sufficient quantities of hydrocarbons to justify potential development and is actively pursuing efforts to assess whether reserves can be attributed to the respective areas. If additional information becomes available that raises substantial doubt as to the economic or operational viability of any of these projects, the associated costs will be expensed at that time.
7. Goodwill and Other Intangible Assets
Goodwill The Company completed its annual impairment assessment of goodwill during the fourth quarter of 2011, and the test indicated no impairment. At December 31, 2011, the Company had $5.6 billion of goodwill allocated as follows: $5.4 billion to oil and gas exploration and production; $102 million to other gathering and processing; $59 million to WES gathering and processing; and $5 million to transportation.
Significant declines in commodity prices, difficulty or potential delays in obtaining drilling permits, or other unanticipated events could result in further goodwill impairment tests in the near term, the results of which may have a material adverse impact on the Company’s results of operations.
Other Intangible Assets Intangible assets subject to amortization and associated amortization expense are as follows:
| | | | | | | | | | | | | | | | |
| millions | | Gross Carrying
Amount | | | Accumulated
Amortization | | | Net Carrying
Amount | | | Amortization
Expense | |
December 31, 2011 | | | | | | | | | | | | | | | | |
Offshore platform leases | | $ | 60 | | | $ | (33 | ) | | $ | 27 | | | $ | 2 | |
Customer contracts | | | 165 | | | | (2 | ) | | | 163 | | | | 2 | |
| | | | | | | | | | | | | | | | |
| | $ | 225 | | | $ | (35 | ) | | $ | 190 | | | $ | 4 | |
| | | | | | | | | | | | | | | | |
| | | | |
December 31, 2010 | | | | | | | | | | | | | | | | |
Offshore platform leases | | $ | 60 | | | $ | (31 | ) | | $ | 29 | | | $ | 3 | |
| | | | | | | | | | | | | | | | |
| | $ | 60 | | | $ | (31 | ) | | $ | 29 | | | $ | 3 | |
| | | | | | | | | | | | | | | | |
Customer contract intangible assets are primarily related to the Wattenberg Plant acquisition and are included in the Company’s midstream reporting segment, and are being amortized over 50 years. See Note 3—Acquisitions. The estimated aggregate amortization expense for all intangible assets for the next five years is not expected to be material.
ANADARKO PETROLEUM CORPORATION
NOTES TO CONSOLIDATED FINANCIAL STATEMENTS
YEARS ENDED DECEMBER 31, 2011, 2010, AND 2009
8. Noncontrolling Interests
WES, a consolidated subsidiary, is a limited partnership formed by Anadarko to own, operate, acquire, and develop midstream assets. In 2011 and 2010, WES issued approximately 10 million and 13 million common units to the public, respectively, raising net proceeds of $328 million and $338 million, respectively, which increased the noncontrolling interest component of total equity.
In August 2011, the WES subordinated limited partner units held by Anadarko converted to common limited partner units on a one-for-one basis. Upon this conversion, $162 million related to pre-conversion changes in the Company’s ownership interest in WES was transferred from noncontrolling interests to paid-in capital. Additionally, $32 million was recorded to paid-in capital as a result of WES’s third-quarter 2011 issuance of common units. The Company’s net income (loss) attributable to common stockholders, together with the above-described increases to Anadarko’s paid-in capital, for the year ended December 31, 2011, totaled $(2,455) million. At December 31, 2011, Anadarko’s ownership interest in WES consisted of a 43.3% limited partner interest, a 2% general partner interest, and incentive distribution rights.
9. Investments
Noncontrolling Mandatorily Redeemable Interests In 2007, Anadarko contributed certain of its oil and gas properties and gathering and processing assets, with an aggregate fair value of $2.9 billion at the time of the contribution, to newly formed unconsolidated entities in exchange for noncontrolling mandatorily redeemable London Interbank Offered Rate (LIBOR) based preferred interests in those entities. The common equity of the investee entities is 95% owned by third parties that also maintain control over the assets. Subsequent to their formation, the investee entities loaned Anadarko an aggregate of $2.9 billion. The Company accounts for its investment in these entities using the equity method of accounting. The carrying amount of these investments was $2.8 billion and the carrying amount of notes payable to affiliates was $2.9 billion at December 31, 2011. Anadarko has legal right of setoff and intends to net-settle its obligations under each of the notes payable to the investees with the distributable value of its interest in the corresponding investee. Accordingly, the investments and the obligations are presented net on the Consolidated Balance Sheets with the excess of the notes payable to affiliates over the aggregate investment carrying amounts reported in other long-term liabilities—other for all periods presented.
Interest on the notes issued by Anadarko is variable, based on LIBOR, plus a spread that fluctuates with Anadarko’s credit rating. The applicable interest rate was 1.55% and 1.30% at December 31, 2011 and 2010, respectively. The note payable agreement contains a covenant that provides for a maximum debt-to-capital ratio of 67%. Anadarko was in compliance with this covenant at December 31, 2011. Other (income) expense, net for 2011, 2010, and 2009, includes interest expense on the notes payable of $38 million, $39 million, and $57 million, respectively, and equity earnings from Anadarko’s investments in the investee entities of $(41) million, $(37) million, and $(42) million, respectively.
Other During 2011 and 2010, the Company recognized impairment expense of $91 million ($37 million net of tax) and $61 million ($23 million net of tax), respectively, related to the Company’s cost-method investment in Venezuelan assets due to changes in expected recoverable reserves. These assets are included in the oil and gas exploration and production reporting segment and were impaired to fair value, estimated using Level 3 fair-value inputs. The Company’s after-tax net investment in these assets was $39 million and $70 million at December 31, 2011 and 2010, respectively.
ANADARKO PETROLEUM CORPORATION
NOTES TO CONSOLIDATED FINANCIAL STATEMENTS
YEARS ENDED DECEMBER 31, 2011, 2010, AND 2009
10. Derivative Instruments
Objective and Strategy The Company uses derivative instruments to manage its exposure to cash-flow variability from commodity-price and interest-rate risks.
Futures, swaps, and options are used to manage exposure to commodity-price risk inherent in the Company’s oil and natural-gas production and natural-gas processing operations (Oil and Natural-Gas Production/Processing Derivative Activities). Futures contracts and commodity-price swap agreements are used to fix the price of expected future oil and natural-gas sales at major industry trading locations, such as Henry Hub for natural gas and Cushing for oil. Basis swaps are used to fix or float the price differential between product prices at one market location versus another. Options are used to establish a floor price, a ceiling price, or a floor and a ceiling price (collar) for expected future oil and natural-gas sales. Derivative instruments are also used to manage commodity-price risk inherent in customer price requirements and to fix margins on the future sale of natural gas and NGLs from the Company’s leased storage facilities (Marketing and Trading Derivative Activities).
Interest-rate swaps are used to fix or float interest rates on existing or anticipated indebtedness. The purpose of these instruments is to manage the Company’s existing or anticipated exposure to unfavorable interest-rate changes. The fair value of this swap portfolio increases (decreases) when interest rates increase (decrease).
The Company does not apply hedge accounting to any of its derivative instruments. As a result, both realized and unrealized gains and losses associated with derivative instruments are recognized in earnings. Net derivative losses attributable to derivatives previously subject to hedge accounting reside in accumulated other comprehensive income (loss) and are reclassified to earnings as the transactions to which the derivatives relate are recognized in earnings. Accumulated other comprehensive loss balances of $109 million ($70 million after tax) and $125 million ($79 million after tax) at December 31, 2011 and 2010, respectively, relate to interest-rate derivatives that were previously subject to hedge accounting.
Oil and Natural-Gas Production/Processing Derivative Activities Below is a summary of the Company’s derivative instruments related to its Oil and Natural-Gas Production/Processing Activities at December 31, 2011. The natural-gas prices listed below are New York Mercantile Exchange (NYMEX) Henry Hub prices. The crude-oil prices listed below are NYMEX Cushing prices.
| | | | | | | | |
| | | 2012 | | | 2013 | |
Natural Gas | | | | | | | | |
Three-Way Collars (thousand MMBtu/d) | | | — | (1) | | | 450 | |
Average price per MMBtu | | | | | | | | |
Ceiling sold price (call) | | $ | — | | | $ | 6.57 | |
Floor purchased price (put) | | $ | — | | | $ | 5.00 | |
Floor sold price (put) | | $ | — | | | $ | 4.00 | |
Fixed-Price Contracts (thousand MMBtu/d) | | | 1,000 | | | | — | |
Average price per MMBtu | | $ | 4.69 | | | $ | — | |
Crude Oil | | | | | | | | |
Three-Way Collars (MBbls/d) | | | 2 | | | | — | |
Average price per barrel | | | | | | | | |
Ceiling sold price (call) | | $ | 92.50 | | | $ | — | |
Floor purchased price (put) | | $ | 50.00 | | | $ | — | |
Floor sold price (put) | | $ | 35.00 | | | $ | — | |
(1) | Includes the effects of offsetting purchased and sold natural-gas three-way collars of 500,000 MMBtu/d.
|
MMBtu—million British thermal units
MMBtu/d—million British thermal units per day
MBbls/d—thousand barrels per day
ANADARKO PETROLEUM CORPORATION
NOTES TO CONSOLIDATED FINANCIAL STATEMENTS
YEARS ENDED DECEMBER 31, 2011, 2010, AND 2009
10. Derivative Instruments (Continued)
A three-way collar is a combination of three options: a sold call, a purchased put, and a sold put. The sold call establishes the maximum price that the Company will receive for the contracted commodity volumes. The purchased put establishes the minimum price that the Company will receive for the contracted volumes unless the market price for the commodity falls below the sold put strike price, at which point the minimum price equals the reference price (e.g., NYMEX) plus the excess of the purchased put strike price over the sold put strike price.
Marketing and Trading Derivative Activities In addition to the positions in the above tables, the Company also engages in marketing and trading activities, which include physical product sales and related derivative transactions used to manage commodity-price risk. At December 31, 2011 and 2010, the Company had fixed-price physical transactions related to natural gas totaling 22 billion cubic feet (Bcf) and 32 Bcf, respectively, offset by derivative transactions for 21 Bcf and 28 Bcf, respectively, for net positions of 1 Bcf and 4 Bcf, respectively.
Interest-Rate Derivatives In December 2008 and January 2009, Anadarko entered into interest-rate swap contracts as a fixed-rate payor to mitigate the interest-rate risk associated with anticipated 2011 and 2012 debt issuances. The Company locked in a fixed interest rate in exchange for a floating interest rate indexed to the three-month LIBOR. The swap instruments include a provision that requires both the termination of the swaps and cash settlement in full at the start of the reference period.
Due to rising interest rates in 2009, the fair value of the swap contracts increased. As a result, the Company revised the swap contract terms in the second quarter of 2009 to increase the weighted-average interest rate of the swap portfolio from approximately 3.25% to approximately 4.80%, and realized a $552 million gain. During the third quarter of 2011, in order to better align the swap portfolio with the anticipated timing of future debt refinancing, the Company extended the swap maturity dates from October 2011 to June 2014 for interest-rate swaps with an aggregate notional principal amount of $1.85 billion. In connection with these extensions, the swap interest rates were also adjusted. In addition, interest-rate swap agreements with an aggregate notional principal amount of $150 million were settled for a loss of $57 million in October 2011.
The Company had the following outstanding interest-rate swaps at December 31, 2011.
| | | | | | |
| millions except percentages | | Reference Period | | Weighted-Average |
Notional Principal Amount | | Start | | End | | Interest Rate |
$ 250 | | October 2012 | | October 2022 | | 4.91% |
$ 750 | | October 2012 | | October 2042 | | 4.80% |
$ 750 | | June 2014 | | June 2024 | | 6.00% |
$ 1,100 | | June 2014 | | June 2044 | | 5.57% |
ANADARKO PETROLEUM CORPORATION
NOTES TO CONSOLIDATED FINANCIAL STATEMENTS
YEARS ENDED DECEMBER 31, 2011, 2010, AND 2009
10. Derivative Instruments (Continued)
Effect of Derivative Instruments—Balance Sheet The fair value of the Company’s derivative instruments is presented below.
| | | | | | | | | | | | | | | | | | |
| | | | | Gross
Derivative Assets | | | Gross
Derivative Liabilities | |
| millions | | Balance Sheet | | December 31, | | | December 31, | | | December 31, | | | December 31, | |
Derivatives | | Classification | | 2011 | | | 2010 | | | 2011 | | | 2010 | |
Commodity | | | | | | | | | | | | | | | | | | |
| | Other Current Assets | | $ | 924 | | | $ | 444 | | | $ | (353 | ) | | $ | (274 | ) |
| | Other Assets | | | 150 | | | | 242 | | | | (15 | ) | | | (56 | ) |
| | Accrued Expenses | | | 5 | | | | 89 | | | | (33 | ) | | | (131 | ) |
| | Other Liabilities | | | 1 | | | | 26 | | | | (17 | ) | | | (28 | ) |
| | | | | | | | | | | | | | | | | | |
| | | 1,080 | | | | 801 | | | | (418 | ) | | | (489 | ) |
| | | | | | | | | | | | | | | | | | |
Interest Rate and Other | | | | | | | | | | | | | | | | | | |
| | Accrued Expenses | | | — | | | | — | | | | (391 | ) | | | (190 | ) |
| | Other Liabilities | | | — | | | | — | | | | (808 | ) | | | (45 | ) |
| | | | | | | | | | | | | | | | | | |
| | | — | | | | — | | | | (1,199 | ) | | | (235 | ) |
| | | | | | | | | | | | | | | | | | |
Total Derivatives | | | | $ | 1,080 | | | $ | 801 | | | $ | (1,617 | ) | | $ | (724 | ) |
| | | | | | | | | | | | | | | | | | |
Effect of Derivative Instruments—Statement of Income The realized and unrealized gain or loss amounts and classification of derivative instruments for the respective years ended December 31 are as follows:
| | | | | | | | | | | | | | |
| millions | | | | (Gain) Loss | |
Derivatives | | Classification of (Gain) Loss Recognized | | Realized | | | Unrealized | | | Total | |
2011 | | | | | | | | | | | | | | |
Commodity | | | | | | | | | | | | | | |
| | Gathering, Processing, and Marketing Sales(1) | | $ | 20 | | | $ | (12 | ) | | $ | 8 | |
| | (Gains) Losses on Commodity Derivatives, net | | | (226 | ) | | | (336 | ) | | | (562 | ) |
Interest Rate and Other | | | | | | | | | | | | | | |
| | (Gains) Losses on Other Derivatives, net | | | 59 | | | | 964 | | | | 1,023 | |
| | | | | | | | | | | | | | |
Derivative (Gain) Loss, net | | $ | (147 | ) | | $ | 616 | | | $ | 469 | |
| | | | | | | | | | | | | | |
2010 | | | | | | | | | | | | | | |
Commodity | | | | | | | | | | | | | | |
| | Gathering, Processing, and Marketing Sales(1) | | $ | 3 | | | $ | (4 | ) | | $ | (1 | ) |
| | (Gains) Losses on Commodity Derivatives, net | | | (498 | ) | | | (395 | ) | | | (893 | ) |
Interest Rate and Other | | | | | | | | | | | | | | |
| | (Gains) Losses on Other Derivatives, net | | | — | | | | 285 | | | | 285 | |
| | | | | | | | | | | | | | |
Derivative (Gain) Loss, net | | $ | (495 | ) | | $ | (114 | ) | | $ | (609 | ) |
| | | | | | | | | | | | | | |
2009 | | | | | | | | | | | | | | |
Commodity | | | | | | | | | | | | | | |
| | Gathering, Processing, and Marketing Sales(1) | | $ | (2 | ) | | $ | 39 | | | $ | 37 | |
| | (Gains) Losses on Commodity Derivatives, net | | | (327 | ) | | | 735 | | | | 408 | |
Interest Rate | | | | | | | | | | | | | | |
| | (Gains) Losses on Other Derivatives, net | | | (525 | ) | | | (57 | ) | | | (582 | ) |
| | | | | | | | | | | | | | |
Derivative (Gain) Loss, net | | $ | (854 | ) | | $ | 717 | | | $ | (137 | ) |
| | | | | | | | | | | | | | |
(1) | Represents the effect of marketing and trading derivative activities.
|
ANADARKO PETROLEUM CORPORATION
NOTES TO CONSOLIDATED FINANCIAL STATEMENTS
YEARS ENDED DECEMBER 31, 2011, 2010, AND 2009
10. Derivative Instruments (Continued)
Credit-Risk Considerations The financial integrity of exchange-traded contracts is assured by NYMEX or the Intercontinental Exchange through systems of financial safeguards and transaction guarantees and is subject to nominal credit risk. Over-the-counter traded swaps, options, and futures contracts expose the Company to counterparty credit risk. The Company monitors the creditworthiness of its counterparties, establishes credit limits according to the Company’s credit policies and guidelines, and assesses the impact of a counterparty’s creditworthiness on fair value. The Company has the ability to require cash collateral or letters of credit to mitigate its credit-risk exposure. The Company has netting agreements with financial institutions that permit net settlement of gross commodity derivative assets against gross commodity derivative liabilities, and routinely exercises its contractual right to offset realized gains against realized losses when settling with derivative counterparties.
In addition, the Company has setoff agreements with certain financial institutions that may be exercised in the event of default and provide for contract termination and net settlement across all derivative types. At December 31, 2011, $749 million of the Company’s $1.6 billion gross derivative liability balance, and at December 31, 2010, $394 million of the Company’s $724 million gross derivative liability balance, would have been eligible for setoff against the Company’s gross derivative asset balance in the event of default. Other than in the event of default, the Company does not net settle across commodity and interest-rate derivatives, as settlement timing differs.
Some of the Company’s derivative instruments are subject to provisions that can require collateralization of the Company’s obligations. However, most of the Company’s derivative counterparties maintain secured positions with respect to the Company’s derivative liabilities under the Company’s $5.0 billion senior secured revolving credit facility ($5.0 billion Facility), the available capacity of which is sufficient to secure potential obligations to such counterparties.
Unsecured derivative obligations may require immediate settlement or full collateralization if certain credit-risk-related provisions are triggered, such as the Company’s credit rating declining to a level below investment grade by major credit rating agencies. In June 2010, the Company’s credit rating was downgraded from “Baa3” to “Ba1” by Moody’s Investors Service (Moody’s), which triggered credit-risk-related features with certain derivative counterparties, resulting in the Company posting additional collateral under its derivative instruments. No counterparties have requested termination or full settlement of derivative positions. At December 31, 2011 and 2010, the aggregate fair value of all derivative instruments with credit-risk-related contingent features for which a net liability position existed was $2 million (net of collateral) and $10 million (net of collateral), respectively, included in accrued expenses on the Company’s Consolidated Balance Sheets.
ANADARKO PETROLEUM CORPORATION
NOTES TO CONSOLIDATED FINANCIAL STATEMENTS
YEARS ENDED DECEMBER 31, 2011, 2010, AND 2009
10. Derivative Instruments (Continued)
Fair Value Fair value of futures contracts is based on quoted prices in active markets for identical assets or liabilities, which represent Level 1 inputs. Valuations of physical-delivery purchase and sale agreements, over-the-counter financial swaps, and commodity option collars are based on similar transactions observable in active markets and industry-standard models that primarily rely on market-observable inputs. Inputs used to estimate the fair value of swaps and options include market-price curves; contract terms and prices; credit-risk adjustments; and, for Black-Scholes option valuations, implied market volatility and discount factors. Inputs used to estimate fair value in industry-standard models are categorized as Level 2 inputs because substantially all assumptions and inputs are observable in active markets throughout the full term of the instruments.
The fair value of the Company’s derivative financial assets and liabilities, by input level within the fair-value hierarchy, is presented below.
| | | 0000000 | | | | 0000000 | | | | 0000000 | | | | 0000000 | | | | 0000000 | | | | 0000000 | |
| December 31, 2011 | | | | | | | | | | | | | | | | | | | | | | | | |
| millions | | Level 1 | | | Level 2 | | | Level 3 | | | Netting(1) | | | Collateral | | | Total | |
Assets: | | | | | | | | | | | | | | | | | | | | | | | | |
Commodity derivatives | | | | | | | | | | | | | | | | | | | | | | | | |
Financial institutions | | $ | 3 | | | $ | 909 | | | $ | — | | | $ | (323 | ) | | $ | (52 | ) | | $ | 537 | |
Other counterparties | | | — | | | | 168 | | | | — | | | | (51 | ) | | | — | | | | 117 | |
| | | | | | | | | | | | | | | | | | | | | | | | |
Total derivative assets | | $ | 3 | | | $ | 1,077 | | | $ | — | | | $ | (374 | ) | | $ | (52 | ) | | $ | 654 | |
| | | | | | | | | | | | | | | | | | | | | | | | |
Liabilities: | | | | | | | | | | | | | | | | | | | | | | | | |
Commodity derivatives | | | | | | | | | | | | | | | | | | | | | | | | |
Financial institutions | | $ | (4 | ) | | $ | (375 | ) | | $ | — | | | $ | 361 | | | $ | 7 | | | $ | (11 | ) |
Other counterparties | | | — | | | | (39 | ) | | | — | | | | 13 | | | | — | | | | (26 | ) |
Interest-rate and other derivatives | | | — | | | | (1,199 | ) | | | — | | | | — | | | | 130 | | | | (1,069 | ) |
| | | | | | | | | | | | | | | | | | | | | | | | |
Total derivative liabilities | | $ | (4 | ) | | $ | (1,613 | ) | | $ | — | | | $ | 374 | | | $ | 137 | | | $ | (1,106 | ) |
| | | | | | | | | | | | | | | | | | | | | | | | |
(1) | Represents the impact of netting commodity derivative assets and liabilities with counterparties where the Company has the contractual right and intends to net settle.
|
ANADARKO PETROLEUM CORPORATION
NOTES TO CONSOLIDATED FINANCIAL STATEMENTS
YEARS ENDED DECEMBER 31, 2011, 2010, AND 2009
10. Derivative Instruments (Continued)
| | | 0000000 | | | | 0000000 | | | | 0000000 | | | | 0000000 | | | | 0000000 | | | | 0000000 | |
| December 31, 2010 | | | | | | | | | | | | | | | | | | | | | | | | |
| millions | | Level 1 | | | Level 2 | | | Level 3 | | | Netting(1) | | | Collateral | | | Total | |
Assets: | | | | | | | | | | | | | | | | | | | | | | | | |
Commodity derivatives | | | | | | | | | | | | | | | | | | | | | | | | |
Financial institutions | | $ | 3 | | | $ | 557 | | | $ | — | | | $ | (298 | ) | | $ | (15 | ) | | $ | 247 | |
Other counterparties | | | — | | | | 241 | | | | — | | | | (148 | ) | | | — | | | | 93 | |
| | | | | | | | | | | | | | | | | | | | | | | | |
Total derivative assets | | $ | 3 | | | $ | 798 | | | $ | — | | | $ | (446 | ) | | $ | (15 | ) | | $ | 340 | |
| | | | | | | | | | | | | | | | | | | | | | | | |
Liabilities: | | | | | | | | | | | | | | | | | | | | | | | | |
Commodity derivatives | | | | | | | | | | | | | | | | | | | | | | | | |
Financial institutions | | $ | (2 | ) | | $ | (333 | ) | | $ | — | | | $ | 298 | | | $ | — | | | $ | (37 | ) |
Other counterparties | | | — | | | | (154 | ) | | | — | | | | 148 | | | | — | | | | (6 | ) |
Interest-rate and other derivatives | | | — | | | | (235 | ) | | | — | | | | — | | | | 15 | | | | (220 | ) |
| | | | | | | | | | | | | | | | | | | | | | | | |
Total derivative liabilities | | $ | (2 | ) | | $ | (722 | ) | | $ | — | | | $ | 446 | | | $ | 15 | | | $ | (263 | ) |
| | | | | | | | | | | | | | | | | | | | | | | | |
(1) | Represents the impact of netting commodity derivative assets and liabilities with counterparties where the Company has the contractual right and intends to net settle.
|
11. Asset Retirement Obligations
The majority of Anadarko’s AROs relate to the plugging of wells and the related abandonment of oil and gas properties. The following provides a rollforward of the Company’s combined short- and long-term AROs. Liabilities settled include settlement payments for obligations, as well as obligations that were assumed by purchasers of divested properties. Revisions to estimated liabilities during the period relate primarily to changes in estimates of asset retirement costs and include, but are not limited to, revisions of estimated inflation rates, changes in property lives, and the expected timing of settlement.
| | | 0000000 | | | | 0000000 | |
| millions | | 2011 | | | 2010 | |
Carrying amount of asset retirement obligations at January 1 | | $ | 1,571 | | | $ | 1,446 | |
Liabilities incurred | | | 39 | | | | 88 | |
Liabilities settled | | | (68 | ) | | | (36 | ) |
Accretion expense | | | 100 | | | | 92 | |
Revisions in estimated liabilities | | | 126 | | | | (19 | ) |
| | | | | | | | |
Carrying amount of asset retirement obligations at December 31(1) | | $ | 1,768 | | | $ | 1,571 | |
| | | | | | | | |
(1) | At December 31, 2011 and 2010, short-term AROs of $31 million and $42 million, respectively, were presented on the Company’s Consolidated Balance Sheets as accrued expenses.
|
ANADARKO PETROLEUM CORPORATION
NOTES TO CONSOLIDATED FINANCIAL STATEMENTS
YEARS ENDED DECEMBER 31, 2011, 2010, AND 2009
12. Debt and Interest Expense
Debt Except for borrowings under the $5.0 billion Facility, all of the Company’s outstanding debt is senior unsecured. SeeNote 9—Investments for disclosure regarding Anadarko’s notes payable related to its ownership of certain noncontrolling mandatorily redeemable interests that are not included in the Company’s reported debt balance and do not affect consolidated interest expense. The following presents the Company’s outstanding debt and capital lease obligations at December 31, 2011 and 2010.
| | | 0000000 | | | | 0000000 | |
| | | December 31, | |
| millions | | 2011 | | | 2010 | |
6.875% Senior Notes due 2011 | | $ | — | | | $ | 285 | |
6.125% Senior Notes due 2012 | | | 131 | | | | 131 | |
5.000% Senior Notes due 2012 | | | 39 | | | | 39 | |
5.750% Senior Notes due 2014 | | | 275 | | | | 275 | |
7.625% Senior Notes due 2014 | | | 500 | | | | 500 | |
5.950% Senior Notes due 2016 | | | 1,750 | | | | 1,750 | |
6.375% Senior Notes due 2017 | | | 2,000 | | | | 2,000 | |
7.050% Debentures due 2018 | | | 114 | | | | 114 | |
6.950% Senior Notes due 2019 | | | 300 | | | | 300 | |
8.700% Senior Notes due 2019 | | | 600 | | | | 600 | |
6.950% Senior Notes due 2024 | | | 650 | | | | 650 | |
7.500% Debentures due 2026 | | | 112 | | | | 112 | |
7.000% Debentures due 2027 | | | 54 | | | | 54 | |
7.125% Debentures due 2027 | | | 150 | | | | 150 | |
6.625% Debentures due 2028 | | | 17 | | | | 17 | |
7.150% Debentures due 2028 | | | 235 | | | | 235 | |
7.200% Debentures due 2029 | | | 135 | | | | 135 | |
7.950% Debentures due 2029 | | | 117 | | | | 117 | |
7.500% Senior Notes due 2031 | | | 900 | | | | 900 | |
7.875% Senior Notes due 2031 | | | 500 | | | | 500 | |
Zero-Coupon Senior Notes due 2036 | | | 2,360 | | | | 2,360 | |
6.450% Senior Notes due 2036 | | | 1,750 | | | | 1,750 | |
7.950% Senior Notes due 2039 | | | 325 | | | | 325 | |
6.200% Senior Notes due 2040 | | | 750 | | | | 750 | |
7.730% Debentures due 2096 | | | 61 | | | | 61 | |
7.500% Debentures due 2096 | | | 78 | | | | 78 | |
7.250% Debentures due 2096 | | | 49 | | | | 49 | |
$5.0 billion Facility | | | 2,500 | | | | — | |
WES borrowings | | | 500 | | | | 299 | |
| | | | | | | | |
Total debt at face value | | $ | 16,952 | | | $ | 14,536 | |
Net unamortized discounts and premiums(1) | | | (1,722 | ) | | | (1,749 | ) |
| | | | | | | | |
Total borrowings | | $ | 15,230 | | | $ | 12,787 | |
| | | | | | | | |
Capital lease obligation | | | — | | | | 226 | |
Less: Current portion of long-term debt | | | 170 | | | | 291 | |
| | | | | | | | |
Total long-term debt | | $ | 15,060 | | | $ | 12,722 | |
| | | | | | | | |
(1) | Unamortized discounts and premiums are amortized over the terms of the related debt.
|
ANADARKO PETROLEUM CORPORATION
NOTES TO CONSOLIDATED FINANCIAL STATEMENTS
YEARS ENDED DECEMBER 31, 2011, 2010, AND 2009
12. Debt and Interest Expense (Continued)
In a 2006 private offering, Anadarko received $500 million of loan proceeds upon issuing the Zero-Coupon Senior Notes due 2036 (Zero Coupons). The Zero Coupons mature in 2036 and have an aggregate principal amount due at maturity of $2.4 billion, reflecting a yield to maturity of 5.24%. The holder has the right to cause the Company to repay an amount up to the then-accreted value of the outstanding Zero Coupons in October of each year starting in 2012. The Zero Coupons are classified as long-term debt on the Consolidated Balance Sheets based on the Company’s ability and intent to refinance the obligations, if the holder requests repayment in 2012.
Fair Value The Company uses a market approach to determine fair value of its fixed-rate debt using observable market data, which results in a Level 2 fair-value measurement. The carrying amount of floating-rate debt approximates fair value as the interest rates are variable and reflective of market rates. As of December 31, 2011 and 2010, the estimated fair value of the Company’s total long-term debt was $17.3 billion and $13.5 billion, respectively.
Debt Activity The following presents the Company’s debt activity for 2011 and 2010.
| | | 000000 | | | 000000 |
| millions | | Carrying
Value | | | Description |
Balance at December 31, 2009 | | $ | 12,748 | | | |
Issuances | | | 2,000 | | | 6.375% Senior Notes due 2017 |
| | | 745 | | | 6.200% Senior Notes due 2040 |
Borrowings | | | 670 | | | WES credit facility and term loan |
Repayments(1) | | | (942 | ) | | 6.750% Senior Notes due 2011 |
| | | (398 | ) | | 6.875% Senior Notes due 2011 |
| | | (38 | ) | | 6.125% Senior Notes due 2012 |
| | | (43 | ) | | 5.000% Senior Notes due 2012 |
| | | (371 | ) | | WES credit facility |
| | | (1,599 | ) | | Midstream Subsidiary Note due 2012 |
Other, net | | | 15 | | | Changes in debt premium or discount |
| | | | | | |
Balance at December 31, 2010 | | $ | 12,787 | | | |
Issuances | | | 494 | | | WES 5.375% Senior Notes due 2021 |
Borrowings | | | 570 | | | WES credit facility |
| | | 2,500 | | | $5.0 billion Facility |
Repayments(1) | | | (869 | ) | | WES credit facility and WES term loan |
| | | (285 | ) | | 6.875% Senior Notes due 2011 |
Other, net | | | 33 | | | Changes in debt premium or discount |
| | | | | | |
Balance at December 31, 2011 | | $ | 15,230 | | | |
| | | | | | |
(1) | Debt repayment activity includes both scheduled repayments and retirements before scheduled maturity.
|
Capital Lease Obligation In the fourth quarter of 2010, a lease commenced for a floating production, storage, and offloading vessel (FPSO) for the Company’s Jubilee field operations in Ghana. In December 2011, the Company and its partners in the Jubilee project purchased the FPSO, resulting in the cancellation of the capital lease obligation.
ANADARKO PETROLEUM CORPORATION
NOTES TO CONSOLIDATED FINANCIAL STATEMENTS
YEARS ENDED DECEMBER 31, 2011, 2010, AND 2009
12. Debt and Interest Expense (Continued)
Anadarko Revolving Credit Facility and Letter of Credit Facility In September 2010, the Company entered into the $5.0 billion Facility maturing in September 2015, and terminated its $1.3 billion revolving credit agreement, scheduled to mature in 2013. During the third quarter of 2011, the Company entered into an agreement with a financial institution to provide up to $400 million of letters of credit (LOC Facility). Compensating balances deposited with the financial institution provide for reduced fees under the LOC Facility. These compensating balances may be withdrawn at any time, resulting in higher fees. Cash and cash equivalents include $328 million of demand deposits serving as compensating balances for outstanding letters of credit at December 31, 2011. The LOC Facility also requires the Company to maintain a senior debt revolving credit facility with minimum commitments of at least $1.0 billion and the availability to issue letters of credit of at least $400 million.
In August 2011, the Company amended the $5.0 billion Facility to reduce the maintenance costs and to lower the interest rates under the facility. Borrowings under the $5.0 billion Facility bear interest at LIBOR plus an applicable margin ranging from 1.25% to 2.50%, depending on the Company’s credit rating, or rates at a margin above the one-month LIBOR, the federal funds rate, or prime rates offered by certain designated banks. The $5.0 billion Facility had outstanding borrowings of $2.5 billion at a rate of 1.79%, with available borrowing capacity of $2.1 billion ($5.0 billion maximum capacity, less $2.5 billion of outstanding borrowings and $400 million of letter-of-credit capacity maintained pursuant to the terms of the LOC Facility) at December 31, 2011.
Obligations incurred under the $5.0 billion Facility, as well as obligations Anadarko has to lenders or their affiliates pursuant to certain derivative instruments (as discussed inNote 10—Derivative Instruments), are guaranteed by certain of the Company’s wholly owned domestic subsidiaries, and are secured by a perfected first-priority security interest in certain exploration and production assets located in the United States and 65% of the capital stock of certain wholly owned foreign subsidiaries. The Company was in compliance with all applicable covenants and there were no restrictions on its ability to utilize the available capacity of the $5.0 billion Facility.
WES Revolving Credit Facility In March 2011, WES entered into a five-year, $800 million senior unsecured revolving credit facility (RCF), which amended and restated the $450 million senior unsecured revolving credit facility. The $800 million RCF matures in March 2016 and bears interest at LIBOR plus an applicable margin ranging from 1.30% to 1.90%, or rates at a margin above the one-month LIBOR, the federal funds rate, or prime rates offered by certain designated banks. WES was in compliance with all covenants contained in the RCF, had no outstanding borrowings under the RCF, and had the full $800 million of RCF borrowing capacity available at December 31, 2011.
Scheduled Maturities Total principal amount of debt maturities for the five years ending December 31, 2016 are shown below and exclude amounts attributable to the potential repayment of the outstanding Zero Coupons that may be put by the holder to the Company annually, starting in 2012, as discussed above.
| | | 0000000 | |
| millions | | Principal
Amount of
Debt Maturities | |
2012 | | $ | 170 | |
2013 | | | — | |
2014 | | | 775 | |
2015 | | | 2,500 | |
2016 | | | 1,750 | |
ANADARKO PETROLEUM CORPORATION
NOTES TO CONSOLIDATED FINANCIAL STATEMENTS
YEARS ENDED DECEMBER 31, 2011, 2010, AND 2009
12. Debt and Interest Expense (Continued)
Interest Expense The following summarizes the amounts included in interest expense.
| | | 0000000 | | | | 0000000 | | | | 0000000 | |
| | | Years Ended December 31, | |
| millions | | 2011 | | | 2010 | | | 2009 | |
Current debt, long-term debt, and other(1) | | $ | 986 | | | $ | 871 | | | $ | 773 | |
(Gain) loss on early debt retirements and commitment termination(2) | | | — | | | | 112 | | | | (2 | ) |
Capitalized interest | | | (147 | ) | | | (128 | ) | | | (69 | ) |
| | | | | | | | | | | | |
Interest expense | | $ | 839 | | | $ | 855 | | | $ | 702 | |
| | | | | | | | | | | | |
(1) | Included in 2009 is the reversal of the $78 million liability for unpaid interest related to the Deepwater Royalty Relief Act (DWRRA) dispute. SeeNote 16—Contingencies.
|
(2) | Loss on early debt retirements in 2010 is the result of repurchasing $1.4 billion aggregate principal amount of debt due 2011 and 2012.
|
13. Stockholders’ Equity
Common Stock In August 2011, the Company terminated a $5.0 billion share-repurchase program under which shares could be repurchased either in the open market or through privately negotiated transactions.
In May 2009, Anadarko completed a public offering of 30 million shares of common stock at $45.50 per share. After deducting the underwriting discount and other offering costs of $28 million, net proceeds of approximately $1.3 billion were used for general corporate purposes, including capital expenditures.
| | | 0000000 | | | | 0000000 | | | | 0000000 | |
| millions | | 2011 | | | 2010 | | | 2009 | |
Shares of common stock issued | | | | | | | | | | | | |
Shares at January 1 | | | 513 | | | | 509 | | | | 476 | |
Issuance of common stock | | | — | | | | — | | | | 30 | |
Exercise of stock options | | | 1 | | | | 2 | | | | 1 | |
Issuance of restricted stock | | | 2 | | | | 2 | | | | 2 | |
| | | | | | | | | | | | |
Shares at December 31 | | | 516 | | | | 513 | | | | 509 | |
| | | | | | | | | | | | |
Shares of common stock held in treasury | | | | | | | | | | | | |
Shares at January 1 | | | 17 | | | | 16 | | | | 16 | |
Shares received for restricted stock vested and options exercised | | | 1 | | | | 1 | | | | — | |
| | | | | | | | | | | | |
Shares at December 31 | | | 18 | | | | 17 | | | | 16 | |
| | | | | | | | | | | | |
| | | | | | | | | | | | |
| | | | | | | | | | | | |
Shares of common stock outstanding at December 31 | | | 498 | | | | 496 | | | | 493 | |
| | | | | | | | | | | | |
ANADARKO PETROLEUM CORPORATION
NOTES TO CONSOLIDATED FINANCIAL STATEMENTS
YEARS ENDED DECEMBER 31, 2011, 2010, AND 2009
13. Stockholders’ Equity (Continued)
Shares of common stock issued and shares of common stock held in treasury presented above include four million shares held by the Anadarko Petroleum Corporation Executives and Directors Benefits Trust, a grantor trust associated with the Company’s obligations under certain of its pension and deferred-compensation plans.
The reconciliation between basic and diluted EPS attributable to common stockholders is as follows:
| | | 0000000 | | | | 0000000 | | | | 0000000 | |
| | | Years Ended December 31, | |
| millions except per-share amounts | | 2011 | | | 2010 | | | 2009 | |
Net income (loss): | | | | | | | | | | | | |
Net income (loss) attributable to common stockholders | | $ | (2,649 | ) | | $ | 761 | | | $ | (135 | ) |
Less: Distributions on participating securities | | | — | | | | 1 | | | | — | |
Less: Undistributed income allocated to participating securities | | | — | | | | 4 | | | | — | |
| | | | | | | | | | | | |
Basic | | $ | (2,649 | ) | | $ | 756 | | | $ | (135 | ) |
| | | | | | | | | | | | |
Diluted | | $ | (2,649 | ) | | $ | 756 | | | $ | (135 | ) |
| | | | | | | | | | | | |
Shares: | | | | | | | | | | | | |
Average number of common shares outstanding—basic | | | 498 | | | | 495 | | | | 480 | |
Dilutive effect of stock options and performance-based stock awards | | | — | | | | 2 | | | | — | |
| | | | | | | | | | | | |
Average number of common shares outstanding—diluted | | | 498 | | | | 497 | | | | 480 | |
| | | | | | | | | | | | |
Excluded(1) | | | 12 | | | | 6 | | | | 14 | |
Net income (loss) per common share: | | | | | | | | | | | | |
Basic | | $ | (5.32 | ) | | $ | 1.53 | | | $ | (0.28 | ) |
Diluted | | $ | (5.32 | ) | | $ | 1.52 | | | $ | (0.28 | ) |
Dividends per common share | | $ | 0.36 | | | $ | 0.36 | | | $ | 0.36 | |
(1) | Inclusion of the average shares for these awards would have an anti-dilutive effect.
|
ANADARKO PETROLEUM CORPORATION
NOTES TO CONSOLIDATED FINANCIAL STATEMENTS
YEARS ENDED DECEMBER 31, 2011, 2010, AND 2009
14. Share-Based Compensation
At December 31, 2011, 15 million shares of the 35 million shares of Anadarko common stock originally authorized for awards under active share-based compensation plans remained available for future issuance. The Company generally issues new shares to satisfy awards under employee share-based payment plans. The number of shares available is reduced by awards granted. A summary of share-based compensation cost is presented below.
| | | 0000000 | | | | 0000000 | | | | 0000000 | |
| | | Years Ended December 31, | |
| millions | | 2011 | | | 2010 | | | 2009 | |
Compensation Cost: | | | | | | | | | | | | |
Equity-Classified Awards: | | | | | | | | | | | | |
Restricted stock | | $ | 80 | | | $ | 103 | | | $ | 138 | |
Stock options | | | 51 | | | | 45 | | | | 36 | |
Performance-based share awards and other | | | 1 | | | | 3 | | | | 11 | |
| | | | | | | | | | | | |
Total Equity-Classified Award Compensation Expense | | | 132 | | | | 151 | | | | 185 | |
| | | |
Liability-Classified Awards: | | | | | | | | | | | | |
Value Creation Plan | | | 26 | | | | — | | | | 104 | |
Performance-based unit awards | | | 28 | | | | 36 | | | | 17 | |
Other performance-based awards | | | 28 | | | | 8 | | | | — | |
Other | | | 1 | | | | 2 | | | | 3 | |
| | | | | | | | | | | | |
Total Liability-Classified Award Compensation Expense | | | 83 | | | | 46 | | | | 124 | |
| | | | | | | | | | | | |
Total Compensation Expense, pretax | | $ | 215 | | | $ | 197 | | | $ | 309 | |
| | | | | | | | | | | | |
Income tax benefit | | $ | 78 | | | $ | 72 | | | $ | 112 | |
For 2011, 2010, and 2009, $(15) million, $26 million, and $12 million, respectively, in excess tax benefits related to share-based compensation were included in cash flows from financing activities. Cash received from stock option exercises for 2011, 2010, and 2009 was $45 million, $78 million, and $22 million, respectively.
Equity-Classified Awards
Restricted Stock Certain employees may be granted restricted stock in the form of restricted stock awards or restricted stock units. Restricted stock is subject to forfeiture restrictions and cannot be sold, transferred, or disposed of during the restriction period. The holders of restricted stock awards have the same rights as a stockholder of the Company with respect to such shares, including the right to vote and receive dividends or other distributions paid with respect to the shares. A restricted stock unit is equivalent to a restricted stock award except that unit holders receive cash dividend equivalents during the restriction period and do not have the right to vote the units. Restricted stock vests over service periods ranging from the date of grant up to four years and is not considered issued and outstanding until it vests.
Nonemployee directors are granted deferred shares that are held in a grantor trust by the Company until payable, generally when the director ceases to serve on the Board of Directors. Directors may receive these shares in a lump-sum payment or in annual installments.
ANADARKO PETROLEUM CORPORATION
NOTES TO CONSOLIDATED FINANCIAL STATEMENTS
YEARS ENDED DECEMBER 31, 2011, 2010, AND 2009
14. Share-Based Compensation (Continued)
A summary of restricted stock activity is presented below.
| | | | | | | | |
| | | | | | Weighted- | |
| | | Shares
(millions) | | | Average
Grant-Date
Fair Value
(per share) | |
Non-vested at January 1, 2011 | | | 2.76 | | | $ | 56.44 | |
Granted | | | 1.34 | | | $ | 81.19 | |
Vested | | | (1.56 | ) | | $ | 56.53 | |
Forfeited | | | (0.07 | ) | | $ | 65.88 | |
| | | | | | | | |
Non-vested at December 31, 2011 | | | 2.47 | | | $ | 69.55 | |
| | | | | | | | |
The weighted-average grant-date fair value per share of restricted stock granted during 2010 and 2009 was $68.51 and $40.65, respectively. The total fair value of restricted shares vested during 2011, 2010, and 2009 was $124 million, $122 million, and $122 million, respectively, based on the market price at the vesting date. At December 31, 2011, $119 million of total unrecognized compensation cost related to restricted stock is expected to be recognized over a weighted-average remaining service period of 2.0 years.
Stock Options Certain employees may be granted options to purchase shares of Anadarko common stock with an exercise price equal to, or greater than, the fair market value of Anadarko common stock on the date of grant. These stock options vest over service periods ranging from three to four years from the date of grant and will terminate at the earlier of the date of exercise, or seven years from the date of grant.
Non-employee directors may be granted nonqualified stock options with an exercise price equal to the fair market value of Anadarko common stock on the date of grant. These stock options vest over a one-year service period from the date of grant and terminate at the earlier of the date of exercise, or ten years from the date of grant.
The fair value of stock option awards is determined using the Black-Scholes option-pricing model. The expected life of an option is estimated based on historical exercise behavior. Expected forfeiture rates are estimated based on historical forfeiture rates. Volatility assumptions are estimated based on expectations of volatility over the expected life of an option as indicated by historical and implied volatility. Risk-free interest rates are based on the U.S. Treasury rate for a term commensurate with the expected life of an option. The dividend yield is based on a 12-month average dividend yield, taking into account the Company’s expected dividend policy over the expected life of an option. The Company used the following weighted-average assumptions to estimate the fair value of stock options granted during 2011, 2010, and 2009.
| | | | | | | | | | | | | | | |
| | | 2011 | | 2010 | | 2009 |
Expected option life—years | | | | 4.8 | | | | | 4.9 | | | | | 4.9 | |
Volatility | | | | 42.0 | % | | | | 43.9 | % | | | | 46.3 | % |
Risk-free interest rate | | | | 1.5 | % | | | | 2.0 | % | | | | 1.9 | % |
Dividend yield | | | | 0.5 | % | | | | 0.7 | % | | | | 0.8 | % |
ANADARKO PETROLEUM CORPORATION
NOTES TO CONSOLIDATED FINANCIAL STATEMENTS
YEARS ENDED DECEMBER 31, 2011, 2010, AND 2009
14. Share-Based Compensation (Continued)
A summary of stock option activity is presented below.
| | | 00000000 | | | | 00000000 | | | | 00000000 | | | | 00000000 | |
| | | Shares
(millions) | | | Weighted-
Average
Exercise
Price
(per share) | | | Weighted-
Average
Remaining
Contractual
Term
(years) | | | Aggregate
Intrinsic
Value
(millions) | |
Outstanding at January 1, 2011 | | | 9.55 | | | $ | 49.15 | | | | | | | | | |
Granted | | | 1.55 | | | $ | 82.39 | | | | | | | | | |
Exercised | | | (1.12 | ) | | $ | 40.25 | | | | | | | | | |
Forfeited or expired | | | (0.11 | ) | | $ | 58.08 | | | | | | | | | |
| | | | | | | | | | | | | | | | |
Outstanding at December 31, 2011 | | | 9.87 | | | $ | 55.27 | | | | 4.46 | | | $ | 217.2 | |
| | | | | | | | | | | | | | | | |
Vested or expected to vest at December 31, 2011 | | | 4.04 | | | $ | 65.36 | | | | 5.50 | | | $ | 53.3 | |
| | | | | | | | | | | | | | | | |
Exercisable at December 31, 2011 | | | 5.68 | | | $ | 47.91 | | | | 3.70 | | | $ | 161.6 | |
| | | | | | | | | | | | | | | | |
The weighted-average grant-date fair value per option of stock options granted during 2011, 2010, and 2009 was $29.77, $26.44, and $15.23, respectively. The total intrinsic value of stock options exercised during 2011, 2010, and 2009 was $45 million, $62 million, and $24 million, respectively, based on the difference between the market price at the exercise date and the exercise price. At December 31, 2011, $71 million of total unrecognized compensation cost related to stock options is expected to be recognized over a weighted-average period of 2.0 years.
Performance-Based Share Awards Certain officers of the Company were provided Performance Unit Award Agreements with performance periods ranging from one to three years. The number of shares of common stock awarded under these agreements is based on a comparison of the Company’s TSR to the TSR of a predetermined group of peer companies over the specified performance period. The agreements provide for issuance of up to a maximum of 934,424 shares of Anadarko common stock. Through December 31, 2011, a total of 521,258 shares were granted, with 386,574 of these shares issued and 134,684 shares deferred pursuant to the agreements. The fair value of the performance-based share awards issued during 2011, 2010, and 2009 was $6 million, $17 million, and $1 million, respectively, based on the market price at the date issued. At December 31, 2011, the Company had no unrecognized compensation cost related to these awards.
Liability-Classified Awards
Value Creation Plan As a part of its employee compensation program, the Company offers an incentive compensation program that generally providesnon-officer employees the opportunity to earn cash bonus awards based on the Company’s TSR for the year, compared to the TSR of a predetermined group of peer companies. At December 31, 2011, 2010, and 2009, the Company had accrued $25 million, zero, and $105 million, respectively, for the 2011, 2010, and 2009 performance periods, respectively.
ANADARKO PETROLEUM CORPORATION
NOTES TO CONSOLIDATED FINANCIAL STATEMENTS
YEARS ENDED DECEMBER 31, 2011, 2010, AND 2009
14. Share-Based Compensation (Continued)
Performance-Based Unit Awards Certain officers of the Company were provided Performance Unit Award Agreements with two- and three-year performance periods. The vesting of these units is based solely on comparing the Company’s TSR to the TSR of a predetermined group of peer companies over the specified performance period. Each performance unit represents the value of one share of the Company’s common stock. At the end of each performance period, the value of the vested performance units, if any, is paid in cash. During 2011, $25 million was paid related to vested performance units. At December 31, 2011, the Company’s liability under Performance Unit Award Agreements was $53 million, with $27 million of total estimated unrecognized compensation cost related to these awards expected to be recognized over a weighted-average, remaining performance period of 1.6 years.
Other Performance-Based Awards Certain officers of the general partner of WES were awarded general partner (GP) Unit Appreciation Rights (UARs) pursuant to the Western Gas Holdings, LLC Equity Incentive Plan. No awards have been granted subsequent to 2010. The vesting restrictions on the UARs lapse over defined performance periods, and the value of vested awards is paid in cash upon exercise by the holder, which is permitted based on defined events. The fair value of the UARs is re-measured periodically based on the estimated fair value of WES’s GP, calculated using a discounted cash flow methodology. At December 31, 2011, the liability attributable to the UARs was $37 million, with $6 million of total estimated unrecognized compensation cost related to these awards expected to be recognized over a weighted-average remaining period of 1.4 years.
15. Commitments
Operating Leases The Company had $2.9 billion in long-term drilling rig commitments that satisfy operating lease criteria. The Company also has various commitments under non-cancelable operating lease agreements of $678 million for production platforms and equipment, buildings, facilities, compressors, and aircraft. These operating leases expire at various dates through 2026. Certain of these operating leases contain residual value guarantees at the end of the lease term, totaling $104 million at December 31, 2011; however, no liability has been accrued for residual value guarantees. Future minimum lease payments under operating leases at December 31, 2011 were as follows:
| | | | |
| millions | | Operating
Leases | |
2012 | | $ | 696 | |
2013 | | | 523 | |
2014 | | | 630 | |
2015 | | | 547 | |
2016 | | | 414 | |
Later years | | | 812 | |
| | | | |
Total future minimum lease payments | | $ | 3,622 | |
| | | | |
Total rent expense, net of sublease income, amounted to $143 million in 2011, $154 million in 2010, and $188 million in 2009. Total rent expense includes contingent rent expense related to processing fees of $21 million, $20 million, and $39 million in 2011, 2010, and 2009, respectively.
ANADARKO PETROLEUM CORPORATION
NOTES TO CONSOLIDATED FINANCIAL STATEMENTS
YEARS ENDED DECEMBER 31, 2011, 2010, AND 2009
15. Commitments (Continued)
Drilling Rig Commitments Anadarko has entered into various agreements to secure drilling rigs necessary to execute its drilling plans over the next several years. The table of future minimum lease payments above includes approximately $2.7 billion related to six offshore drilling vessels and $217 million related to certain contracts for onshore U.S. drilling rigs. Lease payments associated with the drilling of exploratory wells and development wells, net of amounts billed to partners, will initially be capitalized as a component of oil and gas properties, and either depreciated in future periods or written off as exploration expense.
Spar Platform and Production Vessel Leases Anadarko has operating leases related to certain spar platforms in the Gulf of Mexico. The table of future minimum lease payments above includes approximately $395 million for these agreements. These agreements also contain residual value guarantees totaling $37 million at the end of the lease periods.
Other Commitments In the normal course of business, the Company enters into other contractual agreements to purchase natural gas or crude oil, pipeline capacity, storage capacity, utilities, and other services. At December 31, 2011, aggregate future payments under these contracts totaled $6.8 billion, of which $1.6 billion is expected to be paid in 2012, $917 million in 2013, $839 million in 2014, $726 million in 2015, $607 million in 2016, and $2.1 billion thereafter.
16. Contingencies
The following discussion of the Company’s contingencies excludes discussion related to the Deepwater Horizon events. SeeNote 2—Deepwater Horizon Events.
General The Company is a defendant in a number of lawsuits and is involved in governmental proceedings and regulatory controls arising in the ordinary course of business, including, but not limited to, personal injury claims, title disputes, royalty claims, contract claims, oil-field contamination claims, and environmental claims, including claims involving assets owned by predecessors of acquired companies. The Company had accrued $342 million and $114 million at December 31, 2011 and 2010, respectively, related to litigation contingencies. Anadarko is also subject to various environmental-remediation and reclamation obligations arising from federal, state, and local laws and regulations. At December 31, 2011 and 2010, the Company’s Consolidated Balance Sheets include liabilities of $92 million and $96 million, respectively, for remediation and reclamation obligations. The ultimate outcome and impact on the Company cannot be predicted with certainty; however, after consideration of recorded expense and liability accruals, management believes that the resolution of pending proceedings will not have a material adverse effect on the Company’s consolidated financial position, results of operations, or cash flows.
ANADARKO PETROLEUM CORPORATION
NOTES TO CONSOLIDATED FINANCIAL STATEMENTS
YEARS ENDED DECEMBER 31, 2011, 2010, AND 2009
16. Contingencies (Continued)
Tronox Litigation In January 2009, Tronox Incorporated (Tronox), a former subsidiary of Kerr-McGee Corporation (Kerr-McGee), which is a current subsidiary of Anadarko, and certain of Tronox’s subsidiaries filed voluntary petitions for relief under Chapter 11 of the U.S. Bankruptcy Code (the Bankruptcy) in the U.S. Bankruptcy Court for the Southern District of New York (Bankruptcy Court). Subsequently, in May 2009, Tronox and certain of its affiliates filed a lawsuit against Anadarko and Kerr-McGee asserting a number of claims, including claims for actual and constructive fraudulent conveyance (Adversary Proceeding). Tronox alleges, among other things, that it was insolvent or undercapitalized at the time it was spun off from Kerr-McGee and seeks, among other things, to recover damages, including interest, in excess of $14.5 billion from Kerr-McGee and Anadarko, as well as litigation fees and costs. Anadarko and Kerr-McGee moved to dismiss the complaint in its entirety. In March 2010, the Bankruptcy Court issued an opinion granting in part and denying in part Anadarko’s and Kerr-McGee’s motion to dismiss the complaint. Notably, the Bankruptcy Court dismissed, with prejudice, Tronox’s request for punitive damages relating to the fraudulent-conveyance claims. The Bankruptcy Court granted Tronox leave to replead certain of its common law claims, and Tronox filed an amended complaint in April 2010. In May 2010, Anadarko and Kerr-McGee moved to dismiss certain claims in the amended complaint. In May 2011, the Bankruptcy Court dismissed two claims against Anadarko for conspiracy and aiding and abetting, and declined to dismiss a breach of fiduciary duty claim against Kerr-McGee. In August 2011, Tronox filed a motion for partial summary judgment on the issue of whether damages in the Adversary Proceeding are limited to the amount of allowed creditor claims filed in the Bankruptcy. Kerr-McGee and Anadarko filed a response and cross-motion in September 2011 seeking a ruling that Sections 544, 548, and 550 of the Bankruptcy Code limit Tronox’s potential recovery to the value of valid, unpaid creditor claims. In January 2012, the Court granted Tronox’s motion for summary judgment in part and held that Section 550 of the Bankruptcy Code does not impose a cap on Tronox’s potential damages for fraudulent transfer claims. The Court denied Tronox’s motion in part, to the extent Tronox sought a ruling that there are no other limitations on fraudulent conveyance damages. The Court stated that the appropriate measure of damages should only be determined after trial. The parties engaged in mediation in January 2012, but were unable to reach a resolution.
The U.S. government was granted authority to intervene in the Adversary Proceeding, and it has asserted separate claims against Anadarko and Kerr-McGee under the Federal Debt Collection Procedures Act. Anadarko and Kerr-McGee have moved to dismiss the claims of the U.S. government, but that motion has been stayed by the Bankruptcy Court.
In August 2010, the Bankruptcy Court entered a Stipulation and Agreed Order among Tronox, Anadarko, and Kerr-McGee authorizing the rejection of the Master Separation Agreement (together with all annexes, related agreements, and ancillary agreements to it, the MSA). Anadarko and Kerr-McGee filed Proofs of Claim, which included claims for damages arising from the MSA rejection. In January 2011, the Bankruptcy Court entered a Stipulation and Agreed Order approving a settlement of Anadarko and Kerr-McGee’s rejection damage claims against Tronox. The settlement provided Anadarko a general unsecured claim against Tronox. In February 2011, in settlement of its claim, Anadarko received shares of Tronox stock, which were assigned to a financial institution in exchange for $46 million, included as a credit to general and administrative expenses in the Company’s Consolidated Statements of Income for the year ended December 31, 2011.
The Company will continue to monitor the impactMDL and other legal proceedings discussed above as well as federal investigations related to the Deepwater Horizon events. The Company cannot predict the nature of additional evidence that may be discovered during the course of legal proceedings or the timing of completion of any legal proceedings.
Deepwater Horizon and Tronox Derivative Claims In May 2013, an Anadarko shareholder filed a derivative action in the 215th District Court of Harris County, Texas (215th District Court) against Anadarko and certain current and former directors and officers (DWH Derivative Action). The shareholder purported to bring claims on behalf of Anadarko and alleged, among other things, that certain current and former directors and officers breached their fiduciary duty in connection with the Company’s investment in the Macondo lease.
In addition, in April 2014, the Company’s Board of Directors received a letter from a current shareholder demanding that the rejectionBoard undertake an independent investigation of certain current and former officers and directors for alleged breach of fiduciary duty related to the Company’s April 2014 settlement of the MSA may have on other litigation and other proceedings, including theTronox Adversary Proceeding (Tronox Derivative Demand).
In May 2014, the parties reached an agreement to jointly resolve the DWH Derivative Action and will assess the Tronox Derivative Demand in one settlement. In order to achieve the joint settlement, the petition in the DWH Derivative Action was amended to include the allegations asserted in the Tronox Derivative Demand. In August 2014, the 215th District Court approved the settlement. The settlement did not have a material impact of future events on the Company’s consolidated financial position,condition, results of operations, andor cash flows.
ANADARKO PETROLEUM CORPORATION
NOTES TO CONSOLIDATED FINANCIAL STATEMENTS
YEARS ENDED DECEMBER 31, 2011, 2010,2014, 2013, AND 20092012
17. Contingencies16. Contingencies (Continued)
In February 2011, in accordance with Chapter 11 of the U.S. Bankruptcy Code, Tronox emerged from bankruptcy pursuant to an August 2010 Bankruptcy Court approved Plan of Reorganization (Plan). The terms of the Plan, which were confirmed by the Bankruptcy Court in the third quarter of 2010, contemplate that the claims of the U.S. government (together with other federal, state, local, or tribal governmental entities having regulatory authority or responsibilities for environmental laws, the Governmental Entities) related to Tronox’s environmental liabilities will be settled through certain environmental response trusts and a litigation trust (Anadarko Litigation Trust). The Plan provides that the Governmental Entities will receive, among other things, 88% of the proceeds from the Adversary Proceeding. Additionally, certain creditors asserting tort claims against Tronox may receive, among other things, 12% of the proceeds from the Adversary Proceeding. Certain documents central to the Plan and the Adversary Proceeding were approved by the Bankruptcy Court in the fourth quarter of 2010 and in February 2011, including the Environmental Claims Settlement Agreement, the Tort Claims Trust Agreement, the Environmental Response Trust Agreement, and the Anadarko Litigation Trust Agreement (ALTA). In accordance with the Plan, the Adversary Proceeding will be prosecuted by the Anadarko Litigation Trust. Pursuant to the ALTA, the Anadarko Litigation Trust was “deemed substituted” for Tronox in the Adversary Proceeding as the party in such litigation. For purposes of this Form 10-K, references to “Tronox” after February 2011 refer to the Anadarko Litigation Trust.
Discovery, motion practice, and mediation are ongoing in the Adversary Proceeding. The Company’s current estimated loss related to final disposition of the Adversary Proceeding is $250 million, and the Company has recorded a liability for this amount at December 31, 2011. As the Adversary Proceeding progresses, it is reasonably possible for the Company’s current estimate of probable loss related to this matter to change, perhaps materially, because the amount of potential damages depends on circumstances that have not yet occurred, including the outcome of expert testimony and certain trial and pretrial determinations to be made by the Bankruptcy Court. The Company intends to vigorously defend the claims asserted in these proceedings.
In addition, in July 2009, a consolidated class action complaint was filed in the New York District Court on behalf of purported purchasers of Tronox’s equity and debt securities between November 21, 2005, and January 12, 2009 (Class Period), against Anadarko, Kerr-McGee, several former Kerr-McGee officers and directors, several former Tronox officers and directors, and Ernst & Young LLP (Securities Case). The complaint alleges causes of action arising under Sections 10(b) and 20(a) of the Securities Exchange Act of 1934 (Exchange Act) for purported misstatements and omissions regarding, among other things, Tronox’s environmental-remediation and tort-claim liabilities. The plaintiffs allege, among other things, that these purported misstatements and omissions are contained in certain of Tronox’s public filings, including filings made in connection with Tronox’s initial public offering. The plaintiffs seek an unspecified amount of compensatory damages, including interest thereon, as well as litigation fees and costs. Anadarko, Kerr-McGee, and other defendants moved to dismiss the consolidated class action complaint and in August 2010 moved to dismiss an amended consolidated class action complaint that had been filed in July 2010. The New York District Court issued the second of two opinions and orders on the motions (Orders). Following the Orders, only the plaintiffs’ Section 20(a) claims under the Exchange Act remain against Anadarko and Kerr-McGee. The plaintiffs’ claims against Anadarko are limited to the period beginning on August 10, 2006, through the end of the Class Period. In August 2011, plaintiffs filed a motion for class certification. The defendants in the Securities Case filed briefs in opposition to class certification in September 2011. In January 2012, the Court entered a Stipulation and Order pursuant to which plaintiffs agreed to withdraw their motion for class certification without prejudice to resubmit the motion as previously filed.
Based on the Company’s assessment of the current status and merits of the Securities Case, the Company does not consider a loss related to litigation of these matters to be probable. This conclusion considers that the court has not certified a class, no fact discovery has occurred, and no dispositive motions have been filed by the litigants. As the Securities Case progresses, it is reasonably possible the Company’s assessment as to its potential loss could change, perhaps materially. The Company carries Directors’ and Officers’ liability insurance and has notified its insurers as to the status of this litigation. The Company will continue to vigorously defend itself, its officers, and its directors in these proceedings.
ANADARKO PETROLEUM CORPORATIONNOTES TO CONSOLIDATED FINANCIAL STATEMENTS
YEARS ENDED DECEMBER 31, 2011, 2010, AND 2009
16. Contingencies (Continued)
Other LitigationSM Energy alleged that the Company breached a Joint Exploration Agreement (JEA) originally executed between Anadarko and TXCO Energy Corp. (TXCO) in March 2008 relating to an oil and gas development project in Maverick, Dimmitt, Webb, and LaSalle Counties in the Eagleford shale in South Texas. The parties entered into binding arbitration on the matter, and in November 2011, the arbitration panel rendered a final decision in favor of the Company.
In December 2008, Anadarko sold its interest in the Peregrino heavy-oil field offshore Brazil. The Company is currently litigating a dispute with the Brazilian tax authorities regarding the tax rate applicable to the transaction. Currently, $182$128 million, the amount of tax originally in dispute, resides in a judicially controlled Brazilian bank account pending final resolution of the matter.
matter and is included in other assets on the Company’s Consolidated Balance Sheet at December 31, 2014.
In July 2009, the lower judicial court ruled in favor of the Brazilian tax authorities. The Company appealed this decision to the Brazilian Regional courts, which upheld the lower court’s ruling in favor of the Brazilian tax authorities in December 2011.
TheIn April 2012, the Company
will filefiled simultaneous appeals to the Brazilian Superior
courtCourt and the Brazilian Supreme
court.Court. The Brazilian
Superior Court and the Brazilian Supreme
court is not requiredCourt have agreed to hear the
case.case and the Company currently is awaiting the setting of initial hearing dates. In August 2013, following a determination by an administrative court in a related matter that the amount of tax in dispute was not calculated properly, the Company filed a petition requesting the withdrawal of a portion of the judicial deposit to the extent it exceeds $42 million, the amount of tax currently in dispute, and any interest on such amount.
The Company believes that it will more likely than not prevail in Brazilian courts. Therefore, no tax liability has been recorded for Peregrino divestiture-related litigation as of at December 31, 2011. The Company continues to vigorously defend itself in Brazilian courts.2014
Deepwater Drilling Moratorium and Other Related Matters As a result of the moratorium on drilling in the Gulf of Mexico between mid-May 2010 and mid-October 2010 (Moratorium) and additional inspection and safety requirements issued by the Bureau of Ocean Energy Management, Regulation, and Enforcement (BOEMRE), previously known as the Minerals Management Service (MMS), in May and June 2010, the Company provided notification of force majeure to drilling contractors of four of the Company’s contracted deepwater rigs in the Gulf of Mexico. Some of the contracts have provisions that authorize contract termination by either party if force majeure conditions continue for a specified number of consecutive days.In June 2010, the Company gave written notice of termination to the drilling contractor of a rig placed in force majeure in May 2010, and filed a lawsuit in the U.S. District Court for the Southern District of Houston, Texas (Houston, Texas District Court) against the drilling contractor seeking a judicial declaration that the Company’s interpretation of the drilling contract was correct and that the contract terminated on June 19, 2010. The drilling contractor filed an Original Answer in July 2010 denying the Moratorium constituted a force majeure event and asserted that Anadarko had breached the drilling contract. If the Company does not prevail in its claim, the Company could be obligated to pay the rig contract rate from the contract-termination date through March 2011, the end of the original contract term. The disputed rental for the contract period is $116 million; however, any potential damages would be reduced by, among other things, amounts resulting from the drilling contractor’s ability to mitigate damages by leasing the drilling rig to another third party, as well as cost savings realized by the drilling contractor as a result of not operating the drilling rig for the entire original contract period.. The Company continues to vigorously defend its position and will participate with the drilling contractor in court-ordered mediation in February 2012.
Brazilian courts.
Deepwater Royalty Relief Act In 1995, the U.S. Congress passed the Deepwater Royalty Relief Act (DWRRA) to stimulate exploration and production of oil and natural gas by providing relief from the obligation to pay royalties on certain federal leases located in the deep waters of the Gulf of Mexico. The Company currently owns interests in several deepwater Gulf of Mexico leases. After the passage of the DWRRA, the MMS (renamed the BOEMRE as discussed above) inserted price thresholds into leases issued in 1996, 1997, and 2000 that effectively eliminated the DWRRA royalty relief if these price thresholds were exceeded.ANADARKO PETROLEUM CORPORATION
NOTES TO CONSOLIDATED FINANCIAL STATEMENTS
YEARS ENDED DECEMBER 31, 2011, 2010, AND 2009
16. Contingencies (Continued)
In January 2006, the DOI issued an order (2006 Order) to Kerr-McGee Oil and Gas Corporation (KMOG), a subsidiary of Kerr-McGee, to pay oil and gas royalties and accrued interest on KMOG’s deepwater Gulf of Mexico production associated with eight 1996, 1997, and 2000 leases, for which KMOG considered royalties to be suspended under the DWRRA. KMOG successfully appealed the 2006 Order, and the DOI’s petition for a writ of certiorari with the U.S. Supreme Court was denied on October 5, 2009.
In 2009, based on the U.S. Supreme Court’s denial of the DOI’s petition for review by the court, Anadarko reversed its $657 million liability for accrued royalties on leases listed in the 2006 Order, similar orders to pay issued in 2008 and 2009, and other deepwater Gulf of Mexico leases with similar price-threshold provisions. The Company’s accrued liability of $657 million related to royalties on production from January 2003 through September 2009, and included $165 million related to pre-acquisition contingencies recorded as part of the Company’s 2006 acquisition of Kerr-McGee. In addition, the Company reversed its $78 million accrued liability for interest on these unpaid royalty amounts, substantially all of which related to post-acquisition periods.
The MMS issued two additional orders to Anadarko in 2008 and 2009 to pay “past-due” royalties and interest covering several deepwater Gulf of Mexico leases. Anadarko filed administrative appeals with the MMS for the 2008 and 2009 orders (which were stayed pending a final non-appealable judgment relating to the 2006 Order). As a result of the Supreme Court’s denial of certiorari, the MMS notified Anadarko on February 25, 2010 that the 2008 and 2009 orders had been withdrawn.
Guarantees and Indemnifications Under the terms of the MSA entered into between Kerr-McGee and Tronox, Kerr-McGee agreed to reimburse Tronox for 50% of certain qualifying environmental-remediation costs incurred and paid by Tronox and its subsidiaries before November 28, 2012, subject to certain limitations and conditions. The reimbursement obligation under the MSA was limited to a maximum aggregate reimbursement of $100 million. During 2010, the Company reversed to non-operating income a $95 million liability recorded for this reimbursement obligation as a result of a court-authorized rejection of the MSA. SeeTronox Litigation section of this note.
The Company also provides certain indemnifications in relation to asset dispositions. These indemnifications typically relate to disputes, litigation, or tax matters existing at the date of disposition. No material liabilitiesIn 2013, as a result of a Chapter 11 bankruptcy declaration by a third party, the DOI ordered Anadarko to perform the decommissioning of a production facility and related wells, which were recorded forpreviously sold to the third party. During 2013, the Company accrued costs of $117 million to decommission the production facility and related wells, reported in other (income) expense, net in the Consolidated Statement of Income. During 2014, the Company recognized a $22 million increase in the estimated decommissioning costs. Anadarko completed decommissioning of the production facility in 2014 and expects to complete decommissioning of the wells in 2015. Decommissioning obligations of $114 million were included in accrued expenses on the Consolidated Balance Sheet at December 31, 2014. Actual costs may vary from this estimate; however, the Company does not believe that any such indemnificationschange will materially impact its financial condition, results of operations, or cash flows.
Environmental Matters Anadarko is also subject to various environmental-remediation and reclamation obligations arising from federal, state, and local laws and regulations. The Company’s Consolidated Balance Sheets include liabilities for remediation and reclamation obligations of $126 million at December 31, 2014 and December 31, 2013. The current portion of these amounts was included in accounts payable and the long-term portion of these amounts was included in other long-term liabilities—other on the Company’s Consolidated Balance Sheets. The Company continually monitors remediation and reclamation processes and adjusts its liability for these obligations as necessary.
The Company is one of numerous parties previously notified by the California Department of Toxic Substances Control (DTSC) that, as a result of a prior acquisition, it is a potentially responsible party with respect to a landfill located in West Covina, California. While no agreement is in place with the DTSC, the Company recorded a $50 million restoration liability in 2013 with respect to the site, representing the current estimated obligation, which is included in the Company’s liability balance at December 31,
2011.17. Other Taxes
Taxes incurred, other than income taxes,2014. The Company could incur additional obligations if any of the potentially responsible parties are as follows:
| | | $1,094 | | | | $1,094 | | | | $1,094 | |
| | | Years Ended December 31, | |
| millions | | 2011 | | | 2010 | | | 2009 | |
Production and severance | | $ | 1,094 | | | $ | 770 | | | $ | 523 | |
Ad valorem | | | 265 | | | | 219 | | | | 189 | |
Other | | | 133 | | | | 79 | | | | 34 | |
| | | | | | | | | | | | |
Total | | $ | 1,492 | | | $ | 1,068 | | | $ | 746 | |
| | | | | | | | | | | | |
ultimately not able to fund their allocated share of the costs or if the DTSC requires a more costly remedial approach. It is possible that the Company’s current estimate of probable loss related to this matter could change, perhaps materially, in the future.
ANADARKO PETROLEUM CORPORATION
NOTES TO CONSOLIDATED FINANCIAL STATEMENTS
YEARS ENDED DECEMBER 31,
2011, 2010,2014, 2013, AND
200917. Other Taxes (Continued)
In 2006, the Algerian parliament approved legislation and implementing regulations establishing an exceptional profits tax on foreign companies’ Algerian oil production. These provisions provide for an exceptional profits tax imposed on gross production at rates of taxation ranging from 5% to 50% based on average daily production volumes for each calendar month in which the price of Brent crude averages over $30 per barrel, retroactively effective to August-2006 production. Exceptional profits tax applies to the full value of production rather than to the production value in excess of $30 per barrel. On this measurement basis, the Company recognized production tax expense of $680 million, $508 million, and $379 million for 2011, 2010, and 2009, respectively.
In response to the Algerian government’s imposition of the exceptional profits tax, the Company has notified Sonatrach of its disagreement with the collection of the exceptional profits tax. The Company believes that the Production Sharing Agreement (PSA) provides fiscal stability through several provisions that require Sonatrach to pay all taxes and royalties. To facilitate discussions between the parties in an effort to resolve the dispute, in October 2007 the Company initiated a conciliation proceeding on the exceptional profits tax as provided in the PSA. Any recommendation issued by a conciliation board (Conciliation Board) arising out of the conciliation proceeding is non-binding on the parties. The Conciliation Board issued its non-binding recommendation in November 2008. In February 2009, the Company initiated arbitration against Sonatrach with regard to the exceptional profits tax. In accordance with the terms of the PSA, a notice of arbitration was submitted to Sonatrach. The arbitration hearing on the merits of the claims presented by Anadarko was held in June 2011. Any decision issued by the arbitration panel is binding on the parties. Although the Company cannot reasonably determine the timing of a decision by the arbitration panel, the Company anticipates a decision in the near term.
2012
18. Income Taxes
Components
The following summarizes components of income tax expense (benefit)
are as follows: | | | $(1,453) | | | | $(1,453) | | | | $(1,453) | |
| | | Years Ended December 31, | |
| millions | | 2011 | | | 2010 | | | 2009 | |
Current | | | | | | | | | | | | |
Federal | | $ | (381 | ) | | $ | 305 | | | $ | (233 | ) |
State | | | 1 | | | | 18 | | | | (13 | ) |
Foreign | | | 977 | | | | 628 | | | | 409 | |
| | | | | | | | | | | | |
Total | | | 597 | | | | 951 | | | | 163 | |
| | | | | | | | | | | | |
Deferred | | | | | | | | | | | | |
Federal | | | (1,470 | ) | | | (72 | ) | | | (25 | ) |
State | | | (68 | ) | | | (11 | ) | | | (91 | ) |
Foreign | | | 85 | | | | (48 | ) | | | (52 | ) |
| | | | | | | | | | | | |
Total | | | (1,453 | ) | | | (131 | ) | | | (168 | ) |
| | | | | | | | | | | | |
Total income tax expense (benefit) | | $ | (856 | ) | | $ | 820 | | | $ | (5 | ) |
| | | | | | | | | | | | |
ANADARKO PETROLEUM CORPORATION
NOTES TO CONSOLIDATED FINANCIAL STATEMENTS
YEARS ENDED DECEMBER 31, 2011, 2010, AND 2009
18. Income Taxes (Continued)
for the years ended December 31:
|
| | | | | | | | | | | |
| millions | 2014 | | 2013 | | 2012 |
| Current | | | | | |
| Federal | $ | 188 |
| | $ | 113 |
| | $ | 45 |
|
| State | 2 |
| | 42 |
| | 25 |
|
| Foreign | 1,574 |
| | 873 |
| | 891 |
|
| | 1,764 |
| | 1,028 |
| | 961 |
|
| Deferred | | | | | |
| Federal | (389 | ) | | 94 |
| | (30 | ) |
| State | 27 |
| | (9 | ) | | 115 |
|
| Foreign | 215 |
| | 52 |
| | 74 |
|
| | (147 | ) | | 137 |
| | 159 |
|
| Total income tax expense (benefit) | $ | 1,617 |
| | $ | 1,165 |
| | $ | 1,120 |
|
Total income taxes differed from the amounts computed by applying the U.S. federal statutory income tax rate to income (loss) before income taxes. The
following summarizes the sources of these differences
are as follows: | | | | | | | | | | | | | | | |
| | | Years Ended December 31, |
| millions except percentages | | 2011 | | 2010 | | 2009 |
Income (loss) before income taxes | | | | | | | | | | | | | | | |
Domestic | | | $ | (5,416 | ) | | | $ | 855 | | | | $ | (660 | ) |
Foreign | | | | 1,992 | | | | | 786 | | | | | 552 | |
| | | | | | | | | | | | | | | |
Total | | | $ | (3,424 | ) | | | $ | 1,641 | | | | $ | (108 | ) |
| | | | | | | | | | | | | | | |
U.S. federal statutory tax rate | | | | 35% | | | | | 35% | | | | | 35% | |
Tax computed at the U.S. federal statutory rate | | | $ | (1,198 | ) | | | $ | 574 | | | | $ | (38 | ) |
Adjustments resulting from: | | | | | | | | | | | | | | | |
State income taxes (net of federal income tax benefit) | | | | (44 | ) | | | | 5 | | | | | (68 | ) |
Foreign tax rate differential and valuation allowances | | | | 58 | | | | | 115 | | | | | 46 | |
Non-deductible Algerian exceptional profits tax | | | | 258 | | | | | 193 | | | | | 144 | |
U.S. tax on foreign income inclusions and distributions | | | | 20 | | | | | 22 | | | | | 119 | |
Excess U.S. foreign tax credit generated | | | | — | | | | | — | | | | | (8 | ) |
U.S. tax impact from losses and restructuring of foreign operations | | | | (24 | ) | | | | (48 | ) | | | | (94 | ) |
Net changes in uncertain tax positions | | | | 8 | | | | | 28 | | | | | (110 | ) |
Federal manufacturing deduction | | | | — | | | | | (23 | ) | | | | 19 | |
Items resulting from business acquisitions | | | | 19 | | | | | — | | | | | — | |
Other—net | | | | 47 | | | | | (46 | ) | | | | (15 | ) |
| | | | | | | | | | | | | | | |
Total income tax expense (benefit) | | | $ | (856 | ) | | | $ | 820 | | | | $ | (5 | ) |
| | | | | | | | | | | | | | | |
Effective tax rate | | | | 25% | | | | | 50% | | | | | 5% | |
| | | | | | | | | | | | | | | |
Certain tax effects related to internal restructuringfor the years ended December 31:
|
| | | | | | | | | | | |
| millions except percentages | 2014 | | 2013 | | 2012 |
| Income (loss) before income taxes | | | | | |
| Domestic | $ | (3,564 | ) | | $ | 428 |
| | $ | 132 |
|
| Foreign | 3,618 |
| | 1,678 |
| | 3,433 |
|
| Total | $ | 54 |
| | $ | 2,106 |
| | $ | 3,565 |
|
| U.S. federal statutory tax rate | 35 | % | | 35 | % | | 35 | % |
| Tax computed at the U.S. federal statutory rate | $ | 19 |
| | $ | 737 |
| | $ | 1,248 |
|
| Adjustments resulting from | | | | | |
| State income taxes (net of federal income tax benefit) | (11 | ) | | 23 |
| | 93 |
|
| Tax impact from foreign operations | 62 |
| | 204 |
| | 215 |
|
| Non-deductible Algerian exceptional profits tax | 193 |
| | 144 |
| | 188 |
|
| Non-taxable Algeria exceptional profits tax settlement | — |
| | 13 |
| | (679 | ) |
| Net changes in uncertain tax positions | 1,427 |
| | (29 | ) | | 28 |
|
| Deferred tax adjustments | 15 |
| | 76 |
| | 22 |
|
| Non-deductible Tronox-related contingent loss | (36 | ) | | 36 |
| | — |
|
| Income attributable to noncontrolling interests | (66 | ) | | (48 | ) | | (24 | ) |
| Non-deductible Deepwater Horizon settlement | 32 |
| | — |
| | — |
|
| Federal manufacturing deduction | (27 | ) | | — |
| | — |
|
| Non-deductible goodwill | 21 |
| | — |
| | 15 |
|
| Other—net | (12 | ) | | 9 |
| | 14 |
|
| Total income tax expense (benefit) | $ | 1,617 |
| | $ | 1,165 |
| | $ | 1,120 |
|
| Effective tax rate | 2,994 | % | | 55 | % | | 31 | % |
Table of certain foreign and domestic operations have been recorded to other long-term assets or other long-term liabilities and are being recognized in the Consolidated Statements of Income as income tax expense (benefit) over the estimated life of the related properties. During 2011, 2010, and 2009, $55 million, $42 million, and $54 million, respectively, of the net liabilities recorded in prior years were reversed to income tax benefit. At December 31, 2011 and 2010, the balance related to the restructuring of certain foreign and domestic operations was $10 million in other long-term assets and $51 million in other long-term liabilities, respectively.Components of total deferred taxes are as follows:
| | | $(8,341) | | | | $(8,341) | |
| | | December 31, | |
| millions | | 2011 | | | 2010 | |
Federal | | $ | (7,916 | ) | | $ | (9,365 | ) |
State, net of federal | | | (252 | ) | | | (297 | ) |
Foreign | | | (173 | ) | | | (88 | ) |
| | | | | | | | |
Total deferred taxes | | $ | (8,341 | ) | | $ | (9,750 | ) |
| | | | | | | | |
Contents
ANADARKO PETROLEUM CORPORATION
NOTES TO CONSOLIDATED FINANCIAL STATEMENTS
YEARS ENDED DECEMBER 31,
2011, 2010,2014, 2013, AND
20092012
18. Income Taxes (Continued)
The following summarizes components of total deferred taxes at December 31:
|
| | | | | | | |
| millions | 2014 | | 2013 |
| Federal | $ | (7,649 | ) | | $ | (8,246 | ) |
| State, net of federal | (341 | ) | | (332 | ) |
| Foreign | (537 | ) | | (307 | ) |
| Total deferred taxes | $ | (8,527 | ) | | $ | (8,885 | ) |
The following summarizes tax effects of temporary differences that give rise to significant portions of the deferred tax assets (liabilities)
are as follows: | | | $(8,341) | | | | $(8,341) | |
| | | December 31, | |
| millions | | 2011 | | | 2010 | |
Net current deferred tax assets | | $ | 138 | | | $ | 78 | |
| | | | | | | | |
Net long-term deferred tax assets | | | — | | | | 33 | |
| | | | | | | | |
Oil and gas exploration and development operations | | | (8,187 | ) | | | (8,577 | ) |
Mineral operations | | | (407 | ) | | | (414 | ) |
Midstream and other depreciable properties | | | (1,264 | ) | | | (1,314 | ) |
Other | | | (1 | ) | | | (49 | ) |
| | | | | | | | |
Gross long-term deferred tax liabilities | | | (9,859 | ) | | | (10,354 | ) |
| | | | | | | | |
Oil and gas exploration and development costs | | | 127 | | | | 253 | |
Net operating loss carryforward | | | 1,071 | | | | 311 | |
Foreign tax credit carryforward | | | 119 | | | | 11 | |
Other | | | 618 | | | | 372 | |
| | | | | | | | |
Gross long-term deferred tax assets | | | 1,935 | | | | 947 | |
Less: valuation allowances on deferred tax assets not expected to be realized | | | (555 | ) | | | (454 | ) |
| | | | | | | | |
Net long-term deferred tax assets | | | 1,380 | | | | 493 | |
| | | | | | | | |
Net long-term deferred tax liabilities | | | (8,479 | ) | | | (9,861 | ) |
| | | | | | | | |
Total deferred taxes | | $ | (8,341 | ) | | $ | (9,750 | ) |
| | | | | | | | |
at December 31:
|
| | | | | | | |
| millions | 2014 | | 2013 |
| Current deferred tax assets | $ | 210 |
| | $ | 412 |
|
| Settlement agreement related to the Tronox Adversary Proceeding | 590 |
| | — |
|
| Valuation allowances on deferred tax assets not expected to be realized | (78 | ) | | (52 | ) |
| Net current deferred tax assets | 722 |
| | 360 |
|
| Oil and gas exploration and development operations | (8,418 | ) | | (8,213 | ) |
| Mineral operations | (412 | ) | | (410 | ) |
| Midstream and other depreciable properties | (1,611 | ) | | (1,586 | ) |
| Other | (351 | ) | | (499 | ) |
| Gross long-term deferred tax liabilities | (10,792 | ) | | (10,708 | ) |
| Oil and gas exploration and development costs | 177 |
| | 94 |
|
| Net operating loss carryforward | 558 |
| | 599 |
|
| Foreign tax credit carryforward and alternative minimum tax credit carryforward | 166 |
| | 325 |
|
| Other | 1,428 |
| | 1,211 |
|
| Gross long-term deferred tax assets | 2,329 |
| | 2,229 |
|
| Valuation allowances on deferred tax assets not expected to be realized | (786 | ) | | (766 | ) |
| Net long-term deferred tax assets | 1,543 |
| | 1,463 |
|
| Net long-term deferred tax liabilities | (9,249 | ) | | (9,245 | ) |
| Total deferred taxes | $ | (8,527 | ) | | $ | (8,885 | ) |
Changes to valuation allowances, due to changes in judgment regarding the future realizability of deferred tax assets, were a decrease of $17 million and an increase of $24$2 million for 2011 in 2013 and 2010, respectively. Changes$23 million in 2012. There were no changes to valuation allowances due to changes in judgment regarding the future realizability of deferred tax assets in 2014.
The following summarizes changes in the balance of valuation allowances on deferred tax
assets are as follows: | | | $(454) | | | | $(454) | | | | $(454) | |
| millions | | 2011 | | | 2010 | | | 2009 | |
Balance at January 1 | | $ | (454 | ) | | $ | (418 | ) | | $ | (509 | ) |
Additions | | | (138 | ) | | | (49 | ) | | | (3 | ) |
Reductions | | | 37 | | | | 13 | | | | 94 | |
| | | | | | | | | | | | |
Balance at December 31 | | $ | (555 | ) | | $ | (454 | ) | | $ | (418 | ) |
| | | | | | | | | | | | |
assets:
|
| | | | | | | | | | | |
| millions | 2014 | | 2013 | | 2012 |
| Balance at January 1 | $ | (818 | ) | | $ | (922 | ) | | $ | (555 | ) |
| Additions | (59 | ) | | (38 | ) | | (426 | ) |
| Reductions | 13 |
| | 142 |
| | 59 |
|
| Balance at December 31 | $ | (864 | ) | | $ | (818 | ) | | $ | (922 | ) |
ANADARKO PETROLEUM CORPORATION
NOTES TO CONSOLIDATED FINANCIAL STATEMENTS
YEARS ENDED DECEMBER 31, 2014, 2013, AND 2012
18. Income Taxes (Continued)
The following summarizes taxes receivable (payable) related to income tax expense (benefit)
are as follows: | | $597 | | | $597 | | | | $597 | |
| | | Balance Sheet Classification | | December 31, | |
| millions | | | 2011 | | | 2010 | |
Income taxes receivable | | Accounts receivable—other | | $ | 597 | | | $ | 47 | |
| | Other assets | | | 2 | | | | 5 | |
| | | | | | | | | | |
Total income taxes receivable | | | | | 599 | | | | 52 | |
| | | | | | | | | | |
Income taxes payable | | Accrued expense | | | (248 | ) | | | (198 | ) |
| | | | | | | | | | |
Total income taxes receivable (payable) | | | | $ | 351 | | | $ | (146 | ) |
| | | | | | | | | | |
at December 31:
|
| | | | | | | | |
| Balance Sheet Classification | | 2014 | | 2013 |
| Income taxes receivable | | | | |
| Accounts receivable—other | | $ | 93 |
| | $ | 66 |
|
| Other assets | | 35 |
| | 35 |
|
| | | 128 |
| | 101 |
|
| Income taxes (payable) | | | | |
| Accrued expense | | (152 | ) | | (82 | ) |
| Total net income taxes receivable (payable) | | $ | (24 | ) | | $ | 19 |
|
ANADARKO PETROLEUM CORPORATIONNOTES TO CONSOLIDATED FINANCIAL STATEMENTS
YEARS ENDED DECEMBER 31, 2011, 2010, AND 2009
18. Income Taxes (Continued)
Tax carryforwards available for use on future income tax returns at December 31, 2011,2014, were as follows:
| | | | | | | | | | | | |
| millions | | Domestic | | | Foreign | | | Expiration | |
Net operating loss—federal | | $ | 1,728 | | | $ | — | | | | 2031 | |
Net operating loss—foreign | | $ | — | | | $ | 825 | | | | 2016 - indefinite | |
Net operating loss—state | | $ | 4,609 | | | $ | — | | | | 2012-2030 | |
Foreign tax credits | | $ | 119 | | | $ | — | | | | 2015-2021 | |
Charitable contribution | | $ | 27 | | | $ | — | | | | 2016 | |
Texas margins tax credit | | $ | 37 | | | $ | — | | | | 2026 | |
|
| | | | | | | | | |
| millions | Domestic | | Foreign | | Expiration |
| Net operating loss—foreign | $ | — |
| | $ | 1,165 |
| | 2015 - Indefinite |
| Net operating loss—state | $ | 4,477 |
| | $ | — |
| | 2015-2034 |
| Foreign tax credits | $ | 167 |
| | $ | — |
| | 2022-2023 |
| Texas margins tax credit | $ | 34 |
| | $ | — |
| | 2026 |
Changes in the balance of unrecognized tax benefits excluding interest and penalties on uncertain tax positions
arewere as follows:
| | | $(132) | | | | $(132) | | | | $(132) | |
| | | Assets (Liabilities) | |
| millions | | 2011 | | | 2010 | | | 2009 | |
Balance at January 1 | | $ | (32 | ) | | $ | (29 | ) | | $ | (132 | ) |
Increases related to prior-year tax positions | | | — | | | | (13 | ) | | | (17 | ) |
Decreases related to prior-year tax positions | | | 3 | | | | 8 | | | | 89 | |
Increases related to current-year tax positions | | | (10 | ) | | | — | | | | (6 | ) |
Decreases related to current-year tax positions | | | — | | | | — | | | | 8 | |
Settlements | | | 8 | | | | 2 | | | | 29 | |
| | | | | | | | | | | | |
Balance at December 31 | | $ | (31 | ) | | $ | (32 | ) | | $ | (29 | ) |
| | | | | | | | | | | | |
|
| | | | | | | | | | | |
| | Assets (Liabilities) |
| millions | 2014 | | 2013 | | 2012 |
| Balance at January 1 | $ | (147 | ) | | $ | (46 | ) | | $ | (31 | ) |
| Increases related to prior-year tax positions | (11 | ) | | (54 | ) | | (17 | ) |
| Decreases related to prior-year tax positions | 39 |
| | 3 |
| | 3 |
|
| Increases related to current-year tax positions | (1,568 | ) | | (72 | ) | | (1 | ) |
| Settlements | — |
| | 5 |
| | — |
|
| Lapse of statute of limitations | — |
| | 17 |
| | — |
|
| Balance at December 31 | $ | (1,687 | ) | | $ | (147 | ) | | $ | (46 | ) |
Included in the 20112014 ending balance of unrecognized tax benefits presented above are potential benefits of $(22) million that$1.679 billion, of which, if recognized, $1.456 billion would affect the effective tax rate on income, if recognized.and $188 million would be in the form of tax credits and net operating loss carryforwards that would attract a full valuation allowance. Also included in the 20112014 ending balance are benefits of $(9)$8 million related to tax positions for which the ultimate deductibility is highly certain, but the timing of such deductibility is uncertain.
ANADARKO PETROLEUM CORPORATION
NOTES TO CONSOLIDATED FINANCIAL STATEMENTS
YEARS ENDED DECEMBER 31, 2014, 2013, AND 2012
18. Income Taxes (Continued)
In 2013, the Company recognized a deferred tax benefit of $274 million related to the $850 million loss for the Tronox-related contingent liability. In 2014, the Company recognized a deferred tax benefit of $316 million related to the additional $4.360 billion loss for the Tronox-related contingent liability. The total deferred tax benefit of $590 million is net of a $1.326 billion uncertain tax position due to the uncertainty related to the deductibility of the settlement payment. This uncertain tax position is presented in deferred income taxes and as a reduction to the associated deferred tax asset. The Company is a participant in the U.S. Internal Revenue Service’s (IRS) Compliance Assurance Process and has regular discussions with the IRS concerning the Company’s tax positions. Depending on the outcome of such discussions, it is reasonably possible that the amount of the uncertain tax position related to the settlement could change, perhaps materially. See Note 17—Contingencies—Tronox Litigation.
Income tax audits and the Company’s acquisition and divestiture activity have given rise to tax disputes in U.S. and foreign jurisdictions. See Note 17—Contingencies—Other Litigation. The Company estimates that $(5)$120 million to $(14)$130 million of unrecognized tax benefits related to adjustments to taxable income and credits previously recorded pursuant to the accounting standard for accounting for tax uncertainties will reverse within the next 12 months due to expiration of statutes of limitation and audit settlements.At December 31, 2011 Management does not believe that the final resolution of outstanding tax audits and 2010,litigation will have a material adverse effect on the Company’s consolidated financial condition, results of operations, or cash flows.
The Company had accrued approximately $18$9 million and $26 million, respectively, of accrued interest related to uncertain tax positions. During 2011positions at December 31, 2014, and 2010, the$8 million at December 31, 2013. The Company recognized $(8) millioninterest and $12 million, respectively,penalties in income tax expense (benefit) for interestof $1 million during 2014 and penalties.$(20) million during 2013. Anadarko is subject to audit by tax authorities in the U.S. federal, state, and local tax jurisdictions as well as in various foreign jurisdictions. The Company is currently under routine examination by the U.S. Internal Revenue ServiceIRS for the tax years 2010 and 2011.Income tax audits and the Company’s acquisition and divestiture activity have given rise to tax disputes in U.S. and foreign jurisdictions. SeeNote 16—Contingencies—Other Litigation. Management does not believe that the final resolution of outstanding tax audits and litigation will have a material adverse effect on the Company’s consolidated financial position, results of operations, or cash flows.2008ANADARKO PETROLEUM CORPORATION through
NOTES TO CONSOLIDATED FINANCIAL STATEMENTS2014
YEARS ENDED DECEMBER 31, 2011, 2010, AND 2009.
18. Income Taxes (Continued)
The following
is a list oflists the tax years subject to examination by major tax
jurisdiction.jurisdiction: | | |
| |
| | | Tax Year | Years |
United States | | | 2008-2011 | 2008-2014 |
China
Algeria | | | 2006-2010 | 2011-2014 |
Algeria
Ghana | | | 2008-2010 | |
Ghana
| | | 2006-2010 | 2006-2014 |
ANADARKO PETROLEUM CORPORATION
NOTES TO CONSOLIDATED FINANCIAL STATEMENTS
YEARS ENDED DECEMBER 31, 2014, 2013, AND 2012
19. Supplemental Cash Flow Information
The following
presentssummarizes cash paid
(received) for interest
(net of amounts capitalized) and income taxes, as well as non-cash investing and financing
transactions. | | | | | | | | | | | | |
| | | Years Ended December 31, | |
| millions | | 2011 | | | 2010 | | | 2009 | |
Cash paid: | | | | | | | | | | | | |
Interest | | $ | 806 | | | $ | 672 | | | $ | 724 | |
Income taxes | | $ | 262 | | | $ | 308 | | | $ | 194 | |
Non-cash investing activities: | | | | | | | | | | | | |
Fair value of properties and equipment received in
non-cash exchange transactions | | $ | 19 | | | $ | 37 | | | $ | 280 | |
Gain related to the fair-value remeasurement of Anadarko’s
pre-acquisition 7% equity interest in the Wattenberg Plant | | $ | 21 | | | $ | — | | | $ | — | |
Non-cash financing activities: | | | | | | | | | | | | |
Capital lease obligation | | $ | (118 | ) | | $ | 226 | | | $ | — | |
activities for the years ended December 31:
|
| | | | | | | | | | | |
| millions | 2014 | | 2013 | | 2012 |
| Cash paid (received) | | | | | |
| Interest, net of amounts capitalized | $ | 689 |
| | $ | 627 |
| | $ | 684 |
|
| Income taxes, net of refunds | 956 |
| | 169 |
| | (300 | ) |
| Non-cash investing activities | | | | | |
| Fair value of properties and equipment from non-cash transactions | $ | 18 |
| | $ | 62 |
| | $ | 65 |
|
| Asset retirement cost additions | 348 |
| | 297 |
| | 142 |
|
| Accruals of property, plant, and equipment | 1,156 |
| | 1,446 |
| | 1,205 |
|
| Net liabilities assumed or divested in acquisitions and divestitures | (92 | ) | | (80 | ) | | (34 | ) |
| Non-cash investing and financing activities | | | | | |
| Capital lease obligation | $ | 13 |
| | $ | 8 |
| | $ | — |
|
Floating production, storage, and offloading vessel construction period obligation | 149 |
| | 17 |
| | — |
|
Anadarko’s primary business segments are vertically integrated within the oil and gas industry. These segments are separately managed due to distinct operational differences and unique technology, distribution, and marketing requirements. The Company’s three reporting segments are oil and gas exploration and production, midstream, and marketing. The oil and gas exploration and production segment explores for and produces natural gas, crude oil, condensate, and NGLs.NGLs, and plans for the development and operation of the Company’s LNG project in Mozambique. The midstream segment engages in gathering, processing, treating, and transporting Anadarko and third-party oil, natural-gas, and NGLs production. The marketingmidstream reporting segment sells mostconsists of Anadarko’s production, as well as third-party purchased volumes.During the first quarter of 2011, the chief operating decision maker (CODM) began separately assessing the performance of, and resource allocation to, the WES operating segment. As a result, the midstream operating segment was separated into
two operating segments, WES and other midstream, activities. The WES and other midstream activities operating segmentswhich are aggregated into a single midstreamone reporting segment due to similar financial and operating characteristics. The marketing segment sells much of Anadarko’s oil, natural-gas, and NGLs production, as well as third-party purchased volumes.
ANADARKO PETROLEUM CORPORATION
NOTES TO CONSOLIDATED FINANCIAL STATEMENTS
YEARS ENDED DECEMBER 31,
2011, 2010,2014, 2013, AND
20092012
20. Segment Information (Continued)
To assess the performance of Anadarko’s operating segments, the CODMchief operating decision maker analyzes Adjusted EBITDAX. The Company defines Adjusted EBITDAX as income (loss) before income taxes,taxes; exploration expense; DD&A; impairments; interest expense, exploration expense, DD&A, impairments, Deepwater Horizon settlement and related costs, and unrealizedexpense; total (gains) losses on derivatives, net, less net cash from settlement of commodity derivatives; and certain items not related to the Company’s normal operations, less net income attributable to noncontrolling interests (Adjusted EBITDAX).interests. During the periods presented, items not related to the Company’s normal operations included Deepwater Horizon settlement and related costs, Algeria exceptional profits tax settlement, Tronox-related contingent loss, and certain other nonoperating items included in other (income) expense, net. The Company’s definition of Adjusted EBITDAX excludes interest expense to allow for assessment of segment operating results without regard to Anadarko’s financing methods or capital structure. Adjusted EBITDAX also excludes exploration expense as it is not an indicator of operating efficiency for a given reporting period. However, exploration expense is monitored by management as part of costs incurred in exploration and development activities. Similarly, DD&A and impairments are excluded from Adjusted EBITDAX as a measure of segment operating performance because capital expenditures are evaluated at the time capital costs are incurred. Anadarko’s definition of Adjusted EBITDAX also excludes Deepwater Horizon settlement and related costs as these costs are outside the normal operationsinterest expense to allow for assessment of the Company. SeeNote 2—Deepwater Horizon Events. Finally, unrealizedsegment operating results without regard to Anadarko’s financing methods or capital structure. Total (gains) losses on derivatives, net, less net cash from settlement of commodity derivatives are excluded from Adjusted EBITDAX because unrealizedthese (gains) losses are not considered a measure of asset operating performance. Finally, net income attributable to noncontrolling interests is excluded from the Company’s measure of Adjusted EBITDAX because it represents earnings that are not attributable to the Company’s common stockholders.
Management believes that the presentation of Adjusted EBITDAX provides information useful in assessing the Company’s financial condition and results of operations and that Adjusted EBITDAX is a widely accepted financial indicator of a company’s ability to incur and service debt, fund capital expenditures, and make distributions to stockholders.
Adjusted EBITDAX as defined by Anadarko may not be comparable to similarly titled measures used by other companies and should be considered in conjunction with net income (loss) attributable to common stockholders and other performance measures, such as operating income or cash flows from operating activities. Below is a reconciliation of consolidated Adjusted EBITDAX to income (loss) before income taxes.
| | | $(3,424) | | | | $(3,424) | | | | $(3,424) | |
| | | Years Ended December 31, | |
| millions | | 2011 | | | 2010 | | | 2009 | |
Income (loss) before income taxes | | $ | (3,424 | ) | | $ | 1,641 | | | $ | (108 | ) |
Exploration expense | | | 1,076 | | | | 974 | | | | 1,107 | |
DD&A | | | 3,830 | | | | 3,714 | | | | 3,532 | |
Impairments | | | 1,774 | | | | 216 | | | | 115 | |
Deepwater Horizon settlement and related costs(1) | | | 3,930 | | | | 15 | | | | — | |
Interest expense | | | 839 | | | | 855 | | | | 702 | |
Unrealized (gains) losses on derivatives, net(2) | | | 616 | | | | (114 | ) | | | 717 | |
Less: Net income attributable to noncontrolling interests | | | 81 | | | | 60 | | | | 32 | |
| | | | | | | | | | | | |
Consolidated Adjusted EBITDAX | | $ | 8,560 | | | $ | 7,241 | | | $ | 6,033 | |
| | | | | | | | | | | | |
(1) | In the third quarter of 2011, the Company revised the definition of Adjusted EBITDAX to exclude the Deepwater Horizon settlement and related costs. The prior periods have been adjusted to reflect this change.
|
(2) | In the fourth quarter of 2010, the Company revised the definition of Adjusted EBITDAX to exclude the impact of unrealized (gains) losses on derivatives, net. The prior periods have been adjusted to reflect this change.
|
taxes for the years ended December 31:
|
| | | | | | | | | | | |
| millions | 2014 | | 2013 | | 2012 |
| Income (loss) before income taxes | $ | 54 |
| | $ | 2,106 |
| | $ | 3,565 |
|
| Exploration expense | 1,639 |
| | 1,329 |
| | 1,946 |
|
| DD&A | 4,550 |
| | 3,927 |
| | 3,964 |
|
| Impairments | 836 |
| | 794 |
| | 389 |
|
| Interest expense | 772 |
| | 686 |
| | 742 |
|
Total (gains) losses on derivatives, net, less net cash from settlement of commodity derivatives | 578 |
| | (307 | ) | | 443 |
|
| Deepwater Horizon settlement and related costs | 97 |
| | 15 |
| | 18 |
|
| Algeria exceptional profits tax settlement | — |
| | 33 |
| | (1,797 | ) |
| Tronox-related contingent loss | 4,360 |
| | 850 |
| | (250 | ) |
| Certain other nonoperating items | 22 |
| | 110 |
| | — |
|
| Less net income attributable to noncontrolling interests | 187 |
| | 140 |
| | 54 |
|
| Consolidated Adjusted EBITDAX | $ | 12,721 |
| | $ | 9,403 |
| | $ | 8,966 |
|
ANADARKO PETROLEUM CORPORATION
NOTES TO CONSOLIDATED FINANCIAL STATEMENTS
YEARS ENDED DECEMBER 31, 2014, 2013, AND 2012
20. Segment Information (Continued)
The Company’s accounting policies for individual segments are the same as those described in the summary of significant accounting policies, with the following exception: certain intersegment commodity contracts may meet the
U.S. Generally Accepted Accounting Principles (GAAP)GAAP definition of a derivative instrument, which would be accounted for at fair value under GAAP. However, Anadarko does not recognize any mark-to-market adjustments on such intersegment arrangements. Additionally, intersegment asset transfers are accounted for at historical cost basis, and do not give rise to gain or loss recognition.
ANADARKO PETROLEUM CORPORATION
NOTES TO CONSOLIDATED FINANCIAL STATEMENTS
YEARS ENDED DECEMBER 31, 2011, 2010, AND 2009
20. Segment Information (Continued)
The following presents selected financial information for Anadarko’s reporting segments for the respective years ended December 31.
Information presented below as “Other and Intersegment Eliminations” includes corporate costs, results from hard-minerals non-operated joint venturesroyalties, and royalty arrangements; and corporate, financing, and certain hedging activities.net cash from settlement of commodity derivatives. The following summarizes selected financial information for Anadarko’s reporting segments:
|
| | | | | | | | | | | | | | | | | | | |
| millions | Oil and Gas Exploration & Production | | Midstream | | Marketing | | Other and Intersegment Eliminations | | Total |
| 2014 | | | | | | | | | |
| Sales revenues | $ | 8,603 |
| | $ | 484 |
| | $ | 7,288 |
| | $ | — |
| | $ | 16,375 |
|
| Intersegment revenues | 6,225 |
| | 1,338 |
| | (6,771 | ) | | (792 | ) | | — |
|
| Gains (losses) on divestitures and other, net | 1,893 |
| | (3 | ) | | — |
| | 205 |
| | 2,095 |
|
| Total revenues and other | 16,721 |
| | 1,819 |
| | 517 |
| | (587 | ) | | 18,470 |
|
Operating costs and expenses (1) | 4,216 |
| | 972 |
| | 740 |
| | 17 |
| | 5,945 |
|
Net cash from settlement of commodity derivatives | — |
| | — |
| | — |
| | (377 | ) | | (377 | ) |
Other (income) expense, net (2) | — |
| | — |
| | — |
| | (2 | ) | | (2 | ) |
Net income attributable to noncontrolling interests | — |
| | 187 |
| | — |
| | — |
| | 187 |
|
| Total expenses and other | 4,216 |
| | 1,159 |
| | 740 |
| | (362 | ) | | 5,753 |
|
Total (gains) losses on derivatives, net included in marketing revenue, less net cash from settlement | — |
| | — |
| | 4 |
| | — |
| | 4 |
|
| Adjusted EBITDAX | $ | 12,505 |
| | $ | 660 |
| | $ | (219 | ) | | $ | (225 | ) | | $ | 12,721 |
|
| Net properties and equipment | $ | 32,717 |
| | $ | 6,697 |
| | $ | — |
| | $ | 2,175 |
| | $ | 41,589 |
|
| Capital expenditures | $ | 7,934 |
| | $ | 1,149 |
| | $ | — |
| | $ | 173 |
| | $ | 9,256 |
|
| Goodwill | $ | 5,123 |
| | $ | 453 |
| | $ | — |
| | $ | — |
| | $ | 5,576 |
|
| | | | | | | | | | | | | | | | | | | | |
| millions | | Oil and Gas
Exploration
& Production | | | Midstream | | | Marketing | | | Other and
Intersegment
Eliminations | | | Total | |
2011 | | | | | | | | | | | | | | | | | | | | |
Sales revenues | | $ | 7,519 | | | $ | 342 | | | $ | 6,023 | | | $ | (2 | ) | | $ | 13,882 | |
Intersegment revenues | | | 5,005 | | | | 957 | | | | (5,515 | ) | | | (447 | ) | | | — | |
Gains (losses) on divestitures and other, net | | | (41 | ) | | | (13 | ) | | | — | | | | 139 | | | | 85 | |
| | | | | | | | | | | | | | | | | | | | |
Total revenues and other | | | 12,483 | | | | 1,286 | | | | 508 | | | | (310 | ) | | | 13,967 | |
| | | | | | | | | | | | | | | | | | | | |
Operating costs and expenses(1) | | | 3,696 | | | | 786 | | | | 559 | | | | 186 | | | | 5,227 | |
Realized (gains) losses on derivatives, net | | | — | | | | — | | | | — | | | | (167 | ) | | | (167 | ) |
Other (income) expense, net | | | — | | | | — | | | | — | | | | 254 | | | | 254 | |
Net income attributable to noncontrolling interests | | | — | | | | 81 | | | | — | | | | — | | | | 81 | |
| | | | | | | | | | | | | | | | | | | | |
Total expenses and other | | | 3,696 | | | | 867 | | | | 559 | | | | 273 | | | | 5,395 | |
| | | | | | | | | | | | | | | | | | | | |
Unrealized (gains) losses on derivatives, net included in marketing revenue | | | — | | | | — | | | | (12 | ) | | | — | | | | (12 | ) |
| | | | | | | | | | | | | | | | | | | | |
Adjusted EBITDAX | | $ | 8,787 | | | $ | 419 | | | $ | (63 | ) | | $ | (583 | ) | | $ | 8,560 | |
| | | | | | | | | | | | | | | | | | | | |
Net properties and equipment | | $ | 32,235 | | | $ | 3,432 | | | $ | 9 | | | $ | 1,825 | | | $ | 37,501 | |
| | | | | | | | | | | | | | | | | | | | |
Capital expenditures | | $ | 5,026 | | | $ | 1,420 | | | $ | — | | | $ | 107 | | | $ | 6,553 | |
| | | | | | | | | | | | | | | | | | | | |
Goodwill | | $ | 5,475 | | | $ | 166 | | | $ | — | | | $ | — | | | $ | 5,641 | |
| | | | | | | | | | | | | | | | | | | | |
ANADARKO PETROLEUM CORPORATION
NOTES TO CONSOLIDATED FINANCIAL STATEMENTS
YEARS ENDED DECEMBER 31, 2011, 2010, AND 2009
20. Segment Information (Continued)
| | | $32,850 | | | | $32,850 | | | | $32,850 | | | | $32,850 | | | | $32,850 | |
| millions | | Oil and Gas
Exploration
& Production | | | Midstream | | | Marketing | | | Other and
Intersegment
Eliminations | | | Total | |
2010 | | | | | | | | | | | | | | | | | | | | |
Sales revenues | | $ | 5,613 | | | $ | 192 | | | $ | 5,037 | | | $ | — | | | $ | 10,842 | |
Intersegment revenues | | | 4,136 | | | | 831 | | | | (4,572 | ) | | | (395 | ) | | | — | |
Gains (losses) on divestitures and other, net | | | — | | | | — | | | | — | | | | 142 | | | | 142 | |
| | | | | | | | | | | | | | | | | | | | |
Total revenues and other | | | 9,749 | | | | 1,023 | | | | 465 | | | | (253 | ) | | | 10,984 | |
| | | | | | | | | | | | | | | | | | | | |
Operating costs and expenses(1) | | | 2,963 | | | | 655 | | | | 457 | | | | 221 | | | | 4,296 | |
Realized (gains) losses on derivatives, net | | | — | | | | — | | | | — | | | | (498 | ) | | | (498 | ) |
Other (income) expense, net | | | — | | | | — | | | | — | | | | (119 | ) | | | (119 | ) |
Net income attributable to noncontrolling interests | | | — | | | | 60 | | | | — | | | | — | | | | 60 | |
| | | | | | | | | | | | | | | | | | | | |
Total expenses and other | | | 2,963 | | | | 715 | | | | 457 | | | | (396 | ) | | | 3,739 | |
| | | | | | | | | | | | | | | | | | | | |
Unrealized (gains) losses on derivatives, net included in marketing revenue | | | — | | | | — | | | | (4 | ) | | | — | | | | (4 | ) |
| | | | | | | | | | | | | | | | | | | | |
Adjusted EBITDAX | | $ | 6,786 | | | $ | 308 | | | $ | 4 | | | $ | 143 | | | $ | 7,241 | |
| | | | | | | | | | | | | | | | | | | | |
Net properties and equipment | | $ | 32,850 | | | $ | 3,303 | | | $ | 9 | | | $ | 1,795 | | | $ | 37,957 | |
| | | | | | | | | | | | | | | | | | | | |
Capital expenditures | | $ | 4,672 | | | $ | 384 | | | $ | — | | | $ | 113 | | | $ | 5,169 | |
| | | | | | | | | | | | | | | | | | | | |
Goodwill | | $ | 5,143 | | | $ | 139 | | | $ | — | | | $ | — | | | $ | 5,282 | |
| | | | | | | | | | | | | | | | | | | | |
| | | | | |
2009 | | | | | | | | | | | | | | | | | | | | |
Sales revenues | | $ | 3,844 | | | $ | 222 | | | $ | 4,144 | | | $ | — | | | $ | 8,210 | |
Intersegment revenues | | | 3,479 | | | | 718 | | | | (3,842 | ) | | | (355 | ) | | | — | |
Gains (losses) on divestitures and other, net | | | 43 | | | | 1 | | | | — | | | | 89 | | | | 133 | |
Reversal of accrual for DWRRA dispute | | | 657 | | | | — | | | | — | | | | — | | | | 657 | |
| | | | | | | | | | | | | | | | | | | | |
Total revenues and other | | | 8,023 | | | | 941 | | | | 302 | | | | (266 | ) | | | 9,000 | |
| | | | | | | | | | | | | | | | | | | | |
Operating costs and expenses(1) | | | 2,499 | | | | 646 | | | | 451 | | | | 273 | | | | 3,869 | |
Realized (gains) losses on derivatives, net | | | — | | | | — | | | | — | | | | (852 | ) | | | (852 | ) |
Other (income) expense, net | | | — | | | | — | | | | — | | | | (43 | ) | | | (43 | ) |
Net income attributable to noncontrolling interests | | | — | | | | 32 | | | | — | | | | — | | | | 32 | |
| | | | | | | | | | | | | | | | | | | | |
Total expenses and other | | | 2,499 | | | | 678 | | | | 451 | | | | (622 | ) | | | 3,006 | |
| | | | | | | | | | | | | | | | | | | | |
Unrealized (gains) losses on derivatives, net included in marketing revenue | | | — | | | | — | | | | 39 | | | | — | | | | 39 | |
| | | | | | | | | | | | | | | | | | | | |
Adjusted EBITDAX | | $ | 5,524 | | | $ | 263 | | | $ | (110 | ) | | $ | 356 | | | $ | 6,033 | |
| | | | | | | | | | | | | | | | | | | | |
Net properties and equipment | | $ | 32,338 | | | $ | 3,091 | | | $ | 9 | | | $ | 1,766 | | | $ | 37,204 | |
| | | | | | | | | | | | | | | | | | | | |
Capital expenditures | | $ | 4,001 | | | $ | 303 | | | $ | — | | | $ | 254 | | | $ | 4,558 | |
| | | | | | | | | | | | | | | | | | | | |
Goodwill | | $ | 5,143 | | | $ | 139 | | | $ | — | | | $ | — | | | $ | 5,282 | |
| | | | | | | | | | | | | | | | | | | | |
| |
(1) | Operating costs and expenses excludeexcludes exploration expense, DD&A, impairments, and Deepwater Horizon settlement and related costs, and Algeria exceptional profits tax settlement since these expenses are excluded from Adjusted EBITDAX. For the year ended December 31, 2010 and 2009, $79 million and $61 million, respectively, has been reclassified |
| |
(2) | Other (income) expense, net excludes certain other nonoperating items since these items are excluded from the oil and gas exploration and production segment to the midstream segment to properly reflect the previously reported amounts.Adjusted EBITDAX. |
ANADARKO PETROLEUM CORPORATION
NOTES TO CONSOLIDATED FINANCIAL STATEMENTS
YEARS ENDED DECEMBER 31,
2011, 2010,2014, 2013, AND
20092012
20. Segment Information (Continued)
|
| | | | | | | | | | | | | | | | | | | |
| millions | Oil and Gas Exploration & Production | | Midstream | | Marketing | | Other and Intersegment Eliminations | | Total |
| 2013 | | | | | | | | | |
| Sales revenues | $ | 7,090 |
| | $ | 387 |
| | $ | 7,390 |
| | $ | — |
| | $ | 14,867 |
|
| Intersegment revenues | 6,405 |
| | 1,105 |
| | (6,859 | ) | | (651 | ) | | — |
|
| Gains (losses) on divestitures and other, net | (622 | ) | | (1 | ) | | — |
| | 337 |
| | (286 | ) |
| Total revenues and other | 12,873 |
| | 1,491 |
| | 531 |
| | (314 | ) | | 14,581 |
|
Operating costs and expenses (1) | 3,635 |
| | 843 |
| | 652 |
| | 20 |
| | 5,150 |
|
Net cash from settlement of commodity derivatives | — |
| | — |
| | — |
| | (95 | ) | | (95 | ) |
Other (income) expense, net (2) | — |
| | — |
| | — |
| | (21 | ) | | (21 | ) |
Net income attributable to noncontrolling interests | — |
| | 140 |
| | — |
| | — |
| | 140 |
|
| Total expenses and other | 3,635 |
| | 983 |
| | 652 |
| | (96 | ) | | 5,174 |
|
Total (gains) losses on derivatives, net included in marketing revenue, less net cash from settlement | — |
| | — |
| | (4 | ) | | — |
| | (4 | ) |
| Adjusted EBITDAX | $ | 9,238 |
| | $ | 508 |
| | $ | (125 | ) | | $ | (218 | ) | | $ | 9,403 |
|
| Net properties and equipment | $ | 33,409 |
| | $ | 5,408 |
| | $ | 9 |
| | $ | 2,103 |
| | $ | 40,929 |
|
| Capital expenditures | $ | 7,008 |
| | $ | 1,248 |
| | $ | — |
| | $ | 267 |
| | $ | 8,523 |
|
| Goodwill | $ | 5,317 |
| | $ | 175 |
| | $ | — |
| | $ | — |
| | $ | 5,492 |
|
| 2012 | | | | | | | | | |
| Sales revenues | $ | 6,752 |
| | $ | 325 |
| | $ | 6,230 |
| | $ | — |
| | $ | 13,307 |
|
| Intersegment revenues | 5,318 |
| | 959 |
| | (5,734 | ) | | (543 | ) | | — |
|
| Gains (losses) on divestitures and other, net | (65 | ) | | (8 | ) | | — |
| | 177 |
| | 104 |
|
| Total revenues and other | 12,005 |
| | 1,276 |
| | 496 |
| | (366 | ) | | 13,411 |
|
Operating costs and expenses (1) | 3,505 |
| | 748 |
| | 616 |
| | 295 |
| | 5,164 |
|
Net cash from settlement of commodity derivatives | — |
| | — |
| | — |
| | (753 | ) | | (753 | ) |
| Other (income) expense, net | — |
| | — |
| | — |
| | (4 | ) | | (4 | ) |
Net income attributable to noncontrolling interests | — |
| | 54 |
| | — |
| | — |
| | 54 |
|
| Total expenses and other | 3,505 |
| | 802 |
| | 616 |
| | (462 | ) | | 4,461 |
|
Total (gains) losses on derivatives, net included in marketing revenue, less net cash from settlement | — |
| | — |
| | 16 |
| | — |
| | 16 |
|
| Adjusted EBITDAX | $ | 8,500 |
| | $ | 474 |
| | $ | (104 | ) | | $ | 96 |
| | $ | 8,966 |
|
| Net properties and equipment | $ | 32,024 |
| | $ | 4,459 |
| | $ | 9 |
| | $ | 1,906 |
| | $ | 38,398 |
|
| Capital expenditures | $ | 5,906 |
| | $ | 1,250 |
| | $ | — |
| | $ | 155 |
| | $ | 7,311 |
|
| Goodwill | $ | 5,317 |
| | $ | 175 |
| | $ | — |
| | $ | — |
| | $ | 5,492 |
|
| |
(1) | Operating costs and expenses excludes exploration expense, DD&A, impairments, Deepwater Horizon settlement and related costs, and Algeria exceptional profits tax settlement since these expenses are excluded from Adjusted EBITDAX. |
| |
(2) | Other (income) expense, net excludes certain other nonoperating items since these items are excluded from Adjusted EBITDAX. |
ANADARKO PETROLEUM CORPORATION
NOTES TO CONSOLIDATED FINANCIAL STATEMENTS
YEARS ENDED DECEMBER 31, 2014, 2013, AND 2012
20. Segment Information (Continued)
The following represents Anadarko’s sales revenues (based on the origin of the sales) and net properties and equipment by geographic
area. | | | $10,477 | | | | $10,477 | | | | $10,477 | |
| | | Years Ended December 31, | |
| millions | | 2011 | | | 2010 | | | 2009 | |
Sales Revenues | | | | | | | | | | | | |
United States | | $ | 10,477 | | | $ | 8,806 | | | $ | 6,773 | |
Algeria | | | 2,258 | | | | 1,582 | | | | 1,133 | |
Other International | | | 1,147 | | | | 454 | | | | 304 | |
| | | | | | | | | | | | |
Total | | $ | 13,882 | | | $ | 10,842 | | | $ | 8,210 | |
| | | | | | | | | | | | |
| | | $33,050 | | | | $33,050 | |
| | | December 31, | |
| millions | | 2011 | | | 2010 | |
Net Properties and Equipment | | | | | | | | |
United States | | $ | 33,050 | | | $ | 34,100 | |
Algeria | | | 1,416 | | | | 1,165 | |
Other International | | | 3,035 | | | | 2,692 | |
| | | | | | | | |
Total | | $ | 37,501 | | | $ | 37,957 | |
| | | | | | | | |
area:
|
| | | | | | | | | | | |
| | Years Ended December 31, |
| millions | 2014 | | 2013 | | 2012 |
| Sales Revenues | | | | | |
| United States | $ | 13,083 |
| | $ | 11,290 |
| | $ | 9,911 |
|
| Algeria | 2,435 |
| | 2,184 |
| | 2,182 |
|
| Other International | 857 |
| | 1,393 |
| | 1,214 |
|
| Total sales revenues | $ | 16,375 |
| | $ | 14,867 |
| | $ | 13,307 |
|
|
| | | | | | | |
| | December 31, |
| millions | 2014 | | 2013 |
| Net Properties and Equipment | | | |
| United States | $ | 37,186 |
| | $ | 35,486 |
|
| Algeria | 1,431 |
| | 1,582 |
|
| Other International | 2,972 |
| | 3,861 |
|
| Total net properties and equipment | $ | 41,589 |
| | $ | 40,929 |
|
Major Customers In 2014, there were no sales to individual customers that exceeded 10% of the Company’s total sales revenues. Sales to Total S.A. were $2.0 billion in 2013 and $1.9 billion in 2012. These amounts are included in the oil and gas exploration and production reporting segment.
21. Pension Plans, Other Postretirement Benefits, and Defined-Contribution Plans
The Company has
contributory and non-contributory
U.S. defined-benefit pension plans,
includingwhich include both qualified and supplemental
plans, and a foreign contributory defined-benefit pension plan.plans. The Company also provides certain health care and life insurance benefits for certain retired employees. Retiree health care benefits are funded by contributions from the retiree, and in certain circumstances, contributions from the Company. The Company’s retiree life insurance plan is
noncontributory.In 2011, the Company made contributions of $301 million to its funded pension plans, $10 million to its unfunded pension plans, and $17 million to its unfunded other postretirement benefit plans. non-contributory.
While reported benefit obligations exceed the fair value of pension and other postretirement plan assets at December 31, 2011,2014, the Company monitors the funded status of its funded pension and other postretirement benefit plans to ensure that plan funds are sufficient to continue paying benefits. During 2014, the Company made contributions of $106 million to its funded pension plans, $15 million to its unfunded pension plans, and $15 million to its unfunded other postretirement benefit plans. Contributions to funded plans increase plan assets while contributions to unfunded plans are used to fund current benefit payments. The Company expects to contribute approximately $80$5 million to its funded pension plans, approximately $35$24 million to its unfunded pension plans, and approximately $20$16 million to its unfunded other postretirement benefit plans in 2012.2015.
ANADARKO PETROLEUM CORPORATION
NOTES TO CONSOLIDATED FINANCIAL STATEMENTS
YEARS ENDED DECEMBER 31,
2011, 2010,2014, 2013, AND
20092012
21. Pension Plans, Other Postretirement Benefits, and Defined-Contribution Plans (Continued)
The following sets forth changes in the benefit obligations and fair value of plan assets for the Company’s pension and other postretirement benefit plans for the years ended December 31, 20112014 and 2010,2013, as well as the funded status of the plans and amounts recognized in the financial statements at December 31, 20112014 and 2010.2013:
|
| | | | | | | | | | | | | | | |
| | Pension Benefits | | Other Benefits |
| millions | 2014 | | 2013 | | 2014 | | 2013 |
| Change in benefit obligation | | | | | | | |
| Benefit obligation at beginning of year | $ | 2,158 |
| | $ | 2,297 |
| | $ | 294 |
| | $ | 359 |
|
| Service cost | 99 |
| | 85 |
| | 7 |
| | 9 |
|
| Interest cost | 99 |
| | 78 |
| | 15 |
| | 14 |
|
| Actuarial (gain) loss | 337 |
| | (156 | ) | | 72 |
| | (74 | ) |
| Participant contributions | 1 |
| | — |
| | 4 |
| | 4 |
|
| Benefit payments | (159 | ) | | (149 | ) | | (19 | ) | | (18 | ) |
| Foreign-currency exchange-rate changes | (7 | ) | | 3 |
| | — |
| | — |
|
Benefit obligation at end of year (1) | $ | 2,528 |
| | $ | 2,158 |
| | $ | 373 |
| | $ | 294 |
|
|
| | | | | | | | | | | | | | | |
| Change in plan assets | | | | | | | |
| Fair value of plan assets at beginning of year | $ | 1,754 |
| | $ | 1,462 |
| | $ | — |
| | $ | — |
|
| Actual return on plan assets | 111 |
| | 278 |
| | — |
| | — |
|
| Employer contributions | 121 |
| | 160 |
| | 15 |
| | 14 |
|
| Participant contributions | 1 |
| | — |
| | 4 |
| | 4 |
|
| Benefit payments | (159 | ) | | (149 | ) | | (19 | ) | | (18 | ) |
| Foreign-currency exchange-rate changes | (10 | ) | | 3 |
| | — |
| | — |
|
| Fair value of plan assets at end of year | $ | 1,818 |
| | $ | 1,754 |
| | $ | — |
| | $ | — |
|
| | | | | | | | |
| Funded status of the plans at end of year | $ | (710 | ) | | $ | (404 | ) | | $ | (373 | ) | | $ | (294 | ) |
|
| | | | | | | | | | | | | | | |
| Total recognized amounts in the balance sheet consist of | | | | | | | |
| Other assets | $ | 41 |
| | $ | 37 |
| | $ | — |
| | $ | — |
|
| Accrued expenses | (24 | ) | | (19 | ) | | (15 | ) | | (15 | ) |
| Other long-term liabilities—other | (727 | ) | | (422 | ) | | (358 | ) | | (279 | ) |
| Total | $ | (710 | ) | | $ | (404 | ) | | $ | (373 | ) | | $ | (294 | ) |
|
| | | | | | | | | | | | | | | |
Total recognized amounts in accumulated other comprehensive income consist of | | | | | | | |
| Prior service cost (credit) | $ | (1 | ) | | $ | (1 | ) | | $ | 2 |
| | $ | 2 |
|
| Net actuarial (gain) loss | 740 |
| | 441 |
| | 1 |
| | (78 | ) |
| Total | $ | 739 |
| | $ | 440 |
| | $ | 3 |
| | $ | (76 | ) |
| | | $1,308 | | | | $1,308 | | | | $1,308 | | | | $1,308 | |
| | | Pension Benefits | | | Other Benefits | |
| millions | | 2011 | | | 2010 | | | 2011 | | | 2010 | |
Change in benefit obligations | | | | | | | | | | | | | | | | |
Benefit obligations at beginning of year | | $ | 1,882 | | | $ | 1,630 | | | $ | 316 | | | $ | 316 | |
Service cost | | | 78 | | | | 69 | | | | 9 | | | | 9 | |
Interest cost | | | 85 | | | | 84 | | | | 16 | | | | 16 | |
Plan amendments | | | (12 | ) | | | 6 | | | | — | | | | — | |
Actuarial (gain) loss | | | 94 | | | | 217 | | | | 30 | | | | (8 | ) |
Participant contributions | | | 1 | | | | 1 | | | | 4 | | | | 4 | |
Benefit payments | | | (103 | ) | | | (122 | ) | | | (21 | ) | | | (21 | ) |
Foreign-currency exchange-rate changes | | | (1 | ) | | | (3 | ) | | | — | | | | — | |
| | | | | | | | | | | | | | | | |
Benefit obligations at end of year | | $ | 2,024 | | | $ | 1,882 | | | $ | 354 | | | $ | 316 | |
| | | | | | | | | | | | | | | | |
Change in plan assets | | | | | | | | | | | | | | | | |
Fair value of plan assets at beginning of year | | $ | 1,104 | | | $ | 979 | | | $ | — | | | $ | — | |
Actual return on plan assets | | | (4 | ) | | | 147 | | | | — | | | | — | |
Employer contributions | | | 311 | | | | 102 | | | | 17 | | | | 17 | |
Participant contributions | | | 1 | | | | 1 | | | | 4 | | | | 4 | |
Benefit payments | | | (103 | ) | | | (122 | ) | | | (21 | ) | | | (21 | ) |
Foreign-currency exchange-rate changes | | | (1 | ) | | | (3 | ) | | | — | | | | — | |
| | | | | | | | | | | | | | | | |
Fair value of plan assets at end of year | | $ | 1,308 | | | $ | 1,104 | | | $ | — | | | $ | — | |
| | | | | | | | | | | | | | | | |
Funded status of the plans at end of year | | $ | (716 | ) | | $ | (778 | ) | | $ | (354 | ) | | $ | (316 | ) |
| | | | | | | | | | | | | | | | |
Total recognized amounts in the balance sheet consist of: | | | | | | | | | | | | | | | | |
Other assets | | $ | 11 | | | $ | 14 | | | $ | — | | | $ | — | |
Accrued expenses | | | (33 | ) | | | (29 | ) | | | (18 | ) | | | (17 | ) |
Other long-term liabilities—other | | | (694 | ) | | | (763 | ) | | | (336 | ) | | | (299 | ) |
| | | | | | | | | | | | | | | | |
Total | | $ | (716 | ) | | $ | (778 | ) | | $ | (354 | ) | | $ | (316 | ) |
| | | | | | | | | | | | | | | | |
Total recognized amounts in accumulated other comprehensive income consist of: | | | | | | | | | | | | | | | | |
Prior service cost (credit) | | $ | (2 | ) | | $ | 12 | | | $ | 5 | | | $ | 5 | |
Net actuarial (gain) loss | | | 853 | | | | 755 | | | | (4 | ) | | | (34 | ) |
| | | | | | | | | | | | | | | | |
Total | | $ | 851 | | | $ | 767 | | | $ | 1 | | | $ | (29 | ) |
| | | | | | | | | | | | | | | | |
| |
(1) | The accumulated benefit obligation for all defined-benefit pension plans was $2.1 billion at December 31, 2014, and $1.8 billion at December 31, 2013. |
ANADARKO PETROLEUM CORPORATION
NOTES TO CONSOLIDATED FINANCIAL STATEMENTS
YEARS ENDED DECEMBER 31, 2014, 2013, AND 2012
21. Pension Plans, Other Postretirement Benefits, and Defined-Contribution Plans (Continued)
The
accumulated benefit obligation for all defined-benefit pension plans was $1.9 billion and $1.7 billion at December 31, 2011 and 2010, respectively. Forfollowing summarizes the Company’s defined-benefit pension plans with accumulated benefit obligations in excess of plan assets
for the
projected benefit obligation, accumulated benefit obligation, and fair value of plan assets were $1.9 billion, $1.8 billion, and $1.2 billion, respectively, atyears ended December
31, 2011, and $1.8 billion, $1.6 billion, and $1.0 billion, respectively, at December 31, 2010.ANADARKO PETROLEUM CORPORATION
NOTES TO CONSOLIDATED FINANCIAL STATEMENTS
YEARS ENDED DECEMBER 31, 2011, 2010, AND 2009
21. Pension Plans, Other Postretirement Benefits, and Defined-Contribution Plans (Continued)
31:
|
| | | | | | | |
| millions | 2014 | | 2013 |
| Projected benefit obligation | $ | 2,403 |
| | $ | 2,047 |
|
| Accumulated benefit obligation | 2,024 |
| | 1,742 |
|
| Fair value of plan assets | 1,652 |
| | 1,606 |
|
The following
sets forthsummarizes the Company’s pension and other postretirement benefit cost and amounts recognized in other comprehensive income (before tax benefit) for the
respective years ended December
31. | | | 0000000 | | | | 0000000 | | | | 0000000 | | | | 0000000 | | | | 0000000 | | | | 0000000 | |
| | | Pension Benefits | | | Other Benefits | |
| millions | | 2011 | | | 2010 | | | 2009 | | | 2011 | | | 2010 | | | 2009 | |
Components of net periodic benefit cost | | | | | | | | | | | | | | | | | | | | | | | | |
Service cost | | $ | 78 | | | $ | 69 | | | $ | 54 | | | $ | 9 | | | $ | 9 | | | $ | 9 | |
Interest cost | | | 85 | | | | 84 | | | | 79 | | | | 16 | | | | 16 | | | | 17 | |
Expected return on plan assets | | | (85 | ) | | | (80 | ) | | | (71 | ) | | | — | | | | — | | | | — | |
Amortization of net actuarial loss (gain) | | | 85 | | | | 65 | | | | 49 | | | | — | | | | (3 | ) | | | (2 | ) |
Amortization of net prior service cost (credit) | | | 2 | | | | 3 | | | | 1 | | | | — | | | | (1 | ) | | | (1 | ) |
Settlement loss (gain) | | | — | | | | — | | | | 11 | | | | — | | | | — | | | | — | |
| | | | | | | | | | | | | | | | | | | | | | | | |
Net periodic benefit cost | | $ | 165 | | | $ | 141 | | | $ | 123 | | | $ | 25 | | | $ | 21 | | | $ | 23 | |
| | | | | | | | | | | | | | | | | | | | | | | | |
Amounts recognized in other comprehensive income (expense) | | | | | | | | | | | | | | | | | | | | | | | | |
Net actuarial gain (loss) | | $ | (183 | ) | | $ | (151 | ) | | $ | (221 | ) | | $ | (30 | ) | | $ | 8 | | | $ | 16 | |
Amortization of net actuarial (gain) loss | | | 85 | | | | 65 | | | | 49 | | | | — | | | | (3 | ) | | | (2 | ) |
Amortization of settlement (gain) loss | | | — | | | | — | | | | 11 | | | | — | | | | — | | | | — | |
Net prior service (cost) credit | | | 12 | | | | (6 | ) | | | — | | | | — | | | | — | | | | — | |
Amortization of net prior service cost (credit) | | | 2 | | | | 3 | | | | 1 | | | | — | | | | (1 | ) | | | (1 | ) |
| | | | | | | | | | | | | | | | | | | | | | | | |
Total amounts recognized in other comprehensive income (expense) | | $ | (84 | ) | | $ | (89 | ) | | $ | (160 | ) | | $ | (30 | ) | | $ | 4 | | | $ | 13 | |
| | | | | | | | | | | | | | | | | | | | | | | | |
The31:
|
| | | | | | | | | | | | | | | | | | | | | | | |
| | Pension Benefits | | Other Benefits |
| millions | 2014 | | 2013 | | 2012 | | 2014 | | 2013 | | 2012 |
| Components of net periodic benefit cost | | | | | | | | | | | |
| Service cost | $ | 99 |
| | $ | 85 |
| | $ | 76 |
| | $ | 7 |
| | $ | 9 |
| | $ | 9 |
|
| Interest cost | 99 |
| | 78 |
| | 85 |
| | 15 |
| | 14 |
| | 16 |
|
| Expected return on plan assets | (106 | ) | | (91 | ) | | (91 | ) | | — |
| | — |
| | — |
|
| Amortization of net actuarial loss (gain) | 34 |
| | 118 |
| | 93 |
| | (7 | ) | | — |
| | — |
|
| Amortization of net prior service cost (credit) | — |
| | — |
| | — |
| | — |
| | 1 |
| | 2 |
|
| Settlement loss | — |
| | 14 |
| | — |
| | — |
| | — |
| | — |
|
| Net periodic benefit cost | $ | 126 |
| | $ | 204 |
| | $ | 163 |
| | $ | 15 |
| | $ | 24 |
| | $ | 27 |
|
|
| | | | | | | | | | | | | | | | | | | | | | | |
Amounts recognized in other comprehensive income (expense) | | | | | | | | | | | |
| Net actuarial gain (loss) | $ | (333 | ) | | $ | 342 |
| | $ | (156 | ) | | $ | (72 | ) | | $ | 74 |
| | $ | 1 |
|
| Amortization of net actuarial (gain) loss | 34 |
| | 118 |
| | 93 |
| | (7 | ) | | — |
| | — |
|
| Amortization of net prior service cost (credit) | — |
| | — |
| | — |
| | — |
| | 1 |
| | 2 |
|
| Settlement loss | — |
| | 14 |
| | — |
| | — |
| | — |
| | — |
|
Total amounts recognized in other comprehensive income (expense) | $ | (299 | ) | | $ | 474 |
| | $ | (63 | ) | | $ | (79 | ) | | $ | 75 |
| | $ | 3 |
|
In 2015, an estimated amounts$49 million of net actuarial loss and net prior service cost for the pension and other postretirement plans that will be amortized from accumulated other comprehensive income into net periodic benefit cost in 2012 are $93 million and $1 million, respectively.Following arecost.
The following summarizes the weighted-average assumptions used by the Company in determining the pension and other postretirement benefit obligations at December 31:
|
| | | | | | | | | | | |
| | Pension Benefits | | Other Benefits |
| | 2014 | | 2013 | | 2014 | | 2013 |
| Discount rate | 4.00 | % | | 4.75 | % | | 4.25 | % | | 5.25 | % |
| Rates of increase in compensation levels | 5.25 | % | | 5.00 | % | | 5.25 | % | | 5.25 | % |
ANADARKO PETROLEUM CORPORATION
NOTES TO CONSOLIDATED FINANCIAL STATEMENTS
YEARS ENDED DECEMBER 31, 20112014, 2013, AND 2012
21. Pension Plans, Other Postretirement Benefits, and 2010. | | | | | | | | | | | | | | | | | | | | |
| | | Pension Benefits | | Other Benefits |
| | | 2011 | | 2010 | | 2011 | | 2010 |
Discount rate | | | | 4.50% | | | | | 4.75% | | | | | 4.75% | | | | | 5.25% | |
Rates of increase in compensation levels | | | | 4.50% | | | | | 5.00% | | | | | 4.50% | | | | | 5.00% | |
Defined-Contribution Plans
(Continued)
Accumulated and projected benefit obligations are measured as the present value of future cash payments. The Company discounts those cash payments using a discount rate that reflects the weighted average of market-observed yields for select
high qualityhigh-quality (AA-rated) fixed-income securities with cash flows that correspond to the expected amounts and timing of benefit payments.
Discount-rate selection for measurements prior to December 31, 2011, was based on a similar cash-flow-matching analysis, although, instead of using a portfolio of select high quality fixed-income securities to determine the effective settlement rate for a given plan obligation, the Company relied primarily on a published yield curve derived from market-observed yields for a universe of high quality bonds. Both methods are acceptable and result in aThe discount-rate assumption
thatused by the Company represents an estimate of the interest rate at which the pension and other postretirement benefit obligations could effectively be settled on the measurement date.
However, the Company believes a discount rate reflecting yields for high-quality fixed-income securities better corresponds to the Company’s expectations asANADARKO PETROLEUM CORPORATION
NOTES TO CONSOLIDATED FINANCIAL STATEMENTS
YEARS ENDED DECEMBER 31, 2011, 2010, AND 2009
21. Pension Plans, Other Postretirement Benefits, and Defined-Contribution Plans (Continued)
to the amount and timing of its benefit payments. Assumed rates of compensation increases for active participants vary by age group, with the resulting weighted-average assumed rate (weighted by the plan-level benefit obligation) provided in the preceding table.
Following are
The following summarizes the weighted-average assumptions used by the Company in determining the net periodic pension and other postretirement benefit
cost for 2011, 2010, and 2009. | | | | | | | | | | | | | | | | | | | | | | | | | | | | | | |
| | | Pension Benefits | | Other Benefits |
| | | 2011 | | 2010 | | 2009 | | 2011 | | 2010 | | 2009 |
Discount rate | | | | 4.75 | % | | | | 5.25 | % | | | | 6.00 | % | | | | 5.25 | % | | | | 5.50 | % | | | | 6.00 | % |
Long-term rate of return on plan assets | | | | 7.00 | % | | | | 7.50 | % | | | | 7.50 | % | | | | N/A | | | | | N/A | | | | | N/A | |
Rates of increase in compensation levels | | | | 5.00 | % | | | | 5.00 | % | | | | 5.00 | % | | | | 5.00 | % | | | | 5.00 | % | | | | 5.00 | % |
cost:
|
| | | | | | | | | | | | | | | | | |
| | Pension Benefits | | Other Benefits |
| | 2014 | | 2013 | | 2012 | | 2014 | | 2013 | | 2012 |
| Discount rate | 4.75 | % | | 3.50 | % | | 4.50 | % | | 5.25 | % | | 4.00 | % | | 4.75 | % |
| Long-term rate of return on plan assets | 6.75 | % | | 7.00 | % | | 7.00 | % | | N/A |
| | N/A |
| | N/A |
|
| Rates of increase in compensation levels | 5.00 | % | | 4.50 | % | | 4.50 | % | | 5.25 | % | | 4.50 | % | | 4.50 | % |
At December 31, 2010, a 10%2014 and December 31, 2013, an 8.00% annual rate of increase in the per-capita cost of covered health care benefits for 2011 is assumed for purposes of measuring other postretirement benefit obligations. At December 31, 2011, a 9% increase for 2012the next year was assumed for purposes of measuring other postretirement benefit obligations. This rate is expected to gradually decrease to 5%5.00% in 20182020 and beyond. The assumed health care cost trend rate can have a significant effect on the cost and obligation amounts reported for the health care plan. A 1% change in the assumed health care cost trend rate over the projected period would have the following effects: | | | | | | | | |
| millions | | 1% Increase | | | 1% Decrease | |
Effect on total of service and interest cost components | | $ | 2 | | | $ | (2 | ) |
Effect on other postretirement benefit obligation | | $ | 26 | | | $ | (22 | ) |
|
| | | | | | | |
| millions | 1% Increase | | 1% Decrease |
| Effect on total of service and interest cost components | $ | 3 |
| | $ | (2 | ) |
| Effect on other postretirement benefit obligation | $ | 40 |
| | $ | (33 | ) |
ANADARKO PETROLEUM CORPORATION
NOTES TO CONSOLIDATED FINANCIAL STATEMENTS
YEARS ENDED DECEMBER 31, 2014, 2013, AND 2012
21. Pension Plans, Other Postretirement Benefits, and Defined-Contribution Plans (Continued)
Investment Policies and Strategies The Company has adopted a balanced, diversified investment strategy, with the intent of maximizing returns without exposure to undue risk. Investments are typically made through investment managers across several investment categories (domestic large- and small-capitalization equity securities, international equity securities, fixed-income securities, real estate, hedge funds, and private equity), with selective exposure to Growth/Value investment styles. Performance for each investment is measured relative to the appropriate index benchmark for its category. Target asset-allocation percentages by major category are 45%-55%-55% equity securities, 20%-30%-30% fixed income, and up to 25% in a combination of other investments such as real estate, hedge funds, and private equity. Investment managers have full discretion as to investment decisions regarding all funds under their management to the extent permitted within investment guidelines. Although investment managers may, at their discretion and within investment guidelines, invest in Anadarko securities, there are no direct investments in Anadarko securities included in plan assets. There may be, however, indirect investments in Anadarko securities through the plans’ collective fund investments. The expected long-term rate of return on plan assets assumption was determined using the year-end 20112014 pension investment balances by asset class and expected long-term asset allocation. The expected return for each asset class reflects capital-market projections formulated using a forward-looking building-block approach, while also taking into account historical return trends and current market conditions. Equity returns generally reflect long-term expectations of real earnings growth, dividend yield, and inflation. Returns on fixed-income securities are generally developed based on expected inflation, real bond yield, and risk spread (as appropriate), adjusted for the expected effect that changing yields have on the rate of return. Other asset-class returns are derived from their relationship to the equity and fixed-income markets.
ANADARKO PETROLEUM CORPORATION
NOTES TO CONSOLIDATED FINANCIAL STATEMENTS
YEARS ENDED DECEMBER 31,
2011, 2010,2014, 2013, AND
20092012
21. Pension Plans, Other Postretirement Benefits, and Defined-Contribution Plans (Continued)
The fair value of the Company’s pension plan assets by asset categoryclass and input level within the fair-value hierarchy arewere as follows:
|
| | | | | | | | | | | | | | | |
| millions | | | | | | | |
| December 31, 2014 | Level 1 | | Level 2 | | Level 3 | | Total |
| Investments | | | | | | | |
| Cash and cash equivalents | $ | 3 |
| | $ | 53 |
| | $ | — |
| | $ | 56 |
|
| Fixed income | | | | | | | |
| Mortgage-backed securities | — |
| | 51 |
| | — |
| | 51 |
|
| U.S. government securities | — |
| | 56 |
| | — |
| | 56 |
|
Other fixed-income securities (1) | 48 |
| | 212 |
| | — |
| | 260 |
|
| Equity securities | | | | | | | |
| Domestic | 446 |
| | 130 |
| | — |
| | 576 |
|
| International | 124 |
| | 299 |
| | — |
| | 423 |
|
| Other | | | | | | | |
| Real estate | — |
| | 56 |
| | 94 |
| | 150 |
|
| Private equity | — |
| | — |
| | 84 |
| | 84 |
|
| Hedge funds and other alternative strategies | 9 |
| | — |
| | 126 |
| | 135 |
|
| Other | $ | — |
| | $ | 30 |
| | $ | — |
| | $ | 30 |
|
Total investments (2) | $ | 630 |
| | $ | 887 |
| | $ | 304 |
| | $ | 1,821 |
|
| Liabilities | | | | | | | |
| Hedge funds and other alternative strategies | $ | (3 | ) | | $ | — |
| | $ | — |
| | $ | (3 | ) |
| Total liabilities | $ | (3 | ) | | $ | — |
| | $ | — |
| | $ | (3 | ) |
| | | | | | | | |
| December 31, 2013 | | | | | | | |
| Investments | | | | | | | |
| Cash and cash equivalents | $ | 17 |
| | $ | 80 |
| | $ | — |
| | $ | 97 |
|
| Fixed income | | | | | | | |
| Mortgage-backed securities | — |
| | 54 |
| | — |
| | 54 |
|
| U.S. government securities | — |
| | 52 |
| | — |
| | 52 |
|
Other fixed-income securities (1) | 42 |
| | 197 |
| | — |
| | 239 |
|
| Equity securities | | | | | | | |
| Domestic | 445 |
| | 116 |
| | — |
| | 561 |
|
| International | 148 |
| | 303 |
| | — |
| | 451 |
|
| Other | | | | | | | |
| Real estate | — |
| | 47 |
| | 86 |
| | 133 |
|
| Private equity | — |
| | — |
| | 72 |
| | 72 |
|
| Hedge funds and other alternative strategies | 31 |
| | — |
| | 79 |
| | 110 |
|
Total investments (2) | $ | 683 |
| | $ | 849 |
| | $ | 237 |
| | $ | 1,769 |
|
| Liabilities | | | | | | | |
| Hedge funds and other alternative strategies | $ | (17 | ) | | $ | — |
| | $ | — |
| | $ | (17 | ) |
| Total liabilities | $ | (17 | ) | | $ | — |
| | $ | — |
| | $ | (17 | ) |
| | | 00000000 | | | | 00000000 | | | | 00000000 | | | | 00000000 | |
| December 31, 2011 | | | | | | | | | | | | |
| millions | | Level 1 | | | Level 2 | | | Level 3 | | | Total | |
Investments: | | | | | | | | | | | | | | | | |
Cash and cash equivalents | | $ | 37 | | | $ | 54 | | | $ | — | | | $ | 91 | |
Fixed income: | | | | | | | | | | | | | | | | |
Mortgage-backed securities | | | — | | | | 66 | | | | — | | | | 66 | |
U.S. Government securities | | | 1 | | | | 49 | | | | — | | | | 50 | |
Other fixed-income securities(1) | | | 36 | | | | 171 | | | | — | | | | 207 | |
Equity securities: | | | | | | | | | | | | | | | | |
Domestic | | | 265 | | | | 94 | | | | — | | | | 359 | |
International | | | 91 | | | | 203 | | | | — | | | | 294 | |
Other: | | | | | | | | | | | | | | | | |
Real estate | | | — | | | | 37 | | | | 72 | | | | 109 | |
Private equity | | | — | | | | — | | | | 55 | | | | 55 | |
Hedge funds and other alternative strategies | | | 26 | | | | — | | | | 64 | | | | 90 | |
| | | | | | | | | | | | | | | | |
Total investments(2) | | $ | 456 | | | $ | 674 | | | $ | 191 | | | $ | 1,321 | |
| | | | | | | | | | | | | | | | |
| | | | |
Liabilities: | | | | | | | | | | | | | | | | |
Hedge funds and other alternative strategies | | $ | (12 | ) | | $ | — | | | $ | — | | | $ | (12 | ) |
| | | | | | | | | | | | | | | | |
Total liabilities(2) | | $ | (12 | ) | | $ | — | | | $ | — | | | $ | (12 | ) |
| | | | | | | | | | | | | | | | |
| |
(1) | Amounts include investments in diversified fixed-income collective investment funds with exposure to mortgage-backed securities, government-issued securities, corporate debt, and other fixed-income securities. |
| |
(2) | Amount excludes netreceivables and payables, of $(1) million primarily related to Level 1 investments. |
ANADARKO PETROLEUM CORPORATION
NOTES TO CONSOLIDATED FINANCIAL STATEMENTS
YEARS ENDED DECEMBER 31,
2011, 2010,2014, 2013, AND
20092012
21. Pension Plans, Other Postretirement Benefits, and Defined-Contribution Plans (Continued) | | | 00000000 | | | | 00000000 | | | | 00000000 | | | | 00000000 | |
| December 31, 2010 | | | | | | | | | | | | |
| millions | | Level 1 | | | Level 2 | | | Level 3 | | | Total | |
Investments: | | | | | | | | | | | | | | | | |
Cash and cash equivalents | | $ | 18 | | | $ | 30 | | | $ | — | | | $ | 48 | |
Fixed income:(1) | | | | | | | | | | | | | | | | |
Mortgage-backed securities | | | — | | | | 79 | | | | — | | | | 79 | |
U.S. Government securities | | | 17 | | | | 28 | | | | — | | | | 45 | |
Other fixed-income securities(2) | | | 71 | | | | 105 | | | | — | | | | 176 | |
Equity securities:(1) | | | | | | | | | | | | | | | | |
Domestic | | | 258 | | | | 56 | | | | — | | | | 314 | |
International | | | 92 | | | | 211 | | | | — | | | | 303 | |
Other: | | | | | | | | | | | | | | | | |
Real estate | | | 31 | | | | — | | | | 9 | | | | 40 | |
Private equity | | | — | | | | — | | | | 41 | | | | 41 | |
Hedge funds and other alternative strategies | | | 27 | | | | — | | | | 49 | | | | 76 | |
| | | | | | | | | | | | | | | | |
Total investments(3) | | $ | 514 | | | $ | 509 | | | $ | 99 | | | $ | 1,122 | |
| | | | | | | | | | | | | | | | |
| | | | |
Liabilities: | | | | | | | | | | | | | | | | |
Hedge funds and other alternative strategies | | $ | (19 | ) | | $ | — | | | $ | — | | | $ | (19 | ) |
| | | | | | | | | | | | | | | | |
Total liabilities(3) | | $ | (19 | ) | | $ | — | | | $ | — | | | $ | (19 | ) |
| | | | | | | | | | | | | | | | |
(1) | Certain amounts have been reclassified to conform to current-year presentation.
|
(2) | Amounts include investments in diversified fixed-income collective investment funds with exposure to mortgage-backed securities, government-issued securities, corporate debt, and other fixed-income securities.
|
(3) | Amount excludes net receivables of $1 million primarily related to Level 1 investments.
|
ANADARKO PETROLEUM CORPORATION
NOTES TO CONSOLIDATED FINANCIAL STATEMENTS
YEARS ENDED DECEMBER 31, 2011, 2010, AND 2009
21. Pension Plans, Other Postretirement Benefits, and Defined-Contribution Plans (Continued)
Investments in securities traded in active markets are measured based on quoted prices, which represent Level 1
inputs above.inputs. Investments based on Level 2 inputs include direct investments in corporate debt and other fixed-income securities, as well as shares of open-end mutual funds or similar investment vehicles that do not have a readily determinable fair value, but are valued at the net asset value per share (NAV). For such funds, the NAV is the value at which investors transact with the fund, and is determined by the fund based on the estimated fair values of the underlying fund assets. Fair value of investments included as Level 3 inputs generally also reflect investments valued at fund NAVs, but, unlike investments characteristic of Level 2 fair-value measurements, such plan assets have significant liquidity restrictions or other features that are not reflected in NAV.
The following
sets forth a summary ofsummarizes changes in the fair value of investments based on Level 3
inputs. | | | 00000000 | | | | 00000000 | | | | 00000000 | | | | 00000000 | |
| millions | | Hedge Funds
and Other
Alternative
Strategies | | | Private
Equity | | | Real Estate | | | Total | |
Balance at January 1, 2011 | | $ | 49 | | | $ | 41 | | | $ | 9 | | | $ | 99 | |
Acquisitions (dispositions), net | | | 17 | | | | 6 | | | | 60 | | | | 83 | |
Actual return on plan assets: | | | | | | | | | | | | | | | | |
Relating to assets sold during the reporting period | | | (1 | ) | | | 1 | | | | — | | | | — | |
Relating to assets still held at the reporting date | | | (1 | ) | | | 7 | | | | 3 | | | | 9 | |
| | | | | | | | | | | | | | | | |
Balance at December 31, 2011 | | $ | 64 | | | $ | 55 | | | $ | 72 | | | $ | 191 | |
| | | | | | | | | | | | | | | | |
| | | | |
Balance at January 1, 2010 | | $ | 13 | | | $ | 25 | | | $ | — | | | $ | 38 | |
Acquisitions (dispositions), net | | | 35 | | | | 10 | | | | 9 | | | | 54 | |
Actual return on plan assets: | | | | | | | | | | | | | | | | |
Relating to assets sold during the reporting period | | | — | | | | 2 | | | | — | | | | 2 | |
Relating to assets still held at the reporting date | | | 1 | | | | 4 | | | | — | | | | 5 | |
| | | | | | | | | | | | | | | | |
Balance at December 31, 2010 | | $ | 49 | | | $ | 41 | | | $ | 9 | | | $ | 99 | |
| | | | | | | | | | | | | | | | |
inputs:
|
| | | | | | | | | | | | | | | |
| millions | Hedge Funds and Other Alternative Strategies | | Private Equity | | Real Estate | | Total |
| Balance at January 1, 2013 | $ | 77 |
| | $ | 64 |
| | $ | 78 |
| | $ | 219 |
|
| Acquisitions (dispositions), net | (6 | ) | | — |
| | 2 |
| | (4 | ) |
| Actual return on plan assets | | | | | | | |
| Relating to assets sold during the reporting period | 1 |
| | 4 |
| | — |
| | 5 |
|
| Relating to assets still held at the reporting date | 7 |
| | 4 |
| | 6 |
| | 17 |
|
| Balance at December 31, 2013 | $ | 79 |
| | $ | 72 |
| | $ | 86 |
| | $ | 237 |
|
| Acquisitions (dispositions), net | 42 |
| | — |
| | 2 |
| | 44 |
|
| Actual return on plan assets | | | | | | | |
| Relating to assets sold during the reporting period | 2 |
| | 5 |
| | — |
| | 7 |
|
| Relating to assets still held at the reporting date | 3 |
| | 7 |
| | 6 |
| | 16 |
|
| Balance at December 31, 2014 | $ | 126 |
| | $ | 84 |
| | $ | 94 |
| | $ | 304 |
|
Risks and Uncertainties The plan assets include various investment securities that are exposed to various risks, such as interest-rate, credit, and market risks. Due to the level of risk associated with certain investment securities, it is reasonably possible that changes in the values of investment securities could significantly impact the plan assets. The plan assets may include securities with contractual cash flows, such as asset-backed securities, collateralized mortgage obligations, and commercial mortgage-backed securities, including securities backed by subprime mortgage loans. The value, liquidity, and related income of those securities are sensitive to changes in economic conditions, including real estate
value,values, delinquencies or defaults, or both, and may be adversely affected by shifts in the market’s perception of the issuers and changes in interest rates.
ANADARKO PETROLEUM CORPORATION
NOTES TO CONSOLIDATED FINANCIAL STATEMENTS
YEARS ENDED DECEMBER 31,
2011, 2010,2014, 2013, AND
20092012
21. Pension Plans, Other Postretirement Benefits, and Defined-Contribution Plans (Continued)
Expected Benefit Payments
The following
provides an estimate ofsummarizes estimated benefit payments for the next ten
years. These estimates reflectyears, including benefit increases due to continuing employee
service. | | | | | | | | |
| millions | | Pension
Benefit
Payments | | | Other
Benefit
Payments | |
2012 | | $ | 214 | | | $ | 19 | |
2013 | | | 209 | | | | 19 | |
2014 | | | 204 | | | | 21 | |
2015 | | | 197 | | | | 22 | |
2016 | | | 190 | | | | 23 | |
2017-2021 | | | 784 | | | | 121 | |
service:
|
| | | | | | | |
| millions | Pension Benefit Payments | | Other Benefit Payments |
| 2015 | $ | 162 |
| | $ | 16 |
|
| 2016 | 175 |
| | 17 |
|
| 2017 | 199 |
| | 18 |
|
| 2018 | 194 |
| | 18 |
|
| 2019 | 216 |
| | 19 |
|
| 2020-2024 | 1,192 |
| | 109 |
|
Defined-Contribution Plans The Company maintains several defined-contribution benefit plans, includingthe most significant of which is the Anadarko Employee Savings Plan (ESP). All U.S. payroll-based regular employees of the Company on its U.S. payroll are eligible to participate in the ESP by making elective contributions that are matched by the Company, subject to certain limitations. The Company recognized expense of $41$76 million $40 for 2014, $78 million for 2013, and $43$55 million for 2011, 2010, and 2009, respectively,2012, related to these plans.
ANADARKO PETROLEUM CORPORATION
SUPPLEMENTAL INFORMATION ON OIL AND GAS EXPLORATION
AND PRODUCTION ACTIVITIES
(Unaudited)
(Unaudited)In December 2009, Anadarko adopted revised oil and gas reserve estimation and disclosure requirements that conformed the definition of proved reserves to the Securities and Exchange Commission (SEC) Modernization of Oil and Gas Reporting rules, issued by the SEC in 2008. An accounting standards update revised the definition of proved oil and gas reserves to require that the average, first-day-of-the-month price during the 12-month period before the end of the year rather than the year-end price, must be used when estimating whether reserve quantities are economic to produce. This same 12-month average price is also used in calculating the aggregate amount of (and changes in) future cash inflows related to the standardized measure of discounted future net cash flows. The rules also allow for the use of reliable technologies to estimate proved oil, natural-gas, and natural-gas liquids (NGLs) reserves if those technologies have been demonstrated to result in reliable conclusions about reserve volumes.
The unaudited supplemental information on oil and gas exploration and production activities for 2011, 2010,2014, 2013, and 20092012 has been presented in accordance with the revised reserve estimation and disclosure rules, which were not applied retrospectively. The December 31, 2008 data is presented in accordance with Financial Accounting Standards Board (FASB) oilAccounting Standards Codification Topic 932, Extractive Activities—Oil and gas disclosure requirements effective at that time. However, historical information has been reclassified to conform toGas and the geographic areas required to be disclosed under the revised accounting standard.Securities and Exchange Commission’s final rule, Modernization of Oil and Gas Reporting. Disclosures by geographic area include the United States and International. The International geographic area consists of proved reserves located in Algeria China, and Ghana.
The Company sold its Chinese subsidiary during 2014.
The following reserves disclosures reflect estimates of proved reserves, proved developed reserves, and proved undeveloped reserves, net of third-party royalty interests, of natural gas, oil, condensate, and
NGLsnatural-gas liquids (NGLs) owned at each year end and changes in proved reserves during each of the last three years. Natural-gas volumes are presented in billions of cubic feet (Bcf) at a pressure base of 14.73 pounds per square inch and volumes for oil, condensate, and NGLs are presented in millions of barrels (MMBbls). Total volumes are presented in millions of barrels of oil equivalent (MMBOE). For this computation, one barrel is
assumed to be the equivalent of 6,000 cubic feet of natural gas. Shrinkage associated with NGLs has been deducted from the natural-gas
reservereserves volumes.
ANADARKO PETROLEUM CORPORATION
SUPPLEMENTAL INFORMATION ON OIL AND GAS EXPLORATION
AND PRODUCTION ACTIVITIES
(Unaudited)
Oil and Gas Reserves (Continued)
Reserves for international locations are calculated in accordance with the terms of governing agreements. The international reserves include estimated quantities allocated to Anadarko for recovery of costs and income taxes and Anadarko’s net equity share after recovery of such costs.
The Company’s estimates of proved reserves are made using available geological and reservoir data as well as production performance data. These estimates are reviewed annually by internal reservoir engineers and revised, either upward or downward, as warranted by additional data. The results of infill drilling are treated as positive revisions due to increases to expected recovery. Other revisions are due to changes in, among other things,
development plans, reservoir performance,
commodity prices, economic conditions, and governmental restrictions.
In 2011, Anadarko added 174 MMBOE of proved reserves primarily as the result of successful drilling in the United States. Reserves revisions for 2011 include an increase of 210 MMBOE primarily related to successful infill drilling in the large onshore areas, such as the Greater Natural Buttes, Wattenberg, and Pinedale fields, and an increase of 8 MMBOE driven by higher oil prices. Sales of proved reserves in place were 29 MMBOE, related to onshore domestic assets.
In 2010, Anadarko added 83 MMBOE of proved reserves primarily as the result of successful drilling in the United States. Reserves revisions for 2010 include an increase of 246 MMBOE primarily related to successful infill drilling in the large onshore natural-gas plays, such as the Greater Natural Buttes, Wattenberg, and Pinedale fields, and an increase of 29 MMBOE driven by higher oil and gas prices. Sales of proved reserves in place were 6 MMBOE, related to onshore domestic and international assets.
In 2009, Anadarko added 70 MMBOE of proved reserves primarily as the result of successful drilling in the United States and international locations. Reserves revisions for 2009 included an increase of 212 MMBOE primarily related to large onshore natural-gas plays, such as the Greater Natural Buttes and Pinedale fields, as a result of successful infill drilling. The revisions include a decrease of 39 MMBOE driven by lower natural-gas prices. Sales and acquisitions of proved reserves in place were 24 MMBOE and 32 MMBOE, respectively, related to onshore domestic assets.
Prices used to compute the information presented in the following tables below are adjusted only for fixed and determinable amounts under provisions in existing contracts. These prices, before adjustments, were $4.12, $4.38,$4.35, $3.67, and $3.87$2.76 per MMBtu of natural gas and $96.19, $79.43,$94.99, $96.78, and $61.18$94.71 per barrel of oil respectively, for 2011, 2010,2014, 2013, and 2009.2012. The benchmark price for NGLs used in the computation, previously the same as that for oil, was converted to a NGLs-specific price of $45.25 per barrel in 2014.
ANADARKO PETROLEUM CORPORATION
SUPPLEMENTAL INFORMATION ON OIL AND GAS EXPLORATION
AND PRODUCTION ACTIVITIES
Oil and Gas Reserves (Continued)
| | | 000000000 | | | | 000000000 | | | | 000000000 | | | | 000000000 | | | | 000000000 | | | | 000000000 | |
| | | Natural Gas
(Bcf) | | | Oil and Condensate
(MMBbls) | |
| | | United States | | | International | | | Total | | | United States | | | International | | | Total | |
Proved Reserves | | | | | | | | | | | | | | | | | | | | | | | | |
December 31, 2008 | | | 8,105 | | | | — | | | | 8,105 | | | | 487 | | | | 222 | | | | 709 | |
Revisions of prior estimates | | | 228 | | | | — | | | | 228 | | | | 45 | | | | 16 | | | | 61 | |
Extensions, discoveries, and other additions | | | 210 | | | | — | | | | 210 | | | | 13 | | | | 20 | | | | 33 | |
Purchases in place | | | 149 | | | | — | | | | 149 | | | | 1 | | | | — | | | | 1 | |
Sales in place | | | (111 | ) | | | — | | | | (111 | ) | | | (2 | ) | | | — | | | | (2 | ) |
Production | | | (817 | ) | | | — | | | | (817 | ) | | | (44 | ) | | | (25 | ) | | | (69 | ) |
| | | | | | | | | | | | | | | | | | | | | | | | |
December 31, 2009 | | | 7,764 | | | | — | | | | 7,764 | | | | 500 | | | | 233 | | | | 733 | |
Revisions of prior estimates | | | 851 | | | | — | | | | 851 | | | | 32 | | | | 44 | | | | 76 | |
Extensions, discoveries, and other additions | | | 363 | | | | — | | | | 363 | | | | 13 | | | | — | | | | 13 | |
Purchases in place | | | 7 | | | | — | | | | 7 | | | | — | | | | — | | | | — | |
Sales in place | | | (39 | ) | | | — | | | | (39 | ) | | | — | | | | — | | | | — | |
Production | | | (829 | ) | | | — | | | | (829 | ) | | | (47 | ) | | | (26 | ) | | | (73 | ) |
| | | | | | | | | | | | | | | | | | | | | | | | |
December 31, 2010 | | | 8,117 | | | | — | | | | 8,117 | | | | 498 | | | | 251 | | | | 749 | |
Revisions of prior estimates | | | 550 | | | | — | | | | 550 | | | | 44 | | | | 14 | | | | 58 | |
Extensions, discoveries, and other additions | | | 614 | | | | — | | | | 614 | | | | 52 | | | | — | | | | 52 | |
Purchases in place | | | — | | | | — | | | | — | | | | — | | | | — | | | | — | |
Sales in place | | | (64 | ) | | | — | | | | (64 | ) | | | (10 | ) | | | — | | | | (10 | ) |
Production | | | (852 | ) | | | — | | | | (852 | ) | | | (48 | ) | | | (30 | ) | | | (78 | ) |
| | | | | | | | | | | | | | | | | | | | | | | | |
December 31, 2011 | | | 8,365 | | | | — | | | | 8,365 | | | | 536 | | | | 235 | | | | 771 | |
| | | | | | | | | | | | | | | | | | | | | | | | |
| | | | | | |
Proved Developed Reserves | | | | | | | | | | | | | | | | | | | | | | | | |
December 31, 2008 | | | 6,117 | | | | — | | | | 6,117 | | | | 285 | | | | 145 | | | | 430 | |
December 31, 2009 | | | 5,884 | | | | — | | | | 5,884 | | | | 300 | | | | 144 | | | | 444 | |
December 31, 2010 | | | 5,982 | | | | — | | | | 5,982 | | | | 303 | | | | 150 | | | | 453 | |
December 31, 2011 | | | 6,113 | | | | — | | | | 6,113 | | | | 352 | | | | 173 | | | | 525 | |
| | | | | | |
Proved Undeveloped Reserves | | | | | | | | | | | | | | | | | | | | | | | | |
December 31, 2008 | | | 1,988 | | | | — | | | | 1,988 | | | | 202 | | | | 77 | | | | 279 | |
December 31, 2009 | | | 1,880 | | | | — | | | | 1,880 | | | | 200 | | | | 89 | | | | 289 | |
December 31, 2010 | | | 2,135 | | | | — | | | | 2,135 | | | | 195 | | | | 101 | | | | 296 | |
December 31, 2011 | | | 2,252 | | | | — | | | | 2,252 | | | | 184 | | | | 62 | | | | 246 | |
|
| | | | | | | | | | | | | | | | | |
| | Natural Gas (Bcf) | | Oil and Condensate (MMBbls) |
| | United States | | International | | Total | | United States | | International | | Total |
| Proved Reserves | | | | | | | | | | | |
| December 31, 2011 | 8,365 |
| | — |
| | 8,365 |
| | 536 |
| | 235 |
| | 771 |
|
| Revisions of prior estimates | 635 |
| | — |
| | 635 |
| | 62 |
| | 52 |
| | 114 |
|
Extensions, discoveries, and other additions | 418 |
| | — |
| | 418 |
| | 9 |
| | — |
| | 9 |
|
| Purchases in place | 26 |
| | — |
| | 26 |
| | — |
| | — |
| | — |
|
| Sales in place | (199 | ) | | — |
| | (199 | ) | | (42 | ) | | — |
| | (42 | ) |
| Production | (916 | ) | | — |
| | (916 | ) | | (54 | ) | | (31 | ) | | (85 | ) |
| December 31, 2012 | 8,329 |
| | — |
| | 8,329 |
| | 511 |
| | 256 |
| | 767 |
|
| Revisions of prior estimates | 1,276 |
| | — |
| | 1,276 |
| | 96 |
| | 21 |
| | 117 |
|
Extensions, discoveries, and other additions | 416 |
| | — |
| | 416 |
| | 52 |
| | 14 |
| | 66 |
|
| Purchases in place | 153 |
| | — |
| | 153 |
| | 1 |
| | — |
| | 1 |
|
| Sales in place | (4 | ) | | — |
| | (4 | ) | | (10 | ) | | — |
| | (10 | ) |
| Production | (965 | ) | | — |
| | (965 | ) | | (58 | ) | | (32 | ) | | (90 | ) |
| December 31, 2013 | 9,205 |
| | — |
| | 9,205 |
| | 592 |
| | 259 |
| | 851 |
|
| Revisions of prior estimates | 710 |
| | 31 |
| | 741 |
| | 167 |
| | 18 |
| | 185 |
|
Extensions, discoveries, and other additions | 196 |
| | — |
| | 196 |
| | 25 |
| | — |
| | 25 |
|
| Purchases in place | — |
| | — |
| | — |
| | — |
| | — |
| | — |
|
| Sales in place | (492 | ) | | — |
| | (492 | ) | | (6 | ) | | (17 | ) | | (23 | ) |
| Production | (951 | ) | | — |
| | (951 | ) | | (74 | ) | | (35 | ) | | (109 | ) |
| December 31, 2014 | 8,668 |
| | 31 |
| | 8,699 |
| | 704 |
| | 225 |
| | 929 |
|
| Proved Developed Reserves | | | | | | | | | | | |
| December 31, 2011 | 6,113 |
| | — |
| | 6,113 |
| | 352 |
| | 173 |
| | 525 |
|
| December 31, 2012 | 6,445 |
| | — |
| | 6,445 |
| | 318 |
| | 208 |
| | 526 |
|
| December 31, 2013 | 7,120 |
| | — |
| | 7,120 |
| | 347 |
| | 202 |
| | 549 |
|
| December 31, 2014 | 6,635 |
| | 27 |
| | 6,662 |
| | 352 |
| | 190 |
| | 542 |
|
| Proved Undeveloped Reserves | | | | | | | | | | | |
| December 31, 2011 | 2,252 |
| | — |
| | 2,252 |
| | 184 |
| | 62 |
| | 246 |
|
| December 31, 2012 | 1,884 |
| | — |
| | 1,884 |
| | 193 |
| | 48 |
| | 241 |
|
| December 31, 2013 | 2,085 |
| | — |
| | 2,085 |
| | 245 |
| | 57 |
| | 302 |
|
| December 31, 2014 | 2,033 |
| | 4 |
| | 2,037 |
| | 352 |
| | 35 |
| | 387 |
|
ANADARKO PETROLEUM CORPORATION
SUPPLEMENTAL INFORMATION ON OIL AND GAS EXPLORATION
AND PRODUCTION ACTIVITIES
Oil and Gas Reserves (Continued)
|
| | | | | | | | | | | | | | | | | |
| | NGLs (MMBbls) | | Total (MMBOE) |
| | United States | | International | | Total | | United States | | International | | Total |
| Proved Reserves | | | | | | | | | | | |
| December 31, 2011 | 361 |
| | 13 |
| | 374 |
| | 2,291 |
| | 248 |
| | 2,539 |
|
Revisions of prior estimates (1) | 65 |
| | (1 | ) | | 64 |
| | 233 |
| | 51 |
| | 284 |
|
Extensions, discoveries, and other additions | 3 |
| | — |
| | 3 |
| | 82 |
| | — |
| | 82 |
|
| Purchases in place | — |
| | — |
| | — |
| | 4 |
| | — |
| | 4 |
|
| Sales in place | (6 | ) | | — |
| | (6 | ) | | (81 | ) | | — |
| | (81 | ) |
| Production | (30 | ) | | — |
| | (30 | ) | | (237 | ) | | (31 | ) | | (268 | ) |
| December 31, 2012 | 393 |
| | 12 |
| | 405 |
| | 2,292 |
| | 268 |
| | 2,560 |
|
Revisions of prior estimates (1) | 17 |
| | — |
| | 17 |
| | 326 |
| | 21 |
| | 347 |
|
Extensions, discoveries, and other additions | 10 |
| | — |
| | 10 |
| | 131 |
| | 14 |
| | 145 |
|
| Purchases in place | 9 |
| | — |
| | 9 |
| | 36 |
| | — |
| | 36 |
|
| Sales in place | (1 | ) | | — |
| | (1 | ) | | (12 | ) | | — |
| | (12 | ) |
| Production | (33 | ) | | — |
| | (33 | ) | | (252 | ) | | (32 | ) | | (284 | ) |
| December 31, 2013 | 395 |
| | 12 |
| | 407 |
| | 2,521 |
| | 271 |
| | 2,792 |
|
Revisions of prior estimates (1) | 129 |
| | 2 |
| | 131 |
| | 414 |
| | 25 |
| | 439 |
|
Extensions, discoveries, and other additions | 5 |
| | — |
| | 5 |
| | 63 |
| | — |
| | 63 |
|
| Purchases in place | — |
| | — |
| | — |
| | — |
| | — |
| | — |
|
| Sales in place | (19 | ) | | — |
| | (19 | ) | | (107 | ) | | (17 | ) | | (124 | ) |
| Production | (44 | ) | | (1 | ) | | (45 | ) | | (276 | ) | | (36 | ) | | (312 | ) |
| December 31, 2014 | 466 |
| | 13 |
| | 479 |
| | 2,615 |
| | 243 |
| | 2,858 |
|
| Proved Developed Reserves | | | | | | | | | | | |
| December 31, 2011 | 267 |
| | — |
| | 267 |
| | 1,638 |
| | 173 |
| | 1,811 |
|
| December 31, 2012 | 283 |
| | — |
| | 283 |
| | 1,675 |
| | 208 |
| | 1,883 |
|
| December 31, 2013 | 268 |
| | — |
| | 268 |
| | 1,801 |
| | 202 |
| | 2,003 |
|
| December 31, 2014 | 304 |
| | 13 |
| | 317 |
| | 1,762 |
| | 207 |
| | 1,969 |
|
| Proved Undeveloped Reserves | | | | | | | | | | | |
| December 31, 2011 | 94 |
| | 13 |
| | 107 |
| | 653 |
| | 75 |
| | 728 |
|
| December 31, 2012 | 110 |
| | 12 |
| | 122 |
| | 617 |
| | 60 |
| | 677 |
|
| December 31, 2013 | 127 |
| | 12 |
| | 139 |
| | 720 |
| | 69 |
| | 789 |
|
| December 31, 2014 | 162 |
| | — |
| | 162 |
| | 853 |
| | 36 |
| | 889 |
|
| | | 0000000 | | | | 0000000 | | | | 0000000 | | | | 0000000 | | | | 0000000 | | | | 0000000 | |
| | | NGLs
(MMBbls) | | | Total
(MMBOE) | |
| | | United States | | | International | | | Total | | | United States | | | International | | | Total | |
Proved Reserves | | | | | | | | | | | | | | | | | | | | | | | | |
December 31, 2008 | | | 205 | | | | 12 | | | | 217 | | | | 2,043 | | | | 234 | | | | 2,277 | |
Revisions of prior estimates(1) | | | 69 | | | | 5 | | | | 74 | | | | 152 | | | | 21 | | | | 173 | |
Extensions, discoveries, and other additions | | | 2 | | | | — | | | | 2 | | | | 50 | | | | 20 | | | | 70 | |
Purchases in place | | | 6 | | | | — | | | | 6 | | | | 32 | | | | — | | | | 32 | |
Sales in place | | | (3 | ) | | | — | | | | (3 | ) | | | (24 | ) | | | — | | | | (24 | ) |
Production | | | (19 | ) | | | — | | | | (19 | ) | | | (199 | ) | | | (25 | ) | | | (224 | ) |
| | | | | | | | | | | | | | | | | | | | | | | | |
December 31, 2009 | | | 260 | | | | 17 | | | | 277 | | | | 2,054 | | | | 250 | | | | 2,304 | |
Revisions of prior estimates(1) | | | 60 | | | | (4 | ) | | | 56 | | | | 235 | | | | 40 | | | | 275 | |
Extensions, discoveries, and other additions | | | 10 | | | | — | | | | 10 | | | | 83 | | | | — | | | | 83 | |
Purchases in place | | | — | | | | — | | | | — | | | | 1 | | | | — | | | | 1 | |
Sales in place | | | — | | | | — | | | | — | | | | (6 | ) | | | — | | | | (6 | ) |
Production | | | (23 | ) | | | — | | | | (23 | ) | | | (209 | ) | | | (26 | ) | | | (235 | ) |
| | | | | | | | | | | | | | | | | | | | | | | | |
December 31, 2010 | | | 307 | | | | 13 | | | | 320 | | | | 2,158 | | | | 264 | | | | 2,422 | |
Revisions of prior estimates(1) | | | 68 | | | | — | | | | 68 | | | | 204 | | | | 14 | | | | 218 | |
Extensions, discoveries, and other additions | | | 20 | | | | — | | | | 20 | | | | 174 | | | | — | | | | 174 | |
Purchases in place | | | — | | | | — | | | | — | | | | — | | | | — | | | | — | |
Sales in place | | | (8 | ) | | | — | | | | (8 | ) | | | (29 | ) | | | — | | | | (29 | ) |
Production | | | (26 | ) | | | — | | | | (26 | ) | | | (216 | ) | | | (30 | ) | | | (246 | ) |
| | | | | | | | | | | | | | | | | | | | | | | | |
December 31, 2011 | | | 361 | | | | 13 | | | | 374 | | | | 2,291 | | | | 248 | | | | 2,539 | |
| | | | | | | | | | | | | | | | | | | | | | | | |
| | | | | | |
Proved Developed Reserves | | | | | | | | | | | | | | | | | | | | | | | | |
December 31, 2008 | | | 150 | | | | — | | | | 150 | | | | 1,455 | | | | 145 | | | | 1,600 | |
December 31, 2009 | | | 199 | | | | — | | | | 199 | | | | 1,480 | | | | 144 | | | | 1,624 | |
December 31, 2010 | | | 222 | | | | — | | | | 222 | | | | 1,523 | | | | 150 | | | | 1,673 | |
December 31, 2011 | | | 267 | | | | — | | | | 267 | | | | 1,638 | | | | 173 | | | | 1,811 | |
| | | | | | |
Proved Undeveloped Reserves | | | | | | | | | | | | | | | | | | | | | | | | |
December 31, 2008 | | | 55 | | | | 12 | | | | 67 | | | | 588 | | | | 89 | | | | 677 | |
December 31, 2009 | | | 61 | | | | 17 | | | | 78 | | | | 574 | | | | 106 | | | | 680 | |
December 31, 2010 | | | 85 | | | | 13 | | | | 98 | | | | 635 | | | | 114 | | | | 749 | |
December 31, 2011 | | | 94 | | | | 13 | | | | 107 | | | | 653 | | | | 75 | | | | 728 | |
| |
(1) |
Revisions of prior estimates for 2011, 2010, and 2009 total proved reserves include 203 MMBOE, 312 MMBOE, and 125 MMBOE, respectively, of additions generated by Anadarko’s infill drilling programs.programs of 577 MMBOE for 2014, 410 MMBOE for 2013, and 383 MMBOE for 2012. |
ANADARKO PETROLEUM CORPORATION
SUPPLEMENTAL INFORMATION ON OIL AND GAS EXPLORATION
AND PRODUCTION ACTIVITIES
(Unaudited)
In 2014, Anadarko added 63 MMBOE of proved reserves through extensions and discoveries primarily as a result of successful drilling in the Marcellus and Wolfcamp shale plays. Although shale plays represented only about 17% of the Company’s total proved reserves at December 31, 2014, growth in the shale plays contributed 49 MMBOE, or 78%, of the total extensions and discoveries. Total revisions include the effects of new infill drilling, changes in commodity prices and other updates reflecting changes in economic conditions, changes in reservoir performance, and changes to development plans. Total revisions in 2014 resulted in an increase of 439 MMBOE, or 16%, of the beginning-of-year reserves base. These revisions are primarily associated with a 577 MMBOE increase related to successful infill drilling in large onshore areas such as the Wattenberg area and the Eagleford and Haynesville shales. Partially offsetting these positive infill revisions was a net decrease of 138 MMBOE, primarily associated with the optimization of horizontal drilling locations and the discontinuation of vertical well workover plans in the Wattenberg area. In 2014, the Company sold properties or interests in properties containing 69 MMBOE of proved developed reserves and 55 MMBOE of proved undeveloped reserves. Sales included the divestiture of the Company’s interest in the Pinedale/Jonah assets in Wyoming, the Company’s Chinese subsidiary, and a portion of the Company’s working interest in the East Texas Chalk area.
In 2013, Anadarko added 145 MMBOE of proved reserves through extensions and discoveries as the result of successful drilling primarily in the Marcellus shale and the Gulf of Mexico. Although shale plays represented only about 13% of the Company’s total proved reserves at December 31, 2013, growth in the shale plays contributed 70 MMBOE, or 48%, of the total extensions and discoveries. Total revisions in 2013 resulted in an increase of 347 MMBOE, or 14%, of the beginning-of-year reserves base. Total 2013 revisions included an increase of 410 MMBOE related to successful infill drilling, primarily in large onshore areas such as Wattenberg, Greater Natural Buttes, and the Eagleford shale, and 30 MMBOE resulting from improved oil and natural-gas prices. Partially offsetting these positive revisions were decreases of 53 MMBbls of NGLs reserves due to lower ethane prices and 40 MMBOE due to other non-price-related revisions primarily in the Rocky Mountains Region (Rockies). In 2013, the Company sold U.S. properties or interests in U.S. properties containing 12 MMBOE of proved undeveloped reserves. Sales were almost exclusively associated with a partial sale of a working interest in the Gulf of Mexico Heidelberg development project. Acquisitions of proved reserves were 36 MMBOE, related to domestic assets almost exclusively in the Rockies.
In 2012, Anadarko added 82 MMBOE of proved reserves through extensions and discoveries as the result of successful drilling in the Marcellus shale and the Gulf of Mexico. Shale plays contributed 66 MMBOE of the total extensions and discoveries in 2012. Total revisions in 2012 were 284 MMBOE or 11% of the beginning-of-year reserves base. Total 2012 revisions included an increase of 383 MMBOE related to successful infill drilling, primarily in Greater Natural Buttes, Wattenberg, and Carthage, and 33 MMBOE resulting from the resolution of the Algeria exceptional profits tax dispute. Partially offsetting these positive revisions were decreases of 68 MMBOE due to lower commodity prices, 56 MMBOE at Wattenberg primarily due to removing reserves associated with the discontinued vertical drilling program, and 8 MMBOE from all other assets. In 2012, the Company sold U.S. properties or interests in U.S. properties containing 81 MMBOE of proved reserves, including 59 MMBOE of proved developed reserves and 22 MMBOE of proved undeveloped reserves. Sales included a portion of the Company’s working interests in the Rockies Salt Creek enhanced oil recovery project and the Gulf of Mexico Lucius development project, and asset divestitures in South Texas, West Texas, the Gulf of Mexico, the Rockies, and North Louisiana.
ANADARKO PETROLEUM CORPORATION
SUPPLEMENTAL INFORMATION ON OIL AND GAS EXPLORATION
AND PRODUCTION ACTIVITIES
Capitalized costs include the cost of properties, equipment, and facilities for oil and natural-gas producing activities. Capitalized costs for proved properties include costs for oil and natural-gas leaseholds where proved reserves have been identified, development wells, and related equipment and facilities, including development wells in progress. Capitalized costs for unproved properties include costs for acquiring oil and gas leaseholds where no proved reserves have been identified, including costs of exploratory wells that are in the process of drilling or in active completion, and costs of exploratory wells suspended or waiting on completion. Capitalized costs associated with activities of the Company’s midstream and marketing
reporting segments,
liquefied natural gas (LNG) facilities costs, and other corporate activities are not included.
| | | 0000000 | | | | 0000000 | | | | 0000000 | |
| millions | | United States | | | International | | | Total | |
December 31, 2011 | | | | | | | | | | | | |
Capitalized | | | | | | | | | | | | |
Unproved properties | | $ | 7,020 | | | $ | 1,328 | | | $ | 8,348 | |
Proved properties | | | 39,711 | | | | 4,652 | | | | 44,363 | |
| | | | | | | | | | | | |
| | | 46,731 | | | | 5,980 | | | | 52,711 | |
Less: Accumulated DD&A | | | 18,908 | | | | 1,568 | | | | 20,476 | |
| | | | | | | | | | | | |
Net capitalized costs | | $ | 27,823 | | | $ | 4,412 | | | $ | 32,235 | |
| | | | | | | | | | | | |
December 31, 2010 | | | | | | | | | | | | |
Capitalized | | | | | | | | | | | | |
Unproved properties | | $ | 7,518 | | | $ | 2,331 | | | $ | 9,849 | |
Proved properties | | | 35,792 | | | | 2,687 | | | | 38,479 | |
| | | | | | | | | | | | |
| | | 43,310 | | | | 5,018 | | | | 48,328 | |
Less: Accumulated DD&A | | | 14,302 | | | | 1,176 | | | | 15,478 | |
| | | | | | | | | | | | |
Net capitalized costs | | $ | 29,008 | | | $ | 3,842 | | | $ | 32,850 | |
| | | | | | | | | | | | |
|
| | | | | | | | | | | |
| millions | United States | | International | | Total |
| December 31, 2014 | | | | | |
| Capitalized | | | | | |
| Unproved properties | $ | 3,858 |
| | $ | 1,291 |
| | $ | 5,149 |
|
| Proved properties | 53,545 |
| | 4,895 |
| | 58,440 |
|
| | 57,403 |
| | 6,186 |
| | 63,589 |
|
| Less accumulated DD&A | 29,055 |
| | 1,902 |
| | 30,957 |
|
| Net capitalized costs | $ | 28,348 |
| | $ | 4,284 |
| | $ | 32,632 |
|
| December 31, 2013 | | | | | |
| Capitalized | | | | | |
| Unproved properties | $ | 4,938 |
| | $ | 1,970 |
| | $ | 6,908 |
|
| Proved properties | 48,631 |
| | 5,540 |
| | 54,171 |
|
| | 53,569 |
| | 7,510 |
| | 61,079 |
|
| Less accumulated DD&A | 25,560 |
| | 2,333 |
| | 27,893 |
|
| Net capitalized costs | $ | 28,009 |
| | $ | 5,177 |
| | $ | 33,186 |
|
ANADARKO PETROLEUM CORPORATION
SUPPLEMENTAL INFORMATION ON OIL AND GAS EXPLORATION
AND PRODUCTION ACTIVITIES
Costs Incurred in Oil and Gas Property Acquisition, Exploration, and Development
Amounts reported as costs incurred include both capitalized costs and costs charged to expense when incurred for oil and gas property acquisition, exploration, and development activities. Costs incurred also include new asset retirement obligations established in the current year, as well as increases or decreases to the asset retirement obligations resulting from changes to cost estimates during the year. Exploration costs presented below include the costs of drilling and equipping successful and unsuccessful exploration wells during the year, geological and geophysical expenses, and the costs of retaining undeveloped leaseholds. Development costs include the costs of drilling and equipping development wells, and construction of related production facilities. Costs associated with activities of the Company’s midstream and marketing
reporting segments,
LNG facilities costs, and other corporate activities are not included.
| | | 00000000 | | | | 00000000 | | | | 00000000 | |
| millions | | United States | | | International | | | Total | |
Year Ended December 31, 2011 | | | | | | | | | | | | |
Property acquisitions | | | | | | | | | | | | |
Unproved | | $ | 610 | | | $ | 37 | | | $ | 647 | |
Proved | | | — | | | | — | | | | — | |
Exploration | | | 666 | | | | 803 | | | | 1,469 | |
Development | | | 2,970 | | | | 555 | | | | 3,525 | |
| | | | | | | | | | | | |
Total Costs Incurred | | $ | 4,246 | | | $ | 1,395 | | | $ | 5,641 | |
| | | | | | | | | | | | |
Year Ended December 31, 2010 | | | | | | | | | | | | |
Property acquisitions | | | | | | | | | | | | |
Unproved | | $ | 428 | | | $ | 91 | | | $ | 519 | |
Proved | | | 22 | | | | — | | | | 22 | |
Exploration | | | 693 | | | | 585 | | | | 1,278 | |
Development | | | 2,368 | | | | 899 | | | | 3,267 | |
| | | | | | | | | | | | |
Total Costs Incurred | | $ | 3,511 | | | $ | 1,575 | | | $ | 5,086 | |
| | | | | | | | | | | | |
Year Ended December 31, 2009 | | | | | | | | | | | | |
Property acquisitions | | | | | | | | | | | | |
Unproved | | $ | 270 | | | $ | 9 | | | $ | 279 | |
Proved | | | 266 | | | | — | | | | 266 | |
Exploration | | | 743 | | | | 486 | | | | 1,229 | |
Development | | | 2,005 | | | | 881 | | | | 2,886 | |
| | | | | | | | | | | | |
Total Costs Incurred | | $ | 3,284 | | | $ | 1,376 | | | $ | 4,660 | |
| | | | | | | | | | | | |
|
| | | | | | | | | | | |
| millions | United States | | International | | Total |
| Year Ended December 31, 2014 | | | | | |
| Property acquisitions | | | | | |
| Unproved | $ | 264 |
| | $ | 19 |
| | $ | 283 |
|
| Proved | 3 |
| | — |
| | 3 |
|
| Exploration | 1,095 |
| | 616 |
| | 1,711 |
|
| Development | 6,158 |
| | 557 |
| | 6,715 |
|
| Total costs incurred | $ | 7,520 |
| | $ | 1,192 |
| | $ | 8,712 |
|
| Year Ended December 31, 2013 | | | | | |
| Property acquisitions | | | | | |
| Unproved | $ | 282 |
| | $ | 45 |
| | $ | 327 |
|
| Proved | 324 |
| | — |
| | 324 |
|
| Exploration | 1,031 |
| | 939 |
| | 1,970 |
|
| Development | 4,421 |
| | 444 |
| | 4,865 |
|
| Total costs incurred | $ | 6,058 |
| | $ | 1,428 |
| | $ | 7,486 |
|
| Year Ended December 31, 2012 | | | | | |
| Property acquisitions | | | | | |
| Unproved | $ | 224 |
| | $ | 15 |
| | $ | 239 |
|
| Proved | — |
| | — |
| | — |
|
| Exploration | 1,064 |
| | 1,000 |
| | 2,064 |
|
| Development | 3,592 |
| | 472 |
| | 4,064 |
|
| Total costs incurred | $ | 4,880 |
| | $ | 1,487 |
| | $ | 6,367 |
|
ANADARKO PETROLEUM CORPORATION
SUPPLEMENTAL INFORMATION ON OIL AND GAS EXPLORATION
AND PRODUCTION ACTIVITIES
Results of operations for producing activities consist of all activities within the oil and gas exploration and production
reporting segment. Net revenues from production include only the revenues from the production and sale of natural gas, oil, condensate, and NGLs. Gains (losses) on property dispositions represent net gains or losses on sales of oil and gas properties.
Deepwater Horizon settlement and related costs represents the Company’s $4.0 billion settlement with BP, and associated legal and other costs, net of related insurance recoveries. Reversal of accrual for Deepwater Royalty Relief Act (DWRRA) dispute represents the reversal of previously recorded liabilities for royalties due on leases subject to litigation with the Department of Interior as described inNote 16—Contingenciesin theNotes to Consolidated Financial Statements. Production costs are
those incurredcosts to operate and maintain
the Company’s wells,
and related equipment, and
supporting facilities used in oil and gas
operations.operations, including the cost of labor, well service and repair, location maintenance, power and fuel, gathering, processing, transportation, other taxes, and production-related general and administrative costs. Exploration expenses include dry hole costs, leasehold impairments, geological and geophysical expenses, and the costs of retaining unproved leaseholds.
Algeria exceptional profits tax settlement represents the Company’s resolution of the Algeria exceptional profits tax dispute with Sonatrach, which provided for the transfer of $1.7 billion of oil to the Company over a 12-month period ending in mid-2013. Income tax expense is calculated by applying the current statutory tax rates to the revenues after deducting costs, which include depreciation, depletion, and amortization allowances, after giving effect to permanent differences. The results of operations exclude general office overhead and interest expense attributable to oil and gas activities.
| | | 000000000 | | | | 000000000 | | | | 000000000 | |
| millions | | United States | | | International | | | Total | |
Year Ended December 31, 2011 | | | | | | | | | | | | |
Net revenues from production | | | | | | | | | | | | |
Third-party sales | | $ | 5,778 | | | $ | 2,051 | | | $ | 7,829 | |
Sales to consolidated affiliates | | | 3,652 | | | | 1,353 | | | | 5,005 | |
Gains (losses) on property dispositions | | | (495 | ) | | | 454 | | | | (41 | ) |
| | | | | | | | | | | | |
| | | 8,935 | | | | 3,858 | | | | 12,793 | |
Production costs | | | | | | | | | | | | |
Oil and gas operating | | | 862 | | | | 131 | | | | 993 | |
Oil and gas transportation and other | | | 867 | | | | 23 | | | | 890 | |
Production-related general and administrative expenses | | | 322 | | | | 20 | | | | 342 | |
Other taxes | | | 646 | | | | 811 | | | | 1,457 | |
| | | | | | | | | | | | |
| | | 2,697 | | | | 985 | | | | 3,682 | |
Exploration expenses | | | 688 | | | | 388 | | | | 1,076 | |
Depreciation, depletion, and amortization | | | 3,193 | | | | 391 | | | | 3,584 | |
Impairments related to oil and gas properties | | | 1,225 | | | | — | | | | 1,225 | |
Deepwater Horizon settlement and related costs | | | 3,930 | | | | — | | | | 3,930 | |
| | | | | | | | | | | | |
| | | (2,798 | ) | | | 2,094 | | | | (704 | ) |
Income tax expense | | | (1,015 | ) | | | 1,027 | | | | 12 | |
| | | | | | | | | | | | |
Results of operations | | $ | (1,783 | ) | | $ | 1,067 | | | $ | (716 | ) |
| | | | | | | | | | | | |
|
| | | | | | | | | | | |
| millions | United States | | International | | Total |
| Year Ended December 31, 2014 | | | | | |
| Net revenues from production | | | | | |
| Third-party sales | $ | 7,425 |
| | $ | 1,518 |
| | $ | 8,943 |
|
| Sales to consolidated affiliates | 4,453 |
| | 1,773 |
| | 6,226 |
|
| Gains (losses) on property dispositions | (91 | ) | | 1,982 |
| | 1,891 |
|
| | 11,787 |
| | 5,273 |
| | 17,060 |
|
| Production costs | | | | | |
| Oil and gas operating | 968 |
| | 203 |
| | 1,171 |
|
| Oil and gas transportation and other | 1,150 |
| | 33 |
| | 1,183 |
|
| Production-related general and administrative expenses | 394 |
| | 32 |
| | 426 |
|
| Other taxes | 652 |
| | 535 |
| | 1,187 |
|
| | 3,164 |
| | 803 |
| | 3,967 |
|
| Exploration expenses | 1,218 |
| | 421 |
| | 1,639 |
|
| Depreciation, depletion, and amortization | 3,783 |
| | 398 |
| | 4,181 |
|
| Impairments related to oil and gas properties | 821 |
| | — |
| | 821 |
|
| Deepwater Horizon settlement and related costs | 97 |
| | — |
| | 97 |
|
| | 2,704 |
| | 3,651 |
| | 6,355 |
|
| Income tax expense | 995 |
| | 979 |
| | 1,974 |
|
| Results of operations | $ | 1,709 |
| | $ | 2,672 |
| | $ | 4,381 |
|
ANADARKO PETROLEUM CORPORATION
SUPPLEMENTAL INFORMATION ON OIL AND GAS EXPLORATION
AND PRODUCTION ACTIVITIES
Results of Operations (Continued)
| | | 000000000 | | | | 000000000 | | | | 000000000 | |
| millions | | United States | | | International | | | Total | |
Year Ended December 31, 2010 | | | | | | | | | | | | |
Net revenues from production | | | | | | | | | | | | |
Third-party sales | | $ | 4,369 | | | $ | 1,504 | | | $ | 5,873 | |
Sales to consolidated affiliates | | | 3,604 | | | | 532 | | | | 4,136 | |
Gains (losses) on property dispositions | | | 33 | | | | (7 | ) | | | 26 | |
| | | | | | | | | | | | |
| | | 8,006 | | | | 2,029 | | | | 10,035 | |
Production costs | | | | | | | | | | | | |
Oil and gas operating | | | 744 | | | | 86 | | | | 830 | |
Oil and gas transportation and other | | | 792 | | | | 22 | | | | 814 | |
Production-related general and administrative expenses | | | 274 | | | | 16 | | | | 290 | |
Other taxes | | | 456 | | | | 581 | | | | 1,037 | |
| | | | | | | | | | | | |
| | | 2,266 | | | | 705 | | | | 2,971 | |
Exploration expenses | | | 677 | | | | 297 | | | | 974 | |
Depreciation, depletion, and amortization | | | 3,281 | | | | 204 | | | | 3,485 | |
Impairments related to oil and gas properties | | | 145 | | | | — | | | | 145 | |
Deepwater Horizon settlement and related costs | | | 15 | | | | — | | | | 15 | |
| | | | | | | | | | | | |
| | | 1,622 | | | | 823 | | | | 2,445 | |
Income tax expense | | | 565 | | | | 563 | | | | 1,128 | |
| | | | | | | | | | | | |
Results of operations | | $ | 1,057 | | | $ | 260 | | | $ | 1,317 | |
| | | | | | | | | | | | |
| | | | | | | | | | | | |
Year Ended December 31, 2009 | | | | | | | | | | | | |
Net revenues from production | | | | | | | | | | | | |
Third-party sales | | $ | 2,957 | | | $ | 1,046 | | | $ | 4,003 | |
Sales to consolidated affiliates | | | 3,088 | | | | 391 | | | | 3,479 | |
Gains (losses) on property dispositions | | | 2 | | | | 41 | | | | 43 | |
Reversal of accrual for DWRRA dispute | | | 657 | | | | — | | | | 657 | |
| | | | | | | | | | | | |
| | | 6,704 | | | | 1,478 | | | | 8,182 | |
Production costs | | | | | | | | | | | | |
Oil and gas operating | | | 771 | | | | 88 | | | | 859 | |
Oil and gas transportation and other | | | 641 | | | | 22 | | | | 663 | |
Production-related general and administrative expenses | | | 294 | | | | 12 | | | | 306 | |
Other taxes | | | 304 | | | | 408 | | | | 712 | |
| | | | | | | | | | | | |
| | | 2,010 | | | | 530 | | | | 2,540 | |
Exploration expenses | | | 810 | | | | 297 | | | | 1,107 | |
Depreciation, depletion and amortization | | | 3,138 | | | | 181 | | | | 3,319 | |
Impairments related to oil and gas properties | | | 22 | | | | — | | | | 22 | |
| | | | | | | | | | | | |
| | | 724 | | | | 470 | | | | 1,194 | |
Income tax expense | | | 279 | | | | 379 | | | | 658 | |
| | | | | | | | | | | | |
Results of operations | | $ | 445 | | | $ | 91 | | | $ | 536 | |
| | | | | | | | | | | | |
|
| | | | | | | | | | | |
| millions | United States | | International | | Total |
| Year Ended December 31, 2013 | | | | | |
| Net revenues from production | | | | | |
| Third-party sales | $ | 6,567 |
| | $ | 856 |
| | $ | 7,423 |
|
| Sales to consolidated affiliates | 3,685 |
| | 2,720 |
| | 6,405 |
|
| Gains (losses) on property dispositions | (618 | ) | | (3 | ) | | (621 | ) |
| | 9,634 |
| | 3,573 |
| | 13,207 |
|
| Production costs | | | | | |
| Oil and gas operating | 874 |
| | 218 |
| | 1,092 |
|
| Oil and gas transportation and other | 998 |
| | 22 |
| | 1,020 |
|
| Production-related general and administrative expenses | 332 |
| | 5 |
| | 337 |
|
| Other taxes | 569 |
| | 455 |
| | 1,024 |
|
| | 2,773 |
| | 700 |
| | 3,473 |
|
| Exploration expenses | 611 |
| | 718 |
| | 1,329 |
|
| Depreciation, depletion, and amortization | 3,222 |
| | 399 |
| | 3,621 |
|
| Impairments related to oil and gas properties | 704 |
| | — |
| | 704 |
|
| Algeria exceptional profits tax settlement | — |
| | 33 |
| | 33 |
|
| Deepwater Horizon settlement and related costs | 15 |
| | — |
| | 15 |
|
| | 2,309 |
| | 1,723 |
| | 4,032 |
|
| Income tax expense | 845 |
| | 1,005 |
| | 1,850 |
|
| Results of operations | $ | 1,464 |
| | $ | 718 |
| | $ | 2,182 |
|
| Year Ended December 31, 2012 | | | | | |
| Net revenues from production | | | | | |
| Third-party sales | $ | 6,233 |
| | $ | 846 |
| | $ | 7,079 |
|
| Sales to consolidated affiliates | 2,767 |
| | 2,550 |
| | 5,317 |
|
| Gains (losses) on property dispositions | (16 | ) | | (48 | ) | | (64 | ) |
| | 8,984 |
| | 3,348 |
| | 12,332 |
|
| Production costs | | | | | |
| Oil and gas operating | 786 |
| | 190 |
| | 976 |
|
| Oil and gas transportation and other | 931 |
| | 22 |
| | 953 |
|
| Production-related general and administrative expenses | 318 |
| | 18 |
| | 336 |
|
| Other taxes | 581 |
| | 599 |
| | 1,180 |
|
| | 2,616 |
| | 829 |
| | 3,445 |
|
| Exploration expenses | 1,484 |
| | 462 |
| | 1,946 |
|
| Depreciation, depletion and amortization | 3,320 |
| | 390 |
| | 3,710 |
|
| Impairments related to oil and gas properties | 364 |
| | — |
| | 364 |
|
| Algeria exceptional profits tax settlement | — |
| | (1,797 | ) | | (1,797 | ) |
| Deepwater Horizon settlement and related costs | 18 |
| | — |
| | 18 |
|
| | 1,182 |
| | 3,464 |
| | 4,646 |
|
| Income tax expense | 433 |
| | 943 |
| | 1,376 |
|
| Results of operations | $ | 749 |
| | $ | 2,521 |
| | $ | 3,270 |
|
ANADARKO PETROLEUM CORPORATION
SUPPLEMENTAL INFORMATION ON OIL AND GAS EXPLORATION
AND PRODUCTION ACTIVITIES
Standardized Measure of Discounted Future Net Cash Flows
Estimates of future net cash flows from proved reserves of natural gas, oil, condensate, and NGLs for 2011, 2010,2014, 2013, and 20092012 are computed usingbased on the average first-day-of-the-month pricebeginning-of-the-month prices during the 12-month period for the respective year. Prices used to compute the information presented in the tables below are adjusted only for fixed and determinable amounts under provisions in existing contracts. These prices, before adjustments, were $4.12, $4.38,$4.35, $3.67, and $3.87$2.76 per MMBtu of natural gas and $96.19, $79.43,$94.99, $96.78, and $61.18$94.71 per barrel of oil, respectively, for 2011, 2010,2014, 2013, and 2009.2012. The benchmark price for NGLs used in the computation, previously the same as that for oil, was converted to a NGLs-specific price of $45.25 per barrel in 2014. Estimated future net cash flows for all periods presented are reduced by estimated future development, production, and abandonment and dismantlement costs based on existing costs, assuming continuation of existing economic conditions, and by estimated future income tax expense. These estimates also include assumptions about the timing of future production of proved reserves, and timing of future development, production costs, and abandonment and dismantlement. Income tax expense, both U.S. and foreign, is calculated by applying the existing statutory tax rates, including any known future changes, to the pretax net cash flows, giving effect to any permanent differences and reduced by the applicable tax basis. The effect of tax credits is considered in determining the income tax expense. The 10-percent10% discount factor is prescribed by U.S. Generally Accepted Accounting Principles. The present value of future net cash flows
doesis not
purport to be an estimate of the fair value of Anadarko’s proved reserves. An estimate of fair value would also take into account, among other things, anticipated changes in future prices and costs, the expected recovery of reserves in excess of proved reserves, and a discount factor more representative of the time value of money and the risks inherent in producing oil and natural gas. Significant changes in estimated
reservereserves volumes or commodity prices could have a material effect on the Company’s Consolidated Financial Statements.
ANADARKO PETROLEUM CORPORATION
SUPPLEMENTAL INFORMATION ON OIL AND GAS EXPLORATION
AND PRODUCTION ACTIVITIES
Standardized Measure of Discounted Future Net Cash Flows Relating to Proved Oil and Gas Reserves | | | | | | | | | | | | |
| millions | | United States | | | International | | | Total | |
December 31, 2011 | | | | | | | | | | | | |
Future cash inflows | | $ | 98,615 | | | $ | 27,351 | | | $ | 125,966 | |
Future production costs | | | 30,385 | | | | 8,342 | | | | 38,727 | |
Future development costs | | | 10,534 | | | | 995 | | | | 11,529 | |
Future income tax expenses | | | 20,391 | | | | 8,101 | | | | 28,492 | |
| | | | | | | | | | | | |
Future net cash flows | | | 37,305 | | | | 9,913 | | | | 47,218 | |
10% annual discount for estimated timing of cash flows | | | 17,132 | | | | 3,630 | | | | 20,762 | |
| | | | | | | | | | | | |
Standardized measure of discounted future net cash flows | | $ | 20,173 | | | $ | 6,283 | | | $ | 26,456 | |
| | | | | | | | | | | | |
December 31, 2010 | | | | | | | | | | | | |
Future cash inflows | | $ | 82,793 | | | $ | 20,633 | | | $ | 103,426 | |
Future production costs | | | 26,245 | | | | 6,989 | | | | 33,234 | |
Future development costs | | | 8,041 | | | | 1,040 | | | | 9,081 | |
Future income tax expenses | | | 16,512 | | | | 5,543 | | | | 22,055 | |
| | | | | | | | | | | | |
Future net cash flows | | | 31,995 | | | | 7,061 | | | | 39,056 | |
10% annual discount for estimated timing of cash flows | | | 15,008 | | | | 2,550 | | | | 17,558 | |
| | | | | | | | | | | | |
Standardized measure of discounted future net cash flows | | $ | 16,987 | | | $ | 4,511 | | | $ | 21,498 | |
| | | | | | | | | | | | |
December 31, 2009 | | | | | | | | | | | | |
Future cash inflows | | $ | 60,555 | | | $ | 14,699 | | | $ | 75,254 | |
Future production costs | | | 21,312 | | | | 5,665 | | | | 26,977 | |
Future development costs | | | 7,243 | | | | 1,644 | | | | 8,887 | |
Future income tax expenses | | | 10,537 | | | | 3,641 | | | | 14,178 | |
| | | | | | | | | | | | |
Future net cash flows | | | 21,463 | | | | 3,749 | | | | 25,212 | |
10% annual discount for estimated timing of cash flows | | | 9,938 | | | | 1,721 | | | | 11,659 | |
| | | | | | | | | | | | |
Standardized measure of discounted future net cash flows | | $ | 11,525 | | | $ | 2,028 | | | $ | 13,553 | |
| | | | | | | | | | | | |
|
| | | | | | | | | | | |
| millions | United States | | International | | Total |
| December 31, 2014 | | | | | |
| Future cash inflows | $ | 114,384 |
| | $ | 23,795 |
| | $ | 138,179 |
|
| Future production costs | 36,390 |
| | 6,061 |
| | 42,451 |
|
| Future development costs | 14,794 |
| | 1,356 |
| | 16,150 |
|
| Future income tax expenses | 21,813 |
| | 6,968 |
| | 28,781 |
|
| Future net cash flows | 41,387 |
| | 9,410 |
| | 50,797 |
|
| 10% annual discount for estimated timing of cash flows | 17,239 |
| | 2,898 |
| | 20,137 |
|
| Standardized measure of discounted future net cash flows | $ | 24,148 |
| | $ | 6,512 |
| | $ | 30,660 |
|
| December 31, 2013 | | | | | |
| Future cash inflows | $ | 102,765 |
| | $ | 28,454 |
| | $ | 131,219 |
|
| Future production costs | 33,271 |
| | 6,819 |
| | 40,090 |
|
| Future development costs | 12,285 |
| | 1,501 |
| | 13,786 |
|
| Future income tax expenses | 20,222 |
| | 8,148 |
| | 28,370 |
|
| Future net cash flows | 36,987 |
| | 11,986 |
| | 48,973 |
|
| 10% annual discount for estimated timing of cash flows | 15,818 |
| | 4,049 |
| | 19,867 |
|
| Standardized measure of discounted future net cash flows | $ | 21,169 |
| | $ | 7,937 |
| | $ | 29,106 |
|
| December 31, 2012 | | | | | |
| Future cash inflows | $ | 86,129 |
| | $ | 29,268 |
| | $ | 115,397 |
|
| Future production costs | 29,356 |
| | 6,239 |
| | 35,595 |
|
| Future development costs | 9,195 |
| | 606 |
| | 9,801 |
|
| Future income tax expenses | 16,804 |
| | 9,035 |
| | 25,839 |
|
| Future net cash flows | 30,774 |
| | 13,388 |
| | 44,162 |
|
| 10% annual discount for estimated timing of cash flows | 13,236 |
| | 4,612 |
| | 17,848 |
|
| Standardized measure of discounted future net cash flows | $ | 17,538 |
| | $ | 8,776 |
| | $ | 26,314 |
|
ANADARKO PETROLEUM CORPORATION
SUPPLEMENTAL INFORMATION ON OIL AND GAS EXPLORATION
AND PRODUCTION ACTIVITIES
Changes in Standardized Measure of Discounted Future Net Cash Flows
Relating to Proved Oil and Gas Reserves
| | | | | | | | | | | | |
| millions | | United States | | | International | | | Total | |
2011 | | | | | | | | | | | | |
Balance at January 1 | | $ | 16,987 | | | $ | 4,511 | | | $ | 21,498 | |
Sales and transfers of oil and gas produced,
net of production costs | | | (6,733 | ) | | | (2,420 | ) | | | (9,153 | ) |
Net changes in prices and production costs | | | 2,424 | | | | 4,777 | | | | 7,201 | |
Changes in estimated future development costs | | | 32 | | | | (709 | ) | | | (677 | ) |
Extensions, discoveries, additions, and improved
recovery, less related costs | | | 3,040 | | | | — | | | | 3,040 | |
Development costs incurred during the period | | | 561 | | | | 442 | | | | 1,003 | |
Revisions of previous quantity estimates | | | 5,438 | | | | 313 | | | | 5,751 | |
Purchases of minerals in place | | | 1 | | | | — | | | | 1 | |
Sales of minerals in place | | | (560 | ) | | | — | | | | (560 | ) |
Accretion of discount | | | 2,519 | | | | 800 | | | | 3,319 | |
Net change in income taxes | | | (2,254 | ) | | | (1,611 | ) | | | (3,865 | ) |
Other | | | (1,282 | ) | | | 180 | | | | (1,102 | ) |
| | | | | | | | | | | | |
Balance at December 31 | | $ | 20,173 | | | $ | 6,283 | | | $ | 26,456 | |
| | | | | | | | | | | | |
| | | |
2010 | | | | | | | | | | | | |
Balance at January 1 | | $ | 11,525 | | | $ | 2,028 | | | $ | 13,553 | |
Sales and transfers of oil and gas produced,
net of production costs | | | (5,707 | ) | | | (1,331 | ) | | | (7,038 | ) |
Net changes in prices and production costs | | | 6,645 | | | | 2,704 | | | | 9,349 | |
Changes in estimated future development costs | | | (516 | ) | | | (185 | ) | | | (701 | ) |
Extensions, discoveries, additions, and improved
recovery, less related costs | | | 1,150 | | | | — | | | | 1,150 | |
Development costs incurred during the period | | | 424 | | | | 811 | | | | 1,235 | |
Revisions of previous quantity estimates | | | 4,181 | | | | 1,235 | | | | 5,416 | |
Purchases of minerals in place | | | 8 | | | | — | | | | 8 | |
Sales of minerals in place | | | (61 | ) | | | (5 | ) | | | (66 | ) |
Accretion of discount | | | 1,673 | | | | 421 | | | | 2,094 | |
Net change in income taxes | | | (3,001 | ) | | | (1,305 | ) | | | (4,306 | ) |
Other | | | 666 | | | | 138 | | | | 804 | |
| | | | | | | | | | | | |
Balance at December 31 | | $ | 16,987 | | | $ | 4,511 | | | $ | 21,498 | |
| | | | | | | | | | | | |
|
| | | | | | | | | | | |
| millions | United States | | International | | Total |
| 2014 | | | | | |
| Balance at January 1 | $ | 21,169 |
| | $ | 7,937 |
| | $ | 29,106 |
|
| Sales and transfers of oil and gas produced, net of production costs | (8,714 | ) | | (2,492 | ) | | (11,206 | ) |
| Net changes in prices and production costs | (4,046 | ) | | (1,984 | ) | | (6,030 | ) |
| Changes in estimated future development costs | (4,180 | ) | | (250 | ) | | (4,430 | ) |
Extensions, discoveries, additions, and improved recovery, less related costs | 963 |
| | — |
| | 963 |
|
| Development costs incurred during the period | 2,591 |
| | 279 |
| | 2,870 |
|
| Revisions of previous quantity estimates | 13,703 |
| | 1,921 |
| | 15,624 |
|
| Purchases of minerals in place | — |
| | — |
| | — |
|
| Sales of minerals in place | (591 | ) | | (696 | ) | | (1,287 | ) |
| Accretion of discount | 3,221 |
| | 1,341 |
| | 4,562 |
|
| Net change in income taxes | (1,294 | ) | | 549 |
| | (745 | ) |
| Other | 1,326 |
| | (93 | ) | | 1,233 |
|
| Balance at December 31 | $ | 24,148 |
| | $ | 6,512 |
| | $ | 30,660 |
|
| 2013 | | | | | |
| Balance at January 1 | $ | 17,538 |
| | $ | 8,776 |
| | $ | 26,314 |
|
| Sales and transfers of oil and gas produced, net of production costs | (7,478 | ) | | (2,881 | ) | | (10,359 | ) |
| Net changes in prices and production costs | 1,394 |
| | (1,072 | ) | | 322 |
|
| Changes in estimated future development costs | (2,326 | ) | | (193 | ) | | (2,519 | ) |
Extensions, discoveries, additions, and improved recovery, less related costs | 2,659 |
| | (128 | ) | | 2,531 |
|
| Development costs incurred during the period | 1,076 |
| | 193 |
| | 1,269 |
|
| Revisions of previous quantity estimates | 6,526 |
| | 1,324 |
| | 7,850 |
|
| Purchases of minerals in place | 253 |
| | — |
| | 253 |
|
| Sales of minerals in place | 284 |
| | — |
| | 284 |
|
| Accretion of discount | 2,671 |
| | 1,465 |
| | 4,136 |
|
| Net change in income taxes | (1,865 | ) | | 401 |
| | (1,464 | ) |
| Other | 437 |
| | 52 |
| | 489 |
|
| Balance at December 31 | $ | 21,169 |
| | $ | 7,937 |
| | $ | 29,106 |
|
ANADARKO PETROLEUM CORPORATION
SUPPLEMENTAL INFORMATION ON OIL AND GAS EXPLORATION
AND PRODUCTION ACTIVITIES
Changes in Standardized Measure of Discounted Future Net Cash Flows
Relating to Proved Oil and Gas Reserves (Continued)
| | | | | | | | | | | | |
| millions | | United States | | | International | | | Total | |
2009 | | | | | | | | | | | | |
Balance at January 1 | | $ | 11,403 | | | $ | 568 | | | $ | 11,971 | |
Sales and transfers of oil and gas produced,
net of production costs | | | (4,035 | ) | | | (907 | ) | | | (4,942 | ) |
Net changes in prices and production costs | | | (2,064 | ) | | | 2,999 | | | | 935 | |
Changes in estimated future development costs | | | 1,196 | | | | (243 | ) | | | 953 | |
Extensions, discoveries, additions, and improved
recovery, less related costs | | | 717 | | | | 264 | | | | 981 | |
Development costs incurred during the period | | | 720 | | | | 273 | | | | 993 | |
Revisions of previous quantity estimates | | | 2,389 | | | | (26 | ) | | | 2,363 | |
Purchases of minerals in place | | | 206 | | | | — | | | | 206 | |
Sales of minerals in place | | | (70 | ) | | | — | | | | (70 | ) |
Accretion of discount | | | 1,642 | | | | 171 | | | | 1,813 | |
Net change in income taxes | | | (192 | ) | | | (1,044 | ) | | | (1,236 | ) |
Other | | | (387 | ) | | | (27 | ) | | | (414 | ) |
| | | | | | | | | | | | |
Balance at December 31 | | $ | 11,525 | | | $ | 2,028 | | | $ | 13,553 | |
| | | | | | | | | | | | |
|
| | | | | | | | | | | |
| millions | United States | | International | | Total |
| 2012 | | | | | |
| Balance at January 1 | $ | 20,173 |
| | $ | 6,283 |
| | $ | 26,456 |
|
| Sales and transfers of oil and gas produced, net of production costs | (6,384 | ) | | (2,571 | ) | | (8,955 | ) |
| Net changes in prices and production costs | (7,948 | ) | | (391 | ) | | (8,339 | ) |
| Changes in estimated future development costs | (744 | ) | | (70 | ) | | (814 | ) |
Extensions, discoveries, additions, and improved recovery, less related costs | 963 |
| | — |
| | 963 |
|
| Development costs incurred during the period | 1,103 |
| | 357 |
| | 1,460 |
|
| Revisions of previous quantity estimates | 5,026 |
| | 4,390 |
| | 9,416 |
|
| Purchases of minerals in place | (9 | ) | | — |
| | (9 | ) |
| Sales of minerals in place | (763 | ) | | — |
| | (763 | ) |
| Accretion of discount | 3,063 |
| | 1,139 |
| | 4,202 |
|
| Net change in income taxes | 1,285 |
| | (759 | ) | | 526 |
|
| Other | 1,773 |
| | 398 |
| | 2,171 |
|
| Balance at December 31 | $ | 17,538 |
| | $ | 8,776 |
| | $ | 26,314 |
|
ANADARKO PETROLEUM CORPORATION
SUPPLEMENTAL QUARTERLY INFORMATION
The following shows summarysummarizes quarterly financial data for 20112014 and 2010. | | | 00000000 | | | | 00000000 | | | | 00000000 | | | | 00000000 | |
| millions except per-share amounts | | First
Quarter | | | Second
Quarter | | | Third
Quarter | | | Fourth
Quarter | |
2011 | | | | | | | | | | | | | | | | |
Sales revenues | | $ | 3,224 | | | $ | 3,734 | | | $ | 3,384 | | | $ | 3,540 | |
Gains (losses) on divestitures and other, net | | | 29 | | | | (58 | ) | | | (185 | ) | | | 299 | |
Deepwater Horizon settlement and related costs | | | 26 | | | | 9 | | | | 4,042 | | | | (147 | ) |
Operating income (loss) | | | 896 | | | | 1,001 | | | | (3,626 | ) | | | (141 | ) |
Net income (loss) | | | 237 | | | | 562 | | | | (3,028 | ) | | | (339 | ) |
Net income attributable to noncontrolling interests | | | 21 | | | | 18 | | | | 23 | | | | 19 | |
Net income (loss) attributable to common stockholders | | | 216 | | | | 544 | | | | (3,051 | ) | | | (358 | ) |
Earnings per share: | | | | | | | | | | | | | | | | |
Net income (loss) attributable to common stockholders—basic | | $ | 0.43 | | | $ | 1.09 | | | $ | (6.12 | ) | | $ | (0.72 | ) |
Net income (loss) attributable to common stockholders—diluted | | $ | 0.43 | | | $ | 1.08 | | | $ | (6.12 | ) | | $ | (0.72 | ) |
Average number common shares outstanding—basic | | | 497 | | | | 498 | | | | 498 | | | | 498 | |
Average number common shares outstanding—diluted | | | 499 | | | | 500 | | | | 498 | | | | 498 | |
| | | | |
2010 | | | | | | | | | | | | | | | | |
Sales revenues | | $ | 3,130 | | | $ | 2,563 | | | $ | 2,516 | | | $ | 2,633 | |
Gains (losses) on divestitures and other, net | | | 9 | | | | 41 | | | | 34 | | | | 58 | |
Deepwater Horizon settlement and related costs | | | — | | | | — | | | | 2 | | | | 13 | |
Operating income (loss) | | | 919 | | | | 377 | | | | 196 | | | | 277 | |
Net income (loss) | | | 728 | | | | (28 | ) | | | (8 | ) | | | 129 | |
Net income attributable to noncontrolling interests | | | 12 | | | | 12 | | | | 18 | | | | 18 | |
Net income (loss) attributable to common stockholders | | | 716 | | | | (40 | ) | | | (26 | ) | | | 111 | |
Earnings per share: | | | | | | | | | | | | | | | | |
Net income (loss) attributable to common stockholders—basic | | $ | 1.44 | | | $ | (0.08 | ) | | $ | (0.05 | ) | | $ | 0.22 | |
Net income (loss) attributable to common stockholders—diluted | | $ | 1.43 | | | $ | (0.08 | ) | | $ | (0.05 | ) | | $ | 0.22 | |
Average number common shares outstanding—basic | | | 493 | | | | 495 | | | | 496 | | | | 496 | |
Average number common shares outstanding—diluted | | | 496 | | | | 495 | | | | 496 | | | | 498 | |
|
| | | | | | | | | | | | | | | |
| millions except per-share amounts | First Quarter | | Second Quarter | | Third Quarter | | Fourth Quarter |
| 2014 | | | | | | | |
| Sales revenues | $ | 4,338 |
| | $ | 4,385 |
| | $ | 4,230 |
| | $ | 3,422 |
|
| Gains (losses) on divestitures and other, net | 1,506 |
| | 54 |
| | 780 |
| | (245 | ) |
| Deepwater Horizon settlement and related costs | — |
| | 93 |
| | 3 |
| | 1 |
|
| Operating income (loss) | 2,975 |
| | 1,209 |
| | 1,698 |
| | (479 | ) |
| Tronox-related contingent loss | 4,300 |
| | 19 |
| | 19 |
| | 22 |
|
| Net income (loss) | (2,626 | ) | | 266 |
| | 1,147 |
| | (350 | ) |
| Net income (loss) attributable to noncontrolling interests | 43 |
| | 39 |
| | 60 |
| | 45 |
|
| Net income (loss) attributable to common stockholders | (2,669 | ) | | 227 |
| | 1,087 |
| | (395 | ) |
| Earnings per share | | | | | | | |
| Net income (loss) attributable to common stockholders—basic | $ | (5.30 | ) | | $ | 0.45 |
| | $ | 2.13 |
| | $ | (0.78 | ) |
| Net income (loss) attributable to common stockholders—diluted | $ | (5.30 | ) | | $ | 0.45 |
| | $ | 2.12 |
| | $ | (0.78 | ) |
| Average number common shares outstanding—basic | 504 |
| | 505 |
| | 506 |
| | 507 |
|
| Average number common shares outstanding—diluted | 504 |
| | 507 |
| | 508 |
| | 507 |
|
| | | | | | | | |
| 2013 | | | | | | | |
| Sales revenues | $ | 3,718 |
| | $ | 3,440 |
| | $ | 3,789 |
| | $ | 3,920 |
|
| Gains (losses) on divestitures and other, net | 175 |
| | 57 |
| | 64 |
| | (582 | ) |
| Algeria exceptional profits tax settlement | 33 |
| | — |
| | — |
| | — |
|
| Deepwater Horizon settlement and related costs | 3 |
| | 4 |
| | 5 |
| | 3 |
|
| Operating income (loss) | 1,289 |
| | 1,140 |
| | 689 |
| | 215 |
|
| Tronox-related contingent loss | — |
| | — |
| | — |
| | 850 |
|
| Net income (loss) | 484 |
| | 959 |
| | 223 |
| | (725 | ) |
| Net income attributable to noncontrolling interests | 24 |
| | 30 |
| | 41 |
| | 45 |
|
| Net income (loss) attributable to common stockholders | 460 |
| | 929 |
| | 182 |
| | (770 | ) |
| Earnings per share | | | | | | | |
| Net income (loss) attributable to common stockholders—basic | $ | 0.91 |
| | $ | 1.84 |
| | $ | 0.36 |
| | $ | (1.53 | ) |
| Net income (loss) attributable to common stockholders—diluted | $ | 0.91 |
| | $ | 1.83 |
| | $ | 0.36 |
| | $ | (1.53 | ) |
| Average number common shares outstanding—basic | 501 |
| | 502 |
| | 503 |
| | 504 |
|
| Average number common shares outstanding—diluted | 503 |
| | 504 |
| | 505 |
| | 504 |
|
Item 9. Changes in and Disagreements with Accountants on Accounting and Financial Disclosure
Item 9A. Controls and Procedures
EVALUATION AND DISCLOSURE CONTROLS AND PROCEDURES
Anadarko’s Chief Executive Officer and Chief Financial Officer performed an evaluation of the Company’s disclosure controls and procedures as defined in Rules 13a-15(e) and 15d-15(e) of the Securities Exchange Act of
1934.1934, as amended. The Company’s disclosure controls and procedures are designed to ensure that information required to be disclosed by the Company in reports it files or submits under the Securities Exchange Act of 1934,
as amended, is recorded, processed, summarized, and reported within the time periods specified in the rules and forms of the Securities and Exchange Commission, and to ensure that the information required to be disclosed by
usthe Company in reports that
we fileit files under the Securities Exchange Act of 1934,
as amended, is accumulated and communicated to the Company’s management, including the principal executive officer and principal financial officer, as appropriate, to allow timely decisions regarding required disclosure. Based on this evaluation, the Chief Executive Officer and Chief Financial Officer have concluded that the Company’s disclosure controls and procedures are effective as of December 31,
2011.2014.
MANAGEMENT’S ANNUAL REPORT ON INTERNAL CONTROL OVER FINANCIAL REPORTING
SeeManagement’s Assessment of Internal Control Over Financial Reporting under Item 8 of this Form 10-K.
ATTESTATION REPORT OF THE REGISTERED PUBLIC ACCOUNTING FIRM
SeeReport of Independent Registered Public Accounting Firm under Item 8 of this Form 10-K.
CHANGES IN INTERNAL CONTROL OVER FINANCIAL REPORTING
There were no changes in Anadarko’s internal control over financial reporting during the fourth quarter of 20112014 that materially affected, or are reasonably likely to materially affect, the Company’s internal control over financial reporting. See
Management’s Assessment of Internal Control Over Financial Reporting under Item 8 of this Form 10-K.
Item 9B. Other Information
Item 10. Directors, Executive Officers, and Corporate Governance
SeeAnadarko Board of Directors, Corporate Governance—Board of Directors, Corporate Governance—Committees of the Board, Corporate Governance—Board of Directors,andSection 16(a) Beneficial Ownership Reporting Compliance in the Anadarko Petroleum Corporation Proxy Statement (Proxy Statement), for the Annual Meeting of Stockholders of Anadarko Petroleum Corporation to be held May 15, 201212, 2015 (to be filed with the Securities and Exchange Commission prior to April 5, 2012)2, 2015), each of which is incorporated herein by reference.
See list ofExecutive Officers of the Registrant under Items 1 and 2 of this Form 10-K, which is incorporated herein by reference.
The Company’s Code of Business Conduct and Ethics and the Code of Ethics for the Chief Executive Officer, Chief Financial Officer and Chief Accounting Officer (Code of Ethics) can be found on the Company’s website located at www.anadarko.com/
About/Pages/Governance.aspx.Responsibility/Good-Governance. Any stockholder may request a printed copy of the Code of Ethics by submitting a written request to the Company’s Corporate Secretary. If the Company amends the Code of Ethics or grants a waiver, including an implicit waiver, from the Code of Ethics, the Company will disclose the information on its website. The waiver information will remain on the website for at least 12 months after the initial disclosure of such waiver.
Item 11. Executive Compensation
SeeCorporate Governance—Board of Directors—Compensation and Benefits Committee Interlocks and Insider Participation, Corporate Governance—Board of Directors—Director Compensation, Corporate Governance—Director Compensation Table for 2011,2014, Compensation and Benefits Committee Report on 20112014 Executive Compensation, Compensation Discussion and Analysis,andExecutive Compensationin the Proxy Statement, each of which is incorporated herein by reference. The Compensation and Benefits Committee Report and related information incorporated by reference herein shall not be deemed “soliciting material” or to be “filed” with the Securities and Exchange Commission, nor shall such information be incorporated by reference into any future filing under the Securities Act of 1933 or Securities Exchange Act of 1934, each as amended, except to the extent that the Company specifically incorporates it by reference into such filing.
Item 12. Security Ownership of Certain Beneficial Owners and Management and Related Stockholder
Matters
SeeSecurity Ownership of Certain Beneficial Owners and Management in the Proxy Statement which is incorporated herein by reference.and SeeSecurities Authorized for Issuance under Equity Compensation Plansunder Item 5 of this Form 10-K, which isare incorporated herein by reference.
Item 13. Certain Relationships and Related Transactions, and Director Independence
SeeCorporate Governance—Board of Directors andTransactions with Related Persons in the Proxy Statement, each of which is incorporated herein by reference.
Item 14. Principal
AccountantAccounting Fees and Services
SeeIndependent Auditor in the Proxy Statement, which is incorporated herein by reference.
Item 15. Exhibits, Financial Statement Schedules
The following documents are filed as part of this report or incorporated by reference:
| |
| (1) | The Consolidated Financial Statements of Anadarko Petroleum Corporation are listed on the Index to this report, page 82. 84. |
| |
| (2) | Exhibits not incorporated by reference to a prior filing are designated by an asterisk (*) and are filed herewith or double asterisk (**) and are furnished herewith; all exhibits not so designated are incorporated herein by reference to a prior filing under File Number 1-8968 as indicated. |
| | | | | |
| | | | |
Exhibit
Number | | Description |
| | Original Filed
Exhibit
2 | | File
Number | |
| | 2(i)(i) | | Agreement and Plan of Merger dated as of June 22, 2006, among Anadarko Petroleum Corporation, APC Acquisition Sub, Inc. and Kerr-McGee Corporation, | | filed as Exhibit 2.2 to Form 8-K filed on June 26, 2006 |
| | 3 | 1-8968 | |
| | | | |
| | 3(i)(i) | | Restated Certificate of Incorporation of Anadarko Petroleum Corporation, dated May 22,21, 2009, | | filed as Exhibit 3.3 to Form 8-K filed on May 22, 2009 |
| | | 1-8968 | |
| | | | |
| | (ii) | | By-Laws of Anadarko Petroleum Corporation, amended and restated as of May 22, 2009 | | 3.4November 6, 2014, filed as Exhibit 3.1 to Form 8-K filed on May 22, 2009November 10, 2014 |
| | 4 | 1-8968 | |
| | | | |
| | 4(i)(i) | | Trustee Indenture dated as of September 19, 2006, Anadarko Petroleum Corporation to The Bank of New York Trust Company, N.A. | | , filed as Exhibit 4.1 to Form 8-K filed on September 19, 2006 |
| | | 1-8968 | |
| | | | |
| | (ii) | | Second Supplemental Indenture dated October 6,4, 2006, among Anadarko Petroleum Corporation, Kerr-McGee Corporation, and Citibank, N.A. | | , filed as Exhibit 4.1 to Form 8-K filed on October 6, 2006 |
| | | 1-8968 | |
| | | | |
| | (iii) | | Ninth Supplemental Indenture dated October 6,4, 2006, among Anadarko Petroleum Corporation, Kerr-McGee Corporation, and Citibank, N.A. | | , filed as Exhibit 4.2 to Form 8-K filed on October 6, 2006 |
| | | 1-8968 | |
| | | | |
| | (iv) | | Officers’ Certificate of Anadarko Petroleum Corporation, dated March 2, 2009, establishing the 7.625% Senior Notes due 2014 and the 8.700% Senior Notes due 2019, | | filed as Exhibit 4.1 to Form 8-K filed on March 6, 2009 |
| | | 1-8968 | |
| | | | |
| | (v) | | Form of 7.625% Senior Notes due 2014, | | filed as Exhibit 4.2 to Form 8-K filed on March 6, 2009 |
| | | 1-8968 | |
| | | | |
| | (vi) | | Form of 8.700% Senior Notes due 2019, | | filed as Exhibit 4.3 to Form 8-K filed on March 6, 2009 |
| | | 1-8968 | |
| | | | | | | | | | |
Exhibit
Number | | Description
| | Original Filed
Exhibit
| | File
Number | |
| | 4(vii)(vii) | | Officers’ Certificate of Anadarko Petroleum Corporation, dated June 9, 2009, establishing the 5.75% Senior Notes due 2014, the 6.95% Senior Notes due 2019 and the 7.95% Senior Notes due 2039, | | filed as Exhibit 4.1 to Form 8-K filed on June 12, 2009 |
| | | 1-8968 | |
| | | | |
| | (viii) | | Form of 5.75% Senior Notes due 2014, | | filed as Exhibit 4.2 to Form 8-K filed on June 12, 2009 |
| | | 1-8968 | |
| | | | |
| | (ix) | | Form of 6.95% Senior Notes due 2019, | | filed as Exhibit 4.3 to Form 8-K filed on June 12, 2009 |
| | | 1-8968 | |
| | | | |
| | (x) | | Form of 7.95% Senior Notes due 2039, | | filed as Exhibit 4.4 to Form 8-K filed on June 12, 2009 |
| | | 1-8968 | |
| | | | |
| | (xi) | | Officers’ Certificate of Anadarko Petroleum Corporation dated March 9, 2010, establishing the 6.200% Senior Notes due 2040, | | filed as Exhibit 4.1 to Form 8-K filed on March 16, 2010 |
| | | 1-8968 | |
| | | | |
| | (xii) | | Form of 6.200% Senior Notes due 2040, | | filed as Exhibit 4.2 to Form 8-K filed on March 16, 2010 |
| | | 1-8968 | |
| | | | |
| | (xiii) | | Officers’ Certificate of Anadarko Petroleum Corporation dated August 9, 2010, establishing the 6.375% Senior Notes due 2017, | | filed as Exhibit 4.1 to Form 8-K filed on August 12, 2010 |
| | 1-8968 | |
| | | | |
Exhibit Number | | Description |
| 4 | (xiv) | | Form of 6.375% Senior Notes due 2017, | | filed as Exhibit 4.2 to Form 8-K filed on August 12, 2010 |
| | | 1-8968(xv) | | Officers’ Certificate of Anadarko Petroleum Corporation dated July 7, 2014, establishing the 3.45% Senior Notes due 2024 and the 4.50% Senior Notes due 2044, filed as Exhibit 4.1 to Form 8-K filed on July 7, 2014 |
| | (xvi) | | Form of 3.45% Senior Notes due 2024, filed as Exhibit 4.2 to Form 8-K filed on July 7, 2014 |
| | (xvii) | | Form of 4.50% Senior Notes due 2044, filed as Exhibit 4.3 to Form 8-K filed on July 7, 2014 |
| † | 10 | 10(i)(i) | | 1998 Director Stock Plan of Anadarko Petroleum Corporation, effective January 30, 1998, | | filed as Appendix A to DEF 14A filed on March 16, 1998 | | | 1-8968 | |
| | | | |
| † | | (ii) | | Form of Anadarko Petroleum Corporation 1998 Director Stock Plan Stock Option Agreement, | | filed as Exhibit 10.1 to Form 8-K filed on November 17, 2005 | | | 1-8968 | |
| | | | |
| † | | (iii) | | Anadarko Petroleum Corporation Amended and Restated 1999 Stock Incentive Plan, | | filed as Appendix A to DEF 14A filed on March 18, 2005 | | | 1-8968 | |
| | | | |
| † | | (iv) | | Form of Anadarko Petroleum Corporation Executive 1999 Stock Incentive Plan Stock Option Agreement, | | filed as Exhibit 10.2 to Form 8-K filed on November 17, 2005 | | | 1-8968 | |
| | | | |
| † | | (v) | | Form of Anadarko Petroleum Corporation Non-Executive 1999 Stock Incentive Plan Stock Option Agreement, | | filed as Exhibit 10.3 to Form 8-K filed on November 17, 2005 | | | 1-8968 | |
| | | | |
| † | | (vi) | | Form of Stock Option Agreement—1999 Stock Incentive Plan (UK Nationals) | | , filed as Exhibit 10.4 to Form 8-K filed on November 17, 2005 | | | 1-8968 | |
| | | | | | | | | | |
Exhibit
Number | | Description
| | Original Filed
Exhibit
| | File
Number | |
| † | | 10(vii)(vii) | | Amendment to Stock Option Agreement Under the Anadarko Petroleum Corporation 1999 Stock Incentive Plan, | | filed as Exhibit 10.1 to Form 8-K filed on January 23, 2007 | | | 1-8968 | |
| | | | |
| † | | (viii) | | Anadarko Petroleum Corporation 1999 Stock Incentive Plan (Amendment to Performance Unit Agreement) | | , filed as Exhibit 10.3 to Form 8-K filed on November 13, 2007 | | | 1-8968 | |
| | | | |
| † | | (ix) | | Form of Anadarko Petroleum Corporation 1999 Stock Incentive Plan Restricted Stock Agreement, | | filed as Exhibit 10(b)(xxiv) to Form 10-K for year ended December 31, 1999, filed on March 16, 2000 | | | 1-8968 | |
| | | | |
| † | | (x) | | Form of Anadarko Petroleum Corporation 1999 Stock Incentive Plan Restricted Stock Unit Award Letter, | | filed as Exhibit 10.1 to Form 8-K filed on November 13, 2007 | | | 1-8968 | |
| | | | |
| † | | (xi) | | The Approved UK Sub-Plan of the Anadarko Petroleum Corporation 1999 Stock Incentive Plan, | | filed as Exhibit 10(b)(xxiv) to Form 10-K for year ended December 31, 2003, filed on March 4, 2004 | | | 1-8968 | |
| | | | |
| † | | (xii) | | Key Employee Change of Control Contract, | | filed as Exhibit 10(b)(xxii) to Form 10-K for year ended December 31, 1997, filed on March 18, 1998 | | | 1-8968 | |
| | | | |
| † | | (xiii) | | First Amendment to Anadarko Petroleum Corporation Key Employee Change of Control Contract, | | filed as Exhibit 10(b) to Form 10-Q for quarter ended September 30, 2000, filed on November 13, 2000 | | | 1-8968 | |
| | | | |
| † | | (xiv) | | Form of Amendment to Anadarko Petroleum Corporation Key Employee Change of Control Contract, | | filed as Exhibit 10(b)(ii) to Form 10-Q for quarter ended June 30, 2003, filed on August 11, 2003 | | | 1-8968 | |
| | | | |
| † | | (xv) | | Form of Key Employee Change of Control Contract (2011) | | , filed as Exhibit 10(i) to Form 10-Q for quarter ended June 30, 2011, filed on July 27, 2011 | | | 1-8968 | |
| | | | |
| † | | (xvi) | | Letter Agreement regarding Post-Retirement Benefits, dated February 16, 2004—Robert J. Allison, Jr. | | , filed as Exhibit 10(b)(xxxiv) to Form
10-K for year ended December 31, 2003, filed on March 4, 2004 | | | 1-8968 | |
| | | | |
| | | | | | | | | | |
| | | | | | | | | | |
Exhibit
Number | | Description
| | Original Filed
Exhibit
| | File
Number | |
| | | | |
| † | | 10(xvii)(xvii) | | Anadarko Petroleum Corporation Savings Restoration Plan (As Amended and Restated Effective January 1, 2007) | | , filed as Exhibit 10(xxii) to Form 10-K
for year ended December 31, 2009, filed on February 23, 2010 |
| | 1-8968 | |
| | | | |
Exhibit Number | | Description |
| †* | 10 | (xviii) | | First Amendment, dated July 1, 2010, to the Anadarko Petroleum Corporation Savings Restoration Plan (As Amended and Restated Effective January 1, 2007) |
| †* | | (xix) | | Second Amendment, dated November 30, 2011, to the Anadarko Petroleum Corporation Savings Restoration Plan (As Amended and Restated Effective January 1, 2007) |
| †* | | (xx) | | Third Amendment, dated December 18, 2014, to the Anadarko Petroleum Corporation Savings Restoration Plan (As Amended and Restated Effective January 1, 2007) |
| † | | (xviii)(xxi) | | Anadarko Retirement Restoration Plan (As Amended and Restated Effective as of November 7, 2007) | | , filed as Exhibit 10.2 to Form 8-K filed on November 13, 2007 |
| †* | | 1-8968(xxii) | |
| | | | First Amendment, dated November 30, 2011, to the Anadarko Retirement Restoration Plan (As Amended and Restated Effective January 1, 2007) |
| † | | (xix)(xxiii) | | Anadarko Petroleum Corporation Estate Enhancement Program, | | filed as Exhibit 10(b)(xxxiv) to Form 10-K for year ended December 31, 1998, filed on March 15, 1999 | | | 1-8968 | |
| | | | |
| † | | (xx)(xxiv) | | Estate Enhancement Program Agreement between Anadarko Petroleum Corporation and Eligible Executives, | | filed as Exhibit 10(b)(xxxv) to Form 10-K for year ended December 31, 1998, filed on March 15, 1999 | | | 1-8968 | |
| | | | |
| † | | (xxi)(xxv) | | Estate Enhancement Program Agreements effective November 29, 2000, | | filed as Exhibit 10(b)(xxxxii) to Form 10-K for year ended December 31, 2000, filed on March 15, 2001 | | | 1-8968 | |
| | | | |
| † | | (xxii)(xxvi) | | Anadarko Petroleum Corporation Management Life Insurance Plan, restated November 1, 2002, | | filed as Exhibit 10(b)(xxxii) to Form 10-K for year ended December 31, 2002, filed on March 14, 2003 | | | 1-8968 | |
| | | | |
| † | | (xxiii)(xxvii) | | First Amendment to Anadarko Petroleum Corporation Management Life Insurance Plan, effective June 30, 2003, | | filed as Exhibit 10(b)(xliii) to Form 10-K for year ended December 31, 2003, filed on March 4, 2004 | | | 1-8968 | |
| | | | |
| † | | (xxiv)(xxviii) | | Second Amendment to Anadarko Petroleum Corporation Management Life Insurance Plan, effective January 1, 2008, | | filed as Exhibit 10(xxix) to Form 10-K for year ended December 31, 2009, filed on February 23, 2010 | | | 1-8968 | |
| | | | |
| † | | (xxv)(xxix) | | Anadarko Petroleum Corporation Officer Severance Plan, | | filed as Exhibit 10(b)(iv) to Form 10-Q for quarter ended September 30, 2003, filed on November 12, 2003 | | | 1-8968 | |
| | | | | | | | | | |
Exhibit
Number | | Description
| | Original Filed
Exhibit
| | File
Number | |
| † | | 10(xxvi)(xxx) | | Form of Termination Agreement and Release of All Claims Under Officer Severance Plan, | | filed as Exhibit 10(b)(v) to Form 10-Q for quarter ended September 30, 2003, filed on November 12, 2003 | | | 1-8968 | |
| | | | |
| † | | (xxvii)(xxxi) | | Form of Director and Officer Indemnification Agreement, | | filed as Exhibit 10 to Form 8-K filed on September 3, 2004 |
| | | 1-8968 | |
| | | | |
| | (xxviii)(xxxii) | | $5,000,000,000 Revolving Credit Agreement, dated as of September 2, 2010, among Anadarko Petroleum Corporation, as Borrower, JPMorgan Chase Bank, N.A., as Administrative Agent, Bank of America, N.A., DnB NorBank ASA, The Royal Bank of Scotland plc, Société Général, and Wells Fargo Bank, N.A., as Syndication Agents, and the several lenders named therein. | | therein, filed as Exhibit 10.1 to Form 8-K filed on September 8, 2010 |
| | | 1-8968 | |
| | | | |
| | (xxix)(xxxiii) | | First Amendment to Revolving Credit Agreement, dated as of August 3, 2011, to the Revolving Credit Agreement dated as of September 2, 2010, among Anadarko Petroleum Corporation, as Borrower, JPMorgan Chase Bank, N.A. as Administrative Agent, Bank of America, N.A., DnB Nor Bank ASA, The Royal Bank of Scotland plc, Société Générale, and Wells Fargo Bank, N.A., as co-syndication agents, and each of the Lenders from time to time party thereto. | | thereto, filed as Exhibit 10(i) to Form 10-Q for quarter ended September 30, 2011, filed on October 31, 2011 |
| | 1-8968 | |
| | | | |
Exhibit Number | | Description |
| 10 | (xxxiv) | | Second Amendment to Revolving Credit Agreement, dated as of March 26, 2014, to the Revolving Credit Agreement dated as of September 2, 2010, as amended on August 3, 2011, among Anadarko Petroleum Corporation, as Borrower, JPMorgan Chase Bank, N.A., as Administrative Agent, Bank of America, N.A., DnB Nor Bank ASA, The Royal Bank of Scotland plc, Société Générale, and Wells Fargo Bank, N.A., as co-syndication agents, and each of the Lenders from time to time party thereto, filed as Exhibit 10(ii) to Form 10-Q for quarter ended March 31, 2014, filed on May 5, 2014 |
| † | | (xxx)(xxxv) | | Anadarko Petroleum Corporation 2008 Omnibus Incentive Compensation Plan, effective as of May 20, 2008, | | filed as Exhibit 10.1 to Form 8-K filed on May 20,27, 2008 | | | 1-8968 | |
| | | | |
| † | | (xxxi)(xxxvi) | | Form of Anadarko Petroleum Corporation 2008 Omnibus Incentive Compensation Plan Stock Option Award Agreement, | | filed as Exhibit 10.3 to Form 8-K filed on November 13, 2009 | | | 1-8968 | |
| | | | |
| † | | (xxxii)(xxxvii) | | Form of Anadarko Petroleum Corporation 2008 Omnibus Incentive Compensation Plan Restricted Stock Unit Award Agreement, | | filed as Exhibit 10.1 to Form 8-K filed on November 13, 2009 | | | 1-8968 | |
| | | | |
| † | | (xxxiii)(xxxviii) | | Form of Anadarko Petroleum Corporation 2008 Omnibus Incentive Compensation Plan Performance Unit Award Agreement, | | filed as Exhibit 10.2 to Form 8-K filed on November 13, 2009 | | | 1-8968 | |
| | | | |
| † | | (xxxiv)(xxxvix) | | Anadarko Petroleum Corporation 2008 Director Compensation Plan, effective as of May 20, 2008, | | filed as Exhibit 10.2 to Form 8-K filed on May 27, 2008 | | | 1-8968 | |
| | | | |
| † | | (xxxv)(xl) | | Form of Award Letter for Anadarko Petroleum Corporation 2008 Director Compensation Plan, | | filed as Exhibit 10.3 to Form 8-K filed on May 27, 2008 |
| † | | 1-8968 | |
| | | | | | | | | | |
Exhibit
Number(xli) | | Description
| | Original Filed
Form of Award Letter for Anadarko Petroleum Corporation 2008 Director Compensation Plan (2013), filed as Exhibit | | File
Number | 10(i) to Form 10-Q for quarter ended June 30, 2013, filed on July 29, 2013 |
| † | | 10(xxxvi)(xlii) | | Anadarko Petroleum Corporation Benefits Trust Agreement, amended and restated effective as of November 5, 2008, | | filed as Exhibit 10(lvi) to Form 10-K
for year ended
December 31, 2008, filed on February 25, 2009 | | | 1-8968 | |
| | | | |
| † | | (xxxvii)(xliii) | | Anadarko Petroleum Corporation Deferred Compensation Plan (as amended and restated effective as of January 1, 2010) | | 10(xlvi)2012), filed as Exhibit 10(i) to Form 10-K
10-Q for yearthe quarter ended
December 31, 2009, June 30, 2014, filed on February 23, 2010 | | | 1-8968 | |
| | | | July 29, 2014 |
| † | | (xxxviii)(xliv) | | Amended and Restated Employment Agreement between James T. Hackett andFirst Amendment, dated December 17, 2013, to the Anadarko Petroleum Corporation dated November 11, 2009 | | 10.4Deferred Compensation Plan (as amended and restated effective as of January 1, 2012), filed as Exhibit 10(ii) to Form 8-K10-Q for the quarter ended June 30, 2014, filed on November 13, 2009July 29, 2014 |
| | | 1-8968 | |
| | | | |
† | | (xxxix) | | Letter Agreement between James T. Hackett and Anadarko Petroleum Corporation, dated February 16, 2012 | | 10.1 to Form 8-K filed on February 21, 2012 | | | 1-8968 | |
| | | | |
| | (xl)(xlv) | | Operating Agreement, dated October 1, 2009, between BP Exploration & Production Inc., as Operator, and MOEX Offshore 2007 LLC, as Non-Operator, as ratified by that certain Ratification and Joinder of Operating Agreement, dated December 17, 2009, by and among BP Exploration & Production Inc., Anadarko Petroleum Corporation (as Non-Operator), Anadarko E&P Company LP (as predecessor in interest to Anadarko Petroleum Corporation), and MOEX Offshore 2007 LLC, together with material exhibits. | | exhibits, filed as Exhibit 10 to Form 10-Q
for quarter ended June 30, 2010, filed on August 3, 2010 |
| | | 1-8968 | |
| | | | |
† | | (xli) | | Retention Agreement, dated August 2, 2010 | | 10.1 to Form 8-K filed on August 6, 2010 | | | 1-8968 | |
| | | | |
‡ | | * (xlii)(xlvi) | | Confidential Settlement Agreement, Mutual Releases and Agreement to Indemnify, dated October 16, 2011, by and among BP Exploration & Production Inc., Anadarko Petroleum Corporation, Anadarko E&P Company LP, BP Corporation North America Inc. and BP p.l.c. | | | | | | |
| | | | , filed as Exhibit 10(xlii) to Form 10-K for year ended December 31, 2011, filed on February 21, 2012 (Portions of this exhibit have been omitted and filed separately with the SEC pursuant to a request for confidential treatment) |
| † | | (xliii)(xlvii) | | Severance Agreement between R.A.R. A. Walker and Anadarko Petroleum Corporation, dated February 16, 2012, | | filed as Exhibit 10.2 to Form 8-K filed on February 21, 2012 |
| † | | 1-8968(xlviii) | | Time Sharing Agreement between R. A. Walker and Anadarko Petroleum Corporation, dated May 15, 2012, filed as Exhibit 10(ii) to Form 10-Q for quarter ended June 30, 2012, filed on August 8, 2012 |
|
| | | | |
Exhibit Number | | Description |
| † | 10 | (xlix) | | Anadarko Petroleum Corporation 2012 Omnibus Incentive Compensation Plan, effective as of May 15, 2012, filed as Exhibit 10.1 to Form 8-K filed on May 15, 2012 |
| † | | (l) | | Form of Anadarko Petroleum Corporation 2012 Omnibus Incentive Compensation Plan Stock Option Award Agreement, filed as Exhibit 10.2 to Form 8-K filed on May 15, 2012 |
| † | | (li) | | Form of Anadarko Petroleum Corporation 2012 Omnibus Incentive Compensation Plan Restricted Stock Unit Award Agreement, filed as Exhibit 10.3 to Form 8-K filed on May 15, 2012 |
| † | | (lii) | | Form of Anadarko Petroleum Corporation 2012 Omnibus Incentive Compensation Plan Performance Unit Award Agreement, filed as Exhibit 10.4 to Form 8-K filed on May 15, 2012 |
| † | | (liii) | | Form of Anadarko Petroleum Corporation 2012 Omnibus Incentive Compensation Plan Restricted Stock Unit Award Agreement, filed as Exhibit 10.1 to Form 8-K filed on November 9, 2012 |
| † | | (liv) | | Form of Anadarko Petroleum Corporation 2012 Omnibus Incentive Compensation Plan Performance Unit Award Agreement, filed as Exhibit 10.2 to Form 8-K filed on November 9, 2012 |
| † | | (lv) | | Form of Anadarko Petroleum Corporation 2012 Omnibus Incentive Compensation Plan Performance Unit Award Agreement (2014), filed as Exhibit 10.1 to Form 8-K filed on November 10, 2014 |
| † | | (lvi) | | Form of U.K. Award Letter for Anadarko Petroleum Corporation 2008 Director Compensation Plan, filed as Exhibit 10.5 to Form 8-K filed on May 15, 2012 |
| † | | (lvii) | | Amended and Restated Performance Unit Award Agreement, effective November 5, 2012, for R. A. Walker, filed as Exhibit 10.3 to Form 8-K filed on November 9, 2012 |
| | (lviii) | | Settlement Agreement dated as of April 3, 2014, by and among (1) the Anadarko Litigation Trust, (2) the United States of America in its capacity as plaintiff-intervenor in the Tronox Adversary Proceeding and acting for and on behalf of certain U.S. government agencies and (3) Anadarko Petroleum Corporation, Kerr-McGee Corporation, and certain other subsidiaries, filed as exhibit 10.1 to Form 8-K filed on April 3, 2014 |
| | (lix) | | Credit Agreement, dated as of June 17, 2014, among Anadarko Petroleum Corporation, as Borrower, JPMorgan Chase Bank, N.A., as Administrative Agent, Wells Fargo Bank, National Association, as Syndication Agent, Bank of America, N.A., Citibank, N.A., The Royal Bank of Scotland plc, and The Bank of Tokyo-Mitsubishi UFJ, Ltd., as Co-Documentation Agents, and the additional lenders party thereto, filed as Exhibit 10.1 to Form 8-K filed on June 23, 2014 |
| | (lx) | | First Amendment to Credit Agreement, dated November 14, 2014, among Anadarko Petroleum Corporation, JPMorgan Chase Bank, N.A., as Administrative Agent, and the lenders party thereto, filed as Exhibit 10.1 to Form 8-K filed on November 19, 2014 |
| | (lxi) | | 364-Day Revolving Credit Agreement, dated as of June 17, 2014, among Anadarko Petroleum Corporation, as Borrower, JPMorgan Chase Bank, N.A., as Administrative Agent, Wells Fargo Bank, National Association, as Syndication Agent, Bank of America, N.A., Citibank, N.A., The Royal Bank of Scotland plc, and The Bank of Tokyo-Mitsubishi UFJ, Ltd., as Co-Documentation Agents, and the additional lenders party thereto, filed as Exhibit 10.2 to Form 8-K filed on June 23, 2014 |
| | (lxii) | | First Amendment to 364-Day Revolving Credit Agreement, dated November 14, 2014, among Anadarko Petroleum Corporation, JPMorgan Chase Bank, N.A., as Administrative Agent, and the lenders party thereto, filed as Exhibit 10.2 to Form 8-K filed on November 19, 2014 |
| * | 12 | | | Computation of Ratios of Earnings to Fixed Charges and Earnings to Combined Fixed Charges and Preferred Stock Dividends |
| * | 21 | | | List of Subsidiaries |
| * | 23 | (i) | | Consent of KPMG LLP |
| * | 23 | (ii) | | Consent of Miller and Lents, Ltd. |
|
| | | | |
Exhibit Number | | *21 | | List of Subsidiaries | | | | | | Description |
| * | | | | |
| 24 | | *23(i) | | Consent of KPMG LLP | | | | | | |
| | | | |
| | *23(ii) | | Consent of Miller and Lents, Ltd. | | | | | | |
| | | | |
| | *24 | | Power of Attorney | | | | | | |
| * | 31 | | | |
| | *31(i)(i) | | Rule 13a-14(a)/15d-14(a) Certification—Chief Executive Officer | | | | | | |
| | | | | | | | |
Exhibit
Number* | 31 | Description
| | Original Filed
Exhibit
| | File
Number |
| | | | |
| | * 31(ii)(ii) | | Rule 13a-14(a)/15d-14(a) Certification—Chief Financial Officer |
| ** | 32 | | |
| | | | |
| | * 32 | | Section 1350 Certifications | | | | |
| * | | | | |
| | * 99 | | 2011 | Report of Miller and Lents, Ltd. | | | | |
| * | 101 | | | |
| | *101 .INS | | XBRL Instance Document | | | | |
| * | 101 | | | |
| | *101 .SCH | | XBRL Schema Document | | | | |
| * | 101 | | | |
| | *101 .CAL | | XBRL Calculation Linkbase Document |
| * | 101 | .DEF | | XBRL Definition Linkbase Document |
| * | 101 | | | |
| | *101 .LAB | | XBRL Label Linkbase Document | | | | |
| * | 101 | | | |
| | *101 .PRE | | XBRL Presentation Linkbase Document | | | | |
| | | | |
| | *101 .DEF | | XBRL Definition Linkbase Document | | | | |
| † | Management contracts or compensatory plans or arrangements required to be filed pursuant to Item 15. |
‡ | Application has been made to the Securities and Exchange Commission (SEC) for confidential treatment of certain provisions of the exhibit. Omitted material for which confidential treatment has been requested has been filed separately with the SEC.
|
The total amount of securities of the registrant authorized under any instrument with respect to long-term debt not filed as an exhibit does not exceed 10% of the total assets of the registrants and its subsidiaries on a consolidated basis. The registrant agrees, upon request of the SEC, to furnish copies of any or all of such instruments to the SEC.
b)FINANCIAL STATEMENT SCHEDULES
Financial statement schedules have been omitted because they are not required, not applicable, or the information is included in the Company’s Consolidated Financial Statements.
Pursuant to the requirements of Section 13 or 15(d) of the Securities Exchange Act of 1934, the registrant has duly caused this report to be signed on its behalf by the undersigned, thereunto duly authorized.
|
| | | |
| | | ANADARKO PETROLEUM CORPORATION |
| | ANADARKO PETROLEUM CORPORATION
|
| | |
February 21, 2012 | 20, 2015 | By: | | /s/ ROBERT G. GWIN |
| | | | Executive Vice President, Finance and Chief Financial Officer |
Pursuant to the requirements of the Securities Exchange Act of 1934, this Reportreport has been signed below by the following persons on behalf of the registrant and in the capacities indicated on February 21, 2012.20, 2015. | |
| | |
Name and Signature | | Title |
| |
(i) Principal executive officer:* officer and director: | | |
| |
JAMES T. HACKETT
/s/ R. A. WALKER | | Chairman, President and Chief Executive Officer |
James T. HackettR. A. Walker | | |
| |
(ii) Principal financial officer: | | Senior |
| /s/ ROBERT G. GWIN | | Executive Vice President, Finance and Chief Financial Officer |
/s/ ROBERT G. GWIN
| |
| Robert G. Gwin | | |
| |
(iii) Principal accounting officer: | | |
| |
/s/ M. CATHY DOUGLAS | | Senior Vice President, and Chief Accounting Officer and Controller |
| M. Cathy Douglas | |
| |
| |
| (iv) Directors:* | | |
ANTHONY R. CHASE KEVIN P. CHILTON LUKE R. CORBETT
PETER J. FLUOR PRESTON M. GEREN III
RICHARD L. GEORGE CHARLES W. GOODYEAR JOSEPH W. GORDER JOHN R. GORDON JAMES T. HACKETT
PAULA ROSPUT REYNOLDS
MARK C. MCKINLEY ERIC D. MULLINS | | |
| | |
* Signed on behalf of each of these persons and on his own behalf: |
|
| | |
By: | | /s/ ROBERT G. GWIN | | |
| | Robert G. Gwin, Attorney-in-Fact | | |
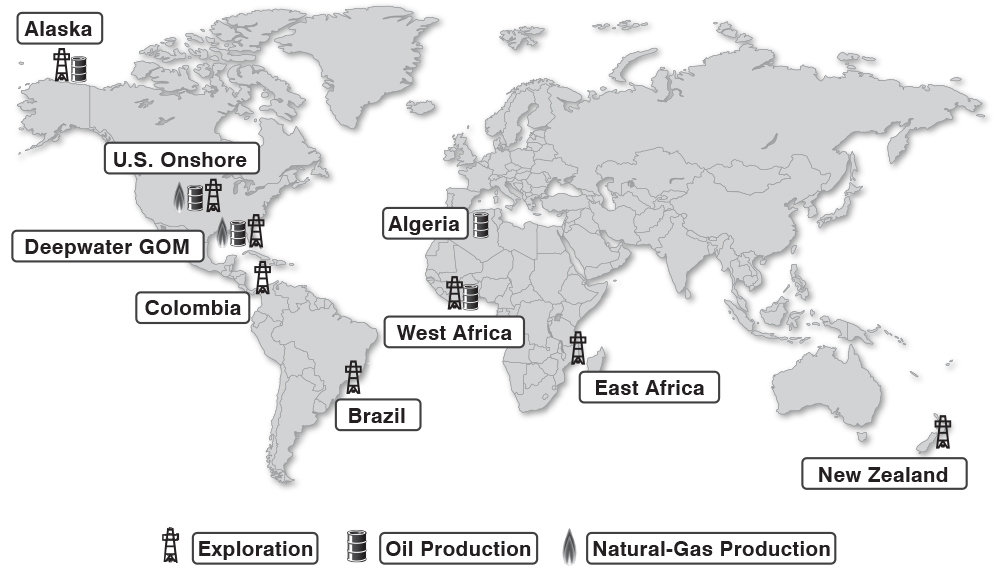
 The following includes the significant development, exploration, and appraisal activity in the Gulf of Mexico during 2014.