| þ | ANNUAL REPORT PURSUANT TO SECTION 13 OR 15(d) OF THE SECURITIES EXCHANGE ACT OF 1934 |
OF THE SECURITIES EXCHANGE ACT OF 1934
2013
| ¨ | TRANSITION REPORT PURSUANT TO SECTION 13 OR 15(d) OF THE SECURITIES EXCHANGE ACT OF 1934 |
OF THE SECURITIES EXCHANGE ACT OF 1934
| Delaware | 76-0515284 | |
(State or other jurisdiction of incorporation or organization) | (I.R.S. Employer Identification No.) | |
|
| |
Title of each class |
| |
| Common Stock, par value $.01 per share | New York and Chicago Stock Exchanges | |
Note — Checking the box above will not relieve any registrant required to file reports pursuant to Section 13 or 15(d) of the Exchange Act from their obligations under those Sections.
Indicate by check mark if disclosure of delinquent filers pursuant to Item 405 of Regulation S-K is not contained herein, and will not be contained, to the best of registrant’s knowledge, in definitive proxy or information statements incorporated by reference in Part III of this Form 10-K or any amendment to this Form 10-K. þ
þ
Large accelerated filer þ | Accelerated filer ¨ | Non-accelerated filer ¨ | Smaller reporting company ¨ | |||
| (Do not check if a smaller reporting company) | ||||||
State the
| ||
|
INDICATE THE NUMBER OF SHARES OUTSTANDING OF EACH OF THE REGISTRANT’S CLASSES OF COMMON STOCK, AS OF THE LATEST PRACTICABLE DATE. New York Stock Exchange on June 28, 2013, was approximately $2.7 billion.
2014 was 60,922,497.
| Document | Part of the Form 10-K into which incorporated | |
| Portions of Tenneco Inc.’s Definitive Proxy Statement for the Annual Meeting of Stockholders to be held May | Part III | |
general economic, business and market conditions; our ability to source and procure needed materials, components and other products and services in accordance with customer demand and at competitive prices; changes in capital availability or costs, including increases in our cost of borrowing (i.e., interest rate increases), the amount of our debt, our ability to access capital markets at favorable rates, and the credit ratings of our debt; changes in consumer demand, prices and our ability to have our products included on top selling vehicles, including any shifts in consumer preferences away from light trucks, which tend to be higher margin products for our customers and us, to other lower margin vehicles, for which we may or may not have supply changes in consumer demand for our automotive, commercial or aftermarket products, or changes in automotive and commercial vehicle manufacturers’ production rates and their actual and forecasted requirements for our products, due to difficult economic conditions, such as the the overall highly competitive nature of the automobile and commercial vehicle parts industries, and any resultant inability to realize the sales represented by our awarded book of business (which is based on anticipated pricing and volumes the loss of any of our large original equipment manufacturer (“OEM”) customers (on whom we depend for a substantial portion of our revenues), or the loss of market shares by these customers if we are unable to achieve increased sales to other our ability to successfully execute cash management and other cost reduction plans, including our current European cost reduction initiatives, and to realize anticipated benefits from these plans; increases in the costs of raw materials, including our ability to successfully reduce the impact of any such cost increases through materials substitutions, cost reduction initiatives, the negative impact of higher fuel prices on transportation and logistics costs, raw material costs and discretionary purchases of vehicles or aftermarket products; the cyclical nature of the global vehicle industry, including the performance of the global aftermarket sector and the impact of vehicle parts’ longer product costs related to product warranties and other customer satisfaction actions; Annual Report contains forward-looking statements within the meaning of the Private Securities Litigation Reform Act of 1995 concerning, among other things, our prospects and business strategies. These forward-looking statements are included in various sections of this report, including the section entitled “Outlook” appearing in Item 7 of this report. The words “may,” “will,” “believe,” “should,” “could,” “plan,” “expect,” “anticipate,” “estimate,” and similar expressions (and variations thereof), identify these forward-looking statements. Although we believe that the expectations reflected in these forward-looking statements are based on reasonable assumptions, these expectations may not prove to be correct. Because these forward-looking statements are also subject to risks and uncertainties, actual results may differ materially from the expectations expressed in the forward-looking statements. Important factors that could cause actual results to differ materially from the expectations reflected in the forward-looking statements include:contracts;significant production cuts during 2008 and 2009 by automotive manufacturersprolonged recession in response to difficult economic conditions;forover the life of the applicable program over its life)program);OEMs;suppliers (such as the 2008 strike at American Axle, which disrupted our supply of products for significant General Motors (GM) platforms);suppliers;low cost country sourcing,customer recovery and price recovery efforts with aftermarket and OE customers;lives of vehicle parts;our ability to successfully execute cash management, restructuring and other cost reduction plans and to realize anticipated benefits from these plans;
the cost and outcome of existing and any future claims, legal proceedings or investigations, including, but not limited to, claims or proceedings against us or our customers relating to product performance, product safety or intellectual property rights;
changes in distribution channels or competitive conditions in the markets and countries where we operate, including the impact of changes in distribution channels for aftermarket products on our ability to increase or maintain aftermarket sales;
the cost and outcome of existing and any future legal proceedings, including, but not limited to, proceedings against us or our customers relating to intellectual property rights;
economic, exchange rate and political conditions in the countries where we operate or sell our products;
customer acceptance of new products;
new technologies that reduce the demand for certain of our products or otherwise render them obsolete;
our ability to introduce new products and technologies that satisfy customers' needs in a timely fashion;
our ability to successfully integrate any acquisitions that we complete and effectively manage our joint ventures and other third-party relationships;
changes by the Financial Accounting Standards Board or the Securities and Exchange Commission of authoritative generally accepted accounting principles or policies;
changes in accounting estimates and assumptions, including changes based on additional information;
any changes by the International Standards Organization for Standardization (ISO), Technical Specifications (TS) and or other such committees in their certification processesprotocols for processes and products, which may have the effect of delaying or hindering our ability to bring new products to market;
the impact of changes inthe extensive, increasing and compliance withchanging laws and regulations to which we are subject, including environmental laws and regulations, which may result in our incurrence of environmental liabilities in excess of the amount reserved, the implementation of mandated timelines for local, regional and national emission regulations, which could impact the demand for certain of our products, and any changes to the timing of the funding requirements for our pension and other postretirement benefit liabilities;
the potential impairment in the carrying value of our long-lived assets and goodwill or our deferred tax assets;
potential volatility in our effective tax rate;
natural disasters, such as the 2011 earthquake in Japan and flooding in Thailand, and any resultant disruptions in the supply or production of goods or services to us or by us or in demand by our customers;
acts of war and/or terrorism, as well as actions taken or to be taken by the United States and other governments as a result of further acts or threats of terrorism, and the impact of these acts on economic, financial and social conditions in the countries where we operate; and
the timing and occurrence (or non-occurrence) of other transactions, events and circumstances which may be beyond our control.
| PART I | ||||||||
Item 1. | ||||||||
Item 1A. | ||||||||
Item 1B. | ||||||||
Item 2. | ||||||||
Item 3. | ||||||||
Item 4. | ||||||||
Item 4.1. | ||||||||
| PART II | ||||||||
Item 5. | ||||||||
Item 6. | ||||||||
Item 7. | ||||||||
Item 7A. | ||||||||
Item 8. | ||||||||
Item 9. | ||||||||
Item 9A. | ||||||||
| Item 9B. | ||||||||
| PART III | |||||||
Item 10. | ||||||||
Item 11. | ||||||||
Item 12. | ||||||||
Item 13. | ||||||||
Item 14. | ||||||||
| PART IV | ||||||||
Item 15. | ||||||||
14, 2014.
Six of our eight directors are independent under the New York Stock Exchange (“NYSE”)NYSE listing standards.
Independent directors are scheduled to meet separately in executive session after every regularly scheduled Board of Directors meeting.
We have a lead independent director, Mr. Paul T. Stecko.
All members meet the independence standards for audit committee membership under the NYSE listing standards and applicable Securities and Exchange Commission (“SEC”) rules. The Audit Committee operates under a written charter which governs its duties and responsibilities, including its sole authority to appoint, review, evaluate and replace our independent auditors. The Audit Committee has adopted policies and procedures governing the pre-approval of all audit, audit-related, tax and other services provided by our independent auditors. All members meet the independence standards for compensation and nominating committee membership under the NYSE listing standards. The Compensation/Nominating/Governance Committee operates under a written charter that governs its duties and responsibilities, including the responsibility for executive compensation. We have an Executive Compensation Subcommittee which has the responsibility to consider and approve We have adopted Corporate Governance Principles, including qualification and independence standards for directors. The Stock Ownership Guidelines apply to the independent directors, the Chairman and Chief Executive Officer, and all other officers with a rank of Vice President or higher. The Audit Committee has established a process for confidential and anonymous submission by our employees, as well as submissions by other interested parties, regarding questionable accounting or auditing matters. Additionally, the Board of Directors has established a process for stockholders to communicate with the Board of Directors, as a whole, or any independent director. We have adopted a Code of Ethical Conduct for Financial Managers, which applies to our Chief Executive Officer, Chief Operating Officer, Chief Financial Officer, Controller and other key financial managers. This code is filed as Exhibit 14 to this report. We also operate under a We have adopted a Policy and Procedure for Transactions With Related Persons, under which our Board of Directors must generally pre-approve transactions involving more than $120,000 with our directors, executive officers, five percent or greater stockholders and their immediate family members. We have adopted a written policy for all issuances by our company of compensatory awards in the form of our common stock or any derivative of the common stock. We comply with and operate in a manner consistent with the legislation outlawing extensions of credit in the form of a personal loan to or for our directors or executive officers. website as soon as reasonably practicable after submission to the SEC. Securities ownership reports on Forms 3, 4 and 5 are also available free of charge on our website as soon as reasonably practicable after submission to the SEC. The contents of our website are not, however, a part of this report. All such statements and reports can also be found at the internet site maintained by the SEC athttp://www.sec.gov. results; and management’s announced organizational changes on February 14, 2013 that aligned our business along product lines, effective with the first quarter of 2013, such that our three prior geographic reportable segments have each been split into two product segments (clean air and ride performance) and three geographic areas (North America; Europe, South America and India; and Asia Pacific), resulting in six operating segments (North America Clean Air, North America Ride Performance, Europe, South America and India Clean Air, Europe, South America and India Ride Performance, Asia Pacific Clean Air and Asia Pacific Ride Performance). The Clean Air division includes the company's emissions control businesses and the Ride Performance division is comprised of its ride control businesses. Costs related to other business activities, primarily corporate headquarter functions, are disclosed separately from the six operating segments as "Other". Prior period segment information has been revised to reflect our new reporting segments. North America Europe, South America and India Asia Pacific Intergroup sales Total North America Europe, South America and India Asia Pacific Total North America Europe, South America and India Asia Pacific Total Equipment: Interest expense (net of interest capitalized) Income tax expense Noncontrolling interests Australia. software which we have developed and sold to several customers. in the aftermarket space. In addition to these efforts, we continue to promote the Safety Triangle “Modules” are groups of component parts arranged in close physical proximity to each other within a vehicle. Modules are often assembled by the supplier and shipped to the OEM for installation in a vehicle as a unit. Integrated shock and spring units, seats, instrument panels, axles and door panels are examples. “Systems” are groups of component parts located throughout a vehicle which operate together to provide a specific vehicle functionality. Emission control systems, anti-lock braking systems, safety restraint systems, roll control systems and powertrain systems are examples. world. 2018. Emission Control Products & Systems Aftermarket Original Equipment OE Value-add OE Substrate(1) Ride Control Products & Systems Aftermarket Original Equipment Total Revenues 2013. Customer General Motors Ford 2013. automobiles and other capital goods. Aftermarket sales tend not to be as adversely affected during periods of economic downturn, as consumers forego new vehicle purchases and keep their vehicles longer, thereby increasing demand for repair and maintenance services. By participating in both the OE and aftermarket segments, we generally see a smaller revenue decline during economic downturns than the overall change in OE production. Catalytic converters and diesel oxidation catalysts — Devices consisting of a substrate coated with precious metals enclosed in a steel casing used to reduce harmful gaseous emissions such as carbon monoxide; Diesel Particulate Filters (DPFs) — Devices to capture and regenerate particulate matter emitted from diesel engines; Burner systems — Devices which actively combust fuel and air inside the exhaust system to create extra heat for DPF regeneration, or Lean NOx traps — Devices which reduce Hydrocarbon vaporizers and injectors — Devices to add fuel to a diesel exhaust system in order to regenerate diesel particulate filters or Lean NOx traps; Alternative NOx reduction technologies — Devices which reduce NOx emissions from diesel powertrains, by using alternative reductants such as diesel fuel, E85 (85% ethanol, 15% gasoline), or solid forms of ammonia; Mufflers and resonators — Devices to provide noise elimination and acoustic tuning; Fabricated Exhaust manifolds — Components that collect gases from individual cylinders of a vehicle’s engine and direct them into a single exhaust pipe; fabricated manifolds can form the core of an emissions module Pipes — Utilized to connect various parts of both the hot and cold ends of an exhaust system; Hydroformed assemblies — Forms in various geometric shapes, such as Y-pipes or T-pipes, which provide optimization in both design and installation as compared to conventional pipes; Hangers and isolators — Used for system installation and elimination of noise and vibration, and for the improvement of useful life; and Aftertreatment control units — Computerized electronic devices that utilize embedded software to regulate the performance of active aftertreatment systems, including the control of sensors, injectors, vaporizers, pumps, heaters, valves, actuators, wiring harnesses, relays and other mechatronic components. Shock absorbers — A broad range of mechanical shock absorbers and related components for light- and heavy-duty vehicles, including twin-tube and monotube shock absorbers; Struts — A complete line of struts and strut assemblies for light vehicles; Advanced suspension systems — Shock absorbers and suspension systems that electronically adjust a vehicle’s performance based on inputs such as steering and braking; Other — We also offer other ride in Europe. 13 in Asia Pacific. Manufacturing & Engineering). The innovation of our KBM&E (which we call TEN-KBM&E) is a modular toolbox set of CAD embedded applications for manufacturing and engineering compliant design. The encapsulated TEN-KBM&E content is driven by an analytical method which continuously Performance Of the seven ride performance engineering and technical facilities, two are located in North America, four in Europe, South America and India, and one in Asia Pacific. assembly operation in Europe. Adaptive damping systems — adapt to the vehicle’s motion to better control undesirable vehicle motions; Electronically adjustable suspensions — change suspension performance based on a variety of inputs such as steering, braking, vehicle height, and velocity; and Air leveling systems — manually or automatically adjust the height of the vehicle. Geographically SOLID-SCR 2015. labor agreements in Mexico and the U.S. are scheduled for renegotiation in Our ability to make payments on our indebtedness depends on our ability to generate cash in the future. If we do not generate sufficient cash flow to meet our debt service and working capital requirements, we may need to seek additional financing or sell assets. This may make it more difficult for us to obtain financing on terms that are acceptable to us, or at all. Without For example, as a result of the economic downturn in 2008 and 2009, we needed to amend our senior credit agreement to revise the financial ratios we are required to maintain. Even though we were able to obtain that amendment, we cannot assure you that we would be able to obtain an amendment on commercially reasonable terms, or at all, if required in the future. disruptions were to occur, our business could be adversely affected by, for instance, a loss of revenues, increased costs or reduced profitability. We have not experienced a material labor disruption in our recent history, but there can be no assurance that we will not experience a material labor disruption at one of our facilities in the future in the course of renegotiation of our labor arrangements or otherwise. these constraints. component products in new vehicles sold to consumers. Warranty claims may range from individual customer claims to full recalls of all products in the field. We cannot assure you that costs associated with providing product warranties will not be material, or that those costs will not exceed any amounts reserved in our consolidated financial statements. For a description of our accounting policies regarding warranty reserves, see “Management’s Discussion and Analysis of Financial Condition and Results of Operations — Critical Accounting Policies” included in Item 7. well as prohibitions on the conduct of our business, and could also materially affect our reputation, business and results of operations. been awarded. We cannot be certain that we will be able to generate cost savings and operational improvements in the future that are sufficient to offset price reductions requested by existing customers and necessary to win additional business. exposure to local economic exposure to local political conditions, including the risk of seizure of assets by a foreign government; exposure to local social unrest, including any resultant acts of war, terrorism or similar events; exposure to local public health issues and the resultant impact on economic and political conditions; currency exchange rate fluctuations; hyperinflation in certain foreign countries; controls on the repatriation of cash, including imposition or increase of withholding and other taxes on remittances and other payments by foreign subsidiaries; export and import unit and during the fiscal year ended December 31, 2012, we recorded non-cash asset impairment charges of $4 million related to the announced closing of our aftermarket clean air plant in Vittaryd, Sweden, and a $7 million asset impairment charge related to certain assets of our European ride performance business. facility and is located in Europe. United Arab Emirates. environmental regulations that relate to current operations. We expense costs related to an existing condition caused by past operations that do not contribute to current or future revenue generation. As of December 31, out of business or file for bankruptcy, we may experience an increased number of these claims. We vigorously defend ourselves against these claims as part of our ordinary course of business. In future periods, we could be subject to cash costs or charges to earnings if any of these matters are resolved unfavorably to us. To date, with respect to claims that have proceeded sufficiently through the judicial process, we have regularly achieved favorable resolutions. Accordingly, we presently believe that these asbestos-related claims will not have a material adverse impact on our future consolidated financial condition, results of operations or cash flows. Name and Age Offices Held Hari N. Nair Josep Fornos (61) Neal A. Yanos Brent J. Bauer James D. Harrington Paul D. Novas Quarter 2011 1st 2nd 3rd 4th 2010 1st 2nd 3rd 4th Period October 2011 November 2011 December 2011 Total Tenneco Inc. S&P 500 Peer Group Statements of Income (Loss) Data: Net sales and operating revenues — North America Europe, South America and India Asia Pacific Intergroup sales Earnings (loss) before interest expense, income taxes, and noncontrolling interests North America Europe, South America and India Asia Pacific Total Interest expense (net of interest capitalized) Income tax expense Net income (loss) Less: Net income attributable to noncontrolling interests Net income (loss) attributable to Tenneco Inc. Weighted average shares of common stock outstanding — Basic Diluted Basic earnings (loss) per share of common stock Diluted earnings (loss) per share of common stock Balance Sheet Data (at year end): Total assets Short-term debt Long-term debt Redeemable noncontrolling interests Total Tenneco Inc. shareholders’ equity Noncontrolling interests Total equity Statement of Cash Flows Data: Net cash provided by operating activities Net cash used by investing activities Net cash used by financing activities Cash payments for plant, property and equipment Other Data: EBITDA including noncontrolling interests(d) Ratio of EBITDA including noncontrolling interests to interest expense Ratio of net debt (total debt less cash and cash equivalents) to EBITDA including noncontrolling interests(e) Ratio of earnings to fixed charges(f) EBITDA including noncontrolling interests is a non-GAAP measure defined as net income before extraordinary items, cumulative effect of changes in accounting principle, interest expense, income taxes, depreciation and amortization and noncontrolling interests. We use EBITDA including noncontrolling interests, together with GAAP measures, to evaluate and compare our operating performance on a consistent basis between time periods and with other companies that Net income (loss) Noncontrolling interests Income tax expense Interest expense, net of interest capitalized Depreciation and amortization of other intangibles Total EBITDA including noncontrolling interests in Item 8. businesses. Year ended December 31, 2010 Volume and mix Material Currency exchange rates Restructuring Other Costs Year ended December 31, 2011 rates. better material cost management. year-over-year increase. transactions originated by The Pullman Company before being acquired by Tenneco in 1996. related to the European ride performance business. sales. 2012 North America Original Equipment Ride Control Emission Control Total North America Original Equipment North America Aftermarket Ride Control Emission Control Total North America Aftermarket Total North America Europe Original Equipment Ride Control Emission Control Total Europe Original Equipment Europe Aftermarket Ride Control Emission Control Total Europe Aftermarket South America & India Total Europe, South America & India Asia Australia Total Asia Pacific Total Tenneco North America Original Equipment Ride Control Emission Control Total North America Original Equipment North America Aftermarket Ride Control Emission Control Total North America Aftermarket Total North America Europe Original Equipment Ride Control Emission Control Total Europe Original Equipment Europe Aftermarket Ride Control Emission Control Total Europe Aftermarket South America & India Total Europe, South America & India Asia Australia Total Asia Pacific Total Tenneco North America Original Equipment Ride Control Emission Control Total North America Original Equipment North America Aftermarket Ride Control Emission Control Total North America Aftermarket Total North America Europe Original Equipment Ride Control Emission Control Total Europe Original Equipment Europe Aftermarket Ride Control Emission Control Total Europe Aftermarket South America & India Total Europe, South America & India Asia Australia Total Asia Pacific Total Tenneco North America Europe South America India Total Europe, South America & India China Australia revenues. 2011 North America Original Equipment Ride Control Emission Control Total North America Original Equipment North America Aftermarket Ride Control Emission Control Total North America Aftermarket Total North America Europe Original Equipment Ride Control Emission Control Total Europe Original Equipment Europe Aftermarket Ride Control Emission Control Total Europe Aftermarket South America & India Total Europe, South America & India Asia Australia Total Asia Pacific Total Tenneco North America Original Equipment Ride Control Emission Control Total North America Original Equipment North America Aftermarket Ride Control Emission Control Total North America Aftermarket Total North America Europe Original Equipment Ride Control Emission Control Total Europe Original Equipment Europe Aftermarket Ride Control Emission Control Total Europe Aftermarket South America & India Total Europe, South America & India Asia Australia Total Asia Pacific Total Tenneco North America Original Equipment Ride Control Emission Control Total North America Original Equipment North America Aftermarket Ride Control Emission Control Total North America Aftermarket Total North America Europe Original Equipment Ride Control Emission Control Total Europe Original Equipment Europe Aftermarket Ride Control Emission Control Total Europe Aftermarket South America & India Total Europe, South America & India Asia Australia Total Asia Pacific Total Tenneco North America Europe South America India Total Europe, South America & India China Australia Pacific revenues. North America Europe, South America and India Asia Pacific 2012 North America Restructuring and related expenses Pension Charges(1) Europe, South America and India Restructuring and related expenses Asia Pacific Restructuring and related expenses Goodwill impairment charge(2) certain assets of our European ride performance business. Currency had a $14 million North America Europe, South America and India Asia Pacific 2011 North America Restructuring and related expenses Pension Charges(1) Environmental reserve(2) Europe, South America and India Restructuring and related expenses Asia Pacific Restructuring and related expenses North America Europe, South America and India Asia Pacific Total Tenneco revenues in 2013 was even compared to last year. In North America, EBIT as a percentage of costs to support new plants and new customers in Asia. 2012. is eliminated. In 2012, we incurred $13 million in restructuring and related costs, primarily related to headcount reductions in South America and non-cash asset write downs of $4 million in Europe, of which $10 million was recorded in cost of sales and $3 million was recorded in SG&A. In 2013, we have incurred $78 million in restructuring and related costs, primarily related to European cost reduction efforts including non-cash asset write downs of $3 million, our exit from the distribution of aftermarket exhaust products and ending production of leaf springs in Australia, headcount reductions in various regions, and the net impact of freezing our defined benefit plans in the United Kingdom, of which $70 million was recorded in cost of sales, $6 million in SG&A, $1 million in engineering expense and $1 million in other expense. Severance the third quarter. The net impact of these items increased earnings per diluted common share by $1.18. We reported Cash provided (used) by: Operating activities Investing activities Financing activities 2012 2012. Changes in restricted cash were a use of cash of $5 million in 2013. Cash provided (used) by: Operating activities Investing activities Financing activities 10 percent. North America Europe China South America North America Europe China Brazil U.S. (³25hp) Europe (³50hp) between $190 million and $210 million and our 2014 tax rate to be between 36 percent and 38 percent. Short-term debt and maturities classified as current Long-term debt Total debt Total redeemable noncontrolling interests Total noncontrolling interests Tenneco Inc. shareholders’ equity Total equity Total capitalization dollars. our Tranche A Term Facility due March 22, 2017, $225 million of 7 Applicable Margin over: LIBOR for Revolving Loans LIBOR for Term Loan B Loans LIBOR for Term Loan A Loans LIBOR for Tranche B-1 Loans Prime-based Term Loan A Loans Prime for Revolving Loans Prime for Term Loan B Loans Prime for Tranche B-1 Loans Federal Funds for Revolving Loans Federal Funds for Term Loan B Loans Federal Funds for Tranche B-1 Loans Commitment Fee 2013. Leverage Ratio (maximum) Interest Coverage Ratio (minimum) 2.55 through December 31, 2013 and 2.75 thereafter, through March 22, 2017. Pro forma Consolidated Leverage Ratio Greater than or equal to 3.0x Greater than or equal to 2.5x Less than 2.5x redemption): year, but some may be cancelled with notice 90 days prior to renewal. In some instances, the arrangement provides for cancellation by the applicable financial institution at any time upon agreement. No negotiable financial instruments were held by our European subsidiary as of December 31, 2013 and December 31, 2012, respectively. Obligations: Revolver borrowings Senior term loans Senior notes Notes payable to customers Debentures Other subsidiary debt Short-term debt Debt and capital lease obligations Operating leases Interest payments Capital commitments Total payments not included cash requirements for funding pension and postretirement benefit costs. Based upon current estimates, we believe we will be required to make contributions of approximately and Estimates Income. recovered or paid. Future reversals of existing taxable temporary differences; Taxable income or loss, based on recent results, exclusive of reversing temporary differences and carryforwards; Tax-planning strategies; and assumptions are developed based on historical cost data and an assessment of likely long-term trends. Retirement rates are based primarily on actual plan experience while mortality rates are based upon the general population experience which is not expected to differ materially from our experience. 2012. Australian dollars British pounds European euro South African rand U.S. dollars Other Product Warranties based on actual costs or new information. With respect to our environmental liabilities, where future cash flows are fixed or reliably determinable, we have discounted those liabilities. All other environmental liabilities are recorded at their undiscounted amounts. We evaluate recoveries separately from the liability and, when they are assured, recoveries are recorded and reported separately from the associated liability in our consolidated financial statements. our automotive products. Only a small percentage of the claimants allege that they were automobile mechanics and a significant number appear to involve workers in other industries or otherwise do not include sufficient information to determine whether there is any basis for a claim against us. We believe, based on scientific and other evidence, it is unlikely that mechanics were exposed to asbestos by our former products and that, in any event, they would not be at increased risk of asbestos-related disease based on their work with these products. Further, many of these cases involve numerous defendants, with the number 2013. 28, 2014 Revenues Net sales and operating revenues Costs and expenses Cost of sales (exclusive of depreciation and amortization shown below) Goodwill impairment charge Engineering, research, and development Selling, general, and administrative Depreciation and amortization of other intangibles Other income (expense) Loss on sale of receivables Other income (expense) Earnings before interest expense, income taxes, and noncontrolling interests Interest expense (net of interest capitalized of $4 million in each of 2011, 2010 and 2009, respectively) Earnings before income taxes and noncontrolling interests Income tax expense Net income (loss) Less: Net income attributable to noncontrolling interests Net income (loss) attributable to Tenneco Inc. Earnings (loss) per share Weighted average shares of common stock outstanding — Basic Diluted Basic earnings (loss) per share of common stock Diluted earnings (loss) per share of common stock income. Current assets: Cash and cash equivalents Receivables — Customer notes and accounts, net Other Inventories Deferred income taxes Prepayments and other Total current assets Other assets: Long-term receivables, net Goodwill Intangibles, net Deferred income taxes Other Plant, property, and equipment, at cost Less — Accumulated depreciation and amortization Total Assets Current liabilities: Short-term debt (including current maturities of long-term debt) Trade payables Accrued taxes Accrued interest Accrued liabilities Other Total current liabilities Long-term debt Deferred income taxes Postretirement benefits Deferred credits and other liabilities Commitments and contingencies Total liabilities Redeemable noncontrolling interests Tenneco Inc. Shareholders’ equity: Common stock Premium on common stock and other capital surplus Accumulated other comprehensive loss Retained earnings (accumulated deficit) Less — Shares held as treasury stock, at cost Total Tenneco Inc. shareholders’ equity Noncontrolling interests Total equity Total liabilities, redeemable noncontrolling interests and equity STATEMENTS OF COMPREHENSIVE INCOME Operating Activities Net income (loss) Adjustments to reconcile net income (loss) to cash provided by operating activities — Goodwill impairment charge Depreciation and amortization of other intangibles Deferred income taxes Stock-based compensation Loss on sale of assets Changes in components of working capital — (Increase) decrease in receivables (Increase) decrease in inventories (Increase) decrease in prepayments and other current assets Increase (decrease) in payables Increase (decrease) in accrued taxes Increase (decrease) in accrued interest Increase (decrease) in other current liabilities Change in long-term assets Change in long-term liabilities Other Net cash provided by operating activities Investing Activities Proceeds from sale of assets Cash payments for plant, property, and equipment Cash payments for software related intangible assets Acquisition of businesses, net of cash acquired Other Net cash used by investing activities Financing Activities Purchase of common stock under the share repurchase program Issuance of common shares Issuance of long-term debt Debt issuance costs of long-term debt Retirement of long-term debt Increase (decrease) in bank overdrafts Net increase (decrease) in revolver borrowings and short-term debt excluding current maturities of long-term debt Capital contribution from noncontrolling interest partner Purchase of additional noncontrolling equity interest Distribution to noncontrolling interests partners Net cash used by financing activities Effect of foreign exchange rate changes on cash and cash equivalents Increase (decrease) in cash and cash equivalents Cash and cash equivalents, January 1 Cash and cash equivalents, December 31 (Note) Supplemental Cash Flow Information Cash paid during the year for interest Cash paid during the year for income taxes (net of refunds) Non-cash Investing and Financing Activities Period end balance of trade payables for plant, property, and equipment Common Stock Balance January 1 Issued Issued pursuant to benefit plans Stock options exercised Balance December 31 Premium on Common Stock and Other Capital Surplus Balance January 1 Purchase of additional noncontrolling equity interest Premium on common stock issued Premium on common stock issued pursuant to benefit plans Balance December 31 Accumulated Other Comprehensive Loss Balance January 1 Other comprehensive income (loss) Balance December 31 Retained Earnings (Accumulated Deficit) Balance January 1 Net income (loss) attributable to Tenneco Inc. Balance December 31 Less — Common Stock Held as Treasury Stock, at Cost Balance January 1 Purchase of common stock through stock repurchase program Balance December 31 Total Tenneco Inc. shareholders’ equity Noncontrolling interests: Balance January 1 Net income Sale of twenty percent equity interest to Tenneco Inc. Other comprehensive income (loss) Dividends declared Balance December 31 Total equity Net Income Accumulated Other Comprehensive Income (Loss) Cumulative Translation Adjustment Balance January 1 Translation of foreign currency statements Balance December 31 Additional Liability for Pension and Postretirement Benefits Balance January 1 Additional Liability for Pension and Postretirement benefits, net of tax Balance December 31 Balance December 31 Other comprehensive income (loss) Comprehensive Income Net Income Accumulated Other Comprehensive Income (Loss) Cumulative Translation Adjustment Balance January 1 Translation of foreign currency statements Balance December 31 Additional Liability for Pension and Postretirement Benefits Balance January 1 Additional liability for pension and postretirement benefits, net of tax Balance December 31 Balance December 31 Other comprehensive income (loss) Comprehensive Income Net Income (Loss) Accumulated Other Comprehensive Income (Loss) Cumulative Translation Adjustment Balance January 1 Translation of foreign currency statements Balance December 31 Additional Liability for Pension and Postretirement Benefits Balance January 1 Additional liability for pension and postretirement benefits, net of tax of $1 million Balance December 31 Balance December 31 Other comprehensive income (loss) Comprehensive Income Summary of Accounting Policies Balance January 1 Net income attributable to redeemable noncontrolling interests Sale of 25 percent equity interest to Tenneco Inc Capital Contributions Other comprehensive income (loss) Dividends declared Balance December 31 Finished goods Work in process Raw materials Materials and supplies Balance as January 1 Goodwill Accumulated impairment losses Translation adjustments Goodwill impairment charge Balance at December 31 Goodwill Accumulated impairment losses Balance as January 1 Goodwill Accumulated impairment losses Translation adjustments Balance at December 31 Goodwill Accumulated impairment losses We have capitalized certain intangible assets, primarily technology rights, trademarks and patents, based on their estimated fair value at the date we acquired them. We amortize our finite useful life intangible assets on a straight-line basis over periods ranging from Customer contract Patents Technology rights Other Total 2008. Land, buildings, and improvements Machinery and equipment Other, including construction in progress 2012. at December 31, changes to prior year estimates. Future reversals of existing taxable temporary differences; Taxable income or loss, based on recent results, exclusive of reversing temporary differences and carryforwards; Tax-planning strategies; and Taxable income in prior carryback years if carryback is permitted under the relevant tax law. cost of sales. incorporates observable inputs including quoted spot rates, forward exchange rates and discounted future expected cash flows utilizing market interest rates with similar quality and maturity characteristics. We record the change in fair value of these foreign exchange forward contracts as part of currency gains (losses) within cost of sales in the consolidated statements of income (loss). The fair value of foreign exchange forward contracts are recorded in prepayments and other current assets or other current liabilities in the consolidated balance sheet. statements. Earnings Basic earnings (loss) per share — Net income (loss) attributable to Tenneco Inc. Average shares of common stock outstanding Earnings (loss) per average share of common stock Diluted earnings (loss) per share — Net income attributable to Tenneco Inc. Average shares of common stock outstanding Effect of dilutive securities: Restricted stock Stock options Average shares of common stock outstanding including dilutive securities Earnings (loss) per average share of common stock In August 2011, we purchased the remaining 25 percent equity interest in our Over the past several years, we have adopted plans to restructure portions of our operations. These plans were approved by our Board of Directors and were designed to reduce operational and administrative overhead costs throughout the business. In 2012, we incurred $4 million in Europe, of which $10 million was recorded in cost of sales and $3 million was recorded in SG&A. In 2013, we incurred $78 million in restructuring and related costs, primarily related to European cost reduction efforts including non-cash asset write downs of $3 million, our exit from the distribution of aftermarket exhaust products and ending production of leaf springs in Australia, headcount reductions in various regions, and the net impact of freezing our defined benefit plans in the United Kingdom, of which $70 million was recorded in cost of sales, $6 million in SG&A, $1 million in engineering expense and $1 million in other expense. Severance Tenneco Inc. — Revolver borrowings due 2014, average effective interest rate 5.3% in 2011 and 5.4% in 2010 Senior Term Loan due 2012 through 2016, average effective interest rate 4.9% in 2011 and 5.1% in 2010 7 3/4% Senior Notes due 2018 6 7/8% Senior Notes due 2020 8 5/8% Senior Subordinated Notes due 2014(a) 8 1/8% Senior Notes due 2015 Debentures due 2012 through 2025, average effective interest rate 8.4% in 2011 and 2010 Customer Notes due 2013, average effective interest rate 8.0% in 2011 and 2010 Other subsidiaries — Notes due 2012 through 2025, average effective interest rate 1.3% in 2011 and 3.0% in 2010 Less — maturities classified as current Total long-term debt The aggregate maturities and sinking fund requirements applicable to the long-term debt outstanding at December 31, Maturities classified as current Notes payable Total short-term debt Outstanding borrowings at end of year Weighted average interest rate on outstanding borrowings at end of year(b) Approximate maximum month-end outstanding borrowings during year Approximate average month-end outstanding borrowings during year Weighted average interest rate on approximate average month-end outstanding borrowings during year(b) Tenneco Inc. revolving credit agreement Tenneco Inc. tranche B-1 letter of credit/revolving loan agreement Tenneco Inc. Senior Term Loans Subsidiaries’ credit agreements substantially all our domestic assets and pledges of up to 66 percent of the stock of certain first-tier foreign subsidiaries, as well as guarantees by our material domestic subsidiaries. our Tranche A Term Facility due March 22, 2017, Applicable Margin over: LIBOR for Revolving Loans LIBOR for Term Loan B Loans LIBOR for Term Loan A Loans LIBOR for Tranche B-1 Loans Prime-based Term Loan A Loans Prime for Revolving Loans Prime for Term Loan B Loans Prime for Tranche B-1 Loans Federal Funds for Revolving Loans Federal Funds for Term Loan B Loans Federal Funds for Tranche B-1 Loans Commitment Fee Senior Credit Facility — Other Terms and Conditions. Our senior credit facility requires that we maintain financial ratios equal to or better than the following consolidated net leverage ratio (consolidated indebtedness net of cash divided by consolidated EBITDA, as defined in the senior credit facility agreement), and consolidated interest coverage ratio (consolidated EBITDA divided by consolidated interest expense, as defined under the senior credit facility agreement) at the end of each period indicated. Failure to maintain these ratios will result in a default under our senior credit facility. The financial ratios required under the amended and restated senior credit facility and, the actual ratios we achieved for the four quarters of Leverage Ratio (maximum) Interest Coverage Ratio (minimum) redemption): (v) asset sales and (vi) mergers and consolidations. Subject to limited exceptions, all of our existing and future material domestic wholly owned subsidiaries fully and unconditionally guarantee these notes on a joint and several basis. There are no significant restrictions on the ability of the subsidiaries that have guaranteed these notes to make distributions to us. As of December 31, $50 million at December 31, 2012. agreement. In our North American accounts receivable securitization programs, we transfer a partial interest in a pool of receivables and the interest that we retain is subordinate to the transferred interest. Accordingly, Long-term debt (including current maturities) Instruments with off-balance sheet risk: Foreign exchange forward contracts: Asset derivative contracts $792 million and $790 million at December 31, 2013 and December 31, 2012, respectively. We have classified the $287 million and $334 million as level 2 in the fair value hierarchy at December 31, 2013 and December 31, 2012, respectively, since we utilize valuation inputs that are observable both directly and indirectly. We classified the remaining $10 million and $12 million, consisting of foreign subsidiary debt, as level 3 in the fair value hierarchy at December 31, 2013 , and December 31, 2012 , respectively. rates and discounted future expected cash flows utilizing market interest rates with similar quality and maturity characteristics. We record the change in fair value of these foreign exchange forward contracts as part of currency gains (losses) within cost of sales in the consolidated statements of Foreign exchange forward contracts Financial Assets: Foreign exchange contracts Level 1 Level 2 Level 3 Australian dollars British pounds European euro Japanese liens on substantially all our domestic assets and pledges of up to 66 percent of the stock of certain first-tier foreign subsidiaries. No assets or capital stock instruments received from our 2013 or December 31, 2012. U.S. income (loss) before income taxes Foreign income before income taxes Income (loss) before income taxes and noncontrolling interests Current — U.S. federal State and local Foreign Deferred — U.S. federal State and local Foreign Income tax expense Following is a reconciliation of income taxes computed at the statutory U.S. federal income tax rate Income tax expense (benefit) computed at the statutory U.S. federal income tax rate Increases (reductions) in income tax expense resulting from: Foreign income taxed at different rates Taxes on repatriation of dividends State and local taxes on income, net of U.S. federal income tax benefit Changes in valuation allowance for tax loss carryforwards and credits Foreign tax holidays Investment and R&D tax credits Foreign earnings subject to U.S. federal income tax Adjustment of prior years taxes Impact of foreign tax law changes Tax contingencies Goodwill impairment Other Income tax expense income: Deferred tax assets — Tax loss carryforwards: U.S. federal State Foreign Investment tax credit benefits Postretirement benefits other than pensions Pensions Bad debts Sales allowances Payroll and other accruals Valuation allowance Total deferred tax assets Deferred tax liabilities — Tax over book depreciation Other Total deferred tax liabilities Net deferred tax assets Balance Sheet: Current portion — deferred tax asset Non-current portion — deferred tax asset Current portion — deferred tax liability shown in other current liabilities Non-current portion — deferred tax liability Net deferred tax assets taxes and a favorable mix of income generated in low tax rate jurisdictions. Future reversals of existing taxable temporary differences; Taxable income or loss, based on recent results, exclusive of reversing temporary differences and carryforwards; Tax-planning strategies; and Taxable income in prior carryback years if carryback is permitted under the relevant tax law. Uncertain tax positions — Balance January 1 Gross increases in tax positions in current period Gross increases in tax positions in prior period Gross decreases in tax positions in prior period Gross decreases — settlements Gross decreases — statute of limitations expired Balance December 31 Included in the balance of uncertain tax positions were $107 million in 2013, $101 million in 2012, $36 million at United States Belgium We have authorized 135 million shares income. losses. Stock Options Granted Weighted average grant date fair value, per share Weighted average assumptions used: Expected volatility Expected lives Risk-free interest rates Dividends yields Outstanding Stock Options Outstanding, January 1, 2011 Granted Expired Forfeited Exercised Outstanding, March 31, 2011 Granted Forfeited Exercised Outstanding, June 30, 2011 Granted Forfeited Exercised Outstanding, September 30, 2011 Granted Expired Forfeited Exercised Outstanding, December 31, 2011 Vested and Expected to Vest, December 31, 2011 Exercisable, December 31, 2011 2011. Restricted Stock — The following table reflects the status for all nonvested restricted shares for the period indicated: Nonvested Restricted Shares Nonvested balance at January 1, 2011 Granted Vested Forfeited Nonvested balance at March 31, 2011 Granted Vested Forfeited Nonvested balance at June 30, 2011 Granted Vested Forfeited Nonvested balance at September 30, 2011 Granted Vested Forfeited Nonvested balance at December 31, 2011 2011. Long-Term Performance Units, Restricted Stock Units and SARs — Long-term performance units, restricted stock units, and SARs are paid in cash and recognized as a liability based upon their fair value. As of December 31, We had 50 million shares of preferred stock Pension benefits are based on years of service and, for most salaried employees, on average compensation. Our funding policy is to contribute to the plans amounts necessary to satisfy the funding requirement of applicable federal or foreign laws and regulations. Of our Equity Securities Debt Securities Real Estate Other Asset Category Equity securities: U.S. large cap U.S. mid cap U.S. Small Cap Non-U.S. large cap Non-U.S. mid cap Non-U.S. small cap Emerging markets Debt securities: U.S. corporate bonds U.S. other fixed income Non-U.S. treasuries/government bonds Non-U.S. corporate bonds Non-U.S. mortgage backed securities Non-U.S. municipal obligations Non-U.S. asset backed securities Non-U.S. other fixed income Real Estate: Non-U.S. real estate Other: Insurance contracts Cash held in bank accounts Total Asset Category Equity securities: U.S. large cap U.S. mid cap U.S. Small Cap Non-U.S. large cap Non-U.S. mid cap Non-U.S. small cap Emerging markets Debt securities: U.S. treasuries/government bonds U.S. corporate bonds U.S. mortgage backed securities U.S. asset backed securities U.S. other fixed income Non-U.S. treasuries/government bonds Non-U.S. corporate bonds Non-U.S. other fixed income Real Estate: Non-U.S. real estate Other: Insurance contracts Cash held in bank accounts Total Balance at December 31 of the previous year Actual return on plan assets: Relating to assets still held at the reporting date Ending Balance at December 31 The following table contains information about significant concentrations of risk, including all individual assets that make up more than Asset Category 2011: Tenneco Stock 2010: Tenneco Stock Change in benefit obligation: Benefit obligation at December 31 of the previous year Currency rate conversion Settlement Service cost Interest cost Administrative expenses/taxes paid Plan amendments Actuarial (gain)/loss Benefits paid Participants’ contributions Benefit obligation at December 31 Change in plan assets: Fair value at December 31 of the previous year Currency rate conversion Settlement Actual return on plan assets Employer contributions Prescription drug subsidy received Participants’ contributions Benefits paid Fair value at December 31 Development of net amount recognized: Unfunded status at December 31 Unrecognized cost: Actuarial loss Prior service cost/(credit) Net amount recognized at December 31 Amounts recognized in the balance sheets as of December 31 Noncurrent assets Current liabilities Noncurrent liabilities Net amount recognized Service cost — benefits earned during the year Interest cost Expected return on plan assets Curtailment loss Settlement loss Net amortization: Actuarial loss Prior service cost Net pension costs Net actuarial loss Prior service cost Net actuarial loss Prior service cost Projected benefit obligation Accumulated benefit obligation Fair value of plan assets Year 2012 2013 2014 2015 2016 2017-2021 Weighted-average assumptions used to determine benefit obligations Discount rate Rate of compensation increase Weighted-average assumptions used to determine net periodic benefit cost Discount rate Expected long-term return on plan assets Rate of compensation increase 2011: 2014 and future discount rate changes. hourly employee retirement plans. All of these benefits may be subject to deductibles, co-payment provisions and other limitations, and we have reserved the right to change these benefits. For those employees hired after January 1, 2001, we do not provide any postretirement benefits. Our postretirement healthcare and life insurance plans are not funded. The measurement date used to determine postretirement benefit obligations is December 31. Service cost — benefits earned during the year Interest on accumulated postretirement benefit obligation Net amortization: Actuarial loss Prior service credit Net periodic postretirement benefit cost Net actuarial loss Prior service credit Year 2012 2013 2014 2015 2016 2017-2021 Year 2012 2013 2014 2015 2016 2017-2021 Act. Weighted-average assumptions used to determine benefit obligations Discount rate Rate of compensation increase Weighted-average assumptions used to determine net periodic benefit cost Discount rate Rate of compensation increase 2011: At December 31, 2011, and for the Year Then Ended Revenues from external customers Intersegment revenues Interest income Depreciation and amortization of intangibles Earnings before interest expense, income taxes, and noncontrolling interests Total assets Equity in net assets of unconsolidated affiliates Expenditures for plant, property and equipment Noncash items other than depreciation and amortization At December 31, 2010, and for the Year Then Ended Revenues from external customers Intersegment revenues Interest income Depreciation and amortization of intangibles Earnings before interest expense, income taxes, and noncontrolling interests Total assets Equity in net assets of unconsolidated affiliates Expenditures for plant, property and equipment Noncash items other than depreciation and amortization At December 31, 2009, and for the Year Then Ended Revenues from external customers Intersegment revenues Interest income Depreciation and amortization of intangibles Earnings before interest expense, income taxes, and noncontrolling interests Total assets Equity in net assets of unconsolidated affiliates Expenditures for plant, property and equipment Noncash items other than depreciation and amortization Emission Control Systems & Products Aftermarket Original Equipment OE Value-add OE Substrate Ride Control Systems & Products Aftermarket Original Equipment Total Revenues Customer General Motors Ford At December 31, 2011, and for the Year Then Ended Revenues from external customers(b) Long-lived assets(c) Total assets At December 31, 2010, and for the Year Then Ended Revenues from external customers(b) Long-lived assets(c) Total assets At December 31, 2009, and for the Year Then Ended Revenues from external customers(b) Long-lived assets(c) Total assets Revenues from external customers and long-lived assets for individual foreign countries other than Germany, Canada, and China are not material. Commitments and Contingencies potentially responsible party in the Federal Superfund site, or as a liable party at the other locations referenced herein, will be material to our consolidated results of operations, financial position or cash flows. Beginning Balance Accruals related to product warranties Reductions for payments made Ending Balance 2013. Revenues Net sales and operating revenues — External Affiliated companies Costs and expenses Cost of sales (exclusive of depreciation and amortization shown below) Goodwill impairment charge Engineering, research, and development Selling, general, and administrative Depreciation and amortization of other intangibles Other income (expense) Loss on sale of receivables Other income (expense) Earnings (loss) before interest expense, income taxes, noncontrolling interests and equity in net income from affiliated companies Interest expense — External (net of interest capitalized) Affiliated companies (net of interest income) Earnings (loss) before income taxes, noncontrolling interests and equity in net income from affiliated companies Income tax expense (benefit) Equity in net income (loss) from affiliated companies Net income (loss) Less: Net income attributable to noncontrolling interests Net income (loss) attributable to Tenneco Inc. Revenues Net sales and operating revenues — External Affiliated companies Costs and expenses Cost of sales (exclusive of depreciation and amortization shown below) Engineering, research, and development Selling, general, and administrative Depreciation and amortization of other intangibles Other income (expense) Loss on sale of receivables Other income (expense) Earnings (loss) before interest expense, income taxes, noncontrolling interests and equity in net income from affiliated companies Interest expense — External (net of interest capitalized) Affiliated companies (net of interest income) Earnings (loss) before income taxes, noncontrolling interests and equity in net income from affiliated companies Income tax expense (benefit) Equity in net income (loss) from affiliated companies Net income (loss) Less: Net income attributable to noncontrolling interests Net income (loss) attributable to Tenneco Inc. Revenues Net sales and operating revenues — External Affiliated companies Costs and expenses Cost of sales (exclusive of depreciation and amortization shown below) Engineering, research, and development Selling, general, and administrative Depreciation and amortization of other intangibles Other income (expense) Loss on sale of receivables Other income (expense) Earnings (loss) before interest expense, income taxes, noncontrolling interests, and equity in net income from affiliated companies Interest expense — External (net of interest capitalized) Affiliated companies (net of interest income) Earnings (loss) before income taxes, noncontrolling interests, and equity in net income from affiliated companies Income tax expense (benefit) Equity in net income (loss) from affiliated companies Net income (loss) Less: Net income attributable to noncontrolling interests Net income (loss) attributable to Tenneco Inc. Current assets: Cash and cash equivalents Receivables, net Inventories Deferred income taxes Prepayments and other Total current assets Other assets: Investment in affiliated companies Notes and advances receivable from affiliates Long-term receivables, net Goodwill Intangibles, net Deferred income taxes Other Plant, property, and equipment, at cost Less — Accumulated depreciation and amortization Total assets Current liabilities: Short-term debt (including current maturities of long-term debt) Short-term debt — non-affiliated Short-term debt — affiliated Trade payables Accrued taxes Other Total current liabilities Long-term debt — non-affiliated Long-term debt — affiliated Deferred income taxes Postretirement benefits and other liabilities Commitments and contingencies Total liabilities Redeemable noncontrolling interests Tenneco Inc. Shareholders’ equity Noncontrolling interests Total equity Total liabilities, redeemable noncontrolling interests and equity Current assets: Cash and cash equivalents Receivables, net Inventories Deferred income taxes Prepayments and other Total current assets Other assets: Investment in affiliated companies Notes and advances receivable from affiliates Long-term receivables, net Goodwill Intangibles, net Deferred income taxes Other Plant, property, and equipment, at cost Less — Accumulated depreciation and amortization Total assets Current liabilities: Short-term debt (including current maturities of long-term debt) Short-term debt — non-affiliated Short-term debt — affiliated Trade payables Accrued taxes Other Total current liabilities Long-term debt — non-affiliated Long-term debt — affiliated Deferred income taxes Postretirement benefits and other liabilities Commitments and contingencies Total liabilities Redeemable noncontrolling interests Tenneco Inc. Shareholders’ equity Noncontrolling interests Total equity Total liabilities, redeemable noncontrolling interests and equity Operating Activities Net cash provided (used) by operating activities Investing Activities Proceeds from sale of assets Cash payments for plant, property, and equipment Cash payments for software related intangible assets Net cash used by investing activities Financing Activities Issuance of long-term debt Debt issuance cost on long-term debt Retirement of long-term debt Increase (decrease) in bank overdrafts Net increase (decrease) in revolver borrowings and short-term debt excluding current maturities of long-term debt Intercompany dividends and net increase (decrease) in intercompany obligations Capital contribution from noncontrolling interest partner Purchase of additional noncontrolling equity interest Distribution to noncontrolling interests partners Purchase of common stock under the share repurchase program Net cash provided (used) by financing activities Effect of foreign exchange rate changes on cash and cash equivalents Increase (decrease) in cash and cash equivalents Cash and cash equivalents, January 1 Cash and cash equivalents, December 31 (Note) Operating Activities Net cash provided (used) by operating activities Investing Activities Proceeds from sale of assets Cash payments for plant, property, and equipment Cash payments for software related intangible assets Investments and other Net cash used by investing activities Financing Activities Issuance of long-term debt Debt issuance cost on long-term debt Retirement of long-term debt Increase (decrease) in bank overdrafts Net increase (decrease) in revolver borrowings and short-term debt excluding current maturities of long-term debt Intercompany dividends and net increase (decrease) in intercompany obligations Distribution to noncontrolling interests partners Net cash provided (used) by financing activities Effect of foreign exchange rate changes on cash and cash equivalents Increase (decrease) in cash and cash equivalents Cash and cash equivalents, January 1 Cash and cash equivalents, December 31 (Note) Operating Activities Net cash provided (used) by operating activities Investing Activities Proceeds from sale of assets Cash payments for plant, property, and equipment Acquisition of business (net of cash acquired) Cash payments for software related intangible assets Investment and other Net cash used by investing activities Financing Activities Issuance of common shares Issuance of long-term debt Debt issuance cost on long-term debt Retirement of long-term debt Increase (decrease) in bank overdrafts Net increase (decrease) in revolver borrowings and short-term debt excluding current maturities of long-term debt Intercompany dividends and net increase (decrease) in intercompany obligations Distribution to noncontrolling interests partners Net cash provided (used) by financing activities Effect of foreign exchange rate changes on cash and cash equivalents Increase (decrease) in cash and cash equivalents Cash and cash equivalents, January 1 Cash and cash equivalents, December 31 (Note) Quarter 2011 1st 2nd 3rd 4th 2010 1st 2nd 3rd 4th Quarter 2011 1st 2nd 3rd 4th Full Year 2010 1st 2nd 3rd 4th Full Year Column A Description Allowance for Doubtful Accounts and Notes Receivable Deducted from Assets to Which it Applies: Year Ended December 31, 2011 Year Ended December 31, 2010 Year Ended December 31, 2009 Plan category Equity compensation plans approved by security holders: Stock Ownership Plan(2) 2002 Long-Term Incentive Plan (as amended)(3) 2006 Long-Term Incentive Plan(4) Description Description 28, 2014 Signature Title and Director (principal executive officer) * * * * *One memberTwo members of the Audit Committee, Mr. Dennis J. Letham hasand Mr. Thomas C. Freyman, have been designated by the Board as an “audit committee financial expert,experts,” as defined in the SEC rules, and the remainingall members of the Audit Committee satisfy the NYSE’s financial literacy requirements. equity based compensation for our executive officers which is intended to qualify as “performance based compensation” under Section 162(m) of the Internal Revenue Code.StatementCode of Business PrinciplesConduct that applies to all directors, officers and employees and includes provisions ranging from restrictions on gifts to conflicts of interests. All salaried employees are required to affirm annually their acceptance of, and compliance with, these principles. annual report to stockholders, annual report on Form 10-K, quarterly reports on Form 10-Q, current reports on Form 8-K and amendments to those reports, as filed with or furnished to the SEC, available free of charge on our InternetStatementCode of Business Principles,Conduct, Policy and Procedures for Transactions with Related Persons, Equity Award Policy, policy for communicating with the Board of Directors and Audit Committee policy regarding the pre-approval of audit, non-audit, tax and other services are available free of charge on our website atwww.tenneco.com.In addition, we will make a copy of any of these documents available to any person, without charge, upon written request to Tenneco Inc., 500 North Field Drive, Lake Forest, Illinois 60045, Attn: General Counsel. We intend to satisfy the disclosure requirements under Item 5.05 of Form 8-K and applicable NYSE rules regarding amendments to, or waivers of, our Code of Ethical Conduct for Financial Managers and StatementCode of Business PrinciplesConduct by posting this information on our website atwww.tenneco.com.You shouldSee also read “Management’s Discussion and Analysis of Financial Condition and Results of Operations” included in Item 7 for information about certain costs and charges included in our results. 2011 2010 2009 (Dollar Amounts in Millions) $ 3,426 48 % $ 2,832 48 % $ 2,099 45 % 3,169 44 2,594 44 2,209 48 804 11 698 12 525 11 (194 ) (3 ) (187 ) (4 ) (184 ) (4 ) $ 7,205 100 % $ 5,937 100 % $ 4,649 100 % 2013 2012 2011 (Dollar Amounts in Millions) Clean Air Division North America $ 2,666 33 % $ 2,512 34 % $ 2,291 32 % Europe, South America & India 2,045 26 % 1,827 25 % 1,952 27 % Asia Pacific 853 11 % 695 9 % 625 9 % Intergroup sales (120 ) (2 )% (108 ) (1 )% (107 ) (2 )% Total Clean Air Division 5,444 68 % 4,926 67 % 4,761 66 % Ride Performance Division North America 1,265 16 % 1,223 16 % 1,135 16 % Europe, South America & India 1,087 14 % 1,094 15 % 1,217 17 % Asia Pacific 251 3 % 213 3 % 179 2 % Intergroup sales (83 ) (1 )% (93 ) (1 )% (87 ) (1 )% Total Ride Performance Division 2,520 32 % 2,437 33 % 2,444 34 % Total Tenneco Inc. $ 7,964 100 % $ 7,363 100 % $ 7,205 100 % 2011 2010 2009 (Dollar Amounts in Millions) $ 216 57 % $ 155 55 % $ 42 45 % 125 33 76 27 20 22 38 10 50 18 30 33 $ 379 100 % $ 281 100 % $ 92 100 % 2013 2012 2011 (Dollar Amounts in Millions) Clean Air Division North America $ 229 54 % $ 202 47 % $ 172 45 % Europe, South America & India 57 13 % 54 13 % 79 21 % Asia Pacific 84 20 % 71 17 % 47 12 % Total Clean Air Division 370 87 % 327 76 % 298 79 % Ride Performance Division North America 124 29 % 122 29 % 76 20 % Europe, South America & India (7 ) (2 )% 41 10 % 69 18 % Asia Pacific 22 5 % 5 1 % (6 ) (2 )% Total Ride Performance Division 139 33 % 168 39 % 139 37 % Other (85 ) (20 )% (67 ) (16 )% (58 ) (15 )% Total Tenneco Inc. $ 424 100 % $ 428 100 % $ 379 100 % plant, propertyPlant, Property and equipment: 2011 2010 2009 (Dollar Amounts in Millions) $ 88 40 % $ 59 38 % $ 45 38 % 95 44 66 43 58 49 35 16 29 19 15 13 $ 218 100 % $ 154 100 % $ 118 100 % 2013 2012 2011 (Dollar Amounts in Millions) Clean Air Division North America $ 77 30 % $ 76 29 % $ 49 22 % Europe, South America & India 61 24 % 56 21 % 55 25 % Asia Pacific 44 17 % 40 15 % 24 11 % Total Clean Air Division 182 72 % 172 65 % 128 59 % Ride Performance Division North America 32 13 % 46 17 % 39 18 % Europe, South America & India 34 13 % 32 12 % 40 18 % Asia Pacific 6 2 % 13 5 % 11 5 % Total Ride Performance Division 72 28 % 91 35 % 90 41 % Total Tenneco Inc. $ 254 100 % $ 263 100 % $ 218 100 % 2011 2010 2009 (Millions) $ 108 $ 149 $ 133 88 69 13 26 24 19 2013 2012 2011 (Millions) Interest expense (net of interest capitalized) $ 80 $ 105 $ 108 Income tax expense 122 19 88 Noncontrolling interests 39 29 26 emission controlclean air and ride controlperformance systems and products for light vehicle, commercial truck, off-highway and specialty vehicleother applications, and generated revenues of $7.2$8.0 billion in 2011.2013. We serve both original equipment manufacturers (OEMs) and replacement markets worldwide through leading brands, including Monroe®, Rancho®, Clevite® Elastomers, Marzocchi®, AxiosTM™, KineticTM™, and Fric-RotTM™ ride controlperformance products and Walker®, XNOx™, FonosTM™, DynoMax®, ThrushTM™, and LukeyTM™ emission controlclean air products.vehicletruck and off-highway engine manufactures,manufacturers, and aftermarket distribution channels.vehicletruck and off-highway engine manufactures;manufacturers; and (2) “aftermarket” in which replacement parts are sold in varying quantities to wholesalers, retailers and installers. In the OE market,category, parts suppliers are generally divided into tiers — “Tier 1” suppliers that provide their products directly to OEMs, and “Tier 2” or “Tier 3” suppliers that sell their products principally to other suppliers for combination into the other supplier’ssuppliers’ own product offerings.The market for “lightisare comprised of: (1) passenger cars and (2) light trucks which include sport-utility vehicles (SUV)(SUVs), crossover vehicles (CUV)(CUVs), pick-up trucks, vans and multi-purpose passenger vehicles. Demand for automotive parts in the OE light vehicle marketautomotive parts is generally a function of the number of new vehicles produced, which in turn is a function ofdepends on prevailing economic conditions and consumer preferences. In 2011,2013, the number of light vehicles produced by region was 13.116.2 million in North America, 30.227.5 million in Europe, South America and India and 33.321.0 million in Asia Pacific. Worldwide light vehicle production is forecasted to increase to 79.687.4 million units in 20122014 from approximately 76.684.5 million units in 2011,2013, according to IHS Automotive. Although OE demand is tied to planned vehicle production, parts suppliers also have the opportunity to grow revenues by increasing their product content per vehicle, by further expanding business with existing customers and by serving new customers in existing or new markets. Companies with a global presence and advanced technology, engineering, manufacturing and support capabilities, such as our Company, are better positioned to take advantage of these opportunities. through 2014 in North America, Europe, China, Japan, Brazil, Russia and India have enabled suppliers such as us to serve customers beyond the light vehicle market.vehicles. Certain automotive parts suppliers are now developingthat have traditionally supplied the automotive industry also develop and producingproduce components and integrated systems for the commercial market oftruck, off-highway and other applications, such as medium- and heavy-duty trucks, buses, off-roadoff-highway equipment, and locomotive/marine applications as well as the recreational segment for two-wheelers and all-terrain vehicles. Tenneco foresees this market diversification of segments served as a source of future growth.of OE parts and increases in theincreased average useful life of automotivevehicle parts that has come to pass as a result of technological innovation. SuppliersParts suppliers are increasingly being required to deliver innovative aftermarket products to drive increased aftermarket demand. Global economic downturns generally impact aftermarket sales less adversely than OE sales, as customers forego new vehicle purchases and keep their vehicles longer, thereby increasing demand for repair and maintenance parts and services.marketscustomers we serve change, so do the roles, responsibilities and relationships of the participants. Key trends that we believe are affecting parts suppliers include:The economic crisis in 2008 and 2009 materially and negatively impacted the automotive industry and our customers’ businesses in the U.S. and elsewhere. Automakers around the world experienced financial difficulties from a weakened economy, tightening credit markets, low consumer confidence, and reduced demand for their products. General Motors and Chrysler reorganized under bankruptcy protection in 2009, and other OE manufacturers took actions to improve profitability and remain solvent. The automotive supply base in turn also faced severe cash flow problems as a result of the significantly lower production levels of light vehicles, increased costs of certain raw materials, commodity and energy costs, and restricted access to additional liquidity through the capital markets. Consumers facing a weak job market and inadequate financing options were reluctant to purchase durable goods such as automobiles.continued to strengthen, evidenced bygrew 39 percent in North America, 30 percent in Asia Pacific and Europe light vehicle production volumes increasing 39 percent, 30 percent and 16 percent respectively in 2010 as compared to 2009.Europe. Production volumes continued to strengthen in 2011 in most geographic regions in which we operate. For example, production volumes in North America, Europe and EuropeChina increased 10 percent, five percent and five percent, respectively, in 2011,2011. In 2012, light vehicle production improved further in some regions, but declined markedly in Europe. Light vehicle production was up 17 percent in North America, though still not to the levels seen in recent history. The Asia Pacific region experienced a decline of twohistory, and six percent in China. European light vehicle production volumes as a resultwas down five percent from 2011 levels. In 2013, light vehicle production improved further in some regions, but declined in India and Australia. Light vehicle production was up fiveindustryNorth America, six percent in South America, and 14 percent in China. European light vehicle production was about even with 2012 levels. Light vehicle production was down six percent when compared to 2012 in Australia,both India and lower OE volumes in Thailand and Japan as a result of the flooding and earthquakes experienced in those regions in 2011.theengines using diesel marketsand alternative fuels and increased demandsdemand for better fuel economy. Government regulations adopted over the past decade require substantial reductions in vehicle tailpipe criteria pollutant emissions, longer warranties on parts ofwarranty periods for a vehicle’s pollution control equipment and additional equipment to control fuel vapor emissions. In addition, new regulations have been adopted to regulate greenhouse gas emissions of carbon dioxide and improved combustion efficiency and reduction of vehicle mass have become priorities. Manufacturers are responding with new technologies for gasoline- and diesel-fueled vehicles that minimize pollution and improve fuel economy.emission controlclean air systems with strong technical capabilities, we believe we are well positioned to benefit from the more rigorous environmental standards being adopted around the world. We continue to expand our investment in regions such as China, India, Thailand and ThailandJapan to capitalize on the growing demand for environmentally friendly solutions for light vehicle, commercial truck and commercial vehiclesoff-highway applications driven by environmental regulations in these regions.Mercedes Benz Sprinter andAudi A4, BMW 1 and 3 series passenger cars and Scania trucks and in Europe andNorth America for GM Duramax engine applications, the Ford Super Duty, the Chrysler Ram, Navistar medium-duty trucks in North America, and off-roadoff-highway applications for Caterpillar and John Deere in North America and Europe, and North America.Kubota in Japan. These particulate filters, coupled with converters, reduce emissions of particulate matter by up to 90 percent and of nitrogen oxide by up to 85 percent. In addition, we have development and production contracts for our selective catalytic reduction (SCR) systems with light, medium and medium-dutyheavy-duty truck manufacturers in North America,manufacturers. These SCR systems reduce emissions of nitrogen oxides by up to 95 percent. In China, South America, Europe, and Asia. In China,Japan, we have development and production contracts for complete turnkey SCR systems includingthat include the ELIM-NOx urea dosing technology acquired in 2007 and now sold globally under the name XNOxTM™. Customers have also purchased prototypes of our hydrocarbon injector, a product acquired in 2007 alongside our XNOxTM technology, which is used to inject hydrocarbon directly into the exhaust system to regenerate diesel particulate filters andLean NOx Traps. New regulations in the U.S. and European markets, which require reductions in carbon dioxide emissions and improvements in fuel economy, are creating increased demand for our fabricated manifolds, maniverters, integrated turbocharger/manifold modules, electronic exhaust valves, and lighter weightlightweight components. Lastly, for various off-roadoff-highway customers, we have developedoffer emission aftertreatment systems designed to meet Tier 4A4 interim and Tier 4 final environmental regulations. Both on-roadcommercial truck and off-roadoff-highway customers are embracing the concept of turnkey aftertreatment systems where we have developed and sold both electronicwhich require aftertreatment electronic control units (ECUs) as well as the related control software.$117 million in 2010, and $97 million in 2009, net of customer reimbursements. In addition, we build prototypes and incur other costs on behalf of our customers to further our technological capabilities. Such expenses reimbursed by our customers totaled $169 million in 2013, $159 million in 2012, and $119 million in 2011, $110 million in 2010,including building prototypes and $104 million in 2009.incurring other costs on behalf of our customers. We also fund and sponsor university and other independent research to advance our emission controlclean air and ride controlperformance development.canhave been able to expand our product offerings and penetrate new markets. For example, we developed DPFs which were first sold in Europe and then offered in North America. Since these original innovations, we have developed T.R.U.E-Clean®with our partners, a product used to regenerate DPFs. We have also built prototypes of urea SCR systems for locomotive and marine engines. We expanded our suite of NOx-reduction technologies, developing prototypes of SCR systems using gaseous ammonia, absorbed on a solid forms of ammoniasalt, as the reductant andor a hydrocarbon lean NOx catalyst (HC-LNC for NOx reduction) that relies on hydrocarbons, ethanol, or other reductants instead of urea. For example, we are in aduring our period of exclusive development with General Electric utilizing their proprietary(GE), we developed a commercially viable hydrocarbon lean NOx catalyst (HC-LNC for NOx reduction),system which utilizes GE’s proprietary silver based catalyst formulation and haveattracted multiple customers in Brazil that are testing this system in Brazil.using ethanol as the reductant. We successfully developed and sold fabricated manifolds, previously used only on gasoline engines, into the passenger car diesel segment. Recently, we developed and sold our first prototype aftertreatment system for large engines, up to 4500 horsepower, used as line haul locomotives. Tenneco, through an exclusive partnership with Jiangsu Lvyuan in China, has become the first company to obtain China Classification Society (CCS) approval to sell marine selective catalytic reduction systems for China flagged vessels, as required by the International Maritime Organization. On the ride controlperformance side of our business, we co-developed with Öhlins Racing AB a continuously controlled electronic suspension system (CES) now offered by OEMs such as Volvo, Audi, Ford, VW, and Mercedes Benz in their vehicles.and BMW.In 2009, with the adoptionCES, and offers Kinetic® ride control technology to improvethat improves vehicle stability and handling. We also develop other advanced suspension systems like Actively Controlled Car (ACOCAR)TM™ that are being designed to provide improved vehicle safety and control. Further, we introducedsupply premium Monroe® branded brakes to the aftermarket to further complement our product offeringsTM™ of Steering-Stopping-Stability to educate consumers about the detrimental effect of worn shock absorbers on vehicle steering and stopping distances.With more than a decade of experience asAs an established Tier 1 supplier, we have produced modules and systems for various vehicle platforms produced worldwide, supplying ride controlperformance modules for the Chevrolet Silverado, GMC Sierra, Chevrolet Malibu, Chevrolet Impala and Chevrolet Cruze and emission control systems for the Ford Super Duty, Ford Focus, Chevrolet Silverado, GMC Sierra, Chevrolet Malibu, Opel Astra, and VW Golf. In addition, we continue to design other modules and systems for platforms yet to be introduced to the global marketplace.•Growing Importance of Developing Markets: Because the North American and Western European automotive markets are mature, OEMs are increasingly focusing on developing markets for growth opportunities, particularly Brazil, Russia, India and China, collectively known as the BRIC economies, as well as Thailand. As OEMs have penetrated new regions, growth opportunities for suppliers have emerged.•Governmental Tariffs and Local Parts Requirements: Many governments around the world require vehicles sold within their country to contain specified percentages of locally produced parts. Additionally, some governments place high tariffs on imported parts.•Location of Production Closer to End Markets: As OE manufacturers and parts suppliers have shifted production globally to be closer to their end markets, suppliers have expanded their reach, capturing sales in developing markets and taking advantage of relatively lower labor costs.inmany regions around the developing markets.each suitedsuitable for a number of similar vehicle models and able to accommodate different features for more than one region. Light vehicle platforms of over one million units are expected to grow from 4248 percent to 5155 percent of global OE production from 20112013 to 2016.been steadily increasingincreased in recent years due to technological innovations including longer-lasting materials. As a result, although there are more vehicles on the road than ever before, the global aftermarket has not kept pace with that growth. Accordingly, aftermarket suppliers have focused on reducing costs and providing product differentiation through advanced technology and recognized brand names. With our long history of technological innovation, strong brands and operational effectiveness, we believe we are well positioned to leverage our products and technology.20012003 to 2011,2013, the number of retail outlets supplying aftermarket parts increased significantly while the number of jobber stores declined 10nearly seven percent in the U.S. Major aftermarket retailers, such as AutoZone and Advance Auto Parts, attempted to expand their commercial sales by selling directly to parts installers, which had historically purchased from their local warehouse distributors and jobbers, as they continued to market to individual retail consumers. Retailers now have the option to offer premium brands which are often preferred by their commercial customers in addition to standard products which are often selected by their individual store buyers. We believe we are well positioned to respond to this trend because we continue to produce high-quality, premium brands and products. As distribution channels continue to consolidate, both wholesalers and retailers can realize the benefits of sourcing products from a supplier like Tenneco with our breadth of suspension and emissions control products.20092011 through 2011,2013, information relating to our net sales and operating revenues, by primary product lines and customer categories. Net Sales
Year Ended December 31, 2011 2010 2009 (Millions) $ 351 $ 318 $ 315 2,732 2,223 1,638 1,678 1,284 966 4,410 3,507 2,604 4,761 3,825 2,919 944 851 721 1,500 1,261 1,009 2,444 2,112 1,730 $ 7,205 $ 5,937 $ 4,649 2013 2012 2011 (Millions) Clean Air Products & Systems Aftermarket $ 327 $ 318 $ 351 Original Equipment OE Value-add 3,282 2,948 2,732 OE Substrate(1) 1,835 1,660 1,678 5,117 4,608 4,410 5,444 4,926 4,761 Ride Performance Products & Systems Aftermarket 953 944 944 Original Equipment 1,567 1,493 1,500 2,520 2,437 2,444 Total Revenues $ 7,964 $ 7,363 $ 7,205 (1) See “Management’s Discussion and Analysis of Financial Condition and Results of Operations” included in Item 7 for a discussion of substrate sales. , AxiosTM (suspension products), KineticTM™ and Fric-RotTM™ (ride control(ride performance products), DynoMaxWalker®, XNOx™ (clean air products), DynoMax®, ThrushTM™ and LukeyTM™ (performance exhaustclean air products), Rancho® (ride controlperformance products for the high performance light truck market)trucks), Clevite® Elastomers and Axios™ (noise, vibration and harshness control components), and Marzocchi® (forks and suspensions for the two-wheeler market)two-wheelers).have developedstrive to develop long-standing business relationships with our customers around the world. In each of our operating segments, we work collaboratively with our customers in all stages of production, including design, development, component sourcing, quality assurance, manufacturing and delivery. With a diverse mix of OE and aftermarket products and facilities in major markets worldwide, we believe we are well positioned to meet customer needs. We believe we have a strong, establishedWorldwideserveserved more than 6465 different OEMs and Commercial Vehiclecommercial truck and off-highway engine manufacturers worldwide, and our products arewere included on nine of the top 10 passenger car models produced for sale in Europe and nineeight of the top 10 light truck models produced for sale in North America for 2011.2011,2013, our OEM and Commercial Vehiclecommercial truck and off-highway engine manufacturer customers included:North America Europe Asia AM General AvtoVAZ Beijing Automotive Caterpillar BMW BMW Club Car Caterpillar Brilliance Automobile CNH Industrial CNH Industrial (Iveco) Changan Automotive Daimler AG Daimler AG Changan AutomotiveChina National Heavy-Duty Truck GroupE-Z Go Deutz AG Daimler AG Fiat-ChryslerFiat Chrysler Automobile Ducati Motor Dongfeng Motor Fiat Industrial (CNH)Ford Motor Fiat-ChryslerFiat Chrysler Automobile Ducati Motor General Motors Ford Motor First Auto Works Harley-Davidson Gas-Gas Motors Ford Motor Honda Motors Geely Automobile Geely Automobile Hyundai Motor General Motors General Motors John Deere Harley-Davidson Great Wall Motor Navistar International John Deere Hyundai Motor Nissan Motor Mazda Motor Isuzu Motors Oshkosh Truck McLaren Automotive Jiangling Motors Paccar Nissan Motor Kubota Toyota Motor Paccar Nissan Motor Volkswagen Group PSA Peugeot Citroen SAIC Motor Volvo Global Truck Renault Suzuki Motor Scania Toyota Motor Suzuki Motor Volkswagen Group Tata Motors Weichai Power Toyota Motor Yuchai Group Volkswagen Group Volvo Global Truck Australia South America India Club Car CNH Industrial (Iveco) Club Car CNH Industrial (Iveco) Daimler AG Daimler AG Ford Motor Fiat Industrial (Iveco)Chrysler Automobile First Auto WorksE-Z GoGeneral Motors Ford Motor Ford Motor Harley-DavidsonGeely AutomobileGeely AutomobileHonda MotorsGeneral MotorsGeneral MotorsHyundai MotorHarley-DavidsonGreat Wall MotorJohn DeereJohn DeereHyundai MotorNavistar InternationalMazda MotorIsuzu MotorsNissan MotorMcLaren AutomotiveJiangling MotorsOshkosh TruckNissan MotorNissan MotorPaccarPaccarSAIC MotorToyota MotorPorscheSuzuki MotorVolkswagen GroupPSA Peugeot CitroenVolkswagen GroupVolvo Global TruckRenaultWeichai PowerSuzuki MotorTata MotorsToyota MotorVolkswagen GroupVolvo Global TruckAustraliaSouth AmericaIndiaClub CarDaimler AGClub CarFiat Industrial (Iveco)Fiat-ChryslerE-Z GoFord MotorFiat Industrial (Iveco)Fiat-ChryslerGeneral MotorsFord MotorFord MotorMazda Motor General Motors General Motors Toyota Motor MAN SE Isuzu Motor Navistar International Mahindra & Mahindra Nissan Motor Nissan Motor PSA Peugeot Citroen Suzuki Motor Renault Tata Motors Scania Toyota Motor Toyota Motor Toyota MotorVolkswagen Group Volkswagen Group Volkswagen Group Volvo Global Truck 2011 2010 2009 19 % 19 % 16 % 15 % 13 % 14 % Customer 2013 2012 2011 General Motors 15 % 17 % 19 % Ford Motor 14 % 15 % 15 % 2011,2013, our aftermarket customers were comprised of full-line and specialty warehouse distributors, retailers, jobbers, installer chains and car dealers. These customers included National Auto Parts Association (NAPA), Advance Auto Parts, Uni-Select, and O’Reilly Automotive, Aftermarket Auto Parts Alliance, and AutoZone in North America, Temot Autoteile GmbH, Autodistribution International, Group Auto Union, Auto Teile Ring and AP United in Europe and Rede Presidente in South America. We believe our revenue mix is balanced, with our top 10 aftermarket customers accounting for 4055 percent of our net aftermarket sales and our aftermarket sales representing 1816 percent of our total net sales in 2011.In both thelight vehicle market and aftermarket parts, we compete with the vehicle manufacturers, some of which are also customers of ours, and numerous independent suppliers. In theFor OE market,sales, we believe that we rank among the top two suppliers infor certain key marketsapplications we serveservice throughout most regions in the world for both emission controlclean air and ride controlperformance products and systems for light vehicles.systems. In the aftermarket, we believe that we are the market sharea leader in supplying emission controlclean air and ride controlperformance products for light vehicles in certainfor the key marketsapplications we serve throughout the world.consumer demand for new vehiclesproduction during the holiday season and the winter months in North America and Europe generally. Our aftermarket operations, also affected by seasonality, experience relatively higher demand during the springSpring as vehicle owners prepare for the summerSummer driving season.During the recent global recession that began in 2008, seasonal OE plant closures were longer and more pronounced and aftermarket inventory levels remained leaner than normal. As the industry began to recover, the effectsextendingwhich extends from the manifold that connects an engine’s exhaust ports to an exhaust pipe, to the catalytic converter that eliminates pollutants from the exhaust, and to the muffler that modulates noise and emissions — leads to a pleasant, tuned engine sound, reduced pollutants and optimized engine performance.for improvedto improve the efficiency of SCR systems;Nitrogen Oxidenitrogen oxide (NOx) emissions from diesel powertrains using capture and store technology;• (AdBLue)(AdBlueTM™) or Diesel Exhaust Fluid (DEF);includingthat includes an integrated catalytic converter (maniverter) and/or turbocharger;convertersconverter systems or procure substrates coated with precious metals which we incorporate into full systems. We obtain these components and systems from third parties or directly from OE manufacturers, often at the OEM’s direction. See Item 7, “Management’s Discussion and Analysis of Financial Condition and Results of Operations” for more information on our sales of these products.emission controlclean air offerings to 28 light vehicle manufacturers for use on over 215225 light vehicle models, including sixseven of the top 10 passenger car models produced in Europe and sixseven of the top 10 light truck models produced in North America for 2011.2013. We also supply emission controlclean air products to 1825 manufacturers of commercial vehiclestruck, off-highway and engines, and specialtyother vehicles including Harley-Davidson, BMW Motorcycle, Scania, Daimler Trucks, Navistar, Caterpillar, John Deere, Deutz, Kubota, CNHTC, FAW Truck, and Weichai Power.emission controlclean air market in 1967 with the acquisition of Walker Manufacturing Company, which was founded in 1888, and became one of Europe’s leading OE emission controlclean air systems suppliers with the acquisition of Heinrich Gillet GmbH & Co. in 1994. Throughout this document, the term “Walker” refers to our subsidiaries and affiliates that produce emission controlclean air products and systems., and Tru-Fit® and Aluminox ProTM, in addition to offering a variety of other related products such as pipes and catalytic converters (Walker® Perfection). We also serve the specialty exhaust aftermarket with offerings that include Mega-Flow® exhaust products for heavy-duty vehicle applications and DynoMax® high performance exhaust products. We continue to emphasize product-value differentiation with other aftermarket brands such as ThrushWalker®, Thrush® and FonosTM™.ControlPerformance Systemsdependsdepend on maintaining contact between the tires and the road. Worn shocks and struts can allow excess transfer of the vehicle’s weight — either from side to side which is called “roll;” from front to rear which is called “pitch;” or up and down, which is called “bounce.” Shock absorbers and struts are designed to control the vertical loads placed on tires and thereby provide resistance to vehicle roll, pitch and bounce. They function as safety components and provide a comfortable ride.controlperformance products and systems including:• • The Kinetic® suspension technology was incorporated on the Citroën World Rally Car that was featured in the World Rally Championship of 2003, 2004 and 2005. Additionally, the Kinetic® suspension technology was offered on the Lexus GX 470 sport utility vehicle which resulted in our winningWe have won the PACE Award;Award for our Kinetic® suspension technology;controlperformance products such as load assist products, springs, steering stabilizers, adjustable suspension systems, suspension kits and modular assemblies.controlperformance offerings to 2221 light vehicle manufacturers for use on over 150 light vehicle models, including fiveseven of the top 10 passenger car models produced in Europe and nineeight of the top 10 light truck models produced in North America for 2011.2013. We also supply ride controlperformance products and systems to over 40 commercial and specialty vehicletruck manufacturers including Volvo Truck, Scania, Navistar, Daimler Trucks and PACCAR.controlperformance aftermarket, we manufacture, market and distribute replacement shock absorbers for virtually all North American, European and Asian light vehicle models under several brand names including Gas-Matic®, Sensa-Trac®, Monroe Reflex® Reflex® and Monroe® AdventureTM™, Quick-Strut®, as well as Clevite® Elastomers for elastomeric vibration control components. We also sell ride controlperformance offerings for the heavy-duty, off-roadcommercial truck and specialtyother aftermarket segments, such as our Gas-Magnum® shock absorbers for the North American heavy-dutycommercial category and Marzocchi® front forks for two-wheelers.controlperformance product line in 1977 with the acquisition of Monroe Auto Equipment Company, which was founded in 1916, and introduced the world’s first modern tubular shock absorber in 1930. When the term “Monroe” is used in this document it refers to our subsidiaries and affiliates that produce ride controlperformance products and systems.controlperformance and emission control)clean air). Our sales and marketing team provides the appropriate mix of operational and technical expertise needed to interface successfully with the OEMs. Our new business “capture process” involves working closely with the OEM platform engineering and purchasing teams. Bidding on OE automotive platforms typically encompasses many months of engineering and business development activity. Throughout the process, our sales team, program managers and product engineers assist the OE customer in defining the project’s technical and business requirements. A normal part of the process includes our engineering and sales personnel working on customers’ integrated product teams, and assisting with developing component/system specifications and test procedures. Given that the OE business involves long-term production contracts awarded on a platform-by-platform basis, our strategy is to leverage our engineering expertise and strong customer relationships to target and win new business and increase operating margins.televisionoutdoor advertisements and offer pricing promotions. We offer business-to-business services to customers with TA-Direct, an on-line order entry and customer service tool. In addition, we maintain detailed web sites for each of Walker®, Monroe®, Rancho®, DynoMax®, Monroe® brake brands and our heavy-duty products.competitorscompetitors’ and to achieve higher quality and productivity. We continue to adapt our capacity to customer demand, both expanding capabilities in growth areas as well as reallocating capacity away from segments in decline.Emission Controlemission controlof the manufacturing facilities in the U.S. and 46 emission control manufacturing facilities outside of the U.S. We operate 16 of these international manufacturing facilitiesAsia Pacific through joint ventures in which we hold a controlling interest. We operate five emission controlfour clean air engineering and technical facilities worldwide and share twothree other such facilities with our ride controlperformance operations. Of the four clean air engineering and technical facilities, one is located in North America, two in Europe, and one in Asia Pacific. In addition, two joint ventures in which we hold a noncontrolling interest operate a total of two manufacturing facilities outside the U.S.emission controlclean air manufacturing facilities, operations are organized by component (e.g., muffler, catalytic converter, pipe, resonator and manifold). Our manufacturing systems incorporate cell-based designs, allowing work-in-process to move through the operation with greater speed and flexibility. We continue to invest in plant and equipment to stay competitive in the industry. For instance, in our Smithville, Tennessee, OE manufacturing facility, we have developed a muffler assembly cell that utilizes laser welding. This allows for quicker change-over times in the process as well as less material used and less weight for the product. There is also a reduced cycle time compared to traditional joining and increased manufacturing precision for superior durability and performance. In 2007, we introduced the Measured and Matched Converter technique in North America. This allows us to maintain the optimum GBD (Gap Bulk Density) in our converter manufacturing operations with Tenneco proprietary processing. This process, coupled with cold spinning of the converter body, versus traditional cone to can welding, allows for more effective use of material through reduced welding, lower cost, and better performance of the product. In 2009, we introduced low-cost fabricated diesel manifolds in Europe which utilize advanced manufacturing processes such as deep drawing, laser welding, and furnace brazing.emission controlclean air manufacturing operations into “just-in-time” or “JIT” systems. In this system, a JIT facility located close to our OE customer’s manufacturing plant receives product components from both our manufacturing operations and independent suppliers, and then assembles and ships products to the OEMs on an as-needed basis. To manage the JIT functions and material flow, we have advanced computerized material requirements planning systems linked with our customers’ and supplier partners’ resource management systems. We have three emission control26 clean air JIT assembly facilities worldwide, of which three facilities are located in the United StatesNorth America, ten in Europe and 23 throughout the rest of the world.ELIM-NOx, mobile emission technology, now sold globally under the XNOxTM™ name, thatwhich includes urea and hydrocarbon injection, and electronic controls and software for selective catalytic reduction. We also offer a complete suite of alternative full system NOx aftertreatment technologies, including the Hydrocarbon Lean NOx Catalyst (HC-LNC) technology under joint development with General Electric, and SOLID SCRTM™ technology licensed from FEV, a powertrain developmentAmminex, an engineering and engineeringmanufacturing company basedlocated in Germany.Denmark. We also developed advanced predictive engineering tools, including KBM&E (Knowledge BasedControlseven27 ride controlperformance manufacturing facilities worldwide, of which nine facilities are located in the U.S.North America, 13 in Europe, South America and 23 ride control manufacturing facilities outside the U.S.India, and five in Asia Pacific. We operate two of these internationalthe facilities through joint ventures in which we hold a controlling interest.interest, one in Europe and another one in Asia. We operate seven engineering and technical facilities worldwide and share twothree other such facilities with our emission controlclean air operations.controlperformance manufacturing facilities, operations are organized by product (e.g., shocks, struts and vibration control products) and include computer numerically controlled and conventional machine centers; tube milling and drawn-over-mandrel manufacturing equipment; metal inert gas and resistance welding; powdered metal pressing and sintering; chrome plating; stamping; and assembly/test capabilities. Our manufacturing systems incorporate cell-based designs, allowing work-in-process to move through the operation with greater speed and flexibility.someone of our ride performance manufacturing operations into a JIT systems. We have two JIT ride control facilities outside the U.S.eitherbetween ride comfort or vehicle control.and handling. Our innovative grooved-tube, gas-charged shock absorbers and struts provide both ride comfort and vehicle control, resulting in improved handling, reduced vibration and a wider range of vehicle control. This technology can be found in our premium quality Sensa-Trac® shock absorbers. We further enhanced this technology by adding the SafeTechTM™ fluon banded piston, which improves shock absorber performance and durability. We introduced the Monroe Reflex® Reflex® shock absorber, which incorporates our Impact SensorTM™ device. This technology permits the shock absorber to automatically switch in a matter of milliseconds between firm and soft compression damping when the vehicle encounters rough road conditions, and thus maintaining better tire-to-road contact and improving handling and safety. We developed the Quick-Strut® which simplifies and shortens the installation of aftermarket struts. This technology combines the spring and upper mount into a single, complete module, eliminating the need for special tools and skills required previously. We have also developed an innovative computerized electronic suspension system, which features dampers developed by Tenneco and electronic valves designed by Öhlins Racing AB. The continuously controlled electronic suspension (“CES”) ride controlperformance system is featured on Audi, Volvo, Ford, VW,Volkswagen, BMW, and Mercedes Benz vehicles.theto our OE market, respectively,customers, either locally or globally. All of our manufacturing facilities where we have determined that TS certification is required to serve our customers or would provide us with an advantage in securing additional business, have achieved ISO/TS 16949 certification.emission controlclean air and ride controlperformance products and systems for OEMs and the aftermarket. We work toward achieving a balanced mix of products, markets and customers by capitalizing on emerging trends, specific regional preferences and changing customer requirements. We target both mature and developing markets for both light vehicle, commercial truck, off-highway and commercial and specialtyother vehicle business. We further enhance our operations by focusing on operational excellence in all functional areas.onfrom passenger, commercial truck and commercialoff-highway vehicles. This includesThese technologies include an integrated Selective Catalytic Reduction (SCR) system that incorporates our ELIM-NOx technology, now sold globally under the name XNOxTM™. technology, electrical valves for diesel-powered vehicles with low-pressure exhaust gas recirculation systems, and diesel and gasoline particulate filters. We also offer a NOx absorber and are developing a hydrocarbon lean NOx catalyst system and a solid form of ammonia SCR system to address NOx emissions.system. Additionally, we offer thermal management solutions, includingsuch as our T.R.U.E.-Clean® active diesel particulate filter system.system and through a consortium thermoelectric generators that convert waste exhaust heat into electrical energy.commercialoff-highway vehicles as well as off-road, locomotive, marine and stationary engines. In addition, vehicle manufacturers, we believe, will offer greater comfort, handling and safety features by offering products such as electronic suspension and adjustable dampers. Our Continuously Controlled Electronic Suspension (CES) shock absorbers, which we co-developed with Öhlins Racing AB, are now sold to Volvo, Audi, Mercedes, VW, BMW, and Ford, among others, and our engineered elastomers to manufacturers with unique requirements. Our newest electronic suspension product DRiVTM™, based onusing digital-valve technology licensed fromdeveloped by Sturman Industries, is the first industry example of using digital valves for ride controlperformance products thereby offering faster response, lighter weight, and reduced power consumption compared to existing analog products.developingintroducing highly engineered systems and complex assemblies and modules designed to provide value-added solutions to customers and increase vehicle content generally. Having many of our engineering and manufacturing facilities integrated electronically, we believe, has helped our products continue to be selected for inclusion in top-selling vehicles. In addition, our just-in-time and in-line sequencing manufacturing processes and distribution capabilities have enabled us to be more responsive to our customers’ needs.marketssales opportunities and achieve growth in higher-margin businesses by applying our existing design, engineering and manufacturing capabilities. For example, we are aggressively leveragingleverage our technology and engineering leadership in emissionclean air and ride controlperformance into adjacent marketssales opportunities for two-wheelers, heavy-duty trucks, buses, agricultural equipment, construction machinery and other commercial and specialty vehicles. Commercial vehicle emission control launches are currently underway and will ramp up inIn line with regulatory enforcement, for on-regulations set and off-road equipmentenforced in North America, Europe, China, Japan, South America and South America. TheseIndia, we launch clean air products for commercial truck and off-highway customers. Such customers include Caterpillar, for whom we are their global diesel emission controlclean air system integrator, as well as John Deere, Navistar, Deutz, Daimler Trucks, MAN SE, Scania, China National Heavy Duty Truck Company, Shanghai Diesel Engine Company, Weichai Power, FAW Group, and YuChai.Yuchai. In addition, we continue to expand into new markets with new customers, including our most recently announced new emission control business with a commercial vehicle customerclean air products for customers, such as Kubota in Japan.Japan, and Mahindra in India. Our 20102013 and 20112012 revenue generated by our commercial truck, off-highway and specialty vehicleother business was nine14 percent and 1113 percent, of our total OE revenue, respectively. In 2008, we added the ride control products and technologies of Gruppo Marzocchi to our existing exhaust systems business for two-wheelers. In addition, we are evaluating and selectively pursuing retrofit opportunities which will allow us to penetrate new markets or expand our products in existing markets.in Developing Marketsemission controlclean air manufacturing facilities in Chennai, India and Guangzhou, China, and a ride controlperformance facility in Chonburi, Thailand. In addition, we opened new emission controlclean air facilities in Changchun, China and in Beijing, China as a result of our joint venture agreements with FAW Sihuan and Beijing Hainachuan Automotive Part Company Limited, respectively. In 2011 we relocated and expanded two plants in China and during the third quarter, increased our investment in Thailand during the third quarter of 2011, by acquiring the remaining interest in our emission controlmarketsregions of Brazil, Russia, India, China, and Thailand, we have followed, building our capabilities to engineer and produce locally cost-competitive and cutting-edge products, which has enabledenabling us to capture new business.controlperformance products and Walker® emission control clean air products, which have been offered to consumers since the 1930s. We believe our brand equity in the aftermarket is a key asset especially as customers consolidate and distribution channels converge. Reflex® and Monroe Reflex® Sensa-Trac and Monroe® Sensa-Trac® shock absorbers, Walker® Quiet-Flow® mufflers, Rancho® ride controlperformance products, DynoMax® exhaust products and Walker Ultra® catalytic converters, and in European markets,Europe, Walker and Aluminox ProTM™ mufflers. Further, we introduced Monroe® Springs and Monro-Magnum® (bus and truck shock line) in Europe and Monroe Dynamics® and Monroe Ceramics Dynamics® and Monroe® Ceramics® brake pads in the United States. We continue to explore other opportunities for developing new product lines that will be marketed under our existing, well-known brands.controlperformance product, the Quick-Strut®, that combines the spring and the upper mount into a single, complete module and simplifies and shortens the installation process, eliminating the need for the special tools and skills required previously. We plan on adaptingadapt our products further for use in foreign nameplate vehicles, withfor example, by introducing the introductionOESpectrum® line of OESpectrumride performance products. Additionally, we find ways to our ride control line. We benefitedbenefit from the consolidation of, and regional expansion by, our customers and gained business lost by competitors that encountered financial difficulties.OnFor our exhaustclean air product line, we continue to enhance our converter coverage, including additionaladding for example to our suite of manifold converter part numbers. In addition, we also offer aftermarket diesel particulate filters.marketsregions outside North America.We developed a strategic alliance with Futaba, a leading exhaust manufacturer in Japan. This alliance helps us grow our business with Japan-based OEMs by leveraging the geographical reach of our partner to serve global vehicle platforms of these OEMs. marketregion through our operations in China, India and Thailand. In June 2009, we formed a joint venture with Beijing Hainachuan Automotive Parts Company Limited in Beijing that produces emission controlclean air exhaust systems for Hyundai. In addition, we continue to serve North American and European OEMs located in China; we supply parts and systems for luxury cars produced by BMW and Audi through our joint venture with Eberspächer International GmbH, and we supply parts and systems for various Ford platforms through our joint venture with Chengdu Lingchuan Mechanical Plant. We established a local engineering center in Shanghai to develop automotive exhaustclean air products when our joint venture with Shanghai Tractor and Engine Company, a subsidiary of Shanghai Automotive Industry Corp., was expanded. Also, we increased our investment from 6080 percent to 80100 percent in Tenneco Tongtai Exhaust Company Limited (TTEC) located in Dalian in January 2010the fourth quarter of 2013 and from 75 percent to 100 percent in our Thailand emission controlclean air company, Walker Exhaust Co. Limited in August 2011. Further, we formed a new joint venture in March 2010 with FAW Sihuan to supply emission controlclean air components and systems for passenger and commercial vehicles. We are workingothers on alternative ureaCormetech Inc., a joint equity company of Corning Inc. and Mitsubishi Heavy Industries Ltd, to design ultra-large diameter SCR technologies, such as solid formscatalysts for marine, locomotive and certain stationary applications. Also in late 2012, we signed a nonexclusive Joint Development and Licensing Agreement with Amminex for the design and development of ammonia.signedhave exclusive licensing agreements for T.R.U.E. CleanT.R.U.E.-Clean®, an exhaust aftertreatment technology used for automatic and active regeneration of Diesel Particulate Filters (DPFs), with Woodward Governor Company and for vaporizer technologies with another company. These technologies,Company. This is an example of a technology, which complementcomplements our array of existing emissions controlclean air products, allowallowing us to provide integrated exhaust aftertreatment systems to commercial truck, off-highway and other vehicle manufacturers and others.manufacturers.In the fourth quarter of 2008, we launched a global restructuring program which included actions to permanently reduce our fixed cost base and flex our costs, such as:Permanently eliminating 1,100 jobs worldwide, which is in addition to 1,150 jobs previously eliminated in 2008;Closing three North American manufacturing plants and an engineering facility in Australia;Suspending matching contributions to employee 401(k) programs (which we reinstituted in 2010); andCutting spending on information technology, sales and marketing programs.DuringOn September 22, 2009, we further flexed our operations to address the market conditions, implementing temporary layoffs of hourly workers at our plants worldwideannounced that we were impacted by customers’ plant shutdowns and announced the closing of our original equipment ride controlperformance plant in Cozad, Nebraska. In North America, where customerThe closure of the Cozad plant eliminated approximately 500 positions. We hired at other facilities as we moved production cuts werefrom Cozad to those facilities, which resulted in a net decrease of approximately 60 positions. Much of the greatest, we also initiated salaried employee furloughs. In Europe, we eliminated all temporary positions and negotiated with various works councilsproduction was shifted from Cozad to pursue similarour plant in Hartwell, Georgia. The closure of the Cozad plant was completed in August 2012 at a total cost of $23 million. Annualized cost savings as a result of these actions total $8 million.efforts including reduced work hours. We instituted salary reductions of at least 10 percent for salaried employees effective April 1, 2009,initiatives where appropriate and implemented other actions to control employee costs. As economic and industry-wide conditions improved, we restored salaries to their prior levels effective October 1, 2009, and reinstated the employer matching contributions to the employee 401(k) plans for the year 2010.In addition, during 2009, we strategically reduced capital expenditures and engineering investments where possible without compromising our long-term growth prospects. We eliminated or postponed regional expansion projects, deferred spending tied to delayed customer launches, redeployed assets where feasible, and eliminated all discretionary capital spending. We focused on developing technologies and capabilities tied to business launching within the next two to three years, making exceptions in instances where the customer agreed to pay upfront for engineering and advance technology developments for programs launching in 2012 and beyond. In this way, we were able to continue all programs critical to our growth while limiting any near-term cash impact.In the third quarter of 2011, we completed a restructuring action that permanently eliminated 53 positions, or seven percent of our total workforce in Australia, which put our cost structure more in line with the industry environment.Australia. This restructuring is part of a continuing broader plan for the Asia Pacific region where we are positioning Tenneco for growth by re-deploying assets to maximize utilization while at the same time addressing the industry environment in the region.20122014 and $3$5 million in 2013.” Item 7, “Management’s Discussion and Analysis of Financial Condition and Results of Operations — Environmental and Other Matters,” Item 7, “Management’s Discussion and Analysis of Financial Condition and Results of Operations — Liquidity and Capital Resources” and Note 12 to the consolidated financial statements of Tenneco Inc. included in Item 8.2011,2013, we had approximately 24,00026,000 employees of whom approximately 4843 percent were covered by collective bargaining agreements. European works councils cover 1918 percent of our total employees, a majority of whom are also included under collective bargaining agreements. Several of our existing2012.2014. In addition, agreements are expiring in 2012 in Europe and South America covering plants in France, Germany, Poland, and Argentina.Argentina are expiring in 2014. We regard our employee relations as satisfactory.addressed theseaddress such price increases by evaluating alternative materials and processes, reviewing material substitution opportunities, increasing component and assembly to best cost countries, as well as strategically pursuing regional and global purchasing strategies for specific commodities, and aggressively negotiating with our customers to allow us to recover these higher costs from them. As global economies continue to recover, we expect increasing price pressure on key commodities, including rubber, oil and steel.sellmarket certain of our emission controlclean air products to OE manufacturers under the names SOLID SCRTM™ and XNOxTM™. The patents, trademarks and other intellectual property owned by or licensed to us are important in the manufacturing, marketing and distribution of our products.ITEM 1A.RISK FACTORS.LightIn general, light vehicle production has been increasingincreased since the second half of 2009, and is forecasted to increase in most regions in 2012 as compared to 2011, however, production is still at low levels and is expected to declinealthough there was weakness in Europe and Australia.South America in 2012 and in Europe and India in 2013. Additionally, production of commercial truck and off-highway vehicles with our content on them has been weaker than historical production levels in certain product applications, such as construction equipment in North America. We cannot assure you that production levels will continue to increase or that they may not decline. Future deterioration or prolonged difficulty in economic conditions could have a material adverse effect on our business, financial position and liquidity.offsdowns of accounts receivable, significant impairment charges or additional restructurings beyond our current global plans. Severe financial or other difficulties at any of our major suppliers could have a material adverse effect on us if we are unable to obtain on a timely basis on similar economic terms the quantity and quality of components we require to produce our products. automotive industry, leading to supply chain disruptions and labor unrest, among other things. These disruptions could force automotiveoriginal equipment manufacturers and, in turn, other suppliers, including us, to shut down production at plants. While the difficulties facing our customers and suppliers over the last several years have been primarily financial in nature, other difficulties, such as an inability to meet increased demand as the economy recovers, could also result in supply chain and other disruptions.commercialoff-highway vehicle purchases is cyclical, affected by such factors as general economic conditions, interest rates and availability of credit, consumer confidence, patterns of consumer spending, industrial construction levels, fuel costcosts, government incentives and the automobilevehicle replacement cycle.cycles. Consumer preferences also impact the demand for new light vehicle purchases. For example, if consumers increasingly prefer electric vehicles, demand for the vehicles equipped with our emission controlclean air products would decrease.emissions controlclean air business. We cannot assure you, however, that environmental standards for emissions will continue to become more stringent or that the adoption of any new standards will not be delayed beyond our expectations.2011,2013, GM and Ford accounted for 1915 percent and 1514 percent of our net sales, respectively. The loss of allhistory.history in many of those regions. However, European production declined in 2012 and was weak in 2013, production in South America declined in 2012 and production in India declined in 2013. Additionally, production of commercial truck and off-highway vehicles with our content on them has been weaker than historical production levels in certain product applications, such as construction equipment in North America. In addition to the risks inherent in the cyclicality of vehicle production, our customers generally have the right to replace us with another supplier at any time for a variety of reasons and have demanded price decreases over the life of awarded business. Accordingly, we cannot assure you that we will in fact realize any or all of the future sales represented by our awarded business. Any failure to realize these sales could have a material adverse effect on our financial condition, results of operations, and liquidity.substantialsignificant portion of our cash flow from operations is dedicated to servicing our debt and is not available for other purposes. Ourpurposes and our level of debt could have other negative consequences to us, including the following:limitingimpair our ability to borrow money or sell stock for our workingraise additional capital capital expenditures, debt service requirements or other general corporate purposes;limiting our flexibility in planning for, or reacting to, changes in our operations, our business or the industry in which we compete; andour leverage may place us at a competitive disadvantage by limiting our ability to invest in the business or in further research and development.any such financing, we could be forced to sell assets to make up for any shortfall in our payment obligations under unfavorable circumstances. If necessary,circumstances and we may not be able to sell assets quickly enough or for sufficient amounts to enable us to meet our obligations.orand capital needs or to engage in other favorable business activities. senior credit facility or the indentures for our other debt instruments, including as a result of events beyond our control, could result in an event of default, which could materially and adversely affect our operating results and our financial condition.immediately.immediately (which, in turn, could also result in an event of default under one or more of our other financing arrangements). If such event occurs, the lenders under ourFor example, in February 2009, we sought an amendment to our senior credit facility to revise the financial ratios we are required to maintain thereunder. If, in the future, we are required to obtain similar amendments as a result of our inability to meet the required financial ratios, there can be no assurance that those amendments will be available on commercially reasonable terms or at all. If, as or when required, we are unable to repay, refinance or restructure our indebtedness under our senior credit facility, or amend the covenants contained therein, the lenders under our senior credit facility could elect to terminate their commitments thereunder, cease making further loans and institute foreclosure proceedings against our assets. In addition, any event of default or declaration of acceleration under one of our debt instruments could also result in an event of default under one or more of our other financing agreements, including our other debt instruments and/or the agreements under which we sell certain of our accounts receivable. This would have a material adverse impact on our liquidity, financial position and results of operations.automotive industryindustries in which we participate is highly unionized and our business could be adversely affected by labor disruptions.Europe isother regions are unionized. Although we consider our current relations with our employees to be satisfactory, if major workutilitiesutility services could have a material adverse impact on us without proportionate recovery from our customers.utilitiesutility services required to produce our products, to the extent they are not timely reflected in the price we charge our customers or are otherwise mitigated, could materially and adversely impact our results. In general, commodity prices including steel, oil and rubber, have been increasing since 2004 with the exception of a temporary but significant decline in prices as a result of the economic turmoil in 2008 and 2009. Notwithstanding this temporary decline, the trend of increasing commodity prices has continued. We mitigated these challenges by evaluating alternative materials and processes, reviewing material substitution opportunities, increasing component sourcing and parts assembly toin best cost countries as well as strategically pursuing regional and globalutilitiesutility services generally rise. Accordingly, we cannot ensure that we will not face increased prices in the future or, if we do, whether these actions will be effective in containing them.Webe unable to realize our business strategy of improving operating performance, growing our business and generating savings and improvements.We regularly implement strategic and other initiatives designed to improve our operating performance. The failure to achieve the goals of these initiatives could have a material adverse effect on our business, particularly since we rely on these initiatives to offset pricing pressures from our suppliers and our customers, as described above, as well as to manage the impacts of production cuts such as the significant production decreases we experienced during 2008 and 2009 as a result of the recent global economic crisis. Furthermore, the terms of our senior credit facility and the indentures governing our notes may restrict the types of initiatives we undertake, as these agreements restrict our uses of cash andfor certain of these agreements require usproducts be constrained in terms of investment and/or lead time. Therefore accurate and long term planning is becoming important to maintain financial ratios and otherwise prohibit us from undertaking certain activities. In the past we have been successful in obtaining the consentavoid supply interruptions because of our senior lenders where appropriate in connection with our initiatives. We cannot assure you, however, that we will be able to pursue, successfully implement or realize the expected benefits of any initiative or that we will be able to sustain improvements made to date. material costs related to product warranties, environmental and regulatory matters, legal proceedings and other claims, which could have a material adverse impact on our financial condition and results of operations.be subject toincur cash costs or charges to earnings if we are required to undertake material additional remediation efforts based onas the resultsresult of our ongoing analysis of the environmental status of our properties,properties. In addition, violations of the laws and regulations we are subject to could result in civil and criminal fines, penalties and sanctions against us, our officers or our employees, as more information becomes available to us.investigations thatinvestigations. These matters typically are incidental to the conduct of our business. Some of these proceedings allegematters involve allegations of damages against us relating to environmental liabilities, intellectual property matters, personal injury claims, taxes, employment matters or commercial or contractual disputes.disputes or allegations relating to legal compliance by us or our employees. For example, we are subject to a number of lawsuits initiated by a significant number of claimants alleging health problems as a result of exposure to asbestos. Many of these cases involve significant numbers of individual claimants. Many of these cases also involve numerous defendants, with the number of defendants in some cases exceeding 100 defendants from a variety of industries. As major asbestos manufacturers or other companies that used asbestos in their manufacturing processes continue to go out of business, we may experience an increased number of these claims.Other Matters”Legal Contingencies” included in Item 7.low-costbest-cost country production strategy and otherwise continue to seek process improvements to reduce costs, we cannot assure you that we will be able to continue to compete favorably in this competitive market or that increased competition will not have a material adverse effect on our business by reducing our ability to increase or maintain sales or profit margins.the trend toward consolidation and bankruptcies among automotive parts suppliers isare resulting in fewer, larger suppliers who benefit from purchasing and distribution economies of scale. If we cannot achieve cost savings and operational improvements sufficient to allow us to compete favorably in the future with these larger companies, our financial condition and results of operations could be adversely affected due to a reduction of, or inability to increase sales.1816 percent and 2017 percent of our net sales in the fiscal years ended December 31, 20112013 and 2010,2012, respectively.Assertions against us or our customers relating to intellectual property rights could materially impact our business.We and others in our industry hold a number of patents and other intellectual property rights that are critical to our respective businesses. On occasion, third parties may assert claims against us and our customers and distributors alleging our products or technology infringe upon third-party intellectual property rights. Similarly, we may assert claims against third-parties who are taking actions that we believe are infringing on our intellectual property rights. These claims, regardless of their merit or resolution, are frequently costly to prosecute, defend or settle and divert the efforts and attention of our management and employees. Claims of this sort also could harm our relationships with our customers and might deter future customers from doing business with us. If any such claim were to result in an adverse outcome, we could be required to take actions which may include: cease the manufacture, use or sale of the infringing products; pay substantial damages to third parties, including to customers to compensate them for their discontinued use or replace infringing technology with non-infringing technology; or expend significant resources to develop or license non-infringing products. Any of the foregoing results could have a material adverse effect on our business, financial condition and results of operations. current customers and suppliers. In addition, any acquisitions could involve the incurrence of substantial additional indebtedness. We cannot assure you that we will be able to successfully integrate any acquisitions that we pursue or that such acquisitions will perform as planned or prove to be beneficial to our operations and cash flow. Any such failure could seriously harm our business, financial condition and results of operations.2011,2013, approximately 5351 percent of our net sales were derived from operations outside North America. International operations are subject to various risks which could have a material adverse effect on those operations or our business as a whole, including:conditions; andrestrictions. However, in 2008 through 2010, the dollar strengthened against the Euro which had negative effects on our results of operations. Our South American operations were negatively impacted by the devaluation in 2000 of the Brazilian currency as well as by the devaluation of the Argentine currency in 2002. We do not generally seek to mitigate this translation effect through the use of derivative financial instruments. To the extent we are unable to match revenues received in foreign currencies with costs paid in the same currency, exchange rate fluctuations in that currency could have a material adverse effect on our business.productionproducts, or financial difficulties.2008, we recorded a $114 million asset impairment charge to write-off the remaining goodwill related to our 1996 acquisition of Clevite Industries and during the fiscal year ended December 31, 2011, we recorded a $11 million goodwill impairment charge relating to our Australian reporting unit.2011,2013, we had approximately $76$165 million in net deferred tax assets. These deferred tax assets include net operating loss carryovers and tax credits that can be used to offset taxable income in future periods and reduce income taxes payable in those future periods. Each quarter, we determine the probability of the realization of deferred tax assets, using significant judgments and estimates with respect to, among other things, historical operating results and expectations of future earnings and tax planning strategies. If we determine in the future that there is not sufficient positive evidence to support the valuation of these assets, due to the risk factors described herein or other factors, we may be required to further adjust the valuation allowance to reduce our deferred tax assets. Such a reduction could result in material non-cash expenses in the period in which the valuation allowance is adjusted and could have a material adverse effect on our results of operations.ITEM 1B.UNRESOLVED STAFF COMMENTS.emission controlClean Air business operates 1162 manufacturing facilities worldwide, of which 14 facilities are located in the U.S.North America, 24 in Europe, South America and 46 manufacturing facilities outside of the U.S. Our emission controlIndia, and 24 in Asia Pacific. Clean Air business also operates fivefour engineering and technical facilities worldwide and share twoshares three other such facilities with our ride controlRide Performance business. Twenty-six of these manufacturing plants are JIT facilities. In addition, two joint ventures in which we hold a noncontrolling interest operate a total of two manufacturing facilities outside the U.S.,in Europe, all of which are JIT facilities.ride controlRide Performance business operates seven27 manufacturing facilities worldwide, of which nine facilities are located in the U.S.North America, 13 in Europe, South America and 23 manufacturing facilities outside the U.S.India, and five in Asia Pacific. Our ride controlRide Performance business also operates seven engineering and technical facilities worldwide and share twoshares three other such facilities with our emission controlClean Air business. TwoOne of these manufacturing plants areis a JIT facilities. outside of the U.S. are located in Argentina, Australia, Belgium, Brazil, Canada, China, Czech Republic, France, Germany, Hungary, India, Italy, Japan, Korea, Mexico, Poland, Portugal, Russia, Spain, South Africa, Sweden, Thailand, the United Kingdom and the United Kingdom.States. We also have sales offices located in Japan, Singapore, Taiwan and Taiwan.5245 and lease 57 of the properties described above and lease 64.above. We hold 1713 of the above-described international manufacturing facilities through sevensix joint ventures in which we own a controlling interest. In addition, two joint ventures in which we hold a noncontrolling interest operate a total of two manufacturing facilities outside the U.S.in Europe. We also have distribution facilities at our manufacturing sites and at a few offsiteoff-site locations, substantially all of which we lease.ITEM 3.LEGAL PROCEEDINGS.obligations thatobligations. These matters are typically incidental to the conduct of our business and create the potential for contingent losses. We accrue for potential contingent losses when our review of available facts indicates that it is probable a loss has been incurred and the amount of the loss is reasonably estimable. Each quarter we assess our loss contingencies based upon currently available facts, existing technology, and presently enacted laws and regulations taking into consideration the likely effects of inflation and other societal and economic factors and record adjustments to these reserves as required. As an example, we consider all available evidence including prior experience in remediation of contaminated sites, other companies’ cleanup experiences and data released by the United States Environmental Protection Agency or other organizations when we evaluate our environmental remediation contingencies. Further, all of our loss contingency estimates are subject to revision in future periods based on actual costs or new information. With respect to our environmental liabilities, where future cash flows are fixed or reliably determinable, we have discounted those liabilities. All other environmental liabilities are recorded at their undiscounted amounts. We evaluate recoveries separately from the liability and, when they are assured, recoveries are recorded and reported separately from the associated liability in our consolidated financial statements.2011,2013, we have the obligation to remediate or contribute towards the remediation of certain sites, including one Federal Superfund site. At December 31, 2011,2013$17$15 million, of which $5$3 million is recorded in other current liabilities and $12 million is recorded in deferred credits and other liabilities in our consolidated balance sheet. For those locations in whichwhere the liability was discounted, the weighted average discount rate used was 1.92.8 percent. The undiscounted value of the estimated remediation costs was $20$19 million. Our expected payments of environmental remediation costs are estimated to be approximately $4$3 million in 2012, $2 million in 2013,2014, $1 million each year beginning 20142015 through 20162018 and $11$12 million in aggregate thereafter. Based on information known to us, we have established reserves that we believe are adequate for these costs. Although we believe these estimates of remediation costs are reasonable and are based on the latest available information, the costs are estimates and are subject to revision as more information becomes available about the extent of remediation required. At some sites, we expect that other parties will contribute towards the remediation costs. Inproceedings allegematters involve allegations of damages against us relating to environmental liabilities (including, toxic tort, property damage and remediation), intellectual property matters (including patent, trademark and copyright infringement, and licensing disputes), personal injury claims (including injuries due to product failure, design or warning issues, and other product liability related matters), taxes, employment matters, and commercial or contractual disputes, sometimes related to acquisitions or divestitures. Some of these matters involve allegations relating to legal compliance. For example, one of our Argentine subsidiaries is currently defending against a criminal complaint alleging the failure to comply with laws requiring the proceeds of export transactions to be collected, reported and/or converted to local currency within specified time periods. As another example, in the U.S. we are subject to an audit in 11 states with respect to the payment of unclaimed property to those states, spanning a period as far back as over 30 years. We now have practices in place whichWhile we believe ensure that we pay unclaimed property as required. We vigorously defend ourselves against all of these claims. Inclaims in future periods we could be subject to cash costs or charges to earnings if any of these matters are resolved on unfavorable terms. However, althoughAlthough the ultimate outcome of any legal matter cannot be predicted with certainty, based on current information, including our assessment of the merits of the particular claim, we do not expect that thesethe legal proceedings or claims currently pending against us will have any material adverse impact on our future consolidated financial position, results of operations or cash flows. a number of lawsuits initiated by a significant number of claimants alleging health problems as a result of exposure to asbestos. In the early 2000’s we were named in nearly 20,000 complaints, most of which were filed in Mississippi state court and the vast majority of which made no allegations of exposure to asbestos from our product categories. Most of these claims have been dismissed and our current docket of active and inactive cases is less than 500 cases nationwide. A small number of claims have been asserted by railroad workers alleging exposure to asbestos products in railroad cars manufactured by The Pullman Company, one of our subsidiaries. The balancesubstantial majority of the remaining claims isare related to alleged exposure to asbestos in our automotive products. Only a small percentage of the claimants allege that they were automobile mechanics and a significant number appear to involve workers in other industries or otherwise do not include sufficient information to determine whether there is any basis for a claim against us. We believe, based on scientific and other evidence, it is unlikely that mechanics were exposed to asbestos by our former products and that, in any event, they would not be at increased risk of asbestos-related disease based on their work with these products. Further, many of these cases involve numerous defendants, with the number of each in some cases exceeding 100 defendants from a variety of industries. Additionally, the plaintiffs either do not specify any, or specify the jurisdictional minimum, dollar amount for damages. As major asbestos manufacturers and/or users continue to goITEM 4.MINE SAFETY DISCLOSURES.24, 2012.28, 2014. Gregg M. Sherrill (59)(61) Chairman and Chief Executive Officer (52) Chief Operating Officer Executive Vice President, Ride Performance Division Timothy E. Jackson (57) Executive Vice President Technology, Strategy and Business Development Kenneth R. Trammell (51)(53) Executive Vice President and Chief Financial Officer (50) Executive Vice President, North AmericaClean Air Division(56) Senior Vice President and General Manager — North America Original Equipment Emission ControlClean AirMichael J. Charlton (53) Senior Vice President, Global Supply Chain ManagementHuman Resources and ManufacturingAdministrationJosep Fornos (59) Senior Vice President, General Manager Europe, South AmericaGlobal Manufacturing Development and IndiaEuropean Cost Reduction Initiatives(51) Senior Vice President, General Counsel and Corporate Secretary Timothy E. Jackson (55)Senior Vice President and Chief Technology OfficerBarbara A. Kluth (55)Senior Vice President — Global Human Resources(53) Vice President and Controller Kenneth R. TrammellJosep Fornos — Mr. Trammell has served as our Executive Vice President and Chief Financial Officer since January 2006. Mr. Trammell was named our Senior Vice President and Chief Financial Officer in September 2003, having served as our Vice President and Controller since September 1999. From April 1997 toNovember 1999, he served as Corporate Controller of Tenneco Inc. He joined Tenneco Inc. in May 1996 as Assistant Controller. Before joining Tenneco Inc., Mr. Trammell spent 12 years with the international public accounting firm of Arthur Andersen LLP, last serving as a senior manager.Neal A. Yanos — Mr. YanosFornos was named Executive Vice President, North AmericaRide Performance Division in July 2008. Prior to that, heFebruary 2013. He served as our SeniorExecutive Vice President and General Manager, — North American Original Equipment Ride ControlEurope, South America and North American Aftermarket since May 2003. He joined our Monroe ride control division as a process engineer in 1988 and since that time has served in a broad range of assignments including product engineering, strategic planning, business development, finance, program management and marketing, including Director of our North American Original Equipment GM/VW business unit and most recently as our Vice President and General Manager — North American Original Equipment Ride Control from December 2000. Before joining our company, Mr. Yanos was employed in various engineering positions by Sheller Globe Inc. from 1985 to 1988.Brent J. Bauer — Mr. Bauer has served as our Senior Vice President and General Manager — North American Original Equipment Emission Control since May 2002. Prior to this appointment, Mr. Bauer was named Vice President and General Manager — European and North American Original Equipment Emission Control in July 2001. Mr. Bauer joined Tenneco Automotive in August 1996 as a Plant Manager and was named Vice President and General Manager — European Original Equipment Emission Control in September 1999. Prior to joining Tenneco, he was employed at AeroquipVickers Corporation for 20 years in positions of increasing responsibility serving most recently as Director of Operations.Michael J. Charlton — Mr. Charlton has served as our Senior Vice President, Global Supply Chain Management and Manufacturing since January 2010. Mr. Charlton served as our Vice President, Global Supply Chain Management and Manufacturing from November 2008 through December 2009. Mr. Charlton served as Tenneco’s Managing Director for India from January 2008 until November 2008. PriorMarch 2012 to that, he servedFebruary 2013 and as the operations director for the Company’s emission control business in Europe since 2005. Prior to joining Tenneco in 2005, Mr. Charlton held a variety of positions of increasing responsibility at TRW Automotive, the most recent being Lead Director, European Purchasing and Operations for the United Kingdom.Josep Fornos — Josep Fornos was named Senior Vice President and General Manager, Europe, South America and India infrom July 2010.2010 to March 2012. Prior to this appointment,that, he had served as Vice President and General Manager, Europe Original Equipment Emission Control since March 2007. Mr. Fornos joined Tenneco in July 2000 as Vice President and General Manager, Europe Original Equipment Ride Control. Prior to joining Tenneco, Fornos spent a year at Lear Corporation as General Manager of the company’s seating and wire and harness business in France, following Lear’s acquisition of United Technologies Automotive. Mr. Fornos spent 16 years with United Technologies Automotive, holding several management positions in production, engineering and quality control in Spain and later having Europe-wide responsibility for engineering and quality control.James D. HarringtonTimothy E. Jackson — Mr. HarringtonJackson has served as Executive Vice President, Technology, Strategy and Business Development since March 2012. He served as our Senior Vice President General Counsel and Corporate Secretary since June 2009 and is responsible for managing our worldwide legal affairs including corporate governance and compliance. Mr. Harrington joined us in January 2005 as Corporate Counsel and was named Vice President — Law in July 2007. Prior to joining Tenneco, he worked at Mayer Brown LLP in the firm’s corporate and securities practice.Timothy E. Jackson — Mr. Jackson has served as our Chief Technology Officer sincefrom March 2007.2007 to March 2012. Prior to this role,that, Mr. Jackson served as our Senior Vice President — Global Technology and General Manager, Asia Pacific since July 2005. From 2002 to 2005, Mr. Jackson served as Senior Vice President — Manufacturing, Engineering, and Global Technology. In August 2000, he was named Senior Vice President — Global Technology, a role he served in after joining us as Senior Vice President and General Manager — North American Original Equipment and Worldwide Program Management in June 1999. Mr. Jackson came to Tenneco from ITT Industries where he was President of that company’s Fluid Handling Systems Division. With over 30 years of management experience, 14 within the automotive industry, he had also served as Chief Executive Officer for HiSAN,HiSan, a joint venture between ITT Industries and Sanoh Industrial Company. Mr. Jackson has also held senior management positions at BF Goodrich Aerospace and General Motors Corporation.Barbara A. KluthKenneth R. Trammell — Ms. KluthMr. Trammell has served as our Executive Vice President and Chief Financial Officer since January 2006. Mr. Trammell was named our Senior Vice President and Chief Financial Officer in September 2003, having served as our Vice President and Controller since September 1999. From April 1997 to November 1999, he served as Corporate Controller of Tenneco Inc. He joined Tenneco Inc. in May 1996 as Assistant Controller. Before joining Tenneco Inc., Mr. Trammell spent 12 years with the international public accounting firm of Arthur Andersen LLP, last serving as a senior manager.March 2011. She2005. Prior to joining Tenneco in 2005, Mr. Charlton held a variety of positions of increasing responsibility at TRW Automotive, the most recent being Lead Director, European Purchasing and Operations for the United Kingdom.Global Human Resources— Law in April 2010. In December 2001, she was named Executive Director, HR, North America after beginning her careerJuly 2007. Prior to joining Tenneco, he worked at Mayer Brown LLP in human resources in 1988 as HR manager for our Marshall, Michigan facility. She joined Tenneco in 1985 as an internal auditor.the firm’s corporate and securities practice.was namedhas served as our Vice President and Controller insince July 2006. Mr. Novas served as Vice President, Finance and Administration for Tenneco Europe from January 2004 until July 2006 and as Vice President and Treasurer of Tenneco from November 1999 until January 2004. Mr. Novas joined Tenneco in 1996 as assistant treasurer responsible for corporate finance and North American treasury operations. Prior to joining Tenneco, Mr. Novas worked in the treasurer’s office of General Motors Corporation for ten years.ITEM 5. MARKET FOR REGISTRANT’S COMMON EQUITY, RELATED STOCKHOLDER MATTERS, AND ISSUER PURCHASES OF EQUITY SECURITIES. Sales Prices High Low $ 46.81 $ 36.23 46.80 36.52 46.49 24.33 36.96 22.47 $ 25.00 $ 17.17 27.50 19.06 31.46 19.29 43.71 28.47 Sales Prices Quarter High Low 2013 1st $ 39.50 $ 34.55 2nd 47.83 34.26 3rd 52.01 45.30 4th 57.85 48.60 2012 1st $ 40.69 $ 29.45 2nd 39.28 24.35 3rd 32.81 24.43 4th 35.25 26.72 2012,2014, there were approximately 18,37817,016 holders of record of our common stock, including brokers and other nominees.then-then current industry conditions, primarily greater than anticipated production volume reductions by OEMs in North America and continued softness in the global aftermarket. We have not paid dividends on our common stock since the fourth quarter of 2000. There are no current plans to reinstate a dividend on our common stock. For additional information concerning our payment of dividends, see “Management’s Discussion and Analysis of Financial Condition and Results of Operations” included in Item 7.2011. All these2013. These purchases reflectinclude shares withheld upon vesting of restricted stock for minimum tax withholding obligations. We intend to continue to satisfy statutory minimum tax withholding obligations in connection with the vesting of outstanding restricted stock through the withholding of shares. Total Number of
Shares Purchased Average Price
Paid 2,888 $33.98 9 31.10 2,820 29.73 5,717 $31.88 Period Total Number of
Shares Purchased Average Price
Paid Total Number of Shares Purchased as Part of Publicly Announced Plans or Programs Maximum Number of Shares That May Yet be Purchased Under These Plans or Programs October 2013 116,732 $ 52.02 114,646 15,454 November 2013 15,463 $ 53.68 15,454 — December 2013 — $ — — — Total 132,195 $ 52.21 130,100 — 2012,2014, our Board of Directors approved a share repurchase program, authorizing our company to repurchase up to 600,000400,000 shares of the Company’s outstanding common stock over a 12 month period. OurThis share repurchase program is intended to offset dilution from shares of restricted stock and stock options issued in 20122014 to employees.ArvinMeritorMeritor, Inc., American Axle & Manufacturing Co., Borg Warner Inc., Cummins Inc., Johnson Controls Inc., Lear Corp., Magna International Inc. and TRW Automotive Holdings Corp. These comparisons assume an initial investment of $100 and the reinvestment of dividends.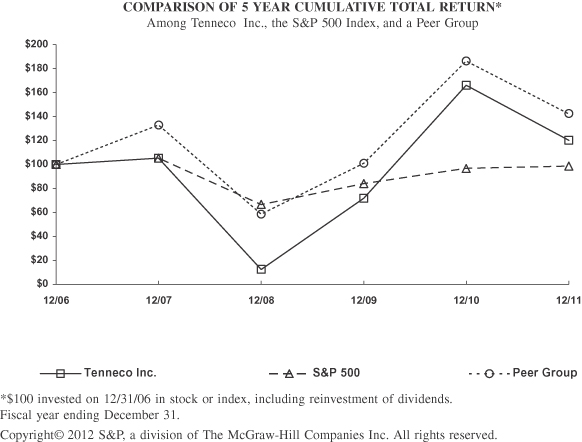
12/31/06 12/31/07 12/31/08 12/31/09 12/31/10 12/31/11 100.00 105.46 11.93 71.72 166.50 120.47 100.00 105.49 66.46 84.05 96.71 98.75 100.00 133.21 58.42 101.00 186.97 142.42 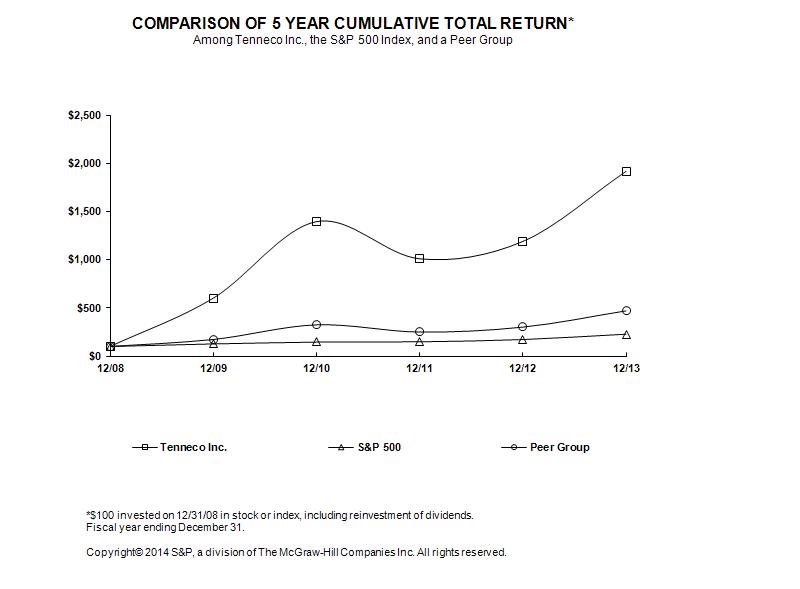
12/31/2008 12/31/2009 12/31/2010 12/31/2011 12/31/2012 12/31/2013 Tenneco Inc. 100.00 601.02 1,395.25 1,009.49 1,190.17 1,917.63 S&P 500 100.00 126.46 145.51 148.59 172.37 228.19 Peer Group 100.00 172.90 324.17 249.91 300.97 469.40 ITEM 6.SELECTED FINANCIAL DATA. Year Ended December 31, 2011(a) 2010 2009(b) 2008(c) 2007 (Millions Except Share and Per Share Amounts) $ 3,426 $ 2,832 $ 2,099 $ 2,641 $ 2,910 3,169 2,594 2,209 2,983 3,135 804 698 525 543 560 (194 ) (187 ) (184 ) (251 ) (421 ) $ 7,205 $ 5,937 $ 4,649 $ 5,916 $ 6,184 $ 216 $ 155 $ 42 $ (107 ) $ 120 125 76 20 85 99 38 50 30 19 33 379 281 92 (3 ) 252 108 149 133 113 164 88 69 13 289 83 183 63 (54 ) (405 ) 5 26 24 19 10 10 $ 157 $ 39 $ (73 ) $ (415 ) $ (5 ) 59,884,139 59,208,103 48,572,463 46,406,095 45,809,730 61,520,160 60,998,694 48,572,463 46,406,095 45,809,730 $ 2.62 $ 0.65 $ (1.50 ) $ (8.95 ) $ (0.11 ) $ 2.55 $ 0.63 $ (1.50 ) $ (8.95 ) $ (0.11 ) Years Ended December 31, 2011 2010 2009 2008 2007 (Millions Except Ratio and Percent Amounts) $ 3,337 $ 3,167 $ 2,841 $ 2,828 $ 3,590 66 63 75 49 46 1,158 1,160 1,145 1,402 1,328 12 12 7 7 6 — (4 ) (21 ) (251 ) 400 43 39 32 24 25 43 35 11 (227 ) 425 $ 245 $ 244 $ 241 $ 160 $ 158 (224 ) (157 ) (119 ) (261 ) (202 ) (26 ) (30 ) (87 ) 58 (10 ) (213 ) (151 ) (120 ) (233 ) (177 ) $ 586 $ 497 $ 313 $ 219 $ 457 5.43 3.34 2.35 1.94 2.79 1.72 1.99 3.36 6.05 2.60 3.10 1.79 — — 1.46 Year Ended December 31, 2013(a) 2012(b) 2011(c) 2010 2009(d) (Millions Except Share and Per Share Amounts) Statements of Income (Loss) Data: Net sales and operating revenues — Clean Air Division North America $ 2,666 $ 2,512 $ 2,291 $ 1,813 $ 1,305 Europe, South America & India 2,045 1,827 1,952 $ 1,562 $ 1,330 Asia Pacific 853 695 625 $ 543 $ 405 Intergroup sales (120 ) (108 ) (107 ) $ (93 ) $ (121 ) Total Clean Air Division 5,444 4,926 4,761 $ 3,825 $ 2,919 Ride Performance Division North America 1,265 1,223 1,135 $ 1,019 $ 799 Europe, South America & India 1,087 1,094 1,217 $ 1,032 $ 880 Asia Pacific 251 213 179 $ 155 $ 121 Intergroup sales (83 ) (93 ) (87 ) $ (94 ) $ (70 ) Total Ride Performance Division 2,520 2,437 2,444 $ 2,112 $ 1,730 Total Tenneco Inc. $ 7,964 $ 7,363 $ 7,205 $ 5,937 $ 4,649 Earnings (loss) before interest expense, income taxes, and noncontrolling interests — Clean Air Division North America $ 229 $ 202 $ 172 $ 114 $ 52 Europe, South America & India 57 54 79 $ 50 $ 7 Asia Pacific 84 71 47 $ 53 $ 25 Total Clean Air Division 370 327 298 $ 217 $ 84 Ride Performance Division North America 124 122 76 $ 87 $ 26 Europe, South America & India (7 ) 41 69 $ 55 $ 27 Asia Pacific 22 5 (6 ) $ 3 $ 4 Total Ride Performance Division 139 168 139 $ 145 $ 57 Other (85 ) (67 ) (58 ) (81 ) (49 ) Total Tenneco Inc. $ 424 $ 428 $ 379 281 92 Interest expense (net of interest capitalized) 80 105 108 149 133 Income tax expense 122 19 88 69 13 Net income (loss) 222 304 183 63 (54 ) Less: Net income attributable to noncontrolling interests 39 29 26 24 19 Net income (loss) attributable to Tenneco Inc. $ 183 $ 275 $ 157 $ 39 $ (73 ) Weighted average shares of common stock outstanding — Basic 60,474,492 59,985,677 59,884,139 59,208,103 48,572,463 Diluted 61,594,062 61,083,510 61,520,160 60,998,694 48,572,463 Basic earnings (loss) per share of common stock $ 3.03 $ 4.58 $ 2.62 $ 0.65 $ (1.50 ) Diluted earnings (loss) per share of common stock $ 2.97 $ 4.50 $ 2.55 $ 0.63 $ (1.50 ) Years Ended December 31, 2013 2012 2011 2010 2009 (Millions Except Ratio and Percent Amounts) Balance Sheet Data (at year end): Total assets $ 3,830 $ 3,608 $ 3,337 $ 3,167 $ 2,841 Short-term debt 83 113 66 63 75 Long-term debt 1,019 1,067 1,158 1,160 1,145 Redeemable noncontrolling interests 20 15 12 12 7 Total Tenneco Inc. shareholders’ equity 433 246 — (4 ) (21 ) Noncontrolling interests 39 45 43 39 32 Total equity 472 291 43 35 11 Statement of Cash Flows Data: Net cash provided by operating activities $ 503 $ 365 $ 245 $ 244 $ 241 Net cash used by investing activities (266 ) (273 ) (224 ) (157 ) (119 ) Net cash used by financing activities (175 ) (89 ) (26 ) (30 ) (87 ) Cash payments for plant, property and equipment (244 ) (256 ) (213 ) (151 ) (120 ) Other Data: EBITDA including noncontrolling interests(e) $ 629 $ 633 $ 586 $ 497 $ 313 Ratio of EBITDA including noncontrolling interests to interest expense 7.86 6.03 5.43 3.34 2.35 Ratio of net debt (total debt less cash and cash equivalents) to EBITDA including noncontrolling interests(f) 1.31 1.51 1.72 1.99 3.36 Ratio of earnings to fixed charges(g) 4.34 3.55 3.10 1.79 — 2011,2013, which are discussed in the following notes, are included in this Form 10-K under Item 8.(a) 2013 includes $78 million of restructuring and related costs primarily related to European cost reduction efforts including the closing of the ride performance plant in Gijon, Spain and intended reductions to the workforce at our ride performance plant in Sint-Truiden, our exit from the distribution of aftermarket exhaust products and ending production of leaf springs in Australia, headcount reductions in various regions, and the net impact of freezing our defined benefit plans in the United Kingdom. Of the total $78 million we incurred in restructuring and related costs, $3 million was related to non-cash asset write downs. (b) 2012 includes a $7 million asset impairment charge related to certain assets of our European Ride Performance business and a benefit of $5 million from property recoveries related to transactions originated by The Pullman Company before being acquired by Tenneco in 1996. (c) During the third quarter of 2011, we recorded a goodwill impairment charge of $11 million related to our Australian reporting unit within the Asia Pacific segment. (b)(d) We incurred no direct economic loss from the bankruptcy filing of Chrysler and General Motors plants in North America during the second and third quarters of 2009. In this regard, we collected substantially all of our pre-petition receivables from Chrysler Group LLC and Chrysler Group LLC has assumed substantially all of the contracts which we had with Chrysler LLC. We collected substantially all of our pre-petition receivables from General Motors Company and General Motors Company has assumed substantially all of the contracts which we had with General Motors Corporation. However, the vehicle production shutdowns at Chrysler and significant reductions in vehicle production volumes at General Motors plants in North America during the second quarter of 2009 that coincided with their bankruptcies did cause Tenneco’s revenue from those two customers in North America to decline to $123 million in the second quarter of 2009, down from $242 million in the second quarter of 2008. We believe that General Motors and Chrysler were able to meet any unmet demand for their vehicles resulting from their production volume reductions in the second quarter of 2009 during the second half of 2009 after they exited their respective bankruptcy proceedings. Accordingly, for the entire 2009 calendar year, we consider the vehicle production volume reductions at Chrysler and General Motors to have been primarily driven by the same severe deterioration in overall economic conditions that caused substantially all of our original equipment customers in North America to significantly reduce production volumes in response to lower purchases of new vehicles.(c)During the fourth quarter of 2008, we recorded a goodwill impairment charge of $114 million related to our North American Original Equipment Ride Control reporting unit whose carrying value exceeded the estimated fair value. In addition, during the second half of 2008, we recorded tax expense of $190 million related to establishing a valuation allowance against our net deferred tax assets in the U.S.(d)(e)compete in our markets but which may have different capital structures and tax positions, which can have an impact on the comparability of interest expense, noncontrolling interests and tax expense. We also believe that using this measure allows us to understand and compare operating performance both with and without depreciation expense, which can vary based on several factors. We believe EBITDA including noncontrolling interests is useful to our investors and other parties for these same reasons. Year Ended December 31, 2011 2010 2009 2008 2007 (Millions) $ 157 $ 39 $ (73 ) $ (415 ) $ (5 ) 26 24 19 10 10 88 69 13 289 83 108 149 133 113 164 207 216 221 222 205 $ 586 $ 497 $ 313 $ 219 $ 457 Year Ended December 31, 2013 2012 2011 2010 2009 (Millions) Net income (loss) $ 183 $ 275 $ 157 $ 39 $ (73 ) Noncontrolling interests 39 29 26 24 19 Income tax expense 122 19 88 69 13 Interest expense, net of interest capitalized 80 105 108 149 133 Depreciation and amortization of other intangibles 205 205 207 216 221 Total EBITDA including noncontrolling interests $ 629 $ 633 $ 586 $ 497 $ 313 (e)(f) We present the ratio of net debt (total debt less cash and cash equivalents) to EBITDA including noncontrolling interests because management believes it is a useful measure of Tenneco’s credit position and progress toward reducing leverage. The calculation is limited in that we may not always be able to use cash to repay debt on a dollar-for-dollar basis. (f)(g) For purposes of computing this ratio, earnings generally consist of income before income taxes and fixed charges excluding capitalized interest. Fixed charges consist of interest expense, the portion of rental expense considered representative of the interest factor and capitalized interest. Earnings were insufficient to cover fixed charges by $39 million and $121 million for the yearsyear ended December 31, 2009 and 2008, respectively.2009. See Exhibit 12 to this Form 10-K for the calculation of this ratio.ITEM 7. MANAGEMENT’S DISCUSSION AND ANALYSIS OF FINANCIAL CONDITION AND RESULTS OF OPERATIONS. beginning on page 67.emission controlclean air and ride controlperformance products and systems for light vehicle, commercial truck and specialty vehicleoff-highway applications. We serve both original equipment (OE) vehicle designers and manufacturers and the repair and replacement markets, or aftermarket, globally through leading brands, including Monroe®, Rancho®, Clevite® Elastomers, Marzocchi®, AxiosTM™, KineticTM™ and Fric-RotTM™ ride controlperformance products and Walker®, XNOx™, FonosTM™, DynoMax®, ThrushTM™ and LukeyTM™ emission controlclean air products. We serve more than 6465 different original equipment manufacturers and commercial vehicletruck and off-highway engine manufacturers, and our products are included on nine of the top 10 car models produced for sale in Europe and nineeight of the top 10 light truck models produced for sale in North America for 2011.2013. Our aftermarket customers are comprised of full-line and specialty warehouse distributors, retailers, jobbers, installer chains and car dealers. As of December 31, 2011,2013, we operated 8789 manufacturing facilities worldwide and employed approximately 24,00026,000 people to service our customers’ demands.2011,2013, light vehicle production continued to improve from recent years in mostsome of the geographic regions in which we operate. Light vehicle production was up 10five percent in North America, and up five14 percent in bothChina and six percent in South America. India light vehicle production was down four percent and Australia was down 6 percent from 2012 levels. Europe light vehicle production was even compared to 2012.China, though not toorganized along our two major product lines (clean air and ride performance) and three geographic areas (North America; Europe, South America and India; and Asia Pacific), resulting in six operating segments (North America Clean Air, North America Ride Performance, Europe, South America and India Clean Air, Europe, South America and India Ride Performance, Asia Pacific Clean Air and Asia Pacific Ride Performance). Within each geographical area, each operating segment manufactures and distributes either clean air or ride performance products primarily for the levels seen in recent history.We have a substantial amount of indebtedness. As such, our ability to generate cash — both to fund operations and service our debt — is also a significant area of focus for our company. See “Liquidity and Capital Resources” below for further discussion of cash flows and Item 1A, “Risk Factors” included in this Annual Report on Form 10-K.Total revenues for 2011 were $7,205 million ($1,295 million in aftermarket revenues and $5,910 million in original equipment revenues),and aftermarket industries. Each of the six operating segments constitutes a 21reportable segment. Costs related to other business activities, primarily corporate headquarter functions, are disclosed separately from the six operating segments as "Other." Prior period segment information has been revised to reflect our new reporting segments.$5,937 million ($1,169$7,363 million in aftermarket revenues and $4,768 million in original equipment revenues) in 2010.2012. Excluding the impact of currency and substrate sales, revenue was up $711$481 million, or 15 percent,from $5,703 million to $6,184 million, driven primarily by higher OE productionstronger global light vehicle volumes, higherlaunching new light vehicle platforms and growing commercial truck and off-highway and aftermarket sales globally and new launches of light and commercial vehicle emission control programs.20112013 was $6,037$6,734 million, or 84.6 percent of sales, compared to $6,170 million, or 83.8 percent of sales compared to $4,900 million, or 82.5 percent of sales in 2010.2012. The following table lists the primary drivers behind the change in cost of sales ($ millions). $ 4,900 871 70 179 (16 ) 33 $ 6,037 Year ended December 31, 2012 $ 6,170 Volume and mix 571 Material (59 ) Currency exchange rates (37 ) Restructuring 57 Other Costs 32 Year ended December 31, 2013 $ 6,734 production volumes, higher restructuring and other costs, mainly manufacturing, partially offset by lower net material costs and the impact of foreign currency exchange rates and higher material and other costs, mainly manufacturing.20112013 was $1,168$1,230 million, or 15.4 percent of sales, versus $1,193 million, or 16.2 percent versus $1,037 million, or 17.5 percentof sales in 2010. The decline in gross margin percentage was primarily driven by a higher mix of OE revenues, higher substrate sales and higher material costs net of recoveries, which together had a 0.9 percentage point impact on gross margin.2012. The effects on gross margin resulting from higher volumes and lower restructuring and related expenses, were more than offset by unfavorable pricing, primarily related to contractual price reductions, higher manufacturing costs particularly in our North America OE ride control business, and inflationary wage costs in South Americanegative currency were partially offset by higher volumes and accounted for the remaining decline in gross margin.$133$144 million and $117$126 million in 20112013 and 2010,2012, respectively. Increased spending to support customer programs, technology applications, and growth in emerging markets and higher foreign exchange ratesdecreased engineering cost recoveries drove the increase in expense year-over-year.$11$26 million in 2011,2013, at $428$453 million, compared to $417$427 million in 2010. Wage inflation2012. The year-over-year increase is due to higher compensation related accruals, growth in South America,emerging markets, higher restructuring and related expenses, to support new customer programs and new manufacturing facilitiesa benefit of $5 million in China, and higher aftermarket changeover costs primarily drove the increase in expense year-over-year. Lower deferred and long-term compensation expense indexed to the Company’s stock price partially offset these increases. 2010 included $6 million of charges2012 from property recoveries related to an actuarial loss for lump-sum pension payments.2011 was $2072012 included a $7 million compared to $216 million in 2010. Included in 2010 was $5 million of restructuring and related expenses.Goodwill impairment: During the third quarter of 2011, we performed an impairment evaluation of our Australian reporting unit’s goodwill balance as a result of continued deterioration of that reporting unit’s financial performance driven by significant declines in industry production volumes in that region. As a result of our impairment evaluation, we concluded that the remaining amount of goodwill was impaired and accordingly, we recorded a goodwillasset impairment charge of $11 million.$379$424 million for 2011, an improvement2013, a decrease of $98$4 million, when compared to $281$428 million in the prior year. Higher OE revenues, stronger margins on new light and commercial vehicle launches, lower depreciation and amortization expense, decreased restructuring and related costs,expenses, higher aftermarket sales, lower deferred and long-term compensationengineering expense, indexed to the Company’s stock price and $14 million of positivenegative currency drove the year-over-year increaseand a benefit of $5 million in 2012 from property recoveries related to EBIT. Partially offsetting the increasetransactions originated by The Pullman Company before being acquired by Tenneco in 1996 were partially offset by operational costselling, general, administrativelight vehicle volumes globally, commercial truck and engineering spending to support new customer programs, which includedoff-highway revenue growth and higher aftermarket changeover costs and investments in new facilities in China, unfavorable pricing, primarily related to contractual price reductions, increased material costs net of recoveries, a goodwill impairment charge of $11 million in Australia and higher manufacturing and freight expenses.20112013 and 2010following tables below reflect our revenues for 20112013 and 2010.2012. We present these reconciliations of revenues in order to reflect the trend in our sales in various product lines and geographic regions separately from the effects of doing business in currencies other than the U.S. dollar. We have not reflected any currency impact in the 2010 table since this is the base period for measuring the effects of currency during 2011 on our operations. We believe investors find this information useful in understanding period-to-period comparisons in our revenues.Additionally, we show the component of our OE revenue represented by substrate sales in the following tables.sales. While we generally have primary design, engineering and manufacturing responsibility for OE emission control systems, we do not manufacture substrates. Substrates are porous ceramic filters coated with a catalyst —- typically, precious metals such as platinum, palladium and rhodium. These are supplied to us by Tier 2 suppliers generally as directed by our OE customers. We generally earn a small margin on these components of the system. As the need for more sophisticated emission control solutions increases to meet more stringent environmental regulations, and as we capture more diesel aftertreatment business, these substrate components have been increasing as a percentage of our revenue. While these substrates dilute our gross margin percentage, they are a necessary component of an emission control system. We view the growth of substrates as a key indicator that our value-add content in an emission control system is moving toward the higher technology hot-end gas and diesel business.Excluding “substrate”Presenting revenues that exclude “substrates” used in catalytic converterconverters and diesel particulate filter salesfilters removes this impact. Year Ended December 31, 2011 Revenues Currency
Impact Revenues
Excluding
Currency Substrate
Sales
Excluding
Currency Revenues
Excluding
Currency and
Substrate
Sales (Millions) $ 608 $ 4 $ 604 $ — $ 604 2,085 — 2,085 971 1,114 2,693 4 2,689 971 1,718 518 5 513 — 513 203 3 200 — 200 721 8 713 — 713 3,414 12 3,402 971 2,431 567 31 536 — 536 1,455 81 1,374 464 910 2,022 112 1,910 464 1,446 219 12 207 — 207 140 8 132 — 132 359 20 339 — 339 632 8 624 102 522 3,013 140 2,873 566 2,307 618 29 589 93 496 160 20 140 10 130 778 49 729 103 626 $ 7,205 $ 201 $ 7,004 $ 1,640 $ 5,364 Year Ended December 31, 2010 Revenues Currency
Impact Revenues
Excluding
Currency Substrate
Sales
Excluding
Currency Revenues
Excluding
Currency and
Substrate
Sales (Millions) $ 527 $ — $ 527 $ — $ 527 1,642 — 1,642 739 903 2,169 — 2,169 739 1,430 484 — 484 — 484 168 — 168 — 168 652 — 652 — 652 2,821 — 2,821 739 2,082 462 — 462 — 462 1,121 — 1,121 351 770 1,583 — 1,583 351 1,232 190 — 190 — 190 141 — 141 — 141 331 — 331 — 331 532 — 532 76 456 2,446 — 2,446 427 2,019 517 — 517 107 410 153 — 153 11 142 670 — 670 118 552 $ 5,937 $ — $ 5,937 $ 1,284 $ 4,653 Year Ended December 31, 2011
Versus Year Ended December 31, 2010
Dollar and Percent Increase (Decrease) Revenues Percent Revenues
Excluding
Currency and
Substrate
Sales Percent (Millions Except Percent Amounts) $ 81 15 % $ 77 15 % 443 27 % 211 23 % 524 24 % 288 20 % 34 7 % 29 6 % 35 21 % 32 19 % 69 11 % 61 9 % 593 21 % 349 17 % 105 23 % 74 16 % 334 30 % 140 18 % 439 28 % 214 17 % 29 15 % 17 9 % (1 ) (1 )% (9 ) (7 )% 28 8 % 8 2 % 100 19 % 66 15 % 567 23 % 288 14 % 101 20 % 86 21 % 7 5 % (12 ) (9 )% 108 16 % 74 13 % $ 1,268 21 % $ 711 15 % Year Ended December 31, 2013 Revenues Substrate Sales Value-add Revenues Currency Impact on Value-add Revenues Value-add Revenues excluding Currency (Millions) Clean Air Division North America $ 2,658 $ 1,030 $ 1,628 $ (1 ) $ 1,629 Europe, South America & India 1,934 663 1,271 (18 ) 1,289 Asia Pacific 852 142 710 9 701 Total Clean Air Division 5,444 1,835 3,609 (10 ) 3,619 Ride Performance Division North America 1,255 — 1,255 (6 ) 1,261 Europe, South America & India 1,046 — 1,046 (36 ) 1,082 Asia Pacific 219 — 219 (3 ) 222 Total Ride Performance Division 2,520 — 2,520 (45 ) 2,565 Total Tenneco Inc. $ 7,964 $ 1,835 $ 6,129 $ (55 ) $ 6,184 Year Ended December 31, 2012 Revenues Substrate Sales Value-add Revenues Currency Impact on Value-add Revenues Value-add Revenues excluding Currency (Millions) Clean Air Division North America $ 2,506 $ 997 $ 1,509 $ — $ 1,509 Europe, South America & India 1,726 570 1,156 — 1,156 Asia Pacific 694 93 601 — 601 Total Clean Air Division 4,926 1,660 3,266 — 3,266 Ride Performance Division North America 1,213 — 1,213 — 1,213 Europe, South America & India 1,041 — 1,041 — 1,041 Asia Pacific 183 — 183 — 183 Total Ride Performance Division 2,437 — 2,437 — 2,437 Total Tenneco Inc. $ 7,363 $ 1,660 $ 5,703 $ — $ 5,703 Year Ended December 31, 2013
Versus Year Ended December 31, 2012
Dollar and Percent Increase (Decrease) Revenues Percent Value-add Revenues excluding Currency Percent (Millions Except Percent Amounts) Clean Air Division North America $ 152 6 % $ 120 8 % Europe, South America & India 208 12 % 133 12 % Asia Pacific 158 23 % 100 17 % Total Clean Air Division 518 11 % 353 11 % Ride Performance Division North America 42 3 % 48 4 % Europe, South America & India 5 — % 41 4 % Asia Pacific 36 20 % 39 21 % Total Ride Performance Division 83 3 % 128 5 % Total Tenneco Inc. $ 601 8 % $ 481 8 % 20112013 and 2010(According2012 (According to IHS Automotive, January 2012)2014) Year Ended
December 31, Increase
(Decrease) % Increase 2011 2010 (Number of Vehicles in Thousands) 13,126 11,941 1,185 10 % 20,089 19,208 881 5 % 4,318 4,173 145 3 % 3,573 3,247 326 10 % 27,980 26,628 1,352 5 % 17,210 16,398 812 5 % 221 242 (21 ) (9 )% North American light vehicle production increased 10 percent, while industry Class 8 commercial vehicle production Year Ended December 31, 2013 2012 Increase
(Decrease) % Increase
(Decrease) (Number of Vehicles in Thousands) North America 16,184 15,434 750 5 % Europe 19,331 19,298 33 — % South America 4,536 4,291 245 6 % India 3,648 3,802 (154 ) (4 )% Total Europe, South America & India 27,515 27,391 124 — % China 20,818 18,235 2,583 14 % Australia 208 221 (13 ) (6 )% 61 percent and industry Class 4-7 commercial vehicle production was up 49%$518 million in 2011 when2013 compared to 2010. Revenues from our North American operations increased2012, driven by higher sales in 2011 compared to last year due to higher OE and aftermarket sales of both product lines.all the regions. The increase in North American OE revenues was primarily driven by improved productionhigher volumes, which accounted for $503$156 million of the year-over-year change in revenues, on Tenneco-supplied vehicles such as the Ford Super-Duty and F-150 pick-ups, Ford Focus, Chevy Malibu, VW Jetta, Chevrolet Equinox, GM’s crossover models and the Toyota Tundra. Also contributing to the increase wasrevenues. Currency had a 63 percent increase in commercial vehicle OE revenues and a favorable $4$1 million currencyunfavorable impact on OE revenue year-over-year.North American revenues. The increase in aftermarket revenue for North America was primarily due to higher volumes in both product lines which resulted in a combined increase in revenue of $57 million. Favorable currency impacted aftermarket revenue by $8 million year-over-year.Our European, South American and Indian segment’s revenues increased in 2011 compared to last year, due to increased sales in both Europe OE business units and European Aftermarket ride control as well as in South America and India. The full year total European light vehicle industry production was up five percent, while industry Class 8 commercial vehicle production was up 37 percent and industry Class 4-7 commercial vehicle production was up eight percent in 2011 when compared to 2010. Improvedmostly driven by higher volumes of $231 million, mainly due to higher year-over-year OE productionlight vehicle and commercial truck and off-highway revenues. Currency had a $15 million unfavorable impact on platforms such as the VW GolfEuropean, South American and Polo, the Mercedes E-class and CLS, Diamler Sprinter, the Ford Focus, the BMW 1 and 3 Series, Audi A4, A6 and A1, Renault/Dacia Logan and Opel Astra and Zafira were the primary drivers of our increased Europe OE revenues and contributed to anIndian revenues. The increase in Asia Pacific revenues was primarily driven by higher volumes of $166 million, mostly due to higher light vehicle and commercial truck volumes in China. Currency had an $11 million favorable impact on Asia Pacific revenues.of $315 million. Higher commercial and specialty revenue also contributed to this increase. European OE revenue also benefitedwas up $83 million in 2013 compared to last year from improved pricing, mainly material cost recovery and favorable foreign currency which2012, primarily driven by higher sales in all the regions. The increase in North American revenues was primarily driven by higher volumes of $43 million. Currency had a combined$6 million unfavorable impact of $127 million. Excluding currency,on North American revenues. The increase in European, ride control aftermarket revenues improved compared to last year on higher sales volumes which had a $17 million impact, tied in part to heavy duty sales. Excluding currency, European emission control aftermarket sales were down mainly due to volumes which accounted for $8 million of the decline. Light vehicle production increased three percent in South America and 10 percent in India for 2011 when compared to 2010. South American and Indian revenues werewas primarily driven by higher in 2011 when compared to the prior year primarily due to stronger OE and aftermarket volumes in both regions, which increased revenue by $76of $25 million. Currency also added $8had a $36 million tounfavorable impact on European, South American and Indian revenue.Industryrevenues. The increase in Asia Pacific revenues was driven by higher volumes of $42 million, mostly due to higher light vehicle production increased five percent year-over-yearvolumes in China but decreased nine percent year-over-year in Australia. Revenues from ourChina. Currency had a $3 million unfavorable impact on Asia Pacific segment increased mainly due to higher sales in China. Asian revenues for 2011 improved from last year, primarily due to $77 million from stronger production volumes, particularly in China on key Tenneco-supplied GM, Ford, Audi, Volkswagon, FAW and Nissan platforms. Foreign currency also benefited Asian revenue by $29 million. Excluding $20 million in favorable foreign currency, lower OE production volumes in Australia drove a $10 million negative impact on revenue for 2011 over 2010.20102012 and 200920102012 and 2009.2011. See “Net Sales and Operating Revenues for Years 20112013 and 2010”2012” for a description of why we present these reconciliations of revenue. Year Ended December 31, 2010 Revenues Currency
Impact Revenues
Excluding
Currency Substrate
Sales
Excluding
Currency Revenues
Excluding
Currency and
Substrate
Sales (Millions) $ 527 $ 11 $ 516 $ — $ 516 1,642 7 1,635 739 896 2,169 18 2,151 739 1,412 484 4 480 — 480 168 2 166 — 166 652 6 646 — 646 2,821 24 2,797 739 2,058 462 (26 ) 488 — 488 1,121 (40 ) 1,161 369 792 1,583 (66 ) 1,649 369 1,280 190 (8 ) 198 — 198 141 (7 ) 148 — 148 331 (15 ) 346 — 346 532 33 499 74 425 2,446 (48 ) 2,494 443 2,051 517 8 509 106 403 153 18 135 9 126 670 26 644 115 529 $ 5,937 $ 2 $ 5,935 $ 1,297 $ 4,638 Year Ended December 31, 2009 Revenues Currency
Impact Revenues
Excluding
Currency Substrate
Sales
Excluding
Currency Revenues
Excluding
Currency and
Substrate
Sales (Millions) $ 382 $ — $ 382 $ — $ 382 1,154 — 1,154 530 624 1,536 — 1,536 530 1,006 406 — 406 — 406 150 — 150 — 150 556 — 556 — 556 2,092 — 2,092 530 1,562 421 — 421 — 421 917 — 917 296 621 1,338 — 1,338 296 1,042 181 — 181 — 181 154 — 154 — 154 335 — 335 — 335 374 — 374 45 329 2,047 — 2,047 341 1,706 380 — 380 85 295 130 — 130 10 120 510 — 510 95 415 $ 4,649 $ — $ 4,649 $ 966 $ 3,683 Year Ended December 31, 2010
Versus Year Ended December 31, 2009
Dollar and Percent Increase (Decrease) Revenues Percent Revenues
Excluding
Currency and
Substrate
Sales Percent (Millions Except Percent Amounts) $ 145 38 % $ 134 35 % 488 42 % 272 44 % 633 41 % 406 40 % 78 19 % 74 18 % 18 12 % 16 10 % 96 17 % 90 16 % 729 35 % 496 32 % 41 10 % 67 16 % 204 22 % 171 28 % 245 18 % 238 23 % 9 6 % 17 10 % (13 ) (9 )% (6 ) (4 )% (4 ) (1 )% 11 3 % 158 42 % 96 29 % 399 20 % 345 20 % 137 36 % 108 37 % 23 18 % 6 4 % 160 31 % 114 27 % $ 1,288 28 % $ 955 26 % Year Ended December 31, 2012 Revenues Substrate Sales Value-add Revenues Currency Impact on Value-add Revenues Value-add Revenues excluding Currency (Millions) Clean Air Division North America $ 2,506 $ 997 $ 1,509 $ — $ 1,509 Europe, South America & India 1,726 570 1,156 (113 ) 1,269 Asia Pacific 694 93 601 — 601 Total Clean Air Division 4,926 1,660 3,266 (113 ) 3,379 Ride Performance Division North America 1,213 — 1,213 — 1,213 Europe, South America & India 1,041 — 1,041 (120 ) 1,161 Asia Pacific 183 — 183 (2 ) 185 Total Ride Performance Division 2,437 — 2,437 (122 ) 2,559 Total Tenneco Inc. $ 7,363 $ 1,660 $ 5,703 $ (235 ) $ 5,938 Year Ended December 31, 2011 Revenues Substrate Sales Value-add Revenues Currency Impact on Value-add Revenues Value-add Revenues excluding Currency (Millions) Clean Air Division North America $ 2,288 $ 971 $ 1,317 $ — $ 1,317 Europe, South America & India 1,849 597 1,252 — 1,252 Asia Pacific 624 110 514 — 514 Total Clean Air Division 4,761 1,678 3,083 — 3,083 Ride Performance Division North America 1,126 — 1,126 — 1,126 Europe, South America & India 1,164 — 1,164 — 1,164 Asia Pacific 154 — 154 — 154 Total Ride Performance Division 2,444 — 2,444 — 2,444 Total Tenneco Inc. $ 7,205 $ 1,678 $ 5,527 $ — $ 5,527 Year Ended December 31, 2012
Versus Year Ended December 31, 2011
Dollar and Percent Increase (Decrease) Revenues Percent Value-add Revenues excluding Currency Percent (Millions Except Percent Amounts) Clean Air Division North America 218 10 % 192 15 % Europe, South America & India (123 ) (7 )% 17 1 % Asia Pacific 70 11 % 87 17 % Total Clean Air Division 165 3 % 296 10 % Ride Performance Division North America 87 8 % 87 8 % Europe, South America & India (123 ) (11 )% (3 ) — % Asia Pacific 29 19 % 31 20 % Total Ride Performance Division (7 ) — % 115 5 % Total Tenneco Inc. 158 2 % 411 7 % 20102012 and 2009(Updated2011 (Updated according to IHS Automotive, January 2012)2014) Year Ended
December 31, Increase
(Decrease) % Increase 2010 2009 (Number of Vehicles in Thousands) 11,941 8,583 3,358 39 % 19,208 16,517 2,691 16 % 4,173 3,693 480 13 % 3,247 2,464 783 32 % 26,628 22,674 3,954 17 % 16,398 12,601 3,797 30 % 242 213 29 14 % North American light vehicle production increased 39 percent, while industry Class 8 commercial vehicle production Year Ended December 31, 2012 2011 Increase
(Decrease) % Increase
(Decrease) (Number of Vehicles in Thousands) North America 15,434 13,126 2,308 18 % Europe 19,298 20,159 (861 ) (4 )% South America 4,291 4,312 (21 ) — % India 3,802 3,600 202 6 % Total Europe, South America & India 27,391 28,071 (680 ) (2 )% China 18,235 17,276 959 6 % Australia 221 222 (1 ) — % 25 percent and industry Class 4-7 commercial vehicle production was flat$165 million in 2010 when2012 compared to 2009. Revenues from our2011, primarily driven by higher volumes in North American operations increasedAmerica and Asia Pacific, partially offset by lower volumes in 2010 compared to 2009 due to higher OEEurope, South America and aftermarket sales of both product lines.India. The increase in North American OErevenues was driven by higher volumes, which accounted for $214 million of the year-over-year change in revenues. The decrease in European, South American and Indian revenues was mostly driven by unfavorable currency impact of $166 million, partially offset by higher volumes of $36 million. The increase in Asia Pacific revenues was driven by higher volumes of $83 million, mostly due to higher light vehicle production volumes in China. Currency had $2 million favorable impact on Asia Pacific revenues.improved productionan unfavorable currency impact of $120 million and lower volumes of Tenneco-supplied vehicles such as the Ford F-150 and Super-Duty pick-ups, GM’s crossover models and the GMT900 platform which accounted for $655 million in revenues. Partially offsetting the increase was unfavorable platform mix which impacted revenue by $31 million when comparing 2010 to 2009.$26 million. The increase in aftermarketAsia Pacific revenues for North America was primarily due todriven by higher customer demand for both product lines which resulted in a combined increase in revenue of $101 million.Our European, South American and Indian segment’s revenues increased in 2010 compared to 2009, due to increased sales in both Europe OE business units as well as in South America and India. The full year total European light vehicle industry production was up 16 percent, while industry Class 8 commercial vehicle production was up 55 percent and industry Class 4-7 commercial vehicle production was up 38 percent in 2010 when compared to 2009. Improved volumes due to our content on better-selling vehicles such as the Ford Focus, VW Polo, Opel Astra, Ford Mondeo and the Daimler Sprinter was the primary driver of our increased Europe OE revenues and resulted in an increase in revenue of $292 million, partially offset by a decrease of $66 million due to foreign currency. Excluding currency, European aftermarket revenues improved on higher ride control sales volumes of $16 million, tied in part to heavy duty sales, partially offset by lower emission control sales volumes of $6 million. Light vehicle production increased 13 percent in South America and 32 percent in India for 2010 when compared to 2009. South American and Indian revenues were higher in 2010 when compared to 2009 primarily due to higher aftermarket sales in South America and stronger OE production volumes in both regions, which increased revenue by $112 million. Currency also added $33 million, to South American and Indian revenue.Industry light vehicle production increased when comparing 2010 versus 2009 by 30 percent and 14 percent in China and Australia, respectively. Revenues from our Asia Pacific segment, which includes Australia and Asia, increased due to higher sales in both regions. Asian revenues for 2010 improved from 2009, primarily due to $133 million from stronger production volumes, particularly in China on key Tenneco-supplied GM, VW and Audi platforms. A $9Currency had $2 million unfavorable impact on revenue due to stronger OE production volumes drove the 2010 revenue increase for Australia over 2009. Currency added $8 million to Asia revenue and $18 million to Australia revenue.20112013 and 2010 Year Ended
December 31, Change 2011 2010 (Millions) $ 216 $ 155 $ 61 125 76 49 38 50 (12 ) $ 379 $ 281 $ 98 Year Ended December 31, Change 2013 2012 (Millions) Clean Air Division North America $ 229 $ 202 $ 27 Europe, South America & India 57 54 3 Asia Pacific 84 71 13 Total Clean Air Division 370 327 43 Ride Performance Division North America 124 122 2 Europe, South America & India (7 ) 41 (48 ) Asia Pacific 22 5 17 Total Ride Performance Division 139 168 (29 ) Other (85 ) $ (67 ) $ (18 ) Total Tenneco Inc. $ 424 $ 428 $ (4 ) Year Ended
December 31, 2011 2010 (Millions) $ 2 $ 14 — 6 3 3 3 2 11 — Year Ended December 31, 2013 2012 (Millions) Clean Air Division Europe, South America & India Restructuring and related expenses $ 8 $ 7 Asia Pacific Restructuring and related expenses 3 — Total Clean Air Division $ 11 $ 7 Ride Performance Division North America Restructuring and related expenses $ 1 $ 1 Pullman property recoveries (1) — (5 ) Europe, South America & India Restructuring and related expenses 62 5 Asset impairment charge (2) — 7 Asia Pacific Restructuring and related expenses 2 — Total Ride Performance Division $ 65 $ 8 Other Restructuring and related expenses $ 2 $ — (1) Represents chargesBenefit from property recoveries related to an actuarial loss for lump-sum pension paymentstransactions originated by The Pullman Company before being acquired by Tenneco in a non-qualified pension plan in which one current and three former employees were participants. Lump-sum pension payments are required when participants retire or when they turn 55. Two former employees turned 55 in 2010.1996.(2) Non-cash asset impairment charge related to goodwill for Tenneco’s Australian reporting unit.certain assets of our European ride performance business.from North American operations increased to $216for the Clean Air division was $370 million in 2011, from $1552013 compared to $327 million one year ago.in 2012. EBIT for North America increased $27 million to $229 million in 2013 versus 2012. The benefits to EBIT from significantly higher OE production volumes, the related manufacturing efficiencies, decreased depreciationramp-up on new platforms and amortization expense, lower deferred and long-term compensation expense indexed to the Company’s stock price and improved aftermarket revenuesoperational cost improvements were partially offset by higher engineering investments for customer programs and negative currency. Europe, South America and India's EBIT increased material spending, increased manufacturing and distribution costs, and higher selling, general, administrative and engineering costs, which included a year-over-year increase to aftermarket changeover costs related to new aftermarket business. Restructuring and related expenses of $2 million were included in 2011 compared to $14 million of restructuring and related expenses and charges of $6 million for an actuarial loss from lump-sum pension payments in 2010. The increased manufacturing costs included higher year-over-year costs, particularly in the third and fourth quarters, related to our North American OE ride control business as we incur some temporarily higher costs while consolidating two North American manufacturing locations. Additionally, in the fourth quarter, we encountered an issue involving struts supplied on one particular OE platform. As a result, we directly incurred approximately $2$3 million in premium freight and overtime costs, some of which we expect2013 to continue into$57 million from $54 million in 2012. We are also continuing to work through details with the customer to determine responsibility for any other costs associated with this issue. We cannot estimate the amount of these costs at this time, but do not believe they will be material to our annual operating results.Our European, South American and Indian segment’s EBIT was $125 million for 2011 compared to $76 million during the same period last year. The increase was driven by higher OE revenues partially offset by higher restructuring and related expenses and negative currency. EBIT for Asia Pacific increased $13 million to $84 million in 2013 from $71 million in 2012. The benefits to EBIT from launches of new platforms and higher production volumes, materialoperational cost management activities and lower deferred and long-term compensation expense indexed to the Company’s stock price. Unfavorable pricing, mainly contractual price reductions and increased manufacturing and selling, general, administrative and engineering costs, in particular inflationary wage costs in South America,positive currency were partially offset by increased restructuring and related expenses. For the increase. RestructuringClean Air division, EBIT included restructuring and related expenses of $3$11 million was included in EBIT for both 20112013 and 2010.$7 million in 2012. Currency had an $11 million favorableno impact on EBIT of the Clean Air division for 20112013 when compared to last year.our Asia Pacific segmentthe Ride Performance division was $139 million in 2011 was $38 million2013 compared to $50$168 million in 2010. Higher2012. EBIT for North America increased $2 million in 2013 to $124 million from $122 million in 2012. The increase was driven by higher OE light vehicle volumes and the related manufacturing efficiencies in Chinaramp-up on new OE platforms, which was partially offset by lower OE commercial truck and lower deferredoff-highway revenues and long-term compensation expense indexedaftermarket sales, negative currency and costs related to the Company’s stock price droveresolution of an issue related to struts supplied to one particular OE platform. We also recorded a benefit of $5 million in 2012 from property recoveries related to transactions originated by The Pullman Company before being acquired by Tenneco in 1996. Europe, South America and India's EBIT improvement, but was more than$(7) million in 2013, compared to $41 million a year ago. The decrease was driven by higher restructuring costs, lower OE light vehicle volumes and negative currency, which was partially offset by a goodwillnew OE platform launches and higher aftermarket volumes. EBIT from Asia Pacific increased $17 million in 2013 to $22 million from 2012. EBIT benefited from higher light vehicle production volumes and operational cost improvements, offset partially by higher restructuring costs. For the Ride Performance division, EBIT included restructuring and related expenses of $65 million in 2013 and $6 million in 2012. We also recorded an asset impairment charge and volume declinesof $7 million in Australia, unfavorable pricing and increased selling, general, administrative, and engineering costs2012 related to support new plants in China. In addition, lower OE production volumes in Thailand due to the flooding negatively impacted EBIT. Currency had a $3 million favorable impact on EBIT for 2011 when compared to last year.favorableunfavorable impact on EBIT of the Ride Performance division for 2013 when compared to last year.for 2011in 2013 as compared to the prior year.20102012 and 2009 Year Ended
December 31, Change 2010 2009 (Millions) $ 155 $ 42 $ 113 76 20 56 50 30 20 $ 281 $ 92 $ 189 Year Ended December 31, Change 2012 2011 (Millions) Clean Air Division North America $ 202 $ 172 $ 30 Europe, South America & India 54 79 (25 ) Asia Pacific 71 47 24 Total Clean Air Division 327 298 29 Ride Performance Division North America 122 76 46 Europe, South America & India 41 69 (28 ) Asia Pacific 5 (6 ) 11 Total Ride Performance Division 168 139 29 Other (67 ) $ (58 ) $ (9 ) Total Tenneco Inc. $ 428 $ 379 $ 49 Charges”,Charges,” which have an effect on the comparability of EBIT results between periods: Year Ended
December 31, 2010 2009 (Millions) $ 14 $ 17 6 — — 5 3 4 2 — Year Ended December 31, 2012 2011 (Millions) Clean Air Division Europe, South America & India Restructuring and related expenses $ 7 $ 3 Asia Pacific Restructuring and related expenses — 2 Goodwill impairment charge (3) — 1 Total Clean Air Division $ 7 $ 6 Ride Performance Division North America Restructuring and related expenses $ 1 $ 2 Pullman property recoveries (1) (5 ) — Europe, South America & India Restructuring and related expenses 5 — Asset impairment charge (2) 7 — Asia Pacific Restructuring and related expenses — 1 Goodwill impairment charge (3) — 10 Total Ride Performance Division $ 8 $ 13 (1) Represents chargesBenefit from property recoveries related to an actuarial loss for lump-sum pension paymentstransactions originated by The Pullman Company before being acquired by Tenneco in a non-qualified pension plan in which one current and three former employees were participants. Lump-sum pension payments are required when participants retire or when they turn 55. Two former employees turned 55 in 2010.1996.(2) Represents a reserveNon-cash asset impairment charge related to environmental liabilitiescertain assets of a company Tenneco acquired in 1996, at locations never operated by Tenneco, andour European ride performance business.(3) Non-cash asset impairment charge related to goodwill for which that acquired company had been indemnified by Mark IV Industries, which declared bankruptcy in the second quarter of 2009.Tenneco’s Australian reporting unit.American operations was $155 million in 2010, an increase of $113 million from $42 million in 2009. The benefits to EBIT from significantly higher OE production volumes, the related manufacturing efficiencies and improved aftermarket revenues were partially offset by higher selling, general, administrative and engineering costs, which included higher performance-based compensation costs, the temporary cost reduction efforts from 2009, which included employee furloughs and salary and benefit cuts, that were subsequently restored by the beginning of 2010, charges of $6 million related to an actuarial loss for lump-sum pension payments andAmerica increased aftermarket changeover costs related to new aftermarket business. Currency had a $13 million favorable impact on North American EBIT for 2010 when compared to 2009. Restructuring and related expenses of $14 million were included in 2010 compared to $17 million of restructuring and related expenses and an environmental reserve charge of $5 million in 2009.Our European, South American and Indian segment’s EBIT was $76 million for 2010, up $56 million from $20 million in 2009. The increase was driven by higher OE production volumes and the related manufacturing efficiencies, new platform launches, favorable platform mix in Europe and material cost management activities.Increased selling, general, administrative and engineering costs partially offset the increase. Restructuring and related expenses of $3 million were included in EBIT for 2010, versus $4 million from the same period 2009. Currency had a $13 million unfavorable impact on EBIT for 2010.EBIT for our Asia Pacific segment, which includes Asia and Australia, increased $20 million to $50 million in 2010 from $30 million in 2009. Higher volumes and the related manufacturing efficiencies drove the EBIT improvement. This increase was partially offset by increased selling, general, administrative and engineering costs. Currency had a $12012 to $202 million favorable impact on 2010 EBIT for our Asia Pacific segment.Currency had a $1 million favorable impact on overall company EBIT for 2010 as comparedverses 2011. The benefits to 2009.EBIT as a Percentage of Revenue for Years 2011, 2010 and 2009 Year Ended
December 31, 2011 2010 2009 6 % 6 % 2 % 4 % 3 % 1 % 5 % 7 % 6 % 5 % 5 % 2 % In North America, EBIT as a percentage of revenue for 2011 was even when compared to last year. The increase in EBIT from higher OE production volumes and the related manufacturing efficiencies higher aftermarket sales,were partially offset by increased operational costs. European, South American and Indian segment’s EBIT decreased $25 million to $54 million in 2012 from $79 million in 2011, driven by unfavorable currency, lower depreciationvolumes, increased operational costs and amortization expense, lower deferred and long-term compensation expense indexed to the Company’s stock price and decreasedhigher restructuring and related chargesexpenses. EBIT for Asia Pacific increased $24 million to $71 million in 2012 from $47 million in 2011. Higher volumes, the related manufacturing efficiencies, lower restructuringoffset as$168 million in 2012 compared to $139 million in 2011. EBIT for North America increased $46 million in 2012 to $122 million verses 2011, primarily driven by higher OE production volumes, increased aftermarket revenues, the related manufacturing efficiencies, operational cost management, lower restructuring and related expenses and a percentagebenefit of revenue$5 million from property recoveries related to transactions originated by increased material spending and manufacturing and distribution costs and higher selling, general, administrative and engineering expenses, including higher aftermarket changeover costs. InThe Pullman Company before being acquired by Tenneco in 1996. Europe, South America and India segment’s EBIT margin for 2011decreased $28 million to $41 million in 2012 from 2011. The decrease in EBIT was up one percentage point from the prior year. Improveddriven by unfavorable currency, higher restructuring and related costs, lower volumes lower deferred and long-term compensation expense indexed toin Europe, the Company’s stock price, currency benefits and material cost management actions, were almost offset asdecision to relinquish a percentage of revenue by unfavorableplatform due to pricing and increased manufacturing and selling, general, administrative and engineering expenses, in particular inflationary wage costsprofitability in South America.America, and increased operational costs. EBIT as a percentage of revenue for our Asia Pacific segment decreased two percentage points in 2011 versus the prior year as higher2012 was $5 million compared to a loss of $6 million in 2011. Higher volumes and thelower restructuring and related manufacturing efficiencies in China and lower deferred and long-term compensation expense indexed to the Company’s stock price, were more thancosts drove EBIT improvement, but was partially offset by unfavorable pricing, a goodwill impairment charge, production declines in Australia and increased selling, general, administrative, and engineering expensescosts to support new plants and new customers in China. Asia. For Ride Performance division, EBIT included restructuring and related expenses of $6 million in 2012 and $3 million in 2011. We also recorded an asset impairment charge of $7 million in 2012 related to certain asset of our European Ride Performance business. The expense in 2011 included a goodwill impairment charge of $10 million. Currency had a $14 million unfavorable impact on EBIT of the Ride Performance division for 2012 when compared to 2011. Year Ended December 31, 2013 2012 2011 Clean Air Division North America 9% 8% 8% Europe, South America & India 3% 3% 4% Asia Pacific 10% 10% 8% Total Clean Air Division 7% 7% 6% Ride Performance Division North America 10% 10% 7% Europe, South America & India (1)% 4% 6% Asia Pacific 10% 3% (4)% Total Ride Performance Division 6% 7% 6% Total Tenneco Inc. 5% 6% 5% addition, lower OE production volumes in Thailand due to the flooding negatively impactedClean Air division, EBIT as a percentage of revenue.revenue for 2010revenues in 2013 was up fourone percentage pointspoint from last year. The benefits from higher volumes, the ramp-up on new platforms and operational cost improvements were partially offset by higher engineering investments for customer programs and negative currency. Europe, South America and India's EBIT as a percentage of revenues in 2013 was even compared to prior year. The benefit from higher OE revenues was offset by higher restructuring and related expenses and negative currency. EBIT as a percentage of revenues for Asia Pacific was even in 2013 when compared to 2009.2012. The increasebenefits from launches of new platforms and higher production volumes, operational cost management and positive currency were offset by increased restructuring and related expenses.decreased restructuringwere offset by increased operational costs. Europe, South America and related charges, higher aftermarket sales and favorable currency was partially offsetIndia's EBIT as a percentage of revenuerevenues in 2012 decreased by higher selling, general, administrative and engineering expenses, including higher aftermarket changeover costs, higher performance-based compensationone percentage point compared to 2011, driven by unfavorable currency, lower volumes, increased operational costs and chargeshigher restructuring and related expenses. EBIT as a percentage of revenues for an actuarial loss for lump-sum pension payments. In Europe, South America and India, EBIT margin for 2010 wasAsia Pacific increased by two percentage points higher than 2009 duewhen compared to improved2011. Higher volumes, mostly in China, the related manufacturing efficiencies, lower restructuring and related expenses, favorable platform mix and materialoperational cost management actions, partially offset by unfavorable currency and increased selling, general, administrative and engineering expenses.drove the improvement.revenue for our Asia Pacific segment increasedrevenues was up one percentage point in 2010 versus the 20092012 compared to 2011. EBIT as a percentage of revenues for North America increased three percentage points in 2012 when compared to 2011, primarily driven by higher OE production volumes, andincreased aftermarket revenues, the related manufacturing efficiencies, wereoperational cost management, lower restructuring and related expenses and a benefit of $5 million from property recoveries related to transactions originated by The Pullman Company before being acquired by Tenneco in 1996. EBIT as a percentage of revenues in Europe, South America and India was down two percentage points in 2012 when compared to 2011. The decrease was driven by unfavorable currency, higher restructuring and related costs, lower volumes in Europe, the Company’s decision to relinquish a platform due to pricing and profitability in South America, and increased operational costs. In Asia Pacific, EBIT as a percentage of revenues in 2012 was up seven percentage points from 2011. Higher volumes, mostly in China on current and new platforms, and lower restructuring and related costs drove the improvement, but was partially offset by increased selling, general, administrative, and engineering expenses.20112013 of $108$80 million ($77 million in our U.S. operations and $3 million in our foreign operations) net of interest capitalized of $4 million, down from $105 million ($102 million in our U.S. operations and $3 million in our foreign operations) net of interest capitalized of $4 million in 2012. Included in 2012 was $18 million of expense related to our refinancing activities. Excluding the refinancing expenses, interest expense decreased in 2013 compared to the prior year as a result of lower rates due to last year's debt refinancing transactions., down from $149 million net of interest capitalized of $4 million ($146in 2011. Included in 2012 was $18 million inof expense related to our U.S. operations and $3 million in our foreign operations) in 2010.refinancing activities. Included in 2011 was $1 million of expense related to our refinancing activities. Included in 2010 was $27 million of expense related to our refinancing activities and $4 million of expense related to an accounting change impacting our factored receivables. See “Liquidity and Capital Resources” below for further discussion on the accounting change. Excluding the refinancing expenses, interest expense decreased in 20112012 compared to the prior year2011 as a result of lower rates due to last year’sthe debt refinancing transactions.We reported interest expense in 2010transactions from the first quarter of $149 million net of interest capitalized of $4 million ($146 million in our U.S. operations and $3 million in our foreign operations), up from $133 million net of interest capitalized of $4 million ($130 million in our U.S. operations and $3 million in our foreign operations) in 2009. Included in 2010 was $27 million of expense related to our refinancing activities and $4 million of expense related to an accounting change impacting our factored receivables. See “Liquidity and Capital Resources” below for further discussion of the accounting change. Excluding the refinancing expenses, interest expense decreased in 2010 compared to 2009 as a result of our lower average borrowings due to our operating cash performance and the 2009 equity offering.2011,2013, we had $987$733 million in long-term debt obligations that have fixed interest rates. Of that amount, $250$500 million is fixed through November 2015,December 2020, $225 million is fixed through August 2018 $500 million is fixed through December 2020 and the remainder is fixed from 20122014 through 2025. We also have $175$288 million in long-term debt obligations that are subject to variable interest rates. For more detailed explanations on our debt structure and senior credit facility refer to “Liquidity and Capital Resources — Capitalization” later in this Management’s Discussion and Analysis.differs from a statutory rate of 35 percent due toincluded a net tax benefit of $7 million primarily related to U.S. taxable income with no associated tax expense due to our net operating loss carryforward and income generated in lower tax rate jurisdictions, partially offset by the impact of recording a valuation allowance against the tax benefit for losses in certain foreign jurisdictions and taxes on repatriation of foreign earnings. Income expense was $69 million for 2010. The tax expense recorded for 2010 differs from a statutory rate of 35 percent due to tax charges of $23 million primarily related to the impact of recording a valuation allowance that we recorded in 2008 against our net deferred tax assets in the tax benefitU.S. based on operating improvements we had made, the outlook for losseslight and commercial truck, off-highway and other vehicle production in the U.S. and the positive impact this should have on our U.S. operations. The net income impact of the tax valuation allowance release in the U.S. was a tax benefit of approximately $81 million. Our federal net operating loss ("NOL") at December 31, 2013 totaled $37 million and expires in 2030. The state NOLs expire in various tax years through 2032.charges related to adjustments tocarryforwards;year income taxes andcarryback years if carryback is permitted under the relevant tax contingencies, partially offset by income generated in lower tax rate jurisdictions. In 2009, we recorded income tax expense of $13 million. Computed using the U.S. Federal statutory income tax rate of 35 percent, income tax would be a benefit of $14 million. law. difference is due primarily to valuation allowances recorded against deferred tax assets generated by 2009taxable losses in the U.S. and in certain foreign countries which we cannot benefit, partially offset by adjustments to pastjurisdictions will impact our provision for income taxes until the valuation allowances are released. Our provision for deferredincome taxes will include no tax assets including a reversal of $20 million of U.S.benefit for losses incurred and no tax expense with respect to income generated in these jurisdictions until the respective valuation allowance based on the change in the fair value of a tax planning strategy.For 2009, we incurred $21 million in restructuring and related costs, of which $16 million was recorded in cost of sales, $1 million was recorded in selling, general, administrative and engineering expense and $4 million was recorded in depreciation and amortization expense. In 2010, we incurred $19 million in restructuring and related costs, of which $14 million was recorded in cost of sales and $5 million was recorded in depreciation and amortization expense. During 2011, we incurred $8 million in restructuring and related costs, primarily related to headcount reductions in Europe and Australia and the closure of our ride controlperformance plant in Cozad, Nebraska, all of which was recorded in cost of sales. December 31,
2010
Restructuring
Reserve 2011
Expenses 2011
Cash
Payments Reserve
Adjustments December 31,
2011
Restructuring
Reserve (millions) $ 7 8 (13 ) (1 ) $ 1 Impact of Exchange Rates (Millions) Employee Severance, Termination Benefits and Other Related Costs $ — 75 (32 ) 1 $ 44 amended and extended senior credit agreement, that took effect on June 3, 2010, we are allowed to exclude $60$80 million of cash charges and expenses, before taxes, related to cost reduction initiatives incurred after June 3, 2010March 22, 2012 from the calculation of the financial covenant ratios required under our senior credit facility. As of December 31, 2011,2013, we have excluded $17 million in cumulativeall allowable charges relating to restructuring initiatives against the $60$80 million available under the terms of the senior credit facility.September 22, 2009,January 31, 2013, we announced our intent to reduce structural costs in Europe by approximately $60 million annually, and anticipate related costs of approximately $120 million, which includes the closing of the Vittaryd facility in Sweden that we were closing our originalannounced in September 2012 and a $7 million charge recorded in the fourth quarter of 2012 related to the impairment of certain assets in the European ride performance business. The $120 million of anticipated costs includes approximately $20 million of non-cash asset write downs, the cost of relocating tooling, equipment ride control plant in Cozad, Nebraska. The closure of the Cozad plant eliminates approximately 500 positions. We are hiring atand production to other facilities, as we move production from Cozadseverance and retention payments to those facilities, which will result in a net decrease of approximately 60 positions. Much ofemployees and other costs related to these actions. Any plans affecting our European hourly and salaried workforce would be subject to consultation with the production is being shifted from Cozad to our plant in Hartwell, Georgia.During the transition of production from our Cozad facility to our Hartwell facility, several customer programs, which were planned to phase out, were reinstated and volumes increased beyond the amount in our original restructuring plan. To meet the higher volume requirements, we have taken a number of actions over the past few months to stabilize the production environment in Hartwell including reinforcing several core processes, realigning assembly lines, upgrading equipment to increase output and accelerating our Lean manufacturing activities. Based on the higher volumes, we are adjusting our consolidation plan. Our revised consolidation plan includes temporarily continuing some basic production operations in Cozad, and redirecting some programs from our Hartwell facility to our other North American facilities to better balance production. These actions are anticipated to conclude during the third quarter of 2012. As of December 31, 2011, more than 95 percent of the positions at our Cozad facility have been eliminated.relevant employee representatives. We still estimate that we will generate $8incurred $78 million in annualized cost savings once these actions are completed.During 2009 and 2010, we recorded $11 million and $10 million, respectively, of restructuring and related expensescosts in 2013, of which $69 million was related to this initiative including $3 million for non-cash asset write downs. We expect that most of whichthe remaining expense will be recorded in 2014, and that the Company will reach a full savings run rate in 2016. On September 5, 2013, we announced our intent to close our ride performance plant in Gijon, Spain and reduce the workforce at our ride performance plant in Sint-Truiden, Belgium. The actions are subject to consultation with the relevant employee representatives and in total would eliminate approximately $16 million represents cash expenditures. For 2011,480 jobs in Western Europe while allowing the most efficient use of our capital assets and production capacity across the region. The actions in Sint-Truiden would transfer higher labor assemblies to other ride performance operations while focusing the Sint-Truiden plant on more highly automated, advanced component production and final assembly. We concluded the consultation period with employee representatives at Gijon without having reached agreement and on December 17, 2013 notified the Gijon workers' council that the Company is proceeding with the plant closure. Employee terminations at Gijon were completed by the end of 2013. The workers' council filed suit challenging the decision to close the Gijon plant and thehave recorded an additional cash chargeannounced the intention of $2the Company to appeal that decision to the Supreme Court of Spain in Madrid. Negotiations with employee representatives at Sint-Truiden are continuing. Our estimate of total charges related to the actions at the Gijon and Sint-Truiden plants remains unchanged from what was announced previously. We expect to record charges of $63 million related to this initiative.During 2011, wethese actions, of which $60 million was recorded $3in 2013. The charges comprise $57 million of restructuringcash expenditures (which consist of severance and related payments to employees, the cost of relocating tooling, equipment and production to other facilities and other costs related to these actions) and $6 million of non-cash asset write downs.allrelated to our restructuring activities, which were partially offset by net tax benefits. The net impact of these items decreased earnings per diluted share by $0.81. We reported net income attributable to Tenneco Inc. of $275 million or $4.50 per diluted common share for 2012. Included in the results for 2012 were negative impacts from expenses related to our restructuring activities, an asset impairment charge and costs related to our refinancing activities, which represented cash expenditures,were more than offset by the benefit from The Pullman Company property recoveries and net tax benefits which included the net impact of approximately $81 million or $1.33 per diluted common share related to the permanent elimination of 53 positions in our Australian operations as a resultreversal of the continued declinetax valuation allowance on the Company’s U.S. net operating loss position in industry production volumes in that region.Earnings (Loss) Per Sharea net income attributable to Tenneco Inc. of $157 million or $2.55 per diluted common share for 2011. Included in the results for 2011 were negative impacts from expenses related to our restructuring activities, a goodwill impairment charge, costs related to our refinancing activities and tax adjustments. The net impact of these items decreased earnings per diluted share by $0.11. We reported net income of $39 million or $0.63 per diluted common share for 2010. Included in the results for 2010 were negative impacts from expenses related to our restructuring activities, pension charges, costs related to our refinancing activities and tax adjustments. The net impact of these items decreased earnings per diluted share by $0.94. We reported a net loss of $73 million or $1.50 per diluted common share for 2009. Included in the results for 2009 were negative impacts from expenses related to our restructuring activities, an environmental reserve and tax adjustments. The net impact of these items decreased earnings per diluted share by $0.91.20112013 and 2010 Year Ended
December 31, 2011 2010 (Millions) $ 245 $ 244 (224 ) (157 ) (26 ) (30 ) 2013 2012 (Millions) Cash provided (used) by: Operating activities $ 503 $ 365 Investing activities (266 ) (273 ) Financing activities (175 ) (89 ) 2011,2013, operating activities provided $245$503 million in cash compared to $244$365 million in cash provided during last year. The increase was mainly from working capital improvement. For 2011,2013, cash used forprovided from working capital was $130$77 million versus $71$76 million of cash used for working capital in 2010. The demand for working capital to support higher revenue primarily drove the increase in 2011 versus 2010.2012. Receivables were a use of cash of $183$88 million in 20112013 compared to a cash use of $231$9 million in the prior year. Inventory represented a cash outflowinflow of $64$3 million during 2011,2013, compared to a cash outflow of $122$72 million for the prior year. Accounts payable provided cash of $144$161 million for the year ended December 31, 2011,2013, compared to cash provided of $238$12 million for the year ended December 31, 2010.2012. Cash taxes were $85$109 million for 20112013 compared to $53$80 million in the prior year.One of our European subsidiaries receives payment from one of its OE customers whereby the accounts receivable are satisfied through the delivery of negotiable financial instruments. We may collect these financial instruments before their maturity date by either selling them at a discount or using them to satisfy accounts receivable that have previously been sold to a European bank. Any of these financial instruments which are not sold are classified as other current assets. The amount of these financial instruments that was collected before their maturity date and sold at a discount totaled $10 million and $6 million at December 31, 2011 and 2010, respectively. No negotiable financial instruments were held by our European subsidiary as of December 31, 2011 and 2010, respectively.In certain instances, several of our Chinese subsidiaries receive payment from OE customers and satisfy vendor payments through the receipt and delivery of negotiable financial instruments. Financial instruments used to satisfy vendor payables and not redeemed totaled $14 million and $8 million at December 31, 2011 and 2010, respectively, and were classified as notes payable. Financial instruments received from OE customers and not redeemed totaled $9 million and $11 million at December 31, 2011 and 2010, respectively. We classify financial instruments received from our OE customers as other current assets if issued by a financial institution of our customers or as customer notes and accounts, net if issued by our customer. We classified $9 million and $11 million in other current assets at December 31, 2011 and 2010, respectively. Some of our Chinese subsidiaries that issue their own negotiable financial instruments to pay vendors are required to maintain a cash balance if they exceed certain credit limits with the financial institution that guarantees those financial instruments. A restricted cash balance was not required at those Chinese subsidiaries at December 31, 2011 and 2010, respectively.The negotiable financial instruments received by one of our European subsidiaries and some of our Chinese subsidiaries are checks drawn by our OE customers and guaranteed by their banks that are payable at a future date. The use of these instruments for payment follows local commercial practice. Because negotiable financial instruments are financial obligations of our customers and are guaranteed by our customers’ banks, we believe they represent a lower financial risk than the outstanding accounts receivable that they satisfy which are not guaranteed by a bank.$67$7 million higherlower in 20112013 compared to the same period a year ago. Cash payments for plant, property and equipment were $213$244 million in 20112013 versus payments of $151$256 million in2010, an increase 2012, a decrease of $62$12 million. This increaseThe majority of spending was due to investmentssupport continued growth in the Clean Air business. In 2012, cash of $7 million was used to acquire certain rights from Combustion Components Associates, Inc. primarily pertaining to clean air technology for new business launches, technology development and future growth opportunities.stationary reciprocating engine applications. Cash payments for software-related intangible assets were $15$25 million in 20112013 compared to $12$13 million in 2010. 2012 2011 (Millions) Cash provided (used) by: Operating activities $ 365 $ 245 Investing activities (273 ) (224 ) Financing activities (89 ) (26 ) 2011 compared to an outflow of $30 million for the year ending December 31, 2010. In the second quarter of 2011,2011. During 2012, we completed a previously announced astock buyback plan, to repurchase up to 400,000repurchasing 600,000 shares of our outstanding common stock. Duringstock for $18 million, at an average price of $29.22 per share. In 2011, we purchased allcompleted a previously announced stock buyback plan, repurchasing 400,000 shares of our outstanding common stock for $16 million.million, at an average price of $39.84 per share. In 2012, refinancing activities included retiring certain of our 8 1/8 percent senior notes due in 2015 and the $148 million Tranche B Term Facility, adding a new $250 million Tranche A Term Facility and increasing the amount and extending the maturity date of our revolving credit facility. We also paid $4 million to secure the remaining 25 percent interest in our emission controlclean air joint venture in Thailand, now wholly-owned, during 2011. We ended 2012 and 2011 with $92 million and $24 million, respectively, in borrowings under our revolving credit facility. At December 31, 2011, there were no borrowings outstanding under the North American accounts receivable securitization programs.Cash Flowsprograms, whereas at December 31, 2012, there was $50 million outstanding.2010off-highway equipment to meet the next round of regulatory changes in North America and 2009 Year Ended
December 31, 2010 2009 (Millions) $ 244 $ 241 (157 ) (119 ) (30 ) (87 ) Operating ActivitiesFor 2010, operating activities provided $244 millionEurope, and as the pace of commercial truck customer orders in cash comparedChina continues to $241 milliongradually increase.cash for 2009. For 2010, cash used for working capital was $71 million versus $65 million of cash provided from working capital in 2009. Receivables were a use of cash of $231 million comparedthe first quarter to a cash use of $8 million in 2009. The change in cash flow from receivables was partially due to higher year-over-year sales and a change in accountingremain at the strong levels achieved in the first quarter of 2010.2013.accounting change requires thatincludes IHS estimates of year-over-year increases in North America accounts receivable securitization(four percent), Europe (one percent), China (10 percent), South America (two percent) and India (six percent). Our light vehicle OE revenue growth will be driven by leveraging higher industry production volumes with a strong position on top-selling platforms and with customers globally; light vehicle program launches including new technology content; and the ramp-up of volumes on platforms launched in 2013.accounted forthe launch of new programs globally, and gradually increasing revenues in China as secured borrowings rather than asmore cities enforce already enacted emissions regulations and low sulfur diesel fuel becomes more widely available.sale of accounts receivables. As a result, funding from the North America accounts receivable securitization program is included in net cash provided by financing activities on the statement of cash flows and was previously reflected in net cash used by operating activities. See “Liquidity and Capital Resources” below for further discussion of the accounting change. Inventory represented a cash outflow of $122 million during 2010, compared to a cash inflow of $101 million in 2009. The year-over-year change to cash flow from inventory was primarily a result of higher OE production levels. The higher production environment also led to accounts payable providing cash of $238 million in 2010, compared to a use of cash of $2 million in 2009. Cash taxes were $53 million for 2010 compared to $38 million in 2009.Investing ActivitiesCash used for investing activities was $38 million higher in 2010 compared to 2009. Cash payments for plant, property, and equipment were $151 million in 2010 versus payments of $120 million in 2009, an increase of $31 million. This increase was due to deferring discretionary projects in 2009, the investments for new business launches, technology development and future growth opportunities. Cash payments for software-related intangible assets were $12 million in 2010 compared to $6 million in 2009.Financing ActivitiesCash flow from financing activities was an outflow of $30 million in 2010 compared to an outflow of $87 million in 2009. The 2010 outflow was primarily due to debt issuance costs relatedstable contributor to our refinancing activities. We used $188 millionrevenue performance in net proceeds from our common stock offering in 2009 to pay down debt, primarily borrowings against our revolving credit facility. We ended 2010 with no borrowings under our revolving credit facility. As mentioned above in the “Operating Activities” section of this cash flow discussion, cash flow from financing activities was impacted by the accounting change for the way2014.account for our North American accounts receivable securitization programs. At December 31, 2010, there were no borrowings outstanding under the North American accounts receivable securitization programs.OutlookWe are well positioned to deliverexpect significant revenue growth in 2012over the next five years, largely driven by increasingly stringent global emissions regulations for light vehicles and commercial markets. Our OE light vehicle revenue is expected to outpace global industry light vehicle production as we launch new business, ramp up programs that have already launched and help our customers meet stricter emissions standards for both on-road and off-road vehicles. We will continue to benefit fromleverage our strong position on manyplatforms, across geographic regions and with leading customers worldwide. In addition, we anticipate our strong book of the top-selling light vehicle modelsbusiness with commercial truck and our global presence in the world’s largestoff-highway manufacturers will support further revenue growth, driven by new business, incremental content and fastest growing markets. We estimate that our global original equipment revenues will be approximately $6.6 billion in 2012 and $7.8 billion in 2013 with substrate sales making up 29 percent of totalstronger volumes as various commercial markets recover. Over this timeframe, we expect a compounded annual OE revenue in 2012 and 30 percentgrowth rate of total OE revenue in 2013. We expect our global original equipment revenue to increase to between $10.0 billion and $11.5 billion by 2016, with substrate sales comprising 32 percent of total OE revenue.We will continue to drive OE growth with the technology-driven expansion of commercial vehicle emission control programs, both truck and engine manufacturers, to help customers meet new emissions regulations for on-road and off-road commercial vehicles. We project that our OE commercial and specialty vehicle revenue to be $1.2 billion in 2012 and $1.9 billion in 2013 and account for about 30 percent to 35 percent of our global original equipment revenue by 2016.volume projections summarized in the following chartprojected customer production schedules, IHS Automotive and onPower Systems Research forecasts as of January 2014; original equipment manufacturers’ programs that have been formally awarded to the company;us; programs where the company iswe are highly confident that itwe will be awarded business based on informal customer indications consistent with past practices; our status as supplier for the existing programs and our relationships and experience with the customer;our customers; and the actual original equipment revenues achieved by the companyus for each of the last several years compared to the amount of those revenues that the companywe estimated itwe would generate at the beginning of each year. OurThe revenue estimates are subject to increase or decrease due to changes in customer requirements, customeralso based on anticipated vehicle production levels and consumer preferences,pricing, including precious metals pricing and the numberimpact of vehicles actually produced by our customers. We update these estimates annually. In the interim we do not intend to otherwise update the estimates to reflect future changes in these assumptions. In addition, our revenue estimate is based on our anticipated pricing for each applicable program over its life. However, we are under continuing pricing pressures from our OE customers. We do not intend to update the amounts shown above for any pricematerial cost changes. Finally, for our foreign operations, our revenue estimate assumes fixed foreign currency values relative to the U.S. dollar. These values are used to translate foreign revenues to the U.S. dollar. Although such currency values are subject to fluctuations based on the economic conditions in each of our foreign operations, we do not intend to update the annual revenue estimates shown above due to these fluctuations. CurrencyFor example, currency is assumed to be constant at $1.27$1.33 per Euro throughout our projection. We plan to update our revenue guidance during the first quarter of 2013.2015. See “Cautionary Statement for Purposes of the ‘Safe Harbor’ Provisions of the Private Securities Litigation Reform Act of 1995” and Item 1A, “Risk Factors”.Light Vehicle Production(According to IHS Automotive, January 2012) 2011(actual) 2012 2013 2016 (Number of Vehicles in Millions) 13.1 13.9 14.7 16.8 20.1 18.5 19.6 22.5 17.2 18.4 20.4 25.8 4.3 4.6 5.0 5.9 On-Road Commercial Vehicle Production (Class 4-8)(According to Power Systems Research, January 2012) 2011(actual) 2012 2013 2016 (Number of Vehicles in Thousands) 416 467 512 477 558 655 753 790 1,095 1,154 1,214 1,300 204 184 196 223 Off-Road Commercial Vehicle Production (Agriculture, Construction, Mining & Forestry) (According to Power Systems Research, January 2012) 2011(actual) 2012 2013 2016 (Number of Vehicles in Thousands) 218 217 229 247 426 440 458 459 We anticipate that the global aftermarket for 2012 will continue to be a solid contributor to our business based on our market-leading global brands. We will continue to support our strong brands and aggressively pursue new customers, actions that we hope will help expand our market share globally.20122014 to be approximately $230between $275 million to $250 million. We expectand $300 million, our 20122014 interest expense to be about $105$80 million, and our 20122014 cash taxes to be approximately $100 million. % Change 2013 2012 (Millions) Short-term debt and maturities classified as current $ 83 $ 113 (27 )% Long-term debt 1,019 1,067 (4 ) Total debt 1,102 1,180 (7 ) Total redeemable noncontrolling interests 20 15 33 Total noncontrolling interests 39 45 (13 ) Tenneco Inc. shareholders’ equity 433 246 76 Total equity 472 291 62 Total capitalization $ 1,594 $ 1,486 7 % Capitalization Year Ended
December 31, % Change 2011 2010 (Millions) $ 66 $ 63 5 % 1,158 1,160 — 1,224 1,223 — 12 12 — 43 39 10 — (4 ) NM 43 35 23 $ 1,279 $ 1,270 1 General. Short-term debt, which includes maturities classified as current, borrowings by parent company and foreign subsidiaries, and borrowings by foreign subsidiaries, was $66under our North American accounts receivable securitization program, were $83 million and $63$113 million as of December 31, 20112013 and 2010,December 31, 2012, respectively. Borrowings under our revolving credit facilities, which are classified as long-term debt, were $24$58 million and zero$92 million at December 31, 20112013 and 2010,December 31, 2012, respectively.20112013 year-to-date increase in totalTenneco Inc. shareholders' equity primarily resulted from net income attributable to Tenneco Inc. of $157$183 million, a $10$85 million increase related to pension and postretirement benefits, a $51 million increase in premium on common stock and other capital surplus relating to common stock issued pursuant to benefit plans, partially offset by a $102 $27 million increase in accumulatedtreasury stock as a result of purchases of common stock under our share purchase program, a $68 million decrease in premium on common stock and other comprehensive loss duecapital surplus relating to higher unrecognized pensionpurchase of noncontrolling equity interest in the Tenneco Tongtai (Dalian) Exhaust System Co., Ltd. (TTEC) joint venture investment in China and postretirement benefit costs, a $43 million $37 million decrease caused by the impact of changes in foreign exchange rates on the translation of financial statements of our foreign subsidiaries into U.S. dollars, a $16 million increase in treasury stock as a result of open market purchases of common stock under our share repurchase program, and a $2 million decrease in premium on common stock and other capital surplus due to the purchase of the remaining 25 percent equity interest in our Thailand emission control joint venture, Walker Exhaust Co. Limited, now wholly owned by Tenneco Automotive (Thailand) Limited.We have in the past and will continue to review our outstanding indebtedness and opportunities to optimize our debt structure. We will continue to undertake transactions to amend, extend or otherwise refinance our indebtedness as and when market conditions permit and we determine it would be in our interests to do so. We may incur costs and charges relating to these refinancing transactions when they are undertaken.June 3, 2010,March 22, 2012, we completed an amendment and extensionrestatement of our senior secured credit facility by increasing the amount and extending the termmaturity date of our revolving credit facility and replacingadding a new Tranche A Term Facility. The amended and restated facility replaces our $128former $556 million termrevolving credit facility, $148 million Tranche B Term Facility and $130 million Tranche B-1 letter of credit/revolving loan A with a largerfacility. The proceeds from this refinancing transaction were used to repay our $148 million Tranche B Term Facility and longer maturity term loan B facility.to fund the purchase and redemption of our $250 million 8 1/8 percent senior notes due in 2015. As a result of the amendment and extension, as of December 31, 2011,2013, the senior credit facility provides us with a total revolving credit facility size of $622$850 million until March 16, 2012, when commitmentsand a $228 million Tranche A Term Facility, both of $66 million will expire. After March 16, 2012, the extended revolving credit facility will provide $556 million of revolving credit andwhich will mature on May 31, 2014. The extended facility will mature earlier on December 15, 2013, if our $130 million tranche B-1 letter of credit/revolving loan facility is not refinanced by that date. Prior to maturity, fundsMarch 22, 2017. Funds may be borrowed, repaid and re-borrowed under the two revolving credit facilitiesfacility without premium or penalty.As of December 31, 2011, the senior The revolving credit facility also provides a six-year, $148 million term loan B maturing in June 2016, and a seven-year $130 million tranche B-1 letter of credit/revolving loan facility maturing in March 2014. We are required to make quarterly principal payments of $375 thousand on the term loan B, through March 31, 2016 with a final payment of $141 million due June 3, 2016. The tranche B-1 letter of credit/revolving loan facility requires repayment by March 2014. We can enter into revolving loans and issue letters of credit under the $130 million tranche B-1 letter of credit/revolving loan facility. The tranche B-1 letter of credit/revolving loan facility is reflected as debt on our balance sheet only if we borrow money under this facility or if we use the facility to make payments for letters of credit. There is no additional cost to us for issuing letters of credit under the tranche B-1 letter of credit/revolving loan facility. However, outstandingOutstanding letters of credit reduce our availability to enter into revolving loans under the facility. We payare required to make quarterly principal payments under the tranche B-1 lendersTranche A Term Facility of $3.1 million from June 30, 2012 through March 31, 2014, $6.3 million beginning June 30, 2014 through March 31, 2015, $9.4 million beginning June 30, 2015 through March 31, 2016, $12.5 million beginning June 30, 2016 through December 31, 2016 and a marginfinal payment of $125 million is due on March 22, 2017. We have excluded the $130required payments, within the next twelve months, under the Tranche A Term Facility totaling $22 million deposited withfrom current liabilities as of December 31, 2013, because we have the administrative agent. In addition,intent and ability to refinance the obligations on a long-term basis by using our revolving credit facility.pay lenders interest equalannounced a cash tender offer to purchase our outstanding $250 million 8 1/8 percent senior notes due in 2015 and a solicitation of consents to certain proposed amendments to the London Interbank Offered Rate (“LIBOR”)indenture governing these notes. We received tenders and consents representing $232 million aggregate principal amount of the notes and, on March 22, 2012, we purchased the tendered notes at a price of 104.44 percent of the principal amount (which includes a consent payment of three percent of the principal amount), plus accrued and unpaid interest, and amended the related indenture. On April 6, 2012, we redeemed the remaining outstanding $18 million aggregate principal amount of senior notes that were not purchased pursuant to the tender offer at a price of 104.06 percent of the principal amount, plus accrued and unpaid interest. The additional liquidity provided by the new $850 million revolving credit facility and the new $250 million Tranche A Term Facility was used to fund the total cost of the tender offer and redemption, including all borrowingsrelated fees and expenses.facility. Funds depositedrevolving credit facility, we had unused borrowing capacity of $755 million with the administrative agent by the lenders$58 million in outstanding borrowings and not borrowed by the Company earn interest at an annual rate approximately equal$37 million in outstanding letters of credit. As of December 31, 2013, our outstanding debt also included $228 million related to LIBOR less 25 basis points.June 3, 2010,March 22, 2012, our term loan BTranche A Term Facility and revolving credit facility bear interest at an annual rate equal to, at our option, either (i) LIBORLondon Interbank Offered Rate (“LIBOR”) plus a margin of 475 and 450 basis points, respectively, or (ii) a rate consisting of the greater of (a) the JPMorgan Chase prime rate plus a margin of 375 and 350 basis points, respectively, (b) the Federal Funds rate plus 50 basis points plus a margin of 375 and 350 basis points, respectively, and (c) the Eurodollar Rate plus 100 basis points plus a margin of 375 and 350 basis points, respectively. The margin we pay on these borrowings will be reduced by 25 basis points following each fiscal quarter for which our consolidated net leverage ratio is less than 2.25 for extending lenders and for the term loan B and will be further reduced by an additional 25 basis points following each fiscal quarter for which the consolidated net leverage ratio is less than 2.00 for extending lenders. Our consolidated net leverage ratio was 1.88 and 2.24 as of December 31, 2011 and 2010, respectively. Accordingly, in February of 2012 the margin we pay on these borrowings will be reduced by 25 basis points for extending lenders and will remain at such level for so long as our consolidated net leverage ratio remains below 2.00.The borrowings under our tranche B-1 letter of credit/revolving loan facility incur interest at an annual rate equal to, at our option, either (i) LIBOR plus a margin of 500250 basis points, or (ii) a rate consisting of the greater of (a) the JPMorgan Chase prime rate plus a margin of 400150 basis points, (b) the Federal Funds rate plus 50 basis points plus a margin of 400150 basis points, and (c) the Eurodollar Rate plus 100 basis points plus a margin of 400150 basis points.At December 31, 2011, of the $752 million available under the two revolving credit facilities within our senior secured credit facility, The margin we had unused borrowing capacity of $670 million with $24 million in outstandingpay on these borrowings and $58 million in letters of credit outstanding. As of December 31, 2011, our outstanding debt also included $250 million of 8 1/8 percent senior notes due November 15, 2015, $148 million term loan B due June 3, 2016, $225 million of 7 3/4 percent senior notes due August 15, 2018, $500 million of 6 7/8 percent senior notes due December 15, 2020, and $78 million of other debt.On December 9, 2010, we commencedwill be reduced by a cash tender offer of our outstanding $500 million 8 5/8 percent senior subordinated notes due in 2014 and a consent solicitation to amend the indenture governing these notes. On December 23, 2010, we issued $500 million of 6 7/8 percent senior notes due December 15, 2020 in a private offering. The net proceeds of this transaction, together with cash and available liquidity, were used to finance the purchase of our 8 5/8 percent senior subordinated notes pursuant to the tender offer at a price of 103.25 percent of the principal amount, plus accrued and unpaid interest for holders who tendered prior to the expiration of the consent solicitation, and 100.25 percent of the principal amount, plus accrued and unpaid interest, for other participants. A total of $480 million of the senior subordinated notes were tendered prior to the expiration of the consent solicitation. On January 7, 2011, we redeemed all remaining outstanding $20 million of senior subordinated notes that were not previously tendered, at a price of 102.875 percent of the principal amount, plus accrued and unpaid interest. To facilitate these transactions, we amended our senior credit agreement to permit us to refinance our senior subordinated notes with new senior unsecured notes. We did not incur any fee in connection with this amendment. The new notes are general senior obligations of Tenneco Inc. and are notsecured by assets of Tenneco Inc. or any of our subsidiaries that guarantee the new notes. We recorded $20 million of pre-tax charges in December 2010 and an additional $1 million of pre-tax charges in the first quarter of 2011 related to our repurchase and redemption of our 8 5/8 percent senior subordinated notes. On March 14, 2011, we completed an offer to exchange the $500 million of 6 7/8 percent senior notes due in 2020 which have been registered under the Securities Act of 1933, for and in replacement of all outstanding unregistered 6 7/8 percent senior notes due in 2020. We received tenders from holders of all $500 million of the aggregate outstanding amount of25 basis points below the original notes. The termsmargin following each fiscal quarter for which our consolidated net leverage ratio is less than 1.50 or will be increased by a total of the new notes are substantially identical to the terms of25 basis points above the original notes for which they were exchanged, except that the transfer restrictions and the registration rights applicable to the original notes generally do not apply to the new notes.On August 3, 2010, we issued $225 million of 7 3/4 percent senior notes due August 15, 2018 in a private offering. Themargin if our consolidated net proceeds of this transaction, together with cash and available liquidity, were used to finance the redemption of our 10 1/4 percent senior secured notes due in 2013. We called the senior secured notes for redemption on August 3, 2010, and completed the redemption on September 2, 2010 at a price of 101.708 percent of the principal amount, plus accrued and unpaid interest. We recorded $5 million of expense related to our redemption of our 10 1/4 percent senior secured notes in the third quarter of 2010. The new notes are general senior obligations of Tenneco Inc. and are not secured by assets of Tenneco Inc.leverage ratio is greater than or any of our subsidiaries that guarantee the new notes. On February 14, 2011, we completed an offer to exchange the $225 million of 7 3/4 percent senior notes due in 2018 which have been registered under the Securities Act of 1933, for and in replacement of all outstanding unregistered 7 3/4 percent senior notes due in 2018. We received tenders from holders of all $225 million of the aggregate outstanding amount of the original notes. The terms of the new notes are substantially identical to the terms of the original notes for which they were exchanged, except that the transfer restrictions and the registration rights applicable to the original notes generally do not apply to the new notes.Senior Credit Facility — Interest Rates and Fees. Borrowings and letters of credit issued under the senior credit facility bear interest at an annual rate equal to at our option, either (i) LIBOR plus2.50. We also pay a margin as set forth in the table below; or (ii) a rate consisting of the greater of the JPMorgan Chase prime rate, the Federal Funds rate plus 50commitment fee equal to 40 basis points or the Eurodollar Rate plus 100 basis points, plus a margin as set forth in the table below: 8/14/2009
thru
2/28/2010 3/1/2010
thru
6/2/2010 6/3/2010
thru
2/27/2011 2/28/2011
thru
5/15/2011 5/16/2011
thru
8/7/2011 Beginning
8/8/2011 5.50 % 4.50 % 4.50 % 4.25 % 4.50 % 4.25 %* — — 4.75 % 4.50 % 4.75 % 4.50 %* 5.50 % 4.50 % — — — — 5.50 % 5.00 % 5.00 % 5.00 % 5.00 % 5.00 % 4.50 % 3.50 % — — — — — — 3.50 % 3.25 % 3.50 % 3.25 %* — — 3.75 % 3.50 % 3.75 % 3.50 %* — — 4.00 % 4.00 % 4.00 % 4.00 % — — 3.50 % 3.25 % 3.50 % 3.25 %* — — 3.75 % 3.50 % 3.75 % 3.50 %* 5.00 % 4.00 % 4.00 % 4.00 % 4.00 % 4.00 % 0.75 % 0.50 % 0.75 % 0.50 % 0.75 % 0.50 %* *points. In February 2012,2014, the margin we pay on borrowings will decreasedecreased by 25 basis points below the original margin, as a result of a decrease in our consolidated net leverage ratio from 2.071.86 at September 30, 20112013 to 1.881.39 at December 31, 2011.2011,2013, are as follows: Quarter Ended March 31,
2011 June 30,
2011 September 30,
2011 December 31,
2011 Req. Act. Req. Act. Req. Act. Req. Act. 4.00 2.32 3.75 2.17 3.50 2.07 3.50 1.88 2.55 4.37 2.55 4.76 2.55 5.17 2.55 5.69 Quarter Ended Req. Act. Req. Act. Req. Act. Req. Act. Leverage Ratio (maximum) 3.50 1.98 3.50 1.79 3.50 1.86 3.50 1.39 Interest Coverage Ratio (minimum) 2.55 8.39 2.55 8.74 2.55 9.09 2.55 9.89 financial ratios required under the senior credit facility for each quarter beyond December 31, 2011 includeincludes a maximum leverage ratio covenant of 3.50 through March 22, 2017 and a minimum interest coverage ratio of 2.75.notes:notes (i) with the net cash proceeds of incremental facilities and permitted refinancing indebtedness (as defined in the senior credit facility agreement)agreement or with the net cash proceeds of our common stock); (ii) with the net cash proceeds fromof the saleincremental facilities (as defined in the senior credit facility agreement); (iii) with the net cash proceeds of sharesthe revolving loans (as defined in the senior credit facility agreement); (iv) with the cash generated by our operations; (v) in an amount equal to the net cash proceeds of our common stock; (iii)qualified capital stock (as defined in the senior credit facility agreement) issued by us after March 22, 2012; and (vi) in exchange for permitted refinancing indebtedness or in exchange for shares of our common stock; (iv) with the net cash proceeds of any new senior or subordinated unsecured indebtedness; (v) with the proceeds of revolving credit loans (as defined in the senior credit facility agreement); (vi) with the cash generated by the operations of the Company; and (vii) in an amount equal to the sum of (a) the net cash proceeds of qualified stock issued by the Company after March 16, 2007, plus (b) the portion of annual excess cash flow (beginning with excess cash flow for fiscal year 2010) not required to be applied to payment of the credit facilities and which is not used for other purposes, provided that the aggregate principal amount of senior notes purchased and cancelled or redeemed pursuant to clauses (v), (vi) and (vii), issuch purchases are capped as follows based(with respect to clauses (iii), (iv) and (v) on thea pro forma consolidated leverage ratio after giving effect to such purchase, cancellation or redemption: Aggregate Senior
Note Maximum
Amount (Millions) $ 20 $ 100 $ 125 Pro forma Consolidated Leverage Ratio (Millions) Greater than or equal to 3.0x $ 20 Greater than or equal to 2.5x $ 100 Greater than or equal to 2.0x $ 200 Less than 2.0x no limit 2011,2013, we were in compliance with all the financial covenants and operational restrictions of the senior credit facility. Our senior credit facility does not contain any terms that could accelerate payment of the facility or affect pricing under the facility as a result of a credit rating agency downgrade.2011,2013, our outstanding debt also includes $250 million of 8 1/8 percent senior notes due November 15, 2015,included $225 million of 7 3/4 percent senior notes due August 15, 2018 and $500 million of 6 7/8 percent senior notes due December 15, 2020. Under the indentures governing the notes, we are permitted to redeem some or all of the remaining senior notes at specified prices that decline to par over a specified period at any time on and after NovemberAugust 15, 2011 in the case of the senior notes due 2015, August 14, 2014 in the case of the senior notes due 2018, and December 15, 2015 in the case of the senior notes due 2020. In addition, prior to such dates the notes may also be redeemed at a price generally equal to 100 percent of the principal amount thereof plus a premium based on the present values of the remaining payments due to the note holders. If we sell certain of our assets or experience specified kinds of changes in control, we must offer to repurchase the notes. Under the indentures governing the notes we are permitted to redeem up to 35due 2018 and 2020 at 101 percent of the senior notes due 2018, with the proceeds of certain equity offerings completed before August 13, 2013principal amount thereof plus accrued and up to 35 percent of the senior notes due 2020, with the proceeds of certain equity offerings completed before December 15, 2013.unpaid interest.2011,2013, we were in compliance with the covenants and restrictions of these indentures.2011,2013, the North American program was amended and extended to March 23, 2012.21, 2014. The first priority facility continues to provide financing of up to $110 million and the second priority facility, which is subordinated to the first priority facility, continues to provide up to an additional $40 million of financing. Both facilities monetize accounts receivable generated in the U.S. and Canada that meet certain eligibility requirements, and therequirements. The second priority facility also monetizes certain accounts receivable generated in the U.S. or Canada that would otherwise be ineligible under the first priority securitization facility. The amendments to the North American program expand the trade receivables that are eligible for purchase under the program and decrease the margin we pay to our banks. We had noamount of outstanding third partythird-party investments in our securitized accounts receivable under the North American program was $10 million at December 31, 20112013 and 2010, respectively.$50 million at December 31, 2012.consolidationconsolidations and amendments to the agreements underlying the receivables pool. Further, each facility may be terminated upon the occurrence of customary events (with customary grace periods, if applicable), including breaches of covenants, failure to maintain certain financial ratios, inaccuracies of representations and warranties, bankruptcy and insolvency events, certain changes in the rate of default or delinquency of the receivables, a change of control and the entry or other enforcement of material judgments. In addition, each facility contains cross-default provisions, where the facility could be terminated in the event of non-payment of other material indebtedness when due and any other event which permits the acceleration of the maturity of material indebtedness.sevensix separate facilities provided by various financial institutions in each of the foreign15 days, or less, notification. The amount of outstanding third partythird-party investments in our securitized accounts receivable in Europe was $121$134 million and $91$94 million at December 31, 20112013 and December 31, 2010,2012, respectively.agreementsagreement might increase. These accounts receivable securitization programs provide us with access to cash at costs that are generally favorable to alternative sources of financing, and allow us to reduce borrowings under our revolving credit agreements.We adopted the amended accounting guidance under Accounting Standards Codification (“ASC”) Topic 860, Accounting for Transfers of Financial Assets effective January 1, 2010. Prior to the adoption of this new guidance, we accounted for activities under our North American and European accounts receivable securitization programs as sales of financial assets to our banks. The new accounting guidance changed the condition that must be met for the transfer of financial assets to be accounted for as a sale. The new guidance adds additional conditions that must be satisfied for transfers of financial assets to be accounted for as sales when the transferor has not transferred the entire original financial asset, including the requirement that no partial interest holder have rights in the transferred asset that are subordinate to the rights of other partial interest holders. beginning January 1, 2010, we account for our North American securitization program as a secured borrowing. In our European programs, we transfer accounts receivables in their entirety to the acquiring entities and satisfy all of the conditions established under ASC Topic 860, “Transfers and Servicing,” to report the transfer of financial assets in their entirety as a sale. The fair value of assets received as proceeds in exchange for the transfer of accounts receivable under our European securitization programs approximates the fair value of such receivables. We recognized $3 million and $4$2 million in interest expense for the year ended 2013 and $3 million for each of the years ended 20112012 and 2010, respectively,2011, relating to our North American securitization program, which effective January 1, 2010, is accounted for as a secured borrowing under the amended accounting guidance for transfers of financial assets.program. In addition, we recognized a loss of $4 million, $4 million and $5 million $3 million and $9 million for each of the years ended 2011, 20102013, 2012 and 2009, respectively,2011, on the sale of trade accounts receivable in our European and North American accounts receivable securitization programs, representing the discount from book values at which these receivables were sold to our banks. The discount rate varies based on funding costs incurred by our banks, which averaged approximately three percent four percent and five percent for the years ended 2013, 2012 and 2011, 2010respectively.2009,sold at a discount totaled $5 million and $6 million at December 31, 2013 and December 31, 2012, respectively.20112013 are shown in the following table: Payments due in: 2012 2013 2014 2015 2016 Beyond
2016 Total (Millions) $ — $ — $ 24 $ — $ — $ — $ 24 1 2 2 2 141 — 148 — — — 250 — 725 975 1 2 — — — — 3 1 — — — — — 1 1 1 1 1 1 6 11 62 — — — — — 62 66 5 27 253 142 731 1,224 33 24 17 10 8 8 100 91 90 82 77 55 172 567 80 — — — — — 80 $ 270 $ 119 $ 126 $ 340 $ 205 $ 911 $ 1,971 Payments due in: 2014 2015 2016 2017 2018 Total (Millions) Obligations: Revolver borrowings $ — $ — $ — $ 58 $ — $ — $ 58 Senior term loans 22 34 47 125 — — 228 Senior notes — — — — 225 500 725 Debentures — — — — — 1 1 Other subsidiary debt and capital lease obligations 1 1 1 1 1 4 9 Short-term debt 81 — — — — — 81 Debt and capital lease obligations 104 35 48 184 226 505 1,102 Operating leases 40 30 21 15 11 25 142 Interest payments 85 81 63 52 52 68 401 Capital commitments 100 — — — — — 100 Total payments $ 329 $ 146 $ 132 $ 251 $ 63 $ 598 $ 1,745 percent, 6 7/8 percent and 86 17/8 percent, respectively. Interest on our variable rate debt is calculated as LIBOR plus the applicable margin in effect at December 31, 20112013 for the Eurodollar, term loan B and trancheTranche B-1 loans and prime plus the applicable margin in effect on December 31, 20112013 on the prime-based loans. We have assumed that both LIBOR and the prime rate will remain unchanged for the outlying years. See “— Capitalization.”20112013 to complete the projects authorized at December 31, 2011,2013, in which we have made substantial commitments in connection with purchasing plant, property and equipment for our operations. For 2012,2014, we expect our capital expenditures to be about $230between $275 million to $250and $300 million.$57$47 million to those plans in 2012.2014. Pension and postretirement contributions beyond 20122014 will be required but those amounts will vary based upon many factors, including the performance of our pension fund investments during 2012.2014 and future discount rate changes. For additional information relating to the funding of our pension and other$20$19 million over the next 30 years. However, due to possible modifications in remediation processes and other factors, it is difficult to determine the actual timing of the payments. See “— Environmental and Other Matters.”Condensed Consolidating Financial Statements.In March 2011, we entered into(Europe)Europe Limited (“TMEL”) and the two Walker Group Retirement Plans, the Walker Group Employee Benefit Plan and the Walker Group Executive Retirement Benefit Plan (the “Walker Plans”), whereby TMEL will guarantee the payment of all current and future pension contributions in event of a payment default by the sponsoring or participating employers of the Walker Plans. As a result of our decision to enter into these performance guarantee agreements, the levy due to the U.K. Pension Protection Fund was reduced. The Walker Plans are comprised of employees from Tenneco Walker (U.K.) Limited and our Futaba TennecoFutaba-Tenneco U.K. joint venture. Employer contributions are funded by both Tenneco Walker (U.K.) Limited, as the sponsoring employer, and Futaba TennecoFutaba-Tenneco U.K., as a participating employer. The performance guarantee agreements are expected to remain in effect until all pension obligations for the Walker Plans’ sponsoring and participating employers have been satisfied. The maximum amount payable for these pension performance guarantees, relating to other participating employers, is approximately $3$27 million as of December 31, 20112013 which is determined by taking 105 percent of the liability of the Walker Plans calculated under section 179 of the U.K. Pension Act of 2004 offset by plan assets. We did not record an additional liability in March 2011 for this performance guarantee since Tenneco Walker (U.K.) Limited, as the sponsoring employer of the Walker Plans, already recognizes 100 percent of the pension obligation calculated based on U.S. GAAP, for all of the Walker Plans’ participating employers on its balance sheet, which was $13$10 million and $9$7 million at December 31, 20112013 and December 31, 2010,2012, respectively. At December 31, 2011,2013, all pension contributions under the Walker Plans were current for all of the Walker Plans’ sponsoring and participating employers. (“Futaba”) which requires Futaba to indemnify TMEL for any cost, loss or liability which TMEL may incur under the performance guarantee agreements.agreements relating to the Futaba-Tenneco U.K. joint venture. The maximum amount reimbursable by Futaba to TMEL under this indemnity agreement is equal to the amount incurred by TMEL under the performance guarantee agreements multiplied by Futaba’s shareholder ownership percentage of the Futaba TennecoFutaba-Tenneco U.K. joint venture. At December 31, 20112013 the maximum amount reimbursable by Futaba to TMEL is approximately $3 million.$5 million.2011,2013, we have $58$38 million in letters of credit to support some of our subsidiaries’ insurance arrangements, foreign employee benefit programs, environmental remediation activities and cash management and capital requirements. $1,640$1,297$1,660 million and $966$1,678 million in 2011, 20102013, 2012 and 2009,2011, respectively. For our aftermarket customers, we provide for promotional incentives and returns at the time of sale. Estimates are based upon the terms of the incentives and historical experience with returns. Certain taxes assessed by governmental authorities on revenue producing transactions, such as value added taxes, are excluded from revenue and recorded on a net basis. Shipping and handling costs billed to customers are included in revenues and the related costs are included in cost of sales in our Statements of Income (Loss). $117 million for 2010 and $97 million for 2009, net of reimbursements from our customers. Of these amounts, $19 million in 2013, $13 million in 2012 and $16 million in 2011 $13 million in 2010 and $10 million in 2009 relate to research and development, which includes the research, design, and development of a new unproven product or process. Additionally, $101 million, $92 million $80 million and $61$92 million of engineering, research, and development expense for 2011, 20102013, 2012 and 2009,2011, respectively, relates to engineering costs we incurred for application of existing products and processes to vehicle platforms. The remainder of the expenses in each year relate to improvements and enhancements to existing products and processes. Further, our customers reimburse us for engineering, research, and development costs on some platforms when we prepare prototypes and incur costs before platform awards. Our engineering, research, and development expense for 2011, 20102013, 2012 and 20092011 has been reduced by $119$169 million, $110$159 million and $104$119 million, respectively, for these reimbursements.was $19were $30 million and $15$25 million on December 31, 20112013 and 2010,2012, respectively. In addition, plant, property and equipment included $38$59 million and $50 million at both December 31, 20112013 and 2010,2012, respectively, for original equipment tools and dies that we own, and prepayments and other included $49$86 million and $46$66 million at December 31, 20112013 and 2010,2012, respectively, for in-process tools and dies that we are building for our original equipment customers.reported incomerecognize deferred tax expenseassets and liabilities on the basis of $88 million, $69 millionthe future tax consequences attributable to temporary differences that exist between the financial statement carrying value of assets and $13 millionliabilities and their respective tax values, and net operating losses (“NOL”) and tax credit carryforwards on a taxing jurisdiction basis. We measure deferred tax assets and liabilities using enacted tax rates that will apply in the years ending 2011, 2010 and 2009, respectively. The tax expense recorded in 2011 differs fromwhich we expect the expense that wouldtemporary differences to be recorded using a U.S. Federal statutory rate of 35 percent due to a net tax benefit of $7 million primarily related to U.S. taxable income with no associated tax expense due to our net operating loss (“NOL”) carryforward and income generated in lower tax rate jurisdictions, partially offset by the impact of recording a valuation allowance against the tax benefit for losses in certain foreign jurisdictions and taxes on repatriation of foreign earnings.have beenare established for deferred tax assets based on a “more likely than not” threshold. The ability to realize deferred tax assets depends on our ability to generate sufficient taxable income within the carryforward periods provided for in the tax law for each tax jurisdiction. We have consideredconsider the following possible sources of taxable income when assessing the realization of our deferred tax assets:assets and the need for a valuation allowance:NOLsfederal and state NOL was limited, as we were required to project the continuation of the negative economic environment at that time and the impact of the negative operating environment on our tax planning strategies.limited. As a result, we recorded a valuation allowance against all of our U.S. deferred tax assets except for our tax planning strategies which havehad not yet been implemented and which dodid not depend upon generating future taxable income. We carryPrior to the reversal of the valuation allowance in the third quarter of 2012, we carried a deferred tax asset in the U.S. of $90 million relating to the expected utilization of the federal and state NOL.$90 million, as of December 31, 2011, relating to the expected utilization of those NOLs. The recording of atax valuation allowance does not impact the amount of the NOL that would be available for federal and state income tax purposes in future periods. The federal NOLs expire beginning in tax years ending in 2021 through 2029. The state NOLs expire in various tax years through 2029.If our operating performance continues to improve on a sustained basis, our conclusion regarding the need for a valuation allowance could change, resultingrelease in the reversalU.S. was a tax benefit of some orapproximately $81 million.thetaxable income, we recorded a $19 million tax valuation allowance in the future. Spain for tax credits that may not be utilized due to tax losses in Spain.charge to establish the U.S. valuation allowance also includes items related to the losses allocable to certain state jurisdictions where it was determined that tax attributes related to those jurisdictions were potentially not realizable. In addition, the charge to establish the U.S. valuation allowance eliminated the need for certain tax reserves which would need to beallowances recorded if the valuation allowance was reversed. If we were to reverse our U.S. valuation allowance, as of December 31, 2011, the impact on earnings would approximate $147 million.In prior years, we recorded a valuation allowance against deferred tax assets generated by taxable losses in the U.S. as well asSpain and certain other foreign jurisdictions.jurisdictions will impact our provision for income taxes until the valuation allowances are released. Our provision for income taxes will include no tax benefit with respect tofor losses incurred and no tax expense with respect to income generated in these jurisdictions until the respective valuation allowance is eliminated. In certain foreign jurisdictions, we have recorded a tax benefit on NOLs and tax credits with unlimited lives that are supported by tax actions and forecasted profitability. If the tax actions are not successful or losses are incurred, we may need to record a valuation allowance in a future period. We have recorded net deferred tax assets of approximately $23 million in these jurisdictions as of December 31, 2011. These actions will cause variability in our effective tax rate.andto equity structure,ratio, was used to calculate the discounted cash flows for each of our reporting units. These estimates are based on assumptions that we believe to be reasonable, but which are inherently uncertain and outside of the control of management. If the carrying value of the reporting unit is higher than its fair value, there is an indication that impairment may exist which requires step two to be performed to measure the amount of the impairment loss. The amount of impairment is determined by comparing the implied fair value of a reporting unit’s goodwill to its carrying value.In the fourth quarter of 2010, the estimated fair value of all of our reporting units, except for our Australian reporting unit, significantly exceeded the carrying value of its assets and liabilities. Our Australian reporting unit had a goodwill balance of $11 million with an estimated fair value in excess of its net carrying value of one percent as of the testing date. primarily by significant declines in industry production volumes in that region. We identified in our step one test that the carrying value of our Australian reporting unit was higher than its fair value which is an indication that impairment may exist which required us to perform step two of the goodwill impairment test to measure the amount of the impairment loss. Step two of the goodwill impairment evaluation required us to calculate the implied fair value of goodwill of our Australian reporting unit by allocating the estimated fair value to the assets and liabilities of this reporting unit as if the reporting unit had been acquired in a business combination and the fair value of the reporting unit was the acquisition price. As a result of performing steps one and two of the goodwill impairment test, we concluded that the remaining amount of goodwill related to our Australian reporting unit was impaired and accordingly, we recorded a goodwill impairment charge of $11 million during the third quarter of 2011.2011,2013 and 2012, as a result of our annual goodwill impairment testing, the estimated fair value of each of our reporting units exceeded the carrying value of their assets and liabilities as of the testing date.for 2011 we loweredraised the weighted average discount rate for all our pension plans to 4.94.6 percent in 20112013 from 5.54.1 percent in 2010.2012. The discount rate for postretirement benefits was loweredraised to 4.8 percent in 20112013 from 5.64.1 percent in 2010.Based on this approach,As a result, our estimate of the weighted average long-term rate of return on plan assets for all of our pension plans was 7.2remained unchanged at 6.9 percent for both 20112013 and 2010.Except in the U.K., our2012.2011,2013, all legal funding requirements had been met. In 2010, we recognized a charge of $6 million related to an actuarial loss for lump sum pension payments to two former employees. Other postretirement benefit obligations, such as retire medical, and certain foreign pension plans are funded as the obligations become due.areis incorporated herein by reference.assetliability position of less than $1 million at December 31, 20112013 and is based on an internally developed model which incorporates observable inputs including quoted spot rates, forward exchange rates and discounted future expected cash flows utilizing market interest rates with similar quality and maturity characteristics. The following table summarizes by major currency the notional amounts for our foreign currency forward purchase and sale contracts as of December 31, 2011.2013. All contracts in the following table mature in 2012.2014. (Millions) —Purchase 3 2—Purchase 4 —Sell (16 ) Japanese yen —Purchase 135 —Sell ( 56842) Japanese yenPolish zloty —Purchase 33 431—Purchase 144 92—Purchase 15 2 —Sell ( 4715) —Purchase1—Sell ( 12) 2011,2013, we had $987$733 million in long-term debt obligations that have fixed interest rates. Of that amount, $500 million is fixed through December 2020, $250 million is fixed through November 2015, $225 million is fixed through August 2018 and the remainder is fixed from 20122013 through 2025. We also have $175$288 million in long-term debt obligations that are subject to variable interest rates. For more detailed explanations on our debt structure and senior credit facility refer to “Liquidity and Capital Resources — Capitalization” earlier in this Management’s Discussion and Analysis.20112013 was about 103107 percent of its book value. A one percentage point increase or decrease in interest rates would increase or decrease the annual interest expense we recognize in the income statement and the cash we pay for interest expense by about $2$4 million.Legal Contingenciesobligations thatobligations. These matters are typically incidental to the conduct of our business and create the potential for contingent losses. We accrue for potential contingent losses when our review of available facts indicates that it is probable a loss has been incurred and the amount of the loss is reasonably estimable. Each quarter we assess our loss contingencies based upon currently available facts, existing technology, and presently enacted laws and regulations taking into consideration the likely effects of inflation and other societal and economic factors and record adjustments to these reserves as required. As an example, we consider all available evidence including prior experience in remediation of contaminated sites, other companies’ cleanup experiences and data released by the United States Environmental Protection Agency or other organizations when we evaluate our environmental remediation contingencies. Further, all of our loss contingency estimates are subject to revision in future periods2011,2013, we have the obligation to remediate or contribute towards the remediation of certain sites, including one Federal Superfund site. At December 31, 2011,2013, our aggregated estimated share of environmental remediation costs for all these sites on a discounted basis was approximately $17$15 million, of which $5$3 million is recorded in other current liabilities and $12 million is recorded in deferred credits and other liabilities in our consolidated balance sheet. For those locations in whichwhere the liability was discounted, the weighted average discount rate used was 1.92.8 percent. The undiscounted value of the estimated remediation costs was $20$19 million. Our expected payments of environmental remediation costs are estimated to be approximately $4$3 million in 2012, $2 million in 2013,2014, $1 million each year beginning 20142015 through 20162018 and $11$12 million in aggregate thereafter. Based on information known to us, we have established reserves that we believe are adequate for these costs. Although we believe these estimates of remediation costs are reasonable and are based on the latest available information, the costs are estimates and are subject to revision as more information becomes available about the extent of remediation required. At some sites, we expect that other parties will contribute towards the remediation costs. In addition, certain environmental statutes provide that our liability could be joint and several, meaning that we could be required to pay in excess of our share of remediation costs. Our understanding of the financial strength of other potentially responsible parties at these sites has been considered, where appropriate, in our determination of our estimated liability. We do not believe that any potential costs associated with our current status as a potentially responsible party in the Federal Superfund site, or as a liable party at the other locations referenced herein, will be material to our consolidated results of operations, financial position or cash flows.proceedings allegematters involve allegations of damages against us relating to environmental liabilities (including toxic tort, property damage and remediation), intellectual property matters (including patent, trademark and copyright infringement, and licensing disputes), personal injury claims (including injuries due to product failure, design or warning issues, and other product liability related matters), taxes, employment matters, and commercial or contractual disputes, sometimes related to acquisitions or divestitures. Some of these matters involve allegations relating to legal compliance. For example, one of our Argentine subsidiaries is currently defending against a criminal complaint alleging the failure to comply with laws requiring the proceeds of export transactions to be collected, reported and/or converted to local currency within specified time periods. As another example, in the U.S. we are subject to an audit in 11 states with respect to the payment of unclaimed property to those states, spanning a period as far back as over 30 years. We now have practices in place whichWhile we believe ensure that we pay unclaimed property as required. We vigorously defend ourselves against all of these claims. Inclaims, in future periods we could be subject to cash costs or charges to earnings if any of these matters are resolved on unfavorable terms. However, althoughAlthough the ultimate outcome of any legal matter cannot be predicted with certainty, based on current information, including our assessment of the merits of the particular claim, we do not expect that thesethe legal proceedings or claims currently pending against us will have any material adverse impact on our future consolidated financial position, results of operations or cash flows. a number of lawsuits initiated by a significant number of claimants alleging health problems as a result of exposure to asbestos. In the early 2000’s we were named in nearly 20,000 complaints, most of which were filed in Mississippi state court and the vast majority of which made no allegations of exposure to asbestos from our product categories. Most of these claims have been dismissed and our current docket of active and inactive cases is less than 500 cases nationwide. A small number of claims have been asserted by railroad workers alleging exposure to asbestos products in railroad carsbalancesubstantial majority of the remaining claims isare related to alleged exposure to asbestos inof each in some cases exceeding 100 defendants from a variety of industries. Additionally, the plaintiffs either do not specify any, or specify the jurisdictional minimum, dollar amount for damages. As major asbestos manufacturers and/or users continue to go out of business or file for bankruptcy, we may experience an increased number of these claims. We vigorously defend ourselves against these claims as part of our ordinary course of business. In future periods, we could be subject to cash costs or charges to earnings if any of these matters are resolved unfavorably to us. To date, with respect to claims that have proceeded sufficiently through the judicial process, we have regularly achieved favorable resolutions. Accordingly, we presently believe that these asbestos-related claims will not have a material adverse impact on our future consolidated financial condition, results of operations or cash flows. Year Ended
December 31, 2013 2012 2011 (Millions) Beginning Balance $ 23 $ 26 $ 33 Accruals related to product warranties 20 15 11 Reductions for payments made (19 ) (18 ) (18 ) Ending Balance $ 24 $ 23 $ 26 EmployeeIn the fourth quarter of 2011, we encountered an issue in our North America OE ride performance business involving struts supplied on one particular OE platform. As a result, we directly incurred approximately $2 million in premium freight and overtime costs in the fourth quarter of 2011 and $3 million in 2012. In the first quarter of 2013 we incurred a charge of $2 million in connection with the resolution of all existing claims pertaining to this matter. We paid the customer the $2 million in the second quarter of 2013. We have establishedPlansPlan for Hourly Employees and the benefit of U.S. employees.Tenneco Employee Stock Ownership Plan for Salaried Employees were merged into one plan called the Tenneco 401(k) Retirement Savings Plan (the “Retirement Savings Plan”). Under the plans,plan, subject to limitations in the Internal Revenue Code, participants may elect to defer up to 75 percent of their salary through contributions to the plan, which are invested in selected mutual funds or used to buy our common stock. We match in cash 100 percent on the first three percent and 50 percent of each employee’s contribution up to eighton the next two percent of the employee’s salary. In 2009, we temporarily discontinued these matching contributions as a result of the global economic downturn that began in 2008. We restored the matching contributions to salaried and non-union hourly U.S. employees beginning on January 1, 2010.employee contributions. In connection with freezing the defined benefit pension plans for nearly all U.S. based salaried and non-union hourly employees effective December 31, 2006, and the related replacement of those defined benefit plans with defined contribution plans, we are making additional contributions to the Employee Stock Ownership Plans. We recorded expense for these contributions of approximately $23 million, $21 million and $18 million $17 million,in 2013, 2012, and $10 million in 2011, 2010 and 2009, respectively. Matching contributions vest immediately. Defined benefit replacement contributions fully vest on the employee’s third anniversary of employment.Effective January 1, 2012, the Tenneco Employee Stock Ownership Plan for Hourly Employees and the Tenneco Employee Stock Ownership Plan for Salaried Employees were merged into one plan called the Tenneco 401(k) Retirement Savings Plan (the “Retirement Savings Plan”). The Retirement Savings Plan has been designed to adopt a Safe-Harbor approach approved by the Internal Revenue Service and which will provide for increased company matching contributions at lower percentages of employee deferrals. The company matching contribution will increase from 50 percent on the first eight percent of employee contributions to 100 percent on the first three percent and 50 percent on the next two percent of employee contributions.ITEM 7A.QUANTITATIVE AND QUALITATIVE DISCLOSURES ABOUT MARKET RISK.ITEM 8.FINANCIAL STATEMENTS AND SUPPLEMENTARY DATA. Page 8081838485868790143Framework.Framework (1992).2011.20112013 has been audited by PricewaterhouseCoopers LLP, our independent registered public accounting firm, as stated in their report, which is included herein.24, 2012(loss),comprehensive income, cash flows, and changes in shareholders’ equity and comprehensive income present fairly, in all material respects, the financial position of Tenneco Inc. and its subsidiaries at December 31, 20112013, and 20102012 and the results of their operations and their cash flows for each of the three years in the period ended December 31, 2011 and 20102013 in conformity with accounting principles generally accepted in the United States of America. In addition, in our opinion, the financial statement schedule forlisted in the years ended December 31, 2011 and 2010 in Item 8accompanying index presents fairly, in all material respects, the information set forth therein when read in conjunction with the related consolidated financial statements. Also in our opinion, the Company maintained, in all material respects, effective internal control over financial reporting as of December 31, 2011,2013, based on criteria established inInternal Control — Integrated Framework (1992) issued by the Committee of Sponsoring Organizations of the Treadway Commission (COSO). The Company’s management is responsible for these financial statements and financial statement schedule, for maintaining effective internal control over financial reporting and for its assessment of the effectiveness of internal control over financial reporting, included in the accompanying Management’s Report on Internal Control over Financial Reporting. Our responsibility is to express opinions on these financial statements, on the financial statement schedule, and on the Company’s internal control over financial reporting based on our integrated audits. We conducted our audits in accordance with the standards of the Public Company Accounting Oversight Board (United States). Those standards require that we plan and perform the audits to obtain reasonable assurance about whether the financial statements are free of material misstatement and whether effective internal control over financial reporting was maintained in all material respects. Our audits of the financial statements included examining, on a test basis, evidence supporting the amounts and disclosures in the financial statements, assessing the accounting principles used and significant estimates made by management, and evaluating the overall financial statement presentation. Our audit of internal control over financial reporting included obtaining an understanding of internal control over financial reporting, assessing the risk that a material weakness exists, and testing and evaluating the design and operating effectiveness of internal control based on the assessed risk. Our audits also included performing such other procedures as we considered necessary in the circumstances. We believe that our audits provide a reasonable basis for our opinions.Chicago, Illinois24, 2012REPORT OF INDEPENDENT REGISTERED PUBLIC ACCOUNTING FIRMTo the Board27, 2014 (LOSS) Year Ended December 31, 2011 2010 2009 (Millions Except Share and Per Share Amounts) $ 7,205 $ 5,937 $ 4,649 6,037 4,900 3,875 11 — — 133 117 97 428 417 344 207 216 221 6,816 5,650 4,537 (5 ) (3 ) (9 ) (5 ) (3 ) (11 ) (10 ) (6 ) (20 ) 379 281 92 108 149 133 271 132 (41 ) 88 69 13 183 63 (54 ) 26 24 19 $ 157 $ 39 $ (73 ) 59,884,139 59,208,103 48,572,463 61,520,160 60,998,694 48,572,463 $ 2.62 $ 0.65 $ (1.50 ) $ 2.55 $ 0.63 $ (1.50 ) Year Ended December 31, 2013 2012 2011 (Millions Except Share and Per Share Amounts) Revenues Net sales and operating revenues $ 7,964 $ 7,363 $ 7,205 Costs and expenses Cost of sales (exclusive of depreciation and amortization shown below) 6,734 6,170 6,037 Goodwill impairment charge — — 11 Engineering, research, and development 144 126 133 Selling, general, and administrative 453 427 428 Depreciation and amortization of other intangibles 205 205 207 7,536 6,928 6,816 Other income (expense) Loss on sale of receivables (4 ) (4 ) (5 ) Other expense — (3 ) (5 ) (4 ) (7 ) (10 ) Earnings before interest expense, income taxes, and noncontrolling interests 424 428 379 Interest expense (net of interest capitalized of $4 million each for 2013, 2012 and 2011, respectively) 80 105 108 Earnings before income taxes and noncontrolling interests 344 323 271 Income tax expense 122 19 88 Net income 222 304 183 Less: Net income attributable to noncontrolling interests 39 29 26 Net income attributable to Tenneco Inc. $ 183 $ 275 $ 157 Earnings per share Weighted average shares of common stock outstanding — Basic 60,474,492 59,985,677 59,884,139 Diluted 61,594,062 61,083,510 61,520,160 Basic earnings per share of common stock $ 3.03 $ 4.58 $ 2.62 Diluted earnings per share of common stock $ 2.97 $ 4.50 $ 2.55 income (loss).BALANCE SHEETS December 31, 2011 2010 (Millions) ASSETS $ 214 $ 233 936 796 44 30 592 547 40 38 153 146 1,979 1,790 10 9 74 89 32 32 92 92 103 105 311 327 3,153 3,109 (2,106 ) (2,059 ) 1,047 1,050 $ 3,337 $ 3,167 LIABILITIES AND SHAREHOLDERS’ EQUITY $ 66 $ 63 1,171 1,048 44 51 13 13 226 227 50 66 1,570 1,468 1,158 1,160 51 56 385 311 118 125 3,282 3,120 12 12 1 1 3,016 3,008 (382 ) (237 ) (2,379 ) (2,536 ) 256 236 256 240 — (4 ) 43 39 43 35 $ 3,337 $ 3,167 Year Ended December 31, 2013 Tenneco Inc. Noncontrolling interests Total (Millions) Net Income $ 183 $ 39 $ 222 Accumulated Other Comprehensive Income (Loss) Cumulative Translation Adjustment Balance January 1 $ (24 ) $ 5 $ (19 ) Translation of foreign currency statements (37 ) (37 ) — — (37 ) (37 ) Balance December 31 (61 ) 5 (56 ) Adjustment to the Liability for Pension and Postretirement Benefits Balance January 1 (384 ) — (384 ) Adjustment to the Liability for Pension and Postretirement benefits, net of tax 85 85 85 85 Balance December 31 (299 ) (299 ) Balance December 31 $ (360 ) $ 5 $ (355 ) Other comprehensive income 48 — 48 Comprehensive Income $ 231 $ 39 $ 270 Year Ended December 31, 2012 Tenneco Inc. Noncontrolling interests Total (Millions) Net Income $ 275 $ 29 $ 304 Accumulated Other Comprehensive Income (Loss) Cumulative Translation Adjustment Balance January 1 $ (30 ) $ 4 $ (26 ) Translation of foreign currency statements 6 6 1 1 7 7 Balance December 31 (24 ) 5 (19 ) Adjustment to the Liability for Pension and Postretirement Benefits Balance January 1 (352 ) — (352 ) Adjustment to the Liability for Pension and Postretirement benefits, net of tax (32 ) (32 ) (32 ) (32 ) Balance December 31 (384 ) (384 ) Balance December 31 $ (408 ) $ 5 $ (403 ) Other comprehensive income (loss) (26 ) 1 (25 ) Comprehensive Income $ 249 $ 30 $ 279 Year Ended December 31, 2011 Tenneco Inc. Noncontrolling interests Total (Millions) Net Income $ 157 $ 26 $ 183 Accumulated Other Comprehensive Income (Loss) Cumulative Translation Adjustment Balance January 1 $ 8 $ 5 $ 13 Translation of foreign currency statements (38 ) (38 ) (1 ) (1 ) (39 ) (39 ) Balance December 31 (30 ) 4 (26 ) Adjustment to the Liability for Pension and Postretirement Benefits Balance January 1 (250 ) — (250 ) Adjustment to the Liability for Pension and Postretirement benefits, net of tax (102 ) (102 ) (102 ) (102 ) Balance December 31 (352 ) (352 ) Balance December 31 $ (382 ) $ 4 $ (378 ) Other comprehensive loss (140 ) (1 ) (141 ) Comprehensive Income $ 17 $ 25 $ 42 December 31, 2013 2012 (Millions) ASSETS Current assets: Cash and cash equivalents $ 275 $ 223 Restricted cash 5 — Receivables — Customer notes and accounts, net 1,041 966 Other 19 20 Inventories 656 667 Deferred income taxes 71 72 Prepayments and other 223 176 Total current assets 2,290 2,124 Other assets: Long-term receivables, net 14 4 Goodwill 69 72 Intangibles, net 30 35 Deferred income taxes 125 116 Other 127 135 365 362 Plant, property, and equipment, at cost 3,498 3,365 Less — Accumulated depreciation and amortization (2,323 ) (2,243 ) 1,175 1,122 Total Assets $ 3,830 $ 3,608 LIABILITIES AND SHAREHOLDERS’ EQUITY Current liabilities: Short-term debt (including current maturities of long-term debt) $ 83 $ 113 Accounts payable 1,359 1,186 Accrued taxes 40 50 Accrued interest 10 10 Accrued liabilities 252 239 Other 94 51 Total current liabilities 1,838 1,649 Long-term debt 1,019 1,067 Deferred income taxes 28 27 Postretirement benefits 249 407 Deferred credits and other liabilities 204 152 Commitments and contingencies Total liabilities 3,338 3,302 Redeemable noncontrolling interests 20 15 Tenneco Inc. Shareholders’ equity: Common stock 1 1 Premium on common stock and other capital surplus 3,014 3,031 Accumulated other comprehensive loss (360 ) (408 ) Retained earnings (accumulated deficit) (1,921 ) (2,104 ) 734 520 Less — Shares held as treasury stock, at cost 301 274 Total Tenneco Inc. shareholders’ equity 433 246 Noncontrolling interests 39 45 Total equity 472 291 Total liabilities, redeemable noncontrolling interests and equity $ 3,830 $ 3,608 Year Ended December 31, 2011 2010 2009 (Millions) $ 183 $ 63 $ (54 ) 11 — — 207 216 221 (5 ) 4 (24 ) 8 9 7 4 3 9 (183 ) (231 ) (8 ) (64 ) (122 ) 101 (13 ) 20 (55 ) 144 238 (2 ) (7 ) 12 10 — (8 ) (1 ) (7 ) 20 20 1 12 10 (41 ) 6 2 7 2 5 245 244 241 4 3 5 (213 ) (151 ) (120 ) (15 ) (12 ) (6 ) — — 1 — 3 1 (224 ) (157 ) (119 ) (16 ) — — — — 188 5 880 6 (1 ) (24 ) (8 ) (24 ) (864 ) (22 ) 3 2 (23 ) 30 (10 ) (218 ) 1 — — (4 ) — — (20 ) (14 ) (10 ) (26 ) (30 ) (87 ) (14 ) 9 6 (19 ) 66 41 233 167 126 $ 214 $ 233 $ 167 $ 106 $ 149 $ 131 85 53 38 $ 35 $ 29 $ 26 Year Ended December 31, 2013 2012 2011 (Millions) Operating Activities Net income $ 222 $ 304 $ 183 Adjustments to reconcile net income to cash provided by operating activities — Goodwill impairment charge — — 11 Depreciation and amortization of other intangibles 205 205 207 Deferred income taxes 5 (65 ) (5 ) Stock-based compensation 13 11 8 Loss on sale of assets 1 4 4 Changes in components of working capital — (Increase) decrease in receivables (88 ) (9 ) (183 ) (Increase) decrease in inventories 3 (72 ) (64 ) (Increase) decrease in prepayments and other current assets (53 ) (21 ) (13 ) Increase (decrease) in payables 161 12 144 Increase (decrease) in accrued taxes (10 ) 7 (7 ) Increase (decrease) in accrued interest — (3 ) — Increase (decrease) in other current liabilities 64 10 (7 ) Change in long-term assets 7 14 1 Change in long-term liabilities (32 ) (37 ) (41 ) Other 5 5 7 Net cash provided by operating activities 503 365 245 Investing Activities Proceeds from sale of assets 8 3 4 Cash payments for plant, property, and equipment (244 ) (256 ) (213 ) Cash payments for software related intangible assets (25 ) (13 ) (15 ) Cash payments for net assets purchased — (7 ) — Change in restricted cash (5 ) — — Net cash used by investing activities (266 ) (273 ) (224 ) Financing Activities Retirement of long-term debt (16 ) (411 ) (24 ) Issuance of long-term debt — 250 5 Debt issuance costs of long-term debt — (13 ) (1 ) Purchase of common stock under the share repurchase program (27 ) (18 ) (16 ) Issuance of common stock 20 5 — Tax benefit from stock-based compensation 24 — — Increase (decrease) in bank overdrafts (6 ) 5 3 Net increase (decrease) in revolver borrowings and short-term debt excluding current maturities of long-term debt and short-term borrowings secured by accounts receivable (22 ) 67 30 Net increase (decrease) in short-term borrowings secured by accounts receivable (40 ) 50 — Capital contribution from noncontrolling interest partner — 5 1 Purchase of noncontrolling equity interest (69 ) — (4 ) Distribution to noncontrolling interest partners (39 ) (29 ) (20 ) Net cash used by financing activities (175 ) (89 ) (26 ) Effect of foreign exchange rate changes on cash and cash equivalents (10 ) 6 (14 ) Increase (decrease) in cash and cash equivalents 52 9 (19 ) Cash and cash equivalents, January 1 223 214 233 Cash and cash equivalents, December 31 (Note) $ 275 $ 223 $ 214 Supplemental Cash Flow Information Cash paid during the year for interest $ 79 $ 100 $ 106 Cash paid during the year for income taxes (net of refunds) 109 80 85 Non-cash Investing and Financing Activities Period end balance of trade payables for plant, property, and equipment $ 52 $ 42 $ 35 Note: Cash and cash equivalents include highly liquid investments with a maturity of three months or less at the date of purchase. Year Ended December 31, 2011 2010 2009 Shares Amount Shares Amount Shares Amount (Millions Except Share Amounts) 61,541,760 $ 1 60,789,739 $ 1 48,314,490 $ — — — — — 12,000,000 1 49,871 — 142,643 — 283,195 — 509,704 — 609,378 — 192,054 — 62,101,335 1 61,541,760 1 60,789,739 1 3,008 3,005 2,809 (2 ) (11 ) — — — 188 10 14 8 3,016 3,008 3,005 (237 ) (212 ) (318 ) (145 ) (25 ) 106 (382 ) (237 ) (212 ) (2,536 ) (2,575 ) (2,502 ) 157 39 (73 ) (2,379 ) (2,536 ) (2,575 ) 1,294,692 240 1,294,692 240 1,294,692 240 400,000 16 — — — — 1,694,692 256 1,294,692 240 1,294,692 240 $ — $ (4 ) $ (21 ) 39 32 24 19 16 13 — (4 ) — (1 ) 3 — (14 ) (8 ) (5 ) $ 43 $ 39 $ 32 $ 43 $ 35 $ 11 Year Ended December 31, 2013 2012 2011 Shares Amount Shares Amount Shares Amount (Millions Except Share Amounts) Common Stock Balance January 1 62,789,382 $ 1 62,101,335 $ 1 61,541,760 $ 1 Issued — — — — — — Issued pursuant to benefit plans 156,213 — 149,398 — 49,871 — Stock options exercised 769,133 — 538,649 — 509,704 — Balance December 31 63,714,728 1 62,789,382 1 62,101,335 1 Premium on Common Stock and Other Capital Surplus Balance January 1 3,031 3,016 3,008 Purchase of noncontrolling equity interest (68 ) — (2 ) Premium on common stock issued pursuant to benefit plans 51 15 10 Balance December 31 3,014 3,031 3,016 Accumulated Other Comprehensive Loss Balance January 1 (408 ) (382 ) (237 ) Other comprehensive loss 48 (26 ) (145 ) Balance December 31 (360 ) (408 ) (382 ) Retained Earnings (Accumulated Deficit) Balance January 1 (2,104 ) (2,379 ) (2,536 ) Net income attributable to Tenneco Inc. 183 275 157 Balance December 31 (1,921 ) (2,104 ) (2,379 ) Less — Common Stock Held as Treasury Stock, at Cost Balance January 1 2,294,692 274 1,694,692 256 1,294,692 240 Purchase of common stock through stock repurchase program 550,000 27 600,000 18 400,000 16 Balance December 31 2,844,692 301 2,294,692 274 1,694,692 256 Total Tenneco Inc. shareholders’ equity $ 433 $ 246 $ — Noncontrolling interests: Balance January 1 45 43 39 Net income 24 20 19 Capital contribution — 3 — Sale of noncontrolling equity interest (1 ) — — Other comprehensive income (loss) — 1 (1 ) Dividends declared (29 ) (22 ) (14 ) Balance December 31 $ 39 $ 45 $ 43 Total equity $ 472 $ 291 $ 43 CONSOLIDATED STATEMENTS OF COMPREHENSIVE INCOME Year Ended December 31, 2011 Tenneco Inc. Noncontrolling interests Total Accumulated
Other
Comprehensive
Income
(Loss) Comprehensive
Income
(Loss) Accumulated
Other
Comprehensive
Income
(Loss) Comprehensive
Income
(Loss) Accumulated
Other
Comprehensive
Income
(Loss) Comprehensive
Income
(Loss) (Millions) $ 157 $ 26 $ 183 $ 8 $ 5 $ 13 (38 ) (38 ) (1 ) (1 ) (39 ) (39 ) (30 ) 4 (26 ) (250 ) — (250 ) (102 ) (102 ) (102 ) (102 ) (352 ) (352 ) $ (382 ) $ 4 $ (378 ) (140 ) (1 ) (141 ) $ 17 $ 25 $ 42 The accompanying notes to consolidated financial statements are an integralpart of these statements of comprehensive income.TENNECO INC.CONSOLIDATED STATEMENTS OF COMPREHENSIVE INCOME Year Ended December 31, 2010 Tenneco Inc. Noncontrolling interests Total Accumulated
Other
Comprehensive
Income
(Loss) Comprehensive
Income
(Loss) Accumulated
Other
Comprehensive
Income
(Loss) Comprehensive
Income
(Loss) Accumulated
Other
Comprehensive
Income
(Loss) Comprehensive
Income
(Loss) (Millions) $ 39 $ 24 $ 63 $ 37 $ — $ 37 (29 ) (29 ) 5 5 (24 ) (24 ) 8 5 13 (249 ) — (249 ) (1 ) (1 ) (1 ) (1 ) (250 ) (250 ) $ (242 ) $ 5 $ (237 ) (30 ) 5 (25 ) $ 9 $ 29 $ 38 The accompanying notes to consolidated financial statements are an integralpart of these statements of comprehensive income.TENNECO INC.CONSOLIDATED STATEMENTS OF COMPREHENSIVE INCOME Year Ended December 31, 2009 Tenneco Inc. Noncontrolling interests Total Accumulated
Other
Comprehensive
Income
(Loss) Comprehensive
Income
(Loss) Accumulated
Other
Comprehensive
Income
(Loss) Comprehensive
Income
(Loss) Accumulated
Other
Comprehensive
Income
(Loss) Comprehensive
Income
(Loss) (Millions) $ (73) $ 19 $ (54) $ (42) $— $ (42) 79 79 — — 79 79 37 — 37 (276) — (276) 27 27 27 27 (249) (249) $(212) $— $(212) 106 — 106 $ 33 $ 19 $ 52 The accompanying notes to consolidated financial statements are an integralpart of these statements of comprehensive income.1.Summary of Accounting Policiespost-retirementpostretirement benefit plans, income taxes, and contingencies. These items are covered in more detail elsewhere in Note 1, Note 7, Note 10, and Note 12 of the consolidated financial statements of Tenneco Inc. Actual results could differ from those estimates.threefour joint ventures with redemption features that could require us to purchase the noncontrolling interests at fair value in the event of a change in control of Tenneco Inc. or certain of our subsidiaries. We do not believe that it is probable that the redemption features in any of these joint venture agreements will be triggered. However, the redemption of these shares is not solely within our control. Accordingly, the related noncontrolling interests are presented as “Redeemable noncontrolling interests” in the temporary equity section of our consolidated balance sheets.emission controlclean air joint venture in Thailand for $4$4 million in cash. As a result of this purchase, our equity ownership of this joint venture investment changed to 100 percent from 75 percent.percent. Refer to Note 3 of the consolidated financial statements of Tenneco Inc. for additional details.2010 and 2009, respectively: 2011 2010 2009 (Millions) $ 12 $ 7 $ 7 7 8 5 (2 ) — — 1 — — — 2 — (6 ) (5 ) (5 ) $ 12 $ 12 $ 7 TENNECO INC.NOTES TO CONSOLIDATED FINANCIAL STATEMENTS — (Continued)2013 2012 2011 (Millions) Balance January 1 $ 15 $ 12 $ 12 Net income attributable to redeemable noncontrolling interests 14 9 7 Sale of 25 percent equity interest to Tenneco Inc — — (2 ) Capital Contributions — 2 1 Dividends declared (9 ) (8 ) (6 ) Balance December 31 $ 20 $ 15 $ 12 20112013 and 2010,2012, inventory by major classification was as follows: 2011 2010 (Millions) $ 244 $ 222 181 164 121 118 46 43 $ 592 $ 547 2013 2012 (Millions) Finished goods $ 267 $ 273 Work in process 202 207 Raw materials 130 133 Materials and supplies 57 54 $ 656 $ 667 andto equity structure,ratio, was used to calculate the discounted cash flows for each of our reporting units. These estimates are based on assumptions that we believe to be reasonable, but which are inherently uncertain and outside of the control of management. If the carrying value of the reporting unit is higher than its fair value, there is an indication that impairment may exist which requires step two to be performed to measure the amount of the impairment loss. The amount of impairment is determined by comparing the implied fair value of a reporting unit’s goodwill to its carrying value.In the fourth quarter of 2010, the estimated fair value of all of our reporting units, except for our Australian reporting unit, significantly exceeded the carrying value of its assets and liabilities. Our Australian reporting unit had a goodwill balance of $11 million with an estimated fair value in excess of its net carrying value of one percent as of the testing date.We identified in our step one test that the carrying value of our Australian reporting unit was higher than its fair value which is an indication that impairment may exist which required us to perform step two of the goodwill impairment test to measure the amount of the impairment loss. Step two of the goodwill impairment evaluation required us to calculate the implied fair value of goodwill of our Australian reporting unit by allocating the estimated fair value to the assets and liabilities of this reporting unit as if the reporting unit had been acquired in a business combination and the fair value of the reporting unit was the acquisition price. As a result of performing steps one and two of the goodwill impairment test, we concluded that the remaining amount of goodwill related to our Australian reporting unit was impaired and accordingly, we recorded a goodwill impairment charge of $11$11 million during the third quarter of 2011.TENNECO INC.NOTES TO CONSOLIDATED FINANCIAL STATEMENTS — (Continued)2011,2013 and 2012, as a result of our annual goodwill impairment testing, the estimated fair value of each of our reporting units exceeded the carrying value of their assets and liabilities as of the testing date.20112013 and 20102012 were as follows: Year Ended December 31, 2011 North
America Europe,
South
America
and India Asia
Pacific Total (Millions) $ 330 $ 85 $ 12 $ 427 (306 ) (31 ) (1 ) (338 ) 24 54 11 89 1 (5 ) — (4 ) — — 11 11 331 80 12 423 (306 ) (31 ) (12 ) (349 ) $ 25 $ 49 $ — $ 74 Year Ended December 31, 2010 North
America Europe,
South
America
and India Asia
Pacific Total (Millions) $ 330 $ 87 $ 10 $ 427 (306 ) (32 ) — (338 ) 24 55 10 89 — (1 ) 1 — 330 85 12 427 (306 ) (31 ) (1 ) (338 ) $ 24 $ 54 $ 11 $ 89 Clean Air Division Ride Performance Division North
America Europe, South America & India Asia
Pacific North
America Europe, South America & India Asia
Pacific Total (Millions) Balance at December 31, 2011 $ 15 $ 13 $ — $ 10 $ 36 $ — $ 74 Translation Adjustment (1 ) — — — (1 ) — (2 ) Balance at December 31, 2012 14 14 — 10 34 — 72 Translation Adjustment — — — — (3 ) — (3 ) Balance at December 31, 2013 14 14 — 10 31 — 69 TENNECO INC.NOTES TO CONSOLIDATED FINANCIAL STATEMENTS — (Continued)five5 to 50 years. Amortization of intangibles amounted to $2$5 million in each of 2013 and 2012, and $2 million in 2011, 2010 and 2009, and isare included in the statements of income caption “Depreciation and amortization of intangibles.” The carrying amount and accumulated amortization of our finite useful life intangible assets were as follows: December 31, 2011 December 31, 2010 Gross Carrying
Value Accumulated
Amortization Gross Carrying
Value Accumulated
Amortization (Millions) (Millions) $ 8 $ (3) $ 8 $ (2) 5 (4) 5 (4) 20 (6) 21 (5) 9 — 6 (1) $ 42 $ (13) $ 40 $ (12) December 31, 2013 December 31, 2012 Gross Carrying
Value Accumulated
Amortization Gross Carrying
Value Accumulated
Amortization (Millions) (Millions) Customer contract $ 8 $ (4 ) $ 8 $ (3 ) Patents 3 (2 ) 3 (1 ) Technology rights 26 (12 ) 26 (7 ) Other 11 (1 ) 11 (1 ) Total $ 48 $ (19 ) $ 48 $ (12 ) $3$3 million in 2012,2014, $5 million in 2015, $4 million in both 20132016, $3 million in 2017 and 2014, $3$2 million in 2015 and $2 million in 2016.2018. We have capitalized indefinite life intangibles of $3$1 million relating to purchased trademarks from our Marzocchi® acquisition in 2007.20112013 and 2010,2012, plant, property, and equipment, at cost, by major category were as follows: 2011 2010 (Millions) $ 530 $ 524 2,406 2,406 217 179 $ 3,153 $ 3,109 2013 2012 (Millions) Land, buildings, and improvements $ 579 $ 563 Machinery and equipment 2,673 2,574 Other, including construction in progress 246 228 $ 3,498 $ 3,365 three3 to 25 years for machinery and equipment.$959$1,065 million and $823$980 million at December 31, 20112013 and 2010,2012, respectively. The allowance for doubtful accounts on short-term and long-term accounts receivable was $17$14 million and $20 million at both December 31, 20112013 and 2010,2012, respectively. Short and long-term notes receivable outstanding were $4$5 million and $2$3 million at December 31, 20112013 and 2010,2012, respectively. The allowance for doubtful accounts on short-term and long-term notes receivable was zero at both December 31, 20112013 and 2010.was $19were $30 million and $15$25 millionTENNECO INC.NOTES TO CONSOLIDATED FINANCIAL STATEMENTS — (Continued)20112013 and 2010,2012, respectively. In addition, plant, property and equipment included $38$59 million and $50 million at both December 31, 20112013 and 2010,2012, respectively, for original equipment tools and dies that we own, and prepayments and other included $49$86 million and $46$66 million at December 31, 20112013 and 2010,2012, respectively, for in-process tools and dies that we are building for our original equipment customers.$58$55 million and $53$58 million at December 31, 20112013 and 2010,2012, respectively, and are recorded in other long-term assets. Amortization of software development costs was approximately $15$15 million $18, $15 million and $22$18 million for the years ended December 31, 2011, 20102013, 2012 and 2009,2011, respectively, and is included in the statements of income (loss) caption “Depreciation and amortization of intangibles.” Additions to capitalized software development costs, including payroll and payroll-related costs for those employees directly associated with developing and obtaining the internal use software, are classified as investing activities in the statements of cash flows.expenseexpenses of $88$122 million $69, $19 million and $13$88 million in the years endingended 2013, 2012 and 2011, 2010 and 2009, respectively. The tax expense recorded in 2011 differs from the expense that would be recorded using a U.S. Federal statutory rate of 35 percent due to2013 includes a net tax benefit of $7$25 million primarily for tax adjustments related to U.S. taxable income with no associated tax expense due to our net operating loss (“NOL”) carryforward and income generated in lower tax rate jurisdictions, partially offset by the impact of recordingrecognizing a valuation allowance against theU.S. tax benefit for losses in certain foreign jurisdictionstaxes and taxes on repatriation of foreign earnings.In 2008, given our historical losses in the U.S., we concluded that our ability to fully utilize our NOLs was limited, as we were required to project the continuation of the negative economic environment at that time and the impact of the negative operating environment on our tax planning strategies. As a result, we recorded aallowance against all of our U.S. deferred tax assets except for our tax planning strategies which have not yet been implemented and which do not depend upon generating future taxable income. We carry deferredTENNECO INC.NOTES TO CONSOLIDATED FINANCIAL STATEMENTS — (Continued)tax assets in the U.S. of $90 million, as of December 31, 2011, relating to the expected utilization of those NOLs. The recording of a valuation allowance does not impact the amount of the NOL that would be available for federal and state income tax purposes in future periods. The federal NOLs expire beginning in tax years ending in 2021 through 2029. The state NOLs expire in various tax years through 2029.If our operating performance continues to improve on a sustained basis, our conclusion regarding the need for a valuation allowance could change, resulting in the reversal of some or all of the valuation allowance in the future. The charge to establish the U.S. valuation allowance also includes items related to the losses allocable to certain state jurisdictions where it was determined that tax attributes related to those jurisdictions were potentially not realizable. In addition, the charge to establish the U.S. valuation allowance eliminated the need for certain tax reserves which would need to beallowances recorded if the valuation allowance was reversed. If we were to reverse our U.S. valuation allowance, as of December 31, 2011, the impact on earnings would approximate $147 million.In prior years, we recorded a valuation allowance against deferred tax assets generated by taxable losses in the U.S. as well asSpain and certain other foreign jurisdictions.jurisdictions will impact our provision for income taxes until the valuation allowances are released. Our provision for income taxes will include no tax benefit with respect tofor losses incurred and no tax expense with respect to income generated in these jurisdictions until the respective valuation allowance is eliminated. In certain foreign jurisdictions, we have recorded a tax benefit on NOLs and tax credits with unlimited lives that are supported by tax actions and forecasted profitability. If the tax actions are not successful or losses are incurred, we may need to record a valuation allowance in a future period. We have recorded net deferred tax assets of approximately $23 million in these jurisdictions as of December 31, 2011. These actions will cause variability in our effective tax rate.$1,640$1,835 million $1,297, $1,660 million and $966$1,678 million in 2011, 20102013, 2012 and 2009,2011, respectively. For our aftermarket customers, we provide for promotional incentives and returns at the time of sale. Estimates are based upon the terms of the incentives and historical experience with returns. Certain taxes assessed by governmental authorities on revenue producing transactions, such as value added taxes, are excluded from revenue and recorded on a net basis. Shipping and handling costs billed to customers are included in revenues and the related costs are included in cost of sales in our consolidated statements of income (loss).TENNECO INC.NOTES TO CONSOLIDATED FINANCIAL STATEMENTS — (Continued)Due to the net loss for the year ended December 31, 2009, the calculation of diluted earnings per share did not include the dilutive effect from shares of restricted stock and stock options. See Note 2 to the consolidated financial statements of Tenneco Inc.$133$144 million for 2013, $126 million for 2012, and $133 million for 2011, $117 million for 2010 and $97 million for 2009, net of reimbursements from our customers. Our customers reimburse us for engineering, research, and development costs on some platforms when we prepare prototypes and incur costs before platform awards. Our engineering, research, and development expense for 2011, 2010,2013, 2012 and 20092011 has been reduced by $119$169 million $110, $159 million and $104$119 million, respectively, for these reimbursements.$61$53 million $59, $54 million, and $50$61 million for the years ended December 31, 2013, 2012, and 2011, 2010, and 2009, respectively.lossincome (loss) in shareholders’ equity. We recognize transaction gains and losses arising from fluctuations in currency exchange rates on transactions denominated in currencies other than the functional currency in earnings as incurred, except for those transactions which hedge purchase commitments and for those intercompany balances which are designated as long-term investments. Our results include foreign currency transaction losses of $13 million in 2013, of $8 million in 2012 and $3 million in 2011, less than $1 million2011. The amounts are recorded in 2010, and $4 million in 2009, respectively.assetliability position of $1less than $1 million at December 31, 20112013 and is based on an internally developed model whichTENNECO INC.NOTES TO CONSOLIDATED FINANCIAL STATEMENTS — (Continued)April 2011,July 2013, the Financial Accounting Standards Board (“FASB”) issued an amendment to provide explicit guidance on financial statement presentation of an unrecognized tax benefit when a net operating loss carryforward, similar tax loss, or tax credit carryforward exists. The objective of the accounting guidance for transfers of financial assets which changesamendment is to eliminate the criteria that must be met to achieve sales accounting. This amendment removes from the assessment of effective control the criterion relating to the transferor’s ability to repurchase or redeem financial assets on substantially the agreed terms, evendiversity in practice in the eventpresentation of default by the transferee. In addition, this amendment eliminates the requirement to demonstrate that the transferor possesses adequate collateral to fund substantially all the cost of purchasing replacement financial assets.unrecognized tax benefits in those instances. This amendment is effective for a reporting entity’s first interim or annual periodperiods beginning on or after December 15, 2011.2013. We do not believe the adoption ofadopted this amendment to the accounting guidance for transfers of financial assets on January 1, 2012 will2014. Adoption of the amendment is not expected to have a material impact on our consolidated financial statements.May 2011,April 2013, the FASB issued an amendment to achieve common fair value measurement and disclosure requirements in United States Generally Accepted Accounting Principles (“U.S. GAAP”) and International Financial Reporting Standards (“IFRS”). The amendment includes (1) that the concepts of highest and best use and valuation premise in a fair value measurement are relevant onlyclarify when measuring the fair value of nonfinancial assets, (2) provides specific requirements for measuring the fair value of an instrument classified in a reporting entity’s shareholders’ equity, (3) requires disclosure of quantitative information about unobservable inputs used in a fair value measurement that is categorized within Level 3 of the fair value hierarchy, (4) allows the use of a price, that would be received to sell a net asset position for a particular risk or to transfer a net liability position for a particular risk, in measuring the fair value of financial instruments that are managed within a portfolio, (5) in the absence of a Level 1 input a reporting entity should apply premiums or discounts when market participants would do so when pricing an asset or liabilitythe liquidation basis of accounting and (6) additional disclosure about fair value measurements.to provide principles for the measurement of assets and liabilities under the liquidation basis of accounting, as well as any required disclosures. The amendment applies to all entities that issue financial statements that are presented in conformity with U.S. GAAP except investment companies that are regulated under the Investment Company Act of 1940. This amendment is effective for a reporting entity’s interim and annual periods beginning after December 15, 2011. We do2013. Adoption of the amendment will not believe the adoption of this amendment for fair value measurements on January 1, 2012 will have a materialany impact on our consolidated financial statements.measurementFASB issued an amendment to resolve the diversity in practice about whether Subtopic 810-10, Consolidation-Overall, or Subtopic 830-30, Foreign Currency Matters-Translation of Financial Statements, applies to the release of the cumulative translation adjustment into net income when a parent either sells a part of all of its investment in a foreign entity or no longer holds a controlling financial interest in a subsidiary or group of assets that is a nonprofit activity or a business (other than a sale of in substance real state or conveyance of oil and gas mineral rights) within a foreign entity. In addition, the amendments resolve the diversity in practice for the treatment of business combinations achieved in stages (sometimes also referred to as step acquisitions) involving a foreign entity. This amendment is effective for reporting periods beginning after December 15, 2013. Adoption of the amendment will not have any impact on our consolidated financial assets and liabilities. We will add additional fair value disclosures, as required by this amendment, beginning with our first interim reporting period ending March 31, 2012.June 2011,February 2013, the FASB issued an amendment to the accounting guidance for the presentation on comprehensive incomerecognition, measurement, and disclosure of obligations resulting from joint and several liability arrangements for which must be applied retrospectively for all periods presented. This amendment removes onethe total amount of the three presentation optionsobligation is fixed at the reporting date, except for presentingobligations addressed within existing guidance in U.S. GAAP. The guidance requires an entity to measure those obligations as the components of other comprehensive income as partsum of the statementamount the reporting entity agreed to pay on the basis of changesits arrangement amount its co-obligors and any additional amount the reporting entity expects to pay on behalf of its co-obligors. The guidance in stockholders’ equitythis amendment also requires an entity to disclose the nature and requires either a single continuous statementamount of comprehensive income or a two statement approach andthe obligation as well as other information about those obligations. This amendment is effective for fiscal years, and interimreporting periods within those fiscal years, beginning after December 15, 2011. If a reporting entity elects the two statement approach, this amendment requires consecutive presentation2013. Adoption of the statement of net income followed by the statement of other comprehensive income. In addition, this amendment requires an entity to present reclassification adjustments on the face of the financial statements from other comprehensive income to net income. The FASB issued in December 2011, an amendment to defer the presentation of reclassification adjustments to allow additional time to redeliberate these new presentation requirements. We dowill not believe the adoption of this amendment to the accounting guidance for the presentation of comprehensive income on January 1, 2012 will have a materialany impact on our consolidated financial statements.September 2011,February 2013, the FASB issued an amendment to the accounting guidance to improve the transparency of reporting amounts reclassified out of other comprehensive income. Other comprehensive income (loss) includes gains and losses that are initially excluded from net income for testing goodwill for impairment.an accounting period. Those gains and losses are later reclassified out of accumulated other comprehensive income into net income. This amendment provides adoes not change the current requirements for reporting entitynet income or other comprehensive income in the option to first assess qualitative factors to determine whether the existence of events and circumstances leads to a determination that it is more likely than not that theTENNECO INC.NOTES TO CONSOLIDATED FINANCIAL STATEMENTS — (Continued)fair value of a reporting unit is less than its carrying amount. If the reporting entity’s assessment after considering all events and circumstances is that it is not more likely than not that its fair value is less than its carrying amount, then performing the two-step impairment test is not required. If the reporting entity concludes that it is more likely than not that its fair value is less than its carrying amount then the first stepfinancial statements. All of the two-step impairment test is required. If the carrying amount of the reporting unit exceeds its fair value, then the reporting unitinformation that this amendment requires already is required to performbe disclosed elsewhere in the second stepfinancial statements under U.S. GAAP. This new amendment requires presentation either on the face of the goodwill impairment teststatement where net income is presented or in the notes, the effects of significant amounts reclassified out of accumulated other comprehensive income, and that the reclassified amounts be cross-referenced to measure the amount of the impairment loss.other disclosures required under U.S. GAAP. This amendment iswas effective for annual and interim goodwill impairment tests performed for fiscal yearsreporting periods beginning after December 15, 2011. We do2012. This amendment has not believe the adoption of this amendment on January 1, 2012 for testing goodwill for impairment will havehad a material impact on our condensed consolidated financial statements.IFRS.International Financial Reporting Standards ("IFRS"). A reporting entity will be required to disclose 1)(1) the gross amount of recognized assets and liabilities, 2)(2) the amounts offset to determine the net amounts presented in the statement of financial position, 3)(3) the net amounts presented in the statement of financial position, 4)(4) the amounts subject to an enforceable master netting arrangement or similar agreement not otherwise included in (2), and 5)(5) the net amount after deducting the amounts in (4) and (3). This amendment iswas effective for a reporting entity’s interim and annual periods beginning on or after January 1, 2013. We do not believe the adoptionFollowing issuance of this amendment, relatingconsiderable concerns were raised regarding the broad scope of this amendment. In response to the concerns, in January, 2013, the FASB issued a new amendment revising the scope of the disclosure requirements to apply only to derivatives, repurchase agreements and reverse repurchase agreements, and security borrowing and lending transactions subject to a master netting arrangement or similar agreement. As a result of this new amendment the disclosure about offsetting assets and liabilities on January 1, 2013 willdid not have a materialany impact onto our consolidated financial statements. Russia, South Africa, India, Thailand and Argentina. At December 31, 2011, theThailand. The net asset balance of our subsidiaries in the countries in which we operate that have such restrictions was $137 million.$177 million and $183 million as of December 31, 2013 and 2012, respectively. These central banking restrictions do not have a significant effect on our ability to manage liquidity on a global basis.TENNECO INC.2.NOTES TO CONSOLIDATED FINANCIAL STATEMENTS — (Continued)2.Earnings (Loss) Per Share(loss)Per Share Year Ended December 31, 2011 2010 2009 (Millions Except Share and Per Share Amounts) $ 157 $ 39 $ (73 ) 59,884,139 59,208,103 48,572,463 $ 2.62 $ 0.65 $ (1.50 ) $ 157 $ 39 $ (73 ) 59,884,139 59,208,103 48,572,463 168,539 441,561 — 1,467,482 1,349,030 — 61,520,160 60,998,694 48,572,463 $ 2.55 $ 0.63 $ (1.50 ) Year Ended December 31, 2013 2012 2011 (Millions Except Share and Per Share Amounts) Basic earnings per share — Net income attributable to Tenneco Inc. $ 183 $ 275 $ 157 Average shares of common stock outstanding 60,474,492 59,985,677 59,884,139 Earnings per average share of common stock $ 3.03 $ 4.58 $ 2.62 Diluted earnings per share — Net income attributable to Tenneco Inc. $ 183 $ 275 $ 157 Average shares of common stock outstanding 60,474,492 59,985,677 59,884,139 Effect of dilutive securities: Restricted stock 205,020 140,609 168,539 Stock options 914,550 957,224 1,467,482 Average shares of common stock outstanding including dilutive securities 61,594,062 61,083,510 61,520,160 Earnings per average share of common stock $ 2.97 $ 4.50 $ 2.55 202,009205,104, 521,249 and 612,832202,009 shares of common stock were outstanding as of December 31, 20112013, 2012 and 2010,2011, respectively, but not included in the computation of diluted earnings per share, because the options were anti-dilutive. As a resultthe net loss in 2009, the calculation of diluted loss per share excludes the dilutive effect of options and restricted stock.Contents 3.Acquisitionsemission controlclean air joint venture in Thailand for $4$4 million in cash. As a result of this purchase, our equity ownership of this joint venture investment changed to 100 percent from 75 percent.January 2010,September 2012, we purchased certain rights from Combustion Components Associates, Inc. primarily pertaining to emission control technology for stationary reciprocating engine applications for $7 million in cash.our Tenneco Tongtai (Dalian) Exhaust System Co., Ltd. (TTEC) joint venture investment in China for $15$69 million in cash.cash through two transactions. The joint venture partner also received an additional amount of $9 million in lieu of receiving its pro-rata share of dividends owed from the joint venture. As a result of thisthe purchase, our equity ownership percentageTTEC became a wholly owned indirect subsidiary of this joint venture investment increasedTenneco.80 percent from 60 percent.For 2009, we incurred $21 million in restructuring and related costs, of which $16 million was recorded in cost of sales, $1 million was recorded in selling, general, administrative and engineering expense and $4 million was recorded in depreciation and amortization expense. In 2010, we incurred $19 million in restructuring and related costs, of which $14 million was recorded in cost of sales and $5 million was recorded in depreciation and amortization expense. During 2011, we incurred $8$8 million in restructuring and related costs, primarily related to headcount reductions in Europe and Australia and the closure of our ride controlperformance plant in Cozad, Nebraska, all of which was recorded in cost of sales.TENNECO INC.$13 millionNOTES TO CONSOLIDATED FINANCIAL STATEMENTS — (Continued) in restructuring and related costs, primarily related to headcount reductions in South America and non-cash asset write downs of December 31,
2010
Restructuring
Reserve 2011
Expenses 2011
Cash
Payments Reserve
Adjustments December 31,
2011
Restructuring
Reserve (Millions) $7 8 (13 ) (1 ) $1 December 31,
2012
Restructuring
Reserve 2013
Expenses 2013
Cash
Payments Impact of Exchange Rates December 31,
2013
Restructuring
Reserve (Millions) Employee Severance, Termination Benefits and Other Related Costs $ — 75 (32 ) 1 $ 44 extendedrestated senior credit agreement that took effect on June 3, 2010,March 22, 2012, we are allowed to exclude $60$80 million of cash charges and expenses, before taxes, related to cost reduction initiatives incurred after June 3, 2010March 22, 2012 from the calculation of the financial covenant ratios required under our senior credit facility. As of December 31, 2011,2013, we have excluded $17 million in cumulativeall allowable charges relating to restructuring initiatives against the $60$80 million available under the terms of the senior credit facility.September 22, 2009,January 31, 2013, we announced thatour intent to reduce structural costs in Europe. This initiative includes the non-cash charges of $4 million we wereincurred in 2012 in connection with the announced closing our original equipmentof the Vittaryd facility in Sweden and a $7 million charge recorded in the fourth quarter of 2012 related to the impairment of certain assets in the European ride control plant in Cozad, Nebraska. TheCozadVittaryd facility. On September 5, 2013, we announced our intent to close our ride performance plant will eliminate approximately 500 positions. We are hiringin Gijon, Spain and reduce the workforce at other facilities as we move production from Cozadour ride performance plant in Sint-Truiden, Belgium. The workers' council filed suit challenging the decision to those facilities, which will resultclose the Gijon plant and the local High Court of Justice of Asturias ruled in a net decrease of approximately 60 positions. Muchfavor of the production is being shifted from Cozad to our plant in Hartwell, Georgia.Duringworkers' council. On February 25, 2014, we announced the transition of production from our Cozad facility to our Hartwell facility, several customer programs, which were planned to phase out, were reinstated and volumes increased beyond the amount in our original restructuring plan. To meet the higher volume requirements, we have taken a number of actions over the past few months to stabilize the production environment in Hartwell including reinforcing several core processes, realigning assembly lines, upgrading equipment to increase output and accelerating our Lean manufacturing activities. Based on the higher volumes, we are adjusting our consolidation plan. Our revised consolidation plan includes temporarily continuing some basic production operations in Cozad, and redirecting some programs from our Hartwell facility to our other North American facilities to better balance production. These actions are anticipated to conclude during the third quarter of 2012. As of December 31, 2011, more than 95 percentintention of the positions at our Cozad facility have been eliminated.During 2009 and 2010, weCompany to appeal that decision to the Supreme Court of Spain in Madrid. We recorded $11$60 million and $10in charges related to these actions in 2013. We incurred $78 million respectively, ofin restructuring and related expensescosts in 2013, of which $69 million was related to this initiative including $3 million for non-cash asset write downs. These charges included non-cash asset impairments, the cost of which approximately $16 million represents cash expenditures. In 2011, we have recorded an additional cash charge of $2 millionrelocating tooling, equipment and production to other facilities, severance and retention payments to employees and other costs related to this initiative.In 2011, we recorded $3 million of restructuringthese actions.related expenses, all of which represented cash expenditures, related to the permanent elimination of 53 positions in our Australian operations as a result of the continued decline in industry production volumes in that region.TENNECO INC.Financing ArrangementsNOTES TO CONSOLIDATED FINANCIAL STATEMENTS — (Continued)5.Long-Term Debt, Short-Term Debt, and Financing Arrangements20112013 and 2010,2012, is set forth in the following table: 2011 2010 (Millions) $ 24 $ — 148 149 225 225 500 500 — 20 250 250 1 1 3 4 11 13 1,162 1,162 4 2 $ 1,158 $ 1,160 (a) 2013 2012 (Millions) Tenneco Inc. — Revolver borrowings due 2017, average effective interest rate 2.7% in 2013 and 1.2% in 2012 $ 58 $ 92 Senior Term Loan due 2014 through 2017, average effective interest rate 2.7% in 2013 and 3.0% in 2012 228 241 7 3/4% Senior Notes due 2018 225 225 6 7/8% Senior Notes due 2020 500 500 Debentures due 2014 through 2026, average effective interest rate 7.5 in 2013 and 8.4% in 2012 1 1 Customer Notes due 2013, average effective interest rate 8.0% in 2013 and 2012 — 1 Other subsidiaries — Notes due 2014 through 2026, average effective interest rate 1.3% in both 2013 and 2012 9 10 1,021 1,070 Less — maturities classified as current 2 3 Total long-term debt $ 1,019 $ 1,067 On January 7, 2011, we redeemed the remaining $20 million 8 5/8 percent senior subordinated notes by increasing our revolver borrowings which are classified as long-term debt.2011,2013, are $4$23 million $5, $35 million $27, $48 million $253, $184 million and $142$226 million for 2012, 2013, 2014, 2015, 2016, 2017 and 2016,2018, respectively.TENNECO INC.NOTES TO CONSOLIDATED FINANCIAL STATEMENTS — (Continued)20112013 and 20102012 is as follows: 2011 2010 (Millions) $ 4 $ 2 62 61 $ 66 $ 63 Notes Payable(a) 2011 2010 (Dollars in Millions) $ 62 $ 61 6.0 % 7.8 % $ 178 $ 201 $ 118 $ 109 5.6 % 5.5 % 2013 2012 (Millions) Maturities classified as current $ 2 $ 3 Short-term borrowings 81 110 Total short-term debt $ 83 $ 113 Notes Payable(a) 2013 2012 (Dollars in Millions) Outstanding borrowings at end of year $ 81 $ 110 Weighted average interest rate on outstanding borrowings at end of year(b) 4.4 % 5.3 % Approximate maximum month-end outstanding borrowings during year $ 177 $ 156 Approximate average month-end outstanding borrowings during year $ 116 $ 123 Weighted average interest rate on approximate average month-end outstanding borrowings during year(b) 4.7 % 5.5 % (a) Includes borrowings under both committed credit facilities and uncommitted lines of credit and similar arrangements. (b) This calculation does not include the commitment fees to be paid on the unused revolving credit facility balances which are recorded as interest expense for accounting purposes. Committed Credit Facilities(a) as of December 31, 2011 Term Commitments Borrowings Letters of
Credit(b) Available (Millions) 2014 622 — 58 564 2014 130 24 — 106 2016 148 148 — — 2012-2025 88 73 — 15 $ 988 $ 245 $ 58 $ 685 Committed Credit Facilities(a) as of December 31, 2013 Term Commitments Borrowings Available (Millions) Tenneco Inc. revolving credit agreement 2017 850 58 37 755 Tenneco Inc. tranche A term facility 2017 228 228 — — Subsidiaries’ credit agreements 2014-2026 110 90 — 20 $ 1,188 $ 376 $ 37 $ 775 (a) We generally are required to pay commitment fees on the unused portion of the total commitment. (b) Letters of credit reduce the available borrowings under the revolving credit agreement. TENNECO INC.NOTES TO CONSOLIDATED FINANCIAL STATEMENTS — (Continued)June 3, 2010,March 22, 2012, we completed an amendment and extensionrestatement of our senior secured credit facility by increasing the amount and extending the termmaturity date of our revolving credit facility and replacingadding a new Tranche A Term Facility. The amended and restated facility replaces our $128former $556 million term revolving credit facility, $148 million Tranche B Term Facility and $130 million Tranche B-1 letter of credit/revolving loan A with a largerfacility. The proceeds from this refinancing transaction were used to repay our $148 million Tranche B Term Facility and longer maturity term loan B facility.to fund the purchase and redemption of our $250 million 8 1/8 percent senior notes due in 2015. As a result of the amendment and extension, as of December 31, 2011,2013, the senior credit facility provides us with a total revolving credit facility size of $622$850 million until March 16, 2012, when commitments and a $228 million Tranche A Term Facility, both of $66 million will expire. After March 16, 2012, the extended revolving credit facility will provide $556 million of revolving credit andwhich will mature on May 31, 2014. The extended facility will mature earlier on December 15, 2013, if our $130 million tranche B-1 letter of credit/revolving loan facility is not refinanced by that date. Prior to maturity, fundsMarch 22, 2017. Funds may be borrowed, repaid and re-borrowed under the two revolving credit facilitiesfacility without premium or penalty.As of December 31, 2011, the senior The revolving credit facility also provides a six-year, $148 million term loan B maturing in June 2016, and a seven-year $130 million tranche B-1 letter of credit/revolving loan facility maturing in March 2014. We are required to make quarterly principal payments of $375 thousand on the term loan B, through March 31, 2016 with a final payment of $141 million due June 3, 2016. The tranche B-1 letter of credit/revolving loan facility requires repayment by March 2014. We can enter into revolving loans and issue letters of credit under the $130 million tranche B-1 letter of credit/revolving loan facility. The tranche B-1 letter of credit/revolving loan facility is reflected as debt on our balance sheet only if we borrow money under this facility or if we use the facility to make payments for letters of credit. There is no additional cost to us for issuing letters of credit under the tranche B-1 letter of credit/revolving loan facility. However, outstandingOutstanding letters of credit reduce our availability to enter into revolving loans under the facility. We payare required to make quarterly principal payments under the tranche B-1 lendersTranche A Term Facility of marginfinal payment of $125 million is due on March 22, 2017. We have excluded the $130required payments, within the next twelve months, under the Tranche A Term Facility totaling $22 million deposited withfrom current liabilities as of December 31, 2013, because we have the administrative agent. In addition,intent and ability to refinance the obligations on a long-term basis by using our revolving credit facility.pay lenders interest equalannounced a cash tender offer to purchase our outstanding $250 million 8 1/8 percent senior notes due in 2015 and a solicitation of consents to certain proposed amendments to the London Interbank Offered Rate (“LIBOR”)indenture governing these notes. We received tenders and consents representing $232 million aggregate principal amount of the notes and, on March 22, 2012, we purchased the tendered notes at a price of 104.44 percent of the principal amount (which includes a consent payment of three percent of the principal amount), plus accrued and unpaid interest, and amended the related indenture. On April 6, 2012, we redeemed the remaining outstanding $18 million aggregate principal amount of senior notes that were not purchased pursuant to the tender offer at a price of 104.06 percent of the principal amount, plus accrued and unpaid interest. The additional liquidity provided by the new $850 million revolving credit facility and the new $250 million Tranche A Term Facility was used to fund the total cost of the tender offer and redemption, including all borrowingsrelated fees and expenses.facility. Funds depositedrevolving credit facility, we had unused borrowing capacity of $755 million with the administrative agent by the lenders$58 million in outstanding borrowings and not borrowed by the Company earn interest at an annual rate approximately equal$37 million in outstanding letters of credit. As of December 31, 2013, our outstanding debt also included $228 million related to LIBOR less 25 basis points.June 3, 2010,March 22, 2012, our term loan BTranche A Term Facility and revolving credit facility bear interest at an annual rate equal to, at our option, either (i) LIBORLondon Interbank Offered Rate (“LIBOR”) plus a margin of 475 and 450 basis points, respectively, or (ii) a rate consisting of the greater of (a) the JPMorgan Chase prime rate plus a margin of 375 and 350 basis points, respectively, (b) the Federal Funds rate plus 50 basis points plus a margin of 375 and 350 basis points, respectively, and (c) the Eurodollar Rate plus 100 basis points plus a margin of 375 and 350 basis points, respectively. The margin we pay on these borrowings will be reduced by 25 basis points following each fiscal quarter for which our consolidated net leverage ratio is less than 2.25 for extending lenders and for the term loan B and will be further reduced by an additional 25 basis points following each fiscal quarter for which the consolidated net leverage ratio is less than 2.00 for extending lenders. Our consolidated net leverage ratio was 1.88 and 2.24 as of December 31, 2011 and 2010, respectively. Accordingly, in February of 2012 the margin we pay on these borrowings will be reduced by 25 basis points for extending lenders and will remain at such level for so long as our consolidated net leverage ratio remains below 2.00.The borrowings under our tranche B-1 letter of credit/revolving loan facility incur interest at an annual rate equal to, at our option, either (i) LIBOR plus a margin of 500250 basis points, or (ii) a rate consisting of the greater of (a) the JPMorgan Chase prime rate plus a margin of 400150 basis points, (b) the Federal Funds rate plus 50 basis points plus a margin of 400150 basis points, and (c) the Eurodollar Rate plus 100 basis points plus a margin of 400150 basis points.At The margin we pay on these borrowings will be reduced by a total of 25 basis points below the original margin following each fiscal quarter for which our consolidated net leverage ratio is less than 1.50 or will be increased by a total of 25 basis points above the original margin if our consolidated net leverage ratio is greater than or equal to 2.50. We also pay a commitment fee equal to 40 basis points. In February 2014, the margin we pay on borrowings decreased by 25 basis points below the original margin, as a result of a decrease in our consolidated net leverage ratio from 1.86 at September 30, 2013 to 1.39 at December 31, 2011, of the $752 million available under the two revolving credit facilities within our senior secured credit facility, we had unused borrowing capacity of $670 million with $24 million in outstanding borrowings and $58 million in letters of credit outstanding. As of December 31, 2011, our outstanding debt also included $250 million of 82013. 1/8 percent senior notes due November 15, 2015, $148 million term loan B dueTENNECO INC.NOTES TO CONSOLIDATED FINANCIAL STATEMENTS — (Continued)June 3, 2016, $225 million of 7 3/4 percent senior notes due August 15, 2018, $500 million of 6 7/8 percent senior notes due December 15, 2020, and $78 million of other debt.On December 9, 2010, we commenced a cash tender offer of our outstanding $500 million 8 5/8 percent senior subordinated notes due in 2014 and a consent solicitation to amend the indenture governing these notes. On December 23, 2010, we issued $500 million of 6 7/8 percent senior notes due December 15, 2020 in a private offering. The net proceeds of this transaction, together with cash and available liquidity, were used to finance the purchase of our 8 5/8 percent senior subordinated notes pursuant to the tender offer at a price of 103.25 percent of the principal amount, plus accrued and unpaid interest for holders who tendered prior to the expiration of the consent solicitation, and 100.25 percent of the principal amount, plus accrued and unpaid interest, for other participants. A total of $480 million of the senior subordinated notes were tendered prior to the expiration of the consent solicitation. On January 7, 2011, we redeemed all remaining outstanding $20 million of senior subordinated notes that were not previously tendered, at a price of 102.875 percent of the principal amount, plus accrued and unpaid interest. To facilitate these transactions, we amended our senior credit agreement to permit us to refinance our senior subordinated notes with new senior unsecured notes. We did not incur any fee in connection with this amendment. The new notes are general senior obligations of Tenneco Inc. and are not secured by assets of Tenneco Inc. or any of our subsidiaries that guarantee the new notes. We recorded $20 million of pre-tax charges in December 2010 and an additional $1 million of pre-tax charges in the first quarter of 2011 related to our repurchase and redemption of our 8 5/8 percent senior subordinated notes. On March 14, 2011, we completed an offer to exchange the $500 million of 6 7/8 percent senior notes due in 2020 which have been registered under the Securities Act of 1933, for and in replacement of all outstanding unregistered 6 7/8 percent senior notes due in 2020. We received tenders from holders of all $500 million of the aggregate outstanding amount of the original notes. The terms of the new notes are substantially identical to the terms of the original notes for which they were exchanged, except that the transfer restrictions and the registration rights applicable to the original notes generally do not apply to the new notes.On August 3, 2010, we issued $225 million of 7 3/4 percent senior notes due August 15, 2018 in a private offering. The net proceeds of this transaction, together with cash and available liquidity, were used to finance the redemption of our 10 1/4 percent senior secured notes due in 2013. We called the senior secured notes for redemption on August 3, 2010, and completed the redemption on September 2, 2010 at a price of 101.708 percent of the principal amount, plus accrued and unpaid interest. We recorded $5 million of expense related to our redemption of our 10 1/4 percent senior secured notes in the third quarter of 2010. The new notes are general senior obligations of Tenneco Inc. and are not secured by assets of Tenneco Inc. or any of our subsidiaries that guarantee the new notes. On February 14, 2011, we completed an offer to exchange the $225 million of 7 3/4 percent senior notes due in 2018 which have been registered under the Securities Act of 1933, for and in replacement of all outstanding unregistered 7 3/4 percent senior notes due in 2018. We received tenders from holders of all $225 million of the aggregate outstanding amount of the original notes. The terms of the new notes are substantially identical to the terms of the original notes for which they were exchanged, except that the transfer restrictions and the registration rights applicable to the original notes generally do not apply to the new notes.TENNECO INC.NOTES TO CONSOLIDATED FINANCIAL STATEMENTS — (Continued)Senior Credit Facility — Interest Rates and Fees. Borrowings and letters of credit issued under the senior credit facility bear interest at an annual rate equal to, at our option, either (i) LIBOR plus a margin as set forth in the table below; or (ii) a rate consisting of the greater of the JPMorgan Chase prime rate, the Federal Funds rate plus 50 basis points or the Eurodollar Rate plus 100 basis points, plus a margin as set forth in the table below: 8/14/2009
thru
2/28/2010 3/1/2010
thru
6/2/2010 6/3/2010
thru
2/27/2011 2/28/2011
thru
5/15/2011 5/16/2011
thru
8/7/2011 Beginning
8/8/2011 5.50 % 4.50 % 4.50 % 4.25 % 4.50 % 4.25 %* — — 4.75 % 4.50 % 4.75 % 4.50 %* 5.50 % 4.50 % — — — — 5.50 % 5.00 % 5.00 % 5.00 % 5.00 % 5.00 % 4.50 % 3.50 % — — — — — — 3.50 % 3.25 % 3.50 % 3.25 %* — — 3.75 % 3.50 % 3.75 % 3.50 %* — — 4.00 % 4.00 % 4.00 % 4.00 % — — 3.50 % 3.25 % 3.50 % 3.25 %* — — 3.75 % 3.50 % 3.75 % 3.50 %* 5.00 % 4.00 % 4.00 % 4.00 % 4.00 % 4.00 % 0.75 % 0.50 % 0.75 % 0.50 % 0.75 % 0.50 %* *In February 2012, the margin we pay on borrowings will decrease by 25 basis points, as a result of a decrease in our consolidated net leverage ratio from 2.07 at September 30, 2011 to 1.88 at December 31, 2011.2011,2013, are as follows: Quarter Ended March 31,
2011 June 30,
2011 September 30,
2011 December 31,
2011 Req. Act. Req. Act. Req. Act. Req. Act. 4.00 2.32 3.75 2.17 3.50 2.07 3.50 1.88 2.55 4.37 2.55 4.76 2.55 5.17 2.55 5.69 Quarter Ended Req. Act. Req. Act. Req. Act. Req. Act. Leverage Ratio (maximum) 3.50 1.98 3.50 1.79 3.50 1.86 3.50 1.39 Interest Coverage Ratio (minimum) 2.55 8.39 2.55 8.74 2.55 9.09 2.55 9.89 financial ratios required under the senior credit facility for each quarter beyond December 31, 2011 includeincludes a maximum leverage ratio covenant of 3.50 through March 22, 2017 and a minimum interest coverage ratio of 2.75.2.55 through December 31, 2013 and 2.75 thereafter, through March 22, 2017.notes:notes (i) with the net cash proceeds of incremental facilities and permitted refinancing indebtedness (as defined in the senior credit facility agreement)agreement or with the net cash proceeds of our common stock); (ii) with the net cash proceeds fromof the saleincremental facilities (as defined in the senior credit facility agreement); (iii) with the net cash proceeds of sharesthe revolving loans (as defined in the senior credit facility agreement); (iv) with the cash generated by our operations; (v) in an amount equal to the net cash proceeds of our common stock; (iii)qualified capital stock (as defined in the senior credit facility agreement) issued by us after March 22, 2012; and (vi) in exchange for permitted refinancing indebtedness or in exchange for shares of our common stock; (iv) with the net cash proceeds of any new senior or subordinated unsecured indebtedness; (v) with the proceeds of revolving credit loans (as defined in the senior credit facilityTENNECO INC.NOTES TO CONSOLIDATED FINANCIAL STATEMENTS — (Continued)agreement); (vi) with the cash generated by the operations of the Company; and (vii) in an amount equal to the sum of (a) the net cash proceeds of qualified stock issued by the Company after March 16, 2007, plus (b) the portion of annual excess cash flow (beginning with excess cash flow for fiscal year 2010) not required to be applied to payment of the credit facilities and which is not used for other purposes, provided that the aggregate principal amount of senior notes purchased and cancelled or redeemed pursuant to clauses (v), (vi) and (vii), issuch purchases are capped as follows based(with respect to clauses (iii), (iv) and (v) on thea pro forma consolidated leverage ratio after giving effect to such purchase, cancellation or redemption:Pro forma ConsolidatedLeverage RatioAggregate Senior NoteMaximum Amount(Millions)Greater than or equal to 3.0x$ 20Greater than or equal to 2.5x$100Less than 2.5x$125Pro forma Consolidated
Leverage RatioAggregate Senior
Note Maximum Amount (Millions) Greater than or equal to 3.0x $ 20 Greater than or equal to 2.5x $ 100 Greater than or equal to 2.0x $ 200 Less than 2.0x no limit 2011,2013, we were in compliance with all the financial covenants and operational restrictions of the senior credit facility. Our senior credit facility does not contain any terms that could accelerate payment of the facility or affect pricing under the facility as a result of a credit rating agency downgrade.2011,2013, our outstanding debt also includes $250 million of 8 1/8 percent senior notes due November 15, 2015, $225included $225 million of 7 3/4 percent senior notes due August 15, 2018 and $500$500 million of 6 7/8 percent senior notes due December 15, 2020. Under the indentures governing the notes, we are permitted to redeem some or all of the remaining senior notes at specified prices that decline to par over a specified period at any time on and after NovemberAugust 15, 2011 in the case of the senior notes due 2015, August 14, 2014 in the case of the senior notes due 2018, and December 15, 2015 in the case of the senior notes due 2020. In addition, prior to such dates the notes may also be redeemed at a price generally equal to 100 percent of the principal amount thereof plus a premium based on the present values of the remaining payments due to the noteholders. If we sell certain of our assets or experience specified kinds of changes in control, we must offer to repurchase the notes. Under the indentures governing the notes, we are permitted to redeem up to 35 percent of the senior notes due 2018 with the proceeds of certain equity offerings completed before August 13, 2013 and up to 352020 at 101 percent of the senior notes due 2020, with the proceeds of certain equity offerings completed before December 15, 2013.principal amount thereof plus accrued and unpaid interest.2.00.2.00. The indentures also contain restrictions on our operations, including limitations on: (i) incurring additional indebtedness or liens; (ii) dividends; (iii) distributions and stock repurchases; (iv) investments;TENNECO INC.NOTES TO CONSOLIDATED FINANCIAL STATEMENTS — (Continued)2011,2013, we were in compliance with the covenants and restrictions of these indentures.2011,2013, the North American program was amended and extended to March 23, 2012.21, 2014. The first priority facility continues to provide financing of up to $110$110 million and the second priority facility, which is subordinated to the first priority facility, continues to provide up to an additional $40$40 million of financing. Both facilities monetize accounts receivable generated in the U.S. and Canada that meet certain eligibility requirements, and therequirements. The second priority facility also monetizes certain accounts receivable generated in the U.S. or Canada that would otherwise be ineligible under the first priority securitization facility. The amendments to the North American program expand the trade receivables that are eligible for purchase under the program and decrease the margin we pay to our banks. We had noamount of outstanding third partythird-party investments in our securitized accounts receivable under the North American program was $10 millionat December 31, 20112013 and 2010, respectively.consolidationconsolidations and amendments to the agreements underlying the receivables pool. Further, each facility may be terminated upon the occurrence of customary events (with customary grace periods, if applicable), including breaches of covenants, failure to maintain certain financial ratios, inaccuracies of representations and warranties, bankruptcy and insolvency events, certain changes in the rate of default or delinquency of the receivables, a change of control and the entry or other enforcement of material judgments. In addition, each facility contains cross-default provisions, where the facility could be terminated in the event of non-payment of other material indebtedness when due and any other event which permits the acceleration of the maturity of material indebtedness.sevensix separate facilities provided by various financial institutions in each of the foreign15 days, or less, notification. The amount of outstanding third partythird-party investments in our securitized accounts receivable in Europe was $121$134 million and $91$94 million at December 31, 20112013 and 2010,December 31, 2012, respectively.agreementsagreement might increase. These accounts receivable securitization programs provide us with access to cash at costs that are generally favorable to alternative sources of financing, and allow us to reduce borrowings under our revolving credit agreements.We adopted the amended accounting guidance under ASC Topic 860, Accounting for Transfers of Financial Assets effective January 1, 2010. Prior to the adoption of this new guidance, we accounted for activities under our North American and European accounts receivable securitization programs as sales of financial assets to our banks. The new accounting guidance changed the condition that must be met for the transfer of financial assets to be accounted for as a sale. The new guidance adds additional conditions that must be satisfied for transfers of financial assets to be accounted for as sales when the transferor has not transferred the entire original financialTENNECO INC.NOTES TO CONSOLIDATED FINANCIAL STATEMENTS — (Continued)asset, including the requirement that no partial interest holder have rights in the transferred asset that are subordinate to the rights of other partial interest holders. beginning January 1, 2010, we account for our North American securitization program as a secured borrowing. In our European programs, we transfer accounts receivables in their entirety to the acquiring entities and satisfy all of the conditions established under ASC Topic 860, “Transfers and Servicing,” to report the transfer of financial assets in their entirety as a sale. The fair value of assets received as proceeds in exchange for the transfer of accounts receivable under our European securitization programs approximates the fair value of such receivables. We recognized $3$2 million in interest expense for the year ended 2013 and $4$3 million in interest expense for each of the years ended 20112012 and 2010,2011, respectively, relating to our North American securitization program, which effective January 1, 2010, is accounted for as a secured borrowing under the amended accounting guidance for transfers of financial assets.program. In addition, we recognized a loss of $5$4 million $3, $4 million and $9$5 million for each of the years ended 2011, 20102013, 2012 and 2009, respectively,2011, on the sale of trade accounts receivable in our European and North American accounts receivable securitization programs, representing the discount from book values at which these receivables were sold to our banks. The discount rate varies based on funding costs incurred by our banks, which averaged approximately three percent four percent and five percent for each of the years ended 2013, 2012 and 2011, 2010 and 2009, respectively.6.Financial Instruments20112013 and 20102012 were as follows: December 31, 2011 December 31, 2010 Carrying
Amount Fair
Value Carrying
Amount Fair
Value (Millions) $ 1,162 $ 1,200 $ 1,162 $ 1,201 1 1 2 2 December 31, 2013 December 31, 2012 Carrying
Amount Fair
Value Carrying
Amount Fair
Value (Millions) Long-term debt (including current maturities) $ 1,021 $ 1,089 $ 1,070 $ 1,136 Instruments with off-balance sheet risk: Foreign exchange forward contracts: Asset derivative contracts — — 1 1 TENNECO INC.NOTES TO CONSOLIDATED FINANCIAL STATEMENTS — (Continued)20112013 and 2010,2012, respectively, was as follows: Fair Value of Derivative Instruments December 31, 2011 December 31, 2010 Asset
Derivatives Liability
Derivatives Total Asset
Derivatives Liability
Derivatives Total (Millions) $1 $— $1 $2 $— $2 Fair Value of Derivative Instruments December 31, 2013 December 31, 2012 Asset
Derivatives Liability
Derivatives Total Asset
Derivatives Liability
Derivatives Total (Millions) Foreign exchange forward contracts $ — $ — $ — $ 1 $ — $ 1 20112013 and 2010,2012, respectively, are as follows: December 31, 2011 December 31, 2010 Level 1 Level 2 Level 3 Level 1 Level 2 Level 3 (Millions) n/a $1 n/a n/a $2 n/a December 31, 2013 December 31, 2012 Level 1 Level 2 Level 3 Level 1 Level 2 Level 3 (Millions) Financial Assets: Foreign exchange contracts $ — $ — $ — n/a $ 1 n/a — Quoted prices in active markets for identical assets or liabilities. — Inputs, other than quoted prices in active markets, that are observable either directly or indirectly. — Unobservable inputs based on our own assumptions. 20112013 (all of which mature in 2012)2014): Notional Amount
in Foreign Currency (Millions) —Purchase 3 2—Purchase 4 —Sell ( 5616) Yenyen —Purchase 135 431South African rand—Purchase92U.S. dollars—Purchase2—Sell ( 47842) OtherPolish zloty —Purchase 33 1South African rand —Purchase 144 U.S. dollars —Purchase 15 —Sell (15 ) Other —Sell ( 12) TENNECO INC.NOTES TO CONSOLIDATED FINANCIAL STATEMENTS — (Continued) of our direct or indirect foreign subsidiaries secure our senior notes. For additional information, refer to Note 13 of the consolidated financial statements of Tenneco Inc., where we present the Supplemental Guarantor Condensed Consolidating Financial Statements.Futaba TennecoFutaba-Tenneco U.K. joint venture. Employer contributions are funded by both Tenneco Walker (U.K.) Limited, as the sponsoring employer and Futaba TennecoFutaba-Tenneco U.K., as a participating employer. The performance guarantee agreements are expected to remain in effect until all pension obligations for the Walker Plans’ sponsoring and participating employers haverelatingrelated to other participating employers, is approximately $3$27 million as of December 31, 20112013 which is determined by taking 105 percent of the liability of the Walker Plans calculated under section 179 of the U.K. Pension Act of 2004 offset by plan assets. We did not record an additional liability in March 2011 for this performance guarantee since Tenneco Walker (U.K.) Limited, as the sponsoring employer of the Walker Plans, already recognizes 100 percent of the pension obligation calculated based on U.S. GAAP, for all of the Walker Plans’ participating employers on its balance sheet, which was $13$10 million and $9$7 million at December 31, 20112013 and 2010,December 31, 2012, respectively. At December 31, 2011,2013, all pension contributions under the Walker Plans were current for all of the Walker Plans’ sponsoring and participating employers. (“Futaba”) which requires Futaba to indemnify TMEL for any cost, loss or liability which TMEL may incur under the performance guarantee agreements.agreements relating to the Futaba-Tenneco U.K. joint venture. The maximum amount reimbursable by Futaba to TMEL under this indemnity agreement is equal to the amount incurred by TMEL under the performance guarantee agreements multiplied by Futaba’s shareholder ownership percentage of the Futaba TennecoFutaba-Tenneco U.K. joint venture. At December 31, 20112013, the maximum amount reimbursable by Futaba to TMEL is approximately $3 million.$5 million.2011,2013, we have guaranteed $58$38 million in letters of credit to support some of our subsidiaries’ insurance arrangements, foreign employee benefit programs, environmental remediation activities and cash management and capital requirements. OE customers whereby the accounts receivable are satisfied through the delivery of negotiable financial instruments. We may collect these financial instruments before their maturity date by either selling them at a discount or using them to satisfy accounts receivable that have previously been sold to a European bank. Any of these financial instruments which are not sold are classified as other current assets. The amount of these financial instruments that was collected before their maturity date and sold at a discount totaled $10$5 million and $6$6 million at December 31, 20112013 and 2010,December 31, 2012, respectively. No negotiable financial instruments were held by our European subsidiary as of December 31, 20112013 and 2010,December 31, 2012, respectively. OE customers and satisfy vendor payments through the receipt and delivery of negotiable financial instruments. Financial instruments usedissued to satisfy vendor payables and not redeemed totaled $14$13 million and $8$12 million at December 31, 20112013 and 2010,December 31, 2012, respectively, and were classified as notes payable. Financial instruments received from OE customers and not redeemed totaled $9$12 million and $11$8 million at December 31, 20112013 and 2010,December 31, 2012, respectively. We classify financialTENNECO INC.NOTES TO CONSOLIDATED FINANCIAL STATEMENTS — (Continued) OE customers as other current assets if issued by a financial institution of our customers or as customer notes and accounts net if issued by our customer. We classified $9$11$8 million in other current assets at December 31, 20112013 and 2010,December 31, 2012, respectively. Some of our Chinese subsidiaries that issue their own negotiable financial instruments to pay vendors are required to maintain a cash balance if they exceed certain credit limits with the financial institution that guarantees those financial instruments. A restricted cash balance was not required at those Chinese subsidiaries at December 31, 2011 and 2010, respectively. OE customers and guaranteed by their banks that are payable at a future date. The use of these instruments for payment follows local commercial practice. Because negotiable financial instruments are financial obligations of our customers and are guaranteed by our customers’ banks, we believe they represent a lower financial risk than the outstanding accounts receivable that they satisfy which are not guaranteed by a bank.7.Income Taxes Year Ended
December 31, 2011 2010 2009 (Millions) $ 55 $ (45) $ (118 ) 216 177 77 $ 271 $ 132 $ (41 ) Year Ended December 31, 2013 2012 2011 (Millions) U.S. income before income taxes $ 150 $ 166 $ 55 Foreign income before income taxes 194 157 216 Income before income taxes and noncontrolling interests $ 344 $ 323 $ 271 Year Ended
December 31, 2011 2010 2009 (Millions) $ — $ — $ (2 ) 2 1 4 91 64 35 93 65 37 — — (18 ) — — (3 ) (5 ) 4 (3 ) (5 ) 4 (24 ) $ 88 $ 69 $ 13 Year Ended December 31, 2013 2012 2011 (Millions) Current — U.S. federal $ 25 $ — $ — State and local 4 4 2 Foreign 81 89 91 110 93 93 Deferred — U.S. federal (4 ) (25 ) — State and local 2 (20 ) — Foreign 14 (29 ) (5 ) 12 (74 ) (5 ) Income tax expense $ 122 $ 19 $ 88 TENNECO INC.NOTES TO CONSOLIDATED FINANCIAL STATEMENTS — (Continued)(35(35 percent for all years presented) to the income tax expense reflected in the statements of income (loss): Year Ended December 31, 2011 2010 2009 (Millions) $ 95 $ 46 $ (14 ) (14 ) (16 ) 14 6 4 4 2 2 2 (11 ) 16 5 (4 ) (5 ) (3 ) (4 ) (2 ) (5 ) 6 5 3 — 4 — — (1 ) 2 3 12 6 3 — — 6 4 (1 ) $ 88 $ 69 $ 13 Year Ended December 31, 2013 2012 2011 (Millions) Income tax expense computed at the statutory U.S. federal income tax rate $ 120 $ 113 $ 95 Increases (reductions) in income tax expense resulting from: Foreign income taxed at different rates (21 ) (21 ) (14 ) Taxes on repatriation of dividends 9 8 6 Remeasurement of estimated tax on unremitted earnings (17 ) — — State and local taxes on income, net of U.S. federal income tax benefit 6 4 2 Changes in valuation allowance for tax loss carryforwards and credits 27 (91 ) (11 ) Foreign tax holidays (5 ) (5 ) (4 ) Investment and R&D tax credits (8 ) (1 ) (4 ) Foreign earnings subject to U.S. federal income tax 5 23 6 Adjustment of prior years taxes (1 ) (5 ) — Impact of tax law changes (3 ) (1 ) — Tax contingencies 6 (6 ) 3 Goodwill impairment — — 3 Other 4 1 6 Income tax expense $ 122 $ 19 $ 88 December 31, 2011 2010 (Millions) $ 41 $ 96 45 43 57 56 45 46 54 52 79 55 3 3 6 6 98 93 (225 ) (247 ) 203 203 65 82 62 54 127 136 $ 76 $ 67 Certain amounts in the 2010 presentation were reclassified to conform to the current year presentation. Year Ended December 31, 2013 2012 (Millions) Deferred tax assets — Tax loss carryforwards: U.S. federal $ — $ — State 23 23 Foreign 78 63 Tax credit benefits 88 51 Postretirement benefits other than pensions 43 50 Pensions 36 87 Bad debts 1 1 Sales allowances 6 6 Payroll and other accruals 132 119 Valuation allowance (135 ) (118 ) Total deferred tax assets 272 282 Deferred tax liabilities — Tax over book depreciation 56 57 Other 51 70 Total deferred tax liabilities 107 127 Net deferred tax assets $ 165 $ 155 20112013 and 20102012 by $53$4 million and $9$47 million, respectively. December 31, 2011 2010 (Millions) $ 40 $ 38 92 92 (5 ) (7 ) (51 ) (56 ) $ 76 $ 67 Year Ended December 31, 2013 2012 (Millions) Balance Sheet: Current portion — deferred tax asset $ 71 $ 72 Non-current portion — deferred tax asset 125 116 Current portion — deferred tax liability shown in other current liabilities (3 ) (6 ) Non-current portion — deferred tax liability (28 ) (27 ) Net deferred tax assets $ 165 $ 155 $225$135 million and $247$118 million at December 31, 20112013 and 2010,2012, respectively, we have potential tax assets that were not recognized on our balance sheet. These unrecognized tax assets resulted primarily from U.S. tax loss carryforwards, foreign tax loss carryforwards, foreign investment tax credits and U.S. state net operating losses that are available to reduce future U.S., U.S. state and foreign tax liabilities.$88$122 million $69, $19 million and $13$88 million in the years endingended 2013, 2012 and 2011, 2010 and 2009, respectively. The tax expense recorded in 20112013 differs from the expense that would be recorded using a U.S. Federal statutory rate of 35 percent primarily due to a net tax benefit of $7 million primarily related to U.S. taxable income with no associated tax expense due to our net operating loss (“NOL”) carryforward and income generated in lower tax rate jurisdictions, partially offset by the impact of recording a valuation allowance against thea tax benefit for lossesrestructuring activities in certain foreign jurisdictionsSpain and Belgium and U.S. taxes on repatriation of dividends, partially offset by tax adjustments related to recognizing a U.S. tax benefit for foreign earnings.2008, given our historical losses in the U.S., we concluded that our ability to fully utilize our NOLs was limited, as we were required to project the continuation2012, after considering all available evidence and all possible sources of the negative economic environment at that time and the impact of the negative operating environment on our tax planning strategies. As a result,taxable income, we recorded a valuation allowance against all of our U.S. deferred$19 million tax assets except for our tax planning strategies which haveTENNECO INC.NOTES TO CONSOLIDATED FINANCIAL STATEMENTS — (Continued)not yet been implemented and which do not depend upon generating future taxable income. We carry deferred tax assets in the U.S. of $90 million, as of December 31, 2011, relating to the expected utilization of those NOLs. The recording of a valuation allowance does not impact the amount of the NOL that would be available for federal and state income tax purposes in future periods. The federal NOLs expire beginning in tax years ending in 2021 through 2029. The state NOLs expire in various tax years through 2029.If our operating performance continues to improve on a sustained basis, our conclusion regarding the need for a U.S. valuation allowance could change, resulting in the reversal of some or all of the valuation allowance in the future. Spain for tax credits that may not be utilized due to tax losses in Spain.charge to establish the U.S. valuation allowance also includes items related to the losses allocable to certain state jurisdictions where it was determined that tax attributes related to those jurisdictions were potentially not realizable. In addition, the charge to establish the U.S. valuation allowance eliminated the need for certain tax reserves which would need to beallowances recorded if the valuation allowance was reversed. If we were to reverse our U.S. valuation allowance as of December 31, 2011, the impact on earnings would approximate $147 million.In prior years, we recorded a valuation allowance against deferred tax assets generated by taxable losses in the U.S. as well asSpain and certain other foreign jurisdictions.jurisdictions will impact our provision for income taxes until the valuation allowances are released. Our provision for income taxes will include no tax benefit with respect tofor losses incurred and no tax expense with respect to income generated in these jurisdictions until the respective valuation allowance is eliminated. In certain foreign jurisdictions, we have recorded a tax benefit on NOLs and tax credits with unlimited lives that are supported by tax actions and forecasted profitability. If the tax actions are not successful or losses are incurred, we may need to record a valuation allowance in a future period. We have recorded net deferred tax assets of approximately $23 million in these jurisdictions as of December 31, 2011. These actions will cause variability in our effective tax rate.$698$858 million at December 31, 2011.2013. We estimated that the amount of U.S. and foreign income taxes that would be accrued or paid upon remittance of the assets that represent those unremitted earnings was $269 million.$159 million. The estimated U.S. and foreign income taxes on unremitted earnings may be impacted in the future if we are unable to claim a U.S. foreign tax credit.periodsto year 2000 and establish indemnity rights on certain tax issues. 2011 2010 2009 (Millions) $ 111 $ 96 $ 83 19 23 17 3 4 16 (10 ) (6 ) — — (2 ) (17 ) (4 ) (4 ) (3 ) $ 119 $ 111 $ 96 2013 2012 2011 (Millions) Uncertain tax positions — Balance January 1 $ 107 $ 119 $ 111 Gross increases in tax positions in current period 15 13 19 Gross increases in tax positions in prior period — 1 3 Gross decreases in tax positions in prior period (1 ) (12 ) (10 ) Gross decreases — settlements — (5 ) — Gross decreases — statute of limitations expired (6 ) (9 ) (4 ) Balance December 31 $ 115 $ 107 $ 119 TENNECO INC.NOTES TO CONSOLIDATED FINANCIAL STATEMENTS — (Continued)both December 31, 2011, and 2010, and $28 million in 2009, of tax benefits, that if recognized, would affect the effective tax rate. We recognize accrued interest and penalties related to unrecognized tax benefits as income tax expense. Related to the uncertain tax positions noted above, we accrued penaltiesPenalties of $2less than $1 million in 2009. No penalties were accrued in 20112013, 2012 and 2010.2011. Additionally, we accrued interest related to uncertain tax positions of $2 million in 2011, less than one$2 million in 2010,2013, less than $1 million in 2012, and zero$2 million in 2009.2011. Our liability for penalties was $2$2 million at 2013, $3 million at December 31, 20112012 and $3$2 million at both December 31, 2010 and 2009,2011, respectively, and our liability for interest was $7$7 million $5, $5 million, and $4$7 million at December 31, 2013, 2012 and 2011, 2010 and 2009, respectively.20112013 and 20102012 included foreign exposures relating to the disallowance of deductions, global transfer pricing and various other issues. We believe it is reasonably possible that a decrease of up to $4$4 million inforeign income tax examinations may occur within the coming year.2011,2013, our tax years open to examination in primary jurisdictions are as follows: Open To Tax
Year — due to NOL19982000 SpainChina 2003 Spain 2003 Germany20062007 Canada20072008 Belgium20092008 2011 Germany 2011 United Kingdom 20102012 8.Common Stock($($0.01 par value) of common stock, of which 62,101,33563,714,728 shares and 61,541,76062,789,382 shares were issued at December 31, 20112013 and 2010,2012, respectively. We held 1,694,6922,844,692 and 1,294,6922,294,692 shares of treasury stock at December 31, 20112013 and 2010,2012, respectively.million.million. Each share underlying an award generally counts as one share against the total plan availability. Eachavailability under the 2009 amendment, each share underlying a full value award (e.g. restricted stock), however, counts as 1.25 shares against the total plan availability. On May 15, 2013 our stockholders approved another amendment to the Tenneco Inc. 2006 Long-Term Incentive Plan to increase the shares of common stock available thereunder by 3.5 million. As part of this amendment, each share underlying a full value award subsequently issued counts as 1.49 shares against total plan availability. As of December 31, 2011,2013, up to 1,569,0253,979,918 shares of our common stock remain authorized for delivery under the 2006 Long-Term Incentive Plan. Our nonqualified stock options have seven to 20 year terms and vest equally over a three-year service period from the date of the grant.TENNECO INC.NOTES TO CONSOLIDATED FINANCIAL STATEMENTS — (Continued)2011,2013, the long-term performance units outstanding included a three-year grant for 2010-2012 (“the 2010 Grant”)2011-2013 payable in the first quarter of 2013 and2014, a three-year grant for 2011-2013 (“the 2011 Grant”)2012-2014 payable in the first quarter of 2014.2015, and a three-year grant for 2013-2015 payable in the first quarter of 2016. Payment is based on the attainment of specified performance goals. Grant value is based on stock price, cumulative EBITDA and free cashflowcash flow metrics. In addition, we have granted SARs to certain key employees in our Asian and Indian operations that are payable in cash after a three-year service period. The grant value is indexed to the stock price.In November 2009, we successfully completed the public offering of 12 million shares of common stock at a price of $16.50 per share. We received $198 million in gross proceeds and approximately $188 million in net proceeds, after expenses from the sales of our common stock. We used the proceeds to repay outstanding borrowings under our revolving credit facility and for general corporate purposes.$3$6 million, $5 million, and $3 millionin each of the three years ended December 31, 2011, 20102013, 2012 and 2009,2011, respectively, related to nonqualified stock options as part of our selling, general and administrative expense. This resulted in a $0.10 decrease in basic and a $0.09 decrease in diluted earnings per share in 2013, aof $0.05 in both 2011 and 2010, and $0.06 in 2009.2011.Westock awarded to employees who are eligible to retire. Whenstock. If employees become eligible to retire during the vesting period, we immediately recognize theany remaining expense associated with their stock options and restricted stock.2011,2013, there was approximately $5$6 million of unrecognized compensation costs related to our stock options awards that we expect to recognize over a weighted average period of 0.71.2 years.$11$17 million $14, $16 million, and $5$11 million for each of the years ended 2011, 20102013, 2012 and 2009,2011, respectively, and was recorded in selling, general, and administrative expense on the consolidated statements of income (loss).$6$15 million in both 20112013, $7 million in 2012, and 2010, and $1$6 million in 2009.2011. Stock option exercises would have generated an excess tax benefit of $4$6 million in 2013 and $10 million in both 20112012 and 2010, and $1 million in 2009. We did not record the excess2011. This tax benefit aswas not recorded because we still have federal net operating losses that have not been utilized.losses which are not currently being utilized. Year Ended December 31, 2011 2010 2009 $ 26.13 $ 11.76 $ 1.34 70.1 % 75.4 % 82.6 % 4.8 4.6 4.5 1.8 % 2.2 % 1.48 % 0.00 % 0.00 % 0.00 % TENNECO INC.NOTES TO CONSOLIDATED FINANCIAL STATEMENTS — (Continued) 2013 2012 2011 Stock Options Granted: Weighted average grant date fair value, per share $ 19.84 $ 17.35 $ 26.13 Weighted average assumptions used: Expected volatility 66.4 % 73.5 % 70.1 % Expected lives 4.9 4.7 4.8 Risk-free interest rates 0.7 % 0.8 % 1.8 % Dividends yields — % — % — % Year Ended December 31, 2011 Shares
Under
Option Weighted Avg.
Exercise
Prices Weighted Avg.
Remaining
Life in
Years Aggregate
Intrinsic
Value (Millions) 3,168,474 $ 14.27 4.3 $ 68 201,133 45.42 (56,046 ) 3.66 (13,184 ) 9.36 (125,624 ) 17.10 3 3,174,753 $ 16.34 4.4 $ 80 2,711 43.51 (23,841 ) 14.26 (82,166 ) 11.50 3 3,071,457 $ 16.51 4.2 $ 76 1,649 44.02 (450 ) 4.03 (115,249 ) 8.94 3 2,957,407 $ 16.83 4.0 $ 54 173 24.97 (10,000 ) 1.57 (17,716 ) 1.82 (186,665 ) 10.19 3 2,743,199 $ 17.43 4.0 $ 37 2,700,577 17.17 4.0 $ 37 2,164,226 $ 15.95 3.9 $ 30 Year Ended December 31, 2013 Shares
Under
Option Weighted Avg.
Exercise
Prices Weighted Avg.
Remaining
Life in Years Aggregate
Intrinsic
Value (Millions) Outstanding Stock Options: Outstanding, January 1, 2013 2,447,475 $ 20.14 4.1 $ 29 Granted 311,539 36.29 Canceled (7,225 ) 11.73 Forfeited (14,920 ) 14.59 Exercised (82,622 ) 19.96 1 Outstanding, March 31, 2013 2,654,247 $ 22.12 4.3 $ 41 Granted 388 38.90 Forfeited (450 ) 21.81 Exercised (393,442 ) 22.53 7 Outstanding, June 30, 2013 2,260,743 $ 22.06 4.7 $ 44 Granted 1,182 35.41 Forfeited (283 ) 8.68 Exercised (147,753 ) 15.42 — Outstanding, September 30, 2013 2,113,889 $ 22.52 4.6 $ 56 Granted — — Canceled — — Forfeited — — Exercised (130,316 ) 16.23 5 Outstanding, December 31, 2013 1,983,573 $ 22.93 4.5 $ 62 2010was $19.86, $17.49 and 2009 was $45.37, $11.84 and $1.34,$26.11, respectively. The total intrinsic value of options exercised during the years ended December 31, 2013, 2012, and 2011 2010was $19 million, $10 million and 2009 was $13$13 million $10 million and $4 million,, respectively. The total fair value of shares vested was $3$5 million, $4 million, and $3 millionin both 20112013, 2012 and 2010, and $4 million in 2009.TENNECO INC.NOTES TO CONSOLIDATED FINANCIAL STATEMENTS — (Continued) Year Ended
December 31, 2011 Shares Weighted Avg.
Grant Date
Fair Value 558,198 $ 11.58 141,036 45.42 (268,891 ) 12.00 (4,822 ) 13.74 425,521 $ 22.51 1,381 43.51 (3,851 ) 15.47 (7,190 ) 23.82 �� 415,861 $ 22.62 1,042 44.02 (3,206 ) 15.41 (158 ) 1.86 413,539 $ 22.74 109 24.97 (5,735 ) 29.92 (162 ) 1.87 407,751 $ 22.64 Year Ended December 31, 2013 Shares Weighted Avg.
Grant Date
Fair ValueNonvested Restricted Shares Nonvested balance at January 1, 2013 348,918 $ 31.69 Granted 204,731 36.28 Vested (154,160 ) 29.54 Forfeited — — Nonvested balance at March 31, 2013 399,489 $ 34.88 Granted 226 38.90 Vested (15,289 ) 35.40 Forfeited — — Nonvested balance at June 30, 2013 384,426 $ 34.86 Granted 2,223 46.91 Vested (16,255 ) 35.58 Forfeited — — Nonvested balance at September 30, 2013 370,394 $ 34.90 Granted — — Vested (2,126 ) 34.93 Forfeited — — Nonvested balance at December 31, 2012 368,268 $ 34.90 2011,2013, approximately $5$6 million of total unrecognized compensation costs related to restricted stock awards is expected to be recognized over a weighted-average period of approximately 1.81.7 years.2010was $36.40, $30.06, and 2009 was $45.38, $19.60 and $2.02,$45.38, respectively. The total fair value of restricted shares vested was $3$6 million in 20112013, $5 million in 2012 and $2$3 million in both 2010 and 2009.May 2011,January 2012, our Board of Directors approved a share repurchase program, authorizing us to repurchase up to 600,000 shares of our outstanding common stock over a 12 months period. This share repurchase program was intended to offset dilution from shares of restricted stock and stock options issued in 2012 to employees. We purchased all of the 600,000 shares during the second quarter of 2012 through open market purchases, which were funded through cash from operations, at a total cost of $18 million, at an average price of $29.22 per share. These repurchased shares are held as part of our treasury stock which increased to 2,294,692 shares at December 31, 2012 from 1,694,692 shares at December 31, 2011.was intended to offset dilution from shares of restricted stock and stock options that were issued in 2011 to employees. We purchased all of the 400,000 shares through open market purchases, which were funded through cash from operations, as of August 3, 2011 at a total cost of $16 million through this program. These repurchased shares are held as part of our treasury stock which increased to 1,694,692 shares at December 31, 2011 from 1,294,692 shares at December 31, 2010.In January 2012, our Board of Directors approved a share repurchase program, authorizing our company to repurchase up to 600,000 shares of the Company’s outstanding common stock over a 12 month period. This share repurchase program is intended to offset dilution from shares of restricted stock and stock options issued in 20122014 to employees.TENNECO INC.NOTES TO CONSOLIDATED FINANCIAL STATEMENTS — (Continued)2011, $72013, $13 million of total unrecognized compensation costs is expected to be recognized over a weighted-average period of approximately 1.2 years.9.Preferred Stock($($0.01 par value) authorized at December 31, 20112013 and 2010,2012, respectively. No shares of preferred stock were outstanding at those dates.10.Pension Plans, Postretirement and Other Employee Benefits$784$863 million benefit obligation at December 31, 2011,2013, approximately $710$779 million required funding under applicable federal and foreign laws. At December 31, 2011,2013, we had approximately $529$726 million in assets to fund that obligation. The balance of our benefit obligation, $74$84 million, did not require funding under applicable federal or foreign laws and regulations. Pension plan assets were invested in the following classes of securities: Percentage of Fair Market Value December 31,
2011 December 31,
2010 US Foreign US Foreign 70 % 53 % 71 % 57 % 29 % 40 % 28 % 36 % — 2 % — 2 % 1 % 5 % 1 % 5 % Percentage of Fair Market Value December 31, 2013 December 31, 2012 US Foreign US Foreign Equity Securities 71 % 62 % 70 % 59 % Debt Securities 29 % 31 % 30 % 33 % Real Estate — 2 % — 2 % Other — 5 % — % 6 % TENNECO INC.NOTES TO CONSOLIDATED FINANCIAL STATEMENTS — (Continued)20112013 and 2010,2012, respectively. The fair value hierarchy has three levels based on the methods used to determine the fair value. Level 1 assets refer to those asset values based on quoted market prices in active markets for identical assets at the measurement date. Level 2 assets refer to assets with values determined using significant other observable inputs, and Level 3 assets include values determined with non-observable inputs. Fair Value Level as of December 31, 2011 US Foreign Level 1 Level 2 Level 3 Level 1 Level 2 Level 3 (Millions) $ 24 $ 102 $ — $ 23 $ 9 $ — — — — — 2 — — 18 — — 1 — — — — 26 63 — — 17 — 3 19 — — — — — 5 — — 5 — 1 — — — 4 — — — — — 67 — — — — — — — 37 35 — — — — 17 20 — — — — — 3 — — — — 1 — — — — — — 3 — — — — — 1 — — — — — 5 — — — — — 7 6 2 — — 3 — — $ 26 $ 213 $ — $ 111 $ 173 $ 6 Fair Value Level as of December 31, 2010 US Foreign Level 1 Level 2 Level 3 Level 1 Level 2 Level 3 (Millions) $ 33 $ 96 $ — $ 25 $ 7 $ — — — — — 1 — — 18 — — 1 — — 18 — 36 65 — — — — — 19 — — — — — 8 — — 6 — 1 — — 20 — — — — — — 20 — — — — — 24 — — — — — 1 — — — — — 4 — — — — — 1 — 59 5 — — 1 — 15 21 — — — — — — 6 — — — — 5 — — — — — 7 — — — — 6 — — $ 53 $ 189 $ — $ 142 $ 139 $ 6 Fair Value Level as of December 31, 2013 US Foreign Asset Category Level 1 Level 2 Level 3 Level 1 Level 2 Level 3 (Millions) Equity securities: U.S. large cap $ 41 $ 143 $ — $ 31 $ 21 $ — U.S. mid cap — — — 4 4 — U.S. Small Cap — 27 — — — — Non-U.S. large cap — — — 57 71 — Non-U.S. mid cap — 27 — 20 19 — Non-U.S. small cap — — — 1 7 — Emerging markets — 8 — — 4 — Debt securities: U.S. corporate bonds — 5 — — 4 — U.S. other fixed income — 96 — — — — Non-U.S. treasuries/government bonds — — — 35 25 — Non-U.S. corporate bonds — — — 18 18 — Non-U.S. mortgage backed securities — — — — 4 — Non-U.S. municipal obligations — — — 1 — — Non-U.S. asset backed securities — — — — 3 — Non-U.S. other fixed income — — — 1 2 — Real Estate: Non-U.S. real estate — — — 1 5 — Other: Insurance contracts — — — — 9 8 Cash held in bank accounts — — — 6 — — Total $ 41 $ 306 $ — $ 175 $ 196 $ 8 Fair Value Level as of December 31, 2012 US Foreign Asset Category Level 1 Level 2 Level 3 Level 1 Level 2 Level 3 (Millions) Equity securities: U.S. large cap $ 29 $ 117 $ — $ 26 $ 15 $ — U.S. mid cap — — — 2 5 — U.S. Small Cap — 20 — — — — Non-U.S. large cap — — — 48 63 — Non-U.S. mid cap — 20 — 13 16 — Non-U.S. small cap — — — 1 4 — Emerging markets — 7 — 2 1 — Debt securities: U.S. treasuries/government bonds — — — — — — U.S. corporate bonds — 4 — — — — U.S. mortgage backed securities — — — — — — U.S. asset backed securities — — — — — — U.S. other fixed income — 78 — — — — Non-U.S. treasuries/government bonds — — — 36 24 — Non-U.S. corporate bonds — — — 18 24 — Non-U.S. mortgage backed securities — — — — 3 — Non-U.S. municipal obligations — — — 1 — — Non-U.S. asset backed securities — — — — 3 — Non-U.S. other fixed income — — — 1 — — Real Estate: Non-U.S. real estate — — — 1 5 — Other: Insurance contracts — — — — 8 8 Cash held in bank accounts — — — 4 — — Total $ 29 $ 246 $ — $ 153 $ 171 $ 8 December 31,
2011 December 31,
2010 Level 3 Assets Level 3 Assets US Foreign US Foreign (Millions) (Millions) $ — $ 6 $ — $ 6 — — — — $ — $ 6 $ — $ 6 December 31, 2013 December 31, 2012 Level 3 Assets Level 3 Assets US Foreign US Foreign (Millions) (Millions) Balance at December 31 of the previous year $ — $ 8 $ — $ 6 Actual return on plan assets: Relating to assets still held at the reporting date — — — 2 Ending Balance at December 31 $ — $ 8 $ — $ 8 TENNECO INC.NOTES TO CONSOLIDATED FINANCIAL STATEMENTS — (Continued)5%5 percent of the total assets and any direct investments in Tenneco stock: Fair Value Level Value Percentage of
Total Assets (Millions) 1 $ 24 4.6 % 1 $ 34 6.3 % Asset Category Fair Value Level Value Percentage of
Total Assets (Millions) 2013: Tenneco Stock 1 $ 41 5.6 % 2012: Tenneco Stock 1 $ 29 4.7 % TENNECO INC.NOTES TO CONSOLIDATED FINANCIAL STATEMENTS — (Continued) Pension Postretirement 2011 2010 2011 2010 US Foreign US Foreign US US (Millions) $ 354 $ 361 $ 341 $ 333 $ 135 $ 142 — (6 ) — (3 ) — — — (4 ) — (2 ) — — 1 6 1 5 1 1 20 19 20 19 7 8 — (1 ) — (1 ) — — — — — 1 — — 56 8 22 21 5 (7 ) (17 ) (15 ) (30 ) (15 ) (8 ) (9 ) — 2 — 3 — — $ 414 $ 370 $ 354 $ 361 $ 140 $ 135 $ 242 $ 287 $ 199 $ 262 $ — $ — — (4 ) — (1 ) — — — (4 ) — (2 ) — — (7 ) — 40 20 — — 21 24 33 20 9 9 — — — — (1 ) — — 2 — 3 — — (17 ) (15 ) (30 ) (15 ) (8 ) (9 ) $ 239 $ 290 $ 242 $ 287 $ — $ — $ (175 ) $ (80 ) $ (112 ) $ (74 ) $ (140 ) $ (135 ) 248 138 165 120 64 63 1 9 2 11 (29 ) (35 ) $ 74 $ 67 $ 55 $ 57 $ (105 ) $ (107 ) $ — $ — $ — $ 1 $ — $ — (3 ) (2 ) (3 ) (3 ) (9 ) (10 ) (172 ) (78 ) (109 ) (72 ) (131 ) (125 ) $ (175 ) $ (80 ) $ (112 ) $ (74 ) $ (140 ) $ (135 ) Pension Postretirement 2013 2012 2013 2012 US Foreign US Foreign US US (Millions) Change in benefit obligation: Benefit obligation at December 31 of the previous year $ 461 $ 431 $ 414 $ 370 $ 131 $ 140 Currency rate conversion — (2 ) — 13 — — Settlement — (1 ) — (4 ) — — Curtailment — (1 ) Service cost 1 9 1 7 — — Interest cost 19 17 20 18 5 6 Administrative expenses/taxes paid — (2 ) — (1 ) — — Plan amendments — 1 — — — — Actuarial (gain)/loss (41 ) 6 44 42 (16 ) (6 ) Benefits paid (19 ) (18 ) (18 ) (16 ) (8 ) (9 ) Participants’ contributions — 2 — 2 — — Benefit obligation at December 31 $ 421 $ 442 $ 461 $ 431 $ 112 $ 131 Change in plan assets: Fair value at December 31 of the previous year $ 275 $ 332 $ 239 $ 290 $ — $ — Currency rate conversion — (3 ) — 11 — — Settlement — (1 ) — (4 ) — — Actual return on plan assets 60 43 28 27 — — Administrative expenses/taxes paid — (2 ) — — — — Employer contributions 31 26 26 22 8 10 Prescription drug subsidy received — — — — — (1 ) Participants’ contributions — 2 — 2 — — Benefits paid (19 ) (18 ) (18 ) (16 ) (8 ) (9 ) Fair value at December 31 $ 347 $ 379 $ 275 $ 332 $ — $ — Development of net amount recognized: Unfunded status at December 31 $ (74 ) $ (62 ) $ (186 ) $ (99 ) $ (112 ) $ (131 ) Unrecognized cost: Actuarial loss 190 137 278 168 32 52 Prior service cost/(credit) 1 7 1 8 (16 ) (22 ) Net amount recognized at December 31 $ 117 $ 82 $ 93 $ 77 $ (96 ) $ (101 ) Amounts recognized in the balance sheets as of December 31 Noncurrent assets — 11 — — — — Current liabilities (6 ) (2 ) (3 ) (2 ) (8 ) (8 ) Noncurrent liabilities (68 ) (71 ) (183 ) (97 ) (104 ) (123 ) Net amount recognized $ (74 ) $ (62 ) $ (186 ) $ (99 ) $ (112 ) $ (131 ) (income) for the years 2011, 2010,2013, 2012 and 2009,2011, consist of the following components: 2011 2010 2009 US Foreign US Foreign US Foreign (Millions) $ 1 $ 6 $ 1 $ 5 $ 1 $ 4 20 19 20 19 20 18 (23 ) (20 ) (21 ) (19 ) (22 ) (19 ) — — — — 1 — — 1 6 — 2 — 4 5 3 3 2 2 — 2 — 2 1 2 $ 2 $ 13 $ 9 $ 10 $ 5 $ 7 2013 2012 2011 US Foreign US Foreign US Foreign (Millions) Service cost — benefits earned during the year $ 1 $ 9 $ 1 $ 7 $ 1 $ 6 Interest cost 19 17 20 18 20 19 Expected return on plan assets (22 ) (20 ) (22 ) (20 ) (23 ) (20 ) Curtailment loss — — — — — — Settlement loss — 1 — 1 — 1 Net amortization: Actuarial loss 9 10 7 7 4 5 Prior service cost — 1 — 2 — 2 Net pension costs $ 7 $ 18 $ 6 $ 15 $ 2 $ 13 2011 2010 US Foreign US Foreign (Millions) $ 248 $ 138 $ 165 $ 120 1 9 2 11 $ 249 $ 147 $ 167 $ 131 2013 2012 US Foreign �� US Foreign (Millions) Net actuarial loss $ 190 $ 137 $ 278 $ 168 Prior service cost 1 7 1 8 $ 191 $ 144 $ 279 $ 176 Year Ended December 31, 2013 2012 Before-Tax
Amount Tax
Benefit Net-of-Tax
Amount Before-Tax
Amount Tax
Benefit Net-of-Tax
Amount (Millions) Defined benefit pension and postretirement plans: Change in total actuarial loss $ 113 $ (41 ) $ 72 $ (66 ) $ 22 $ (44 ) Amortization of prior service cost included in net periodic pension and postretirement cost (5 ) 2 (3 ) (4 ) 2 (2 ) Amortization of actuarial loss included in net periodic pension and postretirement cost 23 (7 ) 16 20 (6 ) 14 Other comprehensive income — pension benefits $ 131 $ (46 ) $ 85 $ (50 ) $ 18 $ (32 ) 2012,2014, we expect to recognize the following amounts, which are currently reflected in accumulated other comprehensive loss, as components of net periodic benefit cost: 2012 US Foreign (Millions) $ 6 $ 7 — 1 $ 6 $ 8 TENNECO INC.NOTES TO CONSOLIDATED FINANCIAL STATEMENTS — (Continued) 2014 US Foreign (Millions) Net actuarial loss $ 7 $ 7 Prior service cost — 1 $ 7 $ 8 20112013 and 20102012 were as follows: December 31,
2011 December 31,
2010 US Foreign US Foreign (Millions) $ 414 $ 363 $ 354 $ 332 414 355 352 328 239 284 242 257 December 31, 2013 December 31, 2012 US Foreign US Foreign (Millions) Projected benefit obligation $ 421 $ 289 $ 461 $ 400 Accumulated benefit obligation 421 286 461 389 Fair value of plan assets 347 218 275 301 US Foreign (Millions) $ 19 $ 16 24 15 22 16 20 17 20 18 122 100 Year US Foreign (Millions) 2014 $ 24 $ 17 2015 21 17 2016 21 19 2017 28 18 2018 22 19 2019-2022 131 140 2011, 2010,2013, 2012, and 2009: 2011 2010 US Foreign US Foreign 4.8 % 4.9 % 5.6 % 5.4 % N/A 3.5 % N/A 3.5 % 2011 2010 2009 US Foreign US Foreign US Foreign 5.6 % 5.4 % 6.1 % 6.0 % 6.2 % 6.3 % 8.3 % 6.4 % 8.3 % 6.9 % 8.8 % 7.3 % N/A 3.5 % N/A 3.5 % N/A 3.1 % 2013 2012 US Foreign US Foreign Weighted-average assumptions used to determine benefit obligations Discount rate 4.8 % 4.3 % 4.1 % 4.2 % Rate of compensation increase N/A 3.3 % N/A 3.4 % 2013 2012 2011 US Foreign US Foreign US Foreign Weighted-average assumptions used to determine net periodic benefit cost Discount rate 4.1 % 4.2 % 4.8 % 4.9 % 5.6 % 5.4 % Expected long-term return on plan assets 7.8 % 6.2 % 8.3 % 6.3 % 8.3 % 6.4 % Rate of compensation increase N/A 3.4 % N/A 3.5 % N/A 3.5 % $45$57 million to our pension plans during 2011.2013. Based on current actuarial estimates, we believe we will be required to make contributions of $48$47 million to those plans during 2012.2014. Pension contributions beyond 20122014 will be required, but those amounts will vary based upon many factors, including the performance of our pension fund investments during 2012.us after attaining age 45.us. For hourly employees, the postretirement benefit plans generally cover employees who retire according to one of ourTENNECO INC.NOTES TO CONSOLIDATED FINANCIAL STATEMENTS — (Continued)2011, 2010,2013, 2012, and 2009,2011, consists of the following components: 2011 2010 2009 (Millions) $ 1 $ 1 $ 1 7 8 8 4 4 5 (6 ) (6 ) (6 ) $ 6 $ 7 $ 8 2013 2012 2011 (Millions) Service cost — benefits earned during the year $ — $ 1 $ 1 Interest on accumulated postretirement benefit obligation 5 6 7 Net amortization: Actuarial loss 4 5 4 Prior service credit (6 ) (6 ) (6 ) Net periodic postretirement benefit cost $ 3 $ 6 $ 6 2012,2014, we expect to recognize the following amounts, which are currently reflected in accumulated other comprehensive loss, as components of net periodic benefit cost: 2012 (Millions) $ 5 (6 ) $ (1 ) 2014 (Millions) Net actuarial loss $ 2 Prior service credit (6 ) $ (4 ) Postretirement
Benefits (Millions) 9 10 10 10 10 48 TENNECO INC.NOTES TO CONSOLIDATED FINANCIAL STATEMENTS — (Continued)The following estimatedYear Postretirement
Benefits (Millions) 2014 $ 8 2015 8 2016 8 2017 8 2018 8 2019-2022 38 Act are expected to be received: Postretirement
Benefits (Millions) 1 1 1 1 1 4 20112013 accumulated postretirement benefit obligation was 7.0 percent, declining to 4.5 percent by 2019. For 2012, the health care cost trend rate was 7.5 percent declining to 4.5 percent by 2019 and for 2011, the health care cost trend rate was 8.0 percent declining to 4.5 percent by 2019. The health care cost trend rate was 7.5 percent for 2010 and 8.3 percent in 2009, declining to five percent over succeeding periods.2011, 20102013, 2012 and 2009: 2011 2010 4.8 % 5.6 % N/A N/A 2011 2010 2009 5.6 % 6.1 % 6.2 % N/A N/A 4.0 % 2013 2012 Weighted-average assumptions used to determine benefit obligations Discount rate 4.8 % 4.1 % Rate of compensation increase N/A N/A 2013 2012 2011 Weighted-average assumptions used to determine net periodic benefit cost Discount rate 4.1 % 4.8 % 5.6 % Rate of compensation increase N/A N/A N/A 20112013 assumed health care cost trend rates would increase total service and interest cost by less than $1$1 million and would increase the postretirement benefit obligation by $10 million.$8 million. A one-percentage-point decrease in the 20112013 assumed health care cost trend rates would decrease the total service and interest cost by less than $1$1 million and decrease the postretirement benefit obligation by $8 million.$7 million.$9$8 million during 2012.We have established2014.PlansPlan for Hourly Employees and the benefit of U.S. employees.Tenneco Employee Stock Ownership Plan for Salaried Employees were merged into one plan called the Tenneco 401(k) Retirement Savings Plan (the “Retirement Savings Plan”). Under the plans,plan, subject to limitations in the Internal Revenue Code, participants may elect to defer up to 75 percent of their salary through contributions to the plan, which are invested in selected mutual funds or used to buy our common stock. We match in cash 100 percent on the first three percent and 50 percent on the next two percent of each employee’s contribution up to eight percent of the employee’s salary. In 2009, we temporarily discontinued these matching contributions, as a result of the global economic downturn that began in 2008. We restored the matching contributions to salaried and non-union hourly U.S. employees beginning on January 1, 2010.employee contributions. In connection with freezing the defined benefit pension plans for nearly all U.S. based salaried and non-union hourly employees effective December 31, 2006, and the related replacement of those defined benefit plans with defined contribution plans, we are making additional contributions to the Employee Stock Ownership Plans. We recorded expense for these contributions of approximately $18$23 million $17, $21 million and $10$18 million in 2011, 20102013, 2012 and 2009,2011, respectively. Matching contributions vest immediately. Defined benefit replacement contributions fully vest on the employee’s third anniversary of employment.Effective January 1, 2012, the Tenneco Employee Stock Ownership Plan for Hourly Employees and the Tenneco Employee Stock Ownership Plan for Salaried Employees were merged into one plan called the Tenneco 401(k) Retirement Savings Plan (the “Retirement Savings Plan”). The Retirement Savings Plan has been designed to adopt a Safe-Harbor approach approved by the Internal Revenue Service and which will provide for increased company matching contributions at lower percentages of employee deferrals. The company matching contribution will increase from 50 percent on the first eight percent of employee contributions to 100 percent on the first three percent and 50 percent on the next two percent of employee contributions.11.Segment and Geographic Area InformationWe are a global manufacturer with three geographic reportable segments: (1) North America, (2) Europe, South America and India (“Europe”), and (3) Asia Pacific. Each segment manufactures and distributes ride control and emission control products primarily for the automotive industry. We have not aggregated individual operating segments within these reportable segments. We evaluate segment performance based primarily on earnings before interest expense, income taxes, and noncontrolling interests. Products are transferred between segments and geographic areas on a basis intended to reflect as nearly as possible the “market value” of the products.TENNECO INC.NOTES TO CONSOLIDATED FINANCIAL STATEMENTS — (Continued)Segment results for 2011, 2010, and 2009 are as follows: Segment North
America Europe Asia
Pacific Reclass &
Elims Consolidated (Millions) $ 3,414 $ 3,013 $ 778 $ — $ 7,205 12 156 26 (194 ) — — 3 1 — 4 95 88 24 — 207 216 125 38 — 379 1,419 1,326 567 25 3,337 — 9 — — 9 88 95 35 — 218 6 12 11 — 29 $ 2,821 $ 2,446 $ 670 $ — $ 5,937 11 148 28 (187 ) — — 3 1 — 4 109 86 21 — 216 155 76 50 — 281 1,281 1,337 525 24 3,167 — 9 — — 9 59 66 29 — 154 4 6 — — 10 $ 2,092 $ 2,047 $ 510 $ — $ 4,649 7 162 15 (184 ) — — 3 1 — 4 113 89 19 — 221 42 20 30 — 92 1,102 1,338 391 10 2,841 — 12 — — 12 45 58 15 — 118 8 (1 ) 1 — 8 TENNECO INC.NOTES TO CONSOLIDATED FINANCIAL STATEMENTS — (Continued) Clean Air Division Ride Performance Division North
AmericaEurope, South America & India Asia
PacificNorth
AmericaEurope, South America & India Asia
PacificOther Reclass & Elims Total (Millions) At December 31, 2013, and for the Year Ended Revenues from external customers $ 2,659 $ 1,933 $ 852 $ 1,255 $ 1,046 $ 219 $ — $ — $ 7,964 Intersegment revenues 7 112 1 10 41 32 — (203 ) — EBIT, Earnings (loss) before interest expense, income taxes, and noncontrolling interests 229 57 84 124 (7 ) 22 (85 ) — 424 Total assets 1,030 827 544 628 552 213 — 36 3,830 At December 31, 2012, and for the Year Ended Revenues from external customers 2,506 1,726 694 1,213 1,041 183 — — 7,363 Intersegment revenues 6 101 1 10 53 30 — (201 ) — EBIT, Earnings (loss) before interest expense, income taxes, and noncontrolling interests 202 54 71 122 41 5 (67 ) — 428 Total assets 1,029 725 435 593 600 202 — 24 3,608 At December 31, 2011, and for the Year Ended Revenues from external customers $ 2,288 $ 1,849 $ 624 $ 1,126 $ 1,164 $ 154 $ — $ — $ 7,205 Intersegment revenues 3 104 — 9 52 26 — (194 ) — EBIT, Earnings (loss) before interest expense, income taxes, and noncontrolling interests 172 79 47 76 69 (6 ) (58 ) — 379 Total assets 889 719 386 530 607 181 — 25 3,337 Net Sales
Year Ended December 31, 2011 2010 2009 (Millions) $ 351 $ 318 $ 315 2,732 2,223 1,638 1,678 1,284 966 4,410 3,507 2,604 4,761 3,825 2,919 944 851 721 1,500 1,261 1,009 2,444 2,112 1,730 $ 7,205 $ 5,937 $ 4,649 Net Sales
Year Ended December 31, 2013 2012 2011 (Millions) Clean Air Systems & Products Aftermarket $ 327 $ 318 $ 351 Original Equipment OE Value-add 3,282 2,948 2,732 OE Substrate 1,835 1,660 1,678 5,117 4,608 4,410 5,444 4,926 4,761 Ride Performance Systems & Products Aftermarket 953 944 944 Original Equipment 1,567 1,493 1,500 2,520 2,437 2,444 Total Revenues $ 7,964 $ 7,363 $ 7,205 any of the last three years. 2011 2010 2009 19 % 19 % 16 % 15 % 13 % 14 % Customer 2013 2012 2011 General Motors 15 % 17 % 19 % Ford 14 % 15 % 15 % Geographic Area United
States Germany Canada China Other
Foreign(a) Reclass &
Elims Consolidated (Millions) $ 2,795 $ 826 $ 343 $ 567 $ 2,674 $ — $ 7,205 359 110 57 104 530 — 1,160 1,280 347 163 387 1,251 (91 ) 3,337 $ 2,275 $ 616 $ 327 $ 473 $ 2,246 $ — $ 5,937 352 109 64 76 564 — 1,165 1,147 322 149 321 1,308 (80 ) 3,167 $ 1,531 $ 559 $ 416 $ 361 $ 1,782 $ — $ 4,649 373 116 75 61 604 — 1,229 984 409 125 249 1,153 (79 ) 2,841 Geographic Area United
States Germany Canada China Other
Foreign(a) Reclass &
Elims Consolidated (Millions) At December 31, 2013, and for the Year Then Ended Revenues from external customers(b) $ 3,144 $ 941 $ 387 $ 875 $ 2,617 $ — $ 7,964 Long-lived assets(c) 448 120 59 158 531 — 1,316 Total assets 1,552 358 182 602 1,326 (190 ) 3,830 At December 31, 2012, and for the Year Then Ended Revenues from external customers(b) $ 2,975 $ 817 $ 389 $ 661 $ 2,521 $ — $ 7,363 Long-lived assets(c) 429 115 57 139 521 — 1,261 Total assets 1,521 344 168 448 1,307 (180 ) 3,608 At December 31, 2011, and for the Year Then Ended Revenues from external customers(b) $ 2,795 $ 826 $ 343 $ 567 $ 2,674 $ — $ 7,205 Long-lived assets(c) 359 110 57 104 530 — 1,160 Total assets 1,280 347 163 387 1,251 (91 ) 3,337 Note:(a) (b) Revenues are attributed to countries based on location of the shipper. (c) Long-lived assets include all long-term assets except goodwill, intangibles and deferred tax assets. 12.Commitments and Contingencies$80$100 million will be required after December 31, 20112013 to complete facilities and projects authorized at such date, and we have made substantial commitments in connection with these facilities and projects.$33$40 million in 2012, $24 million in 2013, $17 million in 2014, $10$30 million in 2015, $21 million in 2016, $15 million in 2017, and $8$11 million in both 20162018 and$25 million in subsequent years. The minimum lease payments under our non-cancelable capital leases with lease terms in excess of one year are less than $1$1 million in each of the next five years. Total rental expense for the year 2013, 2012 and 2011 2010was $58 million, $55 million and 2009 was $52$52 million $45 million and $43 million,, respectively.obligations thatobligations. These matters are typically incidental to the conduct of our business and create the potential for contingent losses. We accrue for potential contingent losses when our review of available facts indicates that it is probable a loss has been incurred and the amount of the loss is reasonably estimable. Each quarter we assess our loss contingencies based upon currently available facts, existing technology, and presently enacted laws and regulations taking into consideration the likely effects of inflation and other societal and economic factors and record adjustments to these reserves as required. As an example, we consider all available evidence including prior experience in remediation of contaminated sites, other companies’ cleanup experiences and data released by the United States Environmental Protection Agency or other organizations when we evaluate our environmental remediation contingencies. Further, all of our loss contingency estimates are subject to revision in future periods based on actual costs or new information. With respect to our environmental liabilities, where future cash flows are fixed or reliably determinable, we have discounted those liabilities. All other environmental liabilities are recorded at their undiscounted amounts. We evaluate recoveries separately from the liability and, when they are assured, recoveries are recorded and reported separately from the associated liability in our consolidated financial statements.2011,2013, we have the obligation to remediate or contribute towards the remediation of certain sites, including one Federal Superfund site. At December 31, 2011,2013, our aggregated estimated share of environmental remediation costs for all these sites on a discounted basis was approximately $17$15 million, of which $5$3 million is recorded in other current liabilities and $12$12 million is recorded in deferred credits and other liabilities in our consolidated balance sheet. For those locations in whichwhere the liability was discounted, the weighted average discount rate used was 1.9 percent.2.8 percent. The undiscounted value of the estimated remediation costs was $20 million.$19 million. Our expected payments of environmental remediation costs are estimated to be approximately $3 million in 2014, $1 million each year beginning 2015 through 2018 and $12 million in aggregate thereafter. Based on information known to us, we have established reserves that we believe are adequate for these costs. Although we believe these estimates of remediation costs are reasonable and are based on the latest available information, the costs are estimates and are subject to revision as more information becomes available about the extent of remediation is required. At some sites, we expect that other parties will contribute towards the remediation costs. In addition, certain environmental statutes provide that our liability could be joint and several, meaning that we could be required to pay in excess of our share of remediation costs. Our understanding of the financial strength of other potentially responsible parties at these sites has been considered, where appropriate, in our determination of our estimated liability. We do not believe that any potential costs associated with our current status as aTENNECO INC.NOTES TO CONSOLIDATED FINANCIAL STATEMENTS — (Continued)proceedings allegematters involve allegations of damages against us relating to environmental liabilities (including toxic tort, property damage and remediation), intellectual property matters (including patent, trademark and copyright infringement, and licensing disputes), personal injury claims (including injuries due to product failure, design or warning issues, and other product liability related matters), taxes, employment matters, and commercial or contractual disputes, sometimes related to acquisitions or divestitures. Some of these matters involve allegations relating to legal compliance. For example, one of our Argentine subsidiaries is currently defending against a criminal complaint alleging the failure to comply with laws requiring the proceeds of export transactions to be collected, reported and/or converted to local currency within specified time periods. As another example, in the U.S. we are subject to an audit in 11 states with respect to the payment of unclaimed property to those states, spanning a period as far backWe now have practices in place whichWhile we believe ensure that we pay unclaimed property as required. We vigorously defend ourselves against all of these claims. Inclaims, in future periods we could be subject to cash costs or charges to earnings if any of these matters are resolved on unfavorable terms. However, althoughAlthough the ultimate outcome of any legal matter cannot be predicted with certainty, based on current information, including our assessment of the merits of the particular claim, we do not expect that thesethe legal proceedings or claims currently pending against us will have any material adverse impact on our future consolidated financial position, results of operations or cash flows. a number of lawsuits initiated by a significant number of claimants alleging health problems as a result of exposure to asbestos. In the early 2000’s we were named in nearly 20,000 complaints, most of which were filed in Mississippi state court and the vast majority of which made no allegations of exposure to asbestos from our product categories. Most of these claims have been dismissed and our current docket of active and inactive cases is less than 500 cases nationwide. A small number of claims have been asserted by railroad workers alleging exposure to asbestos products in railroad cars manufactured by The Pullman Company, one of our subsidiaries. The balancesubstantial majority of the remaining claims isare related to alleged exposure to asbestos in our automotive products. Only a small percentage of the claimants allege that they were automobile mechanics and a significant number appear to involve workers in other industries or otherwise do not include sufficient information to determine whether there is any basis for a claim against us. We believe, based on scientific and other evidence, it is unlikely that mechanics were exposed to asbestos by our former products and that, in any event, they would not be at increased risk of asbestos-related disease based on their work with these products. Further, many of these cases involve numerous defendants, with the number of each in some cases exceeding 100 defendants from a variety of industries. Additionally, the plaintiffs either do not specify any, or specify the jurisdictional minimum, dollar amount for damages. As major asbestos manufacturers and/or users continue to go out of business or file for bankruptcy, we may experience an increased number of these claims. We vigorously defend ourselves against these claims as part of our ordinary course of business. In future periods, we could be subject to cash costs or charges to earnings if any of these matters are resolved unfavorably to us. To date, with respect to claims that have proceeded sufficiently through the judicial process, we have regularly achieved favorable resolutions. Accordingly, we presently believe that these asbestos-related claims will not have a material adverse impact on our future consolidated financial condition, results of operations or cash flows.TENNECO INC.NOTES TO CONSOLIDATED FINANCIAL STATEMENTS — (Continued) Year Ended
December 31, 2011 2010 2009 (Millions) $ 33 $ 32 $ 27 11 19 18 (18 ) (18 ) (13 ) $ 26 $ 33 $ 32 Year Ended
December 31, 2013 2012 2011 (Millions) Beginning Balance $ 23 $ 26 $ 33 Accruals related to product warranties 20 15 11 Reductions for payments made (19 ) (18 ) (18 ) Ending Balance $ 24 $ 23 $ 26 controlperformance business involving struts supplied on one particular OE platform. As a result, we directly incurred approximately $2 million in premium freight and overtime costs. We are continuing to work through detailscosts in the fourth quarter of 2011 and $3 million in 2012. In the first quarter of 2013 we incurred a charge of $2 million in connection with the resolution of all existing claims pertaining to this matter. We paid the customer to determine responsibility for any other costs associated with this issue. We cannot estimate the amount$2 million in the second quarter of these costs at this time, but do not believe they will be material to our annual operating results.13.Supplemental Guarantor Condensed Consolidating Financial Statements 2015, 2018 and 2020 on a joint and several basis. However, a subsidiary’s guarantee may be released in certain customary circumstances such as a sale of the subsidiary or all or substantially all of its assets in accordance with the indenture applicable to the notes. The Guarantor Subsidiaries are combined in the presentation below. For the Year Ended December 31, 2013 Guarantor
Subsidiaries Nonguarantor
Subsidiaries Tenneco Inc.
(Parent
Company) Reclass
& Elims Consolidated (Millions) Revenues Net sales and operating revenues — External $ 3,498 $ 4,466 $ — $ — $ 7,964 Affiliated companies 350 572 — (922 ) — 3,848 5,038 — (922 ) 7,964 Costs and expenses Cost of sales (exclusive of depreciation and amortization shown below) 3,103 4,553 — (922 ) 6,734 Goodwill impairment charge — — — — — Engineering, research, and development 66 78 — — 144 Selling, general, and administrative 187 260 6 — 453 Depreciation and amortization of other intangibles 78 127 — — 205 3,434 5,018 6 (922 ) 7,536 Other income (expense) Loss on sale of receivables — (4 ) — — (4 ) Other income (expense) (1 ) 59 — (58 ) — (1 ) 55 — (58 ) (4 ) Earnings (loss) before interest expense, income taxes, noncontrolling interests and equity in net income from affiliated companies 413 75 (6 ) (58 ) 424 Interest expense — External (net of interest capitalized) (2 ) 5 77 — 80 Affiliated companies (net of interest income) 70 (72 ) 2 — — Earnings (loss) before income taxes, noncontrolling interests and equity in net income from affiliated companies 345 142 (85 ) (58 ) 344 Income tax expense 60 62 — — 122 Equity in net income (loss) from affiliated companies 32 — 268 (300 ) — Net income (loss) 317 80 183 (358 ) 222 Less: Net income attributable to noncontrolling interests — 39 — — 39 Net income (loss) attributable to Tenneco Inc. $ 317 $ 41 $ 183 $ (358 ) $ 183 Comprehensive income (loss) attributable to Tenneco Inc. $ 390 $ 16 $ 183 $ (358 ) $ 231 For the Year Ended December 31, 2011 Guarantor
Subsidiaries Nonguarantor
Subsidiaries Tenneco Inc.
(Parent
Company) Reclass
& Elims Consolidated (Millions) $ 3,103 $ 4,102 $ — $ — $ 7,205 162 514 — (676 ) — 3,265 4,616 — (676 ) 7,205 2,764 3,949 — (676 ) 6,037 — 11 — — 11 57 76 — — 133 144 281 3 — 428 74 133 — — 207 3,039 4,450 3 (676 ) 6,816 — (5 ) — — (5 ) 80 1 — (86 ) (5 ) 80 (4 ) — (86 ) (10 ) 306 162 (3 ) (86 ) 379 (1 ) 6 103 — 108 211 (72 ) (139 ) — — 96 228 33 (86 ) 271 12 76 — — 88 116 — 124 (240 ) — 200 152 157 (326 ) 183 — 26 — — 26 $ 200 $ 126 $ 157 $ (326 ) $ 157 For the Year Ended December 31, 2012 Guarantor
Subsidiaries Nonguarantor
Subsidiaries Tenneco Inc.
(Parent
Company) Reclass
& Elims Consolidated (Millions) Revenues Net sales and operating revenues — External $ 3,331 $ 4,032 $ — $ — $ 7,363 Affiliated companies 182 547 — (729 ) — 3,513 4,579 — — 7,363 Costs and expenses Cost of sales (exclusive of depreciation and amortization shown below) 3,056 3,843 — (729 ) 6,170 Goodwill impairment charge — — — — — Engineering, research, and development 57 69 — — 126 Selling, general, and administrative 198 224 5 — 427 Depreciation and amortization of other intangibles 72 133 — — 205 3,383 4,269 5 (729 ) 6,928 Other income (expense) Loss on sale of receivables — (4 ) — — (4 ) Other income (expense) 115 (71 ) — (47 ) (3 ) 115 (75 ) — (47 ) (7 ) Earnings (loss) before interest expense, income taxes, noncontrolling interests and equity in net income from affiliated companies 245 235 (5 ) (47 ) 428 Interest expense — External (net of interest capitalized) — 5 100 — 105 Affiliated companies (net of interest income) 212 (81 ) (131 ) — — Earnings (loss) before income taxes, noncontrolling interests and equity in net income from affiliated companies 33 311 26 (47 ) 323 Income tax expense (39 ) 58 — — 19 Equity in net income (loss) from affiliated companies 217 — 249 (466 ) — Net income (loss) 289 253 275 (513 ) 304 Less: Net income attributable to noncontrolling interests — 29 — — 29 Net income (loss) attributable to Tenneco Inc. $ 289 $ 224 $ 275 $ (513 ) $ 275 Comprehensive income (loss) attributable to Tenneco Inc. $ 277 $ 210 $ 275 $ (513 ) $ 249 For the Year Ended December 31, 2010 Guarantor
Subsidiaries Nonguarantor
Subsidiaries Tenneco Inc.
(Parent
Company) Reclass
& Elims Consolidated (Millions) $ 2,571 $ 3,366 $ — $ — $ 5,937 130 472 — (602 ) — 2,701 3,838 — (602 ) 5,937 2,331 3,171 — (602 ) 4,900 48 69 — — 117 153 261 3 — 417 86 130 — — 216 2,618 3,631 3 (602 ) 5,650 — (3 ) — — (3 ) 12 1 — (16 ) (3 ) 12 (2 ) — (16 ) (6 ) 95 205 (3 ) (16 ) 281 (2 ) 7 144 — 149 186 (54 ) (132 ) — — (89 ) 252 (15 ) (16 ) 132 7 62 — — 69 154 — 54 (208 ) — 58 190 39 (224 ) 63 — 24 — — 24 $ 58 $ 166 $ 39 $ (224 ) $ 39 For the Year Ended December 31, 2011 Guarantor
Subsidiaries Nonguarantor
Subsidiaries Tenneco Inc.
(Parent
Company) Reclass
& Elims Consolidated (Millions) Revenues Net sales and operating revenues — External $ 3,103 $ 4,102 $ — $ — $ 7,205 Affiliated companies 162 514 — (676 ) — 3,265 4,616 — (676 ) 7,205 Costs and expenses Cost of sales (exclusive of depreciation and amortization shown below) 2,764 3,949 — (676 ) 6,037 Goodwill impairment charge — 11 — — 11 Engineering, research, and development 57 76 — — 133 Selling, general, and administrative 144 281 3 — 428 Depreciation and amortization of other intangibles 74 133 — — 207 3,039 4,450 3 (676 ) 6,816 Other income (expense) Loss on sale of receivables — (5 ) — — (5 ) Other income (expense) 80 1 — (86 ) (5 ) 80 (4 ) — (86 ) (10 ) Earnings (loss) before interest expense, income taxes, noncontrolling interests, and equity in net income from affiliated companies 306 162 (3 ) (86 ) 379 Interest expense — External (net of interest capitalized) (1 ) 6 103 — 108 Affiliated companies (net of interest income) 211 (72 ) (139 ) — — Earnings (loss) before income taxes, noncontrolling interests, and equity in net income from affiliated companies 96 228 33 (86 ) 271 Income tax expense 12 76 — — 88 Equity in net income (loss) from affiliated companies 116 — 124 (240 ) — Net income (loss) 200 152 157 (326 ) 183 Less: Net income attributable to noncontrolling interests — 26 — — 26 Net income (loss) attributable to Tenneco Inc. $ 200 $ 126 $ 157 $ (326 ) $ 157 Comprehensive income (loss) attributable to Tenneco Inc. $ 105 $ 81 $ 157 $ (326 ) $ 17 STATEMENT OF INCOME (LOSS) For the Year Ended December 31, 2009 Guarantor
Subsidiaries Nonguarantor
Subsidiaries Tenneco Inc.
(Parent
Company) Reclass
& Elims Consolidated (Millions) $ 1,915 $ 2,734 $ — $ — $ 4,649 92 399 — (491 ) — 2,007 3,133 — (491 ) 4,649 1,836 2,530 — (491 ) 3,875 36 61 — — 97 105 236 3 — 344 91 130 — — 221 2,068 2,957 3 (491 ) 4,537 — (9 ) — — (9 ) (2 ) 4 — (13 ) (11 ) (2 ) (5 ) — (13 ) (20 ) (63 ) 171 (3 ) (13 ) 92 (1 ) 4 130 — 133 140 (15 ) (125 ) — — (202 ) 182 (8 ) (13 ) (41 ) (1 ) 33 (19 ) — 13 124 — (84 ) (40 ) — (77 ) 149 (73 ) (53 ) (54 ) — 19 — — 19 $ (77 ) $ 130 $ (73 ) $ (53 ) $ (73 ) December 31, 2013 Guarantor
Subsidiaries Nonguarantor
Subsidiaries Tenneco Inc.
(Parent
Company) Reclass
& Elims Consolidated (Millions) ASSETS Current assets: Cash and cash equivalents $ 6 $ 269 $ — $ — $ 275 Restricted cash — 5 — — 5 Receivables, net 387 1,306 16 (649 ) 1,060 Inventories 279 377 — — 656 Deferred income taxes 87 — 7 (23 ) 71 Prepayments and other 35 188 — — 223 Total current assets 794 2,145 23 (672 ) 2,290 Other assets: Investment in affiliated companies 944 — 696 (1,640 ) — Notes and advances receivable from affiliates 1,026 7,320 4,826 (13,172 ) — Long-term receivables, net 12 2 — — 14 Goodwill 22 47 — — 69 Intangibles, net 13 17 — — 30 Deferred income taxes 72 9 44 — 125 Pension Assets — — — — — Other 44 60 23 — 127 2,133 7,455 5,589 (14,812 ) 365 Plant, property, and equipment, at cost 1,173 2,325 — — 3,498 Less — Accumulated depreciation and amortization (807 ) (1,516 ) — — (2,323 ) 366 809 — — 1,175 Total assets $ 3,293 $ 10,409 $ 5,612 $ (15,484 ) $ 3,830 LIABILITIES AND SHAREHOLDERS’ EQUITY Current liabilities: Short-term debt (including current maturities of long-term debt) Short-term debt — non-affiliated $ — $ 68 $ 15 $ — $ 83 Short-term debt — affiliated 247 176 10 (433 ) — Accounts payable 521 1,011 — (173 ) 1,359 Accrued taxes 9 31 — — 40 Other 128 285 9 (66 ) 356 Total current liabilities 905 1,571 34 (672 ) 1,838 Long-term debt — non-affiliated — 8 1,011 — 1,019 Long-term debt — affiliated 1,700 7,338 4,134 (13,172 ) — Deferred income taxes — 28 — — 28 Postretirement benefits and other liabilities 357 92 — 4 453 Commitments and contingencies Total liabilities 2,962 9,037 5,179 (13,840 ) 3,338 Redeemable noncontrolling interests — 20 — — 20 Tenneco Inc. Shareholders’ equity 331 1,313 433 (1,644 ) 433 Noncontrolling interests — 39 — — 39 Total equity 331 1,352 433 (1,644 ) 472 Total liabilities, redeemable noncontrolling interests and equity $ 3,293 $ 10,409 $ 5,612 $ (15,484 ) $ 3,830 December 31, 2011 Guarantor
Subsidiaries Nonguarantor
Subsidiaries Tenneco Inc.
(Parent
Company) Reclass
& Elims Consolidated (Millions) ASSETS $ 1 $ 213 $ — $ — $ 214 455 1,214 27 (716 ) 980 248 344 — — 592 35 31 — (26 ) 40 21 132 — — 153 760 1,934 27 (742 ) 1,979 444 — 681 (1,125 ) — 4,252 1,507 6,059 (11,818 ) — 2 8 — — 10 22 52 — — 74 13 19 — — 32 64 25 3 — 92 31 45 27 — 103 4,828 1,656 6,770 (12,943 ) 311 1,041 2,112 — — 3,153 (749 ) (1,357 ) — — (2,106 ) 292 755 — — 1,047 $ 5,880 $ 4,345 $ 6,797 $ (13,685 ) $ 3,337 LIABILITIES AND SHAREHOLDERS’ EQUITY $ — $ 64 $ 2 $ — $ 66 203 374 10 (587 ) — 455 825 — (109 ) 1,171 11 33 — — 44 118 178 39 (46 ) 289 787 1,474 51 (742 ) 1,570 — 9 1,149 — 1,158 4,718 1,546 5,554 (11,818 ) — — 51 — — 51 407 92 — 4 503 5,912 3,172 6,754 (12,556 ) 3,282 — 12 — — 12 (32 ) 1,118 43 (1,129 ) — — 43 — — 43 (32 ) 1,161 43 (1,129 ) 43 $ 5,880 $ 4,345 $ 6,797 $ (13,685 ) $ 3,337 December 31, 2012 Guarantor
Subsidiaries Nonguarantor
Subsidiaries Tenneco Inc.
(Parent
Company) Reclass
& Elims Consolidated (Millions) ASSETS Current assets: Cash and cash equivalents $ 4 $ 219 $ — $ — $ 223 Receivables, net 341 1,268 30 (653 ) 986 Inventories 278 389 — — 667 Deferred income taxes 91 — 6 (25 ) 72 Prepayments and other 28 148 — — 176 Total current assets 742 2,024 36 (678 ) 2,124 Other assets: Investment in affiliated companies 551 — 717 (1,268 ) — Notes and advances receivable from affiliates 957 4,495 4,594 (10,046 ) — Long-term receivables, net 2 2 — — 4 Goodwill 21 51 — — 72 Intangibles, net 18 17 — — 35 Deferred income taxes 55 1 60 — 116 Other 31 75 29 — 135 1,635 4,641 5,400 (11,314 ) 362 Plant, property, and equipment, at cost 1,098 2,267 — — 3,365 Less — Accumulated depreciation and amortization (763 ) (1,480 ) — — (2,243 ) 335 787 — — 1,122 Total assets $ 2,712 $ 7,452 $ 5,436 $ (11,992 ) $ 3,608 LIABILITIES AND SHAREHOLDERS’ EQUITY Current liabilities: Short-term debt (including current maturities of long-term debt) Short-term debt — non-affiliated $ — $ 112 $ 1 $ — $ 113 Short-term debt — affiliated 250 173 10 (433 ) — Accounts payable 423 954 — (191 ) 1,186 Accrued taxes 16 34 — — 50 Other 135 210 9 (54 ) 300 Total current liabilities 824 1,483 20 (678 ) 1,649 Long-term debt — non-affiliated — 8 1,059 — 1,067 Long-term debt — affiliated 1,447 4,533 4,066 (10,046 ) — Deferred income taxes — 27 — — 27 Postretirement benefits and other liabilities 438 118 — 3 559 Commitments and contingencies Total liabilities 2,709 6,169 5,145 (10,721 ) 3,302 Redeemable noncontrolling interests — 15 — — 15 Tenneco Inc. Shareholders’ equity 3 1,223 291 (1,271 ) 246 Noncontrolling interests — 45 — — 45 Total equity 3 1,268 291 (1,271 ) 291 Total liabilities, redeemable noncontrolling interests and equity $ 2,712 $ 7,452 $ 5,436 $ (11,992 ) $ 3,608 BALANCE SHEET December 31, 2010 Guarantor
Subsidiaries Nonguarantor
Subsidiaries Tenneco Inc.
(Parent
Company) Reclass
& Elims Consolidated (Millions) ASSETS $ — $ 233 $ — $ — $ 233 402 1,106 24 (706 ) 826 221 326 — — 547 103 — — (65 ) 38 35 111 — — 146 761 1,776 24 (771 ) 1,790 391 — 707 (1,098 ) — 4,119 788 5,853 (10,760 ) — 1 8 — — 9 22 67 — — 89 14 18 — — 32 37 21 34 — 92 26 46 33 — 105 4,610 948 6,627 (11,858 ) 327 997 2,112 — — 3,109 (713 ) (1,346 ) — — (2,059 ) 284 766 — — 1,050 $ 5,655 $ 3,490 $ 6,651 $ (12,629 ) $ 3,167 LIABILITIES AND SHAREHOLDERS’ EQUITY $ — $ 62 $ 1 $ — $ 63 214 371 10 (595 ) — 367 773 — (92 ) 1,048 20 31 — — 51 130 213 47 (84 ) 306 731 1,450 58 (771 ) 1,468 — 11 1,149 — 1,160 4,583 768 5,409 (10,760 ) — — 56 — — 56 347 85 — 4 436 5,661 2,370 6,616 (11,527 ) 3,120 — 12 — — 12 (6 ) 1,069 35 (1,102 ) (4 ) — 39 — — 39 (6 ) 1,108 35 (1,102 ) 35 $ 5,655 $ 3,490 $ 6,651 $ (12,629 ) $ 3,167 TENNECO INC.NOTES TO CONSOLIDATED FINANCIAL STATEMENTS — (Continued) Year Ended December 31, 2011 Guarantor
Subsidiaries Nonguarantor
Subsidiaries Tenneco Inc.
(Parent
Company) Reclass
& Elims Consolidated (Millions) $ 401 $ 83 $ (239 ) $ — $ 245 3 1 — — 4 (69 ) (144 ) — — (213 ) (4 ) (11 ) — — (15 ) (70 ) (154 ) — — (224 ) — 5 — — 5 — — (1 ) — (1 ) — (1 ) (23 ) — (24 ) — 3 — — 3 — 6 24 — 30 (330 ) 75 255 — — — 1 — — 1 — (4 ) — — (4 ) — (20 ) — — (20 ) — — (16 ) — (16 ) (330 ) 65 239 — (26 ) — (14 ) — — (14 ) 1 (20 ) — — (19 ) — 233 — — 233 $ 1 $ 213 $ — $ — $ 214 Year Ended December 31, 2013 Guarantor
Subsidiaries Nonguarantor
Subsidiaries Tenneco Inc.
(Parent
Company) Reclass
& Elims Consolidated (Millions) Operating Activities Net cash provided (used) by operating activities $ 270 $ 185 $ 48 $ — $ 503 Investing Activities Proceeds from sale of assets 1 7 — — 8 Cash payments for plant, property, and equipment (102 ) (142 ) — — (244 ) Cash payments for software related intangible assets (19 ) (6 ) — — (25 ) Changes in restricted cash — (5 ) — — (5 ) Net cash used by investing activities (120 ) (146 ) — — (266 ) Financing Activities Retirement of long-term debt — (2 ) (14 ) — (16 ) Tax benefit from stock-based compensation — — 24 — 24 Purchase of common stock under the share repurchase program — — (27 ) — (27 ) Issuance of common stock — — 20 — 20 Increase in bank overdrafts — (6 ) — — (6 ) Net increase in revolver borrowings and short-term debt excluding current maturities of long-term debt and short-term borrowings secured by accounts receivable — (43 ) 21 — (22 ) Net increase in short-term borrowings secured by accounts receivable — — (40 ) — (40 ) Intercompany dividends and net increase (decrease) in intercompany obligations (148 ) 180 (32 ) — — Purchase of noncontrolling equity interest — (69 ) — — (69 ) Distribution to noncontrolling interests partners — (39 ) — — (39 ) Net cash provided (used) by financing activities (148 ) 21 (48 ) — (175 ) Effect of foreign exchange rate changes on cash and cash equivalents — (10 ) — — (10 ) Increase in cash and cash equivalents 2 50 — — 52 Cash and cash equivalents, January 1 4 219 — — 223 Cash and cash equivalents, December 31 (Note) $ 6 $ 269 $ — $ — $ 275 Note: Cash and cash equivalents include highly liquid investments with a maturity of three months or less at the date of purchase. Year Ended December 31, 2010 Guarantor
Subsidiaries Nonguarantor
Subsidiaries Tenneco Inc.
(Parent
Company) Reclass
& Elims Consolidated (Millions) $ 97 $ 380 $ (233) $ — $ 244 1 2 — — 3 (50 ) (101 ) — — (151 ) (7 ) (5 ) — — (12 ) — 3 — — 3 (56 ) (101 ) — — (157 ) — 5 875 — 880 — — (24 ) — (24 ) — (4 ) (860 ) — (864 ) — 2 — — 2 — (10 ) — — (10 ) (61 ) (181 ) 242 — — — (14 ) — — (14 ) (61 ) (202 ) 233 — (30 ) — 9 — — 9 (20 ) 86 — — 66 20 147 — — 167 $ — $ 233 $ — $ — $ 233 Year Ended December 31, 2012 Guarantor
SubsidiariesNonguarantor
SubsidiariesTenneco Inc.
(Parent
Company)Reclass
& ElimsConsolidated (Millions) Operating Activities Net cash provided (used) by operating activities $ 385 $ 206 $ (226 ) $ — $ 365 Investing Activities Proceeds from sale of assets — 3 — — 3 Cash payments for plant, property, and equipment (101 ) (155 ) — — (256 ) Cash payments for software related intangible assets (6 ) (7 ) — — (13 ) Cash payments for net assets purchased (7 ) — — — (7 ) Net cash used by investing activities (114 ) (159 ) — — (273 ) Financing Activities Retirement of long-term debt — (1 ) (410 ) — (411 ) Issuance of long-term debt — — 250 — 250 Debt issuance cost on long-term debt — — (13 ) — (13 ) Purchase of common stock under the share repurchase program — — (18 ) — (18 ) Issuance of common stock — — 5 — 5 Increase in bank overdrafts — 5 — — 5 Net increase in revolver borrowings and short-term debt excluding current maturities of long-term debt and short-term borrowings secured by accounts receivable — 48 19 — 67 Net increase in short-term borrowings secured by accounts receivable — — 50 — 50 Intercompany dividends and net increase (decrease) in intercompany obligations (268 ) (75 ) 343 — — Capital contribution from noncontrolling interest partner — 5 — — 5 Distribution to noncontrolling interests partners — (29 ) — — (29 ) Net cash provided (used) by financing activities (268 ) (47 ) 226 — (89 ) Effect of foreign exchange rate changes on cash and cash equivalents — 6 — — 6 Increase (decrease) in cash and cash equivalents 3 6 — — 9 Cash and cash equivalents, January 1 1 213 — — 214 Cash and cash equivalents, December 31 (Note) $ 4 $ 219 $ — $ — $ 223 Note: Cash and cash equivalents include highly liquid investments with a maturity of three months or less at the date of purchase. Year Ended December 31, 2009 Guarantor
Subsidiaries Nonguarantor
Subsidiaries Tenneco Inc.
(Parent
Company) Reclass
& Elims Consolidated (Millions) $ 347 $ 160 $ (266) $ — $ 241 — 5 — — 5 (42 ) (78 ) — — (120 ) — 1 — — 1 (2 ) (4 ) — — (6 ) — 1 — — 1 (44 ) (75 ) — — (119 ) — — 188 — 188 — — 6 — 6 — — (8 ) — (8 ) — (5 ) (17 ) — (22 ) — (23 ) — — (23 ) — 21 (239 ) — (218 ) (299 ) (37 ) 336 — — — (10 ) — — (10 ) (299 ) (54 ) 266 — (87 ) — 6 — — 6 4 37 — — 41 16 110 — — 126 $ 20 $ 147 $ — $ — $ 167 Year Ended December 31, 2011 Guarantor
Subsidiaries Nonguarantor
Subsidiaries Tenneco Inc.
(Parent
Company) Reclass
& Elims Consolidated (Millions) Operating Activities Net cash provided (used) by operating activities $ 401 $ 83 $ (239 ) $ — $ 245 Investing Activities Proceeds from sale of assets 3 1 — — 4 Cash payments for plant, property, and equipment (69 ) (144 ) — — (213 ) Cash payments for software related intangible assets (4 ) (11 ) — — (15 ) Cash payments for net assets purchased — — — — — Net cash used by investing activities (70 ) (154 ) — — (224 ) Financing Activities Retirement of long-term debt — (1 ) (23 ) — (24 ) Issuance of long-term debt — 5 — — 5 Debt issuance cost on long-term debt — — (1 ) — (1 ) Purchase of common stock under the share repurchase program — — (16 ) — (16 ) Increase in bank overdrafts — 3 — — 3 Net decrease in revolver borrowings and short-term debt excluding current maturities of long-term debt — 6 24 — 30 Net increase in short-term borrowings secured by accounts receivable — — — — — Intercompany dividends and net increase (decrease) in intercompany obligations (330 ) 75 255 ��� — Capital contribution from noncontrolling interest partner — 1 — — 1 Purchase of noncontrolling equity interest — (4 ) — — (4 ) Distribution to noncontrolling interests partners — (20 ) — — (20 ) Net cash provided (used) by financing activities (330 ) 65 239 — (26 ) Effect of foreign exchange rate changes on cash and cash equivalents — (14 ) — — (14 ) Increase (decrease) in cash and cash equivalents 1 (20 ) — — (19 ) Cash and cash equivalents, January 1 — 233 — — 233 Cash and cash equivalents, December 31 (Note) $ 1 $ 213 $ — $ — $ 214 Note: Cash and cash equivalents include highly liquid investments with a maturity of three months or less at the date of purchase. Quarter Net Sales
and
Operating
Revenues Cost of Sales
(Excluding
Depreciation and
Amortization) Earnings Before
Interest Expense,
Income Taxes
and Noncontrolling
Interests Net Income
Attributable
to Tenneco
Inc. (Millions) 2013 1st $ 1,903 $ 1,604 $ 93 $ 54 2nd 2,067 1,736 141 63 3rd 1,963 1,691 72 12 4th 2,031 1,703 118 54 $ 7,964 $ 6,734 $ 424 $ 183 2012 1st $ 1,912 $ 1,607 $ 96 $ 30 2nd 1,920 1,595 137 87 3rd 1,778 1,494 111 125 4th 1,753 1,474 84 33 $ 7,363 $ 6,170 $ 428 $ 275 Quarter Basic
Earnings
per Share of
Common Stock Diluted
Earnings
per Share of
Common Stock2013 1st $ 0.90 $ 0.88 2nd 1.04 1.02 3rd 0.19 0.19 4th 0.90 0.88 Full Year 3.03 2.97 2012 1st $ 0.50 $ 0.49 2nd 1.45 1.42 3rd 2.09 2.05 4th 0.55 0.54 Full Year 4.58 4.50 14.Quarterly Financial Data (Unaudited) Net Sales
and
Operating
Revenues Cost of Sales
(Excluding
Depreciation and
Amortization) Earnings Before
Interest Expense,
Income Taxes
and Noncontrolling
Interests Net Income (Loss)
Attributable
to Tenneco
Inc. (Millions) $ 1,760 $ 1,466 $ 94 $ 47 1,888 1,565 113 50 1,773 1,492 84 30 1,784 1,514 88 30 $ 7,205 $ 6,037 $ 379 $ 157 $ 1,316 $ 1,073 $ 59 $ 7 1,502 1,222 93 40 1,542 1,280 67 10 1,577 1,325 62 (18 ) $ 5,937 $ 4,900 $ 281 $ 39 Basic
Earnings (Loss)
per Share of
Common Stock Diluted
Earnings (Loss)
per Share of
Common Stock $ 0.78 $ 0.75 0.84 0.81 0.51 0.49 0.50 0.49 2.62 2.55 $ 0.11 $ 0.11 0.68 0.66 0.17 0.17 (0.31 ) (0.31 ) 0.65 0.63 Note: The sum of the quarters may not equal the total of the respective year’s earnings per share on either a basic or diluted basis due to changes in the weighted average shares outstanding throughout the year. SCHEDULE VALUATION AND QUALIFYING ACCOUNTS Column B Column C Column D Column E Additions Balance
at
Beginning
of Year Charged
to
Costs and
Expenses Charged
to
Other
Accounts Deductions Balance
at End of
Year (Millions) $ 20 1 — 4 $ 17 $ 25 2 — 7 $ 20 $ 24 5 — 4 $ 25 Column A Column B Column C Column D Column E Additions Description Balance
at
Beginning
of Year Charged
to
Costs and
Expenses Charged
to
Other
Accounts Deductions Balance
at End of
Year (Millions) Allowance for Doubtful Accounts and Notes Receivable Deducted from Assets to Which it Applies: Year Ended December 31, 2013 $ 14 1 — 1 $ 14 Year Ended December 31, 2012 $ 17 3 — 6 $ 14 Year Ended December 31, 2011 $ 20 1 — 4 $ 17 ITEM 9. CHANGES IN AND DISAGREEMENTS WITH ACCOUNTANTS ON ACCOUNTING AND FINANCIAL DISCLOSURE. 2011,2013, that have materially affected, or are reasonably likely to materially affect, our internal control over financial reporting.ITEM 9B.OTHER INFORMATION.16, 201214, 2014 are incorporated herein by reference. In addition, Item 4.1 of this Annual Report on Form 10-K, which appears at the end of Part I, is incorporated herein by reference.ITEM 11.EXECUTIVE COMPENSATION.16, 201214, 2014 is incorporated herein by reference.ITEM 12. SECURITY OWNERSHIP OF CERTAIN BENEFICIAL OWNERS AND MANAGEMENT AND RELATED STOCKHOLDER MATTERS. 16, 201214, 2014 is incorporated herein by reference.2011,2013, information regarding outstanding awards available under our compensation plans (including individual compensation arrangements) under which our equity securities may be delivered: (a)
Number of
securities to be
issued upon
exercise of
outstanding
options,
warrants and
rights(1) (b)
Weighted-
average exercise
price of
outstanding
options,
warrants and
rights (c)
Number of
securities
available for
future
issuance
(excluding
shares in
column (a))(1) 79,155 $ 20.39 — 659,810 $ 6.06 — 2,004,234 $ 19.30 1,569,025 Plan category (a)
Number of
securities to be
issued upon
exercise of
outstanding
options,
warrants and
rights(1) (b)
Weighted-
average exercise
price of
outstanding
options,
warrants and
rights (c)
Number of
securities
available for
future
issuance
(excluding
shares in
column (a))(1)Equity compensation plans approved by security holders: Stock Ownership Plan(2) 76,075 $ 20.34 — 2002 Long-Term Incentive Plan (as amended)(3) 12,628 $ 9.74 — 2006 Long-Term Incentive Plan (as amended)(4) 1,894,870 $ 23.12 3,979,918 (1) Reflects the number of shares of the Company’s common stock. Does not include 436,662388,851 shares that may be issued in settlement of common stock equivalent units that were (i) credited to outside directors as payment for their retainer and other fees or (ii) credited to any of our executive officers who have elected to defer a portion of their compensation. In general, these units are settled in cash. At the option of the Company, however, the units may be settled in shares of the Company’s common stock.(2) This plan terminated as to new awards on December 31, 2001 (except awards pursuant to commitments outstanding at that date). (3) This plan terminated as to new awards upon adoption of our 2006 Long-term Incentive Plan (except awards pursuant to commitments outstanding on that date). (4) Does not include 407,751368,268 shares subject to outstanding restricted stock (vest over time) as of December 31, 20112013 that were issued at a weighted average grant date fair value of $22.64.$34.92. Under this plan, as of December 31, 2011,2013, a maximum of 1,255,2202,671,086 shares remained available for delivery under full value awards (i.e., bonus stock, stock equivalent units, performance units, restricted stock and restricted stock units).ITEM 13. CERTAIN RELATIONSHIPS AND RELATED TRANSACTIONS, AND DIRECTOR INDEPENDENCE. 16, 201214, 2014 are incorporated herein by reference.ITEM 14.PRINCIPAL ACCOUNTANT FEES AND SERVICES.16, 201214, 2014 are incorporated herein by reference. Page 1192011,2013, or incorporated herein by reference (exhibits designated by an asterisk are filed with the report; all other exhibits are incorporated by reference): 2 — None. 3.1(a) — Restated Certificate of Incorporation of the registrant dated December 11, 1996 (incorporated herein by reference to Exhibit 3.1(a) of the registrant’s Annual Report on Form 10-K for the year ended December 31, 1997, File No. 1-12387). 3.1(b) — Certificate of Amendment, dated December 11, 1996 (incorporated herein by reference to Exhibit 3.1(c) of the registrant’s Annual Report on Form 10-K for the year ended December 31, 1997, File No. 1-12387). 3.1(c) — Certificate of Ownership and Merger, dated July 8, 1997 (incorporated herein by reference to Exhibit 3.1(d) of the registrant’s Annual Report on Form 10-K for the year ended December 31, 1997, File No. 1-12387). 3.1(d) — Certificate of Designation of Series B Junior Participating Preferred Stock dated September 9, 1998 (incorporated herein by reference to Exhibit 3.1(d) of the registrant’s Quarterly Report on Form 10-Q for the quarter ended September 30, 1998, File No. 1-12387). 3.1(e) — Certificate of Elimination of the Series A Participating Junior Preferred Stock of the registrant dated September 11, 1998 (incorporated herein by reference to Exhibit 3.1(e) of the registrant’s Quarterly Report on Form 10-Q for the quarter ended September 30, 1998, File No. 1-12387). 3.1(f) — Certificate of Amendment to Restated Certificate of Incorporation of the registrant dated November 5, 1999 (incorporated herein by reference to Exhibit 3.1(f) of the registrant’s Quarterly Report on Form 10-Q for the quarter ended September 30, 1999, File No. 1-12387). 3.1(g) — Certificate of Amendment to Restated Certificate of Incorporation of the registrant dated November 5, 1999 (incorporated herein by reference to Exhibit 3.1(g) of the registrant’s Quarterly Report on Form 10-Q for the quarter ended September 30, 1999, File No. 1-12387). 3.1(h) — Certificate of Ownership and Merger merging Tenneco Automotive Merger Sub Inc. with and into the registrant, dated November 5, 1999 (incorporated herein by reference to Exhibit 3.1(h) of the registrant’s Quarterly Report on Form 10-Q for the quarter ended September 30, 1999, File No. 1-12387). 3.1(i) — Certificate of Amendment to Restated Certificate of Incorporation of the registrant dated May 9, 2000 (incorporated herein by reference to Exhibit 3.1(i) of the registrant’s Quarterly Report on Form 10-Q for the quarter ended March 31, 2000, File No. 1-12387). 3.1(j) — Certificate of Ownership and Merger merging Tenneco Inc. with and into the registrant, dated October 27, 2005 (incorporated herein by reference to Exhibit 99.1 of the registrant’s Current Report on Form 8-K dated October 28, 2005, File No. 1-12387). 3.2 — By-laws of the registrant, as amended March 4, 2008 (incorporated herein by reference to Exhibit 99.1 of the registrant’s Current Report on Form 8-K event date March 4, 2008, File No. 1-12387). 3.3 — Certificate of Incorporation of Tenneco Global Holdings Inc. (“Global”), as amended (incorporated herein by reference to Exhibit 3.3 of the registrant’s Registration Statement on Form S-4, Reg. No. 333-93757). 3.4 — By-laws of Global (incorporated herein by reference to Exhibit 3.4 of the registrant’s Registration Statement on Form S-4, Reg. No. 333-93757). ExhibitNumberDescription3.5 — Certificate of Incorporation of TMC Texas Inc. (“TMC”) (incorporated herein by reference to Exhibit 3.5 of the registrant’s Registration Statement on Form S-4, Reg. No. 333-93757). 3.6 — By-laws of TMC (incorporated herein by reference to Exhibit 3.6 of the registrant’s Registration Statement on Form S-4, Reg. No. 333-93757). 3.7 — Amended and Restated Certificate of Incorporation of Tenneco International Holding Corp. (“TIHC”) dated as of April 29, 2010 (incorporated herein by reference to Exhibit 3.1 of the registrant’s Quarterly Report on Form 10-Q for the quarter ended September 30, 2010, File No. 1-12387). 3.8 — Amended and Restated By-laws of TIHC (incorporated herein by reference to Exhibit 3.8 of the registrant’s Registration Statement on Form S-4, Reg. No. 333-93757). 3.9 — Certificate of Incorporation of Clevite Industries Inc. (“Clevite”), as amended (incorporated herein by reference to Exhibit 3.9 of the registrant’s Registration Statement on Form S-4, Reg. No. 333-93757). 3.10 — By-laws of Clevite (incorporated herein by reference to Exhibit 3.10 of the registrant’s Registration Statement on Form S-4, Reg. No. 333-93757). Description 3.11 — Amended and Restated Certificate of Incorporation of The Pullman Company (“Pullman”) (incorporated herein by reference to Exhibit 3.11 of the registrant’s Registration Statement on Form S-4, Reg. No. 333-93757). 3.12 — By-laws of Pullman (incorporated herein by reference to Exhibit 3.12 of the registrant’s Registration Statement on Form S-4, Reg. No. 333-93757). 3.13 — Certificate of Incorporation of Tenneco Automotive Operating Company Inc. (“Operating”) (incorporated herein by reference to Exhibit 3.13 of the registrant’s Registration Statement on Form S-4, Reg. No. 333-93757). 3.14 — By-laws of Operating (incorporated herein by reference to Exhibit 3.14 of the registrant’s Registration Statement on Form S-4, Reg. No. 333-93757). 4.1(a)4.1 — Indenture, dated as of November 1, 1996, between the registrant and The Chase Manhattan Bank, as Trustee (incorporated herein by reference to Exhibit 4.1 of the registrant’s Registration Statement on Form S-4, Registration No. 333-14003).4.1(b)—Third Supplemental Indenture dated as of December 11, 1996 to Indenture dated as of November 1, 1996 between the registrant and The Chase Manhattan Bank, as Trustee (incorporated herein by reference to Exhibit 4.3(d) of the registrant’s Annual Report on Form 10-K for the year ended December 31, 1996, File No. 1-12387).4.1(c)—Fourth Supplemental Indenture dated as of December 11, 1996 to Indenture dated as of November 1, 1996 between the registrant and The Chase Manhattan Bank, as Trustee (incorporated herein by reference to Exhibit 4.3(e) of the registrant’s Annual Report on Form 10-K for the year ended December 31, 1996, File No. 1-12387).4.1(d)—Eleventh Supplemental Indenture, dated October 21, 1999, to Indenture dated November 1, 1996 between The Chase Manhattan Bank, as Trustee, and the registrant (incorporated herein by reference to Exhibit 4.2(l) of the registrant’s Quarterly Report on Form 10-Q for the quarter ended September 30, 1999, File No. 1-12387).4.2—Specimen stock certificate for Tenneco Inc. common stock (incorporated herein by reference to Exhibit 4.3 of the registrant’s Annual Report on Form 10-K for the year ended December 31, 2006, File No. 1-12387). 4.3(a)4.2(a) — SecondThird Amended and Restated Credit Agreement, dated as of March 16, 2007,22, 2012, among Tenneco Inc., JPMorgan Chase Bank, N.A., as administrative agent, and the other lenders party thereto (incorporated herein by reference to Exhibit 99.1 of the registrant’s Current Report on Form 8-K dated March 16, 2007).ExhibitNumberDescription4.3(b)—Guarantee and Collateral Agreement, dated as of March 16, 2007 (amending and restating the Guarantee and Collateral Agreement dated as of November 4, 1999, as previously amended and amended and restated), among Tenneco Inc., various of its subsidiaries and JPMorgan Chase Bank, N.A., as administrative agent (incorporated herein by reference to Exhibit 99.2 of the registrant’s Current Report on Form 8-K dated March 16, 2007).4.3(c)—Waiver, dated July 23, 2007, to Second Amended and Restated Credit Agreement, dated as March 16, 2007, by and among the registrant, JPMorgan Chase Bank, N.A., as administrative agent, and the other lenders party thereto (incorporated herein by reference to Exhibit 4.5(c) of the registrant’s Annual Report on Form 10-K for the year ended December 31, 2007, File No. 1-12387).4.3(d)—Second Amendment, dated November 26, 2007, to Second Amended and Restated Credit Agreement, dated as March 16, 2007, by and among the registrant, JPMorgan Chase Bank, N.A., as administrative agent, and the other lenders party thereto (incorporated herein by reference to Exhibit 4.5(d) of the registrant’s Annual Report on Form 10-K for the year ended December 31, 2007, File No. 1-12387).4.3(e)—Third Amendment, dated as of December 23, 2008, to Second Amended and Restated Credit Agreement, dated as of March 16, 2007, by and among the registrant, JPMorgan Chase Bank, N.A., as administrative agent, and the other lenders party thereto (incorporated herein by reference to Exhibit 10.1 of the registrant’s Current Report on Form 8-K dated December 23, 2008).4.3(f)—Fourth Amendment, dated as of February 23, 2009, to Second Amended and Restated Credit Agreement, dated as of March 16, 2007, by and among the registrant, JP Morgan Chase Bank, N.A., as administrative agent, and the other lenders party thereto (incorporated herein by reference to Exhibit 4.1 of the registrant’s Current Report on Form 8-K dated February 23, 2009)March 22, 2012).4.3(g)4.2(b) — Fifth Amendment to the Second AmendedGuarantee and Restated CreditCollateral Agreement, dated June 3, 2010, byas of March 22, 2012 (amending and restating the Guarantee and Collateral Agreement dated as of March 17, 2007, as previously amended and restated), among the registrant,Tenneco Inc., various of its subsidiaries of the registrant and JP MorganJPMorgan Chase Bank, N.A., as administrative agent (incorporated herein by reference to Exhibit 99.14.2 of the registrant’s Current Report on Form 8-K filed June 9, 2010, File No. 1-12387)dated March 22, 2012).4.3(h)4.3 — Sixth Amendment to the Second Amended and Restated Credit Agreement, dated November 15, 2010, by and among the registrant, various subsidiaries of the registrant and JP Morgan Chase Bank, N.A., as administrative agent (incorporated herein by reference to Exhibit 4.1 of the registrant’s Current Report on Form 8-K filed November 30, 2010, File No. 1-12387).4.4(a)—Indenture, dated as of November 19, 2007, by and among the registrant, the subsidiary guarantors party thereto and Wells Fargo Bank, N.A., as trustee (incorporated herein by reference to Exhibit 4.9(a) of the registrant’s Annual Report on Form 10-K for the year ended December 31, 2007, File No. 1-12387).4.4(b)—Agreement of Resignation, Appointment and Acceptance between Tenneco Inc., Wells Fargo Bank, National Association and Bank of New York Mellon Trust Company, N.A. (incorporated herein by reference to Exhibit 10.1 of the registrant’s Quarterly Report on Form 10-Q for the quarter ended September 30, 2009, File No. 1-12387).4.5—Indenture, dated August 3, 2010, among the registrant, various subsidiaries of the registrant and U.S. Bank National Association, as trustee (incorporated herein by reference to Exhibit 4.1 of the registrant’s Current Report on Form 8-K filed August 3, 2010, File No. 1-12387). 4.64.4 — Indenture, dated December 23, 2010, among the registrant, various subsidiaries of the registrant and The Bank of New York Mellon Trust Company, N.A., as trustee (incorporated herein by reference to Exhibit 4.1 of the registrant’s Current Report on Form 8-K filed December 23, 2010, File No. 1-12387). 94.5 — None.ExhibitNumberDescription 10.1—Distribution Agreement, dated November 1, 1996, by and among El Paso Tennessee Pipeline Co., theThe registrant and Newport News Shipbuilding Inc. (incorporated herein by referenceis a party to Exhibit 2other agreements for unregistered long-term debt securities, which do not exceed 10% of the registrant’s Form 10, File No. 1-12387).total assets. The registrant agrees to furnish a copy of such agreements to the Commission upon request. 10.29 — Amendment No. 1 to Distribution Agreement, dated as of December 11, 1996, by and among El Paso Tennessee Pipeline Co., the registrant, and Newport News Shipbuilding Inc. (incorporated herein by reference to Exhibit 10.2 of the registrant’s Annual Report on Form 10-K for the year ended December 31, 1996, File No. 1-12387). 10.3—Debt and Cash Allocation Agreement, dated December 11, 1996, by and among El Paso Tennessee Pipeline Co., the registrant, and Newport News Shipbuilding Inc. (incorporated herein by reference to Exhibit 10.3 of the registrant’s Annual Report on Form 10-K for the year ended December 31, 1996, File No. 1-12387). 10.4—Benefits Agreement, dated December 11, 1996, by and among El Paso Tennessee Pipeline Co., the registrant, and Newport News Shipbuilding Inc. (incorporated herein by reference to Exhibit 10.4 of the registrant’s Annual Report on Form 10-K for the year ended December 31, 1996, File No. 1-12387). 10.5—Insurance Agreement, dated December 11, 1996, by and among El Paso Tennessee Pipeline Co., the registrant, and Newport News Shipbuilding Inc. (incorporated herein by reference to Exhibit 10.5 of the registrant’s Annual Report on Form 10-K for the year ended December 31, 1996, File No. 1-12387). 10.6—Tax Sharing Agreement, dated December 11, 1996, by and among El Paso Tennessee Pipeline Co., Newport News Shipbuilding Inc., the registrant, and El Paso Natural Gas Company (incorporated herein by reference to Exhibit 10.6 of the registrant’s Annual Report on Form 10-K for the year ended December 31, 1996, File No. 1-12387). 10.7—First Amendment to Tax Sharing Agreement, dated as of December 11, 1996, among El Paso Tennessee Pipeline Co., the registrant, El Paso Natural Gas Company and Newport News Shipbuilding Inc. (incorporated herein by reference to Exhibit 10.7 of the registrant’s Annual Report on Form 10-K for the year ended December 31, 1996, File No. 1-12387).None+ 10.810.1 — Change of Control Severance Benefits Plan for Key Executives (incorporated herein by reference to Exhibit 10.13 of the registrant’s Quarterly Report on Form 10-Q for the quarter ended September 30, 1999, File No. 1-12387). + 10.910.2 — Stock Ownership Plan (incorporated herein by reference to Exhibit 10.1010.14 of the registrant’s Registration Statement on Form S-4, Reg. No. 333-93757).+ 10.1010.3 — Key Executive Pension Plan (incorporated herein by reference to Exhibit 10.11 of the registrant’s Quarterly Report on Form 10-Q for the quarter ended June 30, 2000, File No. 1-12387). + 10.1110.4 — Deferred Compensation Plan (incorporated herein by reference to Exhibit 10.12 of the registrant’s Quarterly Report on Form 10-Q for the quarter ended June 30, 2000, File No. 1-12387). + 10.1210.5 — Supplemental Executive Retirement Plan (incorporated herein by reference to Exhibit 10.13 of the registrant’s Quarterly Report on Form 10-Q for the quarter ended June 30, 2000, File No. 1-12387). 10.13+10.6 — Human Resources Agreement by and between the registrant and Tenneco Packaging Inc. dated November 4, 1999 (incorporated herein by reference to Exhibit 99.1 of the registrant’s Current Report on Form 8-K dated November 4, 1999, File No. 1-12387). 10.14—Tax Sharing Agreement by and between the registrant and Tenneco Packaging Inc. dated November 3, 1999 (incorporated herein by reference to Exhibit 99.2 of the registrant’s Current Report on Form 8-K dated November 4, 1999, File No. 1-12387).ExhibitNumberDescription 10.15—Amended and Restated Transition Services Agreement by and between the registrant and Tenneco Packaging Inc. dated as of November 4, 1999 (incorporated herein by reference to Exhibit 10.21 of the registrant’s Quarterly Report on Form 10-Q for the quarter ended September 30, 1999, File No. 1-12387).+10.16—Amendment No. 1 to Change in Control Severance Benefits Plan for Key Executives (incorporated herein by reference to Exhibit 10.23 of the registrant’s Quarterly Report on Form 10-Q for the quarter ended June 30, 2000, File No. 1-12387). + 10.1710.7 — Form of Indemnity Agreement entered into between the registrant and the following directors of the registrant: Paul Stecko M. Kathryn Eickhoff and Dennis Severance (incorporated herein by reference to Exhibit 10.29 of the registrant’s Quarterly Report on Form 10-Q for the quarter ended September 30, 2000, File No. 1-12387).+ 10.1810.8 — Letter Agreement dated July 27, 2000 between the registrant and Timothy E. Jackson (incorporated herein by reference to Exhibit 10.27 of the registrant’s Quarterly Report on Form 10-Q for the quarter ended June 30, 2000, File No. 1-12387).+10.19—Letter Agreement dated as of June 1, 2001 between the registrant and Hari Nair (incorporated herein by reference to Exhibit 10.28 of the registrant’s Annual Report on Form 10-K for the year ended December 31, 2001, File No. 1-12387).+10.20—2002 Long-Term Incentive Plan (As Amended and Restated Effective March 11, 2003) (incorporated herein by reference to Exhibit 10.26 of the registrant’s Quarterly Report on Form 10-Q for the quarter ended June 30, 2003, File No. 1-12387). + 10.2110.9 — Amendment No. 1 to Deferred Compensation Plan (incorporated herein by reference to Exhibit 10.27 of the registrant’s Annual Report on Form 10-K for the year ended December 31, 2002, File No. 1-12387). +10.22 —Supplemental Stock Ownership Plan (incorporated herein by reference to Exhibit 10.28 of the registrant’s Annual Report on Form 10-K for the year ended December 31, 2002, File No. 1-12387).Description+ 10.2310.10 — Form of Stock Option Agreement for employees under the 2002 Long-Term Incentive Plan, as amended (providing for a ten year option term) (incorporated herein by reference to Exhibit 99.2 of the registrant’s Current Report on Form 8-K dated January 13, 2005, File No. 1-12387). + 10.2410.11 — Form of Stock Option Agreement for non-employee directors under the 2002 Long-Term Incentive Plan, as amended (providing for a ten year option term) (incorporated herein by reference to Exhibit 99.3 of the registrant’s Current Report on Form 8-K dated January 13, 2005, File No. 1-12387).+10.25—Form of Stock Option Agreement for employees under the 2002 Long-Term Incentive Plan, as amended (providing for a seven year option term) (incorporated herein by reference to Exhibit 99.2 of the registrant’s Current Report on Form 8-K dated January 17, 2005, File No. 1-12387).+10.26—Form of Stock Option Agreement for non-employee directors under the 2002 Long-Term Incentive Plan, as amended (providing for a seven year option term) (incorporated herein by reference to Exhibit 99.3 of the registrant’s Current Report on Form 8-K dated January 17, 2005, File No. 1-12387).+10.27—Amendment No. 1 to the Key Executive Pension Plan (incorporated herein by reference to Exhibit 10.39 of the registrant’s Quarterly Report on Form 10-Q for the quarter ended March 31, 2005, File No. 1-12387). + 10.2810.12 — Amendment No. 1 to the Supplemental Executive Retirement Plan (incorporated herein by reference to Exhibit 10.40 of the registrant’s Quarterly Report on Form 10-Q for the quarter ended June 30, 2005, File No. 1-12387). ExhibitNumberDescription+ 10.2910.13 — Second Amendment to the Key Executive Pension Plan (incorporated herein by reference to Exhibit 10.41 of the registrant’s Quarterly Report on Form 10-Q for the quarter ended June 30, 2005, File No. 1-12387). + 10.3010.14 — Amendment No. 2 to the Deferred Compensation Plan (incorporated herein by reference to Exhibit 10.42 of the registrant’s Quarterly Report on Form 10-Q for the quarter ended June 30, 2005, File No. 1-12387). + 10.3110.15 — Supplemental Retirement Plan (incorporated herein by reference to Exhibit 10.43 of the registrant’s Quarterly Report on Form 10-Q for the quarter ended June 30, 2005, File No. 1-12387). + 10.3210.16 — Supplemental Pension Plan for Management (incorporated herein by reference to Exhibit 10.45 of the registrant’s Quarterly Report on Form 10-Q for the quarter ended June 30, 2005, File No. 1-12387). + 10.3310.17 — Amended and Restated Value Added (“TAVA”) Incentive Compensation Plan, effective January 1, 2006 (incorporated herein by reference to Exhibit 10.47 of the registrant’s Annual Report on Form 10-K for the year ended December 31, 2005, File No. 1-12387). + 10.3410.18 — Tenneco Inc. 2006 Long-Term Incentive Plan (incorporated herein by reference to Exhibit 99.1 of the registrant’s Current Report on Form 8-K, dated May 9, 2006). + 10.3510.19 — Form of Restricted Stock Award Agreement for non-employee directors under the Tenneco Inc. 2006 Long-Term Incentive Plan (incorporated herein by reference to Exhibit 99.2 of the registrant’s Current Report on Form 8-K, dated May 9, 2006).+10.36—Form of Stock Option Agreement for employees under the Tenneco Inc. 2006 Long-Term Incentive Plan (incorporated herein by reference to Exhibit 99.3 of the registrant’s Current Report on Form 8-K, dated May 9, 2006). + 10.3710.20 — Form of Restricted Stock Award Agreement for employees under the Tenneco Inc. 2006 Long-Term Incentive Plan (incorporated herein by reference to Exhibit 99.4 of the registrant’s Current Report on Form 8-K, dated May 9, 2006).+10.38—Form of First Amendment to the Tenneco Inc. Supplemental Pension Plan for Management (incorporated herein by reference to Exhibit 10.56 of the registrant’s Annual Report on Form 10-K for the year ended December 31, 2006, File No. 1-12387). + 10.3910.21 — Form of First Amendment to the Tenneco Inc. Supplemental Retirement Plan (incorporated herein by reference to Exhibit 10.57 of the registrant’s Annual Report on Form 10-K for the year ended December 31, 2006, File No. 1-12387). + 10.4010.22 — Letter Agreement dated January 5, 2007 between the registrant and Hari N. Nair (incorporated herein by reference to Exhibit 10.60 of the registrant’s Annual Report on Form 10-K for the year ended December 31, 2006, File No. 1-12387).+10.41—Letter Agreement between Tenneco Inc. and Gregg Sherrill (incorporated herein by reference to Exhibit 99.2 of the registrant’s Current Report on Form 8-K dated as of January 5, 2007, File No. 1-12387).+10.42—Letter Agreement between Tenneco Inc. and Gregg Sherrill, dated as of January 15, 2007 (incorporated herein by reference to Exhibit 99.1 of the registrant’s Current Report on Form 8-K dated as of January 15, 2007, File No. 1-12387).+10.43—Form of Restricted Stock Agreement between Tenneco Inc. and Gregg M. Sherrill (incorporated herein by reference to Exhibit 10.63 of the registrant’s Annual Report on Form 10-K for the year ended December 31, 2006, File No. 1-12387).+10.44—Form of Long-Term Performance Unit Award Under the 2006 Long-Term Incentive Plan (stub period award for 2007) (incorporated herein by reference to Exhibit 10.64 of the registrant’s Quarterly Report on Form 10-Q for the quarter ended June 30, 2007, File No. 1-12387).ExhibitNumberDescription+10.45—Form of Long-Term Performance Unit Award Under the 2006 Long-Term Incentive Plan (three-year award for 2007-2009 period) (incorporated herein by reference to Exhibit 10.65 of the registrant’s Quarterly Report on Form 10-Q for the quarter ended June 30, 2007, File No. 1-12387).+10.46—Tenneco Inc. Change in Control Severance Benefit Plan for Key Executives, as Amended and Restated effective December 12, 2007 (incorporated herein by reference to Exhibit 10.61 of the registrant’s Annual Report on Form 10-K for the year ended December 31, 2008, File No. 1-12387). + 10.4710.23 — Form of Long-Term Performance Unit Award Under the 2006 Long-Term Incentive Plan (stub period award for 2008) (incorporated herein by reference to Exhibit 10.67 of the registrant’s Annual Report on Form 10-K for the year ended December 31, 2007, File No. 1-12387).+10.48—Form of Long-Term Performance Unit Award Under the 2006 Long-Term Incentive Plan (three-year award for periods commencing with 2008) (incorporated herein by reference to Exhibit 10.68 of the registrant’s Annual Report on Form 10-K for the year ended December 31, 2007, File No. 1-12387).+10.49—Letter Agreement dated January 5, 2007 between the registrant and Timothy E. Jackson (incorporated herein by reference to Exhibit 10.69 of the registrant’s Annual Report on Form 10-K for the year ended December 31, 2007, File No. 1-12387).+10.50—Excess Benefit Plan, including Supplements for Gregg M. Sherrill and Kenneth R. Trammell (incorporated herein by reference to Exhibit 10.65 of the registrant’s Annual Report on Form 10-K for the year ended December 31, 2008, File No. 1-12387). + 10.5110.24 — Amendment No. 2 to Change in Control Severance Benefit Plan for Key Executives (incorporated herein by reference to Exhibit 10.66 of the registrant’s Annual Report on Form 10-K for the year ended December 31, 2008, File No. 1-12387). + 10.5210.25 — Incentive Deferral Plan, as Amended and Restated Effective as of January 1, 2008 (incorporated herein by reference to Exhibit 10.67 of the registrant’s Annual Report on Form 10-K for the year ended December 31, 2008, File No. 1-12387). + 10.5310.26 — Code Section 409A Amendment to 2002 Long-Term Incentive Plan (incorporated herein by reference to Exhibit 10.68 of the registrant’s Annual Report on Form 10-K for the year ended December 31, 2008, File No. 1-12387). + 10.5410.27 — Code Section 409A Amendment to 2006 Long-Term Incentive Plan (incorporated herein by reference to Exhibit 10.69 of the registrant’s Annual Report on Form 10-K for the year ended December 31, 2008, File No. 1-12387). + 10.5510.28 — Code Section 409A to Excess Benefit Plan (incorporated herein by reference to Exhibit 10.70 of the registrant’s Annual Report on Form 10-K for the year ended December 31, 2008, File No. 1-12387). + 10.5610.29 — Code Section 409A Amendment to Supplemental Retirement Plan (incorporated herein by reference to Exhibit 10.71 of the registrant’s Annual Report on Form 10-K for the year ended December 31, 2008, File No. 1-12387). +10.57 —Description+10.30 — Code Section 409A Amendment to Supplemental Pension Plan for Management (incorporated herein by reference to Exhibit 10.72 of the registrant’s Annual Report on Form 10-K for the year ended December 31, 2008, File No. 1-12387). + 10.5810.31 — Code Section 409A Amendment to Amended and Restated Value Added (“TAVA”) Incentive Compensation Plan (incorporated herein by reference to Exhibit 10.73 of the registrant’s Annual Report on Form 10-K for the year ended December 31, 2008, File No. 1-12387). + 10.5910.32 — Code Section 409A Amendment to Letter Agreement between the registrant and Gregg M. Sherrill (incorporated herein by reference to Exhibit 10.74 of the registrant’s Annual Report on Form 10-K for the year ended December 31, 2008, File No. 1-12387).ExhibitNumberDescription+10.60—Code Section 409A Amendment to Letter Agreement between the registrant and Hari N. Nair (incorporated herein by reference to Exhibit 10.75 of the registrant’s Annual Report on Form 10-K for the year ended December 31, 2008, File No. 1-12387).+10.61—Code Section 409A Amendment to Letter Agreement between the registrant and Timothy E. Jackson (incorporated herein by reference to Exhibit 10.76 of the registrant’s Annual Report on Form 10-K for the year ended December 31, 2008, File No. 1-12387). 10.62—Second Amended and Restated Receivables Purchase Agreement, dated as of May 4, 2005, among the registrant, as Servicer, Tenneco Automotive RSA Company, as Seller, Jupiter Securitization Corporation and Liberty Street Funding Corp., as Conduits The Bank of Nova Scotia, JP Morgan Chase Bank, N.A. and the Committed Purchasers from time to time party thereto, and Amendments 1 through 10 thereto (incorporated herein by reference to Exhibit 10.77 of the registrant’s Annual Report on Form 10-K for the year ended December 31, 2008, File No. 1-12387). 10.63—Amendment No. 11, dated as of April 29, 2009, to Second Amended and Restated Receivable Purchase Agreement (incorporated herein by reference to Exhibit 10.1 of the registrant’s Quarterly Report on Form 10-Q for the quarter ended March 31, 2009, File No. 1-12387).+10.64—Tenneco Inc. 2006 Long-Term Incentive Plan (as amended and restated effective March 11, 2009) (incorporated herein by reference to Appendix A of the registrant’s proxy statement on Schedule 14A, filed with the Securities and Exchange Commission on March 31, 2009, File No. 1-12387). 10.65+10.33 — Amendment No. 12, dated as of June 25, 2009, to Second Amended and Restated Receivable Purchase Agreement (incorporated herein by reference to Exhibit 10.1 of the registrant’s Quarterly Report on Form 10-Q for the quarter ended June 30, 2009, File No. 1-12387). 10.66—Amendment No. 13, dated as of July 31, 2009, to Second Amended and Restated Receivable Purchase Agreement (incorporated herein by reference to Exhibit 10.2 of the registrant’s Quarterly Report on Form 10-Q for the quarter ended June 30, 2009, File No. 1-12387). 10.67—Underwriting Agreement, dated November 18, 2009, between Tenneco Inc. and the underwriters named therein (incorporated herein by reference to Exhibit 1.1 of the registrant’s Current Report on Form 8-K filed November 19, 2009, File No. 1-12387).+10.68—Amendment No. 2, effective January 15, 2010, to Amended and Restated Tenneco Value Added Incentive Compensation Plan (incorporated herein by reference to Exhibit 10.70 of the registrant’s Annual Report on Form 10-K for the year ended December 31, 2009, File No. 1-12387). + 10.6910.34 — Amendment dated December 18, 2009, to Tenneco Inc. Incentive Deferral Plan (incorporated herein by reference to Exhibit 10.71 of the registrant’s Annual Report on Form 10-K for the year ended December 31, 2009, File No. 1-12387). + 10.7010.35 — Form of Amendment toTenneco Inc. Three Year Long-Term Performance Unit Award under the 2006 Long-Term Incentive Plan (three year award for 2007-2009 period)Agreement (incorporated herein by reference to Exhibit 10.7210.1 of the registrant’s AnnualCurrent Report on Form 10-K for the year ended December 31, 2009,8-K dated as of March 15, 2010, File No. 1-12387).+ 10.7110.36 — Form of Amendment to Long-Term Performance Unit Award under theTenneco Inc. 2006 Long-Term Incentive Plan (three year award for 2008-2010 period)Restricted Stock Award Agreement (incorporated herein by reference to Exhibit 10.7310.1 of the registrant’s AnnualQuarterly Report on Form 10-K10-Q for the yearquarter ended December 31, 2009,September 30, 2010, File No. 1-12387). 10.72+10.37 — Second Amendment to Tenneco Inc. Incentive Deferral Plan effective as of January 1, 2011 (incorporated herein by reference to Exhibit 10.1 of the registrant’s Quarterly Report on Form 10-Q for the quarter ended September 30, 2010, File No. 1-12387). +10.38 — First Amendment No. 14, dated February 19, 2010, to SecondTenneco Inc. Change in Control Severance Benefit Plan for Key Executives, as Amended and Restated Receivables Purchaseeffective December 12, 2007 (incorporated herein by reference to Exhibit 10.3 of the registrant’s Quarterly Report on Form 10-Q for the quarter ended March 31, 2011, File No. 1-12387).+10.39 — Form of Restricted Stock Award for Non-Employee Directors under Tenneco Inc. 2006 Long-Term Incentive Plan (incorporated herein by reference to Exhibit 10.1 of the registrant’s Current Report on Form 8-K dated January 18, 2012, File No. 1-12387). +10.40 — Form of Restricted Stock Award for Employees under Tenneco Inc. 2006 Long-Term Incentive Plan (incorporated herein by reference to Exhibit 10.2 of the registrant’s Current Report on Form 8-K dated January 18, 2012, File No. 1-12387). +10.41 — Form of Non-Qualified Stock Option Agreement for Employees under Tenneco Inc. 2006 Long-Term Incentive Plan (incorporated herein by reference to Exhibit 10.3 of the registrant’s Current Report on Form 8-K dated January 18, 2012, File No. 1-12387). +10.42 — Letter Agreement between Tenneco Inc. and Gregg M. Sherrill (incorporated herein by reference to Exhibit 99.2 of the registrant's Current Report on Form 8-K dated as of January 5, 2007. File No. 1-12387). +10.43 — Letter Agreement between Tenneco Inc. and Gregg M. Sherrill, dated as of January 15, 2007 (incorporated herein by reference to Exhibit 99.1 of the registrant’s Current Report on Form 8-K dated as of January 15, 2007, File No. 1-12387). +10.44 — Code Section 409A Amendment to Letter Agreement between the registrant and Gregg M. Sherrill (incorporated herein by reference to Exhibit 10.74 of the registrant’s Annual Report on Form 10-K for the year ended December 31, 2009,2008, File No. 1-12387).+10.45 — Letter Agreement dated January 5, 2007 between registrant and Hari N. Nair (incorporated herein by Exhibit 10.28 of the registrant's Annual Report on Form 10-K for the year ended December 31, 2008, File No. 1-12387). +10.46 — Letter Agreement dated January 5, 2007 between the registrant and Hari N. Nair (incorporated herein by reference to Exhibit 10.60 of the registrant’s Annual Report on Form 10-K for the year ended December 31, 2006, File No. 1-12387). +10.47 — Code Section 409A Amendment to Letter Agreement between the registrant and Hari N. Nair (incorporated herein by reference to Exhibit 10.75 of the registrant’s Annual Report on Form 10-K for the year ended December 31, 2008, File No. 1-12387). +10.48 — General Manager Service Contract, dated as of March 1, 2007, between Heinrich Gillet GmbH and Josep Fornos (incorporated herein by reference from Exhibit 10.87 of the registrant’s Annual Report on Form 10-K for the year ended December 31, 2011, File No. 1-12387). 10.73*+10.49 — Letter of Understanding, dated as of January 2012, between Tenneco Inc. and Josep Fornos. 10.50 — Third Amended and Restated Receivables Purchase Agreement, dated as of March 26, 2010, among Tenneco Automotive RSA Company, as Seller, Tenneco Automotive Operating Company Inc., as Servicer, Falcon Asset Securitization Company LLC and Liberty Street Funding LLC, as Conduits, the Committed Purchasers from time to time party thereto, JPMorgan Chase Bank, N.A., The Bank of Nova Scotia and Wells Fargo Bank, N.A., as Co-Agents and JPMorgan Chase Bank, N.A., as Administrative Agent (incorporated herein by reference to Exhibit 10.1 of the registrant’s Current Report on Form 8-K dated as of March 26, 2010, File No. 1-12387). 10.7410.51 — Intercreditor Agreement, dated as of March 26, 2010, among Tenneco Automotive RSA Company, Tenneco Automotive Operating Company Inc., JPMorgan Chase Bank, N.A. and Wells Fargo Bank, N.A. (incorporated herein by reference to Exhibit 10.2 of the registrant’s Current Report on Form 8-K dated as of March 26, 2010, File No. 1-12387). 10.7510.52 — Omnibus Amendment No. 4, dated as of March 26, 2010, to Receivables Sale Agreements, as amended (incorporated herein by reference to Exhibit 10.3 of the registrant’s Current Report on Form 8-K dated as of March 26, 2010, File No. 1-12387). 10.7610.53 — SLOT Receivables Purchase Agreement, dated as of March 26, 2010, among Tenneco Automotive RSA Company, as Seller, Tenneco Automotive Operating Company Inc., as Servicer, and Wells Fargo Bank, N.A., individually and as SLOT Agent (incorporated herein by reference to Exhibit 10.4 of the registrant’s Current Report on Form 8-K dated as of March 26, 2010, File No. 1-12387). 10.7710.54 — Fourth Amended and Restated Performance Undertaking, dated as of March 26, 2010, by the registrant in favor of Tenneco Automotive RSA Company (incorporated herein by reference to Exhibit 10.5 of the registrant’s Current Report on Form 8-K dated as of March 26, 2010, File No. 1-12387). +10.7810.55 — Form of Tenneco Inc. Three Year Long-Term Performance Unit Award Agreement (incorporated herein by reference to Exhibit 10.1 of the registrant’s Current Report on Form 8-K dated as of March 15, 2010, File No. 1-12387).+10.79—Form of Tenneco Inc. 2006 Long-Term Incentive Plan Restricted Stock Award Agreement (incorporated herein by reference to Exhibit 10.1 of the registrant’s Quarterly Report on Form 10-Q for the quarter ended September 30, 2010, File No. 1-12387).+10.80—Second Amendment to Tenneco Inc. Incentive Deferral Plan effective as of January 1, 2011 (incorporated herein by reference to Exhibit 10.1 of the registrant’s Quarterly Report on Form 10-Q for the quarter ended September 30, 2010, File No. 1-12387). 10.81—Amendment No. 1 to Third Amended and Restated Receivables Purchase Agreement, dated as of March 25, 2011, among Tenneco Automotive RSA Company, as Seller, Tenneco Automotive Operating Company Inc., as Servicer, Falcon Asset Securitization Company LLC and Liberty Street Funding LLC, as Conduits, the Committed Purchasers from time to time party thereto, JPMorgan Chase Bank, N.A., The Bank of Nova Scotia and Wells Fargo Bank, N.A., as Co-Agents and JPMorgan Chase Bank, N.A., as Administrative Agent (incorporated herein by reference from Exhibit 10.1 of the registrant’s Current Report on Form 8-K dated as of March 29, 2011, File No. 1-12387). 10.8210.56 — Amendment No. 1 to SLOT Receivables Purchase Agreement, dated as of March 25, 2011, among Tenneco Automotive RSA Company, as Seller, Tenneco Automotive Operating Company Inc. as Servicer, and Wells Fargo Bank, N.A., individually and as SLOT Agent (incorporated herein by reference from Exhibit 10.2 of the registrant’s Current Report on Form 8-K dated as of March 29, 2011, File No. 1-12387). +10.8310.57 — First Amendment No. 2 to Tenneco Inc. Change in Control Severance Benefit Plan for Key Executives, asThird Amended and Restated effective December 12, 2007Receivables Purchase Agreement, dated as of March 23, 2012 (incorporated herein by reference to Exhibit 10.3 of the registrant’s Quarterly Report on Form 10-Q for the quarter ended March 31, 2011, File No. 1-12387).ExhibitNumberDescription +10.84—Form of Restricted Stock Award for Non-Employee Directors (incorporated herein by reference tofrom Exhibit 10.1 of the registrant’s Current Report on Form 8-K dated January 18,as of March 26, 2012, File No. 1-12387). +10.8510.58 — FormAmendment No. 2 to SLOT Receivables Purchase Agreement, dated as of Restricted Stock Award for EmployeesMarch 23, 2012 (incorporated herein by reference tofrom Exhibit 10.2 of the registrant’s Current Report on Form 8-K dated January 18,as of March 26, 2012, File No. 1-12387). +10.8610.59 — Form of Non-Qualified Stock OptionOmnibus Amendment No. 5 to Receivables Sale Agreements and Amendment No. 3 to Third Amended and Restated Receivables Purchase Agreement, for Employeesdated March 22, 2013 (incorporated herein by reference from Exhibit 10.1 of the registrant’s Current Report on Form 8-K dated as of March 22, 2013, File No. 1-12387).10.60 — Amendment No. 3 to SLOT Receivables Purchase Agreement, dated as of March 22, 2013 (incorporated herein by reference from Exhibit 10.2 of the registrant’s Current Report on Form 8-K dated as of March 22, 2013, File No. 1-12387). 10.61 — Amendment No. 4 to SLOT Receivables Purchase Agreement, dated May 22, 2013 (incorporated herein by reference from Exhibit 10.41of the registrant’s Current Report on Form 8-K dated as of May 28, 2013, File No. 1-12387). +10.62 — Tenneco Inc. Executive Bonus Plan (incorporated herein by reference from Exhibit 99.1 of the registrant’s Current Report on Form 8-K dated as of January 15, 2014, File No. 1-12387). +10.63 — Amended and Restated Tenneco Inc. 2006 Long-Term Incentive Plan (effective March 18, 2013) (incorporated by reference to Appendix A of the Company’s Proxy Statement on Schedule 14A, filed with the Securities and Exchange Commission on April 3, 2013). +10.64 — Form of Restricted Stock Award Agreement for Employees under Tenneco Inc. 2006 Long-Term Incentive Plan (awards after May 21, 2013) (incorporated herein by reference from Exhibit 10.3 of the registrant’s Current Report on Form 8-K dated January 18, 2012,as of May 21, 2013, File No. 1-12387).+*10.87 Description +10.65 — General Manager Service Contract,Form of Stock Option Award Agreement for Employees under Tenneco Inc. 2006 Long-Term Incentive Plan (awards after May 21, 2013) (incorporated herein by reference from Exhibit 10.4 of the registrant’s Current Report on Form 8-K dated as of March 1, 2007, between Heinrich Gillet GmbH and Josep Fornos.May 21, 2013, File No. 1-12387).+ *10.8810.66— LetterForm of Understanding,Tenneco Inc. Long-Term Performance Unit Award Agreement under Tenneco Inc. 2006 Long-Term Incentive Plan (grants after January 14, 2014) (incorporated herein by reference from Exhibit 99.2 of the registrant’s Current Report on Form 8-K dated as of December 2, 2010, between Tenneco Inc. and Josep Fornos.January 15, 2014, File No. 1-12387).11 — None. *12*12 — Computation of Ratio of Earnings to Fixed Charges. 13 — None. 14 — Tenneco Inc. Code of Ethical Conduct for Financial Managers (incorporated herein by reference from Exhibit 99.3 to the registrant’s Annual Report on Form 10-K for the year ended December 31, 2002, File No. 1-12387). 16.116 — Letter from Deloitte & Touche LLP to the Securities and Exchange Commission dated August 6, 2009 (incorporated herein by reference to Exhibit 10.1 of the registrant’s Current Report on Form 8-K dated August 6, 2009, File No. 1-12387). 16.2—Letter from Deloitte & Touche LLP to the Securities and Exchange Commission dated March 3, 2010 (incorporated herein by reference to Exhibit 16.1 of the registrant’s Current Report on Form 8-K dated March 3, 2010, File No. 1-12387). 18—None. *2118 — None. *21 — List of Subsidiaries of Tenneco Inc. 22 — None. *23.1*23.1 — Consent of PricewaterhouseCoopers LLP. *23.2*24.1 — Consent of Deloitte & Touche LLP. *24—Powers of Attorney. *31.1*31.1 — Certification of Gregg M. Sherrill under Section 302 of the Sarbanes-Oxley Act of 2002. *31.2*31.2 — Certification of Kenneth R. Trammell under Section 302 of the Sarbanes-Oxley Act of 2002. *32.1*32.1 — Certification of Gregg M. Sherrill and Kenneth R. Trammell under Section 906 of the Sarbanes-Oxley Act of 2002. 33 — None. 34 — None. 35 — None. 99 — None. 100 — None. 101 — None. *101.INS — XBRL Instance Document. *101.SCH — XBRL Taxonomy Extension Schema Document. *101.CAL — XBRL Taxonomy Extension Calculation Linkbase Document. *101.DEF — XBRL Taxonomy Extension Definition Linkbase Document. *101.LAB — XBRL Taxonomy Extension Label Linkbase Document. *101.PRE — XBRL Taxonomy Extension Presentation Linkbase Document. * Filed herewith. + Indicates a management contract or compensatory plan or arrangement. TENNECO INC. By Gregg M. Sherrill Chairman and Chief Executive Officer 24, 201224, 2011.28, 2014. /S/ GREGG M. SHERRILL Gregg M. Sherrill Chairman President and Chief Executive OfficerGregg M. Sherrill /S/ KENNETH R. TRAMMELL Kenneth R. Trammell Kenneth R. Trammell * Paul D. Novas Vice President and Controller (principal accounting officer) Paul D. Novas * Director Thomas C. Freyman * Director Dennis J. Letham DirectorDirector Hari N. Nair DirectorDirector Roger B. Porter DirectorDirector David B. Price, Jr. DirectorDirector Paul T. Stecko Director*Mitsunobu Takeuchi DirectorDirector Jane L. Warner Director*By: 158