

UNITED STATES
SECURITIES AND EXCHANGE COMMISSION
WASHINGTON, D.C. 20549
FORM 10-K
(Mark one)
| x | ANNUAL REPORT PURSUANT TO SECTION 13 OR 15(d) OF THE SECURITIES EXCHANGE ACT OF 1934 |
For the fiscal year ended December 31, 20112012
OR
| ¨ | TRANSITION REPORT PURSUANT TO SECTION 13 OR 15(d) OF THE SECURITIES EXCHANGE ACT OF 1934 |
COMMISSION FILE NUMBER 1-16483
Kraft FoodsMondelēz International, Inc.
(Exact name of registrant as specified in its charter)
| Virginia | 52-2284372 | |
(State or other jurisdiction of incorporation or organization) | (I.R.S. Employer Identification No.) | |
| Three | ||
| (Address of principal executive offices) | (Zip Code) | |
Registrant’s telephone number, including area code:847-646-2000 847-943-4000
Securities registered pursuant to Section 12(b) of the Act:
Title of each class | Name of each exchange on which registered | |
| Class A Common Stock, no par value |
Securities registered pursuant to Section 12(g) of the Act:None
Indicate by check mark if the registrant is a well-known seasoned issuer, as defined in Rule 405 of the Securities Act. Yes x No ¨
Indicate by check mark if the registrant is not required to file reports pursuant to Section 13 or Section 15(d) of the Act. Yes ¨ No x
Note: Checking the box above will not relieve any registrant required to file reports pursuant to Section 13 or 15(d) of the Exchange Act from their obligations under those Sections.
Indicate by check mark whether the registrant (1) has filed all reports required to be filed by Section 13 or 15(d) of the Securities Exchange Act of 1934 during the preceding 12 months (or for such shorter period that the registrant was required to file such reports), and (2) has been subject to such filing requirements for the past 90 days. Yes x No ¨
Indicate by check mark whether the registrant has submitted electronically and posted on its corporate Web site, if any, every Interactive Data File required to be submitted and posted pursuant to Rule 405 of Regulation S-T (§ 232.405 of this chapter) during the preceding 12 months (or for such shorter period that the registrant was required to submit and post such files). Yes x No ¨
Indicate by check mark if disclosure of delinquent filers pursuant to Item 405 of Regulation S-K (§ 229.405 of this chapter) is not contained herein, and will not be contained, to the best of registrant’s knowledge, in definitive proxy or information statements incorporated by reference in Part III of this Form 10-K or any amendment to this Form 10-K. x
Indicate by check mark whether the registrant is a large accelerated filer, an accelerated filer, a non-accelerated filer, or a smaller reporting company. See the definitions of “large accelerated filer,” “accelerated filer” and “smaller reporting company” in Rule 12b-2 of the Exchange Act. (Check one):
| Large accelerated filer x | Accelerated filer ¨ | Non-accelerated filer ¨ | Smaller reporting company ¨ | |||
| (Do not check if a smaller reporting company) | ||||||
Indicate by check mark whether the registrant is a shell company (as defined in Rule 12b-2 of the Act). Yes ¨ No x
The aggregate market value of the shares of Class A Common Stock held by non-affiliates of the registrant, computed by reference to the closing price of such stock on June 30, 2011,2012, was $62$69 billion. At January 31, 2012,2013, there were 1,768,235,0211,778,287,539 shares of the registrant’s Class A Common Stock outstanding.
Documents Incorporated by Reference
Portions of the registrant’s definitive proxy statement to be filed with the Securities and Exchange Commission in connection with its annual meeting of shareholders expected to be held on May 23, 201221, 2013 are incorporated by reference into Part III hereof.
Kraft FoodsMondelēz International, Inc.
| Page No. | ||||||
| Part I – | ||||||
| Item 1. | 1 | |||||
| Item 1A. | ||||||
| Item 1B. | 15 | |||||
| Item 2. | 15 | |||||
| Item 3. | 16 | |||||
| Item |
| |||||
| ||||||
| Part II – | ||||||
| Item 5. | ||||||
| Item 6. | 19 | |||||
| Item 7. | Management’s Discussion and Analysis of Financial Condition and | 20 | ||||
| 21 | ||||||
| 43 | ||||||
| 44 | ||||||
Off-Balance Sheet Arrangements and Aggregate Contractual Obligations | 46 | |||||
| 47 | ||||||
| ||||||
| ||||||
| Item 7A. | 52 | |||||
| Item 8. | 53 | |||||
Report of Management on Internal Control over Financial Reporting | 53 | |||||
| 54 | ||||||
| 55 | |||||
| 56 | ||||||
| 57 | ||||||
| 58 | ||||||
| 59 | ||||||
| 60 | ||||||
| ||||||
| ||||||
| Item 9. | Changes in and Disagreements with Accountants on Accounting | |||||
| Item 9A. | ||||||
| Item 9B. | ||||||
| Part III – | ||||||
| Item 10. | ||||||
| Item 11. | ||||||
| Item 12. | Security Ownership of Certain Beneficial Owners and Management | |||||
| Item 13. | Certain Relationships and Related Transactions, and Director | |||||
| Item 14. | ||||||
| Part IV – | ||||||
| Item 15. | ||||||
Report of Independent Registered Public Accounting Firm on | S-1 | |||||
| S-2 | ||||||
In this report, “Kraft Foods,” “the Company,”for all periods presented, “we,” “us”“us,” “our,” and “our” refers“Mondelēz International,” refer to Mondelēz International, Inc. and subsidiaries (formerly Kraft Foods Inc. and subsidiaries, andsubsidiaries). References to “Common Stock” refersrefer to Kraft Foods’our Class A common stock.
i
Forward-looking Statements
This report contains a number of forward-looking statements. Words, and variations of words, such as “goals,” “expect,” “goals,“plan,” “plans,“drive,” “focus,” “believe,” “continue,“anticipate,” “may,” “will,”“estimate” and similar expressions are intended to identify our forward-looking statements, including but not limited to those related to our strategy,Strategy, in particular, our proposed spin-off, expectations for the Global Snacks Businessgoal to deliver top-tier financial performance, our expectation to drive substantial growth, our market-leading positions, our expansion plans, sales and expectations for the North American Grocery Business;earnings growth and our Power Brands and Priority Markets; Spin-Off Costs; price volatility; cost environment; measures to address increased costs; raw material prices and supply; new food lawlaws and regulations; ourenvironmental compliance and resolutions; relationships with employees and representative organizations;representatives; our properties; our legal proceedings, including environmental remediation actions; that our spin-off will be tax-free and is subject to conditions; our combination withLegal Matters; Cadbury including, synergies and cost savings;synergies; Restructuring Program costs; Integration Program costs; deferred tax assets; our accounting estimates; our pension plansU.S. Confections and otherEurope Biscuits fair value; employee benefit plans, including expectedplan net expenses, obligations and assumptions; pension expenses, contributions obligations, rates of return and costs; commodity costs; our liquidity, effects onassumptions; pension costs related to the Hostess bankruptcy; our liquidity and funding sources; our capital expenditures and funding; our revolving credit facility; use of net proceeds of January 2012 notes; ourfinancial and long-term debt covenantscovenants; debt repayment and expected funding; effects of guarantees on our liquidity;guarantees; our aggregate contractual obligations; dividends; our 20122013 Outlook, including, organic net revenuein particular, 2013 Organic Net Revenue growth and Operating EPS; and our risk management program, including the use of financial instruments for hedging activities.
These forward-looking statements are subject to a number of risks and uncertainties, and the cautionary statements contained in the “Risk Factors” found in this Annual Report on Form 10-K identify important factors that could cause actual results to differ materially from those in our forward-looking statements. Such factors include, but are not limited to, continued volatility of and sharp increase in, commodity and other input costs, pricing actions, increased competition, our ability to differentiate our products from retailer brands, increased costs of sales, our indebtedness and our ability to pay our indebtedness, unexpected safety or manufacturing issues, regulatory or legal restrictions, actions or delays, unanticipated expenses such as litigation or legal settlement expenses, a shift in our product mix to lower margin offerings, private label, risks from operating internationally,globally, continued consumer weakness, weakness in economic conditions, performance in developing marketsour labor force and tax law changes. We disclaim and do not undertake any obligation to update or revise any forward-looking statement in this report.
General
Kraft FoodsMondelēz International is one of the world’s second largest food companysnack companies with global net revenues of $54.4$35.0 billion and earnings from continuing operations before income taxes of $4.8$1.6 billion in 2011. Kraft Foods was incorporated2012. Beginning on October 1, 2012, following the spin-off of our North American grocery operations to our shareholders (the “Spin-Off”), Mondelēz International is a “new” company in 2000 inname and strategy, yet we carry forward the Commonwealthvalues of Virginia.our legacy organization and the heritage of our iconic brands.
Our vision is toCreate Delicious Moments of Joy. We have approximately 126,000 employees worldwide,support this vision by manufacturing and we manufacturemarketing delicious food and market packaged foodbeverage products including biscuits, confectionery, beverages, cheese, convenient meals and various packaged grocery products. We sell our products tofor consumers in approximately 170 countries. At December 31, 2011, we had operations in more than 80165 countries and made our products at 220 manufacturing and processing facilities worldwide. At December 31, 2011, we had net assets of $35.3 billion and gross assets of $93.8 billion. around the world.
We are a memberGlobal Snacks Powerhouse. We hold leading market shares in every category and every region of the Dow Jones Industrial Average, Standard & Poor’s 500,world in which we compete. We hold the Dow Jones Sustainability IndexNo. 1 position globally in biscuits, chocolate, candy and powdered beverages as well as the Ethibel Sustainability Index.
At December 31, 2011, ourNo. 2 position in gum and coffee. Our portfolio included twelveincludes nine brands with annual revenues exceeding $1 billion each:each includingOreo,Nabisco andLU biscuits;Milka, Cadbury Dairy Milk andCadbury chocolates;Trident gum;Jacobs andMaxwell House coffees;Philadelphia cream cheeses;Kraft cheeses, dinners and dressings;Oscar Mayer meats;coffee; andTang powdered beverage. OurIn addition, our portfolio included approximately 80of snack foods and refreshments includes 52 brands which each generategenerated annual revenues of more than $100 million.million in 2012.
BecauseUpon completing the Spin-Off of Kraft Foods Group, Inc., we changed our name from Kraft Foods Inc. isto Mondelēz International, Inc. Our name reflects our vision to create a holding company,moredelicious world in which to live. Following the Spin-Off, on October 2, 2012, our principal sourceshares began to trade on The NASDAQ Global Select Market under the new symbol “MDLZ.” We remain incorporated in the Commonwealth of funds is fromVirginia since 2000 and we continue to be a proud member of the Standard & Poor’s 500 and the Dow Jones Sustainability Index. (For more information on theSpin-Off of Kraft Foods Group, seeSignificant Divestitures and Acquisitions below and Note 2,Divestitures and Acquisitions, to the consolidated financial statements.)
Strategy
As a Global Snacks Powerhouse, we intend to leverage our subsidiaries. Our wholly owned subsidiaries currently are not limitedcore strengths, including market leadership positions across our categories and a significant presence in every geography, to achieve two primary goals: deliver top-tier financial performance and be a great place to work. We plan to achieve these goals by long-term debt or other agreements in their ability to pay cash dividends or make other distributions with respect to their Common Stock.executing five strategies:
| • | Unleash the Power of Our People. We recognize the importance of our people living out our shared vision and delivering on our shared goals with joy, commitment and unquestioned integrity. With our employees, we are creating collaborative, creative, learning communities to share good ideas and execute plans more efficiently and effectively. |
| • | Transform Snacking. Our globalPower Brands are the heart of our competitive advantage. They enable us to fulfill consumers’ needs with a full range of snacking choices that fuel the body, treat the spirit and boost the mind. By skewing resources to these brands, we expect to drive substantial growth. In addition, our global innovation platforms, such as those that help consumers “sustain energy” or “satisfy hunger,” allow us to quickly adapt successful products from one market to many others. By meeting the needs of consumers and continually innovating our existing portfolio of products, we expect to grow and maintain our market-leading positions. |
| • | Revolutionize Selling.Following our acquisitions of theLUbiscuit business in 2007 and Cadbury Limited in 2010, we significantly expanded our routes to market around the globe, particularly in emerging markets. We plan to expand and further develop best-in-class sales and distribution capabilities across our key markets in both developing and developed markets. |
| • | Drive Efficiency to Fuel Growth.We drive growth by managing our business through a virtuous cycle to deliver great quality at advantaged costs. To drive sales and earnings growth, we focus on ourPower Brands andPriority Markets, we work to expand margins through overhead discipline and by leveraging lean and simple cost management programs within our integrated supply chain. We then reinvest savings to pursue additional targeted growth opportunities within our portfolio. |
| • | Protect the Well-being of Our Planet. We are committed to growing our business while protecting our planet and its people. To accomplish this, we deliver safe, high-quality foods and ensure a safe work environment for our employees. We also create foods that fit the way people eat today and provide balanced snacking choices by inventing new solutions and improving our nutritional profile. We protect our resources, focusing on where we can have the greatest impact. We empower farming communities to deliver innovative solutions throughout our ingredient supply chain. We drive resource efficiency and design sustainability into our operations to minimize the toll we have on the planet. |
Reportable Segments
We manage our global business and report operating results through three geographic units: Kraft Foods North America, Kraft FoodsDeveloping Markets, Europe and Kraft Foods Developing Markets. We manageNorth America. In connection with the operationsdivestiture of Kraft Foods North AmericaGroup, we divested and Kraft Foods Europe by product category, and we manageno longer report on the operations of Kraft Foods Developing Markets by location. Our reportablefollowing segments arewithin our results from continuing operations: U.S. Beverages, U.S. Cheese, U.S. Convenient Meals and U.S. Grocery, U.S. Snacks, Canada &Grocery. Our remaining businesses within North America Foodservice, Kraft Foodsare predominantly snacks businesses. Our segment results in this Annual Report on Form 10-K reflect these changes for all periods presented.
Beginning in 2013, our segment structure will change. In December 2012, we announced a reorganization of our business and reporting structure following the Spin-Off. Effective January 1, 2013, our operations, management and segments will be reorganized into five operating segments: Asia Pacific; Eastern Europe, Middle East & Africa (“EEMEA”); Europe; Latin America and Kraft Foods Developing Markets.North America. Accordingly, we will begin to report on our new segment structure during the first quarter of 2013 and reflect the change for all the historical periods we present.
As further discussed in Note 16,Segment Reporting, to the consolidated financial statements, weWe use segment operating income to evaluate segment performance and to allocate resources. We believe this measure is most relevant to investors in order to analyze segment results and trends. As further discussed in Note 16,Segment Reporting, to the consolidated financial statements, segment operating income excludes unrealized gains and losses on hedging activities (which are a component of cost of sales), certain components of our U.S. pension plan cost (which isare a component of cost of sales and selling, general and administrative expenses), gains / (losses) on divestitures, acquisition-related costs (which are a component of selling, general and administrative expenses), general corporate expenses (which are a component of selling, general and administrative expenses) and amortization of intangibles.
1
During the last three fiscal years, our reportable segments contributed to total segment operating income as reflected below. See Note 16,Segment Reporting,for additional information, including total assets and net revenues by segment.
| 00,000,000 | 00,000,000 | 00,000,000 | ||||||||||
| For the Years Ended December 31, | ||||||||||||
| 2011 | 2010 | 2009 | ||||||||||
Kraft Foods North America: | ||||||||||||
U.S. Beverages | 5.9 | % | 8.4 | % | 9.3 | % | ||||||
U.S. Cheese | 8.3 | % | 8.9 | % | 12.2 | % | ||||||
U.S. Convenient Meals | 4.2 | % | 4.0 | % | 4.3 | % | ||||||
U.S. Grocery | 16.3 | % | 17.3 | % | 21.0 | % | ||||||
U.S. Snacks | 11.1 | % | 12.6 | % | 13.2 | % | ||||||
Canada & N.A. Foodservice | 8.9 | % | 8.7 | % | 8.5 | % | ||||||
Kraft Foods Europe | 18.4 | % | 16.6 | % | 14.4 | % | ||||||
Kraft Foods Developing Markets | 26.9 | % | 23.5 | % | 17.1 | % | ||||||
|
|
|
|
|
| |||||||
Total Segment Operating Income | 100.0 | % | 100.0 | % | 100.0 | % | ||||||
|
|
|
|
|
| |||||||
| For the Years Ended December 31, | ||||||||||||
| 2012 | 2011 | 2010 | ||||||||||
Developing Markets | 45.4% | 46.9% | 44.4% | |||||||||
Europe | 35.4% | 32.9% | 32.3% | |||||||||
North America | 19.2% | 20.2% | 23.3% | |||||||||
|
|
|
|
|
| |||||||
Total Segment Operating Income | 100.0% | 100.0% | 100.0% | |||||||||
|
|
|
|
|
| |||||||
Our brands span sixfive consumer sectors:
Biscuits– primarily (including cookies, crackers and salted snackssnacks)
Confectionery –primarily chocolate, gum and candyChocolate
Beverages– primarily coffee, packaged juice drinks and powdered beveragesGum & Candy
Cheese – primarily natural, processed and cream cheesesBeverages
Cheese & Grocery– primarily spoonable and pourable dressings, condiments and desserts
Convenient Meals– primarily processed meats and lunch combinations
During 2011,2012, our reportable segments participated in these sixfive consumer sectors as follows:
| Percentage of 2011 Net Revenues by Consumer Sector(1) | ||||||||||||||||||||||||||||
| Confec- | Convenient | |||||||||||||||||||||||||||
Segment | Biscuits | tionery | Beverages | Cheese | Grocery | Meals | Total | |||||||||||||||||||||
Kraft Foods North America: | ||||||||||||||||||||||||||||
U.S. Beverages | – | – | 31.1 | % | – | – | – | 5.5 | % | |||||||||||||||||||
U.S. Cheese | – | – | – | 49.4 | % | – | – | 7.0 | % | |||||||||||||||||||
U.S. Convenient Meals | – | – | – | – | – | 62.8 | % | 6.1 | % | |||||||||||||||||||
U.S. Grocery | – | 1.0 | % | – | – | 52.9 | % | 22.5 | % | 6.6 | % | |||||||||||||||||
U.S. Snacks | 42.8 | % | 6.9 | % | – | 0.8 | % | 1.1 | % | – | 11.6 | % | ||||||||||||||||
Canada & N.A. | 7.5 | % | 4.5 | % | 6.1 | % | 21.6 | % | 22.0 | % | 7.2 | % | 9.5 | % | ||||||||||||||
|
|
|
|
|
|
|
|
|
|
|
|
|
| |||||||||||||||
Total Kraft Foods | 50.3 | % | 12.4 | % | 37.2 | % | 71.8 | % | 76.0 | % | 92.5 | % | 46.3 | % | ||||||||||||||
|
|
|
|
|
|
|
|
|
|
|
|
|
| |||||||||||||||
Kraft Foods Europe | 21.7 | % | 37.4 | % | 32.6 | % | 15.3 | % | 8.7 | % | 5.1 | % | 24.6 | % | ||||||||||||||
Kraft Foods Developing | 28.0 | % | 50.2 | % | 30.2 | % | 12.9 | % | 15.3 | % | 2.4 | % | 29.1 | % | ||||||||||||||
|
|
|
|
|
|
|
|
|
|
|
|
|
| |||||||||||||||
Total Kraft Foods | 100.0 | % | 100.0 | % | 100.0 | % | 100.0 | % | 100.0 | % | 100.0 | % | 100.0 | % | ||||||||||||||
|
|
|
|
|
|
|
|
|
|
|
|
|
| |||||||||||||||
Consumer Sector Percentage | 22.1 | % | 28.5 | % | 17.8 | % | 14.2 | % | 7.7 | % | 9.7 | % | 100.0 | % | ||||||||||||||
|
|
|
|
|
|
|
|
|
|
|
|
|
| |||||||||||||||
| Percentage of 2012 Net Revenues by Consumer Sector | ||||||||||||||||||||||||
| Gum & | Cheese & | |||||||||||||||||||||||
Segment | Biscuits | Chocolate | Candy | Beverages | Grocery | Total | ||||||||||||||||||
Developing Markets | 10.0% | 12.8% | 8.8% | 8.2% | 4.8% | 44.6% | ||||||||||||||||||
Europe | 6.9% | 12.9% | 2.8% | 8.5% | 4.5% | 35.6% | ||||||||||||||||||
North America | 14.9% | 1.0% | 3.7% | – | 0.2% | 19.8% | ||||||||||||||||||
|
|
|
|
|
|
|
|
|
|
|
| |||||||||||||
Consumer Sector Percentage Total | 31.8% | 26.7% | 15.3% | 16.7% | 9.5% | 100.0% | ||||||||||||||||||
|
|
|
|
|
|
|
|
|
|
|
| |||||||||||||
2
ProductsWithin the consumer sectors, the classes of products which contributed 10% or more to consolidated net revenues for the years ended December 31, were:
| 00,000,000 | 00,000,000 | 00,000,000 | For the Years Ended December 31, | |||||||||||||||||||||
| 2011 | 2010 | 2009 | 2012 | 2011 | 2010 | |||||||||||||||||||
Biscuits (cookies and crackers) | 19% | 19% | 23% | 27% | 26% | 26% | ||||||||||||||||||
Chocolate | 18% | 17% | 11% | 27% | 27% | 26% | ||||||||||||||||||
Cheese | 14% | 14% | 18% | |||||||||||||||||||||
Gum & Candy | 15% | 16% | 16% | |||||||||||||||||||||
Coffee | 11% | 11% | 13% | 11% | 12% | 11% | ||||||||||||||||||
Gum & Candy | 10% | 10% | – | |||||||||||||||||||||
Our major brands within each reportable segmentSignificant Divestitures and consumer sector at December 31, 2011 were:
3
| ||
| ||
| ||
| ||
| ||
| ||
| ||
| ||
| ||
| ||
Proposed Spin-Off TransactionAcquisitions
Spin-Off of Kraft Foods Group:
On August 4, 2011,October 1, 2012 (the “Distribution Date”), we announced thatcompleted the spin-off of our Board of Directors intendsNorth American grocery business, Kraft Foods Group, Inc. (“Kraft Foods Group”), to create two independent public companies: (i) aour shareholders (the “Spin-Off”). Along with our other food and beverage categories, we also retained our global snacks business (the “Global Snacks Business”). On October 1, 2012, each of our shareholders of record as of the close of business on September 19, 2012 (“the Record Date”) received one share of Kraft Foods Group common stock for every three shares of our Common Stock held as of the Record Date. The distribution was structured to be tax free to our U.S. shareholders for U.S. federal income tax purposes.
Kraft Foods Group is now an independent public company and (ii)following the Spin-Off, we do not beneficially own any shares of Kraft Foods Group common stock.
The divested Kraft Foods Group business is presented as a discontinued operation on the consolidated statements of earnings for all periods presented. The Kraft Foods Group balance sheet, other comprehensive earnings and cash flows are included within our consolidated balance sheet and consolidated statements of equity, comprehensive earnings and cash flows through October 1, 2012.
In order to implement the Spin-Off, we entered into certain agreements with Kraft Foods Group to effect our legal and structural separation; govern the relationship between us; and allocate various assets, liabilities and obligations between us, including, among other things, employee benefits, intellectual property and tax-related assets and liabilities (see Note 14,Income Taxes, for additional information on the current and deferred tax assets and liabilities transferred or retained in the Spin-Off). In addition to executing the Spin-Off in the manner provided in the agreements, in November 2012, pursuant to these agreements, we paid Kraft Foods Group $163 million related to targeted cash flows (together with the $247 million of cash divested on the Distribution Date, totaling $410 million of cash transferred to Kraft Foods Group in connection with the Spin-Off). To facilitate the management, including final payment and resolution, of certain obligations, Kraft Foods Group retained certain of our North American grocery business (the “North American Grocery Business”). The Global Snacks Business will consistnet trade payables and receivables. We also retained approximately $140 million of our currentworkers’ compensation liabilities for claims incurred by Kraft Foods EuropeGroup employees prior to the Spin-Off. In November 2012, we paid Kraft Foods Group $95 million to cash settle the net trade payables and Developing Markets segmentsreceivables. As of December 31, 2012, we also have a $55 million receivable from Kraft Foods Group related to the cash settlement of stock awards held by our respective employees at the time of the Spin-Off as further described in Note 11,Stock Plans, to the consolidated financial statements.
Our results from continuing operations include one-time Spin-Off transaction, transition and financing and related costs (“Spin-Off Costs”) we have incurred to date. We recorded Spin-Off Costs of $1,053 million, or $0.39 per diluted share in 2012 and $46 million, or $0.02 per diluted share, in 2011. We expect to incur Spin-Off Costs of approximately $100 million in 2013 related primarily to human resource, customer service and logistics and information systems and processes as well as our North American snacklegal costs associated with revising intellectual property and confectionery businesses. The North American Grocery Business will primarily consist of our current U.S. Beverages, Cheese, Convenient Mealsother long-term agreements.
Refer to Note 2,Divestitures and Grocery segments, grocery – related categories in our Canada & N.A. Foodservice segment as well as thePlantersAcquisitions andCorn Nuts brands and businesses. We expect to create these companies through a U.S. tax-free spin-off of the North American Grocery Business to our shareholders.
The transaction is subject to a number of conditions, including the receipt of regulatory approvals, a favorable ruling from the Internal Revenue Service to ensure the U.S. tax-free status of the spin-off, execution of intercompany agreements, further diligence as appropriate and final approval from our Board of Directors. While our current target is to complete the spin-off before year-end 2012, we cannot assure that the spin-off will be completed on the anticipated timeline or that the terms of the spin-off will not change. See “Item 1A. Risk Factors” for certain risk factors relating, to the proposed spin-off transaction.
4
Significant Acquisitions and Divestituresconsolidated financial statements, for additional information on theSpin-Off of Kraft Foods Group.
Cadbury Acquisition:
On February 2,In 2010, we acquired 71.73%all the outstanding shares of Cadbury Limited (“Cadbury”) and as of June 1, 2010, we owned 100% of all outstanding Cadbury shares. The Cadburyin an acquisition was valued at $18,547 million, or $17,503 million net of cash and cash equivalents. WeIn 2010, we incurred acquisition-related transaction related feescosts of $218 million in 2010 and $40 million in 2009, which we recorded(recorded in selling, general and administrative expense. We also incurred acquisitionexpense) and acquisition-related financing fees of $96 million in 2010, which were recorded(recorded in interest and other expenses, net. net).
As a condition of ourthe acquisition, the EU Commission required that we divest certain Cadbury confectionery operations in Poland and Romania. The divestitures were completed in the third quarter of 2010 and generated $342 million of sale proceeds. The impact of these divestitures was reflected as adjustments within the Cadbury final purchase accounting.
During 2010, Cadbury contributed net revenues of $9,143 million and net earnings of $530 million from February 2, 2010 through December 31, 2010. We acquired Cadbury to create a global snacks powerhouse and an unrivaled portfolio of brands people love.
Pizza Divestiture:
On March 1, 2010, we completed the sale of the assets of our North American frozen pizza business (“Frozen Pizza”) to Nestlé USA, Inc. (“Nestlé”) for $3.7 billion. The Frozen Pizza business was a component of our U.S. Convenient Meals and Canada & N.A. Foodservice segments. The sale included theDiGiorno,Tombstone andJack’s brands in the U.S., theDelissio brand in Canada and theCalifornia Pizza Kitchen trademark license. It also included two Wisconsin manufacturing facilities (Medford and Little Chute) and the leases for the pizza depots and delivery trucks. Approximately 3,600 of our employees transferred with the business to Nestlé. As a result of the divestiture, we recorded a gain on discontinued operations of $1,596 million, or $0.92 per diluted share, in 2010.
See Note 3,2,AcquisitionsDivestitures and DivestituresAcquisitions, to our consolidated financial statements for additional information on these transactions.the Cadbury acquisition.
Customers
OurAs a percentage of our net revenues from continuing operations, our five largest customers accounted for approximately 21%15.6% of our net revenues in 20112012 compared with 23%15.5% in 20102011 and 27%15.1% in 2009. Our2010. Also, our ten largest customers accounted for approximately 29%24.1% of net revenues in 2012 compared with 22.7% in 2011 and 23.2% in 2010. No single customer accounted for 10% or more of our net revenues in 2011 compared with 31% in 2010 and 36% in 2009. Our largest customer, Wal-Mart Stores, Inc., accounted for approximately 12% of our net revenues in 2011 compared with 13% in 2010 and 16% in 2009.from continuing operations.
Seasonality
Demand for some of our products may be influenced by holidays, changes in seasons or other annual events. However, overall sales of our products are generally evenly balanced throughout the year due to the offsetting nature of demands for our products within our diversified product portfolio.
Competition
We face competition in all aspects of our business. Competitors include large national and international companies and numerous local and regional companies. Some competitors have different profit objectives and some international competitors are less susceptible to currency exchange rates. We also compete with generic products and retailer brands, wholesalers and cooperatives. We compete primarily on the basis of product quality, brand recognition, brand loyalty, service, marketing, advertising and price. Moreover, improving our market position or introducing a new product requires substantial research, development, advertising and promotional expenditures.
Distribution and Marketing
OurAcross our segments, our products are generally sold to supermarket chains, wholesalers, supercenters, club stores, mass merchandisers, distributors, convenience stores, gasoline stations, drug stores, value stores and other retail food outlets. In general, the retail trade for food products is consolidating. We distribute our products through distribution centers,direct store delivery, company-owned and satellite warehouses, company-operated and public cold-storage facilities, depotsdistribution centers and other facilities. We also use a combination of warehouse delivery and direct store delivery and usethe services of independent sales offices and agents primarily in some of our international locations.
Our marketing efforts are conducted through three principal sets of activities: (i) consumer marketing in on-air, print, outdoor, digital and digitalsocial media; (ii) consumer incentives such as coupons and contests; and (iii) trade promotions to support price features, displays and other merchandising of our products by our customers.
5
Raw Materials and Packaging
We purchase large quantities of commodities, including dairy,sugar and other sweeteners, coffee, cocoa, wheat, corn products, soybean and vegetable oils nuts, meat products, and sugar and other sweeteners.dairy. In addition, we use significant quantities of plastic, glass and cardboardpackaging materials to package our products and natural gas, fuels and electricity for our factories and warehouses. We continuouslyregularly monitor worldwide supply and cost trends of these commodities so we can act quickly to obtaincost-effectively secure ingredients and packaging neededrequired for production.
Significant cost items in biscuit, chocolate, confectionerygum & candy and many powdered beverage products are cocoasugar and sugar.cocoa. We purchase cocoasugar and sugarcocoa on world markets, and theirthe prices of these commodities are affected by the quality and availability of supply and changes in the value of the pound sterlingforeign currencies. Significant cost items in our biscuit products are grains (wheat, corn and the U.S. dollar relativesoybean oil). Grain costs have experienced volatility and have increased significantly in recent years due largely to certain other currencies. Cocoa bean, cocoa butterburgeoning global demand for food, livestock feed and sugar costs on average were higher in 2011 than in 2010. We purchase our dairy raw material requirements, including milk and cheese, from independent third partiesbiofuels such as agricultural cooperativesethanol and independent processors. The prices for milkbiodiesel and other dairy products are substantially influenced by market supply and demand,factors such as well as by government programs. Dairy commodity costs on average were higher in 2011 than in 2010.weather. The most significant cost item in coffee products is green coffee beans which we purchase on world markets.markets as well as from local grower cooperatives. Green coffee bean prices are affected by the quality and availability of supply, changes in the value of the U.S. dollar in relation to certain other currencies and consumer demand for coffee products. Green coffee bean costs on average were higher in 2011 than in 2010. Significant cost items in packaging include cardboards, resins and plastics and our biscuitenergy costs include natural gas, electricity and grocery productsdiesel fuel. We purchase these packaging and energy commodities on world markets and within the countries we operate, and the prices are grains (wheat, cornaffected by supply and soybean oil). Grain costs have experienced significant volatility and have increased from 2010 to 2011 due largely to burgeoning global demand for food, livestock feed and biofuels such as ethanol and biodiesel.changes in foreign currencies.
During 2011,2012, our aggregate commodity costs increased primarily as a result of higher costs of coffee, dairy,increased packaging, energy, grains and oils, packaging materials, other raw materials, meat and nuts. Our commodity costs increased approximately $2.6 billion in 2011 and approximately $1.0 billion in 2010 compared to the prior year.oil costs. We expect the price volatility and a slightly higher cost environment to continue over the remainder of 2013. We have addressed higher commodity costs primarily through higher pricing, lower manufacturing costs due to our end-to-end cost management program and overhead cost control. We expect to continue to use these measures to address further commodity cost volatility to continue in 2012.increases.
The prices for raw materials and agricultural materials used in our products are affected by externalExternal factors such as weather conditions, commodity market conditions, currency fluctuations and the effects of governmental agricultural programs.programs affect the prices for raw materials and agricultural materials used in our products. We use hedging techniques to limit the impact of price fluctuations in our principal raw materials. However, we do not fully hedge against changes in commodity prices, and these strategies may not protect us from increases in specific raw material costs. While the prices of our principal raw materials can be expected to fluctuate, we believe there will continue to be an adequate supply of the raw materials we use and that they will generally remain available from numerous sources.
Intellectual Property
Our intellectual property rights (including trademarks, patents, copyright, registered designs, proprietary trade secrets, technology and know-how) are material to our business.
We protect ourown numerous trademarks by registration or otherwiseand patents in countries around the U.S. and in other markets where we sell our products. Trademark protection continues in some countriesworld. Depending upon the country, trademarks remain valid for as long as the markthey are in use or their registration status is used and in other countries for as long as it is registered. Registrationsmaintained. Trademark registrations generally are for renewable, fixed terms. From time to time, we grant third parties licenses to use one or more of our trademarks in particular locations. Similarly, we sell some products under brands we license from third parties, including at December 31, 2011:
|
|
We also own numerous patents worldwide. We consider our portfolio of patents, patent applications, patents licenses under patents owned by third parties, proprietary trade secrets, technology, know – how processes and related intellectual property rights to be of material importance to our operations. While our patent portfolio is material to our business, the loss of one patent or a group of related patents would not have a material adverse effect on our business. We have either been issued patents or have patent applications pending for a number of current and potential products, including products licensed to others. Patents issued, or applied for,products. Our patents cover inventions ranging from basic packaging techniques to processes relating to specific products and to the products themselves. Our issued patents extend for varying periods according to the date of patent application filing or grant and the legal term of patents in the various countries where patent protection is obtained. The actual protection afforded by a patent, which can vary from country to country, depends upon the type of patent, the scope of its coverage as determined by the patent office or courts in the country, and the availability of legal remedies in the country. While our patent portfolio is material to our business, the loss of one patent or a group of related patents would not have a material adverse effect on our business.
From time to time, we grant third parties licenses to use one or more of our trademarks in connection with the manufacture, sale or distribution of third party products. Similarly, we sell some products under brands we license from third parties. In our agreement with the Kraft Foods Group, we each granted the other party various licenses to use certain of our and their respective intellectual property rights in named jurisdictions following the Spin-Off.
6
Research and Development
We pursue four objectives in research and development: product safety and quality; growth through new products; superior consumer satisfaction; and reduced costs. We haveAt December 31, 2012, we had approximately 3,3002,700 food scientists, chemists and engineers working primarily in 1512 key technology centers: East Hanover, New Jersey; Glenview, Illinois; Madison, Wisconsin; Tarrytown, New York; Whippany, New Jersey; Banbury, United Kingdom; Bournville, United Kingdom; Curitiba, Brazil; Eysins, Switzerland; Paris, France; Melbourne, Australia; Mexico City, Mexico; Munich, Germany; Reading, United Kingdom; and Suzhou, China. TheseMany of our technology centers are equipped with pilot plants and state-of-the-art instruments. ResearchOur research and development expense was $702$462 million in 2012, $511 million in 2011 $583and $404 million in 2010, and $466 million in 2009.2010.
Regulation
Our U.S. food products and packaging materials are primarily regulated by the U.S. Foodsubject to local, national and Drug Administration (“FDA”) or, for products containing meatmulti-national regulations comprising labeling, packaging, food content, pricing, marketing and poultry, the U.S. Food Safetyadvertising, privacy and Inspection Service of the U.S. Department of Agriculture. These agencies enact and enforce regulations relating to the manufacturing, distribution and labeling of food products. We supported the Food Safety Modernization Act, a 2011 law that provided additional food safety authority to the FDA. We do not expect the cost of complying with that law, and implementing regulations expected over the next two to three years, to be material.
related areas. In addition, various statesjurisdictions regulate our U.S. operations by licensing our manufacturing plants, enforcing federal and state standards for selected food products, grading food products, inspecting manufacturing plants and warehouses, regulating trade practices related to the sale of dairy products and imposing their own labeling requirements on our food products.
Many of the food commodities we use in our U.S. operations are subject to governmental agricultural programs. These programs have substantial effects on prices and supplies and are subject to periodic U.S. Congressionalgovernmental and administrative review.
AllThroughout the countries in which we do business, regulators are continually adopting new laws and implementing new regulations that affect our business and operations, such as the European Commission’s EU Health Claim Regulation, effective December 14, 2012, that limits the number of our non-U.S. based operations are subjecthealth claims that may be made by food companies about their products and a major reform of the EU legal framework related to localthe protection of personal data, and national regulations, some of which are similar to those applicable to our U.S. operations. For example, in the European Union,U.S., the Food Safety Modernization Act, that provides additional food safety authority to the FDA. We will continue to monitor developments of those new laws and regulations. At this time, we must complydo not expect the cost of complying with requirements that apply to labeling, packaging, food content, pricing, marketingthese new laws and advertising and related areas.implementing these new regulations will be material.
Environmental Regulation
WeThroughout the countries in which we do business, we are subject to variouslocal, national and multi-national environmental laws and regulations in and outside of the U.S. relating to the protection of the environment. We have programs across our business units designed to meet applicable environmental compliance requirements.
In the U.S.,United States, the laws and regulations include the Clean Air Act, the Clean Water Act, the Resource Conservation and Recovery Act and Superfund (the environmental program established in the Comprehensive Environmental Response, Compensation, and Liability Act to address abandoned hazardous waste sites), which(“CERCLA”). CERCLA imposes joint and severable liability on each potentially responsible party. AtAs of December 31, 2012, our subsidiaries were involved in one active proceeding in the U.S. under a state equivalent of CERCLA related to our current operations. As of December 31, 2011, our subsidiaries were involved in 68 active actions. Except for the one active proceeding we retained, all the remaining active actions inrelate to and were retained by the U.S. under the Superfund legislation (and other similar actions and legislation) related to our current operations and certain former or divested operations for which we retain liability.Kraft Foods Group business.
Outside the U.S., we are subject to applicable multi-national, national and local environmental laws and regulations in the countries in which we do business. Outside the U.S., we have specific programs across our business units designed to meet applicable environmental compliance requirements.
As of December 31, 2011,2012, we accrued an immaterial amount for environmental remediation. Based on information currently available, we believe that the ultimate resolution of existing environmental remediation actions and our compliance in general with environmental laws and regulations will not have a material effect on our financial results. See Note 1, Summary of Significant Accounting Policies, for additional information on our environmental remediation programs.
Employees
At December 31, 2011,2012, we employed approximately 126,000110,000 people worldwide. Labor unions represent approximately 27% of our 36,000 U.S. employees. Most of the unionized workers at our U.S. locations are represented under contracts with the Bakery, Confectionery, Tobacco Workers and Grain Millers International Union; the United Food and Commercial Workers International Union; and the International Brotherhood of Teamsters. These contracts expire at various times throughout the next several years. Outside the U.S., labor unions or workers’ councils represent approximately 58% of our 90,000 employees. Our business units are subject to various local, national and multi-national laws and regulations relating to their relationships with their employees. These laws and regulations are specific to the location of each business unit. In addition, in accordance with European Union requirements, we also have established a European WorksWorkers Council composed of management and elected members of our workforce. Employees represented by labor unions or workers’ councils represent 37.7% of our 96,000 employees outside the U.S. and 23.1% of our 14,000 U.S. employees. Most of these workers are represented under contracts which expire at various times throughout the next several years. We believe that ourwe have good relationships with employees and their representative organizations are generally good.organizations.
7
Foreign Operations
We sell our products to consumers in approximately 170165 countries. At December 31, 2011,2012, we had operations in more than 80 countries and made our products at 220171 manufacturing and processing facilities worldwide.in 56 countries. We generated approximately 60%82.9% of our 2012 net revenues, 83.7% of our 2011 net revenues 57%and 82.6% of our 2010 net revenues and 49% of our 2009 net revenuesfrom continuing operations outside the U.S. Refer to Note 16,Segment Reporting, for additional information on our foreign operations. Also, for a discussion of risks attendant to our foreign operations, see “Risk Factors” in Item 1A.
Executive Officers of the Registrant
The following are our executive officers as of February 27, 2012:25, 2013:
Name | Age | Title | ||
| Irene B. Rosenfeld | Chairman and Chief Executive Officer | |||
| David A. Brearton | Executive Vice President and Chief Financial Officer | |||
| 52 | Executive Vice President | |||
| Executive Vice President, Strategy | ||||
| Mark Clouse | 44 | Executive Vice President and President, | ||
| Timothy P. Cofer | 44 | Executive Vice President and President, Europe | ||
| Karen J. May | Executive Vice President, Global Human Resources | |||
| Executive Vice President, Integrated Supply Chain | ||||
| 59 | Executive Vice President and President, Asia Pacific and EEMEA | |||
| Gerhard W. Pleuhs | 56 | Executive Vice President | ||
| Jean E. Spence | Executive Vice President, Research, Development and Quality | |||
| Mary Beth West | Executive Vice President and Chief Category and Marketing Officer | |||
Ms. Rosenfeldwas appointed Chief Executive Officer and a member of the Board of DirectorsDirector of Kraft Foods Inc., the predecessor to Mondelēz International, in June 2006 and became Chairman of the Board in March 2007. Prior to that, she had beenserved as Chairman and Chief Executive Officer of Frito-Lay, a division of PepsiCo, Inc., a food and beverage company, from September 2004 to June 2006. Previously,Previous to that, Ms. Rosenfeld was employed continuously by Kraft Foods Inc., and its predecessor, General Foods Corporation, in various capacities from 1981 until 2003, including President of Kraft Foods North America and before that, President of Operations, Technology, Information Systems ofand Kraft Foods, Canada, Mexico and Puerto Rico. She is also a Trustee of Cornell University.
Mr. Breartonwas appointed Executive Vice President and Chief Financial Officer effectiveof Kraft Foods Inc., the predecessor to Mondelēz International, in May 9, 2011. Prior to that, at Kraft Foods Inc., he served as Executive Vice President, Operations and Business Services from January 2008 to May 2011, Executive Vice President, Global Business Services and Strategy from April 2006 to December 2007 and Senior Vice President of Business Process Simplification and Corporate Controller from February 2005 to April 2006. He previously served as Senior Vice President, Finance for Kraft Foods International. Mr. Brearton joined Kraft Foods Inc. in 1984. Mr. Brearton also serves on the Board of Directors of Feeding America.America, a non-for-profit organization.
Mr. CahillAbelendawas designated Executive Chairman North American Grocery effective January 2, 2012. Prior to that, he served as an Industrial Partner at Ripplewood Holdings LLC, a private equity firm, from 2008 to 2011. Mr. Cahill spent nine years with The Pepsi Bottling Group, Inc., a beverage manufacturing company, most recently as Chairman and Chief Executive Officer from 2003 to 2006 and Executive Chairman until 2007. Mr. Cahill previously spent nine years with PepsiCo, Inc., a food and beverage company, in a variety of leadership positions. Mr. Cahill also serves on the Boards of Directors of Colgate-Palmolive Company and Legg Mason, Inc.
Mr. Coferwas appointed Executive Vice President and President, Latin America effective January 1, 2013. Prior to that, he served as Group Vice President and President, Latin America from August 2003 to December 2012 and Vice President and Managing Director, Brazil, from October 2000 to August 2003. Mr. Abelenda joined Kraft Foods Inc. in 1984.
Ms. Belcourtwas appointed Executive Vice President, Strategy effective October 2, 2012. She joined Kraft Foods Inc., the predecessor to Mondelēz International, in September 2012. Prior to that, she was a partner of Bain & Company, a management consulting firm, since 1999, where she specialized in the design and implementation of growth strategies to improve business performance across a variety of consumer industries. Prior to Bain, Ms. Belcourt was an assistant professor of economics at Concordia University in Montreal from 1994 to 1999. She also served as an economic consultant to the U.S. Agency for International Development in Africa in 1999 during her professorship.
Mr. Clousewas appointed Executive Vice President and President, North America effective October 2, 2012. Prior to that, Mr. Clouse held various positions around the world during his 16 years with Kraft Foods Inc., the predecessor to Mondelēz International. He served as President of Kraft Foods Inc. Snacks and Confectionery business in North America from June 2011 to October 2012 and Senior Vice President of the Biscuits Global Category Team from October 2010 to June 2011. He was Managing Director of Kraft Foods Brazil from 2008 to 2010 and President of Kraft Foods Greater China from 2006 to 2008. Before joining Kraft Foods Inc. in 1996, Mr. Clouse served in the United States Army for seven years, obtaining the rank of Captain.
Mr. Cofer is Executive Vice President and President, Europe, effectivea position he held with Kraft Foods Inc., the predecessor to Mondelēz International, since August 15, 2011. Prior to that, he served as Senior Vice President Global Chocolate Category from June 2010 to August 2011, Senior Vice President Strategy and Integration from January 2010 to June 2010, President ofKraft Pizza Company from January 2008 to January 2010, and Senior Vice President and General Manager of Oscar Mayer from January 2007 to January 2008. He served as Vice President and General Manager of EU Chocolate from June 2003 to January 2007. Mr. Cofer joined Kraft Foods Inc. in 1992.
Mr. Firestone was appointed Executive Vice President, Corporate and Legal Affairs and General Counsel in October 2006. He previously served as Kraft Foods’ Executive Vice President, General Counsel and Corporate Secretary from November 2003 to October 2006. Prior to joining Kraft Foods in 2003, Mr. Firestone served as Senior Vice President and General Counsel of Philip Morris International, a tobacco company. Mr. Firestone also serves on the Board of Directors of Unilife Corporation. On February 16, 2012, we announced that Mr. Firestone will be leaving the Company in early 2012.
8
Mr. Khosla was appointed Executive Vice President and President, Developing Markets effective August 1, 2010. Prior to that, he served as Executive Vice President and President, Kraft Foods International from January 2007 to July 2010. Before joining Kraft Foods, he served as the Managing Director of Fonterra Brands, a dairy company, from 2004 to 2006. Previously, Mr. Khosla spent 27 years with Unilever N.V., a consumer products company, in India, London and Europe. Mr. Khosla also serves on the Boards of Directors of Best Buy Co., Inc. and NIIT Ltd. and is a trustee of the Goodman Theater Company in Chicago.
Ms. Maywas appointed Executive Vice President, Global Human Resources of Kraft Foods Inc., the predecessor to Mondelēz International, in October 2005. Prior to that, she was Corporate Vice President, Human Resources, for Baxter International Inc., a healthcare company, since February 2001. Ms. May also serves on the Board of Directors of MB Financial Inc.
Mr. McLevishhas served as Executive Vice President since August 15, 2011, planning for the proposed separation of Kraft Foods into two independent companies. Prior to that, he served as Executive Vice President and Chief Financial Officer from October 2007 to May 2011. He previously served as Senior Vice President and Chief Financial Officer at Ingersoll-Rand Company Limited, an industrial company, since June 2002. Mr. McLevish also serves on the Board of Directors of Kennametal Inc., a financial services provider.
Mr. Myers is Executive Vice President, Integrated Supply Chain, a position he has held since he joined Kraft Foods as Executive Vice President, Supply ChainInc., the predecessor to Mondelēz International, in September 2011. Prior to that, he worked for Procter & Gamble, a consumer products company, for 33 years, in a variety of leadership positions, most recently serving as Vice President, Product Supply for P&G’s Global Hair Care business from September 2007 to August 2011. Mr. Myers also serves on the Advisory Board of the University of Tennessee’s Supply Chain Institute.
Mr. RovitPantwas appointed Executive Vice President Strategyand President, Asia Pacific and EEMEA effective FebruaryJanuary 1, 2011.2013. Prior to joining Kraft Foods,that, he served as a Director of Bain & Co., a management consulting firm,President, Asia Pacific from January 2008 to January 2011 and from 1988December 2012. Before joining Kraft Foods Inc., the predecessor to June 2005. Mr. RovitMondelēz International, he served as President, Chief Executive OfficerRegional Managing Director for Asia, Africa and Directorthe Middle East of Swift & Company,Fonterra Brands, a meat processingdairy company, from June 2005January 2006 to December 2007 and as a member of the of Fonterra Leadership Team from January 2007 to December 2007. Mr. Pant spent 20 years with Gillette, a consumer products company, holding various positions throughout Asia Pacific including Greater China, Australia, Korea, Japan and India.
Mr. Pleuhswas appointed Executive Vice President and General Counsel of Kraft Foods Inc., the predecessor to Mondelēz International, effective April 1, 2012. Prior to that, he was Senior Vice President & Deputy General Counsel, Business Units from November 2007 to March 2012 and Senior Vice President and Deputy General Counsel, International for Kraft Foods Global, Inc., from July 2004 to November 2007. Before joining Kraft Foods Inc. in 1990, Mr. Pleuhs held a number of senior positions within the German Law Department of Jacobs Kaffee Deutschland GmbH, an international beverage and confectionery company, prior to and after its acquisition by Altria Group, the former parent company of Kraft Foods Inc.
Ms. Spence was appointed Executive Vice President, Research, Development and Quality of Kraft Foods Inc., the predecessor to Mondelēz International, in January 2004. Prior to that, Ms. Spence served as Senior Vice President, Research and Development for Kraft Foods North America from August 2003 to January 2004 and Senior Vice President of Worldwide Quality, Scientific Affairs and Compliance for Kraft Foods North America from November 2001 to August 2003. She joined Kraft Foods Inc. in 1981. Ms. Spence also serves as a Trustee of Clarkson University and on the Supervisory Board of GEA Group AG.
Mr. Vernonjoined Kraft Foods as Executive Vice President and President, Kraft Foods North America in August 2009. Prior to that, he was the Healthcare Industry Partner of Ripplewood Holdings LLC, a private equity firm, since 2006. Mr. Vernon spent 23 years with Johnson & Johnson, a pharmaceutical company, in a variety of leadership positions, most recently serving as Company Group Chairman of DePuy Inc., an orthopedics company and subsidiary of Johnson & Johnson, from 2004 to 2005. Mr. Vernon also serves on the Boards of Directors of Medivation, Inc. and Novocare, Inc.
Ms. Westwas appointed Executive Vice President and Chief Category and Marketing Officer of Kraft Foods Inc., the predecessor to Mondelēz International, effective August 1, 2010. Previously, she served as Executive Vice President and Chief Marketing Officer from October 2007 to July 2010 and as Group Vice President for Kraft Foods and President of the North America Beverages Sector from 2005 to October 2007. Ms. West joined Kraft Foods Inc. in 1986. Ms. West also serves on the Board of Directors of J.C. Penney Co.,Company, Inc. and is a member of the Executive Leadership Council.
Ethics and Governance
We adopted the Kraft FoodsMondelēz International Code of Conduct, which qualifies as a code of ethics under Item 406 of Regulation S-K. The code applies to all of our employees, including our principal executive officer, principal financial officer, principal accounting officer or controller, and persons performing similar functions. Our code of ethics is available free of charge on our Web site atwww.kraftfoodscompany.comwww.mondelezinternational.com and will be provided free of charge to any shareholder submitting a written request to: Corporate Secretary, Kraft FoodsMondelēz International, Inc., Three Lakes Drive, Northfield,Parkway North, Deerfield, IL 60093.60015. We will disclose any waiver we grant to our principal executive officer, principal financial officer, principal accounting officer or controller under our code of ethics, or certain amendments to the code of ethics, on our Web site atwww.kraftfoodscompany.comwww.mondelezinternational.com.
In addition, we adopted Corporate Governance Guidelines, charters for each of the Board’s fourthree standing committees and the Code of Business Conduct and Ethics for Non-Employee Directors. All of these materials are available on our Web site atwww.kraftfoodscompany.comwww.mondelezinternational.com and will be provided free of charge to any shareholder requesting a copy by writing to: Corporate Secretary, Kraft FoodsMondelēz International, Inc., Three Lakes Drive, Northfield,Parkway North, Deerfield, IL 60093.60015.
Available Information
Our Internet address iswww.kraftfoodscompany.comwww.mondelezinternational.com. Our Annual Reports on Form 10-K, Quarterly Reports on Form 10-Q, Current Reports on Form 8-K and amendments to those reports filed or furnished pursuant to Section 13(a) or 15(d) of the Securities Exchange Act of 1934, as amended, are available free of charge as soon as possible after we electronically file them with, or furnish them to, the SEC. You can access our filings with the SEC by visitingwww.kraftfoodscompany.comwww.mondelezinternational.com. The information on our Web site is not, and shall not be deemed to be, a part of this Annual Report on Form 10-K or incorporated into any other filings we make with the SEC.
9
You can also read, access and copy any document that we file, including this Annual Report on Form 10-K, at the SEC’s Public Reference Room at 100 F Street, N.E., Washington, D.C. 20549. Call the SEC at 1-800-SEC-0330 for information on the operation of the Public Reference Room. In addition, the SEC maintains an Internet site atwww.sec.gov that contains reports, proxy and information statements, and other information regarding issuers, including Kraft Foods,Mondelēz International, that are electronically filed with the SEC.
You should read the following risk factors carefully in connection with evaluating our business and the forward – lookingforward-looking information contained in this Annual Report on Form 10-K. Any of the following risks could materially and adversely affect our business, operating results, financial condition and the actual outcome of matters as to which forward – looking statements are made in this Annual Report on Form 10-K. While we believe we have identified and discussed below the key risk factors affecting our business, there may be additional risks and uncertainties that are not presently known or that are not currently believed to be significant that may adversely affect our business, performance or financial condition in the future.
We operate in a highly competitive industry.
The food industry isand snacking industries are highly competitive. Our principal competitors are major international food, snack and beverage companies that, like us, operate in multiple geographic areas. We compete based on price, product innovation, product quality, brand recognition and loyalty, effectiveness of marketing, promotional activity and the ability to identify and satisfy consumer preferences.
We may need to reduce our prices in response to competitive and customer pressures. Additionally, the emergence of new distribution channels, such as Internet sales directly to consumers, may affect customer and consumer preferences. Competition and customer pressures may also restrict our ability to increase prices in response to commodity and other cost increases. We may also need to increase or reallocate spending on marketing, advertising and new product innovation to protect or increase market share. These expenditures are subject to risks, including uncertainties about trade and consumer acceptance of our efforts. If we reduce prices or our costs increase, costs, but we cannot increase sales volumes to offset those changes, then our financial condition and results of operations will suffer.
Maintaining, extending and expanding our reputation and brand image is essential to our business success.
We have many iconic brands with worldwide recognition. Our success depends on our ability to maintain brand image for our existing products, extend our brands into new geographies and to new platforms and expand our brand image with new product offerings.
We seek to maintain, extend and expand our brand image through marketing investments, including advertising and consumer promotions, and product innovation. Continuing global focus on health and wellness, including weight management, and increasing media attention to the role of food marketing could adversely affect our brand image or lead to stricter regulations and greater scrutiny of food and snacking marketing practices. Increased legal or regulatory restrictions on our advertising, consumer promotions and marketing, or our response to those restrictions, could limit our efforts to maintain, extend and expand our brands. Moreover, adverse publicity about regulatory or legal action against us could damage our reputation and brand image, undermine our customers’ confidence and reduce long-term demand for our products, even if the regulatory or legal action is unfounded or not material to our operations.
In addition, our success in maintaining, extending and expanding our brand image depends on our ability to adapt to a rapidly changing media environment, including our increasing reliance on social media and online dissemination of advertising campaigns. We are subject to a variety of legal and regulatory restrictions on how and to whom we market our products, for instance marketing to children. These restrictions may limit our ability to maintain, extend and expand our brand image as the media and communications environment continues to evolve. Negative posts or comments about us on social networking web sites could seriously damage our reputation and brand image. If we do not maintain, extend and expand our brand image, then our product sales, financial condition and results of operations could be materially and adversely affected.
10
We must leverage our value proposition to compete against retailer brands and other economy brands.
Retailers are increasingly offering retailer and other economy brands that compete with some of our products. Our products must provide higher value and/or quality to our consumers than less expensive alternatives, particularly during periods of economic uncertainty such as those we continue to experience. Consumers may not buy our products if the difference in value or quality between our products and retailer or other economy brands narrows or if consumers perceive a narrowing. If consumers prefer retailer or other economy brands, then we could lose market share or sales volumes or shift our product mix to lower margin offerings. The impact could materially and adversely affect our financial condition and results of operations.
The consolidation of retail customers could adversely affect us.creates larger retailers with increased influence in the marketplace.
Retail customers, such as supermarkets, warehouse clubs and food distributors in the U.S.,European Union, the European UnionUnited States and our other major markets, continue to consolidate, resulting in fewer customers on which we can rely for business. Consolidation also produces large, more sophisticated retail customers that can resist price increases and demand lower pricing, increased promotional programs or specifically tailored products. In addition, larger retailers have the scale to develop supply chains that permit them to operate with reduced inventories or to develop and market their own retailer brands. Further retail consolidation and increasing retail power could materially and adversely affect our product sales, financial condition and results of operations.
Retail consolidation also increases the risk that adverse changes in our customers’ business operations or financial performance will have a corresponding material adverse effect on us. For example, if our customers cannot access sufficient funds or financing, then they may delay, decrease or cancel purchases of our products, or delay or fail to pay us for previous purchases.
Changes in our relationships with significant customers or suppliers could adversely affect us.sales and our ability to supply products to our customers.
During 2011,2012, our five largest customers accounted for approximately 21%15.6% of our net revenues. No single customer accounted for 10% or more of our net revenues with our largest customer Wal-Mart Stores, Inc., accounting for approximately 12% of our net revenues.from continuing operations. There can be no assurance that all significant customers will continue to purchase our products in the same mix or quantities or on the same terms as in the past, particularly as increasingly powerful retailers continue to demand lower pricing and develop their own brands. The loss of a significant customer or a material reduction in sales, or a change in the mix of products we sell to a significant customer could materially and adversely affect our product sales, financial condition and results of operations.
Disputes with significant suppliers, including regardingthose related to pricing or performance, could adversely affect our ability to supply products to our customers and could materially and adversely affect our product sales, financial condition and results of operations.
Commodity and other input prices are volatile and may rise significantly.
We purchase large quantities of commodities, including dairy,sugar and other sweeteners, coffee, beans, cocoa, wheat, corn products, soybean and vegetable oils nuts, meat products, and sugar and other sweeteners.dairy. In addition, we purchase and use significant quantities of plastic, glass and cardboardpackaging materials to package our products, andproducts. We also use natural gas, to operatefuels and electricity for our factories and warehouses. Prices for commodities, other supplies and energy are volatile and can fluctuate due to conditions that are difficult to predict, including global
competition for resources, currency fluctuations, severe weather, consumer or industrial demand and changes in governmental trade, alternative energy and agricultural programs. In addition, speculative trading often exacerbates price volatility. For 2011, our commodity costs were approximately $2.6 billion higher than for 2010. Although we monitor our exposure to commodity prices as an integral part of our overall risk management program, and seek to hedge against input price increases, continued volatility in the prices of commodities and other supplies we purchase could increase the costs of our products, and our profitability could suffer. Moreover, increases in the price of our products to cover these increased costs may result in lower sales volumes.volumes, while decreases could require us to lower our prices and affect our revenues, profits or margins. If we are not successful in our hedging activities, or if we are unable to price to cover increased costs or if we must reduce our prices, then commodity and other input price volatility, increases or increasesdecreases could materially and adversely affect our financial condition and results of operations.
The proposed spin-offWe must leverage our value proposition in order to compete against retailer brands and other economy brands.
Retailers are increasingly offering retailer and other economy brands that compete with some of our products. Our products must provide higher value and/or quality to our consumers than less expensive alternatives, particularly during periods of economic uncertainty such as those we continue to experience. Consumers may not be completed onbuy our products if the termsdifference in value or timeline currently contemplated,quality between our products and retailer or other economy brands narrows or if at all.
In August 2011, we announced our intentionconsumers perceive a narrowing. If consumers switch to become two independent publicly traded companies through a U.S. tax-free spin-off of our North American Grocery Business to existing shareholders. Unanticipated developments could delay, preventpurchasing, or otherwise adversely affect the proposed spin-off of the North American Grocery Business, including possible problemsprefer retailer or delays in obtaining various regulatoryother economy brands, then we could lose market share or sales volumes or shift our product mix to lower margin offerings. The impact could materially and tax approvals or clearances and disruptions in the capital and other financial markets, among other things. In addition, consummation of the proposed spin-off will require final approval from our Board of Directors. Therefore, we cannot assure that we will be able to complete the spin-off on the terms or on the timeline that we announced, if at all.
11
In order to position ourselves for the proposed spin-off, we are actively pursuing strategic, structural and process realignment and restructuring actions within our North American operations. These actions could lead to disruption of our operations, loss of, or inability to recruit, key personnel needed to operate and grow our businesses and complete the proposed spin-off, weakening of our internal standards, controls or procedures, and impairment of our relationship with key customers and suppliers. We have and will continue to incur significant expenses in connection with the proposed spin-off. In addition, completion of the proposed spin-off will require significant amounts of our management’s time and effort which may divert management’s attention from operating and growing our businesses and could adversely affect our business,financial condition and results of operations or financial condition.
If the spin-off is completed, it may not achieve the intended results.
If the proposed spin-off is completed, our operational and financial profile will change upon the separation of the North American Grocery Business from our other businesses. As a result, our diversification of revenue sources will diminish, and our results of operations, cash flows, working capital and financing requirements may be subject to increased volatility. Further, shares of our Common Stock will represent an investment in a smaller company with its business concentrated in the global snacks business. These changes may not meet some shareholders’ investment strategies, which could cause investors to sell their shares of our Common Stock. Excessive selling could cause the relative market price of our Common Stock to decrease following the consummation of the proposed spin-off.
In addition, if the proposed spin-off is completed, as the Global Snacks Business our business in North America will be greatly reduced and a significantly greater proportion of our revenues will be derived from non-U.S. operations. Accordingly, the risks discussed below and elsewhere in this annual report that are associated with operating a global business could increase if the proposed spin-off is completed.
Changes in regulations could increase our costs and affect our profitability.costs.
Our activities in the United States and aroundthroughout the world are highly regulated and subject to government oversight. Various federal, state, provincial and local laws and regulations govern food production and marketing, as well as licensing, trade, tax and environmental matters. Governing bodies regularly issueadopt new laws and regulations and changes tochange existing laws and regulations. Our need to comply with new or revised laws and regulations or their interpretation and application, including proposed requirements designed to enhance food safety or to regulate imported ingredients, could materially and adversely affect our product sales, financial condition and results of operations.
Legal claims or other regulatory enforcement actions could subject us to civil and criminal penalties that affect our product sales, reputation and profitability.penalties.
We are a large food and snacking company operating in a highly regulated environmentenvironments and a constantly evolving legal and regulatory frameworkframeworks around the world. Consequently, we are subject to heightened risk of legal claims or other regulatory enforcement actions. Although we have implemented policies and procedures designed to ensure compliance with existing laws and regulations, there can be no assurance that our employees, contractors or agents will not violate our policies and procedures. Moreover, theour failure to maintain effective control environment processes could lead to violations, unintentional or otherwise, of laws and regulations. Legal claims or regulatory enforcement actions arising out of our failure or alleged failure to comply with applicable laws and regulations could subject us to civil and criminal penalties that could materially and adversely affect our product sales, reputation, financial condition and results of operations.
Product recallsWe may decide or be required to recall products or be subjected to other product liability claims could materially and adversely affect us.claims.
Selling products for human consumption involves inherent risks. We could decide to, or be required to recall products due to suspected or confirmed product contamination, spoilage or other adulteration, product misbranding or product tampering. Any of these events could materially and adversely affect our reputation and product sales, reputation, financial condition and results of operations.
We may also suffer losses if our products or operations violate applicable laws or regulations, or if our products cause injury, illness or death. In addition, our marketing could face claims of false or deceptive advertising or other criticism. A significant product liability or other legal judgment or a related regulatory enforcement action against us, or a widespread product recall, may materially and adversely affect our reputation and profitability. Moreover, even if a product liability or consumer fraud claim is unsuccessful, has no merit or is not pursued, the negative publicity surrounding assertions against our products or processes could materially and adversely affect our product sales, financial condition and results of operations.
12
We are subject to risks generally associated with companies that operate inglobally.
We are a global environment, which could affectcompany generating 82.9% of our growth and financial performance.
We generated approximately 60%2012 net revenues, 83.7% of our 2011 net revenues 57%and 82.6% of our 2010 net revenues and 49% of our 2009 net revenues outside the U.S.United States. With operations in more than 80 countries, our operations are subject to risks inherent in multinational operations. Those risks include:
compliance with U.S. laws affecting operations outside of the U.S.,United States, such as the Foreign Corrupt Practices Act (“FCPA”),
compliance with a variety ofvarying local, national and multi-national regulations and laws operating in multiple regimes,
changes in tax laws and the interpretation of those laws,
fluctuations in currency values,
sudden changes in foreign currency exchange controls, such as the recent devaluation in Venezuela
discriminatory or conflicting fiscal policies,
difficulties enforcingincreased risk on sovereign debt investments,
varying abilities to enforce intellectual property and contractual rights, in certain jurisdictions,
greater risk of uncollectible accounts and longer collection cycles,
effective and immediate implementation of control environment processes across our diverse operations and employee base, and the
imposition of more or new tariff,tariffs, quotas, trade barriers, and similar restrictions on our sales outside the U.S.sales.
Moreover,In addition, political and economic changes or volatility, geopolitical regional conflicts, terrorist activity, political unrest, civil strife, acts of war, public corruption and other economic or political uncertainties could interrupt and negatively affect our business operations. All of these factors could result in increased costs or decreased revenues, and could materially and adversely affect our product sales, financial condition and results of operations.
Our operations in certain developingemerging markets expose us to political, economic and regulatory risks.
Our growth strategy depends in part on our ability to expand our operations in developingemerging markets, including Brazil, China, India, Mexico, Russia and Southeast Asia. However, some developingemerging markets have greater political and economic volatility and greater vulnerability to infrastructure and labor disruptions than most established markets. In many countries outside of the U.S.,United States, particularly in those with developingemerging economies, it may be common for others to engage in business practices prohibited by laws and regulations applicable to us,with extraterritorial reach, such as the U.S. Foreign Corrupt Practices Act, the U.K. Bribery Act or similar local anti-bribery laws. These laws generally prohibit companies and their employees, contractors or agents from making improper payments to government officials for the purpose of obtaining or retaining business.officials. Failure to comply with these laws could subject us to civil and criminal penalties that could materially and adversely affect our financial condition and results of operations.
In addition, competition in developingemerging markets is increasing as our competitors grow their global operations and low cost local manufacturers expand their production capacities. Our success in integrating Cadbury’s operations and products, many of which have a strong presence in a number of developingemerging markets, is critical to our growth strategy. If we cannot successfully increase our business in developingemerging markets, our product sales, financial condition and results of operations could be materially and adversely affected.
Unanticipated business disruptions could affect our ability to provide our products to our customers.
We manufacture and source products and materials on a global scale. We have a complex network of suppliers, owned manufacturing locations, co-manufacturing locations, distribution networks and information systems that support our ability consistently to provide our products to our customers. Factors that are hard to predict or beyond our control, like weather, natural disasters, fire, terrorism, generalized labor unrest or health pandemics, could damage or disrupt our operations, or our suppliers’ or co-manufacturers’ operations. If we cannot respond to disruptions in our operations, whetherfor example, by finding alternative suppliers or replacing capacity at key manufacturing or distribution locations, or are unable tocannot quickly repair damage to our information, production or supply systems, we may be late in delivering, or be unable to deliver, products to our customers. If that occurs, we may lose our customers’ confidence in us and long-term demand for our products could decline. Any of these events could materially and adversely affect our product sales, financial condition and results of operations.
We must correctly predict, identify and interpret changes in consumer preferences and demand, and offer new products to meet those changes.
Consumer preferences for food and snacking products change continually. Our success depends on our ability to predict, identify and interpret the tastes and dietary habits of consumers and to offer products that appeal to consumer preferences. If we do not offer products that appeal to consumers, our sales and market share will decrease and our profitability could suffer.
13
We must distinguish among short-term fads, mid-term trends and long-term changes in consumer preferences. If we do not accurately predict which shifts in consumer preferences will be long-term, or if we fail to introduce new and improved products to satisfy those preferences, our sales could decline. In addition, because of our varied consumer base, including by geography, we must offer an array of products that satisfy the broad spectrum of consumer preferences. If we fail to expand our product offerings successfully across product categories, or if we do not rapidly develop products in faster growing and more profitable categories, demand for our products will decrease and our profitability could suffer.
Prolonged negative perceptions concerning the health implications of certain food products could influence consumer preferences and acceptance of some of our products and marketing programs. For example, recently, consumers have been increasingly focused on health and wellness, including weight management and reducing sodium consumption. We strive to respond to consumer preferences and social expectations, but we may be unsuccessful in these efforts. Continued negative perceptions and failure to satisfy consumer preferences could materially and adversely affect our product sales, financial condition and results of operations.
We may not successfully identify or complete proposed acquisitions or divestitures or successfully integrate acquired businesses.the businesses we acquire.
From time to time, we evaluate acquisition candidates that may strategically fit our business objectives. If we are unable to complete acquisitions or to successfully integrate and develop acquired businesses including Cadbury, we could fail to achieve anticipated synergies and cost savings, including the expected increases in revenues and operating results, any of which could materially and adversely affect our financial results. In addition, we may divest businesses that do not meet our strategic objectives, or do not meet our growth or profitability targets. We may not be able to complete desired or proposed divestitures on terms favorable to us. Gains or losses on the sales of, or lost operating income from, those businesses may affect our profitability. Moreover, we may incur asset impairment charges related to acquisitions or divestitures that reduce our profitability.
Our acquisition or divestiture activities may present financial, managerial and operational risks. Those risks include diversion of management attention from existing core businesses, difficulties integrating or separating personnel and financial and other systems, effective and immediate implementation of control environment processes across our diverse employee population, adverse effects on existing business relationships with suppliers and customers, inaccurate estimates of fair value made in the accounting for acquisitions and amortization of acquired intangible assets which would reduce future reported earnings, potential loss of customers or key employees of acquired businesses, and indemnities and potential disputes with the buyers or sellers. Any of these factors could materially and adversely affect our product sales, financial condition and results of operations.
We are subject to foreign currency exchange rate fluctuations.
Our acquisition of Cadbury and dispositionThe Spin-Off increased the proportion of our Frozen Pizza business increased the portion of our assets, liabilities and earnings denominated in non-U.S. dollar currencies, which increased our exposureexposed to currency exchange rate fluctuations. Our financial results and capital ratios are now more sensitive to movements in foreign exchange rates than in prior periods because a larger portion of our assets, liabilities, revenue and expenses must be translated into U.S. dollars for external reporting purposes or converted into U.S. dollars to service obligations such as our U.S. dollar – denominated indebtedness.dollar-denominated indebtedness and dividends. In addition, movements in foreign exchange rates can affect transaction costs because we source product ingredients from various countries. We may seek to mitigate our exposure to currency exchange rate fluctuations, but our efforts may not be successful. Accordingly, a depreciation of non-U.S. dollar currencies relative to the U.S. dollar, or changes in the relative value of any two currencies that we use for transactions, could materially and adversely affect our financial condition and results of operations.
We are increasingly dependent on information technology, and if we are unable to protect against service interruptions, data corruption, cyber-based attacks or network security breaches, our operations could be disrupted.technology.
We rely on information technology networks and systems, including the Internet, to process, transmit and store electronic and financial information, to manage a variety of business processes and activities, and to comply with regulatory, legal and tax requirements. We also depend on our information technology infrastructure for digital marketing activities and for electronic communications among our locations, personnel, customers and suppliers around the world. These information technology systems, some of which are managed by third parties, may be susceptible to damage, disruptions or shutdowns due to failures during the process of upgrading or replacing software, databases or components thereof, power outages, hardware failures, computer viruses, attacks by computer hackers, telecommunication failures, user errors or catastrophic events. If any of our significant information technology systems suffer severe damage, disruption or shutdown, and our business continuity plans do not effectively resolve the issues in a timely manner, our product sales, financial condition and results of operations may be materially and adversely affected, and we could experience delays in reporting our financial results.
14
In addition, if we are unable to prevent security breaches, we may suffer financial and reputational damage, litigation or remediation costs or penalties because of the unauthorized disclosure of confidential information belonging to us or to our partners, customers or suppliers. In addition, the disclosure of non-public sensitive information through external media channels could lead to the loss of intellectual property or damage our reputation and brand image.
Weak financial performance, downgrades in our credit ratings, illiquid global capital markets and volatile global economic conditions could limit our access to the capital markets, reduce our liquidity orand increase our borrowing costs.
From time to time we may need to access the long-term and short-term global capital markets to obtain financing. Our financial performance, our short-andshort- and long-term credit ratings, the liquidity of the overall global capital markets and the state of the global economy, including the food industry, will affect our access to, and the availability of, financing on acceptable terms and conditions in the future. There can be no assurance that we will have access to the global capital markets on terms we find acceptable.
We access the U.S. and euro commercial paper marketmarkets for regular funding requirements. A downgrade in our credit ratings would increase our borrowing costs and could affect our ability to issue commercial paper. Disruptions in the global commercial paper market or other effects of volatile economic conditions on the global credit markets also could reduce the amount of commercial paper that we could issue and could raise our borrowing costs for both short-andshort- and long-term debt offerings.
Our inability to access the global capital markets or an increase in our borrowing costs could materially and adversely affect our financial condition and results of operations.
Volatility in the equity markets, or interest rates or other factors could substantially increase our pension costs and have a negative impact on our operating results and profitability.costs.
We sponsor a number of benefit plans for our employees inthroughout the United States, the United Kingdom and many other non-U.S. locations,world, including defined benefit pension plans, retiree health and welfare, active health care, severance and other postemployment benefits. At the end of 2011,2012, the projected benefit obligation of our defined benefit pension plans was $17.1$11.2 billion and plan assets were $13.4$8.3 billion. The difference between plan obligations and assets, or the funded status of the plans, significantly affects the net periodic benefit costs of our pension plans and the ongoing funding requirements of those plans. Our major defined benefit pension plans are funded with trust assets invested in a globally diversified portfolio of investments, including equities and corporate debt. We also have an insignificant amount of trust assets invested in European and other sovereign debt. Among other factors, changes in interest rates, mortality rates, early retirement rates, investment returns, minimum funding requirements in the jurisdictions in which the plans operate, arrangements made with the trustees of certain foreign plans and the market value of plan assets can affect the level of plan funding, cause volatility in the net periodic pension cost, and increase our future funding requirements. Legislative and other governmental regulatory actions may also increase funding requirements for our pension plans’ benefits obligation.
Based on current tax laws, we estimate the 2012our 2013 pension contributions will be approximately $480 million, which is approximately $420 million less than we contributed in 2011.$320 million. We also expect that our net pension cost will increasedecrease to approximately $750$370 million in 2012.2013. The decrease is primarily due to non-recurring costs in 2012 related primarily to certain pension plan obligations transferred to Kraft Foods Group in the Spin-Off and other 2012 one-time costs, partially offset by increased pension plan expenses in 2013 related to lower discount rates. Volatility in the global capital markets has increased the risk that we may be required to make additional cash contributions to the pension plans and recognize further increases in our net pension cost beyond 2012.2013. A significant portion of some of our pension trust assets are invested in European sovereign debt and are subject to heightened risk that they will lose value as a result of political and financial turmoil in Europe.
Due to our participation in multi-employer pension plans, we may have exposure under those plans that extends beyond what our obligation would be with respect to our employees. If a participating employer ceases its contributions to the plan, as a result of a bankruptcy or otherwise, such as in the case of Hostess Brands’ bankruptcy which we are currently evaluating, we may be required to participate in funding the unfunded obligations of the plan allocable to the withdrawing employer and our costs might increase as a result. (See Note 10,Benefit Plans, to the consolidated financial statements for more information). Further, if we withdraw from a multi-employer pension plan, we may be required to pay those plans an amount based on our allocable share of the underfunded status of the plan.
A significant increase in our U.S. pension funding requirements could have a negative impact on our ability to invest in the business.
We may be unable to hire or retain and develop key personnel or a highly skilled and diverse global workforce.
Our continued growth requires us to hire, retain and develop our leadership bench and a highly skilled and diverse global workforce. We compete to hire new personnel and then to develop and retain their skills and competencies. Any unplanned turnover or our failure to develop an adequate succession plan to backfill current leadership positions, or to hire and retain a diverse global workforce could deplete our institutional knowledge base and erode our competitive advantage. In addition, if we divest certain businesses, weour operating results could be adversely affected by increased costs due to increased competition for employees, higher employee turnover or increased employee benefit costs.
Our intellectual property rights are valuable, and any inability to protect them could reduce the value of our products and brands.
We consider our intellectual property rights, particularly and most notably our trademarks, but also our patents, trade secrets, copyrights and licensing agreements, to be a significant and valuable aspect of our business. We attempt to protect our intellectual property rights through a combination of patent, trademark, copyright and trade secret laws, as well as licensing agreements, third party nondisclosure and assignment agreements and policing of third party misuses of our intellectual property. Our failure to obtain or adequately protect our trademarks, products, new features of our products, or our technology, or any change in law or other changes that serve to lessen or remove the current legal protections of our intellectual property, may diminish our competitiveness and could materially harm our business.
We may be requiredunaware of intellectual property rights of others that may cover some of our technology, brands or products. Any litigation regarding patents or other intellectual property could be costly and time-consuming and could divert management’s and other key personnel’s attention from our business operations. Third party claims of intellectual property infringement might also require us to increase future contributionsenter into costly license agreements. We also may be subject to the benefit planssignificant damages or injunctions against development and the related net periodic pension costsale of certain of our products. Any of these occurrences could increase.materially and adversely affect our financial condition and results of operations.
Item 1B. Unresolved Staff Comments.
Not applicable.
15
We have 220On December 31, 2012, we had 171 manufacturing and processing facilities worldwide. These facilities are located in 5956 countries. We have 57 facilities in Kraft Foods North America, 62 in Kraft Foods Europe and 101 In Kraft Foods Developing Markets.
We own 208162 and lease 129 of these manufacturing and processing facilities. It is our practice to maintain all of our plants and properties in good condition, and wecondition. We believe they are suitable and adequate for our present needs.
We also have 228had 173 distribution centers and depots worldwide. We own 4944 of these distribution centers and depots, and we lease 179129 of these distribution centers and depots. In North America, we have 134 distribution centers and depots, more than 61% of which support our direct store delivery systems. Outside North America, we have 94 distribution centers and depots in 29 countries.
These facilities are in good condition, and wecondition. We believe they have sufficient capacity to meet our distribution needs in the near term.
These facilities are located throughout the following regions:by segment as follows:
| 00,000,000 | 00,000,000 | |||||||
Region | Number of Manufacturing Facilities | Number of Distribution Facilities | ||||||
U.S. | 46 | 124 | ||||||
Canada | 11 | 10 | ||||||
Western Europe | 62 | 23 | ||||||
Central & Eastern Europe, Middle East and Africa | 48 | 3 | ||||||
Latin America | 20 | 13 | ||||||
Asia Pacific | 33 | 55 | ||||||
|
|
|
| |||||
Total | 220 | 228 | ||||||
|
|
|
| |||||
| Number of Manufacturing Facilities | Number of Distribution Facilities | |||||||
Developing Markets | 95 | 61 | ||||||
Europe | 59 | 22 | ||||||
North America | 17 | 90 | ||||||
|
|
|
| |||||
Total | 171 | 173 | ||||||
|
|
|
| |||||
16
We routinely are involved in legal proceedings, claims, and governmental inspections or investigations (“Legal Matters”) arising in the ordinary course of our business.
Competition authorities in certain Member States of the European Union have ongoing investigations into possible anticompetitive activity in the fast moving consumer goods (“FMCG”) sector, which includes products such as chocolate and coffee. On October 18, 2011,January 31, 2012, the German Federal Cartel Office (“FCO”) issued a press release stating that it had discontinued proceedings against our wholly owned subsidiary, Kraft Foods Deutschland GmbH (“KFD”), based on a settlement agreed between KFD and the FCO following the FCO’s finding of illegal price agreements regarding instant cappuccino.an exchange of competitively sensitive information. The FCO also imposed a finefines against a former KFD employee.employee, as well as several other producers of confectionery. Due to KFD’s cooperation with the FCO in the matter, the fine to resolve the matter against KFD was reduced to EUR 2.2 million (or approximately $3 million as of October 18, 2011).€21.7 million.
A compliant and ethical corporate culture, which includes adhering to laws and industry regulations in all jurisdictions in which we do business, is integral to our success. Accordingly, after we acquired Cadbury in February 2010 we began reviewing and adjusting, as needed, Cadbury’s operations in light of U.S. and internationalapplicable standards as well as Kraft Foods’our policies and practices. We initially focused on such high priority areas as food safety, the Foreign Corrupt Practices Act (“FCPA”) and antitrust. Based upon Cadbury’s pre-acquisition policies and compliance programs and our post-acquisition reviews, our preliminary findings indicated that Cadbury’s overall state of compliance was sound. Nonetheless, through our reviews, we determined that in certain jurisdictions, including India, there appeared to be facts and circumstances warranting further investigation. We are continuing our investigations in certain jurisdictions, including in India, and we continue to cooperate with governmental authorities.
On March 1, 2011, the Starbucks Coffee Company (“Starbucks”), without our authorization and in what we contend is a violation and breach of our agreements with Starbucks, took control of the Starbucks packaged coffee business (“Starbucks CPG business”) in grocery stores and other channels, after alleging we had breached the Supply and License Agreement. The dispute is pending Arbitration in Chicago, Illinois. We are seeking appropriate remedies, including but not limited to payment of the fair market value of the Supply and License Agreement plus the premium this agreement specifies. Starbucks has counterclaimed for unspecified damages. The arbitration proceeding is set to begin on July 11, 2012 and is expected to conclude on July 31, 2012. The results of the Starbucks CPG business were included primarily in our U.S. Beverage and Canada and N.A. Foodservice segments through March 1, 2011.
As we previously disclosed, on February 1, 2011, we received a subpoena from the SEC in connection with an investigation under the FCPA, primarily related to a Cadbury facility in India that we acquired in the Cadbury acquisition. The subpoena primarily requests information regarding dealings with Indian governmental agencies and officials to obtain approvals related to the operation of that facility. We are cooperating with the U.S. governmentand Indian governments in its investigationtheir investigations of these matters.
As we previously disclosed, on March 1, 2011, the Starbucks Coffee Company (“Starbucks”) took control of the Starbucks packaged coffee business (“Starbucks CPG business”) in grocery stores and other channels. Starbucks did so without our authorization and in what we contend is a violation and breach of our license and supply agreement with Starbucks related to the Starbucks CPG business. The dispute is in arbitration in Chicago, Illinois. We are seeking appropriate remedies, including payment of the fair market value of the supply and license agreement, plus the premium this agreement specifies, prejudgment interest under New York law and attorney’s fees. Starbucks has counterclaimed for damages. Testimony and post-hearing briefing in the arbitration proceeding are completed. We await the arbitrator’s decision. Kraft Foods Group remains the named party in the proceeding. Under the Separation and Distribution Agreement between Kraft Foods Group and us, Kraft Foods Group will direct any recovery awarded in the arbitration proceeding to us. We will reimburse Kraft Foods Group for any costs and expenses it incurs in connection with the arbitration.
While we cannot predict with certainty the results of these or any other Legal Matters in which we are currently involved, we do not expect that the ultimate costs to resolve any of these Legal Matters, individually or in the aggregate, will have a material effect on our financial results.
Item 4. Mine Safety Disclosures
Not applicable.
17
Item 5. Market for Registrant’s Common Equity, Related Stockholder Matters and Issuer Purchases of Equity Securities.
Our Common Stock is listed onOn June 26, 2012, we transitioned our listing from the New York Stock Exchange (“NYSE”).and our Common Stock began to trade on The NASDAQ Global Select Market under the symbol “KFT.” Following the Spin-Off, on October 2, 2012, our Common Stock began trading under the symbol “MDLZ.” At January 31, 2012,2013, there were approximately 75,74370,992 holders of record of our Common Stock. Information regarding our Common Stock market prices and dividends declared during the last two fiscal years is included in Note 17,Quarterly Financial Data (Unaudited), to the consolidated financial statements.
Comparison of Five-Year Cumulative Total Return
The following graph compares the cumulative total return on our Common Stock with the cumulative total return of the S&P 500 Index, and the former Kraft Foods Inc. performance peer group index.and the new Mondelēz International performance peer group index following the Spin-Off of Kraft Foods Group. The graph shows total shareholder return assumingassumes, in each case, an initial investment of $100 was invested on December 31, 20062007, based on the market prices at the end of each fiscal year through and including December 31, 2012, and reinvestment of dividends were reinvested on a quarterly basis.(also taking into account the value of Kraft Foods Group shares distributed in the Spin-Off). A vertical line below indicates the October 1, 2012 Spin-Off date and is intended to facilitate comparisons of performance against peers and the stock market before and following the Spin-Off.
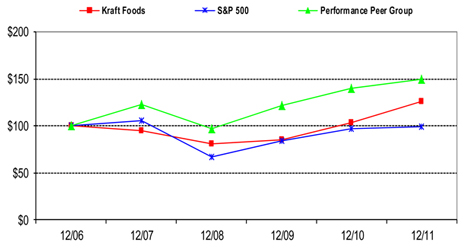

| 00,000,000 | 00,000,000 | 00,000,000 | ||||||||||
Date | Kraft Foods | S&P 500 | Performance Peer Group | |||||||||
December 2006 | $ | 100.00 | $ | 100.00 | $ | 100.00 | ||||||
December 2007 | 94.28 | 105.48 | 122.88 | |||||||||
December 2008 | 80.55 | 66.52 | 97.34 | |||||||||
December 2009 | 85.37 | 84.07 | 121.72 | |||||||||
December 2010 | 102.85 | 96.71 | 140.35 | |||||||||
December 2011 | 126.12 | 98.76 | 149.69 | |||||||||
Date | Mondelēz International | S&P 500 | Performance Peer Group | Former Performance Peer Group | ||||||||||||
December 31, 2007 | $ | 100.00 | $ | 100.00 | $ | 100.00 | $ | 100.00 | ||||||||
December 31, 2008 | 85.40 | 63.00 | 81.08 | 78.42 | ||||||||||||
December 31, 2009 | 90.52 | 79.68 | 96.80 | 99.02 | ||||||||||||
December 31, 2010 | 108.97 | 91.68 | 108.93 | 113.41 | ||||||||||||
December 31, 2011 | 133.64 | 93.61 | 117.11 | 121.92 | ||||||||||||
December 31, 2012 | 143.67 | 108.59 | 128.78 | 134.52 | ||||||||||||
The Kraft Foodsnew Mondelēz International performance peer group consists of the following companies considered our market competitors, or that have been selected on the basis of industry, level of management complexity, global focus or industry leadership: Campbell Soup Company, The Coca-Cola Company, Colgate-Palmolive Company, DANONE, General Mills, Inc., H.J. Heinz Company, The Hershey Company, Kellogg Company, Nestlé S.A., PepsiCo, Inc., The Procter & Gamble Company and Unilever N.V.
Our former performance peer group consisted of the following companies: Campbell Soup Company, The Coca-Cola Company, ConAgra Foods, Inc., DANONE, General Mills, Inc., H.J. Heinz Company, The Hershey Foods Corporation,Company, Kellogg Company, Nestlé S.A., PepsiCo, Inc., Sara Lee Corporation, and Unilever N.V.
Information regarding our Common Stock market prices on the NYSE and dividends declared during the last two fiscal years is included in Note 17,Quarterly Financial Data (Unaudited), to the consolidated financial statements.
This performance graph and other information furnished under this Part II Item 5(a) of this Form 10-K shall not be deemed to be “soliciting material” or to be “filed” with the SEC or subject to Regulation 14A or 14C, or to the liabilities of Section 18 of the Securities Exchange Act of 1934, as amended.
Issuer Purchases of Equity Securities during the Quarter ended December 31, 20112012
There are currently no share repurchase programs authorized by our Board of Directors. The following activity represents shares tendered by our employees who used shares to exercise options, and who used shares to pay the related taxes for grants of restricted and deferred stock that vested. Accordingly, these are non-cash transactions.
| 00,000,000 | 00,000,000 | |||||||
| Total Number of Shares | Average Price Paid per Share | |||||||
October 1 – 31, 2011 | 151 | $ | 34.18 | |||||
November 1 – 30, 2011 | 16,184 | 35.01 | ||||||
December 1 – 31, 2011 | 5,157 | 35.22 | ||||||
|
| |||||||
For the Quarter Ended December 31, 2011 | 21,492 | $ | 35.20 | |||||
|
| |||||||
| Total Number of Shares | Average Price Paid per Share | |||||||
October 1 – 31, 2012 | 34,654 | $ | 27.94 | |||||
November 1 – 30, 2012 | 9,164 | 25.73 | ||||||
December 1 – 31, 2012 | 17,355 | 25.69 | ||||||
|
| |||||||
For the Quarter Ended December 31, 2012 | 61,173 | $ | 26.97 | |||||
|
| |||||||
18
Item 6. Selected Financial Data.
Kraft FoodsMondelēz International, Inc.
Selected Financial Data – Five Year Review*Review(1)
| 00,000,000 | 00,000,000 | 00,000,000 | 00,000,000 | 00,000,000 | ||||||||||||||||
| 2011 | 2010 | 2009 | 2008 | 2007 | ||||||||||||||||
| (in millions of dollars, except share, per share and employee data) | ||||||||||||||||||||
Year Ended December 31: | ||||||||||||||||||||
Net revenues | $ | 54,365 | $ | 49,207 | $ | 38,754 | $ | 40,492 | $ | 34,580 | ||||||||||
Cost of sales | 35,350 | 31,305 | 24,819 | 27,164 | 22,848 | |||||||||||||||
Operating income | 6,657 | 5,666 | 5,183 | 3,576 | 3,939 | |||||||||||||||
Operating margin | 12.2% | 11.5 | % | 13.4 | % | 8.8 | % | 11.4 | % | |||||||||||
Interest and other expense, net | 1,885 | 2,024 | 1,237 | 1,240 | 604 | |||||||||||||||
|
|
|
|
|
|
|
|
|
| |||||||||||
Earnings from continuing operations | 4,772 | 3,642 | 3,946 | 2,336 | 3,335 | |||||||||||||||
Provision for income taxes | 1,225 | 1,147 | 1,136 | 658 | 992 | |||||||||||||||
|
|
|
|
|
|
|
|
|
| |||||||||||
Earnings from continuing operations | 3,547 | 2,495 | 2,810 | 1,678 | 2,343 | |||||||||||||||
Earnings and gain from discontinued | – | 1,644 | 218 | 1,215 | 381 | |||||||||||||||
|
|
|
|
|
|
|
|
|
| |||||||||||
Net earnings | 3,547 | 4,139 | 3,028 | 2,893 | 2,724 | |||||||||||||||
Noncontrolling interest | 20 | 25 | 7 | 9 | 3 | |||||||||||||||
|
|
|
|
|
|
|
|
|
| |||||||||||
Net earnings attributable to Kraft Foods | $ | 3,527 | $ | 4,114 | $ | 3,021 | $ | 2,884 | $ | 2,721 | ||||||||||
Basic EPS attributable to Kraft Foods: | ||||||||||||||||||||
Continuing operations | $ | 2.00 | $ | 1.44 | $ | 1.90 | $ | 1.11 | $ | 1.47 | ||||||||||
Discontinued operations | – | 0.96 | 0.14 | 0.81 | 0.24 | |||||||||||||||
|
|
|
|
|
|
|
|
|
| |||||||||||
Net earnings attributable to Kraft Foods | $ | 2.00 | $ | 2.40 | $ | 2.04 | $ | 1.92 | $ | 1.71 | ||||||||||
Diluted EPS attributable to Kraft Foods: | ||||||||||||||||||||
Continuing operations | $ | 1.99 | $ | 1.44 | $ | 1.89 | $ | 1.10 | $ | 1.46 | ||||||||||
Discontinued operations | – | 0.95 | 0.14 | 0.80 | 0.24 | |||||||||||||||
|
|
|
|
|
|
|
|
|
| |||||||||||
Net earnings attributable to Kraft Foods | $ | 1.99 | $ | 2.39 | $ | 2.03 | $ | 1.90 | $ | 1.70 | ||||||||||
Weighted-average shares-basic | 1,765 | 1,715 | 1,478 | 1,505 | 1,591 | |||||||||||||||
Weighted-average shares-diluted | 1,772 | 1,720 | 1,486 | 1,515 | 1,600 | |||||||||||||||
Net cash provided by operating activities | $ | 4,520 | $ | 3,748 | $ | 5,084 | $ | 4,141 | $ | 3,571 | ||||||||||
Capital expenditures | 1,771 | 1,661 | 1,330 | 1,367 | 1,241 | |||||||||||||||
Depreciation | 1,260 | 1,229 | 905 | 963 | 873 | |||||||||||||||
As of December 31: | ||||||||||||||||||||
Inventories, net | $ | 5,706 | $ | 5,310 | $ | 3,775 | $ | 3,881 | $ | 4,238 | ||||||||||
Property, plant and equipment, net | 13,813 | 13,792 | 10,693 | 9,917 | 10,778 | |||||||||||||||
Total assets | 93,837 | 95,289 | 66,714 | 63,173 | 68,132 | |||||||||||||||
Long-term debt | 23,095 | 26,859 | 18,024 | 18,589 | 12,902 | |||||||||||||||
Total debt | 26,931 | 28,724 | 18,990 | 20,251 | 21,009 | |||||||||||||||
Total long-term liabilities | 40,064 | 43,454 | 29,251 | 29,773 | 23,574 | |||||||||||||||
Total Kraft Foods shareholders’ equity | 35,217 | 35,834 | 25,876 | 22,295 | 27,407 | |||||||||||||||
Total equity | 35,328 | 35,942 | 25,972 | 22,356 | 27,445 | |||||||||||||||
Shares outstanding at year end | 1,768 | 1,748 | 1,478 | 1,469 | 1,534 | |||||||||||||||
Book value per common share outstanding | $ | 19.92 | $ | 20.50 | $ | 17.51 | $ | 15.18 | $ | 17.87 | ||||||||||
Dividends declared per share | $ | 1.16 | $ | 1.16 | $ | 1.16 | $ | 1.12 | $ | 1.04 | ||||||||||
Dividends as a % of basic / diluted EPS | 58.0% /58.3 | % | 48.3% /48.5 | % | 56.9% /57.1 | % | 58.3% /58.9 | % | 60.8% /61.2 | % | ||||||||||
Common Stock closing price at year end | $ | 37.36 | $ | 31.51 | $ | 27.18 | $ | 26.85 | $ | 32.63 | ||||||||||
Common Stock price-high / low | $ | 37.93/$30.21 | $ | 32.67/$27.09 | $ | 29.84/$20.81 | $ | 34.97/$24.75 | $ | 37.20/$29.95 | ||||||||||
Price / earnings ratio-basic / diluted | 19 / 19 | 13 / 13 | 13 / 13 | 14 / 14 | 19 / 19 | |||||||||||||||
Number of employees | 126,000 | 127,000 | 97,000 | 98,000 | 103,000 | |||||||||||||||
| 2012 | 2011 | 2010 | 2009 | 2008 | ||||||||||||||||
| (in millions, except per share and employee data) | ||||||||||||||||||||
Continuing Operations(2) | ||||||||||||||||||||
Net revenues | $ | 35,015 | $ | 35,810 | $ | 31,489 | $ | 21,559 | $ | 22,872 | ||||||||||
Earnings from continuing operations, net of taxes | 1,567 | 1,737 | 672 | 850 | 147 | |||||||||||||||
Net earnings attributable to Mondelēz International: | ||||||||||||||||||||
Per share, basic | 0.87 | 0.97 | 0.38 | 0.57 | 0.09 | |||||||||||||||
Per share, diluted | 0.86 | 0.97 | 0.38 | 0.57 | 0.09 | |||||||||||||||
Cash Flow and Financial Position(3) | ||||||||||||||||||||
Net cash provided by operating activities | 3,923 | 4,520 | 3,748 | 5,084 | 4,141 | |||||||||||||||
Capital expenditures | 1,610 | 1,771 | 1,661 | 1,330 | 1,367 | |||||||||||||||
Property, plant and equipment, net | 10,010 | 13,813 | 13,792 | 10,693 | 9,917 | |||||||||||||||
Total assets | 75,478 | 93,837 | 95,289 | 66,714 | 63,173 | |||||||||||||||
Long-term debt | 15,574 | 23,095 | 26,859 | 18,024 | 18,589 | |||||||||||||||
Total Mondelēz International shareholders’ equity | 32,215 | 35,217 | 35,834 | 25,876 | 22,295 | |||||||||||||||
Shares outstanding at year end | 1,778 | 1,768 | 1,748 | 1,478 | 1,469 | |||||||||||||||
Per Share and Other Data(4) | ||||||||||||||||||||
Book value per shares outstanding | 18.12 | 19.92 | 20.50 | 17.51 | 15.18 | |||||||||||||||
Dividends declared per share(5) | 1.00 | 1.16 | 1.16 | 1.16 | 1.12 | |||||||||||||||
Common Stock closing price at year end(6) | 25.45 | 37.36 | 31.51 | 27.18 | 26.85 | |||||||||||||||
Number of employees | 110,000 | 126,000 | 127,000 | 97,000 | 98,000 | |||||||||||||||
|
| (2) | Significant items impacting the comparability of our results from continuing operations include: Spin-Off Costs in 2012, Restructuring Programs in 2012 and 2008, Cost Savings Initiatives in all years; divestitures and sales of property in 2012 and 2010, the |
| (3) | Our Cash Flow and Financial Position information includes Kraft Foods Group data for periods prior to the October 1, 2012 Spin-Off date. Refer to Note 2,Divestitures and Acquisitions, for information on the divested net assets and items impacting cash flow. Other items impacting comparability primarily relate to our acquisition of Cadbury in 2010. |
| (4) | Per Share and Other Data includes Kraft Foods Group data for periods prior to the October 1, 2012 Spin-Off date. |
| (5) | Refer to theEquity and Dividends section withinManagement’s Discussion and Analysis of Financial Condition and Results of Operationsfor additional information on our dividends following the Spin-Off. |
| (6) | Closing prices reflect historical market prices and have not been adjusted for periods prior to October 1, 2012 to reflect the Spin-Off of Kraft Foods Group on that date. |
19
Item 7. Management’s Discussion and Analysis of Financial Condition and Results of Operations.
The following discussions should be read in conjunction with the other sections of this Annual Report on Form 10-K, including the consolidated financial statements and related notes contained in Item 8.
Description of the Company
We manufacture and market packagedprimarily snack food and beverage products, including snacks,biscuits, chocolate, gum & candy, beverages cheese, convenient meals and various packagedcheese & grocery products. We have operations in more than 80 countries and sell our products in approximately 170165 countries.
Proposed Spin-Off Transaction
On August 4, 2011,October 1, 2012 (the “Distribution Date”), we announced thatcompleted the spin-off of our Board of Directors intendsNorth American grocery business, Kraft Foods Group, Inc. (“Kraft Foods Group”), to create two independent public companies: (i) aour shareholders (the “Spin-Off”). Along with our other food and beverage categories, we also retained our global snacks business (the “Global Snacks Business”) and (ii) a North American grocery business (the “North American Grocery Business”). The Global Snacks Business will consist of our current Kraft Foods Europe and Developing Markets segments as well as our North American snack and confectionery businesses. The North American Grocery Business will primarily consist of our current U.S. Beverages, U.S. Cheese, U.S. Convenient Meals and U.S. Grocery segments, grocery – related categories in our Canada & N.A. Foodservice segment as well as thePlanters andCorn Nuts brands and businesses. We expect to create these companies through a U.S. tax-free spin-off of the North American Grocery Business to our shareholders.
The transaction is subject to a number of conditions, including the receipt of regulatory approvals, a favorable ruling from the Internal Revenue Service to ensure the U.S. tax-free status of the spin-off, execution of intercompany agreements, further diligence as appropriate and final approval from our Board of Directors. While our current target is to complete the spin-off before year-end 2012, we cannot assure that the spin-off will be completed on the anticipated timeline or that the terms of the spin-off will not change. See “Part II, Item 1A. Risk Factors” for certain risk factors relating to the proposed spin-off transaction. The disclosures within this Management’s Discussion and Analysis of Financial Condition and Results of Operations are on a consolidated Kraft Foods Inc. basis and do not take into account the proposed spin-off of the North American Grocery Business.
Summary of Results and Other Significant Highlights
Net revenues increased 10.5% to $54.4 billion in 2011 and increased 27.0% to $49.2 billion in 2010.
|
|
|
|
On December 29, 2010, we repurchased $1.5 billion of our notes due in 2011 and 2012. We paid $1,596 million aggregate consideration, including accrued and unpaid interest, for the accepted notes.
On March 1, 2010, we completed the sale of the assets of our North American frozen pizza business to Nestlé USA, Inc. for $3.7 billion. Accordingly, the results of our frozen pizza business have been reflected as discontinued operations on the consolidated statement of earnings for all periods presented.
20
Discussion and Analysis
Strategy
Over the last several years, we have transformed our portfolio by expanding geographically and building our presence in the fast-growing snacking category. At the same time, we have continued to invest in product quality, marketing and innovation behind our iconic North American brands, while implementing a series of cost saving initiatives. Our Global Snacks Business and the North American Grocery Business now have different future strategic priorities, growth profiles and operational focus. As such, weWe expect that our proposed spin-off will provide both businesses an opportunity to pursue different strategies and achieve a distinct operational focus and return on investment.
The Global Snacks Business will build upon its strong presence across numerous fast-growing markets, categories and channels including the high-margin instant consumption channel. This business willWe plan to target industry-leading revenue growth, leverage itsour cost structure through volume growth and improved product mix to drive margin gains and grow earnings per share in the top-tier of itsour peer group.
The North American Grocery Business will buildSummary of Results and Significant Highlights
As a result of the Spin-Off, the historical results of Kraft Foods Group have been reflected as a discontinued operation within our consolidated statements of earnings for all periods presented. We discuss our results of continuing operations below and in the discussion and analysis which follows.
Net revenues decreased 2.2% to $35.0 billion in 2012 and increased 13.7% to $35.8 billion in 2011. Our reported net revenues were significantly impacted by unfavorable foreign currency exchange rates, the lapping of prior-year accounting calendar changes and divestitures in 2012.
| • | Organic Net Revenues is a non-GAAP financial measure we use to evaluate our underlying results (see the definition of Organic Net Revenues and our reconciliation with net revenues withinNon-GAAP Financial Measures appearing later in this section). Organic Net Revenues increased 4.4% to $36.3 billion in 2012 and increased 7.0% to $33.4 billion in 2011. Organic Net Revenues is on a constant currency basis and excludes the impact of accounting calendar changes and divestitures. |
Diluted EPS attributable to Mondelēz International decreased 15.1% to $1.69 in 2012 and decreased 16.7% to $1.99 in 2011. Excluding the results of discontinued operations, our diluted EPS attributable to Mondelēz International from continuing operations decreased 11.3% to $0.86 in 2012 and increased 155.3% to $0.97 in 2011. Included within our reported results were one-time Spin-Off Costs, 2012-2014 Restructuring Program costs, Cadbury Integration Program costs, gains and losses on its leading market positions by targeting moderate revenue growth while maintaining a sharp focus on its cost structuredivestitures and superior execution. This business will target revenue growth in line with its categories, strong marginsdivested operating results.
| • | Operating EPS is a non-GAAP financial measure we use to evaluate our underlying results (see the definition of Operating EPS and our reconciliation with Diluted EPS withinNon-GAAP Financial Measures appearing later in this section). Operating EPS provides transparency of our underlying results from continuing operations and excludes Spin-Off Costs, Spin-Off pension expense and interest expense adjustments, 2012-2014 Restructuring Program costs, Cadbury Integration Program costs, gains and losses on divestitures and divested operating results. We also evaluate Operating EPS on a constant currency basis. Operating EPS increased 0.7% to $1.39 in 2012 and increased 33.0% to $1.41 in 2011. On a constant currency basis, Operating EPS increased 5.1% to $1.45 in 2012 and increased 26.4% to $1.34 in 2011. |
| • | On October 1, 2012, we completed the Spin-Off in a distribution to shareholders of one share of Kraft Foods Group common stock for every three shares of our Common Stock held as of the Record Date. The distribution was structured to be tax free to our U.S. shareholders for U.S. federal income tax purposes. See additional information on theSpin-Off of Kraft Foods Group in Note 2,Divestitures and Acquisitions, to the consolidated financial statements. |
| • | During 2012, in anticipation of the Spin-Off, Kraft Foods Group and we executed a series of debt transactions in order to adequately capitalize both companies and to secure for each investment grade credit ratings following the Spin-Off. During 2012, Kraft Foods Group incurred approximately $10 billion of debt through direct note issuances or exchanges of our debt for their debt. As Kraft Foods Group received cash from its note issuances, the cash was distributed to us through the Distribution Date so that we could reduce our debt over time. We were successful in recapitalizing both companies and secured and maintain an investment grade credit rating following the Spin-Off. SeeLiquidity and Capital Resources below and Note 8,Debt and Borrowing Arrangements, to the consolidated financial statements for more information. |
Discussion and free cash flow, and expects to have a highly competitive dividend payout.Analysis
Items Affecting Comparability of Financial Results
Acquisitions and DivestituresSpin-Off of Kraft Foods Group:
Cadbury Acquisition:
On February 2, 2010,October 1, 2012, we acquired 71.73%completed the Spin-Off of Cadbury Limited (“Cadbury”) and asKraft Foods Group to our shareholders. On October 1, 2012, each of June 1, 2010, we owned 100%our shareholders of all outstanding Cadbury shares.record on September 19, 2012 received one share of Kraft Foods Group common stock for every three shares of our Common Stock held. The distribution was structured to be tax free to our U.S. shareholders for U.S. federal income tax purposes. See Note 3,2,AcquisitionsDivestitures and DivestituresAcquisitions, to the consolidated financial statements for additional information.
As partThe divested Kraft Foods Group business is presented as a discontinued operation on the consolidated statements of earnings for all periods presented. The Kraft Foods Group balance sheet, other comprehensive earnings and cash flows are included within our consolidated balance sheet and consolidated statements of equity, comprehensive earnings and cash flows through October 1, 2012.
Summary results of operations for the divested Kraft Foods Group through October 1, 2012 were as follows:
| Nine Months Ended | For the Years Ended December 31, | |||||||||||
| October 1, 2012 | 2011 | 2010 | ||||||||||
| (in millions) | ||||||||||||
Net revenues | $ | 13,768 | $ | 18,555 | $ | 17,718 | ||||||
|
|
|
|
|
| |||||||
Earnings before income taxes | $ | 2,266 | $ | 2,892 | $ | 2,916 | ||||||
Provision for income taxes | 778 | 1,082 | 1,093 | |||||||||
Earnings and gain from discontinued operations, | – | – | 1,644 | |||||||||
|
|
|
|
|
| |||||||
Earnings from discontinued operations, | $ | 1,488 | $ | 1,810 | $ | 3,467 | ||||||
|
|
|
|
|
| |||||||
| (1) | On March 1, 2010, Kraft Foods Group completed the sale of the assets of the North American frozen pizza business to Nestlē USA, Inc. The earnings through March 1, 2010 and the gain were included in discontinued operations for Kraft Foods Group for the year ended December 31, 2010. |
The results of the Kraft Foods Group discontinued operation exclude certain corporate and business unit costs which were allocated to Kraft Foods Group historically and are expected to continue at Mondelēz International after the Spin-Off. These costs include primarily corporate overheads, information systems and sales force support. On a pre-tax basis, through the date of the Spin-Off, these costs were $150 million for the nine months ended October 1, 2012, $236 million for the year ended December 31, 2011 and $209 million for the year ended December 31, 2010.
Interest expense relating to debt Kraft Foods Group incurred or assumed through October 1, 2012 has been included in the results from discontinued operations for all periods presented and as follows:
| Nine Months Ended | For the Years Ended December 31, | |||||||||||
| October 1, 2012 | 2011 | 2010 | ||||||||||
| (in millions) | ||||||||||||
$6.0 billion note issuance in June 2012 | $ | 70 | $ | – | $ | – | ||||||
$3.6 billion notes exchanged in July 2012 | 171 | 226 | 216 | |||||||||
$0.4 billion debt transferred in October 2012 | 24 | 31 | 31 | |||||||||
Capital leases and other | 13 | 10 | 7 | |||||||||
|
|
|
|
|
| |||||||
| $ | 278 | $ | 267 | $ | 254 | |||||||
|
|
|
|
|
| |||||||
On October 1, 2012, we divested the following assets and liabilities which net to $4,358 million, or $4,111 million net of cash retained by Kraft Foods Group on the Distribution Date (in millions):
Assets | ||||
Cash | $ | 247 | ||
Receivables | 1,685 | |||
Inventories, net | 2,099 | |||
Deferred income taxes | 338 | |||
Other current assets | 168 | |||
Property, plant and equipment, net | 4,211 | |||
Goodwill | 11,911 | |||
Intangible assets, net | 2,632 | |||
Prepaid pension assets | 16 | |||
Other assets | 856 | |||
|
| |||
| $ | 24,163 | |||
|
| |||
Liabilities | ||||
Current portion of long-term debt | $ | 6 | ||
Accounts payable | 1,798 | |||
Accrued marketing | 463 | |||
Accrued employment costs | 190 | |||
Other current liabilities | 751 | |||
Long-term debt | 9,965 | |||
Deferred income taxes | 874 | |||
Accrued pension costs | 2,026 | |||
Accrued postretirement health care costs | 3,316 | |||
Other liabilities | 416 | |||
|
| |||
| $ | 19,805 | |||
|
| |||
Net assets divested in the Spin-Off | $ | 4,358 | ||
|
|
Additionally, $4,308 million of accumulated other comprehensive losses primarily related to the pension and other benefit plan net liabilities transferred to Kraft Foods Group and $89 million of unearned compensation recorded within additional paid in capital were distributed to Kraft Foods Group. In total, we recorded a distribution of $8,755 million to our shareholders in connection with the Spin-Off of Kraft Foods Group.
In order to implement the Spin-Off, we entered into certain agreements with Kraft Foods Group to effect our legal and structural separation; govern the relationship between us; and allocate various assets, liabilities and obligations between us, including, among other things, employee benefits, intellectual property and tax-related assets and liabilities (see Note 14,Income Taxes, for additional information on the current and deferred tax assets and liabilities transferred or retained in the Spin-Off). In addition to executing the Spin-Off in the manner provided in the agreements, in November 2012, pursuant to these agreements, we paid Kraft Foods Group $163 million related to targeted cash flows (together with the $247 million of cash divested on the Distribution Date, totaling $410 million of cash transferred to Kraft Foods Group in connection with the Spin-Off). To facilitate the management, including final payment and resolution, of certain obligations, Kraft Foods Group retained certain of our North American net trade payables and receivables. We also retained approximately $140 million of workers’ compensation liabilities for claims incurred by Kraft Foods Group employees prior to the Spin-Off. In November 2012, we paid Kraft Foods Group $95 million to cash settle the net trade payables and receivables and which are also reflected in table above. As of December 31, 2012, we also have a $55 million receivable from Kraft Foods Group related to the cash settlement of stock awards held by our respective employees at the time of the Spin-Off as further described in Note 11,Stock Plans, to the consolidated financial statements.
Our results from continuing operations include one-time Spin-Off transaction, transition and financing and related costs (“Spin-Off Costs”) we have incurred to date. We recorded Spin-Off Costs of $1,053 million, or $0.39 per diluted share in 2012 and $46 million, or $0.02 per diluted share, in 2011. We expect to incur Spin-Off Costs of approximately $100 million in 2013 related primarily to human resource, customer service and logistics and information systems and processes as well as legal costs associated with revising intellectual property and other long-term agreements.
Cadbury Acquisition:
In 2010, we acquired all the outstanding shares of Cadbury Limited (“Cadbury”) in an acquisition valued at $18,547 million, or $17,503 million net of cash and cash equivalents. In 2010, we incurred and expensedacquisition-related transaction related feescosts of $218 million (recorded in 2010 and $40 million in 2009. We recorded these expenses within selling, general and administrative expenses. We also incurred acquisitionexpense) and acquisition-related financing fees of $96 million (recorded in 2010. We recorded these expenses within interest and other expense, net.expenses, net).
To secure EU regulatory
As a condition to granting approval of the acquisition, we werethe EU required tothat we divest certain Cadbury confectionery operations in Poland and Romania. InThe divestitures were completed in the third quarter of 2010 we completed the sale of the assets of these businesses and generated $342 million inof sale proceeds. The impactsimpact of these divestitures were primarilywas reflected as adjustments towithin the Cadbury final purchase price allocations.accounting.
During 2010, Cadbury contributed net revenues of $9,143 million and net earnings of $530 million from February 2, 2010 through December 31, 2010. The following unaudited pro forma summary presents Kraft Foods’our consolidated informationresults of continuing operations as if Cadbury had been acquired on January 1, 2009.2010. These amounts were calculated after conversion to U.S. GAAP, applying our accounting policies, and adjusting Cadbury’s results to reflect the additional depreciation and amortization that would have been charged assuming the fair value adjustments to property, plant and equipment, and intangible assets had been applied from January 1, 2009,2010, together with the consequential tax effects. These adjustments also reflect the additional interest expense incurred on the debt to finance the purchase and the divestitures of certain Cadbury confectionery operations in Poland and Romania.
| 00,000,000,000 | 00,000,000,000 | |||||||
| Pro forma for the | ||||||||
| Years Ended December 31, | ||||||||
| 2010 | 2009 | |||||||
| (in millions) | ||||||||
Net revenues | $ | 49,770 | $ | 47,852 | ||||
Net earnings attributable to Kraft Foods | 3,938 | 2,586 | ||||||
| Pro forma Year Ended December 31, 2010 | ||||
| (in millions) | ||||
Net revenues | $ 32,052 | |||
Net earnings attributable to Mondelēz International | 2,115 | |||
21
Our February 2, 2010, Cadbury acquisition was valued at $18,547 million, or $17,503 million net of cash and cash equivalents. As part of that acquisition, weWe also acquired the following assets and assumed the following liabilities as follows (in millions):
| 00,000,000 | ||||||||
Assets | ||||||||
Cash and cash equivalents | $ | 1,044 | ||||||
Receivables(1) | $ | 1,333 | 1,333 | |||||
Inventories | 1,298 | |||||||
Inventories, net | 1,298 | |||||||
Other current assets | 660 | 660 | ||||||
Property, plant and equipment | 3,293 | |||||||
Property, plant and equipment, net | 3,293 | |||||||
Goodwill(2) | 9,530 | 9,530 | ||||||
Intangible assets(3) | 12,905 | |||||||
Intangible assets, net(3) | 12,905 | |||||||
Other assets | 593 | 593 | ||||||
| ||||||||
| $ | 30,656 | |||||||
| ||||||||
Liabilities | ||||||||
Short-term borrowings | (1,206 | ) | $ | 1,206 | ||||
Accounts payable | (1,605 | ) | 1,605 | |||||
Other current liabilities(4) | (1,866 | ) | 1,866 | |||||
Long-term debt | (2,437 | ) | 2,437 | |||||
Deferred income taxes | (3,218 | ) | 3,218 | |||||
Accrued pension costs | (817 | ) | 817 | |||||
Other liabilities | (927 | ) | 927 | |||||
Noncontrolling interest | (33 | ) | 33 | |||||
| ||||||||
| $ | 12,109 | |||||||
| ||||||||
Net assets acquired | $ | 18,547 | ||||||
| ||||||||
| (1) | The gross amount of acquired receivables was $1,474 million, of which $141 million was reserved as uncollectable. |
| (2) | Goodwill will not be deductible for statutory tax purposes and is attributable to Cadbury’s workforce and the significant synergies we expect from the acquisition. |
| (3) | We acquired $10.3 billion of |
| (4) | Within other current liabilities, a reserve for exposures related to taxes of approximately $70 million was established within our Developing Markets segment. The cumulative exposure was approximately $150 million at December 31, 2010. |
Pizza Divestiture:Other Divestitures and Sales of Property
On March 1, 2010,During the three months ended December 31, 2012, we completed the saleseveral divestitures within our Europe segment which generated cash proceeds of the assets$200 million and pre-tax gains of our North American frozen pizza$107 million. The divestitures primarily included a dinners and sauces grocery business (“Frozen Pizza”) to Nestlé USA, Inc. (“Nestlé”) for $3.7 billion. Our Frozen Pizzain Germany and Belgium and a canned meat business was a component of our U.S. Convenient Mealsin Italy. In 2011, there were no significant divestitures. In 2010, as discussed above, we divested businesses in Poland and Canada & North America Foodservice segments. The sale included theDiGiorno,Tombstone andJack’s brandsRomania in the U.S., theDelissio brand in Canada and theCalifornia Pizza Kitchen trademark license. It also included two Wisconsin manufacturing facilities (Medford and Little Chute) and the leases for the pizza depots and delivery trucks. Approximately 3,600 of our employees transferredconnection with the business to Nestlé. Accordingly,acquisition of Cadbury.
During the resultsthree months ended March 31, 2012, we also sold property located in Russia which generated cash proceeds of our Frozen Pizza business have been reflected as discontinued operations on the consolidated statement of earnings for all periods presented. As a result of the divestiture, we recorded a gain on discontinued operations of $1,596$72 million or $0.92 per diluted share, in 2010.
Pursuant to the Frozen Pizza business Transition Services Agreement, we agreed to provide certain sales, co-manufacturing, distribution, information technology, accounting and finance services to Nestlé for up to two years. As of December 31, 2011, these service agreements were substantially complete.
Summary results of operations for the Frozen Pizza business through March 1, 2010 were as follows:
| 00,000,000,000 | 00,000,000,000 | |||||||
| For the Years Ended December 31, | ||||||||
| 2010 | 2009 | |||||||
| (in millions) | ||||||||
Net revenues | $ | 335 | $ | 1,632 | ||||
|
|
|
| |||||
Earnings before income taxes | 73 | 341 | ||||||
Provision for income taxes | (25 | ) | (123 | ) | ||||
Gain on discontinued operations, net of | 1,596 | – | ||||||
|
|
|
| |||||
Earnings and gain from discontinued | $ | 1,644 | $ | 218 | ||||
|
|
|
| |||||
22
Earnings before income taxes as presented exclude associated allocated overheads of $25 million in 2010 and $108 million in 2009. The 2010 gain on discontinued operations from the sale of the Frozen Pizza business included tax expense of $1.2 billion.
The following assets of the Frozen Pizza business were included in the Frozen Pizza divestiture (in millions):
| 00,000,000 | ||||
Inventories, net | $ | 102 | ||
Property, plant and equipment, net | 317 | |||
Goodwill | 475 | |||
|
| |||
Divested assets of the Frozen Pizza business | $ | 894 | ||
|
|
Other Divestitures:
In 2009, we received $41 million in net proceeds and recorded pre-tax losses of $6 million on the divestitures of ourBalancebar operations in the U.S., a juice operation in Brazil and a plant in Spain. Wepre-tax gain of $55 million which was recorded after-tax gains of $58 million, or $0.04 per diluted share, on these divestitures, primarily due to the differing bookwithin selling, general and tax bases of ourBalancebar operations.administrative expenses.
The aggregate operating results of the divestitures discussed above other than the divestiture of the Frozen Pizza business, were not material to our financial statements in any of the periods presented. Refer
2012-2014 Restructuring Program
On March 14, 2012, our Board of Directors approved $1.1 billion of restructuring and related implementation costs (“2012-2014 Restructuring Program”) reflecting primarily severance, asset disposals and other manufacturing-related one-time costs. The primary objective of the restructuring and implementation activities was to ensure that both Kraft Foods Group and Mondelēz International were each set up to operate efficiently and execute on our respective business strategies upon separation and in the future. On October 23, 2012, our Board of Directors approved $400 million of additional restructuring and related implementation programs, totaling $1.5 billion of expected 2012-2014 Restructuring Program costs.
Of the $1.5 billion of 2012-2014 Restructuring Program costs, $575 million relates to Kraft Foods Group and approximately $925 million are costs we expect to incur or have incurred in our results from continuing operations.
Through December 31, 2012, we have recorded restructuring charges of $102 million, or $0.04 per diluted share, in our results from continuing operations, which were recorded within asset impairment and exit costs. In 2012, we spent $33 million on primarily severance and related costs and also recognized non-cash severance and related costs and asset write-downs (including accelerated depreciation and asset impairments) totaling $33 million. At December 31, 2012, $36 million of restructuring liabilities were recorded within other current liabilities. In 2012, we also incurred $8 million of implementation costs which were recorded within cost of sales and selling, general and administrative expenses. See Note 16,6,Segment Reporting2012-2014 Restructuring Program, for details of the gains and losses on divestitures by segment.additional information.
Integration Program and Cost Savings Initiatives
Integration Program
OurAs a result of our combination with Cadbury continuesin 2010, we launched an integration program to have the potential for meaningful synergies and costs savings. We now expect to recognizerealize annual cost savings of approximately $800$750 million of cost savings by the end of the third year following completion of the acquisition, up from our original estimate of $750 million. Additionally, we expect to create2013 and revenue synergies from investments in distribution, marketing and product development. In order to achieve these cost savings and synergies and integrate the two businesses, we expect to incur total integration charges of approximately $1.5 billion inthrough the first three years following the acquisition to combine and integrate the two businessesend of 2013 (the “Integration Program”).
Integration Program costs include the costs associated with combining the Cadbury operations within our operations with Cadbury’sGlobal Snacks Business and are separate from the costs related to the acquisition. We incurred charges underSince the inception of the Integration Program, we have incurred approximately $1.3 billion of the estimated $1.5 billion total integration charges. In 2012, we met and exceeded our annual cost savings target of $750 million and achieved approximately $800 million of annual costs savings one year ahead of schedule.
We recorded Integration Program charges of $185 million in 2012, $521 million in 2011 and $657$646 million in 2010. During 2012, we reversed $45 million of Integration Program charges previously accrued in 2010 and primarily related to planned and announced position eliminations that did not occur within our Europe segment. We recorded these charges primarily in operations as a part of selling, general and administrative expenses primarily within our Kraft Foods Europe and Kraft Foods Developing Markets segments, as well as within general corporate expenses. Since the inception of the Integration Program, we have incurred approximately $1.2 billion of the $1.5 billion in expected charges. At December 31, 2011,2012, we had an accrual of $346$202 million related to the Integration Program. See Note 7,Integration Program and Cost Savings Initiatives, to the consolidated financial statements for additional information.
Cost Savings Initiatives
Cost savings initiatives generally include exit, disposal and other project costs outside of our Integration Program and consisted2012-2014 Restructuring Program and consist of the following specific initiatives:
In 2011,2012, we recorded a $64$21 million charge primarily within the segment operating income of Kraft Foods Europe and related to severance benefits provided to terminated employees and charges in connection with Kraft Foodsthe reorganization within the Europe and Developing Markets segment (the “Europe reorganization”).
In 2011, we recorded a $61 million charge primarily within the segment operating income of Europe related to severance benefits provided to terminated employees and charges in connection with the Europe reorganization. We also reversed $37approximately $15 million of cost savings initiative program costs across all segments except Kraft Foods Europe.the North America and Developing Markets segments.
In 2010, we recorded $170$117 million primarily within the segment operating income of Kraft Foods Europe and Canada & N.A. Foodservice and in connection with the Kraft Foods Europe reorganization.
In 2009, we recorded $318 million primarily for severance benefits provided to terminated employees, associated benefit plan costs and other related activities. These were recorded in operations, primarily within the segment operating income of Kraft Foods Europe, with the remainder spread across all other segments.
Within our Integration Program and cost savings initiatives, we include certain costs along with exit and disposal costs that are directly attributable to these activities and do not qualify for treatment as exit or disposal costs under U.S. GAAP. These costs, which we commonly refer to as other project costs or implementation costs, generally include the integration and reorganization of operations and facilities, the discontinuance of certain product lines and the incremental expenses related to the closure of facilities. We believe the disclosure of these charges within our operating income provides greater transparency of the impact of these programs and initiatives on our operating results.
23
Starbucks CPG Business
On March 1, 2011, the Starbucks Coffee Company (“Starbucks”), without our authorization and in what we contend is a violation and breach of our agreements with Starbucks, took control of the Starbucks packaged coffee business (“Starbucks CPG business”) in grocery stores and other channels, after alleging we had breached the Supply and License Agreement. The dispute is pending Arbitration in Chicago, Illinois. We are seeking appropriate remedies, including but not limited to payment of the fair market value of the Supply and License Agreement plus the premium this agreement specifies. Starbucks has counterclaimed for unspecified damages. The arbitration proceeding is set to begin on July 11, 2012 and is expected to conclude on July 31, 2012. The results of the Starbucks CPG business were included primarily in our U.S. Beverage and Canada and N.A. Foodservice segments through March 1, 2011.
Accounting Calendar Changes in 2011 and 2010
The majority of our operating subsidiaries report results as of the last Saturday of the year. A portion of our international operating subsidiaries report results as of the last calendar day or the last Saturday of the year. Because a significant number of our operating subsidiaries report results onIn 2011, the last Saturday of the year and this year, that day fell on December 31, so our 2011 results included an extraone more week of operating results (“53rd week”) of operating results than in the prior two years2012 or 2010, which each had 52-weeks.52 weeks.
In 2011, we changed the consolidation date for certain operations of our Kraft Foods Europe segment and in the Latin America, and Central and Eastern Europe (“CEE”) and Middle East and Africa (“CEEMA”MEA”) regions within our Kraft Foods Developing Markets segment. Previously, these operations primarily reported results two weeks prior to the end of the period. Now,Subsequent to the 2011 changes, our Kraft Foods Europe segment reports results as of the last Saturday of each period. OurCertain operations in Latin America and certain operations in CEEMAwithin our Developing Markets segment report results as of the last calendar day of the period or the last Saturday of the period. These changes and the 53rd week in 2011 resulted in a favorable impact to net revenues of approximately $920$679 million and a favorable impact of approximately $150$93 million to operating income in 2011.
In 2010, we changed the consolidation date for certain European biscuits operations, which are included within our Kraft Foods Europe segment, and certain operations in Asia Pacific and Latin America within our Kraft Foods Developing Markets segment. Previously, these operations primarily reported period-end results one month or two weeks prior to the end of the period. Kraft Foods Europe moved the reporting of these operations to two weeks prior to the end of the period, and Asia Pacific and Latin America moved the reporting of these operations to the last day of the period. These changes resulted in a favorable impact to net revenues of approximately $200$193 million and had an insignificanta favorable impact onof $23 million to operating income in 2010.
We believe these changes are preferable and will improve business planning and financial reporting by better matching the close dates of the operating subsidiaries within our Kraft Foods Europe segment and Kraft Foods Developing Markets segment and by bringing the reporting date closer to the period-end date. As the effect to prior-period results was not material, we have not revised prior-period results.
Provision for Income Taxes
Our 2012 effective tax rate was 25.7%favorably impacted by the mix of pre-tax income in 2011, 31.5% in 2010,various foreign jurisdictions and 28.8% in 2009. net tax benefits of $101 million from discrete one-time events, primarily related to the revaluation of U.K. deferred tax assets and liabilities resulting from tax legislation enacted during 2012 that reduced U.K. corporate income tax rates and net favorable tax audit settlements, partially offset by non-deductible expenses.
Our 2011 effective tax rate was favorably impacted by the mix of pre-tax income in various foreign jurisdictions and net tax benefits of $199$226 million from discrete one-time events, primarily from the revaluation of U.K. deferred tax assets and liabilities resulting from tax legislation enacted in 2011 that reduced U.K. corporate income tax rates, the reversal of valuation allowances on certain foreign deferred tax assets that are now expected to be realized and the net favorable impact from various U.S. federal U.S. state and foreign tax audit developments during the year. The 2011 effective tax rate also reflects increased tax benefits from operations outside the United States, which are generally taxed at lower rates than the U.S statutory rate of 35 percent. The mix of pretax income from these various foreign jurisdictions can have a significant impact on our effective tax rate. The fourth quarter and full year tax rate benefited from lower than projected taxes on our earnings outside the U.S., and the fourth quarter was also favorable due to a true-up of prior quarter estimates to a lower actual tax expense reported by these operations.
Our 2010 effective tax rate includedwas favorably impacted by the mix of pre-tax income in various foreign jurisdictions and net tax benefits of $123$165 million from discrete one-time events, primarily due tofrom the favorable resolution of aU.S. federal and foreign tax auditaudits and the resolutionrevaluation of several itemsU.K. deferred tax assets and liabilities resulting from tax legislation enacted in our international operations,2010 that reduced U.K. corporate income tax rates, partially offset by a $137 million write-off of deferred tax assets as a result of the U.S. health care legislation enacted in March 2010.
Our 2009 effective tax rate included net tax benefits of $225 million, primarily due to an agreement we reached with the IRS on specific matters related to years 2000 through 2003, settlements with various foreign and state tax authorities, the expiration of the statutes of limitations in various jurisdictions and the divestiture of ourBalance bar operations in the U.S.
24
Consolidated Results of Operations
The following discussion compares our consolidated results of operations for 2012 with 2011 and 2011 with 2010, and for 2010 with 2009.2010.
20112012 compared with 20102011
| 00,000,000 | 00,000,000 | 00,000,000 | 00,000,000 | |||||||||||||||||||||||||||||
| For the Years Ended | ||||||||||||||||||||||||||||||||
| December 31, | For the Years Ended December 31, | |||||||||||||||||||||||||||||||
| 2011 | 2010 | $ change | % change | 2012 | 2011 | $ change | % change | |||||||||||||||||||||||||
| (in millions, except per share data) | (in millions, except per share data) | |||||||||||||||||||||||||||||||
Net revenues | $ | 54,365 | $ | 49,207 | $ | 5,158 | 10.5 | % | $ | 35,015 | $ | 35,810 | $ | (795 | ) | (2.2% | ) | |||||||||||||||
Operating income | 6,657 | 5,666 | 991 | 17.5 | % | 3,637 | 3,498 | 139 | 4.0% | |||||||||||||||||||||||
Earnings from continuing operations | 3,547 | 2,495 | 1,052 | 42.2 | % | 1,567 | 1,737 | (170 | ) | (9.8% | ) | |||||||||||||||||||||
Net earnings attributable to Kraft Foods | 3,527 | 4,114 | (587 | ) | (14.3 | %) | ||||||||||||||||||||||||||
Net earnings attributable to | 3,028 | 3,527 | (499 | ) | (14.1% | ) | ||||||||||||||||||||||||||
Diluted earnings per share from continuing | 1.99 | 1.44 | 0.55 | 38.2 | % | |||||||||||||||||||||||||||
Diluted earnings per share from | 0.86 | 0.97 | (0.11 | ) | (11.3% | ) | ||||||||||||||||||||||||||
Diluted earnings per share attributable | 1.99 | 2.39 | (0.40 | ) | (16.7 | %) | ||||||||||||||||||||||||||
Diluted earnings per share attributable to | 1.69 | 1.99 | (0.30 | ) | (15.1% | ) | ||||||||||||||||||||||||||
Net Revenues– Net revenues increased $5,158decreased $795 million (10.5%(2.2%) to $54,365$35,015 million in 2011,2012, and organic net revenuesOrganic Net Revenues(1)increased $3,170$1,531 million (6.6%(4.4%) to $51,533$36,347 million as follows.
Change in net revenues (by percentage point) | ||||
Higher net pricing | ||||
Favorable volume/mix | ||||
|
| |||
Total change in organic net revenues(1) | ||||
| ||||
| ||||
Impact of accounting calendar changes (including | ||||
Impact of divestitures | ||||
|
| |||
Total change in net revenues | ||||
| (1) |
Organic Net Revenue growth was driven by higher net pricing and favorable volume/mix. Higher net pricing, including the impact of pricing actions from the prior year, was realized across all reportable segments as we increased pricing to offset higher input costs. Favorable volume/mix was driven by higher shipments in Developing Markets and Europe, mostly offset by lower shipments in North America, driven primarily by the completion of a co-manufacturing agreement from a previous divestiture. Unfavorable foreign currency decreased net revenues by $1,576 million, due primarily to the strength of the U.S. dollar relative to most foreign currencies, primarily the euro, Brazilian real, Indian rupee, Argentinean peso, South African rand, Russian ruble and Mexican peso. Non-recurring accounting calendar changes in 2011 resulted in a year-over-year decrease in net revenues of $679 million. Divested businesses also resulted in a year-over-year decrease in net revenues of $72 million.
Operating Income – Operating income increased $139 million (4.0%) to $3,637 million in 2012, Adjusted Operating Income(1) increased $138 million (3.4%) to $4,235 million, and Adjusted Operating Income (on a constant currency basis)(1) increased $291 million (7.1%) to $4,388 million due to the following:
| Operating | ||||||||
| Income | Change | |||||||
| (in millions) | (percentage point) | |||||||
Operating Income for the Year Ended December 31, 2011 | $ | 3,498 | ||||||
Integration Program costs | 521 | 14.7pp | ||||||
Spin-Off pension expense adjustment (2) | 91 | 2.7pp | ||||||
Spin-Off Costs | 46 | 1.4pp | ||||||
Operating income from divested businesses | (59 | ) | (1.5)pp | |||||
|
|
|
| |||||
Adjusted Operating Income for the Year Ended December 31, 2011 (1) | $ | 4,097 | ||||||
|
| |||||||
Higher net pricing | 1,132 | 28.4pp | ||||||
Higher input costs | (598 | ) | (15.0)pp | |||||
Favorable volume/mix | 114 | 2.8pp | ||||||
Higher selling, general and administrative expenses | (293 | ) | (7.2)pp | |||||
Impact of accounting calendar changes | (93 | ) | (2.5)pp | |||||
Gain on sale of property | 55 | 1.3pp | ||||||
Intangible asset impairment charge | (52 | ) | (1.3)pp | |||||
Change in unrealized gains/losses on hedging activities | 37 | 0.9pp | ||||||
Other, net | (11 | ) | (0.3)pp | |||||
|
|
|
| |||||
Total change in Adjusted Operating Income (constant currency) (1) | 291 | 7.1% | ||||||
|
|
|
| |||||
Unfavorable foreign currency | (153 | ) | (3.7)pp | |||||
|
|
|
| |||||
Total change in Adjusted Operating Income | 138 | 3.4% | ||||||
|
|
|
| |||||
Adjusted Operating Income for the Year Ended December 31, 2012 (1) | $ | 4,235 | ||||||
Spin-Off Costs | (444 | ) | (12.3)pp | |||||
Integration Program costs | (140 | ) | (3.4)pp | |||||
2012-2014 Restructuring Program costs | (110 | ) | (3.0)pp | |||||
Spin-Off pension expense adjustment (2) | (68 | ) | (1.9)pp | |||||
Acquisition-related costs | (1 | ) | (0.1)pp | |||||
Gains on divestitures, net | 107 | 2.6pp | ||||||
Operating income from divested businesses | 58 | 1.4pp | ||||||
|
|
|
| |||||
Operating Income for the Year Ended December 31, 2012 | $ | 3,637 | 4.0% | |||||
|
|
|
| |||||
| (1) | Please see theNon-GAAP Financial Measures section at the end of this item. |
| (2) | Represents the estimated annual benefit plan expense associated with certain benefit plan obligations transferred to Kraft Foods Group in the Spin-Off. The estimate of $91 million was based on market conditions and benefit plan assumptions as of January 1, 2012. For the year ended December 31, 2012, a prorated estimate of $68 million was reflected for the nine months prior to the Spin-Off and transfer of the benefit plan obligations to Kraft Foods Group. |
Higher net pricing, including the impact of pricing actions taken in the prior year, outpaced increased input costs during 2012. The increase in input costs was driven by higher raw material costs, partially offset by lower manufacturing costs. Favorable volume/mix was driven by strong contributions from Developing Markets and Europe, partially offset by an unfavorable impact in North America. Total selling, general and administrative expenses decreased $206 million from 2011, including the benefits from a favorable impact of foreign currency on expenses, lower Integration Program costs (including the reversal of previously accrued Integration Program charges primarily related to planned and announced position eliminations that did not occur), higher expenses in the prior year related to accounting calendar changes, divested businesses and a gain on the sale of a property in Russia, which were partially offset by the Spin-Off Costs and 2012-2014 Restructuring Program costs incurred in 2012. Excluding these factors, selling, general and administrative expenses increased $293 million from 2011, driven primarily by higher advertising and consumer promotion costs in each of the geographic units, partially offset by the reversal of reserves not required carried over from the Cadbury acquisition in 2010. Unfavorable foreign currency decreased operating income by $153 million, due primarily to the strength of the U.S. dollar relative to most foreign currencies, primarily the euro, Brazilian real, Argentinean peso and Indian rupee, partially offset by the impact of adjustments in the prior year related to the highly inflationary Venezuelan economy. Accounting calendar changes made in 2011 (including the 53rd week of shipments in 2011) decreased operating income by $93 million. In 2012, we divested property located in Russia and recorded a pre-tax gain of $55 million. During 2012, we recorded $52 million related to a trademark impairment in Japan. The change in unrealized gains / (losses) on hedging activities increased operating income by $37 million, as we recognized gains of $1 million in 2012, versus losses of $36 million in 2011.
As a result of the net effect of these drivers, operating income margin increased, from 9.8% in 2011 to 10.4% in 2012. The margin increase was due primarily to higher gross margin, reflecting the impact of pricing actions net of increased input costs and the favorable change in unrealized gains on hedging activities and overhead leverage, partially offset by the impact of higher advertising and consumer promotion costs. The favorable impacts from lower Integration Program costs and the realized net gain on divestitures were offset by the unfavorable impacts of higher Spin-Off Costs and the 2012-2014 Restructuring Program costs.
Net Earnings and Earnings per Share Attributable to Mondelēz International– Net earnings attributable to Mondelēz International of $3,028 million decreased by $499 million (14.1%) in 2012. Diluted EPS attributable to Mondelēz International was $1.69 in 2012, down 15.1% from $1.99 in 2011. Diluted EPS from continuing operations attributable to Mondelēz International was $0.86 in 2012, down 11.3% from $0.97 in 2011. Operating EPS(1) was $1.39 in 2012, up $0.01 (0.7%) from $1.38 in 2011. Operating EPS (on a constant currency basis)(1) was $1.45 in 2012, up $0.07 (5.1%) from $1.38 in 2011. These changes, shown net of tax below, were due to the following:
| Diluted EPS | ||||
Diluted EPS Attributable to Mondelēz International for the Year Ended December 31, 2011 | $ | 1.99 | ||
Discontinued operations | 1.02 | |||
|
| |||
Diluted EPS Attributable to Mondelēz International from Continuing Operations for the Year Ended December 31, 2011 | 0.97 | |||
Integration Program costs | 0.28 | |||
Spin-Off interest expense adjustment (2) | 0.11 | |||
Spin-Off pension expense adjustment (3) | 0.03 | |||
Spin-Off Costs | 0.02 | |||
Net earnings from divested businesses | (0.03 | ) | ||
|
| |||
Operating EPS for the Year Ended December 31, 2011 (1) | 1.38 | |||
Increases in operations | 0.16 | |||
Impact of accounting calendar changes | (0.04 | ) | ||
Gain on sale of property | 0.03 | |||
Change in unrealized gains/losses on hedging activities | 0.02 | |||
Intangible asset impairment charge | (0.02 | ) | ||
Lower interest and other expense, net (4) | 0.09 | |||
Changes in income taxes | (0.16 | ) | ||
Higher shares outstanding | (0.01 | ) | ||
|
| |||
Operating EPS for the Year Ended December 31, 2012 (constant currency) (1) | 1.45 | |||
|
| |||
Unfavorable foreign currency | (0.06 | ) | ||
|
| |||
Operating EPS for the Year Ended December 31, 2012 (1) | 1.39 | |||
Spin-Off Costs(5) | (0.39 | ) | ||
Integration Program costs | (0.08 | ) | ||
2012-2014 Restructuring Program costs | (0.04 | ) | ||
Spin-Off interest expense adjustment (2) | (0.06 | ) | ||
Spin-Off pension expense adjustment (3) | (0.02 | ) | ||
Gains on divestitures, net | 0.03 | |||
Net earnings from divested businesses | 0.03 | |||
|
| |||
Diluted EPS Attributable to Mondelēz International from Continuing Operations for the Year Ended December 31, 2012 | 0.86 | |||
Discontinued operations | 0.83 | |||
|
| |||
Diluted EPS Attributable to Mondelēz International for the Year Ended December 31, 2012 | $ | 1.69 | ||
|
| |||
| (1) | Please see theNon-GAAP Financial Measures section at the end of this item. |
| (2) | Represents interest expense associated with the assumed reduction of $6 billion of our debt on January 1, 2011 from the utilization of funds received from the $6 billion of notes Kraft Foods Group issued directly and cash proceeds distributed to us in June 2012 in connection with our Spin-Off capitalization plan. Note during the year ended December 31, 2012, a portion of the $6 billion of debt was retired. As such, we adjusted interest expense during this period as if this debt had been repaid on January 1, 2011 to ensure consistency of our assumption and related results. |
| (3) | Represents the estimated annual benefit plan expense associated with certain benefit plan obligations transferred to Kraft Foods Group in the Spin-Off. The estimate of $91 million was based on market conditions and benefit plan assumptions as of January 1, 2012. For the year ended December 31, 2012, a prorated estimate of $68 million was reflected for the nine months prior to the Spin-Off and transfer of the benefit plan obligations to Kraft Foods Group. |
| (4) | Excludes the favorable foreign currency impact on interest expense related to our foreign denominated debt, the change in interest expense included in Spin-Off costs and the change in interest expense associated with the assumed reduction of $6 billion of our debt on January 1, 2011 from the utilization of funds received from the $6 billion of notes Kraft Foods Group issued directly and cash proceeds distributed to us in June 2012 in connection with our Spin-Off capitalization plan. |
| (5) | Spin-Off costs include $444 million of pre-tax Spin-Off Costs in selling, general and administrative expense and $609 million of pre-tax Spin-Off Costs in interest expense. |
2011 compared with 2010
| For the Years Ended December 31, | ||||||||||||||||
| 2011 | 2010 | $ change | % change | |||||||||||||
| (in millions, except per share data) | ||||||||||||||||
Net revenues | $ | 35,810 | $ | 31,489 | $ | 4,321 | 13.7% | |||||||||
Operating income | 3,498 | 2,496 | 1,002 | 40.1% | ||||||||||||
Earnings from continuing operations | 1,737 | 672 | 1,065 | 158.5% | ||||||||||||
Net earnings attributable to | 3,527 | 4,114 | (587 | ) | (14.3% | ) | ||||||||||
Diluted earnings per share from | 0.97 | 0.38 | 0.59 | 155.3% | ||||||||||||
Diluted earnings per share attributable to | 1.99 | 2.39 | (0.40 | ) | (16.7% | ) | ||||||||||
Net Revenues – Net revenues increased $4,321 million (13.7%) to $35,810 million in 2011, and Organic Net Revenues(1)increased $2,193 million (7.0%) to $33,385 million as follows.
Change in net revenues (by percentage point) | ||||
Higher net pricing | 5.5pp | |||
Favorable volume/mix | 1.5pp | |||
Total change in organic net revenues (1) | 7.0% | |||
Favorable foreign currency | 3.4pp | |||
Impact of the Cadbury acquisition (2) | 2.3pp | |||
Impact of accounting calendar changes (including the 53rdweek of shipments) | 1.4pp | |||
Impact of divestitures | (0.4)pp | |||
Total change in net revenues | 13.7% | |||
|
|
| (1) | Please see theNon-GAAP Financial Measures section at the end of this item. |
| (2) | Impact of acquisition reflects the incremental January 2011 operating results from our Cadbury acquisition. |
Organic net revenueNet Revenue growth was driven primarily by higher net pricing as well asand favorable volume/mix. Higher net pricing was reflectedrealized across all reportable business segments as we increased pricing to offset higher input costs. Favorable volume/mix was driven primarily by higher shipments in Kraft Foods Developing Markets. Favorable foreign currency increased net revenues by $1,165$1,074 million, due primarily to the strength of most foreign currencies relative to the U.S. dollar, primarily the euro, Australian dollar, Canadian dollar, Brazilian real, Swedish krona, British pound, Swiss franc, Canadian dollar and Russian ruble versus the U.S. dollar.ruble. The Cadbury acquisition due(due to the incremental January 2011 operating results,results) added $697 million in net revenues.revenues in 2011. Accounting calendar changes (including the 53rd week of shipments in 2011 and excluding the effects of foreign currency) added $880$655 million in net revenues in 2011, as compared to $193 million in 2010. These gains were partially offset by the impact of divestitures (including for reporting purposes the Starbucks CPG business).divestitures.
25
Operating Income– Operating income increased $991$1,002 million (17.5%(40.1%) to $6,657$3,498 million in 2011, and Adjusted Operating Income(1) increased $654 million (18.7%) to $4,156 million, and Adjusted Operating Income (on a constant currency basis)(1) increased $495 million (14.1%) to $3,997 million due to the following:
| 00,000,000 | 00,000,000 | |||||||||||||||
| Operating | Operating | |||||||||||||||
| Income | Change | Income | Change | |||||||||||||
| (in millions) | (percentage point) | (in millions) | (percentage point) | |||||||||||||
Operating Income for the Year Ended December 31, 2010 | $ | 5,666 | $ | 2,496 | ||||||||||||
Integration Program costs | 646 | 12.0 | pp | 646 | 23.4pp | |||||||||||
2010 acquisition-related costs associated with Cadbury | 273 | 4.7 | pp | |||||||||||||
Acquisition-related costs – Cadbury | 273 | 13.4pp | ||||||||||||||
Spin-Off pension expense adjustment (2) | 91 | 5.0pp | ||||||||||||||
Operating income from divested businesses | (4 | ) | (0.2)pp | |||||||||||||
|
|
|
| |||||||||||||
Underlying Operating Income for the Year | $ | 6,585 | ||||||||||||||
Adjusted Operating Income for the Year Ended December 31, 2010 (1) | $ | 3,502 | ||||||||||||||
|
| |||||||||||||||
Higher net pricing | 2,914 | 45.3 | pp | 1,715 | 48.9pp | |||||||||||
Higher input costs | (2,540 | ) | (39.4 | )pp | (1,562 | ) | (44.6)pp | |||||||||
Favorable volume/mix | 136 | 2.1 | pp | 293 | 8.4pp | |||||||||||
Higher selling, general and administrative expenses | (6 | ) | (0.1 | )pp | (71 | ) | (2.0)pp | |||||||||
Favorable foreign currency | 178 | 2.7 | pp | |||||||||||||
Increased operating income from accounting calendar changes | 129 | 2.0 | pp | |||||||||||||
Incremental operating income from the Cadbury acquisition | 83 | 1.2 | pp | 83 | 2.4pp | |||||||||||
Change in unrealized gains/losses on hedging activities | (74 | ) | (2.1)pp | |||||||||||||
Impact from accounting calendar changes | 66 | 1.8pp | ||||||||||||||
Lower net asset impairment and exit costs | 25 | 0.4 | pp | 31 | 0.9pp | |||||||||||
Change in unrealized gains/losses on hedging activities | (167 | ) | (2.6 | )pp | ||||||||||||
Decreased operating income from divestitures (including for | (134 | ) | (2.2 | )pp | ||||||||||||
Other, net | 21 | 0.3 | pp | 14 | 0.4pp | |||||||||||
|
|
|
| |||||||||||||
Total change in underlying operating income | 639 | 9.7% | ||||||||||||||
Total change in Adjusted Operating Income (constant currency) (1) | 495 | 14.1% | ||||||||||||||
|
|
|
| |||||||||||||
Underlying Operating Income for the Year | $ | 7,224 | ||||||||||||||
Favorable foreign currency | 159 | 4.6pp | ||||||||||||||
|
| |||||||||||||||
Total change in Adjusted Operating Income | 654 | 18.7% | ||||||||||||||
|
| |||||||||||||||
Adjusted Operating Income for the Year Ended December 31, 2011 (1) | $ | 4,156 | ||||||||||||||
Integration Program costs | $ | (521 | ) | (8.2 | )pp | (521 | ) | (14.8)pp | ||||||||
Costs associated with the proposed spin-off | (46 | ) | (0.7 | )pp | ||||||||||||
Spin-Off pension expense adjustment (2) | (91 | ) | (3.5)pp | |||||||||||||
Spin-Off Costs | (46 | ) | (1.9)pp | |||||||||||||
|
|
|
| |||||||||||||
Operating Income for the Year Ended December 31, 2011 | $ | 6,657 | 17.5% | $ | 3,498 | 40.1% | ||||||||||
|
|
|
| |||||||||||||
| (1) | Please see theNon-GAAP Financial Measures section at the end of this item. |
| (2) | Represents the estimated annual benefit plan expense associated with certain benefit plan obligations transferred to Kraft Foods Group in the Spin-Off. The estimate of $91 million was based on market conditions and benefit plan obligations as of January 1, 2012. |
| (3) | Impact of acquisition reflects the incremental January 2011 operating results from our Cadbury acquisition. |
Higher pricing outpaced increased input costs during 2011. The increase in input costs was driven by significantly higher raw material costs, partially offset by loweras well as higher manufacturing costs. Favorable volume/mix was driven by a strong contribution from Kraft Foods Developing Markets, partially offset by a net decline for the segments within Kraft Foodsan unfavorable impact in North America. Total selling, general and administrative expenses increased $139$242 million from 2010. Excluding2010, including the impactsdetriments from an unfavorable impact of divestitures (including for reporting purposesforeign currency on expenses, the Starbucks CPG business), foreign currency,incremental expenses associated with our Cadbury acquisition and 2011 accounting calendar changes, our Cadbury acquisition (includingpartially offset by lower Integration Program costs and acquisition-related costs) and the costs associated with the proposed spin-off of the North American Grocery Business,lower expenses related to divested businesses. Excluding these factors, selling, general and administrative expenses increased $6$71 million from 2010.2010, driven primarily by higher advertising and consumer promotion costs in Developing Markets. Favorable foreign currency increased operating income by $178$159 million, due primarily to the strength of most foreign currencies relative to U.S. dollar, primarily the euro, Australian dollar Canadian dollar and Brazilian realreal. The Cadbury acquisition, due to the incremental January 2011 operating results, increased operating income by $83 million. The change in unrealized gains/losses on hedging activities decreased operating income by $74 million, as we recognized losses of $36 million in 2011, versus the U.S. dollar.gains of $38 million in 2010. Accounting calendar changes (including the 53rd week of shipments in 2011 and excluding the effects of foreign currency) added $129$66 million in operating income, as we realized operating income from accounting calendar changes of $152$89 million in 2011, versus $23 million in 2010. The Cadbury acquisition, due to the incremental January 2011 operating results, increased operating income by $83 million. During 2011, we reversed $7$5 million in restructuring program charges recorded in prior years, versus a reversal of $37$29 million in restructuring program charges recorded in prior years during 2010. We recorded asset impairment charges of $55 million in 2010 related to intangible assets in China and the Netherlands and on a biscuit plant and related property, plant and equipment in France. The change in unrealized gains/losses on hedging activities decreased operating income by $167 million, as we recognized losses of $100 million in 2011, versus gains of $67 million in 2010. The impact of divestitures, including for reporting purposes the Starbucks CPG business and the 2010 divestitures of certainCadbury confectionery operations in Poland and Romania, decreased operating income by $134 million.
As a result of the net effect of these drivers, operating income margin increased, from 11.5%7.9% in 2010 to 12.2%9.8% in 2011. The margin gainincrease was drivendue primarily byto overhead leverage, lower acquisition-related costs and lower corporate expenses reflecting lower acquisition-relatedIntegration Program costs, which more than offset thea decline in gross profit margin, driven primarily by the impact of the higher revenue base on the margin calculation.
26
Net Earnings and Earnings per Share Attributable to Kraft FoodsMondelēz International– Net earnings attributable to Kraft FoodsMondelēz International of $3,527 million decreased by $587 million (14.3%) in 2011. Diluted EPS from continuing operations attributable to Kraft Foods were $1.99 in 2011, up 38.2% from $1.44 in 2010. Diluted EPS attributable to Kraft Foods wereMondelēz International was $1.99 in 2011, down 16.7% from $2.39 in 2010,2010. Diluted EPS from continuing operations attributable to Mondelēz International was $0.97 in 2011, up 155.3% from $0.38 in 2010. Operating EPS(1) was $1.41 in 2011, up $0.35 (33.0%) from $1.06 in 2010. Operating EPS (on a constant currency basis)(1) was $1.34 in 2012, up $0.28 (26.4%) from $1.06 in 2011. These changes, shown net of tax below, were due to the following:
| 00,000,000 | ||||||||
| Diluted EPS | Diluted EPS | |||||||
Diluted EPS Attributable to Kraft Foods for the Year Ended December 31, 2010 | $ | 2.39 | ||||||
2010 gain on the divestiture of our Frozen Pizza business | 0.92 | |||||||
Diluted EPS Attributable to Mondelēz International for the Year Ended December 31, 2010 | $ | 2.39 | ||||||
Discontinued operations | 0.03 | 2.01 | ||||||
|
| |||||||
Diluted EPS Attributable to Kraft Foods from Continuing | 1.44 | |||||||
Diluted EPS Attributable to Mondelēz International from Continuing Operations for the Year Ended December 31, 2010 | 0.38 | |||||||
Integration Program costs | 0.29 | |||||||
Acquisition-related costs | 0.12 | 0.13 | ||||||
Acquisition-related interest and other expense, net | 0.09 | 0.09 | ||||||
Integration Program costs | 0.29 | |||||||
Spin-Off interest expense adjustment (2) | 0.11 | |||||||
Spin-Off pension expense adjustment (3) | 0.03 | |||||||
U.S. health care legislation impact on deferred taxes | 0.08 | 0.03 | ||||||
|
| |||||||
Operating EPS for the Year Ended December 31, 2010(1) | 2.02 | 1.06 | ||||||
Increases in operations | 0.21 | 0.17 | ||||||
Increases in operations from accounting calendar changes | 0.04 | |||||||
Increases in operations from the Cadbury acquisition | 0.03 | 0.03 | ||||||
Decreased operating income from divestitures (including for reporting | (0.05 | ) | ||||||
Change in unrealized gains/losses on hedging activities | (0.06 | ) | (0.03 | ) | ||||
Impact from accounting calendar changes | 0.02 | |||||||
Lower net asset impairments and exit costs | 0.01 | 0.01 | ||||||
Higher interest and other expense, net (5) | (0.04 | ) | ||||||
Changes in income taxes (6) | 0.16 | |||||||
Higher shares outstanding | (0.04 | ) | ||||||
| ||||||||
Operating EPS for the Year Ended December 31, 2011 (constant currency) (1) | 1.34 | |||||||
| ||||||||
Favorable foreign currency | 0.06 | 0.07 | ||||||
Higher interest and other expense, net(3) | (0.04 | ) | ||||||
Changes in taxes (4) | 0.13 | |||||||
Higher shares outstanding | (0.06 | ) | ||||||
|
| |||||||
Operating EPS for the Year Ended December 31, 2011(1) | 2.29 | 1.41 | ||||||
Integration Program costs | (0.28 | ) | (0.28 | ) | ||||
Costs associated with the proposed spin-off of the North America Grocery Business | (0.02 | ) | ||||||
Spin-Off interest expense adjustment (2) | (0.11 | ) | ||||||
Spin-Off pension expense adjustment (3) | (0.03 | ) | ||||||
Spin-Off Costs | (0.02 | ) | ||||||
|
| |||||||
Diluted EPS Attributable to Kraft Foods for the Year Ended December 31, 2011 | $ | 1.99 | ||||||
Diluted EPS Attributable to Mondelēz International from Continuing Operations for the Year Ended December 31, 2011 | 0.97 | |||||||
Discontinued operations | 1.02 | |||||||
|
| |||||||
Diluted EPS Attributable to Mondelēz International for the Year Ended December 31, 2011 | $ | 1.99 | ||||||
| ||||||||
| (1) | Please see theNon-GAAP Financial Measures section at the end of this item. |
| (2) | Represents interest expense associated with the assumed reduction of $6 billion of our debt on January 1, 2010 from the utilization of funds received from the $6 billion of notes Kraft Foods Group issued directly and cash proceeds distributed to us in June 2012 in connection with our Spin-Off capitalization plan. Note during the year ended December 31, 2012, a portion of the $6 billion of debt was retired. As such, we adjusted interest expense during this period as if this debt had been repaid on January 1, 2010 to ensure consistency of our assumption and related results. |
| (3) | Represents the estimated annual benefit plan expense associated with certain benefit plan obligations transferred to Kraft Foods Group in the Spin-Off. The estimate of $91 million was based on market conditions and benefit plan assumptions as of January 1, 2012. |
| (4) | Impact of acquisition reflects the incremental January 2011 operating results from our Cadbury acquisition. |
| Excludes the unfavorable foreign currency impact on interest expense related to our foreign denominated debt and the impacts of acquisition-related interest and other expense, net, and includes a loss of $157 million related to several interest rate swaps that settled in 2011. |
| Excludes the impact of the 2010 U.S. health care legislation on deferred taxes. |
27
2010 compared with 2009
| 00,000,000 | 00,000,000 | 00,000,000 | 00,000,000 | |||||||||||||
| For the Years Ended | ||||||||||||||||
| December 31, | ||||||||||||||||
| 2010 | 2009 | $ change | % change | |||||||||||||
| (in millions, except per share data) | ||||||||||||||||
Net revenues | $ | 49,207 | $ | 38,754 | $ | 10,453 | 27.0 | % | ||||||||
Operating income | 5,666 | 5,183 | 483 | 9.3 | % | |||||||||||
Earnings from continuing operations | 2,495 | 2,810 | (315 | ) | (11.2 | %) | ||||||||||
Net earnings attributable to Kraft Foods | 4,114 | 3,021 | 1,093 | 36.2 | % | |||||||||||
Diluted earnings per share from continuing | 1.44 | 1.89 | (0.45 | ) | (23.8 | %) | ||||||||||
Diluted earnings per share attributable | 2.39 | 2.03 | 0.36 | 17.7 | % | |||||||||||
NetRevenues – Net revenues increased $10,453 million (27.0%) to $49,207 million in 2010, and organic net revenues (1) increased $1,229 million (3.2%) to $39,874 million as follows.
| ||||
| ||||
| ||||
| ||||
| ||||
| ||||
| ||||
| ||||
| ||||
Organic net revenue growth was driven by favorable volume/mix and higher net pricing. Favorable volume/mix was driven by higher base business shipments across all reportable business segments, except U.S. Cheese and U.S. Grocery. Higher net pricing was reflected across all reportable business segments, except Kraft Foods Europe and U.S. Snacks, as we increased pricing to offset higher input costs. The Cadbury acquisition added $9,143 million in net revenues and accounting calendar changes (excluding the effects of foreign currency) added $201 million in net revenues in 2010. These gains were partially offset by the impact of divestitures and unfavorable foreign currency. Foreign currency negatively affected net revenue in 2010 due primarily to the impacts of the highly inflationary Venezuelan economy and the strength of the U.S. dollar against the euro, partially offset by the strength of the Canadian dollar, Brazilian real, Australian dollar and Russian ruble against the U.S. dollar.
28
Operating Income– Operating income increased $483 million (9.3%) to $5,666 million in 2010, due to the following:
| 00,000,000 | 00,000,000 | |||||||
| Operating | ||||||||
| Income | Change | |||||||
| (in millions) | (percentage point) | |||||||
Operating Income for the Year Ended December 31, 2009 | $ | 5,183 | ||||||
2009 acquisition-related costs associated with Cadbury | 40 | 0.9 | pp | |||||
|
|
|
| |||||
Underlying Operating Income for the Year | $ | 5,223 | ||||||
|
| |||||||
Higher input costs | (477 | ) | (8.5 | )pp | ||||
Higher pricing | 403 | 7.2 | pp | |||||
Favorable volume/mix | 422 | 7.6 | pp | |||||
Lower selling, general and administrative expenses | 72 | 1.5 | pp | |||||
Increased operating income from the Cadbury acquisition | 1,139 | 21.8 | pp | |||||
Increased operating income from accounting calendar changes | 25 | 0.5 | pp | |||||
Change in unrealized gains/losses on hedging activities | (136 | ) | (2.3 | )pp | ||||
Higher net asset impairment and exit costs | (82 | ) | (1.6 | )pp | ||||
Unfavorable foreign currency | (8 | ) | (0.1 | )pp | ||||
Other, net | 4 | – | ||||||
|
|
|
| |||||
Total change in underlying operating income | 1,362 | 26.1% | ||||||
|
|
|
| |||||
Underlying Operating Income for the Year | $ | 6,585 | ||||||
Integration Program costs | (646 | ) | (12.5 | )pp | ||||
2010 acquisition-related costs associated with Cadbury | (273 | ) | (5.2 | )pp | ||||
|
|
|
| |||||
Operating Income for the Year Ended December 31, 2010 | $ | 5,666 | 9.3% | |||||
|
|
|
| |||||
Input cost increases outpaced pricing during the year. Higher raw material costs more than offset lower manufacturing costs and higher pricing was driven by the increased input costs we experienced during the year. The favorable volume/mix was driven primarily by strong contributions from Kraft Foods Developing Markets, Kraft Foods Europe, U.S. Beverages and U.S. Convenient Meals, partially offset by declines in U.S. Grocery, U.S. Cheese and U.S. Snacks. Total selling, general and administrative expenses increased $3,217 million from 2009. Excluding the impacts of divestitures, foreign currency, accounting calendar changes and our Cadbury acquisition (including Integration Program and acquisition-related costs), selling, general and administrative expenses decreased $72 million versus the prior year. The Cadbury acquisition increased operating income by $1,139 million. Accounting calendar changes (excluding the effects of foreign currency) added $25 million in operating income. The change in unrealized gains/losses on hedging activities also decreased operating income by $136 million, as we recognized gains of $67 million in 2010, versus gains of $203 million in 2009. During 2010, we reversed $37 million in restructuring program charges recorded in prior years, versus a reversal of $85 million in restructuring program charges recorded in prior years during 2009. We recorded asset impairment charges of $55 million in 2010 related to intangible assets in China and the Netherlands and on a biscuit plant and related property, plant and equipment in France, versus asset impairment charges of $21 million related to intangible assets in the Netherlands and to write off an investment in Norway that were recorded in 2009. In addition, unfavorable foreign currency decreased operating income by $8 million, due primarily to the impacts of the highly inflationary Venezuelan economy and the strength of the U.S. dollar against the euro, partially offset by the strength of the Canadian dollar, Brazilian real, Korean won and Australian dollar against the U.S. dollar. As a result of the net effect of these drivers, operating income margin decreased from 13.4% in 2009 to 11.5% in 2010. The margin decline was driven primarily by higher corporate expenses reflecting acquisition-related costs and Integration Program costs, as the decline in gross profit margin, due to increased input costs outpacing pricing, was essentially offset by overhead leverage.
29
Net Earnings and Earnings per Share Attributable to Kraft Foods– Net earnings attributable to Kraft Foods of $4,114 million increased by $1,093 million (36.2%) in 2010. Diluted EPS from continuing operations attributable to Kraft Foods were $1.44 in 2010, down 23.8% from $1.89 in 2009. Diluted EPS attributable to Kraft Foods were $2.39 in 2010, up 17.7% from $2.03 in 2009, due to the following:
| 00,000,000 | ||||
| Diluted EPS | ||||
Diluted EPS Attributable to Kraft Foods for the Year | $ | 2.03 | ||
Discontinued operations | 0.14 | |||
|
| |||
Diluted EPS Attributable to Kraft Foods from Continuing | 1.89 | |||
Acquisition-related costs | 0.04 | |||
|
| |||
Operating EPS(1) for the Year Ended December 31, 2009 | 1.93 | |||
|
| |||
Increases in operations | 0.22 | |||
Increases in operations from the Cadbury acquisition | 0.45 | |||
Change in unrealized gains on hedging activities | (0.06 | ) | ||
Higher net asset impairments and exit costs | (0.04 | ) | ||
Lower gains on divestitures | (0.04 | ) | ||
Change in foreign currency | – | |||
Higher interest and other expense, net(2) | (0.25 | ) | ||
Changes in taxes (3) | 0.05 | |||
Higher shares outstanding | (0.24 | ) | ||
|
| |||
Operating EPS(1) for the Year Ended December 31, 2010 | 2.02 | |||
|
| |||
Acquisition-related costs | (0.12 | ) | ||
Acquisition-related interest and other expense, net | (0.09 | ) | ||
Integration Program costs | (0.29 | ) | ||
U.S. health care legislation impact on deferred taxes | (0.08 | ) | ||
|
| |||
Diluted EPS Attributable to Kraft Foods from Continuing | 1.44 | |||
2010 gain on the divestiture of our Frozen Pizza business | 0.92 | |||
Discontinued operations | 0.03 | |||
|
| |||
Diluted EPS Attributable to Kraft Foods for the Year | $ | 2.39 | ||
|
| |||
30
Results of Operations by Reportable Segment
We manage and report operating results through three geographic units, Kraft Foods North America, Kraft Foodsreporting units: Developing Markets, Europe and Kraft Foods Developing Markets.North America. We manage the operations of Kraft Foods North America and Kraft Foods Europe by product category, and we manage the operations of Kraft Foods Developing Markets by location. Our reportable segments are U.S. Beverages, U.S. Cheese, U.S. Convenient Meals, U.S. Grocery, U.S. Snacks, Canada & N.A. Foodservice, Kraft Foodslocation and Europe and Kraft Foods Developing Markets. The results of operations from our Cadbury acquisition (including Integration Program and acquisition-related costs), are reflected within our U.S. Snacks, Canada & N.A. Foodservice, Kraft Foods Europe and Kraft Foods Developing Markets segments.North America by product category.
The following discussion compares our segment results offrom continuing operations for each of our reportable segments for 2011 with 2010, and for 2010 with 2009.the following periods –
| 00,000,000 | 00,000,000 | 00,000,000 | ||||||||||
| For the Years Ended December 31, | ||||||||||||
| 2011 | 2010 | 2009 | ||||||||||
| (in millions) | ||||||||||||
Net revenues: | ||||||||||||
Kraft Foods North America: | ||||||||||||
U.S. Beverages | $ | 3,006 | $ | 3,212 | $ | 3,057 | ||||||
U.S. Cheese | 3,810 | 3,528 | 3,605 | |||||||||
U.S. Convenient Meals | 3,328 | 3,131 | 3,029 | |||||||||
U.S. Grocery | 3,563 | 3,398 | 3,453 | |||||||||
U.S. Snacks | 6,329 | 6,001 | 4,964 | |||||||||
Canada & N.A. Foodservice | 5,152 | 4,696 | 3,922 | |||||||||
Kraft Foods Europe | 13,356 | 11,628 | 8,768 | |||||||||
Kraft Foods Developing Markets | 15,821 | 13,613 | 7,956 | |||||||||
|
|
|
|
|
| |||||||
Net revenues | $ | 54,365 | $ | 49,207 | $ | 38,754 | ||||||
|
|
|
|
|
| |||||||
| For the Years Ended December 31, | ||||||||||||
| 2012 | 2011 | 2010 | ||||||||||
| (in millions) | ||||||||||||
Net revenues: | ||||||||||||
Developing Markets | $ | 15,655 | $ | 15,621 | $ | 13,420 | ||||||
Europe | 12,457 | 13,356 | 11,628 | |||||||||
North America | 6,903 | 6,833 | 6,441 | |||||||||
|
|
|
|
|
| |||||||
Net revenues | $ | 35,015 | $ | 35,810 | $ | 31,489 | ||||||
|
|
|
|
|
| |||||||
| 00,000,000 | 00,000,000 | 00,000,000 | ||||||||||
| For the Years Ended December 31, | ||||||||||||
| 2011 | 2010 | 2009 | ||||||||||
| (in millions) | ||||||||||||
Operating income: | ||||||||||||
Kraft Foods North America: | ||||||||||||
U.S. Beverages | $ | 450 | $ | 564 | $ | 511 | ||||||
U.S. Cheese | 629 | 598 | 667 | |||||||||
U.S. Convenient Meals | 319 | 268 | 234 | |||||||||
U.S. Grocery | 1,240 | 1,164 | 1,146 | |||||||||
U.S. Snacks | 847 | 845 | 723 | |||||||||
Canada & N.A. Foodservice | 682 | 582 | 462 | |||||||||
Kraft Foods Europe | 1,406 | 1,115 | 785 | |||||||||
Kraft Foods Developing Markets | 2,053 | 1,577 | 936 | |||||||||
Unrealized gains / (losses) on | (100 | ) | 67 | 203 | ||||||||
Certain U.S. pension plan costs | (206 | ) | (179 | ) | (165 | ) | ||||||
General corporate expenses | (438 | ) | (724 | ) | (293 | ) | ||||||
Amortization of intangibles | (225 | ) | (211 | ) | (26 | ) | ||||||
|
|
|
|
|
| |||||||
Operating income | $ | 6,657 | $ | 5,666 | $ | 5,183 | ||||||
|
|
|
|
|
| |||||||
| For the Years Ended December 31, | ||||||||||||
| 2012 | 2011 | 2010 | ||||||||||
| (in millions) | ||||||||||||
Earnings from continuing operations before income taxes: | ||||||||||||
Operating income: | ||||||||||||
Developing Markets | $ | 2,067 | $ | 2,003 | $ | 1,533 | ||||||
Europe | 1,613 | 1,406 | 1,115 | |||||||||
North America | 873 | 863 | 805 | |||||||||
Unrealized gains / (losses) on hedging activities | 1 | (36 | ) | 38 | ||||||||
Certain U.S. pension plan costs | (92 | ) | (76 | ) | (56 | ) | ||||||
General corporate expenses | (714 | ) | (437 | ) | (511 | ) | ||||||
Amortization of intangibles | (217 | ) | (225 | ) | (210 | ) | ||||||
Gains on divestitures, net | 107 | – | – | |||||||||
Acquisition-related costs | (1 | ) | – | (218 | ) | |||||||
|
|
|
|
|
| |||||||
Operating income | 3,637 | 3,498 | 2,496 | |||||||||
Interest and other expense, net | (1,863 | ) | (1,618 | ) | (1,770 | ) | ||||||
|
|
|
|
|
| |||||||
Earnings from continuing operations before income taxes | $ | 1,774 | $ | 1,880 | $ | 726 | ||||||
|
|
|
|
|
| |||||||
31
As discussed in Note 16,Segment Reporting, we use segment operating income to evaluate segment performance and allocate resources. We believe it is appropriate to disclose this measure to help investors analyze segment performance and trends. Segment operating income excludes unrealized gains and losses on hedging activities (which are a component of cost of sales), certain components of our U.S. pension plan cost (which are a component of cost of sales and selling, general and administrative expenses), general corporate expenses (which are a component of selling, general and administrative expenses) and, amortization of intangibles, forgains and losses on divestitures and acquisition-related costs (which are a component of selling, general and administrative expenses) in all periods presented. We exclude the unrealized gains and losses on hedging activities from segment operating income in order to provide better transparency of our segment operating results. Once realized, the gains and losses on hedging activities are recorded within segment operating results. We exclude certain components of our U.S. pension plan cost from segment operating income because we centrally manage pension plan funding decisions and the determination of discount rate, expected rate of return on plan assets and other actuarial assumptions. Therefore, we allocate only the service cost component of our U.S. pension plan expense to segment operating income.
On March 1, 2011, Starbucks, without our authorization We exclude general corporate expenses, amortization of intangibles, gains and losses on divestitures and acquisition-related costs from segment operating income in what we contend is a violation and breachorder to provide better transparency of our agreements with Starbucks, took controlsegment operating results.
On February 8, 2013, the Venezuelan government announced the devaluation of the Starbucks CPG business in grocery storesofficial Venezuelan bolivar exchange rate from 4.30 bolivars to 6.30 bolivars to the U.S. dollar and other channels, after alleging we had breached the Supply and License Agreement. The dispute is pending Arbitration in Chicago, Illinois. We are seeking appropriate remedies, including but not limited to paymentelimination of the fair marketsecond-tier, government-regulated SITME exchange rate previously applied to value certain types of transactions. The impact of these announced changes resulted in a one-time $30 million unfavorable foreign currency impact which we will record within our Latin America operating segment in the Supply and License Agreement plusfirst quarter of 2013. We began accounting for the premium this agreement specifies. Starbucks has counterclaimedresults of our Venezuelan subsidiaries in U.S. dollars on January 1, 2010, as prescribed under U.S. GAAP for unspecified damages. The arbitration proceeding is sethighly inflationary economies. We use the official Venezuelan bolivar exchange rate to begin on July 11,translate the results of our Venezuelan operations into U.S. dollars. During 2012 and is expected to conclude on July 31, 2012. The results2011, we recorded immaterial foreign currency impacts in connection with highly inflationary accounting for Venezuela. In 2010, we recorded $115 million of the Starbucks CPG business were included primarily in our U.S. Beverage and Canada and N.A. Foodservice segments through March 1, 2011.unfavorable foreign currency impacts including a one-time $34 million charge upon adopting highly inflationary accounting for Venezuela.
In 2011, the unfavorable $1002012, we divested property of a Developing Markets subsidiary located in Russia for $72 million in net changeproceeds and recorded a $55 million pre-tax gain within selling, general and administrative expenses.
In 2012, net changes in unrealized gains / (losses) on hedging activities were favorable, primarily resulted from higher commodity hedge losses, partially offset byrelated to gains on foreign currency forward contracts.contracts and commodity hedging activity of $1 million. In 2010, the favorable $67 million2011, net changechanges in unrealized gains / (losses) on hedging activities were unfavorable, primarily resulted from gains associated withrelated to losses on foreign currency contracts and commodity hedge contracts.hedging activity of $36 million. In 2009, the favorable $203 million2010, net changechanges in unrealized gains / (losses) on hedging activities were favorable, primarily resultedrelated to gains on foreign currency contracts and commodity hedging activity of $38 million.
In connection with our 2012-2014 Restructuring Program, during 2012 we recorded restructuring charges of $102 million in operations, as a part of asset impairment and exit costs and implementation costs of $8 million in operations, as a part of cost of sales and selling, general and administrative expenses. These charges were recorded primarily within our North America segment.
In 2012, we recorded a $44 million benefit within our Europe segment related to the reversal of reserves carried over from 2008 unrealized losses on energy derivatives becoming realizedthe Cadbury acquisition in 20092010 which was subsequently determined to not be required.
We recorded Integration Program charges of $185 million in 2012, $521 million in 2011 and therefore, included$646 million in segment operating income.2010. During 2012, we reversed $45 million of Integration Program charges previously accrued in 2010 primarily related to planned and announced position eliminations that did not occur within our Europe segment. We recorded charges in the Integration Program in operations, as a part of selling, general and administrative expenses primarily within our Europe and Developing Markets segments, as well as within general corporate expenses.
The 2012 increase in general corporate expenses was due primarily to $407 million of Spin-Off Costs recorded within general corporate expenses, partially offset by lower Integration Program costs. The 2011 decrease in general corporate expenses was due primarily to Cadbury acquisition-related transaction fees in the prior year and lower Integration Program costs. Thecosts in 2011. In 2010, increase in general corporate expenses was primarily due to acquisition-related transaction fees,included $155 million of Integration Program costs, andas well as the impactaddition of Cadbury’s corporate charges. We
In 2012, we received $200 million in proceeds and recorded pre-tax gains of $107 million primarily related to the divestitures in Germany, Belgium and Italy. In 2011, there were no significant divestitures. In 2010, we divested businesses in Poland and Romania in connection with the acquisition of Cadbury, and reflected the impacts of these divestitures as adjustments to the Cadbury purchase price allocations.
In 2010, we acquired Cadbury and incurred acquisition-related transaction fees of $218 million of acquisition-related costs which was recorded within selling, general and administrative expenses.
The 2012 increase in interest and other expense, net was due primarily to $609 million of Spin-Off Costs recorded within interest expense, partially offset by a 2011 loss of $157 million related to several interest rate swaps that were settled in 2011, as well as lower long-term debt interest expense. The 2011 decrease in interest and other expense, net was due primarily to $251 million of acquisition-related financing fees recorded in 2010, and $40partially offset by the loss of $157 million in 2009. We recorded these charges in operations as part of general corporate expenses. In 2009, general corporate expenses included $50 million of charges for legal matters related to certain of our European operations.several interest rate swaps that settled in 2011.
32
U.S. BeveragesDeveloping Markets
| 00,000,000 | 00,000,000 | 00,000,000 | 00,000,000 | |||||||||||||||||||||||||||||
| For the Years Ended | ||||||||||||||||||||||||||||||||
| December 31, | For the Years Ended December 31, | |||||||||||||||||||||||||||||||
| 2011 | 2010 | $ change | % change | 2012 | 2011 | $ change | % change | |||||||||||||||||||||||||
| (in millions) | (in millions) | |||||||||||||||||||||||||||||||
Net revenues | $ | 3,006 | $ | 3,212 | $ | (206 | ) | (6.4 | %) | $ | 15,655 | $ | 15,621 | $ | 34 | 0.2% | ||||||||||||||||
Segment operating income | 450 | 564 | (114 | ) | (20.2 | %) | 2,067 | 2,003 | 64 | 3.2% | ||||||||||||||||||||||
| For the Years Ended | ||||||||||||||||||||||||||||||||
| December 31, | ||||||||||||||||||||||||||||||||
| 2010 | 2009 | $ change | % change | |||||||||||||||||||||||||||||
| (in millions) | ||||||||||||||||||||||||||||||||
Net revenues | $ | 3,212 | $ | 3,057 | $ | 155 | 5.1 | % | ||||||||||||||||||||||||
Segment operating income | 564 | 511 | 53 | 10.4 | % | |||||||||||||||||||||||||||
| For the Years Ended December 31, | ||||||||||||||||
| 2011 | 2010 | $ change | % change | |||||||||||||
| (in millions) | ||||||||||||||||
Net revenues | $ | 15,621 | $ | 13,420 | $ | 2,201 | 16.4% | |||||||||
Segment operating income | 2,003 | 1,533 | 470 | 30.7% | ||||||||||||
20112012 compared with 2010:2011:
Net revenues decreased $206increased $34 million (6.4%(0.2%), due to the impact of the Starbucks CPG business cessation (14.5 pp) and unfavorable volume/mix (0.2 pp), partially offset by higher net pricing (6.9(5.1 pp) and favorable volume/mix (1.9 pp), mostly offset by unfavorable foreign currency (5.6 pp) and the impact of prior year’s accounting calendar changes (1.2 pp). In Central and Eastern Europe, net revenues decreased driven by unfavorable foreign currency and the impact of prior year’s accounting calendar changes (including the 53rd week of shipments (1.4 pp). Unfavorable volume/mix was driven primarily by lower shipments in mainstream coffee, primarilyMaxwell House, and Gevaliacoffee, partially offset by the introduction ofMiOliquid concentrate and higher shipments in ready-to-drink beverages, primarilyCapri SunandKool-Aid, and Tassimocoffee. Higher net pricing was due primarily to input cost-driven pricing in coffee.
Segment operating income decreased $114 million (20.2%), due primarily to the impact of the Starbucks CPG business cessation. Remaining effects of higher net pricing, lower manufacturing costs, favorable volume mix, the impact of the 53rd week of shipments and lower advertising and consumer promotion costs, more than offset higher raw material costs and higher other selling, general and administrative expenses.
2010 compared with 2009:
Net revenues increased $155 million (5.1%), due to favorable volume/mix (4.5 pp) and higher net pricing (0.6 pp). Favorable volume/mix was driven primarily by higher shipments in ready-to-drink beverages, primarilyKool-Aid andCapri Sun; coffee, primarilyMaxwell House, Starbucks and Tassimo; and powdered beverages, primarilyTang.
Segment operating income increased $53 million (10.4%), due to favorable volume/mix, lower manufacturing costs, higher net pricing and lower other selling, general and administrative expenses, partially offset by higher raw material costs and higher advertising and consumer promotion costs.
33
U.S. Cheese
| 00,000,000 | 00,000,000 | 00,000,000 | 00,000,000 | |||||||||||||
| For the Years Ended | ||||||||||||||||
| December 31, | ||||||||||||||||
| 2011 | 2010 | $ change | % change | |||||||||||||
| (in millions) | ||||||||||||||||
Net revenues | $ | 3,810 | $ | 3,528 | $ | 282 | 8.0 | % | ||||||||
Segment operating income | 629 | 598 | 31 | 5.2 | % | |||||||||||
| For the Years Ended | ||||||||||||||||
| December 31, | ||||||||||||||||
| 2010 | 2009 | $ change | % change | |||||||||||||
| (in millions) | ||||||||||||||||
Net revenues | $ | 3,528 | $ | 3,605 | $ | (77 | ) | (2.1 | %) | |||||||
Segment operating income | 598 | 667 | (69 | ) | (10.3 | %) | ||||||||||
2011 compared with 2010:
Net revenues increased $282 million (8.0%), due to higher net pricing (8.2 pp) and the impact of the 53rd week of shipments (1.3 pp), partially offset by unfavorable volume/mix (1.1 pp) and the impact of divestitures (0.4 pp). Higher net pricing, across most major cheese categories, was due to input cost-driven pricing. Unfavorable volume/mix was driven primarily by lower shipments in sandwich, cream cheese and recipe cheese categories, partially offset by higher shipments in cultured, natural cheese and grated cheese categories.
Segment operating income increased $31 million (5.2%), due primarily to higher net pricing, lower other selling, general and administrative expenses (including a termination fee received due to the restructuring of a service contract), lower manufacturing costs, the impact of the 53rd week of shipments and the 2010 loss on the divestiture of ourBagelfuls operations, partially offset by higher raw material costs (primarily higher dairy costs), unfavorable volume/mix and higher advertising and consumer promotion costs.
2010 compared with 2009:
Net revenues decreased $77 million (2.1%), due to unfavorable volume/mix (4.7 pp) and the impact of divestitures (0.4 pp)2011), partially offset by higher net pricing (3.0 pp). Unfavorableacross most of the region and favorable volume/mix. In Middle East and Africa, net revenues increased driven by favorable volume/mix was driven by lower shipments across most cheese categories. Higherand higher net pricing across all cheese categories, was due to input cost-driven pricing,most of the region, partially offset by increased promotional spending.
Segment operating incomeunfavorable foreign currency and the impact of prior year’s accounting calendar changes. In Latin America, net revenues decreased $69 million (10.3%), due to higher raw material costs (primarily higher dairy costs),driven by unfavorable foreign currency, unfavorable volume/mix higher advertisingprimarily in Mexico and consumer promotion costsVenezuela and a loss on the divestitureimpact of ourBagelfulsoperations,prior year’s accounting calendar changes, partially offset by higher net pricing lower manufacturing costs, lower other selling, general and administrative expenses andacross the impact of divestitures.
34
U.S. Convenient Meals
| 00,000,000 | 00,000,000 | 00,000,000 | 00,000,000 | |||||||||||||
| For the Years Ended | ||||||||||||||||
| December 31, | ||||||||||||||||
| 2011 | 2010 | $ change | % change | |||||||||||||
| (in millions) | ||||||||||||||||
Net revenues | $ | 3,328 | $ | 3,131 | $ | 197 | 6.3 | % | ||||||||
Segment operating income | 319 | 268 | 51 | 19.0 | % | |||||||||||
| For the Years Ended | ||||||||||||||||
| December 31, | ||||||||||||||||
| 2010 | 2009 | $ change | % change | |||||||||||||
| (in millions) | ||||||||||||||||
Net revenues | $ | 3,131 | $ | 3,029 | $ | 102 | 3.4 | % | ||||||||
Segment operating income | 268 | 234 | 34 | 14.5 | % | |||||||||||
2011 compared with 2010:
Net revenues increased $197 million (6.3%), due to higher net pricing (5.9 pp) and the impact of the 53rd week of shipments (1.4 pp), partially offset by unfavorable volume/mix (1.0 pp). Higher net pricing was due to input cost-driven pricing primarily related to bacon, cold cuts, hot dogs andLunchables combination meals. Unfavorable volume/mix was driven primarily by lower shipments in bacon and hot dogs, partially offset by higher shipments in cold cuts andLunchables combination meals.
Segment operating income increased $51 million (19.0%), due primarily to higher net pricing, lower manufacturing costs, lower other selling, general and administrative expenses and the impact of the 53rd week of shipments, partially offset by higher raw material costs, higher advertising and consumer promotion costs and unfavorable volume/mix.
2010 compared with 2009:
Net revenues increased $102 million (3.4%), due to favorable volume/mix (3.1 pp) and higher net pricing (0.3 pp). Favorable volume/mix was driven by higher shipments in hot dogs, Lunchablescombination meals and cold cuts. Higher net pricing was driven by input-cost driven pricing, mostly offset by increased promotional spending.
Segment operating income increased $34 million (14.5%), due to lower other selling, general and administrative expenses, lower manufacturing costs, favorable volume/mix and higher net pricing, partially offset by higher raw material costs and higher advertising and consumer promotion costs.
35
U.S. Grocery
| 00,000,000 | 00,000,000 | 00,000,000 | 00,000,000 | |||||||||||||
| For the Years Ended | ||||||||||||||||
| December 31, | ||||||||||||||||
| 2011 | 2010 | $ change | % change | |||||||||||||
| (in millions) | ||||||||||||||||
Net revenues | $ | 3,563 | $ | 3,398 | $ | 165 | 4.9 | % | ||||||||
Segment operating income | 1,240 | 1,164 | 76 | 6.5 | % | |||||||||||
| For the Years Ended | ||||||||||||||||
| December 31, | ||||||||||||||||
| 2010 | 2009 | $ change | % change | |||||||||||||
| (in millions) | ||||||||||||||||
Net revenues | $ | 3,398 | $ | 3,453 | $ | (55 | ) | (1.6 | %) | |||||||
Segment operating income | 1,164 | 1,146 | 18 | 1.6 | % | |||||||||||
2011 compared with 2010:
Net revenues increased $165 million (4.9%), due to higher net pricing (6.4 pp) and the impact of the 53rd week of shipments (1.4 pp), partially offset by unfavorable volume/mix (2.9 pp). Higher net pricing was reflected across most grocery categories including spoonable dressings,Kraftmacaroni and cheese dinners, dry packaged desserts and ready-to-eat desserts. Unfavorable volume/mix was driven by lower shipments, primarily spoonable dressings, ready-to-eat desserts, barbecue sauces, dessert toppings and dry packaged desserts, partially offset by the introduction ofPlanters peanut butter and higher shipments inKraft macaroni and cheese dinners.
Segment operating income increased $76 million (6.5%), due primarily to higher net pricing, lower manufacturing costs, the impact of the 53rd week of shipments, lower advertising and consumer promotion costs and lower other selling, general and administrative expenses, partially offset by higher raw material costs and unfavorable volume/mix.
2010 compared with 2009:
Net revenues decreased $55 million (1.6%), due to unfavorable volume/mix (3.3 pp), partially offset by higher net pricing (1.7 pp). Unfavorable volume/mix was due primarily to lower shipments across most key categories, including pourable dressings, ready-to-eat desserts, spoonable dressings and dry packaged desserts. Higher net pricing, across key categories, was primarily related toKraftmacaroni and cheese dinners, pourable dressings, ready-to-eat desserts and dry packaged desserts.
Segment operating income increased $18 million (1.6%), due primarily to higher net pricing, lower manufacturing costs and lower other selling, general and administrative expenses, partially offset by unfavorable volume/mix and higher advertising and consumer promotion costs.
36
U.S. Snacks
| 00,000,000 | 00,000,000 | 00,000,000 | 00,000,000 | |||||||||||||
| For the Years Ended | ||||||||||||||||
| December 31, | ||||||||||||||||
| 2011 | 2010 | $ change | % change | |||||||||||||
| (in millions) | ||||||||||||||||
Net revenues | $ | 6,329 | $ | 6,001 | $ | 328 | 5.5 | % | ||||||||
Segment operating income | 847 | 845 | 2 | 0.2 | % | |||||||||||
| For the Years Ended | ||||||||||||||||
| December 31, | ||||||||||||||||
| 2010 | 2009 | $ change | % change | |||||||||||||
| (in millions) | ||||||||||||||||
Net revenues | $ | 6,001 | $ | 4,964 | $ | 1,037 | 20.9 | % | ||||||||
Segment operating income | 845 | 723 | 122 | 16.9 | % | |||||||||||
2011 compared with 2010:
Net revenues increased $328 million (5.5%), due to higher net pricing (5.0 pp), our Cadbury acquisition (1.3 pp) and the impact of the 53rd week of shipments (1.1 pp), partially offset by unfavorable volume/mix (1.9 pp). Biscuitsregion. In Asia Pacific, net revenues increased due to higher net pricing the impactacross most of the 53rd week of shipments and favorable volume/mix. Biscuitsregion, favorable volume/mix wasprimarily in China, Southeast Asia and Australia/New Zealand, partially offset by unfavorable foreign currency.
Segment operating income increased $64 million (3.2%), due primarily to higher shipments in cookies (primarilyChips Ahoy!, Oreo and Newtons), partially offset by lower shipments in crackers (primarily Premium, Ritz, 100 Calorie PacksandTriscuit). Snack nuts net revenues increased, due to higher net pricing, and the impact of the 53rd week of shipments, partially offset by unfavorable volume/mix. Confectionery net revenues increased, due to our Cadbury acquisition (incremental January 2011 operating results) and higher net pricing, partially offset by unfavorable volume/mix, due primarily to lower shipments in gum and candy.
Segment operating income increased $2 million (0.2%), due to higher net pricing, lower other selling, general and administrative expenses, the impact of the 53rd week of shipments, our Cadbury acquisition due to the incremental January 2011 operating results and lower acquisition-related costs, partially offset by higher raw material costs, unfavorable volume/mix, higher manufacturing costs and higher Integration Program costs.
2010 compared with 2009:
Net revenues increased $1,037 million (20.9%), due to our Cadbury acquisition (21.7 pp) and favorable volume/mix, (0.5 pp), partially offset by the impact of divestitures (1.1 pp) and lower net pricing (0.2 pp). Biscuits net revenues decreased, driven by unfavorable volume/mix, partially offset by higher net pricing. Biscuits unfavorable volume/mix was due primarily to lower shipments in crackers (primarilyWheat Thins,Cheese Nips, PremiumandHoney Maid) and cookies (primarilyNewtonsand Nutter Butter). Snack nuts net revenues increased, due to favorable volume/mix, driven by higher shipments.
Segment operating income increased $122 million (16.9%), due primarily to our Cadbury acquisition (including Integration Program costs and acquisition-related costs),a gain on the favorable resolutionsale of a settlement relating to the 2009 pistachio product recall, lower manufacturing costs and lower other selling, general and administrative expenses. These favorable variances wereproperty in Russia, partially offset by higher raw material costs, higher advertising and consumer promotion costs, unfavorable volume/mix, the 2009 gain on the divestiture of ourBalancebar operationsforeign currency, an asset impairment charge related to a trademark in the U.S.,Japan, higher other selling, general and administrative expenses, higher manufacturing costs, Spin-Off Costs incurred, the impact of divestituresfrom prior year’s accounting calendar changes and lower net pricing.costs incurred for the 2012-2014 Restructuring Program.
37
Canada & N.A. Foodservice
| 00,000,000 | 00,000,000 | 00,000,000 | 00,000,000 | |||||||||||||
| For the Years Ended | ||||||||||||||||
| December 31, | ||||||||||||||||
| 2011 | 2010 | $ change | % change | |||||||||||||
| (in millions) | ||||||||||||||||
Net revenues | $ | 5,152 | $ | 4,696 | $ | 456 | 9.7 | % | ||||||||
Segment operating income | 682 | 582 | 100 | 17.2 | % | |||||||||||
| For the Years Ended | ||||||||||||||||
| December 31, | ||||||||||||||||
| 2010 | 2009 | $ change | % change | |||||||||||||
| (in millions) | ||||||||||||||||
Net revenues | $ | 4,696 | $ | 3,922 | $ | 774 | 19.7 | % | ||||||||
Segment operating income | 582 | 462 | 120 | 26.0 | % | |||||||||||
2011 compared with 2010:
Net revenues increased $456$2,201 million (9.7%(16.4%), due to higher net pricing (5.3(7.4 pp), favorable volume/mix (4.0 pp), favorable foreign currency (2.9(3.0 pp), our Cadbury acquisition (2.8 pp), and the impact of accounting calendar changes (including the 53rd week of shipments (1.2 pp) and our Cadbury acquisition (0.9in 2011) (0.1 pp), partially offset by the impact of divestitures (including for reporting purposes the Starbucks CPG business) (0.4 pp)2010 divestiture of certain Cadbury confectionery operations in Poland and unfavorable volume/mix (0.2Romania (0.9 pp). In Canada,Central and Eastern Europe, net revenues increased, driven primarily by favorable foreign currency, higher net pricing our Cadbury acquisition andacross the region, the impact of accounting calendar changes (including the 53rd week of shipments partially offset by unfavorable volume/mix, reflecting volume declines across most retail businesses, except grocery and cheese, and the impact of divestitures (including for reporting purposes the Starbucks CPG business). In N.A. Foodservice, net revenues increased, driven primarily by higher net pricing, favorable volume/mix, the impact of the 53rd week of shipments,in 2011), favorable foreign currency and our Cadbury acquisition.acquisition, partially offset by the impact of divestitures and unfavorable volume/mix. In Middle East and Africa, net revenues increased, driven by higher net pricing across the region, our Cadbury acquisition, favorable volume/mix and the impact of accounting calendar changes, partially offset by unfavorable foreign currency. In Latin America, net revenues increased, driven by higher net pricing across the region, favorable volume/mix across most of the region, our Cadbury acquisition and favorable foreign currency, partially offset by the impact of accounting calendar changes. In Asia Pacific, net revenues increased, due primarily to favorable volume/mix, favorable foreign currency, our Cadbury acquisition and higher net pricing across most of the region, partially offset by the impact of accounting calendar changes.
Segment operating income increased $100$470 million (17.2%(30.7%), due primarily to higher net pricing, lower manufacturing costs,favorable volume/mix, favorable foreign currency, our Cadbury acquisition due to the incremental January 2011 operating results, 2010 asset impairment charges related to trademarks in China, lower acquisition-related costs and lower Integration Program costs. These favorable variances were partially offset by higher raw material costs, higher manufacturing costs, higher other selling, general and administrative expenses (net of a gain on the sale of land) and higher advertising and consumer promotion costs.
Europe
| For the Years Ended December 31, | ||||||||||||||||
| 2012 | 2011 | $ change | % change | |||||||||||||
| (in millions) | ||||||||||||||||
Net revenues | $ | 12,457 | $ | 13,356 | $ | (899 | ) | (6.7% | ) | |||||||
Segment operating income | 1,613 | 1,406 | 207 | 14.7% | ||||||||||||
| For the Years Ended December 31, | ||||||||||||||||
| 2011 | 2010 | $ change | % change | |||||||||||||
| (in millions) | ||||||||||||||||
Net revenues | $ | 13,356 | $ | 11,628 | $ | 1,728 | 14.9% | |||||||||
Segment operating income | 1,406 | 1,115 | 291 | 26.1% | ||||||||||||
2012 compared with 2011:
Net revenues decreased $899 million (6.7%), due to unfavorable foreign currency (5.3 pp), the impact of prior year’s accounting calendar changes (including the 53rd week of shipments partially offset by higher raw material costsin 2011) (3.4 pp) and unfavorable volume/mix.
2010 compared with 2009:
Net revenues increased $774 million (19.7%), due to our Cadbury acquisition (11.1 pp), the significant impact of favorable foreign currency (6.4 pp), higher net pricing (1.5 pp) and favorable volume/mix (0.8divestitures (0.3 pp), partially offset by the impact of divestitures (0.1favorable volume/mix (1.5 pp). In Canada, net revenues increased, driven by our Cadbury acquisition, favorable foreign currency, and higher net pricing (0.8 pp). Unfavorable foreign currency was due to the strength of the U.S. dollar relative to most foreign currencies, primarily the euro, British pound sterling, Swedish krona and favorableSwiss Franc. Favorable volume/mix was driven primarily by higher shipments in its grocery, cheesechocolate, biscuits and convenient meals retail businesses. In N.A. Foodservice, net revenues increased, driven by higher net pricing and favorable foreign currency,coffee, partially offset by unfavorable volume/mix (unfavorable product mix,lower shipments in cheese & grocery and gum & candy. Higher net of higher shipments).pricing was reflected across all categories except chocolate.
Segment operating income increased $120$207 million (26.0%(14.7%), due primarily to our Cadbury acquisition (includinglower Integration Program costs (including the $45 million reversal of Integration Program charges previously accrued in 2010 primarily related to planned and acquisition-related costs)announced position eliminations that did not occur upon concluding the majority of local workers council negotiations in April 2012), lower manufacturing costs, higher net pricing, favorable foreign currency, lower manufacturing costs,other selling, general and administrative expenses (which includes a $44 million benefit related to the reversal of reserves not required carried over from the Cadbury acquisition in 2010), and favorable volume/mix, and lowerpartially offset by higher advertising and consumer promotion costs, partially offset by higher raw material costs, unfavorable foreign currency, the impact of prior year’s accounting calendar changes (including the 53rd week of shipments in 2011) and higher other selling, general and administrative expenses.
38
Kraft Foods Europecosts incurred for the 2012-2014 Restructuring Program.
| 00,000,000 | 00,000,000 | 00,000,000 | 00,000,000 | |||||||||||||
| For the Years Ended | ||||||||||||||||
| December 31, | ||||||||||||||||
| 2011 | 2010 | $ change | % change | |||||||||||||
| (in millions) | ||||||||||||||||
Net revenues | $ | 13,356 | $ | 11,628 | $ | 1,728 | 14.9 | % | ||||||||
Segment operating income | 1,406 | 1,115 | 291 | 26.1 | % | |||||||||||
| For the Years Ended | ||||||||||||||||
| December 31, | ||||||||||||||||
| 2010 | 2009 | $ change | % change | |||||||||||||
| (in millions) | ||||||||||||||||
Net revenues | $ | 11,628 | $ | 8,768 | $ | 2,860 | 32.6 | % | ||||||||
Segment operating income | 1,115 | 785 | 330 | 42.0 | % | |||||||||||
2011 compared with 2010:
Net revenues increased $1,728 million (14.9%), due to favorable foreign currency (5.5 pp), higher net pricing (4.4 pp), the impact of accounting calendar changes (including the 53rd week of shipments) (3.0 pp), our Cadbury acquisition (1.8 pp) and favorable volume/mix (0.2 pp). Favorable foreign currency primarily reflectedwas due to the strength of most foreign currencies relative to the U.S. dollar, primarily the euro, Swedish krona, British pound sterling and Swiss franc against the U.S. dollar.franc. Higher net pricing was reflected across all major categories except gum and& candy. Favorable volume/mix was due primarily to higher shipments in cheese, biscuits and chocolate, partially offset by lower shipments in coffee, cheese & grocery and gum and& candy.
Segment operating income increased $291 million (26.1%), due primarily to higher net pricing, lower manufacturing costs, lower other selling, general and administrative expenses, favorable foreign currency, the impact of accounting calendar changes (including the 53rd week of shipments), the absence of asset impairment charges recorded in 2010, our Cadbury acquisition due to the incremental January 2011 operating results, lower acquisition-related costs, lower advertising and consumer promotion costs and favorable volume/mix. These favorable factors were partially offset by higher raw material costs and lower reversal of prior years’ restructuring program costs.
2010 compared with 2009:North America
| For the Years Ended December 31, | ||||||||||||||||
| 2012 | 2011 | $ change | % change | |||||||||||||
| (in millions) | ||||||||||||||||
Net revenues | $ | 6,903 | $ | 6,833 | $ | 70 | 1.0% | |||||||||
Segment operating income | 873 | 863 | 10 | 1.2% | ||||||||||||
| For the Years Ended December 31, | ||||||||||||||||
| 2011 | 2010 | $ change | % change | |||||||||||||
| (in millions) | ||||||||||||||||
Net revenues | $ | 6,833 | $ | 6,441 | $ | 392 | 6.1% | |||||||||
Segment operating income | 863 | 805 | 58 | 7.2% | ||||||||||||
2012 compared with 2011:
Net revenues increased $2,860$70 million (32.6%(1.0%), due to our Cadbury acquisition (33.0higher net pricing (3.6 pp), favorablepartially offset by unfavorable volume/mix (3.3(1.2 pp), the impact of prior year’s 53rd week of shipments (1.0 pp), the impact of divestitures (0.2 pp) and unfavorable foreign currency (0.2 pp). In the favorable impact of an accounting calendar change for certain European biscuits operations (0.6 pp)U.S., net revenues increased due to higher net pricing, partially offset by the impact of prior year’s 53rd week of shipments, unfavorable foreign currency (3.1 pp), lower net pricing (1.0 pp),volume/mix including the impact of package size changes primarily in biscuits and the impact of divestitures (0.2 pp). Volume/divestitures. Higher net pricing was reflected primarily in biscuits. In Canada, net revenues decreased due to unfavorable volume/mix, gainsunfavorable foreign currency and the impact of prior year’s 53rd week of shipments, partially offset by higher net pricing. Unfavorable volume/mix was due primarily to lower shipments in chocolate and gum & candy as well as the completion of a co-manufacturing agreement from a previous divestiture, partially offset by higher shipments in biscuits. Higher net pricing was reflected primarily in biscuits chocolate, cheese and coffee,chocolate.
Segment operating income increased $10 million (1.2%), due primarily to higher shipments, drove net revenues higher. Lower net pricing, was reflected across all categories, except coffee. Unfavorable foreign currency primarily reflected the strength of the U.S. dollar against the euro, partially offset by the strength of the Swedish krona, Swiss franc,lower Integration Program costs and Norwegian krone versus the U.S. dollar.
Segment operating income increased $330 million (42.0%), due primarily to favorable volume/mix, lower manufacturing costs, lower other selling, general and administrative expenses, our Cadbury acquisition (including Integration Program and acquisition-related costs), the 2009 asset impairment charges related to certain intangible assets in the Netherlands and to write-off an investment in Norway, the 2009 loss on the divestiture of a plant in Spain, lower advertising and consumer promotion costs and the impact of accounting calendar change for certain European biscuits operations. These favorable variances were partially offset by higher raw material costs, lower net pricing, lower reversalcosts incurred for the 2012-2014 Restructuring Program, unfavorable volume/mix, higher advertising and consumer promotion costs, higher other selling, general and administrative expenses and the impact of the prior years’ restructuring program costs, asset impairment charges related to intangible assets in the Netherlands and on a biscuit plant and related property, plant and equipment in France, and unfavorable foreign currency.
39
year’s 53Kraft Foods Developing Marketsrd week of shipments.
| 00,000,000 | 00,000,000 | 00,000,000 | 00,000,000 | |||||||||||||
| For the Years Ended | ||||||||||||||||
| December 31, | ||||||||||||||||
| 2011 | 2010 | $ change | % change | |||||||||||||
| (in millions) | ||||||||||||||||
Net revenues | $ | 15,821 | $ | 13,613 | $ | 2,208 | 16.2 | % | ||||||||
Segment operating income | 2,053 | 1,577 | 476 | 30.2 | % | |||||||||||
| For the Years Ended | ||||||||||||||||
| December 31, | ||||||||||||||||
| 2010 | 2009 | $ change | % change | |||||||||||||
| (in millions) | ||||||||||||||||
Net revenues | $ | 13,613 | $ | 7,956 | $ | 5,657 | 71.1 | % | ||||||||
Segment operating income | 1,577 | 936 | 641 | 68.5 | % | |||||||||||
2011 compared with 2010:
Net revenues increased $2,208$392 million (16.2%(6.1%), due to higher net pricing (7.3 pp), favorable volume/mix (3.9 pp), favorable foreign currency (2.9(3.5 pp), our Cadbury acquisition (2.9(1.8 pp), and the impact of accounting calendar changes (including the 53rd week of shipments in 2011) (0.1(1.1 pp) and favorable foreign currency (0.7 pp), partially offset by the impact of the 2010 divestiture of certain Cadbury confectionery operations in Poland and Romania (0.9unfavorable volume/mix (1.0 pp). In CEEMA,the U.S., net revenues increased, driven bydue to higher net pricing, across the region,our Cadbury acquisition and the impact of accounting calendar changes (including the 53rd week of shipments, in 2011), our Cadbury acquisition and favorable foreign currency, partially offset by the impact of divestitures and unfavorable volume/mix. Higher net pricing was reflected across all categories. Unfavorable volume/mix was due primarily to lower shipments in gum & candy, partially offset by higher shipments in biscuits. In Latin America,Canada, net revenues increased, driven by higher net pricing across the region, favorable volume/mix across most of the region, our Cadbury acquisition and favorable foreign currency, partially offset by the impact of accounting calendar changes. In Asia Pacific, net revenues increased, due primarily to favorable volume/mix,by favorable foreign currency, our Cadbury acquisition, the impact of the 53rd week of shipments and higher net pricing, across most of the region, partially offset by the impact of accounting calendar changes.unfavorable volume/mix. Higher net pricing was reflected primarily in biscuits. Unfavorable volume/mix was due primarily to lower shipments in chocolate and biscuits.
Segment operating income increased $476$58 million (30.2%(7.2%), due primarily to higher net pricing, favorable volume/mix, favorable foreign currency,lower other selling, general and administrative expenses, our Cadbury acquisition due to the incremental January 2011 operating results, 2010 asset impairment charges related to trademarks in China,the impact of the 53rd week of shipments, favorable foreign currency, lower acquisition-related costs and lower Integration Program costs. These favorable variances wereadvertising and consumer promotion costs, partially offset by higher raw material costs, higher manufacturing costs, higher other selling, generalunfavorable volume/mix, and administrative expenses (net of a gain on the sale of land), higher advertising and consumer promotion costs.
2010 compared with 2009:
Net revenues increased $5,657 million (71.1%), due to our Cadbury acquisition (59.8 pp), favorable volume/mix (6.7 pp), higher net pricing (3.2 pp) and the impact of accounting calendar changes for Asia Pacific and certain operations in Latin America (1.9 pp), partially offset by the impact of divestitures (0.3 pp) and the impact of unfavorable foreign currency (0.2 pp). In CEEMA, net revenues increased, driven by our Cadbury acquisition, favorable volume/mix across most of the region and favorable foreign currency. In Latin America, net revenues increased, driven by our Cadbury acquisition, higher net pricing across most of the region and favorable volume/mix, primarily in Brazil, Argentina, Central America and Mexico, partially offset by unfavorable foreign currency and the impact of divestitures. In Asia Pacific, net revenues increased, due primarily to our Cadbury acquisition, favorable volume/mix driven by higher shipments across the region, primarily in China, Indonesia and Australia/New Zealand, and favorable foreign currency.
Segment operating income increased $641 million (68.5%), due to our Cadbury acquisition (including Integration Program and acquisition-related costs), favorable volume/mix, higher net pricing, lower other selling, general and administrative expenses and the impact of the accounting calendar change for Asia Pacific and certain operations in Latin America. These favorable variances were partially offset by higher advertising and consumer promotion costs, higher manufacturing costs, higher raw material costs, asset impairment charges related to trademarks in China and unfavorable foreign currency.
Venezuela – In the fourth quarter of 2009, the Venezuelan economy was classified as highly inflationary under U.S. GAAP. Effective January 1, 2010, we began accounting for our Venezuelan subsidiaries under highly inflationary accounting rules, which principally means all transactions are recorded in U.S. dollars. We use both the official Venezuelan bolivar exchange rate and the government-regulated Transaction System for Foreign Currency Denominated Securities (“SITME”) rate to translate our Venezuelan operations into U.S. dollars, based on the nature of the operations of each individual subsidiary.costs.
40
We recorded approximately $10 million of favorable foreign currency impacts relating to highly inflationary accounting in Venezuela during 2011 and approximately $115 million of unfavorable foreign currency impacts during 2010. The 2010 loss included a one-time impact of $34 million to translate cash we previously recorded at the secondary market exchange rate.
We do not expect our 2012 operating results to be significantly affected by changes in Venezuelan foreign currency.
Note 1,Summary of Significant Accounting Policies, to the consolidated financial statements includes a summary of the significant accounting policies we used to prepare our consolidated financial statements. We have discussed the selection and disclosure of our critical accounting policies and estimates with our Audit Committee. The following is a review of the more significant assumptions and estimates, as well as the accounting policies we used to prepare our consolidated financial statements.
Principles of Consolidation:
The consolidated financial statements include Kraft Foods,Mondelēz International, as well as our wholly owned and majority owned subsidiaries. The majority of our operating subsidiaries report results as of the last Saturday of the year. A portion of our international operating subsidiaries report results as of the last calendar day or the last Saturday of the year. Because a significant number of our operating subsidiaries report results onday. In 2011, the last Saturday of the year and this year, that day fell on December 31, so our 2011 results included an extraone more week of operating results (“53rd week”) of operating results than in the prior two years2012 or 2010, which each had 52-weeks.52 weeks.
In 2011, we changed the consolidation date for certain operations of our Kraft Foods Europe segment and in the Latin America, and Central and Eastern Europe (“CEE”) and Middle East and Africa (“CEEMA”MEA”) regions within our Kraft Foods Developing Markets segment. Previously, these operations primarily reported results two weeks prior to the end of the period. Now,Subsequent to the 2011 changes, our Kraft Foods Europe segment reports results as of the last Saturday of each period. OurCertain operations in Latin America and certain operations in CEEMAwithin our Developing Markets segment now report results as of the last calendar day of the period or the last Saturday of the period. These changes and the 53rd week in 2011 resulted in a favorable impact to net revenues of approximately $920$679 million and a favorable impact of approximately $150$93 million to operating income in 2011.
In 2010, we changed the consolidation date for certain European biscuits operations, which are included within our Kraft Foods Europe segment, and certain operations in Asia Pacific and Latin America within our Kraft Foods Developing Markets segment. Previously, these operations primarily reported period-end results one month or two weeks prior to the end of the period. Kraft Foods Europe moved the reporting of these operations to two weeks prior to the end of the period, and Asia Pacific and Latin America moved the reporting of these operations to the last day of the period. These changes resulted in a favorable impact to net revenues of approximately $200$193 million and had an insignificanta favorable impact onof $23 million to operating income in 2010.
We believe these changes are preferable and will improve business planning and financial reporting by better matching the close dates of the operating subsidiaries within our Kraft Foods Europe segment and Kraft Foods Developing Markets segmentsegments and by bringing the reporting datedates closer to the period-end date. As the effect to prior-period results was not material, we have not revised prior-period results.
We account for investments in which we exercise significant influence (20%-50% ownership interest) under the equity method of accounting. We use the cost method of accounting for investments in which we have an ownership interest of less than 20% and in which we do not exercise significant influence. Noncontrolling interest in subsidiaries consists of the equity interest of noncontrolling investors in consolidated subsidiaries of Kraft Foods.Mondelēz International. All intercompany transactions are eliminated.
Use of Estimates:
We prepare our consolidated financial statements in accordance with U.S. GAAP, which requires us to make estimates and assumptions that affect a number of amounts in our consolidated financial statements. Significant accounting policy elections, estimates and assumptions include, among others, pension and benefit plan assumptions, valuation assumptions of goodwill and intangible assets, useful lives of long-lived assets, marketing program accruals, insurance and self-insurance reserves and income taxes. We base our estimates on historical experience and other assumptions that we believe are reasonable. If actual amounts differ from estimates, we include the revisions in our consolidated results of operations in the period in which we know the actual amounts. Historically, the aggregate differences, if any, between our estimates and actual amounts in any year have not had a material effect on our consolidated financial statements.
41
Inventories:
Inventories are stated at the lower of cost or market. We value all our inventories using the average cost method. We also record inventory allowances for overstocked and obsolete inventories due to ingredient and packaging changes.
Long-Lived Assets:
We review long-lived assets, including amortizable intangible assets, for impairment when conditions exist that indicate the carrying amount of the assets may not be fully recoverable. We perform undiscounted operating cash flow analyses to determine if an impairment exists. When testing for impairment of assets held for use, we group assets and liabilities at the lowest level for which cash flows are separately identifiable. If an impairment is determined to exist, the loss is calculated based on estimated fair value. Impairment losses on assets to be disposed of, if any, are based on the estimated proceeds to be received, less costs of disposal.
In 2011, there were no2012, we recorded impairment charges of $18 million within the 2012-2014 Restructuring Program. We did not record any asset impairments recorded.in 2011. In 2010, we recorded an asset impairment of $12 million on a biscuit plant and relatedfor certain property, plant and equipment in France. In 2009, we recorded a $9 million asset impairment charge to write off an investmentbiscuit plant in Norway.France.
Goodwill and Non-Amortizable Intangible Assets:
We test goodwill and non-amortizable intangible assets for impairment at least annually on October 1. We assess goodwill impairment risk by first performing a qualitative review of entity-specific, industry, market and general economic factors for each reporting unit. If significant potential goodwill impairment risk exists for a specific reporting unit, we apply a two-step quantitative test. The first step compares the reporting unit’s estimated fair value with its carrying value. We estimate a reporting unit’s fair value using a 20-year projection of discounted cash flows which incorporates planned growth rates, market-based discount rates and estimates of residual value. For reporting units within our Kraft Foods North America and Kraft Foods Europe geographic units, we used a market-based, weighted-average cost of capital of 6.8%6.3% to discount the projected cash flows of those operations. For reporting units within our Kraft Foods Developing Markets geographic unit, we used a risk-rated discount rate of 9.8%9.3%. Estimating the fair value of individual reporting units requires us to make assumptions and estimates regarding our future plans, industry and economic conditions and ourconditions. Our actual results and conditions may differ over time. If the carrying value of a reporting unit’s net assets exceeds its fair value, the second step is applied to measure the difference between the carrying value and implied fair value of goodwill. If the carrying value of goodwill exceeds its implied fair value, the goodwill is considered impaired and reduced to its implied fair value.
In 2012, 2011 and 2010, there were no impairments of goodwill. In connection with our 2012 annual impairment testing, we noted two reporting units which were more sensitive to near-term changes in discounted cash flow assumptions: U.S. Confections with $2,177 million of goodwill as of December 31, 2012 and fair value in excess of its carrying value of net assets of 9% and Europe Biscuits with $2,569 million of goodwill as of December 31, 2012 and fair value in excess of its carrying value of net assets of 16%. While the reporting units passed the first step of the impairment test, if the segment operating income or another valuation assumption for either reporting unit were to deteriorate significantly in the future, it could adversely affect the estimated fair value. If we are unsuccessful in our plans to increase the profitability of these businesses, the estimated fair values could fall further and lead to a potential goodwill impairment in the future.
We test non-amortizable intangible assets for impairment by first performing a qualitative review by assessing events and circumstances that could affect the fair value or carrying value of the indefinite-lived intangible asset. If significant potential impairment risk exists for a specific non-amortizable intangible asset, we quantitatively test for impairment by comparing the fair value of each intangible asset with its carrying value. Fair value of non-amortizable intangible assets is determined using planned growth rates, market-based discount rates and estimates of royalty rates. If the carrying value of the asset exceeds its fair value, the intangible asset is considered impaired and is reduced to its estimated fair value. We record intangible asset impairment charges within asset impairment and exit costs.
InDuring our 2012 review of non-amortizable intangible assets, we recorded $52 million of charges related to a trademark on a Japanese chewing gum product within our Developing Markets segment which had significantly lower revenue. The fair value of the intangible asset was determined under a relief of royalty valuation, which models the cash flows from the trademark assuming royalties were received under a licensing arrangement. The charge was calculated as the excess of the carrying value of the intangible asset over its estimated fair value and was recorded within asset impairment and exit costs. During our 2011 review, there were no impairments of goodwill or non-amortizable intangible assets. In 2010, we also noted no goodwill impairment and disclosed five reporting units which were more sensitive to near-term changes in discounted cash flow assumptions. In 2011, we noted only one reporting unit, U.S. Salty Snacks, which continues to be sensitive primarily to ongoing significant input cost pressure. U.S. Salty Snacks has $1,170 million of goodwill as of December 31, 2011, and its excess fair value over the carrying value of its net assets improved from 12% in 2010, to 19% in 2011. While the reporting unit passed the first step of the impairment test by a substantial margin, if its operating income were to decline significantly in the future, it would adversely affect the estimated fair value of the reporting unit. If input costs were to continue to rise, we expect to take further pricing actions as we have done in 2011. However, if we are unsuccessful in these efforts, it would decrease profitability, negatively affect the estimated fair value of the U.S. Salty Snacks reporting unit and could lead to a potential impairment in the future.
During our 2010 review, of goodwill and non-amortizable intangible assets, we recorded a $13 million charge for the impairment of intangible assets in the Netherlands and a $30 million charge for the impairment of intangible assets in China.
During our 2009 review, we recorded a $12 million charge for the impairment of intangible assets in the Netherlands.
Insurance and Self-Insurance:
We use a combination of insurance and self-insurance for a number of risks, including workers’ compensation, general liability, automobile liability, product liability and our obligation for employee health care benefits. LiabilitiesWe estimate the liabilities associated with thethese risks are estimated by consideringevaluating and making judgments about historical claims experience and other actuarial assumptions.assumptions and the estimated impact on future results.
Revenue Recognition:
We recognize revenues when title and risk of loss pass to customers, which generally occurs upon shipment or delivery of goods. Revenues are recorded net of consumer incentives and trade promotions and include all shipping and handling charges billed to customers. Our shipping and handling costs are classified as part of cost of sales. Provisions for product returns and customer allowances are also recorded as reductions to revenues within the same period that the revenue is recognized.
42
Marketing and Research and Development:
We promote our products with advertising, consumer incentives and trade promotions. These programs include, but are not limited to, discounts, coupons, rebates, in-store display incentives and volume-based incentives. We expense advertising costs either in the period the advertising first takes place or as incurred. Consumer incentive and trade promotion activities are recorded as a reduction to revenues based on amounts estimated as being due to customers and consumers at the end of a period. We base these estimates principally on historical utilization and redemption rates. For interim reporting purposes, advertising and consumer incentive expenses are charged to operations as a percentage of volume, based on estimated volume and related expense for the full year. We do not defer costs on our year-end consolidated balance sheet and all marketing costs are recorded as an expense in the year incurred. Advertising expense was $2,396$1,815 million in 2012, $1,860 million in 2011, $2,270and $1,729 million in 2010, and $1,581 million in 2009.2010. We expense costs as incurred for product research and development.development costs as incurred. Research and development expense was $702$462 million in 2012, $511 million in 2011, $583and $404 million in 2010, and $466 million in 2009.2010. We record marketing and research and development expenses within selling, general and administrative expenses.
Environmental Costs:
WeThroughout the countries in which we do business, we are subject to local, national and multi-national environmental laws and regulations relating to the protection of the environment. We accrue for environmental remediation obligations on an undiscounted basis when amounts are probable and can be reasonably estimated. The accruals are adjusted as new information develops or circumstances change. Recoveries of environmental remediation costs from third parties are recorded as assets when recovery of those costs is deemed probable. At December 31, 2011, our subsidiaries were involved in 68 active actions in the U.S. under Superfund legislation (and other similar actions and legislation) related to current operations and certain former or divested operations for which we retain liability.
Outside the U.S., we are subject to applicable multi-national, national and local environmental laws and regulations in the countries in which we do business. Outside the U.S., we have specific programs across our business units designed to meet applicable environmental compliance requirements.
In the United States, the laws and regulations include the Clean Air Act, the Clean Water Act, the Resource Conservation and Recovery Act and the Comprehensive Environmental Response, Compensation, and Liability Act (“CERCLA”). CERCLA imposes joint and severable liability on each potentially responsible party. As of December 31, 2012, our subsidiaries were involved in one active proceeding in the U.S. under a state equivalent of CERCLA related to our current operations. As of December 31, 2011, our subsidiaries were involved in 68 active actions. Except for the one active proceeding we retained, all the remaining active actions relate to and were retained by the divested Kraft Foods Group business.
As of December 31, 2012, we accrued an immaterial amount for environmental remediation. Based on information currently available, we believe that the ultimate resolution of existing environmental remediation actions and our compliance in general with environmental laws and regulations will not have a material effect on our financial results.
Employee Benefit Plans:
We provide a range of benefits to our employeescurrent and retired employees. TheseDepending on jurisdictions, tenure, presence of a union, job level and other factors, these include pension benefits, postretirement health care benefits and postemployment benefits, consisting primarily of severance. We record amounts relating to these plans based on calculations specified by U.S. GAAP. These calculations require the use of various actuarial assumptions, such as discount rates, assumed rates of return on plan assets, compensation increases, turnover rates and health care cost trend rates. We review our actuarial assumptions on an annual basis and make modifications to the assumptions based on current rates and trends when appropriate. As permitted by U.S. GAAP, we generally amortize any effect of the modifications over future periods. We believe that the assumptions used in recording our plan obligations are reasonable based on our experience and advice from our actuaries. Refer to Note 11,10,Benefit Plans, to the consolidated financial statements for a discussion of the assumptions used.
In connection with the Spin-Off, we transferred to Kraft Foods Group, the plan liabilities and assets associated with the Kraft Foods Group active and retired employees and certain of our retired employees that previously participated in our North American benefit plans. At October 1, 2012, we transferred benefit plan liabilities of $12,218 million, pension plan assets of $6,550 million, accumulated other comprehensive losses, net of tax, of $3,810 million and $2,146 million of related deferred tax assets. We also expect annual pension expenses to decrease by $91 million in connection with certain of our North American benefit plan obligations which were transferred to Kraft Foods Group in the Spin-Off.
We recorded the following amounts in earnings from continuing operations for these employee benefit plans during the years ended December 31, 2012, 2011 2010 and 2009:2010:
| 00,000,000 | 00,000,000 | 00,000,000 | ||||||||||||||||||||||
| 2011 | 2010 | 2009 | 2012 | 2011 | 2010 | |||||||||||||||||||
| (in millions) | (in millions) | |||||||||||||||||||||||
U.S. pension plan cost | $ | 351 | $ | 322 | $ | 313 | $ | 168 | $ | 118 | $ | 92 | ||||||||||||
Non-U.S. pension plan cost | 209 | 209 | 77 | 220 | 180 | 188 | ||||||||||||||||||
Postretirement health care cost | 229 | 234 | 221 | 84 | 66 | 66 | ||||||||||||||||||
Postemployment benefit plan cost | 51 | 17 | 18 | 15 | 49 | 13 | ||||||||||||||||||
Employee savings plan cost | 114 | 104 | 94 | 74 | 62 | 56 | ||||||||||||||||||
Multiemployer pension plan contributions | 32 | 30 | 29 | 28 | 27 | 27 | ||||||||||||||||||
Multiemployer medical plan contributions | 36 | 35 | 35 | 18 | 16 | 17 | ||||||||||||||||||
|
|
|
|
|
| |||||||||||||||||||
Net expense for employee benefit plans | $ | 1,022 | $ | 951 | $ | 787 | $ | 607 | $ | 518 | $ | 459 | ||||||||||||
|
|
|
|
|
| |||||||||||||||||||
The 20112012 net expense for employee benefit plans of $1,022$607 million increased by $71$89 million over the 2010 amount. The cost increase2011 amount, primarily related to higher amortization of the net loss from experience differences related to the U.S. and non-U.S. pension plans. The 2011 net expense for employee benefit plans of $518 million increased by $59 million over the 2010 amount, primarily related to higher amortization of the net loss from experience differences related to the U.S. pension plans and the incorporation of a Canadian postemployment plan into our obligations. The 2010
We expect our 2013 net expense for employee benefit plans to decrease by approximately $66 million. The decrease is primarily due to non-recurring costs in 2012 related primarily to certain benefit plan obligations transferred to Kraft Foods Group in the Spin-Off and other 2012 one-time costs, partially offset by increased benefit plan expenses in 2013 due to lower discount rates.
In 2012, other comprehensive losses included $2,266 million of $951 million increased by $164 million over the 2009 amount. The cost increasenet actuarial pre-tax losses primarily related to higherthe decrease in the discount rate utilized to determine our pension plan costs, including costs associated withbenefit obligations at December 31, 2012 (65 basis point decrease for U.S. plans and 81 basis point decrease for non-U.S. plans) and the Cadbury acquisitiondecrease in the discount rate utilized to determine our postretirement benefit obligations at December 31, 2012 (50 basis point decrease for U.S. plans and higher amortization of the net loss from experience differences.
43
The21 basis point decrease for our non-U.S. plans). In 2011, other comprehensive losses included $2.3 billion$2,333 million of net actuarial pre-tax losses primarily related to the decrease in the discount rate utilized to determine our pension plan benefit obligations at December 31, 2011 (68 basis point decrease for U.S. plans and 49 basis point decrease for non-U.S. plans), unfavorable differences between our expected and actual return on pension plan assets and the decrease in the discount rate utilized to determine our postretirement benefit obligations at December 31, 2011 (60 basis point decrease for U.S. plans and 73 basis point decrease for our non-U.S. plans). TheIn 2010, other comprehensive earnings included $361 million of net actuarial pre-tax losses primarily related to the decrease in the discount rate utilized to determine our pension plan benefit obligations at December 31, 2010 (40 basis point decrease for U.S. plans and 10 basis point decrease for non-U.S. plans) and the decrease in the discount rate utilized to determine our postretirement benefit obligations at December 31, 2010 (40 basis point decrease for U.S. plans and 23 basis point decrease for our non-U.S. plans), partially offset by favorable differences between our expected and actual return on pension plan assets.
In 2011,2012, we contributed $538$349 million to our U.S. pension plans (including $202 million related to Kraft Foods Group U.S. pension plans) and $361$329 million to our non-U.S. pension plans.plans (including $42 million related to Kraft Foods Group non-U.S. pension plans). In addition, employees contributed $26$24 million to our non-U.S. plans. Of our 20112012 pension contributions, approximately $495$315 million was voluntary.voluntary (including $185 million related to Kraft Foods Group pension plans). We make contributions to our U.S. and non-U.S. pension plans, primarily, to the extent that they are tax deductible and do not generate an excise tax liability. For
In 2013, we estimate that our pension contributions will be $8 million to our U.S. qualified pension plans in 2012, weand $309 million to our non-U.S. plans based on current tax laws. We are currently only required to make a nominal cash contribution to our U.S. qualified pension plans under the Pension Protection Act of 2006. Based on current tax law, we estimate that 2012 pension contributions would be approximately $55 million to our U.S. plans and approximately $425 million to our non-U.S. plans. Of the total 20122013 pension contributions, none is expected to be voluntary. Our actual contributions may be different due to many factors, including changes in tax and other benefit laws; significant differences between expected and actual pension asset performance or interest rates; or other factors.
We expect our 2012 net expense for employee benefit plans to increase by approximately $180 million, primarily due to a weighted-average decrease of 68 basis points in our U.S. pension discount rate assumptions and 49 basis points in our non-U.S. pension discount rate assumptions.
In 2009, our U.S. pension plans were amended. We are freezing our U.S. pension plans for current salaried and non-union hourly employees effective December 31, 2019. Pension accruals for all salaried and non-union employees who are currently earning pension benefits will end on December 31, 2019, and continuing pay and service will be used to calculate the pension benefits through December 31, 2019. Our projected benefit obligation decreased $168 million in 2009, and we incurred a $5 million curtailment charge in 2009 related to the freeze. Beginning in 2010, our annual U.S. pension plan costs decreased by approximately $40 million as a result of this change. Additionally, forFor salaried and non-union hourly employees hired in the U.S. after January 1, 2009, we discontinued benefits under our U.S. pension plans, and we replaced them with an enhanced company contribution to our employee savings plan. This did not have a significant impact on our 2011, 2010 or 2009Additionally, we will be freezing the U.S. pension plan costs.plans for current salaried and non-union hourly employees effective December 31, 2019.
For our postretirement plans, our 20122013 health care cost trend rate assumption decreasedincreased to 7.00%7.50% from 7.50%7.00% for our U.S. postretirement plans and decreasedincreased to 7.42%7.68% from 8.83%7.42% for our non-U.S. postretirement plans. We established these rates based upon our most recent experience as well as our expectation for health care trend rates going forward. We anticipate that our health care cost trend rate assumption will be 5.00% for U.S. plans by 20162018 and 5.53%5.58% for non-U.S. plans by 2016.2018. Assumed health care cost trend rates have a significant effect on the amounts reported for the health care plans. A one-percentage-point change in assumed health care cost trend rates would have the following effects on our costs and obligation as of December 31, 2011:2012:
| 00,000,000 | 00,000,000 | |||||||||||||||
| One-Percentage-Point | One-Percentage-Point | |||||||||||||||
| Increase | Decrease | Increase | Decrease | |||||||||||||
Effect on total of service and interest cost | 12.8 | % | (10.5 | %) | 13.8% | (11.2% | ) | |||||||||
Effect on postretirement benefit obligation | 10.7 | % | (9.0 | %) | 16.8% | (13.4% | ) | |||||||||
Our 20122013 discount rate assumption decreased to 4.70%4.20% from 5.30%4.70% for our U.S. postretirement plans and decreased to 4.29%4.08% from 5.02%4.29% for our non-U.S. postretirement plans. Our 20122013 discount rate decreased to 4.85%4.20% from 5.53%4.85% for our U.S. pension plans. We model these discount rates using a portfolio of high quality, fixed-income debt instruments with durations that match the expected future cash flows of the benefit obligations. Our 20122013 discount rate assumption for our non-U.S. pension plans decreased to 4.62%3.81% from 5.11%4.62%. We developed the discount rates for our non-U.S. plans from local bond indices that match local benefit obligations as closely as possible. Changes in our discount rates were primarily the result of changes in bond yields year-over-year.
Our 20122013 expected rate of return on plan assets increaseddecreased to 8.00%7.75% from 7.95%8.00% for our U.S. pension plans. We determine our expected rate of return on plan assets from the plan assets’ historical long-term investment performance, current asset allocation and estimates of future long-term returns by asset class. We attempt to maintain our target asset allocation by rebalancing between asset classes as we make contributions and monthly benefit payments. Our 2013 expected rate of return on plan assets decreased to 6.08% from 6.47% for our non-U.S. pension plans. We determine our expected rate of return on plan assets from the plan assets’ historical long-term investment performance, current asset allocation and estimates of future long-term returns by asset class.
44
While we do not anticipate further changes in the 20122013 assumptions for our U.S. and non-U.S. pension and postretirement health care plans, as a sensitivity measure, a fifty-basis point change in our discount raterates or a fifty-basis point change in the expected rate of return on plan assets would have the following effects, increase / (decrease) in cost, as of December 31, 2011:2012:
| 00,000,000 | 00,000,000 | 00,000,000 | 00,000,000 | |||||||||||||||||||||||||||||
| U.S. Plans | Non-U.S. Plans | U.S. Plans | Non-U.S. Plans | |||||||||||||||||||||||||||||
| Fifty-Basis-Point | Fifty-Basis-Point | Fifty-Basis-Point | Fifty-Basis-Point | |||||||||||||||||||||||||||||
| Increase | Decrease | Increase | Decrease | Increase | Decrease | Increase | Decrease | |||||||||||||||||||||||||
| (in millions) | (in millions) | |||||||||||||||||||||||||||||||
Effect of change in discount rate on | $ | (71 | ) | $ | 72 | $ | (40 | ) | $ | 58 | $ | (13 | ) | $ | 14 | $ | (43 | ) | $ | 68 | ||||||||||||
Effect of change in expected rate of return | (29 | ) | 29 | (37 | ) | 37 | (4 | ) | 4 | (32 | ) | 32 | ||||||||||||||||||||
Effect of change in discount rate on | (13 | ) | 13 | (1 | ) | 1 | (3 | ) | 3 | (1 | ) | 1 | ||||||||||||||||||||
Financial Instruments:
As we operate globally, weWe use certain financial instruments to manage our foreign currency exchange rate, commodity price and interest rate risks. We monitor and manage these exposures as part of our overall risk management program. Our risk management program which focuses on the unpredictability of financial markets and seeks to reduce the potentially adverse effects that the volatility of these markets may have on our operating results. We maintain foreign currency, commodity price and interest rateA principal objective of our risk management strategies that seekis to reduce significant, unanticipated earnings fluctuations that may arise from volatility in foreign currency exchange rates, commodity prices and interest rates, principally through the use of derivative instruments.
We use a combination of primarily foreign currency forward contracts, futures, options and swaps; commodity forward contracts, futures and options; and interest rate swaps to manage our exposure to cash flow variability, protect the value of our existing foreign currency assets and liabilities and protect the value of our debt. See Note 1,Summary of Significant Accounting Policies, and Note 9,Financial Instruments, to the consolidated financial statements for more information on the types of derivative instruments qualifyingwe use.
We record derivative financial instruments at fair value in our consolidated balance sheets within other current assets or other current liabilities due to their relatively short-term duration. Cash flows from derivative instruments are classified in the consolidated statements of cash flows based on the nature of the derivative instrument. Changes in the fair value of a derivative that is designated as a cash flow hedge, to the extent that the hedge is effective, are recorded in accumulated other comprehensive earnings / (losses) and reclassified to earnings when the hedged item affects earnings. Changes in fair value of economic hedges and the ineffective portion of all hedges are recognized in current period earnings. Changes in the fair value of a derivative that is designated as a fair value hedge, along with the changes in the fair value of the related hedged asset or liability, are recorded in earnings in the same period. We use foreign currency denominated debt to hedge a portion of our net investment in foreign operations against adverse movements in exchange rates, with changes in the value of the debt recorded within currency translation adjustment in accumulated other comprehensive earnings / (losses).
In order to qualify for hedge accounting, must maintain a specified level of hedging effectiveness between the hedgingderivative instrument and the item being hedged bothmust exist at inception and throughout the hedged period. We must also formally document the nature of and relationshipsrelationship between the hedging instrumentsderivative and the hedged items,item, as well as our risk management objectives, strategies for undertaking the various hedge transactionstransaction and method of assessing hedge effectiveness. Additionally, for hedgesa hedge of a forecasted transactions,transaction, the significant characteristics and expected termsterm of the forecasted transactionstransaction must be specifically identified, and it must be probable that eachthe forecasted transaction will occur. If we deem it is no longer probable that the hedged forecasted transaction will not occur, we would recognize the gain or loss related to the derivative in earnings currently.earnings.
By usingWhen we use derivatives, to hedge exposures to changes in exchange rates, commodity prices and interest rates, we have exposure on these derivativesare exposed to credit and market risk. We are exposedrisks. Credit risk exists when a counterparty to credit risk that the counterpartya derivative contract might fail to fulfill its performance obligations under the terms of the derivative contract. We minimize our credit risk by entering into transactions with counterparties with high quality, counterparties with investment grade credit ratings, limiting the amount of exposure we have with each counterparty and monitoring the financial condition of our counterparties. We also maintain a policy of requiring that all significant, non-exchange traded derivative contracts with a duration greater thanof one year beor longer are governed by an International Swaps and Derivatives Association master agreement. Market risk is the risk thatexists when the value of thea derivative or other financial instrument might be adversely affected by a changechanges in market conditions and foreign currency exchange rates, commodity prices, or interest rates. We manage market risk by incorporating monitoring parameters within our risk management strategy that limitlimiting the types of derivative instruments and derivative strategies we use and the degree of market risk that may be undertaken bywe plan to hedge through the use of derivative instruments.
We record derivative financial instruments at fair value in our consolidated balance sheets as either current assets or current liabilities. Changes in the fair value of a derivative that is highly effective and designated as a cash flow hedge, to the extent that the hedge is effective, are recorded each period in accumulated other comprehensive earnings / (losses). Gains and losses on derivative instruments reported in accumulated other comprehensive earnings / (losses) are reclassified to the consolidated statement of earnings in the periods in which operating results are affected by the hedged item. Changes in the fair value of a derivative that is highly effective and designated as a fair value hedge, along with the changes in the fair value of the hedged asset or liability that are attributable to the hedged risk, are recorded in current period earnings. Cash flows from hedging instruments are classified in the same manner as the affected hedged item in the consolidated statements of cash flows.
We also have numerous investments in our foreign subsidiaries. The net assets of these subsidiaries are exposed to volatility in foreign currency exchange rates. We use foreign-currency-denominated debt to hedge a portion of our net investment in foreign operations against adverse movements in exchange rates. We designated our euro and pound sterling denominated borrowings as a net investment hedge of a portion of our overall European operations. The gains and losses on our net investment in these designated European operations are economically offset by losses and gains on our euro and pound sterling denominated borrowings. The change in the debt’s fair value is recorded in the currency translation adjustment component of accumulated other comprehensive earnings / (losses).
45
Income Taxes:
We recognize tax benefits in our financial statements when our uncertain tax positions are assessed more likely than not to be sustained upon audit. The amount we recognize is measured as the largest amount of benefit that is greater than 50 percent likely of being realized upon ultimate settlement.
We recognize deferred tax assets for deductible temporary differences, operating loss carryforwards and tax credit carryforwards. Deferred tax assets are reduced by a valuation allowance if it is more likely than not that some portion, or all, of the deferred tax assets will not be realized.
Contingencies
See Note 12,Commitments and Contingencies, to the consolidated financial statements.
New Accounting Guidance
See Note 1,Summary of Significant Accounting Policies, to the consolidated financial statements for a discussion of new accounting standards.
Contingencies
See Note 13,Commitments and Contingencies, to the consolidated financial statements.
We purchase large quantities of commodities, including dairy,sugar and other sweeteners, coffee, cocoa, wheat, corn products, soybean and vegetable oils nuts, meat products, and sugar and other sweeteners.dairy. In addition, we use significant quantities of plastic, glass and cardboardpackaging materials to package our products and natural gas, fuels and electricity for our factories and warehouses. We continuouslyregularly monitor worldwide supply and cost trends of these commodities so we can act quickly to obtain ingredients and packaging needed for production.
Significant cost items in biscuit, chocolate, confectionerygum & candy and many powdered beverage products are cocoasugar and sugar.cocoa. We purchase cocoasugar and sugarcocoa on world markets, and the prices of these commodities are affected by the quality and availability of supply and changes in the value of the pound sterlingforeign currencies. Significant cost items in our biscuit products are grains (wheat, corn and the U.S. dollar relativesoybean oil). Grain costs have experienced volatility and have increased significantly in recent years due largely to certain other currencies. Cocoa bean, cocoa butterburgeoning global demand for food, livestock feed and sugar costs on average were higher in 2011 than in 2010. We purchase our dairy raw material requirements, including milk and cheese, from independent third partiesbiofuels such as agricultural cooperativesethanol and independent processors. The prices for milkbiodiesel and other dairy products are substantially influenced by market supply and demand,factors such as well as by government programs. Dairy commodity costs on average were higher in 2011 than in 2010.weather. The most significant cost item in coffee products is green coffee beans which are purchasedwe purchase on world markets.markets as well as from local grower cooperatives. Green coffee bean prices are affected by the quality and availability of supply, changes in the value of the U.S. dollar in relation to certain other currencies and consumer demand for coffee products. Green coffee bean costs on average were higher in 2011 than in 2010. Significant cost items in packaging include cardboards, resins and plastics and our biscuitenergy costs include natural gas, electricity and grocery productsdiesel fuel. We purchase these packaging and energy commodities on world markets and within the countries we operate, and the prices are grains (wheat, cornaffected by supply and soybean oil). Grain costs have experienced significant volatility and have increased from 2010 to 2011 due largely to burgeoning global demand for food, livestock feed and biofuels such as ethanol and biodiesel.changes in foreign currencies.
During 2011,2012, our aggregate commodity costs increased primarily as a result of higher costs of coffee, dairy,increased packaging, energy, grains and oils, packaging materials, other raw materials, meat and nuts. Our commodity costs increased approximately $2.6 billion in 2011 and approximately $1.0 billion in 2010 compared to the prior year.oil costs. We expect the price volatility and a slightly higher cost environment to continue over the remainder of 2013. We have addressed higher commodity costs primarily through higher pricing, lower manufacturing costs due to our end-to-end cost management program and overhead cost control. We expect to continue to use these measures to address further commodity cost volatilityincreases.
External factors such as weather conditions, commodity market conditions, currency fluctuations and the effects of governmental agricultural programs affect the prices for raw materials and agricultural materials used in our products. We use hedging techniques to limit the impact of price fluctuations in our principal raw materials. However, we do not fully hedge against changes in commodity prices, and these strategies may not protect us from increases in specific raw material costs. While the prices of our principal raw materials can be expected to fluctuate, we believe there will continue in 2012.to be an adequate supply of the raw materials we use and that they will generally remain available from numerous sources.
46
Liquidity and Capital Resources
We believe that our cash from operations, our existing $4.5 billion revolving credit facility (which supports our commercial paper program) and our authorized long-term financing will provide sufficient liquidity to meet our working capital needs, planned capital expenditures, future contractual obligations and payment of our anticipated quarterly dividends. We continue to maintain investment grade credit ratings on our debt. We continue to utilize our commercial paper program and primarily uncommitted international credit lines for regular funding requirements. We also use short-term intercompany loans fromwith foreign subsidiaries to improve financial flexibility. Overall, we do not expect any negative effects to our funding sources that would have a material effect on our liquidity.liquidity, including the permanent reinvestment of our foreign earnings.
Net Cash Provided by Operating Activities:
Operating activities provided net cash of $4.5 billion$3,923 million in 2012, $4,520 million in 2011 $3.7 billionand $3,748 million in 2010,2010. The decrease in operating cash flows in 2012 was primarily related to higher spending associated with Spin-Off Costs and $5.1 billionthe 2012-2014 Restructuring Program, partially offset by lower net working capital costs (primarily related to favorable inventory positions due to higher inventory costs in 2009.2011 and favorable accounts payable positions, partially offset by increased receivables). The increase in operating cash flows in 2011 is primarily related to increased earnings from continuing operations and the absence of tax payments in the prior year in connection with theKraft Foods Group’s Frozen Pizza divestiture, partially offset by higher working capital (mainly higher inventory costs, increased interest payments and increased integrationIntegration Program spending) and a $495 million voluntary contribution to our U.S. pension plans. The decrease in operating cash flows in 2010 was primarily related to the estimated tax payments on the Frozen Pizza divestiture, increased inventory levels and the unfavorable impact of acquisition-related financing fees, partially offset by increased earnings.
Net Cash Used in Investing Activities:
Net cash used in investing activities was $1.7 billion$1,687 million in 2012, $1,728 million in 2011 $7.5 billionand $7,462 million in 2010,2010. The decrease in net cash used in investing activities in 2012 related to proceeds received from our divested businesses and $1.2 billionlower capital expenditures in 2009.the current year, partially offset by cash transferred to Kraft Foods Group related to the Spin-Off. The decrease in cash used in investing activities in 2011 primarily related to cash payments in the prior year2010 related to the 2010 Cadbury acquisition, partially offset by the proceeds from theKraft Foods Group’s sale of the Frozen Pizza business and proceeds we received from the divestitures in Poland and Romania. The increase in cash used in investing activities in 2010 primarilyRomania related to the Cadburyour acquisition partially offset by higher proceeds from divestitures. During 2010, we paid $9.8 billion in net cash for the Cadbury acquisition, and we received $3.7 billion in proceeds from the sale of the Frozen Pizza business and $0.3 billion in proceeds from the divestitures in Poland and Romania. During 2009, we divested ourBalancebar operations in the U.S., a juice operation in Brazil and a plant in Spain and received $41 million in net proceeds.Cadbury.
Capital expenditures, which were funded by operating activities and include expenditures for Kraft Foods Group in all periods through October 1, 2012, were $1.8 billion$1,610 million in 2012, $1,771 million in 2011 $1.7 billionand $1,661 million in 2010, and $1.3 billion in 2009.2010. The 20112012 capital expenditures were made primarily used to modernize manufacturing facilities and support new product and productivity initiatives. We expect 20122013 capital expenditures to be approximately $2 billion, including capital expenditures required for investments in systems, investmentsthe 2012-2014 Restructuring Program and the Integration Program. We expect to continue to fund these expenditures from operations.
Net Cash Provided by / (Used in) Financing Activities:
Net cash used inprovided by financing activities was $3.2 billion$204 million in 2012, $3,175 million used in 2011 $4.2 billionand $4,188 million provided in 2010 and $3.1 billion used2010. The increase in 2009.net cash provided by financing activities in 2012 was primarily due to higher proceeds from the issuance of long-term debt (including notes issued by Kraft Foods Group in June 2012 for which we retained the proceeds), offset by higher long-term debt repayments. The net cash used in 2011 primarily related to $2.0 billion$2,043 million in dividends paid, $1.1 billion$1,114 million in long-term debt repayments and $565 million in repayments of short-term borrowings, partially offset by $492 million in primarily proceeds from primarily stock option exercises. The net cash provided by financing activities in 2010 primarily related to proceeds from our long-term debt issuance of $9.4 billion,$9,433 million, partially offset by $2.2 billion$2,175 million in dividends paid, $2.1 billion$2,134 million in long-term debt repayments, primarily related to our repurchase of $1.5 billion in notes through our tender offer, and $864 million in net repayments of short-term borrowings. The net cash used in financing activities in 2009 primarily related to $1.7 billion in dividend payments, $950 million in repayments of long-term debt and $344 million in net commercial paper repayments. Additionally, other cash used in financing activities in 2009 included $69 million in costs related to our bridge facility agreement dated November 9, 2009 (the “Cadbury Bridge Facility”).
Borrowing Arrangements:
On April 1, 2011, we entered into an agreement forWe maintain a $4.5 billion four-year senior unsecured revolving credit facility which expires in April 2015. The agreement replaced our former revolving credit agreement, which was terminated upon the signing of the new agreement. We intend to use the revolving credit facilitythat we have historically used for general corporate purposes, including for working capital purposes and to support our commercial paper issuances. Our $4.5 billion four-year senior unsecured revolving credit facility expires in April 2015. As of December 31, 2011,2012, no amounts have been drawn on the facility.
The revolving credit agreement includes a covenant that we maintain a minimum total shareholders’ equity, excluding accumulated other comprehensive earnings / (losses), of at least $28.6 billion. At December 31, 2011,2012, our total shareholders’ equity, excluding accumulated other comprehensive earnings / (losses), was $41.9$34.8 billion. We expect to continue to meet this covenant. The revolving credit agreement also contains customary representations, covenants and events of default. However, the revolving credit facility has no other financial covenants, credit rating triggers or provisions that could require us to post collateral as security.
In addition to the above, someSome of our international subsidiaries maintain primarily uncommitted credit lines to meet short-term working capital needs. Collectively, these credit lines amounted to $2.4 billion at December 31, 2012 and $2.3 billion at December 31, 2011, and $2.4 billion at December 31, 2010. Borrowings2011. In the aggregate, borrowings on these lines amounted to $274 million at December 31, 2012 and $182 million at December 31, 2011 and $267 million at December 31, 2010.2011.
47
As part of our Cadbury acquisition, on November 9, 2009, we entered into the Cadbury Bridge Facility. During the first quarter of 2010, we borrowed £807 million under the Cadbury Bridge Facility, and later repaid it ($1,205 million at the time of repayment) with proceeds from the divestiture of our Frozen Pizza business. Upon repayment, the Cadbury Bridge Facility was terminated.
Long-term Debt:
Our total debt was $19.4 billion at December 31, 2012 and $26.9 billion at December 31, 2011 and $28.7 billion at December 31, 2010.2011. Our debt-to-capitalization ratio was 0.38 at December 31, 2012 and 0.43 at December 31, 2011 and 0.44 at December 31, 2010.2011. At December 31, 2011,2012, the weighted-average term of our outstanding long-term debt was 9.38.8 years.
On October 2, 2012 our $150 million Canadian dollar variable rate loan matured. The loan and accrued interest to date were repaid with cash from operations.
On October 1, 2012, approximately $10 billion of debt on our balance sheet at September 30, 2012 was transferred to or retained by Kraft Foods Group. As described below, the debt primarily included: $6.0 billion of senior unsecured notes issued on June 4, 2012; $3.6 billion of debt exchanged on July 18, 2012; and $400 million migrated on October 1, 2012. See Note 2,Divestitures and Acquisitions, for more information regarding the Spin-Off and liabilities transferred.
On October 1, 2012, in connection with the Spin-Off and related debt capitalization plan, a $400 million 7.55% senior unsecured note was retained by Kraft Foods Group. No cash was generated from the transaction.
On July 18, 2012, we completed a debt exchange in which $3.6 billion of our debt held by third-party note holders was exchanged for notes issued by Kraft Foods Group in order to migrate debt to Kraft Foods Group in connection with our Spin-Off capitalization plan. No cash was generated from the exchange and we incurred one-time financing costs of $18 million which we recorded in interest expense. As a result of the exchange, we retired the following debt:
$596 million of our 6.125% Notes due in February 2018
$439 million of our 6.125% Notes due in August 2018
$900 million of our 5.375% Notes due in February 2020
$233 million of our 6.875% Notes due in January 2039
$290 million of our 6.875% Notes due in February 2038
$185 million of our 7.000% Notes due in August 2037
$170 million of our 6.500% Notes due in November 2031 and
$787 million of our 6.500% Notes due in 2040.
On June 4, 2012, Kraft Foods Group issued $6.0 billion of senior unsecured notes and distributed $5.9 billion of net proceeds to us in connection with the Spin-Off capitalization plan. We used the proceeds to pay $3.6 billion of outstanding commercial paper borrowings and expect to use the remaining cash proceeds to pay down additional debt over time or for general corporate purposes. This debt and approximately $260 million of related deferred financing costs were retained by Kraft Foods Group in the Spin-Off.
On June 1, 2012, $900 million of our 6.25% notes matured. The notes and accrued interest to date were repaid using primarily commercial paper borrowings which were subsequently repaid from $5.9 billion net proceeds received from the Kraft Foods Group $6.0 billion notes issuance on June 4, 2012.
On March 20, 2012,€2.0 billion of our 5.75% bonds matured. The bonds and accrued interest to date were repaid using proceeds from the issuance of commercial paper which was subsequently repaid in June 2012 as discussed above.
On January 10, 2012, we issued $800 million of floating rate notes maturing in 2013 which bear interest at a rate equal to the three-month London Inter-Bank Offered Rate (“LIBOR”) plus 0.875%. We intend to use thereceived net proceeds of $798.8 million for general corporate purposes, which may include repayment of debt.from the issuance. The notes havewere set to mature on July 10, 2013 or subject to a special mandatory redemption. Uponredemption tied to the public announcement of the record dateRecord Date for the proposed spin-off of our North American grocery business to our shareholders, we will be required to issue a notice of redemption of all ofSpin-Off. After announcing the Record Date, on September 24, 2012, the notes were redeemed at a redemption price equal to 100% of the aggregate principal amount of the notes, or $800 million, plus accrued and unpaid interest through the day prior to the redemption date.of $2 million from cash on hand.
On November 1, 2011, we repaid $1.1 billion of our long-term debt5.625% notes matured. The notes and accrued interest to date were repaid with cash from operations and short-term borrowings.operations.
On December 29, 2010, we repurchased $900 million principal amount of our 5.625% notes due 2011 and $600 million principal amount of our 6.25% notes due 2012, which were validly tendered pursuant to the cash tender offers we initiated in November 2010. We paid $1,596 million aggregate consideration, including accrued and unpaid interest, for the accepted notes in December 2010.
On December 20, 2010, we repaid £77 million (approximately $119 million) of our long-term debt and on August 11, 2010, we repaid $500 million of our long-term debt. We funded these repayments with cash from operations and short-term borrowings.
On February 8, 2010, we issued $9.5 billion of senior unsecured notes at a weighted-average effective rate of 5.364% and used the net proceeds ($9,379 million) to finance the Cadbury acquisition and for general corporate purposes. The notes include covenants that restrict our ability to incur debt secured by liens above a certain threshold. We also must offer to purchase these notes at a price equal to 101% of the aggregate principal amount, plus accrued and unpaid interest to the date of repurchase, if both of the following occur: (i) a “change of control” triggering event, and (ii) a downgrade of these notes below an investment grade rating by each of Moody’s Investor Service, Inc., Standard & Poor’s Ratings Services and Fitch, Inc. within a specified period.
On February 2, 2010, as part of the Cadbury acquisition, we acquired $2,437 million of long-term debt. The terms of the debt (including U.S. dollar par amounts as of February 2, 2010) were:
£77 million (approximately $123 million) total principal notes due December 20, 2010 at a fixed, annual interest rate of 4.875%.
C$150 million (approximately $140 million) Canadian bank loan agreement expiring August 30, 2012 at a variable interest rate. The interest rate at December 31, 2011 was 1.507%.
$1.0 billion total principal notes due October 1, 2013 at a fixed, annual interest rate of 5.125%.
£300 million (approximately $499 million) total principal notes due December 11, 2014 at a fixed, annual interest rate of 5.375%.
£350 million (approximately $626 million) total principal notes due July 18, 2018 at a fixed, annual interest rate of 7.250%.
We expect to continue to comply with our long-term debt covenants. Refer to Note 8,Debt and Borrowing Arrangements, for further details of these debt offerings.
In the next twelve months, $3.7 billion of long-term debt becomes due as follows:€2.0 billion (approximately $2.6 billion) in March 2012, $900 million in June 2012 and C$150 million (approximately $147 million) due in August 2012. We expect to fund these repayments with cash from operations, the issuance of commercial paper and the issuance of additional debt. We do not expect to repatriate earnings from our non-U.S. operations to meet these obligations.
From time to time, we refinance long-term and short-term debt. The nature and amount of our long-term and short-term debt and the proportionate amount of each varies as a result of future business requirements, market conditions and other factors. As of December 31, 2011,2012, we had $12$11.2 billion remaining in long-term financing authority from our Board of Directors.
In the next twelve months, $3.55 billion of long-term debt becomes due as follows: $750 million in February 2013, $1 billion in May 2013 and $1.8 billion in October 2013. We expect to fund these repayments with cash from operations and the issuance of commercial paper.
48
Off-Balance Sheet Arrangements and Aggregate Contractual Obligations
We have no off-balance sheet arrangements other than the guarantees and contractual obligations that are discussed below.
Guarantees:
As discussed in Note 13,12,Commitments and Contingencies, we haveenter into third-party guarantees primarily coveringto cover the long-term obligations of our vendors. As part of thosethese transactions, we guarantee that third parties will make contractual payments or achieve performance measures. At December 31, 2011, the carrying amount of our2012, we had no material third-party guarantees recorded on our consolidated balance sheet and the maximum potential payments under these guarantees was $22 million. Substantially all of these guarantees expire at various times through 2018.sheet.
In addition, at December 31, 2011,2012, we were contingently liable for $471$516 million of guarantees related to our own performance. These include letters of credit related to dairy commodity purchases and guarantees related to the payment of custom duties and taxes,taxes.
As of December 31, 2012, we and other lettersthree of credit.our indirect wholly owned subsidiaries are joint and several guarantors of $1.0 billion of indebtedness issued by an unrelated third party, Cadbury Schweppes US Finance LLC, and maturing on October 1, 2013. Following the Spin-Off, one of the guarantors of this indebtedness became an indirect wholly owned subsidiary of Kraft Foods Group. We have agreed to indemnify Kraft Foods Group pursuant to the Separation and Distribution Agreement, in the event its subsidiary is called upon to satisfy its obligation under the guarantee.
Guarantees do not have, and we do not expect them to have, a material effect on our liquidity.
Aggregate Contractual Obligations:
The following table summarizes our contractual obligations at December 31, 2011.2012.
| 00,000,000 | 00,000,000 | 00,000,000 | 00,000,000 | 00,000,000 | ||||||||||||||||||||||||||||||||||||
| Payments Due | Payments Due | |||||||||||||||||||||||||||||||||||||||
| Total | 2012 | 2013-14 | 2015-16 | 2017 and Thereafter | Total | 2013 | 2014-15 | 2016-17 | 2018 and Thereafter | |||||||||||||||||||||||||||||||
| (in millions) | (in millions) | |||||||||||||||||||||||||||||||||||||||
Long-term debt(1) | $ | 26,732 | $ | 3,642 | $ | 4,523 | $ | 3,273 | $ | 15,294 | ||||||||||||||||||||||||||||||
Debt(1) | $ | 19,158 | $ | 3,567 | $ | 2,111 | $ | 3,264 | $ | 10,216 | ||||||||||||||||||||||||||||||
Interest expense(2) | 16,351 | 1,526 | 2,480 | 2,100 | 10,245 | 11,191 | 1,064 | 1,793 | 1,502 | 6,832 | ||||||||||||||||||||||||||||||
Capital leases | 52 | 13 | 13 | 8 | 18 | 4 | 2 | 2 | – | – | ||||||||||||||||||||||||||||||
Operating leases | 1,318 | 353 | 494 | 284 | 187 | 1,144 | 330 | 406 | 277 | 131 | ||||||||||||||||||||||||||||||
Purchase obligations: | ||||||||||||||||||||||||||||||||||||||||
Inventory and production | 9,018 | 6,710 | 1,134 | 492 | 682 | 5,769 | 3,979 | 882 | 458 | 450 | ||||||||||||||||||||||||||||||
Other | 1,902 | 1,180 | 551 | 115 | 56 | 1,540 | 1,105 | 331 | 78 | 26 | ||||||||||||||||||||||||||||||
|
|
|
|
|
|
|
|
|
| |||||||||||||||||||||||||||||||
| 10,920 | 7,890 | 1,685 | 607 | 738 | 7,309 | 5,084 | 1,213 | 536 | 476 | |||||||||||||||||||||||||||||||
Other long-term liabilities | 2,251 | 228 | 463 | 452 | 1,108 | 246 | 28 | 69 | 43 | 106 | ||||||||||||||||||||||||||||||
|
|
|
|
|
|
|
|
|
| |||||||||||||||||||||||||||||||
Total | $ | 57,624 | $ | 13,652 | $ | 9,658 | $ | 6,724 | $ | 27,590 | $ | 39,052 | $ | 10,075 | $ | 5,594 | $ | 5,622 | $ | 17,761 | ||||||||||||||||||||
|
|
|
|
|
|
|
|
|
| |||||||||||||||||||||||||||||||
| (1) | Amounts |
| (2) | Amounts represent the expected cash payments of our interest expense on our long-term debt. Interest calculated on our euro notes was forecasted using the euro to U.S. dollar exchange rate as of December 31, |
| (3) |
| Operating leases represent the minimum rental commitments under non-cancelable operating leases. |
| Purchase obligations for inventory and production costs (such as raw materials, indirect materials and supplies, packaging, co-manufacturing arrangements, storage and distribution) are commitments for projected needs to be utilized in the normal course of business. Other purchase obligations include commitments for marketing, advertising, capital expenditures, information technology and professional services. Arrangements are considered purchase obligations if a contract specifies all significant terms, including fixed or minimum quantities to be purchased, a pricing structure and approximate timing of the transaction. Most arrangements are cancelable without a significant penalty and with short notice (usually 30 days). Any amounts reflected on the consolidated balance sheet as accounts payable and accrued liabilities are excluded from the table above. |
| Other long-term liabilities primarily consist of estimated future benefit payments for our postretirement health care plans through December 31, |
49
At our annual meetingEquity:
As a result of shareholders held on May 24, 2011,the Spin-Off, we divested $4.4 billion of Kraft Foods Group net assets, $4.3 billion of accumulated other comprehensive losses primarily related to the pension and other benefits plan net liabilities transferred to Kraft Foods Group and $89 million of unearned compensation recorded within additional paid in capital. In total, we recorded a distribution of $8.8 billion to our shareholders approvedin connection with the Spin-Off of Kraft Foods Inc. AmendedGroup on October 1, 2012. See Note 2,Divestitures and Restated 2006 Stock Compensation Plan for Non-Employee Directors. The amended plan includes, among other provisions, an increaseAcquisitions, to the numberconsolidated financial statements for additional information on the Spin-Off of shares we are authorized to issue to a maximum of 1.0 million shares of our Common Stock. As of the effective date of the amendment, there were 0.8 million shares available to be granted under the plan.Kraft Foods Group.
Stock Plans:
In January 2011, we granted 1.5 million shares of stock in connection with our long-term incentive plan,the Spin-Off and divestiture of Kraft Foods Group, under the market value per share was $31.62 on the date of grant. In February 2011, as partprovisions of our annual equity program, we issued 2.6 million shares ofexisting plans, employee stock option and restricted and deferred stock awards were adjusted to eligiblepreserve the fair value of the awards immediately before and after the Spin-Off. Long-term incentive plan awards held by Mondelēz International employees andremained Mondelēz International awards. The underlying performance conditions for the market value per restricted or deferred share was $31.83 on the date of grant. In aggregate, we issued 5.1 million restricted and deferred shares during 2011, including those issued as part of ourMondelēz International long-term incentive plan with a weighted-average market value per share of $31.97.
In February 2011, as part of our annual equity program, we granted 15.8 million stock options to eligible employees at an exercise price of $31.83. In aggregate, we granted 16.3 million stock options in 2011 with a weighted-average market value per share of $31.81.
At December 31, 2011, the number of shares to be issued upon exercise of outstanding stock options, vesting of non-U.S. deferred sharesawards were modified and vesting of long-term incentive plan shares was 57.6 million or 3.3% of total shares outstanding.
In January 2010, we granted 1.7 million shares of stock in connectionare consistent with our long-term incentive plan, and the market value per shareoriginal performance targets adjusted to reflect our standalone business. No incremental compensation expense was $27.33 on the date of grant. In February 2010, as part of our annual equity program, we issued 2.5 million shares of restricted and deferred stock to eligible employees, and the market value per restricted or deferred share was $29.15 on the date of grant. In aggregate, we issued 5.8 million restricted and deferred shares during 2010, including those issued as part of our long-term incentive plan, with a weighted-average market value per share of $28.82.
In February 2010,recorded as a partresult of the modifications of the stock plan awards. See Note 11,Stock Plans, to the consolidated financial statements for more information on our annual equity program, we granted 15.0 million stock optionsplans, awards activity during 2012, 2011 and 2010, and stock award modifications related to eligible employees at an exercise price of $29.15. In aggregate, we granted 18.1 million stock options in 2010 with a weighted-average market value per share of $29.24.
In January 2009, we granted 1.5 million shares of stock in connection with our long-term incentive plan. The market value per share was $27.00 on the date of grant. In February 2009, as part of our annual equity program, we issued 4.1 million shares of restricted and deferred stock to eligible employees. The market value per restricted or deferred share was $23.64 on the date of grant. In aggregate, we issued 5.8 million restricted and deferred shares during 2009, including those issued as part of our long-term incentive plan, with a weighted-average market value per share of $24.68.
In February 2009, as part of our annual equity program, we granted 16.3 million stock options to eligible employees at an exercise price of $23.64.Spin-Off.
Dividends:
We paid dividends of $2,058 million in 2012, $2,043 million in 2011 and $2,175 million in 2010,2010. The dividends paid relate to periods prior to the Spin-Off and $1,712 millionare based on an annualized dividend rate of $1.16 per common share for these periods. The 0.7% increase in 2009.2012 reflects an increase in shares outstanding. The decrease of 6.1% decrease in 2011 was due to areflects an additional dividend payment of $224 million in the prior year2010 related to the Cadbury acquisition. The increase of 27.0% in 2010 reflectsFollowing the Spin-Off, we expect to pay an increase in shares outstanding due to the Cadbury acquisition and the $224 million payment of a ten pence per share dividend that Cadbury declared and accrued on the Cadbury shares that were outstanding at the time of the acquisition. The present annualized dividend rate is $1.16 per common share.of $0.52. The declaration of dividends is subject to the discretion of our Board of Directors and depends on various factors, including our net earnings, financial condition, cash requirements, future prospects and other factors that our Board of Directors deems relevant to its analysis and decision making.
50
Our outlook for 2012 reflects confidence in continuing our strong business momentum in a challenging environment of weak consumer and category growth as well as significant input cost inflation.
We expect our 2013 Organic Net Revenue growth to deliver organic net revenuebe at the low end of our long-term growth target of approximately 5 percent, including a negative impact of up to one percentage point from product pruning in North America.7 percent. Additionally, we expect our 2013 Operating EPS is expected to grow at least 9 percentbe $1.52 to $1.57, reflecting average 2012 foreign currency rates and the devaluation of the Venezuelan bolivar announced on a constant currency basis.February 8, 2013.
We use certain non-GAAP financial measures to budget, make operating and strategic decisions and evaluate our performance. We have disclosed the followingdisclose non-GAAP financial measures so that you have the same financial data that we use with the intention of assistingto assist you in making comparisons to our historical operating results and analyzing our underlying performance.
Our non-GAAP financial measures reflect how we evaluate our operating results currently. As new events or circumstances arise, these definitions could change over time:
| • | “Organic Net Revenues” which is defined as net revenues excluding the impact of acquisitions, divestitures, Integration Program costs, accounting calendar changes (including a 53rd week in 2011) and foreign currency rate fluctuations. |
“Adjusted Operating Income” which is defined as operating income excluding the impact of Spin-Off Costs, the 2012-2014 Restructuring Program, Integration Program, acquisition-related costs, gains / losses on divestitures, pension costs related to obligations transferred in the Spin-Off and operating income from divested businesses. We also evaluate growth in our Adjusted Operating Income on a constant currency basis.
“Operating EPS” which is defined as Diluted EPS attributable to Mondelēz International from continuing operations excluding the impact of Spin-Off Costs, the 2012-2014 Restructuring Program, Integration Program, acquisition-related costs, gains / losses on divestitures, pension costs related to the obligations transferred in the Spin-Off, interest expense adjustment related to the Spin-Off transaction, operating income from divested businesses and the 2010 U.S. healthcare legislation change in prior periods. We also evaluate growth in our Operating EPS on a constant currency basis.
We believe that the presentation of these non-U.S. GAAPnon-GAAP financial measures, when considered together with our U.S. GAAP financial measures and the reconciliations to the corresponding U.S. GAAP financial measures, provides you with a more complete understanding of the factors and trends affecting our business than could be obtained absent these disclosures. Because non-GAAP financial measures may vary among other companies, the non-GAAP financial measures presented in the ConsolidatedourManagement’s Discussion and Analysis of Financial Condition and Results of Operations section may not be comparable to similarly titled measures used by other companies. Our use of these non-GAAP financial measures is not meant to be considered in isolation or as a substitute for any U.S. GAAP financial measure. A limitation of the Non-GAAPthese non-GAAP financial measures is they exclude items detailed below which have an impact on our U.S. GAAP reported results. The best way this limitation can be addressed is by evaluating our Non-GAAPnon-GAAP financial measures in combination with our U.S. GAAP reported results and carefully evaluating the following tables which reconciliereconcile U.S. GAAP reported figures to the non-GAAP financial measures.measures in this Form 10-K.
Organic Net Revenues
We useUsing the non-U.S. GAAP financial measure “organic net revenues” and corresponding growth ratios. The difference between “organic net revenues” anddefinition of “Organic Net Revenues” above, the only adjustments made to “net revenues” (the most comparable U.S. GAAP financial measure), is that organic net revenues were to exclude the impact of acquisitions, divestitures, (including for reporting purposes the Starbucks CPG business), currency andIntegration Program costs, accounting calendar changes (including the 53rd week in 2011). and foreign currency rate fluctuations. We believe that organic net revenuesOrganic Net Revenues better reflectreflects the underlying growth from the ongoing activities of our business and provideprovides improved comparability of results.
| 00,000,000 | 00,000,000 | 00,000,000 | 00,000,000 | |||||||||||||
| For the Years Ended | ||||||||||||||||
| December 31, | ||||||||||||||||
| 2011 | 2010 | $ Change | % Change | |||||||||||||
| (in millions) | ||||||||||||||||
Organic net revenues | $ | 51,533 | $ | 48,363 | $ | 3,170 | 6.6 | % | ||||||||
Impact of divestitures(1) | 91 | 652 | (561 | ) | (1.3 | )pp | ||||||||||
Impact of acquisitions(2) | 697 | – | 697 | 1.4 | pp | |||||||||||
Impact of Integration Program | (1 | ) | (1 | ) | – | – | ||||||||||
Impact of accounting calendar changes (3) | 880 | 193 | 687 | 1.4 | pp | |||||||||||
Impact of foreign currency | 1,165 | – | 1,165 | 2.4 | pp | |||||||||||
|
|
|
|
|
|
|
| |||||||||
Net revenues | $ | 54,365 | $ | 49,207 | $ | 5,158 | 10.5 | % | ||||||||
|
|
|
|
|
|
|
| |||||||||
| For the Years Ended | ||||||||||||||||
| December 31, | ||||||||||||||||
| 2012 | 2011 | $ Change | % Change | |||||||||||||
| (in millions) | ||||||||||||||||
Organic Net Revenues | $ | 36,347 | $ | 34,816 | $ | 1,531 | 4.4% | |||||||||
Impact of foreign currency | (1,576 | ) | – | (1,576 | ) | (4.4)pp | ||||||||||
Impact of accounting calendar changes (2) | – | 679 | (679 | ) | (2.0)pp | |||||||||||
Impact of divestitures | 244 | 316 | (72 | ) | (0.2)pp | |||||||||||
Impact of Integration Program | – | (1 | ) | 1 | – | |||||||||||
|
|
|
|
|
|
|
| |||||||||
Net revenues | $ | 35,015 | $ | 35,810 | $ | (795 | ) | (2.2)% | ||||||||
|
|
|
|
|
|
|
| |||||||||
| For the Years Ended | ||||||||||||||||
| December 31, | ||||||||||||||||
| 2011 | 2010 | $ Change | % Change | |||||||||||||
| (in millions) | ||||||||||||||||
Organic Net Revenues | $ | 33,385 | $ | 31,192 | $ | 2,193 | 7.0% | |||||||||
Impact of foreign currency | 1,074 | – | 1,074 | 3.4pp | ||||||||||||
Impact of acquisitions (1) | 697 | – | 697 | 2.3pp | ||||||||||||
Impact of accounting calendar changes (2) | 655 | 193 | 462 | 1.4pp | ||||||||||||
Impact of Integration Program | (1 | ) | (1 | ) | – | – | ||||||||||
Impact of divestitures | – | 105 | (105 | ) | (0.4)pp | |||||||||||
|
|
|
|
|
|
|
| |||||||||
Net revenues | $ | 35,810 | $ | 31,489 | $ | 4,321 | 13.7% | |||||||||
|
|
|
|
|
|
|
| |||||||||
51
| 00,000,000 | 00,000,000 | 00,000,000 | 00,000,000 | |||||||||||||
| For the Years Ended | ||||||||||||||||
| December 31, | ||||||||||||||||
| 2010 | 2009 | $ Change | % Change | |||||||||||||
| (in millions) | ||||||||||||||||
Organic net revenues | $ | 39,874 | $ | 38,645 | $ | 1,229 | 3.2 | % | ||||||||
Impact of divestitures | 21 | 109 | (88 | ) | (0.3 | )pp | ||||||||||
Impact of acquisitions(4) | 9,143 | – | 9,143 | 23.6 | pp | |||||||||||
Impact of Integration Program | (1 | ) | – | (1 | ) | – | ||||||||||
Impact of accounting calendar changes | 201 | – | 201 | 0.6 | pp | |||||||||||
Impact of foreign currency | (31 | ) | – | (31 | ) | (0.1 | )pp | |||||||||
|
|
|
|
|
|
|
| |||||||||
Net revenues | $ | 49,207 | $ | 38,754 | $ | 10,453 | 27.0 | % | ||||||||
|
|
|
|
|
|
|
| |||||||||
Note: In 2011, we revised our organic net revenues to exclude the effect of accounting calendar changes as the impact from new accounting calendar changes was significant in 2011. As such, we have conformed our 2010 organic net revenues to be consistent with the current year presentation.
| (1) |
| Impact of acquisitions reflects the incremental January 2011 operating results from our Cadbury acquisition. |
Includes |
UnderlyingAdjusted Operating Income
We useUsing the non-U.S. GAAP financial measure “underlying operatingdefinition of “Adjusted Operating Income” above, the only adjustments made to “operating income” and corresponding growth ratios. The difference between “underlying operating income” and “operating income”from continuing operations (the most comparable U.S. GAAP financial measure), is that underlying were to exclude Spin-Off Costs, Integration Program costs, 2012-2014 Restructuring Program costs, acquisition-related costs and gains / (losses) on divestitures, pension costs related to obligations transferred in the Spin-Off, interest expense adjustment related to the Spin-Off transaction and operating income exclude costs related to: the Integration Program and acquisition-related costs, including transaction advisory fees, U.K. stamp taxes and the impact of the Cadbury inventory revaluation; and costs associated with the proposed spin-off of the North American Grocery Business.from divested businesses. We also evaluate Adjusted Operating Income on a constant currency basis. We believe that underlying operating incomethese measures provide improved comparability of operating results.
| 00,000,000 | 00,000,000 | 00,000,000 | 00,000,000 | |||||||||||||
| For the Years Ended | ||||||||||||||||
| December 31, | ||||||||||||||||
| 2011 | 2010 | $ Change | % Change | |||||||||||||
| (in millions) | ||||||||||||||||
Underlying operating income | $ | 7,224 | $ | 6,585 | $ | 639 | 9.7 % | |||||||||
Integration Program costs | (521 | ) | (646 | ) | 125 | 3.8 | pp | |||||||||
Cadbury acquisition-related costs | – | (273 | ) | 273 | 4.7 | pp | ||||||||||
Costs associated with the proposed spin-off | (46 | ) | – | (46 | ) | (0.7 | )pp | |||||||||
|
|
|
|
|
|
|
| |||||||||
Operating income | $ | 6,657 | $ | 5,666 | $ | 991 | 17.5 % | |||||||||
|
|
|
|
|
|
|
| |||||||||
| For the Years Ended | ||||||||||||||||
| December 31, | ||||||||||||||||
| 2010 | 2009 | $ Change | % Change | |||||||||||||
| (in millions) | ||||||||||||||||
Underlying operating income | $ | 6,585 | $ | 5,223 | $ | 1,362 | 26.1 % | |||||||||
Integration Program costs | (646 | ) | – | (646 | ) | (12.5 | )pp | |||||||||
Cadbury acquisition-related costs | (273 | ) | (40 | ) | (233 | ) | (4.3 | )pp | ||||||||
|
|
|
|
|
|
|
| |||||||||
Operating income | $ | 5,666 | $ | 5,183 | $ | 483 | 9.3 % | |||||||||
|
|
|
|
|
|
|
| |||||||||
| For the Years Ended | ||||||||||||||||
| December 31, | ||||||||||||||||
| 2012 | 2011 | $ Change | % Change | |||||||||||||
| (in millions) | ||||||||||||||||
Adjusted Operating Income (constant currency) | $ | 4,388 | $ | 4,097 | $ | 291 | 7.1% | |||||||||
Impact of unfavorable foreign currency | (153 | ) | – | (153 | ) | (3.7)pp | ||||||||||
|
|
|
|
|
|
|
| |||||||||
Adjusted Operating Income | $ | 4,235 | $ | 4,097 | $ | 138 | 3.4% | |||||||||
Integration Program | (140 | ) | (521 | ) | 381 | 11.3pp | ||||||||||
Gains on divestitures, net | 107 | – | 107 | 2.6pp | ||||||||||||
Spin-Off pension expense adjustment (1) | (68 | ) | (91 | ) | 23 | 0.8pp | ||||||||||
Spin-Off Costs | (444 | ) | (46 | ) | (398 | ) | (10.9)pp | |||||||||
2012-2014 Restructuring Program | (110 | ) | – | (110 | ) | (3.0)pp | ||||||||||
Operating income from divested businesses | 58 | 59 | (1 | ) | (0.1)pp | |||||||||||
Acquisition-related costs | (1 | ) | – | (1 | ) | (0.1)pp | ||||||||||
|
|
|
|
|
|
|
| |||||||||
Operating Income | $ | 3,637 | $ | 3,498 | $ | 139 | 4.0% | |||||||||
|
|
|
|
|
|
|
| |||||||||
| For the Years Ended | ||||||||||||||||
| December 31, | ||||||||||||||||
| 2011 | 2010 | $ Change | % Change | |||||||||||||
| (in millions) | ||||||||||||||||
Adjusted Operating Income (constant currency) | $ | 3,997 | $ | 3,502 | $ | 495 | 14.1% | |||||||||
Impact of favorable foreign currency | 159 | – | 159 | 4.6pp | ||||||||||||
|
|
|
|
|
|
|
| |||||||||
Adjusted Operating Income | $ | 4,156 | $ | 3,502 | $ | 654 | 18.7% | |||||||||
Acquisition-related costs-Cadbury | – | (273 | ) | 273 | 13.4pp | |||||||||||
Integration Program | (521 | ) | (646 | ) | 125 | 8.6pp | ||||||||||
Spin-Off pension expense adjustment (1) | (91 | ) | (91 | ) | – | 1.5pp | ||||||||||
Spin-Off Costs | (46 | ) | – | (46 | ) | (1.9)pp | ||||||||||
Operating income from divested business | – | 4 | (4 | ) | (0.2)pp | |||||||||||
|
|
|
|
|
|
|
| |||||||||
Operating Income | $ | 3,498 | $ | 2,496 | $ | 1,002 | 40.1% | |||||||||
|
|
|
|
|
|
|
| |||||||||
52
| (1) | Represents the estimated annual benefit plan expense associated with certain benefit plan obligations transferred to Kraft Foods Group in the Spin-Off. The estimate of $91 million was based on market conditions and benefit plan obligations as of January 1, 2012. For the year ended December 31, 2012, a prorated estimate of $68 million was reflected for the nine months prior to the Spin-Off and transfer of the benefit plan obligations to Kraft Foods Group. |
Operating EPS
We useUsing the non-U.S. GAAP financial measuredefinition of “Operating EPS” and corresponding growth ratios. The difference between “Operating EPS” and “dilutedabove, the only adjustments made to “Diluted EPS attributable to Kraft FoodsMondelēz International from continuing operations” (the most comparable U.S. GAAP financial measure), is that Operating EPS were to exclude Spin-Off Costs, Integration Program costs, 2012-2014 Restructuring Program costs, acquisition and related financing costs, gains / (losses) on divestitures, pension costs related to:to obligations transferred in the Integration Program; acquisition-related costs, includingSpin-Off, interest expense adjustment related to the Spin-Off transaction, advisory fees, U.K. stamp taxesoperating results from divested businesses and the impact of the Cadbury inventory revaluation; acquisition-related financing fees, including hedging and foreign currency impacts associated with the Cadbury acquisition and other fees associated with the Cadbury Bridge Facility; the impact of a deferred tax charge resulting from the recently enacted2010 U.S. health care legislation and costs associated with the proposed spin-off of the North American Grocery Business.change in prior periods. We also evaluate Operating EPS on a constant currency basis. We believe Operating EPSthese measures provide improved comparability of operating results.
| 00,000,000 | 00,000,000 | 00,000,000 | ||||||||||
| For the Years Ended December 31, | ||||||||||||
| 2011 | 2010 | 2009 | ||||||||||
Operating EPS | $ | 2.29 | $ | 2.02 | $ | 1.93 | ||||||
Integration Program costs(1) | (0.28 | ) | (0.29 | ) | – | |||||||
Acquisition related costs(2) and financing fees(3) | – | (0.21 | ) | (0.04 | ) | |||||||
U.S. healthcare legislation impact on deferred taxes | – | (0.08 | ) | – | ||||||||
Costs associated with the proposed spin-off | (0.02 | ) | – | – | ||||||||
|
|
|
|
|
| |||||||
Diluted EPS attributable to Kraft Foods | 1.99 | 1.44 | 1.89 | |||||||||
Discontinued operations | – | 0.95 | 0.14 | |||||||||
|
|
|
|
|
| |||||||
Diluted EPS attributable to Kraft Foods | $ | 1.99 | $ | 2.39 | $ | 2.03 | ||||||
|
|
|
|
|
| |||||||
| For the Years Ended | ||||||||||||||||
| December 31, | ||||||||||||||||
| 2012 | 2011 | $ Change | % Change | |||||||||||||
| (in millions) | ||||||||||||||||
Operating EPS (constant currency) | $ | 1.45 | $ | 1.38 | $ | 0.07 | 5.1% | |||||||||
Impact of unfavorable foreign currency | (0.06) | – | (0.06) | |||||||||||||
|
|
|
|
|
| |||||||||||
Operating EPS | $ | 1.39 | $ | 1.38 | $ | 0.01 | 0.7% | |||||||||
Spin-Off Costs | (0.39) | (0.02) | (0.37) | |||||||||||||
Integration Program | (0.08) | (0.28) | 0.20 | |||||||||||||
2012-2014 Restructuring Program | (0.04) | – | (0.04) | |||||||||||||
Spin-Off interest expense adjustment(1) | (0.06) | (0.11) | 0.05 | |||||||||||||
Spin-Off pension expense adjustment(2) | (0.02) | (0.03) | 0.01 | |||||||||||||
Gains on divestitures, net | 0.03 | – | 0.03 | |||||||||||||
Net earnings from divested businesses | 0.03 | 0.03 | – | |||||||||||||
|
|
|
|
|
| |||||||||||
Diluted EPS attributable to Mondelēz International from continuing operations | $ | 0.86 | $ | 0.97 | $ | (0.11) | (11.3)% | |||||||||
Discontinued operations | 0.83 | 1.02 | (0.19) | |||||||||||||
|
|
|
|
|
| |||||||||||
Diluted EPS attributable to Mondelēz International | $ | 1.69 | $ | 1.99 | $ | (0.30) | (15.1)% | |||||||||
|
|
|
|
|
| |||||||||||
| For the Years Ended | ||||||||||||||||
| December 31, | ||||||||||||||||
| 2011 | 2010 | $ Change | % Change | |||||||||||||
| (in millions) | ||||||||||||||||
Operating EPS (constant currency) | $ | 1.34 | $ | 1.06 | $ | 0.28 | 26.4% | |||||||||
Impact of unfavorable foreign currency | 0.07 | – | 0.07 | |||||||||||||
|
|
|
|
|
| |||||||||||
Operating EPS | $ | 1.41 | $ | 1.06 | $ | 0.35 | 33.0% | |||||||||
Spin-Off Costs | (0.02) | – | (0.02) | |||||||||||||
Integration Program | (0.28) | (0.29) | 0.01 | |||||||||||||
Spin-Off interest expense adjustment(1) | (0.11) | (0.11) | – | |||||||||||||
Spin-Off pension expense adjustment(2) | (0.03) | (0.03) | – | |||||||||||||
Acquisition and related financing costs | – | (0.22) | 0.22 | |||||||||||||
U.S. healthcare legislation impact on deferred taxes | – | (0.03) | 0.03 | |||||||||||||
|
|
|
|
|
| |||||||||||
Diluted EPS attributable to Mondelēz International from continuing operations | $ | 0.97 | $ | 0.38 | $ | 0.59 | 155.3% | |||||||||
Discontinued operations | 1.02 | 2.01 | (0.99) | |||||||||||||
|
|
|
|
|
| |||||||||||
Diluted EPS attributable to Mondelēz International | $ | 1.99 | $ | 2.39 | $ | (0.40) | (16.7)% | |||||||||
|
|
|
|
|
| |||||||||||
| (1) |
| (2) |
Adjusted Free Cash Flow
In addition, we use the non-U.S. GAAP financial measure “adjusted free cash flow.” The difference between “adjusted free cash flow” and “net cash provided by operating activities” (the most comparable U.S. GAAP financial measure), is that adjusted free cash flow includes the impact of capital expenditures, exclude voluntary pension contributions and in 2010, exclude the impact of taxes paid on the divestiture of our Frozen Pizza business. We use adjusted free cash flow as the primary cash flow metric as it represents controllable cash flows from operations.
| 00,000,000 | 00,000,000 | 00,000,000 | ||||||||||
| For the Years Ended December 31, | ||||||||||||
| 2011 | 2010 | 2009 | ||||||||||
| (in millions) | ||||||||||||
Adjusted free cash flow | $ | 3,244 | $ | 3,263 | $ | 4,154 | ||||||
Capital expenditures | 1,771 | 1,661 | 1,330 | |||||||||
Voluntary pension contributions | (495 | ) | – | (400 | ) | |||||||
Taxes paid on frozen pizza divestiture | – | (1,176 | ) | – | ||||||||
|
|
|
|
|
| |||||||
Net cash provided by operating activities | $ | 4,520 | $ | 3,748 | $ | 5,084 | ||||||
|
|
|
|
|
| |||||||
Note: In 2011, we revised our free cash flow measure to exclude the effect of voluntary pension contributions and the taxes paid on the Frozen Pizza divestiture and now refer to this measure as adjusted free cash flow. As such, we have conformed our 2010 and 2009 information to be consistent with the current year presentation.
53
Item 7A. Quantitative and Qualitative Disclosures about Market Risk.
As we operate globally, we use certain financial instruments to manage our foreign currency exchange rate, commodity price and interest rate risks. We monitor and manage these exposures as part of our overall risk management program. Our risk management program focuses on the unpredictability of financial markets and seeks to reduce the potentially adverse effects that the volatility of these markets may have on our operating results. We maintain foreign currency, commodity price and interest rate risk management policies that principally use derivative instruments to reduce significant, unanticipated earnings fluctuations that may arise from volatility in foreign currency exchange rates, commodity prices and interest rates. We also sell commodity futures to unprice future purchase commitments, and we occasionally use related futures to cross-hedge a commodity exposure. We are not a party to leveraged derivatives and, by policy, do not use financial instruments for speculative purposes. Refer to Note 1, Summary of Significant Accounting Policies,and Note 12,9,Financial Instruments, to the consolidated financial statements for further details of our foreign currency, commodity price and interest rate risk management policies and the types of derivative instruments we use to hedge those exposures.
Value at Risk:
We use a value at risk (“VAR”) computation to estimate: 1) the potential one-day loss in the fair value of our interest rate-sensitive financial instruments; and 2) the potential one-day loss in pre-tax earnings of our foreign currency and commodity price-sensitive derivative financial instruments. We included our debt; foreign currency forwards and futures, swaps and options; and commodity futures, forwards and options in our VAR computation. Excluded from the computation were anticipated transactions, foreign currency trade payables and receivables, and net investments in foreign subsidiaries, which the abovementioned instruments are intended to hedge.
We made the VAR estimates assuming normal market conditions, using a 95% confidence interval. We used a “variance / co-variance” model to determine the observed interrelationships between movements in interest rates and various currencies. These interrelationships were determined by observing interest rate and forward currency rate movements over the prior quarter for the calculation of VAR amounts at December 31, 20112012 and 2010,2011, and over each of the four prior quarters for the calculation of average VAR amounts during each year. The values of foreign currency and commodity options do not change on a one-to-one basis with the underlying currency or commodity, and were valued accordingly in the VAR computation.
As of December 31, 2011,2012, the estimated potential one-day loss in fair value of our interest rate-sensitive instruments, primarily debt, and the estimated potential one-day loss in pre-tax earnings from our foreign currency and commodity instruments, as calculated in the VAR model, were (in millions):
| Average | Average | Average | Average | Average | Average | Average | Average | |||||||||||||||||||||||||||||||||||||||||||||||||||||||||
| Pre-Tax Earnings Impact | Fair Value Impact | Pre-Tax Earnings Impact | Fair Value Impact | |||||||||||||||||||||||||||||||||||||||||||||||||||||||||||||
| At 12/31/11 | Average | High | Low | At 12/31/11 | Average | High | Low | At 12/31/12 | Average | High | Low | At 12/31/12 | Average | High | Low | |||||||||||||||||||||||||||||||||||||||||||||||||
Instruments sensitive to: | ||||||||||||||||||||||||||||||||||||||||||||||||||||||||||||||||
Interest rates | $ | 157 | $ | 164 | $ | 234 | $ | 133 | $ | 80 | $ | 133 | $ | 172 | $ | 80 | ||||||||||||||||||||||||||||||||||||||||||||||||
Foreign currency rates | $ | 17 | $ | 22 | $ | 30 | $ | 17 | $ | 10 | $ | 17 | $ | 24 | $ | 10 | ||||||||||||||||||||||||||||||||||||||||||||||||
Commodity prices | 33 | 33 | 42 | 28 | 19 | 44 | 60 | 19 | ||||||||||||||||||||||||||||||||||||||||||||||||||||||||
| Pre-Tax Earnings Impact | Fair Value Impact | Pre-Tax Earnings Impact | Fair Value Impact | |||||||||||||||||||||||||||||||||||||||||||||||||||||||||||||
| At 12/31/10 | Average | High | Low | At 12/31/10 | Average | High | Low | At 12/31/11 | Average | High | Low | At 12/31/11 | Average | High | Low | |||||||||||||||||||||||||||||||||||||||||||||||||
Instruments sensitive to: | ||||||||||||||||||||||||||||||||||||||||||||||||||||||||||||||||
Interest rates | $ | 237 | $ | 176 | $ | 237 | $ | 97 | $ | 157 | $ | 164 | $ | 234 | $ | 133 | ||||||||||||||||||||||||||||||||||||||||||||||||
Foreign currency rates | $ | 13 | $ | 8 | $ | 13 | $ | 4 | $ | 17 | $ | 22 | $ | 30 | $ | 17 | ||||||||||||||||||||||||||||||||||||||||||||||||
Commodity prices | 34 | 22 | 34 | 9 | 33 | 33 | 42 | 28 | ||||||||||||||||||||||||||||||||||||||||||||||||||||||||
With the Spin-Off, a significant portion of our primarily U.S. derivative instruments were divested in the fourth quarter of 2012. The impacts presented in the table above have not been recast to reflect the divestiture for periods prior to the Spin-Off as it is impracticable to do so. This VAR computation is a risk analysis tool designed to statistically estimate the maximum probable daily loss from adverse movements in interest rates, foreign currency rates and commodity prices under normal market conditions. The computation does not represent actual losses in fair value or earnings to be incurred by Kraft Foods,we will incur, nor does it consider the effect of favorable changes in market rates. We cannot predict actual future movements in such market rates and do not present these VAR results to be indicative of future movements in such market rates or to be representative of any actual impact that future changes in market rates may have on our future financial results.
54
Item 8. Financial Statements and Supplementary Data.
Report of Management on Internal Control Over Financial Reporting
Management is responsible for establishing and maintaining adequate internal control over financial reporting as defined in Rules 13a-15(f) and 15d-15(f) under the Securities Exchange Act of 1934, as amended. Our internal control over financial reporting is a process designed to provide reasonable assurance regarding the reliability of financial reporting and the preparation of financial statements for external purposes in accordance with accounting principles generally accepted in the United States of America. Our internal control over financial reporting includes those written policies and procedures that:
pertain to the maintenance of records that, in reasonable detail, accurately and fairly reflect the transactions and dispositions of assets;
provide reasonable assurance that transactions are recorded as necessary to permit preparation of financial statements in accordance with accounting principles generally accepted in the United States of America;
provide reasonable assurance that receipts and expenditures are being made only in accordance with management and director authorization; and
provide reasonable assurance regarding prevention or timely detection of unauthorized acquisition, use or disposition of assets that could have a material effect on the consolidated financial statements.
Internal control over financial reporting includes the controls themselves, monitoring and internal auditing practices and actions taken to correct deficiencies as identified.
Because of its inherent limitations, internal control over financial reporting may not prevent or detect misstatements. Also, projections of any evaluation of effectiveness to future periods are subject to the risk that controls may become inadequate because of changes in conditions, or that the degree of compliance with the policies or procedures may deteriorate.
Management assessed the effectiveness of our internal control over financial reporting as of December 31, 2011.2012. Management based this assessment on criteria for effective internal control over financial reporting described inInternal Control-IntegratedControl – Integrated Framework issued by the Committee of Sponsoring Organizations of the Treadway Commission (“COSO”). Management’s assessment included an evaluation of the design of our internal control over financial reporting and testing of the operational effectiveness of our internal control over financial reporting.
Management reviewed the results of our assessment with the Audit Committee of our Board of Directors. Based on this assessment, management determined that, as of December 31, 2011,2012, we maintained effective internal control over financial reporting.
PricewaterhouseCoopers LLP, independent registered public accounting firm, who audited and reported on the consolidated financial statements included in this report, has audited our internal control over financial reporting as of December 31, 2011.2012.
February 27, 201225, 2013
55
Report of Independent Registered Public Accounting Firm
To the Board of Directors and Shareholders of Kraft FoodsMondelēz International, Inc.:
In our opinion, the accompanying consolidated balance sheets and the related consolidated statements of earnings, comprehensive earnings, equity and cash flows present fairly, in all material respects, the financial position of Kraft FoodsMondelēz International, Inc. and its subsidiaries at December 31, 20112012 and 2010,2011, and the results of their operations and their cash flows for each of the three years in the period ended December 31, 20112012 in conformity with accounting principles generally accepted in the United States of America. Also in our opinion, the Company maintained, in all material respects, effective internal control over financial reporting as of December 31, 2011,2012, based on criteria established inInternal Control-IntegratedControl – Integrated Framework issued by the Committee of Sponsoring Organizations of the Treadway Commission (COSO). The Company’s management is responsible for these financial statements, for maintaining effective internal control over financial reporting and for its assessment of the effectiveness of internal control over financial reporting, included in the accompanying Report of Management on Internal Control over Financial Reporting. Our responsibility is to express opinions on these financial statements and on the Company’s internal control over financial reporting based on our integrated audits. We conducted our audits in accordance with the standards of the Public Company Accounting Oversight Board (United States). Those standards require that we plan and perform the audits to obtain reasonable assurance about whether the financial statements are free of material misstatement and whether effective internal control over financial reporting was maintained in all material respects. Our audits of the financial statements included examining, on a test basis, evidence supporting the amounts and disclosures in the financial statements, assessing the accounting principles used and significant estimates made by management, and evaluating the overall financial statement presentation. Our audit of internal control over financial reporting included obtaining an understanding of internal control over financial reporting, assessing the risk that a material weakness exists, and testing and evaluating the design and operating effectiveness of internal control based on the assessed risk. Our audits also included performing such other procedures as we considered necessary in the circumstances. We believe that our audits provide a reasonable basis for our opinions.
As discussed in Note 1 to the consolidated financial statements, in 2011, the Company changed the reporting date to remove the two-week reporting lag for certain of the Company’s locations outside of the United States.
A company’s internal control over financial reporting is a process designed to provide reasonable assurance regarding the reliability of financial reporting and the preparation of financial statements for external purposes in accordance with generally accepted accounting principles. A company’s internal control over financial reporting includes those policies and procedures that (i) pertain to the maintenance of records that, in reasonable detail, accurately and fairly reflect the transactions and dispositions of the assets of the company; (ii) provide reasonable assurance that transactions are recorded as necessary to permit preparation of financial statements in accordance with generally accepted accounting principles, and that receipts and expenditures of the company are being made only in accordance with authorizations of management and directors of the company; and (iii) provide reasonable assurance regarding prevention or timely detection of unauthorized acquisition, use, or disposition of the company’s assets that could have a material effect on the financial statements.
Because of its inherent limitations, internal control over financial reporting may not prevent or detect misstatements. Also, projections of any evaluation of effectiveness to future periods are subject to the risk that controls may become inadequate because of changes in conditions, or that the degree of compliance with the policies or procedures may deteriorate.
/s/ PRICEWATERHOUSECOOPERS LLP
Chicago, Illinois
February 27, 201225, 2013
56
Kraft FoodsMondelēz International, Inc. and Subsidiaries
Consolidated Statements of Earnings
For the Years Ended December 31
(in millions of U.S. dollars, except per share data)
| 00,000,000 | 00,000,000 | 00,000,000 | ||||||||||||||||||||||
| 2011 | 2010 | 2009 | 2012 | 2011 | 2010 | |||||||||||||||||||
Net revenues | $ | 54,365 | $ | 49,207 | $ | 38,754 | $ | 35,015 | $ | 35,810 | $ | 31,489 | ||||||||||||
Cost of sales | 35,350 | 31,305 | 24,819 | 21,939 | 22,710 | 19,617 | ||||||||||||||||||
|
|
|
|
|
| |||||||||||||||||||
Gross profit | 19,015 | 17,902 | 13,935 | 13,076 | 13,100 | 11,872 | ||||||||||||||||||
Selling, general and administrative expenses | 12,140 | 12,001 | 8,784 | 9,176 | 9,382 | 9,140 | ||||||||||||||||||
Asset impairment and exit costs | (7 | ) | 18 | (64 | ) | 153 | (5 | ) | 26 | |||||||||||||||
Losses on divestitures, net | – | 6 | 6 | |||||||||||||||||||||
Gains on divestitures, net | (107 | ) | – | – | ||||||||||||||||||||
Amortization of intangibles | 225 | 211 | 26 | 217 | 225 | 210 | ||||||||||||||||||
|
|
|
|
|
| |||||||||||||||||||
Operating income | 6,657 | 5,666 | 5,183 | 3,637 | 3,498 | 2,496 | ||||||||||||||||||
Interest and other expense, net | 1,885 | 2,024 | 1,237 | 1,863 | 1,618 | 1,770 | ||||||||||||||||||
|
|
|
|
|
| |||||||||||||||||||
Earnings from continuing operations before income taxes | 4,772 | 3,642 | 3,946 | 1,774 | 1,880 | 726 | ||||||||||||||||||
Provision for income taxes | 1,225 | 1,147 | 1,136 | 207 | 143 | 54 | ||||||||||||||||||
|
|
|
|
|
| |||||||||||||||||||
Earnings from continuing operations | 3,547 | 2,495 | 2,810 | 1,567 | 1,737 | 672 | ||||||||||||||||||
Earnings and gain from discontinued operations, net of | – | 1,644 | 218 | |||||||||||||||||||||
Earnings from discontinued operations, net of income taxes | 1,488 | 1,810 | 3,467 | |||||||||||||||||||||
|
|
|
|
|
| |||||||||||||||||||
Net earnings | 3,547 | 4,139 | 3,028 | 3,055 | 3,547 | 4,139 | ||||||||||||||||||
Noncontrolling interest | 20 | 25 | 7 | 27 | 20 | 25 | ||||||||||||||||||
|
|
|
|
|
| |||||||||||||||||||
Net earnings attributable to Kraft Foods | $ | 3,527 | $ | 4,114 | $ | 3,021 | ||||||||||||||||||
Net earnings attributable to Mondelēz International | $ | 3,028 | $ | 3,527 | $ | 4,114 | ||||||||||||||||||
|
|
|
|
|
| |||||||||||||||||||
Per share data: | ||||||||||||||||||||||||
Basic earnings per share attributable to Kraft Foods: | ||||||||||||||||||||||||
Basic earnings per share attributable to Mondelēz International: | ||||||||||||||||||||||||
Continuing operations | $ | 2.00 | $ | 1.44 | $ | 1.90 | $ | 0.87 | $ | 0.97 | $ | 0.38 | ||||||||||||
Discontinued operations | – | 0.96 | 0.14 | 0.83 | 1.03 | 2.02 | ||||||||||||||||||
|
|
|
|
|
| |||||||||||||||||||
Net earnings attributable to Kraft Foods | $ | 2.00 | $ | 2.40 | $ | 2.04 | ||||||||||||||||||
Net earnings attributable to Mondelēz International | $ | 1.70 | $ | 2.00 | $ | 2.40 | ||||||||||||||||||
|
|
|
|
|
| |||||||||||||||||||
Diluted earnings per share attributable to Kraft Foods: | ||||||||||||||||||||||||
Diluted earnings per share attributable to Mondelēz International: | ||||||||||||||||||||||||
Continuing operations | $ | 1.99 | $ | 1.44 | $ | 1.89 | $ | 0.86 | $ | 0.97 | $ | 0.38 | ||||||||||||
Discontinued operations | – | 0.95 | 0.14 | 0.83 | 1.02 | 2.01 | ||||||||||||||||||
|
|
|
|
|
| |||||||||||||||||||
Net earnings attributable to Kraft Foods | $ | 1.99 | $ | 2.39 | $ | 2.03 | ||||||||||||||||||
Net earnings attributable to Mondelēz International | $ | 1.69 | $ | 1.99 | $ | 2.39 | ||||||||||||||||||
|
|
|
|
|
| |||||||||||||||||||
Dividends declared | $ | 1.16 | $ | 1.16 | $ | 1.16 | $ | 1.00 | $ | 1.16 | $ | 1.16 | ||||||||||||
See notes to consolidated financial statements.
57
Kraft FoodsMondelēz International, Inc. and Subsidiaries
Consolidated Statements of Comprehensive Earnings
For the Years Ended December 31
(in millions of U.S. dollars)
| 00,000,000 | 00,000,000 | 00,000,000 | ||||||||||||||||||||||
| 2011 | 2010 | 2009 | 2012 | 2011 | 2010 | |||||||||||||||||||
Net earnings | $ | 3,547 | $ | 4,139 | $ | 3,028 | $ | 3,055 | $ | 3,547 | $ | 4,139 | ||||||||||||
Other comprehensive earnings / (losses): | ||||||||||||||||||||||||
Currency translation adjustment: | ||||||||||||||||||||||||
Translation adjustment | (1,245 | ) | 264 | 1,777 | 791 | (1,245 | ) | 264 | ||||||||||||||||
Tax (expense) / benefit | (45 | ) | (101 | ) | 34 | 39 | (45 | ) | (101 | ) | ||||||||||||||
Pension and other benefits: | ||||||||||||||||||||||||
Net actuarial gain / (loss) arising during period | (2,333 | ) | (361 | ) | 29 | (2,266 | ) | (2,333 | ) | (361 | ) | |||||||||||||
Reclassification adjustment for losses / (gains) | ||||||||||||||||||||||||
Amortization of experience losses and | 361 | 281 | 209 | 414 | 361 | 281 | ||||||||||||||||||
Settlement losses | 113 | 129 | 120 | 135 | 113 | 129 | ||||||||||||||||||
Tax benefit / (expense) | 768 | (144 | ) | (220 | ) | |||||||||||||||||||
Tax (expense) / benefit | 486 | 768 | (144 | ) | ||||||||||||||||||||
Derivatives accounted for as hedges: | ||||||||||||||||||||||||
Net derivative (losses) / gains | (709 | ) | (10 | ) | 35 | (412 | ) | (709 | ) | (10 | ) | |||||||||||||
Reclassification adjustment for (gains) / losses | 93 | (30 | ) | 178 | 602 | 93 | (30 | ) | ||||||||||||||||
Tax benefit / (expense) | 240 | 18 | (89 | ) | ||||||||||||||||||||
Tax (expense) / benefit | (87 | ) | 240 | 18 | ||||||||||||||||||||
|
|
|
|
|
| |||||||||||||||||||
Total other comprehensive (losses) / earnings | (2,757 | ) | 46 | 2,073 | ||||||||||||||||||||
Total other comprehensive earnings / (losses) | (298 | ) | (2,757 | ) | 46 | |||||||||||||||||||
Comprehensive earnings | 790 | 4,185 | 5,101 | 2,757 | 790 | 4,185 | ||||||||||||||||||
less: Comprehensive earnings attributable to | 10 | 6 | 41 | 33 | 10 | 6 | ||||||||||||||||||
|
|
|
|
|
| |||||||||||||||||||
Comprehensive earnings attributable to Kraft Foods | $ | 780 | $ | 4,179 | $ | 5,060 | ||||||||||||||||||
Comprehensive earnings attributable to Mondelēz International | $ | 2,724 | $ | 780 | $ | 4,179 | ||||||||||||||||||
|
|
|
|
|
| |||||||||||||||||||
See notes to consolidated financial statements.
58
Kraft FoodsMondelēz International, Inc. and Subsidiaries
Consolidated Balance Sheets, as of December 31
(in millions of U.S. dollars, except share data)
| 00,000,000 | 00,000,000 | |||||||||||||||
| 2011 | 2010 | 2012 | 2011 | |||||||||||||
ASSETS | ||||||||||||||||
Cash and cash equivalents | $ | 1,974 | $ | 2,481 | $ | 4,475 | $ | 1,974 | ||||||||
Receivables (net of allowances of $143 in 2011 and $246 in 2010) | 6,361 | 6,539 | ||||||||||||||
Receivables (net of allowances of $118 in 2012 and $143 in 2011) | 6,129 | 6,361 | ||||||||||||||
Inventories, net | 5,706 | 5,310 | 3,741 | 5,706 | ||||||||||||
Deferred income taxes | 912 | 898 | 542 | 912 | ||||||||||||
Other current assets | 1,249 | 993 | 735 | 1,249 | ||||||||||||
|
|
|
| |||||||||||||
Total current assets | 16,202 | 16,221 | 15,622 | 16,202 | ||||||||||||
Property, plant and equipment, net | 13,813 | 13,792 | 10,010 | 13,813 | ||||||||||||
Goodwill | 37,297 | 37,856 | 25,801 | 37,297 | ||||||||||||
Intangible assets, net | 25,186 | 25,963 | 22,552 | 25,186 | ||||||||||||
Prepaid pension assets | 31 | 86 | 18 | 31 | ||||||||||||
Other assets | 1,308 | 1,371 | 1,475 | 1,308 | ||||||||||||
|
|
|
| |||||||||||||
TOTAL ASSETS | $ | 93,837 | $ | 95,289 | $ | 75,478 | $ | 93,837 | ||||||||
|
|
|
| |||||||||||||
LIABILITIES | ||||||||||||||||
Short-term borrowings | $ | 182 | $ | 750 | $ | 274 | $ | 182 | ||||||||
Current portion of long-term debt | 3,654 | 1,115 | 3,577 | 3,654 | ||||||||||||
Accounts payable | 5,525 | 5,409 | 4,642 | 5,525 | ||||||||||||
Accrued marketing | 2,863 | 2,515 | 2,484 | 2,863 | ||||||||||||
Accrued employment costs | 1,365 | 1,292 | 1,038 | 1,365 | ||||||||||||
Other current liabilities | 4,856 | 4,812 | 2,858 | 4,856 | ||||||||||||
|
|
|
| |||||||||||||
Total current liabilities | 18,445 | 15,893 | 14,873 | 18,445 | ||||||||||||
Long-term debt | 23,095 | 26,859 | 15,574 | 23,095 | ||||||||||||
Deferred income taxes | 6,738 | 7,984 | 6,302 | 6,738 | ||||||||||||
Accrued pension costs | 3,597 | 2,382 | 2,885 | 3,597 | ||||||||||||
Accrued postretirement health care costs | 3,238 | 3,046 | 451 | 3,238 | ||||||||||||
Other liabilities | 3,396 | 3,183 | 3,038 | 3,396 | ||||||||||||
|
|
|
| |||||||||||||
TOTAL LIABILITIES | 58,509 | 59,347 | 43,123 | 58,509 | ||||||||||||
Commitments and Contingencies (Note 13) | ||||||||||||||||
Commitments and Contingencies (Note 12) | ||||||||||||||||
EQUITY | ||||||||||||||||
Common Stock, no par value (1,996,537,778 shares issued in 2011 and 2010) | – | – | ||||||||||||||
Common Stock, no par value (1,996,537,778 shares issued in 2012 and 2011) | – | – | ||||||||||||||
Additional paid-in capital | 31,318 | 31,231 | 31,548 | 31,318 | ||||||||||||
Retained earnings | 18,012 | 16,619 | 10,457 | 18,012 | ||||||||||||
Accumulated other comprehensive losses | (6,637 | ) | (3,890 | ) | (2,633 | ) | (6,637 | ) | ||||||||
Treasury stock, at cost | (7,476 | ) | (8,126 | ) | (7,157 | ) | (7,476 | ) | ||||||||
|
|
|
| |||||||||||||
Total Kraft Foods Shareholders’ Equity | 35,217 | 35,834 | ||||||||||||||
Total Mondelēz International Shareholders’ Equity | 32,215 | 35,217 | ||||||||||||||
Noncontrolling interest | 111 | 108 | 140 | 111 | ||||||||||||
|
|
|
| |||||||||||||
TOTAL EQUITY | 35,328 | 35,942 | 32,355 | 35,328 | ||||||||||||
|
|
|
| |||||||||||||
TOTAL LIABILITIES AND EQUITY | $ | 93,837 | $ | 95,289 | $ | 75,478 | $ | 93,837 | ||||||||
|
|
|
| |||||||||||||
See notes to consolidated financial statements.
59
Kraft FoodsMondelēz International, Inc. and Subsidiaries
Consolidated Statements of Equity
(in millions of U.S. dollars, except per share data)
| ` | Mondelēz International Shareholders’ Equity | |||||||||||||||||||||||||||||||||||||||||||||||||||||||
| 0,000,000,000 | 0,000,000,000 | 0,000,000,000 | 0,000,000,000 | 0,000,000,000 | 0,000,000,000 | 0,000,000,000 | Accumulated | |||||||||||||||||||||||||||||||||||||||||||||||||
| Kraft Foods Shareholders’ Equity | Other | |||||||||||||||||||||||||||||||||||||||||||||||||||||||
| Accumulated | Additional | Comprehensive | ||||||||||||||||||||||||||||||||||||||||||||||||||||||
| Other | Common | Paid-in | Retained | Earnings/ | Treasury | Noncontrolling | Total | |||||||||||||||||||||||||||||||||||||||||||||||||
| Additional | Comprehensive | Stock | Capital | Earnings | (Losses) | Stock | Interest | Equity | ||||||||||||||||||||||||||||||||||||||||||||||||
| Common | Paid-in | Retained | Earnings/ | Treasury | Noncontrolling | Total | ||||||||||||||||||||||||||||||||||||||||||||||||||
| Stock | Capital | Earnings | (Losses) | Stock | Interest | Equity | ||||||||||||||||||||||||||||||||||||||||||||||||||
Balances at January 1, 2009 | $ | – | $ | 23,563 | $ | 13,440 | $ | (5,994 | ) | $ | (8,714 | ) | $ | 61 | $ | 22,356 | ||||||||||||||||||||||||||||||||||||||||
Balances at January 1, 2010 | $ | – | $ | 23,611 | $ | 14,636 | $ | (3,955 | ) | $ | (8,416 | ) | $ | 96 | $ | 25,972 | ||||||||||||||||||||||||||||||||||||||||
Comprehensive earnings / (losses): | ||||||||||||||||||||||||||||||||||||||||||||||||||||||||
Net earnings | – | – | 3,021 | – | – | 7 | 3,028 | – | – | 4,114 | – | – | 25 | 4,139 | ||||||||||||||||||||||||||||||||||||||||||
Other comprehensive earnings, | – | – | – | 2,039 | – | 34 | 2,073 | |||||||||||||||||||||||||||||||||||||||||||||||||
Exercise of stock options and issuance | – | 49 | (110 | ) | – | 298 | – | 237 | ||||||||||||||||||||||||||||||||||||||||||||||||
Cash dividends declared ($1.16 per share) | – | – | (1,715 | ) | – | – | – | (1,715 | ) | |||||||||||||||||||||||||||||||||||||||||||||||
Dividends paid on noncontrolling | – | (1 | ) | – | – | – | (6 | ) | (7 | ) | ||||||||||||||||||||||||||||||||||||||||||||||
|
|
|
|
|
|
| ||||||||||||||||||||||||||||||||||||||||||||||||||
Balances at December 31, 2009 | $ | – | $ | 23,611 | $ | 14,636 | $ | (3,955 | ) | $ | (8,416 | ) | $ | 96 | $ | 25,972 | ||||||||||||||||||||||||||||||||||||||||
|
|
|
|
|
|
| ||||||||||||||||||||||||||||||||||||||||||||||||||
Comprehensive earnings / (losses): | ||||||||||||||||||||||||||||||||||||||||||||||||||||||||
Net earnings | – | – | 4,114 | – | – | 25 | 4,139 | |||||||||||||||||||||||||||||||||||||||||||||||||
Other comprehensive earnings, | – | – | – | 65 | – | (19 | ) | 46 | ||||||||||||||||||||||||||||||||||||||||||||||||
Other comprehensive earnings / | – | – | – | 65 | – | (19 | ) | 46 | ||||||||||||||||||||||||||||||||||||||||||||||||
Exercise of stock options and issuance | – | 153 | (106 | ) | – | 290 | – | 337 | – | 153 | (106 | ) | – | 290 | – | 337 | ||||||||||||||||||||||||||||||||||||||||
Cash dividends declared ($1.16 per share) | – | – | (2,025 | ) | – | – | – | (2,025 | ) | – | – | (2,025 | ) | – | – | – | (2,025 | ) | ||||||||||||||||||||||||||||||||||||||
Net impact of noncontrolling | – | 38 | – | – | – | 33 | 71 | – | 38 | – | – | – | 33 | 71 | ||||||||||||||||||||||||||||||||||||||||||
Purchase from noncontrolling interest, dividends paid and other activities | – | (28 | ) | – | – | – | (27 | ) | (55 | ) | – | (28 | ) | – | – | – | (27 | ) | (55 | ) | ||||||||||||||||||||||||||||||||||||
Issuance of Common Stock | – | 7,457 | – | – | – | – | 7,457 | – | 7,457 | – | – | – | – | 7,457 | ||||||||||||||||||||||||||||||||||||||||||
|
|
|
|
|
|
|
|
|
|
|
|
|
| |||||||||||||||||||||||||||||||||||||||||||
Balances at December 31, 2010 | $ | – | $ | 31,231 | $ | 16,619 | $ | (3,890 | ) | $ | (8,126 | ) | $ | 108 | $ | 35,942 | $ | – | $ | 31,231 | $ | 16,619 | $ | (3,890 | ) | $ | (8,126 | ) | $ | 108 | $ | 35,942 | ||||||||||||||||||||||||
|
|
|
|
|
|
|
|
|
|
|
|
|
| |||||||||||||||||||||||||||||||||||||||||||
Comprehensive earnings / (losses): | ||||||||||||||||||||||||||||||||||||||||||||||||||||||||
Net earnings | – | – | 3,527 | – | – | 20 | 3,547 | – | – | 3,527 | – | – | 20 | 3,547 | ||||||||||||||||||||||||||||||||||||||||||
Other comprehensive losses, | – | – | – | (2,747 | ) | – | (10 | ) | (2,757 | ) | – | – | – | (2,747 | ) | – | (10 | ) | (2,757 | ) | ||||||||||||||||||||||||||||||||||||
Exercise of stock options and issuance | – | 100 | (86 | ) | – | 650 | – | 664 | – | 100 | (86 | ) | – | 650 | – | 664 | ||||||||||||||||||||||||||||||||||||||||
Cash dividends declared ($1.16 per share) | – | – | (2,048 | ) | – | – | – | (2,048 | ) | – | – | (2,048 | ) | – | – | – | (2,048 | ) | ||||||||||||||||||||||||||||||||||||||
Dividends paid on noncontrolling interest and other activities | – | (13 | ) | – | – | – | (7 | ) | (20 | ) | – | (13 | ) | – | – | – | (7 | ) | (20 | ) | ||||||||||||||||||||||||||||||||||||
|
|
|
|
|
|
|
|
|
|
|
|
|
| |||||||||||||||||||||||||||||||||||||||||||
Balances at December 31, 2011 | $ | – | $ | 31,318 | $ | 18,012 | $ | (6,637 | ) | $ | (7,476 | ) | $ | 111 | $ | 35,328 | $ | – | $ | 31,318 | $ | 18,012 | $ | (6,637 | ) | $ | (7,476 | ) | $ | 111 | $ | 35,328 | ||||||||||||||||||||||||
|
|
|
|
|
|
|
|
|
|
|
|
|
| |||||||||||||||||||||||||||||||||||||||||||
Comprehensive earnings / (losses): | ||||||||||||||||||||||||||||||||||||||||||||||||||||||||
Net earnings | – | – | 3,028 | – | – | 27 | 3,055 | |||||||||||||||||||||||||||||||||||||||||||||||||
Other comprehensive earnings / | – | – | – | (304 | ) | – | 6 | (298 | ) | |||||||||||||||||||||||||||||||||||||||||||||||
Exercise of stock options and issuance of other stock awards | – | 141 | (53 | ) | – | 319 | – | 407 | ||||||||||||||||||||||||||||||||||||||||||||||||
Cash dividends declared | – | – | (1,775 | ) | – | – | – | (1,775 | ) | |||||||||||||||||||||||||||||||||||||||||||||||
Spin-Off of Kraft Foods Group, Inc. | 89 | (8,755 | ) | 4,308 | (4,358 | ) | ||||||||||||||||||||||||||||||||||||||||||||||||||
Dividends paid on noncontrolling interest and other activities | – | – | – | – | – | (4 | ) | (4 | ) | |||||||||||||||||||||||||||||||||||||||||||||||
|
|
|
|
|
|
| ||||||||||||||||||||||||||||||||||||||||||||||||||
Balances at December 31, 2012 | $ | – | $ | 31,548 | $ | 10,457 | $ | (2,633 | ) | $ | (7,157 | ) | $ | 140 | $ | 32,355 | ||||||||||||||||||||||||||||||||||||||||
|
|
|
|
|
|
| ||||||||||||||||||||||||||||||||||||||||||||||||||
See notes to consolidated financial statements.
60
Kraft FoodsMondelēz International, Inc. and Subsidiaries
Consolidated Statements of Cash Flows
For the Years Ended December 31
(in millions of U.S. dollars)
| 00,000,000 | 00,000,000 | 00,000,000 | ||||||||||||||||||||||
| 2011 | 2010 | 2009 | 2012 | 2011 | 2010 | |||||||||||||||||||
CASH PROVIDED BY / (USED IN) OPERATING ACTIVITIES | ||||||||||||||||||||||||
Net earnings | $ | 3,547 | $ | 4,139 | $ | 3,028 | $ | 3,055 | $ | 3,547 | $ | 4,139 | ||||||||||||
Adjustments to reconcile net earnings to operating cash flows: | ||||||||||||||||||||||||
Depreciation and amortization | 1,485 | 1,440 | 931 | 1,345 | 1,485 | 1,440 | ||||||||||||||||||
Stock-based compensation expense | 181 | 174 | 164 | 162 | 181 | 174 | ||||||||||||||||||
Deferred income tax (benefit) / provision | (351 | ) | 251 | 38 | ||||||||||||||||||||
Losses on divestitures, net | – | 6 | 6 | |||||||||||||||||||||
Deferred income tax provision / (benefit) | 410 | (351 | ) | 251 | ||||||||||||||||||||
(Gains) / Losses on divestitures, net | (107 | ) | – | 6 | ||||||||||||||||||||
Gains on discontinued operations | – | (1,596 | ) | – | – | – | (1,596 | ) | ||||||||||||||||
Asset impairment and exit costs, net of cash paid | – | 55 | 17 | |||||||||||||||||||||
Asset impairments | 126 | – | 55 | |||||||||||||||||||||
Other non-cash expense, net | 81 | 329 | 269 | 48 | 81 | 329 | ||||||||||||||||||
Change in assets and liabilities, excluding the effects of | ||||||||||||||||||||||||
Receivables, net | (115 | ) | (165 | ) | (17 | ) | (599 | ) | (115 | ) | (165 | ) | ||||||||||||
Inventories, net | (556 | ) | (359 | ) | 299 | (129 | ) | (556 | ) | (359 | ) | |||||||||||||
Accounts payable | 300 | 83 | 126 | 505 | 300 | 83 | ||||||||||||||||||
Other current assets | (374 | ) | 42 | 351 | 217 | (374 | ) | 42 | ||||||||||||||||
Other current liabilities | 676 | (776 | ) | 111 | (1,166 | ) | 676 | (776 | ) | |||||||||||||||
Change in pension and postretirement assets and liabilities, net | (354 | ) | 125 | (239 | ) | 56 | (354 | ) | 125 | |||||||||||||||
|
|
|
|
|
| |||||||||||||||||||
Net cash provided by operating activities | 4,520 | 3,748 | 5,084 | 3,923 | 4,520 | 3,748 | ||||||||||||||||||
|
|
|
|
|
| |||||||||||||||||||
CASH PROVIDED BY / (USED IN) INVESTING ACTIVITIES | ||||||||||||||||||||||||
Capital expenditures | (1,771 | ) | (1,661 | ) | (1,330 | ) | (1,610 | ) | (1,771 | ) | (1,661 | ) | ||||||||||||
Acquisitions, net of cash received | – | (9,848 | ) | – | – | – | (9,848 | ) | ||||||||||||||||
Proceeds from divestitures, net of disbursements | – | 4,039 | 41 | 200 | – | 4,039 | ||||||||||||||||||
Cash transferred to Kraft Foods Group related to the Spin-Off | (410 | ) | – | – | ||||||||||||||||||||
Proceeds from sale of property, plant and equipment and other | 43 | 8 | 50 | 133 | 43 | 8 | ||||||||||||||||||
|
|
|
|
|
| |||||||||||||||||||
Net cash used in investing activities | (1,728 | ) | (7,462 | ) | (1,239 | ) | (1,687 | ) | (1,728 | ) | (7,462 | ) | ||||||||||||
|
|
|
|
|
| |||||||||||||||||||
CASH PROVIDED BY / (USED IN) FINANCING ACTIVITIES | ||||||||||||||||||||||||
Net repayments of short-term borrowings | (565 | ) | (864 | ) | (446 | ) | ||||||||||||||||||
Net issuance / (repayments) of short-term borrowings | 93 | (565 | ) | (864 | ) | |||||||||||||||||||
Long-term debt proceeds | 36 | 9,433 | 3 | 6,775 | 36 | 9,433 | ||||||||||||||||||
Long-term debt repaid | (1,114 | ) | (2,134 | ) | (968 | ) | (4,495 | ) | (1,114 | ) | (2,134 | ) | ||||||||||||
Dividends paid | (2,043 | ) | (2,175 | ) | (1,712 | ) | (2,058 | ) | (2,043 | ) | (2,175 | ) | ||||||||||||
Proceeds from stock option exercises and other | 511 | (72 | ) | (10 | ) | |||||||||||||||||||
Other | (111 | ) | 511 | (72 | ) | |||||||||||||||||||
|
|
|
|
|
| |||||||||||||||||||
Net cash (used in) / provided by financing activities | (3,175 | ) | 4,188 | (3,133 | ) | |||||||||||||||||||
Net cash provided by / (used in) financing activities | 204 | (3,175 | ) | 4,188 | ||||||||||||||||||||
|
|
|
|
|
| |||||||||||||||||||
Effect of exchange rate changes on cash and cash equivalents | (124 | ) | (94 | ) | 145 | 61 | (124 | ) | (94 | ) | ||||||||||||||
|
|
|
|
|
| |||||||||||||||||||
Cash and cash equivalents: | ||||||||||||||||||||||||
(Decrease) / Increase | (507 | ) | 380 | 857 | ||||||||||||||||||||
Increase / (decrease) | 2,501 | (507 | ) | 380 | ||||||||||||||||||||
Balance at beginning of period | 2,481 | 2,101 | 1,244 | 1,974 | 2,481 | 2,101 | ||||||||||||||||||
|
|
|
|
|
| |||||||||||||||||||
Balance at end of period | $ | 1,974 | $ | 2,481 | $ | 2,101 | $ | 4,475 | $ | 1,974 | $ | 2,481 | ||||||||||||
|
|
|
|
|
| |||||||||||||||||||
Cash paid: | ||||||||||||||||||||||||
Interest | $ | 2,031 | $ | 1,593 | $ | 1,308 | $ | 2,406 | $ | 2,031 | $ | 1,593 | ||||||||||||
|
|
|
|
|
| |||||||||||||||||||
Income taxes | $ | 932 | $ | 2,232 | $ | 1,025 | $ | 1,057 | $ | 932 | $ | 2,232 | ||||||||||||
|
|
|
|
|
| |||||||||||||||||||
See notes to consolidated financial statements.
61
Kraft FoodsMondelēz International, Inc. and Subsidiaries
Notes to Consolidated Financial Statements
Note 1. Summary of Significant Accounting Policies
Description of Business:
Mondelēz International, Inc. (formerly Kraft Foods Inc.) was incorporated in 2000 in the Commonwealth of Virginia. Kraft FoodsMondelēz International, Inc., through its subsidiaries (collectively “Kraft Foods,“Mondelēz International,” “we,” “us” and “our”), sells packaged food and beverage products to consumers in approximately 170165 countries.
On October 1, 2012 (the “Distribution Date”), we completed the spin-off of our former North American grocery business, Kraft Foods Group, Inc. (“Kraft Foods Group”) by distributing 100% of the outstanding shares of common stock of Kraft Foods Group to holders of our common stock (the “Spin-Off”). Along with our other food and beverage categories, we also retained our global snacks business (the “Global Snacks Business.”) See Note 2,Divestitures and Acquisitions, for more information about the Spin-Off.
Changes in Presentation:
The divested Kraft Foods Group is presented as a discontinued operation on the consolidated statements of earnings for all periods presented. The Kraft Foods Group balance sheet, other comprehensive earnings and cash flows are included within our consolidated balance sheet and consolidated statements of equity, comprehensive earnings and cash flows through October 1, 2012. The results from discontinued operations are discussed in further detail in Note 2,Divestitures and Acquisitions.
Principles of Consolidation:
The consolidated financial statements include Kraft Foods,Mondelēz International, as well as our wholly owned and majority owned subsidiaries. The majority of our operating subsidiaries report results as of the last Saturday of the year. A portion of our international operating subsidiaries report results as of the last calendar day or the last Saturday of the year. Because a significant number of our operating subsidiaries report results onperiod. In 2011, the last Saturday of the year and this year, that day fell on December 31, so our 2011 results included an extraone more week of operating results (“53rd week”) of operating results than in the prior two years2012 or 2010, which each had 52-weeks.52 weeks.
In 2011, we changed the consolidation date for certain operations of our Kraft Foods Europe segment and in the Latin America, and Central and Eastern Europe (“CEE”) and Middle East and Africa (“CEEMA”MEA”) regions within our Kraft Foods Developing Markets segment. Previously, these operations primarily reported results two weeks prior to the end of the period. Now,Subsequent to the 2011 changes, our Kraft Foods Europe segment reports results as of the last Saturday of each period. OurCertain operations in Latin America and certain operations in CEEMAwithin our Developing Markets segment now report results as of the last calendar day of the period or the last Saturday of the period. These changes and the 53rd week in 2011 resulted in a favorable impact to net revenues of approximately $920$679 million and a favorable impact of approximately $150$93 million to operating income in 2011.
In 2010, we changed the consolidation date for certain European biscuits operations, which are included within our Kraft Foods Europe segment, and certain operations in Asia Pacific and Latin America within our Kraft Foods Developing Markets segment. Previously, these operations primarily reported period-end results one month or two weeks prior to the end of the period. Kraft Foods Europe moved the reporting of these operations to two weeks prior to the end of the period, and Asia Pacific and Latin America moved the reporting of these operations to the last day of the period. These changes resulted in a favorable impact to net revenues of approximately $200$193 million and had an insignificanta favorable impact onof $23 million to operating income in 2010.
We believe these changes are preferable and will improve business planning and financial reporting by better matching the close dates of the operating subsidiaries within our Kraft Foods Europe segment and Kraft Foods Developing Markets segmentsegments and by bringing the reporting datedates closer to the period-end date. As the effect to prior-period results was not material, we have not revised prior-period results.
We account for investments in which we exercise significant influence (20%-50% ownership interest) under the equity method of accounting. We use the cost method of accounting for investments in which we have an ownership interest of less than 20% and in which we do not exercise significant influence. Noncontrolling interest in subsidiaries consists of the equity interest of noncontrolling investors in consolidated subsidiaries of Kraft Foods.Mondelēz International. All intercompany transactions are eliminated.
Use of Estimates:
We prepare our consolidated financial statements in accordance with accounting principles generally accepted in the United States of America (“U.S. GAAP”), which require us to make estimates and assumptions that affect a number of amounts in our consolidated financial statements. Significant accounting policy elections, estimates and assumptions include, among others, pension and benefit plan assumptions, valuation assumptions of goodwill and intangible assets, useful lives of long-lived assets, marketing program accruals, insurance and self-insurance reserves and income taxes. We base our estimates on historical experience and other assumptions that we believe are reasonable. If actual amounts differ from estimates, we include the revisions in our consolidated results of operations in the period the actual amounts become known. Historically, the aggregate differences, if any, between our estimates and actual amounts in any year have not had a material effect on our consolidated financial statements.
Foreign Currencies:
We translate the results of operations of our foreign subsidiaries using average exchange rates during each period, whereas balance sheet accounts are translated using exchange rates at the end of each period. We record currency translation adjustments as a component of equity. Transaction gains and losses are recorded in earnings and were not significant for any of the periods presented.
62
Highly Inflationary Accounting:
In the fourth quarter of 2009,On February 8, 2013, the Venezuelan economy was classified as highly inflationary under U.S. GAAP. Effective January 1, 2010, we began accounting for our Venezuelan subsidiaries under highly inflationary accounting rules, which principally means all transactions are recorded in U.S. dollars. We use bothgovernment announced the devaluation of the official Venezuelan bolivar exchange rate from 4.30 bolivars to 6.30 bolivars to the U.S. dollar and the elimination of the second-tier, government-regulated Transaction SystemSITME exchange rate previously applied to value certain types of transactions. The impact of these announced changes resulted in a one-time $30 million unfavorable foreign currency impact which we will record within our Latin America operating segment in the first quarter of 2013.
We began accounting for Foreign Currency Denominated Securities (“SITME”)the results of our Venezuelan subsidiaries in U.S. dollars on January 1, 2010, as prescribed under U.S. GAAP for highly inflationary economies. We use the official Venezuelan bolivar exchange rate to translate the results of our Venezuelan operations into U.S. dollars, based on the nature of the operations of each individual subsidiary.
Wedollars. During 2012 and 2011, we recorded approximately $10 million of favorableimmaterial foreign currency impacts relating toin connection with highly inflationary accounting in Venezuela during 2011 and approximatelyfor Venezuela. In 2010, we recorded $115 million of unfavorable foreign currency impacts during 2010. The 2010 loss includedincluding a one-time impact of $34 million to translate cash we previously recorded at the secondary market exchange rate.charge upon adopting highly inflationary accounting for Venezuela.
Cash and Cash Equivalents:
Cash and cash equivalents include demand deposits with banks and all highly liquid investments with original maturities of three months or less.
Inventories:
Inventories are stated at the lower of cost or market. We value all our inventories using the average cost method. We also record inventory allowances for overstocked and obsolete inventories due to ingredient and packaging changes.
Long-Lived Assets:
Property, plant and equipment are stated at historical cost and depreciated by the straight-line method over the estimated useful lives of the assets. Machinery and equipment are depreciated over periods ranging from 3 to 20 years and buildings and building improvements over periods up to 40 years.
We review long-lived assets, including amortizable intangible assets, for impairment when conditions exist that indicate the carrying amount of the assets may not be fully recoverable. We perform undiscounted operating cash flow analyses to determine if an impairment exists. When testing for impairment of assets held for use, we group assets and liabilities at the lowest level for which cash flows are separately identifiable. If an impairment is determined to exist, the loss is calculated based on estimated fair value. Impairment losses on assets to be disposed of, if any, are based on the estimated proceeds to be received, less costs of disposal.
Software Costs:
We capitalize certain computer software and software development costs incurred in connection with developing or obtaining computer software for internal use. Capitalized software costs are included in property, plant and equipment and amortized on a straight-line basis over the estimated useful lives of the software, which do not exceed seven years.
Goodwill and Non-Amortizable Intangible AssetsAssets::
We test goodwill and non-amortizable intangible assets for impairment at least annually on October 1. We assess goodwill impairment risk by first performing a qualitative review of entity-specific, industry, market and general economic factors for each reporting unit. If significant potential goodwill impairment risk exists for a specific reporting unit, we apply a two-step quantitative test. The first step compares the reporting unit’s estimated fair value with its carrying value. We estimate a reporting unit’s fair value using a 20-year projection of discounted cash flows which incorporates planned growth rates, market-based discount rates and estimates of residual value. For reporting units within our Kraft Foods North America and Kraft Foods Europe geographic units, we used a market-based, weighted-average cost of capital of 6.8%6.3% to discount the projected cash flows of those operations. For reporting units within our Kraft Foods Developing Markets geographic unit, we used a risk-rated discount rate of 9.8%9.3%. Estimating the fair value of individual reporting units requires us to make assumptions and estimates regarding our future plans, industry and economic conditions and our actual results and conditions may differ over time. If the carrying value of a reporting unit’s net assets exceeds its fair value, the second step is applied to measure the difference between the carrying value and implied fair value of goodwill. If the carrying value of goodwill exceeds its implied fair value, the goodwill is considered impaired and reduced to its implied fair value.
We test non-amortizable intangible assets for impairment by first performing a qualitative review by assessing events and circumstances that could affect the fair value or carrying value of the indefinite-lived intangible asset. If significant potential impairment risk exists for a specific non-amortizable intangible asset, we quantitatively test for impairment by comparing the fair value of each intangible asset with its carrying value. Fair value of non-amortizable intangible assets is determined using planned growth rates, market-based discount rates and estimates of royalty rates. If the carrying value of the asset exceeds its fair value, the intangible asset is considered impaired and is reduced to its estimated fair value. We record intangible asset impairment charges within asset impairment and exit costs.
Definite-lived intangible assets are amortized over their estimated useful lives and evaluated for impairment as long-lived assets.
63
Insurance and Self-Insurance:
We use a combination of insurance and self-insurance for a number of risks, including workers’ compensation, general liability, automobile liability, product liability and our obligation for employee healthcare benefits. LiabilitiesWe estimate the liabilities associated with thethese risks are estimated by consideringevaluating and making judgments about historical claims experience and other actuarial assumptions.assumptions and the estimated impact on future results.
Revenue Recognition:
We recognize revenues when title and risk of loss pass to customers, which generally occurs upon shipment or delivery of goods. Revenues are recorded net of consumer incentives and trade promotions and include all shipping and handling charges billed to customers. Our shipping and handling costs are classified as part of cost of sales. A provision for product returns and allowances for bad debts is also recorded as reductions to revenues within the same period that the revenue is recognized.
Marketing and Research and Development:
We promote our products with advertising, consumer incentives and trade promotions. These programs include, but are not limited to, discounts, coupons, rebates, in-store display incentives and volume-based incentives. We expense advertising costs either in the period the advertising first takes place or as incurred. Consumer incentive and trade promotion activities are recorded as a reduction to revenues based on amounts estimated as being due to customers and consumers at the end of a period. We base these estimates principally on historical utilization and redemption rates. For interim reporting purposes, advertising and consumer incentive expenses are charged to operations as a percentage of volume, based on estimated volume and related expense for the full year. We do not defer costs on our year-end consolidated balance sheet and all marketing costs are recorded as an expense in the year incurred. Advertising expense was $2,396$1,815 million in 2012, $1,860 million in 2011 $2,270and $1,729 million in 2010, and $1,581 million in 2009.2010. We expense costs as incurred for product research and development.development costs as incurred. Research and development expense was $702$462 million in 2012, $511 million in 2011 $583and $404 million in 2010, and $466 million in 2009.2010. We record marketing and research and development expenses within selling, general and administrative expenses.
Environmental Costs:
WeThroughout the countries in which we do business, we are subject to local, national and multi-national environmental laws and regulations relating to the protection of the environment. We accrue for environmental remediation obligations on an undiscounted basis when amounts are probable and can be reasonably estimated. The accruals are adjusted as new information develops or circumstances change. Recoveries of environmental remediation costs from third parties are recorded as assets when recovery of those costs is deemed probable. At December 31, 2011, our subsidiaries were involved in 68 active actions in the U.S. under Superfund legislation (and other similar actions and legislation) related to current operations and certain former or divested operations for which we retain liability.
Outside the U.S., we are subject to applicable multi-national, national and local environmental laws and regulations in the countries in which we do business. Outside the U.S., we have specific programs across our business units designed to meet applicable environmental compliance requirements.
In the United States, the laws and regulations include the Clean Air Act, the Clean Water Act, the Resource Conservation and Recovery Act and the Comprehensive Environmental Response, Compensation, and Liability Act (“CERCLA”). CERCLA imposes joint and severable liability on each potentially responsible party. As of December 31, 2012, our subsidiaries were involved in one active proceeding in the U.S. under a state equivalent of CERCLA related to our current operations. As of December 31, 2011, our subsidiaries were involved in 68 active actions. Except for the one active proceeding we retained, all the remaining active actions relate to and were retained by the divested Kraft Foods Group business.
As of December 31, 2011,2012, we accrued an immaterial amount for environmental remediation. Based on information currently available, we believe that the ultimate resolution of existing environmental remediation actions and our compliance in general with environmental laws and regulations will not have a material effect on our financial results.
Employee Benefit Plans:
We provide a range of benefits to our employeescurrent and retired employees. TheseDepending upon jurisdictions, tenure, presence of a union, job level and other factors, these include pension benefits, postretirement health care benefits and postemployment benefits, consisting primarily of severance. We provide pension coverage for certain employees of our non-U.S. subsidiaries through separate plans. Local statutory requirements govern many of these plans. For salaried and non-union hourly employees hired in the U.S. after January 1, 2009, we discontinued benefits under our U.S. pension plans, and we replaced them with an enhanced company contribution to our employee savings plan. Additionally, we will be freezing the U.S. pension plans for current salaried and non-union hourly employees effective December 31, 2019. Pension accruals for all salaried and non-union employees who are currently earning pension benefits will end on December 31, 2019, and continuing pay and service will be used to calculate the pension benefits through December 31, 2019. Our projected benefit obligation decreased $168 million in 2009, and we incurred a $5 million curtailment charge in 2009 related to the freeze. Our U.S., Canadian, and United Kingdom subsidiaries provide health care and other benefits to most retired employees. Local government plans generally cover health care benefits for retirees outside the U.S., Canada, and United Kingdom. Our postemployment benefit plans cover most salaried and certain hourly employees. The cost of these plans is charged to expense over the working life of the covered employees.
Financial Instruments:
As we operate globally, weWe use a variety of risk management strategies andcertain financial instruments to manage our foreign currency exchange rate, commodity price and interest rate risks. OurWe monitor and manage these exposures as part of our overall risk management program which focuses on the unpredictability of financial markets and seeks to reduce the potentially adverse effects that the volatility of these markets may have on our operating results. One way we do thisA principal objective of our risk management strategies is through actively hedging our risksto reduce significant, unanticipated earnings fluctuations that may arise from volatility in foreign currency exchange rates, commodity prices and interest rates, principally through the use of derivative instruments.
We use a combination of primarily foreign currency forward contracts, futures, options and swaps; commodity forward contracts, futures and options; and interest rate swaps to manage our exposure to cash flow variability, protect the value of our existing foreign currency assets and liabilities and protect the value of our debt. See Note 9,Financial Instruments, to the consolidated financial statements for more information on the types of derivative instruments we use.
64
Derivatives are recorded onWe record derivative financial instruments at fair value in our consolidated balance sheets atwithin other current assets or other current liabilities due to their relatively short-term duration. Cash flows from derivative instruments are classified in the consolidated statements of cash flows based on the nature of the derivative instrument. Changes in the fair value which fluctuates based on changing market conditions.
Certain derivatives areof a derivative that is designated as eithera cash flow or fair value hedges and qualify for hedge, accounting treatment, while others do not qualify andto the extent that the hedge is effective, are marked to market through earnings. For cash flow hedges, changes in fair value are deferredrecorded in accumulated other comprehensive earnings / (losses) within equity untiland reclassified to earnings when the underlying hedged itemsitem affects earnings. Changes in fair value of economic hedges and the ineffective portion of all hedges are recognized in netcurrent period earnings. Accordingly, we record deferred cash flow hedge gains or lossesChanges in cost of sales when the related inventory is sold and in interest and other expense, net, when the related interest expense is recorded for hedges of intercompany loans. For fair value hedges, changes inof a derivative that is designated as a fair value are recognized immediately in net earnings, consistenthedge, along with the underlying hedged items. As such, in connection with our interest rate swaps designated as fair value hedges, we record gains or losses on interest rate swaps and the corresponding changes in the fair value of the related hedged long-term debt directly within interest and other expense, net. Cash flows from derivative instrumentsasset or liability, are also classifiedrecorded in earnings in the same manner as the underlying hedged itemsperiod. We use foreign currency denominated debt to hedge a portion of our net investment in foreign operations against adverse movements in exchange rates, with changes in the consolidated statementvalue of cash flows. For additional information on the location of derivative activitydebt recorded within our operating results, see Note 12,Financial Instrumentscurrency translation adjustment in accumulated other comprehensive earnings / (losses).
ToIn order to qualify for hedge accounting, a specified level of hedging effectiveness between the hedgingderivative instrument and the item being hedged must be achievedexist at inception and maintained throughout the hedged period. Any hedging ineffectiveness is recognized in net earnings whenWe must also formally document the change innature of and relationship between the value ofderivative and the hedge does not offset the change in the value of the underlying hedged item.
We formally documentitem, as well as our risk management objectives, strategies for undertaking the various hedge transactions, the nature of and relationships between the hedging instruments and hedged items,transaction and method forof assessing hedge effectiveness.
Additionally, for qualified hedgesa hedge of a forecasted transactions, we specifically identifytransaction, the significant characteristics and expected termsterm of the forecasted transactions. Iftransaction must be specifically identified, and it becomesmust be probable that athe forecasted transaction will not occur, the hedge willoccur. If it is no longer be effective and all ofprobable that the hedged forecasted transaction will occur, we would recognize the gain or loss related to the derivative gains or losses would be recognized in earnings in the current period.earnings.
When we use financial instruments,derivatives, we are exposed to credit and market risks. Credit risk thatexists when a counterparty to a derivative contract might fail to fulfill its performance obligations under the terms of our agreement.contract. We minimize our credit risk by entering into transactions with counterparties with high quality, investment grade credit ratings, limiting the amount of exposure we have with each counterparty and monitoring the financial condition of our counterparties. We also maintain a policy of requiring that all significant, non-exchange traded derivative contracts with a duration of greater than one year beor longer are governed by an International Swaps and Derivatives Association master agreement. We are also exposed to marketMarket risk asexists when the value of oura derivative or other financial instrumentsinstrument might be adversely affected by a changechanges in market conditions and foreign currency exchange rates, commodity prices, or interest rates. We manage market risk by incorporating monitoring parameters within our risk management strategy that limitlimiting the types of derivative instruments and derivative strategies we use and the degree of market risk that we plan to hedge withthrough the use of derivative instruments.
Commodity cash flow hedges – We are exposed to price risk related to forecasted purchases of certain commodities that we primarily use as raw materials. We enter into commodity forward contracts primarily for meat, coffee, dairy,wheat, soybean and vegetable oils, sugar cocoa and wheat.other sweeteners and cocoa. Commodity forward contracts generally are not subject to the accounting requirements for derivative instruments and hedging activities under the normal purchases exception. We also use commodity futures and options to hedge the price of certain input costs, including dairy, coffee, cocoa, wheat, corn products, soybean and vegetable oils, meat products, sugar natural gas and heating oil.other sweeteners and cocoa. Some of these derivative instruments are highly effective and qualify for hedge accounting treatment. We also sell commodity futures to unprice future purchase commitments, and we occasionally use related futures to cross-hedge a commodity exposure. We are not a party to leveraged derivatives and, by policy, do not use financial instruments for speculative purposes.
Foreign currency cash flow hedges – We use various financial instruments to mitigate our exposure to changes in exchange rates from third-party and intercompany actual and forecasted transactions. These instruments may include forward foreign exchange forward contracts, forward futures, contracts, foreign currency swapsoptions and foreign currency options.swaps. Based on the size and location of our businesses, we use these instruments to hedge our exposure to certain currencies, including the euro, Swiss franc, pound sterling and Canadian dollar.
65
Interest rate cash flow and fair value hedges– We manage interest rate volatility by modifying the repricingpricing or maturity characteristics of certain liabilities so that the net impact on interest marginexpense is not, on a material basis, adversely affected by movements in interest rates. As a result of interest rate fluctuations, hedged fixed-rate liabilities appreciate or depreciate in market value. We expect the effect of this unrealized appreciation or depreciation to be substantially offset by our gains or losses on the derivative instruments that are linked to these hedged liabilities. We use derivative instruments, including interest rate swaps that have indices related to the pricing of specific liabilities as part of our interest rate risk management strategy. As a matter of policy, we do not use highly leveraged derivative instruments for interest rate risk management. We use interest rate swaps to economically convert a portion of our nonprepayable fixed-rate debt into variable-rate debt. Under the interest rate swap contracts, we agree with other parties to exchange, at specified intervals, the difference between fixed-rate and floating-rate interest amounts, which is calculated based on an agreed-upon notional amount. We also use interest rate swaps to hedge the variability of interest payment cash flows on a portion of our future debt obligations. Substantially all of these derivative instruments are highly effective and qualify for hedge accounting treatment.
Hedges of net investments in foreign operations – We have numerous investments in our foreign subsidiaries. The net assets of these subsidiaries are exposed to volatility in foreign currency exchange rates. We use foreign-currency-denominatedforeign currency denominated debt to hedge our net investment in foreign operations against adverse movements in exchange rates. We designated our euro and pound sterling denominated borrowings as a net investment hedge of a portion of our overall European operations. The gains and losses on our net investment in these designated European operations are economically offset by losses and gains on our euro and pound sterling denominated borrowings. The change in the debt’s fair value is recorded in the currency translation adjustment component of accumulated other comprehensive earnings / (losses).
Income Taxes:
We recognize tax benefits in our financial statements when our uncertain tax positions are assessed more likely than not to be sustained upon audit. The amount we recognize is measured as the largest amount of benefit that is greater than 50 percent likely of being realized upon ultimate settlement.
We recognize deferred tax assets for deductible temporary differences, operating loss carryforwards and tax credit carryforwards. Deferred tax assets are reduced by a valuation allowance if it is more likely than not that some portion, or all, of the deferred tax assets will not be realized.
New Accounting Pronouncements:
In September 2011,February 2013, the Financial Accounting Standards Board (“FASB”) issued an amendment relatedaccounting standards update, clarifying how to multiemployer pension plans. This amendment increasesreport the quantitativeeffect of significant reclassifications out of accumulated other comprehensive income (“AOCI”) by component and qualitative disclosures about an employer’s participation in individually significant multiemployer plansthe respective line items of the statement of earnings that offer pension and other postretirement benefits.are affected. The guidance is effective for fiscal years endedand interim reporting periods beginning after December 15, 2011.2012. We adoptedplan to adopt this guidance in the guidancefirst quarter of 2013 and modifieddo not anticipate that the disclosures surroundingadoption will materially change the presentation of our participation in multiemployer plans in Note 11, Benefit Plans.consolidated financial statements.
In September 2011,July 2012, the FASB issued an amendment to simplify how entities test goodwill for impairment. An entityaccounting standards update which simplifies indefinite-lived intangible asset impairment testing. Companies now hashave the option to first assess qualitative factors to determine whether it is “more likely than not” that goodwillan indefinite-lived intangible asset may be impaired. If, after assessing the totality of events and circumstances, goodwill impairment is determined to be not likely, then performing the quantitative two-step impairment test would not be required. The new guidance also modifies goodwill evaluation during the year to make it consistentamendment is effective for annual tests performed for fiscal years beginning after September 15, 2012, with the new annual qualitative approach.early adoption permitted. We adopted the guidance effective October 1, 2011 and incorporatedin the guidance inquarter ended December 31, 2012, ahead of our annual goodwillintangible asset impairment test.
In June 2011, the FASB issued an amendment related to statements of comprehensive income. This amendment requires an entity to present the total of comprehensive income, the components of net income, and the components of other comprehensive income in either a single continuous statement of comprehensive income or in two separate but consecutive statements. This amended guidance eliminates the option to present the components of other comprehensive income as part of the statement of changes in stockholders’ equity. We adopted the guidance effective October 1, 2011 and we now present the components of other comprehensive income in a separate statement.
In May 2011, the FASB issued an amendment to revise certain fair value measurement and disclosure requirements. This amendment establishes common requirements for measuring fair value and for disclosing information about fair value measurements in accordance with U.S. GAAP and International Financial Reporting Standards. These changes will be effective January 1, 2012 on a prospective basis. Early adoption is not permitted. We do not expect the adoption of this standard to have a material effect on our financial results.
In June 2009,testing. The new guidance was issued on the consolidation of variable interest entities. We adopted the guidance effective January 1, 2010. This guidance increases the likelihood of an enterprise being classified as a variable interest entity. The adoption of this guidance did not have a materialan impact on our financial results.
Reclassifications:
66Certain amounts previously reported have been reclassified to conform to the current-year presentation.
Subsequent Events:
We evaluated subsequent events and included all accounting and disclosure requirements related to subsequent events in our consolidated financial statements.
Reclassifications:
Certain amounts previously reported have been reclassified to conform to the current-year presentation.
Note 2. Proposed Spin-off TransactionDivestitures and Acquisitions
Spin-off Kraft Foods Group
On August 4, 2011,October 1, 2012 (the “Distribution Date”), we announced thatcompleted the spin-off of our Board of Directors intendsNorth American grocery business, Kraft Foods Group, Inc. (“Kraft Foods Group”), to create two independent public companies: (i) aour shareholders (the “Spin-Off”). Along with our other food and beverage categories, we also retained our global snacks business (the “Global Snacks Business”) and (ii) a North American grocery business (the “North American Grocery Business”). The Global Snacks Business will consistOn October 1, 2012, each of our currentshareholders of record as of the close of business on September 19, 2012 (“the Record Date”) received one share of Kraft Foods EuropeGroup common stock for every three shares of our Common Stock held as of the Record Date. The distribution was structured to be tax free to our U.S. shareholders for U.S. federal income tax purposes.
Kraft Foods Group is now an independent public company trading on The NASDAQ Global Select Market under the symbol “KRFT.” After the Spin-Off, we do not beneficially own any shares of Kraft Foods Group common stock.
The divested Kraft Foods Group is presented as a discontinued operation on the consolidated statements of earnings for all periods presented. The Kraft Foods Group balance sheet, other comprehensive earnings and Developing Markets segmentscash flows are included within our consolidated balance sheet and consolidated statements of equity, comprehensive earnings and cash flows through October 1, 2012.
Summary results of operations for Kraft Foods Group through October 1, 2012 were as wellfollows:
| Nine Months Ended | For the Years Ended December 31, | |||||||||||
| October 1, 2012 | 2011 | 2010 | ||||||||||
| (in millions) | ||||||||||||
Net revenues | $ | 13,768 | $ | 18,555 | $ | 17,718 | ||||||
|
|
|
|
|
| |||||||
Earnings before income taxes | $ | 2,266 | $ | 2,892 | $ | 2,916 | ||||||
Provision for income taxes | 778 | 1,082 | 1,093 | |||||||||
Earnings and gain from discontinued operations, | – | – | 1,644 | |||||||||
|
|
|
|
|
| |||||||
Earnings from discontinued operations, net of income taxes | $ | 1,488 | $ | 1,810 | $ | 3,467 | ||||||
|
|
|
|
|
| |||||||
| (1) | On March 1, 2010, Kraft Foods Group completed the sale of the assets of the North American frozen pizza business to Nestlē USA, Inc. The earnings through March 1, 2010 and the gain were included in discontinued operations for Kraft Foods Group for the year ended December 31, 2010. |
The results of the Kraft Foods Group discontinued operation exclude certain corporate and business unit costs which were allocated to Kraft Foods Group historically and are expected to continue at Mondelēz International after the Spin-Off. These costs include primarily corporate overheads, information systems and sales force support. On a pre-tax basis, through the date of the Spin-Off, these costs were $150 million for the nine months ended October 1, 2012, $236 million for the year ended December 31, 2011 and $209 million for the year ended December 31, 2010.
Interest expense relating to debt Kraft Foods Group incurred or assumed through October 1, 2012 has been included in the results from discontinued operations for all periods presented and as follows:
| Nine Months Ended | For the Years Ended December 31, | |||||||||||
| October 1, 2012 | 2011 | 2010 | ||||||||||
| (in millions) | ||||||||||||
$6.0 billion note issuance in June 2012 | $ | 70 | $ | – | $ | – | ||||||
$3.6 billion notes exchanged in July 2012 | 171 | 226 | 216 | |||||||||
$0.4 billion debt transferred in October 2012 | 24 | 31 | 31 | |||||||||
Capital leases and other | 13 | 10 | 7 | |||||||||
|
|
|
|
|
| |||||||
| $ | 278 | $ | 267 | $ | 254 | |||||||
|
|
|
|
|
| |||||||
On October 1, 2012, we divested the following assets and liabilities which net to $4,358 million, or $4,111 million net of cash retained by Kraft Foods Group on the Distribution Date (in millions):
Assets | ||||
Cash | $ | 247 | ||
Receivables | 1,685 | |||
Inventories, net | 2,099 | |||
Deferred income taxes | 338 | |||
Other current assets | 168 | |||
Property, plant and equipment, net | 4,211 | |||
Goodwill | 11,911 | |||
Intangible assets, net | 2,632 | |||
Prepaid pension assets | 16 | |||
Other assets | 856 | |||
|
| |||
| $ | 24,163 | |||
|
| |||
Liabilities | ||||
Current portion of long-term debt | $ | 6 | ||
Accounts payable | 1,798 | |||
Accrued marketing | 463 | |||
Accrued employment costs | 190 | |||
Other current liabilities | 751 | |||
Long-term debt | 9,965 | |||
Deferred income taxes | 874 | |||
Accrued pension costs | 2,026 | |||
Accrued postretirement health care costs | 3,316 | |||
Other liabilities | 416 | |||
|
| |||
| $ | 19,805 | |||
|
| |||
Net assets divested in the Spin-Off | $ | 4,358 | ||
|
|
Additionally, $4,308 million of accumulated other comprehensive losses primarily related to the pension and other benefit plan net liabilities transferred to Kraft Foods Group and $89 million of unearned compensation recorded within additional paid in capital were distributed to Kraft Foods Group. In total, we recorded a distribution of $8,755 million to our shareholders in connection with the Spin-Off of Kraft Foods Group.
In order to implement the Spin-Off, we entered into certain agreements with Kraft Foods Group to effect our legal and structural separation; govern the relationship between us; and allocate various assets, liabilities and obligations between us, including, among other things, employee benefits, intellectual property and tax-related assets and liabilities (see Note 14,Income Taxes, for additional information). In addition to executing the Spin-Off in the manner provided in the agreements, in November 2012, pursuant to these aqreements, we paid Kraft Foods Group $163 million related to targeted cash flows (together with the $247 million of cash divested on the Distribution Date, totaling $410 million of cash transferred to Kraft Foods Group in connection with the Spin-Off). To facilitate the management, including final payment and resolution, of certain obligations, Kraft Foods Group retained certain of our North American snacknet trade payables and confectionery businesses. The North American Grocery Business will primarily consistreceivables. We also retained approximately $140 million of workers’ compensation liabilities for claims incurred by Kraft Foods Group employees prior to the Spin-Off. In November 2012, we paid Kraft Foods Group $95 million to cash settle the net trade payables and receivables and which are also reflected in table above. As of December 31, 2012, we also have a $55 million receivable from Kraft Foods Group related to the cash settlement of stock awards held by our current U.S. Beverages, Cheese, Convenient Mealsrespective employees at the time of the Spin-Off as further described in Note 11,Stock Plans, to the consolidated financial statements.
Spin-Off Costs:
Our historical results include one-time Spin-Off transaction, transition and Grocery segments, grocery-related categoriesfinancing and related costs (“Spin-Off Costs”) we have incurred to date. We recorded Spin-Off Costs of $1,053 million in our Canada & N.A. Foodservice segment as well as thePlanters2012 andCorn Nuts brands and businesses. $46 million of Spin-Off Costs in 2011. We expect to create these companies through a U.S. tax-free spin-off ofreflect all one-time Spin-Off Costs within our reported results. We incurred the North American Grocery Business tofollowing Spin-Off Costs within our shareholders.pre-tax earnings:
The transaction is subject to a number of conditions, including the receipt of regulatory approvals, a favorable ruling from the Internal Revenue Service to ensure the U.S. tax-free status of the spin-off, execution of intercompany agreements, further diligence as appropriate and final approval from our Board of Directors. While our current target is to complete the spin-off before year-end 2012, we cannot assure that the spin-off will be completed on the anticipated timeline or that the terms of the spin-off will not change.
Note 3. Acquisitions and Divestitures
For the Years Ended December 31, | ||||||||
| 2012 | 2011 | |||||||
| (in millions) | ||||||||
Selling, general and administrative expenses | $ | 444 | $ | 46 | ||||
Interest and other expense, net | 609 | – | ||||||
|
|
|
| |||||
Spin-Off Costs | $ | 1,053 | $ | 46 | ||||
|
|
|
| |||||
Cadbury Acquisition and related Divestitures:
On January 19, 2010, we announced the terms of our final offer for each outstanding ordinary share of Cadbury Limited (formerly, Cadbury plc) (“Cadbury”), including each ordinary share represented by an American Depositary Share (“Cadbury ADS”), and the Cadbury Board of Directors recommended that Cadbury shareholders accept the terms of the final offer. On February 2, 2010, all of the conditions to the offer were satisfied or validly waived, the initial offer period expired and a subsequent offer period immediately began. At that point, we had received acceptances of 71.73% of the outstanding Cadbury ordinary shares, including those represented by Cadbury ADSs (“Cadbury Shares”). As of June 1, 2010, we owned 100% of all outstanding Cadbury Shares. We believe the combination of Kraft Foods and
The Cadbury will create a global snacks powerhouse and an unrivaled portfolio of brands people love.
Under the terms of our final offer and the subsequent offer, we agreed to pay Cadbury shareholders 500 pence in cash and 0.1874 shares of Kraft Foods Common Stock per Cadbury ordinary share validly tendered and 2,000 pence in cash and 0.7496 shares of Kraft Foods Common Stock per Cadbury ADS validly tendered. Thisacquisition was valued Cadbury at $18.5 billion, or approximately £11.6 billion (based on the average price of $28.36 for a share of Kraft Foods Inc. Common Stock on February 2, 2010 and an exchange rate of $1.595 per £1.00).
On February 2, 2010, we acquired 71.73% of Cadbury Shares for $13.1 billion and the value attributed to noncontrolling interests was $5.4 billion. From February 2, 2010 through June 1, 2010, we acquired the remaining 28.27% of Cadbury Shares for $5.4 billion. We hadrecorded a $38 million gain on the noncontrolling interestinterests acquired and recorded it within additional paid in capital.
As part of our Cadbury acquisition, we incurred and expensed transaction relatedtransaction-related fees of $218 million in 2010 and $40 million in 2009. We recorded these expenses within selling, general and administrative expenses. We also incurred acquisition financing fees of $96 million in 2010. We recorded these expenses within interest and other expense, net.
To secure EU regulatoryAs a condition to granting approval of the acquisition, we werethe EU required tothat we divest certain Cadbury confectionery operations in Poland and Romania. In 2010, we completed the sale of the assets of these businesses and generated $342 million in sale proceeds. The impactsimpact of these divestitures were primarilywas reflected as adjustments towithin the Cadbury final purchase price allocations.accounting.
During 2010, Cadbury contributed net revenues of $9,143 million and net earnings of $530 million from February 2, 2010 through December 31, 2010. The following unaudited pro forma summary presents Kraft Foods’our consolidated informationresults of continuing operations as if Cadbury had been acquired on January 1, 2009.2010. These amounts were calculated after conversion to U.S. GAAP, applying our accounting policies, and adjusting Cadbury’s results to reflect the additional depreciation and amortization that would have been charged assuming the fair value adjustments to property, plant and equipment, and intangible assets had been applied from January 1, 2009,2010, together with the consequential tax effects. These adjustments also reflect the additional interest expense incurred on the debt to finance the purchase and the divestitures of certain Cadbury confectionery operations in Poland and Romania.
67
| Pro forma | ||||
| Year Ended | ||||
| December 31, 2010 | ||||
| (in millions) | ||||
Net revenues | $ | 32,052 | ||
Net earnings attributable to Mondelēz International | 2,115 | |||
| 00,000,000 | 00,000,000 | |||||||
| Pro forma for the | ||||||||
| Years Ended December 31, | ||||||||
| 2010 | 2009 | |||||||
| (in millions) | ||||||||
Net revenues | $ | 49,770 | $ | 47,852 | ||||
Net earnings attributable to Kraft Foods | 3,938 | 2,586 | ||||||
Our February 2, 2010 Cadbury acquisition was valued at $18,547 million, or $17,503 million net of cash and cash equivalents. As part of that acquisition, we acquired the following assets and assumed the following liabilities (in millions):
| 00,000,000 | ||||||||
Assets | ||||||||
Cash and cash equivalents | $ | 1,044 | ||||||
Receivables(1) | $ | 1,333 | 1,333 | |||||
Inventories | 1,298 | |||||||
Inventories, net | 1,298 | |||||||
Other current assets | 660 | 660 | ||||||
Property, plant and equipment | 3,293 | |||||||
Property, plant and equipment, net | 3,293 | |||||||
Goodwill(2) | 9,530 | 9,530 | ||||||
Intangible assets(3) | 12,905 | |||||||
Intangible assets, net(3) | 12,905 | |||||||
Other assets | 593 | 593 | ||||||
| ||||||||
| $ | 30,656 | |||||||
| ||||||||
Liabilities | ||||||||
Short-term borrowings | (1,206 | ) | $ | 1,206 | ||||
Accounts payable | (1,605 | ) | 1,605 | |||||
Other current liabilities (4) | (1,866 | ) | 1,866 | |||||
Long-term debt | (2,437 | ) | 2,437 | |||||
Deferred income taxes | (3,218 | ) | 3,218 | |||||
Accrued pension costs | (817 | ) | 817 | |||||
Other liabilities | (927 | ) | 927 | |||||
Noncontrolling interest | (33 | ) | 33 | |||||
| ||||||||
| $ | 12,109 | |||||||
| ||||||||
Net assets acquired | $ | 18,547 | ||||||
| ||||||||
| (1) | The gross amount of acquired receivables was $1,474 million, of which $141 million was reserved as uncollectable. |
| (2) | Goodwill will not be deductible for statutory tax purposes and is attributable to Cadbury’s workforce and the significant synergies we expect from the acquisition. |
| (3) | We acquired $10.3 billion of |
| (4) | Within other current liabilities, a reserve for exposures related to taxes of approximately $70 million was established within our Developing Markets segment. The cumulative exposure was approximately $150 million at December 31, 2010. |
Pizza Divestiture:
On March 1, 2010, we completed the sale of the assets of our North American frozen pizza business (“Frozen Pizza”) to Nestlé USA, Inc. (“Nestlé”) for $3.7 billion. Our Frozen Pizza business was a component of our U.S. Convenient Meals and Canada & North America Foodservice segments. The sale included theDiGiorno,Tombstone andJack’s brands in the U.S., theDelissio brand in Canada and theCalifornia Pizza Kitchen trademark license. It also included two Wisconsin manufacturing facilities (Medford and Little Chute) and the leases for the pizza depots and delivery trucks. Approximately 3,600 of our employees transferred with the business to Nestlé. Accordingly, the results of our Frozen Pizza business have been reflected as discontinued operations on the consolidated statement of earnings for all periods presented.
Pursuant to the Frozen Pizza business Transition Services Agreement, we agreed to provide certain sales, co-manufacturing, distribution, information technology, accounting and finance services to Nestlé for up to two years. As of December 31, 2011, these service agreements were substantially complete.
Summary results of operations for the Frozen Pizza business through March 1, 2010 were as follows:
| 00,000,000 | 00,000,000 | |||||||
| For the Years Ended December 31, | ||||||||
| 2010 | 2009 | |||||||
| (in millions) | ||||||||
Net revenues | $ | 335 | $ | 1,632 | ||||
|
|
|
| |||||
Earnings before income taxes | 73 | 341 | ||||||
Provision for income taxes | (25 | ) | (123 | ) | ||||
Gain on discontinued operations, net of | 1,596 | – | ||||||
|
|
|
| |||||
Earnings and gain from discontinued | $ | 1,644 | $ | 218 | ||||
|
|
|
| |||||
Earnings before income taxes as presented exclude associated allocated overheads of $25 million in 2010 and $108 million in 2009. The 2010 gain on discontinued operations from the sale of the Frozen Pizza business included tax expense of $1.2 billion.
68
The following assets of the Frozen Pizza business were included in the Frozen Pizza divestiture (in millions):
| 00,000,000 | ||||
Inventories, net | $ | 102 | ||
Property, plant and equipment, net | 317 | |||
Goodwill | 475 | |||
|
| |||
Divested assets of the Frozen Pizza business | $ | 894 | ||
|
|
Other Divestitures:
In 2009,2012, we received $41$200 million in net proceeds and recorded pre-tax lossesgains of $6$107 million onprimarily related to the divestitures of ourBalancebar operationsa dinners and sauces grocery business in the U.S., a juice operation in BrazilGermany and Belgium and a plantcanned meat business in Spain. We recorded after-tax gainsItaly. In 2011, there were no significant divestitures. In 2010, as discussed above, we divested businesses in Poland and Romania in connection with the acquisition of $58 million on these divestitures, primarily due to the differing book and tax bases of ourBalancebar operations.Cadbury.
The aggregate operating results of the divestitures discussed above other than the divestiture of the Frozen Pizza business, were not material to our financial statements in any of the periods presented. Refer to Note 16,Segment Reporting, for details of the gains and losses on divestitures by segment.
Note 4.3. Inventories
Inventories at December 31, 20112012 and 20102011 were:
| 00,000,000 | 00,000,000 | |||||||||||||||
| 2011 | 2010 | 2012 | 2011 | |||||||||||||
| (in millions) | (in millions) | |||||||||||||||
Raw materials | $ | 1,800 | $ | 1,743 | $ | 1,213 | $ | 1,800 | ||||||||
Finished product | 3,906 | 3,567 | 2,528 | 3,906 | ||||||||||||
|
|
|
| |||||||||||||
Inventories, net | $ | 5,706 | $ | 5,310 | $ | 3,741 | $ | 5,706 | ||||||||
|
|
|
| |||||||||||||
Note 5.4. Property, Plant and Equipment
Property, plant and equipment at December 31, 20112012 and 20102011 were:
| 00,000,000 | 00,000,000 | |||||||||||||||
| 2011 | 2010 | 2012 | 2011 | |||||||||||||
| (in millions) | (in millions) | |||||||||||||||
Land and land improvements | $ | 768 | $ | 795 | $ | 643 | $ | 768 | ||||||||
Buildings and building equipment | 4,997 | 4,934 | ||||||||||||||
Buildings and building improvements | 3,199 | 4,997 | ||||||||||||||
Machinery and equipment | 16,934 | 16,147 | 11,992 | 16,934 | ||||||||||||
Construction in progress | 1,233 | 1,154 | 1,022 | 1,233 | ||||||||||||
|
|
|
| |||||||||||||
| 23,932 | 23,030 | 16,856 | 23,932 | |||||||||||||
Accumulated depreciation | (10,119 | ) | (9,238 | ) | (6,846 | ) | (10,119 | ) | ||||||||
|
|
|
| |||||||||||||
Property, plant and equipment, net | $ | 13,813 | $ | 13,792 | $ | 10,010 | $ | 13,813 | ||||||||
|
|
|
| |||||||||||||
On October 1, 2012, $4,211 million of property, plant and equipment was divested with the Spin-Off of Kraft Foods Group. Additionally, in the first quarter of 2012, we sold a manufacturing facility located in Russia for $72 million in proceeds, disposing of $17 million of primarily buildings and building improvements, which resulted in our recording a pre-tax gain of $55 million within our Developing Markets segment.
Asset impairments:
In 2012, we recorded impairment charges of $18 million, related primarily to machinery and equipment, under our 2012-2014 Restructuring Program which is further described in Note 6, 2012-2014 Restructuring Program. We did not record any asset impairments in 2011. During 2010, we recorded an asset impairment of $12 million on a biscuit plant and related property, plant and equipment in France. During 2009, we recorded a $9 million asset impairment charge to write off an investment in Norway. These charges were recorded within asset impairment and exit costs.
Note 6.5. Goodwill and Intangible Assets
At December 31, 20112012 and 2010,2011, goodwill by reportable segment was:
| 00,000,000 | 00,000,000 | |||||||
| 2011 | 2010 | |||||||
| (in millions) | ||||||||
Kraft Foods North America: | ||||||||
U.S. Beverages | $ | 1,290 | $ | 1,290 | ||||
U.S. Cheese | 3,000 | 3,000 | ||||||
U.S. Convenient Meals | 985 | 985 | ||||||
U.S. Grocery | 3,046 | 3,046 | ||||||
U.S. Snacks | 9,125 | 9,125 | ||||||
Canada & N.A. Foodservice | 3,385 | 3,430 | ||||||
Kraft Foods Europe | 9,003 | 9,023 | ||||||
Kraft Foods Developing Markets | 7,463 | 7,957 | ||||||
|
|
|
| |||||
Goodwill | $ | 37,297 | $ | 37,856 | ||||
|
|
|
| |||||
| 2012 | 2011 | |||||||
| (in millions) | ||||||||
Developing Markets | $ | 7,450 | $ | 7,463 | ||||
Europe | 9,245 | 9,003 | ||||||
North America | 9,106 | 20,831 | ||||||
|
|
|
| |||||
Goodwill | $ | 25,801 | $ | 37,297 | ||||
|
|
|
| |||||
69
Intangible assets at December 31, 20112012 and 20102011 were:
| 00,000,000 | 00,000,000 | |||||||||||||||
| 2011 | 2010 | 2012 | 2011 | |||||||||||||
| (in millions) | (in millions) | |||||||||||||||
Non-amortizable intangible assets | $ | 22,859 | $ | 23,351 | $ | 20,408 | $ | 22,859 | ||||||||
Amortizable intangible assets | 2,853 | 2,928 | 2,861 | 2,853 | ||||||||||||
|
|
|
| |||||||||||||
| 25,712 | 26,279 | 23,269 | 25,712 | |||||||||||||
Accumulated amortization | (526 | ) | (316 | ) | (717 | ) | (526 | ) | ||||||||
|
|
|
| |||||||||||||
Intangible assets, net | $ | 25,186 | $ | 25,963 | $ | 22,552 | $ | 25,186 | ||||||||
|
|
|
| |||||||||||||
Non-amortizable intangible assets consist principally of brand names purchased through our acquisitions of Nabisco Holdings Corp., the Spanish and Portuguese operations of United Biscuits, the globalLU Biscuit business of Groupe Danone S.A. and Cadbury. Amortizable intangible assets consist primarily of trademark licenses,trademarks, customer-related intangibles, process technology, license agreements and non-compete agreements. At December 31, 2011,2012, the weighted-average life of our amortizable intangible assets was 13.2 years.
Amortization expense for intangible assets was $217 million in 2012, $225 million in 2011 and $210 million in 2010. We currently estimate amortization expense for each of the next five years to be approximately $218 million.
Changes in goodwill and intangible assets consisted of:
| 00,000,000 | 00,000,000 | 00,000,000 | 00,000,000 | |||||||||||||||||||||||||||||
| 2011 | 2010 | 2012 | 2011 | |||||||||||||||||||||||||||||
| Goodwill | Intangible Assets, at cost | Goodwill | Intangible Assets, at cost | Goodwill | Intangible Assets, at cost | Goodwill | Intangible Assets, at cost | |||||||||||||||||||||||||
| (in millions) | (in millions) | |||||||||||||||||||||||||||||||
Balance at January 1 | $ | 37,856 | $ | 26,279 | $ | 28,764 | $ | 13,540 | $ | 37,297 | $ | 25,712 | $ | 37,856 | $ | 26,279 | ||||||||||||||||
Changes due to: | ||||||||||||||||||||||||||||||||
Foreign currency | (559 | ) | (567 | ) | 37 | 48 | 436 | 262 | (559 | ) | (567 | ) | ||||||||||||||||||||
Acquisitions | – | – | 9,530 | 12,907 | ||||||||||||||||||||||||||||
Divestitures | – | – | (475 | ) | (168 | ) | (11,932 | ) | (2,669 | ) | – | – | ||||||||||||||||||||
Asset impairments | – | – | – | (43 | ) | – | (52 | ) | – | – | ||||||||||||||||||||||
Acquisitions | – | 14 | ||||||||||||||||||||||||||||||
Other | – | – | – | (5 | ) | – | 2 | – | – | |||||||||||||||||||||||
|
|
|
|
|
|
|
| |||||||||||||||||||||||||
Balance at December 31 | $ | 37,297 | $ | 25,712 | $ | 37,856 | $ | 26,279 | $ | 25,801 | $ | 23,269 | $ | 37,297 | $ | 25,712 | ||||||||||||||||
|
|
|
|
|
|
|
| |||||||||||||||||||||||||
Changes to goodwill and intangible assets during 2012 were:
Divestitures-In 2012, we reduced goodwill by $11,911 million and reduced intangible assets by $2,666 million due to the divestiture of Kraft Foods Group. We also reduced goodwill by $21 million primarily related to the divestitures in Germany, Belgium and Italy.
Asset Impairments-We recorded $52 million of charges related to a trademark on a Japanese chewing gum product within our Developing Markets segment which had significantly lower revenue. The fair value of the intangible asset was determined under a relief of royalty valuation, which models the cash flows from the trademark assuming royalties were received under a licensing arrangement. The charge was calculated as the excess of the carrying value of the intangible asset over its estimated fair value and was recorded within asset impairment and exit costs.
Acquisitions-We increased intangible assets by $14 million related to an acquisition of a license in Pakistan and an acquisition of a trademark in Europe.
In 2011, except for changes due to foreign currency translation, there were no significant changes to goodwill and intangible assets. In 2010, significant changes were:
Acquisitions-We increased goodwill by $9,530 million and intangible assets by $12,907 million related to allocations of purchase price for our Cadbury acquisition. We recorded $2,177 million of the acquired goodwill in our U.S. Snacks segment, $937 million in our Canada & N.A. Foodservice segment, $2,671 million in our Kraft Foods Europe segment and $3,745 million in our Kraft Foods Developing Markets segment.
Divestitures-We reduced goodwill by $475 million due to our Frozen Pizza business divestiture.
Asset impairments-During our 2010 review of goodwill and non-amortizable intangible assets, we recorded a $13 million charge for the impairment of intangible assets in the Netherlands and a $30 million charge for the impairment of intangible assets in China. These charges were recorded within asset impairment and exit costs.
In 2012, 2011 and 2010, there were no impairments of goodwill or non-amortizable intangible assets.goodwill. In 2010,connection with our 2012 annual impairment testing, we also noted no goodwill impairment and disclosed fivetwo reporting units which were more sensitive to near-term changes in discounted cash flow assumptions. In 2011, we noted only one reporting unit,assumptions: U.S. Salty Snacks, which continues to be sensitive primarily to ongoing significant input cost pressure. U.S. Salty Snacks has $1,170Confections with $2,177 million of goodwill as of December 31, 2011,2012 and its excess fair value over thein excess of its carrying value of its net assets improved from 12%of 9% and Europe Biscuits with $2,569 million of goodwill as of December 31, 2012 and fair value in 2010, to 19% in 2011.excess of its carrying value of net assets of 16%. While the reporting unitunits passed the first step of the impairment test, by a substantial margin, if itsthe segment operating income or another valuation assumption for either reporting unit were to declinedeteriorate significantly in the future, it wouldcould adversely affect the estimated fair value of the reporting unit.value. If input costs were to continue to rise, we expect to take further pricing actions as we have done in 2011. However, if we are unsuccessful in our plans to increase the profitability of these efforts, it would decrease profitability, negatively affectbusinesses, the estimated fair value of the U.S. Salty Snacks reporting unitvalues could fall further and could lead to a potential goodwill impairment in the future.
Amortization expense for intangible assetsNote 6. 2012-2014 Restructuring Program
On March 14, 2012, our Board of Directors approved $1.1 billion of restructuring and related implementation costs (“2012-2014 Restructuring Program”) reflecting primarily severance, asset disposals and other manufacturing-related one-time costs. The primary objective of the restructuring and implementation activities was $225to ensure that both Kraft Foods Group and Mondelēz International were each set up to operate efficiently and execute on our respective business strategies upon separation and in the future. On October 23, 2012, our Board of Directors approved $400 million of additional restructuring and related implementation programs, totaling $1.5 billion of expected 2012-2014 Restructuring Program costs.
Of the $1.5 billion of anticipated 2012-2014 Restructuring Program costs, Kraft Foods Group has or expects to incur approximately $575 million. As such, we will retain approximately $925 million of the 2012-2014 Restructuring Program.
Restructuring Costs:
Within our continuing results of operations, to date, we have recorded restructuring charges of $102 million in 2011, $2112012 within asset impairment and exit costs. We spent $33 million in 2010,2012 in cash severance and $26related costs, and we also recognized non-cash pension plan settlement losses (See Note 10,Benefit Plans)and non-cash asset write-downs (including accelerated depreciation and asset impairments) totaling $33 million in 2009.2012. At December 31, 2012, our net restructuring liability was $36 million recorded within other current liabilities.
| Severance and related costs | Asset Write-downs | Total | ||||||||||
| (in millions) | ||||||||||||
Liability balance, January 1, 2012 | $ | – | $ | – | $ | – | ||||||
Charges | 84 | 18 | 102 | |||||||||
Cash spent | (33 | ) | – | (33 | ) | |||||||
Non-cash settlements | (15 | ) | (18 | ) | (33 | ) | ||||||
|
|
|
|
|
| |||||||
Liability balance, December 31, 2012 | $ | 36 | $ | – | $ | 36 | ||||||
|
|
|
|
|
| |||||||
Implementation Costs:
Implementation costs are directly attributable to restructuring activities; however, they do not qualify for special accounting treatment as exit or disposal activities. We currently estimate amortizationbelieve the disclosure of implementation costs provides readers of our financial statements greater transparency to the total costs of our 2012-2014 Restructuring Program. Within our continuing results of operations, to date, we recorded implementation costs of $8 million in 2012 within cost of sales and selling, general and administrative expense for eachin our North America segment. These costs primarily include costs to integrate and reorganize our operations and facilities, the discontinuance of certain product lines and the next five yearsincremental expenses related to be approximately $215 million.the closure of facilities, replicating our information systems infrastructure and reorganizing costs related to our sales function.
Restructuring and Implementation Costs by Segment:
During 2012, we recorded restructuring and implementation costs within our consolidated segment operating income as follows:
70
| For the Year Ended December 31, 2012 | ||||||||||||
| Restructuring | Implementation | |||||||||||
| Costs | Costs | Total | ||||||||||
| (in millions) | ||||||||||||
Developing Markets | $ | 7 | $ | – | $ | 7 | ||||||
Europe | 6 | – | 6 | |||||||||
North America | 89 | 8 | 97 | |||||||||
|
|
|
|
|
| |||||||
Total | $ | 102 | $ | 8 | $ | 110 | ||||||
|
|
|
|
|
| |||||||
Note 7. Integration Program and Cost Savings Initiatives
Integration Program
OurAs a result of our combination with Cadbury continuesin 2010, we launched an integration program to have the potential for meaningful synergies and costs savings. We now expect to recognizerealize expected annual cost savings of approximately $800$750 million of cost savings by the end of the third year following completion of the acquisition, up from our original estimate of $750 million. Additionally, we expect to create2013 and revenue synergies from investments in distribution, marketing and product development. In order to achieve these cost savings and synergies and integrate the two businesses, we expect to incur total integration charges of approximately $1.5 billion inthrough the first three years following the acquisition to combine and integrate the two businessesend of 2013 (the “Integration Program”).
Integration Program costs include the costs associated with combining the Cadbury operations within our operations with Cadbury’sGlobal Snacks Business and are separate from the costs related to the acquisition. We incurred charges underSince the inception of the Integration Program, we have incurred approximately $1.3 billion of the estimated $1.5 billion total integration charges. In 2012, we met and exceeded our annual cost savings target of $750 million and achieved approximately $800 million of annual costs savings one year ahead of schedule.
Changes in the Integration Program liability were (in millions):
| 2012 | 2011 | |||||||
Balance at January 1 | $ | 346 | $ | 406 | ||||
Charges | 140 | 521 | ||||||
Cash spent | (281 | ) | (554 | ) | ||||
Currency / other | (3 | ) | (27 | ) | ||||
|
|
|
| |||||
Balance at December 31 | $ | 202 | $ | 346 | ||||
|
|
|
| |||||
We recorded Integration Program charges of $185 million in 2012, $521 million in 2011 and $657$646 million in 2010. During 2012, we reversed $45 million of Integration Program charges previously accrued in 2010 and primarily related to planned and announced position eliminations that did not occur within our Europe segment. We recorded these charges primarily in operations as a part of selling, general and administrative expenses primarily within our Kraft Foods Europe and Kraft Foods Developing Markets segments, as well as within general corporate expenses. Since the inception of the Integration Program, we have incurred approximately $1.2 billion of the $1.5 billion in expected charges.
Changes in the Integration Program liability consisted of:
| 00,000,000 | 00,000,000 | |||||||
| 2011 | 2010 | |||||||
| (in millions) | ||||||||
Balance at January 1 | $ | 406 | $ | – | ||||
Liability assumed upon acquisition | – | 228 | ||||||
Charges | 521 | 657 | ||||||
Cash spent | (554 | ) | (463 | ) | ||||
Asset impairments | – | (13 | ) | |||||
Currency / other | (27 | ) | (3 | ) | ||||
|
|
|
| |||||
Balance at December 31 | $ | 346 | $ | 406 | ||||
|
|
|
| |||||
Cost Savings Initiatives
Cost savings initiatives generally include exit, disposal and other project costs outside of our Integration Program and consisted2012-2014 Restructuring Program and consist of the following specific initiatives:
In 2011,2012, we recorded a $64$21 million charge primarily within the segment operating income of Kraft Foods Europe and related to severance benefits provided to terminated employees and charges in connection with Kraft Foodsthe reorganization within the Europe and Developing Markets segment (the “Europe reorganization”).
In 2011, we recorded a $61 million charge primarily within the segment operating income of Europe related to severance benefits provided to terminated employees and charges in connection with the Europe reorganization. We also reversed $37approximately $15 million of cost savings initiative program costs across all segments except Kraft Foods Europe.the North America and Developing Markets segments.
In 2010, we recorded $170$117 million primarily within the segment operating income of Kraft Foods Europe and Canada & N.A. Foodservice and in connection with the Kraft Foods Europe reorganization.
In 2009, we recorded $318 million primarily for severance benefits provided to terminated employees, associated benefit plan costs and other related activities. These were recorded in operations, primarily within the segment operating income of Kraft Foods Europe, with the remainder spread across all other segments.
Within our Integration Program and cost savings initiatives, we include certain costs along with exit and disposal costs that are directly attributable to these activities and do not qualify for treatment as exit or disposal costs under U.S. GAAP. These costs, which we commonly refer to as other project costs or implementation costs, generally include the integration and reorganization of operations and facilities, the discontinuance of certain product lines and the incremental expenses related to the closure of facilities. We believe the disclosure of these charges within our operating income provides greater transparency of the impact of these programs and initiatives on our operating results.
Note 8. Debt and Borrowing Arrangements
Short-Term Borrowings:
At December 31, 20112012 and 2010,2011, our short-term borrowings and related weighted-average interest rates consisted of:
| 00,000,000 | 00,000,000 | 00,000,000 | 00,000,000 | |||||||||||||
| 2011 | 2010 | |||||||||||||||
| Amount Outstanding | Weighted-Average Year-End Rate | Amount Outstanding | Weighted-Average Year-End Rate | |||||||||||||
| (in millions) | (in millions) | |||||||||||||||
Commercial paper | $ | – | $ | 483 | 0.5% | |||||||||||
Bank loans | 182 | 10.7% | 267 | 6.3% | ||||||||||||
|
|
|
| |||||||||||||
Total short-term borrowings | $ | 182 | $ | 750 | ||||||||||||
| �� |
|
|
|
| ||||||||||||
| 2012 | 2011 | |||||||||||||||
| Amount | Weighted-Average | Amount | Weighted-Average | |||||||||||||
| Outstanding | Year-End Rate | Outstanding | Year-End Rate | |||||||||||||
| (in millions) | (in millions) | |||||||||||||||
Bank loans | $ | 274 | 7.2% | $ | 182 | 10.7% | ||||||||||
71
The fair values of our short-term borrowings at December 31, 2011 and 2010, based upon current market interest rates, approximate the amounts disclosed above.
Borrowing Arrangements:
On April 1, 2011, we entered into an agreement forWe maintain a $4.5 billion four-year senior unsecured revolving credit facility which expires in April 2015. The agreement replaced our former revolving credit agreement, which was terminated upon the signing of the new agreement. We intend to use the revolving credit facilitythat we have historically used for general corporate purposes, including for working capital purposes and to support our commercial paper issuances. Our $4.5 billion four-year senior unsecured revolving credit facility expires in April 2015. As of December 31, 2011,2012, no amounts have been drawn on the facility.
The revolving credit agreement requires us to maintain a minimum total shareholders’ equity, excluding accumulated other comprehensive earnings / (losses), of at least $28.6 billion. At December 31, 2011,2012, our total shareholders’ equity, excluding accumulated other comprehensive earnings / (losses), was $41.9$34.8 billion. We expect to continue to meet this covenant. The revolving credit agreement also contains customary representations, covenants and events of default. However, the revolving credit facility has no other financial covenants, credit rating triggers or provisions that could require us to post collateral as security.
In addition to the above, some of our international subsidiaries maintain primarily uncommitted credit lines to meet short-term working capital needs. Collectively, these credit lines amounted to $2.4 billion at December 31, 2012 and $2.3 billion at December 31, 2011 and $2.4 billion at December 31, 2010.2011. Borrowings on these lines amounted to $274 million at December 31, 2012 and $182 million at December 31, 2011 and $267 million at December 31, 2010.
As part of our Cadbury acquisition, on November 9, 2009, we entered into an agreement for a 364-day senior unsecured bridge facility (the “Cadbury Bridge Facility”). During the first quarter of 2010, we borrowed £807 million under the Cadbury Bridge Facility, and repaid it ($1,205 million at the time of repayment) with proceeds from the divestiture of our Frozen Pizza business. Upon repayment, the Cadbury Bridge Facility was terminated.2011.
Long-Term Debt:
At December 31, 20112012 and 2010,2011, our long-term debt consisted of (interest rates were as of December 31, 2011)2012):
| 00,000,000 | 00,000,000 | |||||||||||||||
| 2011 | 2010 | 2012 | 2011 | |||||||||||||
| (in millions) | (in millions) | |||||||||||||||
Notes, 2.63% to 7.55% (average effective rate 5.87%), | $ | 21,766 | $ | 22,872 | ||||||||||||
Euro notes, 5.75% to 6.25% (average effective rate 5.98%), | 3,690 | 3,808 | ||||||||||||||
Sterling notes, 5.38% to 7.25% (average effective rate 4.94%), | 1,074 | 1,091 | ||||||||||||||
U.S. Dollar notes, 2.63% to 7.00% (average effective rate 5.71%), | $ | 16,887 | $ | 21,766 | ||||||||||||
Euro notes, 6.25% (effective rate 6.33%), | 1,119 | 3,690 | ||||||||||||||
Pound sterling notes, 5.38% to 7.25% (average effective rate 4.94%), | 1,109 | 1,074 | ||||||||||||||
Other foreign currency obligations | 178 | 158 | 32 | 178 | ||||||||||||
Capital leases and other | 41 | 45 | 4 | 41 | ||||||||||||
|
|
|
| |||||||||||||
Total | 26,749 | 27,974 | 19,151 | 26,749 | ||||||||||||
Less current portion of long-term debt | (3,654 | ) | (1,115 | ) | (3,577 | ) | (3,654 | ) | ||||||||
|
|
|
| |||||||||||||
Long-term debt | $ | 23,095 | $ | 26,859 | $ | 15,574 | $ | 23,095 | ||||||||
|
|
|
| |||||||||||||
As of December 31, 2011,2012, aggregate maturities of long-termour debt based on stated contractual maturities for the years ended were (in
(in millions):
| 00,000,000 | ||||
2012 | $ | 3,654 | ||
2013 | 3,563 | |||
2014 | 971 | |||
2015 | 1,506 | |||
2016 | 1,773 | |||
Thereafter | 15,308 |
| 2013 | 2014 | 2015 | 2016 | 2017 | Thereafter | Total | ||||||||||||||||||||
| $ | 3,569 | $ | 990 | $ | 1,123 | $ | 1,764 | $ | 1,500 | $ | 10,216 | $ | 19,162 | |||||||||||||
On October 2, 2012 our $150 million Canadian dollar variable rate loan matured. The loan and accrued interest to date were repaid with cash from operations.
On October 1, 2012, approximately $10 billion of debt on our balance sheet at September 30, 2012 was transferred to or retained by Kraft Foods Group. As described below, the debt primarily included: $6.0 billion of senior unsecured notes issued on June 4, 2012; $3.6 billion of debt exchanged on July 18, 2012; and $400 million migrated on October 1, 2012. See Note 2,Divestitures and Acquisitions, for additional information regarding the Spin-Off and liabilities transferred in the divestiture of Kraft Foods Group.
On October 1, 2012, in connection with the Spin-Off and related debt capitalization plan, a $400 million 7.55% senior unsecured note was retained by Kraft Foods Group. No cash was generated from the transaction.
On July 18, 2012, we completed a debt exchange in which $3.6 billion of our debt held by third-party note holders was exchanged for notes issued by Kraft Foods Group in order to migrate debt to Kraft Foods Group in connection with our Spin-Off capitalization plan. No cash was generated from the exchange and we incurred one-time financing costs of $18 million which we recorded in interest expense. As a result of the exchange, we retired the following debt:
$596 million of our 6.125% Notes due in February 2018
$439 million of our 6.125% Notes due in August 2018
$900 million of our 5.375% Notes due in February 2020
$233 million of our 6.875% Notes due in January 2039
$290 million of our 6.875% Notes due in February 2038
$185 million of our 7.000% Notes due in August 2037
$170 million of our 6.500% Notes due in November 2031 and
$787 million of our 6.500% Notes due in 2040.
On June 4, 2012, Kraft Foods Group issued $6.0 billion of senior unsecured notes and distributed $5.9 billion of net proceeds to us in connection with the Spin-Off capitalization plan. We used the proceeds to pay $3.6 billion of outstanding commercial paper borrowings and expect to use the remaining cash proceeds to pay down additional debt over time or for general corporate purposes. This debt and approximately $260 million of related deferred financing costs were retained by Kraft Foods Group in the Spin-Off.
On June 1, 2012, $900 million of our 6.25% notes matured. The notes and accrued interest to date were repaid using primarily commercial paper borrowings which were subsequently repaid from $5.9 billion net proceeds received from the Kraft Foods Group $6.0 billion notes issuance on June 4, 2012.
On March 20, 2012,€2.0 billion of our 5.75% bonds matured. The bonds and accrued interest to date were repaid using proceeds from the issuance of commercial paper which was subsequently repaid in June 2012 as discussed above.
On January 10, 2012, we issued $800 million of floating rate notes maturing in 2013 which bear interest at a rate equal to the three-month London Inter-Bank Offered Rate (“LIBOR”) plus 0.875%. We received net proceeds of $798.8 million from the issuance. The notes havewere set to mature on July 10, 2013 or subject to a special mandatory redemption. Uponredemption tied to the public announcement of the record dateRecord Date for the proposed spin-off of our North American grocery business to our shareholders, we will be required to issue a notice of redemption of all ofSpin-Off. After announcing the Record Date, on September 24, 2012, the notes were redeemed at a redemption price equal to 100% of the aggregate principal amount of the notes, or $800 million, plus accrued and unpaid interest through the day prior to the redemption date.of $2 million with cash on hand.
72
On November 1, 2011, we repaid $1.1 billion of our long-term debt5.625% notes matured. The notes and accrued interest to date were repaid with cash from operations and short-term borrowings.operations.
On December 29, 2010 we repurchased $900 million principal amount of our 5.625% notes due 2011 and $600 million principal amount of our 6.25% notes due 2012, which were validly tendered pursuant to the cash tender offers we initiated in November 2010. We paid $1,596 million aggregate consideration, including accrued and unpaid interest, for the accepted notes in December 2010.
On December 20, 2010, we repaid £77 million (approximately $119 million) of our long-term debt and on August 11, 2010, we repaid $500 million of our long-term debt. We funded these repayments with cash from operations and short-term borrowings.
On February 8, 2010, we issued $9.5 billion of senior unsecured notes at a weighted-average effective rate of 5.364% and used the net proceeds ($9,379 million) to finance the Cadbury acquisition and for general corporate purposes. The general terms of the $9.5 billion notes are:
$3.75 billion total principal notes due February 10, 2020 at a fixed, annual interest rate of 5.375%. Interest is payable semiannually beginning August 10, 2010.
$3.00 billion total principal notes due February 9, 2040 at a fixed, annual interest rate of 6.500%. Interest is payable semiannually beginning August 9, 2010.
$1.75 billion total principal notes due February 9, 2016 at a fixed, annual interest rate of 4.125%. Interest is payable semiannually beginning August 9, 2010.
$1.00 billion total principal notes due May 8, 2013 at a fixed, annual interest rate of 2.625%. Interest is payable semiannually beginning November 8, 2010.
In addition, these notes include covenants that restrict our ability to incur debt secured by liens above a certain threshold. We also must offer to purchase these notes at a price equal to 101% of the aggregate principal amount, plus accrued and unpaid interest to the date of repurchase, if both of the following occur: (i) a “change of control” triggering event, and (ii) a downgrade of these notes below an investment grade rating by each of Moody’s Investors Service, Inc., Standard & Poor’s Ratings Services and Fitch, Inc. within a specified period. We expect to continue to comply with our long-term debt covenants.
On February 2, 2010, as part of the Cadbury acquisition, we acquired $2,437 million of long-term debt. The terms of the debt (including U.S. dollar par amounts as of February 2, 2010) were:
£77 million (approximately $123 million) total principal notes due December 20, 2010 at a fixed, annual interest rate of 4.875%.
C$150 million (approximately $140 million) Canadian bank loan agreement expiring August 30, 2012 at a variable interest rate. The interest rate at December 31, 2011 was 1.507%.
$1.0 billion total principal notes due October 1, 2013 at a fixed, annual interest rate of 5.125%.
£300 million (approximately $499 million) total principal notes due December 11, 2014 at a fixed, annual interest rate of 5.375%.
£350 million (approximately $626 million) total principal notes due July 18, 2018 at a fixed, annual interest rate of 7.250%.
Fair Value:
The fair value of our short-term borrowings at December 31, 2012 and December 31, 2011 reflects current market interest rates and approximates the amounts we have recorded on our consolidated balance sheet. The fair value of our long-term debt was determined using quoted prices in active markets for the publicly traded debt obligations (Level 1 valuation data). At December 31, 2012, the aggregate fair value of our total debt was $22,946 million and its carrying value was $19,425 million. At December 31, 2011, the aggregate fair value of our total debt was $31,113 million as compared with theand its carrying value ofwas $26,931 million at December 31, 2011, and $31,459 million as compared with the carrying value of $28,724 million at December 31, 2010. The fair value of our debt was determined using Level 1 quoted prices in active markets for identical liabilities.million.
Interest and Other Expense, Net:
Interest and other expense, net within our results of continuing operations consisted of:
| 00,000,000 | 00,000,000 | 00,000,000 | ||||||||||||||||||||||
| For the Years Ended December 31, | For the Years Ended December 31, | |||||||||||||||||||||||
| 2011 | 2010 | 2009 | 2012 | 2011 | 2010 | |||||||||||||||||||
| (in millions) | (in millions) | |||||||||||||||||||||||
Interest expense, debt | $ | 1,645 | $ | 1,790 | $ | 1,260 | $ | 1,177 | $ | 1,383 | $ | 1,540 | ||||||||||||
Spin-Off-related financing fees | 609 | – | – | |||||||||||||||||||||
Acquisition-related financing fees | – | 251 | – | – | – | 251 | ||||||||||||||||||
Other expense / (income), net | 240 | (17 | ) | (23 | ) | 77 | 235 | (21 | ) | |||||||||||||||
|
|
|
|
|
| |||||||||||||||||||
Total interest and other expense, net | $ | 1,885 | $ | 2,024 | $ | 1,237 | $ | 1,863 | $ | 1,618 | $ | 1,770 | ||||||||||||
|
|
|
|
|
| |||||||||||||||||||
Except for one-time Spin-Off related financing fees, interest expense associated with debt incurred by or migrated to Kraft Foods Group in connection with the Spin-Off is reflected within earnings from discontinued operations, net of income taxes. In 2012, Spin-Off related financing fees include a loss of $556 million related to several interest rate swap settlements. In 2011, other expense includes a loss of $157 million related to several interest rate swaps that settled in 2011. In 2010, acquisition-related financing fees include hedging and foreign currency impacts associated with the Cadbury acquisition and other fees associated with the Cadbury Bridge Facility.
73
Note 9. Capital Stock
Our articles of incorporation authorize 5.0 billion shares of Class A common stock and 500 million shares of preferred stock. In 2010, we combined our Class A and Class B common stock authorizations. Accordingly, we only have a single class of Class A common stock authorized. Shares of Class A common stock issued, in treasury and outstanding were:
| 00,000,000 | 00,000,000 | 00,000,000 | ||||||||||
| Shares Issued | Treasury Shares | Shares Outstanding | ||||||||||
Balance at January 1, 2009 | 1,735,000,000 | (265,698,560 | ) | 1,469,301,440 | ||||||||
Exercise of stock options and issuance of | – | 8,583,463 | 8,583,463 | |||||||||
|
|
|
|
|
| |||||||
Balance at December 31, 2009 | 1,735,000,000 | (257,115,097 | ) | 1,477,884,903 | ||||||||
|
|
|
|
|
| |||||||
Shares issued | 261,537,778 | – | 261,537,778 | |||||||||
Exercise of stock options and issuance of | – | 8,643,868 | 8,643,868 | |||||||||
|
|
|
|
|
| |||||||
Balance at December 31, 2010 | 1,996,537,778 | (248,471,229 | ) | 1,748,066,549 | ||||||||
|
|
|
|
|
| |||||||
Exercise of stock options and issuance of | – | 19,830,140 | 19,830,140 | |||||||||
|
|
|
|
|
| |||||||
Balance at December 31, 2011 | 1,996,537,778 | (228,641,089 | ) | 1,767,896,689 | ||||||||
|
|
|
|
|
| |||||||
At December 31, 2011, 115,094,789 shares of Class A common stock were reserved for stock options and other stock awards. There were no preferred shares or Class B common shares issued and outstanding at December 31, 2011, 2010 and 2009.
In 2010, we issued 262 million shares of our Class A common stock as part of the Cadbury acquisition. The issued stock had a total fair value of $7,457 million based on the average of the high and low market prices on the dates of issuance.
Note 10. Stock Plans
We align our annual and long-term incentive compensation programs with shareholder returns. Under the Amended and Restated 2005 Performance Incentive Plan (the “2005 Plan”), we may grant to eligible employees awards of stock options, stock appreciation rights, restricted stock, restricted and deferred stock units, and other awards based on our Common Stock, as well as performance-based annual and long-term incentive awards. We are authorized to issue a maximum of 168.0 million shares of our Common Stock under the 2005 Plan. In addition, the Kraft Foods Restated 2006 Stock Compensation Plan for Non-Employee Directors (the “2006 Directors Plan”), was amended in 2011 at our annual meeting of shareholders in May 2011, and we now may grant up to 1,000,000 shares of our Common Stock to members of the Board of Directors who are not our full-time employees. At December 31, 2011, there were 56,752,061 shares available to be granted under the 2005 Plan and 789,603 shares available to be granted under the 2006 Directors Plan. Restricted or deferred shares available for grant under the 2005 Plan at December 31, 2011, were 19,886,997.
All stock awards are issued to employees from treasury stock. We have no specific policy to repurchase our Common Stock to mitigate the dilutive impact of options; however, we have historically made adequate discretionary purchases, based on cash availability, market trends and other factors, to satisfy stock option exercise activity.
Stock Options:
Stock options are granted at an exercise price equal to the market value of the underlying stock on the grant date, generally become exercisable in three annual installments beginning on the first anniversary of the grant date and have a maximum term of ten years.
We account for our employee stock options under the fair value method of accounting using a modified Black-Scholes methodology to measure stock option expense at the date of grant. The fair value of the stock options at the date of grant is amortized to expense over the vesting period. We recorded compensation expense related to stock options of $49 million in 2011, $46 million in 2010 and $31 million in 2009. The deferred tax benefit recorded related to this compensation expense was $15 million in 2011, $15 million in 2010 and $11 million in 2009. The unamortized compensation expense related to our stock options was $67 million at December 31, 2011 and is expected to be recognized over a weighted-average period of two years. Our weighted-average Black-Scholes fair value assumptions were as follows:
| 00,000,000 | 00,000,000 | 00,000,000 | 00,000,000 | 00,000,000 | ||||||||||||||||
| Risk-Free | Expected | Expected | Fair Value | |||||||||||||||||
| Interest Rate | Expected Life | Volatility | Dividend Yield | at Grant Date | ||||||||||||||||
2011 | 2.34% | 6 years | 18.92% | 3.72% | $ | 3.84 | ||||||||||||||
2010 | 2.82% | 6 years | 19.86% | 4.14% | $ | 3.69 | ||||||||||||||
2009 | 2.46% | 6 years | 21.36% | 4.90% | $ | 2.68 | ||||||||||||||
74
The risk-free interest rate represents the constant maturity U.S. government treasuries rate with a remaining term equal to the expected life of the options. The expected life is the period over which our employees are expected to hold their options. Volatility reflects historical movements in our stock price for a period commensurate with the expected life of the options. Dividend yield is estimated over the expected life of the options based on our stated dividend policy.
Stock option activity for the year ended December 31, 2011 was:
| 00,000,000 | 00,000,000 | 00,000,000 | 00,000,000 | |||||||
| Average | ||||||||||
| Weighted- | Remaining | Aggregate | ||||||||
| Shares Subject | Average | Contractual | Intrinsic | |||||||
| to Option | Exercise Price | Term | Value | |||||||
Balance at January 1, 2011 | 54,236,161 | $27.71 | ||||||||
Options granted | 16,319,790 | 31.81 | ||||||||
Options exercised | (17,693,101 | ) | 28.00 | |||||||
Options cancelled | (3,263,983 | ) | 29.27 | |||||||
|
| |||||||||
Balance at December 31, 2011 | 49,598,867 | 28.87 | 8 years | $426 million | ||||||
|
| |||||||||
Exercisable at December 31, 2011 | 18,876,266 | 27.21 | 7 years | $189 million | ||||||
|
| |||||||||
In February 2011, as part of our annual equity program, we granted 15.8 million stock options to eligible employees at an exercise price of $31.83. In the aggregate, we granted 16.3 million stock options during 2011 at a weighted-average exercise price of $31.81.
In February 2010, as part of our annual equity program, we granted 15.0 million stock options to eligible employees at an exercise price of $29.15. In the aggregate, we granted 18.1 million stock options during 2010 at a weighted-average exercise price of $29.24, including options issued to Cadbury employees under our annual equity program.
In February 2009, as part of our annual equity program, we granted 16.3 million stock options to eligible employees at an exercise price of $23.64.
The total intrinsic value of options exercised was $98 million in 2011, $92 million in 2010 and $72 million in 2009. Cash received from options exercised was $486 million in 2011, $134 million in 2010 and $79 million in 2009. The actual tax benefit realized for the tax deductions from the option exercises totaled $40 million in 2011, $60 million in 2010 and $52 million in 2009.
Restricted and Deferred Stock:
We may grant shares of restricted or deferred stock to eligible employees, giving them, in most instances, all of the rights of shareholders, except that they may not sell, assign, pledge or otherwise encumber the shares. Shares of restricted and deferred stock are subject to forfeiture if certain employment conditions are not met. Restricted and deferred stock generally vest on the third anniversary of the grant date.
Shares granted in connection with our long-term incentive plan vest based on varying performance, market and service conditions. The unvested shares have no voting rights and do not pay dividends.
The fair value of the restricted and deferred shares at the date of grant is amortized to earnings over the restriction period. We recorded compensation expense related to restricted and deferred stock of $132 million in 2011, $128 million in 2010, and $133 million in 2009. The deferred tax benefit recorded related to this compensation expense was $41 million in 2011, $39 million in 2010, and $44 million in 2009. The unamortized compensation expense related to our restricted and deferred stock was $164 million at December 31, 2011 and is expected to be recognized over a weighted-average period of two years.
Our restricted and deferred stock activity for the year ended December 31, 2011 was:
| 00,000,000 | 00,000,000 | |||||
Weighted- Average | ||||||
| Number | Grant Date Fair Value | |||||
| of Shares | Per Share | |||||
Balance at January 1, 2011 | 14,221,494 | $27.84 | ||||
Granted | 5,070,012 | 31.97 | ||||
Vested | (4,353,760 | ) | 30.35 | |||
Forfeited | (1,320,573 | ) | 29.30 | |||
|
| |||||
Balance at December 31, 2011 | 13,617,173 | 28.43 | ||||
|
| |||||
75
In January 2011, we granted 1.5 million shares of stock in connection with our long-term incentive plan, and the market value per share was $31.62 on the date of grant. In February 2011, as part of our annual equity program, we issued 2.6 million shares of restricted and deferred stock to eligible employees, and the market value per restricted or deferred share was $31.83 on the date of grant. In aggregate, we issued 5.1 million restricted and deferred shares during 2011, including those issued as part of our long-term incentive plan, with a weighted-average market value per share of $31.97.
In January 2010, we granted 1.7 million shares of stock in connection with our long-term incentive plan, and the market value per share was $27.33 on the date of grant. In February 2010, as part of our annual equity program, we issued 2.5 million shares of restricted and deferred stock to eligible employees, and the market value per restricted or deferred share was $29.15 on the date of grant. In aggregate, we issued 5.8 million restricted and deferred shares during 2010, including those issued as part of our long-term incentive plan, with a weighted-average market value per share of $28.82.
In January 2009, we granted 1.5 million shares of stock in connection with our long-term incentive plan, and the market value per share was $27.00 on the date of grant. In February 2009, as part of our annual equity program, we issued 4.1 million shares of restricted and deferred stock to eligible employees, and the market value per restricted or deferred share was $23.64 on the date of grant. In aggregate, we issued 5.8 million restricted and deferred shares during 2009, including those issued as part of our long-term incentive plan, with a weighted-average market value per share of $24.68.
The weighted-average grant date fair value of restricted and deferred stock granted was $162 million, or $31.97 per restricted or deferred share, in 2011; $167 million, or $28.82 per restricted or deferred share, in 2010; and $143 million, or $24.68 per restricted or deferred share, in 2009. The vesting date fair value of restricted and deferred stock was $135 million in 2011, $117 million in 2010, and $153 million in 2009.
Note 11. Benefit Plans
Pension Plans
Obligations and Funded Status:
The projected benefit obligations, plan assets and funded status of our pension plans at December 31, 2011 and 2010 were:
| 00,000,000 | 00,000,000 | 00,000,000 | 00,000,000 | |||||||||||||
| U.S. Plans | Non-U.S. Plans | |||||||||||||||
| 2011 | 2010 | 2011 | 2010 | |||||||||||||
| (in millions) | ||||||||||||||||
Benefit obligation at January 1 | $ | 6,703 | $ | 6,195 | $ | 8,895 | $ | 4,401 | ||||||||
Service cost | 146 | 145 | 170 | 162 | ||||||||||||
Interest cost | 364 | 368 | 458 | 419 | ||||||||||||
Benefits paid | (304 | ) | (322 | ) | (470 | ) | (462 | ) | ||||||||
Settlements paid | (187 | ) | (244 | ) | – | (49 | ) | |||||||||
Curtailment gain | (3 | ) | (23 | ) | (1 | ) | (3 | ) | ||||||||
Actuarial losses | 744 | 368 | 588 | 265 | ||||||||||||
Acquisition | – | 206 | – | 4,375 | ||||||||||||
Currency | – | – | (95 | ) | (164 | ) | ||||||||||
Other | 9 | 10 | 36 | (49 | ) | |||||||||||
|
|
|
|
|
|
|
| |||||||||
Benefit obligation at December 31 | 7,472 | 6,703 | 9,581 | 8,895 | ||||||||||||
|
|
|
|
|
|
|
| |||||||||
Fair value of plan assets at January 1 | 5,800 | 5,496 | 7,453 | 3,397 | ||||||||||||
Actual return on plan assets | (18 | ) | 671 | 284 | 624 | |||||||||||
Contributions | 538 | 85 | 387 | 326 | ||||||||||||
Benefits paid | (304 | ) | (322 | ) | (470 | ) | (462 | ) | ||||||||
Settlements paid | (187 | ) | (244 | ) | – | (49 | ) | |||||||||
Acquisition | – | 114 | – | 3,702 | ||||||||||||
Currency | – | – | (54 | ) | (84 | ) | ||||||||||
Other | – | – | – | (1 | ) | |||||||||||
|
|
|
|
|
|
|
| |||||||||
Fair value of plan assets at December 31 | 5,829 | 5,800 | 7,600 | 7,453 | ||||||||||||
|
|
|
|
|
|
|
| |||||||||
Net pension liability recognized at | $ | (1,643 | ) | $ | (903 | ) | $ | (1,981 | ) | $ | (1,442 | ) | ||||
|
|
|
|
|
|
|
| |||||||||
In 2010, our projected benefit obligation decreased $23 million due to the divestiture of our Frozen Pizza business and its effect on certain of our U.S. pension plans.
76
The accumulated benefit obligation, which represents benefits earned to the measurement date, was $6,971 million at December 31, 2011 and $6,208 million at December 31, 2010 for the U.S. pension plans. The accumulated benefit obligation for the non-U.S. pension plans was $9,207 million at December 31, 2011 and $8,549 million at December 31, 2010.
The combined U.S. and non-U.S. pension plans resulted in a net pension liability of $3,624 million at December 31, 2011 and $2,345 million at December 31, 2010. We recognized these amounts in our consolidated balance sheets at December 31, 2011 and 2010 as follows:
| 00,000,000 | 00,000,000 | |||||||
| 2011 | 2010 | |||||||
| (in millions) | ||||||||
Prepaid pension assets | $ | 31 | $ | 86 | ||||
Other accrued liabilities | (58 | ) | (49 | ) | ||||
Accrued pension costs | (3,597 | ) | (2,382 | ) | ||||
|
|
|
| |||||
| $ | (3,624 | ) | $ | (2,345 | ) | |||
|
|
|
| |||||
Certain of our U.S. and non-U.S. plans are underfunded and have accumulated benefit obligations in excess of plan assets. For these plans, the projected benefit obligations, accumulated benefit obligations and the fair value of plan assets at December 31, 2011 and 2010 were:
| 00,000,000 | 00,000,000 | 00,000,000 | 00,000,000 | |||||||||||||
| U.S. Plans | Non-U.S. Plans | |||||||||||||||
| 2011 | 2010 | 2011 | 2010 | |||||||||||||
| (in millions) | ||||||||||||||||
Projected benefit obligation | $ | 7,472 | $ | 5,097 | $ | 9,314 | $ | 7,934 | ||||||||
Accumulated benefit obligation | 6,971 | 4,627 | 8,962 | 7,668 | ||||||||||||
Fair value of plan assets | 5,829 | 4,156 | 7,313 | 6,471 | ||||||||||||
We used the following weighted-average assumptions to determine our benefit obligations under the pension plans at December 31:
| 00,000,000 | 00,000,000 | 00,000,000 | 00,000,000 | |||||||||||||
| U.S. Plans | Non-U.S. Plans | |||||||||||||||
| 2011 | 2010 | 2011 | 2010 | |||||||||||||
Discount rate | 4.85 | % | 5.53 | % | 4.62 | % | 5.11 | % | ||||||||
Expected rate of return on | 8.00 | % | 7.95 | % | 6.47 | % | 6.77 | % | ||||||||
Rate of compensation increase | 4.00 | % | 4.00 | % | 3.58 | % | 3.68 | % | ||||||||
Year-end discount rates for our U.S. and Canadian plans were developed from a model portfolio of high quality, fixed-income debt instruments with durations that match the expected future cash flows of the benefit obligations. Year-end discount rates for our non-U.S. plans (other than Canadian plans) were developed from local bond indices that match local benefit obligations as closely as possible. Changes in our discount rates were primarily the result of changes in bond yields year-over-year. We determine our expected rate of return on plan assets from the plan assets’ historical long-term investment performance, current asset allocation and estimates of future long-term returns by asset class.
Components of Net Pension Cost:
Net pension cost consisted of the following for the years ended December 31, 2011, 2010, and 2009:
| 00,000,000 | 00,000,000 | 00,000,000 | 00,000,000 | 00,000,000 | 00,000,000 | |||||||||||||||||||
| U.S. Plans | Non- U.S. Plans | |||||||||||||||||||||||
| 2011 | 2010 | 2009 | 2011 | 2010 | 2009 | |||||||||||||||||||
| (in millions) | ||||||||||||||||||||||||
Service cost | $ | 146 | $ | 145 | $ | 152 | $ | 170 | $ | 162 | $ | 67 | ||||||||||||
Interest cost | 364 | 368 | 369 | 458 | 419 | 215 | ||||||||||||||||||
Expected return on plan assets | (496 | ) | (490 | ) | (486 | ) | (536 | ) | (467 | ) | (242 | ) | ||||||||||||
Amortization: | ||||||||||||||||||||||||
Net loss from experience differences | 225 | 170 | 160 | 101 | 77 | 23 | ||||||||||||||||||
Prior service cost | 7 | 6 | 6 | 2 | 7 | 6 | ||||||||||||||||||
Other expenses | 105 | 123 | 112 | 14 | 11 | 8 | ||||||||||||||||||
|
|
|
|
|
|
|
|
|
|
|
| |||||||||||||
Net pension cost | $ | 351 | $ | 322 | $ | 313 | $ | 209 | $ | 209 | $ | 77 | ||||||||||||
|
|
|
|
|
|
|
|
|
|
|
| |||||||||||||
77
A significant portion of the 2010 increase in non-U.S. net periodic pension cost related to the Cadbury acquisition. The following costs are included within other expenses above. Severance payments related to our cost savings initiatives and restructuring program, and retired employees who elected lump-sum payments resulted in settlement losses for our U.S. plans of $105 million in 2011, $118 million in 2010, and $107 million in 2009. In addition, we incurred a $5 million curtailment charge in 2010 related to the divestiture of our Frozen Pizza business. Non-U.S. plant closures and early retirement benefits resulted in curtailment and settlement losses of $8 million in 2011, $11 million in 2010, and $8 million in 2009. In addition, in 2011 we incurred $6 million in special termination benefit costs in the non-U.S. plans related to the Cadbury integration.
For the U.S. plans, we determine the expected return on plan assets component of net periodic benefit cost using a calculated market return value that recognizes the cost over a four year period. For our non-U.S. plans, we utilize a similar approach with varying cost recognition periods for some plans, and with others, we determine the expected return on plan assets based on asset fair values as of the measurement date.
As of December 31, 2011, for the combined U.S. and non-U.S. pension plans, we expected to amortize from accumulated other comprehensive earnings / (losses) into net periodic pension cost during 2012:
an estimated $475 million of net loss from experience differences; and
an estimated $9 million of prior service cost.
We used the following weighted-average assumptions to determine our net pension cost for the years ended December 31:
| 00,000,000 | 00,000,000 | 00,000,000 | 00,000,000 | 00,000,000 | 00,000,000 | |||||||||||||||||||
| U.S. Plans | Non-U.S. Plans | |||||||||||||||||||||||
| 2011 | 2010 | 2009 | 2011 | 2010 | 2009 | |||||||||||||||||||
Discount rate | 5.53 | % | 5.85 | % | 6.10 | % | 5.11 | % | 5.21 | % | 6.41 | % | ||||||||||||
Expected rate of return | 7.95 | % | 7.99 | % | 8.00 | % | 6.77 | % | 6.68 | % | 7.25 | % | ||||||||||||
Rate of compensation | 4.00 | % | 3.98 | % | 4.00 | % | 3.68 | % | 3.59 | % | 3.09 | % | ||||||||||||
Plan Assets:
The fair value of pension plan assets at December 31, 2011 was determined using the following fair value measurements:
| 00,000,000,000 | 00,000,000,000 | 00,000,000,000 | 00,000,000,000 | |||||||||||||
| Total | Quoted Prices in Active Markets for Identical Assets | Significant Other Observable Inputs | Significant Unobservable Inputs | |||||||||||||
| Fair Value | (Level 1) | (Level 2) | (Level 3) | |||||||||||||
| Asset Category | (in millions) | |||||||||||||||
U.S. equity securities | $ | 272 | $ | 266 | $ | 6 | $ | – | ||||||||
Non-U.S. equity securities | 1,666 | 1,664 | 2 | – | ||||||||||||
Pooled funds-equity securities | 4,755 | 485 | 4,270 | – | ||||||||||||
|
|
|
|
|
|
|
| |||||||||
Total equity securities | 6,693 | 2,415 | 4,278 | – | ||||||||||||
Government bonds | 1,170 | 571 | 599 | – | ||||||||||||
Pooled funds-fixed-income securities | 1,515 | 230 | 1,278 | 7 | ||||||||||||
Corporate bonds and other fixed-income | 3,019 | 100 | 2,161 | 758 | ||||||||||||
|
|
|
|
|
|
|
| |||||||||
Total fixed-income securities | 5,704 | 901 | 4,038 | 765 | ||||||||||||
Real estate | 351 | 91 | 5 | 255 | ||||||||||||
Other | 529 | 119 | 19 | 391 | ||||||||||||
|
|
|
|
|
|
|
| |||||||||
Total | $ | 13,277 | $ | 3,526 | $ | 8,340 | $ | 1,411 | ||||||||
|
|
|
|
|
|
|
| |||||||||
78
The fair value of pension plan assets at December 31, 2010 was determined using the following fair value measurements:
| 00,000,000,000 | 00,000,000,000 | 00,000,000,000 | 00,000,000,000 | |||||||||||||
| Total | Quoted Prices in Active Markets for Identical Assets | Significant Other Observable Inputs | Significant Unobservable Inputs | |||||||||||||
| Fair Value | (Level 1) | (Level 2) | (Level 3) | |||||||||||||
| Asset Category | (in millions) | |||||||||||||||
U.S. equity securities | $ | 280 | $ | 276 | $ | 4 | $ | – | ||||||||
Non-U.S. equity securities | 1,915 | 1,912 | 3 | – | ||||||||||||
Pooled funds-equity securities | 4,971 | 281 | 4,690 | – | ||||||||||||
|
|
|
|
|
|
|
| |||||||||
Total equity securities | 7,166 | 2,469 | 4,697 | – | ||||||||||||
Government bonds | 1,405 | 731 | 674 | – | ||||||||||||
Pooled funds-fixed-income securities | 1,893 | 52 | 1,841 | – | ||||||||||||
Corporate bonds and other fixed-income | 1,749 | 5 | 993 | 751 | ||||||||||||
|
|
|
|
|
|
|
| |||||||||
Total fixed-income securities | 5,047 | 788 | 3,508 | 751 | ||||||||||||
Real estate | 343 | 86 | 7 | 250 | ||||||||||||
Other | 542 | 155 | 11 | 376 | ||||||||||||
|
|
|
|
|
|
|
| |||||||||
Total | $ | 13,098 | $ | 3,498 | $ | 8,223 | $ | 1,377 | ||||||||
|
|
|
|
|
|
|
| |||||||||
We excluded plan assets of $152 million at December 31, 2011 and $155 million at December 31, 2010 from the above tables related to certain insurance contracts as they are reported at contract value, in accordance with authoritative guidance.
Fair value measurements:
Level 1 – includes primarily U.S and non-U.S. equity securities and government bonds valued using quoted prices in active markets.
Level 2 – includes primarily pooled funds, including assets in real estate pooled funds, valued using net asset values of participation units held in common collective trusts, as reported by the managers of the trusts and as supported by the unit prices of actual purchase and sale transactions. Level 2 plan assets also primarily include corporate bonds and other fixed-income securities, valued using independent observable market inputs, such as matrix pricing, yield curves and indices.
Level 3 – includes investments valued using unobservable inputs that reflect the plans’ assumptions that market participants would use in pricing the assets, based on the best information available.
Fair value estimates for pooled funds are calculated by the investment advisor when reliable quotations or pricing services are not readily available for certain underlying securities. The estimated value is based on either cost, or last sale price for most of the securities valued in this fashion.
Fair value estimates for limited partnership and private equity investments are calculated by the general partners using the market approach to estimate the fair value of private investments. The market approach utilizes prices and other relevant information generated by market transactions, type of security, degree of liquidity, restrictions on the disposition, latest round of financing data, company financial statements, relevant valuation multiples and discounted cash flow analyses.
Fair value estimates for real estate investments are calculated by the investment managers using the present value of future cash flows expected to be received from the investments, based on valuation methodologies such as appraisals, local market conditions, and current and projected operating performance.
Fair value estimates for investments in hedge fund-of-funds are calculated by the investment managers using the net asset value per share of the investment as reported by the money managers of the underlying funds.
Fair value estimates for insurance contracts are calculated based on the future stream of benefit payments discounted using prevailing interest rates based on the valuation date.
79
Changes in our Level 3 plan assets, which are recorded in other comprehensive earnings / (losses), for the year ended December 31, 2011 included:
| 00,000,000 | 00,000,000 | 00,000,000 | 00,000,000 | 00,000,000 | 00,000,000 | |||||||||||||||||||
| January 1, 2011 Balance | Net Realized and Unrealized Gains/(Losses) | Net Purchases, Issuances and Settlements | Net Transfers Into/(Out of) Level 3 | Currency Impact | December 31, 2011 Balance | |||||||||||||||||||
Asset Category | (in millions) | |||||||||||||||||||||||
Pooled funds fixed-income securities | $ | – | $ | – | $ | – | $ | 8 | $ | (1 | ) | $ | 7 | |||||||||||
Corporate bond and other fixed-income securities | 751 | 105 | (95 | ) | 1 | (4 | ) | 758 | ||||||||||||||||
Real Estate | 250 | (15 | ) | 19 | – | 1 | 255 | |||||||||||||||||
Other | 376 | 10 | 7 | – | (2 | ) | 391 | |||||||||||||||||
|
|
|
|
|
|
|
|
|
|
|
| |||||||||||||
Total Level 3 investments | $ | 1,377 | $ | 100 | $ | (69 | ) | $ | 9 | $ | (6 | ) | $ | 1,411 | ||||||||||
The increases in Level 3 pension plan investments from December 31, 2010 were primarily due to net realized and unrealized gains, partially offset by net purchases, issuances and settlements.
Changes in our Level 3 assets, which are recorded in other comprehensive earnings / (losses), for the year ended December 31, 2010 included:
| 00,000,000 | 00,000,000 | 00,000,000 | 00,000,000 | 00,000,000 | 00,000,000 | |||||||||||||||||||
| January 1, 2010 Balance | Net Realized and Unrealized Gains/(Losses) | Net Purchases, Issuances and Settlements | Net Transfers Into/(Out of) Level 3 | Currency Impact | December 31, 2010 Balance | |||||||||||||||||||
Asset Category | (in millions) | |||||||||||||||||||||||
Non-U.S. equity securities | $ | 1 | $ | – | $ | (1 | ) | $ | – | $ | – | $ | – | |||||||||||
Corporate bond and other fixed-income securities | 2 | 23 | (44 | ) | 789 | (19 | ) | 751 | ||||||||||||||||
Real Estate | – | 34 | (1 | ) | 220 | (3 | ) | 250 | ||||||||||||||||
Other | 2 | 29 | 12 | 341 | (8 | ) | 376 | |||||||||||||||||
|
|
|
|
|
|
|
|
|
|
|
| |||||||||||||
Total Level 3 investments | $ | 5 | $ | 86 | $ | (34 | ) | $ | 1,350 | $ | (30 | ) | $ | 1,377 | ||||||||||
The increases in Level 3 pension plan investments during 2010 were due to our Cadbury acquisition and the types of investments we acquired in those plans.
The percentage of fair value of pension plan assets at December 31, 2011 and 2010 was:
| 00,000,000 | 00,000,000 | 00,000,000 | 00,000,000 | |||||||||||||
| U.S. Plans | Non–U.S. Plans | |||||||||||||||
Asset Category | 2011 | 2010 | 2011 | 2010 | ||||||||||||
Equity securities | 66 | % | 69 | % | 38 | % | 41 | % | ||||||||
Fixed-income securities | 33 | % | 31 | % | 51 | % | 47 | % | ||||||||
Real estate | 1 | % | – | 4 | % | 5 | % | |||||||||
Other | – | – | 7 | % | 7 | % | ||||||||||
|
|
|
|
|
|
|
| |||||||||
Total | 100 | % | 100 | % | 100 | % | 100 | % | ||||||||
|
|
|
|
|
|
|
| |||||||||
Our investment strategy is based on our expectation that equity securities will outperform fixed-income securities over the long term. Due to the nature and timing of our expected pension liabilities, approximately 70% of our U.S. plan assets are in equity securities and approximately 30% are in fixed-income securities. The strategy uses indexed U.S. equity securities, actively managed and indexed international equity securities and actively managed and indexed U.S. investment grade fixed-income securities (which constitute 95% or more of fixed-income securities) with lesser allocations to high yield fixed-income securities.
For the plans outside the U.S., the investment strategy is subject to local regulations and the asset / liability profiles of the plans in each individual country. These specific circumstances result in a level of equity exposure that is typically less than the U.S. plans. In aggregate, the asset allocation targets of our non-U.S. plans are broadly characterized as a mix of 40% equity securities, 46% fixed-income securities and 14% real estate / other. The other asset balance of our non-U.S. plans at December 31, 2011 primarily related to $387 million in hedge funds and private equity investments and $119 million in cash accounts held across various investment managers.
We attempt to maintain our target asset allocation by rebalancing between asset classes as we make contributions and monthly benefit payments.
80
Employer Contributions:
In 2011, we contributed $538 million to our U.S. pension plans and $361 million to our non-U.S. pension plans. In addition, employees contributed $26 million to our non-U.S. plans. Of our 2011 pension contributions, approximately $495 million was voluntary. We make contributions to our U.S. and non-U.S. pension plans, primarily, to the extent that they are tax deductible and do not generate an excise tax liability. For our U.S. qualified pension plans, in 2012, we are currently only required to make a nominal cash contribution to our U.S. pension plans under the Pension Protection Act of 2006. Based on current tax law, we estimate that 2012 pension contributions would be approximately $55 million to our U.S. plans and approximately $425 million to our non-U.S. plans. Of the total 2012 pension contributions, none is expected to be voluntary. Our actual contributions may be different due to many factors, including changes in tax and other benefit laws; or significant differences between expected and actual pension asset performance or interest rates; or other factors.
Future Benefit Payments:
The estimated future benefit payments from our pension plans at December 31, 2011 were:
| U.S. Plans | Non-U.S. Plans | |||||||
| (in millions) | ||||||||
2012 | $ | 467 | $ | 464 | ||||
2013 | 454 | 469 | ||||||
2014 | 444 | 474 | ||||||
2015 | 462 | 489 | ||||||
2016 | 483 | 505 | ||||||
2017-2021 | 2,797 | 2,696 | ||||||
Multiemployer Pension Plans:
We made contributions to multiemployer pension plans of $32 million in 2011, $30 million in 2010, and $29 million in 2009. These plans provide pension benefits to retirees under certain collective bargaining agreements. The following is the only individually significant multiemployer plan we participate in as of December 31, 2011:
| 00,000,000 | 00,000,000 | 00,000,000 | 00,000,000 | 00,000,000 | ||||||||||||||||
Pension Fund | EIN / Pension Plan Number | Pension Protection Act Zone Status (1) | FIP / RP Status Pending / Implemented | Surcharge Imposed | Expiration Date of Collective- Bargaining Agreement | |||||||||||||||
Bakery and Confectionery Union and Industry International Pension Fund | 526118572 | Green | No | No | 2/29/2012 | |||||||||||||||
Our contributions exceeded 5% of total contributions to the Bakery and Confectionery Union and Industry International Pension Fund (“Fund”) for fiscal years 2011, 2010 and 2009. Our contributions to the Fund were $24 million in 2011, $24 million in 2010 and $23 million in 2009. We expect contributions to the Fund to be approximately $25 million for each of the next five years. On January 11, 2012, Hostess Brands, a significant contributor to the Fund, announced that it had filed voluntary petitions for reorganization under Chapter 11 of the U.S. Bankruptcy Code. They also stated that they plan to modify their labor agreements in order to emerge from Chapter 11 with a new cost structure. It is not yet clear what impact these actions will have on the amount of their Fund withdrawal liability. As such, the effect of the bankruptcy on our future contributions or withdrawal liability is not yet known and cannot be reasonably estimated as of December 31, 2011. Our contributions to other multiemployer pension plans that were not individually significant were $8 million in 2011, $6 million in 2010 and $6 million in 2009.
Other Costs:
We sponsor and contribute to employee savings plans. These plans cover eligible salaried, non-union and union employees. Our contributions and costs are determined by the matching of employee contributions, as defined by the plans. Amounts charged to expense for defined contribution plans totaled $114 million in 2011, $104 million in 2010, and $94 million in 2009.
81
Postretirement Benefit Plans
Obligations:
Our postretirement health care plans are not funded. The changes in and the amount of the accrued benefit obligation at December 31, 2011 and 2010 were:
| 00,000,000 | 00,000,000 | |||||||
| 2011 | 2010 | |||||||
| (in millions) | ||||||||
Accrued benefit obligation at January 1 | $ | 3,263 | $ | 3,032 | ||||
Service cost | 36 | 39 | ||||||
Interest cost | 165 | 172 | ||||||
Benefits paid | (221 | ) | (213 | ) | ||||
Plan amendments | (5 | ) | (7 | ) | ||||
Currency | (3 | ) | 10 | |||||
Assumption changes | 254 | 147 | ||||||
Actuarial (gains) / losses | (36 | ) | 42 | |||||
Acquisition | – | 41 | ||||||
|
|
|
| |||||
Accrued benefit obligation at December 31 | $ | 3,453 | $ | 3,263 | ||||
|
|
|
| |||||
The current portion of our accrued postretirement benefit obligation of $215 million at December 31, 2011 and $217 million at December 31, 2010 was included in other accrued liabilities.
We used the following weighted-average assumptions to determine our postretirement benefit obligations at December 31:
| 00,000,000 | 00,000,000 | 00,000,000 | 00,000,000 | |||||||||||||
| U.S. Plans | Non-U.S. Plans | |||||||||||||||
| 2011 | 2010 | 2011 | 2010 | |||||||||||||
Discount rate | 4.70 | % | 5.30 | % | 4.29 | % | 5.02 | % | ||||||||
Health care cost trend rate | 7.00 | % | 7.50 | % | 7.42 | % | 8.83 | % | ||||||||
Ultimate trend rate | 5.00 | % | 5.00 | % | 5.53 | % | 6.00 | % | ||||||||
Year that the rate reaches | 2016 | 2016 | 2016 | 2017 | ||||||||||||
Year-end discount rates for our U.S. and Canadian plans were developed from a model portfolio of high quality, fixed-income debt instruments with durations that match the expected future cash flows of the benefit obligations. Year-end discount rates for our non-U.S. plans (other than Canadian plans) were developed from local bond indices that match local benefit obligations as closely as possible. Changes in our discount rates were primarily the result of changes in bond yields year-over-year. Our expected health care cost trend rate is based on historical costs.
Assumed health care cost trend rates have a significant impact on the amounts reported for the health care plans. A one-percentage-point change in assumed health care cost trend rates would have the following effects as of December 31, 2011:
| One-Percentage-Point | ||||||||
| Increase | Decrease | |||||||
Effect on total of service and interest cost | 12.8 | % | (10.5 | %) | ||||
Effect on postretirement benefit obligation | 10.7 | % | (9.0 | %) | ||||
Components of Net Postretirement Health Care Costs:
Net postretirement health care costs consisted of the following for the years ended December 31, 2011, 2010 and 2009:
| 00,000,000 | 00,000,000 | 00,000,000 | ||||||||||
| 2011 | 2010 | 2009 | ||||||||||
| (in millions) | ||||||||||||
Service cost | $ | 36 | $ | 39 | $ | 35 | ||||||
Interest cost | 165 | 172 | 174 | |||||||||
Amortization: | ||||||||||||
Net loss from experience differences | 60 | 55 | 44 | |||||||||
Prior service credit | (32 | ) | (32 | ) | (32 | ) | ||||||
|
|
|
|
|
| |||||||
Net postretirement health care costs | $ | 229 | $ | 234 | $ | 221 | ||||||
|
|
|
|
|
| |||||||
82
As of December 31, 2011, we expected to amortize from accumulated other comprehensive earnings / (losses) into net postretirement health care costs during 2012:
an estimated $77 million of net loss from experience differences; and
an estimated $32 million of prior service credit.
We used the following weighted-average assumptions to determine our net postretirement cost for the years ended December 31:
| 00,000,000 | 00,000,000 | 00,000,000 | 00,000,000 | 00,000,000 | 00,000,000 | |||||||||||||||||||
| U.S. Plans | Non-U.S. Plans | |||||||||||||||||||||||
| 2011 | 2010 | 2009 | 2011 | 2010 | 2009 | |||||||||||||||||||
Discount rate | 5.30 | % | 5.70 | % | 6.10 | % | 5.02 | % | 5.28 | % | 7.60 | % | ||||||||||||
Health care cost trend rate | 7.50 | % | 7.00 | % | 7.00 | % | 8.83 | % | 8.79 | % | 9.00 | % | ||||||||||||
Future Benefit Payments:
Our estimated future benefit payments for our postretirement health care plans at December 31, 2011 were:
| 00,000,000 | 00,000,000 | |||||||
| U.S. Plans | Non-U.S. Plans | |||||||
| (in millions) | ||||||||
2012 | $ | 210 | $ | 12 | ||||
2013 | 211 | 12 | ||||||
2014 | 212 | 12 | ||||||
2015 | 212 | 13 | ||||||
2016 | 210 | 13 | ||||||
2017-2021 | 1,035 | 73 | ||||||
Other Costs:
We made contributions to multiemployer medical plans totaling $36 million in 2011, $35 million in 2010, and $35 million in 2009. These plans provide medical benefits to active employees and retirees under certain collective bargaining agreements.
Postemployment Benefit Plans
Obligations:
Our postemployment plans are primarily not funded. The changes in and the amount of the accrued benefit obligation at December 31, 2011 and 2010 were:
| 00,000,000 | 00,000,000 | |||||||
| 2011 | 2010 | |||||||
| (in millions) | ||||||||
Accrued benefit obligation at January 1 | $ | 140 | $ | 116 | ||||
Service cost | 11 | 9 | ||||||
Interest cost | 9 | 10 | ||||||
Benefits paid | (40 | ) | (24 | ) | ||||
Assumption changes | 4 | (8 | ) | |||||
Actuarial losses / (gains) | 13 | (12 | ) | |||||
Acquisition | – | 49 | ||||||
Other | 29 | – | ||||||
|
|
|
| |||||
Accrued benefit obligation at December 31 | $ | 166 | $ | 140 | ||||
|
|
|
| |||||
In 2011, we recorded a Canadian postemployment plan, which was partially funded, with a net liability balance of approximately $29 million. The liability was recorded in other. The accrued benefit obligation was determined using a weighted-average discount rate of 5.2% in 2011 and 6.3% in 2010, an assumed ultimate annual turnover rate of 0.5% in 2011 and 2010, assumed compensation cost increases of 4.0% in 2011 and 2010, and assumed benefits as defined in the respective plans.
Postemployment costs arising from actions that offer employees benefits in excess of those specified in the respective plans are charged to expense when incurred.
83
Components of Net Postemployment Costs:
Net postemployment costs consisted of the following for the years ended December 31, 2011, 2010 and 2009:
| 00,000,000 | 00,000,000 | 00,000,000 | ||||||||||
| 2011 | 2010 | 2009 | ||||||||||
| (in millions) | ||||||||||||
Service cost | $ | 11 | $ | 9 | $ | 8 | ||||||
Interest cost | 9 | 10 | 8 | |||||||||
Amortization of net (gains) / losses | (2 | ) | (2 | ) | 2 | |||||||
Other | 33 | – | – | |||||||||
|
|
|
|
|
| |||||||
Net postemployment costs | $ | 51 | $ | 17 | $ | 18 | ||||||
|
|
|
|
|
| |||||||
Other postemployment costs primarily relate to the establishment of the partially funded Canadian postemployment plan.
As of December 31, 2011, the estimated net gain for the postemployment benefit plans that we expected to amortize from accumulated other comprehensive earnings / (losses) into net postemployment costs during 2012 was insignificant.
Note 12.9. Financial Instruments
Fair Value of Derivative InstrumentsInstruments::
TheDerivative instruments were recorded at fair values of derivative instruments recordedvalue in the consolidated balance sheetsheets as of December 31, 2012 and 2011 and 2010 were:as follows:
| 00,000,000 | 00,000,000 | 00,000,000 | 00,000,000 | |||||||||||||||||||||||||||||
| 2011 | 2010 | 2012 | 2011 | |||||||||||||||||||||||||||||
| Asset Derivatives | Liability Derivatives | Asset Derivatives | Liability Derivatives | Asset | Liability | Asset | Liability | |||||||||||||||||||||||||
| (in millions) | (in millions) | Derivatives | Derivatives | Derivatives | Derivatives | |||||||||||||||||||||||||||
| (in millions) | (in millions) | |||||||||||||||||||||||||||||||
Derivatives accounted for as hedges: | ||||||||||||||||||||||||||||||||
Derivatives designated as hedging instruments: | ||||||||||||||||||||||||||||||||
Foreign exchange contracts | $ | 76 | $ | 5 | $ | 24 | $ | 115 | $ | 6 | $ | 10 | $ | 76 | $ | 5 | ||||||||||||||||
Commodity contracts | 14 | 27 | 74 | 5 | 3 | 34 | 14 | 27 | ||||||||||||||||||||||||
Interest rate contracts | 2 | 519 | 58 | 13 | 16 | – | 2 | 519 | ||||||||||||||||||||||||
|
|
|
|
|
|
|
| |||||||||||||||||||||||||
| $ | 92 | $ | 551 | $ | 156 | $ | 133 | $ | 25 | $ | 44 | $ | 92 | $ | 551 | |||||||||||||||||
|
|
|
|
|
|
|
| |||||||||||||||||||||||||
Derivatives not accounted for as hedges: | ||||||||||||||||||||||||||||||||
Derivatives not designated as hedging instruments: | ||||||||||||||||||||||||||||||||
Foreign exchange contracts | $ | 13 | $ | 5 | $ | 21 | $ | 48 | $ | 16 | $ | 33 | $ | 13 | $ | 5 | ||||||||||||||||
Commodity contracts | 392 | 372 | 202 | 114 | 106 | 103 | 392 | 372 | ||||||||||||||||||||||||
Interest rate contracts | 86 | 51 | 59 | 21 | 93 | 61 | 86 | 51 | ||||||||||||||||||||||||
|
|
|
|
|
|
|
| |||||||||||||||||||||||||
| $ | 491 | $ | 428 | $ | 282 | $ | 183 | $ | 215 | $ | 197 | $ | 491 | $ | 428 | |||||||||||||||||
|
|
|
|
|
|
|
| |||||||||||||||||||||||||
Total fair value | $ | 583 | $ | 979 | $ | 438 | $ | 316 | $ | 240 | $ | 241 | $ | 583 | $ | 979 | ||||||||||||||||
|
|
|
|
|
|
|
| |||||||||||||||||||||||||
WeDuring 2012 and 2011, derivatives designated as hedging instruments include cash flow and fair value hedges and derivatives not designated include economic hedges. Non-U.S. debt designated as a hedge of our net investments in foreign operations is not reflected in the table above, but is included in long-term debt summarized in Note 8,Debt and Borrowing Arrangements. The fair value of our asset derivatives are recorded within other current assets and the fair value of our liability derivatives are recorded within other current liabilities. The decrease in derivatives recorded as assets or liabilities as of December 31, 2012 was primarily related to the divestiture of Kraft Foods Group and Spin-Off financing plans.
The fair valuesvalue (asset / (liability)) of our derivative instruments at December 31, 2012 were determined using:
| Total Fair Value of Net Asset / (Liability) | Quoted Prices in Active Markets for Identical Assets (Level 1) | Significant Other Observable Inputs (Level 2) | Significant Unobservable Inputs (Level 3) | |||||||||||||
| (in millions) | ||||||||||||||||
Foreign exchange contracts | $ | (21 | ) | $ | – | $ | (21 | ) | $ | – | ||||||
Commodity contracts | (28 | ) | (53 | ) | 25 | – | ||||||||||
Interest rate contracts | 48 | – | 48 | – | ||||||||||||
|
|
|
|
|
|
|
| |||||||||
Total derivatives | $ | (1 | ) | $ | (53 | ) | $ | 52 | $ | – | ||||||
|
|
|
|
|
|
|
| |||||||||
The fair value (asset / (liability)) of our derivative instruments at December 31, 2011 were determined using:
| 00,000,000 | 00,000,000 | 00,000,000 | 00,000,000 | |||||||||||||
| Total Fair Value of Net Asset / (Liability) | Quoted Prices in Active Markets for Identical Assets (Level 1) | Significant Other Observable Inputs (Level 2) | Significant Unobservable Inputs (Level 3) | |||||||||||||
| (in millions) | ||||||||||||||||
Foreign exchange contracts | $ | 79 | $ | – | $ | 79 | $ | – | ||||||||
Commodity contracts | 7 | (41 | ) | 48 | – | |||||||||||
Interest rate contracts | (482 | ) | – | (482 | ) | – | ||||||||||
|
|
|
|
|
|
|
| |||||||||
Total derivatives | $ | (396 | ) | $ | (41 | ) | $ | (355 | ) | $ | – | |||||
|
|
|
|
|
|
|
| |||||||||
84
The fair values of our derivative instruments at December 31, 2010 were determined using:
| 00,000,000 | 00,000,000 | 00,000,000 | 00,000,000 | |||||||||||||||||||||||||||||
| Total Fair Value of Net Asset / (Liability) | Quoted Prices in Active Markets for Identical Assets (Level 1) | Significant Other Observable Inputs (Level 2) | Significant Unobservable Inputs (Level 3) | Total Fair Value of Net Asset / (Liability) | Quoted Prices in Active Markets for Identical Assets (Level 1) | Significant Other Observable Inputs (Level 2) | Significant Unobservable Inputs (Level 3) | |||||||||||||||||||||||||
| (in millions) | (in millions) | |||||||||||||||||||||||||||||||
Foreign exchange contracts | $ | (118 | ) | $ | – | $ | (118 | ) | $ | – | $ | 79 | $ | – | $ | 79 | $ | – | ||||||||||||||
Commodity contracts | 157 | 129 | 28 | – | 7 | (41 | ) | 48 | – | |||||||||||||||||||||||
Interest rate contracts | 83 | – | 83 | – | (482 | ) | – | (482 | ) | – | ||||||||||||||||||||||
|
|
|
|
|
|
|
| |||||||||||||||||||||||||
Total derivatives | $ | 122 | $ | 129 | $ | (7 | ) | $ | – | $ | (396 | ) | $ | (41 | ) | $ | (355 | ) | $ | – | ||||||||||||
|
|
|
|
|
|
|
| |||||||||||||||||||||||||
Level 2 financial assets and liabilities consist of commodity forwards and options;options, foreign exchange forwards and options, currency swaps and options; and interest rate swaps. Commodity derivatives are valued using an income approach based on the observable market commodity index prices less the contract rate multiplied by the notional amount or based on pricing models which rely on market observable inputs such as commodity prices. Foreign currency contracts are valued using an income approach based on observable market forward rates less the contract rate multiplied by the notional amount. Our calculation of the fair value of interest rate swaps is derived from a discounted cash flow analysis based on the terms of the contract and the observable market interest rate curve. Our calculation of the fair value of financial instruments takes into consideration the risk of nonperformance, including counterparty credit risk.
Derivative Volume:
The net notional values of our derivative instruments as of December 31, 20112012 and 20102011 were:
| 00,000,000 | 00,000,000 | |||||||||||||||
| 2011 | 2010 | 2012 | 2011 | |||||||||||||
| (in millions) | (in millions) | |||||||||||||||
Foreign exchange contracts: | ||||||||||||||||
Intercompany loans and forecasted | $ | 1,982 | $ | 2,183 | $ | 3,743 | $ | 1,982 | ||||||||
Forecasted transactions | 1,181 | 1,946 | 1,663 | 1,181 | ||||||||||||
Commodity contracts | 1,287 | 630 | 620 | 1,287 | ||||||||||||
Interest rate contracts | 4,872 | 5,167 | 2,259 | 4,872 | ||||||||||||
Net investment hedge – euro notes | 3,694 | 3,814 | 1,121 | 3,694 | ||||||||||||
Net investment hedge – pound sterling notes | 1,010 | 1,015 | 1,057 | 1,010 | ||||||||||||
Cash Flow Hedges:
Cash flow hedge activity, net of income taxes, within accumulated other comprehensive earnings / (losses) included:
| 00,000,000 | 00,000,000 | 00,000,000 | ||||||||||||||||||||||
| 2011 | 2010 | 2009 | 2012 | 2011 | 2010 | |||||||||||||||||||
| (in millions) | (in millions) | |||||||||||||||||||||||
Accumulated gain / (loss) at January 1 | $ | 79 | $ | 101 | $ | (23 | ) | $ | (297 | ) | $ | 79 | $ | 101 | ||||||||||
Transfer of realized (gains) / losses in | 72 | (25 | ) | 111 | 312 | 118 | (25 | ) | ||||||||||||||||
Unrealized gain / (loss) in fair value | (448 | ) | 3 | 13 | (75 | ) | (444 | ) | (32 | ) | ||||||||||||||
Discontinued operations | (134 | ) | (50 | ) | 35 | |||||||||||||||||||
Impact of Spin-Off | 156 | – | – | |||||||||||||||||||||
|
|
|
|
|
| |||||||||||||||||||
Accumulated gain / (loss) at December 31 | $ | (297 | ) | $ | 79 | $ | 101 | $ | (38 | ) | $ | (297 | ) | $ | 79 | |||||||||
|
|
|
|
|
| |||||||||||||||||||
The gains / (losses) recognized in other comprehensive income / (loss) were:
| 00,000,000 | 00,000,000 | 00,000,000 | ||||||||||
| 2011 | 2010 | 2009 | ||||||||||
| (in millions) | ||||||||||||
Foreign exchange contracts – | $ | 1 | $ | 2 | $ | (12 | ) | |||||
Foreign exchange contracts – | 8 | 17 | (40 | ) | ||||||||
Commodity contracts | (6 | ) | 74 | (27 | ) | |||||||
Interest rate contracts | (451 | ) | (90 | ) | 92 | |||||||
|
|
|
|
|
| |||||||
Total | $ | (448 | ) | $ | 3 | $ | 13 | |||||
|
|
|
|
|
| |||||||
85
TheAfter-tax gains / (losses) reclassified from accumulated other comprehensive earnings / (losses) into net earnings from continuing operations were:
| 00,000,000 | 00,000,000 | 00,000,000 | ||||||||||||||||||||||
| 2011 | 2010 | 2009 | 2012 | 2011 | 2010 | |||||||||||||||||||
| (in millions) | (in millions) | |||||||||||||||||||||||
Foreign exchange contracts – | $ | 2 | $ | 10 | $ | – | $ | – | $ | 2 | $ | 10 | ||||||||||||
Foreign exchange contracts – | (44 | ) | 1 | 27 | 58 | (38 | ) | 5 | ||||||||||||||||
Commodity contracts | 71 | 15 | (138 | ) | (10 | ) | 19 | 11 | ||||||||||||||||
Interest rate contracts | (101 | ) | (1 | ) | – | (360 | ) | (101 | ) | (1 | ) | |||||||||||||
|
|
|
|
|
| |||||||||||||||||||
Total | $ | (72 | ) | $ | 25 | $ | (111 | ) | $ | (312 | ) | $ | (118 | ) | $ | 25 | ||||||||
|
|
|
|
|
| |||||||||||||||||||
After-tax gains / (losses) recognized in other comprehensive earnings / (losses) from continuing operations were:
| 2012 | 2011 | 2010 | ||||||||||
| (in millions) | ||||||||||||
Foreign exchange contracts – intercompany loans | $ | – | $ | 1 | $ | 2 | ||||||
Foreign exchange contracts – forecasted transactions | (16 | ) | 12 | 19 | ||||||||
Commodity contracts | (24 | ) | (22 | ) | 37 | |||||||
Interest rate contracts | (35 | ) | (435 | ) | (90 | ) | ||||||
|
|
|
|
|
| |||||||
Total | $ | (75 | ) | $ | (444 | ) | $ | (32 | ) | |||
|
|
|
|
|
| |||||||
ThePre-tax gains / (losses) on ineffectiveness recognized in net earnings from continuing operations were:
| 00,000,000 | 00,000,000 | 00,000,000 | ||||||||||||||||||||||
| 2011 | 2010 | 2009 | 2012 | 2011 | 2010 | |||||||||||||||||||
| (in millions) | (in millions) | |||||||||||||||||||||||
Foreign exchange contracts – | $ | – | $ | – | $ | – | ||||||||||||||||||
Foreign exchange contracts – | – | – | – | |||||||||||||||||||||
Commodity contracts | (2 | ) | (6 | ) | 12 | $ | (3 | ) | $ | (4 | ) | $ | – | |||||||||||
Interest rate contracts | (2 | ) | – | – | (23 | ) | (2 | ) | – | |||||||||||||||
|
|
|
|
|
| |||||||||||||||||||
Total | $ | (4 | ) | $ | (6 | ) | $ | 12 | $ | (26 | ) | $ | (6 | ) | $ | – | ||||||||
|
|
|
|
|
| |||||||||||||||||||
ThePre-tax gains / (losses) on the amountamounts excluded from effectiveness testing recognized in net earnings from continuing operations were:
| 00,000,000 | 00,000,000 | 00,000,000 | ||||||||||||||||||||||
| 2011 | 2010 | 2009 | 2012 | 2011 | 2010 | |||||||||||||||||||
| (in millions) | (in millions) | |||||||||||||||||||||||
Foreign exchange contracts – | $ | – | $ | – | $ | – | ||||||||||||||||||
Foreign exchange contracts – | – | – | – | |||||||||||||||||||||
Commodity contracts | (13 | ) | 3 | 1 | $ | – | $ | (17 | ) | $ | – | |||||||||||||
Interest rate contracts | (156 | ) | – | – | (556 | ) | (156 | ) | – | |||||||||||||||
|
|
|
|
|
| |||||||||||||||||||
Total | $ | (169 | ) | $ | 3 | $ | 1 | $ | (556 | ) | $ | (173 | ) | $ | – | |||||||||
|
|
|
|
|
| |||||||||||||||||||
In 2012, we recognized a loss of $556 million in interest and other expenses, net related to certain forward-starting interest rate swaps for which the planned timing of the related forecasted debt was changed in connection with our Spin-Off plans and related debt capitalization plans. In 2011, we recognized a loss of $157 million related to several interest rate swaps that settled in November 2011. We recognized the loss in earnings as the timing of the related forecasted debt changed.
We record pre-tax (i) the gaingains or losslosses reclassified from accumulated other comprehensive earnings / (losses) into earnings, (ii) the gaingains or losslosses on ineffectiveness, and (iii) the gaingains or losslosses on the amountamounts excluded from effectiveness testing in:
cost of sales for commodity contracts;
cost of sales or selling, general and administrative expenses for foreign exchange contracts related to forecasted transactions, depending on the type of transaction;transactions; and
interest and other expense, net for interest rate contracts and foreign exchange contracts related to intercompany loans.
We expect to transfer unrealized losses of $19$28 million (net of taxes) for commodity cash flow hedges, and unrealized gainslosses of $68$9 million (net of taxes) for foreign currency cash flow hedges and unrealized losses of $10$1 million (net of taxes) for interest rate cash flow hedges to earnings during the next 12 months.
As of December 31, 2011,2012, we had hedged transactions forecasted transactions forto impact cash flows over the following durations:periods:
commodity transactions for periods not exceeding the next 1712 months;
interest rate transactions for periods not exceeding the next 3134 years and 42 months; and
foreign currency transactions for periods not exceeding the next 1211 months.
86
Fair Value Hedges:
The followingPre-tax gains / (losses) from continuing operations due to changes in fair value of our interest rate swaps and related hedged long-term debt were recorded in interest and other expense, net:
| 00,000,000 | 00,000,000 | 00,000,000 | ||||||||||||||||||||||
| 2011 | 2010 | 2009 | 2012 | 2011 | 2010 | |||||||||||||||||||
| (in millions) | (in millions) | |||||||||||||||||||||||
Gain / (loss) recognized in income on: | ||||||||||||||||||||||||
Derivatives | $ | (6 | ) | $ | 1 | $ | 7 | $ | (2 | ) | $ | (6 | ) | $ | 1 | |||||||||
Borrowings | 6 | (1 | ) | (7 | ) | 2 | 6 | (1 | ) | |||||||||||||||
Economic Hedges:
GainsPre-tax gains / (losses) recorded in net earnings from continuing operations for economic hedges which are not designated as hedging instruments included:were:
| 00,000,000 | 00,000,000 | 00,000,000 | 00,000,000 | |||||||||||||||||||||||||
| Gain / (Loss) Recognized in Earnings | Location of Gain / (Loss) Recognized in Earnings | |||||||||||||||||||||||||||
| 2011 | 2010 | 2009 | 2012 | 2011 | 2010 | Location of Gain / (Loss) Recognized in Earnings | ||||||||||||||||||||||
| (in millions) | (in millions) | |||||||||||||||||||||||||||
Foreign exchange contracts: | ||||||||||||||||||||||||||||
Intercompany loans and forecasted interest payments | $ | 34 | $ | 28 | $ | (10 | ) | Interest expense | $ | 24 | $ | 34 | $ | 28 | Interest expense | |||||||||||||
Forecasted transactions | 4 | (11 | ) | (10 | ) | Cost of sales | 7 | 4 | (11 | ) | Cost of sales | |||||||||||||||||
Forecasted transactions | 3 | (17 | ) | – | Interest expense | (17 | ) | 3 | (17 | ) | Interest expense | |||||||||||||||||
Cadbury acquisition related | – | (395 | ) | – | Interest expense | |||||||||||||||||||||||
Cadbury acquisition related (1) | – | – | (395 | ) | Interest expense | |||||||||||||||||||||||
Interest rate contracts | (3 | ) | 4 | – | Interest expense | 3 | (3 | ) | 4 | Interest expense | ||||||||||||||||||
Commodity contracts | 166 | 126 | 37 | Cost of sales | 100 | 135 | 90 | Cost of sales | ||||||||||||||||||||
|
|
|
|
|
| |||||||||||||||||||||||
Total | $ | 204 | $ | (265 | ) | $ | 17 | $ | 117 | $ | 173 | $ | (301 | ) | ||||||||||||||
|
|
|
|
|
| |||||||||||||||||||||||
The 2010 Cadbury acquisition related hedging losses were economically offset by $240 million of foreign exchange net gains on cash denominated in pound sterling, the Cadbury Bridge Facility and payable balances associated with the acquisition.
| (1) | The 2010 Cadbury acquisition related hedging losses were economically offset by $240 million of foreign exchange net gains on cash denominated in pound sterling, the Cadbury Bridge Facility and payable balances associated with the acquisition. |
Hedges of Net Investments in Foreign Operations:
GainsAfter-tax gains / (losses) from continuing operations related to hedges of net investments in foreign operations in the form of euro and pound sterling-denominated debt were:
| 2012 | 2011 | 2010 | Location of Gain /(Loss) Recognized in AOCI | |||||||||||
| (in millions) | ||||||||||||||
Euro notes | $ | (41 | ) | $ | 77 | $ | 170 | Currency Translation | ||||||
Pound sterling notes | (29 | ) | 3 | 7 | Adjustment | |||||||||
Note 10. Benefit Plans
Prior to the Spin-Off, certain active and retired employees of Kraft Foods Group and certain of our retired employees participated in our North American benefit plans. Following the Spin-Off, their benefits will be provided directly by Kraft Foods Group. The related plan obligations and plan assets (to the extent that the benefit plans were previously funded) were transferred to Kraft Foods Group on October 1, 2012, and we established new plans. The transfer of these benefits to Kraft Foods Group reduced our benefit plan liabilities by $12,218 million, pension assets by $6,550 million, deferred tax assets of $2,146 million, and accumulated other comprehensive losses by $3,810 million.
Pension Plans
On October 1, 2012, in connection with the Spin-Off, we reduced our benefit obligation by $8,594 million, fair value of pension assets by $6,550 million, long-term deferred tax assets by $727 million, and accumulated other comprehensive losses by $2,917 million.
Obligations and Funded Status:
The projected benefit obligations, plan assets and funded status of our pension plans at December 31, 2012 and 2011 were:
| U.S. Plans | Non-U.S. Plans | |||||||||||||||
| 2012 | 2011 | 2012 | 2011 | |||||||||||||
| (in millions) | ||||||||||||||||
Benefit obligation at January 1 | $ | 7,472 | $ | 6,703 | $ | 9,581 | $ | 8,895 | ||||||||
Service cost | 142 | 146 | 172 | 170 | ||||||||||||
Interest cost | 275 | 364 | 425 | 458 | ||||||||||||
Benefits paid | (241 | ) | (304 | ) | (459 | ) | (470 | ) | ||||||||
Settlements paid | (211 | ) | (187 | ) | – | – | ||||||||||
Curtailment gain | – | (3 | ) | – | (1 | ) | ||||||||||
Actuarial losses | 1,157 | 744 | 1,060 | 588 | ||||||||||||
Spin-Off impact | (7,207 | ) | – | (1,387 | ) | – | ||||||||||
Currency | – | – | 350 | (95 | ) | |||||||||||
Other | 2 | 9 | 44 | 36 | ||||||||||||
|
|
|
|
|
|
|
| |||||||||
Benefit obligation at December 31 | 1,389 | 7,472 | 9,786 | 9,581 | ||||||||||||
|
|
|
|
|
|
|
| |||||||||
Fair value of plan assets at January 1 | 5,829 | 5,800 | 7,600 | 7,453 | ||||||||||||
Actual return on plan assets | 663 | (18 | ) | 684 | 284 | |||||||||||
Contributions | 349 | 538 | 353 | 387 | ||||||||||||
Benefits paid | (241 | ) | (304 | ) | (459 | ) | (470 | ) | ||||||||
Settlements paid | (211 | ) | (187 | ) | – | – | ||||||||||
Spin-Off impact | (5,486 | ) | – | (1,064 | ) | – | ||||||||||
Currency | – | – | 267 | (54 | ) | |||||||||||
Other | – | – | – | – | ||||||||||||
|
|
|
|
|
|
|
| |||||||||
Fair value of plan assets at December 31 | 903 | 5,829 | 7,381 | 7,600 | ||||||||||||
|
|
|
|
|
|
|
| |||||||||
Net pension liability recognized at | $ | (486 | ) | $ | (1,643 | ) | $ | (2,405 | ) | $ | (1,981 | ) | ||||
|
|
|
|
|
|
|
| |||||||||
The accumulated benefit obligation, which represents benefits earned to the measurement date, was $1,218 million at December 31, 2012 and $6,971 million at December 31, 2011 for the U.S. pension plans. The accumulated benefit obligation for the non-U.S. pension plans was $9,453 million at December 31, 2012 and $9,207 million at December 31, 2011.
The combined U.S. and non-U.S. pension plans resulted in a net pension liability of $2,891 million at December 31, 2012 and $3,624 million at December 31, 2011. We recognized these amounts in our consolidated balance sheets at December 31, 2012 and 2011 as follows:
| 2012 | 2011 | |||||||
| (in millions) | ||||||||
Prepaid pension assets | $ | 18 | $ | 31 | ||||
Other accrued liabilities | (24 | ) | (58 | ) | ||||
Accrued pension costs | (2,885 | ) | (3,597 | ) | ||||
|
|
|
| |||||
| $ | (2,891 | ) | $ | (3,624 | ) | |||
|
|
|
| |||||
Certain of our U.S. and non-U.S. plans are underfunded and have accumulated benefit obligations in excess of plan assets. For these plans, the projected benefit obligations, accumulated benefit obligations and the fair value of plan assets at December 31, 2012 and 2011 were:
| U.S. Plans | Non-U.S. Plans | |||||||||||||||
| 2012 | 2011 | 2012 | 2011 | |||||||||||||
| (in millions) | ||||||||||||||||
Projected benefit obligation | $ | 1,389 | $ | 7,472 | $ | 9,539 | $ | 9,314 | ||||||||
Accumulated benefit obligation | 1,218 | 6,971 | 9,230 | 8,962 | ||||||||||||
Fair value of plan assets | 903 | 5,829 | 7,119 | 7,313 | ||||||||||||
We used the following weighted-average assumptions to determine our benefit obligations under the pension plans at December 31:
| U.S. Plans | Non-U.S. Plans | |||||||||||||||
| 2012 | 2011 | 2012 | 2011 | |||||||||||||
Discount rate | 4.20% | 4.85% | 3.81% | 4.62% | ||||||||||||
Expected rate of return on plan assets | 7.75% | 8.00% | 6.08% | 6.47% | ||||||||||||
Rate of compensation increase | 4.00% | 4.00% | 3.47% | 3.58% | ||||||||||||
Year-end discount rates for our U.S. and Canadian plans were developed from a model portfolio of high quality, fixed-income debt instruments with durations that match the expected future cash flows of the benefit obligations. Year-end discount rates for our non-U.S. plans (other than Canadian plans) were developed from local bond indices that match local benefit obligations as closely as possible. Changes in our discount rates were primarily the result of changes in bond yields year-over-year. We determine our expected rate of return on plan assets from the plan assets’ historical long-term investment performance, current asset allocation and estimates of future long-term returns by asset class.
Components of Net Pension Cost:
Net pension cost consisted of the following for the years ended December 31, 2012, 2011, and 2010:
| U.S. Plans | Non-U.S. Plans | |||||||||||||||||||||||
| 2012 | 2011 | 2010 | 2012 | 2011 | 2010 | |||||||||||||||||||
| (in millions) | ||||||||||||||||||||||||
Service cost | $ | 142 | $ | 146 | $ | 145 | $ | 172 | $ | 170 | $ | 162 | ||||||||||||
Interest cost | 275 | 364 | 368 | 425 | 458 | 419 | ||||||||||||||||||
Expected return on plan assets | (358 | ) | (496 | ) | (490 | ) | (494 | ) | (536 | ) | (467 | ) | ||||||||||||
Amortization: | ||||||||||||||||||||||||
Net loss from experience differences | 253 | 225 | 170 | 121 | 101 | 77 | ||||||||||||||||||
Prior service cost | 6 | 7 | 6 | 3 | 2 | 7 | ||||||||||||||||||
Other expenses | 113 | 105 | 123 | 22 | 14 | 11 | ||||||||||||||||||
Net pension costs related to | (263 | ) | (233 | ) | (230 | ) | (29 | ) | (29 | ) | (21 | ) | ||||||||||||
|
|
|
|
|
|
|
|
|
|
|
| |||||||||||||
Net pension cost included in | $ | 168 | $ | 118 | $ | 92 | $ | 220 | $ | 180 | $ | 188 | ||||||||||||
|
|
|
|
|
|
|
|
|
|
|
| |||||||||||||
The following costs are included within other expenses above. Employees who elected lump-sum payments in connection with our 2012-2014 Restructuring Program and cost saving initiatives and retired employees who elected lump-sum payments resulted in settlement losses for our U.S. plans of $113 million in 2012, $105 million in 2011 and $118 million in 2010. Non-U.S. plant closures and early retirement benefits resulted in curtailment and settlement losses of $9 million in 2012, $8 million in 2011 and $11 million in 2010. In addition, in 2012 we incurred $13 million in special termination benefit costs in the non-U.S. plans and in 2011 we incurred $6 million in special termination benefit costs in the non-U.S. plans related to the Cadbury integration.
For the U.S. plans, we determine the expected return on plan assets component of net periodic benefit cost using a calculated market return value that recognizes the cost over a four year period. For our non-U.S. plans, we utilize a similar approach with varying cost recognition periods for some plans, and with others, we determine the expected return on plan assets based on asset fair values as of the measurement date.
As of December 31, 2012, for the combined U.S. and non-U.S. pension plans, we expected to amortize from accumulated other comprehensive earnings / (losses) into net periodic pension cost during 2013:
an estimated $191 million of net loss from experience differences; and
an estimated $4 million of prior service cost.
We used the following weighted-average assumptions to determine our net pension cost for the years ended December 31:
| U.S. Plans | Non-U.S. Plans | |||||||||||||||||||||||
| 2012 | 2011 | 2010 | 2012 | 2011 | 2010 | |||||||||||||||||||
| Discount rate | 4.56% | 5.53% | 5.85% | 4.62% | 5.11% | 5.21% | ||||||||||||||||||
| Expected rate of return on plan assets | 8.00% | 7.95% | 7.99% | 6.47% | 6.77% | 6.68% | ||||||||||||||||||
| Rate of compensation increase | 4.00% | 4.00% | 3.98% | 3.58% | 3.68% | 3.59% | ||||||||||||||||||
Plan Assets:
The fair value of pension plan assets at December 31, 2012 was determined using the following fair value measurements:
Asset Category | Total Fair Value | Quoted Prices in Active Markets for Identical Assets (Level 1) | Significant Other Observable Inputs (Level 2) | Significant Unobservable Inputs (Level 3) | ||||||||||||
| (in millions) | ||||||||||||||||
| Cash | $ | 210 | $ | 210 | $ | – | $ | – | ||||||||
| U.S. equity securities | 186 | 185 | 1 | – | ||||||||||||
| Non-U.S. equity securities | 932 | 932 | – | – | ||||||||||||
| Pooled funds-equity securities | 1,673 | 590 | 1,083 | – | ||||||||||||
|
|
|
|
|
|
|
| |||||||||
Total cash and equity securities | 3,001 | 1,917 | 1,084 | – | ||||||||||||
| Government bonds | 1,440 | 209 | 1,231 | – | ||||||||||||
| Pooled funds-fixed-income securities | 963 | 285 | 668 | 10 | ||||||||||||
Corporate bonds and other fixed-income securities | 1,969 | 210 | 965 | 794 | ||||||||||||
|
|
|
|
|
|
|
| |||||||||
Total fixed-income securities | 4,372 | 704 | 2,864 | 804 | ||||||||||||
| Real estate | 342 | 97 | 6 | 239 | ||||||||||||
| Other | 490 | – | 17 | 473 | ||||||||||||
|
|
|
|
|
|
|
| |||||||||
| Total | $ | 8,205 | $ | 2,718 | $ | 3,971 | $ | 1,516 | ||||||||
|
|
|
|
|
|
|
| |||||||||
The fair value of pension plan assets at December 31, 2011 was determined using the following fair value measurements:
Asset Category | Total Fair Value | Quoted Prices in Active Markets for Identical Assets (Level 1) | Significant Other Observable Inputs (Level 2) | Significant Unobservable Inputs (Level 3) | ||||||||||||
| (in millions) | ||||||||||||||||
Cash | $ | 119 | $ | 119 | $ | – | $ | – | ||||||||
U.S. equity securities | 272 | 266 | 6 | – | ||||||||||||
Non-U.S. equity securities | 1,666 | 1,664 | 2 | – | ||||||||||||
Pooled funds-equity securities | 4,755 | 485 | 4,270 | – | ||||||||||||
|
|
|
|
|
|
|
| |||||||||
Total cash and equity securities | 6,812 | 2,534 | 4,278 | – | ||||||||||||
Government bonds | 1,170 | 571 | 599 | – | ||||||||||||
Pooled funds-fixed-income securities | 1,515 | 230 | 1,278 | 7 | ||||||||||||
Corporate bonds and other fixed-income securities | 3,019 | 100 | 2,161 | 758 | ||||||||||||
|
|
|
|
|
|
|
| |||||||||
Total fixed-income securities | 5,704 | 901 | 4,038 | 765 | ||||||||||||
Real estate | 351 | 91 | 5 | 255 | ||||||||||||
Other | 410 | – | 19 | 391 | ||||||||||||
|
|
|
|
|
|
|
| |||||||||
Total | $ | 13,277 | $ | 3,526 | $ | 8,340 | $ | 1,411 | ||||||||
|
|
|
|
|
|
|
| |||||||||
We excluded plan assets of $79 million at December 31, 2012 and $152 million at December 31, 2011 from the above tables related to certain insurance contracts as they are reported at contract value, in accordance with authoritative guidance.
Fair value measurements:
Level 1 – includes primarily U.S and non-U.S. equity securities and government bonds valued using quoted prices in active markets.
Level 2 – includes primarily pooled funds, including assets in real estate pooled funds, valued using net asset values of participation units held in common collective trusts, as reported by the managers of the trusts and as supported by the unit prices of actual purchase and sale transactions. Level 2 plan assets also include corporate bonds and other fixed-income securities, valued using independent observable market inputs, such as matrix pricing, yield curves and indices.
Level 3 – includes investments valued using unobservable inputs that reflect the plans’ assumptions that market participants would use in pricing the assets, based on the best information available.
Fair value estimates for pooled funds are calculated by the investment advisor when reliable quotations or pricing services are not readily available for certain underlying securities. The estimated value is based on either cost, or last sale price for most of the securities valued in this fashion.
Fair value estimates for limited partnership and private equity investments are calculated by the general partners using the market approach to estimate the fair value of private investments. The market approach utilizes prices and other relevant information generated by market transactions, type of security, degree of liquidity, restrictions on the disposition, latest round of financing data, company financial statements, relevant valuation multiples and discounted cash flow analyses.
Fair value estimates for real estate investments are calculated by the investment managers using the present value of future cash flows expected to be received from the investments, based on valuation methodologies such as appraisals, local market conditions, and current and projected operating performance.
Fair value estimates for investments in hedge fund-of-funds are calculated by the investment managers using the net asset value per share of the investment as reported by the money managers of the underlying funds.
Fair value estimates for insurance contracts are calculated based on the future stream of benefit payments discounted using prevailing interest rates based on the valuation date.
Changes in our Level 3 assets, which are recorded in other comprehensive earnings / (losses), for the year ended December 31, 2012 included:
| 00,000,000 | 00,000,000 | 00,000,000 | 00,000,000 | |||||||||||
| Gain / (Loss) Recognized in OCI | Location of Gain / (Loss) Recognized in AOCI | |||||||||||||
| 2011 | 2010 | 2009 | ||||||||||||
| (in millions) | ||||||||||||||
Euro notes | $ | 77 | $ | 170 | $ | (65 | ) | Currency Translation | ||||||
Pound sterling notes | 3 | 7 | – | Adjustment | ||||||||||
Asset Category | January 1, 2012 Balance | Net Realized and Unrealized Gains/(Losses) | Net Purchases, Issuances and Settlements | Net Transfers Into/(Out of) Level 3 | Currency Impact | December 31, 2012 Balance | ||||||||||||||||||
| (in millions) | ||||||||||||||||||||||||
Pooled funds- fixed-income securities | $ | 7 | $ | – | $ | – | $ | 3 | $ | – | $ | 10 | ||||||||||||
Corporate bond and other | 758 | 61 | (52 | ) | (3 | ) | 30 | 794 | ||||||||||||||||
Real Estate | 255 | 9 | 149 | (181 | ) | 7 | 239 | |||||||||||||||||
Other | 391 | 76 | (10 | ) | (1 | ) | 17 | 473 | ||||||||||||||||
|
|
|
|
|
|
|
|
|
|
|
| |||||||||||||
Total Level 3 investments | $ | 1,411 | $ | 146 | $ | 87 | $ | (182 | ) | $ | 54 | $ | 1,516 | |||||||||||
|
|
|
|
|
|
|
|
|
|
|
| |||||||||||||
The increases in Level 3 pension plan investments during 2012 were due to the net realized gains recorded on the investments, partially offset by net transfers out, primarily related to assets divested with the Spin-Off of Kraft Foods Group.
Changes in our Level 3 plan assets, which are recorded in other comprehensive earnings / (losses), for the year ended December 31, 2011 included:
Asset Category | January 1, 2011 Balance | Net Realized and Unrealized Gains/(Losses) | Net Purchases, Issuances and Settlements | Net Transfers Into/(Out of) Level 3 | Currency Impact | December 31, 2011 Balance | ||||||||||||||||||
| (in millions) | ||||||||||||||||||||||||
Pooled funds- fixed-income securities | $ | – | $ | – | $ | – | $ | 8 | $ | (1 | ) | $ | 7 | |||||||||||
Corporate bond and other | 751 | 105 | (95 | ) | 1 | (4 | ) | 758 | ||||||||||||||||
Real Estate | 250 | (15 | ) | 19 | – | 1 | 255 | |||||||||||||||||
Other | 376 | 10 | 7 | – | (2 | ) | 391 | |||||||||||||||||
|
|
|
|
|
|
|
|
|
|
|
| |||||||||||||
Total Level 3 investments | $ | 1,377 | $ | 100 | $ | (69 | ) | $ | 9 | $ | (6 | ) | $ | 1,411 | ||||||||||
|
|
|
|
|
|
|
|
|
|
|
| |||||||||||||
The increases in Level 3 pension plan investments during 2011 were primarily due to net realized and unrealized gains, partially offset by net purchases, issuances and settlements.
The percentage of fair value of pension plan assets at December 31, 2012 and 2011 was:
| U.S. Plans | Non-U.S. Plans | |||||||||||||||
Asset Category | 2012 | 2011 | 2012 | 2011 | ||||||||||||
Equity securities | 57% | 66% | 31% | 38% | ||||||||||||
Fixed-income securities | 40% | 33% | 49% | 51% | ||||||||||||
Real estate | 3% | 1% | 4% | 4% | ||||||||||||
Other | – | – | 16% | 7% | ||||||||||||
|
|
|
|
|
|
|
| |||||||||
Total | 100% | 100% | 100% | 100% | ||||||||||||
|
|
|
|
|
|
|
| |||||||||
Our investment strategy is based on our expectation that equity securities will outperform fixed-income securities over the long term. We attempt to maintain our target asset allocation by rebalancing between asset classes as we make contributions and monthly benefit payments. Due to the nature and timing of our expected pension liabilities, approximately 60% of our U.S. plan assets are in equity securities and approximately 40% are in fixed-income securities. The strategy uses indexed U.S. equity securities, actively managed and indexed international equity securities and actively managed U.S. investment grade fixed-income securities (which constitute 95% or more of fixed-income securities) with lesser allocations to high yield fixed-income securities.
For the plans outside the U.S., the investment strategy is subject to local regulations and the asset / liability profiles of the plans in each individual country. These specific circumstances result in a level of equity exposure that is typically less than the U.S. plans. In aggregate, the asset allocation targets of our non-U.S. plans are broadly characterized as a mix of approximately 40% equity securities, approximately 50% fixed-income securities and approximately 10% real estate / other. The other asset balance of our non-U.S. plans at December 31, 2012 primarily related to $262 million in hedge funds and $211 million in private equity investments.
Employer Contributions:
In 2012, we contributed $349 million to our U.S. pension plans (including $202 million related to Kraft Foods Group U.S. pension plans) and $329 million to our non-U.S. pension plans (including $42 million related to Kraft Foods Group non-U.S. pension plans). In addition, employees contributed $24 million to our non-U.S. plans. Of our 2012 pension contributions, $315 million was voluntary (including $185 million related to Kraft Foods Group pension plans). We make contributions to our U.S. and non-U.S. pension plans, primarily, to the extent that they are tax deductible and do not generate an excise tax liability.
In 2013, we estimate that our pension contributions will be $8 million to our U.S. plans and $309 million to our non-U.S. plans based on current tax laws. We are currently only required to make a nominal cash contribution to our U.S. qualified pension plans under the Pension Protection Act of 2006. Of the total 2013 pension contributions, none is expected to be voluntary. Our actual contributions may be different due to many factors, including changes in tax and other benefit laws; significant differences between expected and actual pension asset performance or interest rates; or other factors.
Future Benefit Payments:
The estimated future benefit payments from our pension plans at December 31, 2012 were (in millions):
| 2013 | 2014 | 2015 | 2016 | 2017 | 2018-2022 | |||||||||||||||||||
| U.S. Plans | $ | 62 | $ | 66 | $ | 68 | $ | 80 | $ | 92 | $ | 578 | ||||||||||||
| Non-U.S. Plans | 396 | 402 | 412 | 419 | 434 | 2,313 | ||||||||||||||||||
Multiemployer Pension Plans:
We made contributions to multiemployer pension plans of $30 million in 2012, $32 million in 2011 and $30 million in 2010. These plans provide pension benefits to retirees under certain collective bargaining agreements. The following is the only individually significant multiemployer plan we participate in as of December 31, 2012:
Pension Fund | EIN / Pension Plan Number | Pension Protection Act Zone Status | FIP / RP Status Pending / Implemented | Surcharge Imposed | Expiration Date of Collective- Bargaining Agreement | |||||||||||||||
Bakery and Confectionery Union and Industry International Pension Fund | 526118572 | Red | Implemented | Yes | 2/29/2016 | |||||||||||||||
Our contributions exceeded 5% of total contributions to the Bakery and Confectionery Union and Industry International Pension Fund (“Fund”) for fiscal years 2012, 2011 and 2010. Our contributions to the Fund were $25 million in 2012, $24 million in 2011 and $24 million in 2010. We expect contributions to the Fund to be approximately $27 million for each of the next five years. On January 11, 2012, Hostess Brands, a significant contributor to the Fund, announced that it had filed voluntary petitions for reorganization under Chapter 11 of the U.S. Bankruptcy Code and on November 21, 2012, Hostess received court approval to dissolve the company. The full effect of Hostess’ bankruptcy reorganization on the Fund is not known. Once the bankruptcy proceedings are concluded, our costs or withdrawal liability to the Fund might increase. The Fund’s actuarial valuation has been completed and the zone status changed to “Red” for 2012. As a result of this certification, we are being charged a 10% surcharge on our contribution rates. Our expected future contributions include the surcharge. The Fund adopted a rehabilitation plan on November 7, 2012 that requires contribution increases and reduction to benefit provisions.
Our contributions to other multiemployer pension plans that were not individually significant were $5 million in 2012, $8 million in 2011 and $6 million in 2010. These contributions include contributions related to Kraft Foods Group employees who participated in our multiemployer pension plans through October 1, 2012 of $2 million in 2012, $5 million 2011 and $3 million in 2010.
Other Costs:
We sponsor and contribute to employee savings plans. These plans cover eligible salaried, non-union and union employees. Our contributions and costs are determined by the matching of employee contributions, as defined by the plans. Amounts charged to expense in continuing operations for defined contribution plans totaled $74 million in 2012, $62 million in 2011 and $56 million in 2010.
Postretirement Benefit Plans
On October 1, 2012, in connection with the divestiture of Kraft Foods Group, we reduced our benefit obligation by $3,561 million, long-term deferred tax assets by $1,382 million and accumulated other comprehensive losses by $877 million.
Obligations:
Our postretirement health care plans are not funded. The changes in and the amount of the accrued benefit obligation at December 31, 2012 and 2011 were:
| 2012 | 2011 | |||||||
| (in millions) | ||||||||
Accrued benefit obligation at January 1 | $ | 3,453 | $ | 3,263 | ||||
Service cost | 35 | 36 | ||||||
Interest cost | 121 | 165 | ||||||
Benefits paid | (142 | ) | (221 | ) | ||||
Plan amendments | (51 | ) | (5 | ) | ||||
Currency | 8 | (3 | ) | |||||
Assumption changes | 519 | 254 | ||||||
Actuarial (gains) / losses | 47 | (36 | ) | |||||
Impact of Spin-Off | (3,561 | ) | – | |||||
Other | 29 | – | ||||||
|
|
|
| |||||
Accrued benefit obligation at December 31 | $ | 458 | $ | 3,453 | ||||
|
|
|
| |||||
The current portion of our accrued postretirement benefit obligation of $8 million at December 31, 2012 and $215 million at December 31, 2011 was included in other accrued liabilities.
We used the following weighted-average assumptions to determine our postretirement benefit obligations at December 31:
| U.S. Plans | Non-U.S. Plans | |||||||||||||||
| 2012 | 2011 | 2012 | 2011 | |||||||||||||
Discount rate | 4.20% | 4.70% | 4.08% | 4.29% | ||||||||||||
Health care cost trend rate | 7.50% | 7.00% | 7.68% | 7.42% | ||||||||||||
Ultimate trend rate | 5.00% | 5.00% | 5.58% | 5.53% | ||||||||||||
Year that the rate reaches | 2018 | 2016 | 2018 | 2016 | ||||||||||||
Year-end discount rates for our U.S. and Canadian plans were developed from a model portfolio of high quality, fixed-income debt instruments with durations that match the expected future cash flows of the benefit obligations. Year-end discount rates for our non-U.S. plans (other than Canadian plans) were developed from local bond indices that match local benefit obligations as closely as possible. Changes in our discount rates were primarily the result of changes in bond yields year-over-year. Our expected health care cost trend rate is based on historical costs.
Assumed health care cost trend rates have a significant impact on the amounts reported for the health care plans. A one-percentage-point change in assumed health care cost trend rates would have the following effects as of December 31, 2012:
| One-Percentage-Point | ||||||||
| Increase | Decrease | |||||||
Effect on total of service and interest cost | 13.8% | (11.2% | ) | |||||
Effect on postretirement benefit obligation | 16.8% | (13.4% | ) | |||||
Components of Net Postretirement Health Care Costs:
Net postretirement health care costs consisted of the following for the years ended December 31, 2012, 2011 and 2010:
| 2012 | 2011 | 2010 | ||||||||||
| (in millions) | ||||||||||||
Service cost | $ | 35 | $ | 36 | $ | 39 | ||||||
Interest cost | 121 | 165 | 172 | |||||||||
Amortization: | ||||||||||||
Net loss from experience differences | 65 | 60 | 55 | |||||||||
Prior service credit | (31 | ) | (32 | ) | (32 | ) | ||||||
Other (1) | 29 | – | – | |||||||||
Net postretirement health care costs | (135 | ) | (163 | ) | (168 | ) | ||||||
|
|
|
|
|
| |||||||
Net postretirement health care costs | $ | 84 | $ | 66 | $ | 66 | ||||||
|
|
|
|
|
| |||||||
| (1) | In 2012, we recorded a $23 million unfunded U.S. postretirement plan obligation related to long-term disability benefits. |
As of December 31, 2012, we expected to amortize from accumulated other comprehensive earnings / (losses) into pre-tax net postretirement health care costs during 2013:
an estimated $12 million of net loss from experience differences; and
an estimated $11 million of prior service credit.
We used the following weighted-average assumptions to determine our net postretirement cost for the years ended December 31:
| U.S. Plans | Non-U.S. Plans | |||||||||||||||||||||||
| 2012 | 2011 | 2010 | 2012 | 2011 | 2010 | |||||||||||||||||||
Discount rate | 4.47% | 5.30% | 5.70% | 4.14% | 5.02% | 5.28% | ||||||||||||||||||
Health care cost trend rate | 7.00% | 7.50% | 7.00% | 7.42% | 8.83% | 8.79% | ||||||||||||||||||
Future Benefit Payments:
Our estimated future benefit payments for our postretirement health care plans at December 31, 2012 were:
| 2013 | 2014 | 2015 | 2016 | 2017 | 2018-2022 | |||||||||||||||||||
U.S. Plans | $ | 3 | $ | 5 | $ | 6 | $ | 8 | $ | 9 | $ | 73 | ||||||||||||
Non-U.S. Plans | 5 | 5 | 5 | 6 | 6 | 33 | ||||||||||||||||||
Other Costs:
We made contributions to multiemployer medical plans totaling $31 million in 2012, $36 million in 2011 and $35 million in 2010. The contributions include contributions related to Kraft Foods Group employees who participated in our multiemployer medical plans through October 1, 2012 of $13 million in 2012, $20 million in 2011 and $18 million in 2010. These plans provide medical benefits to active employees and retirees under certain collective bargaining agreements.
Postemployment Benefit Plans
On October 1, 2012, in connection with the divestiture of Kraft Foods Group, we reduced our benefit obligation by $63 million, long-term deferred tax assets by $37 million and accumulated other comprehensive losses by $16 million.
Obligations:
Our postemployment plans are primarily not funded. The changes in and the amount of the accrued benefit obligation at December 31, 2012 and 2011 were:
| 2012 | 2011 | |||||||
| (in millions) | ||||||||
Accrued benefit obligation at January 1 | $ | 166 | $ | 140 | ||||
Service cost | 12 | 11 | ||||||
Interest cost | 8 | 9 | ||||||
Benefits paid | (44 | ) | (40 | ) | ||||
Assumption changes | 7 | 4 | ||||||
Actuarial losses / (gains) | 14 | 13 | ||||||
Impact of Spin-Off | (63 | ) | – | |||||
Other | – | 29 | ||||||
|
|
|
| |||||
Accrued benefit obligation at December 31 | $ | 100 | $ | 166 | ||||
|
|
|
| |||||
In 2011, we recorded a Canadian postemployment plan, which was partially funded, with a net liability balance of approximately $29 million.
The accrued benefit obligation was determined using a weighted-average discount rate of 4.0% in 2012 and 5.2% in 2011, an assumed ultimate annual turnover rate of 0.5% in 2012 and 2011, assumed compensation cost increases of 4.0% in 2012 and 2011, and assumed benefits as defined in the respective plans.
Postemployment costs arising from actions that offer employees benefits in excess of those specified in the respective plans are charged to expense when incurred.
Components of Net Postemployment Costs:
Net postemployment costs consisted of the following for the years ended December 31, 2012, 2011 and 2010:
| 2012 | 2011 | 2010 | ||||||||||
| (in millions) | ||||||||||||
Service cost | $ | 12 | $ | 11 | $ | 9 | ||||||
Interest cost | 8 | 9 | 10 | |||||||||
Amortization of net (gains) / losses | (3 | ) | (2 | ) | (2 | ) | ||||||
Other | 3 | 33 | — | |||||||||
Net postemployment costs related to | (5 | ) | (2 | ) | (4 | ) | ||||||
|
|
|
|
|
| |||||||
Net postemployment costs included in | $ | 15 | $ | 49 | $ | 13 | ||||||
|
|
|
|
|
| |||||||
Other postemployment costs in 2011 primarily relate to the establishment of the partially funded Canadian postemployment plan.
As of December 31, 2012, the estimated net gain for the postemployment benefit plans that we expected to amortize from accumulated other comprehensive earnings / (losses) into net postemployment costs during 2013 was insignificant.
Note 11. Stock Plans
We align our annual and long-term incentive compensation programs with shareholder returns. Under our Amended and Restated 2005 Performance Incentive Plan (the “2005 Plan”), we may grant to eligible employees awards of stock options, stock appreciation rights, restricted stock, restricted and deferred stock units, and other awards based on our Common Stock, as well as performance-based annual and long-term incentive awards. We are authorized to issue a maximum of 168.0 million shares of our Common Stock under the 2005 Plan. In addition, under our Amended and Restated 2006 Stock Compensation Plan for Non-Employee Directors (the “2006 Directors Plan”), we may grant up to 1.0 million shares of our Common Stock to members of the Board of Directors who are not our full-time employees. At December 31, 2012, there were 41.3 million shares available to be granted under the 2005 Plan and 0.7 million shares available to be granted under the 2006 Directors Plan.
In connection with the Spin-Off and divestiture of Kraft Foods Group, under the provisions of our existing plans, employee stock option and restricted and deferred stock awards were adjusted to preserve the fair value of the awards immediately before and after the Spin-Off. As such, we did not record any incremental compensation expense related to the conversion of the awards. The restricted and deferred stock continues to vest over the original vesting period, which is generally three years from the grant date.
The stock awards held as of October 1, 2012 were modified as follows:
| • | Stock options: Holders of Kraft Foods Inc. stock option awards received stock options to purchase the same number of shares of our Common Stock at an adjusted exercise price and one new Kraft Foods Group stock option for every three of our stock options held to preserve the fair value of the overall awards granted. |
| • | Restricted and deferred stock: Holders of Kraft Foods Inc. restricted and deferred stock awards received one share of Kraft Foods Group restricted or deferred shares for every three of our restricted or deferred shares they held as of the Record Date. |
| • | Long-term incentive plan: Kraft Foods Inc. awards held by Kraft Foods Group employees were converted to Kraft Foods Group awards. Awards held by our employees were retained with the underlying performance conditions consistent with our original performance targets and only adjusted to reflect our standalone business. |
The net cash settlement for the awards Kraft Foods Group and our employees received was determined as follows:
| • | Stock options: To the extent that our employees received Kraft Foods Group stock options, we plan to reimburse Kraft Foods Group in cash for the fair value of the stock options received. To the extent that Kraft Foods Group employees held our stock options, Kraft Foods Group plans to reimburse us in cash for the fair value of the stock options. |
| • | Restricted and deferred stock: To the extent that our employees received Kraft Foods Group restricted and deferred stock, we plan to reimburse Kraft Foods Group for the fair value of the shares received less the value of projected forfeitures. To the extent that Kraft Foods Group employees held restricted and deferred stock, Kraft Foods Group plans to reimburse us in cash for the fair value of the restricted and deferred stock less the value of projected forfeitures. |
The cash settlements resulted in our recording a receivable of $55 million due from Kraft Foods Group as of December 31, 2012. Payment is subject to the completion of final reviews and other administrative procedures.
Stock Options:
Stock options are granted at an exercise price equal to the market value of the underlying stock on the grant date, generally become exercisable in three annual installments beginning on the first anniversary of the grant date and have a maximum term of ten years.
We account for our employee stock options under the fair value method of accounting using a modified Black-Scholes methodology to measure stock option expense at the date of grant. The fair value of the stock options at the date of grant is amortized to expense over the vesting period. We recorded compensation expense related to stock options held by our employees of $39 million in 2012, $35 million in 2011 and $33 million in 2010 in our results from continuing operations. The deferred tax benefit recorded related to this compensation expense was $11 million in 2012, $10 million in 2011 and $10 million in 2010. The unamortized compensation expense related to our employee stock options was $43 million at December 31, 2012 and is expected to be recognized over a weighted-average period of 2 years.
Our weighted-average Black-Scholes fair value assumptions were:
| Risk-Free Interest Rate | Expected Life | Expected Volatility | Expected Dividend Yield | Fair Value at Grant Date | ||||||||||||||||
2012 | 1.16% | 6 years | 20.13% | 3.08% | $ | 4.78 | ||||||||||||||
2011 | 2.34% | 6 years | 18.92% | 3.72% | $ | 3.84 | ||||||||||||||
2010 | 2.82% | 6 years | 19.86% | 4.14% | $ | 3.69 | ||||||||||||||
The risk-free interest rate represents the constant maturity U.S. government treasuries rate with a remaining term equal to the expected life of the options. The expected life is the period over which our employees are expected to hold their options. Volatility reflects historical movements in our stock price for a period commensurate with the expected life of the options. The 2012 Dividend yield reflects the dividend yield in place at the time of the historical grants and will reflect a lower dividend yield for Mondelēz International for grants made following the Spin-Off of Kraft Foods Group.
Stock option activity for the year ended December 31, 2012 is reflected below. As a result of the Spin-Off, there was no impact on the number of common shares underlying our stock options. For stock options granted prior to the Spin-Off, the weighted-average exercise prices in the table below reflect the historical exercise prices. An adjustment was made as of October 1, 2012 to convert the exercise prices on the exercisable stock options outstanding due to the Spin-Off.
| Shares Subject to Option | Weighted- Average Exercise Price | Average Remaining Contractual Term | Aggregate Intrinsic Value | |||||||||||||
Balance at January 1, 2012 | 49,598,867 | $ | 28.87 | |||||||||||||
Options granted | 13,512,839 | 37.97 | ||||||||||||||
Options exercised | (8,168,062 | ) | 26.39 | |||||||||||||
Options cancelled | (2,440,601 | ) | 30.20 | |||||||||||||
Adjustment due to the Spin-Off(1) | 249,996 | 19.59 | ||||||||||||||
|
| |||||||||||||||
Balance at December 31, 2012 | 52,753,039 | 20.45 | 7 years | $264 million | ||||||||||||
|
| |||||||||||||||
Exercisable at December 31, 2012 | 25,239,082 | 18.32 | 6 years | $180 million | ||||||||||||
|
| |||||||||||||||
| (1) | Due to restrictions stemming from local laws, taxes or other regulatory matters, certain employees who previously held stock options may no longer hold stock options from Kraft Foods Group. As such, their stock option awards were converted into an equivalent amount of additional Mondelēz International stock options in order to preserve the fair value of the overall stock option awards granted. |
In February 2012, as part of our annual equity program, we granted 12.8 million stock options to eligible employees at an exercise price of $38.00 on the grant date. During 2012, we issued 0.7 million of additional stock options with a weighted-average exercise price of $37.60 per share. In the aggregate, we granted 13.5 million stock options during 2012 at a weighted-average exercise price of $37.97.
In February 2011, as part of our annual equity program, we granted 15.8 million stock options to eligible employees at an exercise price of $31.83 on the grant date. During 2011, we issued 0.5 million of additional stock options with a weighted-average exercise price of $31.22 per share. In the aggregate, we granted 16.3 million stock options during 2011 at a weighted-average exercise price of $31.81.
In February 2010, as part of our annual equity program, we granted 15.0 million stock options to eligible employees at an exercise price of $29.15 on the grant date. During 2010, we issued 3.1 million additional stock options with a weighted-average exercise price of $29.73 per share. In the aggregate, we granted 18.1 million stock options during 2010 at a weighted-average exercise price of $29.24, including options issued to Cadbury employees under our annual equity program.
The total intrinsic value of options exercised was $93 million in 2012, $98 million in 2011 and $92 million in 2010. Cash received from options exercised was $205 million in 2012, $486 million in 2011 and $134 million in 2010. The actual tax benefit realized for the tax deductions from the option exercises totaled $21 million in 2012, $40 million in 2011 and $60 million in 2010.
Restricted and Deferred Stock:
We may grant shares of restricted or deferred stock to eligible employees, giving them, in most instances, all of the rights of shareholders, except that they may not sell, assign, pledge or otherwise encumber the shares. Shares of restricted and deferred stock are subject to forfeiture if certain employment conditions are not met. Restricted and deferred shares generally vest on the third anniversary of the grant date.
Shares granted in connection with our long-term incentive plan vest based on varying performance, market and service conditions. The unvested shares have no voting rights and do not pay dividends.
The fair value of the restricted and deferred shares at the date of grant is amortized to earnings over the restriction period. We recorded compensation expense related to restricted and deferred stock of $90 million in 2012, $95 million in 2011 and $93 million in 2010 in our results from continuing operations. The deferred tax benefit recorded related to this compensation expense was $27 million in 2012, $28 million in 2011 and $28 million in 2010. The unamortized compensation expense related to our restricted and deferred stock was $115 million at December 31, 2012 and is expected to be recognized over a weighted-average period of 2 years.
Our restricted and deferred stock activity for the year ended December 31, 2012 is reflected below. As a result of the Spin-Off, there was no impact on the number of shares granted. The grant price information for restricted and deferred stock awarded prior to the Record Date reflects historical market prices which were not adjusted to reflect the Spin-Off.
| Number of Shares | Weighted- Average Grant Date Fair Value Per Share | |||||||
Balance at January 1, 2012 | 13,617,173 | $ | 28.43 | |||||
Granted | 4,962,551 | 35.25 | ||||||
Vested | (5,007,098 | ) | 24.80 | |||||
Forfeited | (1,275,617 | ) | 29.22 | |||||
Adjustment due to the Spin-Off(1) | 518,902 | 19.72 | ||||||
|
| |||||||
Balance at December 31, 2012 | 12,815,911 | 21.55 | ||||||
|
| |||||||
| (1) | Due to restrictions stemming from local laws, taxes or other regulatory matters, certain employees who previously held restricted or deferred shares may no longer hold the stock awards from Kraft Foods Group. As such, their stock awards were converted into an equivalent amount of additional Mondelēz International stock awards in order to preserve the fair value of the overall stock award that was granted. |
In January 2012, we granted 1.3 million shares of stock in connection with our long-term incentive plan, and the market value per share was $37.63 on the date of grant. In February 2012, as part of our annual equity program, we issued 2.2 million shares of restricted and deferred stock to eligible employees, and the market value per restricted or deferred share was $38.00 on the date of grant. During 2012, we issued 1.5 million of additional restricted and deferred shares with a weighted-average market value per share of $29.18, primarily in connection with our 2009 long-term incentive plan performance based awards and a special equity award for our CEO. In aggregate, we issued 5.0 million restricted and deferred shares during 2012, including those issued as part of our long-term incentive plan, with a weighted-average market value per share of $35.25.
In January 2011, we granted 1.5 million shares of stock in connection with our long-term incentive plan, and the market value per share was $31.62 on the date of grant. In February 2011, as part of our annual equity program, we issued 2.6 million shares of restricted and deferred stock to eligible employees, and the market value per restricted or deferred share was $31.83 on the date of grant. During 2011, we issued 1.0 million of additional restricted and deferred shares with a weighted-average market value per share of $33.02. In aggregate, we issued 5.1 million restricted and deferred shares during 2011, including those issued as part of our long-term incentive plan, with a weighted-average market value per share of $31.97.
In January 2010, we granted 1.7 million shares of stock in connection with our long-term incentive plan, and the market value per share was $27.33 on the date of grant. In February 2010, as part of our annual equity program, we issued 2.5 million shares of restricted and deferred stock to eligible employees, and the market value per restricted or deferred share was $29.15 on the date of grant. During 2010, we issued 1.6 million of additional restricted and deferred shares with a weighted-average market value per share of $29.40, including shares issued to Cadbury employees under our annual equity program. In aggregate, we issued 5.8 million restricted and deferred shares during 2010, including those issued as part of our long-term incentive plan, with a weighted-average market value per share of $28.82.
The weighted-average grant date fair value of restricted and deferred stock granted was $175 million, or $35.25 per restricted or deferred share, in 2012; $162 million, or $31.97 per restricted or deferred share, in 2011; $167 million, or $28.82 per restricted or deferred share, in 2010. The vesting date fair value of restricted and deferred stock was $189 million in 2012, $135 million in 2011 and $117 million in 2010.
Note 13.12. Commitments and Contingencies
Legal Proceedings:
We routinely are involved in legal proceedings, claims, and governmental inspections or investigations (“Legal Matters”) arising in the ordinary course of our business.
Competition authorities in certain Member States of the European Union have ongoing investigations into possible anticompetitive activity in the fast moving consumer goods (“FMCG”) sector, which includes products such as chocolate and coffee. On October 18, 2011,January 31, 2012, the German Federal Cartel Office (“FCO”) issued a press release stating that it had discontinued proceedings against our wholly owned subsidiary, Kraft Foods Deutschland GmbH (“KFD”), based on a settlement agreed between KFD and the FCO following the FCO’s finding of illegal price agreements regarding instant cappuccino.an exchange of competitively sensitive information. The FCO also imposed a finefines against a former KFD employee.employee, as well as several other producers of confectionery. Due to KFD’s cooperation with the FCO in the matter, the fine to resolve the matter against KFD was reduced to EUR 2.2 million (approximately $3 million as of October 18, 2011).€21.7 million.
87
A compliant and ethical corporate culture, which includes adhering to laws and industry regulations in all jurisdictions in which we do business, is integral to our success. Accordingly, after we acquired Cadbury in February 2010 we began reviewing and adjusting, as needed, Cadbury’s operations in light of U.S. and international standards as well as Kraft Foods’ policies and practices. We initially focused on such high priority areas as food safety, the Foreign Corrupt Practices Act (“FCPA”) and antitrust. Based upon Cadbury’s pre-acquisition policies and compliance programs and our post-acquisition reviews, our preliminary findings indicated that Cadbury’s overall state of compliance was sound. Nonetheless, through our reviews, we determined that in certain jurisdictions, including India, there appeared to be facts and circumstances warranting further investigation. We are continuing our investigations in certain jurisdictions, including in India, and we continue to cooperate with governmental authorities.
On March 1, 2011, the Starbucks Coffee Company (“Starbucks”), without our authorization and in what we contend is a violation and breach of our agreements with Starbucks, took control of the Starbucks packaged coffee business (“Starbucks CPG business”) in grocery stores and other channels, after alleging we had breached the Supply and License Agreement. The dispute is pending Arbitration in Chicago, Illinois. We are seeking appropriate remedies, including but not limited to payment of the fair market value of the Supply and License Agreement plus the premium this agreement specifies. Starbucks has counterclaimed for unspecified damages. The arbitration proceeding is set to begin on July 11, 2012 and is expected to conclude on July 31, 2012. The results of the Starbucks CPG business were included primarily in our U.S. Beverage and Canada and N.A. Foodservice segments through March 1, 2011.
As we previously disclosed, on February 1, 2011, we received a subpoena from the SEC in connection with an investigation under the FCPA, primarily related to a Cadbury facility in India that we acquired in the Cadbury acquisition. The subpoena primarily requests information regarding dealings with Indian governmental agencies and officials to obtain approvals related to the operation of that facility. We are cooperating with the U.S. governmentand Indian governments in its investigationtheir investigations of these matters.
As we previously disclosed, on March 1, 2011, the Starbucks Coffee Company (“Starbucks”) took control of the Starbucks packaged coffee business (“Starbucks CPG business”) in grocery stores and other channels. Starbucks did so without our authorization and in what we contend is a violation and breach of our license and supply agreement with Starbucks related to the Starbucks CPG business. The dispute is in arbitration in Chicago, Illinois. We are seeking appropriate remedies, including payment of the fair market value of the supply and license agreement, plus the premium this agreement specifies, prejudgment interest under New York law and attorney’s fees. Starbucks has counterclaimed for damages. Testimony and post-hearing briefing in the arbitration proceeding are completed. We await the arbitrator’s decision. Kraft Foods Group remains the named party in the proceeding. Under the Separation and Distribution Agreement between Kraft Foods Group and us, Kraft Foods Group will direct any recovery awarded in the arbitration proceeding to us. We will reimburse Kraft Foods Group for any costs and expenses it incurs in connection with the arbitration.
While we cannot predict with certainty the results of these or any other Legal Matters in which we are currently involved, we do not expect that the ultimate costs to resolve any of these Legal Matters, individually or in the aggregate, will have a material effect on our financial results.
Third-Party Guarantees:
We haveenter into third-party guarantees primarily coveringto cover the long-term obligations of our vendors. As part of thosethese transactions, we guarantee that third parties will make contractual payments or achieve performance measures. At December 31, 2011, the carrying amount of our2012, we had no material third-party guarantees recorded on our consolidated balance sheetsheet.
As of December 31, 2012, we and three of our indirect wholly owned subsidiaries are joint and several guarantors of $1.0 billion of indebtedness issued by an unrelated third party, Cadbury Schweppes US Finance LLC, and maturing on October 1, 2013. Following the maximum potential paymentSpin-Off, one of the guarantors of this indebtedness became an indirect wholly owned subsidiary of Kraft Foods Group. We have agreed to indemnify Kraft Foods Group pursuant to a separation and distribution agreement, in the event its subsidiary is called upon to satisfy its obligation under these guarantees was $22 million. Substantially all of these guarantees expire at various times through 2018.the guarantee.
Leases:
Rental expenses recorded in continuing operations were $452$341 million in 2012, $283 million in 2011 $514and $330 million in 2010, and $505 million in 2009.2010. As of December 31, 2011,2012, minimum rental commitments under non-cancelable operating leases in effect at year-end were (in millions):
| 00,000,000 | ||||
2012 | $ | 353 | ||
2013 | 287 | |||
2014 | 207 | |||
2015 | 155 | |||
2016 | 129 | |||
Thereafter | 187 | |||
|
| |||
Total | $ | 1,318 | ||
|
| |||
| 2013 | 2014 | 2015 | 2016 | 2017 | Thereafter | Total | ||||||||||||||||||||
| $ | 330 | $ | 228 | $ | 178 | $ | 152 | $ | 125 | $ | 131 | $ | 1,144 | |||||||||||||
Note 13. Capital Stock
On October 1, 2012, we spun off Kraft Foods Group which became an independent, publicly traded company. To effect the Spin-Off, our shareholders of record as of September 19, 2012 received one share of Kraft Foods Group for every three shares of Mondelēz International. The Spin-Off had no effect on the number of shares of Mondelēz International common stock in treasury or outstanding. As further described in Note 2,Divestitures and Acquisitions, book value per common share outstanding decreased as we distributed $4.4 billion of net assets related to the divestiture of Kraft Foods Group to our shareholders.
Our amended and restated articles of incorporation authorize 5.0 billion shares of Class A common stock and 500 million shares of preferred stock. There were no preferred shares issued and outstanding at December 31, 2012, 2011 and 2010. Shares of Class A common stock issued, in treasury and outstanding were:
| Shares Issued | Treasury Shares | Shares Outstanding | ||||||||||
Balance at January 1, 2010 | 1,735,000,000 | (257,115,097 | ) | 1,477,884,903 | ||||||||
Shares issued | 261,537,778 | – | 261,537,778 | |||||||||
Exercise of stock options and issuance of | – | 8,643,868 | 8,643,868 | |||||||||
|
|
|
|
|
| |||||||
Balance at December 31, 2010 | 1,996,537,778 | (248,471,229 | ) | 1,748,066,549 | ||||||||
|
|
|
|
|
| |||||||
Exercise of stock options and issuance of | – | 19,830,140 | 19,830,140 | |||||||||
|
|
|
|
|
| |||||||
Balance at December 31, 2011 | 1,996,537,778 | (228,641,089 | ) | 1,767,896,689 | ||||||||
|
|
|
|
|
| |||||||
Exercise of stock options and issuance of | – | 10,099,153 | 10,099,153 | |||||||||
|
|
|
|
|
| |||||||
Balance at December 31, 2012 | 1,996,537,778 | (218,541,936 | ) | 1,777,995,842 | ||||||||
|
|
|
|
|
| |||||||
88In 2010, we issued 261.5 million shares of our Class A common stock as part of the Cadbury acquisition. The issued stock had a total fair value of $7,457 million based on the average of the high and low market prices on the dates of issuance. See Note 2,Divestitures and Acquisitions, for additional information.
Note 14. Income Taxes
Earnings / (losses) from continuing operations before income taxes and the provision for income taxes consisted of the following for the years ended December 31, 2012, 2011 2010, and 2009:2010:
| 00,000,000 | 00,000,000 | 00,000,000 | ||||||||||||||||||||||
| 2011 | 2010 | 2009 | 2012 | 2011 | 2010 | |||||||||||||||||||
| (in millions) | (in millions) | |||||||||||||||||||||||
Earnings from continuing operations | ||||||||||||||||||||||||
Earnings / (losses) from continuing operations | ||||||||||||||||||||||||
United States | $ | 1,146 | $ | 1,071 | $ | 2,047 | $ | (1,822 | ) | $ | (1,308 | ) | $ | (1,435 | ) | |||||||||
Outside United States | 3,626 | 2,571 | 1,899 | 3,596 | 3,188 | 2,161 | ||||||||||||||||||
|
|
|
|
|
| |||||||||||||||||||
Total | $ | 4,772 | $ | 3,642 | $ | 3,946 | $ | 1,774 | $ | 1,880 | $ | 726 | ||||||||||||
|
|
| ||||||||||||||||||||||
|
|
| ||||||||||||||||||||||
Provision for income taxes: | ||||||||||||||||||||||||
United States federal: | ||||||||||||||||||||||||
Current | $ | 371 | $ | 91 | $ | 335 | $ | (421 | ) | $ | (404 | ) | $ | (853 | ) | |||||||||
Deferred | 63 | 322 | 108 | (37 | ) | 10 | 410 | |||||||||||||||||
|
|
|
|
|
| |||||||||||||||||||
| 434 | 413 | 443 | (458 | ) | (394 | ) | (443 | ) | ||||||||||||||||
State and local: | ||||||||||||||||||||||||
Current | 95 | 47 | 82 | (16 | ) | (38 | ) | (137 | ) | |||||||||||||||
Deferred | 55 | 61 | (39 | ) | (20 | ) | 45 | 129 | ||||||||||||||||
|
|
|
|
|
| |||||||||||||||||||
| 150 | 108 | 43 | (36 | ) | 7 | (8 | ) | |||||||||||||||||
|
|
|
|
|
| |||||||||||||||||||
Total United States | 584 | 521 | 486 | (494 | ) | (387 | ) | (451 | ) | |||||||||||||||
|
|
|
|
|
| |||||||||||||||||||
Outside United States: | ||||||||||||||||||||||||
Current | 1,113 | 763 | 681 | 893 | 1,008 | 642 | ||||||||||||||||||
Deferred | (472 | ) | (137 | ) | (31 | ) | (192 | ) | (478 | ) | (137 | ) | ||||||||||||
|
|
|
|
|
| |||||||||||||||||||
Total outside United States | 641 | 626 | 650 | 701 | 530 | 505 | ||||||||||||||||||
|
|
|
|
|
| |||||||||||||||||||
Total provision for income taxes | $ | 1,225 | $ | 1,147 | $ | 1,136 | $ | 207 | $ | 143 | $ | 54 | ||||||||||||
|
|
|
|
|
| |||||||||||||||||||
We also recognizedThe changes in our unrecognized tax expense of $1.2 billion relatedbenefits for the years ended December 31, 2012, 2011 and 2010 were:
| 2012 | 2011 | 2010 | ||||||||||
| (in millions) | ||||||||||||
January 1 | $ | 1,538 | $ | 1,281 | $ | 829 | ||||||
Increases from positions taken during prior periods | 110 | 222 | 49 | |||||||||
Decreases from positions taken during prior periods | (198 | ) | (147 | ) | (146 | ) | ||||||
Increases from positions taken during the current period | 266 | 253 | 229 | |||||||||
Increases from acquisition adjustments | – | – | 357 | |||||||||
Decreases relating to settlements with taxing authorities | (250 | ) | (17 | ) | (19 | ) | ||||||
Reductions resulting from the lapse of the applicable statute of limitations | (20 | ) | (14 | ) | (10 | ) | ||||||
Impact of Spin-Off | (261 | ) | – | – | ||||||||
Currency / other | (2 | ) | (40 | ) | (8 | ) | ||||||
|
|
|
|
|
| |||||||
December 31 | $ | 1,183 | $ | 1,538 | $ | 1,281 | ||||||
|
|
|
|
|
| |||||||
Under the Tax Sharing and Indemnity Agreements between us and Kraft Foods Group, Kraft Foods Group generally assumes liability for all U.S. state income taxes and Canadian federal and provincial income taxes and we generally assume responsibility for all U.S. federal income taxes and substantially all foreign income taxes, excluding Canadian income taxes for all tax periods prior to the 2010 earningsSpin-Off. In addition, we transferred to Kraft Foods Group all of its deferred tax assets and gain from discontinued operations from the saleliabilities as of the Frozen Pizza business.Distribution Date. See Note 2,Divestitures and Acquisitions.
As of January 1, 2011,2012, our unrecognized tax benefits were $1,281$1,538 million. If we had recognized all of these benefits, the net impact on our income tax provision would have been $1,062$1,317 million. Our unrecognized tax benefits were $1,538$1,183 million at December 31, 2011,2012, and if we had recognized all of these benefits, the net impact on our income tax provision would have been $1,317$1,105 million. The amount ofWithin the next 12 months, our unrecognized tax benefits could increase by approximately $40 million due to unfavorable audit developments or decrease by approximately $160-200$60-80 million during the next 12 months due to audit settlements and the expiration of statutes of limitations in various jurisdictions. We include accrued interest and penalties related to uncertain tax positions in our tax provision. We accrued interest and penalties of $246$286 million as of January 1, 20112012 and $286$203 million as of December 31, 2011.2012. Our 20112012 provision for income taxes included $53$33 million for interest and penalties and we paid interest and penalties of $5$61 million during 2011.2012.
The changes in our unrecognized tax benefits for the years ended December 31, 2011, 2010 and 2009 were:
| 00,000,000 | 00,000,000 | 00,000,000 | ||||||||||
| 2011 | 2010 | 2009 | ||||||||||
| (in millions) | ||||||||||||
January 1 | $ | 1,281 | $ | 829 | $ | 807 | ||||||
Increases from positions taken during prior periods | 222 | 49 | 90 | |||||||||
Decreases from positions taken during prior periods | (147 | ) | (146 | ) | (205 | ) | ||||||
Increases from positions taken during the current period | 253 | 229 | 146 | |||||||||
Increases from acquisition adjustments | – | 357 | – | |||||||||
Decreases relating to settlements with taxing authorities | (17 | ) | (19 | ) | (26 | ) | ||||||
Reductions resulting from the lapse of the applicable | (14 | ) | (10 | ) | (14 | ) | ||||||
Currency / other | (40 | ) | (8 | ) | 31 | |||||||
|
|
|
|
|
| |||||||
December 31 | $ | 1,538 | $ | 1,281 | $ | 829 | ||||||
|
|
|
|
|
| |||||||
89
We are regularly examined by federal and various state and foreign tax authorities. The U.S. federal statute of limitations remains openWe are currently under various income tax examinations by the IRS for the year 2004 and onward. The IRS is currently examining our 2004 -years 2006 tax returns and we expect this examination to close during 2012.through 2009. Our income tax filings are also currently under examination by tax authorities in various U.S. state and foreign jurisdictions.jurisdictions, however, under the Tax Sharing and Indemnity Agreements between us and Kraft Foods Group, Kraft Foods Group is generally liable for all state income tax filings prior to the spin-off. U.S. state and foreign jurisdictions have statutes of limitations generally ranging from three to five years, however, these statutes are often extended by mutual agreement with the tax authorities. Years still open to examination by foreign tax authorities in major jurisdictions include (earliest open tax year in parentheses): Germany (1999)(2005), Brazil (2005), Canada (2003)(2007), France (2006)(2009), United Kingdom (2006)(2004), Australia (2008), Russia (2004)(2010) and India (2003).
At December 31, 2011,2012, applicable U.S. federal income taxes and foreign withholding taxes had not been provided on approximately $10.2$10.8 billion of accumulated earnings of foreign subsidiaries that are expected to be permanently reinvested. It is impractical for us to determine the amount of unrecognized deferred tax liabilities on these permanently reinvested earnings.
The effective income tax rate on pre-tax earnings differed from the U.S. federal statutory rate for the following reasons for the years ended December 31, 2012, 2011 2010 and 2009:2010:
| 00,000,000 | 00,000,000 | 00,000,000 | ||||||||||||||||||||||
| 2011 | 2010 | 2009 | 2012 | 2011 | 2010 | |||||||||||||||||||
U.S. federal statutory rate | 35.0 | % | 35.0 | % | 35.0 | % | 35.0% | 35.0% | 35.0% | |||||||||||||||
Increase / (decrease) resulting from: | ||||||||||||||||||||||||
State and local income taxes, net of federal tax | 2.2 | % | 1.9 | % | 1.9 | % | (0.9%) | 0.2% | (0.9%) | |||||||||||||||
Foreign rate differences | (20.5%) | (20.8%) | (16.8%) | |||||||||||||||||||||
Federal and state tax impacts related to IRS | 0.7 | % | (2.3 | %) | (3.1 | %) | (0.4%) | 0.1% | (8.4%) | |||||||||||||||
Reversal of other tax accruals no longer required | (1.3 | %) | (0.5 | %) | (0.4 | %) | (3.1%) | (4.9%) | (9.6%) | |||||||||||||||
U.S. Health Care Legislation | – | 3.8 | % | – | – | – | 7.9% | |||||||||||||||||
Foreign rate differences | (9.5 | %) | (6.0 | %) | (2.2 | %) | ||||||||||||||||||
Tax Legislation | (3.9%) | (3.8%) | (6.3%) | |||||||||||||||||||||
Non-deductible expenses | 3.6% | 1.9% | 8.1% | |||||||||||||||||||||
Other | (1.4 | %) | (0.4 | %) | (2.4 | %) | 1.9% | (0.1%) | (1.6%) | |||||||||||||||
|
|
|
|
|
| |||||||||||||||||||
Effective tax rate | 25.7 | % | 31.5 | % | 28.8 | % | 11.7% | 7.6% | 7.4% | |||||||||||||||
|
|
|
|
|
| |||||||||||||||||||
Our 2012 effective tax rate was favorably impacted by the mix of pre-tax income in various foreign jurisdictions and net tax benefits of $101 million from discrete one-time events, primarily related to the revaluation of U.K. deferred tax assets and liabilities resulting from tax legislation enacted during 2012 that reduced U.K. corporate income tax rates and net favorable tax audit settlements, partially offset by non-deductible expenses.
Our 2011 effective tax rate was favorably impacted by the mix of pre-tax income in various foreign jurisdictions and net tax benefits of $199$226 million from discrete one-time events, primarily from the revaluation of U.K. deferred tax assets and liabilities resulting from tax legislation enacted in 2011 that reduced U.K. corporate income tax rates, the reversal of valuation allowances on certain foreign deferred tax assets that are now expected to be realized and the net favorable impact from various U.S. federal U.S. state and foreign tax audit developments during the year. The 2011 effective tax rate also reflects increased tax benefits from operations outside the United States, which are generally taxed at lower rates than the U.S statutory rate of 35 percent. The mix of pretax income from these various foreign jurisdictions can have a significant impact on our effective tax rate. The fourth quarter and full year tax rate benefited from lower than projected taxes on our earnings outside the U.S., and the fourth quarter was also favorable due to a true-up of prior quarter estimates to a lower actual tax expense reported by these operations.
Our 2010 effective tax rate includedwas favorably impacted by the mix of pre-tax income in various foreign jurisdictions and net tax benefits of $123$165 million from discrete one-time events, primarily due tofrom the favorable resolution of aU.S. federal and foreign tax auditaudits and the resolutionrevaluation of several itemsU.K. deferred tax assets and liabilities resulting from tax legislation enacted in our international operations,2010 that reduced U.K. corporate income tax rates, partially offset by a $137 million write-off of deferred tax assets as a result of the U.S. health care legislation enacted in March 2010.
Our 2009 effective tax rate included net tax benefits of $225 million, primarily due to an agreement we reached with the IRS on specific matters related to years 2000 through 2003, settlements with various foreign and state tax authorities, the expiration of the statutes of limitations in various jurisdictions and the divestiture of ourBalancebar operations in the U.S.
90
The tax effects of temporary differences that gave rise to deferred income tax assets and liabilities consisted of the following at December 31, 20112012 and 2010:2011:
| 00,000,000 | 00,000,000 | |||||||||||||||
| 2011 | 2010 | 2012 | 2011 | |||||||||||||
| (in millions) | (in millions) | |||||||||||||||
Deferred income tax assets: | ||||||||||||||||
Accrued postretirement and postemployment benefits | $ | 1,276 | $ | 1,103 | $ | 157 | $ | 1,276 | ||||||||
Accrued pension costs | 1,007 | 458 | 678 | 1,007 | ||||||||||||
Other | 3,124 | 2,064 | 2,360 | 3,124 | ||||||||||||
|
|
|
| |||||||||||||
Total deferred income tax assets | 5,407 | 3,625 | 3,195 | 5,407 | ||||||||||||
|
|
|
| |||||||||||||
Valuation allowance | (467 | ) | (400 | ) | (429 | ) | (467 | ) | ||||||||
|
|
|
| |||||||||||||
Net deferred income tax assets | $ | 4,940 | $ | 3,225 | $ | 2,766 | $ | 4,940 | ||||||||
|
|
|
| |||||||||||||
Deferred income tax liabilities: | ||||||||||||||||
Trade names | $ | (7,565 | ) | $ | (7,606 | ) | $ | (6,422 | ) | $ | (7,565 | ) | ||||
Property, plant and equipment | (2,084 | ) | (1,845 | ) | (976 | ) | (2,084 | ) | ||||||||
Other | (1,025 | ) | (611 | ) | (967 | ) | (1,025 | ) | ||||||||
|
|
|
| |||||||||||||
Total deferred income tax liabilities | (10,674 | ) | (10,062 | ) | (8,365 | ) | (10,674 | ) | ||||||||
|
|
|
| |||||||||||||
Net deferred income tax liabilities | $ | (5,734 | ) | $ | (6,837 | ) | $ | (5,599 | ) | $ | (5,734 | ) | ||||
|
|
|
| |||||||||||||
Our significant allowances reside within our operating subsidiaries in Mexico, Ireland, China,U.K., and U.S. and Japan.
Note 15. Earnings Per Share
Basic and diluted EPS from continuing and discontinued operations were calculated using the following:
| 00,000,000 | 00,000,000 | 00,000,000 | ||||||||||||||||||||||
| For the Years Ended December 31, | For the Years Ended December 31, | |||||||||||||||||||||||
| 2011 | 2010 | 2009 | 2012 | 2011 | 2010 | |||||||||||||||||||
| (in millions, except per share data) | (in millions, except per share data) | |||||||||||||||||||||||
Earnings from continuing operations | $ | 3,547 | $ | 2,495 | $ | 2,810 | $ | 1,567 | $ | 1,737 | $ | 672 | ||||||||||||
Earnings and gain from discontinued operations, net of income taxes | – | 1,644 | 218 | |||||||||||||||||||||
Earnings from discontinued operations, | 1,488 | 1,810 | 3,467 | |||||||||||||||||||||
|
|
|
|
|
| |||||||||||||||||||
Net earnings | 3,547 | 4,139 | 3,028 | 3,055 | 3,547 | 4,139 | ||||||||||||||||||
Noncontrolling interest | 20 | 25 | 7 | 27 | 20 | 25 | ||||||||||||||||||
|
|
|
|
|
| |||||||||||||||||||
Net earnings attributable to Kraft Foods | $ | 3,527 | $ | 4,114 | $ | 3,021 | ||||||||||||||||||
|
|
| ||||||||||||||||||||||
Net earnings attributable to Mondelēz International | $ | 3,028 | $ | 3,527 | $ | 4,114 | ||||||||||||||||||
|
|
| ||||||||||||||||||||||
Weighted-average shares for basic EPS | 1,765 | 1,715 | 1,478 | 1,777 | 1,765 | 1,715 | ||||||||||||||||||
Plus incremental shares from assumed conversions of stock options and long–term incentive plan shares | 7 | 5 | 8 | |||||||||||||||||||||
|
|
| ||||||||||||||||||||||
Plus incremental shares from assumed conversions of | 12 | 7 | 5 | |||||||||||||||||||||
|
|
| ||||||||||||||||||||||
Weighted-average shares for diluted EPS | 1,772 | 1,720 | 1,486 | 1,789 | 1,772 | 1,720 | ||||||||||||||||||
|
|
|
|
|
| |||||||||||||||||||
Basic earnings per share attributable to Kraft Foods: | ||||||||||||||||||||||||
Basic earnings per share attributable to | ||||||||||||||||||||||||
Continuing operations | $ | 2.00 | $ | 1.44 | $ | 1.90 | $ | 0.87 | $ | 0.97 | $ | 0.38 | ||||||||||||
Discontinued operations | – | 0.96 | 0.14 | 0.83 | 1.03 | 2.02 | ||||||||||||||||||
|
|
|
|
|
| |||||||||||||||||||
Net earnings attributable to Kraft Foods | $ | 2.00 | $ | 2.40 | $ | 2.04 | ||||||||||||||||||
Net earnings attributable to Mondelēz International | $ | 1.70 | $ | 2.00 | $ | 2.40 | ||||||||||||||||||
|
|
|
|
|
| |||||||||||||||||||
Diluted earnings per share attributable to Kraft Foods: | ||||||||||||||||||||||||
Diluted earnings per share attributable to | ||||||||||||||||||||||||
Continuing operations | $ | 1.99 | $ | 1.44 | $ | 1.89 | $ | 0.86 | $ | 0.97 | $ | 0.38 | ||||||||||||
Discontinued operations | – | 0.95 | 0.14 | 0.83 | 1.02 | 2.01 | ||||||||||||||||||
|
|
|
|
|
| |||||||||||||||||||
Net earnings attributable to Kraft Foods | $ | 1.99 | $ | 2.39 | $ | 2.03 | ||||||||||||||||||
Net earnings attributable to Mondelēz International | $ | 1.69 | $ | 1.99 | $ | 2.39 | ||||||||||||||||||
|
|
|
|
|
| |||||||||||||||||||
91
We exclude antidilutive Kraft FoodsMondelēz International stock options from our calculation of weighted-average shares for diluted EPS. We excluded 7.3 million antidilutive options for the year ended December 31, 2012, 9.2 million antidilutive options for the year ended December 31, 2011 and 28.5 million antidilutive options for the year ended December 31, 2010 and 23.0 million antidilutive options for the year ended December 31, 2009.2010.
Note 16. Segment Reporting
We manufacture and market packagedprimarily snack food and beverage products, including snacks,biscuits (cookies, crackers and salted snacks), chocolate, gum & candy, coffee & powdered beverages cheese, convenient meals and various packagedcheese & grocery products. We manage our global business and report operating results through three geographic units: Kraft Foods North America, Kraft FoodsDeveloping Markets, Europe and Kraft Foods Developing Markets. We manageNorth America. In connection with the operationsdivestiture of Kraft Foods North AmericaGroup, we divested and Kraft Foods Europe by product category, and we manageno longer report on the operations of Kraft Foods Developing Markets by location. Our reportablefollowing segments arewithin our results from continuing operations: U.S. Beverages, U.S. Cheese, U.S. Convenient Meals and U.S. Grocery, U.S. Snacks, CanadaGrocery. Our remaining businesses within North America are predominantly snacks businesses. Our segment results in this Annual Report on Form 10-K reflect these changes for all periods presented.
Beginning in 2013, our segment structure will change. In December 2012, we announced a reorganization of our business and reporting structure following the Spin-Off. Effective January 1, 2013, our operations, management and segments will be reorganized into five operating segments: Asia Pacific; Eastern Europe, Middle East & N.A. Foodservice, Kraft Foods EuropeAfrica (“EEMEA”); Europe; Latin America and Kraft Foods Developing Markets. The resultsNorth America. Accordingly, we will begin to report on our new segment structure during the first quarter of operations from our Cadbury acquisition (including Integration Program2013 and acquisition-related costs), are reflected within our U.S. Snacks, Canada & N.A. Foodservice, Kraft Foods Europe and Kraft Foods Developing Markets segments.reflect the change for all the historical periods we present.
Management usesWe use segment operating income to evaluate segment performance and allocate resources. We believe it is appropriate to disclose this measure to help investors analyze segment performance and trends. Segment operating income excludes unrealized gains and losses on hedging activities (which are a component of cost of sales), certain components of our U.S. pension plan cost (which isare a component of cost of sales and selling, general and administrative expenses), general corporate expenses (which are a component of selling, general and administrative expenses) and, amortization of intangibles, forgains and losses on divestitures and acquisition-related costs (which are a component of selling, general and administrative expenses) in all periods presented. We exclude the unrealized gains and losses on hedging activities from segment operating income in order to provide better transparency of our segment operating results. Once realized, the gains and losses on hedging activities are recorded within segment operating results. We exclude certain components of our U.S. pension plan cost from segment operating income because we centrally manage pension plan funding decisions and the determination of discount rate, expected rate of return on plan assets and other actuarial assumptions. Therefore, we allocate only the service cost component of our U.S. pension plan expense to segment operating income. Furthermore, we centrally manage interest and other expense, net. Accordingly, we do not present these items by segment because they are excluded from the segment profitability measure that management reviews. We use the same accounting policies for the segments as those described in Note 1,Summary of Significant Accounting Policies.
Our segment resultsnet revenues and earnings were:
| 00,000,000 | 00,000,000 | 00,000,000 | ||||||||||
| For the Years Ended December 31, | ||||||||||||
| 2011 | 2010 | 2009 | ||||||||||
| (in millions) | ||||||||||||
Net revenues: | ||||||||||||
Kraft Foods North America: | ||||||||||||
U.S. Beverages | $ | 3,006 | $ | 3,212 | $ | 3,057 | ||||||
U.S. Cheese | 3,810 | 3,528 | 3,605 | |||||||||
U.S. Convenient Meals | 3,328 | 3,131 | 3,029 | |||||||||
U.S. Grocery | 3,563 | 3,398 | 3,453 | |||||||||
U.S. Snacks | 6,329 | 6,001 | 4,964 | |||||||||
Canada & N.A. Foodservice | 5,152 | 4,696 | 3,922 | |||||||||
Kraft Foods Europe | 13,356 | 11,628 | 8,768 | |||||||||
Kraft Foods Developing Markets | 15,821 | 13,613 | 7,956 | |||||||||
|
|
|
|
|
| |||||||
Net revenues | $ | 54,365 | $ | 49,207 | $ | 38,754 | ||||||
|
|
|
|
|
| |||||||
| For the Years Ended December 31, | ||||||||||||
| 2012 | 2011 | 2010 | ||||||||||
| (in millions) | ||||||||||||
Net revenues: | ||||||||||||
Developing Markets | $ | 15,655 | $ | 15,621 | $ | 13,420 | ||||||
Europe | 12,457 | 13,356 | 11,628 | |||||||||
North America | 6,903 | 6,833 | 6,441 | |||||||||
|
|
|
|
|
| |||||||
Net revenues | $ | 35,015 | $ | 35,810 | $ | 31,489 | ||||||
|
|
|
|
|
| |||||||
Earnings from continuing operations before income taxes: | ||||||||||||
Operating income: | ||||||||||||
Developing Markets | $ | 2,067 | $ | 2,003 | $ | 1,533 | ||||||
Europe | 1,613 | 1,406 | 1,115 | |||||||||
North America | 873 | 863 | 805 | |||||||||
Unrealized gains / (losses) on hedging activities | 1 | (36 | ) | 38 | ||||||||
Certain U.S. pension plan costs | (92 | ) | (76 | ) | (56 | ) | ||||||
General corporate expenses | (714 | ) | (437 | ) | (511 | ) | ||||||
Amortization of intangibles | (217 | ) | (225 | ) | (210 | ) | ||||||
Gains on divestitures, net | 107 | – | – | |||||||||
Acquisition-related costs | (1 | ) | – | (218 | ) | |||||||
|
|
|
|
|
| |||||||
Operating income | 3,637 | 3,498 | 2,496 | |||||||||
Interest and other expense, net | (1,863 | ) | (1,618 | ) | (1,770 | ) | ||||||
|
|
|
|
|
| |||||||
Earnings from continuing operations before income taxes | $ | 1,774 | $ | 1,880 | $ | 726 | ||||||
|
|
|
|
|
| |||||||
92
| 00,000,000 | 00,000,000 | 00,000,000 | ||||||||||
| For the Years Ended December 31, | ||||||||||||
| 2011 | 2010 | 2009 | ||||||||||
| (in millions) | ||||||||||||
Earnings from continuing operations | ||||||||||||
Operating income: | ||||||||||||
Kraft Foods North America: | ||||||||||||
U.S. Beverages | $ | 450 | $ | 564 | $ | 511 | ||||||
U.S. Cheese | 629 | 598 | 667 | |||||||||
U.S. Convenient Meals | 319 | 268 | 234 | |||||||||
U.S. Grocery | 1,240 | 1,164 | 1,146 | |||||||||
U.S. Snacks | 847 | 845 | 723 | |||||||||
Canada & N.A. Foodservice | 682 | 582 | 462 | |||||||||
Kraft Foods Europe | 1,406 | 1,115 | 785 | |||||||||
Kraft Foods Developing Markets | 2,053 | 1,577 | 936 | |||||||||
Unrealized gains / (losses) on | (100 | ) | 67 | 203 | ||||||||
Certain U.S. pension plan costs | (206 | ) | (179 | ) | (165 | ) | ||||||
General corporate expenses | (438 | ) | (724 | ) | (293 | ) | ||||||
Amortization of intangibles | (225 | ) | (211 | ) | (26 | ) | ||||||
|
|
|
|
|
| |||||||
Operating income | 6,657 | 5,666 | 5,183 | |||||||||
Interest and other expense, net | (1,885 | ) | (2,024 | ) | (1,237 | ) | ||||||
|
|
|
|
|
| |||||||
Earnings from continuing operations | $ | 4,772 | $ | 3,642 | $ | 3,946 | ||||||
|
|
|
|
|
| |||||||
OurAs a percentage of our net revenues from continuing operations, our five largest customer, Wal-Mart Stores, Inc. and its affiliates,customers accounted for approximately 12%15.6% of consolidatedour net revenues in 2012 compared with 15.5% in 2011 13%and 15.1% in 2010 and 16% in 2009. These2010. Also, our ten largest customers accounted for 24.1% of our net revenues occurred primarilyin 2012 compared with 22.7% in 2011 and 23.2% in 2010. No single customer accounted for 10% or more of our net revenues from continuing operations.
On February 8, 2013, the Venezuelan government announced the devaluation of the official Venezuelan bolivar exchange rate from 4.30 bolivars to 6.30 bolivars to the U.S. dollar and the elimination of the second-tier, government-regulated SITME exchange rate previously applied to value certain types of transactions. The impact of these announced changes resulted in a one-time $30 million unfavorable foreign currency impact which we will record within our Latin America operating segment in the Kraft Foods North America segments.
On March 1, 2011, Starbucks, without our authorization and in what we contend is a violation and breachfirst quarter of 2013. We began accounting for the results of our agreements with Starbucks, took control ofVenezuelan subsidiaries in U.S. dollars on January 1, 2010, as prescribed under U.S. GAAP for highly inflationary economies. We use the Starbucks CPG business in grocery stores and other channels, after alleging we had breachedofficial Venezuelan bolivar exchange rate to translate the Supply and License Agreement. The dispute is pending Arbitration in Chicago, Illinois. We are seeking appropriate remedies, including but not limited to payment of the fair market value of the Supply and License Agreement plus the premium this agreement specifies. Starbucks has counterclaimed for unspecified damages. The arbitration proceeding is set to begin on July 11, 2012 and is expected to conclude on July 31, 2012. The results of the Starbucks CPG business were included primarily in our Venezuelan operations into U.S. Beveragedollars. During 2012 and Canada and N.A. Foodservice segments through March 1, 2011.
In 2011, we recorded a $64 million charge in Kraft Foods Europe related to severance benefits provided to terminated employees and chargesimmaterial foreign currency impacts in connection with Kraft Foods Europe reorganization. We also reversed $37 million of cost savings initiative program costs across all segments except Kraft Foods Europe.highly inflationary accounting for Venezuela. In 2010, we recorded $170$115 million primarily within the segment operating income of Kraft Foods Europe and Canada & N.A. Foodservice and in connection with the Kraft Foods Europe reorganization. In 2009, we recorded $318unfavorable foreign currency impacts including a one-time $34 million primarilycharge upon adopting highly inflationary accounting for severance benefits provided to terminated employees, associated benefit plan costs and other related activities. These were recorded in operations, primarily within the segment operating income of Kraft Foods Europe, with the remainder spread across all other segments.Venezuela.
In 2011, the unfavorable $1002012, we divested property of a Developing Markets subsidiary located in Russia for $72 million in net changeproceeds and recorded a $55 million pre-tax gain within selling, general and administrative expenses.
In 2012, net changes in unrealized gains / (losses) on hedging activities were favorable, primarily resulted from higher commodity hedge losses, partially offset byrelated to gains on foreign currency forward contracts.contracts and commodity hedging activity of $1 million. In 2010, the favorable $67 million2011, net changechanges in unrealized gains / (losses) on hedging activities were unfavorable, primarily resulted from gains associated withrelated to losses on foreign currency contracts and commodity hedge contracts.hedging activity of $36 million. In 2009, the favorable $203 million2010, net changechanges in unrealized gains / (losses) on hedging activities were favorable, primarily resultedrelated to gains on foreign currency contracts and commodity hedging activity of $38 million.
In connection with our 2012-2014 Restructuring Program, during 2012 we recorded restructuring charges of $102 million in operations, as a part of asset impairment and exit costs and we recorded implementation costs of $8 million in operations, as a part of cost of sales and selling, general and administrative expenses. These charges were recorded primarily within our North America segment.
In 2012, we recorded a $44 million benefit within our Europe segment related to the reversal of reserves carried over from 2008 unrealized losses on energy derivatives becoming realizedthe Cadbury acquisition in 20092010 and therefore, includednot required.
We recorded Integration Program charges of $185 million in segment operating income.
93
The 2012 increase in general corporate expenses was due primarily to $407 million of Spin-Off Costs recorded within general corporate expenses, partially offset by lower Integration Program costs. The 2011 decrease in general corporate expenses was due primarily to Cadbury acquisition-related transaction fees in the prior year and lower Integration Program costs. Thecosts in 2011. In 2010, increase in general corporate expenses was primarily due to acquisition-related transaction fees,included $155 million of Integration Program costs, andas well as the impactaddition of Cadbury’s corporate charges. We
In 2012, we received $200 million in proceeds and recorded pre-tax gains of $107 million primarily related to the divestitures in Germany, Belgium and Italy. In 2011, there were no significant divestitures. In 2010, we divested businesses in Poland and Romania in connection with the acquisition of Cadbury, and reflected the impacts of these divestitures as adjustments within the Cadbury final purchase accounting.
In 2010, we acquired Cadbury and incurred acquisition-related transaction fees of $218 million of acquisition-related costs which was recorded within selling, general and administrative expenses.
The 2012 increase in interest and other expense, net was due primarily to $609 million of Spin-Off Costs recorded within interest expense, partially offset by a 2011 loss of $157 million related to several interest rate swaps that were settled in 2011, as well as lower long-term debt interest expense. The 2011 decrease in interest and other expense, net was due primarily to $251 million of acquisition-related financing fees recorded in 2010, and $40partially offset by the loss of $157 million in 2009. We recorded these charges in operations as part of general corporate expenses. In 2009, general corporate expenses included $50 million of charges for legal matters related to certain of our European operations.several interest rate swaps that settled in 2011.
Gains / (losses) on divestitures, net, impacted segment operating income as follows:
| 00,000,000 | 00,000,000 | 00,000,000 | ||||||||||
| For the Years Ended December 31, | ||||||||||||
| 2011 | 2010 | 2009 | ||||||||||
| (in millions) | ||||||||||||
Kraft Foods North America: | ||||||||||||
U.S. Beverages | $ | – | $ | – | $ | – | ||||||
U.S. Cheese | – | (6 | ) | – | ||||||||
U.S. Convenient Meals | – | – | – | |||||||||
U.S. Grocery | – | – | – | |||||||||
U.S. Snacks | – | – | 11 | |||||||||
Canada & N.A. Foodservice | – | – | – | |||||||||
Kraft Foods Europe | – | – | (17 | ) | ||||||||
Kraft Foods Developing Markets | – | – | – | |||||||||
|
|
|
|
|
| |||||||
Gains / (losses) on divestitures, net | $ | – | $ | (6 | ) | $ | (6 | ) | ||||
|
|
|
|
|
| |||||||
Total assets, depreciation expense and capital expenditures by segment were:
| 00,000,000 | 00,000,000 | 00,000,000 | ||||||||||
| As of December 31, | ||||||||||||
| 2011 | 2010 | 2009 | ||||||||||
| (in millions) | ||||||||||||
Total assets: | ||||||||||||
Kraft Foods North America: | ||||||||||||
U.S. Beverages | $ | 2,837 | $ | 2,513 | $ | 2,382 | ||||||
U.S. Cheese | 4,156 | 4,633 | 4,589 | |||||||||
U.S. Convenient Meals | 2,151 | 2,064 | 3,063 | |||||||||
U.S. Grocery | 5,142 | 5,574 | 5,565 | |||||||||
U.S. Snacks | 20,587 | 20,895 | 16,418 | |||||||||
Canada & N.A. Foodservice | 6,989 | 7,207 | 5,051 | |||||||||
Kraft Foods Europe | 24,525 | 24,261 | 16,073 | |||||||||
Kraft Foods Developing Markets | 24,559 | 25,738 | 11,087 | |||||||||
Unallocated assets(1) | 2,891 | 2,404 | 2,486 | |||||||||
|
|
|
|
|
| |||||||
Total assets | $ | 93,837 | $ | 95,289 | $ | 66,714 | ||||||
|
|
|
|
|
| |||||||
| As of December 31, | ||||||||||||
| 2012 | 2011 | 2010 | ||||||||||
| (in millions) | ||||||||||||
Total assets: | ||||||||||||
Developing Markets | $ | 25,608 | $ | 24,559 | $ | 25,738 | ||||||
Europe | 25,801 | 24,525 | 24,261 | |||||||||
North America | 22,098 | 41,862 | 42,886 | |||||||||
Unallocated assets(1) | 1,971 | 2,891 | 2,404 | |||||||||
|
|
|
|
|
| |||||||
Total assets | $ | 75,478 | $ | 93,837 | $ | 95,289 | ||||||
|
|
|
|
|
| |||||||
| (1) | Unallocated assets consist primarily of cash and cash equivalents, deferred income taxes, centrally held property, plant and equipment, prepaid pension assets and derivative financial instrument balances. |
| 00,000,000 | 00,000,000 | 00,000,000 | ||||||||||
| For the Years Ended December 31, | ||||||||||||
| 2011 | 2010 | 2009 | ||||||||||
| (in millions) | ||||||||||||
Depreciation expense: | ||||||||||||
Kraft Foods North America: | ||||||||||||
U.S. Beverages | $ | 66 | $ | 73 | $ | 69 | ||||||
U.S. Cheese | 80 | 67 | 66 | |||||||||
U.S. Convenient Meals | 83 | 61 | 67 | |||||||||
U.S. Grocery | 86 | 88 | 82 | |||||||||
U.S. Snacks | 126 | 139 | 127 | |||||||||
Canada & N.A. Foodservice | 128 | 110 | 83 | |||||||||
Kraft Foods Europe | 354 | 355 | 237 | |||||||||
Kraft Foods Developing Markets | 337 | 320 | 157 | |||||||||
|
|
|
|
|
| |||||||
Total – continuing operations | 1,260 | 1,213 | 888 | |||||||||
Discontinued operations | – | 16 | 17 | |||||||||
|
|
|
|
|
| |||||||
Total depreciation expense | $ | 1,260 | $ | 1,229 | $ | 905 | ||||||
|
|
|
|
|
| |||||||
94
| 00,000,000 | 00,000,000 | 00,000,000 | ||||||||||
| For the Years Ended December 31, | ||||||||||||
| 2011 | 2010 | 2009 | ||||||||||
| (in millions) | ||||||||||||
Capital expenditures: | ||||||||||||
Kraft Foods North America: | ||||||||||||
U.S. Beverages | $ | 121 | $ | 88 | $ | 82 | ||||||
U.S. Cheese | 72 | 88 | 72 | |||||||||
U.S. Convenient Meals | 88 | 109 | 135 | |||||||||
U.S. Grocery | 74 | 76 | 85 | |||||||||
U.S. Snacks | 235 | 245 | 190 | |||||||||
Canada & N.A. Foodservice | 90 | 112 | 94 | |||||||||
Kraft Foods Europe | 378 | 334 | 292 | |||||||||
Kraft Foods Developing Markets | 713 | 607 | 319 | |||||||||
|
|
|
|
|
| |||||||
Total – continuing operations | 1,771 | 1,659 | 1,269 | |||||||||
Discontinued operations | – | 2 | 61 | |||||||||
|
|
|
|
|
| |||||||
Total capital expenditures | $ | 1,771 | $ | 1,661 | $ | 1,330 | ||||||
|
|
|
|
|
| |||||||
| For the Years Ended December 31, | ||||||||||||
| 2012 | 2011 | 2010 | ||||||||||
| (in millions) | ||||||||||||
Depreciation expense: | ||||||||||||
Developing Markets | $ | 317 | $ | 337 | $ | 320 | ||||||
Europe | 326 | 354 | 355 | |||||||||
North America | 224 | 205 | 201 | |||||||||
|
|
|
|
|
| |||||||
Total – continuing operations | 867 | 896 | 876 | |||||||||
Discontinued operations | 261 | 364 | 353 | |||||||||
|
|
|
|
|
| |||||||
Total depreciation expense | $ | 1,128 | $ | 1,260 | $ | 1,229 | ||||||
|
|
|
|
|
| |||||||
| For the Years Ended December 31, | ||||||||||||
| 2012 | 2011 | 2010 | ||||||||||
| (in millions) | ||||||||||||
Capital expenditures: | ||||||||||||
Developing Markets | $ | 761 | $ | 713 | $ | 607 | ||||||
Europe | 350 | 378 | 334 | |||||||||
North America | 217 | 279 | 272 | |||||||||
|
|
|
|
|
| |||||||
Total – continuing operations | 1,328 | 1,370 | 1,213 | |||||||||
Discontinued operations | 282 | 401 | 448 | |||||||||
|
|
|
|
|
| |||||||
Total capital expenditures | $ | 1,610 | $ | 1,771 | $ | 1,661 | ||||||
|
|
|
|
|
| |||||||
Net revenues by consumer sector which reflectsKraft macaroni and cheese dinners in the Convenient Meals sector and separates Canada & N.A. Foodservice, Kraft Foods Europe and Kraft Foods Developing Markets into sector components, were:
| 00,000,000 | 00,000,000 | 00,000,000 | 00,000,000 | |||||||||||||
| For the Year Ended December 31, 2011 | ||||||||||||||||
| Kraft Foods North America | Kraft Foods Europe | Kraft Foods Developing Markets | Total | |||||||||||||
| (in millions) | ||||||||||||||||
Biscuits | $ | 6,046 | $ | 2,598 | $ | 3,366 | $ | 12,010 | ||||||||
Confectionery | 1,916 | 5,785 | 7,774 | 15,475 | ||||||||||||
Beverages | 3,598 | 3,158 | 2,917 | 9,673 | ||||||||||||
Cheese | 5,535 | 1,182 | 995 | 7,712 | ||||||||||||
Grocery | 3,188 | 363 | 642 | 4,193 | ||||||||||||
Convenient Meals | 4,905 | 270 | 127 | 5,302 | ||||||||||||
|
|
|
|
|
|
|
| |||||||||
Total net revenues | $ | 25,188 | $ | 13,356 | $ | 15,821 | $ | 54,365 | ||||||||
|
|
|
|
|
|
|
| |||||||||
| 00,000,000 | 00,000,000 | 00,000,000 | 00,000,000 | |||||||||||||
| For the Year Ended December 31, 2010(1) | ||||||||||||||||
| Kraft Foods North America | Kraft Foods Europe | Kraft Foods Developing Markets | Total | |||||||||||||
| (in millions) | ||||||||||||||||
Biscuits | $ | 5,646 | $ | 2,323 | $ | 2,806 | $ | 10,775 | ||||||||
Confectionery | 1,807 | 5,234 | 6,666 | 13,707 | ||||||||||||
Beverages | 3,741 | 2,511 | 2,536 | 8,788 | ||||||||||||
Cheese | 5,089 | 982 | 904 | 6,975 | ||||||||||||
Grocery | 3,088 | 334 | 579 | 4,001 | ||||||||||||
Convenient Meals | 4,595 | 244 | 122 | 4,961 | ||||||||||||
|
|
|
|
|
|
|
| |||||||||
Total net revenues | $ | 23,966 | $ | 11,628 | $ | 13,613 | $ | 49,207 | ||||||||
|
|
|
|
|
|
|
| |||||||||
| For the Year Ended December 31, 2012 | ||||||||||||||||
| Developing Markets | Europe | North America | Total | |||||||||||||
| (in millions) | ||||||||||||||||
Biscuits | $ | 3,511 | $ | 2,426 | $ | 5,212 | $ | 11,149 | ||||||||
Chocolate | 4,502 | 4,518 | 336 | 9,356 | ||||||||||||
Gum & Candy | 3,085 | 973 | 1,280 | 5,338 | ||||||||||||
Beverages | 2,880 | 2,962 | 1 | 5,843 | ||||||||||||
Cheese & Grocery | 1,677 | 1,578 | 74 | 3,329 | ||||||||||||
|
|
|
|
|
|
|
| |||||||||
Total net revenues | $ | 15,655 | $ | 12,457 | $ | 6,903 | $ | 35,015 | ||||||||
|
|
|
|
|
|
|
| |||||||||
95
| 00,000,000 | 00,000,000 | 00,000,000 | 00,000,000 | |||||||||||||
| For the Year Ended December 31, 2009 | ||||||||||||||||
| Kraft Foods North America | Kraft Foods Europe | Kraft Foods Developing Markets | Total | |||||||||||||
| (in millions) | ||||||||||||||||
Biscuits | $ | 5,628 | $ | 2,330 | $ | 2,446 | $ | 10,404 | ||||||||
Confectionery | 301 | 2,446 | 1,891 | 4,638 | ||||||||||||
Beverages | 3,545 | 2,390 | 2,094 | 8,029 | ||||||||||||
Cheese | 4,980 | 972 | 844 | 6,796 | ||||||||||||
Grocery | 3,136 | 369 | 566 | 4,071 | ||||||||||||
Convenient Meals | 4,440 | 261 | 115 | 4,816 | ||||||||||||
|
|
|
|
|
|
|
| |||||||||
Total net revenues | $ | 22,030 | $ | 8,768 | $ | 7,956 | $ | 38,754 | ||||||||
|
|
|
|
|
|
|
| |||||||||
| For the Year Ended December 31, 2011 | ||||||||||||||||
| Developing Markets | Europe | North America | Total | |||||||||||||
| (in millions) | ||||||||||||||||
Biscuits | $ | 3,359 | $ | 2,598 | $ | 5,031 | $ | 10,988 | ||||||||
Chocolate | 4,554 | 4,659 | 352 | 9,565 | ||||||||||||
Gum & Candy | 3,215 | 1,126 | 1,351 | 5,692 | ||||||||||||
Beverages | 2,897 | 3,158 | 2 | 6,057 | ||||||||||||
Cheese & Grocery | 1,596 | 1,815 | 97 | 3,508 | ||||||||||||
|
|
|
|
|
|
|
| |||||||||
Total net revenues | $ | 15,621 | $ | 13,356 | $ | 6,833 | $ | 35,810 | ||||||||
|
|
|
|
|
|
|
| |||||||||
| For the Year Ended December 31, 2010 | ||||||||||||||||
| Developing Markets | Europe | North America | Total | |||||||||||||
| (in millions) | ||||||||||||||||
Biscuits | $ | 2,796 | $ | 2,323 | $ | 4,711 | $ | 9,830 | ||||||||
Chocolate | 3,770 | 4,211 | 295 | 8,276 | ||||||||||||
Gum & Candy | 2,894 | 1,023 | 1,309 | 5,226 | ||||||||||||
Beverages | 2,517 | 2,511 | 2 | 5,030 | ||||||||||||
Cheese & Grocery | 1,443 | 1,560 | 124 | 3,127 | ||||||||||||
|
|
|
|
|
|
|
| |||||||||
Total net revenues | $ | 13,420 | $ | 11,628 | $ | 6,441 | $ | 31,489 | ||||||||
|
|
|
|
|
|
|
| |||||||||
Geographic data for net revenues long-lived assets and totallong-lived assets were:
| 00,000,000 | 00,000,000 | 00,000,000 | ||||||||||||||||||||||
| For the Years Ended December 31, | For the Years Ended December 31, | |||||||||||||||||||||||
| 2011 | 2010 | 2009 | 2012 | 2011 | 2010 | |||||||||||||||||||
| (in millions) | (in millions) | |||||||||||||||||||||||
Net revenues: | ||||||||||||||||||||||||
United States | $ | 21,938 | $ | 20,934 | $ | 19,713 | $ | 5,974 | $ | 5,848 | $ | 5,485 | ||||||||||||
Europe | 17,237 | 15,733 | 11,471 | |||||||||||||||||||||
Other | 15,190 | 12,540 | 7,570 | 29,041 | 29,962 | 26,004 | ||||||||||||||||||
|
|
|
|
|
| |||||||||||||||||||
Total net revenues | $ | 54,365 | $ | 49,207 | $ | 38,754 | $ | 35,015 | $ | 35,810 | $ | 31,489 | ||||||||||||
|
|
|
|
|
| |||||||||||||||||||
| As of December 31, | ||||||||||||||||||||||||
| 2012 | 2011 | 2010 | ||||||||||||||||||||||
| (in millions) | ||||||||||||||||||||||||
Long-lived assets: | ||||||||||||||||||||||||
United States | $ | 18,176 | $ | 35,093 | $ | 35,200 | ||||||||||||||||||
Other | 41,680 | 42,542 | 43,868 | |||||||||||||||||||||
|
|
| ||||||||||||||||||||||
Total long-lived assets | $ | 59,856 | $ | 77,635 | $ | 79,068 | ||||||||||||||||||
|
|
| ||||||||||||||||||||||
No individual country within Other exceeded 10% of our net revenues or long-lived assets for all periods presented.
| 00,000,000 | 00,000,000 | 00,000,000 | ||||||||||
| As of December 31, | ||||||||||||
| 2011 | 2010 | 2009 | ||||||||||
| (in millions) | ||||||||||||
Long-lived assets: | ||||||||||||
United States | $ | 35,093 | $ | 35,200 | $ | 31,773 | ||||||
Europe | 25,401 | 25,333 | 16,077 | |||||||||
Other | 17,141 | 18,535 | 6,410 | |||||||||
|
|
|
|
|
| |||||||
Total long-lived assets | $ | 77,635 | $ | 79,068 | $ | 54,260 | ||||||
|
|
|
|
|
| |||||||
Total assets: | ||||||||||||
United States | $ | 39,398 | $ | 40,085 | $ | 35,816 | ||||||
Europe | 32,177 | 31,811 | 21,915 | |||||||||
Other | 22,262 | 23,393 | 8,983 | |||||||||
|
|
|
|
|
| |||||||
Total assets | $ | 93,837 | $ | 95,289 | $ | 66,714 | ||||||
|
|
|
|
|
| |||||||
96
Note 17. Quarterly Financial Data (Unaudited)
Kraft Foods Group was divested in the quarter ended December 31, 2012 and the results of its operations have been presented as discontinued operations below for all periods presented.
| 00,000,000 | 00,000,000 | 00,000,000 | 00,000,000 | |||||||||||||||||||||||||||||
| 2011 Quarters | 2012 Quarters | |||||||||||||||||||||||||||||||
| First | Second | Third | Fourth | First | Second | Third | Fourth | |||||||||||||||||||||||||
| (in millions, except per share data) | (in millions, except per share data) | |||||||||||||||||||||||||||||||
Net revenues | $ | 12,573 | $ | 13,878 | $ | 13,226 | $ | 14,688 | $ | 8,667 | $ | 8,527 | $ | 8,326 | $ | 9,495 | ||||||||||||||||
Gross profit | $ | 4,636 | $ | 4,871 | $ | 4,615 | $ | 4,893 | $ | 3,195 | $ | 3,211 | $ | 3,120 | $ | 3,550 | ||||||||||||||||
Earnings from continuing operations | $ | 802 | $ | 976 | $ | 927 | $ | 842 | $ | 339 | $ | 490 | $ | 177 | $ | 561 | ||||||||||||||||
|
|
|
| |||||||||||||||||||||||||||||
Earnings / (losses) from discontinued operations, net of income taxes | 480 | 544 | 482 | (18 | ) | |||||||||||||||||||||||||||
|
|
|
| |||||||||||||||||||||||||||||
Net earnings | 802 | 976 | 927 | 842 | 819 | 1,034 | 659 | 543 | ||||||||||||||||||||||||
Noncontrolling interest | 3 | – | 5 | 12 | 6 | 5 | 7 | 9 | ||||||||||||||||||||||||
|
|
|
|
|
|
|
| |||||||||||||||||||||||||
Net earnings attributable to Kraft Foods | $ | 799 | $ | 976 | $ | 922 | $ | 830 | ||||||||||||||||||||||||
Net earnings attributable to | $ | 813 | $ | 1,029 | $ | 652 | $ | 534 | ||||||||||||||||||||||||
|
|
|
|
|
|
|
| |||||||||||||||||||||||||
Weighted-average shares for diluted EPS | 1,760 | 1,771 | 1,777 | 1,779 | 1,783 | 1,786 | 1,789 | 1,793 | ||||||||||||||||||||||||
Per share data: | ||||||||||||||||||||||||||||||||
Basic EPS attributable to Kraft Foods: | ||||||||||||||||||||||||||||||||
Basic EPS attributable to | ||||||||||||||||||||||||||||||||
Continuing operations | $ | 0.46 | $ | 0.55 | $ | 0.52 | $ | 0.47 | $ | 0.19 | $ | 0.27 | $ | 0.10 | $ | 0.31 | ||||||||||||||||
Discontinued operations | – | – | – | – | 0.27 | 0.31 | 0.27 | (0.01 | ) | |||||||||||||||||||||||
|
|
|
|
|
|
|
| |||||||||||||||||||||||||
Net earnings attributable to Kraft Foods | $ | 0.46 | $ | 0.55 | $ | 0.52 | $ | 0.47 | ||||||||||||||||||||||||
Net earnings attributable to | $ | 0.46 | $ | 0.58 | $ | 0.37 | $ | 0.30 | ||||||||||||||||||||||||
|
|
|
|
|
|
|
| |||||||||||||||||||||||||
Diluted EPS attributable to Kraft Foods: | ||||||||||||||||||||||||||||||||
Diluted EPS attributable to | ||||||||||||||||||||||||||||||||
Continuing operations | $ | 0.45 | $ | 0.55 | $ | 0.52 | $ | 0.47 | $ | 0.19 | $ | 0.27 | $ | 0.10 | $ | 0.31 | ||||||||||||||||
Discontinued operations | – | – | – | – | 0.27 | 0.31 | 0.26 | (0.01 | ) | |||||||||||||||||||||||
|
|
|
|
|
|
|
| |||||||||||||||||||||||||
Net earnings attributable to Kraft Foods | $ | 0.45 | $ | 0.55 | $ | 0.52 | $ | 0.47 | ||||||||||||||||||||||||
Net earnings attributable to | $ | 0.46 | $ | 0.58 | $ | 0.36 | $ | 0.30 | ||||||||||||||||||||||||
|
|
|
|
|
|
|
| |||||||||||||||||||||||||
Dividends declared | $ | 0.29 | $ | 0.29 | $ | 0.29 | $ | 0.29 | $ | 0.29 | $ | 0.29 | $ | 0.29 | $ | 0.13 | ||||||||||||||||
Market price–high | $ | 32.20 | $ | 35.47 | $ | 36.30 | $ | 37.93 | ||||||||||||||||||||||||
–low | $ | 30.21 | $ | 31.35 | $ | 32.63 | $ | 31.88 | ||||||||||||||||||||||||
Market price (1) – high | $ | 39.06 | $ | 39.99 | $ | 42.44 | $ | 42.54 | ||||||||||||||||||||||||
– low | $ | 37.17 | $ | 36.75 | $ | 37.15 | $ | 24.50 | ||||||||||||||||||||||||
| (1) | The first three quarters of 2012 and the fourth quarter 2012 market price-high in the table above reflect historical stock prices which were not adjusted to reflect the Kraft Foods Group Spin-Off. |
Net revenues Gross profit Earnings from continuing operations Earnings from discontinued operations, Net earnings Noncontrolling interest Net earnings attributable to Weighted-average shares for diluted EPS Per share data: Basic EPS attributable to Continuing operations Discontinued operations Net earnings attributable to Diluted EPS attributable to Continuing operations Discontinued operations Net earnings attributable to Dividends declared Market price (1) – high – low 2011 Quarters First Second Third Fourth (in millions, except per share data) $ 8,190 $ 9,163 $ 8,778 $ 9,679 $ 3,115 $ 3,313 $ 3,247 $ 3,425 $ 325 $ 445 $ 508 $ 459
net of income taxes 477 531 419 383 802 976 927 842 3 – 5 12
Mondelēz International $ 799 $ 976 $ 922 $ 830 1,760 1,771 1,777 1,779
Mondelēz International: $ 0.18 $ 0.25 $ 0.28 $ 0.25 0.28 0.30 0.24 0.22
Mondelēz International $ 0.46 $ 0.55 $ 0.52 $ 0.47
Mondelēz International: $ 0.18 $ 0.25 $ 0.28 $ 0.25 0.27 0.30 0.24 0.22
Mondelēz International $ 0.45 $ 0.55 $ 0.52 $ 0.47 $ 0.29 $ 0.29 $ 0.29 $ 0.29 $ 32.20 $ 35.47 $ 36.30 $ 37.93 $ 30.21 $ 31.35 $ 32.63 $ 31.88
| (1) | Market prices in the table above reflect historical stock prices which were not adjusted to reflect the Kraft Foods Group Spin-Off. |
The fourth quarter of 2011 benefited from lower than projected taxes on our earnings outside the U.S. and an $85 million true-up of prior quarter estimates to a lower actual tax expense reported by these operations.
| 00,000,000 | 00,000,000 | 00,000,000 | 00,000,000 | |||||||||||||
| 2010 Quarters | ||||||||||||||||
| First | Second | Third | Fourth | |||||||||||||
| (in millions, except per share data) | ||||||||||||||||
Net revenues | $ | 11,318 | $ | 12,253 | $ | 11,863 | $ | 13,773 | ||||||||
Gross profit | $ | 4,089 | $ | 4,694 | $ | 4,321 | $ | 4,798 | ||||||||
Earnings from continuing operations | $ | 249 | $ | 939 | $ | 760 | $ | 547 | ||||||||
Earnings and gain from discontinued | 1,644 | – | – | – | ||||||||||||
|
|
|
|
|
|
|
| |||||||||
Net earnings | 1,893 | 939 | 760 | 547 | ||||||||||||
Noncontrolling interest | 10 | 2 | 6 | 7 | ||||||||||||
|
|
|
|
|
|
|
| |||||||||
Net earnings attributable to Kraft Foods | $ | 1,883 | $ | 937 | $ | 754 | $ | 540 | ||||||||
|
|
|
|
|
|
|
| |||||||||
Weighted-average shares for diluted EPS | 1,620 | 1,752 | 1,754 | 1,757 | ||||||||||||
Per share data: | ||||||||||||||||
Basic EPS attributable to Kraft Foods: | ||||||||||||||||
Continuing operations | $ | 0.15 | $ | 0.54 | $ | 0.43 | $ | 0.31 | ||||||||
Discontinued operations | 1.02 | – | – | – | ||||||||||||
|
|
|
|
|
|
|
| |||||||||
Net earnings attributable to Kraft Foods | $ | 1.17 | $ | 0.54 | $ | 0.43 | $ | 0.31 | ||||||||
|
|
|
|
|
|
|
| |||||||||
Diluted EPS attributable to Kraft Foods: | ||||||||||||||||
Continuing operations | $ | 0.15 | $ | 0.53 | $ | 0.43 | $ | 0.31 | ||||||||
Discontinued operations | 1.01 | – | – | – | ||||||||||||
|
|
|
|
|
|
|
| |||||||||
Net earnings attributable to Kraft Foods | $ | 1.16 | $ | 0.53 | $ | 0.43 | $ | 0.31 | ||||||||
|
|
|
|
|
|
|
| |||||||||
Dividends declared | $ | 0.29 | $ | 0.29 | $ | 0.29 | $ | 0.29 | ||||||||
Market price – high | $ | 30.98 | $ | 31.09 | $ | 31.98 | $ | 32.67 | ||||||||
– low | $ | 27.09 | $ | 27.49 | $ | 27.59 | $ | 29.80 | ||||||||
97
Basic and diluted EPS are computed independently for each of the periods presented. Accordingly, the sum of the quarterly EPS amounts may not equal the total for the year.
During 2012, we recorded the following pre-tax charges / (gains) in earnings from continuing operations:
| 2012 Quarters | ||||||||||||||||
| First | Second | Third | Fourth | |||||||||||||
| (in millions) | ||||||||||||||||
Asset impairment and exit costs | $ | 44 | $ | 27 | $ | 13 | $ | 69 | ||||||||
(Gains) / losses on divestitures, net | – | – | – | (107 | ) | |||||||||||
|
|
|
|
|
|
|
| |||||||||
| $ | 44 | $ | 27 | $ | 13 | $ | (38 | ) | ||||||||
|
|
|
|
|
|
|
| |||||||||
During 2011, we recorded the following pre-tax charges / (gains) in earnings from continuing operations:
| 00,000,000 | 00,000,000 | 00,000,000 | 00,000,000 | |||||||||||||||||||||||||||||
| 2011 Quarters | 2011 Quarters | |||||||||||||||||||||||||||||||
| First | Second | Third | Fourth | First | Second | Third | Fourth | |||||||||||||||||||||||||
| (in millions) | (in millions) | |||||||||||||||||||||||||||||||
Asset impairment and exit costs | $ | – | $ | – | $ | (7 | ) | $ | – | $ | – | $ | – | $ | (5 | ) | $ | – | ||||||||||||||
(Gains) / losses on divestitures, net | – | – | – | – | – | – | – | – | ||||||||||||||||||||||||
|
|
|
|
|
|
|
| |||||||||||||||||||||||||
| $ | – | $ | – | $ | (7 | ) | $ | – | $ | – | $ | – | $ | (5 | ) | $ | – | |||||||||||||||
|
|
|
|
|
|
|
| |||||||||||||||||||||||||
During 2010, we recorded the following pre-tax charges / (gains) in earnings from continuing operations:
| 00,000,000 | 00,000,000 | 00,000,000 | 00,000,000 | |||||||||||||
| 2010 Quarters | ||||||||||||||||
| First | Second | Third | Fourth | |||||||||||||
| (in millions) | ||||||||||||||||
Asset impairment and exit costs | $ | – | $ | – | $ | (9 | ) | $ | 27 | |||||||
(Gains) / losses on divestitures, net | – | – | – | 6 | ||||||||||||
|
|
|
|
|
|
|
| |||||||||
| $ | – | $ | – | $ | (9 | ) | $ | 33 | ||||||||
|
|
|
|
|
|
|
| |||||||||
Item 9. Changes in and Disagreements with Accountants on Accounting and Financial Disclosure.
None.
Item 9A. Controls and Procedures.
Evaluation of Disclosure Controls and Procedures
Management, together with our CEO and CFO, evaluated the effectiveness of our disclosure controls and procedures (as defined in Securities Exchange Act of 1934 Rule 13a-15(e)) as of the end of the period covered by this report. Based upon that evaluation, our CEO and CFO concluded that our disclosure controls and procedures were effective as of December 31, 2011.2012.
Changes in Internal Control Over Financial Reporting
Management, together with our CEO and CFO, evaluated the changes in our internal control over financial reporting during the quarter ended December 31, 2011.2012. We determined that there were no changes in our internal control over financial reporting during the quarter ended December 31, 2011,2012, that have materially affected, or are reasonably likely to materially affect, our internal control over financial reporting.
None.
98
Item 10. Directors, Executive Officers and Corporate Governance.
Information required by this Item 10 is included under the headings “Election of Directors,” “Corporate Governance – Section–Section 16(a) Beneficial Ownership Reporting Compliance,” “Corporate Governance – Governance Guidelines and Codes of Conduct,” and “Board Committees and Membership – Audit Committee” in our definitive Proxy Statement for our Annual Meeting of Shareholders scheduled to be held on May 23, 201221, 2013 (“20122013 Proxy Statement”). All of this information is incorporated by reference into this Annual Report.
The information on our Web site is not, and shall not be deemed to be, a part of this Annual Report or incorporated into any other filings we make with the SEC.
On June 13, 2011, we filed our Annual CEO Certification as required by Section 303A.12 of the NYSE Listed Company Manual.
Item 11. Executive Compensation.
Information required by this Item 11 is included under the headings “Board Committees and Membership – Human Resources and Compensation Committee,” “Compensation of Non – EmployeeNon-Employee Directors,” “Compensation Discussion and Analysis” and “Executive Compensation Tables” in our 20122013 Proxy Statement. All of this information is incorporated by reference into this Annual Report.
Item 12. Security Ownership of Certain Beneficial Owners and Management and Related Stockholder Matters.
The number of shares to be issued upon exercise or vesting of awards issued under, and the number of shares remaining available for future issuance under, our equity compensation plans at December 31, 20112012 were:
Equity Compensation Plan Information
| 00,000,000 | 00,000,000 | 00,000,000 | ||||||||||
| Number of Securities | ||||||||||||
| Remaining Available for | ||||||||||||
| Number of Securities to | Future Issuance under | |||||||||||
| be Issued Upon Exercise | Weighted Average | Equity Compensation | ||||||||||
| of Outstanding | Exercise Price of | Plans (excluding | ||||||||||
| Options, Warrants | Outstanding Options, | securities reflected | ||||||||||
| and Rights (1) | Warrants and Rights | in column (a)) | ||||||||||
| (a) | (b) | (c) | ||||||||||
Equity compensation plans | 57,553,125 | $ | 28.87 | 57,541,664 | ||||||||
|
|
|
|
|
| |||||||
| Number of Securities | ||||||||||||
| Remaining Available for | ||||||||||||
| Number of Securities to | Future Issuance under | |||||||||||
| be Issued Upon Exercise | Weighted Average | Equity Compensation | ||||||||||
| of Outstanding | Exercise Price of | Plans (excluding | ||||||||||
| Options, Warrants | Outstanding Options, | securities reflected | ||||||||||
| and Rights (1) | Warrants and Rights | in column (a)) (2) | ||||||||||
| (a) | (b) | (c) | ||||||||||
Equity compensation plans | 61,089,666 | $ | 20.45 | 42,013,594 | ||||||||
|
|
|
|
|
| |||||||
| (1) | Includes vesting of deferred and long-term incentive plan stock. |
| (2) | Includes 26,283,412 options and deferred stock available for issuance under the 2005 Performance Incentive Plan and 2006 Stock Compensation Plan for Non-Employee Directors, and 15,730,182 of restricted shares available for issuance under the 2005 Performance Incentive Plan. |
Information related to the security ownership of certain beneficial owners and management is included in our 20122013 Proxy Statement under the heading “Ownership of Equity Securities” and is incorporated by reference into this Annual Report.
Item 13. Certain Relationships and Related Transactions, and Director Independence.
Information required by this Item 13 is included under the headings “Corporate Governance – Review of Transactions with Related Persons” and “Corporate Governance – Director Independence” in our 20122013 Proxy Statement. All of this information is incorporated by reference into this Annual Report.
99
Item 14. Principal Accountant Fees and Services.
Information required by this Item 14 is included under the heading “Board Committees and Membership – Audit Committee” in our 20122013 Proxy Statement. All of this information is incorporated by reference into this Annual Report.
Item 15. Exhibits and Financial Statement Schedules.
| (a) | Index to Consolidated Financial Statements and Schedules |
| Page | ||
Report of Management on Internal Control over Financial Reporting | ||
Report of Independent Registered Public Accounting Firm | ||
Consolidated Statements of Earnings for the Years Ended December 31, 2012, 2011 | ||
Consolidated Statements of Comprehensive Earnings for the Years Ended December 31, 2012, 2011 | ||
Consolidated Balance Sheets at December 31, | ||
Consolidated Statements of Equity for the Years Ended December 31, 2012, 2011 | ||
Consolidated Statements of Cash Flows for the Years Ended December 31, 2012, 2011 | ||
Notes to Consolidated Financial Statements | ||
Report of Independent Registered Public Accounting Firm on Financial Statement Schedule | S-1 | |
Financial Statement Schedule-Valuation and Qualifying Accounts | S-2 |
Schedules other than those listed above have been omitted either because such schedules are not required or are not applicable.
100
| (b) | The following exhibits are filed as part of, or incorporated by reference into, this Annual Report: |
| 2.1 | ||
| Master Sale and Purchase Agreement, by and between Groupe Danone S.A. and | ||
| | ||
| 2.3 | Canadian Asset Transfer Agreement, by and between Mondelez Canada Inc. and Kraft Canada Inc., dated as of September 29, 2012 * | |
| 2.4 | Master Ownership and License Agreement Regarding Patents, Trade Secrets and Related Intellectual Property, among Kraft Foods Global Brands LLC, Kraft Foods Group Brands LLC, Kraft Foods UK Ltd. and Kraft Foods R&D Inc., dated as of October 1, 2012 (incorporated by reference to Exhibit 10.3 to the Registrant’s Current Report on Form 8-K filed with the SEC on October 1, 2012).* | |
| 2.5 | Master Ownership and License Agreement Regarding Trademarks and Related Intellectual Property, by and between Kraft Foods Global Brands LLC and Kraft Foods Group Brands LLC., dated as of September 27, 2012 (incorporated by reference to Exhibit10.4 to the Registrant’s Current Report on Form 8-K filed with the SEC on October 1, 2012).* | |
| 3.1 | Amended and Restated Articles of Incorporation of the Registrant, effective October 1, 2012 (incorporated by reference to Exhibit 3.1 to the Registrant’s Current Report on Form 8-K filed with the SEC on | |
| 3.2 | Amended and Restated By-Laws of the Registrant, effective October 1, 2012 (incorporated by reference to Exhibit 3.2 to the Registrant’s Current Report on Form 8-K filed with the SEC on | |
| 4.1 | The Registrant agrees to furnish copies of any instruments defining the rights of holders of long-term debt of the Registrant and its consolidated subsidiaries that does not exceed 10 percent of the total assets of the Registrant and its consolidated subsidiaries to the SEC upon request. | |
| 4.2 | Indenture, by and between the Registrant and Deutsche Bank Trust Company Americas (as successor trustee to The Bank of New York and The Chase Manhattan Bank), dated as of October 17, 2001 (incorporated by reference to Exhibit 4.1 to the Registrant’s Registration Statement on Form S-3 (Reg. No. 333-86478) filed with the SEC on April 18, 2002). | |
| 10.1 | $4.5 Billion 4-Year Revolving Credit Agreement, by and among the Registrant, the initial lenders named therein, JPMorgan Securities LLC, Deutsche Bank Securities Inc., Citigroup Global Markets Inc., Credit Suisse Securities (USA) LLC and HSBC Securities (USA) LLC, as joint bookrunners, and JPMorgan Chase Bank, N.A. and Deutsche Bank AG New York Branch, as co-administrative agents, dated as of April 1, 2011 (incorporated by reference to Exhibit 10.1 to the Registrant’s Quarterly Report on Form 10-Q filed with the SEC on August 5, 2011). | |
| 10.2 | Master Professional Services Agreement, | |
| 10.3 | Tax Sharing Agreement, by and between the Registrant and Altria Group, Inc., dated as of March 30, 2007 (incorporated by reference to Exhibit 10.3 to the Registrant’s Current Report on Form 8-K filed with the SEC on March 30, 2007). | |
| 10.4 | Tax Sharing and Indemnity Agreement, by and between the Registrant and Kraft Foods Group, Inc., dated as of September 27, 2012 (incorporated by reference to Exhibit 10.1 to the Registrant’s Current Report on Form 8-K filed with the SEC on October 1, 2012). | |
| 10.5 | Employee Matters Agreement, by and between the Registrant and Kraft Foods Group, Inc., dated as of September 27, 2012 (incorporated by reference to Exhibit 10.2 to the Registrant’s Current Report on Form 8-K filed with the SEC on October 1, 2012). * | |
| 10.6 | Mondelēz International, Inc. Amended and Restated 2005 Performance Incentive Plan, amended as of December 31, 2009 | |
| Form of | ||
| Form of | ||
| 10.10 | ||
101
| 10.11 | |||
| 10.12 | Form of Mondelēz Global LLC Amended and Restated Cash Enrollment Agreement. + | ||
| 10.13 | Form of Mondelēz International Global LLC Amended and Restated Employee Grantor Trust Agreement. + | ||
| 10.14 | Mondelēz International, Inc. Amended and Restated 2006 Stock Compensation Plan for Non-Employee Directors, effective as of May 24, 2011 | ||
| Deferred Compensation Plan Trust Document, by and between Mondelēz Global LLC and Wilmington Trust Retirement and Institutional Services Company, dated as of September 18, 2012. + | |||
| 10.20 | Offer of Employment Letter, between the Registrant and Irene B. Rosenfeld, dated June 26, 2006 (incorporated by reference to Exhibit 10.29 to the Registrant’s Quarterly Report on Form 10-Q for the quarter ended June 30, 2006). + | ||
| Amendment to Offer of Employment Letter, between the Registrant and Irene B. Rosenfeld, amended as of December 31, 2008 (incorporated by reference to Exhibit 10.20 to the Registrant’s Annual Report on Form 10-K filed with the SEC on February 27, 2009). + | |||
| Offer of Employment Letter, between the Registrant and Sanjay Khosla, dated December 1, 2006 (incorporated by reference to Exhibit 10.23 to the Registrant’s Annual Report on Form 10-K filed with the SEC on February 27, 2009). + | |||
| Amendment to Offer of Employment Letter, between the Registrant and Sanjay Khosla, amended as of December 31, 2008 (incorporated by reference to Exhibit 10.24 to the Registrant’s Annual Report on Form 10-K filed with the SEC on February 27, 2009). + | |||
| Agreement Upon Retirement and General Release, between the Registrant and Sanjay Khosla, dated as of December 19, 2012 (incorporated by reference to Exhibit 10.1 to the Registrant’s Current Report on Form 8-K filed with the SEC on December 26, 2012). + | |||
| 10.26 | Consulting Agreement between the Registrant and Sanjay Khosla, dated as of December 19, 2012 (incorporated by reference to Exhibit 10.2 to the Registrant’s Current Report on Form 8-K filed with the SEC on December 26, 2012). + | ||
| 10.27 | Offer of Employment Letter, between the Registrant and W. Anthony Vernon, dated June 17, 2009 (incorporated by reference to Exhibit 10.2 to the Registrant’s Quarterly Report on Form 10-Q filed with the SEC on August 5, 2009). + | ||
| Amendment to Offer of Employment Letter, between the Registrant and W. Anthony Vernon, amended as of November 23, 2009 (incorporated by reference to Exhibit 10.31 to the Registrant’s Annual Report on Form 10-K filed with the SEC on February 25, 2010). + | |||
| Offer of Employment Letter, between the Registrant and Daniel P. Myers, dated June 20, 2011 (incorporated by reference to Exhibit 10.1 to the Registrant’s Quarterly Report on Form 10-Q filed with the SEC on November 4, 2011). + | |||
| Offer of Employment Letter, between the Registrant and John T. Cahill, dated December 3, | ||
| Offer of Employment Letter, between the Registrant and Tracey Belcourt, dated July 8, 2012 (incorporated by reference to Exhibit 10.2 to the Registrant’s Quarterly Report on Form 10-Q filed with the SEC on November 8, 2012). + | ||
| 10.32 | Form of Indemnification Agreement for Non-Employee Directors (incorporated by reference to 10.28 to the Registrant’s Annual Report on Form 10-K filed with the SEC on February 27, 2009). + | |
102
| Indemnification Agreement between the Registrant and Irene B. Rosenfeld, dated January 27, 2009 (incorporated by reference to Exhibit 10.1 to the Registrant’s Current Report on Form 8-K filed with the SEC on February 2, 2009). + | ||
| 11 | Computation of Per Share | |
| 12.1 | Computation of Ratios of Earnings to Fixed | |
| 21.1 | Subsidiaries of the | |
| 23.1 | Consent of PricewaterhouseCoopers LLP, Independent Registered Public Accounting Firm. | |
| 31.1 | Certification of the Registrant’s Chief Executive Officer pursuant to Rule 13a-14(a)/15d-14(a) of the Securities Exchange Act of 1934, as amended, as adopted pursuant to Section 302 of the Sarbanes-Oxley Act of 2002. | |
| 31.2 | Certification of the Registrant’s Chief Financial Officer pursuant to Rule 13a-14(a)/15d-14(a) of the Securities Exchange Act of 1934, as amended, as adopted pursuant to Section 302 of the Sarbanes-Oxley Act of 2002. | |
| 32.1 | Certifications of the Registrant’s Chief Executive Officer and Chief Financial Officer pursuant to 18 U.S.C. 1350, as adopted pursuant to Section 906 of the Sarbanes-Oxley Act of 2002. | |
| 101.1 | The following materials from | |
| * |
| ** | Portions of this exhibit (indicated by asterisks) have been omitted pursuant to a request for confidential treatment |
| *** | Data required by Item 601(b)(11) of Regulation S-K is provided in Note 15 to the consolidated financial statements in this Report |
| + | Indicates a management contract or compensatory plan or arrangement. |
103
Pursuant to the requirements of Section 13 or 15(d) of the Securities Exchange Act of 1934, the registrant has duly caused this report to be signed on its behalf by the undersigned, thereunto duly authorized.
| By: | /S/ | |
| (David A. Brearton | ||
| Executive Vice President | ||
| and Chief Financial Officer) | ||
| Date: | February | |
Pursuant to the requirements of the Securities Exchange Act of 1934, this report has been signed below by the following persons on behalf of the registrant and in the capacities and on the date indicated:
Signature | Title | Date | ||
/S/ (Irene B. Rosenfeld) | Director, Chairman and Chief Executive Officer | February | ||
/S/ (David A. Brearton) | Executive Vice President and Chief Financial Officer | February | ||
/S/ (Kim Harris Jones) | Senior Vice President and Corporate Controller | February | ||
/S/ ( | Director | February | ||
/S/ ( | Director | February | ||
/S/
| ||||
(Lois D. Juliber) | Director | February | ||
/S/ (Mark D. Ketchum) | Director | February | ||
/S/ ( | Director | February | ||
/S/
| ||||
| ||||
(Fredric G. Reynolds) | Director | February | ||
/S/ (Patrick T. Siewert) | Director | February 25, 2013 | ||
/ (Ruth J. Simmons) | Director | February 25, 2013 | ||
/ (Jean-François M.L. van Boxmeer) | Director | February | ||
104
REPORT OF INDEPENDENT REGISTERED PUBLIC ACCOUNTING FIRM
ON FINANCIAL STATEMENT SCHEDULE
To the Board of Directors and Shareholders of Kraft FoodsMondelēz International, Inc.:
Our audits of the consolidated financial statements and of the effectiveness of internal control over financial reporting referred to in our report dated February 27, 201225, 2013 appearing in this Annual Report on Form 10-K of Kraft FoodsMondelēz International, Inc. also included an audit of the financial statement schedule listed in Item 15(a) of this Form 10-K. In our opinion, this financial statement schedule presents fairly, in all material respects, the information set forth therein when read in conjunction with the related consolidated financial statements.
/s/ PRICEWATERHOUSECOOPERS LLP
Chicago, Illinois
February 27, 201225, 2013
S-1
Kraft FoodsMondelēz International, Inc. and Subsidiaries
Valuation and Qualifying Accounts
For the Years Ended December 31, 2012, 2011 2010 and 20092010
(in millions)
| 00,000,000 | 00,000,000 | 00,000,000 | 00,000,000 | 00,000,000 | ||||||||||||||||||||||||||||||||||||
Col. A | Col. B | Col. C | Col. D | Col. E | Col. B | Col. C | Col. D | Col. E | ||||||||||||||||||||||||||||||||
| Additions | Additions | |||||||||||||||||||||||||||||||||||||||
Description | Balance at Beginning of Period | Charged to Costs and Expenses | Charged to Other Accounts | Deductions | Balance at End of Period | Balance at Beginning of Period | Charged to Costs and Expenses | Charged to Other Accounts | Deductions | Balance at End of Period | ||||||||||||||||||||||||||||||
| (a) | (b) | (a) | (b) | |||||||||||||||||||||||||||||||||||||
2012: | ||||||||||||||||||||||||||||||||||||||||
Allowance for trade receivables | $ | 143 | $ | 27 | $ | (32 | ) | $ | 20 | $ | 118 | |||||||||||||||||||||||||||||
Allowance for other current receivables | 40 | 6 | (7 | ) | (6 | ) | 45 | |||||||||||||||||||||||||||||||||
Allowance for long-term receivables | 19 | (4 | ) | (1 | ) | (2 | ) | 16 | ||||||||||||||||||||||||||||||||
Allowance for deferred taxes | 467 | 61 | (15 | ) | 84 | 429 | ||||||||||||||||||||||||||||||||||
|
|
|
|
| ||||||||||||||||||||||||||||||||||||
| $ | 669 | $ | 90 | $ | (55 | ) | $ | 96 | $ | 608 | ||||||||||||||||||||||||||||||
|
|
|
|
| ||||||||||||||||||||||||||||||||||||
2011: | ||||||||||||||||||||||||||||||||||||||||
Allowance for discounts | $ | 11 | $ | 19 | $ | 1 | $ | 26 | $ | 5 | ||||||||||||||||||||||||||||||
Allowance for doubtful accounts | 277 | 14 | (1 | ) | 93 | 197 | ||||||||||||||||||||||||||||||||||
Allowance for trade receivables | $ | 246 | $ | 25 | $ | (12 | ) | $ | 116 | $ | 143 | |||||||||||||||||||||||||||||
Allowance for other current receivables | 29 | 8 | 6 | 3 | 40 | |||||||||||||||||||||||||||||||||||
Allowance for long-term receivables | 13 | – | 6 | – | 19 | |||||||||||||||||||||||||||||||||||
Allowance for deferred taxes | 400 | 205 | (17 | ) | 121 | 467 | 400 | 205 | (17 | ) | 121 | 467 | ||||||||||||||||||||||||||||
|
|
|
|
|
|
|
|
|
| |||||||||||||||||||||||||||||||
| $ | 688 | $ | 238 | $ | (17 | ) | $ | 240 | $ | 669 | $ | 688 | $ | 238 | $ | (17 | ) | $ | 240 | $ | 669 | |||||||||||||||||||
|
|
|
|
|
|
|
|
|
| |||||||||||||||||||||||||||||||
2010: | ||||||||||||||||||||||||||||||||||||||||
Allowance for discounts | $ | 8 | $ | 49 | $ | 1 | $ | 47 | $ | 11 | ||||||||||||||||||||||||||||||
Allowance for doubtful accounts | 138 | 89 | 82 | 32 | 277 | |||||||||||||||||||||||||||||||||||
Allowance for trade receivables | $ | 121 | $ | 127 | $ | 70 | $ | 72 | $ | 246 | ||||||||||||||||||||||||||||||
Allowance for other current receivables | 20 | 11 | 5 | 7 | 29 | |||||||||||||||||||||||||||||||||||
Allowance for long-term receivables | 5 | – | 8 | – | 13 | |||||||||||||||||||||||||||||||||||
Allowance for deferred taxes | 97 | 30 | 305 | 32 | 400 | 97 | 30 | 305 | 32 | 400 | ||||||||||||||||||||||||||||||
|
|
|
|
|
|
|
|
|
| |||||||||||||||||||||||||||||||
| $ | 243 | $ | 168 | $ | 388 | $ | 111 | $ | 688 | $ | 243 | $ | 168 | $ | 388 | $ | 111 | $ | 688 | |||||||||||||||||||||
|
|
|
|
|
|
|
|
|
| |||||||||||||||||||||||||||||||
2009: | ||||||||||||||||||||||||||||||||||||||||
Allowance for discounts | $ | 28 | $ | 35 | $ | 4 | $ | 59 | $ | 8 | ||||||||||||||||||||||||||||||
Allowance for doubtful accounts | 128 | 32 | 13 | 35 | 138 | |||||||||||||||||||||||||||||||||||
Allowance for deferred taxes | 84 | 19 | 13 | 19 | 97 | |||||||||||||||||||||||||||||||||||
|
|
|
|
| ||||||||||||||||||||||||||||||||||||
| $ | 240 | $ | 86 | $ | 30 | $ | 113 | $ | 243 | |||||||||||||||||||||||||||||||
|
|
|
|
| ||||||||||||||||||||||||||||||||||||
Notes:
| (a) | Primarily related to divestitures, acquisitions and currency translation. |
| (b) | Represents charges for which allowances were created. |
S-2