UNITED STATES

SECURITIES AND EXCHANGE COMMISSION

Washington, D.C. 20549


FORM 10-K


x

ANNUAL REPORT PURSUANT TO SECTION 13 OR 15(d) OF THE SECURITIES EXCHANGE ACT OF 1934

For the fiscal year ended December 31, 20112014

OR

OR

¨

TRANSITION REPORT PURSUANT TO SECTION 13 OR 15(d) OF THE SECURITIES EXCHANGE ACT OF 1934

For the transition period from             to             

Commission file number 001-34580


(Exact name of registrant as specified in its charter)


Incorporated in Delaware

26-1911571

(State or other jurisdiction of

incorporation or organization)

(I.R.S. Employer

Identification No.)

1 First American Way, Santa Ana, California 92707-5913

(Address of principal executive offices) (Zip Code)

(714) 250-3000

Registrant’s telephone number, including area code


Securities registered pursuant to Section 12(b) of the Act:


Common

Common

New York Stock Exchange

(Title of each class)

(Name of each exchange on which registered)

Securities registered pursuant to Section 12(g) of the Act:

None


None

Indicate by check mark if the registrant is a well-known seasoned issuer, as defined in Rule 405 of the Securities Act.    Yes  x    No  ¨

Indicate by check mark if the registrant is not required to file reports pursuant to Section 13 or Section 15(d) of the Act.    Yes  ¨    No  x

Indicate by check mark whether registrant: (1) has filed all reports required to be filed by Section 13 or 15(d) of the Securities Exchange Act of 1934 during the preceding 12 months (or for such shorter period that the registrant was required to file such reports), and (2) has been subject to such filing requirements for the past 90 days.    Yes  x    No  ¨

Indicate by check mark whether the registrant has submitted electronically and posted on its corporate Web site, if any, every Interactive Data File required to be submitted and posted pursuant to Rule 405 of Regulation S-T (§ 232.405 of this chapter) during the preceding 12 months (or for such shorter period that the registrant was required to submit and post such files).    Yes  x    No  ¨

Indicate by check mark if disclosure of delinquent filers pursuant to Item 405 of Regulation S-K (§ 229.405) is not contained herein, and will not be contained, to the best of registrant’s knowledge, in definitive proxy or information statements incorporated by reference in Part III of this Form 10-K or any amendment to this Form 10-K.  x

Indicate by check mark whether the registrant is a large accelerated filer, an accelerated filer, a non-accelerated filer, or a smaller reporting company. See definitions of “large accelerated filer,” “accelerated filer” and “smaller reporting company” in Rule 12b-2 of the Exchange Act.


Large accelerated filer  x

Accelerated filer  ¨

Non-accelerated filer  ¨  (Do not check if a smaller reporting company)

Smaller reporting company  ¨

Indicate by check mark whether the registrant is a shell company (as defined in Rule 12b-2 of the Act).    Yes  ¨    No  x

The aggregate market value of voting and non-voting common equity held by non-affiliates of the registrant as of June 30, 20112014 was $1,626,920,063.

$2,921,903,015.

On February 15, 2012,18, 2015, there were 105,445,082107,781,233 shares of common stock outstanding.

DOCUMENTS INCORPORATED BY REFERENCE

Portions of the registrant’s definitive proxy statement with respect to the 20122015 annual meeting of the stockholders are incorporated by reference in Part III of this report. The definitive proxy statement or an amendment to this Form 10-K will be filed no later than 120 days after the close of registrant’s fiscal year.


FIRST AMERICAN FINANCIAL CORPORATION

AND SUBSIDIARY COMPANIES

INFORMATION INCLUDED IN REPORT

PART I

Item 1.

Business

6

Item 1A.

Risk Factors

12

Item 1B.

Unresolved Staff Comments

18

Item 2.

Properties

19

Item 3.

Legal Proceedings

19

Item 4.

Mine Safety Disclosures

21

PART II

Item 5.

Market for Registrant’s Common Equity, Related Stockholder Matters and Issuer Purchases of Equity Securities

22

Item 6.

Selected Financial Data

24

Item 7.

Management’s Discussion and Analysis of Financial Condition and Results of Operations

25

Item 7A.

Quantitative and Qualitative Disclosures about Market Risk

46

Item 8.

Financial Statements and Supplementary Data

48

Item 9.

Changes in and Disagreements with Accountants on Accounting and Financial Disclosure

112

Item 9A.

Controls and Procedures

112

Item 9B.

Other Information

112

PART III

PART IV

Item 15.

Exhibits and Financial Statement Schedules

115


CERTAIN STATEMENTS IN THIS ANNUAL REPORT ON FORM 10-K, INCLUDING BUT NOT LIMITED TO THOSE RELATING TO:

·

SAVINGS TO BE ACHIEVED THROUGH EXPENSE MANAGEMENT EFFORTS;

THE COMPANY’S PURSUIT OF TARGETED GROWTH OPPORTUNITIES IN ITS CORE BUSINESS AND EVALUATIONTHE BUILDING, EXPANSION AND MANAGEMENT OF ADJACENT, COMPLIMENTARY BUSINESS SPACES;ITS RELATED BUSINESSES, INCLUDING THROUGH ACQUISITIONS;

·

THE MAKING OF INVESTMENTS DESIGNED TO IMPROVE THE CUSTOMER EXPERIENCE;

·

THE EFFECT OF A DECREASE IN PRODUCTS OR SERVICES PURCHASED BY OR FOR THE BENEFIT OF THE COMPANY’S MOST SIGNIFICANT CUSTOMERS;

·

FUTURE ACTIONS TO BE TAKEN IN CONNECTION WITH THE COMPANY’S REVIEW OF ITS AGENCY RELATIONSHIPS;

·

INTERNATIONAL EXPANSION AND THE ACCEPTANCE OF TITLE INSURANCE INTERNATIONALLY;

THE COMPANY’S CONTINUED PRACTICE OF ASSUMING AND CEDING LARGE TITLE INSURANCE RISKS THROUGH REINSURANCE;

·

THE COMPETITIVE IMPORTANCE OFCONTINUED PRICE AND QUALITY AND TIMELINESS OF SERVICE;AGENCY SPLIT ADJUSTMENTS;

·

CONTINUED PRICE ADJUSTMENTS;THE EFFECTS OF THE CONSUMER FINANCIAL PROTECTION BUREAU’S INTEGRATED DISCLOSURE RULES;

·

THE ADEQUACY OF THE ALLOWANCEAGAINST FORESEEABLE LOAN LOSSES;

THE LIKELIHOOD OF CHANGES IN EXPECTED ULTIMATE LOSSES AND CORRESPONDING LOSS RATES AND RELATED ASSUMPTIONS;

·

ANTICIPATED RECOVERIES IN CONNECTION WITH LARGE COMMERCIAL CLAIMS;

·

THE LIKELIHOOD AND EFFECTS OF CYBER ATTACKS AND SIMILAR INCIDENTS;

·

THE EFFECT OF LAWSUITS, REGULATORY AUDITS AND INVESTIGATIONS AND OTHER LEGAL PROCEEDINGS ON THE COMPANY’S FINANCIAL CONDITION, RESULTS OF OPERATIONS OR CASH FLOWS;

·

FUTURE PAYMENT OF DIVIDENDS;

·

THE HOLDING OFAND EXPECTED CASH FLOW FROMDEBT SECURITIES AND ASSUMPTIONS RELATING THERETO;

·

POTENTIAL FUTURE IMPAIRMENT CHARGESAND RELATEDASSUMPTIONS;

·

THE COMPANY’S INTENTIONS WITH RESPECT TO ITS INVESTMENT IN CORELOGIC STOCK;

THE EFFECT OF PENDING ACCOUNTING PRONOUNCEMENTS ON THE COMPANY’S FINANCIAL STATEMENTS;

·

AN IMPROVING ECONOMY AND STRONGER HOUSING MARKET, INCLUDING MODEST GROWTH IN THE IMPACT OF UNCERTAINTYHOME PURCHASE MARKET WITH SOME IMPROVEMENT IN GENERAL ECONOMIC CONDITIONSTRANSACTION LEVELS AND TIGHT MORTGAGE CREDIT;PRICES, BUT AN UNCERTAIN REFINANCE MARKET;

·

CONTINUED DECLINESSTRENGTH IN FORECLOSURE REVENUES, COSTS ASSOCIATEDTHE COMMERCIAL MARKET, BUT WITH DEFENDING INSURED’S TITLE TO FORECLOSED PROPERTIES, AND THE IMPACT OF FORECLOSURE MATTERS ON THE COMPANY;DECLINING GROWTH RATES;

·

EXPENSE MANAGEMENT EFFORTS, INCLUDING THE COMPANY’S CONTINUED MONITORING OF ORDER VOLUMES AND RELATED STAFFING LEVELS, AND ADJUSTMENTS TO STAFFING LEVELS AS NECESSARY;

·

EXPECTED FORECLOSURES AND FORECLOSURE PROCESSING ACTIVITY;

·

UNCERTAINTY AND VOLATILITY IN THE CURRENT ECONOMIC ENVIRONMENT AND ITS EFFECT ON TITLE CLAIMS;

·

THE VARIANCE BETWEEN ACTUAL CLAIMS EXPERIENCE AND PROJECTIONS AND FUTURE RESERVE ADJUSTMENTS BASED ON UPDATED ESTIMATES OF FUTURE CLAIMS;

·

IMPROVEMENT OF SPECIALTY INSURANCE PROFIT MARGINS AS REVENUES INCREASE;

·

PROJECTED INTEREST AND BENEFIT PLAN EXPENSES;

·

THE SUFFICIENCY OF THE COMPANY’S RESOURCES TO SATISFY OPERATIONAL CASH REQUIREMENTS;


·

THE INTENDED USE OF PROCEEDS FROM THE COMPANY’S ISSUANCE OF SENIOR SECURED NOTES;

·

THE TIMING OF CLAIM, PENSION AND SUPPLEMENTAL BENEFIT PLAN PAYMENTS;

·

EXPECTED MATURITY DATESASSUMPTIONS REGARDING THE LEVEL OF CERTAIN ASSETSTHE COMPANY’S INTEREST RATE RISK, EQUITY PRICE RISK, FOREIGN CURRENCY RISK AND LIABILITIES THAT ARE SENSITIVE TO CHANGES IN INTEREST RATES;CREDIT RISK;

·

THE UNITED STATES GOVERNMENT’S COMMITMENT TO ENSURING THAT FANNIE MAE AND FREDDIE MAC HAVE SUFFICIENT CAPITAL TO PERFORM UNDER GUARANTEES ISSUED AND TO MEET THEIR DEBT OBLIGATIONS;

·

ASSUMPTIONS UNDERLYING GOODWILL VALUATIONS;

·

THE REALIZATION OF TAX BENEFITS ASSOCIATED WITH CERTAIN LOSSES,POTENTIAL TAX PROVISIONS IN CONNECTION WITH THE EARNINGS OF FOREIGN SUBSIDIARIES AND THE ADEQUACY OF TAX AND RELATED INTEREST ESTIMATES IN CONNECTION WITH EXAMINATIONSEXAMINATIONS BY TAX AUTHORITIES;

·

CANADIAN EXCISE TAXES FOR SERVICES PROVIDED TO LENDERS;

·

NET ACTUARIAL LOSS AND PRIOR SERVICE CREDIT RELATING TO PENSION PLANS;

·

EXPECTED BENEFIT AND PENSION PLAN CONTRIBUTIONS, PAYMENTS AND INVESTMENT STRATEGYSTRATEGY AND RETURNASSET AND LIABILITY ASSUMPTIONS;

·

COMPENSATION COST RECOGNITION;RECOGNITION ASSOCIATED WITH UNVESTED RESTRICTED STOCK UNITS AND STOCK OPTIONS; AND

·

RESERVES FOR LIABILITIES ALLOCATED TOEXPECTED BENEFITS OF THE COMPANY IN CONNECTION WITH THE SEPARATION FROM THE FIRST AMERICAN CORPORATION,FORUM SELECTION BYLAW AMENDMENT,


ARE FORWARD LOOKING STATEMENTS WITHIN THE MEANING OF SECTION 27A OF THE SECURITIES ACT OF 1933, AS AMENDED, AND SECTION 21E OF THE SECURITIES EXCHANGE ACT OF 1934, AS AMENDED. THESE FORWARD-LOOKING STATEMENTS MAY CONTAIN THE WORDS “BELIEVE,” “ANTICIPATE,” “EXPECT,” “PLAN,” “PREDICT,” “ESTIMATE,” “PROJECT,” “WILL BE,” “WILL CONTINUE,” “WILL LIKELY RESULT,” OR OTHER SIMILAR WORDS AND PHRASES.

RISKS AND UNCERTAINTIES EXIST THAT MAY CAUSE RESULTS TO DIFFER MATERIALLY FROM THOSE SET FORTH IN THESE FORWARD-LOOKING STATEMENTS. FACTORS THAT COULD CAUSE THE ANTICIPATED RESULTS TO DIFFER FROM THOSE DESCRIBED IN THE FORWARD-LOOKING STATEMENTS INCLUDE:

·

INTEREST RATE FLUCTUATIONS;

·

CHANGES IN THE PERFORMANCE OF THE REAL ESTATE MARKETS;

·

VOLATILITY IN THE CAPITAL MARKETS;

·

UNFAVORABLE ECONOMIC CONDITIONS;

·

IMPAIRMENTS IN THE COMPANY’S GOODWILL OR OTHER INTANGIBLE ASSETS;

·

FAILURES AT FINANCIAL INSTITUTIONS WHERE THE COMPANY DEPOSITS FUNDS;

·

CHANGES IN APPLICABLE GOVERNMENT REGULATIONS;

·

HEIGHTENED SCRUTINY BY LEGISLATORS AND REGULATORS OF THE COMPANY’S TITLE INSURANCE AND SERVICES SEGMENT AND CERTAIN OTHER OF THE COMPANY’S BUSINESSES;

·

THE CONSUMER FINANCIAL PROTECTION BUREAU’S EXERCISE OF ITS BROAD RULEMAKING AND SUPERVISORY POWERS;

·

COMPLIANCE WITH THE CONSUMER FINANCIAL PROTECTION BUREAU’S INTEGRATED DISCLOSURE RULES;

·

REGULATION OF TITLE INSURANCE RATES;

·

REFORM OF GOVERNMENT-SPONSORED MORTGAGE ENTERPRISES;

·

LIMITATIONS ON ACCESS TO PUBLIC RECORDS AND OTHER DATA;


·

PRODUCT MIGRATION;CHANGES IN RELATIONSHIPS WITH LARGE MORTGAGE LENDERS AND GOVERNMENT-SPONSORED ENTERPRISES;

·

CHANGES RESULTING FROM INCREASES IN THE SIZE OF THE COMPANY’S CUSTOMERS;

CHANGES IN MEASURES OF THE STRENGTH OF THE COMPANY’S TITLE INSURANCE UNDERWRITERS, INCLUDING RATINGS AND STATUTORY SURPLUSES;CAPITAL AND SURPLUS;

·

LOSSES IN THE COMPANY’S INVESTMENT PORTFOLIO;

·

EXPENSES OF AND FUNDING OBLIGATIONS TO THE PENSION PLAN;

·

MATERIAL VARIANCE BETWEEN ACTUAL AND EXPECTED CLAIMS EXPERIENCE;

·

DEFALCATIONS, INCREASED CLAIMS OR OTHER COSTS AND EXPENSES ATTRIBUTABLE TO THE COMPANY’S USE OF TITLE AGENTS;

·

ANY INADEQUACY IN THE COMPANY’S RISK MITIGATION EFFORTS;

·

SYSTEMS DAMAGE, FAILURES, INTERRUPTIONS AND INTRUSIONS, WIRE TRANSFER ERRORS OR UNAUTHORIZED DATA DISCLOSURES;

·

INABILITY TO REALIZE THE BENEFITS OF THE COMPANY’S OFFSHORE STRATEGY;

·

INABILITY OF THE COMPANY’S SUBSIDIARIES TO PAY DIVIDENDS OR REPAY FUNDS; AND

·

INABILITY TO REALIZE THE BENEFITS OF, AND CHALLENGES ARISING FROM, THE COMPANY’S ACQUISITION STRATEGY; AND

·

OTHER FACTORS DESCRIBED IN THIS ANNUAL REPORT ON FORM 10-K.

THE FORWARD-LOOKING STATEMENTS SPEAK ONLY AS OF THE DATE THEY ARE MADE. THE COMPANY DOES NOT UNDERTAKE TO UPDATE FORWARD-LOOKING STATEMENTS TO REFLECT CIRCUMSTANCES OR EVENTS THAT OCCUR AFTER THE DATE THE FORWARD-LOOKING STATEMENTS ARE MADE.

PART I


Item 1.    Business


PART I

Item 1.

Business

The Company

First American Financial Corporation (the “Company”) was incorporated in the state of Delaware in January 2008 to serve as the holding company of The First American Corporation’s (“TFAC’s”) financial services businesses following the spin-off of those businesses from TFAC (the “Separation”). The Separation was consummated on June 1, 2010, at which time the Company’s common stock was listed on the New York Stock Exchange under the ticker symbol “FAF.” In connection with the Separation, TFAC reincorporated in Delaware and assumed the name CoreLogic, Inc. The businesses operated by the Company’s subsidiaries have, in some instances, been in existence since the late 1800s.

The Company has its executive offices at 1 First American Way, Santa Ana, California 92707-5913. The Company’s telephone number is (714) 250-3000.

General

The Company, through its subsidiaries, is engaged in the business of providing financial services through its title insurance and services segment and its specialty insurance segment. The title insurance and services segment provides title insurance, closing and/or escrow services and similar or related services domestically and internationally in connection with residential and commercial real estate transactions. It also provides products, services and solutions involving the use of real property related data, including data derived from its proprietary database, which are designed to mitigate risk or otherwise facilitate real estate transactions. It maintains, manages and provides access to title plant records and images and, in addition, provides banking, trust and investment advisory services. The specialty insurance segment issues property and casualty insurance policies and sells home warranty products. In addition, our corporate function consists of certain financing facilities as well as the corporate services that support our business operations. Financial information regarding these business segments and the corporate function is included in “Item 7. Management’s Discussion and Analysis of Financial Condition and Results of Operations” and “Item 8. Financial Statements”Statements and Supplementary Data” of Part II of this report.

The substantial majority of our business is dependent upon activity in the real estate and mortgage markets, which are cyclical and seasonal. DuringIn the most recent real estate and mortgage cycle, we have primarily emphasized expense control and operational efficiency. However, in conjunction with our continuing efforts pertaining to operating efficiency,current market environment, we are pursuing targeted growth opportunities and evaluating adjacent business spaces which are complimentary tofocused on growing our core title insurance and settlementclosing services businesses.business, building and expanding our data assets to strengthen our core business and offer additional solutions for our customers, and managing complementary businesses in ways that support our core business. We are also focused on continued improvement of our customers’ experiences with our products, services and solutions, and we remain committed to efficiently managing our business to market conditions throughout business cycles.

Title Insurance and Services Segment

Our title insurance and services segment issues title insurance policies on residential and commercial property in the United States and offers similar or related products and services internationally. This segment also provides closing and/or escrow services,services; accommodates tax-deferred exchanges of real estate; provides products, services and solutions involving the use of real property related data designed to mitigate risk or otherwise facilitate real estate transactions; maintains, manages and provides access to title plant records and imagesimages; and provides banking, trust and investment advisory services. In 2011, 2010,2014, 2013, and 20092012 the Company derived 92.6%92.0%, 92.5%,92.9% and 93.1%92.5% of its consolidated revenues, respectively, from this segment.

Overview of Title Insurance Industry

In manymost instances mortgage lenders and purchasers of real estate desire to be protected from loss or damage in the event of defects in the title they acquire. Title insurance is a means of providing such protection.

Title Policies.    Title insurance policies insure the interests of owners or lenders against defects in the title to real property. These defects include adverse ownership claims, liens, encumbrances or other matters affecting

title. Title insurance policies generally are issued on the basis of a title report, which is typically prepared after a search of one or more of public records, maps, documents and prior title policies to ascertain the existence of easements, restrictions, rights of way, conditions, encumbrances or other matters affecting the title to, or use of, real property. In certain limited instances, a visual inspection of the property is also made. To facilitate the preparation of title reports, copies and/or abstracts of public records, maps, documents and prior title policies may be compiled and indexed to specific properties in an area. This compilation is known as a “title plant.”


The beneficiaries of title insurance policies usually are usually real estate buyers and mortgage lenders. A title insurance policy indemnifies the named insured and certain successors in interest against title defects, liens and encumbrances existing as of the date of the policy and not specifically excepted from its provisions. The policy typically provides coverage for the real property mortgage lender in the amount of its outstanding mortgage loan balance and for the buyer in the amount of the purchase price of the property. In some cases the policy might provide insurance in a greater amount, such as where the buyer anticipates constructing improvements on the property. CoverageThe potential for claims under a title insurance policy issued to a mortgage lender generally terminatesceases upon repayment of the mortgage loan. CoverageThe potential for claims under a title insurance policy issued to a buyer generally terminatesceases upon the sale or transfer of the insured property.

Before issuing title policies, title insurers typically seek to limit their risk of loss by accurately performing title searches and examinations. The majormajority of the expenses of a title company typically relate to such searches and examinations, the curing of title defects identified by such searches and examinations, the preparation of preliminary reports or commitments and the maintenance of title plants, as well as related sales and administrative expenses, and not from claim losses as in the case of property and casualty insurers.

The Closing Process.    Title insurance is essential to the real estate closing process in most transactions involving real property mortgage lenders. In a typical residential real estate sale transaction where title insurance is issued, a real estate broker, lawyer, developer, lender, closer or closerother participant involved in the transaction orders the title insurance on behalf of an insured. Once the order has been placed, a title insurance company or an agent typically conducts a title search to determine the current status of the title to the property. When the search is complete, the title insurer or agent prepares, issues and circulates a commitment or preliminary report to the parties to the transaction. The commitment or preliminary report identifies the conditions, exceptions and/or limitations that the title insurer intends to attach to the policy and identifies items appearing on the title that must be eliminated prior to closing.

The closing or settlement function, sometimes called an escrow in the western United States, is, depending on the local custom in the region, performed by a lawyer, an escrow company or a title insurance company or agent, generally referred to as a “closer.” Once documentation has been prepared and signed, and any required mortgage lender payoff demands are obtained, the transaction closes. The closer typically records the appropriate title documents and arranges the transfer of funds to pay off prior loans and extinguish the liens securing such loans. Title policies are then issued, typically insuring the priority of the mortgage of the real property mortgage lender in the amount of its mortgage loan and the buyer in the amount of the purchase price. The time between the opening of the title order and the issuance of the title policy is usually between 30 and 90 days. Before a closing takes place, however, the closer typically requests that the title insurer or agent provide an update to the commitment to discover any adverse matters affecting title and, if any are found, works with the seller to eliminate them so that the title insurer or agent issues the title policy subject only to those exceptions to coverage which are acceptable to the title insurer, the buyer and the buyer’s lender.

Issuing the Policy: Direct vs. Agency.  A title insurance policy can be issued directly by a title insurer or indirectly on behalf of a title insurer through agents, which may not themselves be licensed as insurers.usually operate independently of the title insurer and often issue policies for more than one insurer. Where the policy is issued by a title insurer, the search is performed by or on behalf of the title insurer, and the premium is collected and retained by the title insurer. Where the policy is issued by an agent, the agent typically performs the search, examines the title, collects the premium and retains a portion of the premium. The agent remits the remainder of the premium to the title insurer as compensation for the insurer bearing the risk of loss in the event a claim is made under the policy and for other services the insurer may provide. The percentage of the premium

retained by an agent varies from region to region. A title insurer is obligated to pay title claims in accordance with the terms of its policies, regardless of whether it issues its policy directly or indirectly through an agent. UnderIn addition, as part of the policy, a title insurer may issue a closing protection letter that protects a lender from certain misuse of funds by the title insurer’s agent. When a loss to the title insurer occurs under a policy issued through an agent or a closing protection letter, under certain circumstances the title insurer may seek recovery of all or a portion of thisthe loss from the agent or itsthe agent’s insurance carrier.

Premiums.Premiums.    The premium for title insurance is typically due and earned in full when the real estate transaction is closed. Premiums generally are calculated with reference to the policy amount. The premium charged by a title insurer or an agent is subject to regulation in most areas. Such regulations vary from state to state.


Our Title Insurance Operations

Overview.     We conduct our title insurance and closing business through a network of direct operations and agents. Through this network, we issue policies in the 49 states that permit the issuance of title insurance policies and the District of Columbia. We also offer title insurance, closing services and similar or related products and services, either directly or through partnersthird parties in foreign countries, including Canada, the United Kingdom, Australia and various other established and emerging markets as described in the “International Operations” section below.

Customers, Sales and Marketing.  The mortgage markets in the United States and Canada are concentrated. We believe that threetwo institutions, Bank of America Corporation,Wells Fargo & Company and JPMorgan Chase & Co. and Wells Fargo & Company,, together with their affiliates, originate or are involved in approximately 50%25% of the mortgages in the United States. Each of these institutions purchases title insurance policies and other products and services from us. These institutions also benefit from products and services which are purchased for their benefit by others, such as title insurance policies purchased by borrowers as a condition to the making of a loan. The refusal of one or more of these or other significant lending institutions to purchase products and services from us or to accept our products and services that are to be purchased for their benefit could have a material adverse effect on the title insurance and services segment.

We distribute our title insurance policies and related products and services (directly as well as through our agents) through variousdirect and agent channels. In our “distributed”direct channel, the direct distribution of our policies and related products and services occurs through local sales representatives located at hundreds ofnumerous offices throughout the United States where real estate transactions are handled. Title insurance policies issued and other products and services delivered through this channel are primarily delivered in connection with sales and refinances of residential real property, although commercial transactions are also handled through this channel. We also distribute our title policies and related products and services through centralized channels, including a “commercial” channel that is focused on transactions involving commercial real estate, a “national lender” channel dedicated to refinance transactions involving large financial institutions, a “default” channel related to defaults and other pre-foreclosure activity, as well as foreclosures, and a “homebuilders” channel focused on newly constructed residential property.

Within eachthe direct channel, our sales and marketing efforts are focused on the primary sources of business referrals. For the distributedresidential business these arereferred by local or decentralized customers, we market to real estate agents and brokers, mortgage brokers, real estate attorneys, mortgage originators, homebuilders and escrow service providers. For refinance and default related business referred by customers with centrally managed platforms, we market to mortgage originators, servicers, and governmental sponsored enterprises. For the commercial channelbusiness we market primarily to investors, including real estate investment trusts, insurance companies and asset managers, as well as to law firms, commercial banks, investment banks, mortgage brokers and the owners of commercial real estate. In theWe also market directly to national lender channel and the default channel our marketing efforts arehomebuilders focused on mortgage originators and servicers as well as governmental sponsored enterprises. We market primarily to homebuilders in the centralized homebuilder channel. Our marketing efforts emphasize our financial strength, the quality and timeliness of our services, process innovation and our national presence.

Wenewly constructed residential property. In some instances we may supplement the efforts of our sales force with general advertising in various trademarketing. Our marketing efforts emphasize the quality and professional journals.timeliness of our services, our financial strength, process innovation and our national presence.

Underwriting. Before a title insurance policy is issued, a number of underwriting decisions are made. For example, matters of record revealed during the title search may require a determination as to whether an

exception should be taken in the policy. We believe that it is important for the underwriting function to operate efficiently and effectively at all decision-making levels so that transactions may proceed in a timely manner. To perform this function, we have underwriters at the regional, divisional and corporate levels with varying levels of underwriting authority.

Agency Operations. As described above, we also issue title insurance policies directly as well as through a network of agents. Our agreements with our agents state the conditions under which the agent is authorized to issue title insurance policies on our behalf. The agency agreement also prescribes the circumstances under which the agent may be liable to us if a policy loss occurs. Such agency agreements typically are terminable without cause after a specified notice period has been met and are terminable immediately for cause. As is standard in our industry, our agents typically operate with a substantial degree of independence from us.us and frequently act as agents for other title insurers. We evaluate the profitability of our agency relationships on an ongoing basis, including a review of premium splits, deductibles and claims. As a result, from time to time we may terminate or renegotiate the terms of manysome of our agency relationships.

In determining whether to engage an independent agent, we often obtain information about the agent, including the agent’s experience and background. We maintain loss experience records for each agent and also maintain agent representatives and agent auditors. Our agents typically are typically subject to routine audit or examination. In addition to these routine examinations, an expanded examination typically willother examinations may be triggered if certain “warning signs” are evident. Warning signs that can trigger an expanded examination include the failure to implement required accounting controls, shortages of escrow funds and failure to remit title insurance premiums on a timely basis. Adverse findings in an agency audit may result in various actions, including, if warranted, termination of the agency relationship.


International Operations.  We provide products and services in numerous countries outside of the United States, and our international operations accounted for approximately 9.9 percent7.6% of our title insurance and services segment revenues in 2011.2014. Today we have direct operations and a physical presence in 12several countries, including Canada, and the United Kingdom.Kingdom and Australia. Additionally, through local companies we have partnered with leading local companies to provideprovided products and services in many other countries. While reliable data are not available, we believe that we have the largest market share for title insurance outside of the United States. The Company’s revenues from external customers and long-lived assets are broken down between domestic and foreign operations in Note 2322 Segment Financial Information to the consolidated financial statements included in “Item 8. Financial Statements and Supplementary Data” of Part II of this report.

Our range of international products and services is designed to lower our clients’ risk profiles and reduce their operating costs through enhanced operational efficiencies. In established markets, primarily British Commonwealth countries, we have combined title insurance with uniquecustomized processing offerings to enhance the speed and efficiency of the mortgage and conveyancing processes. In these markets we also offer products designed to mitigate risk and otherwise facilitate real estate transactions. As financial institutions worldwide face increased capital requirements and heightened risk management requirements, we believe that title insurance could become a more widely accepted loss mitigation tool internationally. As the demand for risk mitigation products and greater efficiency in the real estate settlement process continues to grow, we believe we are well situated to seize these opportunities because of our industry expertise, financial strength, existing international licenses and contacts around the world. For example, we are licensed or otherwise authorized to do business in over 25 countries and we have partnered with entities authorized to do business in various additional countries.

Our international operations present risks that may not exist to the same extent in our domestic operations, including those associated with differences in the nature of the products provided, the scope of coverage provided by those products and the manner in which risk is underwritten. Limited claims experience in foreign jurisdictions makes it more difficult to set prices and reserve rates. There may also be risks associated with differences in legal systems and/or unforeseen regulatory changes.

Title Plants. Our networkcollection of title plants constitutes one of our principal assets. A title search is typically conducted by searching the abstracted information from public records or utilizing a title plant holding information abstracted information from public records. While public title records generally are indexed by reference to the names of the parties to a given recorded document, our title plants primarily arrange their records on a geographic basis. Because of this difference, title plant records generally may be searched more efficiently, which we believe reduces the risk of errors associated with the search. OurMany of our title plants also index prior policies, adding to searching efficiency. Certain officeslocations utilize jointly owned plants or utilize a plant under a joint user agreement with other title companies. In addition to these ownership interests, we are in the business of maintaining, managing and providing access to title plant records and images that may be owned by us or other parties. We believe that our title plants, whether wholly or partially owned or utilized under a joint user agreement, are among the bestmost comprehensive in the industry.

Reserves for Claims and Losses.Losses.    We provide for losses associated with title insurance policies, closing protection letters and other risk based products based upon our historical experience and other factors by a charge to expense when the related premium revenue is recognized. The resulting reserve for incurred but not reported claims, together with the reserve for known claims, reflects management’s best estimate of the total costs required to settle all claims reported to us and claims incurred but not reported, and are considered to be adequate for such purpose. Each period the reasonableness of the estimated reserves is assessed; if the estimate requires adjustment, such an adjustment is recorded.

Reinsurance and Coinsurance.    We plan to continue our practice of assuming and ceding large title insurance risks through the mechanism of reinsurance. In reinsurance arrangements, the primary insurer retains a certain amount of risk under a policy and cedes the remainder of the risk under the policy to the reinsurer. The primary insurer pays the reinsurer a premium in exchange for accepting this risk of loss. The primary insurer generally remains liable to its insured for the total risk, but is reinsured under the terms of the reinsurance agreement. Prior to 2010, our title insurance arrangements primarily involved other industry participants. Beginning in January of 2010, we established a global reinsurance program involving treaty reinsurance provided by a global syndicate of highly rated non-industry reinsurers. In additionSubject to covering claims under policies issued whilecertain limitations, the program is in effect, the program also generally covers claims made under policies issued in certain prior years, as long as the losses are discovered while the program is in effect.

We also serve as a coinsurer in connection with certain commercial transactions. In a coinsurance scenario, two or more insurers are selected by the insured and typically issue separate policies with respect to the subject property, with each coinsurer liable to the extent provided in the policy that it issues.

Competition.     The business of providing title insurance and related products and services is highly competitive. The number of competing companies and the size of such companies vary in the different areas in which we conduct business. Generally, in areas of major real estate activity, such as metropolitan and suburban localities, we compete with many other title insurers and agents. Our major nationwide competitors in our principal markets include Fidelity National Financial, Inc., Stewart Title Guaranty Company, Old Republic International Corporation Lender Processing Services, Inc. and their affiliates. In addition to these national competitors, small nationwide, regional and local competitors, as well as numerous agency operations throughout the


country, provide aggressive competition on the local level. Approximately 30 title insurance underwriters are currently members of the American Land Title Association, the title insurance industry’s national trade association. We are currently the second largest provider of title insurance in the United States, based on the most recent American Land Title Association market share data.

We believe that competition for title insurance, closing services and related products and services is based primarily on the quality, price and timeliness of the titlepreparation and issuance of the insurance policy (except in states where a uniform price has been established by a regulator) and the price, quality and timelinessprovision of the related products and services. Customer service is an important competitive factor because parties to real estate transactions are usually concerned with time schedules and costs associated with delays in closing transactions. In certain transactions, such as those involving commercial

properties, financial strength is also important. As part of our on-going strategy, we regularly evaluate our pricing and agent splits, and based on competitive, market and regulatory conditions and claims history, among other factors, intend to continue to adjust our prices and agent splits as and where appropriate.

Trust and Investment Advisory Services.  Our federal savings bank subsidiary offers trust and investment advisory services, deposit services and asset management services.  As of December 31, 2011,2014 this company managed $1.5 billion of assets, administered fiduciary and custodial assets having a market value in excess of $2.8$3.0 billion which includes managed assets of $1.2 billion, had assets of $1.2$2.6 billion, deposits of $1.1$2.4 billion and stockholder’s equity of $118.0$224.8 million.

Lending and Deposit Products.    Products.  During the third quarter of 2011, we began the multi-year process of winding-downwinding down the operations of our industrial bank, First Security Business Bank.  Prior to initiatingIn 2014, we completed this process by selling the wind-down, our industrial bank subsidiary accepted deposits and used these deposits to purchase or originate loans secured by commercial properties primarily in Southern California. Currently, the industrial bank continues to accept and service deposits and to service its existingbank’s outstanding loan portfolio, but is no longer originating or purchasing new loans. As of December 31, 2011, the industrial bank had approximately $100.6 million of deposits and $139.2 million of loans outstanding.

Loans made or acquired during 2011 by the industrial bank totaled $13.5 million, with an average new loan balance of $796 thousand. The average loan balance outstanding at December 31, 2011, was $616 thousand. Loans were made only on a secured basis, at loan-to-value percentages generally less than 70 percent. The majority of the industrial bank’s loans were made on a fixed-to-floating rate basis. The average yield on the industrial bank’s loan portfolio for the year ended December 31, 2011, was 6.51 percent. A number of factors are included in the determination of average yield, principal among which are loan fees and closing points amortized to income, prepayment penalties recorded as income, and amortization of discounts on purchased loans. The industrial bank’s average loan to value was approximately 43 percent at December 31, 2011.

The performance of the industrial bank’s loan portfolio is evaluated on an ongoing basis by management of the industrial bank. The industrial bank places a loan on non-accrual status when three payments become past due. When a loan is placed on non-accrual status, the industrial bank’s general policy is to reverse from income previously accrued but unpaid interest. Income on such loans is subsequently recognized only to the extent that cash is received and future collection of principal is probable. Interest income on non-accrual loans that would have been recognized during the year ended December 31, 2011, if all of such loans had been current in accordance with their original terms, totaled $163 thousand.

The following table sets forth the amount of the industrial bank’s non-performing loans as of the dates indicated.

   Year Ended December 31, 
   2011   2010   2009   2008   2007 
   (in thousands) 

Nonperforming Assets:


Loans accounted for on a nonaccrual basis

  $4,910    $2,441    $603    $—      $—    


Total

  $4,910    $2,441    $603    $—      $—    


Based on a variety of factors concerning the creditworthiness oftransferring its borrowers, the industrial bank determined that it had seven non-performing assets as of December 31, 2011.

The industrial bank’s allowance for loan losses is established through charges to earnings in the form of provision for loan losses. Loan losses are charged to, and recoveries are credited to, the allowance for loan losses. The provision for loan losses is determined after considering various factors, such as loan loss experience, maturity of the portfolio, size of the portfolio, borrower credit history, the existing allowance for loan losses,

current charges and recoveries to the allowance for loan losses, the overall quality of the loan portfolio, and current economic conditions, as determined by management of the industrial bank, regulatory agencies and independent credit review specialists. While many of these factors are essentially a matter of judgment and may not be reduceddeposit liabilities to a mathematical formula, we believe that, in light of the collateral securingthird-party bank and surrendering its loan portfolio, the industrial bank’s current allowance for loan losses is an adequate allowance against foreseeable losses.charter.

The following table provides certain information with respect to the industrial bank’s allowance for loan losses as well as charge-off and recovery activity.

   Year Ended December 31, 
   2011  2010  2009  2008  2007 
   (in thousands, except percentages) 

Allowance for Loan Losses:


Balance at beginning of year

  $3,271   $2,071   $1,600   $1,488   $1,440  


Charge-offs:


Real estate—mortgage

   —      —      —      —      —    

Assigned lease payments

   —      —      —      —      —    


   —      —      —      —      —    


Recoveries:


Real estate—mortgage

   —      —      —      —      —    

Assigned lease payments

   —      —      —      —      —    


   —      —      —      —      —    


Net (charge-offs) recoveries

   —      —      —      —      —    

Provision for losses

   900    1,200    471    112    48  


Balance at end of year

  $4,171   $3,271   $2,071   $1,600   $1,488  


Ratio of net charge-offs during the year to average loans outstanding during the year

   0  0  0  0  0


The adequacy of the industrial bank’s allowance for loan losses is based on formula allocations and specific allocations. Formula allocations are made on a percentage basis, which is dependent on the underlying collateral, the type of loan, general economic conditions and historical losses. Specific allocations are made as problem or potential problem loans are identified and are based upon an evaluation by the industrial bank’s management of the status of such loans. Specific allocations may be revised from time to time as the status of problem or potential problem loans changes.

The following table shows the allocation of the industrial bank’s allowance for loan losses and the percent of loans in each category to total loans at the dates indicated.

  Year Ended December 31, 
  2011  2010  2009  2008  2007 
  Allowance  % of
Loans
  Allowance  % of
Loans
  Allowance  % of
Loans
  Allowance  % of
Loans
  Allowance  % of
Loans
 
  (in thousands, except percentages) 

Loan Categories:


Real estate-mortgage

  4,171    100   $3,271    100   $2,071    100   $1,600    100   $1,488    100  

Other

  —      —      —      —      —      —      —      —      —      —    


 $4,171    100   $3,271    100   $2,071    100   $1,600    100   $1,488    100  


Specialty Insurance Segment

Property and Casualty Insurance.  Our property and casualty insurance business provides insurance coverage to residential homeowners and renters for liability losses and typical hazards such as fire, theft, vandalism and other types of property damage. We are licensed to issue policies in all 50 states and the District of Columbia and actively issue policies in 4346 states. In our largest market, California,certain markets we also offer preferred risk auto insurance to better compete with other carriers offering bundled home and auto insurance. We market our property and casualty insurance business using both direct distribution channels, including cross-selling through our existing closing-service activities, and through a network of independent brokers. Reinsurance is used extensively to limit risk associated with natural disasters such as windstorms, winter storms, wildfires and earthquakes.

Home Warranties.  Our home warranty business provides residential service contracts that cover residential systems, such as heating and air conditioning systems, and certain appliances against failures that occur as the result of normal usage during the coverage period. Most of these policies are issued on resale residences, although policies are also available in some instances for new homes. Coverage is typically for one year and is renewable annually at the option of the contract holder and upon our approval. Coverage and pricing typically vary by geographic region. Fees for the warranties generally are paid at the closing of the home purchase or directly by the consumer. Renewal premiums may be paid by a number of different options. In addition, under the contract, the holder is responsible for a service fee for each trade call. First year warranties primarily are marketed through real estate brokers and agents, althoughand we also market directly to consumers. We generally sell renewals directly to consumers. Our home warranty business currently operates in 39 states and the District of Columbia.

Corporate

The Company’s corporate function consists primarily of certain financing facilities as well as the corporate services that support our business operations.

Regulation

Many of our subsidiaries are subject to extensive regulation by applicable domestic or foreign regulatory agencies. The extent of such regulation varies based on the industry involved, the nature of the business conducted by the subsidiary (for example, licensed title insurers are subject to a heightened level of regulation compared to underwritten title companies)companies or agencies), the subsidiary’s jurisdiction of organization and the jurisdictions in which it operates. In addition, the Company is subject to regulation as both an insurance holding company and a savings and loan holding company.

Our domestic subsidiaries that operate in the title insurance industry or the property and casualty insurance industry are subject to regulation by state insurance regulators. Each of our underwriters, or insurers, is regulated primarily by the insurance department or equivalent governmental body within the jurisdiction of its organization, which oversees compliance with the laws and regulations pertaining to such insurer. For example, our primary title insurance underwriter is a CaliforniaNebraska corporation and, accordingly, is primarily regulated by the CaliforniaNebraska Department of Insurance. Insurance regulations


pertaining to insurers typically place limits on, among other matters, the ability of the insurer to pay dividends to its parent company or to enter into transactions with affiliates. They also may require approval of the insurance commissioner prior to a third party directly or indirectly acquiring “control” of the insurer.

In addition, our insurers are subject to the laws of other jurisdictions in which they transact business, which laws typically establish supervisory agencies with broad administrative powers relating to issuing and revoking licenses to transact business, regulating trade practices, licensing agents, approving policy forms, accounting practices and financial practices, establishing requirements pertaining to reserves and capital and surplus as

regards policyholders, requiring the deferral of a portion of all premiums in a reserve for the protection of policyholders and the segregation of investments in a corresponding amount, establishing parameters regarding suitable investments for reserves, capital and surplus, and approving rate schedules. The manner in which rates are established or changed ranges from states which promulgate rates, to states where individual companies or associations of companies prepare rate filings which are submitted for approval, to a few states in which rate changes do not need to be filed for approval. In addition, each of our insurers is subject to periodic examination by regulatory authorities both within its jurisdiction of organization as well as the other jurisdictions where it is licensed to conduct business.

Our foreign insurance subsidiaries are regulated primarily by regulatory authorities in the regions, provinces and/or countries in which they operate and may secondarily be regulated by the domestic regulator of First American Title Insurance Company as a part of the First American insurance holding company system. Each of these regions, provinces and countries has established a regulatory framework with respect to the oversight of compliance with its laws and regulations. Therefore, our foreign insurance subsidiaries are generally subject to regulatory review, examination, investigation and enforcement in a similar manner as our domestic insurance subsidiaries, subject to local variations.

Our underwritten title companies, agencies and property and casualty insurance agencies are also subject to certain regulation by insurance regulatory or banking authorities, including, but not limited to, minimum net worth requirements, licensing requirements, statistical reporting requirements, rate filing requirements and marketing restrictions.

In addition to state-level regulation, our domestic subsidiaries that operate in the insurance business, as well as our home warranty subsidiaries and certain other subsidiaries, are subject to regulation by federal agencies, including the newly formed Consumer Financial Protection Bureau (“CFPB”). The CFPB has been given broad authority to regulate, among other areas, the mortgage and real estate markets, including our domestic subsidiaries that operate in the settlement services businesses, in matters pertaining to consumers. This authority includes the enforcement of federal consumer financial laws, including the Real Estate Settlement Procedures Act formerly placedAct. The manner in which the CFPB will utilize its rulemaking and supervisory powers is not fully known. In addition to other activities, the CFPB has proposed and implemented regulations related to the simplification of mortgage disclosures and the required delivery of documentation to consumers in connection with the Departmentclosing of Housingfederally-regulated mortgage loans. Extensive efforts have been required to implement these and Urban Development.

other CFPB regulations, and may be required to implement future regulations. Regulations issued by the CFPB, or the manner in which it interprets and enforces existing consumer protection laws, also could impact the way in which we conduct our business, require alteration to existing systems, products and services and otherwise increase our expenses or reduce our revenues.  Accordingly, the impact of the CFPB on our business is uncertain.

In addition, our home warranty business isand settlement services businesses are subject to regulation in some states by insurance authorities or other applicable regulatory entities. Our federal savings bank and industrial bank are both subject to regulation by the Federal Deposit Insurance Corporation. Prior to July 21, 2011, our federal savings bank was regulated by the United States Department of the Treasury’s Office of Thrift Supervision. Since July 21, 2011, the federal savings bank has beenis regulated by the Office of the Comptroller of the Currency, with the Federal Reserve Board supervising its parent holding companies. The industrial bankcompany, and is regulatedsubject to regulation by the California Department of Financial Institutions.Federal Deposit Insurance Corporation.

Investment Policies

The Company’s investment portfolio activities such as policy setting, compliance reporting, portfolio reviews, and strategy are overseen by an investment committee made up of certain senior executives. Additionally, certain of the Company’s regulated subsidiaries, including title insurance underwriters, property and casualty insurance companies and banking entities,our federal savings bank, have established and maintain an investment committeecommittees to oversee their own investment portfolios. The Company’s investment policies are designed to comply with regulatory requirements and to align the investment portfolio strategyasset allocation with strategic objectives. For example, our federal savings bank is required to maintain at least 65 percent65% of its asset portfolio in loans or securities that are secured by real estate. Our federal savings bank currently does not make real estate loans, and therefore fulfills this regulatory requirement through investments in mortgage-backed securities. In addition, applicable law imposes certain restrictions upon the types and amounts of investments that may be made by our regulated insurance subsidiaries.


The Company’s investment policies further provide that investments are to be managed to balance earnings,maximize long-term returns consistent with liquidity, regulatory and risk objectives, and that investments should not expose the Company to excessive levels of market, credit, risk,liquidity, and interest risk or liquidity risk.

rate risks.

As of December 31, 2011,2014, our debt and equity investment securities portfolio consistsconsisted of approximately 90 percent90% of fixed income securities. As of that date, over 70 percentapproximately 66% of our fixed income investments arewere held in securities that are United States government-backed or rated AAA, and approximately 98 percent97% of the fixed income portfolio iswere rated or classified as investment grade. Percentages are based on the amortized cost basis of the securities. Credit ratings are based on Standard & Poor’s Ratings Services and Moody’s Investor Services, Inc. published ratings. If a security was rated differently by both rating agencies, the lower of the two ratings was selected.

Our equity portfolio includes the CoreLogic common stock that was issued to us in connection with the Separation and which is further described in Note 19 Transactions with CoreLogic/TFAC to the consolidated financial statements included in “Item 8. Financial Statements and Supplementary Data” of Part II of this report.

In addition to our debt and equity investment securities portfolio, we maintain certain money-market and other short-term investments. We also hold strategic equity investments in companies engaged in the title insurance and settlement services industries.our businesses or similar or related businesses.

Employees

As of December 31, 2011,2014, the Company employed 16,11717,103 people on either a part-time or full-time basis.

Available Information

The Company maintains a website, www.firstam.com, which includes financial information and other information for investors, including open and closed title insurance orders (which typically are posted approximately 12 days after the end of each calendar month). The Company’s Annual Reports on Form 10-K, Quarterly Reports on Form 10-Q, Current Reports on Form 8-K and amendments to those reports filed or furnished pursuant to Section 13(a) or 15(d) of the Securities Exchange Act of 1934 are available free of charge through the “Investors” page of the website as soon as reasonably practicable after the Company electronically files such material with, or furnishes it to, the Securities and Exchange Commission. The Company’s website and the information contained therein or connected thereto are not intended to be incorporated into this Annual Report on Form 10-K, or any other filing with the Securities and Exchange Commission unless the Company expressly incorporates such materials.


Item 1A.    Risk Factors

Risk Factors

You should carefully consider each of the following risk factors and the other information contained in this Annual Report on Form 10-K. The Company faces risks other than those listed here, including those that are unknown to the Company and others of which the Company may be aware but, at present, considers immaterial. Because of the following factors, as well as other variables affecting the Company’s operating results, past financial performance may not be a reliable indicator of future performance, and historical trends should not be used to anticipate results or trends in future periods.

1. Conditions in the real estate market generally impact the demand for a substantial portion of the Company’s products and services

and the Company’s claims experience

Demand for a substantial portion of the Company’s products and services generally decreases as the number of real estate transactions in which its products and services are purchased decreases. The number of real estate transactions in which the Company’s products and services are purchased decreases in the following situations:

·

when mortgage interest rates are high or rising;

·

when the availability of credit, including commercial and residential mortgage funding, is limited; and

·

when real estate values are declining.

when the availability of credit, including commercial and residential mortgage funding, is limited; and

whenThese circumstances, particularly declining real estate values are declining.

and the increase in foreclosures that often results therefrom, also tend to adversely impact the Company’s title claims experience.

2. Unfavorable economic conditions may have a material adverse effect on the Company

Uncertainty and negative trends in general economic conditions in the United States and abroad, including significant tightening of credit markets and a general decline in the value of real property, historically have created a difficult operating environment for the Company’s businesses and other companies in its industries. In addition, the Company holds investments


in entities, such as title agencies, settlement service providers and property and casualty insurance companies, and instruments, such as mortgage-backed securities, which may be

negatively impacted by these conditions. The Company also owns a federal savings bank into which it deposits some of its own funds and some funds held in trust for third parties. This bank invests those funds and any realized losses incurred will be reflected in the Company’s consolidated results. The likelihood of such losses, which generally would not occur if the Company were to deposit these funds in an unaffiliated entity, increases when economic conditions are unfavorable. Depending upon the ultimate severity and duration of any economic downturn, the resulting effects on the Company could be materially adverse, including a significant reduction in revenues, earnings and cash flows, challenges to the Company’s ability to satisfy covenants or otherwise meet its obligations under debt facilities, difficulties in obtaining access to capital, challenges to the Company’s ability to pay dividends at currently anticipated levels, deterioration in the value of its investments and increased credit risk from customers and others with obligations to the Company.

3. Unfavorable economic or other conditions could cause the Company to write off a portion of its goodwill and other intangible assets

The Company performs an impairment test of the carrying value of goodwill and other indefinite-lived intangible assets annually in the fourth quarter, or sooner if circumstances indicate a possible impairment. Finite-lived intangible assets are subject to impairment tests on a periodic basis. Factors that may be considered in connection with this review include, without limitation, underperformance relative to historical or projected future operating results, reductions in the Company’s stock price and market capitalization, increased cost of capital and negative macroeconomic, industry and company-specific trends. These and other factors could lead to a conclusion that goodwill or other intangible assets are no longer fully recoverable, in which case the Company would be required to write off the portion believed to be unrecoverable. Total goodwill and other intangible assets reflected on the Company’s consolidated balance sheet as of December 31, 20112014 are approximately $0.9$1.0 billion. Any substantial goodwill and other intangible asset impairments that may be required could have a material adverse effect on the Company’s results of operations and financial condition and liquidity.condition.

4. Failures at financial institutions at which the Company deposits funds could adversely affect the Company

The Company deposits substantial funds in financial institutions. These funds include amounts owned by third parties, such as escrow deposits. Should one or more of the financial institutions at which deposits are maintained fail, there is no guarantee that the Company would recover the funds deposited, whether through Federal Deposit Insurance Corporation coverage or otherwise. In the event of any such failure, the Company also could be held liable for the funds owned by third parties.

5. Changes in government regulation could prohibit or limit the Company’s operations, make it more burdensome to conduct such operations or result in decreased demand for the Company’s products and services

Many of the Company’s businesses, including its title insurance, property and casualty insurance, home warranty, banking, trust and investment businesses, are regulated by various federal, state, local and foreign governmental agencies. These and other of the Company’s businesses also operate within statutory guidelines. The industry in which the Company operates and the markets into which it sells its products are also regulated and subject to statutory guidelines. Changes in the applicable regulatory environment, statutory guidelines or interpretations of existing regulations or statutes, enhanced governmental oversight or efforts by governmental agencies to cause customers to refrain from using the Company’s products or services could prohibit or limit its future operations or make it more burdensome to conduct such operations or result in decreased demand for the Company’s products and services. The impact of these changes would be more significant if they involve jurisdictions in which the Company generates a greater portion of its title premiums, such as the states of Arizona, California, Florida, Michigan, New York, Ohio, Pennsylvania and Texas and the province of Ontario, Canada. These changes may compel the Company to reduce its prices, may restrict its ability to implement price increases or acquire assets or businesses, may limit the manner in which the Company conducts its business or otherwise may have a negative impact on its ability to generate revenues, earnings and cash flows.

6. Scrutiny of the Company’s businesses and the industries in which it operates by governmental entities and others could adversely affect its operations and financial condition

The real estate settlement services industry, an industry in which the Company generates a substantial portion of its revenue and earnings, is subject to heightened scrutiny by regulators, legislators, the media and plaintiffs’ attorneys. Though often directed at the industry generally, these groups may also focus their attention directly on the Company’s businesses. In either case, this scrutiny may result in changes which could adversely affect the Company’s operations and, therefore, its financial condition and liquidity.


Governmental entities have routinely inquired into certain practices in the real estate settlement services industry to determine whether certain of the Company’s businesses or its competitors have violated applicable laws, which include, among others, the insurance codes of the various jurisdictions and the Real Estate Settlement Procedures Act and similar state, federal and foreign laws. Departments of insurance in the various states, either separately or in conjunction with federal regulators and applicable regulators in international jurisdictions, either separately or together, also periodically conduct targeted inquiries into the practices of title insurance companies and other settlement services providers in their respective jurisdictions.

Further, from time to time plaintiffs’ lawyers may target the Company and other members of the Company’s industry with lawsuits claiming legal violations or other wrongful conduct. These lawsuits may involve large groups of plaintiffs and claims for substantial damages. Any of these types of inquiries or proceedings may result in a finding of a violation of the law or other wrongful conduct and may result in the payment of fines or damages or the imposition of restrictions on the Company’s conduct which could impact its operations and financial condition. Moreover, these laws and standards of conduct often are ambiguous and, thus, it may be difficult to ensure compliance. This ambiguity may force the Company to mitigate its risk by settling claims or by ending practices that generate revenues, earnings and cash flows.

We increasingly utilize social media to communicate with customers, vendors and other individuals interested in our Company. Information delivered via social media can be easily accessed and rapidly disseminated, and the use of social media by us and other parties could result in reputational harm, decreased customer loyalty or other issues that could diminish the value of the Company’s brand or result in significant liability.  

7. The breadth of the Consumer Financial Protection Bureau’s rulemaking and supervisory powers may increase our costs and require changes in our business

The Consumer Financial Protection Bureau (“CFPB”) has broad authority to regulate, among other areas, the mortgage and real estate markets, including our domestic subsidiaries that operate in the settlement services businesses, in matters pertaining to consumers. This authority includes the enforcement of federal consumer financial laws, including the Real Estate Settlement Procedures Act. The manner in which the CFPB will utilize its rulemaking and supervisory powers is not fully known. In addition to other activities, the CFPB has proposed and implemented regulations related to the simplification of mortgage disclosures and the required delivery of documentation to consumers in connection with the closing of federally-regulated mortgage loans. Extensive efforts have been required to implement these and other CFPB regulations, and may be required to implement future regulations. Regulations issued by the CFPB, or the manner in which it interprets and enforces existing consumer protection laws, also could impact the way in which we conduct our business, require alteration to existing systems, products and services and otherwise increase our expenses or reduce our revenues.  Accordingly, the impact of the CFPB on our business is uncertain.

8. The CFPB’s integrated disclosure rules necessitate significant changes to the Company’s business processes, could lead to market disruption and may otherwise adversely affect the Company

Compliance with the CFPB’s integrated disclosure rules will require participants in the mortgage market, including the Company, to make significant changes to the manner in which they create, process, and deliver certain disclosures to consumers in connection with mortgage loan applications made on or after August 1, 2015.  Readiness for, and compliance with, these rules, requires extensive planning; changes to systems, forms and processes; as well as heightened coordination among market participants, including by settlement service providers, such as the Company and its agents, with lenders and others.  While the Company is actively preparing for compliance, the success of the implementation effort is also dependent on the efforts of other market participants.  There can be no assurance that the Company, its agents or other market participants will be successful in their implementation efforts, or that consumers or the CFPB will be satisfied with the manner in which the new rules have been implemented.  These changes also could lead to lower mortgage volumes and/or delays in mortgage processing, particularly in the early stages of implementation.  Accordingly, in addition to the significant time and expense associated with readiness and compliance with the new integrated disclosure rules, the rules may lead to market disruption, loss of business, unexpected expenses or other adverse effects.

9. Regulation of title insurance rates could adversely affect the Company’s results of operations

Title insurance rates are subject to extensive regulation, which varies from state to state. In many states the approval of the applicable state insurance regulator is required prior to implementing a rate change. This regulation could hinder the Company’s ability to promptly adapt to changing market dynamics through price adjustments, which could adversely affect its results of operations, particularly in a rapidly declining market.


8.10. Reform of government-sponsored enterprises could negatively impact the Company

Historically, a substantial proportion of home loans originated in the United States were sold to and, generally, resold in a securitized form by, the Federal National Mortgage Association (Fannie Mae) and the Federal Home Loan Mortgage Corporation (Freddie Mac). As a condition to the purchase of a home loan Fannie Mae and Freddie Mac generally required the purchase of title insurance for their benefit and, as applicable, the benefit of the holders of home loans they may have securitized. The federal government currently is considering various alternatives to reform Fannie Mae and Freddie Mac. The role, if any, that these enterprises or other enterprises fulfilling a similar function will play in the mortgage process following the adoption of any reforms is not currently known. The timing of the adoption and, thereafter, the implementation of the reforms is similarly unknown. Due to the significance of the role of these enterprises, the mortgage process itself may substantially change as a result of these reforms and related discussions. It is possible that these entities, as reformed, or the successors to these entities may require changes to the way title insurance is priced or delivered, changes to standard policy terms or other changes which may make the title insurance business less profitable. These reforms may also alter the home loan market, such as by causing higher mortgage interest rates due to decreased governmental support of mortgage-backed securities. These consequences could be materially adverse to the Company and its financial condition.

9.11. The Company may find it difficult to acquire necessary data

Certain data used and supplied by the Company are subject to regulation by various federal, state and local regulatory authorities. Compliance with existing federal, state and local laws and regulations with respect to such

data has not had a material adverse effect on the Company’s results of operations, financial condition or liquidity to date. Nonetheless, federal, state and local laws and regulations in the United States designed to protect the public from the misuse of personal information in the marketplace and adverse publicity or potential litigation concerning the commercial use of such information may affect the Company’s operations and could result in substantial regulatory compliance expense, litigation expense and a loss of revenue. The suppliers of data to the Company face similar burdensburdens.  As a result of these and consequently,other factors, the Company may find it financially burdensome to acquire necessary data.

10. Product migration may result12. Changes in decreased revenue

Customers of many real estate settlement servicesthe Company’s relationships with large mortgage lenders or government–sponsored enterprises could adversely affect the Company provides increasingly require these services to be delivered faster, cheaper and more efficiently. Many of the traditional products it provides are labor and time intensive. As these customer pressures increase, the Company may be forced to replace traditional products with automated products that can be delivered electronically and with limited human processing. Because many of these traditional products have higher prices than corresponding automated products, the Company’s revenues may decline.

11. Increases in the size of the Company’s customers enhance their negotiating position vis-à-vis the Company and may decrease their need for the services offered by the Company

Many of the Company’s customers are increasing in size as a result of consolidation or the failure of their competitors. For example, the Company believes that three lenders collectively originate approximately 50 percent ofThe mortgage loansmarkets in the United States. As a result,States and Canada are concentrated. Due to the consolidated nature of the industry, the Company may derivederives a highersignificant percentage of its revenues from a smallerrelatively small base of customers,lenders, and their borrowers, which would enhanceenhances the negotiating power of these customerslenders with respect to the pricing and the terms on which these customersthey purchase the Company’s products and other matters. Moreover, these larger customers may prove more capableSimilarly, government-sponsored enterprises, because of performing in-house some or all oftheir significant role in the servicesmortgage process, have significant influence over the Company provides or, with respect to the Company’s title insurance products, more willing to assume the risk of title defects themselves and consequently, the demand for the Company’s products and services may decrease.other service providers. These circumstances could adversely affect the Company’s revenues and profitability. Changes in the Company’s relationship with any of these customers,lenders or government-sponsored enterprises, the loss of all or a portion of the business the Company derives from these customersparties or any refusal of these customersparties to accept the Company’s policiesproducts and services could have a material adverse effect on the Company.

12.13. A downgrade by ratings agencies, reductions in statutory capital and surplus maintained by the Company’s title insurance underwriters or a deterioration in other measures of financial strength may negatively affect the Company’s results of operations and competitive position

Certain of the Company’s customers use measurements of the financial strength of the Company’s title insurance underwriters, including, among others, ratings provided by ratings agencies and levels of statutory capital and surplus maintained by those underwriters, in determining the amount of a policy they will accept and the amount of reinsurance required. Each of the major ratings agencies currently rates the Company’s title insurance operations. The Company’s principal title insurance underwriter’s financial strength ratings are “A3” by Moody’s “A-”Investor Services, Inc., “A” by Fitch “BBB+Ratings Ltd., “A-” by Standard & Poor’s Ratings Services and “A-” by A.M. Best.Best Company, Inc. These ratings provide the agencies’ perspectives on the financial strength, operating performance and cash generating ability of those operations. These agencies continually review these ratings and the ratings are subject to change. Statutory capital and surplus, or the amount by which statutory assets exceed statutory liabilities, is also a measure of financial strength. The Company’s principal title insurance underwriter maintained approximately $817.6$971.3 million of total statutory capital and surplus capital as of December 31, 2011. The current minimum statutory surplus capital required to be maintained by California law is $500,000.2014. Accordingly, if the ratings or statutory capital and surplus of these title insurance underwriters are reduced from their current levels, or if there is a deterioration in other measures of financial strength, the Company’s results of operations, competitive position and liquidity could be adversely affected.


13.14. The Company’s investment portfolio is subject to certain risks and could experience losses

The Company maintains a substantial investment portfolio, primarily consisting of fixed income securities (including mortgage-backed securities) and, as of December 31, 2011, common stock of CoreLogic with a cost basis of $167.6 million and an estimated fair value of $115.5 million that was issued to the Company in connection with its separation from CoreLogic.. The investment portfolio also includes money-market and other short-term investments, as well as some preferred and other common stock. Securities in the Company’s investment portfolio are subject to certain economic and financial market risks, such as credit risk, interest rate (including call, prepayment and extension) risk and/or liquidity risk. Because a substantial proportion of the portfolio consists of the common stock of a single issuer, CoreLogic, the risk of loss in the portfolio also is impacted by factors that influence the value of CoreLogic’s stock, including, but not limited to, CoreLogic’s financial results and the market’s perception of CoreLogic’s and its industry’s prospects. Additionally, theThe risk of loss associated with the portfolio is increased during periods such as the present period, of instability in credit markets and economic conditions. If the carrying value of the investments exceeds the fair value, and the decline in fair value is deemed to be other-than-temporary, the Company will be required to write down the value of the investments, which could have a material adverse effect on the Company’s results of operations, statutory surplus and financial condition.

14.15. The Company’s pension plan is currently underfunded and pension expenses and funding obligations could increase significantly as a result of decreases in interest rates or weak performance of financial markets and its effect on plan assets

The Company is responsible for the obligations of its defined benefit pension plan, which it assumed from its former parent, The First American Corporation, on June 1, 2010 in connection with the spin-off transaction which was consummated on that date. The plan was closed to new entrants effective December 31, 2001 and amended to “freeze” all benefit accruals as of April 30, 2008. The Company’s future funding obligations for this plan depend upon, among other factors, upon the future performance of assets held in trust for the plan.plan and interest rates. The pension plan was underfunded as of December 31, 20112014 by approximately $128.7$111.3 million and the Company may need to make significant contributions to the plan. In addition, pension expenses and funding requirements may also be greater than currently anticipated if the market values of the assets held by the pension plan decline or if the other assumptions regarding plan earnings, expenses and expensesinterest rates require adjustment.

The Company’s obligations under this plan could have a material adverse effect on its results of operations, financial condition and liquidity.

15.16. Actual claims experience could materially vary from the expected claims experience reflected in the Company’s reserve for incurred but not reported claims

The Company maintains a reserve for incurred but not reported (“IBNR”) claims pertaining to its title, escrow and other insurance and guarantee products. The majority of this reserve pertains to title insurance policies, which are long-duration contracts with the majority of the claims reported within the first few years following the issuance of the policy. Generally, 7570% to 85 percent80% of claim amounts become known in the first six years of the policy life, and the majority of IBNR reserves relate to the six most recent policy years. A material change in expected ultimate losses and corresponding loss rates for policy years older than six years, while possible, is not considered reasonably likely. However, changesChanges in expected ultimate losses and corresponding loss rates for recent policy years are considered likely and could result in a material adjustment to the IBNR reserves. Based on historical experience, management believes a 50 basis point change to the loss rates for the most recent policy years, positive or negative, is reasonably likely given the long duration nature of a title insurance policy. For example, if the expected ultimate losses for each of the last six policy years increased or decreased by 50 basis points, the resulting impact on the Company’s IBNR reserve would be an increase or decrease, as the case may be, of $120.4$98.7 million. A material change in expected ultimate losses and corresponding loss rates for older policy years is also possible, particularly for policy years with loss ratios exceeding historical norms. The estimates made by management in determining the appropriate level of IBNR reserves could ultimately prove to be inaccurate andmaterially different from actual claims experience may vary from the expected claims experience.

16.17. The issuance of the Company’s title insurance policies and related activities by title agents, which operate with substantial independence from the Company, could adversely affect the Company

The Company’s title insurance subsidiaries issue a significant portion of their policies through title agents that operate with a substantial degree of independence from the Company. While these title agents are subject to certain contractual limitations that are designed to limit the Company’s risk with respect to their activities, there is no guarantee that the agents will fulfill their contractual obligations to the Company. In addition, regulators are increasingly seeking to hold the Company responsible for the actions of these title agents and, under certain circumstances, the Company may be held liable directly to third parties for actions (including defalcations) or omissions of these agents. As a result, the Company’s use of title agents could result in increased claims on the Company’s policies issued through agents and an increase in other costs and expenses.

18. The Company’s risk mitigation efforts may prove inadequate

17.The Company assumes risks in the ordinary course of its business, including through the issuance of title insurance policies and the provision of other products and services.  The Company mitigates these risks through a number of different means, including the implementation of underwriting policies and procedures and other mechanisms for assessing risk.  However, underwriting of title insurance policies and other risk-assumption decisions frequently involve a substantial degree of individual judgment.  The Company’s risk mitigation efforts or the reliability of any necessary judgment may prove


inadequate, especially in situations where the Company or individuals involved in risk taking decisions are encouraged by customers or others, or because of competitive pressures, to assume risks or to expeditiously make risk determinations.  This circumstance could have an adverse effect on the Company’s results of operations, financial condition and liquidity. 

19. Systems damage, failures, interruptions and intrusions, wire transfer errors and unauthorized data disclosures may impair the delivery ofdisrupt the Company’s products and services,business, harm the Company’s reputation, and result in material claims for damages or otherwise adversely affect the Company

System interruptionsThe Company uses computer systems to receive, process, store and intrusions may impairtransmit business information, including highly sensitive non-public personal information as well as data from suppliers and other information upon which its business relies. It also uses these systems to manage substantial cash, investment assets, bank deposits, trust assets and escrow account balances on behalf of the deliveryCompany and its customers, among other activities. Many of the Company’s products, services and services, resulting insolutions involving the use of real property related data are fully reliant on its systems and are only available electronically.  Accordingly, for a lossvariety of customersreasons, the integrity of the Company’s computer systems and a corresponding loss in revenue.the protection of the information that resides on those systems are critically important to its successful operation.  The Company’s businesses depend heavily uponcore computer systems are primarily located in data centers maintained and managed by a third party.

The Company’s computer systems and systems used by its data centers. Certainagents, suppliers and customers have been subject to, and are likely to continue to be the target of, computer viruses, cyber attacks, phishing attacks and other malicious attacks. These attacks have increased in frequency and sophistication in recent years, and could expose the Company to system-related damage, failures, interruptions, and other negative events.  Further, certain other potential causes of system damage or other negative system-related events are wholly or partially beyond the Company’s control, includingsuch as natural disasters, vendor failures to satisfy service level requirements and power or telecommunications failures and intrusions intofailures.  These incidents, regardless of their underlying causes, could disrupt the Company’s business and could also result in the loss or unauthorized release, gathering, monitoring or destruction of confidential, proprietary and other information pertaining to the Company, its customers, employees, agents or suppliers.

Certain laws and contracts the Company has entered into require it to notify various parties, including consumers or customers, in the event of certain actual or potential data breaches or systems failures. These notifications can result, among other things, in the loss of customers, lawsuits, adverse publicity, diversion of management’s time and energy, the attention of regulatory authorities, fines and disruptions in sales.  Further, the Company’s financial institution customers have obligations to safeguard their computer systems and sensitive information and it may be bound contractually and/or by third partiesregulation to comply with the same requirements. If the Company fails to comply with applicable regulations and contractual requirements, it could temporarilybe exposed to lawsuits, governmental proceedings or permanently interrupt the deliveryimposition of products and services. These interruptions also may interfere with suppliers’ ability to provide necessary data and employees’ ability to attend work and perform their responsibilities. fines, among other consequences.

The Company also relies on its systems, employees and domestic and international banks to transfer funds. These transfers are susceptible to user input error, fraud, system interruptions, or intrusions, incorrect processing and similar errors that could result in lost funds that may be significant. As part of its business,funds.

Accordingly, any inability to prevent or adequately respond to the Company maintains non-public personal information on consumers. There can be no assurance that unauthorized disclosure will not occur either through system intrusions or the actions of third parties or employees. Unauthorized disclosuresissues described above could adversely affectdisrupt the Company’s reputation and expose itbusiness, inhibit its ability to retain existing customers or attract new customers and/or result in financial losses, litigation, increased costs or other adverse consequences which could be material claims for damages.to the Company.

18.20. The Company may not be able to realize the benefits of its offshore strategy

The Company utilizes lower cost labor in foreign countries, such as India and the Philippines, among others. These countries are subject to relatively high degrees of political and social instability and may lack the infrastructure to withstand natural disasters. Such disruptions could decrease efficiency and increase the Company’s costs in these countries. Weakness of the United States dollar in relation to the currencies used in these foreign countries may also reduce the savings achievable through this strategy. Furthermore, the practice of utilizing labor based in foreign countries has come under increasedis subject to heightened scrutiny in the United States and, as a result, some of the Company’s customers may require it to use labor based in the United States. Laws or regulations that require the Company to use labor based in the United States or effectively increase the cost of the Company’s foreign labor also could be enacted. The Company may not be able to pass on these increased costs to its customers.

21. Acquisitions may have an adverse effect on our business

19.The Company has in the past acquired, and is expected to acquire in the future, other businesses. When businesses are acquired, the Company may not be able to integrate or manage these businesses in such a manner as to realize the anticipated


synergies or otherwise produce returns that justify the investment. Acquired businesses may subject the Company to increased regulatory or compliance requirements. The Company may not be able to successfully retain employees of acquired businesses or integrate them, and could lose customers, suppliers or other partners as a result of the acquisitions. For these and other reasons, including changes in market conditions, the projections used to value the acquired businesses may prove inaccurate. In addition, the Company might incur unanticipated liabilities from acquisitions. These and other factors related to acquisitions could have a material adverse effect on the Company’s results of operations, financial condition and liquidity. The Company’s management also will continue to be required to dedicate substantial time and effort to the integration of its acquisitions. These efforts could divert management’s focus and resources from other strategic opportunities and operational matters.

22. As a holding company, the Company depends on distributions from its subsidiaries, and if distributions from its subsidiaries are materially impaired, the Company’s ability to declare and pay dividends may be adversely affected; in addition, insurance and other regulations limit the amount of dividends, loans and advances available from the Company’s insurance subsidiaries

The Company is a holding company whose primary assets are investments in its operating subsidiaries. The Company’s ability to pay dividends is dependent on the ability of its subsidiaries to pay dividends or repay funds. If the Company’s operating subsidiaries are not able to pay dividends or repay funds, the Company may not be able to fulfill parent company obligations and/or declare and pay dividends to its stockholders. Moreover, pursuant to insurance and other regulations under which the Company’s insurance subsidiaries operate, the amount of dividends, loans and advances available is limited. As of December 31, 2011,2014, under such regulations, the maximum amount of dividends, loans and advances available in 20122015 from these insurance subsidiaries, without prior approval from applicable regulators, was $181.1$570.0 million.

20.23. Certain provisions of the Company’s bylaws and certificate of incorporation may reduce the likelihood of any unsolicited acquisition proposal or potential change of control that the Company’s stockholders might consider favorable

The Company’s bylaws and certificate of incorporation contain provisions that could be considered “anti-takeover” provisions because they make it harder for a third-party to acquire the Company without the consent of the Company’s incumbent board of directors. Under these provisions:

·

election of the Company’s board of directors is staggered such that only one-third of the directors are elected by the stockholders each year and the directors serve three year terms prior to reelection;

·

stockholders may not remove directors without cause, change the size of the board of directors or, except as may be provided for in the terms of preferred stock the Company issues in the future, fill vacancies on the board of directors or, except as may be provided for in the terms of preferred stock the Company issues in the future, fill vacancies on the board
of directors;

·

stockholders may act only at stockholder meetings and not by written consent;

·

stockholders must comply with advance notice provisions for nominating directors or presenting other proposals at stockholder meetings; and

·

the Company’s board of directors may without stockholder approval issue preferred shares and determine their rights and terms, including voting rights, or adopt a stockholder rights plan.

While the Company believes that they are appropriate, these provisions, which may only be amended by the affirmative vote of the holders of approximately 67 percent67% of the Company’s issued voting shares, could have the effect of discouraging an unsolicited acquisition proposal or delaying, deferring or preventing a change of control transaction that might involve a premium price or otherwise be considered favorably by the Company’s stockholders.


Item 1B.

Unresolved Staff Comments

21. The Company could have conflicts with CoreLogicNot applicable.


The Company and CoreLogic were part of a single publicly traded company, The First American Corporation, until the Company’s separation from CoreLogic on June 1, 2010. Conflicts with CoreLogic may arise as a result of the Company’s agreements with CoreLogic. Competition between the companies also could result in conflicts. While current competition between the companies is not material, the extent of future competition could increase. In addition, the Company’s chairman of the board of directors, Parker S. Kennedy, is also chairman emeritus of CoreLogic. As such, conflicts of interest with respect to matters potentially or actually affecting both companies may arise. Conflicts, competition or conflicts of interest pertaining to the Company’s relationship with CoreLogic could adversely affect the Company.

Item 1B.    Unresolved Staff Comments

None.

Item 2.    Properties

Properties

We maintain our executive offices at MacArthur Place in Santa Ana, California. In 2005, The First American Corporation expanded its three-buildingThis office campus through the additionconsists of two four-storyfive office buildings, totaling approximately 226,000 square feet, a two-story, free standing, approximately 52,000 square foot technology center and a two-story parking structure, bringing the total square footage tototaling approximately 490,000 square feet. The original threeThree office buildings, totaling approximately 210,000 square feet, and the fixtures thereto and underlying land, are subject to a deed of trust and security agreement securing payment of a promissory note evidencing a loan made in October 2003, to our principal title insurance subsidiary in the original sum of $55.0 million. This loan is payable in monthly installments of principal and interest, is fully amortizing and matures November 1, 2023. The outstanding principal balance of this loan was $39.3$31.6 million as of December 31, 2011. Our title insurance subsidiary owns and operates these properties, and leases approximately 107,000 square feet within one of the buildings to CoreLogic for its executive offices pursuant to a lease entered into in connection with the

Separation.2014. The technology center referred to above is primarily utilized and maintained by a third party and houses technical infrastructure belonging to a third party, in addition to the Company but also houses physically segregated serverstechnical infrastructure belonging to CoreLogic which are maintained by CoreLogic.

the Company.

One of our subsidiaries in the title insurance and services segment leases an aggregate of approximately 150,000127,000 square feet of office space in fourthree buildings of the International Technology Park in Bangalore, India pursuant to various lease agreements. MostAll of the space is leased pursuant to agreements that expire in 2014 and the current term of each of the other leases expires in 2012.

2017.

The office facilities we occupy are, in all material respects, in good condition and adequate for their intended use.


Item 3.    Legal Proceedings

Legal Proceedings

The Company and its subsidiaries are parties to a number of non-ordinary course lawsuits. Frequently theseThese lawsuits frequently are similar in nature to other lawsuits pending against the Company’s competitors.

For those non-ordinary course lawsuits where the Company has determined that a loss is both probable and reasonably estimable, a liability representing the best estimate of the Company’s financial exposure based on known facts has been recorded. Actual losses may materially differ from the amounts recorded.

For a substantial majority of these lawsuits, however, it is not possible to assess the probability of loss. Most of these lawsuits are putative class actions which require a plaintiff to satisfy a number of procedural requirements before proceeding to trial. These requirements include, among others, demonstration to a court that the law proscribes in some manner the Company’s activities, the making of factual allegations sufficient to suggest that the Company’s activities exceeded the limits of the law and a determination by the court—known as class certification—that the law permits a group of individuals to pursue the case together as a class. In certain instances the Company may also be able to compel the plaintiff to arbitrate its claim on an individual basis. If these procedural requirements are not met, either the lawsuit cannot proceed or, as is the case with class certification or compelled arbitration, the plaintiffs lose the financial incentive to proceed with the case (or the amount at issue effectively becomes de minimus)minimis). Frequently, a court’s determination as to these procedural requirements is subject to appeal to a higher court. As a result of, among other factors, ambiguities and inconsistencies in the myriad laws applicable to the Company’s business and the uniqueness of the factual issues presented in any given lawsuit, the Company often cannot determine the probability of loss until a court has finally determined that a plaintiff has satisfied applicable procedural requirements.

Furthermore, because most of these lawsuits are putative class actions, it is often impossible to estimate the possible loss or a range of loss amounts, even where the Company has determined that a loss is reasonably possible. Generally class actions involve a large number of people and the effort to determine which people satisfy the requirements to become plaintiffs—or class members—is often time consuming and burdensome. Moreover, these lawsuits raise complex factual issues which result in uncertainty as to their outcome and, ultimately, make it difficult for the Company to estimate the amount of damages which a plaintiff might successfully prove. In addition, many of the Company’s businesses are regulated by various federal, state, local and foreign governmental agencies and are subject to numerous statutory guidelines. These regulations and statutory guidelines often are complex, inconsistent or ambiguous, which results in additional uncertainty as to the outcome of a given lawsuit—including the amount of damages a plaintiff might be afforded—or makes it difficult to analogize experience in one case or jurisdiction to another case or jurisdiction.

Most of the non-ordinary course lawsuits to which the Company and its subsidiaries are parties challenge practices in the Company’s title insurance business, though a limited number of cases also pertain to the Company’s other businesses. These lawsuits include, among others, cases alleging, among other assertions, that the Company, one of its subsidiaries and/or one of its agents:

·

charged an improper rate for title insurance in a refinance transaction, including

Boucher v. First American Title Insurance Company, filed on May 16, 2007 and pending in the United States District Court for the Western District of Washington,


Loef v. First American Title Insurance Company, filed on August 16, 2008 and pending in the United States District Court for the District of Maine,

·

Levine v. First American Title Insurance Company, filed on February 26, 2009 and pending in the United States District Court for the Eastern District of Pennsylvania,

Hamilton v. First American Title Insurance Company, filed on August 22, 2007 and pending in the United States District Court for the Northern District of Texas,

·

Lewis v. First American Title Insurance Company, filed on November 28, 2006 and pending in the United States District Court for the District of Idaho,

Hamilton v. First American Title Insurance Company, et al., filed on August 25, 2008 and pending in the Superior Court of the State of North Carolina, Wake County,

·

Raffone v. First American Title Insurance Company, filed on February 14, 2004 and pending in the Circuit Court, Nassau County, Florida, and

Haskins v. First American Title Insurance Company, filed on September 29, 2010 and pending in the United States District Court for the District of New Jersey,

Johnson v. First American Title Insurance Company, filed on May 27, 2008 and pending in the United States District Court for the District of Arizona,

Levine v. First American Title Insurance Company, filed on February 26, 2009 and pending in the United States District Court for the Eastern District of Pennsylvania,

Lewis v. First American Title Insurance Company, filed on November 28, 2006 and pending in the United States District Court for the District of Idaho,

Raffone v. First American Title Insurance Company, filed on February 14, 2004 and pending in the Circuit Court, Nassau County, Florida,

Slapikas v. First American Title Insurance Company, filed on December 19, 2005 and pending in the United States District Court for the Western District of Pennsylvania and

Tello v. First American Title Insurance Company, filed on July 14, 2009 and pending in the United States District Court for the District of New Hampshire.

·

Slapikas v. First American Title Insurance Company, filed on December 19, 2005 and pending in the United States District Court for the Western District of Pennsylvania.


All of these lawsuits are putative class actions. A court has only granted class certification in Loef, Hamilton (North Carolina), Johnson, Lewis Raffone and Slapikas. An appeal to a higher court is pending with respect to the granting ofRaffone. The class certificationoriginally certified in Hamilton (North Carolina).Slapikas was subsequently decertified. For the reasons stated above, the Company has been unable to assess the probability of loss or estimate the possible loss or the range of loss or, where the Company has been able to make an estimate, the Company believes the amount is immaterial to the consolidated financial statements as a whole.

·

purchased minority interests in title insurance agents as an inducement to refer title insurance underwriting business to the Company or gave items of value to title insurance agents and others for referrals of business in each case in violation of the Real Estate Settlement Procedures Act, including

·

Edwards v. First American Financial Corporation, filed on June 12, 2007 and pending in the United States District Court for the Central District of California.

Edwards v. First American Financial Corporation, filed on June 12, 2007 and pending in the United States District Court for the Central District of California, and

Galiano v. First American Title Insurance Company, et al., filed on February 8, 2008 and pending in the United States District Court for the Eastern District of New York.

Galiano is a putative class action for which a class has not been certified. In Edwards a narrow class has been certified. The United States Supreme Court is reviewing whether the Edwards plaintiff has the legal right to sue. For the reasons stated above, the Company has been unable to assess the probability of loss or estimate the possible loss or the range of loss.

·

engaged in the unauthorized practice of law, including

·

Gale v. First American Title Insurance Company, et al., filed on October 16, 2006 and pending in the United States District Court of Connecticut.

conspired with its competitors to fix prices or otherwise engagedThe class originally certified in anticompetitive behavior, including

Barton v. First American Title Insurance Company, et al, filed March 10, 2008 and pending in the United States District Court for the Northern District of California,

Holt v. First American Title Insurance Company, et al., filed March 11, 2008 and pending in the United States District Court for the Eastern District of Pennsylvania,

Katz v. First American Title Insurance Company, et al., filed March 18, 2008 and pending in the United States District Court for the Northern District of Ohio,

McCray v. First American Title Insurance Company, et al., filed October 15, 2008 and pending in the United States District Court for the District of Delaware and

Swick v. First American Title Insurance Company, et al., filed March 19, 2008, and pending in the United States District Court for the District of New Jersey.

All of these lawsuits are putative class actions for which a class has not been certified.Gale was subsequently decertified. For the reasons described above, the Company has not yet been able to assess the probability of loss or estimate the possible loss or the range of loss.

·

overcharged or improperly charged fees for products and services, denied home warranty claims, failed to timely file certain documents, and gave items of value to developers, builders and others as inducements to refer business in violation of certain laws, such as consumer protection laws and laws generally prohibiting unfair business practices, and certain obligations, including

·

Bushman v. First American Title Insurance Company, et al., filed on November 21, 2013 and pending in the Circuit Court of the State of Michigan, County of Washtenaw,

·

Chassen v. First American Financial Corporation, et al., filed on January 22, 2009 and pending in the United States District Court of New Jersey,

·

DeLaurentis v. Data Tree Information Services LLC, filed on January 16, 2015 and pending in the United States District Court for the Southern District of New York,

·

Gunning v. First American Title Insurance Company, filed on July 14, 2008 and pending in the United States District Court for the Eastern District of Kentucky,

·

Kaufman v. First American Financial Corporation, et al., filed on December 21, 2007 and pending in the Superior Court of the State of California, County of Los Angeles,

·

Kirk v. First American Financial Corporation, et al., filed on June 15, 2006 and pending in the Superior Court of the State of California, County of Los Angeles,

·

Sjobring v. First American Financial Corporation, et al., filed on February 25, 2005 and pending in the Superior Court of the State of California, County of Los Angeles,

·

Snyder v. First American Financial Corporation, et al., filed on June 21, 2014 and pending in the United States District Court for the District of Colorado,


·

Wilmot v. First American Financial Corporation, et al., filed on April 20, 2007 and pending in the Superior Court of the State of California, County of Los Angeles, and

·

In re First American Home Buyers Protection Corporation, consolidated on October 9, 2014 and pending in the United States District Court for the Southern District of California.

engaged in the unauthorized practiceAll of law, including

Gale v. First American Title Insurance Company, et al., filed on October 16, 2006these lawsuits, except Kaufman and pending in the United States District Court for the District of Connecticut and

Katin v. First American Signature Services, Inc., et al., filed on May 9, 2007 and pending in the United States District Court for the District of Massachusetts.

Katin is aKirk, are putative class action. Aactions for which a class has not been certified. In Kaufman a class was certified in Gale.but that certification was subsequently vacated. A trial of the Kirk matter has concluded, plaintiff has filed a notice of appeal and the Company filed a cross appeal. For the reasons described above, the Company has not yet been able to assess the probability of loss or estimate the possible loss or the range of loss.

misclassified employees and failed to pay overtime, including

Bartko v. First American Title Insurance Company, filed on November 8, 2011, and pending in the Superior Court of the State of California, Los Angeles.

Bartko is a putative class action for which a class has not been certified. For the reasons described above,loss or, where the Company has not yet been able to assess the probability of loss ormake an estimate, the possible loss orCompany believes the range of loss.

overcharged or improperly charged fees for products and services provided in connection withamount is immaterial to the closing of real estate transactions, denied home warranty claims, recorded telephone calls, actedconsolidated financial statements as an unauthorized trustee and gave items of value to developers, builders and others as inducements to refer business in violation of certain other laws, such as consumer protection laws and laws generally prohibiting unfair business practices, and certain obligations, including

Carrera v. First American Home Buyers Protection Corporation, filed on September 23, 2009 and pending in the Superior Court of the State of California, County of Los Angeles,

Chassen v. First American Financial Corporation, et al., filed on January 22, 2009 and pending in the United States District Court for the District of New Jersey,

Coleman v. First American Home Buyers Protection Corporation, et al., filed on August 24, 2009 and pending in the Superior Court of the State of California, County of Los Angeles,

Eberhard v. First American Title Insurance Company, et al., filed on April 4, 2011 and pending in the Court of Common Pleas Cuyahoga County, Ohio,

Eide v. First American Title Company, filed on February 26, 2010 and pending in the Superior Court of the State of California, County of Kern,

Gunning v. First American Title Insurance Company, filed on July 14, 2008 and pending in the United States District Court for the Eastern District of Kentucky,

Kaufman v. First American Financial Corporation, et al., filed on December 21, 2007 and pending in the Superior Court of the State of California, County of Los Angeles,

Kirk v. First American Financial Corporation, filed on June 15, 2006 and pending in the Superior Court of the State of California, County of Los Angeles,

Sjobring v. First American Financial Corporation, et al., filed on February 25, 2005 and pending in the Superior Court of the State of California, County of Los Angeles,

Smith v. First American Title Insurance Company, filed on November 23, 2011 and pending in the United States District Court for the Western District of Washington,

Tavenner v. Talon Group, filed on August 18, 2009 and pending in the United States District Court for the Western District of Washington, and

Wilmot v. First American Financial Corporation, et al., filed on April 20, 2007 and pending in the Superior Court of the State of California, County of Los Angeles.

All of these lawsuits, except Sjobring, are putative class actions for which a class has not been certified. In Sjobring a class was certified but that certification was subsequently vacated. For the reasons described above, the Company has not yet been able to assess the probability of loss or estimate the possible loss or the range of loss.

whole.

While some of the lawsuits described above may be material to the Company’s operating results in any particular period if an unfavorable outcome results, the Company does not believe that any of these lawsuits will have a material adverse effect on the Company’s overall financial condition or liquidity.

On March 5, 2010, Bank of America, N.A. filed a complaint in the North Carolina General Court of Justice, Superior Court Division against United General Title Insurance Company and First American Title Insurance Company alleging that the defendants failed to pay or failed to timely respond to certain claims made on title insurance policies issued in connection with home equity loans or lines of credit that are now in default.

On April 1, 2010, the Company filed a third party complaint within the same litigation against Fiserv Solutions, Inc. for breach of contract, indemnification and other matters relating to the plaintiff’s allegations.

During the fourth quarter of 2011, the Company, Bank of America and Fiserv settled the lawsuit through mediation. As a result of the settlement, the Company recorded a charge of $19.2 million in the fourth quarter, which is in addition to the $13.0 million charge recorded in the third quarter of 2011 and is net of all recoveries. The settlement extinguishes all Company liability in connection with policies issued to Bank of America of the type that are the subject of the lawsuit, whether or not Bank of America has submitted a claim with respect to such policies. The court approved of the settlement on December 8, 2011 and dismissed the case with prejudice.

The Company also is a party to non-ordinary course lawsuits other than those described above. With respect to these lawsuits, the Company has determined either that a loss is not probablereasonably possible or that the possibleestimated loss or range of loss, if any, is not material to the consolidated financial statements as a whole.

The Company’s title insurance, property and casualty insurance, home warranty, banking, thrift, trust and investment advisory businesses are regulated by various federal, state and local governmental agencies. Many of the Company’s other businesses operate within statutory guidelines. Consequently, the Company may from time to time be subject to auditexamination or investigation by such governmental agencies. Currently, governmental agencies are auditingexamining or investigating certain of the Company’s operations. These auditsexams or investigations include inquiries into, among other matters, pricing and rate setting practices in the title insurance industry, competition in the title insurance industry, real estate settlement service customer acquisition and retention practices and agency relationships. With respect to matters where the Company has determined that a loss is both probable and reasonably estimable, the Company has recorded a liability representing its best estimate of the financial exposure based on known facts. While the ultimate disposition of each such auditexam or investigation is not yet determinable, the Company does not believe that individually or in the aggregate they will have a material adverse effect on the Company’s financial condition, results of operations or cash flows. These auditsexams or investigations could, however, result in changes to the Company’s business practices which could ultimately have a material adverse impact on the Company’s financial condition, results of operations or cash flows.

The Company and its subsidiaries also are involved in numerous ongoing routine legal and regulatory proceedings related to their operations.  WhileWith respect to each of these proceedings, the ultimate disposition of each proceedingCompany has determined either that a loss is not determinable,reasonably possible or that the ultimate resolutionestimated loss or range of loss, if any, of such proceedings, individually or inis not material to the aggregate, could haveconsolidated financial statements as a material adverse effect on the Company’s financial condition, results of operations or cash flows in the period of disposition.whole.

Item 4.

Mine Safety Disclosures

Not applicable.


Item 4.    Mine Safety Disclosures


Not applicable.

PART II


Item  5.

Market for Registrant’s Common Equity, Related Stockholder Matters and Issuer Purchases of Equity Securities

Common Stock Market Prices and Dividends

The Company’s common stock trades on the New York Stock Exchange (ticker symbol FAF). The approximate number of record holders of common stock on February 15, 2012,18, 2015, was 3,002.

2,654.  

High and low stock prices and dividends declared for 20112014 and for June 2 through December 31, 20102013 are set forth in the table below. June 2, 2010 was the first day that the Company’s common stock traded regular way on the New York Stock Exchange following the Company’s separation from The First American Corporation on June 1, 2010.


   2011   2010 

Period

  High-low range   Cash
dividends
   High-low range   Cash dividends 

Quarter Ended March 31

  $14.45-$17.37    $0.06            

Quarter Ended June 30 (1)

  $14.50-$16.68    $0.06    $12.03-$15.74    $0.06  

Quarter Ended September 30

  $12.45-$16.36    $0.06    $11.90-$15.95    $0.06  

Quarter Ended December 31

  $10.51-$13.72    $0.06    $13.51-$15.25    $0.06  

(1)For the quarter ended June 30, 2010, the high-low range is between June 2 through June 30, 2010.


2014


2013


Period


High-low range


Cash dividends


High-low range


Cash dividends


Quarter Ended March 31

$

24.81-28.19


$

0.12


$

22.78-25.82


$

0.12


Quarter Ended June 30

$

25.45-28.92


$

0.24


$

20.39-27.40


$

0.12


Quarter Ended September 30

$

26.82-28.67


$

0.24


$

20.85-24.71


$

0.12


Quarter Ended December 31

$

26.20-34.51


$

0.24


$

23.60-28.57


$

0.12


We expect that the Company will continue to pay quarterly cash dividends at or above the current level. The timing, declaration and payment of future dividends, however, falls within the discretion of the Company’s board of directors and will depend upon many factors, including the Company’s financial condition and earnings, the capital requirements of our businesses, industry practice, restrictions imposed by applicable law and any other factors the board of directors deems relevant from time to time. In addition, the ability to pay dividends also is potentially affected by the restrictions described in Note 2 Statutory Restrictions on Investments and Stockholders’ Equity to the consolidated financial statements included in “Item 8. Financial Statements and Supplementary Data” of Part II of this report.

Unregistered Sales of Equity Securities

During the year ended December 31, 2011,2014, the Company did not issue any unregistered common stock.

Purchases of Equity Securities by the Issuer and Affiliated Purchasers

The following table describes purchases by the Company of the Company’s common stock which settled during each period set forth in the table. Prices in column (b) include commissions. Purchases described in column (c) were made pursuantPursuant to the share repurchase program initially announced by the Company on March 16, 2011. Under this plan,2011 and expanded on March 11, 2014, which program has no expiration date, the Company may repurchase up to $150.0$250.0 million of the Company’s issued and outstanding common stock. During the quarter ended December 31, 2014, the Company did not repurchase any shares under this plan. Cumulatively the Company has repurchased $2.5$67.1 million (including commissions) of its shares and hadhas the authority to repurchase an additional $147.5$182.9 million (including commissions) under the plan.

Period

  (a)
Total
Number of
Shares
Purchased
   (b)
Average
Price Paid
per Share
   (c)
Total Number of
Shares
Purchased as Part
of Publicly
Announced Plans
or Programs
   (d)
Maximum
Approximate Dollar
Value of Shares
that May Yet Be
Purchased Under
the Plans or
Programs
 

October 1 to October 31, 2011

                 $150,000,000  

November 1 to November 30, 2011

                 $150,000,000  

December 1 to December 31, 2011

   203,900    $12.27     203,900    $147,497,665  


Total

   203,900    $12.27     203,900    $147,497,665  

Stock Performance Graph

The following performance graph and related information shall not be deemed “soliciting material” or “filed” with the SEC, nor shall such information be incorporated by reference into any future filing under the Securities Act of 1933 or the Securities Exchange Act of 1934, each as amended, except to the extent that it is specifically incorporated by reference into such filing.


The following graph compares the cumulative total stockholder return on the Company’s common stock with the corresponding cumulative total returns of the Russell 2000 Financial Services Index and a peer group index for the period from June 2, 2010, the first day the Company’s common stock traded in the regular way market on the New York Stock Exchange, through December 31, 2011.2014. The comparison assumes an investment of $100 on June 2, 2010 and reinvestment of dividends. This historical performance is not indicative of future performance.


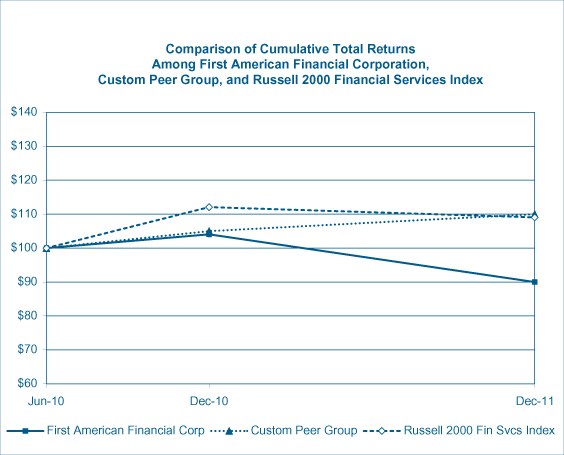
Comparison of Cumulative Total Return


  First
American Financial
Corporation
(FAF) (1)
   Custom Peer
Group (1)(2)
   Russell 2000
Financial
Services Index (1)
 

First
American 

Financial
Corporation
(FAF) (1)


Custom Peer
Group (1)(2)


Russell 2000
Financial
Services 

Index (1)


June 2, 2010

  $100    $100    $100  

$

100


$

100


$

100


December 31, 2010

  $104    $105    $112  

$

104


$

106


$

113


December 31, 2011

  $90    $110    $109  

$

90


$

116


$

109


December 31, 2012

$

174


$

134


$

132


December 31, 2013

$

208


$

191


$

173


December 31, 2014

$

258


$

210


$

189


(1)

As calculated by Bloomberg Financial Services, to include reinvestment of dividends.

(2)

The peer group consists of the following companies: American Financial Group, Inc.; Assurant, Inc.; Cincinnati Financial Corporation; Fidelity National Financial, Inc.;, together with its tracking stock; The Hanover Insurance Group, Inc.; Kemper Corporation; Lender Processing Services, Inc.; Mercury General Corporation; Old Republic International Corp.; White Mountains Insurance Group Ltd.,; and W.R. Berkley Corporation each of which operates in a business similar to a business operated by the Company. Lender Processing Services, Inc. was removed from the peer group for all periods due to its acquisition by Fidelity National Financial, Inc. in January 2014. The compensation committee of the Company utilizes the compensation practices of these companies as benchmarks in setting the compensation of its executive officers.


Item 6.

Selected Financial Data

Item 6.    Selected Financial Data

The selected historical consolidated financial data for First American Financial Corporation (the “Company”) as of and for the five-year period ended December 31, 2011,2014, have been derived from the Company’s consolidated financial statements presented in Item 8.statements. The selected historical consolidated financial data should be read in conjunction with the Consolidated Financial Statements and Notes thereto, “Item 1—Business,” and “Item 7—Management’s Discussion and Analysis of Financial Condition and Results of Operations.”

The Company became a publicly traded company in connection with its spin-off from its prior parent, The First American Corporation (“TFAC”), on June 1, 2010 (the “Separation”). The Company’s historical financial statements prior to June 1, 2010 have been derived from the consolidated financial statements of TFAC and represent carve-out stand-alone combined financial statements. The combined financial statements prior to June 1, 2010 include items attributable to the Company and allocations of general corporate expenses from TFAC. As a result, the Company’s selected historical consolidated financial data prior to June 1, 2010 do not necessarily reflect what its financial position or results of operations would have been if it had been operated as a stand-alone public entity during the periods covered prior to June 1, 2010, and may not be indicative of the Company’s future results of operations and financial position. See Note 1 Description of the Company to the consolidated financial statements for further discussion of the Separation and basis of presentation.

First American Financial Corporation and Subsidiary Companies


   Year Ended December 31, 
   2011  2010  2009  2008  2007 
   (in thousands, except percentages, per share amounts and employee  data) 

Revenues

  $3,820,574   $3,906,612   $4,046,834   $4,367,725   $6,076,132  

Net income (loss)

  $78,579   $128,956   $134,277   $(72,482 $(122,446

Net income attributable to noncontrolling interests

  $303   $1,127   $11,888   $11,523   $20,537  

Net income (loss) attributable to the Company

  $78,276   $127,829   $122,389   $(84,005 $(142,983

Total assets

  $5,370,337   $5,821,826   $5,530,281   $5,720,757   $5,354,531  

Notes and contracts payable

  $299,975   $293,817   $119,313   $153,969   $306,582  

Allocated portion of TFAC debt(Note A)

  $—     $—     $140,000   $140,000   $—    

Stockholders’ equity or TFAC’s invested equity(Note B)

  $2,028,600   $1,980,017   $2,019,800   $1,891,841   $1,930,774  

Return on average stockholders’ equity or TFAC’s invested equity

   3.9  6.4  6.3  (4.4)%   (6.4)% 

Dividends on common shares(Note C)

  $24,784   $18,553   $—     $—     $—    

Per share of common stock(Note D)—
Net income (loss) attributable to the Company:


Basic

  $0.74   $1.23   $1.18   $(0.81 $(1.37

Diluted

  $0.73   $1.20   $1.18   $(0.81 $(1.37

Stockholders’ equity or TFAC’s invested equity

  $19.24   $18.96   $19.42   $18.19   $18.56  

Cash dividends

  $0.24   $0.18   $—     $—     $—    

Number of common shares outstanding(Note E)—Weighted average during the year:


Basic

   105,197    104,134    104,006    104,006    104,006  

Diluted

   106,914    106,177    104,006    104,006    104,006  

End of year

   105,410    104,457    104,006    104,006    104,006  

Other Operating Data (unaudited):


Title orders opened(Note F)

   1,254    1,469    1,771    1,780    2,221  

Title orders closed(Note F)

   918    1,079    1,301    1,239    1,538  

Number of employees(Note G)

   16,117    16,879    13,963    15,147    19,783  


Year Ended December 31,


2014


2013


2012


2011


2010


(in thousands, except percentages, per share amounts and employee data)


Revenues

$

4,677,949


$

4,956,077


$

4,541,821


$

3,820,574


$

3,906,612


Net income

$

234,215


$

187,064


$

301,728


$

78,579


$

128,956


Net income attributable to noncontrolling interests

$

681


$

697


$

687


$

303


$

1,127


Net income attributable to the Company

$

233,534


$

186,367


$

301,041


$

78,276


$

127,829


Total assets

$

7,666,100


$

6,559,183


$

6,077,626


$

5,371,655


$

5,821,612


Notes and contracts payable

$

587,337


$

310,285


$

229,760


$

299,975


$

293,817


Stockholders’ equity

$

2,572,917


$

2,453,049


$

2,348,065


$

2,028,600


$

1,980,017


Return on average stockholders’ equity


9.3

%


7.8

%


13.8

%


3.9

%


6.4

Dividends on common shares

$

89,939


$

51,324


$

37,612


$

24,784


$

18,553


Per share of common stock (Note A)—


Net income attributable to the Company:


Basic

$

2.18


$

1.74


$

2.83


$

0.74


$

1.22


Diluted

$

2.15


$

1.71


$

2.77


$

0.73


$

1.20


Stockholders’ equity

$

23.93


$

23.16


$

21.90


$

19.24


$

18.96


Cash dividends declared

$

0.84


$

0.48


$

0.36


$

0.24


$

0.18


Number of common shares outstanding (Note B)—


Weighted average during the year:


Basic


106,884


106,991


106,307


105,197


104,134


Diluted


108,688


109,102


108,542


106,914


106,177


End of year


107,541


105,900


107,239


105,410


104,457


Other Operating Data (unaudited):


Title orders opened (Note C)


1,156


1,385


1,635


1,249


1,469


Title orders closed (Note C)


816


1,103


1,192


913


1,079


Number of employees (Note D)


17,103


17,292


17,312


16,117


16,879


Note A—Prior to the Separation, a portion of TFAC’s combined debt, in the amount of $140.0 million, was allocated to the Company based on amounts directly incurred for the Company’s benefit. In connection with the Separation, the Company borrowed $200.0 million under its revolving credit facility and transferred such funds to CoreLogic, which fully satisfied the Company’s $140.0 million allocated portion of TFAC debt.

Note B—Stockholders’ equity refers to the stockholders of the Company and excludes noncontrolling interests. TFAC’s invested equity refers to the net assets of the Company which reflects TFAC’s investment in the Company prior to the Separation and excludes noncontrolling interests.

Note C—The Company did not declare dividends prior to the Separation as it was not a stand-alone publicly traded company until the Separation.

Note D—Per share information relating to net income is based on weighted-average number of shares outstanding for the years presented. Per share information relating to stockholders’ equity is based on shares outstanding at the end of each year.

Note E—B—Number of common shares outstanding for prior years2010 was computed using the number of shares of common stock outstanding immediately following the Separation, as if such shares were outstanding for the entire period prior to the Separation.

Note F—C—Title order volumes are those processed by the direct domestic title operations of the Company and do not include orders processed by agents.

Note G—D—Number of employees is based on actual employee headcount. The increase in headcount in 2010 was due to certain offshore functions being performed internally by the Company that prior to the Separation were performed by TFAC. This increase in headcount is substantially related to employees employed outside of the United States.


Item 7.    Management’s Discussion and Analysis of Financial Condition and Results of Operations

Management’s Discussion and Analysis of Financial Condition and Results of Operations

This Management’s Discussion and Analysis contains certain financial measures including adjusted title insurance and services segment operating expenses and personnel costs, that are not presented in accordance with generally accepted accounting principles (“GAAP”)., including adjusted information and other revenues, adjusted personnel costs, adjusted other operating expenses and adjusted depreciation and amortization expense, in each case excluding the effects of recent acquisitions.  The Company is presenting these non-GAAP financial measures because they provide the Company’s management and readers of thethis Annual Report on Form 10-K with additional insight into the operational performance of the Company relative to earlier periods and relative to the Company’s competitors.periods.  The Company does not intend for these non-GAAP financial measures to be a substitute for any GAAP financial information.  In this Annual Report on Form 10-K, these non-GAAP financial measures have been presented with, and reconciled to, the most directly comparable GAAP financial measures.  Readers of this Annual Report on Form 10-K should use these non-GAAP financial measures only in conjunction with the comparable GAAP financial measures.

Spin-off

The Company became a publicly traded company following its spin-off from its prior parent, The First American Corporation (“TFAC”) on June 1, 2010 (the “Separation”). On that date, TFAC distributed all of the Company’s outstanding shares to the record date shareholders of TFAC on a one-for-one basis (the “Distribution”). After the Distribution, the Company owns TFAC’s financial services businesses and TFAC, which reincorporated and assumed the name CoreLogic, Inc. (“CoreLogic”), continues to own its information solutions businesses. The Company’s common stock trades on the New York Stock Exchange under the “FAF” ticker symbol and CoreLogic’s common stock trades on the New York Stock Exchange under the ticker symbol “CLGX.”

To effect the Separation, TFAC and the Company entered into a Separation and Distribution Agreement (the “Separation and Distribution Agreement”) that governs the rights and obligations of the Company and CoreLogic regarding the Distribution. It also governs the relationship between the Company and CoreLogic subsequent to the completion of the Separation and provides for the allocation between the Company and CoreLogic of TFAC’s assets and liabilities. The Separation and Distribution Agreement identifies assets, liabilities and contracts that were allocated between CoreLogic and the Company as part of the Separation and describes the transfers, assumptions and assignments of these assets, liabilities and contracts. In particular, the Separation and Distribution Agreement provides that, subject to the terms and conditions contained therein:

All of the assets and liabilities primarily related to the Company’s business—primarily the business and operations of TFAC’s title insurance and services segment and specialty insurance segment—have been retained by or transferred to the Company;

All of the assets and liabilities primarily related to CoreLogic’s business—primarily the business and operations of TFAC’s data and analytic solutions, information and outsourcing solutions and risk mitigation and business solutions segments—have been retained by or transferred to CoreLogic;

On the record date for the Distribution, TFAC issued to the Company and its principal title insurance subsidiary, First American Title Insurance Company (“FATICO”), a number of shares of its common stock that resulted in the Company and FATICO collectively owning 12.9 million shares of CoreLogic’s common stock immediately following the Separation, some of which have subsequently been sold. See Note 19 Transactions with CoreLogic/TFAC to the consolidated financial statements for further discussion of the CoreLogic stock;

The Company effectively assumed $200.0 million of the outstanding liability for indebtedness under TFAC’s senior secured credit facility through the Company’s borrowing and transferring to CoreLogic of $200.0 million under the Company’s credit facility in connection with the Separation. See Note 10 Notes and Contracts Payable to the consolidated financial statements for further discussion of the Company’s credit facility.

The Separation resulted in a net distribution from the Company to TFAC of $151.4 million. In connection with such distribution, the Company assumed $22.1 million of accumulated other comprehensive loss, net of tax, which was primarily related to the Company’s assumption of the unfunded portion of the defined benefit pension

obligation associated with participants who were employees of the businesses retained by CoreLogic. See Note 14 Employee Benefit Plans to the consolidated financial statements for additional discussion of the defined benefit pension plan.

Principles of Consolidation

The consolidated financial statements have been prepared in accordance with generally accepted accounting principles and reflect the consolidated operations of the Company as a separate, stand-alone publicly traded company subsequent to June 1, 2010.Company. The consolidated financial statements include the accounts of First American Financial Corporation and all controlled subsidiaries. All significant intercompany transactions and balances have been eliminated. Investments in which the Company exercises significant influence, but does not control and is not the primary beneficiary, are accounted for using the equity method. Investments in which the Company does not exercise significant influence over the investee are accounted for under the cost method.

Principles of Combination and Basis of Presentation

The Company’s historical financial statements prior to June 1, 2010 have been prepared in accordance with generally accepted accounting principles and have been derived from the consolidated financial statements of TFAC and represent carve-out stand-alone combined financial statements. The combined financial statements prior to June 1, 2010 include items attributable to the Company and allocations of general corporate expenses from TFAC.

The Company’s historical financial statements prior to June 1, 2010 include assets, liabilities, revenues and expenses directly attributable to the Company’s operations. The Company’s historical financial statements prior to June 1, 2010 reflect allocations of corporate expenses from TFAC for certain functions provided by TFAC, including, but not limited to, general corporate expenses related to finance, legal, information technology, human resources, communications, compliance, facilities, procurement, employee benefits, and share-based compensation. These expenses have been allocated to the Company on the basis of direct usage when identifiable, with the remainder allocated on the basis of net revenue, domestic headcount or assets or a combination of such drivers. The Company considers the basis on which the expenses have been allocated to be a reasonable reflection of the utilization of services provided to or the benefit received by the Company during the periods presented. The Company’s historical financial statements prior to June 1, 2010 do not reflect the debt or interest expense it might have incurred if it had been a stand-alone entity. In addition, the Company expects to incur other expenses, not reflected in its historical financial statements prior to June 1, 2010, as a result of being a separate publicly traded company. As a result, the Company’s historical financial statements prior to June 1, 2010 do not necessarily reflect what its financial position or results of operations would have been if it had been operated as a stand-alone public entity during the periods covered prior to June 1, 2010, and may not be indicative of the Company’s future results of operations and financial position.

Reportable Segments

The Company consists of the following reportable segments and a corporate function:

·

The Company’s title insurance and services segment issues title insurance policies on residential and commercial property in the United States and offers similar or related products and services internationally. This segment also provides closing and/or escrow services; accommodates tax-deferred exchanges of real estate; provides products, services and solutions involving the use of real property related data designed to mitigate risk or otherwise facilitate real estate transactions; maintains, manages and provides access to title plant records and images; and provides banking, trust and investment advisory services. The Company, through its principal title insurance subsidiary and such subsidiary’s affiliates, transacts its title insurance business through a network of direct operations and agents. Through this network, the Company issues policies in the 49 states that permit the issuance of title insurance policies and the District of Columbia. The Company also offers title insurance and services segment issues title insurance policies on residential and commercial property in the United States and offers similar products and services internationally. This segment also provides closing and/or escrow services, accommodates tax-deferred exchanges of real estate, maintains, manages and provides access to title plant records and images and provides banking, trust and investment advisory services. The Company, through its principal title insurance subsidiary and such subsidiary’s affiliates, transacts its title insurance business through a network of direct operations and agents. Through this network, the Company issues policies in the 49 states that permit the issuance of title insurance policies and the District of Columbia. The Company also offers title

insurance and other insurance and guarantee products, as well as similar or related products andsettlement services either directly or through joint ventures in foreign countries, including Canada, the United Kingdom, Australia and various other established and emerging markets.

The Company’s specialty insurance segment issues property and casualty insurance policies and sells home warranty products. The property and casualty insurance business provides insurance coverage to residential homeowners and renters for liability losses and typical hazards such as fire, theft, vandalism and other types of property damage. This business is licensed to issue policies in all 50 states and actively issues policies in 43 states. In its largest market, California,

·

The Company’s specialty insurance segment issues property and casualty insurance policies and sells home warranty products. The property and casualty insurance business provides insurance coverage to residential homeowners and renters for liability losses and typical hazards such as fire, theft, vandalism and other types of property damage. This business is licensed to issue policies in all 50 states and the District of Columbia and actively issues policies in 46 states. In certain markets it also offers preferred risk auto insurance to better compete with other carriers offering bundled home and auto insurance. The home warranty business provides residential service contracts that cover residential systems, such as heating and air conditioning systems, and certain appliances against failures that occur as the result of normal usage during the coverage period. This business currently operates in 39 states and the District of Columbia.

The corporate function consists primarily of certain financing facilities as well as the corporate services that support the Company’s business operations.


Critical Accounting Policies and Estimates

The preparation of financial statements in accordance with GAAP requires the application of accounting policies that often involve a significant degree of judgment.  The Company’s management considers the accounting policies described below to be criticalthe most dependent on the application of estimates and assumptions in preparing the Company’s consolidated financial statements. These policies require management to make estimates and judgments that affect the reported amounts of certain assets, liabilities, revenues, expenses and related disclosures of contingencies. See Note 1 Description of the Company to the consolidated financial statements for a more detailed description of the Company’s significant accounting policies.

Revenuerecognition.    Title premiums on policies issued directly by the Company are recognized on the effective date of the title policy and escrow fees are recorded upon close of the escrow. Revenues from title policies issued by independent agents are recorded when notice of issuance is received from the agent, which is generally when cash payment is received by the Company. Revenues earned by the Company’s title plant management business are recognized at the time of delivery, as the Company has no significant ongoing obligation after delivery.

Direct premiums of the Company’s specialty insurance segment include revenues from home warranty contracts which are recognized ratably over the 12-month duration of the contracts, and revenues from property and casualty insurance policies which are also recognized ratably over the 12-month duration of the policies.

Interest on loans of the Company’s thrift subsidiary is recognized on the outstanding principal balance on the accrual basis. Loan origination fees and related direct loan origination costs are deferred and recognized over the life of the loan. Revenues earned by the other products in the Company’s trust and banking operations are recognized at the time of delivery, as the Company has no significant ongoing obligation after delivery.

Provision for policy losses.    The Company provides for title insurance losses by a charge to expense when the related premium revenue is recognized. The amount charged to expense is generally determined by applying a rate (the loss provision rate) to total title insurance premiums and escrow fees. The Company’s management estimates the loss provision rate at the beginning of each year and reassesses the rate quarterly to ensure that the resulting incurred but not reported (“IBNR”) loss reserve and known claims reserve included in the Company’s consolidated balance sheets together reflect management’s best estimate of the total costs required to settle all IBNR and known claims. If the ending IBNR reserve is not considered adequate, an adjustment is recorded.

The process of assessing the loss provision rate and the resulting IBNR reserve involves evaluation of the results of both an in-house actuarial review and independent actuarial analysis.review. The Company’s in-house actuary performs a reserve analysis utilizing generally accepted actuarial methods that incorporate cumulative historical

claims experience and information provided by in-house claims and operations personnel. Current economic and business trends are also reviewed and used in the reserve analysis. These include real estate and mortgage markets conditions, changes in residential and commercial real estate values, and changes in the levels of defaults and foreclosures that may affect claims levels and patterns of emergence, as well as any company-specific factors that may be relevant to past and future claims experience. Results from the analysis include, but are not limited to, a range of IBNR reserve estimates and a single point estimate for IBNR as of the balance sheet date.

For recent policy years at early stages of development (generally the last three years), IBNR is estimated using a combination of expected loss rate and multiplicative loss development factor calculations. For more mature policy years, IBNR generally is estimated using multiplicative loss development factor calculations. The expected loss rate method estimates IBNR by applying an expected loss rate to total title insurance premiums and escrow fees, and adjusting for policy year maturity using the estimated loss development patterns. Multiplicative loss development factor calculations estimate IBNR by applying factors derived from loss development patterns to losses realized to date. The expected loss rate and loss development patterns are based on historical experience and the relationship of the history to the applicable policy years. This is a generally accepted actuarial method of determining IBNR for policy years at early development ages. IBNR calculated in this way differs from the IBNR that a multiplicative loss development factor calculation would produce. Factor-based development effectively extrapolates results to date forward through the lifetime of the policy year’s development.

For more mature policy years (generally, policy years aged more than three years), IBNR is estimated using multiplicative loss development factor calculations. These years were exposed to adverse economic conditions during 2007 through 2011 that may have resulted in acceleration of claims and one-time losses. The possible extrapolation of these losses to future development periods by using factors was considered. The impact of economic conditions during 2007 through 2011 is believed to account for a much less significant portion of losses on policy years 2004 and prior than on more recent policy years. Policy years 2004 and prior were at relatively mature ages when the adverse development period began in 2007, and much of their losses had already been incurred by then. In addition, the loss development factors for policy years 2004 and prior are low enough that the potential for over-extrapolation is limited to an acceptable level.

The Company utilizes an independent third party actuary who produces a report with estimates and projections of the same financial items described above. The third party actuary’s analysis uses generally accepted actuarial methods that may in whole or in part be different from those used by the in-house actuary. The third party actuary’s report is used to assess the reasonableness of the in-house analysis.

The Company’s management uses the IBNR point estimate from the in-house actuary’s analysis and other relevant information it may have concerning claims to determine what it considers to be the best estimate of the total amount required for the IBNR reserve.

Title insurance policies are long-duration contracts with the majority of the claims reported to the Company within the first few years following the issuance of the policy. Generally, 7570% to 85 percent80% of claim amounts become known in the first six years of the policy life, and the majority of IBNR reserves relate to the six most recent policy years. A material change in expected ultimate losses and corresponding loss rates for policy years older than six years, while possible, is not considered reasonably likely by the Company. However, changesChanges in expected ultimate losses and corresponding loss rates for recent policy years are considered likely and could result in a material adjustment to the IBNR reserves. Based on historical experience, the Companymanagement believes that a 50 basis point change to one or more of the loss rates for the most recent policy years, positive or negative, is reasonably likely given the long duration nature of a title insurance policy. IfFor example, if the expected ultimate losses for each of the last six policy years increased or decreased by 50 basis points, the resulting impact on the Company’s IBNR reserve would be an increase or decrease, as the case may be, of $120.4$98.7 million. A material change in expected ultimate losses and corresponding loss rates for older policy years is also possible, particularly for policy years with loss ratios exceeding historical norms. The estimates made by management in determining the appropriate level of IBNR reserves could ultimately prove to be inaccurate andmaterially different from actual claims experience may vary from expected claims experience.

The Company provides for property and casualty insurance losses when the insured event occurs. The Company provides for claims losses relating to its home warranty business based on the average cost per claim as applied to the total of new claims incurred. The average cost per home warranty claim is calculated using the average of the most recent 12 months of claims experience.experience adjusted for estimated future increases in costs.


A summary of the Company’s loss reserves broken down into its components ofis as follows:

(in thousands, except percentages)


December 31, 2014


December 31, 2013


Known title claims


$

165,330


16.3

%


$

135,478


13.3

%

Incurred but not reported claims


802,069


79.3

%


840,104


82.5

%

Total title claims


967,399


95.6

%


975,582


95.8

%

Non-title claims


44,381


4.4

%


42,783


4.2

%

Total loss reserves


$

1,011,780


100.0

%


$

1,018,365


100.0

%

Activity in the reserve for known title claims is summarized as follows:


December 31,


2014


2013


2012


(in thousands)


Balance at beginning of year

$

135,478


$

133,070


$

162,019


Provision transferred from IBNR title claims related to:


Current year


29,939


17,720


18,592


Prior years


274,481


280,373


233,258


304,420


298,093


251,850


Payments, net of recoveries, related to:


Current year


22,272


15,355


16,044


Prior years


249,851


280,627


269,166


272,123


295,982


285,210


Other


(2,445

)


297


4,411


Balance at end of year

$

165,330


$

135,478


$

133,070


The provision transferred from IBNR title claims related to current year increased by $12.2 million in 2014 from 2013 and decreased by $0.9 million in 2013 from 2012 and payments, net of recoveries, related to current year increased by $6.9 million in 2014 from 2013 and decreased by $0.7 million in 2013 from 2012, reflecting variability in claims volumes characteristic of a policy year during its first year of development. In addition, 2014 experienced a higher level of fraud losses when compared to 2013 and 2012.

The provision transferred from IBNR title claims related to prior years decreased by $5.9 million and payments, net of recoveries, related to prior years decreased by $30.8 million in 2014 from 2013.  The 11.0% decline in payments exceeded the 2.1% decline in provision transferred primarily due to the timing of a large commercial claim settlement payment.  The provision for the large commercial claim was transferred from IBNR during 2014, while the settlement payment occurred in 2015.

The provision transferred from IBNR title claims related to prior years increased by $47.1 million and payments, net of recoveries, related to prior years increased by $11.5 million in 2013 from 2012.  These increases were primarily attributable to increased domestic lenders claims for policy years 2004 through 2008 and, to a lesser extent, large commercial claims above expected levels, mainly from mechanics liens.  The increase in domestic lenders claims was primarily due to mortgage lenders and servicers processing a large volume of foreclosures during 2013.  As foreclosure processing increases, lenders claims generally increase, because lenders claims typically come from foreclosures in which the lender suffers a loss.


Activity in the reserve for incurred but not reported and non-titletitle claims is summarized as follows:


(in thousands except percentages)  December 31, 2011  December 31, 2010 

Known title claims

  $162,019     15.9 $192,268     17.4

IBNR

   816,603     80.5  875,627     79.0


Total title claims

   978,622     96.4  1,067,895     96.4

Non-title claims

   36,054     3.6  40,343     3.6


Total loss reserves

  $1,014,676     100.0 $1,108,238     100.0


December 31,


2014


2013


2012


(in thousands)


Balance at beginning of year

$

840,104


$

805,430


$

816,603


Provision related to:


Current year


190,971


196,275


173,335


Prior years


62,159


148,454


62,620


253,130


344,729


235,955


Provision transferred to known title claims related to:


Current year


29,939


17,720


18,592


Prior years


274,481


280,373


233,258


304,420


298,093


251,850


Other


13,255


(11,962

)


4,722


Balance at end of year

$

802,069


$

840,104


$

805,430


The provision related to current year decreased by $5.3 million, or 2.7%, in 2014 from 2013.  This decrease was attributable to a 7.6% decline in title premiums and escrow fees in 2014 from 2013, partly offset by a higher current year loss rate in 2014 when compared to 2013.  The current year loss rate in 2014 was 5.3% compared to 5.0% in 2013.

The provision related to current year increased by $22.9 million, or 13.2%, in 2013 from 2012.  This increase was attributable to a 12.9% increase in title premiums and escrow fees in 2013 from 2012.

For further discussion of title provision recorded in 2014, 2013 and 2012, see Results of Operations, pages 37 and 38.

Fair Valuevalue of Investment Portfolio.investment portfolio.    The Company classifiescategorizes the fair value of its debt and equity securities using a three-level hierarchy for fair value measurements that distinguishes between market participant assumptions developed based on market data obtained from sources independent of the reporting entity (observable inputs) and the reporting entity’s own assumptions about market participant assumptions developed based on the best information available in the circumstances (unobservable inputs). The hierarchy for inputs used in determining fair value maximizes the use of observable inputs and minimizes the use of unobservable inputs by requiring that observable inputs be used when available. The hierarchy level assigned to each security in the Company’s available-for-sale portfolio iswas based on management’s assessment of the transparency and reliability of the inputs used into estimate the valuation of such instrumentfair values at the measurement date. The three hierarchy levels are defined as follows:

Level 1—Valuations based on unadjusted quoted market prices in active markets for identical securities. The fair value of equity securities are classified as Level 1.

Level 2—Valuations based on observable inputs (other than Level 1 prices), such as quoted prices for similar assets at the measurement date; quoted prices in markets that are not active; or other inputs that are observable, either directly or indirectly. The Level 2 category includes U.S. Treasury bonds, municipal bonds, foreign bonds, governmental agency bonds, governmental agency mortgage-backed securities and corporate debt securities, many of which are actively traded and have market prices that are readily verifiable.

Level 3—Valuations based on inputs that are unobservable and significantSee Note 15 Fair Value Measurements to the overall fair value measurement, and involve management judgment. The Level 3 category includes non-agency mortgage-backed securities which are currently not actively traded.

If the inputs used to measure fair value fall in different levelsconsolidated financial statements for a more detailed description of the fair valuethree-level hierarchy and a financial security’s hierarchy level is based upon the lowest level of input that is significant to the fair value measurement. description for each level.  

The valuation techniques and inputs used to estimate the fair value of the Company’s debt and equity securities are summarized as follows:

Fair value of debt securities

The fair value of debt securities was based on the market values obtained from an independent pricing serviceservices that were evaluated using pricing models that vary by asset class and incorporate available trade, bid and other market information and price quotes from well-established independent broker-dealers. The independent pricing service monitorsservices monitor market indicators, industry and economic events, and for broker-quoted only securities, obtainsobtain quotes from market makers or broker-dealers that it recognizesthey recognize to be market participants. The pricing service utilizesservices utilize the market approach in determining the fair value of the debt securities held by the Company. Additionally, theThe Company obtains an understanding of the valuation models and assumptions utilized by the serviceservices and has controls in place to determine that the values provided represent fair value. The Company’s validation procedures include comparing prices received from the pricing serviceservices to quotes received from other third party sources for certain securities with market prices that are readily verifiable. If the price comparison results in differences over a predefined threshold, the Company will assess the reasonableness of the changes relative to prior periods given the prevailing market conditions and assess changes in the issuers’ credit worthiness, performance of any underlying collateral and prices of the instrument relative to similar issuances. To date, the Company has not made any material adjustments to the fair value measurements provided by the pricing service.services.

Typical inputs and assumptions to pricing models used to value the Company’s U.S. Treasury bonds, municipal bonds, foreign bonds, governmental agency bonds, governmental agency mortgage-backed securities and corporate debt securities


include, but are not limited to, benchmark yields, reported trades, broker-dealer quotes, credit spreads, credit ratings, bond insurance (if applicable), benchmark securities, bids, offers, reference data and industry and economic events. For mortgage-backed securities, inputs and assumptions may also include the structure of issuance, characteristics of the issuer, collateral attributes and prepayment speeds. The fair value of non-agency mortgage-backed securities was obtained from the independent pricing serviceservices referenced above and subject to the Company’s validation procedures discussed above. However, due to the fact thatsince these securities were not actively traded and there was lesswere fewer observable inputs available requiring the pricing serviceservices to use more judgment in determining the fair value of the securities, thereforethey were classified as Level 3.

The significant unobservable inputs used in the Company classifiedfair value measurement of the Company’s non-agency mortgage-backed securities as Level 3.include prepayment rates, default rates and loss severity in the event of default. Significant increases (decreases) in any of those inputs in isolation would result in a significantly lower (higher) fair value measurement. Generally, a change in the assumption used for default rates is accompanied by a directionally similar change in the assumption used for the loss severity and a directionally opposite change in the assumption used for prepayment rates.

Other-than-temporary impairment–debt securities

If the Company intends to sell a debt security in an unrealized loss position or determines that it is more likely than not that the Company will be required to sell a debt security before it recovers its amortized cost basis, the debt security is other-than-temporarily impaired and it is written down to fair value with all losses recognized in earnings. As of December 31, 2011,2014, the Company doesdid not intend to sell any debt securities in an unrealized loss position and it is not more likely than not that the Company will be required to sell debt securities before recovery of their amortized cost basis.

If the Company does not expect to recover the amortized cost basis of a debt security with declines in fair value (even if the Company does not intend to sell the debt security and it is not more likely than not that the Company will be required to sell the debt security before the recovery of its remaining amortized cost basis)security), the losses the Company considers to be the credit portion of the other-than-temporary impairment loss (“credit loss”) is recognized in earnings and the non-credit portion is recognized in other comprehensive income. The credit loss is the difference between the present value of the cash flows expected to be collected and the amortized cost basis of the debt security. The cash flows expected to be collected are discounted at the rate implicit in the security immediately prior to the recognition of the other-than-temporary impairment.

Expected future cash flows for debt securities are based on qualitative and quantitative factors specific to each security, including the probability of default and the estimated timing and amount of recovery. The detailed inputs used to project expected future cash flows may be different depending on the nature of the individual debt security. Specifically,

The Company determines if a non-agency mortgage-backed security in a loss position is other-than-temporarily impaired by comparing the present value of the cash flows expected to be collected from the security to its amortized cost basis. If the present value of the cash flows expected to be collected exceed the amortized cost of the security, the Company concludes that the security is not other-than-temporarily impaired. The Company performs this analysis on all non-agency mortgage-backed securities in its portfolio that are in an unrealized loss position. For the securities that were determined not to be other-than-temporarily impaired at December 31, 2014, the present value of the cash flows expected to be collected exceeded the amortized cost of each security.

Cash flows expected to be collected for each non-agency mortgage-backed security are estimated by analyzing loan-level detail to estimate future cash flows from the underlying assets, which are then applied to the security based on the underlying contractual provisions of the securitization trust that issued the security (e.g., subordination levels, remaining payment terms, etc.). The Company uses third-party software to determine how the underlying collateral cash flows will be distributed to each security issued from the securitization trust. The primary assumptions used in estimating future collateral cash flows are prepayment speeds, default rates and loss severity. In developing these assumptions, the Company considers the financial condition of the borrower, loan to value ratio, loan type and geographical location of the underlying property. The Company utilizes publicly available information related to specific assets, generally available market data such as forward interest rate curves and CoreLogic’s securities, loans and property data and market analytics tools.tools provided through a third party.


The table below summarizes the primary assumptions used at December 31, 20112014 in estimating the cash flows expected to be collected for these securities.


Weighted 

average


Range


Prepayment speeds


10.0

%


8.8

%

14.0

%

Default rates


2.5

%


1.8

%

3.7

%

Loss severity


18.7

%


3.6

%

28.5

%

Weighted averageRange

Prepayment speeds

8.06.4%—10.0%

Default rates

5.11.8%—10.5%

Loss severity

30.47.9%—39.7%
As a result of the Company’s security-level review, the Company recognized $1.7 million and $3.6 million of other-than-temporary impairments considered to be credit related on its non-agency mortgage-backed securities in earnings for the years ended December 31, 2014 and 2012, respectively. The Company did not recognize any other-than-temporary impairments considered to be credit related in 2013. It is possible that the Company could recognize additional other-than-temporary impairment losses on securities it owns at December 31, 2014 if future events or information cause it to determine that a decline in fair value is other-than-temporary.

Fair value of equity securities

The fair value of equity securities, including exchange traded funds, mutual funds, marketable common and preferred and common stocks, waswere based on quoted market prices for identical assets that are readily and regularly available in an active market.

Other-than-temporary impairment–equity securities

When in the opinion of management, a decline in the fair value of an equity security, (includingincluding common and preferred stock) and, prior to the first quarter of 2009, a debt securitystock, is considered to be other-than-temporary, such equity security is written down to its fair value. When assessing if a decline in fair value is other-than-temporary, the factors considered include the length of time and extent to which fair value has been below cost, the probability that the Company will be unable to collect all amounts due under the contractual terms of the security, the seniority and duration of the securities, issuer-specific news and other developments, the financial condition and prospects of the issuer (including credit ratings), macro-economic changes (including the outlook for industry sectors, which includes government policy initiatives) and the Company’s ability and intent to hold the investmentsecurity for a period of time sufficient to allow for any anticipated recovery.

When an equity security has been in an unrealized loss position for greater than twelve months, the Company’s review of the security includes the above noted factors as well as other evidence that might exist supporting the evidence, if any exists, to supportview that the security will recover its value in the foreseeable future, typically within the next twelve months. If objective, substantial evidence does not indicate a likely recovery during that timeframe, the Company’s policy is that such losses are considered other-than-temporary and therefore an impairment loss is recorded. The Company did not record any other-than-temporary impairment losses related to its equity securities for the years ended December 31, 2014, 2013 and 2012.

Litigation and regulatory contingencies.    The Company and its subsidiaries are parties to a number of ongoing routine and non-ordinary course legal proceedings. For those lawsuits where the Company has determined that a loss is both probable and reasonably estimable, a liability representing the best estimate of the Company’s financial exposure based on known facts has been recorded. Actual losses may materially differ from the amounts recorded.  For a substantial majority of these lawsuits it is not possible to assess the probability of loss. Most of these lawsuits are putative class actions which require a plaintiff to satisfy a number of procedural requirements before proceeding to trial. As a result of, among other factors, ambiguities and inconsistencies in the myriad laws applicable to the Company’s business and the uniqueness of the factual issues presented in any given lawsuit, the Company often cannot determine the probability of loss until a court has finally determined that a plaintiff has satisfied applicable procedural requirements. Furthermore, because most of these lawsuits are putative class actions, it is often impossible to estimate the possible loss or a range of loss amounts, even where the Company has determined that a loss is reasonably possible.  In addition, many of the Company’s businesses are regulated by various federal, state, local and foreign governmental agencies and are subject to numerous statutory guidelines. These regulations and statutory guidelines often are complex, inconsistent or ambiguous, which results in additional uncertainty as to the outcome of a given lawsuit—including the amount of damages a plaintiff might be afforded—or makes it difficult to analogize experience in one case or jurisdiction to another case or jurisdiction.


At December 31, 2011, theBusiness Combinations.    The Company owned 8.9 million shares of CoreLogic common stock with a cost basis of $167.6 million and an estimated fair value of $115.5 million. While the Company’s investment in CoreLogic common stock has not been in an unrealized loss position for greater than twelve months, the Company assessed its investment in CoreLogic for other-than-temporary impairment due to the significant amount of shares owned. In August 2011, CoreLogic announced that its board of directors had formed a committee of independent directors to explore options aimed at enhancing shareholder value including cost savings initiatives, an evaluation of CoreLogic’s capital structure, repurchases of debt and common stock, the disposition of business lines, the sale or business combination of CoreLogic and other alternatives. CoreLogic’s board of directors also announced that it retained a financial adviser to assist the committee in its evaluation. Based on the factors considered, the Company’s opinion is the decline inallocates the fair value of CoreLogic’s common stockpurchase consideration to the tangible assets acquired, liabilities assumed and intangible assets acquired based on their estimated fair values. The excess of the fair value of purchase consideration over the fair values of these identifiable assets and liabilities is not other-than-temporary; therefore,recorded as goodwill. When determining the unrealized lossfair values of $52.1 million was recordedassets acquired and liabilities assumed, management makes significant estimates and assumptions, especially with respect to intangible assets.

Critical estimates in accumulated other comprehensive loss on the Company’s consolidated balance sheet. The factors considered by the Companyvaluing certain intangible assets include, but are not limited to, (i) thefuture expected cash flows, useful lives, and discount rates. Management’s estimates of fair value ofare based upon assumptions believed to be reasonable, but which are inherently uncertain and unpredictable and, as a result, actual results may differ from estimates. Other estimates associated with the common stock has been below costaccounting for less than twelve months, (ii)acquisitions may change as additional information becomes available regarding the Company has the abilityassets acquired and intent to hold the common stockliabilities assumed.

Impairment assessment for a period of time sufficient to allow for recovery, (iii) the process of exploring options aimed at enhancing shareholder value in which CoreLogic is engaged, and (iv) in January 2012, CoreLogic issued updated 2011 guidance and full year 2012 guidance containing information that the Company assessed as positive. It is possible that the Company could recognize an other-than-temporary impairment related to its CoreLogic common stock if future events or information cause it to determine that the decline in value is other-than-temporary. The Company will continue to closely monitor and regularly review its investment in CoreLogic common stock.

goodwill.    Impairment testing for goodwill and other indefinite-lived intangible assets.The Company is required to perform an annual goodwill impairment test for goodwill and other indefinite-lived intangible assetsassessment for each reporting unit. This annual test, which the Company has elected to perform every fourth quarter, utilizes a variety of valuation techniques, all of which require it to make estimates and judgments. Fair value is determined by employing an expected present value technique, which utilizes multiple cash flow scenarios that reflect a range of possible outcomes and an appropriate discount rate. The use of comparative market multiples (the “market approach”) compares the reporting unit to other comparable companies (if such comparables are present in the marketplace) based on valuation multiples to arrive at a fair value. The Company also uses certain of these

valuation techniques in accounting for business combinations, primarily in the determination of the fair value of acquired assets and liabilities. In assessing the fair value, the Company utilizes the results of the valuations (including the market approach to the extent comparables are available) and considers the range of fair values determined under all methods and the extent to which the fair value exceeds the book value of the equity. The Company’s four reporting units are title insurance, home warranty, property and casualty insurance and trust and other services. The Company’s policy isCompany has elected to perform anthis annual impairment test for each reporting unitassessment in the fourth quarter of each fiscal year or sooner if circumstances indicate a possible impairment.

Based on current guidance, the Company has the option to perform a qualitative assessment to determine if the fair value is more likely than not (i.e. a likelihood of greater than 50%) less than the carrying amount as a basis for determining whether it is necessary to perform a quantitative impairment test, or may choose to forego the qualitative assessment and perform the quantitative impairment test. The qualitative factors considered in this assessment may include macroeconomic conditions, industry and market considerations, overall financial performance as well as other relevant events and circumstances as determined by the Company. The Company evaluates the weight of each factor to determine whether it is more likely than not that impairment may exist. If the results of the qualitative assessment indicate the more likely than not threshold was not met, the Company may choose not to perform the quantitative impairment test. If, however, the more likely than not threshold is met, the Company performs the quantitative test as required and discussed below.

Management’s quantitative impairment testing process includes two steps. The first step (“Step 1”) compares the fair value of each reporting unit to its book value.carrying amount. The fair value of each reporting unit is determined by using discounted cash flow analysis and market approach valuations. If the fair value of the reporting unit exceeds its book value,carrying amount, the goodwill is not considered impaired and no additional analysis is required. However, if the book valuecarrying amount is greater than the fair value, a second step (“Step 2”) must be completed to determine if the fair value of the goodwill exceeds the book valuecarrying amount of the goodwill.

Step 2 involves calculating an implied fair value of goodwill for each reporting unit for which the first stepStep 1 indicated impairment. The implied fair value of goodwill is determined in a manner similar to the amount of goodwill calculated in a business combination, by measuring the excess of the estimated fair value of the reporting unit, as determined in the first step,Step 1, over the aggregate estimated fair values of the individual assets, liabilities and identifiable intangibles as if the reporting unit was being acquired in a business combination. If the implied fair value of goodwill exceeds the carrying value of goodwill assigned to the reporting unit, there is no impairment. If the carrying value of goodwill assigned to a reporting unit exceeds the implied fair value of the goodwill, an impairment loss is recorded for the excess. An impairment loss cannot exceed the carrying value of goodwill assigned to a reporting unit, and the loss establishes a new basis in the goodwill. Subsequent reversal of goodwill impairment losses is not permitted.

The quantitative impairment test for goodwill utilizes a variety of valuation techniques, all of which require the Company to make estimates and judgments. Fair value is determined by employing an expected present value technique, which utilizes multiple cash flow scenarios that reflect a range of possible outcomes and an appropriate discount rate. The use of comparative market multiples (the “market approach”) compares the reporting unit to other comparable companies (if such comparables are present in the marketplace) based on valuation multiples to arrive at a fair value. In assessing the fair value, the Company utilizes the results of the valuations (including the market approach to the extent comparables are available) and considers the range of fair values determined under all methods and the extent to which the fair value exceeds the carrying amount of the equity or asset.

The valuation of goodwill requireseach reporting unit includes the use of assumptions and estimates of many critical factors, including revenue growth rates and operating margins, discount rates and future market conditions, determination of market multiples and the establishment of a control premium, among others. Forecasts of future operations are based, in part, on operating results and the Company’s expectations as to future market conditions. These types of analyses contain uncertainties because they require the Company to make assumptions and to apply judgments to estimate industry economic factors and the profitability of future business strategies. However, if actual results are not consistent with the Company’s estimates and assumptions, the Company may be exposed to future impairment losses that could be material.


The Company completedelected to perform qualitative assessments for 2014 and 2013, the required annual impairment testing for goodwill and other finite-lived intangible assets forresults of which supported the years ended December 31, 2011 and 2010, inconclusion that the fourth quarter of each year. In 2011 and 2010, management concluded that, based on its assessmentfair values of the reporting units’ operations, the markets in which theCompany’s reporting units operate and the long-term prospects for those reporting units that thewere not more likely than not threshold for decline in value hadless than their carrying amounts and, therefore, a quantitative assessment was not been metconsidered necessary.  For 2012, the Company performed a quantitative assessment and determined that the fair values of its reporting units exceeded their carrying amounts and, therefore, no triggering events requiring an earlieradditional analysis had occurred.was required.  As a result of these assessments, the Company did not record any goodwill impairment losses for 2014, 2013 or 2012.

Impairment testingassessment for long-livedother intangible assets.    Management uses estimated future cash flows (undiscounted and excluding interest) to measure the recoverability of long-lived assets held and used, including intangible assets with finite lives, whenever events or changes in circumstances indicate that the carrying value of an asset may not be fully recoverable. At such time impairment in value of a long-lived asset is identified,If the impairment is measured as the amount by whichundiscounted cash flow analysis indicates that the carrying amount is not recoverable, an impairment loss is recorded for the excess of the long-lived asset exceedscarrying amount over its fair value.

The Company’s other indefinite-lived intangible assets consist of licenses which are not amortized but rather assessed for impairment by comparing the fair value of the license with its carrying value at least annually or when an indicator of potential impairment has occurred. Management’s impairment assessment may involve calculating the fair value by using a discounted cash flow analysis or through a market approach valuation. If the fair value of the asset exceeds its carrying amount, the asset is not considered impaired and no additional analysis is required. However, if the carrying amount is greater than the fair value, an impairment loss is recorded equal to the excess. The impairment loss establishes a new basis and the subsequent reversal of impairment losses is not permitted.

Impairment of equity method investments in affiliates. The carrying value of equity method investments in affiliates is written down, or impaired, to fair value when a decline in value is considered to be other-than-temporary. In making the determination as to whether an individual investment in an affiliate was impaired, the Company assessed the then-current and expected financial condition of each relevant entity, including, but not limited to, the anticipated ability of the entity to make its contractually required payments to the Company (with respect to debt obligations to the Company), the results of valuation work performed with respect to the entity, the entity’s anticipated ability to generate sufficient cash flows and the market conditions in the industry in which the entity was operating.  The Company recognized impairment losses of $22.5 million, $7.8 million and $7.1 million on its equity method investments in 2014, 2013 and 2012, respectively.

Income taxes.    The Company accounts for income taxes under the asset and liability method, whereby deferred tax assets and liabilities are recognized for the future tax consequences attributable to differences between the financial statement carrying amounts of existing assets and liabilities and their respective tax bases. Deferred tax assets and liabilities are measured using enacted tax rates expected to apply in the years in which those temporary differences are expected to be recovered or settled. The effect on deferred tax assets and liabilities of a change in tax rates is recognized in income in the period that includes the enactment date. The

Company evaluates the need to establish a valuation allowance for deferred tax assets based upon the amount of existing temporary differences, the period in which they are expected to be recovered and expected levels of taxable income. A valuation allowance to reduce deferred tax assets is established when it is “moreconsidered more likely than not”not that some or all of the deferred tax assets will not be realized.

The Company recognizes the effect of income tax positions only if sustaining those positions is “moreconsidered more likely than not. Changes in recognition or measurement of uncertain tax positions are reflected in the period in which a change in judgment occurs. The Company recognizes interest and penalties, if any, related to uncertain tax positions in tax expense.

Depreciation and amortization lives for assets.    Management is required to estimate the useful lives of several asset classes, including capitalized data,property and equipment, internally developed software and other intangible assets. The estimation of useful lives requires a significant amount of judgment related to matters such as future changes in technology, legal issues related to allowable uses of data and other matters.

Share-based compensation.    The Company measures the cost of employee services received in exchange for an award of equity instruments based on the grant-date fair value of the award. The cost is recognized in the Company’s financial statements over the requisite service period of the award using the straight-line method for awards that contain only a service condition and the graded vesting method for awards that contain a performance or market condition. The share-based compensation expense recognized is based on the number of shares ultimately expected to vest, net of forfeitures. Forfeitures are estimated at the time of grant and revised, if necessary, in subsequent periods if actual forfeitures differ from those estimates.

The Company’s primary means of share-based compensation is granting restricted stock units (“RSUs”). RSUs granted generally have graded vesting and include a service condition; and for certain key employees and executives also include either a performance or market condition. RSUs receive dividend equivalents in the form of RSUs having the same vesting requirements as the RSUs initially granted.

As of December 31, 2011, all stock options issued under the Company’s plans are vested and no share-based compensation expense related to such stock options remains to be recognized.

In addition, the Company has an employee stock purchase plan that allows eligible employees to purchase common stock of the Company at 85.0% of the closing price on the last day of each month. The Company recognizes an expense in the amount equal to the discount.

Employee benefit plans.    The Company recognizes the overfunded or underfunded status of defined benefit postretirement plans as an asset or liability on its consolidated balance sheets and recognizes changes in the funded status in the year in which changes occur, through accumulated other comprehensive income (loss).loss. The funded status is measured as the difference between the fair value of plan assets and benefit obligation (the projected benefit obligation for pension plans and the accumulated postretirement benefit obligation for the other postretirement plans). Actuarial gains and losses and prior service costs and credits that have not been recognized as a component of net periodic benefit cost previously are recorded as a component of accumulated other comprehensive income (loss).loss. Plan assets and obligations are measured as of December 31.

The assumptions that have had the most significant impact to net periodic costs are the discount rate and expected long-term rate of return on plan assets.  The discount rate assumption reflects the yield available on high-quality, fixed-income


debt securities that match the expected timing of the benefit obligation payments. Assumptions for the expected long-term rate of return on assets of the defined benefit pension plans are based on future expectations for returns for each asset class based on the calculated market-related value of plan assets and the effect of periodic target asset allocation rebalancing, adjusted for the payment of reasonable expenses of the plan from plan assets.  See Note 14 Employee Benefit Plans to the consolidated financial statements for a further description of the expected long-term rate of return on plan assets as well as asset allocation targets.  Additionally, the Company adopted updated mortality tables published by the Society of Actuaries in October 2014.  The revised RP-2014 tables reflect substantial life expectancy improvements relative to the last tables published in 2000.  

Weighted-average actuarial assumptions used to determine costs for the plans were as follows:


December 31,


2014


2013


Defined benefit pension plans


Discount rate


4.97

%


4.18

%

Rate of return on plan assets


6.50

%


6.50

%

Unfunded supplemental benefit plans


Discount rate


4.80

%


3.91

%

Weighted-average actuarial assumptions used to determine benefit obligations for the plans were as follows:


December 31,


2014


2013


Defined benefit pension plans


Discount rate


4.07

%


4.97

%

Unfunded supplemental benefit plans


Discount rate


4.00

%


4.80

%

Recently Adopted Accounting Pronouncements:

Pronouncements

In January 2010,July 2013, the Financial Accounting Standards Board (“FASB”) issued updated guidance relatedintended to fair value measurements and disclosures, which requireseliminate the diversity in practice regarding financial statement presentation of an unrecognized tax benefit when a reporting entity to disclose separately,net operating loss carryforward, a reconciliation for fair value measurements using significant unobservable inputs (Level 3) information about purchases, sales, issuances and settlements (that is, onsimilar tax loss, or a gross basis rather than one net number). The updated guidance is effective for interim or annual financial reporting periods beginning after December 15, 2010 and for interim periods within the fiscal year. Except for the disclosure requirements, the adoption of this guidance had no impact on the Company’s consolidated financial statements.

In July 2010, the FASB issued updated guidance related totax credit risk disclosures for finance receivables and the related allowance for credit losses. The updated guidance requires entities to disclose information at disaggregated levels, specifically defined as “portfolio segments” and “classes”. Expanded disclosures include, among other things, roll-forward schedules of the allowance for credit losses and information regarding the credit quality of receivables (including their aging) as of the end of a reporting period. The updated guidance is effective for interim and annual reporting periods ending after December 15, 2010, although the disclosures of reporting period activity are required for interim and annual reporting periods beginning after December 15, 2010. Except for the disclosure requirements, the adoption of this guidance had no impact on the Company’s consolidated financial statements.

In December 2010, the FASB issued updated guidance related to disclosure of supplementary pro forma information in connection with business combinations. The updated guidance clarifies the acquisition date that should be used for reporting pro forma financial information when comparative financial statements are presented. The updated guidance also expands supplemental pro forma disclosures to include a description of the nature and amount of material, nonrecurring pro forma adjustments directly attributable to the business combination included in the reported pro forma revenue and earnings. The updated guidance is effective for annual reporting periods beginning on or after December 15, 2010. The adoption of this guidance had no impact on the Company’s consolidated financial statements.

In December 2010, the FASB issued updated guidance related to when goodwill impairment testing should include Step 2 for reporting units with zero or negative carrying amounts. The updated guidance modifies Step 1 of the goodwill impairment test for reporting units with zero or negative carrying amounts requiring those entities to perform Step 2 of the goodwill impairment test if it is more likely than not that a goodwill impairmentcarryforward exists. In determining whether it is more likely than not that a goodwill impairment exists, an entity should consider whether there are any adverse qualitative factors indicating an impairment may exist. The updated guidance is effective for interim and annual reporting periods beginning after December 15, 2010.2013, with early adoption permitted. The adoption of thisthe guidance had no impact on the Company’s consolidated financial statements.

Pending Accounting Pronouncements

In September 2011,June 2014, the FASB issued updated guidance that is intended to simplify how entities test goodwilleliminate the diversity in practice regarding share-based payment awards that include terms which provide for impairment.a performance target that affects vesting being achieved after the requisite service period. The new standard requires that a performance target which affects vesting and could be achieved after the requisite service period be treated as a performance condition that affects vesting and should not be reflected in estimating the grant-date fair value.  The updated guidance permits entitiesis effective for interim and annual reporting periods beginning after December 15, 2015, with early adoption permitted.  The Company expects the adoption of this guidance to first assess qualitative factorshave no impact on its consolidated financial statements.

In May 2014, the FASB issued updated guidance for recognizing revenue from contracts with customers to provide a single, comprehensive revenue recognition model for all contracts with customers to improve comparability within and across industries, and across capital markets. The new revenue standard contains principles that an entity will apply to determine whether itthe measurement of revenue and the timing of recognition. The underlying principle is more likely than notthat an entity will recognize revenue to depict the transfer of goods or services to customers at an amount that the fair valueentity expects to be entitled to in exchange for those goods or services. Revenue from insurance contracts is not within the scope of a reporting unit is less than its carrying amount as a basis for determining whether it is necessary to perform the two-step goodwill impairment test as required under current accountingthis guidance. The updated guidance is effective for interim and annual reporting periods beginning after December 15, 2011. Early2016, with early adoption is permitted, including for interim and annual goodwill impairment tests performed as of a date before September 15, 2011, if an entity’s financial statements for the more recent interim and annual period have not yet been issued.prohibited. The Company adopted this guidance inis currently assessing the fourth quarter of 2011, in connection with performing its annual goodwill impairment test and elected to bypass the qualitative assessment and performed the first stepimpact of the two-step goodwill impairment test. The adoption of thisnew guidance had no impact on the Company’sits consolidated financial statements.

Pending Accounting Pronouncements:

In December 2011,April 2014, the FASB issued updated guidance requiring entitieswhich changes the criteria for determining which disposals are required to disclose both gross informationbe presented as discontinued operations and net information about both instruments and transactions eligible for offset in the statement of financial position and instruments and transactions subject to an agreement similar to a master netting arrangement.modifies related disclosure requirements. The updated guidance is effective for interim and annual reporting periods beginning on or after January 1, 2013. Except for the disclosure requirements, management does not expect the adoption of this guidance to have a material impact on the Company’s consolidated financial statements.


In June 2011, the FASB issued updated guidance that is intended to increase the prominence of other comprehensive income in financial statements. The updated guidance eliminates the option to present the components of other comprehensive income as part of the statement of changes in stockholders’ equity, and

requires consecutive presentation of the statement of net income and other comprehensive income or in a single continuous statement of comprehensive income. In addition, the option to present reclassification adjustments in the notes to financial statements has been eliminated. The updated guidance is effective for interim and annual reporting periods beginning after December 15, 2011. In December 2011, the FASB issued updated guidance deferring the effective date of the change in presentation of reclassification adjustments. Management31, 2014, with early adoption permitted. The Company expects the adoption of the guidance that remains effective beginning in the first quarter of 2012 to have no impact on the Company’s consolidated financial statements.

In May 2011, the FASB issued updated guidance that is intended to improve the comparability of fair value measurements presented and disclosed in financial statements prepared in accordance with generally accepted accounting principles and International Financial Reporting Standards. The amendments are of two types: (i) those that clarify the FASB’s intent about the application of existing fair value measurement and disclosure requirements and (ii) those that change a particular principle or requirement for measuring fair value or for disclosing information about fair value measurements. The update is effective for interim and annual periods beginning after December 15, 2011. Except for the disclosure requirements, management does not expect the adoption of this guidance to have a materialno impact on the Company’sits consolidated financial statements.

In October 2010, the FASB issued updated guidance related to accounting for costs associated with acquiring or renewing insurance contracts. The updated guidance modifies the definition of the types of costs incurred by insurance entities that can be capitalized in the acquisition of new and renewal contracts. Under the updated guidance only costs based on successful efforts (that is, acquiring a new or renewal contract) including direct-response advertising costs are eligible for capitalization. The updated guidance is effective for interim and annual reporting periods beginning after December 15, 2011. Management does not expect the adoption of this guidance to have a material impact on the Company’s consolidated financial statements.

Results of Operations

Overview

A substantial portion of the revenues for the Company’s title insurance and services segment results from the sale and refinancing of residential and commercial real estate. In the Company’s specialty insurance segment, revenues associated with the initial year of coverage in both the home warranty and property and casualty operations are impacted by the level of real estatevolatility in residential purchase transactions. Traditionally, the greatest volume of real estate activity, particularly residential resale,purchase activity, has occurred in the spring and summer months. However, changes in interest rates, as well as other changes in general economic factors,conditions in the United States and abroad, can cause fluctuations in the traditional pattern of real estate activity.

The Company’s total revenues for the year ended December 31, 2014 were $4.7 billion, which reflected a decrease of $0.3 billion, or 5.6%, when compared with $5.0 billion for the year ended December 31, 2013.  This decline was primarily attributable to the significant decline in refinance activity during 2014 as a result of increases in mortgage interest rates, which was partially offset by increased revenues from residential purchase transactions and commercial business.  Revenues from refinance transactions were down 43.2% and revenues from residential purchase transactions and commercial business were up 4.5% and 9.0%, respectively, in 2014 when compared to 2013.

ResidentialAccording to the Mortgage Bankers Association’s January 20, 2015 Mortgage Finance Forecast (the “MBA Forecast”), residential mortgage originations in the United States (based on the total dollar value of the transactions) decreased 19.7%39.2% in 20112014 when compared with 2010, according to the Mortgage Bankers Association’s January 18, 2012 Mortgage Finance Forecast (the “MBA Forecast”). This decrease was due to a decline in both purchase and refinance activity.2013. According to the MBA Forecast, the dollar amount of purchase originations decreased 13.1% and refinance originations decreased 14.6%56.4%. The lower volume of domestic residential mortgage origination activity in 2014 contributed to a 1.8% decrease in domestic residential purchase orders closed per day and 21.9%, respectively,a 45.2% decrease in 2011domestic refinance orders closed per day by the Company’s direct title operations in 2014 when compared to 2013.

Given the backdrop of an improving economy, the Company believes that the housing market will continue to strengthen in 2015.  In January 2015, refinance activity rose sharply in response to the unexpected decline in mortgage rates, driving total domestic title orders opened per day by the Company’s direct title operations up by 27.0% when compared with 2010. Residential mortgageJanuary of last year.  While the increase in refinance orders will provide short-term benefits, it’s uncertain how long this elevated level of activity will continue.  With regards to the purchase market, the Company’s full-year expectation is for modest growth in originations, with some improvement in both transaction levels and home prices.  The Company also expects continued strength in the United States decreased 21.2% in 2010 when comparedcommercial market but with 2009 accordingdeclining growth rates.

The Consumer Financial Protection Bureau (“CFPB”) has broad authority to the MBA Forecast. This decrease reflected decreases in purchase originations and refinance originations of 32.6% and 15.1%, respectively.

A low interest rate environment typically has a favorable impact on many of the Company’s businesses, however mortgage credit remains generally tight, which together with the uncertainty in general economic conditions, continues to impact the demand for most of the Company’s products and services.

Given the performance ofregulate, among other areas, the mortgage and real estate markets in 2011matters pertaining to consumers.  In addition to other activities, the CFPB has proposed and implemented regulations related to the simplification of mortgage disclosures and the outlook for 2012,required delivery of documentation to consumers in connection with the closing of federally-regulated mortgage loans.  Compliance with these integrated disclosure rules will require participants in the mortgage market, including the Company, continued its expense management efforts. During 2011,to make significant changes to the Company completed an expense reduction program, primarily directed at its shared services functionmanner in which they create, process, and deliver certain disclosures to consumers in connection with mortgage loan applications made on or after August 1, 2015.  These changes could lead to lower mortgage volumes and/or delays in mortgage processing, particularly in the title insuranceearly stages of implementation.  Readiness for, and services segment, that is

expectedcompliance with, these rules, also requires extensive planning; changes to yield approximately $40 million in annualized cost savings, which the Company began realizing in the third quarter of 2011. The program was incremental to the Company’s ongoing efforts to manage expenses to order volumes at the division level. Overall, the Company reduced its domestic employee countsystems, forms and processes; as well as heightened coordination among market participants, including by 6.3% and its office footprint by 9.1%, which contributed to a decrease in personnel and other operating expenses of 3.9% in 2011 compared to 2010. This reduction in expenses compares favorably to the 2.2% decrease in total revenues in 2011 compared to 2010.

Beginning at the end of September 2010, various lenders’ foreclosure processes came under the review and scrutiny of a number of regulatorssettlement service providers, such as the state Attorneys General, the Federal ReserveCompany and other agencies. Additionally, a growing number of court rulings have called into question some foreclosure practices and regulators have conducted and continue to conduct investigations into such practices. Many of the country’s largestits agents, with lenders and other key parties also have entered into consent decrees which require them, among other things, to alter their foreclosure processes. Though the ultimate effect of the court rulings, regulatory investigations, consent decrees and related matters pertaining to foreclosure processing are currently unknown,others.  While there can be no assurance that the Company, believes that, as a result of these matters, its revenues tied to foreclosures have declined, and may continue to decline, especiallyagents or other market participants will be successful in the short term, andtheir implementation efforts, the Company may incur costs associated with its duty to defend its insureds’ title to foreclosed properties they have purchased. As of the current date, these matters have not had a material adverse effect on the Company. Though the Company will continue to monitor foreclosure developments, at this time, the Company does not believe these matters will have a material adverse effect on the Company in the future.

is actively preparing for compliance.


Title Insurance and Services


 2011 2010 2009 2011 vs. 2010 2010 vs. 2009 

2014


2013


2012


2014 vs. 2013


2013 vs. 2012


       $ Change % Change $ Change % Change 


$ Change


% Change


$ Change


% Change


 (in thousands, except percentages) 

(in thousands, except percentages)


Revenues


Direct premiums and escrow fees

 $1,360,512   $1,391,093   $1,490,096   $(30,581  (2.2 $(99,003  (6.6

$

1,761,462


$

1,855,270


$

1,745,687


$

(93,808

)


(5.1

)


$

109,583


6.3


Agent premiums

  1,491,943    1,517,704    1,524,120    (25,761  (1.7  (6,416  (0.4


1,841,618


2,044,862


1,709,905


(203,244

)


(9.9

)


334,957


19.6


Information and other

  619,951    628,494    667,115    (8,543  (1.4  (38,621  (5.8


617,713


626,016


643,433


(8,303

)


(1.3

)


(17,417

)


(2.7

)

Investment income

  73,883    75,517    104,553    (1,634  (2.2  (29,036  (27.8

Net investment income


59,785


76,606


71,350


(16,821

)


(22.0

)


5,256


7.4


Net realized investment gains

  1,906    8,694    14,509    (6,788  (78.1  (5,815  (40.1


25,551


3,334


33,709


22,217


NM

1


(30,375

)


(90.1

)

Net other-than-temporary impairment losses recognized in earnings

  (9,068  (7,912  (33,038  (1,156  (14.6  25,126    76.1  


  3,539,127    3,613,590    3,767,355    (74,463  (2.1  (153,765  (4.1

Net other-than-temporary impairment losses


(1,701

)


(3,564

)


(1,701

)


3,564


100.0


4,304,428


4,606,088


4,200,520


(301,660

)


(6.5

)


405,568


9.7


Expenses


Personnel costs

  1,104,841    1,131,058    1,145,359    (26,217  (2.3  (14,301  (1.2


1,314,089


1,338,361


1,233,203


(24,272

)


(1.8

)


105,158


8.5


Premiums retained by agents

  1,195,282    1,222,274    1,229,229    (26,992  (2.2  (6,955  (0.6


1,470,895


1,636,694


1,370,193


(165,799

)


(10.1

)


266,501


19.4


Other operating expenses

  693,541    734,901    849,320    (41,360  (5.6  (114,419  (13.5


761,584


816,870


769,477


(55,286

)


(6.8

)


47,393


6.2


Provision for policy losses and other claims

  270,697    180,821    205,819    89,876    49.7    (24,998  (12.1


253,122


343,461


237,427


(90,339

)


(26.3

)


106,034


44.7


Depreciation and amortization

  69,229    72,566    76,038    (3,337  (4.6  (3,472  (4.6


77,820


66,956


67,610


10,864


16.2


(654

)


(1.0

)

Premium taxes

  40,972    33,645    32,138    7,327    21.8    1,507    4.7  


51,098


50,980


46,283


118


0.2


4,697


10.1


Interest

  5,923    8,803    14,336    (2,880  (32.7  (5,533  (38.6


2,796


2,601


2,646


195


7.5


(45

)


(1.7

)


3,931,404


4,255,923


3,726,839


(324,519

)


(7.6

)


529,084


14.2


  3,380,485    3,384,068    3,552,239    (3,583  (0.1  (168,171  (4.7


Income before income taxes

 $158,642   $229,522   $215,116   $(70,880  (30.9 $14,406    6.7  

$

373,024


$

350,165


$

473,681


$

22,859


6.5


$

(123,516

)


(26.1

)


Margins

  4.5  6.4  5.7  (1.9)%   (29.7  0.7  12.3  


8.7

%


7.6

%


11.3

%


1.1

%


14.5


(3.7

)%


(32.7

)


(1)

Not meaningful

Direct premiums and escrow fees decreased 2.2%5.1% in 20112014 from 20102013 and 6.6%increased 6.3% in 20102013 from 2009.2012. The decrease in 2011direct premiums and escrow fees in 2014 from 20102013 was primarily due to a declinedecrease in the number of domestic title orders closed by the Company’s direct operations, which reflected the decline in mortgage originations,partially offset in part by an increase in the domestic average revenues per order closed. The increase in thedirect premiums and escrow fees in 2013 from 2012 was primarily due to an increase in domestic average revenues per order closed, waspartially offset by a decrease in the number of domestic title orders closed by the Company’s direct operations. The domestic average revenues per order closed were $1,918, $1,513 and $1,309 for 2014, 2013 and 2012, respectively.  The 26.7% increase in average revenues per order closed in 2014 from 2013 and the 15.6% increase in average revenues per order closed in 2013 from 2012 were primarily due to an increase in the mix of direct revenues generated from higher premium residential purchase and commercial activity year over year, as well as an increase in the average revenues pertransactions, higher real estate values, and a greater number of large commercial orderdeals that closed in 2011 when compared to 2010. The decrease in 2010 from 2009 was primarily due to a decline in the number of title orders closed by the Company’s direct operations, which reflected the decline in mortgage originations, offset in part by an increase in the average revenues per order closed. The increase in the average revenues per order closed was primarily due to an increase in the mix of revenues from commercial activity year over year and increases in title insurance rates across 28 states. The average revenues per order closed were $1,483, $1,289 and $1,145 for 2011, 2010 and 2009, respectively.prior year. The Company’s direct title operations closed 917,500, 1,079,000816,400, 1,103,400 and 1,301,1001,191,800 domestic title orders during 2011, 20102014, 2013 and 2009,2012, respectively.  The 26.0% decrease in orders closed in 2014 from 2013 and the 7.4% decrease in orders closed in 2013 from 2012 were generally consistent with the declines in residential mortgage origination activity in the United States as reported in the MBA Forecast.

Agent premiums decreased 1.7%9.9% in 20112014 from 20102013 and 0.4%increased 19.6% in 20102013 from 2009.2012. Agent premiums are recorded when notice of issuance is received from the agent, which is generally when cash payment is received by the Company. As a result, there is generally a one quarter delay between the agent’s issuance of a title policy and the Company’s recognition of agent premiums. Therefore, full year agent premiums primarilytypically reflect mortgage origination activity from the fourth quarter of the prior year through the third quarter of the current year. The decreases were primarily due todecrease in agent premiums in 2014 from 2013 was consistent with the same factors impacting direct title operations offset10.3% decrease in part by increases in market share. According to the American Land Title Association’s most recent available market share data, the Company’s agency market share was 15.6%, 15.2%direct premiums and 15.0% forescrow fees in the ninetwelve months ended September 30, 20112014 as compared with the twelve months ended September 30, 2013. The increase in agent premiums in 2013 from 2012 was consistent with the 19.7% increase in the Company’s direct premiums and forescrow fees in the yearstwelve months ended December 31, 2010 and 2009, respectively. The Company analyzesSeptember 30, 2013 as compared with the terms and profitability of its title agency relationships and works to amend agent agreements where appropriate. Amendments that are sought include, among others, changing the percentage of premiums retained by the agent and the deductible paid by the agent on claims; if appropriate changes to the agreements cannot be made, the Company may elect to terminate certain agreements.

twelve months ended September 30, 2012.

Information and other revenuerevenues primarily consist of revenues generated from fees associated with title search and related reports, title and other real property records and images, other non-insured settlement services, and risk mitigation products and services. These revenues generally trend with direct premiums and escrow fees but are typically less volatile since a portion of the revenues are subscription based and do not fluctuate with transaction volumes.

Information and other revenues decreased 1.4%$8.3 million, or 1.3%, in 20112014 from 20102013 and 5.8%$17.4 million, or 2.7%, in 20102013 from 2009.2012. Excluding the $55.7 million impact of new acquisitions for the year ended December 31, 2014, information and other revenues decreased $64.1 million, or 10.2%, in 2014 compared to 2013.  The decrease in 20112014 from 2010 was primarily attributable to2013, adjusted for the same factors affecting the direct title operations, offset in part by a 3.4% increase in international and other revenue, which was primarily attributable to the Company’s Canadian operations. The decrease in 2010 from 2009 was primarily attributable to the same factors affecting the direct title operations and, additionally, a 14.5% decrease in default information and other revenue mainly due to a decline in foreclosure activity as a resultimpact of moratoriums on foreclosures and increased market competition, partially offset by increased loss mitigation activities.

Investment income decreased 2.2% in 2011 from 2010 and 27.8% in 2010 from 2009. The decrease in the current yearnew acquisitions, was primarily attributable to lower demand for the Company’s default and title plant information products as a result of the decrease in domestic loss mitigation, foreclosure and mortgage origination activities.  The decrease in 2013 from 2012 was primarily attributable to lower demand for title related services in Canada due to a


decline in mortgage transactions resulting primarily from lower refinance transactions and lower demand for the Company’s title information products as a result of the decrease in domestic mortgage origination activity, partially offset by higher demand for the Company’s default information products as a result of the increase in domestic loss mitigation activity.

Net investment income decreased 22.0% in 2014 from 2013 and increased 7.4% in 2013 from 2012. The decrease in 2014 from 2013 was primarily attributable to higher impairment losses and lower equity in earnings related to investments accounted for using the equity method, partially offset by higher interest income from the investment portfolio.  The increase in 2013 from 2012 was primarily attributable to increased dividend and interest income from the investment portfolio due to lower yields. The decreasehigher average volumes of equity and debt securities and investments in 2010 comparedequity funds with higher dividend yields when comparing 2013 to 2009 was primarily due to2012.  Net investment income for 2014, 2013 and 2012 included impairment losses recognized fromon investments accounted for using the saleequity method of title plant copies in 2009 while similar sales did not occur in 2010; lower interest income from deposits in 2010 due to lower yields;$22.5 million, $5.8 million and a reduction in interest income from intercompany notes receivable when compared to 2009 due to a reduction in the notes receivable balance.

$5.9 million, respectively.

Net realized investment gains for the title insurance and services segment totaled $1.9$25.6 million, $8.7$3.3 million and $14.5$33.7 million for 2011, 20102014, 2013 and 2009, respectively. The gains for 2011, 20102012, respectively, and 2009 were primarily from the salesales of debt and equity securitiessecurities. Net realized investment gains for 2014 and to a lesser extent, certain fixed assets. The gains recognized in 2011 and 2010 were partially offset by $6.92013 included $7.5 million and $3.4$2.5 million, respectively, inof gains from the sale of real estate.  Net realized investment gains for 2012 included $15.0 million of gains resulting from the sale of CoreLogic common stock during the third quarter of 2012.  Net realized investment gains for 2014, 2013 and 2012 included impairment losses recognized on other long-term investments.of $2.4 million, $1.1 million and $0.8 million, respectively, primarily related to software and certain non-marketable investments accounted for using the cost method.

Net other-than-temporaryOther-than-temporary impairment losses for the title insurance and services segment totaled $9.1 million, $7.9$1.7 million and $33.0$3.6 million for 2011, 20102014 and 2009,2012, respectively. No other-than-temporary impairment losses were recognized in 2013.  The majority of the net other-than-temporary impairment losses recognized in 20112014 and 20102012 related to the Company’s non-agency mortgage-backed securities portfolio. In 2009, the net other-than-temporary impairment losses pertained primarily to the Company’s equity securities portfolio and also to the non-agency mortgage-backed securities portfolios.

The title insurance and services segment (primarily direct operations) is labor intensive; accordingly, a major expense component is personnel costs. This expense component is affected by two competingprimary factors: the need to monitor personnel changes to match the level of corresponding or anticipated new orders and the need to provide quality service.

Title insurancePersonnel costs decreased $24.3 million, or 1.8%, in 2014 from 2013 and increased $105.2 million, or 8.5%, in 2013 from 2012. Excluding the $37.0 million impact of new acquisitions for the year ended December 31, 2014, personnel costs decreased 2.3%$61.3 million, or 4.6%, in 2011 from 2010 and 1.2% in 2010 from 2009.2014 compared to 2013.  The decrease in 2011 compared with 20102014, adjusted for the impact of new acquisitions, was primarily attributable to a reduction in domestic employeeslower salary, payroll tax, employee benefit, overtime, and decreased expenses relatedseverance costs.  The lower salary and payroll tax costs were attributable to reduced headcount when compared to the Company’sprior year.  The lower employee benefit plans. These expensecosts were due to changes in the Company’s medical and dental insurance plans, lower incurred medical claims and lower headcount when compared to the prior year.  The lower overtime costs were due to lower order volumes and revenues when compared to the prior year.  The lower severance costs were due to a lower level of employee reductions were partially offsetmade during 2014 when compared to 2013. The increase in 2013 compared with 2012 was primarily attributable to higher staffing levels and incentive compensation driven by increased commissions inrevenues when compared to the commercial division, which were the result of increased commercial revenues, and increasedprior year. Personnel costs included severance expense associated with a reduction in employees. Included in personnel costsof $8.9 million, $17.5 million and $5.5 million for 2010,2014, 2013 and not for 2009, was $22.0 million of expense associated with certain offshore functions that prior to

the Separation were performed by TFAC and allocated to the Company. The allocations in prior years were included in the title insurance and services segment’s other operating expenses. Beginning in 2010, these offshore functions were part of the Company’s operations and the related personnel expenses were included in the title insurance and services segment’s personnel costs. Excluding the impact of these expenses, title insurance personnel costs decreased 3.2% in 2010 from 2009. This decrease was primarily due to domestic employee reductions, offset in part by increased expense in connection with the Company’s employee benefit plans.

2012, respectively.

The Company continues to closely monitor order volumes and related staffing levels and willintends to adjust staffing levels as considered necessary. The Company’s direct title operations opened 1,254,100, 1,469,1001,155,500, 1,384,600 and 1,770,7001,634,900 domestic title orders in 2011, 20102014, 2013 and 2009,2012, respectively, representing a decreasedecreases of 14.6%16.5% in 20112014 from 20102013 and a decrease of 17.0%15.3% in 20102013 from 2009.

2012.

A summary of premiums retained by agents and agent premiums is as follows:


   2011  2010  2009 
   (in thousands, except percentages) 

Premiums retained by agents

  $1,195,282   $1,222,274   $1,229,229  


Agent premiums

  $1,491,943   $1,517,704   $1,524,120  


% retained by agents

   80.1  80.5  80.7


2014


2013


2012


(in thousands, except percentages)


Premiums retained by agents

$

1,470,895


$

1,636,694


$

1,370,193


Agent premiums

$

1,841,618


$

2,044,862


$

1,709,905


% retained by agents


79.9

%


80.0

%


80.1

%

The premium split between underwriter and agents is in accordance with the respective agency contracts and can vary from region to region due to divergences in real estate closing practices as well as rating structures.and state regulations. As a result, the percentage of title premiums retained by agents variescan vary due to the geographical mix of revenues from agency operations.  The percentage of title premiums retained by agents decreased over the last three years due to the cancellation and/or modification of certain agency relationships with unfavorable splitsfor 2014, 2013 and a more favorable geographic mix of agency revenues. In 2011, the agent retention percentage2012 was also impacted by a large commercial deal that closed in the first quarter with a favorable agent split.essentially unchanged.


Other operating expenses (principally related to direct operations) decreased 5.6%$55.3 million, or 6.8%, in 20112014 from 20102013 and 13.5%increased $47.4 million, or 6.2%, in 20102013 from 2009.2012. Excluding the $29.9 million impact of new acquisitions for the year ended December 31, 2014, other operating expenses decreased $85.1 million, or 10.4%, in 2014 compared to 2013.  The decrease in 20112014 from 20102013, adjusted for the impact of new acquisitions, was primarily attributable to lower furniture and equipment related lease costs due to several lease buyouts that occurred during 2010, lower office related expenses resulting from the Company’s consolidation and/or closure of certain title offices, and a reduction in consulting expenses. These decreases were partially offset by an increase in production related expenses and temporary labor costs driven by lower order volumes. The increase in the Company’s commercial, default and international businesses, and by higher legal expenses. The2013 from 2012 was primarily attributable to increased production related costs in the Company’s commercialexpenses and international businesses were due to higher transaction volumes, while the increase in the default business was due to product mix. Excluding the impact of the $22.0 million of allocations for certain offshore functions discussed in the personnel costs discussion above, the decrease in other operating expenses was 10.9% in 2010 from 2009. This decrease reflected lower occupancy costs as a result of the continued consolidation and/or closure of certain title officeslegal and other cost-containment programs.software related costs.

The provision for policy losses and other claims, expressed as a percentage of title insurance premiums and escrow fees, was 9.5%7.0%, 6.2%8.8% and 6.8%6.9% for the years ended December 31, 2011, 20102014, 2013 and 2009,2012, respectively.

The current year rate of 9.5% reflected7.0% reflects an ultimate loss rate of 5.6%5.3% for the current policy year and included a $45.3 million reserve strengthening adjustment related to a guaranteed valuation product offered in Canada that experienced a meaningfulnet increase in claims activity during the first quarter of 2011, a $32.2 million charge in connection with the settlement of Bank of America’s lawsuit against the Company and $34.2 million in unfavorable developmentloss reserve estimates for certain prior policy years primarily 2007. For additional discussion regarding the Bank of America lawsuit see Note 21 Litigation and Regulatory Contingencies to the consolidated financial statements.$62.2 million. The prior year rate of 6.2% reflected an expected ultimateincrease in loss rate of 4.9% for policy year 2010, with a net upward adjustment to the reserve estimates for prior policy years.years reflected claims development above expected levels during 2014, primarily from domestic commercial policies.  The changes in estimates resultedreserve strengthening associated with domestic commercial policies was $41.4 million and was primarily

attributable to several large commercial claims, net of anticipated recoveries, mainly from higher than expected claims emergence experienced during 2010 for policies issued priormechanics liens, and primarily related to 2009,policy years 2003, 2005 and lower than expected claims emergence experienced during 2010 for2007.  Other factors, including a large international commercial claim from policy year 2009. The rate of 6.8% in 2009 reflected an expected ultimate loss rate of 7.0% for policy year 2009, with a minor downward adjustment2004, also contributed to the net increase in the loss reserve estimates for certain prior policy years.

As of December 31, 2011,2014, the title insurance and services segment’s IBNR reserve was $816.6$802.1 million, which reflected themanagement’s best estimate from the Company’s internal actuarial analysis.estimate. The Company’s internal actuary also determined a range of reasonable estimates of $711.9$726.1 million to $990.9$990.5 million. The range limits are $104.7$76.0 million below and $174.3$188.4 million above themanagement’s best estimate, respectively, and represent an estimate of the range of variation among reasonable estimates of the IBNR reserve.

Actuarial estimates are sensitive to assumptions used in models, as well as the structures of the models themselves, and to changes in claims payment and incurral patterns, which can vary materially due to economic conditions, among other factors.

AdverseThe prior year rate of 8.8% reflected an ultimate loss rate of 5.0% for policy year 2013 and a net increase in the loss reserve estimates for prior policy years of $148.5 million. The increase in loss reserve estimates for prior policy years reflected claims development in 2011 included higher-than-expected claims emergence for commercial andabove expected levels during 2013, primarily from domestic lenders policies, particularlycommercial policies and the Company’s guaranteed valuation product offered in Canada.  The reserve strengthening associated with domestic lenders policies was $67.4 million and was primarily attributable to increased claims frequency for policy years 2004 through 2008.  The increased claims frequency was primarily due to mortgage lenders and servicers processing a large volume of foreclosures during 2013.  As foreclosure processing increases, lenders claims generally increase, because lenders claims typically come from foreclosures in which the lender suffers a loss.  At December 31, 2013, the Company expected the high level of foreclosure processing to continue in the near term as mortgage lenders and servicers worked through their foreclosure inventory.  The reserve strengthening associated with domestic lenders policies reflected these expectations.  The reserve strengthening associated with commercial policies was $38.8 million and was primarily attributable to several large commercial claims, mainly from mechanics liens, and primarily related to policy years 2007 and 2008.  The reserve strengthening associated with the guaranteed valuation product offered in Canada was $21.7 million and was primarily attributable to claims frequency exceeding the Company’s expectations during 2013.  The increase in frequency primarily related to policy years 2007 and 2010.

The 2012 rate of 6.9% reflected an ultimate loss rate of 5.1% for policy year 2012 and a net increase in the loss reserve estimates for prior policy years of $62.1 million. The increase in loss reserve estimates for prior policy years reflected claims development above expected levels during 2012, primarily from domestic lenders policies and international business, including the guaranteed valuation product offered in Canada. The reserve strengthening associated with domestic lenders policies was $25.6 million and was primarily attributable to policy years 2005 through 2007. Management believes that theseThis strengthening was primarily due to an increase in claims frequency experienced during 2012, partially offset by a slight decrease in severity. The reserve strengthening associated with the international business, excluding the guaranteed valuation product, was $15.6 million and was primarily related to increased severity experienced during 2012 for policy years have higher ultimate loss ratios than historical averages,2003 through 2011. The reserve strengthening associated with the guaranteed valuation product was $11.8 million and that they also havereflected an increase in claims frequency experienced accelerated reportingduring the first half of 2012. The increase in frequency primarily related to policy years 2008 and payment of claims, particularly on lenders policies. Reasons for higher loss levels and acceleration of claims reporting and payment include adverse underwriting conditions in real estate markets during 2005 through 2007, declines in real estate prices, increased levels of foreclosures and increased mechanics lien exposure due to failures of development projects.

2009.

The current economic environment continues to show more potential for volatility than usual over the short term, particularly in regard to real estate prices and mortgage defaults, which may affect title claims. Relevant contributing factors include highcontinuing elevated foreclosure volume, tight credit markets,inventory and foreclosure processing and general economic instability and government actions that may mitigate or exacerbate recent trends.uncertainty. Other factors, including factors not yet identified, may also influence claims development. At this point, economicWhile real estate and certainfinancial market conditions appearhave improved to be stabilizingsome extent as evidenced by increased real estate prices and improvinga decline in some respects, yetmortgage defaults, significant uncertainty remains. ThisIn addition, while foreclosure inventory and foreclosure processing remain elevated compared to historic norms, the level of inventory and processing has declined from its peak.  


Nevertheless, the current environment results incontinues to create an increased potential for actual claims experience to vary significantly from projections, in either direction, which would directly affect the claims provision. If actual claims vary significantly from expected, reserves may be adjusted to reflect updated estimates of future claims.

The volume and timing of title insurance claims are subject to cyclical influences from real estate and mortgage markets. Title policies issued to lenders constitute a large portion of the Company’s title insurance volume. These policies insure lenders against losses on mortgage loans due to title defects in the collateral property. Even if an underlying title defect exists that could result in a claim, often the lender must realize an actual loss, or at least be likely to realize an actual loss, for title insurance liability to exist. As a result, title insurance claims exposure is sensitive to lenders’ losses on mortgage loans, and is affected in turn by external factors that affect mortgage loan losses.

losses, particularly macroeconomic factors.

A general decline in real estate prices can expose lenders to greater risk of losses on mortgage loans, as loan-to-value ratios increase and defaults and foreclosures increase. The current environment may continue to have increased potential for claims on lenders’ title policies, particularly if defaults and foreclosures are at elevated levels. Title insurance claims exposure for a given policy year is also affected by the quality of mortgage loan underwriting during the corresponding origination year. The Company believes that sensitivity of claims to external conditions in real estate and mortgage markets is an inherent feature of title insurance’s business economics that applies broadly to the title insurance industry. Lenders have experienced high losses on mortgage loans from prior years, including loans that were originated during the years 2005 through 2007.2008. These losses have led to higher title insurance claims on lenders policies, and also have accelerated the reporting of claims that would have been realized later under more normal conditions.

Loss ratios (projected to ultimate value) for policy years 2005 through 2008 are higher than loss ratios for policy years 1992 through 2004. The major causes of the higher loss ratios for those four policy years are believed to be confined mostly to that underwriting period. These causes included: rapidly increasing residential real estate prices which led to an increase in the incidences of fraud, lower mortgage loan underwriting standards and a higher concentration than usual of subprime mortgage loan originations.

The projected ultimate loss ratios, as of December 31, 2011,2014, for policy years 2011, 20102014, 2013 and 20092012 were 5.6%5.3%, 4.7%4.6% and 5.2%3.8%, respectively, which are lower than the ratios for 2005 through 2008. These projections were based in part on an assumption that more favorable underwriting conditions existed in 2009 through 20112014 than in 2005 through 2008, including, but not limited to, tighter loan underwriting standards and lower housing prices.standards. Current claims data from policy years 2009 through 2011,2014, while still at an early stage of development for the more recent policy years within that period, supports this assumption.

Depreciation and amortization expense increased $10.9 million, or 16.2%, in 2014 from 2013 and decreased $0.7 million, or 1.0%, in 2013 from 2012.  The increase in 2014 was primarily attributable to the depreciation and amortization expense associated with developed technology and other intangible assets recorded in connection with new acquisitions completed during the first quarter of 2014.  Excluding the $8.6 million impact of new acquisitions for the year ended December 31, 2014, depreciation and amortization expense increased $2.3 million, or 3.4%, in 2014 compared to 2013.

Insurers generally are not subject to state income or franchise taxes. However, in lieu thereof, a “premium”premium tax is imposed on certain operating revenues, as defined by statute. Tax rates and bases vary from state to state; accordingly, the total premium tax burden is dependent upon the geographical mix of operating revenues. The Company’s noninsurance subsidiaries are subject to state income tax and do not pay premium tax. Accordingly, the Company’s total tax burden at the state level for the title insurance and services segment is composed of a combination of premium taxes and state income taxes. Premium taxes as a percentage of title insurance premiums and escrow fees were 1.4%, 1.2%1.3% and 1.1%1.3% for the years ended December 31, 2011, 20102014, 2013 and 2009,2012, respectively.

In general, the title insurance business is a lower profit margin business when compared to the Company’s specialty insurance segment. The lower profit margins reflect the high cost of performing the essential services required before insuring title, whereas the corresponding revenues are subject to regulatory and competitive pricing restraints. Due to this relatively high proportion of fixed costs, title insurance profit margins generally improve as closed order volumes increase. Title insurance profit margins are affected by the composition (residential or commercial) and type (resale, refinancing or new construction) of real estate activity. In addition, profit margins from refinance transactions vary depending on whether they are centrally processed or locally processed. Profit margins from resale, new construction and centrally processed refinance transactions are generally higher than from locally processed refinance transactions because in many states there are premium discounts on, and cancellation rates are higher for, refinance transactions. Title insurance profit margins are also affected by the percentage of title insurance premiums generated by agency operations. Profit margins from direct operations are generally higher than from agency operations due primarily to the large portion of the premium that is retained by the agent. The pre-tax margin was 4.5%margins were 8.7%, 6.4%7.6% and 5.7%11.3% for the years ended December 31, 2011, 20102014, 2013 and 2009,2012, respectively.


Specialty Insurance


  2011 2010 2009 2011 vs. 2010 2010 vs. 2009 

2014


2013


2012


2014 vs. 2013


2013 vs. 2012


        $ Change % Change $ Change % Change 


$ Change


% Change


$ Change


% Change


  (in thousands, except percentages) 

(in thousands, except percentages)


Revenues


Direct premiums

  $273,665   $272,863   $270,475   $802    0.3   $2,388    0.9  

$

353,812


$

329,194


$

296,053


$

24,618


7.5


$

33,141


11.2


Information and other

   1,531    —      —      1,531    —      —      —    


2,260


1,652


1,605


608


36.8


47


2.9


Investment income

   10,380    11,876    13,429    (1,496  (12.6  (1,553  (11.6

Net investment income


7,288


7,342


8,923


(54

)


(0.7

)


(1,581

)


(17.7

)

Net realized investment gains

   1,406    1,938    1,292    (532  (27.5  646    50.0  


5,306


1,425


8,590


3,881


272.4


(7,165

)


(83.4

)

Net other-than-temporary impairment losses recognized in earnings

   —      (111  (6,820  111    100.0    6,709    98.4  


   286,982    286,566    278,376    416    0.1    8,190    2.9  


368,666


339,613


315,171


29,053


8.6


24,442


7.8


Expenses


Personnel costs

   51,389    51,939    55,396    (550  (1.1  (3,457  (6.2


62,118


58,261


55,453


3,857


6.6


2,808


5.1


Other operating expenses

   38,106    42,385    41,975    (4,279  (10.1  410    1.0  


45,599


41,725


42,395


3,874


9.3


(670

)


(1.6

)

Provision for policy losses and other claims

   149,439    140,053    140,895    9,386    6.7    (842  (0.6


196,901


186,895


160,290


10,006


5.4


26,605


16.6


Depreciation and amortization

   4,197    5,341    4,295    (1,144  (21.4  1,046    24.4  


4,978


4,865


4,553


113


2.3


312


6.9


Premium taxes

   4,691    4,135    4,346    556    13.4    (211  (4.9


6,096


5,735


5,021


361


6.3


714


14.2


Interest

   17    18    25    (1  (5.6  (7  (28.0


   247,839    243,871    246,932    3,968    1.6    (3,061  (1.2


315,692


297,481


267,712


18,211


6.1


29,769


11.1


Income before income taxes

  $39,143   $42,695   $31,444   $(3,552  (8.3 $11,251    35.8  

$

52,974


$

42,132


$

47,459


$

10,842


25.7


$

(5,327

)


(11.2

)


Margins

   13.6  14.9  11.3  (1.3)%   (8.7  3.6  31.9  


14.4

%


12.4

%


15.1

%


2.0

%


16.1


(2.7

)%


(17.9

)


Specialty insurance directDirect premiums increased 0.3%7.5% in 2011 over 20102014 from 2013 and 0.9%11.2% in 2010 over 2009.2013 from 2012. The increases in 2011 and 2010 were due to increasesdriven by higher premiums earned in volume from the home warranty division partially offset by declines in volumebusiness and, to a lesser extent, higher premiums earned in the property and casualty division.business.  The first-time homebuyer credit, which expired in April of 2010, contributed to the increase in the home warranty division volumebusiness was primarily in 2010 over 2009.

Investment income decreased 12.6%its renewal and real estate channels and was driven by an increase in 2011 from 2010the price charged for home warranty residential service contracts and 11.6%an increase in 2010 from 2009. These decreasesthe number of contracts issued.  The increase in the property and casualty business was primarily reflected a decrease in interest income earned from the investment portfolio reflecting a decline in yields.

its independent broker and direct channels.

Net realized investment gains and net other-than-temporary impairment losses for the specialty insurance segment totaled gains of$5.3 million, $1.4 million in 2011 and $1.8$8.6 million in 2010, compared with losses of $5.5 million in 2009. The 2011for 2014, 2013 and 2010 gains2012, respectively, and were primarily driven byfrom the salesales of debt and equity securities. The 2009 losses were primarily driven by other-than-temporary impairment losses taken on certain equity and debt securities partially offset by gains realized on the sale of equity securities.

Specialty insurance personnelPersonnel costs and other operating expenses decreased 5.1%increased 7.7% in 20112014 from 20102013 and 3.1%2.2% in 20102013 from 2009.2012.  The decreaseincrease in 20112014 from 20102013 was primarily duerelated to reduced marketing costshigher salary expense associated with higher average employee headcount during the current year related to increased volume in the home warranty division.business, higher incentive compensation related to higher revenue and profitability, higher production related expenses due to increased volumes, and increased amortization of deferred acquisition costs. The decreaseincrease in 20102013 from 20092012 was primarily duerelated to increased salary expense associated with higher employee reductions as well as other cost-containment programs.

headcount and higher commissions paid to agents and brokers associated with increased volume in the home warranty and property and casualty businesses, partially offset by an increase in deferred acquisition costs.

The provision for home warranty claims, expressed as a percentage of home warranty premiums, was 56.1%53.3% in 2011, 50.6%2014, 57.5% in 20102013 and 53.9%55.8% in 2009.2012.  The decrease in rate in 2014 from 2013 was primarily attributable to lower severity and lower frequency of claims due to milder weather conditions during the second and third quarters of 2014 when compared to the respective quarters of 2013.  The rate in 2014 also benefited from an improvement in claims management in 2014 when compared to 2013.  The increase in rate in 2011 over 20102013 from 2012 was primarily dueattributable to higher weather related claims in the summer season as compared to the previous year, which resulted in an

increase in business coming frommore costly air conditioning claims when compared to 2012.  In addition, the direct to consumer channel in 2011, which typically has a higher loss ratio than the traditional real estate channel. The decrease in rate in 2010 from 2009 was primarily due to a reduction in the average costfrequency and severity of other types of claims and,increased in 2013 when compared to a lesser extent, fewer incidents.

2012.  

The provision for property and casualty claims, expressed as a percentage of property and casualty insurance premiums, was 52.0%60.1% in 2011, 53.0%2014, 55.4% in 20102013 and 49.8%51.1% in 2009.2012. The decreaseincrease in rate in 20112014 from 20102013 was primarily attributable to higher claims severity and frequency.  2014 was impacted by the severe winter weather experienced in the first quarter and the California wildfires that occurred during the second quarter. The increase in rate in 2013 from 2012 was due to a reductionan increase in seasonal fire and storm claim events partially offset byand an increase in the frequency and severity of routine or non-event core losses. The increase in rate in 2010 over 2009 was primarily due to seasonal winter storms in the first and fourth quarters of 2010, including an unusual hailstorm over Arizona in October 2010, partially offset by lower routine or non-event core losses.


Premium taxes as a percentage of specialty insurance segment premiums were 1.7% in 2011, 1.5% in 20102014, 2013 and 1.6% in 2009.

2012.

A large part of the revenues for the specialty insurance businesses are generated by renewals and are not dependent on the level of real estate activity.activity in the year of renewal. With the exception of loss expense, the majority of the expenses for this segment are variable in nature and therefore generally fluctuate consistent with revenue fluctuations. Accordingly, profit


margins for this segment (before loss expense) are relatively constant, although as a result of some fixed expenses, profit margins (before loss expense) should nominally improve as premium revenues increase. Pre-tax margins were 13.6%14.4%, 14.9%12.4% and 11.3%15.1% for 2011, 20102014, 2013 and 2009,2012, respectively.

Corporate


  2011 2010 2009 2011 vs. 2010 2010 vs. 2009 

2014


2013


2012


2014 vs. 2013


2013 vs. 2012


        $ Change % Change $ Change % Change 


$ Change


% Change


$ Change


% Change


  (in thousands, except percentages) 

(in thousands, except percentages)


Revenues


Investment income

  $2,151   $8,675   $2,267   $(6,524  (75.2 $6,408    282.7  

Net realized investment losses

   (3,811  (423  (1,164  (3,388  NM 1   741    63.7  


   (1,660  8,252    1,103    (9,912  (120.1  7,149    648.1  

Net investment income

$

5,504


$

8,556


$

4,120


$

(3,052

)


(35.7

)


$

4,436


107.7


Net realized investment gains


911


4,452


25,772


(3,541

)


(79.5

)


(21,320

)


(82.7

)


6,415


13,008


29,892


(6,593

)


(50.7

)


(16,884

)


(56.5

)

Expenses


Personnel costs

   30,249    31,437    15,810    (1,188  (3.8  15,627    98.8  


34,545


48,960


46,210


(14,415

)


(29.4

)


2,750


6.0


Other operating expenses

   22,102    26,302    18,171    (4,200  (16.0  8,131    44.7  


26,528


27,264


24,462


(736

)


(2.7

)


2,802


11.5


Depreciation and amortization

   3,463    2,735    3,879    728    26.6    (1,144  (29.5


2,799


3,095


2,787


(296

)


(9.6

)


308


11.1


Interest

   10,403    7,889    5,458    2,514    31.9    2,431    44.5  


17,981


15,278


9,782


2,703


17.7


5,496


56.2


81,853


94,597


83,241


(12,744

)


(13.5

)


11,356


13.6


   66,217    68,363    43,318    (2,146  (3.1  25,045    57.8  


Loss before income taxes

  $(67,877 $(60,111 $(42,215 $(7,766  (12.9 $(17,896  (42.4

$

(75,438

)


$

(81,589

)


$

(53,349

)


$

6,151


7.5


$

(28,240

)


(52.9

)


(1)Not meaningful

InvestmentNet investment income totaled $2.2$5.5 million, $8.7$8.6 million and $2.3$4.1 million in 2011, 20102014, 2013, and 2009,2012, respectively. The variancechange in net investment income for all three years is primarily attributable to fluctuations in the earnings on investments associated with the Company’s deferred compensation plan.

  Net investment income for 2013 and 2012 included impairment losses recognized on investments accounted for using the equity method of $2.0 million and $1.2 million, respectively.

Net realized investment lossesgains totaled $3.8 million, $0.4$0.9 million and $1.2$4.5 million in 2011, 20102014 and 2009, respectively. The loss in 2011 was2013, respectively, and were primarily relatedattributable to the impairment of a non-marketable investment and the sale of a corporate fixed asset.non-marketable investments. Net realized investment gains totaled $25.8 million in 2012 and were attributable to the sale of CoreLogic stock during the third quarter of 2012.

Corporate personnel costs and other operating expenses were $52.4$61.1 million, $57.7$76.2 million and $34.0$70.7 million in 2011, 20102014, 2013 and 2009,2012, respectively. The Company experienced a higher level of corporate personneldecrease for 2014 was primarily attributable to decreased costs associated with the Company’s defined benefit pension, supplemental benefit and other operating expenses following the Separation when compareddeferred compensation plans.  The increase for 2013 was attributable to the amounts allocated from TFAC prior to the Separation. Following the Separation, the Company is a separate publicly traded company, which resulted in a higher level of corporate costs in 2011 and 2010 when compared to 2009. Additionally, personnelincreased costs associated with the Company’s deferred compensation plan were higherand, to a lesser extent, increased expenses allocated to the corporate division.  The Company expects to incur additional expenses of approximately $9 million in 20102015 related to its defined benefit pension and supplemental benefit plans when compared to 2011 and 2009.2014.  The expected increase in costs2015 is primarily the result of a significant decline in 2010 associated with the Company’s deferred compensation plan was offset by the increase in income earned in 2010 on investments associated with the deferred compensation plan, as discussed above. Also, other operating expenses were higher in 2010interest rates at December 31, 2014 when compared to 2011December 31, 2013, and 2009 due to professional services expenses incurred during 2010 relateda lesser extent, the Company’s adoption of the updated mortality tables published by the Society of Actuaries in October 2014 which reflect substantial improvements to the Separation.

life expectancy.  

Interest expense increased $2.5$2.7 million in 2011 over 20102014 from 2013 and increased $2.4$5.5 million in 2010 over 2009.2013 from 2012. Interest expense priorincreased in 2014 from 2013 primarily due to the Separation relatedCompany’s issuance of $300.0 million of debt in November 2014.  Interest expense increased in 2013 from 2012 primarily due to draws made in 2008 used for the operations of the Company’s businessesissuance of $250.0 million of debt in the amountJanuary 2013.  The Company expects to incur additional interest expense of $140.0approximately $10 million under TFAC’s credit agreement that was allocatedin 2015 when compared to 2014 due to the Company. In connection with the Separation,Company’s issuance of debt in November 2014.  This expected increase assumes the Company borrowed $200.0 millionwill not borrow under its credit facility and paid off the allocated portion of TFAC’s debt.in 2015.  Interest expense increased in 2011 over 2010 and in 2010 over 2009 because the Company’s credit facility bears interest at a higher rate than the allocated portion of TFAC’s debt. Additionally, $4.2 million of interest expense related to intercompany notes payable to the title insurance and services and specialty insurance segments was included$1.5 million, $2.6 million and $3.2 million for 2011 compared to $2.7 million of interest expense for 2010the years ended December 31, 2014, 2013 and none for 2009.2012, respectively.

Eliminations

Eliminations primarily represent interest income and related interest expense associated with intercompany notes between the Company’s segments, which are eliminated in the consolidated financial statements. The Company’s inter-segment eliminations were not material for the years ended December 31, 20112014, 2013 and 2010. The Company did not record inter-segment eliminations for the year ended December 31, 2009, as there was no inter-segment income or expense.2012.


Income Taxes

Income taxes differ from the amounts computed by applying the federal income tax rate of 35.0%. A reconciliation of this difference is as follows:

   Year ended December 31, 
   2011  2010  2009 
   (in thousands) 

Taxes calculated at federal rate

  $45,603   $74,237   $71,521  

State taxes, net of federal benefit

   2,499    3,340    (612

Dividends received deduction

   (140  (250  (1,381

Change in liability for tax positions

   2,548    4,626    (8,776

Exclusion of certain meals and entertainment expenses

   2,245    2,889    2,675  

Change in capital loss valuation allowance

   —      (14,683  —    

Foreign taxes in excess of federal rate

   1,740    9,802    10,365  

Other items, net

   (2,781  3,189    (3,724


  $51,714   $83,150   $70,068  


Year ended December 31,


2014


2013


2012


(in thousands, except percentages)


Taxes calculated at federal rate

$

122,696


35.0

%


$

108,748


35.0

%


$

163,592


35.0

%

State taxes, net of federal benefit


2,891


0.8


11,480


3.7


9,525


2.0


Change in liability for tax positions


412


0.1


3,537


1.1


2,033


0.4


Change in capital loss valuation allowance


(5,276

)


(1.1

)

Foreign income taxed at different rates


(6,091

)


(1.7

)


8,567


2.8


2,881


0.6


Foreign tax credits


(2,184

)


(0.6

)


(5,640

)


(1.8

)


(2,921

)


(0.6

)

Other items, net


(1,379

)


(0.4

)


(3,048

)


(1.0

)


(4,156

)


(0.9

)


$

116,345


33.2

%


$

123,644


39.8

%


$

165,678


35.4

%

The Company’s effective income tax rate (income tax expense as a percentage of income before income taxes), was 39.7%33.2% for 2011, 39.2%2014, 39.8% for 20102013 and 34.3%35.4% for 2009.2012. The absolute differences in the effective tax rates were primarily due to changes in the ratio of permanent differences to income before income taxes, reserve adjustments recorded in 2009 for which corresponding tax benefits were recognized, as well as changes in state and foreign income taxes resulting from fluctuations in the Company’s noninsurance and foreign subsidiaries’

contribution to pretax profits, changes in the ratio of permanent differences to income before income taxes and changes in the liability related to tax positions reported on the Company’s tax returns. In addition, theThe effective tax rate for 2010 reflects2012 included the release of a valuation allowance recorded against capital losses.

Net Income and Net Income Attributable to the Company

Net income and per share information are summarized as follows:


  2011   2010   2009 

2014


2013


2012


  (in thousands, except per share amounts) 

(in thousands, except per share amounts)


Net income

  $78,579    $128,956    $134,277  

$

234,215


$

187,064


$

301,728


Less: Net income attributable to noncontrolling interests

   303     1,127     11,888  


681


697


687


Net income attributable to the Company

  $78,276    $127,829    $122,389  

$

233,534


$

186,367


$

301,041


Per share of common stock:


Net income attributable to the Company:


Net income per share attributable to the Company’s stockholders:


Basic

  $0.74    $1.23    $1.18  

$

2.18


$

1.74


$

2.83


Diluted

  $0.73    $1.20    $1.18  

$

2.15


$

1.71


$

2.77


Weighted-average shares:


Weighted-average common shares outstanding:


Basic

   105,197     104,134     104,006  


106,884


106,991


106,307


Diluted

   106,914     106,177     104,006  


108,688


109,102


108,542


Net income attributable to noncontrolling interests decreased $0.8 million, or 73.1%, in 2011 from 2010 and $10.8 million, or 90.5%, in 2010 from 2009. The decrease in net income attributable to noncontrolling interests in 2010 when compared to 2009 is due to the Company’s purchases of subsidiary shares from noncontrolling interests in 2009. The purchases of subsidiary shares did not significantly impact net income attributable to noncontrolling interests in 2009, because the majority of the Company’s purchases occurred late in the fourth quarter of 2009.

Per share information for prior years was computed using the number of shares of common stock outstanding immediately following the Separation, as if such shares were outstanding for the entire period prior to the Separation. See Note 13 Earnings Per Share to the consolidated financial statements for further discussion of earnings per share.

Liquidity and Capital Resources

Cash Requirements.    requirements.    The Company generates cash primarily from the sale of its products and services and investment income. The Company’s current cash requirements include operating expenses, taxes, payments of principal and interest on its debt, capital expenditures, potential business acquisitions and dividends on its common stock. Management forecasts the cash needs of the holding company and its primary subsidiaries and regularly reviews their short-term and long-term projected sources and uses of funds, as well as the asset, liability, investment and cash flow assumptions underlying such forecasts. Due to the Company’s ability to generate cash flows from operations and its liquid-asset position, management believes that its resources are sufficient to satisfy its anticipated operational cash requirements and obligations for at least the next twelve months.

The substantial majority of the Company’s business is dependent upon activity in the real estate and mortgage markets, which are cyclical and seasonal. Periods of increasing interest rates and reduced mortgage financing availability generally have an adverse effect on residential real estate activity and therefore typically decrease the Company’s revenues. In contrast, periods of declining interest rates and increased mortgage financing availability generally have a positive effect on residential


real estate activity which typically increases

the Company’s revenues. Residential purchase activity is typically slower in the winter months with increased volumes in the spring and summer months. Residential refinance activity is typically more volatile than purchase activity and is highly impacted by changes in interest rates. Commercial real estate volumes are less sensitive to changes in interest rates, but fluctuate based on local supply and demand conditions for space and mortgage financing availability.

Cash provided by operating activities amounted to $133.8$360.6 million, $155.5$378.5 million and $233.6$429.7 million for the years ended December 31, 2011, 20102014, 2013 and 2009,2012, respectively, after claim payments, net of recoveries, of $503.4$469.8 million, $456.2$479.3 million and $452.2$446.0 million, respectively. The principal nonoperating uses of cash and cash equivalents for the year ended December 31, 20112014 were purchases of debt and equity securities, decreases in demand deposits at the Company’s banking operations, repayment of debt, business acquisitions, capital expenditures and dividends paid to common stockholders. The most significant nonoperating sources of cash and cash equivalents for the year ended December 31, 2011 were proceeds from the sales and maturities of debt and equity securities, early payoff of the note receivable from CoreLogic, payments collected related to loans receivable and proceeds from the issuance of new debt. The principal nonoperating uses of cash and cash equivalents for the year ended December 31, 20102013 were thepurchases of debt and equity securities, repayment of debt, (to TFACcapital expenditures, purchase of Company shares and third parties),payment of dividends to common stockholders. The principal nonoperating uses of cash distribution to TFAC in connection withand cash equivalents for the Separation, additions to the investment portfolio,year ended December 31, 2012 were purchases of debt and equity securities, repayment of debt, capital expenditures and payment of dividends to common stockholders. The most significant nonoperating sources of cash and cash equivalents for the yearyears ended December 31, 20102014, 2013 and 2012 were proceeds from the sales and maturities of debt and equity securities, increases in the deposit balances at the Company’s banking operations, proceeds from the Company’s new revolving credit facility and proceeds from the sales and maturitiesissuance of debt and equity securities.paydowns and net proceeds related to the sale of loans receivable. The net effect of all activities on total cash and cash equivalents was a decreasewere increases of $310.4$355.2 million, $164.3 million and $225.8 million for 2011, an increase of $97.4 million for 2010,the years ended December 31, 2014, 2013 and a decrease of $92.4 million for 2009.

2012, respectively.

The Company continually assesses its capital allocation strategy, including decisions relating to dividends, sharestock repurchases, capital expenditures, acquisitions and investments. In March 2014, the Company’s board of directors approved an increase in the Company’s second quarter cash dividend to 24 cents per common share, representing a 100% increase from the prior level of 12 cents per common share.  In January 2015, the Company’s board of directors approved a first quarter cash dividend of 25 cents per common share. Management expects that the Company will continue to pay quarterly cash dividends at or above the current level. The timing, declaration and payment of future dividends, however, falls within the discretion of the Company’s board of directors and will depend upon many factors, including the Company’s financial condition and earnings, the capital requirements of the Company’s businesses, industry practice, restrictions imposed by applicable law and any other factors the board of directors deems relevant from time to time.

In March 2011,2014, the Company’s board of directors approved aan increase in the size of the Company’s stock repurchase plan which authorizes the repurchase of up tofrom $150.0 million to $250.0 million, of the Company’s common stock.which $182.9 million remained as of December 31, 2014. Purchases may be made from time to time by the Company in the open market at prevailing market prices or in privately negotiated transactions. AsThe Company did not repurchase any shares of its common stock during the year ended December 31, 2014 and as of December 31, 2011, the Company2014, had repurchased and retired 203,9003.2 million shares of its common stock under the current authorization for a total purchase price of $2.5$67.1 million.

The Company completed acquisitions in 2014 for an aggregate purchase price of $162.5 million, which were partially funded through borrowings under the Company’s credit facility.

Holding Company.    company.    First American Financial Corporation is a holding company that conducts all of its operations through its subsidiaries. The holding company’s current cash requirements include payments of principal and interest on its debt, taxes, payments in connection with employee benefit plans, dividends on its common stock and other expenses. The holding company is dependent upon dividends and other payments from its operating subsidiaries to meet its cash requirements. The Company’s target is to maintain a cash balance at the holding company equal to at least twelve months of estimated cash requirements. At certain points in time, the actual cash balance at the holding company may vary from this target due to, among other potential factors, the timing and amount of cash payments made and dividend payments received. Pursuant to insurance and other regulations under which the Company’s insurance subsidiaries operate, the amount of dividends, loans and advances available to the holding company is limited, principally for the protection of policyholders. UnderAs of December 31, 2014, under such regulations, the maximum amount of dividends, loans and advances available to the holding company from its insurance subsidiaries in 2012 is $181.12015, without prior approval from applicable regulators, was $570.0 million. Such restrictions have not had, nor are they expected to have, an impact on the holding company’s ability to meet its cash obligations.

The Company’s principal title insurance subsidiary, First American Title Insurance Company (“FATICO”), which was previously domiciled in the state of California, redomesticated to Nebraska effective July 1, 2014.  While the redomestication did impact FATICO’s total statutory capital and surplus, statutory net income and the maximum amount of dividends


FATICO can pay to the holding company due to differences in prescribed accounting practices and other regulations between the two states, the impact of the redomestication was not material to the liquidity or capital resources of the holding company.

In 2014, the Company substantially completed a multi-year initiative to restructure its legal entity organizational structure in order to increase the amount of dividends available to the holding company from its operating subsidiaries.  As a result of this restructuring, a number of subsidiaries previously owned by FATICO are now owned either directly by the holding company or otherwise outside of any regulated insurance company.

As of December 31, 2011,2014, the holding company’s sources of liquidity include $147.3included $328.9 million of cash 6.0 million shares of CoreLogic common stock with an estimated fair value of $77.5 million and $200.0cash equivalents and $700.0 million available on the Company’s $400.0 million revolving credit facility described below.facility. Management believes that its liquidity at the holding company is sufficient to satisfy its anticipated cash requirements and obligations for at least the next twelve months.

Financing. Financing.    On April 12, 2010,     In May 2014, the Company entered into aamended and restated its credit agreement with JPMorgan Chase Bank, N.A. (“JPMorgan”) in its capacity as administrative agent and a syndicate of lenders.

the lenders party thereto. The credit agreement is comprised of a $400.0$700.0 million revolving credit facility. TheUnless terminated earlier, the revolving loan commitments under the credit agreement will terminate on the third anniversaryMay 14, 2019. The obligations of the date of closing, or June 1, 2013. On June 1, 2010, the Company borrowed $200.0 million under the facility and transferred such funds to CoreLogic, as previously contemplatedcredit agreement are neither secured nor guaranteed. The agreement replaced the Company’s $600.0 million senior unsecured credit agreement that had been in connection withplace since November 14, 2012.  Proceeds under the Separation. Proceedscredit agreement may also be used for general corporate purposes. At December 31, 2011,2014, the interest rate associated with the $200.0 million borrowedCompany had no outstanding borrowings under the facility is 3.06%.

facility.

The Company’s obligations under the credit agreement are guaranteed by certain of the Company’s subsidiaries (the “Guarantors”). To secure the obligations ofincludes an expansion option that permits the Company, and the Guarantors (collectively, the “Loan Parties”) under the credit agreement, the Loan Parties pledged all of the equity interests they own in each Data Trace and Data Tree company and a 9% equity interest in FATICO.

If at any time the rating by Moody’s Investor Service, Inc. (“Moody’s”) or Standard & Poor’s Ratings Group (“S&P”) of the senior, unsecured, long-term indebtedness for borrowed money of the Company that is not guaranteed by any other person or subject to any other credit enhancement is rated lower than Baa3 or BBB-, respectively, or is not rated by either such rating agency, then the loan commitments are subject to mandatory reduction from (a) 50% of the net proceedssatisfaction of certain equity issuances by any Loan Party, (b) 50% ofconditions, to increase the net proceeds of certain debt incurred revolving commitments and/or issued by any Loan Party, (c) 25% ofadd term loan tranches (“Incremental Term Loans”) in an aggregate amount not to exceed $150.0 million. Incremental Term Loans, if made, may not mature prior to the net proceeds received by any Loan Party from the disposition of CoreLogic stock received in connection with the Separation and (d) the net proceeds received by any Loan Party from certain dispositions of assets,revolving commitment termination date, provided that the commitment reductions described above are only requiredamortization may occur prior to the extent necessary to reduce the total loan commitments to $200.0 million. The Company is only required to prepay loans to the extent that, after giving effect to any mandatory commitment reduction, the aggregate principal amount of all outstanding loans exceeds the remaining total loan commitments.

such date.

At the Company’s election, borrowings of revolving loans under the credit agreement bear interest at (a) the Alternate Base Rate plus the Applicable Rateapplicable spread or (b) the Adjusted LIBOR rate plus the Applicable Rateapplicable spread (in each case as defined in the agreement). The Company may select interest periods of one, two, three or six months or (if agreed to by all lenders) such other number of months for Eurodollar borrowings of loans. The Applicable Rateapplicable spread varies depending upon the debt rating assigned by Moody’s Investor Service (“Moody’s”), Inc. and/or Standard & Poor’s Rating Services (“S&P to the credit agreement, or if no such rating is in effect, the Index Debt Rating.&P”). The minimum Applicable Rateapplicable spread for Alternate Base Rate borrowings is 1.50%0.625% and the maximum is 2.25%1.00%. The minimum Applicable Rateapplicable spread for Adjusted LIBOR rate borrowings is 2.50%1.625% and the maximum is 3.25%2.00%.

The rate of interest on Incremental Term Loans will be established at or about the time such loans are made and may differ from the rate of interest on revolving loans.

The credit agreement includes representations and warranties, reporting covenants, affirmative covenants, negative covenants, financial covenants and events of default customary for financings of this type. Upon the occurrence of an event of default the lenders may accelerate the loans and the Collateral Agent may exercise remedies under the collateral documents.loans. Upon the occurrence of certain insolvency and bankruptcy events of default the loans will automatically accelerate. AtAs of December 31, 2011,2014, the Company iswas in compliance with the debtfinancial covenants under the credit agreement.

In addition to amounts available under theits credit facility, certain subsidiaries of the Company are parties to master repurchase agreements which are used as part of the Company’s liquidity management activities and to

support its risk management activities. In particular, securities loaned or sold under repurchase agreements aremay be used as short-term funding sources. In 2011,During 2014, the Company did not transfer or receivefinanced securities for funds or securitiesreceived totaling $35.6 million under these agreements. As of December 31, 2014, no amounts remained outstanding under these agreements.

On November 10, 2014, the Company issued $300.0 million of 4.60% 10-year senior unsecured notes due in 2024. The notes were priced at 99.975% to yield 4.603%. Interest is due semi-annually on May 15 and November 15, beginning May 15, 2015. The Company intends to use the net proceeds for general corporate purposes. In anticipation of the receipt of the net proceeds from this offering, the Company repaid all borrowings outstanding under its credit facility, increasing the available capacity thereunder to the full $700.0 million size of the facility.

Notes and contracts payable as a percentage of total capitalization was 12.8%18.6% and 11.2% at December 31, 20112014 and 2010.2013, respectively. The increase in 2014 primarily reflected the Company’s issuance of the senior unsecured notes during the fourth quarter of 2014. Notes and contracts payable are more fullyfurther described in Note 10 Notes and Contracts Payable to the consolidated financial statements.

Investment Portfolio.    portfolio.    The Company’sCompany maintains a high quality, liquid investment portfolio that is primarily held at its insurance and banking subsidiaries. The Company maintains a high quality, liquid investment portfolio. As of December 31, 2011, the Company’s debt and equity investment securities portfolio consists of approximately2014, 90% of fixed income securities. As of that date, over 70% of the Company’s investment portfolio consisted of fixed


income investments are held in securities, that areof which 66% were United States government-backed or rated AAA and approximately 98% of the fixed income portfolio is97% were rated or classified as investment grade. Percentages are based on the amortized cost basis of the securities. Credit ratings are based on S&P and Moody’s published ratings. If a security was rated differently by both rating agencies, the lower of the two ratings was selected.

The table below outlines the composition of the investment portfolio currently in an unrealized loss position, by credit rating, (percentages are based on the amortized cost basis of the investments). Credit ratings are based on S&P and Moody’s published ratings and are exclusive as of insurance effects. If a security was rated differently by both rating agencies, the lower of the two ratings was selected:December 31, 2014:


   A-Ratings
or
Higher
  BBB+
to BBB-
Ratings
  Non-
Investment
Grade/Not
Rated
 

December 31, 2011


Municipal bonds

   95.8  0.0  4.2

Foreign bonds

   99.2  0.8  0.0

Governmental agency bonds

   100.0  0.0  0.0

Governmental agency mortgage-backed securities

   100.0  0.0  0.0

Non-agency mortgage-backed securities

   0.0  0.0  100.0

Corporate debt securities

   92.5  7.5  0.0

Preferred stock

   0.0  100.0  0.0


   89.9  1.3  8.8


In connection with the Separation, TFAC issued to the Company and FATICO a number of shares of its common stock that resulted in the Company and FATICO collectively owning 12.9 million shares of CoreLogic’s common stock immediately following the Separation. Due to the fact that a substantial proportion of the Company’s investment portfolio consists of the common stock of a single issuer, CoreLogic, the Company sold 4.0 million shares in April 2011 to reduce its unsystematic risk. At December 31, 2011, the Company owned 8.9 million shares of CoreLogic common stock with a cost basis of $167.6 million and an estimated fair value of $115.5 million. The Company holds 6.0 million shares at the holding company and the remaining 2.9 million shares at FATICO. The Company has agreed to dispose of the shares within five years after the Separation or to bear any adverse tax consequences arising as a result of holding the shares for a longer period. The Company will continue to closely monitor and regularly review its investment in CoreLogic common stock.


A-Ratings
or
Higher


BBB+
to BBB-
Ratings


Non-
Investment
Grade/Not
Rated


December 31, 2014


US Treasury bonds


100.0

%


0.0

%


0.0

%

Municipal bonds


97.9

%


0.0

%


2.1

%

Foreign bonds


99.0

%


1.0

%


0.0

%

Governmental agency bonds


100.0

%


0.0

%


0.0

%

Governmental agency mortgage-backed securities


100.0

%


0.0

%


0.0

%

Non-agency mortgage-backed securities


0.0

%


0.0

%


100.0

%

Corporate debt securities


44.5

%


32.0

%


23.5

%

Preferred stock


0.0

%


45.1

%


54.9

%


89.5

%


5.6

%


4.9

%

In addition to its debt and equity investment securities portfolio, the Company maintains certain money-market and other short-term investments.

Capital expenditures.    Capital expenditures primarily consist of additions to property and equipment, capitalized software development costs and additions to title plants. Capital expenditures were $75.4$99.4 million, $88.7$87.1 million and $42.3$83.9 million for the years ended December 31, 2011, 20102014, 2013 and 2009,2012, respectively. The

decrease increase in 20112014 from 20102013 was primarily attributablerelated to ahigher software, capitalized real estate data and title plant additions partially offset by lower level ofproperty and equipment additions in 2014 when compared to 2013. The increase in 2013 from 2012 was primarily related to higher property and equipment additions, partially offset by lower title plant additions in 20112013 when compared to 2010. The increase in 2010 over 2009 was primarily related to a higher level of capitalized software development costs and title plant additions in 2010 when compared to 2009, and the buyout of several fixed asset operating leases in 2010.2012.

Contractual obligations.    A summary, by due date, of the Company’s total contractual obligations at December 31, 2011,2014, is as follows:


   Total   Less than 1
year
   1-3 years   3-5 years   More than
5 years
 
   (in thousands) 

Notes and contracts payable

  $299,975    $30,155    $221,910    $19,499    $28,411  

Interest on notes and contracts payable

   29,317     11,942     8,552     3,609     5,214  

Operating leases

   258,201     84,036     111,953     45,854     16,358  

Deposits

   1,093,236     1,072,703     14,961     5,572     —    

Claim losses

   1,014,676     256,048     257,998     151,435     349,195  

Pension and supplemental benefit plans

   520,349     34,150     79,382     51,687     355,130  


  $3,215,754    $1,489,034    $694,756    $277,656    $754,308  


Total


Less than 1
year


1-3 years


3-5 years


More than
5 years


(in thousands)


Notes and contracts payable

$

587,337


$

4,899


$

9,467


$

7,454


565,517


Interest on notes and contracts payable


238,088


26,551


52,327


51,595


107,615


Operating leases


323,961


79,243


124,586


59,859


60,273


Deposits


2,332,714


2,332,714


Claim losses


1,011,780


264,175


289,925


163,194


294,486


Pension and supplemental benefit plans


549,673


35,813


67,679


50,056


396,125


$

5,043,553


$

2,743,395


$

543,984


$

332,158


$

1,424,016


The timing of claim payments is estimated and is not set contractually. Nonetheless, based on historical claims experience, the Company anticipates the above payment patterns. Changes in future claim settlement patterns, judicial decisions, legislation, economic conditions and other factors could affect the timing and amount of actual claim payments. The timing and amount of payments in connection with pension and supplemental benefit plans isare based on the Company’s current estimate and requiresrequire the use of significant assumptions. Changes in significant assumptions could affect the amount and timing of pension and supplemental benefit plan payments. See Note 14 Employee Benefit Plans to the consolidated financial statements for additional discussion of management’s significant assumptions. The Company is not able to reasonably estimate the timing of payments, or the amount by which the liability for the Company’s uncertain tax positions will increase or decrease over time; therefore the liability of $17.3$24.1 million has not been included in the contractual obligations table. See Note 12 Income Taxes to the consolidated financial statements for additional discussion of the Company’s liability for uncertain tax positions.


Off-balance sheet arrangements.    The Company administers escrow deposits and trust assets as a service to its customers. Escrow deposits totaled $3.07$6.3 billion and $3.03$4.7 billion at December 31, 20112014 and 2010,2013, respectively, of which $0.9$2.2 billion and $0.9$1.6 billion, respectively, were held at the Company’s federal savings bank subsidiary, First American Trust, FSB. The escrow deposits held at First American Trust, FSB are included in the accompanying consolidated balance sheets,temporarily invested in cash and cash equivalents and debt and equity securities, with offsetting liabilities included in deposits.deposits in the accompanying consolidated balance sheets. The remaining escrow deposits were held at third-party financial institutions.

Trust assets held or managed by First American Trust, FSB totaled $2.8 billion and $2.9$3.0 billion at December 31, 20112014 and 2010, respectively, and were held at First American Trust, FSB.2013. Escrow deposits held at third-party financial institutions and trust assets are not considered assets of the Company and, therefore, are not included in the accompanying consolidated balance sheets. However, the Company could be held contingently liable for the disposition of these assets.

In conducting its operations, the Company often holds customers’ assets in escrow, pending completion of real estate transactions. Astransactions and, as a result, of holding these customers’ assets in escrow, the Company has ongoing programs for realizing economic benefits, including investment programs, borrowing agreements, and vendor services arrangements with various financial institutions. The effects of these programs are included in the consolidated financial statements as income or a reduction in expense, as appropriate, based on the nature of the arrangement and benefit received.

The Company facilitates tax-deferred property exchanges for customers pursuant to Section 1031 of the Internal Revenue Code and tax-deferred reverse exchanges pursuant to Revenue Procedure 2000-37. As a facilitator and intermediary, the Company holds the proceeds from sales transactions and takes temporary title to property identified by the customer to be acquired with such proceeds. Upon the completion of each such exchange, the identified property is transferred to the customer or, if the exchange does not take place, an amount equal to the sales proceeds or, in the case of a reverse exchange, title to the property held by the Company is transferred to the customer. Like-kind exchange funds held by the Company totaled $564.7 million$2.4 billion and $609.9 million$1.4 billion at December 31, 20112014 and 2010, respectively, of which none and $408.8 million, respectively, were held at the Company’s subsidiary, First Security Business Bank (“FSBB”).2013, respectively. The like-kind exchange deposits held at FSBB are included in the accompanying consolidated balance sheets in cash and cash equivalents with offsetting liabilities included in deposits. The remaining exchange deposits were held at third-party financial institutions and, due to the structure utilized to facilitate these transactions, the proceeds and property are not considered assets of the Company and, therefore, are not included in the accompanying consolidated balance sheets. SuchAll such amounts are placed in bank deposits with FDICdeposit accounts insured, institutions.up to applicable limits, by the Federal Deposit Insurance Corporation. The Company could be held contingently liable to the customer for the transfers of property, disbursements of proceeds and the return on the proceeds.

During the third quarter of 2011, the Company began the multi-year process of winding-down the operations of FSBB. FSBB continues to accept and service certain deposits and to service its existing loan portfolio, but is no longer accepting like-kind exchange deposits or originating or purchasing new loans.

At December 31, 20112014 and 2010,2013, the Company was contingently liable for guarantees of indebtedness owed by affiliates and third parties to banks and others totaling $31.0$8.9 million and $34.9$14.7 million, respectively. The guarantee arrangements relate to promissory notes and other contracts andthat contingently require the Company to make payments to the guaranteed party based onupon the failure of debtors to make scheduled payments according to the terms of the notes and contracts. The Company’s maximum potential amount of future paymentsobligation under these guarantees totaled $31.0$8.9 million and $34.9$14.7 million at December 31, 20112014 and 2010,2013, respectively, and is limited in duration to the terms of the underlying indebtedness. The Company has not incurred any costs as a result of these guarantees and has not recorded a liability on its consolidated balance sheets related to these guarantees at December 31, 20112014 and 2010.2013.


Item 7A.    


Item 7A.

Quantitative and Qualitative Disclosures about Market Risk

The Company’s assets and Qualitative Disclosures about Market Riskliabilities include financial instruments subject to the risk of loss from adverse changes in market rates and prices.  The Company’s primary market risk exposures relate to interest rate risk, equity price risk, foreign currency risk and credit risk.

Interest Rate Risk

The Company manages its primary market risk exposures through an investment committee made up of certain senior executives which is advised by an experienced investment management staff.

The Company has selected a new disclosure alternative, from among the three alternatives allowed, to present quantitative information about market risk specific to interest rate risk associated with certainand equity price risk for 2014 and 2013.  The Company has determined that a change from the tabular presentation of information related to market risk sensitive instruments to a sensitivity analysis disclosure of potential losses would be more useful to third party users of the Company’s financial instruments. statements as a sensitivity analysis presents how adverse changes in market rates and prices could impact the Company’s financial results.

While the hypothetical scenarios below are considered to be near-term reasonably possible changes demonstrating potential risk, they are for illustrative purposes only and do not reflect the Company’s expectations about future market changes.  

Interest Rate Risk

The Company monitors its risk associated with fluctuations in interest rates and makes investment decisions to manage accordingly. The Company does not currently use derivative financial instruments in any material amount to hedge these risks.  

The table below provides information about certain assetsCompany’s exposure to interest rate changes primarily results from the Company’s significant portfolio of fixed income securities and liabilities asfrom its financing activities. In general, the fair value of fixed income securities increases or decreases inversely with changes in market interest rates.  The Company also considers its investments in preferred stock, which are tied to interest rates, to be exposed to interest rate risk.  The fair values of the Company’s fixed income portfolio at December 31, 2014 and 2013 were $3.5 billion and $2.8 billion, respectively.  One means of assessing the exposure of the Company’s fixed income portfolio to interest rate changes is a duration-based analysis that measures the potential changes in fair value resulting from a hypothetical parallel and instantaneous shift in interest rates across all maturities.  Under this model, with all other factors held constant, the Company estimates that increases in interest rates of 100 and 200 basis points could cause the fair value of its fixed income portfolio (including investments in preferred stock) at December 31, 2014 to decrease by approximately $110 million, or 3.2%, and $217 million, or 6.2%, respectively, and at December 31, 2013 to decrease by approximately $98 million, or 3.5%, and $194 million, or 6.8%, respectively.  

With respect to floating rate debt, the Company is primarily exposed to the effects of changes in prevailing interest rates through its variable rate credit facility and its interest bearing escrow deposit liabilities.  As of December 31, 20112014 and 2013, the Company had no outstanding borrowings under its credit facility.  Assuming the full utilization of available funds under the facility of $700.0 million and $600.0 million at December 31, 2014 and 2013, respectively, and assuming that the borrowings were outstanding for the entire year, increases of 50 and 100 basis points in the prevailing interest rate on the Company’s credit facility would result in increases in interest expense of $3.5 million and $7.0 million, respectively, for 2014 and increases of $3.0 million and $6.0 million, respectively,  for 2013.  

The Company’s interest bearing escrow deposit liabilities totaled $2.0 billion and $1.4 billion at December 31, 2014 and 2013, respectively.  These variable rate customer savings accounts are sensitivesubject to changesmarket rate fluctuations.  Weighted average interest rates for 2014 and 2013 were 0.11% and 0.13%, respectively. Assuming increases in interest rates of 25 and presents cash flows50 basis points and the related weighted averagedeposit amounts at December 31, 2014 and 2013 are held constant for the entire year, interest ratesexpense for 2014 would be higher by expected maturity dates.

$4.9 million and $9.8 million, respectively, and for 2013 interest expense would be higher by $3.4 million and $6.9 million, respectively.  

  2012  2013  2014  2015  2016  Thereafter  Total  Fair Value 
  (in thousands except percentages) 

Assets


Deposits with Savings and Loan Associations and Banks


Book Value

 $56,201        $56,201   $56,201  

Average Interest Rate

  1.09       

Debt Securities


Amortized Cost

 $105,687    84,075    115,419    131,796    142,371    1,588,232   $2,167,580   $2,201,911  

Average Interest Rate

  3.42  4.17  3.42  3.26  3.58  2.60  

Notes Receivable


Book Value

 $2,767    1,561    4,359    968    1,382    7,946   $18,983   $14,534  

Average Interest Rate

  5.68  5.71  5.16  5.13  5.79  5.87  

Loans Receivable


Book Value

 $2,437    1,284    2,499    9,363    6,033    122,539   $144,155   $144,868  

Average Interest Rate

  7.25  6.33  6.14  6.08  6.99  6.44  

Liabilities


Interest Bearing Escrow Deposits


Book Value

 $744,917        $744,917   $744,917  

Average Interest Rate

  0.25       

Variable Rate Deposits


Book Value

 $26,840        $26,840   $26,840  

Average Interest Rate

  0.65       

Fixed Rate Deposits


Book Value

 $23,239    10,501    4,460    4,206    1,366    $43,772   $44,307  

Average Interest Rate

  1.55  1.82  2.27  2.70  1.91   

Notes and Contracts Payable


Book Value

 $30,155    208,451    13,459    15,327    4,172    28,411   $299,975   $304,806  

Average Interest Rate

  3.23  3.40  4.52  4.66  5.29  5.26  

Equity Price Risk

The Company is also subject to equity price risk related to its equity securities portfolio. At December 31, 2011, the Company had equity securities with a cost basis of $231.9 million and estimated fair value of $184.0 million. Included in the equity securities portfolio are shares of CoreLogic common stock, which the Company received in connection with the Separation, with a cost basis of $167.6 million and estimated fair value of $115.5 million at December 31, 2011. The Company manages its equity price risk including the risk associated with its CoreLogic common stock, through an investment committee made up of certain senior executives which is advised by an experienced investment management staff. The fair value of the Company’s equity securities portfolio (excluding preferred stock of $15.5 million and $11.1 million) was $386.9 million and $347.0 million as of December 31, 2014 and 2013, respectively.  


Assuming broad-based declines in equity market prices of 10% and 20%, with all other factors constant, the fair value of the Company’s equity securities at December 31, 2014 could decrease by $38.7 million and $77.4 million, respectively, and at December 31, 2013 could decrease by $34.7 million and $69.4 million, respectively.

Foreign Currency Risk

Although the Company has exchange rate risk for its operations in certain foreign countries, this risk is not material to the Company’s financial condition or results of operations. The Company does not currently use derivative financial instruments in any material amount to hedge its foreign exchange risk.

Credit Risk

The Company’s corporate, municipal, foreign, non-agency mortgage-backed and, to a lesser extent, its agencydebt securities areportfolio is subject to credit risk. The Company manages its credit risk through actively monitoring issuer financial reports, credit spreads, security pricing and credit rating migration. Further, diversification and concentration limits by asset type and per issuercredit rating are established and monitored by the Company’s investment committee.

The Company’s non-agency mortgage-backed securities credit risk is analyzed by monitoring servicer reports and through utilization of sophisticated cash flow models to measure the default characteristics of the underlying collateral pools.

The Company holds a large concentration in U.S. government agency securities, including agency mortgage-backed securities. In the event of discontinued U.S. government support of its federal agencies, material credit risk could be observed in the portfolio. The Company views that scenario as unlikely but possible. The federal government currently is considering various alternatives to reform the Federal National Mortgage Association (Fannie Mae) and the Federal Home Loan Mortgage Corporation (Freddie Mac). The nature and timing of the reforms is unknown, however, the federal government recently reiterated its commitment to ensuring that Fannie Mae and Freddie Mac have sufficient capital to perform under any guarantees issued now or in the future and the ability to meet any of their debt obligations.

The Company’s overall investment securities portfolio maintains an average credit quality of AA.


Item 8.    Financial Statements and Supplementary Data


Separate financial statements for subsidiaries not consolidated and 50% or less owned persons accounted for by the equity method have been omitted because they would not constitute a significant subsidiary.

INDEX


Item 8.

Financial Statements and Supplementary Data

INDEX

Financial statement schedules not listed are either omitted because they are not applicable or the required information is shown in the consolidated financial statements or in the notes thereto.


Report of Independent Registered Public Accounting Firm


To the Board of Directors and Stockholders of

First American Financial Corporation:

In our opinion, the consolidated financial statements listed in the accompanying index present fairly, in all material respects, the financial position of First American Financial Corporation and its subsidiaries at December 31, 20112014 and 2010,2013, and the results of their operations and their cash flows for each of the three years in the period ended December 31, 20112014 in conformity with accounting principles generally accepted in the United States of America.  In addition, in our opinion, the financial statement schedules listed in the accompanying indexpresent fairly, in all material respects, the information set forth therein when read in conjunction with the related consolidated financial statements.  Also in our opinion, the Company maintained, in all material respects, effective internal control over financial reporting as of December 31, 2011,2014, based on criteria established inInternal Control - Integrated Framework (2013) issued by the Committee of Sponsoring Organizations of the Treadway Commission (COSO).  The Company’sCompany's management is responsible for these financial statements and financial statement schedules, for maintaining effective internal control over financial reporting and for its assessment of the effectiveness of internal control over financial reporting, included in the Management’sManagement's Annual Report on Internal Control Over Financial Reporting appearing under Item 9A.  Our responsibility is to express opinions on these financial statements, on the financial statement schedules, and on the Company’sCompany's internal control over financial reporting based on our audits (which were integrated audits in 2011 and 2010).audits.  We conducted our audits in accordance with the standards of the Public Company Accounting Oversight Board (United States).  Those standards require that we plan and perform the audits to obtain reasonable assurance about whether the financial statements are free of material misstatement and whether effective internal control over financial reporting was maintained in all material respects.  Our audits of the financial statements included examining, on a test basis, evidence supporting the amounts and disclosures in the financial statements, assessing the accounting principles used and significant estimates made by management, and evaluating the overall financial statement presentation.  Our audit of internal control over financial reporting included obtaining an understanding of internal control over financial reporting, assessing the risk that a material weakness exists, and testing and evaluating the design and operating effectiveness of internal control based on the assessed risk.  Our audits also included performing such other procedures as we considered necessary in the circumstances. We believe that our audits provide a reasonable basis for our opinions.

As discussed in Note 1, amounts recorded for allocations of certain expenses directly attributable to the operations of First American Financial Corporation prior to June 1, 2010 are not necessarily representative of the amounts that would have been reflected in the financial statements had the Company operated as a separate, stand-alone entity.

A company’s internal control over financial reporting is a process designed to provide reasonable assurance regarding the reliability of financial reporting and the preparation of financial statements for external purposes in accordance with generally accepted accounting principles.  A company’s internal control over financial reporting includes those policies and procedures that (i) pertain to the maintenance of records that, in reasonable detail, accurately and fairly reflect the transactions and dispositions of the assets of the company; (ii) provide reasonable assurance that transactions are recorded as necessary to permit preparation of financial statements in accordance with generally accepted accounting principles, and that receipts and expenditures of the company are being made only in accordance with authorizations of management and directors of the company; and (iii) provide reasonable assurance regarding prevention or timely detection of unauthorized acquisition, use, or disposition of the company’s assets that could have a material effect on the financial statements.

Because of its inherent limitations, internal control over financial reporting may not prevent or detect misstatements.  Also, projections of any evaluation of effectiveness to future periods are subject to the risk that controls may become inadequate because of changes in conditions, or that the degree of compliance with the policies or procedures may deteriorate.

/s/ PRICEWATERHOUSECOOPERSRICEWATERHOUSECOOPERS LLP

PricewaterhouseCoopers LLP

Orange County,Los Angeles, California

February 27, 2012

23, 2015


FIRST AMERICAN FINANCIAL CORPORATION

AND SUBSIDIARY COMPANIES

CONSOLIDATED BALANCE SHEETS

(in thousands, except par values)


  December 31, 

December 31,


  2011 2010 

2014


2013


ASSETS


Cash and cash equivalents

  $418,299   $728,746  

$

1,190,080


$

834,837


Accounts and accrued income receivable, less allowances ($30,504 and $39,904)

   227,847    234,539  

Accounts and accrued income receivable, less allowances of $34,662 and $31,831


276,610


236,895


Income taxes receivable

   20,431    22,266  


5,547


37,632


Investments:


Deposits with savings and loan associations and banks

   56,201    59,974  

Debt securities

   2,201,911    2,107,984  

Deposits with banks


21,445


23,492


Debt securities, includes pledged securities of $120,742 and $123,956


3,450,252


2,819,817


Equity securities

   184,000    282,416  


402,412


358,043


Other long-term investments

   200,805    213,877  


159,783


183,976


Notes receivable from CoreLogic

   —      18,787  


   2,642,917    2,683,038  


4,033,892


3,385,328


Loans receivable, net

   139,191    161,526  


73,755


Property and equipment, net

   337,578    345,871  


395,287


361,348


Title plants and other indexes

   513,998    504,606  


530,589


523,879


Deferred income taxes

   39,617    96,846  


19,712


27,478


Goodwill

   818,420    812,031  


959,945


846,026


Other intangible assets, net

   59,994    70,050  


55,812


46,347


Other assets

   152,045    162,307  


198,626


185,658


$

7,666,100


$

6,559,183


  $5,370,337   $5,821,826  


LIABILITIES AND EQUITY


Deposits

  $1,093,236   $1,482,557  

$

2,332,714


$

1,692,932


Accounts payable and accrued liabilities:


Accounts payable

   27,525    33,350  


26,264


26,378


Personnel costs

   137,024    137,848  


184,994


183,344


Pension costs and other retirement plans

   432,456    409,317  


477,763


388,993


Other

   138,929    155,889  


165,084


197,097


854,105


795,812


   735,934    736,404  


Due to CoreLogic, net

   35,951    62,370  

Deferred revenue

   155,626    144,719  


202,764


192,184


Reserve for known and incurred but not reported claims

   1,014,676    1,108,238  


1,011,780


1,018,365


Income taxes payable


6,228


Deferred income taxes


95,128


93,362


Notes and contracts payable

   299,975    293,817  


587,337


310,285


5,090,056


4,102,940


   3,335,398    3,828,105  


Commitments and contingencies


Commitments and contingencies (Notes 18 and 20)


Stockholders’ equity:


Preferred stock, $0.00001 par value, Authorized—500 shares; Outstanding—none

   —      —    

Common stock, $0.00001 par value:


Authorized—300,000 shares; Outstanding—105,410 shares and 104,457 shares as of December 31, 2011 and 2010, respectively

   1    1  

Preferred stock, $0.00001 par value; Authorized—500 shares;
Outstanding—none


Common stock, $0.00001 par value; Authorized—300,000 shares;


Outstanding—107,541 shares and 105,900 shares


1


1


Additional paid-in capital

   2,081,242    2,057,098  


2,109,712


2,077,828


Retained earnings

   124,816    72,074  


662,310


520,764


Accumulated other comprehensive loss

   (177,459  (149,156


(199,106

)


(145,544

)


Total stockholders’ equity

   2,028,600    1,980,017  


2,572,917


2,453,049


Noncontrolling interests

   6,339    13,704  


3,127


3,194


Total equity

   2,034,939    1,993,721  


2,576,044


2,456,243


$

7,666,100


$

6,559,183


  $5,370,337   $5,821,826  


See Notes to Consolidated Financial Statements


FIRST AMERICAN FINANCIAL CORPORATION

AND SUBSIDIARY COMPANIES

CONSOLIDATED STATEMENTS OF INCOME

(in thousands, except per share amounts)


Year Ended December 31,


2014


2013


2012


Revenues:


Direct premiums and escrow fees

$

2,115,274


$

2,184,464


$

2,041,740


Agent premiums


1,841,618


2,044,862


1,709,905


Information and other


619,949


627,645


645,023


Net investment income


71,041


89,895


81,031


Net realized investment gains


31,768


9,211


67,686


Net other-than-temporary impairment losses


(1,701

)


(3,564

)


4,677,949


4,956,077


4,541,821


Expenses:


Personnel costs


1,410,752


1,445,582


1,334,866


Premiums retained by agents


1,470,895


1,636,694


1,370,193


Other operating expenses


833,681


885,805


836,319


Provision for policy losses and other claims


450,023


530,356


397,717


Depreciation and amortization


85,597


74,916


74,950


Premium taxes


57,194


56,715


51,304


Interest


19,247


15,301


9,066


4,327,389


4,645,369


4,074,415


Income before income taxes


350,560


310,708


467,406


Income taxes


116,345


123,644


165,678


Net income


234,215


187,064


301,728


Less: Net income attributable to noncontrolling interests


681


697


687


Net income attributable to the Company

$

233,534


$

186,367


$

301,041


Net income per share attributable to the Company’s stockholders:


Basic

$

2.18


$

1.74


$

2.83


Diluted

$

2.15


$

1.71


$

2.77


Cash dividends declared per share

$

0.84


$

0.48


$

0.36


Weighted-average common shares outstanding:


Basic


106,884


106,991


106,307


Diluted


108,688


109,102


108,542


See Notes to Consolidated Financial Statements


FIRST AMERICAN FINANCIAL CORPORATION

AND SUBSIDIARY COMPANIES

CONSOLIDATED STATEMENTS OF COMPREHENSIVE INCOME

(in thousands, except per share amounts)thousands)


   Year Ended December 31, 
  2011  2010  2009 

Revenues:


Direct premiums and escrow fees

  $1,634,177   $1,663,956   $1,760,571  

Agent premiums

   1,491,943    1,517,704    1,524,120  

Information and other

   621,483    628,504    667,115  

Investment income

   82,153    94,262    120,249  

Net realized investment (losses) gains

   (114  10,209    14,637  

Net other-than-temporary impairment (“OTTI”) losses recognized in earnings:


Total OTTI losses on equity securities

   —      (1,722  (21,051

Total OTTI losses on debt securities

   (12,748  (8,497  (45,020

Portion of OTTI losses on debt securities recognized in other comprehensive loss

   3,680    2,196    26,213  


   (9,068  (8,023  (39,858


   3,820,574    3,906,612    4,046,834  


Expenses:


Personnel costs

   1,186,479    1,214,434    1,216,565  

Premiums retained by agents

   1,195,282    1,222,274    1,229,229  

Other operating expenses

   753,750    803,603    909,466  

Provision for policy losses and other claims

   420,136    320,874    346,714  

Depreciation and amortization

   76,889    80,642    84,212  

Premium taxes

   45,663    37,780    36,484  

Interest

   12,082    14,899    19,819  


   3,690,281    3,694,506    3,842,489  


Income before income taxes

   130,293    212,106    204,345  

Income taxes

   51,714    83,150    70,068  


Net income

   78,579    128,956    134,277  

Less: Net income attributable to noncontrolling interests

   303    1,127    11,888  


Net income attributable to the Company

  $78,276   $127,829   $122,389  


Net income per share attributable to the Company’s stockholders:


Basic

  $0.74   $1.23   $1.18  


Diluted

  $0.73   $1.20   $1.18  


Cash dividends per share

  $0.24   $0.18   $—    


Weighted-average common shares outstanding:


Basic

   105,197    104,134    104,006  


Diluted

   106,914    106,177    104,006  


Year Ended December 31,


2014


2013


2012


Net income

$

234,215


$

187,064


$

301,728


Other comprehensive income (loss), net of tax:


Unrealized gain (loss) on securities


18,862


(32,992

)


31,445


Unrealized gain on securities for which credit losses have been recognized in earnings


776


2,327


3,902


Foreign currency translation adjustment


(16,694

)


(13,650

)


5,131


Pension benefit adjustment


(56,496

)


49,324


(13,571

)

Total other comprehensive income (loss), net of tax


(53,552

)


5,009


26,907


Comprehensive income


180,663


192,073


328,635


Less: Comprehensive income attributable to noncontrolling interests


691


694


691


Comprehensive income attributable to the Company

$

179,972


$

191,379


$

327,944


See Notes to Consolidated Financial Statements


FIRST AMERICAN FINANCIAL CORPORATION

AND SUBSIDIARY COMPANIES

CONSOLIDATED STATEMENTS OF COMPREHENSIVE INCOMEEQUITY

(in thousands)


   Year Ended December 31, 
   2011  2010  2009 

Net income

  $78,579   $128,956   $134,277  


Other comprehensive income (loss), net of tax:


Unrealized (loss) gain on securities

   (12,316  2,489    51,873  

Unrealized gain on securities for which credit-related portion was recognized in earnings

   2,144    4,820    10,173  

Foreign currency translation adjustment

   (6,167  5,705    31,972  

Pension benefit adjustment

   (12,034  (10,629  20,846  


Total other comprehensive (loss) income, net of tax

   (28,373  2,385    114,864  


Comprehensive income

   50,206    131,341    249,141  

Less: Comprehensive income attributable to noncontrolling interests

   233    5,177    12,788  


Comprehensive income attributable to the Company

  $49,973   $126,164   $236,353  


First American Financial Corporation Stockholders


Shares


Common
stock


Additional
paid-in
capital


Retained
earnings


Accumulated
other
comprehensive
loss


Total
stockholders’
equity


Noncontrolling
interests


Total


Balance at December 31, 2011


105,410


$

1


$

2,081,242


$

124,816


$

(177,459

)


$

2,028,600


$

6,339


$

2,034,939


Net income for 2012


301,041


301,041


687


301,728


Dividends on common shares


(37,612

)


(37,612

)


(37,612

)

Shares issued in connection with share-based compensation plans


1,829


16,270


(1,230

)


15,040


15,040


Share-based compensation expense


14,839


14,839


14,839


Net activity related to noncontrolling interests


(746

)


(746

)


(3,326

)


(4,072

)

Other comprehensive income (Note 19)


26,903


26,903


4


26,907


Balance at December 31, 2012


107,239


1


2,111,605


387,015


(150,556

)


2,348,065


3,704


2,351,769


Net income for 2013


186,367


186,367


697


187,064


Dividends on common shares


(51,324

)


(51,324

)


(51,324

)

Purchase of Company shares

��

(2,951

)


(64,606

)


(64,606

)


(64,606

)

Shares issued in connection with share-based compensation plans


1,612


9,232


(1,294

)


7,938


7,938


Share-based compensation expense


22,301


22,301


22,301


Net activity related to noncontrolling interests


(704

)


(704

)


(1,204

)


(1,908

)

Other comprehensive income (loss) (Note 19)


5,012


5,012


(3

)


5,009


Balance at December 31, 2013


105,900


1


2,077,828


520,764


(145,544

)


2,453,049


3,194


2,456,243


Net income for 2014


233,534


233,534


681


234,215


Dividends on common shares


(89,939

)


(89,939

)


(89,939

)

Shares issued in connection with share-based compensation plans


1,641


12,506


(2,049

)


10,457


10,457


Share-based compensation expense


19,302


19,302


19,302


Net activity related to noncontrolling interests


76


76


(758

)


(682

)

Other comprehensive income (loss) (Note 19)


(53,562

)


(53,562

)


10


(53,552

)

Balance at December 31, 2014


107,541


$

1


$

2,109,712


$

662,310


$

(199,106

)


$

2,572,917


$

3,127


$

2,576,044


See Notes to Consolidated Financial Statements


FIRST AMERICAN FINANCIAL CORPORATION

AND SUBSIDIARY COMPANIES

CONSOLIDATED STATEMENTS OF EQUITYCASH FLOWS

(in thousands)


  First American Financial Corporation Stockholders       
  Shares  Common
stock
  Additional
paid-in
capital
  Retained
earnings
  TFAC’s
invested
equity
  Accumulated
other
comprehensive
loss
  Noncontrolling
interests
  Total 

Balance at December 31, 2008

  —      —      —      —      2,153,296    (261,455  82,424    1,974,265  

Net income for 2009

  —      —      —      —      122,389    —      11,888    134,277  

Sale of subsidiary shares to /other increases in noncontrolling interests

  —      —      —      —      —      —      30,348    30,348  

Purchase of subsidiary shares from /other decreases in noncontrolling interests

  —      —      —      —      26,948    —      (103,131  (76,183

Distributions to noncontrolling interests

  —      —      —      —      —      —      (9,378  (9,378

Dividends to TFAC

  —      —      —      —      (83,000  —      —      (83,000

Other comprehensive income (Note 20)

  —      —      —      —      —      113,964    900    114,864  

Net distributions to TFAC

  —      —      —      —      (52,342  —      —      (52,342


Balance at December 31, 2009

  —      —      —      —      2,167,291    (147,491  13,051    2,032,851  

Net income earned prior to June 1, 2010 separation

  —      —      —      —      36,777    —      147    36,924  

Net contributions from TFAC

  —      —      —      —      2,097    —      —      2,097  

Distribution to TFAC upon separation

  —      —      —      —      (156,570  (22,051  —      (178,621

Capitalization as a result of separation from TFAC

  —      —      2,047,528    —      (2,047,528  —      —      —    

Issuance of common stock at separation

  104,006    1    (1  —      —      —      —      —    

Net income earned following June 1, 2010 separation

  —      —      —      91,052    —      —      980    92,032  

Dividends on common shares

  —      —  ��   —      (18,553  —      —      —      (18,553

Shares issued in connection with restricted stock unit, option and benefit plans

  451    —      2,855    (425  —      —      —      2,430  

Share-based compensation expense

  —      —      6,852    —      —      —      —      6,852  

Purchase of subsidiary shares from /other decreases in noncontrolling interests

  —      —      (136  —      (2,067  —      (3,501  (5,704

Sale of subsidiary shares to /other increases in noncontrolling interests

  —      —      —      —      —      —      110    110  

Distributions to noncontrolling interests

  —      —      —      —      —      —      (1,133  (1,133

Other comprehensive income (Note 20)

  —      —      —      —      —      20,386    4,050    24,436  


Balance at December 31, 2010

  104,457    1    2,057,098    72,074    —      (149,156  13,704    1,993,721  

Net income for 2011

  —      —      —      78,276    —      —      303    78,579  

Contribution from TFAC as a result of separation

  —      —      5,164    —      —      —      —      5,164  

Dividends on common shares

  —      —      —      (24,784  —      —      —      (24,784

Purchase of Company shares

  (204  —      (2,502  —      —      —      —      (2,502

Shares issued in connection with share-based compensation plans

  1,157    —      2,958    (750  —      —      —      2,208  

Share-based compensation expense

  —      —      14,981    —      —      —      —      14,981  

Purchase of subsidiary shares from /other decreases in noncontrolling interests

  —      —      3,543    —      —      —      (7,699  (4,156

Sale of subsidiary shares to /other increases in noncontrolling interests

  —      —      —      —      —      —      436    436  

Distributions to noncontrolling interests

  —      —      —      —      —      —      (335  (335

Other comprehensive income (Note 20)

  —      —      —      —      —      (28,303  (70  (28,373


Balance at December 31, 2011

  105,410   $1   $2,081,242   $124,816   $—     $(177,459 $6,339   $2,034,939  


Year Ended December 31,


2014


2013


2012


CASH FLOWS FROM OPERATING ACTIVITIES:


Net income

$

234,215


$

187,064


$

301,728


Adjustments to reconcile net income to cash provided by operating activities:


Provision for policy losses and other claims


450,023


530,356


397,717


Depreciation and amortization


85,597


74,916


74,950


Amortization of premiums and accretion of discounts on securities, net


24,579


26,782


17,264


Excess tax benefits from share-based compensation


(6,856

)


(6,202

)


(2,372

)

Net realized investment gains


(31,768

)


(9,211

)


(67,686

)

Net other-than-temporary impairment losses


1,701


3,564


Share-based compensation


19,302


22,301


14,839


Equity in earnings of affiliates, net


16,545


(5,316

)


(6,514

)

Dividends from equity method investments


5,002


11,552


11,585


Changes in assets and liabilities excluding effects of acquisitions and noncash transactions:


Claims paid, including assets acquired, net of recoveries


(469,750

)


(479,310

)


(445,986

)

Net change in income tax accounts


45,872


2,589


64,486


(Increase) decrease in accounts and accrued income receivable


(9,950

)


23,645


(29,398

)

(Decrease) increase in accounts payable and accrued liabilities


(15,003

)


5,318


83,979


Increase in deferred revenue


10,333


20,102


14,844


Other, net


795


(26,114

)


(3,325

)

Cash provided by operating activities


360,637


378,472


429,675


CASH FLOWS FROM INVESTING ACTIVITIES:


Net cash effect of acquisitions/dispositions


(163,320

)


(5,837

)


(32,476

)

Net decrease in deposits with banks


4,211


4,747


2,522


Purchases of debt and equity securities


(1,969,009

)


(1,532,710

)


(1,796,314

)

Proceeds from sales of debt and equity securities


928,386


621,255


954,626


Proceeds from maturities of debt securities


373,969


488,684


491,674


Net change in other long-term investments


8,025


6,443


6,591


Net proceeds from sale of loans receivable


42,284


Net paydowns on loans receivable


23,926


33,597


31,839


Capital expenditures


(97,222

)


(87,142

)


(83,892

)

Proceeds from sale of property and equipment


12,058


5,807


7,767


Cash used for investing activities


(836,692

)


(465,156

)


(417,663

)

CASH FLOWS FROM FINANCING ACTIVITIES:


Net change in deposits


647,857


281,739


317,957


Net proceeds from issuance of debt


594,477


249,144


440,065


Repayment of debt


(325,110

)


(168,205

)


(510,544

)

Net activity related to noncontrolling interests


(682

)


(1,894

)


(4,094

)

Excess tax benefits from share-based compensation


6,856


6,202


2,372


Net proceeds in connection with share-based compensation plans


3,601


1,736


12,668


Purchase of Company shares


(64,606

)


Cash dividends


(89,939

)


(51,324

)


(44,705

)

Cash provided by financing activities


837,060


252,792


213,719


Effect of exchange rate changes on cash


(5,762

)


(1,800

)


105


Net increase in cash and cash equivalents


355,243


164,308


225,836


Cash and cash equivalents—Beginning of year


834,837


670,529


444,693


Cash and cash equivalents—End of year

$

1,190,080


$

834,837


$

670,529


SUPPLEMENTAL INFORMATION:


Cash paid during the year for:


Interest

$

17,327


$

10,827


$

8,909


Premium taxes

$

58,148


$

54,629


$

45,375


Income taxes, less refunds of $13,925, $1,329 and $32,269

$

72,028


$

120,313


$

87,324


See Notes to Consolidated Financial Statements


FIRST AMERICAN FINANCIAL CORPORATION

AND SUBSIDIARY COMPANIES

CONSOLIDATED STATEMENTS OF CASH FLOWS

(in thousands)

   Year Ended December 31, 
   2011  2010  2009 

CASH FLOWS FROM OPERATING ACTIVITIES:


Net income

  $78,579   $128,956   $134,277  

Adjustments to reconcile net income to cash provided by operating activities:


Provision for policy losses and other claims

   420,136    320,874    346,714  

Depreciation and amortization

   76,889    80,642    84,212  

Excess tax benefits from share-based compensation

   (1,145  (1,080  (439

Net realized investment losses (gains)

   114    (10,209  (14,637

Net OTTI losses recognized in earnings

   9,068    8,023    39,858  

Share-based compensation

   14,981    15,163    14,563  

Equity in earnings of affiliates

   (8,099  (8,376  (10,877

Dividends from equity method investments

   11,991    8,257    3,911  

Changes in assets and liabilities excluding effects of acquisitions and noncash transactions:


Claims paid, including assets acquired, net of recoveries

   (503,434  (456,225  (452,187

Net change in income tax accounts

   21,856    60,290    58,437  

Decrease in accounts and accrued income receivable

   5,367    4,730    12,355  

Increase (decrease) in accounts payable and accrued liabilities

   (32,073  5,890    52,620  

Net change in due to CoreLogic/TFAC

   18,595    (11,392  49,589  

Increase (decrease) in deferred revenue

   10,907    (1,802  (3,317

Other, net

   10,088    11,802    (81,492


Cash provided by operating activities

   133,820    155,543    233,587  


CASH FLOWS FROM INVESTING ACTIVITIES:


Net cash effect of acquisitions/dispositions

   (2,706  (12,145  22,350  

Purchase of subsidiary shares from/other decreases in noncontrolling interests

   (4,156  (3,746  (103,131

Sale of subsidiary shares to/other increases in noncontrolling interests

   —      110    30,348  

Net decrease in deposits with banks

   3,773    16,092    113,974  

Purchases of debt and equity securities

   (1,005,804  (1,532,801  (939,229

Proceeds from sales of debt and equity securities

   672,095    699,342    418,552  

Proceeds from maturities of debt securities

   322,009    597,838    478,870  

Proceeds from redemption of Company owned life insurance

   —      19,602    —    

Net decrease (increase) in other long-term investments

   3,860    13,429    (30,717

Proceeds from notes receivable from CoreLogic/TFAC

   18,787    2,830    4,809  

Origination and purchases of loans and participations

   (13,534  (9,090  (23,729

Net decrease in loans receivable after originations and others

   35,869    9,461    13,524  

Capital expenditures

   (69,797  (88,725  (42,304

Proceeds from sale of property and equipment

   9,345    8,832    12,018  


Cash used for investing activities

   (30,259  (278,971  (44,665


CASH FLOWS FROM FINANCING ACTIVITIES:


Net change in deposits

   (389,320  328,983    (144,647

Proceeds from issuance of debt

   24,185    213,462    8,057  

Proceeds from issuance of note payable to TFAC

   —      29,087    —    

Repayment of debt

   (23,117  (40,958  (52,747

Repayment of debt to TFAC

   —      (169,572  —    

Distributions to noncontrolling interests

   (335  (1,133  (9,378

Excess tax benefits from share-based compensation

   1,145    1,080    439  

Net proceeds from shares issued in connection with restricted stock unit, option and benefit plans

   1,152    2,430    —    

Dividends paid to TFAC

   —      —      (83,000

Purchase of Company shares

   (2,502  —      —    

Cash dividends

   (25,216  (12,502  —    

Cash distribution to TFAC upon separation

   —      (130,000  —    


Cash provided by (used for) financing activities

   (414,008  220,877    (281,276


Net (decrease) increase in cash and cash equivalents

   (310,447  97,449    (92,354

Cash and cash equivalents—Beginning of year

   728,746    631,297    723,651  


Cash and cash equivalents—End of year

  $418,299   $728,746   $631,297  


SUPPLEMENTAL INFORMATION:


Cash paid during the year for:


Interest

  $12,631   $16,717   $10,876  

Premium taxes

  $38,136   $41,060   $33,520  

Income taxes, net

  $23,862   $21,771   $25,036  

Noncash investing and financing activities:


Liabilities assumed in connection with acquisitions

  $2,450   $1,100   $2,215  

Net noncash contribution from (distribution to) TFAC upon separation

  $5,164   $2,097   $(52,342

Net noncash capital contribution from TFAC

  $—     $(26,570 $—    

See Notes to Consolidated Financial Statements

FIRST AMERICAN FINANCIAL CORPORATION

AND SUBSIDIARY COMPANIES

NOTES TO CONSOLIDATED FINANCIAL STATEMENTS


NOTE 1.    Description of the Company:

Description of the Company:

First American Financial Corporation (the “Company”), through its subsidiaries, is engaged in the business of providing financial services. The Company consists of the following reportable segments and a corporate function:

·

The Company’s title insurance and services segment issues title insurance policies on residential and commercial property in the United States and offers similar or related products and services internationally. This segment also provides closing and/or escrow services; accommodates tax-deferred exchanges of real estate; provides products, services and solutions involving the use of real property related data designed to mitigate risk or otherwise facilitate real estate transactions; maintains, manages and provides access to title plant records and images; and provides banking, trust and investment advisory services. The Company, through its principal title insurance subsidiary and such subsidiary’s affiliates, transacts its title insurance business through a network of direct operations and agents. Through this network, the Company issues policies in the 49 states that permit the issuance of title insurance policies and the District of Columbia. The Company also offers title insurance and other insurance and guarantee products, as well as related settlement services segment issues title insurance policies on residential and commercial property in the United States and offers similar products and services internationally. This segment also provides closing and/or escrow services, accommodates tax-deferred exchanges of real estate, maintains, manages and provides access to title plant records and images and provides banking, trust and investment advisory services. The Company, through its principal title insurance subsidiary and such subsidiary’s affiliates, transacts its title insurance business through a network of direct operations and agents. Through this network, the Company issues policies in the 49 states that permit the issuance of title insurance policies and the District of Columbia. The Company also offers title insurance and other insurance and guarantee products, as well as similar or related products and services, either directly or through joint ventures in foreign countries, including Canada, the United Kingdom, Australia and various other established and emerging markets.

The Company’s specialty insurance segment issues property and casualty insurance policies and sells home warranty products. The property and casualty insurance business provides insurance coverage to residential homeowners and renters for liability losses and typical hazards such as fire, theft, vandalism and other types of property damage. This business is licensed to issue policies in all 50 states and actively issues policies in 43 states. In its largest market, California,

·

The Company’s specialty insurance segment issues property and casualty insurance policies and sells home warranty products. The property and casualty insurance business provides insurance coverage to residential homeowners and renters for liability losses and typical hazards such as fire, theft, vandalism and other types of property damage. This business is licensed to issue policies in all 50 states and the District of Columbia and actively issues policies in 46 states. In certain markets it also offers preferred risk auto insurance to better compete with other carriers offering bundled home and auto insurance. The home warranty business provides residential service contracts that cover residential systems, such as heating and air conditioning systems, and certain appliances against failures that occur as the result of normal usage during the coverage period. This business currently operates in 39 states and the District of Columbia.

The corporate function consists primarily of certain financing facilities as well as the corporate services that support the Company’s business operations.

Spin-off

The Company became a publicly traded company following its spin-off from its prior parent, The First American Corporation (“TFAC”) on June 1, 2010 (the “Separation”). On that date, TFAC distributed all of the Company’s outstanding shares to the record date shareholders of TFAC on a one-for-one basis (the “Distribution”). After the Distribution, the Company owns TFAC’s financial services businesses and TFAC, which reincorporated and assumed the name CoreLogic, Inc. (“CoreLogic”), continuescontinued to own its information solutions businesses. The Company’s common stock trades on the New York Stock Exchange under the “FAF” ticker symbol and CoreLogic’s common stock trades on the New York Stock Exchange under the ticker symbol “CLGX.”

To effect the Separation, TFAC and the Company entered into a Separation and Distribution Agreement (the “Separation and Distribution Agreement”) that governs the rights and obligations of the Company and CoreLogic regarding the Distribution. It also governs the relationship between the Company and CoreLogic subsequent to the completion of the Separation and provides for the allocation between the Company and CoreLogic of TFAC’s assets and liabilities. The Separation and Distribution Agreement identifies assets, liabilities and contracts that were allocated between CoreLogic and the Company as part of the Separation and describes the

FIRST AMERICAN FINANCIAL CORPORATION

AND SUBSIDIARY COMPANIES

NOTES TO CONSOLIDATED FINANCIAL STATEMENTS—(Continued)

transfers, assumptions and assignments of these assets, liabilities and contracts. In particular, the Separation and Distribution Agreement provides that, subject to the terms and conditions contained therein:

All of the assets and liabilities primarily related to the Company’s business—primarily the business and operations of TFAC’s title insurance and services segment and specialty insurance segment—have been retained by or transferred to the Company;

All of the assets and liabilities primarily related to CoreLogic’s business—primarily the business and operations of TFAC’s data and analytic solutions, information and outsourcing solutions and risk mitigation and business solutions segments—have been retained by or transferred to CoreLogic;

On the record date for the Distribution, TFAC issued to the Company and its principal title insurance subsidiary, First American Title Insurance Company (“FATICO”) a number of shares of its common stock that resulted in the Company and FATICO collectively owning 12.9 million shares of CoreLogic’s common stock immediately following the Separation, some of which have subsequently been sold. See Note 19 Transactions with CoreLogic/TFAC to the consolidated financial statements for further discussion of the CoreLogic stock;

The Company effectively assumed $200.0 million of the outstanding liability for indebtedness under TFAC’s senior secured credit facility through the Company’s borrowing and transferring to CoreLogic of $200.0 million under the Company’s credit facility in connection with the Separation. See Note 10 Notes and Contracts Payable to the consolidated financial statements for further discussion of the Company’s credit facility.

The Separation resulted in a net distribution from the Company to TFAC of $151.4 million. In connection with such distribution, the Company assumed $22.1 million of accumulated other comprehensive loss, net of tax, which was primarily related to the Company’s assumption of the unfunded portion of the defined benefit pension obligation associated with participants who were employees of the businesses retained by CoreLogic. See Note 14 Employee Benefit Plans to the consolidated financial statements for additional discussion of the defined benefit pension plan.

Significant Accounting Policies:

Principles of Consolidation

The consolidated financial statements have been prepared in accordance with generally accepted accounting principles and reflect the consolidated operations of the Company as a separate, stand-alone publicly traded company subsequent to June 1, 2010.Company. The consolidated financial statements include the accounts of First American Financial Corporation and all controlled subsidiaries. All significant intercompany transactions and balances have been eliminated. Investments in which the Company exercises significant influence, but does not control and is not the primary beneficiary, are accounted for using the equity method. Investments in which the Company does not exercise significant influence over the investee are accounted for under the cost method.

Principles of CombinationReclassifications, revisions and Basis of Presentation

The Company’s historical financial statements prior to June 1, 2010 have been prepared in accordance with generally accepted accounting principles and have been derived from the consolidated financial statements of TFAC and represent carve-out stand-alone combined financial statements. The combined financial statements prior to June 1, 2010 include items attributable to the Company and allocations of general corporate expenses from TFAC.

FIRST AMERICAN FINANCIAL CORPORATION

AND SUBSIDIARY COMPANIES

NOTES TO CONSOLIDATED FINANCIAL STATEMENTS—(Continued)

The Company’s historical financial statements prior to June 1, 2010 include assets, liabilities, revenues and expenses directly attributable to the Company’s operations. The Company’s historical financial statements prior to June 1, 2010 reflect allocations of corporate expenses from TFAC for certain functions provided by TFAC, including, but not limited to, general corporate expenses related to finance, legal, information technology, human resources, communications, compliance, facilities, procurement, employee benefits, and share-based compensation. These expenses have been allocated to the Company on the basis of direct usage when identifiable, with the remainder allocated on the basis of net revenue, domestic headcount or assets or a combination of such drivers. The Company considers the basis on which the expenses have been allocated to be a reasonable reflection of the utilization of services provided to or the benefit received by the Company during the periods presented. The Company’s historical financial statements prior to June 1, 2010 do not reflect the debt or interest expense it might have incurred if it had been a stand-alone entity. In addition, the Company expects to incur other expenses, not reflected in its historical financial statements prior to June 1, 2010, as a result of being a separate publicly traded company. As a result, the Company’s historical financial statements prior to June 1, 2010 do not necessarily reflect what its financial position or results of operations would have been if it had been operated as a stand-alone public entity during the periods covered prior to June 1, 2010, and may not be indicative of the Company’s future results of operations and financial position.

Reclassification

out-of-period adjustments

Certain 20092012 and 20102013 amounts have been reclassified to conform to the 20112014 presentation.

The consolidated balance sheet as of December 31, 2013 was revised for an error which resulted in an adjustment between income taxes receivable and deferred income taxes. The adjustment resulted in an increase to income taxes

55


FIRST AMERICAN FINANCIAL CORPORATION

AND SUBSIDIARY COMPANIES

NOTES TO CONSOLIDATED FINANCIAL STATEMENTS—(Continued)


receivable of $11.1 million, an increase in deferred income tax assets of $27.5 million and an increase in deferred income tax liabilities of $38.6 million.

During 2014, the Company identified and recorded adjustments to correct for certain errors in foreign currency translation and transactions in prior periods.  These adjustments resulted in an increase to other operating expenses of $5.0 million.

The Company does not consider these adjustments to be material, individually or in the aggregate, to either the current year or any previously issued consolidated financial statements.

Use of estimates

The preparation of financial statements in accordance with generally accepted accounting principles requires management to make estimates and assumptions that affect the statements. Actual results could differ from the estimates and assumptions used.

Cash and cash equivalents

The Company considers cash equivalents to be all short-term investments that have an initial maturity of 90 days or less and are not restricted for statutory deposit or premium reserve requirements.

Accounts and accrued income receivable

Accounts and accrued income receivable are generally due within thirty days and are recorded net of an allowance for doubtful accounts. We consider accounts outstanding longer than the contractual payment terms as past due. We determine our allowance by considering a number of factors, including the length of time trade accounts receivable are past due, previous loss history, a specific customer’s ability to pay its obligations to us, and the condition of the general economy and industry as a whole. Amounts are charged off in the period they are deemed to be uncollectible.

Investments

Deposits with savings and loan associations and banks are short-term investments with initial maturities of generally more than 90 days.

Debt securities are carried at fair value and consist primarily of investments in obligations of the United States Treasury, various corporations, certain state and political subdivisions and mortgage-backed securities.

FIRST AMERICAN FINANCIAL CORPORATION

AND SUBSIDIARY COMPANIES

NOTES TO CONSOLIDATED FINANCIAL STATEMENTS—(Continued)

The Company maintains investments in debt securities in accordance with certain statutory requirements for the funding of statutory premium reserves and state deposits. At December 31, 20112014 and 2010,2013, the fair value of such investments totaled $149.9$120.7 million and $134.6$124.0 million, respectively. See Note 2 Statutory Restrictions on Investments and Stockholders’ Equity to the consolidated financial statements for additional discussion of the Company’s statutory restrictions.

Equity securities are carried at fair value and consist primarily of investments in exchange traded funds, mutual funds and marketable common and preferred stocks of corporate entities.

The Company classifies its publicly traded debt and equity securities as available-for-sale and carries them at fair value with unrealized gains or losses classified as a component of accumulated other comprehensive loss. See Note 3 Debt and Equity Securities to the consolidated financial statements15 Fair Value Measurements for additional discussion of the Company’s accounting policies pertaining todetermination of fair value. Interest income, as well as the related amortization of premium and accretion of discount, on debt securities is recognized under the effective yield method and included in the accompanying consolidated statements of income in net investment income. Realized gains and losses on sales of debt and equity securities are determined on a first-in, first-out basis.

56


FIRST AMERICAN FINANCIAL CORPORATION

AND SUBSIDIARY COMPANIES

NOTES TO CONSOLIDATED FINANCIAL STATEMENTS—(Continued)

The Company evaluates its debt and equity securities includingwith unrealized losses on a quarterly basis for potential other-than-temporary impairments in value.

If the Company intends to sell a debt security in an unrealized loss position or determines that it is more likely than not that the Company will be required to sell a debt security before it recovers its amortized cost basis, the debt security is other-than-temporarily impaired and it is written down to fair value with all losses recognized in earnings. As of December 31, 2014, the Company did not intend to sell any debt securities in an unrealized loss position and it is not more likely than not that the Company will be required to sell debt securities before recovery of their amortized cost basis.

If the Company does not expect to recover the amortized cost basis of a debt security with declines in fair value (even if the Company does not intend to sell the debt security and it is not more likely than not that the Company will be required to sell the debt security), the losses the Company considers to be the credit portion of the other-than-temporary impairment loss (“credit loss”) is recognized in earnings and the non-credit portion is recognized in other comprehensive income. The credit loss is the difference between the present value of the cash flows expected to be collected and the amortized cost basis of the debt security. The cash flows expected to be collected are discounted at the rate implicit in the security immediately prior to the recognition of the other-than-temporary impairment.

Expected future cash flows for debt securities are based on qualitative and quantitative factors specific to each security, including the probability of default and the estimated timing and amount of recovery. The detailed inputs used to project expected future cash flows may be different depending on the nature of the individual debt security.

The Company determines if a non-agency mortgage-backed security in a loss position is other-than-temporarily impaired by comparing the present value of the cash flows expected to be collected from the security to its amortized cost basis. If the present value of the cash flows expected to be collected exceed the amortized cost of the security, the Company concludes that the security is not other-than-temporarily impaired. The Company performs this analysis on all non-agency mortgage-backed securities in its portfolio that are in an unrealized loss position. For the securities that were determined not to be other-than-temporarily impaired at December 31, 2014, the present value of the cash flows expected to be collected exceeded the amortized cost of each security.

Cash flows expected to be collected for each non-agency mortgage-backed security are estimated by analyzing loan-level detail to estimate future cash flows from the underlying assets, which are then applied to the security based on the underlying contractual provisions of the securitization trust that issued the security (e.g., subordination levels, remaining payment terms, etc.). The Company uses third-party software to determine how the underlying collateral cash flows will be distributed to each security issued from the securitization trust. The primary assumptions used in estimating future collateral cash flows are prepayment speeds, default rates and loss severity. In developing these assumptions, the Company considers the financial condition of the borrower, loan to value ratio, loan type and geographical location of the underlying property. The Company utilizes publicly available information related to specific assets, generally available market data such as forward interest rate curves and securities, loans and property data and market analytics tools provided through a third party.

The table below summarizes the primary assumptions used at December 31, 2014 in estimating the cash flows expected to be collected for these securities.


Weighted 

average


Range


Prepayment speeds


10.0

%


8.8

%

14.0

%

Default rates


2.5

%


1.8

%

3.7

%

Loss severity


18.7

%


3.6

%

28.5

%

As a result of the Company’s security-level review, the Company recognized $1.7 million and $3.6 million of other-than-temporary impairments considered to be credit related on its non-agency mortgage-backed securities in earnings for the years ended December 31, 2014 and 2012, respectively. The Company did not recognize any other-than-temporary impairments considered to be credit related in 2013. It is possible that the Company could recognize additional other-than-temporary impairment losses on securities it owns at December 31, 2014 if future events or information cause it to determine that a decline in fair value measurement.is other-than-temporary.

57


FIRST AMERICAN FINANCIAL CORPORATION

AND SUBSIDIARY COMPANIES

NOTES TO CONSOLIDATED FINANCIAL STATEMENTS—(Continued)


The following table presents the change in the credit portion of the other-than-temporary impairments recognized in earnings on debt securities for which a portion of the other-than-temporary impairments related to other factors was recognized in other comprehensive income (loss) for the years ended December 31, 2014, 2013, and 2012.


December 31,


2014


2013


2012


(in thousands)


Cumulative credit loss on debt securities held at beginning of period

$

16,478


$

16,478


$

33,656


Addition to credit loss for which an other-than-temporary impairment was previously recognized


1,701


3,564


Accumulated losses on securities that matured or were sold during the year


(20,742

)

Cumulative credit loss on debt securities held at end of period

$

18,179


$

16,478


$

16,478


When a decline in the fair value of an equity security, including common and preferred stock, is considered to be other-than-temporary, such equity security is written down to its fair value. When assessing if a decline in fair value is other-than-temporary, the factors considered include the length of time and extent to which fair value has been below cost, the probability that the Company will be unable to collect all amounts due under the contractual terms of the security, the seniority of the securities, issuer-specific news and other developments, the financial condition and prospects of the issuer (including credit ratings), macro-economic changes (including the outlook for industry sectors, which includes government policy initiatives) and the Company’s ability and intent to hold the security for a period of time sufficient to allow for any anticipated recovery.

When an equity security has been in an unrealized loss position for greater than twelve months, the Company’s review of the security includes the above noted factors as well as other evidence that might exist supporting the view that the security will recover its value in the foreseeable future, typically within the next twelve months. If objective, substantial evidence does not indicate a likely recovery during that timeframe, the Company’s policy is that such losses are considered other-than-temporary and therefore an impairment loss is recorded. The Company did not record other-than-temporary impairment losses related to its equity securities for the years ended December 31, 2014, 2013 and 2012.

Other long-term investments consist primarily of investments in affiliates, which are accounted for under either the equity method of accounting or the cost method of accounting, investments in real estate and notes receivable. For the year ended December 31, 2011, the Company recognized $8.6 millionThe carrying value of impairment losses on other long-term investments, including $6.3 million related to investments in affiliates and $2.3 million relatedis written down, or impaired, to notes receivable. For the year ended December 31, 2010, the Company recognized $3.9 million of impairment losses on other long-term investments, including $3.2 million relatedfair value when a decline in value is considered to a note receivable and $0.7 million related to other investments. For the year ended December 31, 2009, the Company recognized a $2.2 million impairment loss on a note receivable.be other-than-temporary. In making the determination as to whether an individual investment in an affiliate was impaired, the Company assessed the then-current and expected financial condition of each relevant entity, including, but not limited to, the anticipated ability of the entity to make its contractually required payments to the Company (with respect to debt obligations to us)the Company), the results of valuation work performed with respect to the entity, the entity’s anticipated ability to generate sufficient cash flows and the market conditions in the industry in which the entity was operating. The Company recognized impairment losses on equity method investments in affiliates of $22.5 million, 7.8 million and $7.1 million for the years ended December 31, 2014, 2013 and 2012, respectively.

Investments in real estate are classified as held for sale and carried at the lower of cost or fair value less estimated selling costs.  An impairment loss is recognized when the carrying value exceeds the estimated undiscounted future cash flows from the investment.

LoansNotes receivable

The performance are carried at cost less reserves for losses. Loss reserves are established for notes receivable based upon an estimate of probable losses for the Company’s loan portfolioindividual notes. A loss reserve is evaluatedestablished on an ongoing basis by management. Loans receivable are impairedindividual note when based on current information and events, it is deemed probable that the Company will be unable to collect all amounts due according to the contractual terms of the loan agreement. Impaired loans receivable are measured at the present value of expected future cash flows discounted at the loan’s effective interest rate. As a practical expedient, the loan may be valued based on its observable market price or the fair value of the collateral, if the loan is collateral-dependent. No indications of material impairment of loans receivable were identified during the three-year period ended December 31, 2011.

Loans, including impaired loans, are generally classified as nonaccrual if they miss more than three contractual payments, which usually represent past due between 60 to 90 days or more. Loans that are on a current payment status or miss 1 or 2 contractual payments may also be classified as nonaccrual if they are classified by the regulators in an examination, and the circumstances have not improved. The Company’s general policy is to reverse from income previously accrued but unpaid interest. While a loan is classified as nonaccrual and the future collectability of the recorded loan balance is doubtful, collections of interest and principal are generally applied as a reduction to principal outstanding. Income on such loans is subsequently recognized only to the extent that cash is received and future collection of principal is probable. Loans may be returned to accrual status when all principal and interest amounts contractually due (including arrearages) are reasonably assured of

FIRST AMERICAN FINANCIAL CORPORATION

AND SUBSIDIARY COMPANIES

NOTES TO CONSOLIDATED FINANCIAL STATEMENTS—(Continued)

repayment within an acceptable period of time, in accordance with the contractual terms of interestthe note. The loss reserve is based upon the Company’s assessment of the borrower’s overall financial condition, resources and principal. Interest incomepayment record; and, if appropriate, the realizable value of any collateral. These estimates consider all available evidence including the expected future cash flows, estimated fair value of collateral on secured notes, general economic conditions and

58


FIRST AMERICAN FINANCIAL CORPORATION

AND SUBSIDIARY COMPANIES

NOTES TO CONSOLIDATED FINANCIAL STATEMENTS—(Continued)

trends, and other relevant factors, as appropriate. Notes are placed on non-accrual loansstatus when management determines that would have been recognized during the years ended December 31, 2011, 2010 and 2009, if allcollectibility of such loans had been current in accordance with their original terms, totaled $163 thousand, $113 thousand, and $12 thousand, respectively.contractual amounts is not reasonably assured.

The allowance for loan losses is established through charges to earnings in the form of provision for loan losses. Loan losses are charged to, and recoveries are credited to, the allowance for loan losses. The provision for loan losses is determined after considering various factors, such as loan loss experience, maturity of the portfolio, size of the portfolio, borrower credit history, the existing allowance for loan losses, current charges and recoveries to the allowance for loan losses, the overall quality of the loan portfolio, and current economic conditions, as determined by management, regulatory agencies and independent credit review specialists. While many of these factors are essentially a matter of judgment and may not be reduced to a mathematical formula, the Company believes that, in light of the collateral securing its loan portfolio, the current allowance for loan losses is an adequate allowance against foreseeable losses.

The adequacy of the allowance for loan losses is based on formula allocations and specific allocations. Formula allocations are made on a percentage basis, which is dependent on the underlying collateral, the type of loan and general economic conditions. Specific allocations are made as problem or potential problem loans are identified and are based upon an evaluation by management of the status of such loans. Specific allocations may be revised from time to time as the status of problem or potential problem loans changes.

Property and equipment

Property and equipment includes computer software acquired or developed for internal use and for use with the Company’s products. Software development costs, which include capitalized interest costs and certain payroll-related costs of employees directly associated with developing software, in addition to incremental payments to third parties, are capitalized from the time technological feasibility is established until the software is ready for use.

Management uses estimated future cash flows (undiscounted and excluding interest) to measure the recoverability of property and equipment whenever events or changes in circumstances indicate that the carrying value may not be fully recoverable. If the undiscounted cash flow analysis indicates that the carrying amount is not recoverable, an impairment loss is recorded for the excess of the carrying amount over its fair value.

Depreciation on buildings and on furniture and equipment is computed using the straight-line method over estimated useful lives of 255 to 40 years and 31 to 1015 years, respectively. Capitalized software costs are amortized using the straight-line method over estimated useful lives of 31 to 15 years. Leasehold improvements are amortized over useful lives that are consistent with the lease term.

Title plants and other indexes

Title plants and other indexes includesat December 31, 2014 included title plants of $512.6$514.6 million and capitalized real estate data net of $1.4$16.0 million, and at December 31, 2011 and2013 included title plants of $502.9$523.1 million and capitalized real estate data net of $1.7 million at December 31, 2010.$0.8 million. Title plants are carried at original cost, with the costs of daily maintenance (updating) charged to expense as incurred. Because properly maintained title plants have indefinite lives and do not diminish in value with the passage of time, no provision has been made for depreciation or amortization. The Company analyzes its title plants at least annually for impairment. This analysis includes, but is not limited to, the effects of obsolescence, duplication, demand and other economic factors. Capitalized real estate data is carried at cost, less amortization. Capitalized real estate data is amortized using the straight-line method over estimated useful lives of 53 to 15 years.

Business Combinations

Amounts paid for acquisitions are allocated to the tangible assets acquired, liabilities assumed and intangible assets acquired based on their estimated fair value at the date of acquisition. GoodwillThe excess of the fair value of purchase consideration over the fair values of these identifiable assets and liabilities is recorded as goodwill

. Acquisition-related costs are expensed in the periods in which the costs are incurred. The results of operations of acquired businesses are included in the consolidated financial statements from the date of acquisition.

Goodwill is tested at least annually for impairment. Impairment

The Company performs theis required to perform an annual goodwill impairment testassessment for each reporting unit. The Company’s four reporting units are title insurance, home warranty, property and casualty insurance and trust and other services. The Company has elected to perform this annual assessment in the fourth quarter using September 30of each fiscal year or sooner if circumstances indicate possible impairment. Based on current guidance, the Company has the option to perform a qualitative assessment to determine if the fair value is more likely than not (i.e., a likelihood of greater than 50%) less than the carrying amount as a basis for determining whether it is necessary to perform a quantitative impairment test, or may choose to forego the annual valuation datequalitative assessment and perform the quantitative impairment test. The qualitative factors considered in this assessment may include macroeconomic conditions, industry and market considerations, overall financial performance as well as other relevant events and circumstances as determined by the Company. The Company evaluates the weight of each factor to determine whether it is more likely than not that impairment may exist. If the results of the qualitative assessment indicate the more likely than not threshold was not met, the Company may choose not to perform the quantitative impairment test. If, however, the more likely than not threshold is met, the Company performs the quantitative test goodwill for impairment.as required and discussed below.

59


FIRST AMERICAN FINANCIAL CORPORATION

AND SUBSIDIARY COMPANIES

NOTES TO CONSOLIDATED FINANCIAL STATEMENTS—(Continued)


Management’s quantitative impairment testing process includes two steps. The first step (“Step 1”) compares the fair value of each reporting unit to its book value.carrying amount. The fair value of each reporting unit is determined by using discounted cash flow analysis and market approach valuations. If the fair value of the reporting unit exceeds its book value,carrying amount, the goodwill is not considered impaired and no additional analysis is required. However, if the book valuecarrying amount is greater than the fair value, a second step (“Step 2”) must be completed to determine if the fair value of the goodwill exceeds the book valuecarrying amount of the goodwill.

Step 2 involves calculating an implied fair value of goodwill for each reporting unit for which the first stepStep 1 indicated impairment. The implied fair value of goodwill is determined in a manner similar to the amount of goodwill calculated in a business combination, by measuring the excess of the estimated fair value of the reporting unit, as determined in the first step,Step 1, over the aggregate estimated fair values of the individual assets, liabilities and identifiable intangibles as if the reporting unit was being acquired in a business combination. If the implied fair value of goodwill exceeds the carrying value of goodwill assigned to the reporting unit, there is no impairment. If the carrying value of goodwill assigned to a reporting unit exceeds the implied fair value of the goodwill, an impairment loss is recorded for the excess. An impairment loss cannot exceed the carrying value of goodwill assigned to a reporting unit, and the loss establishes a new basis in the goodwill. Subsequent reversal of goodwill impairment losses is not permitted.

The quantitative impairment test for goodwill utilizes a variety of valuation techniques, all of which require the Company to make estimates and judgments. Fair value is determined by employing an expected present value technique, which utilizes multiple cash flow scenarios that reflect a range of possible outcomes and an appropriate discount rate. The use of comparative market multiples (the “market approach”) compares the reporting unit to other comparable companies (if such comparables are present in the marketplace) based on valuation multiples to arrive at a fair value. In assessing the fair value, the Company utilizes the results of the valuations (including the market approach to the extent comparables are available) and considers the range of fair values determined under all methods and the extent to which the fair value exceeds the carrying amount of the equity or asset.

The valuation of goodwill requireseach reporting unit includes the use of assumptions and estimates of many critical factors, including revenue growth rates and operating margins, discount rates and future market conditions, determination of market multiples and the establishment of a control premium, among others. Forecasts of future operations are based, in part, on operating results and management’sthe Company’s expectations as to future market conditions. These types of analyses contain uncertainties because they require managementthe Company to make assumptions and to apply judgments to estimate industry economic factors and the profitability of future business strategies. However, if actual results are not consistent with the Company’s estimates and assumptions, the Company may be exposed to future goodwill impairment losses that could be material.

The Company elected to perform qualitative assessments for 2014 and 2013, the results of which supported the conclusion that the fair values of the Company’s reporting units were not more likely than not less than their carrying amounts and, therefore, a quantitative assessment was not considered necessary.  For 2012, the Company performed a quantitative assessment and determined that the fair values of its reporting units exceeded their carrying amounts and, therefore, no additional analysis was required.  As a result of these assessments, the Company did not record any goodwill impairment losses for 2014, 2013 or 2012.

Other intangible assets

The Company’s intangible assets consist of covenants not to compete,noncompete agreements, customer lists,relationships, trademarks, patents and licenses. Each of these intangible assets, excluding licenses, is amortized on a straight-line basis over theirits useful liveslife ranging from 21 to 20 years and is subject to impairment testsassessments when there is an indication of a triggering event or abandonment. Licenses are an intangible asset with an indefinite life and are therefore not amortized but rather testedassessed for impairment by comparing the fair value of the license with its carrying value at least annually and when an indicator of potential impairment has occurred.

Impairment of long-lived assets

Long-lived assets held and used include property and equipment, capitalized software and other intangible assets with a finite life. Management uses estimated future cash flows (undiscounted and excluding interest) to measure the recoverability of long-livedintangible assets held and usedwith finite lives, whenever events or changes in circumstances indicate that the carrying value of an asset may not be fully recoverable. If the undiscounted cash flow analysis indicates a long-lived assetthat the carrying amount is not recoverable, thean impairment loss is recorded isfor the excess of the carrying amount of the asset over its fair value.

60


In addition, the Company carries long-lived assets held for sale at the lower of cost or market as of the date that certain criteria have been met. As of December 31, 2011 and 2010 no long-lived assets were classified as held for sale.

FIRST AMERICAN FINANCIAL CORPORATION

AND SUBSIDIARY COMPANIES

NOTES TO CONSOLIDATED FINANCIAL STATEMENTS—(Continued)


Reserve for known and incurred but not reported claims

The Company provides for title insurance losses by a charge to expense when the related premium revenue is recognized. The amount charged to expense is generally determined by applying a rate (the loss provision rate) to total title insurance premiums and escrow fees. The Company’s management estimates the loss provision rate at the beginning of each year and reassesses the rate quarterly to ensure that the resulting incurred but not reported (“IBNR”) loss reserve and known claims reserve included in the Company’s consolidated balance sheets together reflect management’s best estimate of the total costs required to settle all IBNR and known claims. If the ending IBNR reserve is not considered adequate, an adjustment is recorded.

The process of assessing the loss provision rate and the resulting IBNR reserve involves evaluation of the results of both an in-house actuarial review and independent actuarial analysis.review. The Company’s in-house actuary performs a reserve analysis utilizing generally accepted actuarial methods that incorporate cumulative historical claims experience and information provided by in-house claims and operations personnel. Current economic and business trends are also reviewed and used in the reserve analysis. These include real estate and mortgage markets conditions, changes in residential and commercial real estate values, and changes in the levels of defaults and foreclosures that may affect claims levels and patterns of emergence, as well as any company-specific factors that may be relevant to past and future claims experience. Results from the analysis include, but are not limited to, a range of IBNR reserve estimates and a single point estimate for IBNR as of the balance sheet date.

For recent policy years at early stages of development (generally the last three years), IBNR is estimated using a combination of expected loss rate and multiplicative loss development factor calculations. For more mature policy years, IBNR generally is estimated using multiplicative loss development factor calculations. The expected loss rate method estimates IBNR by applying an expected loss rate to total title insurance premiums and escrow fees, and adjusting for policy year maturity using the estimated loss development patterns. Multiplicative loss development factor calculations estimate IBNR by applying factors derived from loss development patterns to losses realized to date. The expected loss rate and loss development patterns are based on historical experience and the relationship of the history to the applicable policy years. This is a generally accepted actuarial method of determining IBNR for policy years at early development ages. IBNR calculated in this way differs from the IBNR a multiplicative loss development factor calculation would produce. Factor-based development effectively extrapolates results to date forward through the lifetime of the policy year’s development.

For more mature policy years (generally, policy years aged more than three years), IBNR is estimated using multiplicative loss development factor calculations. These years were exposed to adverse economic conditions during 2007 through 2011 that may have resulted in acceleration of claims and one-time losses. The possible extrapolation of these losses to future development periods by using factors was considered. The impact of economic conditions during 2007 through 2011 is believed to account for a much less significant portion of losses on policy years 2004 and prior than on more recent policy years. Policy years 2004 and prior were at relatively mature ages when the adverse development period began in 2007, and much of their losses had already been incurred by then. In addition, the loss development factors for policy years 2004 and prior are low enough that the potential for over-extrapolation is limited to an acceptable level.

The Company utilizes an independent third party actuary who produces a report with estimates and projections of the same financial items described above. The third party actuary’s analysis uses generally accepted actuarial methods that may in whole or in part be different from those used by the in-house actuary. The third party actuary’s report is used to assess the reasonableness of the in-house analysis.

The Company’s management uses the IBNR point estimate from the in-house actuary’s analysis and other relevant information it may have concerning claims to determine what it considers to be the best estimate of the total amount required for the IBNR reserve.

FIRST AMERICAN FINANCIAL CORPORATION

AND SUBSIDIARY COMPANIES

NOTES TO CONSOLIDATED FINANCIAL STATEMENTS—(Continued)

Title insurance policies are long-duration contracts with the majority of the claims reported to the Company within the first few years following the issuance of the policy. Generally, 7570% to 85 percent80% of claim amounts become known in the first six years of the policy life, and the majority of IBNR reserves relate to the six most recent policy years. A material change in expected ultimate losses and corresponding loss rates for policy years older than six years, while possible, is not considered reasonably likely by the Company. However, changesChanges in expected ultimate losses and corresponding loss rates for recent policy years are considered likely and could result in a material adjustment to the IBNR reserves. Based on historical experience, the Companymanagement believes that a 50 basis point change to one or more of the loss rates for the most recent policy years, positive or negative, is reasonably likely given the long duration nature of a title insurance policy. IfFor example, if the expected ultimate losses for each of the last six policy years increased or decreased by 50 basis points, the resulting impact on the Company’s IBNR reserve would be an increase or decrease, as the case may be, of $120.4$98.7 million. A material change in expected ultimate losses and corresponding loss rates for older policy years is also possible, particularly for policy years with loss ratios exceeding historical norms. The estimates made by management in determining the appropriate level of IBNR reserves could ultimately prove to be inaccurate andmaterially different from actual claims experience may vary from expected claims experience.

The Company provides for property and casualty insurance losses when the insured event occurs. The Company provides for claims losses relating to its home warranty business based on the average cost per claim as applied to the total of new claims incurred. The average cost per home warranty claim is calculated using the average of the most recent 12 months of claims experience.experience adjusted for estimated future increases in costs.

Contingent litigation and regulatory liabilities

Amounts related to contingent litigation and regulatory liabilities are accrued if it is probable that a liability has been incurred and an amount is reasonably estimable.  The Company records legal fees in other operating expense in the period incurred.  

61


FIRST AMERICAN FINANCIAL CORPORATION

AND SUBSIDIARY COMPANIES

NOTES TO CONSOLIDATED FINANCIAL STATEMENTS—(Continued)


Invested Equity

Invested equity refers to the net assets of the Company which reflects TFAC’s investment in the Company prior to the Separation and excludes noncontrolling interests.

Revenues

Title premiums on policies issued directly by the Company are recognized on the effective date of the title policy and escrow fees are recorded upon close of the escrow. Revenues from title policies issued by independent agents are recorded when notice of issuance is received from the agent, which is generally when cash payment is received by the Company. Revenues earned by the Company’s title plant management business are recognized at the time of delivery, as the Company has no significant ongoing obligation after delivery.

Direct premiums of the Company’s specialty insurance segment include revenues from home warranty contracts which are generally recognized ratably over the 12-month duration of the contracts, and revenues from property and casualty insurance policies which are also recognized ratably over the 12-month duration of the policies.

Interest on loans receivable is recognized on the outstanding principal balance on the accrual basis. Loan origination fees and related direct loan origination costs are deferred and recognized over the life of the loan. Revenues earned by the other products in the Company’s trust and banking operations are recognized at the time of delivery, as the Company has no significant ongoing obligation after delivery.

Premium taxes

Title insurance, property and casualty insurance and home warranty companies, like other types of insurers, are generally not subject to state income or franchise taxes. However, in lieu thereof, most states impose a tax based primarily on insurance premiums written. This premium tax is reported as a separate line item in the consolidated statements of income in order to provide a more meaningful disclosure of the taxation of the Company.

FIRST AMERICAN FINANCIAL CORPORATION

AND SUBSIDIARY COMPANIES

NOTES TO CONSOLIDATED FINANCIAL STATEMENTS—(Continued)

Legal fees

The Company records legal fees in other operating expenses in the period incurred.

Income taxes

The Company accounts for income taxes under the asset and liability method, whereby deferred tax assets and liabilities are recognized for the future tax consequences attributable to differences between the financial statement carrying amounts of existing assets and liabilities and their respective tax bases. Deferred tax assets and liabilities are measured using enacted tax rates expected to apply in the years in which those temporary differences are expected to be recovered or settled. The effect on deferred tax assets and liabilities of a change in tax rates is recognized in income in the period that includes the enactment date. The Company evaluates the need to establish a valuation allowance for deferred tax assets based upon the amount of existing temporary differences, the period in which they are expected to be recovered and expected levels of taxable income. A valuation allowance to reduce deferred tax assets is established when it is “moreconsidered more likely than not”not that some or all of the deferred tax assets will not be realized.

The Company recognizes the effect of income tax positions only if sustaining those positions is “moreconsidered more likely than not. Changes in recognition or measurement of uncertain tax positions are reflected in the period in which a change in judgment occurs. The Company recognizes interest and penalties, if any, related to uncertain tax positions in tax expense.

Share-based compensation

The Company measures the cost of employee services received in exchange for an award of equity instruments based on the grant-date fair value of the award. The cost is recognized in the Company’s financial statements over the requisite service period of the award using the straight-line method for awards that contain only a service condition and the graded vesting method for awards that contain a performance or market condition. The share-based compensation expense recognized is based on the number of shares ultimately expected to vest, net of forfeitures. Forfeitures are estimated at the time of grant and revised, if necessary, in subsequent periods if actual forfeitures differ from those estimates.

The Company’s primary means of providing share-based compensation is through the granting of restricted stock units (“RSUs”). RSUs granted generally have graded vesting and include a service condition; and for certain key employees and executives, may also include either a performance or market condition. RSUs receive dividend equivalents in the form of RSUs having the same vesting requirements as the RSUs initially granted.

As of December 31, 2011, all stock options issued under the Company’s plans are vested and no share-based compensation expense related to such stock options remains to be recognized.

In addition, the Company has an employee stock purchase plan that allows eligible employees the option to purchase common stock of the Company at 85.0%85% of the lower of the closing price on either the first or last day of each month.offering period.  

62


FIRST AMERICAN FINANCIAL CORPORATION

AND SUBSIDIARY COMPANIES

NOTES TO CONSOLIDATED FINANCIAL STATEMENTS—(Continued)

The offering periods are three-month periods beginning on January 1, April 1, July 1 and October 1 of each fiscal year.  The Company recognizes an expense in the amount equal to the discount.value of the 15% discount and look-back feature over the three-month offering period.

Earnings per share

Basic earnings per share is computed by dividing net income available to the Company’s stockholders by the weighted-average number of common shares outstanding. The computation of diluted earnings per share is

FIRST AMERICAN FINANCIAL CORPORATION

AND SUBSIDIARY COMPANIES

NOTES TO CONSOLIDATED FINANCIAL STATEMENTS—(Continued)

similar to the computation of basic earnings per share, except that the weighted-average number of common shares outstanding is increased to include the number of additional common shares that would have been outstanding if dilutive stock options had been exercised and RSUs were vested. The dilutive effect of stock options and unvested RSUs is computed using the treasury stock method, which assumes any proceeds that could be obtained upon the exercise of stock options and vesting of RSUs would be used to purchase common shares at the average market price for the period. The assumed proceeds include the purchase price the grantee pays, the hypothetical windfall tax benefit that the Company receives upon assumed exercise or vesting and the hypothetical average unrecognized compensation expense for the period. The Company calculates the assumed proceeds from excess tax benefits based on the “as-if” deferred tax assets calculated under share based compensation standards.

Certain unvested RSUs contain nonforfeitable rights to dividends as they are eligible to participate in undistributed earnings without meeting service condition requirements. These awards are considered participating securities under the guidance which requires the use of the two-class method when computing basic and diluted earnings per share. The two-class method reduces earnings allocated to common stockholders by dividends and undistributed earnings allocated to participating securities.

Per share information for prior years was computed using the number of shares of common stock outstanding immediately following the Separation, as if such shares were outstanding for the entire period.

Employee benefit plans

The Company recognizes the overfunded or underfunded status of defined benefit postretirement plans as an asset or liability on its consolidated balance sheets and recognizes changes in the funded status in the year in which changes occur, through accumulated other comprehensive income.loss. The funded status is measured as the difference between the fair value of plan assets and the benefit obligation (the projected benefit obligation for pension plans and the accumulated postretirement benefit obligation for the other postretirement plans). Actuarial gains and losses and prior service costs and credits that have not been recognized as a component of net periodic benefit cost previously are recorded as a component of accumulated other comprehensive income.loss. Plan assets and obligations are measured annually as of December 31.

The Company informally funds its nonqualified deferred compensation plan through tax-advantaged investments known as variable universal life insurance. The Company’s deferred compensation plan assets are included as a component of other assets and the Company’s deferred compensation plan liability is included as a component of pension costs and other retirement plans on the consolidated balance sheets. The income earned on the Company’s deferred compensation plan assets is included as a component of net investment income and the income earned by the deferred compensation plan participants is included as a component of personnel costs on the consolidated statements of income.

Foreign currency

The Company operates in foreign countries, including Canada, the United Kingdom, Australia and various other established and emerging markets. The functional currencies of the Company’s foreign subsidiaries are generally their respective local currencies. The financial statements of the foreign subsidiaries are translated into U.S. dollars as follows: assets and liabilities at the exchange rate as of the balance sheet date, equity at the historical rates of exchange, and income and expense amounts at average rates prevailing throughout the period. Translation adjustments resulting from the translation of the subsidiaries’ accounts are included in accumulated other comprehensive loss as a separate component of stockholders’ equity. Gains and losses resulting from foreign currency transactions are included within other operating expenses.

Reinsurance

The Company assumes and cedes large title insurance risks through the mechanism of reinsurance. Additionally, the Company’s property and casualty insurance business uses reinsurance to limit risk associated

FIRST AMERICAN FINANCIAL CORPORATION

AND SUBSIDIARY COMPANIES

NOTES TO CONSOLIDATED FINANCIAL STATEMENTS—(Continued)

with natural disasters such as windstorms, winter

63


FIRST AMERICAN FINANCIAL CORPORATION

AND SUBSIDIARY COMPANIES

NOTES TO CONSOLIDATED FINANCIAL STATEMENTS—(Continued)

storms, wildfires and earthquakes. In reinsurance arrangements, the primary insurer retains a certain amount of risk under a policy and cedes the remainder of the risk under the policy to the reinsurer. The primary insurer pays the reinsurer a premium in exchange for accepting this risk of loss. The primary insurer generally remains liable to its insured for the total risk, but is reinsured under the terms of the reinsurance agreement. The amount of premiums assumed and ceded is recorded as a component of direct premiums and escrow fees on the Company’s income statement.consolidated statements of income. The total amount of premiums assumed and ceded in connection with reinsurance was less than 1.0% of consolidated premium and escrow fees for each of the three years in the period ended December 31, 2011.2014. Payments and recoveries on reinsured losses for the Company’s title insurance and property and casualty businesses were immaterial during the three years ended December 31, 2011.2014.  At December 31, 2014, a reinsurance receivable of $25.0 million, which related to a large commercial title claim, was included in the Company’s consolidated balance sheets in accounts and accrued income receivable.  The Company collected $23.2 million of the receivable in February 2015 and expects to collect the remaining $1.8 million during the remainder of 2015.  No reinsurance receivable was included in the consolidated balance sheets at December 31, 2013.

Escrow deposits and trust assets

The Company administers escrow deposits and trust assets as a service to its customers. Escrow deposits totaled $3.07$6.3 billion and $3.03$4.7 billion at December 31, 20112014 and 2010,2013, respectively, of which $0.9$2.2 billion and $0.9$1.6 billion, respectively, were held at the Company’s federal savings bank subsidiary, First American Trust, FSB. The escrow deposits held at First American Trust, FSB are included in the accompanying consolidated balance sheets,temporarily invested in cash and cash equivalents and debt and equity securities, with offsetting liabilities included in deposits.deposits in the accompanying consolidated balance sheets. The remaining escrow deposits were held at third-party financial institutions.

Trust assets held or managed by First American Trust, FSB totaled $2.8 billion and $2.9$3.0 billion at December 31, 20112014 and 2010, respectively, and were held at First American Trust, FSB.2013. Escrow deposits held at third-party financial institutions and trust assets are not considered assets of the Company and, therefore, are not included in the accompanying consolidated balance sheets. However, the Company could be held contingently liable for the disposition of these assets.

In conducting its operations, the Company often holds customers’ assets in escrow, pending completion of real estate transactions. Astransactions and, as a result, of holding these customers’ assets in escrow, the Company has ongoing programs for realizing economic benefits, including investment programs, borrowing agreements, and vendor services arrangements with various financial institutions. The effects of these programs are included in the consolidated financial statements as income or a reduction in expense, as appropriate, based on the nature of the arrangement and benefit received.

Like-kind exchanges

The Company facilitates tax-deferred property exchanges for customers pursuant to Section 1031 of the Internal Revenue Code and tax-deferred reverse exchanges pursuant to Revenue Procedure 2000-37. As a facilitator and intermediary, the Company holds the proceeds from sales transactions and takes temporary title to property identified by the customer to be acquired with such proceeds. Upon the completion of each such exchange, the identified property is transferred to the customer or, if the exchange does not take place, an amount equal to the sales proceeds or, in the case of a reverse exchange, title to the property held by the Company is transferred to the customer. Like-kind exchange funds held by the Company totaled $564.7 million$2.4 billion and $609.9 million$1.4 billion at December 31, 20112014 and 2010, respectively, of which none and $408.8 million, respectively, were held at the Company’s subsidiary, First Security Business Bank (“FSBB”).2013, respectively. The like-kind exchange deposits held at FSBB are included in the accompanying consolidated balance sheets in cash and cash equivalents with offsetting liabilities included in deposits. The remaining exchange deposits were held at third-party financial institutions and, due to the structure utilized to facilitate these transactions, the proceeds and property are not considered assets of the Company and, therefore, are not included in the accompanying consolidated balance sheets. SuchAll such amounts are placed in bank deposits with FDICdeposit accounts insured, institutions.up to applicable limits, by the Federal Deposit Insurance Corporation. The Company could be held contingently liable to the customer for the transfers of property, disbursements of proceeds and the return on the proceeds.

FIRST AMERICAN FINANCIAL CORPORATION

AND SUBSIDIARY COMPANIES

NOTES TO CONSOLIDATED FINANCIAL STATEMENTS—(Continued)

During the third quarter of 2011, the Company began the multi-year process of winding-down the operations of FSBB. FSBB continues to accept and service certain deposits and to service its existing loan portfolio, but is no longer accepting like-kind exchange deposits or originating or purchasing new loans.

Recently Adopted Accounting Pronouncements:

In January 2010,July 2013, the Financial Accounting Standards Board (“FASB”) issued updated guidance relatedintended to fair value measurements and disclosures, which requireseliminate the diversity in practice regarding financial statement presentation of an unrecognized tax benefit when a reporting entity to disclose separately,net operating loss carryforward, a reconciliation for fair value measurements using significant unobservable inputs (Level 3) information about purchases, sales, issuances and settlements (that is, onsimilar tax loss, or a gross basis rather than one net number).tax credit carryforward exists. The updated guidance is effective for interim orand annual financial

64


FIRST AMERICAN FINANCIAL CORPORATION

AND SUBSIDIARY COMPANIES

NOTES TO CONSOLIDATED FINANCIAL STATEMENTS—(Continued)

reporting periods beginning after December 15, 2010 and for interim periods within the fiscal year. Except for the disclosure requirements, the2013, with early adoption permitted. The adoption of thisthe guidance had no impact on the Company’s consolidated financial statements.

Pending Accounting Pronouncements:

In July 2010,June 2014, the FASB issued updated guidance relatedintended to credit risk disclosureseliminate the diversity in practice regarding share-based payment awards that include terms which provide for finance receivables anda performance target that affects vesting being achieved after the related allowance for credit losses. The updated guidance requires entities to disclose information at disaggregated levels, specifically defined as “portfolio segments” and “classes”. Expanded disclosures include, among other things, roll-forward schedules of the allowance for credit losses and information regarding the credit quality of receivables (including their aging) as of the end of a reportingrequisite service period. The updated guidance is effective for interim and annual reporting periods ending after December 15, 2010, although the disclosures of reporting period activity are required for interim and annual reporting periods beginning after December 15, 2010. Except for the disclosure requirements, the adoption of this guidance had no impact on the Company’s consolidated financial statements.

In December 2010, the FASB issued updated guidance related to disclosure of supplementary pro forma information in connection with business combinations. The updated guidance clarifies the acquisition date that should be used for reporting pro forma financial information when comparative financial statements are presented. The updated guidance also expands supplemental pro forma disclosures to include a description of the nature and amount of material, nonrecurring pro forma adjustments directly attributable to the business combination included in the reported pro forma revenue and earnings. The updated guidance is effective for annual reporting periods beginning on or after December 15, 2010. The adoption of this guidance had no impact on the Company’s consolidated financial statements.

In December 2010, the FASB issued updated guidance related to when goodwill impairment testing should include Step 2 for reporting units with zero or negative carrying amounts. The updated guidance modifies Step 1 of the goodwill impairment test for reporting units with zero or negative carrying amounts requiring those entities to perform Step 2 of the goodwill impairment test if it is more likely than notnew standard requires that a goodwill impairment exists. In determining whether it is more likely thanperformance target which affects vesting and could be achieved after the requisite service period be treated as a performance condition that affects vesting and should not that a goodwill impairment exists, an entity should consider whether there are any adverse qualitative factors indicating an impairment may exist.be reflected in estimating the grant-date fair value.  The updated guidance is effective for interim and annual reporting periods beginning after December 15, 2010.2015, with early adoption permitted.  The Company expects the adoption of this guidance hadto have no impact on the Company’sits consolidated financial statements.

In September 2011,May 2014, the FASB issued updated guidance for recognizing revenue from contracts with customers to provide a single, comprehensive revenue recognition model for all contracts with customers to improve comparability within and across industries, and across capital markets. The new revenue standard contains principles that is intended to simplify how entities test goodwill for impairment. The updated guidance permits entities to first assess qualitative factorsan entity will apply to determine whether itthe measurement of revenue and the timing of recognition. The underlying principle is more likely than notthat an entity will recognize revenue to depict the transfer of goods or services to customers at an amount that the fair valueentity expects to be entitled to in exchange for those goods or services. Revenue from insurance contracts is not within the scope of a reporting unit is less than its carrying amount as a basis for determining whether it is necessary to perform the two-step goodwill impairment test as required under current accountingthis guidance. The updated guidance is effective for interim and annual reporting periods beginning after December 15, 2011. Early2016, with early adoption is permitted, including for interim and annual goodwill

FIRST AMERICAN FINANCIAL CORPORATION

AND SUBSIDIARY COMPANIES

NOTES TO CONSOLIDATED FINANCIAL STATEMENTS—(Continued)

impairment tests performed as of a date before September 15, 2011, if an entity’s financial statements for the more recent interim and annual period have not yet been issued.prohibited. The Company adopted this guidance inis currently assessing the fourth quarter of 2011, in connection with performing its annual goodwill impairment test and elected to bypass the qualitative assessment and performed the first stepimpact of the two-step goodwill impairment test. The adoption of thisnew guidance had no impact on the Company’sits consolidated financial statements.

Pending Accounting Pronouncements:

In December 2011,April 2014, the FASB issued updated guidance requiring entitieswhich changes the criteria for determining which disposals are required to disclose both gross informationbe presented as discontinued operations and net information about both instruments and transactions eligible for offset in the statement of financial position and instruments and transactions subject to an agreement similar to a master netting arrangement. The updated guidance is effective for interim and annual reporting periods beginning on or after January 1, 2013. Except for themodifies related disclosure requirements, management does not expect the adoption of this guidance to have a material impact on the Company’s consolidated financial statements.

In June 2011, the FASB issued updated guidance that is intended to increase the prominence of other comprehensive income in financial statements. The updated guidance eliminates the option to present the components of other comprehensive income as part of the statement of changes in stockholders’ equity, and requires consecutive presentation of the statement of net income and other comprehensive income or in a single continuous statement of comprehensive income. In addition, the option to present reclassification adjustments in the notes to financial statements has been eliminated.requirements. The updated guidance is effective for interim and annual reporting periods beginning after December 15, 2011. In December 2011, the FASB issued updated guidance deferring the effective date of the change in presentation of reclassification adjustments. Management31, 2014, with early adoption permitted. The Company expects the adoption of the guidance that remains effective beginning in the first quarter of 2012 to have no impact on the Company’s consolidated financial statements.

In May 2011, the FASB issued updated guidance that is intended to improve the comparability of fair value measurements presented and disclosed in financial statements prepared in accordance with generally accepted accounting principles and International Financial Reporting Standards. The amendments are of two types: (i) those that clarify the FASB’s intent about the application of existing fair value measurement and disclosure requirements and (ii) those that change a particular principle or requirement for measuring fair value or for disclosing information about fair value measurements. The update is effective for interim and annual periods beginning after December 15, 2011. Except for the disclosure requirements, management does not expect the adoption of this guidance to have a materialno impact on the Company’sits consolidated financial statements.


In October 2010, the FASB issued updated guidance related to accounting for costs associated with acquiring or renewing insurance contracts. The updated guidance modifies the definition of the types of costs incurred by insurance entities that can be capitalized in the acquisition of new and renewal contracts. Under the updated guidance only costs based on successful efforts (that is, acquiring a new or renewal contract) including direct-response advertising costs are eligible for capitalization. The updated guidance is effective for interim and annual reporting periods beginning after December 15, 2011. Management does not expect the adoption of this guidance to have a material impact on the Company’s consolidated financial statements.

NOTE 2.    Statutory Restrictions on Investments and Stockholders’ Equity:

Investments carried at $152.5totaling $133.0 million and $137.9$128.9 million were on deposit with state treasurers in accordance with statutory requirements for the protection of policyholders at December 31, 20112014 and 2010,2013, respectively.

FIRST AMERICAN FINANCIAL CORPORATION

AND SUBSIDIARY COMPANIES

NOTES TO CONSOLIDATED FINANCIAL STATEMENTS—(Continued)

Pursuant to insurance and other regulations under which the Company’s insurance subsidiaries operate, the amount of dividends, loans and advances available to the Company is limited, principally for the protection of policyholders. UnderAs of December 31, 2014, under such regulations, the maximum amount of dividends, loans and advances available to the Company from its insurance subsidiaries in 2012 is $181.12015, without prior approval from applicable regulators, was $570.0 million.

The Company’s principal title insurance subsidiary, FATICO,First American Title Insurance Company (“FATICO”), maintained total statutory capital and surplus of $817.6$971.3 million and $846.8$996.0 million as of December 31, 20112014 and 2010,2013, respectively. Statutory net income for the years ended December 31, 2011, 20102014, 2013 and 20092012 was $80.2$393.1 million, $42.9$199.1 million and $190.2$301.9 million, respectively. FATICO was in compliance with the minimum statutory capital and surplus requirements as of December 31, 2014.

FATICO, which was previously domiciled in the state of California, redomesticated to Nebraska effective July 1, 2014.  FATICO’s statutory-based financial statements were prepared in accordance with accounting practices prescribed or permitted by the Nebraska Department of Insurance for the year ended December 31, 2014 and by the California Department of Insurance for the year ended December 31, 2013.  The National Association of Insurance Commissioners’ (“NAIC”) Accounting Practices and Procedures Manual (“NAIC SAP”) has been adopted as a component of prescribed or permitted practices by the states of Nebraska and California. Both states have adopted certain prescribed accounting practices that differ from those found in the NAIC SAP. Specifically, the timing of amounts released from the statutory premium reserve under both Nebraska’s and California’s required practice differs from NAIC SAP resulting in total statutory capital and surplus that was lower by $11.7 million and $193.8 million at December 31, 2014 and 2013, respectively, than if reported in accordance with NAIC SAP. Additionally, for the year ended December 31, 2014, the state of Nebraska granted a permitted accounting practice to FATICO that differs from Nebraska’s prescribed accounting practices; specifically, the determination to not

65


FIRST AMERICAN FINANCIAL CORPORATION

AND SUBSIDIARY COMPANIES

NOTES TO CONSOLIDATED FINANCIAL STATEMENTS—(Continued)

record a bulk reserve within the known claims reserve resulting in total statutory capital and surplus that was higher by $8.2 million at December 31, 2014 than if reported in accordance with Nebraska’s required practice.  

Statutory accounting principles differ in some respects from generally accepted accounting principles, and these differences include, but are not limited to, non-admission of certain assets (principally limitations on deferred tax assets, capitalized furniture and other equipment, premiums and other receivables 90 days past due and assets acquired in connection with claim settlements other than real estate or mortgage loans secured by real estate and limitations on goodwill)estate), reporting of bonds at amortized cost, amortization of goodwill, deferral of premiums received as statutory premium reserve, and supplemental reserve (if applicable) and exclusion of the incurred but not reported claims reserve.

FIRST AMERICAN FINANCIAL CORPORATION

AND SUBSIDIARY COMPANIES


NOTES TO CONSOLIDATED FINANCIAL STATEMENTS—(Continued)

NOTE 3.    Debt and Equity Securities:

The amortized cost and estimated fair value of investments in debt securities, all of which are classified as available-for-sale, are as follows:


   Amortized
cost
   Gross unrealized  Estimated
fair value
   Other-than-
temporary
impairments
in AOCI
 

(in thousands)

    gains   losses    

December 31, 2011


U.S. Treasury bonds

  $71,995    $2,236    $—     $74,231    $—    

Municipal bonds

   329,935     19,272     (84  349,123     —    

Foreign bonds

   212,200     3,026     (206  215,020     —    

Governmental agency bonds

   195,784     1,970     (1  197,753     —    

Governmental agency mortgage-backed securities

   1,066,656     10,816     (925  1,076,547     —    

Non-agency mortgage-backed securities (1)

   42,089     478     (11,933  30,634     32,089  

Corporate debt securities

   248,921     10,420     (738  258,603     —    


  $2,167,580    $48,218    $(13,887 $2,201,911    $32,089  


December 31, 2010


U.S. Treasury bonds

  $96,055    $2,578    $(774 $97,859    $—    

Municipal bonds

   280,471     2,925     (5,597  277,799     —    

Foreign bonds

   184,956     1,416     (430  185,942     —    

Governmental agency bonds

   241,844     1,314     (2,997  240,161     —    

Governmental agency mortgage-backed securities

   1,039,266     7,560     (1,329  1,045,497     —    

Non-agency mortgage-backed securities (1)

   63,773     277     (16,516  47,534     28,409  

Corporate debt securities

   209,476     5,216     (1,500  213,192     —    


  $2,115,841    $21,286    $(29,143 $2,107,984    $28,409  


(1)At December 31, 2011, the $42.1 million amortized cost is net of $9.1 million in other-than-temporary impairments determined to be credit related which have been recognized in earnings for the year ended December 31, 2011. At December 31, 2010, the $63.8 million amortized cost is net of $6.3 million in other-than-temporary impairments determined to be credit related which have been recognized in earnings for the year ended December 31, 2010. At December 31, 2011, the $11.9 million gross unrealized losses include $11.4 million of unrealized losses for securities determined to be other-than-temporarily impaired and $0.5 million of unrealized losses for securities for which an other-than-temporary impairment has not been recognized. At December 31, 2010, the $16.5 million gross unrealized losses include $10.4 million of unrealized losses for securities determined to be other-than-temporarily impaired and $6.1 million of unrealized losses for securities for which an other-than-temporary impairment has not been recognized. The $32.1 million and $28.4 million other-than-temporary impairments recorded in accumulated other comprehensive income (“AOCI”) through December 31, 2011 and December 31, 2010, respectively, represent the amount of other-than-temporary impairment losses recognized in AOCI which, from January 1, 2009, were not included in earnings due to the fact that the losses were not considered to be credit related. Other-than-temporary impairments were recognized in AOCI for non-agency mortgage-backed securities only.

FIRST AMERICAN FINANCIAL CORPORATION

AND SUBSIDIARY COMPANIES

NOTES TO CONSOLIDATED FINANCIAL STATEMENTS—(Continued)


Amortized
cost


Gross unrealized


Estimated
fair value


(in thousands)


gains


losses


December 31, 2014


U.S. Treasury bonds


$

64,195


$

968


$

(181

)


$

64,982


Municipal bonds


577,703


10,981


(1,007

)


587,677


Foreign bonds


194,749


2,009


(8

)


196,750


Governmental agency bonds


198,330


1,562


(2,018

)


197,874


Governmental agency mortgage-backed securities


1,812,766


8,491


(9,095

)


1,812,162


Non-agency mortgage-backed securities


15,949


1,306


(717

)


16,538


Corporate debt securities


568,774


8,759


(3,264

)


574,269


$

3,432,466


$

34,076


$

(16,290

)


$

3,450,252


December 31, 2013


U.S. Treasury bonds


$

66,400


$

669


$

(685

)


$

66,384


Municipal bonds


491,143


5,113


(10,291

)


485,965


Foreign bonds


221,298


1,836


(626

)


222,508


Governmental agency bonds


267,713


233


(5,401

)


262,545


Governmental agency mortgage-backed securities


1,426,489


2,074


(25,254

)


1,403,309


Non-agency mortgage-backed securities


19,658


1,167


(1,803

)


19,022


Corporate debt securities


355,893


7,279


(3,088

)


360,084


$

2,848,594


$

18,371


$

(47,148

)


$

2,819,817


The cost and estimated fair value of investments in equity securities, all of which are classified as available-for-sale, are as follows:


(in thousands)

  Cost   Gross unrealized  Estimated
fair value
 
    gains   losses  

December 31, 2011


Preferred stocks

  $7,007    $678    $(17 $7,668  

Common stocks (1)

   224,880     3,793     (52,341  176,332  


  $231,887    $4,471    $(52,358 $184,000  


December 31, 2010


Preferred stocks

  $10,442    $1,150    $(18 $11,574  

Common stocks (1)

   269,512     4,458     (3,128  270,842  


  $279,954    $5,608    $(3,146 $282,416  


Cost


Gross unrealized


Estimated
fair value


(in thousands)


gains


losses


December 31, 2014


Preferred stocks


$

14,976


$

596


$

(47

)


$

15,525


Common stocks


378,938


16,680


(8,731

)


386,887


$

393,914


$

17,276


$

(8,778

)


$

402,412


December 31, 2013


Preferred stocks


$

9,915


$

1,567


$

(397

)


$

11,085


Common stocks


324,184


25,137


(2,363

)


346,958


$

334,099


$

26,704


$

(2,760

)


$

358,043


(1)CoreLogic common stock with a cost basis of $167.6 million and $242.6 million at December 31, 2011 and 2010, respectively, and an estimated fair value of $115.5 million and $239.5 million, respectively, is included in common stocks. See Note 19 Transactions with CoreLogic/TFAC to the consolidated financial statements for additional discussion of the CoreLogic common stock.

66


FIRST AMERICAN FINANCIAL CORPORATION

AND SUBSIDIARY COMPANIES

NOTES TO CONSOLIDATED FINANCIAL STATEMENTS—(Continued)


The Company had the following net unrealized gains (losses) as of December 31, 2011, 20102014, 2013 and 2009:2012:


December 31,


  As of
December 31,
2011
 As of
December 31,
2010
 As of
December 31,
2009
 

2014


2013


2012


  (in thousands) 

(in thousands)


Debt securities for which an OTTI has been recognized

  $(10,937 $(10,175 $(15,690

Debt securities for which an other-than-temporary impairment has been recognized

$

604


$

(625

)


$

(4,435

)

Debt securities—all other

   45,268    2,318    (6,422


17,182


(28,152

)


43,041


Equity securities

   (47,887  2,462    2,879  


8,498


23,944


6,750


$

26,284


$

(4,833

)


$

45,356


  $(13,556 $(5,395 $(19,233


Sales of debt and equity securities resulted in realized gains of $12.4$34.1 million, $15.2$17.2 million and $19.5$70.1 million and realized losses of $1.4$9.1 million, $2.6$15.5 million and $3.5$0.3 million for the years ended December 31, 2011, 20102014, 2013 and 2009,2012, respectively.

FIRST AMERICAN FINANCIAL CORPORATION

AND SUBSIDIARY COMPANIES

NOTES TO CONSOLIDATED FINANCIAL STATEMENTS—(Continued)

The Company had the following gross unrealized losses as of December 31, 20112014 and December 31, 2010:2013:


  Less than 12 months 12 months or longer Total 


Less than 12 months


12 months or longer


Total


(in thousands)

  Estimated
fair value
   Unrealized
losses
 Estimated
fair value
   Unrealized
losses
 Estimated
fair value
   Unrealized
losses


Estimated
fair value


Unrealized
losses


Estimated
fair value


Unrealized
losses


Estimated
fair value


Unrealized
losses


December 31, 2011


December 31, 2014


Debt securities:


U.S. Treasury bonds

  $—      $—     $—      $—     $—      $—    


$

8,122


$

(27

)


$

15,124


$

(154

)


$

23,246


$

(181

)

Municipal bonds

   7,186     (43  1,896     (41  9,082     (84


137,755


(689

)


19,625


(318

)


157,380


(1,007

)

Foreign bonds

   30,508     (206  690     —      31,198     (206


6,215


(8

)


6,215


(8

)

Governmental agency bonds

   13,828     (1  4,150     —      17,978     (1


27,479


(88

)


127,936


(1,930

)


155,415


(2,018

)

Governmental agency mortgage-backed securities

   280,114     (793  43,835     (132  323,949     (925


383,717


(1,612

)


300,918


(7,483

)


684,635


(9,095

)

Non-agency mortgage-backed securities

   —       —      26,500     (11,933  26,500     (11,933


5,611


(717

)


5,611


(717

)

Corporate debt securities

   40,682     (708  1,290     (30  41,972     (738


198,079


(3,151

)


9,683


(113

)


207,762


(3,264

)


Total debt securities

   372,318     (1,751  78,361     (12,136  450,679     (13,887


761,367


(5,575

)


478,897


(10,715

)


1,240,264


(16,290

)

Equity securities

   131,768     (52,358  —       —      131,768     (52,358


208,922


(8,587

)


2,340


(191

)


211,262


(8,778

)


Total

  $504,086    $(54,109 $78,361    $(12,136 $582,447    $(66,245


$

970,289


$

(14,162

)


$

481,237


$

(10,906

)


$

1,451,526


$

(25,068

)


December 31, 2010


December 31, 2013


Debt securities:


U.S. Treasury bonds

  $13,555    $(774 $—      $—     $13,555    $(774


$

37,492


$

(685

)


$


$


$

37,492


$

(685

)

Municipal bonds

   149,921     (5,597  —       —      149,921     (5,597


230,180


(8,938

)


27,687


(1,353

)


257,867


(10,291

)

Foreign bonds

   76,106     (399  13,587     (31  89,693     (430


56,579


(626

)


56,579


(626

)

Governmental agency bonds

   160,240     (2,991  4,994     (6  165,234     (2,997


203,011


(5,375

)


131


(26

)


203,142


(5,401

)

Governmental agency mortgage-backed securities

   177,417     (1,126  74,848     (203  252,265     (1,329


838,411


(20,970

)


124,425


(4,284

)


962,836


(25,254

)

Non-agency mortgage-backed securities

   —       —      45,301     (16,516  45,301     (16,516


12,086


(1,803

)


12,086


(1,803

)

Corporate debt securities

   72,481     (1,497  422     (3  72,903     (1,500


129,394


(2,422

)


12,500


(666

)


141,894


(3,088

)


Total debt securities

   649,720     (12,384  139,152     (16,759  788,872     (29,143


1,495,067


(39,016

)


176,829


(8,132

)


1,671,896


(47,148

)

Equity securities

   247,673     (3,128  220     (18  247,893     (3,146


85,112


(2,718

)


1,046


(42

)


86,158


(2,760

)


Total

  $897,393    $(15,512 $139,372    $(16,777 $1,036,765    $(32,289


$

1,580,179


$

(41,734

)


$

177,875


$

(8,174

)


$

1,758,054


$

(49,908

)


67


FIRST AMERICAN FINANCIAL CORPORATION

AND SUBSIDIARY COMPANIES

NOTES TO CONSOLIDATED FINANCIAL STATEMENTS—(Continued)


Substantially all securities in the Company’s non-agency mortgage-backed portfolio are senior tranches and all were investment grade at the time of purchase, however, all have subsequently been downgraded to below investment grade since purchase.grade. The table below summarizes the composition of the Company’s non-agency mortgage-backed securities by collateral type, year of issuance and current credit ratings. Percentages are based on the amortized cost basis of the securities and credit ratings are based on Standard & Poor’s Ratings Group (“S&P”) and Moody’s Investors Service, Inc. (“Moody’s”) published ratings. If a security was rated differently by either rating agency, the lower of the two ratings was selected. All amounts and ratings are as of December 31, 2011.2014, by collateral type and year of issuance.


(in thousands, except percentages and number of
securities)

  Number
of
Securities
   Amortized
Cost
   Estimated
Fair
Value
   A-Ratings
or
Higher
  BBB+
to BBB-
Ratings
  Non-
Investment
Grade/Not
Rated
 

Non-agency mortgage- backed securities:


Prime single family residential:


2007

   1    $5,623    $4,185     0.0  0.0  100.0

2006

   6     18,450     11,959     0.0  0.0  100.0

2005

   1     3,816     3,297     0.0  0.0  100.0

Alt-A single family residential:


2007

   2     14,200     11,193     0.0  0.0  100.0


   10    $42,089    $30,634     0.0  0.0  100.0


As of December 31, 2011, none of the non-agency mortgage-backed securities were on negative credit watch by S&P or Moody’s.

FIRST AMERICAN FINANCIAL CORPORATION

AND SUBSIDIARY COMPANIES

NOTES TO CONSOLIDATED FINANCIAL STATEMENTS—(Continued)

(in thousands, except number of securities)


Number of
Securities


Amortized
Cost


Estimated
Fair Value


Non-agency mortgage- backed securities:


Prime single family residential:


2007


1


$

2,738


$

2,394


2006


3


7,433


7,377


2005


1


524


509


Alt-A single family residential:


2007


1


5,254


6,258


6


$

15,949


$

16,538


The amortized cost and estimated fair value of debt securities at December 31, 2011,2014, by contractual maturities, are as follows:


(in thousands)

  Due in one
year or less
   Due after
one
through
five years
   Due after
five
through
ten years
   Due after
ten years
   Total 


Due in one
year or less


Due after
one
through
five years


Due after
five
through
ten years


Due after
ten years


Total


U.S. Treasury bonds


Amortized cost

  $52,079    $19,175    $607    $134    $71,995  


$

4,909


$

40,264


$

17,032


$

1,990


$

64,195


Estimated fair value

  $52,520    $20,795    $720    $196    $74,231  


$

4,969


$

40,312


$

17,370


$

2,331


$

64,982


Municipal bonds


Amortized cost

  $1,590    $93,667    $133,227    $101,451    $329,935  


$

20,148


$

262,901


$

181,812


$

112,842


$

577,703


Estimated fair value

  $1,623    $97,004    $143,304    $107,192    $349,123  


$

20,239


$

264,952


$

186,168


$

116,318


$

587,677


Foreign bonds


Amortized cost

  $38,538    $163,206    $10,456    $—      $212,200  


$

46,403


$

131,652


$

13,473


$

3,221


$

194,749


Estimated fair value

  $38,979    $165,546    $10,495    $—      $215,020  


$

46,585


$

133,103


$

13,707


$

3,355


$

196,750


Governmental agency bonds


Amortized cost

  $11,533    $93,611    $73,037    $17,603    $195,784  


$

2,279


$

171,686


$

12,402


$

11,963


$

198,330


Estimated fair value

  $11,673    $94,325    $73,478    $18,277    $197,753  


$

2,284


$

169,796


$

12,762


$

13,032


$

197,874


Corporate debt securities


Amortized cost

  $6,679    $106,261    $115,822    $20,159    $248,921  


$

18,503


$

239,699


$

262,743


$

47,829


$

568,774


Estimated fair value

  $6,745    $108,548    $121,865    $21,445    $258,603  


$

18,640


$

242,236


$

263,623


$

49,770


$

574,269


Total debt securities excluding mortgage-backed securities


Amortized cost

  $110,419    $475,920    $333,149    $139,347    $1,058,835  


$

92,242


$

846,202


$

487,462


$

177,845


$

1,603,751


Estimated fair value

  $111,540    $486,218    $349,862    $147,110    $1,094,730  


$

92,717


$

850,399


$

493,630


$

184,806


$

1,621,552


Total mortgage-backed securities


Amortized cost

          $1,108,745  


$

1,828,715


Estimated fair value

          $1,107,181  


$

1,828,700


Total debt securities


Amortized cost

          $2,167,580  


$

3,432,466


Estimated fair value

          $2,201,911  


$

3,450,252


Other-than-temporary impairment—debtMortgage-backed securities, which include contractual terms to maturity, are not categorized by contractual maturity because borrowers may have the right to call or prepay obligations with or without call or prepayment penalties.


Although dislocations in the capital and credit markets have largely recovered, there continues to be volatility and disruption concerning certain vintages of non-agency mortgage-backed securities. The primary factors negatively impacting certain vintages of non-agency mortgage-backed securities include stringent borrowing guidelines that result in the inability of borrowers to refinance, high unemployment, continued declines in real estate values, uncertainty regarding the timing and effectiveness of governmental solutions and a general slowdown in economic activity. The Company determines if a non-agency mortgage-backed security in a loss position is other-than-temporarily impaired by comparing the present value of the cash flows expected to be collected from the security to its amortized cost basis. If the present value of the cash flows expected to be collected exceed the amortized cost of the security, the Company concludes that the security is not other-than-temporarily impaired. The Company performs this analysis on all non-agency mortgage-backed securities in its portfolio that are in an unrealized loss position. The methodology and key assumptions used in estimating the present value of cash flows expected to be collected are described below. For the securities that were determined

68


FIRST AMERICAN FINANCIAL CORPORATION

AND SUBSIDIARY COMPANIES

NOTES TO CONSOLIDATED FINANCIAL STATEMENTS—(Continued)


notNOTE 4.    Financing Receivables:

During the fourth quarter of 2014, the Company completed its multi-year process of winding-down the operations of its industrial bank, First Security Business Bank, which included the sale of the bank’s loan portfolio and transfer of its customer deposits to be other-than-temporarily impaireda third party bank. The Company received proceeds from the sale of $42.3 million, net of $8.1 million related to customer deposits, and recorded a gain of $0.5 million.  Customer deposits were transferred at par value. Loans receivable, net totaled $73.8 million at December 31, 2011, the present value of the cash flows expected to be collected exceeded the amortized cost of each security.2013.


If the Company intends to sell a debt security in an unrealized loss position or determines that it is more likely than not that the Company will be required to sell a debt security before it recovers its amortized cost basis, the debt security is other-than-temporarily impaired and it is written down to fair value with all losses recognized in earnings. As of December 31, 2011, the Company does not intend to sell any debt securities in an unrealized loss position and it is not more likely than not that the Company will be required to sell debt securities before recovery of their amortized cost basis.

If the Company does not expect to recover the amortized cost basis of a debt security with declines in fair value (even if the Company does not intend to sell the debt security and it is not more likely than not that the Company will be required to sell the debt security before the recovery of its remaining amortized cost basis), the losses the Company considers to be the credit portion of the other-than-temporary impairment loss (“credit loss”) is recognized in earnings and the non-credit portion is recognized in other comprehensive income. The credit loss is the difference between the present value of the cash flows expected to be collected and the amortized cost basis of the debt security. The cash flows expected to be collected are discounted at the rate implicit in the security immediately prior to the recognition of the other-than-temporary impairment.

Expected future cash flows for debt securities are based on qualitative and quantitative factors specific to each security, including the probability of default and the estimated timing and amount of recovery. The detailed inputs used to project expected future cash flows may be different depending on the nature of the individual debt security. Specifically, the cash flows expected to be collected for each non-agency mortgage-backed security are estimated by analyzing loan-level detail to estimate future cash flows from the underlying assets, which are then applied to the security based on the underlying contractual provisions of the securitization trust that issued the security (e.g. subordination levels, remaining payment terms, etc.). The Company uses third-party software to determine how the underlying collateral cash flows will be distributed to each security issued from the securitization trust. The primary assumptions used in estimating future collateral cash flows are prepayment speeds, default rates and loss severity. In developing these assumptions, the Company considers the financial condition of the borrower, loan to value ratio, loan type and geographical location of the underlying property. The Company utilizes publicly available information related to specific assets, generally available market data such as forward interest rate curves and CoreLogic’s securities, loans and property data and market analytics tools.

The table below summarizes the primary assumptions used at December 31, 2011 in estimating the cash flows expected to be collected for these securities.

Weighted averageRange

Prepayment speeds

8.06.4% – 10.0%

Default rates

5.11.8% – 10.5%

Loss severity

30.47.9% – 39.7%

As a result of the Company’s security-level review, it recognized total other-than-temporary impairments of $12.7, million, $8.5 million and $45.0 million on its non-agency mortgage-backed securities for the years ended December 31, 2011, 2010 and 2009, respectively, of which $9.1 million, $6.3 million and $18.8 million of other-than-temporary impairment losses were considered to be credit related and were recognized in earnings for the years ended December 31, 2011, 2010 and 2009, respectively, while $3.7 million, $2.2 million and $26.2 million of other-than-temporary impairment losses were considered to be related to factors other than credit and were

FIRST AMERICAN FINANCIAL CORPORATION

AND SUBSIDIARY COMPANIES

NOTES TO CONSOLIDATED FINANCIAL STATEMENTS—(Continued)

therefore recognized in other comprehensive income for the years ended December 31, 2011, 2010 and 2009, respectively. The amounts remaining in other comprehensive income for the years ended December 31, 2011, 2010 and 2009 should not be recorded in earnings, because the losses were not considered to be credit related based on the Company’s other-than-temporary impairment analysis as discussed above.

It is possible that the Company could recognize additional other-than-temporary impairment losses on some securities it owns at December 31, 2011 if future events or information cause it to determine that a decline in value is other- than-temporary.

The following table presents the change in the credit portion of the other-than-temporary impairments recognized in earnings on debt securities for which a portion of the other-than-temporary impairments related to other factors was recognized in other comprehensive income (loss) for the years ended December 31, 2011, 2010 and 2009.

   Year Ended December 31, 
   2011   2010   2009 
   (in thousands) 

Credit loss on debt securities held at beginning of period

  $25,108    $18,807    $—    

Addition to credit loss for which an other-than-temporary impairment was previously recognized

   7,667     6,169     —    

Addition to credit loss for which an other-than-temporary impairment was not previously recognized

   1,401     132     18,807  


Credit loss on debt securities held as of December 31

  $34,176    $25,108    $18,807  


Other-than-temporary impairment—equity securities

When, in the Company’s opinion, a decline in the fair value of an equity security, including common and preferred stock, is considered to be other-than-temporary, such equity security is written down to its fair value. When assessing if a decline in value is other-than-temporary, the factors considered include the length of time and extent to which fair value has been below cost, the probability that the Company will be unable to collect all amounts due under the contractual terms of the security, the seniority of the securities, issuer-specific news and other developments, the financial condition and prospects of the issuer (including credit ratings), macro-economic changes (including the outlook for industry sectors, which includes government policy initiatives) and the Company’s ability and intent to hold the investment for a period of time sufficient to allow for any anticipated recovery.

When an equity security has been in an unrealized loss position for greater than twelve months, the Company’s review of the security includes the above noted factors as well as the evidence, if any exists, to support that the security will recover its value in the foreseeable future, typically within the next twelve months. If objective, substantial evidence does not indicate a likely recovery during that timeframe, the Company’s policy is that such losses are considered other-than-temporary and therefore an impairment loss is recorded. During the year ended December 31, 2011, the Company did not record material other-than-temporary impairment charges related to its equity securities. The Company recorded other-than-temporary impairment of $1.7 million during the year ended December 31, 2010 relating to the Company’s preferred equity securities as a component of net other-than-temporary impairment losses recognized in earnings. During the year ended December 31, 2009, the Company concluded that objective substantive evidence was not available on 51 common equity securities and 15 preferred equity securities that had been in a loss position for greater than twelve months. Accordingly, the

FIRST AMERICAN FINANCIAL CORPORATION

AND SUBSIDIARY COMPANIES

NOTES TO CONSOLIDATED FINANCIAL STATEMENTS—(Continued)

Company recorded an other-than-temporary impairment charge of $16.0 million and $5.1 million, relating to its common and preferred equity securities, respectively, as a component of net other-than-temporary impairment losses recognized in earnings. The impairment loss includes a $2.9 million other-than-temporary impairment charge upon the Company’s election to convert its preferred stock in Citigroup Inc. into common stock of that entity under the terms of Citigroup’s publicly announced exchange offer.

At December 31, 2011, the Company owned 8.9 million shares of CoreLogic common stock with a cost basis of $167.6 million and an estimated fair value of $115.5 million. While the Company’s investment in CoreLogic common stock has not been in an unrealized loss position for greater than twelve months, the Company assessed its investment in CoreLogic for other-than-temporary impairment due to the significant amount of shares owned. In August 2011, CoreLogic announced that its board of directors had formed a committee of independent directors to explore options aimed at enhancing shareholder value including cost savings initiatives, an evaluation of CoreLogic’s capital structure, repurchases of debt and common stock, the disposition of business lines, the sale or business combination of CoreLogic and other alternatives. CoreLogic’s board of directors also announced that it retained a financial adviser to assist the committee in its evaluation. Based on the factors considered, the Company’s opinion is the decline in the fair value of CoreLogic’s common stock is not other-than-temporary; therefore, the unrealized loss of $52.1 million was recorded in accumulated other comprehensive loss on the Company’s consolidated balance sheet. The factors considered by the Company include, but are not limited to, (i) the fair value of the common stock has been below cost for less than twelve months, (ii) the Company has the ability and intent to hold the common stock for a period of time sufficient to allow for recovery, (iii) the process of exploring options aimed at enhancing shareholder value in which CoreLogic is engaged, and (iv) in January 2012, CoreLogic issued updated 2011 guidance and full year 2012 guidance containing information that the Company assessed as positive. It is possible that the Company could recognize an other-than-temporary impairment related to its CoreLogic common stock if future events or information cause it to determine that the decline in value is other-than-temporary. The Company will continue to closely monitor and regularly review its investment in CoreLogic common stock.

Fair value measurement

The Company classifies the fair value of its debt and equity securities using a three-level hierarchy for fair value measurements that distinguishes between market participant assumptions developed based on market data obtained from sources independent of the reporting entity (observable inputs) and the reporting entity’s own assumptions about market participant assumptions developed based on the best information available in the circumstances (unobservable inputs). The hierarchy level assigned to each security in the Company’s available-for-sale portfolio is based on management’s assessment of the transparency and reliability of the inputs used in the valuation of such instrument at the measurement date. The three hierarchy levels are defined as follows:

Level 1—Valuations based on unadjusted quoted market prices in active markets for identical securities. The fair value of equity securities are classified as Level 1.

Level 2—Valuations based on observable inputs (other than Level 1 prices), such as quoted prices for similar assets at the measurement date; quoted prices in markets that are not active; or other inputs that are observable, either directly or indirectly. The Level 2 category includes U.S. Treasury bonds, municipal bonds, foreign bonds, governmental agency bonds, governmental agency mortgage-backed securities and corporate debt securities, many of which are actively traded and have market prices that are readily verifiable.

FIRST AMERICAN FINANCIAL CORPORATION

AND SUBSIDIARY COMPANIES

NOTES TO CONSOLIDATED FINANCIAL STATEMENTS—(Continued)

Level 3—Valuations based on inputs that are unobservable and significant to the overall fair value measurement, and involve management judgment. The Level 3 category includes non-agency mortgage-backed securities which are currently not actively traded.

If the inputs used to measure fair value fall in different levels of the fair value hierarchy, a financial security’s hierarchy level is based upon the lowest level of input that is significant to the fair value measurement. The valuation techniques and inputs used to estimate the fair value of the Company’s debt and equity securities are summarized as follows:

Debt Securities

The fair value of debt securities was based on the market values obtained from an independent pricing service that were evaluated using pricing models that vary by asset class and incorporate available trade, bid and other market information and price quotes from well-established independent broker-dealers. The independent pricing service monitors market indicators, industry and economic events, and for broker-quoted only securities, obtains quotes from market makers or broker-dealers that it recognizes to be market participants. The pricing service utilizes the market approach in determining the fair value of the debt securities held by the Company. Additionally, the Company obtains an understanding of the valuation models and assumptions utilized by the service and has controls in place to determine that the values provided represent fair value. The Company’s validation procedures include comparing prices received from the pricing service to quotes received from other third party sources for securities with market prices that are readily verifiable. If the price comparison results in differences over a predefined threshold, the Company will assess the reasonableness of the changes relative to prior periods given the prevailing market conditions and assess changes in the issuers’ credit worthiness, performance of any underlying collateral and prices of the instrument relative to similar issuances. To date, the Company has not made any material adjustments to the fair value measurements provided by the pricing service.

Typical inputs and assumptions to pricing models used to value the Company’s U.S. Treasury bonds, governmental agency bonds, governmental agency mortgage-backed securities, municipal bonds, foreign bonds and corporate debt securities include, but are not limited to, benchmark yields, reported trades, broker-dealer quotes, credit spreads, credit ratings, bond insurance (if applicable), benchmark securities, bids, offers, reference data and industry and economic events. For mortgage-backed securities, inputs and assumptions may also include the structure of issuance, characteristics of the issuer, collateral attributes and prepayment speeds. The fair value of non-agency mortgage-backed securities was obtained from the independent pricing service referenced above and subject to the Company’s validation procedures discussed above. However, due to the fact that these securities were not actively traded, there was less observable inputs available requiring the pricing service to use more judgment in determining the fair value of the securities, therefore the Company classified non-agency mortgage-backed securities as Level 3.

Equity Securities

The fair value of equity securities, including preferred and common stocks, was based on quoted market prices for identical assets that are readily and regularly available in an active market.

FIRST AMERICAN FINANCIAL CORPORATION

AND SUBSIDIARY COMPANIES

NOTES TO CONSOLIDATED FINANCIAL STATEMENTS—(Continued)

The following table presents the Company’s available-for-sale investments measured at fair value on a recurring basis as of December 31, 2011 and December 31, 2010, classified using the three-level hierarchy for fair value measurements:

(in thousands)

  Estimated fair value as
of December 31,  2011
   Level 1   Level 2   Level 3 

Debt securities:


U.S. Treasury bonds

  $74,231    $—      $74,231    $—    

Municipal bonds

   349,123     —       349,123     —    

Foreign bonds

   215,020     —       215,020     —    

Governmental agency bonds

   197,753     —       197,753     —    

Governmental agency mortgage- backed securities

   1,076,547     —       1,076,547     —    

Non-agency mortgage-backed securities

   30,634     —       —       30,634  

Corporate debt securities

   258,603     —       258,603     —    


   2,201,911     —       2,171,277     30,634  


Equity securities


Preferred stocks

   7,668     7,668     —       —    

Common stocks

   176,332     176,332     —       —    


   184,000     184,000     —       —    


  $2,385,911    $184,000    $2,171,277    $30,634  


(in thousands)

  Estimated fair value
as
of December 31, 2010
   Level 1   Level 2   Level 3 

Debt securities:


U.S. Treasury bonds

  $97,859    $—      $97,859    $—    

Municipal bonds

   277,799     —       277,799     —    

Foreign bonds

   185,942     —       185,942     —    

Governmental agency bonds

   240,161     —       240,161     —    

Governmental agency mortgage- backed securities

   1,045,497     —       1,045,497     —    

Non-agency mortgage-backed securities

   47,534     —       —       47,534  

Corporate debt securities

   213,192     —       213,192     —    


   2,107,984     —       2,060,450     47,534  


Equity securities


Preferred stocks

   11,574     11,574     —       —    

Common stocks

   270,842     270,842     —       —    


   282,416     282,416     —       —    


  $2,390,400    $282,416    $2,060,450    $47,534  


The Company did not have any transfers in and out of Level 1 and Level 2 measurements during the years ended December 31, 2011 and 2010. The Company’s policy is to recognize transfers between levels in the fair value hierarchy at the end of the reporting period.

FIRST AMERICAN FINANCIAL CORPORATION

AND SUBSIDIARY COMPANIES

NOTES TO CONSOLIDATED FINANCIAL STATEMENTS—(Continued)

The following table presents a summary of the changes in fair value of Level 3 available-for-sale investments for the years ended December 31, 2011 and 2010:

(in thousands)

  Year Ended
December 31,
2011
  Year Ended
December 31,
2010
 

Fair value at beginning of year

  $47,534   $59,201  

Total gains/(losses) (realized and unrealized):


Included in earnings:


Realized losses

   (191  (970

Net other-than-temporary impairment losses recognized in earnings

   (9,068  (6,301

Included in other comprehensive loss

   4,784    19,014  

Settlements

   (9,945  (20,820

Sales

   (2,480  (2,590

Transfers into Level 3

   —      —    

Transfers out of Level 3

   —      —    


Fair value as of December 31

  $30,634   $47,534  


Unrealized gains (losses) included in earnings for the period relating to Level 3 available-for-sale investments that were still held at the end of the period:


Net other-than-temporary impairment losses recognized in earnings

  $(9,068 $(6,301


The Company did not purchase any non-agency mortgage-backed securities during the years ended December 31, 2011 and 2010.

FIRST AMERICAN FINANCIAL CORPORATION

AND SUBSIDIARY COMPANIES

NOTES TO CONSOLIDATED FINANCIAL STATEMENTS—(Continued)

NOTE 4.    Financing Receivables:

Financing receivables are summarized as follows:

   December 31, 
   2011  2010 
   (in thousands) 

Loans receivable, net:


Real estate–mortgage


Multi-family residential

  $12,028   $12,203  

Commercial

   130,724    152,280  

Other

   1,403    1,120  


   144,155    165,603  

Allowance for loan losses

   (4,171  (3,271

Participations sold

   (861  (977

Deferred loan fees, net

   68    171  


Loans receivable, net

   139,191    161,526  


Other long-term investments:


Notes receivable—secured

   14,776    17,244  

Notes receivable—unsecured

   4,207    9,014  

Loss reserve

   (3,402  (5,095


Notes receivable, net

   15,581    21,163  


Notes receivable from CoreLogic

   —      18,787  


Total financing receivables, net

  $154,772   $201,476  


Real estate loans are collateralized by properties located primarily in Southern California. The average yield on the loan portfolio was 6.51% and 6.69% for the years ended December 31, 2011 and 2010, respectively. Average yields are affected by prepayment penalties recorded as income, prepayment speeds, loan fees amortized to income and the market interest rates.


December 31,


 Notes receivable:


2014


2013


(in thousands)


Secured


5,810


10,533


Unsecured


2,761


2,593


8,571


13,126


Loss reserve


(2,441

)


(2,584

)

Notes receivable, net

$

6,130


$

10,542


Aging analysis of loans and notes receivable at December 31, 2011,2014 and 2013, is as follows:


   Total   Current   30-59 days
past due
   60-89 days
past due
   90 days or
more
past due
   Nonaccrual
status
 
   (in thousands) 

Loans Receivable:


Multi-family residential

  $12,028    $12,028    $—      $—      $—      $—    

Commercial

   130,724     123,736     1,918    170    —       4,900  

Other

   1,403     1,403     —       —       —       —    


  $144,155    $137,167    $1,918   $170   $—      $4,900  


Notes Receivable:


Secured

  $14,776    $10,712    $—      $—      $—      $4,064  

Unsecured

   4,207     108     —       —       —       4,099  


  $18,983    $10,820    $—      $—      $—      $8,163  


FIRST AMERICAN FINANCIAL CORPORATION

AND SUBSIDIARY COMPANIES

NOTES TO CONSOLIDATED FINANCIAL STATEMENTS—(Continued)

Aging analysis of loans and notes receivables at December 31, 2010, is as follows:

   Total    Current   30-59 days
past due
   60-89 days
past due
   90 days or
more
past due
   Nonaccrual
status
 
   (in thousands) 

Loans Receivable:


Multi-family residential

  $12,203    $12,203    $—      $—      $—      $—    

Commercial

   152,280     147,441     2,222    176    —       2,441  

Other

   1,120     1,120     —       —       —       —    


  $165,603    $160,764    $2,222   $176   $—      $2,441  


Notes Receivable:


Secured

  $17,244    $11,006    $—     $—      $—      $6,238 

Unsecured

   9,014     2,278     —       —       —       6,736  


  $26,258    $13,284    $—      $—      $—      $12,974  


The Company performs an analysis of its allowance for loan losses on a quarterly basis. In determining the allowance, the Company considers various factors, such as changes in lending policies and procedures, changes in the nature and volume of the portfolio, changes in the trend of the volume and severity of past due and classified loans, changes to the concentration of credit, as well as changes in legal and regulatory requirements. The allowance for loan losses is maintained at a level that is considered appropriate by the Company to provide for known risks in its portfolio.

Loss reserves are established for notes receivable based upon an estimate of probable losses for the individual notes. A loss reserve is established on an individual note when it is deemed probable that the Company will be unable to collect all amounts due in accordance with the contractual terms of the note. The loss reserve is based upon the Company’s assessment of the borrower’s overall financial condition, resources and payment record; and, if appropriate, the realizable value of any collateral. These estimates consider all available evidence including the expected future cash flows, estimated fair value of collateral on secured notes, general economic conditions and trends, and other relevant factors, as appropriate. Notes are placed on non-accrual status when management determines that the collectibility of contractual amounts is not reasonably assured.


Total


Current


30-59 days
past due


60-89 days
past due


90 days or
more
past due


Non-accrual
status


(in thousands)


December 31, 2014


Notes Receivable:


Secured

$

5,810


$

4,929


$

28


$


$

43


$

810


Unsecured


2,761


1,121


7


1,633


$

8,571


$

6,050


$

35


$


$

43


$

2,443


December 31, 2013


Notes Receivable:


Secured

$

10,533


$

5,784


$

3,668


$


$

231


$

850


Unsecured


2,593


771


1,822


$

13,126


$

6,555


$

3,668


$


$

231


$

2,672


The aggregate annual maturities for loans receivable and notes receivable at December 31, 2011, are2014, is as follows:


Year

  Loans
Receivable
   Notes
Receivable
 
   (in thousands) 

2012

  $2,437    $2,767  

2013

   1,284     1,561  

2014

   2,499     4,359  

2015

   9,363     968  

2016

   6,033     1,382  

2017 and thereafter

   122,539     7,946  


  $144,155    $18,983  


Year


Notes
Receivable


 (in thousands)


2015


$

2,035


2016


1,509


2017


719


2018


517


2019


2,603


2020 and thereafter


1,188


$

8,571


69


FIRST AMERICAN FINANCIAL CORPORATION

AND SUBSIDIARY COMPANIES

NOTES TO CONSOLIDATED FINANCIAL STATEMENTS—(Continued)


NOTE 5.    Property and Equipment:

Property and equipment consists of the following:


  December 31, 

December 31,


  2011 2010 

2014


2013


  (in thousands) 

(in thousands)


Land

  $32,023   $31,843  

$

29,700


$

29,816


Buildings

   289,999    297,966  


270,689


277,131


Furniture and equipment

   165,655    190,834  


186,237


182,912


Capitalized software

   338,333    307,454  


466,548


402,713


953,174


892,572


   826,010    828,097  

Accumulated depreciation and amortization

   (488,432  (482,226


(557,887

)


(531,224

)


$

395,287


$

361,348


  $337,578   $345,871  


NOTE 6.    Goodwill:

A reconciliationsummary of the changes in the carrying amount of goodwill, by operating segment, for the years ended December 31, 20112014 and 2010,2013, is as follows:


   Title
Insurance

and Services
   Specialty
Insurance
   Total 
   (in thousands) 

Balance as of December 31, 2009

  $754,221    $46,765    $800,986  

Acquisitions

   8,631     —       8,631  

Other net adjustments

   2,414     —       2,414  


Balance as of December 31, 2010

   765,266     46,765     812,031  

Acquisitions

   2,678     —       2,678  

Other net adjustments

   3,711     —       3,711  


Balance as of December 31, 2011

  $771,655    $46,765    $818,420  


Title
Insurance
and Services


Specialty
Insurance


Total


(in thousands)


Balance as of December 31, 2012

$

799,092


$

46,765


$

845,857


Acquisitions


4,456


4,456


Foreign currency translation


(4,287

)


(4,287

)

Balance as of December 31, 2013


799,261


46,765


846,026


Acquisitions


121,252


121,252


Foreign currency translation


(5,554

)


(5,554

)

Other adjustments


(1,779

)


(1,779

)

Balance as of December 31, 2014

$

913,180


$

46,765


$

959,945


The activityFor further discussion about the Company’s acquisitions in the above reconciliation for other net adjustments primarily relates to foreign currency exchange and post acquisition adjustments.

2014 see Note 21 Business Combinations.

The Company’s four reporting units for purposes of testing impairment are title insurance, home warranty, property and casualty insurance and trust and other services.

The Company’s policy is to perform an annual goodwill impairment testassessments for each reporting unit in the fourth quarter. Although recent market conditions2014, 2013 and economic events have had an overall negative impact on the Company’s operations and related financial results, impairment analyses were not performed at any other time in the year as no triggering events requiring such an analysis occurred.

The Company’s 2011, 2010 and 2009 evaluations2012 did not indicate impairment into any of its reporting units. There is no accumulated impairment for goodwill as the Company has never recognized any impairment to any of its reporting units. Due to significant volatility in the current markets, the Company’s operations may be negatively impacted in the future to the extent that exposure to impairment losses may be increased.

70


FIRST AMERICAN FINANCIAL CORPORATION

AND SUBSIDIARY COMPANIES

NOTES TO CONSOLIDATED FINANCIAL STATEMENTS—(Continued)


NOTE 7.    Other Intangible Assets:

Other intangible assets consist of the following:


  December 31, 

December 31,


  2011 2010 

2014


2013


  (in thousands) 

(in thousands)


Finite-lived intangible assets:


Customer lists

  $69,763   $72,854  

Covenants not to compete

   29,441    30,811  

Customer relationships

$

94,850


$

77,382


Noncompete agreements


27,286


26,928


Trademarks

   9,551    10,304  


11,241


10,026


Patents

   2,840    2,840  


2,840


2,840


136,217


117,176


   111,595    116,809  

Accumulated amortization

   (69,397  (63,597


(97,282

)


(88,624

)


   42,198    53,212  


38,935


28,552


Indefinite-lived intangible assets:


Licenses

   17,796    16,838  


16,877


17,795


$

55,812


$

46,347


  $59,994   $70,050  


Amortization expense for finite-lived intangible assets was $13.9$12.6 million $14.5 millionfor the year ended December 31, 2014 and $14.1$12.0 million for the years ended December 31, 2011, 20102013 and 2009, respectively.

2012.

Estimated amortization expense for finite-lived intangible assets anticipated for the next five years is as follows:


Year

  (in thousands) 


(in thousands)


2012

  $11,330  

2013

  $10,616  

2014

  $6,237  

2015

  $3,321  

2015

$

8,886


2016

  $2,698  

2016

$

8,423


2017

2017

$

6,799


2018

2018

$

4,462


2019

2019

$

3,690


71


FIRST AMERICAN FINANCIAL CORPORATION

AND SUBSIDIARY COMPANIES

NOTES TO CONSOLIDATED FINANCIAL STATEMENTS—(Continued)


NOTE 8.    Deposits:

Escrow, passbook and investment certificateDeposit accounts are summarized as follows:


   December 31, 
   2011  2010 
   (in thousands, except
percentages)
 

Escrow accounts:


Interest bearing

  $744,917   $736,664  

Non-interest bearing

   277,707    263,528  


   1,022,624    1,000,192  


Passbook accounts

   26,840    437,137  


Certificate accounts:


Less than one year

   23,239    22,736  

One to five years

   20,533    22,492  


   43,772    45,228  


  $1,093,236   $1,482,557  


Annualized interest rates:


Escrow accounts

   0.25  0.38


Passbook accounts

   0.65  0.31


Certificate accounts

   1.81  2.39


December 31,


2014


2013


(in thousands, except
percentages)


Escrow accounts:


Interest bearing

$

1,962,351


$

1,376,921


Non-interest bearing


266,281


176,964


2,228,632


1,553,885


Savings accounts (1)


22,015


Certificate accounts (1)


26,596


Business checking and other deposits (2)

104,082


90,436


$

2,332,714


$

1,692,932


Weighted average interest rate:


Escrow accounts


0.11

%


0.13

%

(1)

During the fourth quarter of 2014, the Company completed its multi-year process of winding-down the operations of its industrial bank, First Security Business Bank, which included the sale of the bank’s loan portfolio and transfer of its customer deposits to a third party bank. The Company received proceeds from the sale of $42.3 million, net of $8.1 million related to customer deposits, and recorded a gain of $0.5 million.  Customer deposits were transferred at par value.

(2)

Business checking and other deposits primarily reflect non-interest bearing accounts.


NOTE 9.    Reserve for Known and Incurred But Not Reported Claims:

Activity in the reserve for known and incurred but not reported claims is summarized as follows:


  December 31, 

December 31,


  2011 2010   2009 

2014


2013


2012


  (in thousands) 

(in thousands)


Balance at beginning of year

  $1,108,238   $1,227,757    $1,326,282  

$

1,018,365


$

976,462


$

1,014,676


Provision related to:


Current year

   308,868    289,220     354,149  


385,155


380,723


335,097


Prior years

   111,268    31,654     (7,435


64,868


149,633


62,620


450,023


530,356


397,717


   420,136    320,874     346,714  


Payments, net of recoveries, related to:


Current year

   149,004    136,445     137,300  


196,656


182,653


160,138


Prior years

   354,430    319,780     314,887  


273,094


296,657


285,848


469,750


479,310


445,986


   503,434    456,225     452,187  


Other

   (10,264  15,832     6,948  


13,142


(9,143

)


10,055


Balance at end of year

  $1,014,676   $1,108,238    $1,227,757  

$

1,011,780


$

1,018,365


$

976,462


“Other” primarily represents reclassifications to the reserve for foreign currency gains/losses and assets acquired in connection with claim settlements. Claims activity associated with reinsurance is not material and,

FIRST AMERICAN FINANCIAL CORPORATION

AND SUBSIDIARY COMPANIES

NOTES TO CONSOLIDATED FINANCIAL STATEMENTS—(Continued)

therefore, not presented separately. Current year payments include $135.1$174.4 million, $123.6$167.3 million and $125.2$144.1 million in 2011, 20102014, 2013 and 2009,2012, respectively, that primarily relate to the Company’s specialty insurance segment. Prior year payments include $20.5$23.2 million, $18.6$16.0 million and $20.4$16.7 million in 2011, 20102014, 2013 and 2009,2012, respectively, that relate to the Company’s specialty insurance segment.

72


FIRST AMERICAN FINANCIAL CORPORATION

AND SUBSIDIARY COMPANIES

NOTES TO CONSOLIDATED FINANCIAL STATEMENTS—(Continued)


The provision for title insurance losses, expressed as a percentage of title insurance premiums and escrow fees, was 9.5%7.0%, 6.2%8.8% and 6.8%6.9% for the years ended December 31, 2011, 20102014, 2013 and 2009,2012, respectively.

The current year rate of 9.5% reflected7.0% reflects an ultimate loss rate of 5.6%5.3% for the current policy year and included a $45.3 million reserve strengthening adjustment related to a guaranteed valuation product offered in Canada that experienced a meaningfulnet increase in claims activity during the first quarter of 2011, a $32.2 million charge in connection with the settlement of Bank of America’s lawsuit against the Company and $34.2 million in unfavorable developmentloss reserve estimates for certain prior policy years primarily 2007. For additional discussion regarding the Bank of America lawsuit see Note 21 Litigation and Regulatory Contingencies to the consolidated financial statements.$62.2 million. The prior year rate of 6.2% reflected an expected ultimateincrease in loss rate of 4.9% for policy year 2010, with a net upward adjustment to the reserve estimates for prior policy years. The changes in estimates resultedyears reflected claims development above expected levels during 2014, primarily from higher than expecteddomestic commercial policies.  The reserve strengthening associated with domestic commercial policies was $41.4 million and was primarily attributable to several large commercial claims, emergence experienced during 2010 for policies issued priornet of anticipated recoveries, mainly from mechanics liens, and primarily related to 2009,policy years 2003, 2005 and lower than expected claims emergence experienced during 2010 for2007.  Other factors, including a large international commercial claim from policy year 2009. The rate of 6.8% in 2009 reflected an expected ultimate loss rate of 7.0% for policy year 2009, with a minor downward adjustment2004, also contributed to the net increase in the loss reserve estimates for certain prior policy years.

As of December 31, 2011,2014, the title insurance and services segment’s IBNR reserve was $816.6$802.1 million, which reflected themanagement’s best estimate from the Company’s internal actuarial analysis.estimate. The Company’s internal actuary also determined a range of reasonable estimates of $711.9$726.1 million to $990.9$990.5 million. The range limits are $104.7$76.0 million below and $174.3$188.4 million above themanagement’s best estimate, respectively, and represent an estimate of the range of variation among reasonable estimates of the IBNR reserve.

Actuarial estimates are sensitive to assumptions used in models, as well as the structures of the models themselves, and to changes in claims payment and incurral patterns, which can vary materially due to economic conditions, among other factors.

AdverseThe prior year rate of 8.8% reflected an ultimate loss rate of 5.0% for policy year 2013 and a net increase in the loss reserve estimates for prior policy years of $148.5 million. The increase in loss reserve estimates for prior policy years reflected claims development in 2011 included higher-than-expected claims emergence for commercial andabove expected levels during 2013, primarily from domestic lenders policies, particularlycommercial policies and the Company’s guaranteed valuation product offered in Canada.  The reserve strengthening associated with domestic lenders policies was $67.4 million and was primarily attributable to increased claims frequency for policy years 2004 through 2008.  The increased claims frequency was primarily due to mortgage lenders and servicers processing a large volume of foreclosures during 2013.  As foreclosure processing increases, lenders claims generally increase, because lenders claims typically come from foreclosures in which the lender suffers a loss.  At December 31, 2013, the Company expected the high level of foreclosure processing to continue in the near term as mortgage lenders and servicers worked through their foreclosure inventory.  The reserve strengthening associated with domestic lenders policies reflected these expectations.  The reserve strengthening associated with commercial policies was $38.8 million and was primarily attributable to several large commercial claims, mainly from mechanics liens, and primarily related to policy years 2007 and 2008.  The reserve strengthening associated with the guaranteed valuation product offered in Canada was $21.7 million and was primarily attributable to claims frequency exceeding the Company’s expectations during 2013.  The increase in frequency primarily related to policy years 2007 and 2010.

The 2012 rate of 6.9% reflected an ultimate loss rate of 5.1% for policy year 2012 and a net increase in the loss reserve estimates for prior policy years of $62.1 million. The increase in loss reserve estimates for prior policy years reflected claims development above expected levels during 2012, primarily from domestic lenders policies and international business, including the guaranteed valuation product offered in Canada. The reserve strengthening associated with domestic lenders policies was $25.6 million and was primarily attributable to policy years 2005 through 2007. Management believes that theseThis strengthening was primarily due to an increase in claims frequency experienced during 2012, partially offset by a slight decrease in severity. The reserve strengthening associated with the international business, excluding the guaranteed valuation product, was $15.6 million and was primarily related to increased severity experienced during 2012 for policy years have higher ultimate loss ratios than historical averages,2003 through 2011. The reserve strengthening associated with the guaranteed valuation product was $11.8 million and that they also havereflected an increase in claims frequency experienced accelerated reportingduring the first half of 2012. The increase in frequency primarily related to policy years 2008 and payment of claims, particularly on lenders policies. Reasons for higher loss levels and acceleration of claims reporting and payment include adverse underwriting conditions in real estate markets during 2005 through 2007, declines in real estate prices, increased levels of foreclosures and increased mechanics lien exposure due to failures of development projects.

2009.

The current economic environment continues to show more potential for volatility than usual over the short term, particularly in regard to real estate prices and mortgage defaults, which may affect title claims. Relevant contributing factors include highcontinuing elevated foreclosure volume, tight credit markets,inventory and foreclosure processing and general economic instability and government actions that may mitigate or exacerbate recent trends.uncertainty. Other factors, including factors not yet identified, may also influence claims development. At this point, economicWhile real estate and certainfinancial market conditions appearhave improved to be stabilizingsome extent as evidenced by increased real estate prices and improvinga decline in some respects, yetmortgage defaults, significant uncertainty remains. ThisIn addition, while foreclosure inventory and foreclosure processing remain elevated compared to historic norms, the level of inventory and processing has declined from its peak.  Nevertheless, the current environment results in

continues to create an increased potential for actual claims experience to vary

73


FIRST AMERICAN FINANCIAL CORPORATION

AND SUBSIDIARY COMPANIES

NOTES TO CONSOLIDATED FINANCIAL STATEMENTS—(Continued)

significantly from projections, in either direction, which would directly affect the claims provision. If actual claims vary significantly from expected, reserves may be adjusted to reflect updated estimates of future claims.

FIRST AMERICAN FINANCIAL CORPORATION

AND SUBSIDIARY COMPANIES

NOTES TO CONSOLIDATED FINANCIAL STATEMENTS—(Continued)

The volume and timing of title insurance claims are subject to cyclical influences from real estate and mortgage markets. Title policies issued to lenders constitute a large portion of the Company’s title insurance volume. These policies insure lenders against losses on mortgage loans due to title defects in the collateral property. Even if an underlying title defect exists that could result in a claim, often the lender must realize an actual loss, or at least be likely to realize an actual loss, for title insurance liability to exist. As a result, title insurance claims exposure is sensitive to lenders’ losses on mortgage loans, and is affected in turn by external factors that affect mortgage loan losses.

losses, particularly macroeconomic factors.

A general decline in real estate prices can expose lenders to greater risk of losses on mortgage loans, as loan-to-value ratios increase and defaults and foreclosures increase. The current environment may continue to have increased potential for claims on lenders’ title policies, particularly if defaults and foreclosures are at elevated levels. Title insurance claims exposure for a given policy year is also affected by the quality of mortgage loan underwriting during the corresponding origination year. The Company believes that sensitivity of claims to external conditions in real estate and mortgage markets is an inherent feature of title insurance’s business economics that applies broadly to the title insurance industry. Lenders have experienced high losses on mortgage loans from prior years, including loans that were originated during the years 2005 through 2007.2008. These losses have led to higher title insurance claims on lenders policies, and also have accelerated the reporting of claims that would have been realized later under more normal conditions.

Loss ratios (projected to ultimate value) for policy years 2005 through 2008 are higher than loss ratios for policy years 1992 through 2004. The major causes of the higher loss ratios for those four policy years are believed to be confined mostly to that underwriting period. These causes included: rapidly increasing residential real estate prices which led to an increase in the incidences of fraud, lower mortgage loan underwriting standards and a higher concentration than usual of subprime mortgage loan originations.

The projected ultimate loss ratios, as of December 31, 2011,2014, for policy years 2011, 20102014, 2013 and 20092012 were 5.6%5.3%, 4.7%4.6% and 5.2%3.8%, respectively, which are lower than the ratios for 2005 through 2008. These projections were based in part on an assumption that more favorable underwriting conditions existed in 2009 through 20112014 than in 2005 through 2008, including, but not limited to, tighter loan underwriting standards and lower housing prices.standards. Current claims data from policy years 2009 through 2011,2014, while still at an early stage of development for the more recent policy years within that period, supports this assumption.

A summary of the Company’s loss reserves broken down into its components of known title claims, incurred but not reported claims and non-title claims,is as follows:


(in thousands except percentages)

  December 31,
2011
 December 31,
2010
 

(in thousands, except percentages)


December 31, 2014


December 31, 2013


Known title claims

  $162,019     15.9 $192,268     17.4

Known title claims

$

165,330


16.3

%


$

135,478


13.3

%

IBNR

   816,603     80.5  875,627     79.0


Incurred but not reported claims

Incurred but not reported claims


802,069


79.3

%


840,104


82.5

%

Total title claims

   978,622     96.4  1,067,895     96.4

Total title claims


967,399


95.6

%


975,582


95.8

%

Non-title claims

   36,054     3.6  40,343     3.6

Non-title claims


44,381


4.4

%


42,783


4.2

%


Total loss reserves

  $1,014,676     100.0 $1,108,238     100.0

Total loss reserves

$

1,011,780


100.0

%


$

1,018,365


100.0

%


74


FIRST AMERICAN FINANCIAL CORPORATION

AND SUBSIDIARY COMPANIES

NOTES TO CONSOLIDATED FINANCIAL STATEMENTS—(Continued)


NOTE 10.    Notes and Contracts Payable:


   December 31, 
   2011   2010 
   (in thousands) 

Line of credit borrowings due June 1, 2013, weighted-average interest rate of 3.06% at December 31, 2011 and 2010

  $200,000    $200,000  

Trust deed notes with maturities through 2032, collateralized by land and buildings with a net book value of $54,583 and $56,021 at December 31, 2011 and 2010, respectively, weighted-average interest rate of 5.43% and 5.45%, at December 31, 2011 and 2010, respectively

   44,802     47,931  

Other notes and contracts payable with maturities through 2020, weighted-average interest rate of 2.02% and 4.39% at December 31, 2011 and 2010, respectively

   55,173     45,886  


  $299,975    $293,817  


December 31,


2014


2013


(in thousands, except percentages)


4.60% senior unsecured notes due November 15, 2024, net of unamortized discount of $74 at December 31, 2014, effective interest rate of 4.60%

$

299,926


$


4.30% senior unsecured notes due February 1, 2023, net of unamortized discount of $760 and $837 at December 31, 2014 and 2013, respectively, effective interest rate of 4.35%


249,240


249,163


Trust deed notes with maturities through 2032, collateralized by land and buildings with a net book value of $52,414 and $55,206 at December 31, 2014 and 2013, respectively, weighted-average interest rate of 5.39% and 5.42%, at December 31, 2014 and 2013, respectively


34,420


38,151


Other notes and contracts payable with maturities through 2020, weighted-average interest rate of 5.30% and 2.96% at December 31, 2014 and 2013, respectively


3,751


22,971


$

587,337


$

310,285


The weighted-average interest rate for the Company’s notes and contracts payable was 3.23%4.52% and 3.66%4.34% at December 31, 20112014 and 2010,2013, respectively.

On April 12, 2010,November 10, 2014, the Company entered into aissued $300.0 million of 4.60% 10-year senior unsecured notes due in 2024. The notes were priced at 99.975% to yield 4.603%. Interest is due semi-annually on May 15 and November 15, beginning May 15, 2015. The Company intends to use the net proceeds for general corporate purposes. In anticipation of the receipt of the net proceeds from this offering, the Company repaid all borrowings outstanding under its credit facility, increasing the available capacity thereunder to the full $700.0 million size of the facility.

In May 2014, the Company amended and restated its credit agreement with JPMorgan Chase Bank, N.A. (“JPMorgan”) in its capacity as administrative agent and a syndicate of lenders.

the lenders party thereto. The credit agreement is comprised of a $400.0$700.0 million revolving credit facility. TheUnless terminated earlier, the revolving loan commitments under the credit agreement will terminate on the third anniversaryMay 14, 2019. The obligations of the date of closing, or June 1, 2013. On June 1, 2010, the Company borrowed $200.0 million under the facility and transferred such funds to CoreLogic, as previously contemplatedcredit agreement are neither secured nor guaranteed. The agreement replaced the Company’s $600.0 million senior unsecured credit agreement that had been in connection withplace since November 14, 2012.  Proceeds under the Separation. Proceedscredit agreement may also be used for general corporate purposes. At December 31, 2011 and 2010,2014, the interest rate associated with the $200.0 million borrowedCompany had no outstanding borrowings under the facility is 3.06%. See Note 19 Transactions with CoreLogic/TFACfacility.

The credit agreement includes an expansion option that permits the Company, subject to satisfaction of certain conditions, to increase the revolving commitments and/or add term loan tranches (“Incremental Term Loans”) in an aggregate amount not to exceed $150.0 million. Incremental Term Loans, if made, may not mature prior to the consolidated financial statements for additional discussion of the $200.0 million transferred to CoreLogic.

The Company’s obligations under the credit agreement are guaranteed by certain of the Company’s subsidiaries (the “Guarantors”). To secure the obligations of the Company and the Guarantors (collectively, the “Loan Parties”) under the credit agreement, the Loan Parties pledged all of the equity interests they own in each Data Trace and Data Tree company and a 9% equity interest in FATICO.

If at any time the rating by Moody’s or S&P of the senior, unsecured, long-term indebtedness for borrowed money of the Company that is not guaranteed by any other person or subject to any other credit enhancement is rated lower than Baa3 or BBB-, respectively, or is not rated by either such rating agency, then the loan commitments are subject to mandatory reduction from (a) 50% of the net proceeds of certain equity issuances by any Loan Party, (b) 50% of the net proceeds of certain debt incurred or issued by any Loan Party, (c) 25% of the net proceeds received by any Loan Party from the disposition of CoreLogic stock received in connection with the Separation and (d) the net proceeds received by any Loan Party from certain dispositions of assets,revolving commitment termination date, provided that the commitment reductions described above are only requiredamortization may occur prior to the extent necessary to reduce the total loan commitments to $200.0 million. The Company is only required to prepay loans to the extent that, after giving effect to any mandatory commitment reduction, the aggregate principal amount of all outstanding loans exceeds the remaining total loan commitments.

FIRST AMERICAN FINANCIAL CORPORATION

AND SUBSIDIARY COMPANIES

NOTES TO CONSOLIDATED FINANCIAL STATEMENTS—(Continued)

such date.

At the Company’s election, borrowings of revolving loans under the credit agreement bear interest at (a) the Alternate Base Rate plus the Applicable Rateapplicable spread or (b) the Adjusted LIBOR rate plus the Applicable Rateapplicable spread (in each case as defined in the agreement). The Company may select interest periods of one, two, three or six months or (if agreed to by all lenders) such other number of months for Eurodollar borrowings of loans. The Applicable Rateapplicable spread varies depending upon the debt rating assigned by Moody’s Investor Service, Inc. and/or S&P to the credit agreement, or if no such rating is in effect, the Index Debt Rating.Standard & Poor’s Rating Services. The minimum Applicable Rateapplicable spread for Alternate Base Rate borrowings is 1.50%0.625% and the maximum is 2.25%1.00%. The minimum Applicable Rateapplicable spread for Adjusted LIBOR rate borrowings is 2.50%1.625% and the maximum is 3.25%2.00%.

The rate of interest on Incremental Term Loans will be established at or about the time such loans are made and may differ from the rate of interest on revolving loans.

The credit agreement includes representations and warranties, reporting covenants, affirmative covenants, negative covenants, financial covenants and events of default customary for financings of this type. Upon the occurrence of an event of default the lenders may accelerate the loans and may exercise their remedies under the collateral documents.loans. Upon the occurrence of certain insolvency and bankruptcy events of default

75


FIRST AMERICAN FINANCIAL CORPORATION

AND SUBSIDIARY COMPANIES

NOTES TO CONSOLIDATED FINANCIAL STATEMENTS—(Continued)

the loans will automatically accelerate. AtAs of December 31, 2011,2014, the Company iswas in compliance with the debtfinancial covenants under the credit agreement.

The aggregate annual maturities for notes and contracts payable in each of the five years after December 31, 2011,2014, are as follows:


Year

  Notes and
contracts
payable


Annual maturities


  (in thousands) 

(in thousands)


2012

  $30,155  

2013

   208,451  

2014

   13,459  

2015

   15,327  

2015

$

4,899


2016

   4,172  

2016


4,458


2017

2017


5,009


2018

2018


3,861


2019

2019


3,593


Thereafter

   28,411  

Thereafter


565,517


$

587,337


  $299,975  


NOTE 11.    Net Investment Income:

The components of net investment income are as follows:


  Year ended December 31, 

Year ended December 31,


  2011   2010   2009 

2014


2013


2012


  (in thousands) 

(in thousands)


Interest:


Cash equivalents and deposits with savings and loan associations and banks

  $6,602    $8,505    $14,019  

Cash equivalents and deposits with banks

$

4,471


$

3,694


$

4,407


Debt securities

   47,337     48,127     48,249  


56,373


47,226


45,112


Other long-term investments

   1,693     5,568     12,879  


1,213


2,009


1,013


Loans receivable

   10,172     10,995     10,711  


3,755


5,474


8,132


Dividends on marketable equity securities

   2,896     2,711     5,041  

Equity in earnings of affiliates

   8,099     8,376     10,877  

Dividends on equity securities


11,961


11,776


5,388


Equity in earnings of affiliates, net


(16,545

)


5,316


6,514


Other

   5,354     9,980     18,473  


10,488


14,400


10,465


  $82,153    $94,262    $120,249  


Total investment income


71,716


89,895


81,031


Investment expenses (1)


(675

)


Net investment income

$

71,041


$

89,895


$

81,031


(1)

Investment expenses include fees paid to third party investment managers, which the Company began utilizing in 2014.

76


FIRST AMERICAN FINANCIAL CORPORATION

AND SUBSIDIARY COMPANIES

NOTES TO CONSOLIDATED FINANCIAL STATEMENTS—(Continued)


NOTE 12.    Income Taxes:

For the years ended December 31, 2011, 20102014, 2013 and 2009,2012, domestic and foreign pretax income (loss) from continuing operations before noncontrolling interests was $128.2$301.8 million and $2.1$48.8 million, $213.5$286.2 million and $(1.4)$24.5 million, and $195.2$449.6 million and $9.1$17.8 million, respectively.

Income taxes are summarized as follows:


  Year ended December 31, 

Year ended December 31,


  2011 2010 2009 

2014


2013


2012


  (in thousands) 

(in thousands)


Current:


Federal

  $(23,095 $69,379   $(25,430

$

87,189


$

86,406


$

82,269


State

   (1,267  14,962    3,727  


4,751


7,887


15,229


Foreign

   13,926    13,657    12,450  


812


24,331


8,234


92,752


118,624


105,732


   (10,436  97,998    (9,253


Deferred:


Federal

   69,302    (680  82,488  


15,594


8,937


60,242


State

   4,585    (9,823  (4,668


(304

)


9,774


111


Foreign

   (11,737  (4,345  1,501  


8,303


(13,691

)


(407

)


23,593


5,020


59,946


   62,150    (14,848  79,321  

$

116,345


$

123,644


$

165,678


  $51,714   $83,150   $70,068  


Income taxes differ from the amounts computed by applying the federal income tax rate of 35.0%. A reconciliation of this difference is as follows:


  Year ended December 31, 

Year ended December 31,


  2011 2010 2009 


2014


2013


2012


  (in thousands) 

(in thousands, except percentages)


Taxes calculated at federal rate

  $45,603   $74,237   $71,521  

$

122,696


35.0

%


$

108,748


35.0

%


$

163,592


35.0

%

State taxes, net of federal benefit

   2,499    3,340    (612


2,891


0.8


11,480


3.7


9,525


2.0


Dividends received deduction

   (140  (250  (1,381

Change in liability for tax positions

   2,548    4,626    (8,776


412


0.1


3,537


1.1


2,033


0.4


Exclusion of certain meals and entertainment expenses

   2,245    2,889    2,675  

Change in capital loss valuation allowance

   —      (14,683  —    


(5,276

)


(1.1

)

Foreign taxes in excess of federal rate

   1,740    9,802    10,365  

Foreign income taxed at different rates


(6,091

)


(1.7

)


8,567


2.8


2,881


0.6


Foreign tax credits


(2,184

)


(0.6

)


(5,640

)


(1.8

)


(2,921

)


(0.6

)

Other items, net

   (2,781  3,189    (3,724


(1,379

)


(0.4

)


(3,048

)


(1.0

)


(4,156

)


(0.9

)


$

116,345


33.2

%


$

123,644


39.8

%


$

165,678


35.4

%

  $51,714   $83,150   $70,068  


The Company’s effective income tax rate (income tax expense as a percentage of income before income taxes), was 39.7%33.2% for 2011, 39.2%2014, 39.8% for 20102013 and 34.3%35.4% for 2009.2012. The differences in the effective tax rates were primarily due to changes in the ratio of permanent differences to income before income taxes, changes in state and foreign income taxes resulting from fluctuations in the Company’s noninsurance and foreign subsidiaries’ contribution to pretax profits, changes in the ratio of permanent differences to income before income taxes and changes in the liability related to tax positions reported on the Company’s tax returns. In addition, theThe effective tax rate for 2010 reflects2012 included the release of a valuation allowance recorded against capital losses.

77


FIRST AMERICAN FINANCIAL CORPORATION

AND SUBSIDIARY COMPANIES

NOTES TO CONSOLIDATED FINANCIAL STATEMENTS—(Continued)


The primary components of temporary differences that give rise to the Company’s net deferred tax assetsliability are as follows:


  December 31, 

December 31,


  2011 2010 

2014


2013


  (in thousands) 

(in thousands)


Deferred tax assets:


Deferred revenue

  $6,008   $6,103  

$

9,887


$

8,360


Employee benefits

   76,449    61,726  


74,068


73,302


Bad debt reserves

   13,484    17,508  


15,253


17,588


Investment in affiliates

   —      4,866  

Investments in affiliates


13,670


8,026


Loss reserves

   4,469    7,987  


2,507


1,728


Pension

   112,558    104,535  


120,401


86,858


Capital loss carryforward

   32,887    29,186  

Net operating loss carryforward

   28,175    22,134  


23,727


27,762


Securities and other

   5,422    —    

Securities


1,880


Foreign tax credit


2,184


Other

   6,134    4,301  


8,712


6,782


270,409


232,286


   285,586    258,346  

Valuation allowance


(15,706

)


(18,119

)


254,703


214,167


Deferred tax liabilities:


Depreciable and amortizable assets

   179,613    145,785  


284,532


258,855


Claims and related salvage

   29,533    (1,029


36,653


21,196


Investment in affiliates

   15,397    —    

Other

   —      (2,382

Securities


8,934


330,119


280,051


   224,543    142,374  


Net deferred tax asset before valuation allowance

   61,043    115,972  


Valuation allowance

   (21,426  (19,126


Net deferred tax asset

  $39,617   $96,846  


Net deferred tax liability

$

75,416


$

65,884


The exercise of stock options representsand vesting of RSUs represent a tax benefit andthat has been reflected as a reduction of taxes payable and an increase to equity. The benefits recorded were $1.1$6.9 million and $6.2 million for the years ended December 31, 20112014 and 2010, with no benefit recorded for the year ended December 31, 2009.

2013, respectively.

In connection with the Separation, the Company and TFAC entered into a Tax Sharing Agreement, dated June 1, 2010 (the “Tax Sharing Agreement”),tax sharing agreement which governs the Company’s and CoreLogic’s respective rights, responsibilities and obligations. Pursuant to the Tax Sharing Agreement, CoreLogic will prepare and file the consolidated federal incomeobligations for certain tax return, and any other tax returns that include both CoreLogic and the Company for all taxable periods ending on or prior to June 1, 2010. The Company will prepare and file all tax returns that include solely the Company for all taxable periods ending after that date. As part of the Tax Sharing Agreement, the Company is contingently responsible for 50% of certain Separation-related tax liabilities.related matters. At December 31, 20112014 and 2010, the Company had a payable of $2.5 million and $2.3 million, respectively, to CoreLogic related to these matters which is included in due to CoreLogic, net on the Company’s consolidated balance sheet.

At December 31, 2011 and 2010,2013, the Company had a net payable to CoreLogic of $35.4$35.1 million and $61.5$56.5 million, respectively, related to tax matters prior to the Separation. This amount is included in the Company’s consolidated balance sheetsheets in due to CoreLogic, net. During 2011,other accounts payable and accrued liabilities. The decrease during the Company recordedcurrent year was primarily the result of tax payments made and an examination settlement reached with a $5.2 million increase

FIRST AMERICAN FINANCIAL CORPORATION

AND SUBSIDIARY COMPANIES

NOTES TO CONSOLIDATED FINANCIAL STATEMENTS—(Continued)

to stockholders’ equity relatedtaxing authority for tax matters prior to the Separation to reflect the Company’s actual tax liability to be included in CoreLogic’s consolidated tax return for 2010.

Separation.

At December 31, 2011,2014, the Company had available a foreign tax credit carryover of $2.2 million.  The Company expects to utilize these credits within the carryover period.

At December 31, 2014, the Company had available net operating loss carryforwards for income tax purposes totaling $122.5 million, consisting of federal, state and foreign losses of $0.5 million, $38.5 million and $83.5 million, respectively.  Of the aggregate net operating loss carryforwards totaling, in aggregate, approximately $122.2losses, $41.2 million for income tax purposes, of which $45.2 million hashave an indefinite expiration. Theexpiration and the remaining $77.0$81.3 million expire at various times beginning in 2012.

2015. The Company hascarries a capital loss carryforwardvaluation allowance of $93.7$15.7 million of which $74.7against its deferred tax assets.  Of this amount, $13.3 million expiresrelates to net operating losses; the remaining $2.4 million relates to other foreign deferred tax assets.  The year-over-year decrease in 2012. In addition, the Company has net impairment and unrealized capital gains of $3.6 million, which includes $31.8 million of unrealized losses related to debt securities that the Company has the ability and intent to hold to recovery.

Theoverall valuation allowance relates to the utilization of certain foreign losses and other foreign deferred tax assets for certain of the Company’s tax capital losses, state net operating loss carryforwards and the Company’s foreign operations. against current year income.

The Company evaluates the realizability of its deferred tax assets by assessing the valuation allowance and by adjusting the amount of such allowance, if necessary. The factors used to assess the likelihood of realization are the Company’s forecast of future taxable income and available tax planning strategies that could be implemented to realize the net deferred

78


FIRST AMERICAN FINANCIAL CORPORATION

AND SUBSIDIARY COMPANIES

NOTES TO CONSOLIDATED FINANCIAL STATEMENTS—(Continued)

tax assets. FailureThe ability or failure to achieve the forecasted taxable income in the applicable taxing jurisdictions could affect the ultimate realization of deferred tax assets andassets.  Based on future operating results in certain jurisdictions, it is possible that the current valuation allowance positions of those jurisdictions could result in an increasebe adjusted in the Company’s effective tax rate on future earnings. The activity innext 12 months.

During 2012, the Company released a valuation allowance primarily results from the Company’s determinationof $5.3 million previously recorded against certain of its deferred tax assets. Specifically, management determined that it is notwas more likely than not that a portionall of its tax capital loss carryforwarditems will be realized prior to its expiration date, as the result of realized gains from sales of securities and favorable market value declinesactivity in its equity securities portfolio during the year.portfolio. Application of the accounting guidance related to intraperiod tax allocations resulted in recording the valuation allowance being credited to tax expense in accumulated other comprehensive income. In addition, the valuation allowance has been increased for certain state and foreign net operating losses.

amount of $5.3 million during the year ended December 31, 2012. As of December 31, 2014, no significant capital loss carryover remains in the Company’s deferred tax inventory.

As of December 31, 2011,2014 and 2013, United States taxes were not provided for on the cumulative earnings of the Company’s foreign subsidiaries of $114.8$132.8 million and $121.8 million, respectively, as the Company has invested or expects to invest the undistributed earnings indefinitely. If in the future these earnings are repatriated to the United States, or if the Company determines that the earnings will be remitted in the foreseeable future, additional tax provisions may be required. It is not practicalpracticable to calculate the deferred taxes associated with these earnings;earnings because of the variability of multiple factors that would need to be assessed at the time of any assumed repatriation; however, foreign tax credits may be available to reduce federal income taxes in the event of distribution.

As of December 31, 20112014, 2013 and 2010,2012, the liability for income taxes associated with uncertain tax positions was $17.3$24.1 million, $47.8 million and $11.1$47.9 million, respectively. ThisThe net decrease in the liability canduring 2014 was primarily attributable to an examination settlement reached with a taxing authority for issues related to the timing of deductibility, which, accordingly, did not impact the Company’s consolidated statement of income.  The net decrease in the liability during 2013 was primarily attributable to the Company’s effective settlement of a prior year tax return position. The net increase in the liability during 2012 was primarily attributable to the Company’s claim for a timing deduction in a prior year tax return.  As of December 31, 2014, 2013 and 2012, the liabilities could be reduced by $3.4 million, $32.6 million and $32.6 million, respectively, of offsetting tax benefits associated with the correlative effects of potential adjustments including timing adjustments and state income taxes and timing adjustmentstaxes. The net amounts of $2.9$20.7 million, $15.2 million and $1.5$15.3 million as of December 31, 20112014, 2013 and 2010, respectively. The net amount of $14.4 million and $9.6 million, as of December 31, 2011 and 2010,2012, respectively, if recognized, would favorably affect the Company’s effective tax rate.

FIRST AMERICAN FINANCIAL CORPORATION

AND SUBSIDIARY COMPANIES

NOTES TO CONSOLIDATED FINANCIAL STATEMENTS—(Continued)

A reconciliation of the beginning and ending amount of unrecognized tax benefits for the years ended December 31, 2011, 20102014, 2013 and 20092012 is as follows:


  December 31, 

December 31,


  2011   2010   2009 

2014


2013


2012


  (in thousands) 

(in thousands)


Unrecognized tax benefits—opening balance

  $11,100    $10,400    $18,900  

$

47,800


$

47,900


$

17,300


Gross decreases—tax positions in prior period

   —       —       (1,700

Gross (decreases) increases—tax positions in prior period


(24,100

)


(600

)


200


Gross increases—current period tax positions

   6,200     700     —    


400


500


30,500


Expiration of the statute of limitations for the assessment of taxes

   —       —       (6,800


(100

)


Unrecognized tax benefits—ending balance

  $17,300    $11,100    $10,400  

$

24,100


$

47,800


$

47,900


The Company’s continuing practice is to recognize interest and penalties, if any, related to uncertain tax positions in tax expense. As of December 31, 20112014, 2013 and 2010,2012, the Company had accrued $3.6$8.9 million, $4.7 million and $2.4$4.2 million, respectively, of interest and penalties (net of tax benefits of $1.4$3.7 million, $1.9 million and $0.9$1.7 million, respectively) related to uncertain tax positions.

The Company or one of its subsidiaries files income tax returns in the U.S. federal jurisdiction, various state jurisdictions, and various non-U.S. jurisdictions. The primary non-federal jurisdictions are California, Oregon, Michigan, Texas, Canada, India and the United Kingdom. The Company is no longer subject to U.S. federal, state and non-U.S. income tax examinations by taxing authorities for years prior to 2005.

79


FIRST AMERICAN FINANCIAL CORPORATION

AND SUBSIDIARY COMPANIES

NOTES TO CONSOLIDATED FINANCIAL STATEMENTS—(Continued)


It is reasonably possible that the amount of the unrecognized benefit with respect to certain of the Company’s unrecognized tax positions may significantly increase or decrease within the next 12 months. These changes may be the result of items such as ongoing audits or the expiration of federal and state statutestatutes of limitations for the assessment of taxes. The Company estimates that there will be no increase or decrease in unrecognized tax benefits within the next 12 months.

The Company records a liability for potential tax assessments based on its estimate of the potential exposure. New tax laws and new interpretations of laws and rulings by tax authorities may affect the liability for potential tax assessments. Due to the subjectivity and complex nature of the underlying issues, actual payments or assessments may differ from estimates. To the extent the Company’s estimates differ from actual payments or assessments, income tax expense is adjusted. The Company’s income tax returns in several jurisdictions are being examined by various tax authorities. The Company believes that adequate amounts of tax and related interest, if any, have been provided for any adjustments that may result from these examinations.

FIRST AMERICAN FINANCIAL CORPORATION

AND SUBSIDIARY COMPANIES


NOTES TO CONSOLIDATED FINANCIAL STATEMENTS—(Continued)

NOTE 13.    Earnings Per Share:

The Company’s potential dilutive securities are stock options and RSUs. Stock options and RSUs are reflected in diluted net income per share attributable to the Company’s stockholders by application of the treasury-stock method. There are no reconciling items for net income attributable to the Company for the three years ended December 31, 2011 necessary for the diluted net income per share attributable to the Company’s stockholders calculation. A reconciliation

The computation of weighted-average shares outstanding is as follows:

  2011  2010  2009 
  (in thousands, except per share data) 

Numerator for basic and diluted net income per share attributable to the Company’s stockholders:


Net income attributable to the Company

 $78,276   $127,829   $122,389  


Denominator for basic net income per share attributable to the Company’s stockholders:


Weighted-average shares

  105,197    104,134    104,006  

Effect of dilutive securities:


Employee stock options and restricted stock units

  1,717    2,043    —    


Denominator for diluted net income per share attributable to the Company’s stockholders

  106,914    106,177    104,006  


Net income per share attributable to the Company’s stockholders:


Basic

 $0.74   $1.23   $1.18  


Diluted

 $0.73   $1.20   $1.18  


For the year ended December 31, 2010, basic earnings per share was computed using the number of shares of common stock outstanding immediately following the Separation, as if such shares were outstanding for the entire period prior to the Separation, plus the weighted average number of such shares outstanding following the Separation through December 31, 2010.

For the year ended December 31, 2010, diluted earnings per share was computed using (i) the number of shares of common stock outstanding immediately following the Separation, (ii) the weighted average number of such shares outstanding following the Separation through December 31, 2010, and (iii) if dilutive, the incremental common stock that the Company would issue upon the assumed exercise of stock options and the vesting of RSUs using the treasury stock method.

For the year ended December 31, 2009 basic and diluted earnings per share were computed using the number of shares of common stock outstanding immediately following the Separation,is as if such shares were outstanding for the entire period.follows:


2014


2013


2012


(in thousands, except per share data)


Numerator


Net income attributable to the Company

$

233,534


$

186,367


$

301,041


Less: dividends and undistributed earnings allocated to unvested RSUs


514


324


682


Net income allocated to common stockholders

$

233,020


$

186,043


$

300,359


Denominator


Basic weighted-average shares


106,884


106,991


106,307


Effect of dilutive employee stock options and RSUs


1,804


2,111


2,235


Diluted weighted-average shares


108,688


109,102


108,542


Net income per share attributable to the Company’s stockholders


Basic

$

2.18


$

1.74


$

2.83


Diluted

$

2.15


$

1.71


$

2.77


For the years ended December 31, 20112014, 2013 and 2010, 1.4 million2012, 133 thousand, 11 thousand and 700 thousand, respectively, of stock options and RSUs were excluded from the weighted-average diluted common shares outstanding due to their antidilutive effect.


80


FIRST AMERICAN FINANCIAL CORPORATION

AND SUBSIDIARY COMPANIES

NOTES TO CONSOLIDATED FINANCIAL STATEMENTS—(Continued)

NOTE 14.    Employee Benefit Plans:

In connection with the Separation, the following occurred with respect to the following employee benefit plans:

The Company adopted TFAC’s 401(k) Savings Plan, which is now the First American Financial Corporation 401(k) Savings Plan (the “Savings Plan”). The account balances of employees of

FIRST AMERICAN FINANCIAL CORPORATION

AND SUBSIDIARY COMPANIES

NOTES TO CONSOLIDATED FINANCIAL STATEMENTS—(Continued)

CoreLogic who had previously participated in TFAC’s 401(k) Savings Plan were transferred to the CoreLogic, Inc. 401(k) Savings Plan.

The Company adopted TFAC’s deferred compensation plan. The Company assumed the portion of the deferred compensation liability associated with its employees and former employees of its businesses and CoreLogic assumed the portion of the deferred compensation liability associated with its employees and former employees of its businesses. Plan assets were divided in the same proportion as liabilities.

The Company assumed TFAC’s defined benefit pension plan, which was closed to new entrants effective December 31, 2001 and amended to “freeze” all benefit accruals as of April 30, 2008. The Company assumed the entire benefit obligation and all the plan assets associated with the defined benefit pension plan, including the portion attributable to participants who were employees of the businesses retained by CoreLogic in connection with the Separation, and CoreLogic issued a $19.9 million note payable to the Company which approximated the unfunded portion of the benefit obligation attributable to those participants. In September 2011, the Company received $17.3 million from CoreLogic in satisfaction of the remaining balance of the note. See Note 19 Transactions with CoreLogic/TFAC to the consolidated financial statements for further discussion of this note receivable from CoreLogic.

The Company adopted TFAC’s supplemental benefit plans. The Company assumed the portion of the benefit obligation associated with its employees and former employees of its businesses and CoreLogic assumed the portion of the benefit obligation associated with its employees and former employees of its businesses. The benefit obligation associated with certain participants was divided evenly between the Company and CoreLogic.

No material changes were made to the terms and conditions of the employee benefit plans assumed by the Company in connection with the Separation.

The Company’s Savings Plan allows for employee-elective contributions up to the maximum amount as determined by the Internal Revenue Code. The Company makes discretionary contributions to the Savings Plan based on profitability, as well as the contributions of the participants. The Company’s expense related to the Savings Plan amounted to $8.7 million, $12.1 million and $15.5 million for the years ended December 31, 2011, 2010 and 2009, respectively. This expense represents the discretionary contribution made by the Company following the Separation and by TFAC to the Company’s employees’ accounts prior to the Separation. The Savings Plan allows the participantsParticipants are allowed to purchase the Company’s common stock as one of the investment options, subject to certain limitations. The Savings Plan held 4,417,0003,528,000 shares and 4,968,0003,903,000 shares of the Company’s common stock, representing 4.2%3.3% and 4.8%3.7% of the Company’s total common shares outstanding at December 31, 20112014 and 2010,2013, respectively.

The Company’sCompany maintains a deferred compensation plan for certain employees that allows participants to defer up to 100% of their salary, commissions and bonus. Participants can allocate their deferrals among a variety of investment crediting options (known as “deemed investments”). DeemedThe term deemed investments meanmeans that the participant has no ownership interest in the funds they select; the funds are only used to measure the gains or losses that will be attributed to theireach participant’s deferral account over time. Participants can elect to have their deferral balance paid out in a future year while they are still employed or after their employment ends. The deferred compensation plan is exempt from most provisions of ERISAthe Employee Retirement Income Security Act (“ERISA”) because it is only available to a select group of management and highly compensated employees and is not a qualified employee benefit plan. To preserve the tax-deferred savings advantages of a nonqualified deferred compensation plan, federal law requires that it be unfunded or informally funded. The participants’Participant deferrals, and any earnings on those deferrals, are general unsecured obligations of the Company. The Company is informally fundingfunds the deferred compensation plan through a tax-advantaged investment known as variable universal life

FIRST AMERICAN FINANCIAL CORPORATION

AND SUBSIDIARY COMPANIES

NOTES TO CONSOLIDATED FINANCIAL STATEMENTS—(Continued)

insurance. Deferred compensation plan assets are held as an asset of the Company within a special trust, called a “Rabbi Trust.” At December 31, 20112014 and 2010,2013, the value of the assets in the Rabbi Trust of $59.5$78.6 million and $60.0$73.2 million, respectively, and the unfunded liabilities of $58.2$76.4 million and $61.9$71.1 million, arerespectively, were included in the consolidated balance sheets in other assets and pension costs and other retirement plans, respectively.

The Company’s defined benefit pension plan is a noncontributory, qualified defined benefit plan with benefits based on thean employee’s compensation and years of service. The defined benefit pension plan was closed to new entrants effective December 31, 2001 and amended to “freeze” all benefit accruals as of April 30, 2008.

The Company also has nonqualified, unfunded supplemental benefit plans covering certain management personnel. Benefits under theThe Executive and Management Supplemental Benefit Plans, are, subject to thecertain limitations, described below, based on a participant’s final average compensation, which is computed as the average compensationprovide participants with maximum benefits of the last five full calendar years preceding retirement. Maximum benefits under the Executive and Management Supplemental Benefit Plans are 30% and 15%, respectively, of final average annual compensation respectively. The Company’s compensation committee amended and restated the Executive and Management Supplemental Benefit Plans effective as ofover a fixed five year period. Effective January 1, 2011. The2011, the plans were amended to make the following changes, among others: (i) close the plansclosed to new participants; (ii) fix the period over which the final average compensation that is used to calculate a participant’s benefit is determined as the one-year average of the five-year period ending on December 31, 2010, irrespective of the participant’s actual retirement date; and (iii) cap the maximum annual benefit at $500,000 for the Company’s chief executive officer, at $350,000 for all other Executive Supplemental Benefit Plan participants and at $250,000 for all Management Supplemental Benefit Plan participants. The amendments to the Executive and Management Supplemental Benefit Plans were accounted for as negative plan amendments with the resulting decrease in the projected benefit obligations being recorded to accumulated other comprehensive income as a prior service credit.

Certain of the Company’s subsidiaries have separate savings plans and the Company’s international subsidiaries have other employee benefit plans. Expenses related to these plans thatand the Company’s deferred compensation plan are included in the table below under other plans, net line item shown below.

net.

The following table provides the principal components of the Company’s employee benefit plan expenses related to (i) the Company’s employees’ participation in TFAC’s benefit plans prior to the Separation and (ii) the Company’s benefit plans following the Separation:expenses:


  Year ended December 31, 

Year ended December 31,


  2011   2010   2009 

2014


2013


2012


  (in thousands) 

(in thousands)


Expense:


Savings plan

  $8,697    $12,080    $15,468  

$

16,333


$

10,458


$

27,778


Defined benefit pension plans

   22,386     19,652     8,643  


13,465


20,975


22,657


Unfunded supplemental benefit plans

   17,279     23,252     23,322  


14,614


16,673


16,553


Other plans, net

   6,628     8,730     1,849  


9,259


15,479


10,166


$

53,671


$

63,585


$

77,154


  $54,990    $63,714    $49,282  


81


FIRST AMERICAN FINANCIAL CORPORATION

AND SUBSIDIARY COMPANIES

NOTES TO CONSOLIDATED FINANCIAL STATEMENTS—(Continued)


The following table summarizes the balance sheet impact, includingCompany’s benefit obligations, assets and funded status associated with (i) the Company’s employees who participated in TFAC’sits defined benefit pension and supplemental benefit plans priorplans:


December 31,


2014


2013


Defined
benefit
pension
plans


Unfunded
supplemental
benefit plans


Defined
benefit
pension
plans


Unfunded
supplemental
benefit plans


(in thousands)


Change in projected benefit obligation:


Benefit obligation at beginning of year

$

382,035


$

226,458


$

424,462


$

250,226


Service costs


1,315


1,915


Interest costs


18,644


10,536


17,340


9,521


Plan amendment


2,088


Actuarial losses (gains)


76,164


37,281


(38,766

)


(24,233

)

Benefits paid


(26,176

)


(13,453

)


(21,001

)


(13,059

)

Projected benefit obligation at end of year


450,667


262,137


382,035


226,458


Change in plan assets:


Fair value of plan assets at beginning of year


313,469


294,216


Actual return on plan assets


24,400


10,971


Contributions


27,672


13,453


29,283


13,059


Benefits paid


(26,176

)


(13,453

)


(21,001

)


(13,059

)

Fair value of plan assets at end of year


339,365


313,469


Reconciliation of funded status:


Unfunded status of the plans

$

(111,302

)


$

(262,137

)


$

(68,566

)


$

(226,458

)

Amounts recognized in the consolidated balance sheet:


Accrued benefit liability

$

(111,302

)


$

(262,137

)


$

(68,566

)


$

(226,458

)

Amounts recognized in accumulated other comprehensive loss:


Unrecognized net actuarial loss

$

219,081


$

120,642


$

162,084


$

90,303


Unrecognized prior service cost (credit)


15


(24,964

)


40


(29,142

)


$

219,096


$

95,678


$

162,124


$

61,161


Accumulated benefit obligation at end of year

$

450,667


$

262,137


$

382,035


$

226,458


Net periodic cost related to the Separation and (ii) the Company’s defined benefit pension and supplemental benefit plans includes the following the Separation:components:


   December 31, 
   2011  2010 
   Defined
benefit
pension
plans
  Unfunded
supplemental
benefit plans
  Defined
benefit
pension
plans
  Unfunded
supplemental
benefit plans
 
   (in thousands) 

Change in projected benefit obligation:


Benefit obligation at beginning of year

  $371,224   $215,301   $288,997   $210,396  

Service costs

   —      2,167    —      3,899  

Interest costs

   19,077    11,075    18,155    12,711  

Actuarial losses

   14,271    7,088    23,863    19,496  

Benefits paid

   (18,816  (12,115  (14,010  (12,165

Impact of Separation

   —      —      54,219    15,906  

Impact of plan amendment

   —      —      —      (34,942


Projected benefit obligation at end of year

   385,756    223,516    371,224    215,301  


Change in plan assets:


Plan assets at fair value at beginning of year

   262,827    —      203,105    —    

Actual return on plan assets

   (5,990  —      18,800    —    

Contributions

   19,057    12,115    16,088    12,165  

Benefits paid

   (18,816  (12,115  (14,010  (12,165

Impact of Separation

   —      —      38,844    —    


Plan assets at fair value at end of year

   257,078    —      262,827    —    


Reconciliation of funded status:


Unfunded status of the plans

  $(128,678 $(223,516 $(108,397 $(215,301


Amounts recognized in the consolidated balance sheet:


Accrued benefit liability

  $(128,678 $(223,516 $(108,397 $(215,301


Amounts recognized in accumulated other comprehensive income:


Unrecognized net actuarial loss

  $215,769   $105,585   $198,738   $106,943  

Unrecognized prior service cost (credit)

   90    (40,049  115    (44,459


  $215,859   $65,536   $198,853   $62,484  


Year ended December 31,


2014


2013


2012


(in thousands)


Expense:


Service costs

$

1,315


$

1,915


$

1,712


Interest costs


29,180


26,861


29,068


Expected return on plan assets


(20,850

)


(18,776

)


(15,553

)

Amortization of net actuarial loss


22,587


32,033


28,368


Amortization of prior service credit


(4,153

)


(4,385

)


(4,385

)


$

28,079


$

37,648


$

39,210


82


FIRST AMERICAN FINANCIAL CORPORATION

AND SUBSIDIARY COMPANIES

NOTES TO CONSOLIDATED FINANCIAL STATEMENTS—(Continued)


Net periodic cost related to (i)actuarial loss and prior service credit for the Company’s employees’ participation in TFAC’s defined benefit pension and supplemental benefit plans priorexpected to the Separation and (ii) the Company’s defined benefit pension and supplemental benefit plans following the Separation includes the following components:

   Year ended December 31, 
   2011  2010  2009 
   (in thousands) 

Expense:


Service costs

  $2,167   $3,959   $4,476  

Interest costs

   30,152    30,866    28,923  

Expected return on plan assets

   (15,316  (12,666  (16,969

Amortization of net actuarial loss

   27,047    21,790    16,586  

Amortization of prior service credit

   (4,385  (1,045  (1,051


  $39,665   $42,904   $31,965  


The Company’s net actuarial loss and prior service credit for defined benefit pension and supplemental benefit plans that will be amortized from accumulated other comprehensive income (loss)loss into net periodic cost over the next fiscal year are expected to beinclude an expense of $29.1$34.0 million and a credit of $4.4$4.2 million, respectively.

Weighted-average actuarial assumptions used to determine costs for the plans were as follows:


   December 31, 
   2011  2010 

Defined benefit pension plans


Discount rate

   5.30  5.81

Rate of return on plan assets

   5.75  5.75

Unfunded supplemental benefit plans


Discount rate

   5.30  5.81


December 31,


2014


2013


Defined benefit pension plans


Discount rate


4.97

%


4.18

%

Rate of return on plan assets


6.50

%


6.50

%

Unfunded supplemental benefit plans


Discount rate


4.80

%


3.91

%

Weighted-average actuarial assumptions used to determine benefit obligations for the plans were as follows:


   December 31, 
   2011   2010 

Defined benefit pension plans


Discount rate

   4.90   5.30

Unfunded supplemental benefit plans


Discount rate

   4.90   5.30

Salary increase rate

   N/A(1)    5.00

(1)Effective January 1, 2011, the unfunded supplemental benefit plans were amended to, among other changes, fix the period over which the final average compensation that is used to calculate a participant’s benefit is determined as the one-year average of the five-year period ending on December 31, 2010, irrespective of the participant’s actual retirement date. Therefore, an assumption for salary increase rate is no longer required to determine the benefit obligation beginning December 31, 2011.


December 31,


2014


2013


Defined benefit pension plans


Discount rate


4.07

%


4.97

%

Unfunded supplemental benefit plans


Discount rate


4.00

%


4.80

%

The discount-ratediscount rate assumption used for the Company’s benefit plan accountingplans reflects the yield available on high-quality, fixed-income debt securities that match the expected timing of the benefit obligation payments.

The Company adopted updated mortality tables published by the Society of Actuaries in October 2014.  The revised RP-2014 tables reflect substantial life expectancy improvements relative to the last tables published in 2000.  

Assumptions for the expected long-term rate of return on plan assets of the defined benefit pension plans are based on future expectations for returns for each asset class based on the calculated market-related value of plan assets and the effect of periodic

FIRST AMERICAN FINANCIAL CORPORATION

AND SUBSIDIARY COMPANIES

NOTES TO CONSOLIDATED FINANCIAL STATEMENTS—(Continued)

target asset allocation rebalancing, adjusted for the payment of reasonable expenses of the plan from plan assets. The expected long-term rate of return on assets was selected from within a reasonable range of rates determined by (1) historical real and expected returns for the asset classes covered by the investment policy and (2) projections of inflation over the long-term period during which benefits are payable to plan participants. The Company believes the assumptions are appropriate based on the investment mix and long-term nature of the plan’s investments. The use of expected long-term returns on plan assets may result in recognized pension income that is greater or less than the actual returns of those plan assets in any given year. Over time, however, the expected long-term returns are designed to approximate the actual long-term returns, and therefore result in a pattern of income and cost recognition that more closely matches the pattern of the services provided by the employees.

The following table provides the funded status of the Company’s defined benefit pension and supplemental benefit plans:

   December 31, 
   2011   2010 
   Defined
benefit
pension
plans
   Unfunded
supplemental
benefit plans
   Defined
benefit
pension
plans
   Unfunded
supplemental
benefit plans
 
   (in thousands) 

Projected benefit obligation

  $385,756    $223,516    $371,224    $215,301  

Accumulated benefit obligation

  $385,756    $223,516    $371,224    $215,301  

Plan assets at fair value at end of year

  $257,078    $—      $262,827    $—    

The Company has a pension investment policy designed to meet or exceed the expected rate of return on plan asset assumptions.assumptions for assets of the plan. The policy’s investment objective is to increase the pension plan’s funding status to beingsuch that the plan becomes fully funded on a plan termination basis. basis by taking progressively less risk through aligning a greater percentage of plan assets with plan liabilities as the plan becomes more fully funded.

Under the investment policy, asset allocation targets are segmented into liability tracking assets and return seeking assets. The objective of this allocation strategy is to increase the percentage of assets in liability tracking investments as thesettlement funded status of the pension plan improves, theimproves. Return seeking assets generally include pooled investment manager is to implement a lower risk strategy in order to minimize funded status volatility, according to the predetermined asset allocation strategy disclosed below. This strategy is intended to provide the best balance of minimizing funded status volatility while maintaining upside potential over time in order to fully fund the pension plan. To achieve this, the pension plan assets are monitored regularly to determine the funded status of the plan. The investment manager is responsible for ensuring that the portfolio is invested in compliance with the stated guidelinesvehicles, foreign and that the individual investments are within acceptable risk tolerance levels. The investment manager will invest the assets of the plan in equity anddomestic equities, fixed income debtsecurities, cash, REITs, and commodities. Liability tracking assets generally include fixed income securities and cash. Sufficient liquidity is also maintained to providepooled investment vehicles. The plan maintains a level of cash flowand cash equivalents appropriate for ongoing needs.the timely disbursement of benefits and payment of expenses.

83


Cash investments may be made in short-term securities, such as commercial paper or variable rate notes, or in money market funds. The short-term securities are investment grade with a maturity of less than 13 months. Fixed income investments must be government or government agency obligations, corporate debt or preferred stock, or fixed income mutual funds. The corporate debt securities are investment grade. Common stock investments may be either individual issues or stock mutual funds. The Company’s pension investment policy prohibits the use of the following financial instruments: options, short sales, commodities, derivatives, letter stock, private or direct placements and margin purchases. At December 31, 2011 and 2010, the Company’s pension plan assets also include $6.7 million and $6.3 million, respectively, of investment contracts with insurance companies as part of an acquired plan.

FIRST AMERICAN FINANCIAL CORPORATION

AND SUBSIDIARY COMPANIES

NOTES TO CONSOLIDATED FINANCIAL STATEMENTS—(Continued)


Subject to the requirements of the investment policy, the investment manager may use commingled investment vehicles including but not limited to mutual funds, common trust funds, commingled trusts, and exchange traded funds. The Company’s target assetinvestment policy prohibits certain investment transactions, including derivatives and other illiquid investments (e.g., private equity and real estate), subject to certain exceptions.

The investment manager tracks the estimated settlement funded status of the plan on a regular basis. When the funded status is equal to or greater than the next trigger point, the investment manager will rebalance to the allocation associated with that trigger point. The objective of liability tracking assets is to achieve performance related to changes in the value of the plan’s settlement liabilities, which is consistent with the objective of plan termination.

Asset allocation targets based on settlement funded status for the defined benefit pension plans are as follows:


Funded Ratio


Domestic and International
Equities


Fixed Income

70% or less

  60%  40%

     75%

  53%  47%

     80%

  45%  55%

     85%

  38%  62%

     90%

  31%  69%

     95%

  23%  77%

     100%

  16%  84%

     105%

  9%  91%

     110%

  0%  100%

The investment manager must maintain a threshold of within 2% for each portfolio category.

Settlement funded status


Return seeking assets


Liability tracking assets

100.0

%


0

%


100

%

97.5

%


15

%


85

%

95.0

%


30

%


70

%

92.5

%


40

%


60

%

90.0

%


50

%


50

%

87.5

%


60

%


40

%

85.0

%


70

%


30

%

Below 85.0%


85

%


15

%

A summary of the defined benefit pension plan’s asset allocationallocations as of December 31, 20112014 and 20102013 are as follows:


   Percentage of
plan assets at
December 31,
 
  2011  2010 

Asset category


Domestic and international equities

   61.4  61.6

Fixed income

   36.4  34.1

Cash

   2.2  4.3


December 31,


2014


2013


Asset category


Cash and cash equivalents


0.3

%


0.7

%

Equities


45.5

%


48.3

%

Fixed income funds


32.5

%


29.7

%

Balanced funds


19.4

%


18.9

%

Other


2.3

%


2.4

%

The Company expects to make cash contributions to its pension plansdefined benefit and unfunded supplemental benefit plans of $20.7$21.7 million and $13.6$14.1 million, respectively, during 2012.2015.

The following benefitBenefit payments for all plans, which reflect expected future service, as appropriate, are expected to be paidmade as follows:


Year

  (in thousands) 


(in thousands)


2012

  $31,500  

2013

  $32,523  

2014

  $33,626  

2015

  $34,559  

2015

$

36,141


2016

  $34,896  

2016

$

36,100


2017

2017

$

38,607


2018

2018

$

40,498


2019

2019

$

42,110


Five years thereafter

  $193,550  

Five years thereafter

$

220,002


The Company categorizes its defined benefit pension plan assets carried at fair value using a three-level hierarchy for fair value measurements. See Note 15 Fair Value Measurements for a more in-depth discussion on the fair value hierarchy and a description for each level.

84


FIRST AMERICAN FINANCIAL CORPORATION

AND SUBSIDIARY COMPANIES

NOTES TO CONSOLIDATED FINANCIAL STATEMENTS—(Continued)


The Company determinesfollowing table presents the fair value of itsthe Company’s defined benefit pension plansplan assets as of December 31, 2014 and 2013:

December 31, 2014

Estimated 

fair value


Level 1


Level 2


Level 3


(in thousands)


Cash and cash equivalents

$

1,101


$

1,101


$


$


Equities (a)


154,279


101,304


52,975


Fixed income funds (b)


110,405


59,507


50,898


Balanced funds (c)


65,856


65,856


Other (d)


7,724


7,724


$

339,365


$

161,912


$

169,729


$

7,724


December 31, 2013

Estimated
fair value


Level 1


Level 2


Level 3


(in thousands)


Cash and cash equivalents

$

2,080


$

2,080


$


$


Equities (a)


151,604


95,860


55,744


Fixed income funds (b)


93,210


49,281


43,929


Balanced funds (c)


59,147


59,147


Other (d)


7,428


7,428


$

313,469


$

147,221


$

158,820


$

7,428


(a) Investments in passively managed index funds, actively managed mutual funds with holdings in domestic and international equities, and investments in domestic equities. These investments are valued at the closing price reported on the major market on which the individual securities are traded or the Net Asset Value (“NAV”) provided by the administrator of the fund.

(b) Investments in passively managed index funds and actively managed mutual funds with holdings in domestic and international corporate bonds, sovereign bonds, mortgage-backed securities, and other fixed income instruments. These investments are valued using matrix pricing models and quoted prices of the securities in active markets.

(c) Investments in global multi-asset risk parity strategy funds with holdings in domestic and international debt and equity securities, commodities, real estate, and derivative investments.  These investments are valued using the NAV provided by the administrator of the fund.

(d) Investments in a guaranteed deposit fund with holdings in insurance contracts.  These investments are valued at contract value of the fund including contributions and earnings, less applicable costs and liabilities, as provided by the administrator of the fund.  

NOTE 15.    Fair Value Measurements:

Certain of the Company’s assets are carried at fair value. Fair value is defined as the price that would be received to sell an asset or paid to transfer a liability in an orderly transaction between market participants at the measurement date.  

The Company categorizes its assets and liabilities carried at fair value using a three-level hierarchy for fair value measurements that distinguishes between market participant assumptions developed based on market data obtained from sources independent of the reporting entity (observable inputs) and the reporting entity’s own assumptions about market participant assumptions developed based on the best information available in the circumstances (unobservable inputs). The hierarchy for inputs used in determining fair value maximizes the use of observable inputs and minimizes the use of unobservable inputs by requiring that observable inputs be used when available. The hierarchy level assigned to each security in the Company’s defined benefit pension plan assets and liabilities is based on management’s assessment of the transparency and reliability of the inputs used into estimate the valuation of such instrumentfair values at the measurement date. See Note 3 Debt and Equity Securities to the consolidated financial statementsThe three hierarchy levels are defined as follows:

Level 1—Valuations based on unadjusted quoted market prices in active markets for a more in-depth discussion on the fair value hierarchy and a description for each level.identical assets or liabilities.

85


FIRST AMERICAN FINANCIAL CORPORATION

AND SUBSIDIARY COMPANIES

NOTES TO CONSOLIDATED FINANCIAL STATEMENTS—(Continued)

Level 2—Valuations based on observable inputs (other than Level 1 prices), such as quoted prices for similar assets or liabilities at the measurement date; quoted prices in markets that are not active; or other inputs that are observable, either directly or indirectly.

Level 3—Valuations based on inputs that are unobservable and significant to the overall fair value measurement, and involve management judgment.

If the inputs used to measure fair value fall into different levels of the fair value hierarchy, the hierarchy level assigned is based upon the lowest level of input that is significant to the fair value measurement.

Assets measured at fair value on a recurring basis

The valuation techniques and inputs used by the Company to estimate the fair value of assets measured on a recurring basis, are summarized as follows:

Debt securities

The fair value of debt securities was based on the market values obtained from independent pricing services that were evaluated using pricing models that vary by asset class and incorporate available trade, bid and other market information and price quotes from well-established independent broker-dealers. The independent pricing services monitor market indicators, industry and economic events, and for broker-quoted only securities, obtain quotes from market makers or broker-dealers that they recognize to be market participants. The pricing services utilize the market approach in determining the fair value of the debt securities held by the Company. The Company obtains an understanding of the valuation models and assumptions utilized by the services and has controls in place to determine that the values provided represent fair value. The Company’s validation procedures include comparing prices received from the pricing services to quotes received from other third party sources for certain securities with market prices that are readily verifiable. If the price comparison results in differences over a predefined threshold, the Company will assess the reasonableness of the changes relative to prior periods given the prevailing market conditions and assess changes in the issuers’ credit worthiness, performance of any underlying collateral and prices of the instrument relative to similar issuances. To date, the Company has not made any material adjustments to the fair value measurements provided by the pricing services.

Typical inputs and assumptions to pricing models used to value the Company’s U.S. Treasury bonds, municipal bonds, foreign bonds, governmental agency bonds, governmental agency mortgage-backed securities and corporate debt securities include, but are not limited to, benchmark yields, reported trades, broker-dealer quotes, credit spreads, credit ratings, bond insurance (if applicable), benchmark securities, bids, offers, reference data and industry and economic events. For mortgage-backed securities, inputs and assumptions may also include the structure of issuance, characteristics of the issuer, collateral attributes and prepayment speeds. The fair value of non-agency mortgage-backed securities was obtained from the independent pricing services referenced above and subject to the Company’s validation procedures discussed above. However, since these securities were not actively traded and there were fewer observable inputs available requiring the pricing services to use more judgment in determining the fair value of the securities, they were classified as Level 3.

The significant unobservable inputs used in the fair value measurement of the Company’s non-agency mortgage-backed securities include prepayment rates, default rates and loss severity in the event of default. Significant increases (decreases) in any of those inputs in isolation would result in a significantly lower (higher) fair value measurement. Generally, a change in the assumption used for default rates is accompanied by a directionally similar change in the assumption used for the loss severity and a directionally opposite change in the assumption used for prepayment rates.

Equity securities

The fair value of equity securities, including preferred and common stocks, were based on quoted market prices for identical assets that are readily and regularly available in an active market.

86


FIRST AMERICAN FINANCIAL CORPORATION

AND SUBSIDIARY COMPANIES

NOTES TO CONSOLIDATED FINANCIAL STATEMENTS—(Continued)


The following table presents the Company’s defined benefit pension plan assets at fair value of the Company’s assets measured on a recurring basis as of December 31, 20112014 and 2010, classified using2013:

(in thousands)


Total


Level 1


Level 2


Level 3


December 31, 2014


Assets:


Debt securities:


U.S. Treasury bonds


$

64,982


$


$

64,982


$


Municipal bonds


587,677


587,677


Foreign bonds


196,750


196,750


Governmental agency bonds


197,874


197,874


Governmental agency mortgage- backed securities


1,812,162


1,812,162


Non-agency mortgage-backed securities


16,538


16,538


Corporate debt securities


574,269


574,269


3,450,252


3,433,714


16,538


Equity securities:


Preferred stocks


15,525


15,525


Common stocks


386,887


386,887


402,412


402,412

��


Total assets


$

3,852,664


$

402,412


$

3,433,714


$

16,538


(in thousands)


Total


Level 1


Level 2


Level 3


December 31, 2013


Assets:


Debt securities:


U.S. Treasury bonds


$

66,384


$


$

66,384


$


Municipal bonds


485,965


485,965


Foreign bonds


222,508


222,508


Governmental agency bonds


262,545


262,545


Governmental agency mortgage- backed securities


1,403,309


1,403,309


Non-agency mortgage-backed securities


19,022


19,022


Corporate debt securities


360,084


360,084


2,819,817


2,800,795


19,022


Equity securities:


Preferred stocks


11,085


11,085


Common stocks


346,958


346,958


358,043


358,043


Total assets


$

3,177,860


$

358,043


$

2,800,795


$

19,022


The Company did not have any transfers in and out of Level 1, Level 2 and Level 3 measurements during the years ended December 31, 2014 and 2013. The Company’s policy is to recognize transfers between levels in the fair value hierarchy:hierarchy at the end of the reporting period.

87

   Estimated fair
value as of
December 31, 2011
   Level 1   Level 2   Level 3 
  (in thousands)     

Cash and cash equivalents

  $5,591    $5,591    $—      $—    


Debt securities:


Municipal bonds

   6,801     —       6,801     —    

Foreign bonds

   3,724     —       3,724    —    

Governmental agency mortgage-backed securities

   15,100     —       15,100     —    

Corporate debt securities

   61,284     —       61,284     —    


   86,909     —       86,909     —    


Equity securities:


Preferred stocks

   2,954     2,954     —       —    

Domestic common stocks

   105,550     105,550     —       —    

International common stocks

   49,347     49,347     —       —    


   157,851     157,851     —       —    


Investment contracts with insurance companies

   6,727     —       —      


6,727


  $257,078    $163,442    $86,909    $6,727  


   Estimated fair
value as of
December 31, 2010
   Level 1   Level 2   Level 3 
  (in thousands)     

Cash and cash equivalents

  $11,209    $11,209    $—      $—    


Debt securities:


Municipal bonds

   8,874     —       8,874     —    

Foreign bonds

   4,082     —       4,082     —    

Governmental agency mortgage-backed securities

   25,481     —       25,481     —    

Corporate debt securities

   45,034     —       45,034     —    


   83,471     —       83,471     —    


Equity securities:


Preferred stocks

   3,618     3,618     —       —    

Domestic common stocks

   107,119     107,119     —       —    

International common stocks

   51,139     51,139     —       —    


   161,876     161,876     —       —    


Investment contracts with insurance companies

   6,271     —       —       6,271  


  $262,827    $173,085    $83,471    $6,271  


FIRST AMERICAN FINANCIAL CORPORATION

AND SUBSIDIARY COMPANIES

NOTES TO CONSOLIDATED FINANCIAL STATEMENTS—(Continued)


NOTE 15.    Fair ValueThe following table presents a summary of Financial Instruments:

Guidance requires disclosure of fair value information about financial instruments, whether or not recognizedthe changes in the balance sheet, for which it is practical to estimate that value. In the measurement of the fair value of certain financialLevel 3 assets measured on a recurring basis for the years ended December 31, 2014 and 2013:


Year Ended
December 31,


(in thousands)


2014


2013


Non-agency mortgage-backed securities:


Fair value at beginning of year


$

19,022


$

21,846


Total gains/(losses) (realized and unrealized):


Included in earnings:


Net other-than-temporary impairment losses recognized in earnings


(1,701

)


Included in other comprehensive income


1,225


4,174


Settlements


(2,008

)


(6,998

)

Fair value as of December 31


$

16,538


$

19,022


Unrealized gains (losses) included in earnings for the period relating to Level 3 available-for-sale investments that were still held at the end of the period:


Net other-than-temporary impairment losses recognized in earnings


$

(1,701

)


$


The Company did not purchase or sell any non-agency mortgage-backed securities during the years ended December 31, 2014 and 2013.

Financial instruments other valuation techniques were utilized if quoted market prices were not available. These derivedmeasured at fair value estimates are significantly affected by the assumptions used. Additionally, the guidance excludes certain financial instruments including those related to insurance contracts, pension and other postretirement benefits, and equity method investments.

In estimating the fair value of theits financial instruments presented,not measured at fair value, the Company used the following methods and assumptions:

Cash and cash equivalents

The carrying amount for cash and cash equivalents is a reasonable estimate of fair value due to the short-term maturity of these investments.

Accounts and accrued income receivable, net

The carrying amount for accounts and accrued income receivable is a reasonable estimate of fair value due to the short-term maturity of these assets.

Loans receivable, net

Deposits with banks

The fair value of loans receivabledeposits with banks is estimated based on the discounted value of the future cash flows using the current rates beingcurrently offered for loans with similar terms to borrowersdeposits of similar credit quality.remaining maturities, where applicable.

Investments

The carrying amount of deposits with savings and loan associations and banks is a reasonable estimate of fair value due to their short-term nature.

The methodology for determining the fair value of debt and equity securities is discussed in Note 3 Debt and Equity Securities to the consolidated financial statements.

Notes receivable, net

The fair value of notes receivable, net is estimated based on the discounted value of the future cash flows using approximate current market rates being offered for notes with similar maturities and similar credit quality.

The fair value of the notes receivable from CoreLogic is estimated based on the discounted value of the future cash flows using the current rates being offered for loans with similar terms to third party borrowers of similar credit quality.

Deposits

The carrying value of escrow and passbookother deposit accounts approximates fair value due to the short-term nature of this liability. The fair value of investment certificate accounts was estimated based on the discounted value of future cash flows using a discount rate approximating current market rates for similar liabilities.

88


FIRST AMERICAN FINANCIAL CORPORATION

AND SUBSIDIARY COMPANIES

NOTES TO CONSOLIDATED FINANCIAL STATEMENTS—(Continued)


Accounts payable and accrued liabilities

The carrying amount for accounts payable and accrued liabilities is a reasonable estimate of fair value due to the short-term maturity of these liabilities. The Company did not include the carrying amounts and fair values of pension costs and other retirement plans as the guidance excludes them from disclosure.

Due to CoreLogic, net

The carrying amount for due to CoreLogic, net is a reasonable estimate of fair value due to the short-term maturity of this liability.

Notes and contracts payable

The fair value of notes and contracts payable wereare estimated based on the current rates offered to the Company for debt of the same remaining maturities.

The following table presents the carrying amounts and estimated fair values of the Company’s financial instruments not measured at fair value as of December 31, 20112014 and 2010 are presented in the following table.2013:


  December 31, 
 2011  2010 
 Carrying
Amount
  Fair Value  Carrying
Amount
  Fair Value 
  (in thousands) 

Financial Assets:


Cash and cash equivalents

 $418,299   $418,299   $728,746   $728,746  

Accounts and accrued income receivable, net

 $227,847   $227,847   $234,539   $234,539  

Loans receivable, net

 $139,191   $144,868   $161,526   $166,904  

Investments:


Deposits with savings and loan associations and banks

 $56,201   $56,201   $59,974   $59,974  

Debt securities

 $2,201,911   $2,201,911   $2,107,984   $2,107,984  

Equity securities

 $184,000   $184,000   $282,416   $282,416  

Notes receivable, net

 $15,581   $14,534   $16,068   $14,901  

Notes receivable from CoreLogic

 $—     $—     $18,787   $18,708  

Financial Liabilities:


Deposits

 $1,093,236   $1,093,771   $1,482,557   $1,483,317  

Accounts payable and accrued liabilities

 $303,478   $303,478   $327,087   $327,087  

Due to CoreLogic, net

 $53,264   $53,264   $62,370   $62,370  

Notes and contracts payable

 $299,975   $304,806   $293,817   $295,465  


Carrying


Estimated fair value


(in thousands)


Amount


Total


Level 1


Level 2


Level 3


December 31, 2014


Assets:


Cash and cash equivalents


$

1,190,080


$

1,190,080


$

1,190,080


$


$


Deposits with banks


$

21,445


$

21,540


$

4,068


$

17,472


$


Notes receivable, net


$

6,130


$

3,930


$


$


$

3,930


Liabilities:


Deposits


$

2,332,714


$

2,332,714


$

2,332,714


$


$


Notes and contracts payable


$

587,337


$

595,087


$


$

588,542


$

6,545


Carrying


Estimated fair value


(in thousands)


Amount


Total


Level 1


Level 2


Level 3


December 31, 2013


Assets:


Cash and cash equivalents


$

834,837


$

834,837


$

834,837


$


$


Deposits with banks


$

23,492


$

23,601


$

2,070


$

21,531


$


Notes receivable, net


$

10,542


$

9,953


$


$


$

9,953


Liabilities:


Deposits


$

1,692,932


$

1,693,138


$

1,666,336


$

26,802


$


Notes and contracts payable


$

310,285


$

301,007


$


$

294,221


$

6,786


NOTE 16.    Share-Based Compensation Plans:

Prior to the Separation, the Company participated in TFAC’s share-based compensation plans and the Company’s employees were issued TFAC equity awards. The equity awards consisted of RSUs and stock options. At the date of the Separation, TFAC’s outstanding equity awards for employees of the Company and former employees of its businesses were converted into equity awards of the Company with adjustments to the number of shares underlying each such award and, with respect to options, adjustments to the per share exercise price of each such award, to maintain the pre-separation value of such awards. No material changes were made to the vesting terms or other terms and conditions of the awards. As the post-separation value of the equity awards

FIRST AMERICAN FINANCIAL CORPORATION

AND SUBSIDIARY COMPANIES

NOTES TO CONSOLIDATED FINANCIAL STATEMENTS—(Continued)

was equal to the pre-separation value and no material changes were made to the terms and conditions applicable to the awards, no incremental expense was recognized by the Company related to the conversion.

In connection with the Separation, the Company established the First American Financial Corporation 2010 Incentive Compensation Plan (the “Incentive Compensation Plan”). The Incentive Compensation Plan was adopted by the Company’s board of directors and approved by TFAC, as the Company’s sole stockholder, on, effective May 28, 2010. Eligible participants in the Incentive Compensation Plan include the Company’s directors and officers, as well as other employees. The Incentive Compensation Plan2010, permits the granting of stock options, stock appreciation rights, restricted stock, RSUs, performance units, performance shares and other stock-based awards. Under the terms ofEligible participants in the Incentive Compensation Plan 16.0include the Company’s directors and officers, as well as other employees. At December 31, 2014, 6.0 million shares of common stock canremain available to be awardedissued from either authorized and unissued shares or previously issued shares acquired by the Company, subject to certain annual limits on the amounts that can be awarded based on the type of award granted. The Incentive Compensation Plan terminates 10 years from the effective date unless cancelled prior to that date by the Company’s board of directors.

In connection with the Separation, the Company established theThe First American Financial Corporation 2010 Employee Stock Purchase Plan (the “ESPP”). The ESPP allows eligible employees the option to purchase common stock of the Company at 85.0%85% of the lower of the closing price on either the first or last day of each month. Prior to the Separation, the Company’s employees participated in TFAC’s employee stock purchase plan.quarterly offering period. There were 352,000354,000 and 350,000 shares issued in connection with the Company’sthis plan for the year ended December 31, 2011, and 175,000 and 208,000 shares issued in connection with the Company’s and TFAC’s plans for the years ended December 31, 20102014 and 2009,2013, respectively. At December 31, 2011,2014, there were 1,474,0003.4 million shares reserved for future issuances.

89


FIRST AMERICAN FINANCIAL CORPORATION

AND SUBSIDIARY COMPANIES

NOTES TO CONSOLIDATED FINANCIAL STATEMENTS—(Continued)


The following table presents the share-based compensation expense associated with (i) the Company’s employees that participated in TFAC’s share-based compensation plans prior to the Separation and (ii) the Company’s share-based compensation plans following the Separation:plans:


  2011   2010   2009 

2014


2013


2012


(in thousands) 

(in thousands)


Expense:


Restricted stock units

  $14,203    $11,876    $13,534  

$

17,197


$

20,827


$

13,953


Stock options

   9     315     493  


271


8


Employee stock purchase plan

   769     638     536  


1,834


1,466


886


$

19,302


$

22,301


$

14,839


  $14,981    $12,829    $14,563  


The following table summarizes RSU activity for the year ended December 31, 2011:2014:


(in thousands, except weighted-average grant-date fair value)

  Shares  Weighted-average
grant-date
fair value
 

RSUs unvested at December 31, 2010

   3,686   $12.18  

Granted during 2011

   798   $16.31  

Vested during 2011

   (840 $14.04  

Forfeited during 2011

   (503 $11.60  


RSUs unvested at December 31, 2011

   3,141   $12.83  


(in thousands, except weighted-average grant-date fair value)


Shares


Weighted-average
grant-date
fair value


RSUs unvested at December 31, 2013


2,720


$

17.60


Granted during 2014


740


$

26.76


Vested during 2014


(1,099

)


$

16.08


Forfeited during 2014


(24

)


$

18.45


RSUs unvested at December 31, 2014


2,337


$

21.21


As of December 31, 2011,2014, there was $16.8$19.6 million of total unrecognized compensation cost related to nonvestedunvested RSUs that is expected to be recognized over a weighted-average period of 2.83.0 years. The fair value of

FIRST AMERICAN FINANCIAL CORPORATION

AND SUBSIDIARY COMPANIES

NOTES TO CONSOLIDATED FINANCIAL STATEMENTS—(Continued)

RSUs is generally based on the market value of the Company’s shares on the date of grant. The total fair value of shares vested and not distributed for the years ended December 31, 2011, 20102014, 2013 and 20092012 was $2.2$3.2 million, $3.5$4.3 million and $0.9$2.3 million, respectively.

The following table summarizes stock option activity for the year ended December 31, 2011:2014:


(in thousands, except weighted-average
exercise price and contractual term)

  Number
outstanding
  Weighted-
average
exercise price
   Weighted-
average
remaining
contractual term
   Aggregate
intrinsic
value
 

Balance at December 31, 2010

   2,863   $14.68      

Exercised during 2011

   (183 $10.82      

Forfeited during 2011

   (44 $18.09      


Balance at December 31, 2011

   2,636   $14.89     2.6    $1,754  


Vested at December 31, 2011

   2,636   $14.89     2.6    $1,754  


Exercisable at December 31, 2011

   2,636   $14.89     2.6    $1,754  


(in thousands, except weighted-average
exercise price and contractual term)


Number
outstanding


Weighted-
average
exercise price


Weighted-
average
remaining
contractual term


Aggregate
intrinsic
value


Balance at December 31, 2013


1,270


$

18.03


Exercised during 2014


(584

)


$

15.51


Balance at December 31, 2014


686


$

20.18


2.2 years


$

9,405


Vested and expected to vest at December 31, 2014


686


$

20.18


2.2 years


$

9,405


Exercisable at December 31, 2014


586


$

18.92


1.1 years


$

8,786


AllAs of December 31, 2014, there was $0.8 million of total unrecognized compensation cost related to unvested stock options issued underof the Company’s plans are vested and no share-based compensation expense related to such stock options remainsCompany that is expected to be recognized.

recognized over a weighted-average period of 3.0 years.

Total intrinsic value of options exercised for the years ended December 31, 2011, 20102014, 2013 and 20092012 was $645 thousand, $168 thousand$7.0 million, $6.0 million and $2.9$7.1 million, respectively. This intrinsic value represents the difference between the fair market value of the Company’s common stock on the date of exercise and the exercise price of each option.


NOTE 17.    Stockholders’ Equity:

In March 2011,2014, the Company’s board of directors approved aan increase in the size of the Company’s stock repurchase plan which authorizes the repurchase of up tofrom $150.0 million to $250.0 million, of the Company’s common stock.which $182.9 million remained as of December 31, 2014. Purchases may be made from time to time by the Company in the open market at prevailing market prices or in privately negotiated transactions. AsThe Company did not repurchase any shares of its common stock during the year ended December 31, 2014 and as of December 31, 2011, the Company2014, had repurchased and retired 204 thousand3.2 million shares of its common stock under the current authorization for a total purchase price of $2.5$67.1 million.

90


FIRST AMERICAN FINANCIAL CORPORATION

AND SUBSIDIARY COMPANIES

NOTES TO CONSOLIDATED FINANCIAL STATEMENTS—(Continued)


NOTE 18.    Commitments and Contingencies:

Lease commitments

The Company leases certain office facilities, automobiles and equipment under operating leases, which, for the most part, are renewable. The majority of these leases also provide that the Company pay insurance and taxes.

FIRST AMERICAN FINANCIAL CORPORATION

AND SUBSIDIARY COMPANIES

NOTES TO CONSOLIDATED FINANCIAL STATEMENTS—(Continued)

Future minimum rental payments under operating leases that have initial or remaining noncancelable lease terms in excess of one year as of December 31, 20112014 are as follows:


   Operating 
  (in thousands) 

Year


2012

  $84,036  

2013

   66,409  

2014

   45,544  

2015

   28,883  

2016

   16,971  

Thereafter

   16,358  


  $258,201  


(in thousands)


Year


2015

$

79,243


2016


71,155


2017


53,431


2018


36,296


2019


23,563


Thereafter


60,273


$

323,961


Total rental expense for all operating leases and month-to-month rentals was $102.6$93.5 million, $125.4$94.6 million and $157.9$96.8 million for the years ended December 31, 2011, 20102014, 2013 and 2009,2012, respectively.

Other commitments and guarantees

At December 31, 20112014 and 2010,2013, the Company was contingently liable for guarantees of indebtedness owed by affiliates and third parties to banks and others totaling $31.0$8.9 million and $34.9$14.7 million, respectively. The guarantee arrangements relate to promissory notes and other contracts andthat contingently require the Company to make payments to the guaranteed party based onupon the failure of debtors to make scheduled payments according to the terms of the notes and contracts. The Company’s maximum potential amount of future paymentsobligation under these guarantees totaled $31.0$8.9 million and $34.9$14.7 million at December 31, 20112014 and 2010,2013, respectively, and is limited in duration to the terms of the underlying indebtedness. The Company has not incurred any costs as a result of these guarantees and has not recorded a liability on its consolidated balance sheets related to these guarantees at December 31, 20112014 and 2010.

2013.

The Company also guarantees the obligations of certain of its subsidiaries. These obligations are included in the Company’s consolidated balance sheets as of December 31, 20112014 and 2010.2013.


NOTE 19.    Transactions with CoreLogic/TFAC:91


Prior to the Separation, the Company had certain related party relationships with TFAC. The Company does not consider CoreLogic to be a related party subsequent to the Separation. The related party relationships with TFAC prior to the Separation and subsequent relationships with CoreLogic following the Separation are discussed further below.

Transactions with TFAC prior to the Separation

Prior to the Separation, the Company was allocated corporate income and overhead expenses from TFAC for corporate-related functions based on an allocation methodology that considered the number of the Company’s domestic headcount, the Company’s total assets and total revenues or a combination of those drivers. General corporate overhead expense allocations include executive management, tax, accounting and auditing, legal and treasury services, payroll, human resources and certain employee benefits and marketing and communications. The Company was allocated general net corporate expenses of $23.3 million from TFAC during 2010 prior to the

FIRST AMERICAN FINANCIAL CORPORATION

AND SUBSIDIARY COMPANIES

NOTES TO CONSOLIDATED FINANCIAL STATEMENTS—(Continued)


Separation, and $57.0 million for the year ended December 31, 2009, which are included within the investment income, net realized investment losses, personnel costs, other operating expenses, depreciation and amortization and interest expense line itemsNOTE 19.    Accumulated Other Comprehensive Income (Loss):

Changes in the accompanying consolidated statementsbalances of income.

The Company considers the basis on which the expenses were allocated to be a reasonable reflectioneach component of the utilization of services provided to or the benefit received by the Company during the pre-separation periods presented. The allocations may not, however, reflect the expense the Company would have incurred as an independent publicly traded company for these periods. Actual costs that may have been incurred as a stand-alone company during these periods would have depended on a number of factors, including the chosen organizational structure, the functions outsourced versus performed by employees and strategic decisions in areas such as information technology and infrastructure. Following the Separation, the Company is no longer allocated corporateaccumulated other comprehensive income and overhead expense, as the Company performs these functions using its own resources.

Prior to the Separation, a portion of TFAC’s combined debt, in the amount of $140.0 million, was allocated to the Company based on amounts directly incurred for the Company’s benefit. Net interest expense was allocated in the same proportion as debt. The Company believes the allocation basis for debt and net interest expense was reasonable. However, these amounts may not be indicative of the actual amounts that the Company would have incurred had it been operating as an independent publicly traded company for the period prior to June 1, 2010. Additionally, on January 31, 2010 the Company entered into a note payable with TFAC totaling $29.1 million. In connection with the Separation, the Company borrowed $200.0 million under its revolving credit facility and transferred such funds to CoreLogic, which fully satisfied the Company’s $140.0 million allocated portion of TFAC debt and the $29.1 million note payable to TFAC. The remaining $30.9 million transferred to CoreLogic was reflected as a distribution to CoreLogic in connection with the Separation. See Note 10 Notes and Contracts Payable to the consolidated financial statements for further discussion of the Company’s credit facility.

During the year ended December 31, 2009 the Company made a cash dividend payment of $83.0 million to TFAC which was recorded as a reduction of invested equity on the Company’s consolidated balance sheets. No cash dividends were paid to TFAC during 2010.

Transactions with CoreLogic following the Separation

In connection with the Separation, the Company and TFAC entered into various transition services agreements with effective dates of June 1, 2010. The agreements include transitional services in the areas of information technology, tax, accounting and finance, employee benefits and internal audit. Except for the information technology services agreements, the transition services agreements are short-term in nature. The Company incurred the net amounts of $6.4 million and $5.4 million(loss) for the years ended December 31, 20112014, 2013 and 2010, respectively, under these agreements which2012 are included in other operating expenses in the consolidated statements of income. No amounts were reflected in the consolidated statements of income prior to June 1, 2010, as the transition services agreements were not effective prior to the Separation.follows:


Unrealized
gains (losses)
on securities


Foreign
currency
translation
adjustment


Pension
benefit
adjustment


Accumulated
other
comprehensive
income (loss)


(in thousands)


Balance at December 31, 2011

$

(13,409

)


$

4,793


$

(168,837

)


$

(177,453

)

Change in unrealized gains (losses) on securities


52,409


52,409


Change in unrealized gains (losses) on securities for which credit losses have been recognized in earnings


6,502


6,502


Change in foreign currency translation adjustments


5,131


5,131


Net actuarial loss


(46,602

)


(46,602

)

Amortization of net actuarial loss


28,368


28,368


Amortization of prior service cost


(4,385

)


(4,385

)

Tax effect


(23,564

)


9,048


(14,516

)

Balance at December 31, 2012


21,938


9,924


(182,408

)


(150,546

)

Change in unrealized gains (losses) on securities


(54,000

)


(54,000

)

Change in unrealized gains (losses) on securities for which credit losses have been recognized in earnings


3,809


3,809


Change in foreign currency translation adjustments


(13,650

)


(13,650

)

Net actuarial gain


53,080


53,080


Amortization of net actuarial loss


32,033


32,033


Amortization of prior service cost


(4,385

)


(4,385

)

Tax effect


19,526


(31,404

)


(11,878

)

Balance at December 31, 2013


(8,727

)


(3,726

)


(133,084

)


(145,537

)

Change in unrealized gains (losses) on securities


29,889


29,889


Change in unrealized gains (losses) on securities for which credit losses have been recognized in earnings


1,229


1,229


Change in foreign currency translation adjustments


(16,694

)


(16,694

)

Net actuarial loss


(109,924

)


(109,924

)

Amortization of net actuarial loss


22,587


22,587


Amortization of prior service cost


(4,153

)


(4,153

)

Tax effect


(11,480

)


34,994


23,514


Balance at December 31, 2014

$

10,911


$

(20,420

)


$

(189,580

)


$

(199,089

)

Under the Separation and Distribution Agreement and other agreements, subject to certain exceptions contained in the Tax Sharing Agreement, each of the Company and CoreLogic agreed to assume and be responsible for 50% of certain of TFAC’s contingent and other corporate liabilities. All external costs and expenses associated with the management of these contingent and other corporate liabilities will be shared equally. These contingent and other corporate liabilities primarily relate to consolidated securities litigation and any actions with respect to the Separation or the Distribution brought by any third party. Contingent and other92


FIRST AMERICAN FINANCIAL CORPORATION

AND SUBSIDIARY COMPANIES

NOTES TO CONSOLIDATED FINANCIAL STATEMENTS—(Continued)

corporate liabilities that are related to only TFAC’s information solutions or financial services businesses are generally fully allocated to CoreLogic or the Company, respectively. At December 31, 2011 and 2010, no reserves were considered necessary for such liabilities.

In connection with the Separation, TFAC issued to the Company and FATICO a number of shares of its common stock that resulted in the Company and FATICO collectively owning 12.9 million shares of CoreLogic’s common stock immediately following the Separation. Under the terms of the Separation and Distribution Agreement, if the Company chooses to dispose of 1% or more of CoreLogic’s outstanding common stock at a given date, the Company must first provide CoreLogic with the option to purchase the shares. The Company has agreed to dispose of the shares within five years after the Separation or to bear any adverse tax consequences arising as a result of holding the shares for a longer period. The CoreLogic common stock is classified as available-for-sale and carried at fair value with unrealized gains or losses classified as a component of accumulated other comprehensive loss. In April 2011, FATICO sold 4.0 million shares of CoreLogic common stock for an aggregate cash price of $75.8 million and recorded a gain of $0.8 million related to the sale. At December 31, 2011 and 2010, the cost basis of the CoreLogic common stock was $167.6 million and $242.6 million, respectively, with an estimated fair value of $115.5 million and $239.5 million, respectively. The CoreLogic common stock is included in equity securities in the consolidated balance sheet.

On June 1, 2010, the Company received a note receivable from CoreLogic in the amount of $19.9 million that accrued interest at 6.52%. Interest was first due on July 1, 2010 and was due quarterly thereafter. The note receivable was due on May 31, 2017. The note approximated the unfunded portion of the benefit obligation attributable to participants of the defined benefit pension plan who were employees of TFAC’s businesses that were retained by CoreLogic in connection with the Separation. In September 2011, the Company received $17.3 million from CoreLogic in satisfaction of the remaining balance of the note. See Note 14 Employee Benefit Plans to the consolidated financial statements for further discussion of the defined benefit pension plan.

At December 31, 2011 and December 31, 2010, the Company’s federal savings bank subsidiary, First American Trust, FSB, held $4.3 million and $11.9 million, respectively, of interest and non-interest bearing deposits owned by CoreLogic. These deposits are included in deposits in the consolidated balance sheets. Interest expense on the deposits was immaterial for all periods presented.

Prior to the Separation, the Company owned three office buildings that were leased to the information solutions businesses of TFAC under the terms of formal lease agreements. In connection with the Separation, the Company distributed one of the office buildings to CoreLogic, and currently owns two office buildings that are leased to CoreLogic under the terms of formal lease agreements. Rental income associated with these properties totaled $4.4 million, $6.2 million and $8.5 million for the years ended December 31, 2011, 2010 and 2009, respectively.

The Company and CoreLogic are also parties to certain ordinary course commercial agreements and transactions. The expenses associated with these transactions, which primarily relate to purchases of data and other settlement services totaled $15.0 million, $21.4 million and $46.4 million for the years ended December 31, 2011, 2010 and 2009, respectively, and are included in other operating expenses in the Company’s consolidated statements of income. The Company also sells data and provides other settlement services to CoreLogic through ordinary course commercial agreements and transactions resulting in revenues totaling $4.2 million, $11.8 million and $6.6 million for the years ended December 31, 2011, 2010, and 2009, respectively, which are included in direct premiums and escrow fees and information and other in the Company’s consolidated statements of income.

FIRST AMERICAN FINANCIAL CORPORATION

AND SUBSIDIARY COMPANIES

NOTES TO CONSOLIDATED FINANCIAL STATEMENTS—(Continued)

Prior to the Separation, certain transactions with TFAC were settled in cash and the remaining transactions were settled by non-cash capital contributions between the Company and TFAC, which resulted in net non-cash contributions from TFAC to the Company of $2.1 million for the year ended December 31, 2010. Following the Separation, all transactions with CoreLogic are settled, on a net basis, in cash.

NOTE 20.    Other Comprehensive Income (Loss):

Comprehensive income is a more inclusive financial reporting methodology that includes disclosure of certain financial information that historically has not been recognized in the calculation of net income.


Components of other comprehensive income (loss) are as follows:

   Net unrealized
gains (losses)
on securities
  Foreign
currency
translation
adjustment
  Pension
benefit
adjustment
  Accumulated
other
comprehensive
income (loss)
 
   (in thousands) 

Balance at December 31, 2008

  $(72,592 $(26,717 $(167,020 $(266,329

Pretax change

   71,834    31,972    13,846    117,652  

Pretax change in other-than-temporary impairments for which credit-related portion was recognized in earnings

   15,651    —      —      15,651  

Tax effect

   (25,439  —      7,000    (18,439


Balance at December 31, 2009

   (10,546  5,255    (146,174  (151,465

Pretax change

   5,249    5,705    18,103    29,057  

Pretax change in other-than-temporary impairments for which credit-related portion was recognized in earnings

   8,034    —      —      8,034  

Pretax change in connection with the Separation

   —      —      (36,752  (36,752

Tax effect

   (5,974  —      8,020    2,046  


Balance at December 31, 2010

   (3,237  10,960    (156,803  (149,080

Pretax change

   (11,733  (6,167  (20,059  (37,959

Pretax change in other-than-temporary impairments for which credit-related portion was recognized in earnings

   3,573    —      —      3,573  

Tax effect

   (2,012  —      8,025    6,013  


Balance at December 31, 2011

  $(13,409 $4,793   $(168,837 $(177,453


FIRST AMERICAN FINANCIAL CORPORATION

AND SUBSIDIARY COMPANIES

NOTES TO CONSOLIDATED FINANCIAL STATEMENTS—(Continued)

Components ofaccumulated other comprehensive income (loss) allocated to the Company and noncontrolling interests are as follows:


   Net unrealized
gains (losses)
on securities
  Foreign
currency
translation
adjustment
  Pension
benefit
adjustment
  Accumulated
other
comprehensive
income (loss)
 
   (in thousands) 

2011


Allocated to the Company

  $(13,415 $4,793   $(168,837 $(177,459

Allocated to noncontrolling interests

   6    —      —      6  


Balance at December 31, 2011

  $(13,409 $4,793   $(168,837 $(177,453


2010


Allocated to the Company

  $(3,246 $10,893   $(156,803 $(149,156

Allocated to noncontrolling interests

   9    67    —      76  


Balance at December 31, 2010

  $(3,237 $10,960   $(156,803 $(149,080


2009


Allocated to the Company

  $(10,475 $9,158   $(146,174 $(147,491

Allocated to noncontrolling interests

   (71  (3,903  —      (3,974


Balance at December 31, 2009

  $(10,546 $5,255   $(146,174 $(151,465


Unrealized
gains (losses)
on securities


Foreign
currency
translation
adjustment


Pension
benefit
adjustment


Accumulated
other
comprehensive
income (loss)


(in thousands)


2014


Allocated to the Company

$

10,894


$

(20,420

)


$

(189,580

)


$

(199,106

)

Allocated to noncontrolling interests


17


17


Balance at December 31, 2014

$

10,911


$

(20,420

)


$

(189,580

)


$

(199,089

)

2013


Allocated to the Company

$

(8,734

)


$

(3,726

)


$

(133,084

)


$

(145,544

)

Allocated to noncontrolling interests


7


7


Balance at December 31, 2013

$

(8,727

)


$

(3,726

)


$

(133,084

)


$

(145,537

)

2012


Allocated to the Company

$

21,928


$

9,924


$

(182,408

)


$

(150,556

)

Allocated to noncontrolling interests


10


10


Balance at December 31, 2012

$

21,938


$

9,924


$

(182,408

)


$

(150,546

)

The change in net unrealized gains on securities includesfollowing table presents the other comprehensive income (loss) reclassification adjustments of $11.0 million, $12.5 million and $16.0 million of net realized gains on debt and equity securities for the years ended December 31, 2011, 20102014, 2013 and 2009, respectively.2012:


Unrealized
gains (losses)
on securities


Foreign
currency
translation
adjustment


Pension
benefit
adjustment


Total
other
comprehensive
income (loss)


(in thousands)


Year ended December 31, 2014


Pretax change before reclassifications

$

52,693


$

(16,694

)


$

(109,924

)


$

(73,925

)

Reclassifications out of AOCI


(21,575

)


18,434


(3,141

)

Tax effect


(11,480

)


34,994


23,514


Total other comprehensive income (loss), net of tax

$

19,638


(16,694

)


$

(56,496

)


$

(53,552

)

Year ended December 31, 2013


Pretax change before reclassifications

$

(40,396

)


$

(13,650

)


$

53,080


$

(966

)

Reclassifications out of AOCI


(9,795

)


27,648


17,853


Tax effect


19,526


(31,404

)


(11,878

)

Total other comprehensive income (loss), net of tax

$

(30,665

)


$

(13,650

)


$

49,324


$

5,009


Year ended December 31, 2012


Pretax change before reclassifications

$

128,745


$

5,131


$

(46,602

)


$

87,274


Reclassifications out of AOCI


(69,834

)


23,983


(45,851

)

Tax effect


(23,564

)


9,048


(14,516

)

Total other comprehensive income (loss), net of tax

$

35,347


$

5,131


$

(13,571

)


$

26,907


93


FIRST AMERICAN FINANCIAL CORPORATION

AND SUBSIDIARY COMPANIES

NOTES TO CONSOLIDATED FINANCIAL STATEMENTS—(Continued)


The following table presents the effect of the reclassifications out of accumulated other comprehensive income (loss) on the respective line items in the consolidated statements of income:


Amounts reclassified from accumulated other comprehensive income (loss)


Year ended December 31,


Affected line items in the 


(in thousands)


2014


2013


consolidated statements of income


Unrealized gains (losses) on securities:


Net realized gains (losses) on sales of securities

$

23,276


$

9,795


Net realized investment gains


Net other-than-temporary impairment losses


(1,701

)


Net other-than-temporary impairment losses


Pretax total

$

21,575


$

9,795


Tax effect

$

(7,959

)

$

(3,811

)


Pension benefit adjustment:


Amortization of defined benefit pension and supplemental benefit plan items:


Net actuarial loss

$

(22,587

)

$

(32,033

)

(1)


Prior service credit


4,153


4,385


(1)


Pretax total

$

(18,434

)

$

(27,648

)


Tax effect

$

7,051


$

10,757


(1)

These accumulated other comprehensive income components are included in the computation of net periodic cost. See Note 14 Employee Benefit Plans for additional details.

NOTE 21.20.    Litigation and Regulatory Contingencies:

The Company and its subsidiaries are parties to a number of non-ordinary course lawsuits. Frequently theseThese lawsuits frequently are similar in nature to other lawsuits pending against the Company’s competitors.

For those non-ordinary course lawsuits where the Company has determined that a loss is both probable and reasonably estimable, a liability representing the best estimate of the Company’s financial exposure based on known facts has been recorded. Actual losses may materially differ from the amounts recorded.

For a substantial majority of these lawsuits, however, it is not possible to assess the probability of loss. Most of these lawsuits are putative class actions which require a plaintiff to satisfy a number of procedural requirements before proceeding to trial. These requirements include, among others, demonstration to a court that the law proscribes in some manner the Company’s activities, the making of factual allegations sufficient to suggest that the Company’s activities exceeded the limits of the law and a determination by the court—known as class certification—that the law permits a group of individuals to pursue the case together as a class. In certain instances the Company may also be able to compel the plaintiff to arbitrate its claim on an individual basis. If these procedural requirements are not met, either the lawsuit cannot proceed or, as is the case with class certification or compelled arbitration, the plaintiffs lose the financial incentive to proceed with the case (or the amount at issue effectively becomes de minimus)minimis). Frequently, a court’s determination as to these procedural requirements is subject to appeal to a higher court. As a result of, among other factors, ambiguities and inconsistencies in the myriad laws applicable to the Company’s business and the uniqueness of the factual issues presented in any given lawsuit, the Company often cannot determine the probability of loss until a court has finally determined that a plaintiff has satisfied applicable procedural requirements.

FIRST AMERICAN FINANCIAL CORPORATION

AND SUBSIDIARY COMPANIES

NOTES TO CONSOLIDATED FINANCIAL STATEMENTS—(Continued)

Furthermore, because most of these lawsuits are putative class actions, it is often impossible to estimate the possible loss or a range of loss amounts, even where the Company has determined that a loss is reasonably possible. Generally class actions involve a large number of people and the effort to determine which people satisfy the requirements to become plaintiffs—or class members—is often time consuming and burdensome. Moreover, these lawsuits raise complex factual issues which result in uncertainty as to their outcome and, ultimately, make it difficult for the Company to estimate the amount of damages which a plaintiff might successfully prove. In addition, many of the Company’s businesses are regulated

94


FIRST AMERICAN FINANCIAL CORPORATION

AND SUBSIDIARY COMPANIES

NOTES TO CONSOLIDATED FINANCIAL STATEMENTS—(Continued)

by various federal, state, local and foreign governmental agencies and are subject to numerous statutory guidelines. These regulations and statutory guidelines often are complex, inconsistent or ambiguous, which results in additional uncertainty as to the outcome of a given lawsuit—including the amount of damages a plaintiff might be afforded—or makes it difficult to analogize experience in one case or jurisdiction to another case or jurisdiction.

Most of the non-ordinary course lawsuits to which the Company and its subsidiaries are parties challenge practices in the Company’s title insurance business, though a limited number of cases also pertain to the Company’s other businesses. These lawsuits include, among others, cases alleging, among other assertions, that the Company, one of its subsidiaries and/or one of its agents:

·

charged an improper rate for title insurance in a refinance transaction, including

Boucher v. First American Title Insurance Company, filed on May 16, 2007 and pending in the United States District Court for the Western District of Washington,

·

Levine v. First American Title Insurance Company, filed on February 26, 2009 and pending in the United States District Court for the Eastern District of Pennsylvania,

Loef v. First American Title Insurance Company, filed on August 16, 2008 and pending in the United States District Court for the District of Maine,

·

Lewis v. First American Title Insurance Company, filed on November 28, 2006 and pending in the United States District Court for the District of Idaho,

Hamilton v. First American Title Insurance Company, filed on August 22, 2007 and pending in the United States District Court for the Northern District of Texas,

·

Raffone v. First American Title Insurance Company, filed on February 14, 2004 and pending in the Circuit Court, Nassau County, Florida, and

Hamilton v. First American Title Insurance Company, et al., filed on August 25, 2008 and pending in the Superior Court of the State of North Carolina, Wake County,

Haskins v. First American Title Insurance Company, filed on September 29, 2010 and pending in the United States District Court for the District of New Jersey,

Johnson v. First American Title Insurance Company, filed on May 27, 2008 and pending in the United States District Court for the District of Arizona,

Levine v. First American Title Insurance Company, filed on February 26, 2009 and pending in the United States District Court for the Eastern District of Pennsylvania,

Lewis v. First American Title Insurance Company, filed on November 28, 2006 and pending in the United States District Court for the District of Idaho,

Raffone v. First American Title Insurance Company, filed on February 14, 2004 and pending in the Circuit Court, Nassau County, Florida,

Slapikas v. First American Title Insurance Company, filed on December 19, 2005 and pending in the United States District Court for the Western District of Pennsylvania and

Tello v. First American Title Insurance Company, filed on July 14, 2009 and pending in the United States District Court for the District of New Hampshire.

·

Slapikas v. First American Title Insurance Company, filed on December 19, 2005 and pending in the United States District Court for the Western District of Pennsylvania.


All of these lawsuits are putative class actions. A court has only granted class certification in Loef, Hamilton (North Carolina), Johnson, Lewis Raffone and Slapikas. An appeal to a higher court is pending with

FIRST AMERICAN FINANCIAL CORPORATION

AND SUBSIDIARY COMPANIES

NOTES TO CONSOLIDATED FINANCIAL STATEMENTS—(Continued)

respect to the granting ofRaffone. The class certificationoriginally certified in Hamilton (North Carolina).Slapikas was subsequently decertified. For the reasons stated above, the Company has been unable to assess the probability of loss or estimate the possible loss or the range of loss or, where the Company has been able to make an estimate, the Company believes the amount is immaterial to the consolidated financial statements as a whole.

·

purchased minority interests in title insurance agents as an inducement to refer title insurance underwriting business to the Company or gave items of value to title insurance agents and others for referrals of business in each case in violation of the Real Estate Settlement Procedures Act, including

·

Edwards v. First American Financial Corporation, filed on June 12, 2007 and pending in the United States District Court for the Central District of California.

Edwards v. First American Financial Corporation, filed on June 12, 2007 and pending in the United States District Court for the Central District of California, and

Galiano v. First American Title Insurance Company, et al., filed on February 8, 2008 and pending in the United States District Court for the Eastern District of New York.

Galiano is a putative class action for which a class has not been certified. In Edwards a narrow class has been certified. The United States Supreme Court is reviewing whether the Edwards plaintiff has the legal right to sue. For the reasons stated above, the Company has been unable to assess the probability of loss or estimate the possible loss or the range of loss.

·

engaged in the unauthorized practice of law, including

·

Gale v. First American Title Insurance Company, et al., filed on October 16, 2006 and pending in the United States District Court of Connecticut.

conspired with its competitors to fix prices or otherwise engagedThe class originally certified in anticompetitive behavior, including

Barton v. First American Title Insurance Company, et al, filed March 10, 2008 and pending in the United States District Court for the Northern District of California,

Holt v. First American Title Insurance Company, et al., filed March 11, 2008 and pending in the United States District Court for the Eastern District of Pennsylvania,

Katz v. First American Title Insurance Company, et al., filed March 18, 2008 and pending in the United States District Court for the Northern District of Ohio,

McCray v. First American Title Insurance Company, et al., filed October 15, 2008 and pending in the United States District Court for the District of Delaware and

Swick v. First American Title Insurance Company, et al., filed March 19, 2008, and pending in the United States District Court for the District of New Jersey.

All of these lawsuits are putative class actions for which a class has not been certified.Gale was subsequently decertified. For the reasons described above, the Company has not yet been able to assess the probability of loss or estimate the possible loss or the range of loss.

·

overcharged or improperly charged fees for products and services, denied home warranty claims, failed to timely file certain documents, and gave items of value to developers, builders and others as inducements to refer business in violation of certain laws, such as consumer protection laws and laws generally prohibiting unfair business practices, and certain obligations, including

·

Bushman v. First American Title Insurance Company, et al., filed on November 21, 2013 and pending in the Circuit Court of the State of Michigan, County of Washtenaw,

·

Chassen v. First American Financial Corporation, et al., filed on January 22, 2009 and pending in the United States District Court of New Jersey,

95


FIRST AMERICAN FINANCIAL CORPORATION

AND SUBSIDIARY COMPANIES

NOTES TO CONSOLIDATED FINANCIAL STATEMENTS—(Continued)


·

DeLaurentis v. Data Tree Information Services LLC, filed on January 16, 2015 and pending in the United States District Court for the Southern District of New York,

·

Gunning v. First American Title Insurance Company, filed on July 14, 2008 and pending in the United States District Court for the Eastern District of Kentucky,

·

Kaufman v. First American Financial Corporation, et al., filed on December 21, 2007 and pending in the Superior Court of the State of California, County of Los Angeles,

·

Kirk v. First American Financial Corporation, et al., filed on June 15, 2006 and pending in the Superior Court of the State of California, County of Los Angeles,

·

Sjobring v. First American Financial Corporation, et al., filed on February 25, 2005 and pending in the Superior Court of the State of California, County of Los Angeles,

·

Snyder v. First American Financial Corporation, et al., filed on June 21, 2014 and pending in the United States District Court for the District of Colorado,

·

Wilmot v. First American Financial Corporation, et al., filed on April 20, 2007 and pending in the Superior Court of the State of California, County of Los Angeles, and

·

In re First American Home Buyers Protection Corporation, consolidated on October 9, 2014 and pending in the United States District Court for the Southern District of California.

engaged in the unauthorized practiceAll of law, including

Gale v. First American Title Insurance Company, et al., filed on October 16, 2006these lawsuits, except Kaufman and pending in the United States District Court for the District of Connecticut and

Katin v. First American Signature Services, Inc., et al., filed on May 9, 2007 and pending in the United States District Court for the District of Massachusetts.

Katin is aKirk, are putative class action. Aactions for which a class has not been certified. In Kaufman a class was certified in Gale.but that certification was subsequently vacated. A trial of the Kirk matter has concluded, plaintiff has filed a notice of appeal and the Company filed a cross appeal. For the reasons described above, the Company has not yet been able to assess the probability of loss or estimate the possible loss or the range of loss.

misclassified employees and failed to pay overtime, including

Bartko v. First American Title Insurance Company, filed on November 8, 2011, and pending in the Superior Court of the State of California, Los Angeles.

FIRST AMERICAN FINANCIAL CORPORATION

AND SUBSIDIARY COMPANIES

NOTES TO CONSOLIDATED FINANCIAL STATEMENTS—(Continued)

Bartko is a putative class action for which a class has not been certified. For the reasons described above,loss or, where the Company has not yet been able to assess the probability of loss ormake an estimate, the possible loss orCompany believes the range of loss.

overcharged or improperly charged fees for products and services provided in connection withamount is immaterial to the closing of real estate transactions, denied home warranty claims, recorded telephone calls, actedconsolidated financial statements as an unauthorized trustee and gave items of value to developers, builders and others as inducements to refer business in violation of certain other laws, such as consumer protection laws and laws generally prohibiting unfair business practices, and certain obligations, including

Carrera v. First American Home Buyers Protection Corporation, filed on September 23, 2009 and pending in the Superior Court of the State of California, County of Los Angeles,

Chassen v. First American Financial Corporation, et al., filed on January 22, 2009 and pending in the United States District Court for the District of New Jersey,

Coleman v. First American Home Buyers Protection Corporation, et al., filed on August 24, 2009 and pending in the Superior Court of the State of California, County of Los Angeles,

Eberhard v. First American Title Insurance Company, et al., filed on April 4, 2011 and pending in the Court of Common Pleas Cuyahoga County, Ohio,

Eide v. First American Title Company, filed on February 26, 2010 and pending in the Superior Court of the State of California, County of Kern,

Gunning v. First American Title Insurance Company, filed on July 14, 2008 and pending in the United States District Court for the Eastern District of Kentucky,

Kaufman v. First American Financial Corporation, et al., filed on December 21, 2007 and pending in the Superior Court of the State of California, County of Los Angeles,

Kirk v. First American Financial Corporation, filed on June 15, 2006 and pending in the Superior Court of the State of California, County of Los Angeles,

Sjobring v. First American Financial Corporation, et al., filed on February 25, 2005 and pending in the Superior Court of the State of California, County of Los Angeles,

Smith v. First American Title Insurance Company, filed on November 23, 2011 and pending in the United States District Court for the Western District of Washington,

Tavenner v. Talon Group, filed on August 18, 2009 and pending in the United States District Court for the Western District of Washington, and

Wilmot v. First American Financial Corporation, et al., filed on April 20, 2007 and pending in the Superior Court of the State of California, County of Los Angeles.

All of these lawsuits, except Sjobring, are putative class actions for which a class has not been certified. In Sjobring a class was certified but that certification was subsequently vacated. For the reasons described above, the Company has not yet been able to assess the probability of loss or estimate the possible loss or the range of loss.

whole.

While some of the lawsuits described above may be material to the Company’s operating results in any particular period if an unfavorable outcome results, the Company does not believe that any of these lawsuits will have a material adverse effect on the Company’s overall financial condition or liquidity.

FIRST AMERICAN FINANCIAL CORPORATION

AND SUBSIDIARY COMPANIES

NOTES TO CONSOLIDATED FINANCIAL STATEMENTS—(Continued)

On March 5, 2010, Bank of America, N.A. filed a complaint in the North Carolina General Court of Justice, Superior Court Division against United General Title Insurance Company and First American Title Insurance Company alleging that the defendants failed to pay or failed to timely respond to certain claims made on title insurance policies issued in connection with home equity loans or lines of credit that are now in default.

On April 1, 2010, the Company filed a third party complaint within the same litigation against Fiserv Solutions, Inc. for breach of contract, indemnification and other matters relating to the plaintiff’s allegations.

During the fourth quarter of 2011, the Company, Bank of America and Fiserv settled the lawsuit through mediation. As a result of the settlement, the Company recorded a charge of $19.2 million in the fourth quarter, which is in addition to the $13.0 million charge recorded in the third quarter of 2011 and is net of all recoveries. These charges were recorded to provision for policy losses and other claims on the accompanying consolidated statements of income. The settlement extinguishes all Company liability in connection with policies issued to Bank of America of the type that are the subject of the lawsuit, whether or not Bank of America has submitted a claim with respect to such policies. The court approved of the settlement on December 8, 2011 and dismissed the case with prejudice.

The Company also is a party to non-ordinary course lawsuits other than those described above. With respect to these lawsuits, the Company has determined either that a loss is not probablereasonably possible or that the possibleestimated loss or range of loss, if any, is not material to the consolidated financial statements as a whole.

The Company’s title insurance, property and casualty insurance, home warranty, banking, thrift, trust and investment advisory businesses are regulated by various federal, state and local governmental agencies. Many of the Company’s other businesses operate within statutory guidelines. Consequently, the Company may from time to time be subject to auditexamination or investigation by such governmental agencies. Currently, governmental agencies are auditingexamining or investigating certain of the Company’s operations. These auditsexams or investigations include inquiries into, among other matters, pricing and rate setting practices in the title insurance industry, competition in the title insurance industry, real estate settlement service customer acquisition and retention practices and agency relationships. With respect to matters where the Company has determined that a loss is both probable and reasonably estimable, the Company has recorded a liability representing its best estimate of the financial exposure based on known facts. While the ultimate disposition of each such auditexam or investigation is not yet determinable, the Company does not believe that individually or in the aggregate they will have a material adverse effect on the Company’s financial condition, results of operations or cash flows. These auditsexams or investigations could, however, result in changes to the Company’s business practices which could ultimately have a material adverse impact on the Company’s financial condition, results of operations or cash flows.

The Company’s Canadian operations provide certain services to lenders which it believes to be exempt from excise tax under applicable Canadian tax laws.  However, in October 2014, the Canadian taxing authority provided internal guidance that the services in question should be subject to the excise tax.  While discussions with the taxing authority are ongoing, the Company believes that the guidance may result in an assessment.  The amount, if any, of such assessment is not currently

96


FIRST AMERICAN FINANCIAL CORPORATION

AND SUBSIDIARY COMPANIES

NOTES TO CONSOLIDATED FINANCIAL STATEMENTS—(Continued)

known, and any such assessment would be subject to negotiation.  In the event that the Company disagrees with the ultimate assessment, the Company intends to avail itself of avenues of appeal.  While the Company believes it is reasonably likely that the Company would prevail on the merits, a loss associated with the matter is possible.  In light of the foregoing, the Company is not currently able to reasonably estimate a loss or range of loss associated with the matter.  While such a loss could be material to the Company’s operating results in any particular period if an unfavorable outcome results, the Company does not believe that this matter will have a material adverse effect on the Company’s overall financial condition or liquidity.  

The Company and its subsidiaries also are involved in numerous ongoing routine legal and regulatory proceedings related to their operations.  WhileWith respect to each of these proceedings, the ultimate dispositionCompany has determined either that a loss is not reasonably possible or that the estimated loss or range of loss, if any, is not material to the consolidated financial statements as a whole.

NOTE 21.    Business Combinations:

In March 2014, the Company completed the acquisition of a company that provides loan quality analytics, decision support tools and loan review services for the mortgage industry for a purchase price of $151.2 million. The Company completed additional acquisitions during 2014 for an aggregate purchase price of $11.3 million. The Company allocates the purchase price of each proceeding is not determinable,acquisition to the ultimate resolutionassets acquired and liabilities assumed using a variety of any of such proceedings, individually orvaluation techniques, including discounted cash flow analysis. These acquisitions have been included in the aggregate, could have a material adverse effect on the Company’s financial condition, results of operations or cash flows in the period of disposition.

NOTE 22.    Business Combinations:

title insurance and services segment.

During the year ended December 31, 2011,2013, the Company completed three acquisitions for an aggregate purchase price of $2.1$5.3 million in cash and accrued contingent consideration of $2.5$1.2 million. The purchase price of each acquisition was allocated to the assets acquired and liabilities assumed using a variety of valuation techniques including discounted cash flow analysis. These three acquisitions have been included in the Company’s title insurance and services segment.

FIRST AMERICAN FINANCIAL CORPORATION

AND SUBSIDIARY COMPANIES

NOTES TO CONSOLIDATED FINANCIAL STATEMENTS—(Continued)

In addition to the acquisitions discussed above, during the year ended December 31, 2011, the Company purchased additional noncontrolling interests in companies already included in the Company’s consolidated financial statements for a total purchase price of $4.1 million in cash.

During the year ended December 31, 2010, the Company completed five acquisitions for an aggregate purchase price of $10.9 million in cash. The purchase price of each acquisition was allocated to the assets acquired and liabilities assumed using a variety of valuation techniques including discounted cash flow analysis. These fivefour acquisitions have been included in the Company’s title insurance and services segment.


In addition to the acquisitions discussed above, during the year ended December 31, 2010, the Company purchased the remaining noncontrolling interests in three companies already included in the Company’s consolidated financial statements. The total purchase price of these transactions was $2.8 million in cash and $0.5 million in notes payable.

NOTE 23.22.    Segment Financial Information:

The Company consists of the following reportable segments and a corporate function:

·

The Company’s title insurance and services segment issues title insurance policies on residential and commercial property in the United States and offers similar or related products and services internationally. This segment also provides closing and/or escrow services; accommodates tax-deferred exchanges of real estate; provides products, services and solutions involving the use of real property related data designed to mitigate risk or otherwise facilitate real estate transactions; maintains, manages and provides access to title plant records and images; and provides banking, trust and investment advisory services. The Company, through its principal title insurance subsidiary and such subsidiary’s affiliates, transacts its title insurance business through a network of direct operations and agents. Through this network, the Company issues policies in the 49 states that permit the issuance of title insurance policies and the District of Columbia. The Company also offers title insurance and other insurance and guarantee products, as well as related settlement services segment issues title insurance policies on residential and commercial property in the United States and offers similar or related products and services internationally. This segment also provides closing and/or escrow services, accommodates tax-deferred exchanges of real estate, maintains, manages and provides access to title plant records and images and provides banking, trust and investment advisory services. The Company, through its principal title insurance subsidiary and such subsidiary’s affiliates, transacts its title insurance business through a network of direct operations and agents. Through this network, the Company issues policies in the 49 states that permit the issuance of title insurance policies and the District of Columbia. The Company also offers title insurance and similar products, as well as related services, either directly or through joint ventures in foreign countries, including Canada, the United Kingdom, Australia and various other established and emerging markets.

The Company’s specialty insurance segment issues property and casualty insurance policies and sells home warranty products. The property and casualty insurance business provides insurance coverage to residential homeowners and renters for liability losses and typical hazards such as fire, theft, vandalism and other types of property damage. This business is licensed to issue policies in all 50 states and actively issues policies in 43 states. In its largest market, California,

·

The Company’s specialty insurance segment issues property and casualty insurance policies and sells home warranty products. The property and casualty insurance business provides insurance coverage to residential homeowners and renters for liability losses and typical hazards such as fire, theft, vandalism and other types of property damage. This business is licensed to issue policies in all 50 states and the District of Columbia and actively issues policies in 46 states. In certain markets it also offers preferred risk auto insurance to better compete with other carriers offering bundled home and auto insurance. The home warranty business provides residential service contracts that cover residential systems, such as heating and air conditioning systems, and certain appliances against failures that occur as the result of normal usage during the coverage period. This business currently operates in 39 states and the District of Columbia.

The corporate function consists primarily of certain financing facilities as well as the corporate services that support the Company’s business operations. Eliminations consist of inter-segment revenues and related expenses included in the results of the operating segments. The Company did not record inter-segment eliminations for the year ended December 31, 2009, as there was no inter-segment income or expense.

97


FIRST AMERICAN FINANCIAL CORPORATION

AND SUBSIDIARY COMPANIES

NOTES TO CONSOLIDATED FINANCIAL STATEMENTS—(Continued)


Selected financial information about the Company’s operations, by segment, for each of the past three years is as follows:


Revenues


Depreciation
and
amortization


Equity in
earnings of

affiliates, net


Income (loss)
before
income taxes


Assets


Investments
in equity

method

affiliates


Capital
expenditures


  Revenues Depreciation
and
amortization
   Equity in
earnings
of
affiliates
 Income (loss)
before
income taxes
 Assets Investment
in affiliates
   Capital
expenditures
 

(in thousands)


  (in thousands) 

2011


2014


Title Insurance and Services

  $3,539,127   $69,229    $8,340   $158,642   $4,947,903   $132,628    $68,098  

$

4,304,428


$

77,820


$

(16,545

)


$

373,024


$

6,767,245


$

106,083


$

95,949


Specialty Insurance

   286,982    4,197     —      39,143    490,620    —       7,024  


368,666


4,978


52,974


506,242


3,412


Corporate

   (1,660  3,463     (241  (67,877  48,606    4,099     251  


6,415


2,799


(75,438

)


464,980


Eliminations

   (3,875  —       —      385    (116,792  —       —    


(1,560

)


(72,367

)


$

4,677,949


$

85,597


$

(16,545

)


$

350,560


$

7,666,100


$

106,083


$

99,361


  $3,820,574   $76,889    $8,099   $130,293   $5,370,337   $136,727    $75,373  


2010


2013


Title Insurance and Services

  $3,613,590   $72,566    $8,006   $229,522   $5,109,174   $140,923    $82,123  

$

4,606,088


$

66,956


$

7,387


$

350,165


$

5,751,632


$

124,921


$

83,469


Specialty Insurance

   286,566    5,341     —      42,695    488,351    —       3,273  


339,613


4,865


42,132


499,788


3,673


Corporate

   8,252    2,735     370    (60,111  373,976    5,861     3,329  


13,008


3,095


(2,071

)


(81,589

)


369,385


101


Eliminations

   (1,796  —       —      —      (149,675  —       —    


(2,632

)


(61,622

)


$

4,956,077


$

74,916


$

5,316


$

310,708


$

6,559,183


$

125,022


$

87,142


  $3,906,612   $80,642    $8,376   $212,106   $5,821,826   $146,784    $88,725  


2009


2012


Title Insurance and Services

  $3,767,355   $76,038    $10,577   $215,116   $4,824,581   $228,735    $34,318  

$

4,200,520


$

67,610


$

7,677


$

473,681


$

5,427,432


$

127,217


$

78,614


Specialty Insurance

   278,376    4,295     —      31,444    498,740    —       7,503  


315,171


4,553


47,459


487,780


5,278


Corporate

   1,103    3,879     300    (42,215  206,960    —       483  


29,892


2,787


(1,163

)


(53,349

)


299,707


2,753


Eliminations


(3,762

)


(385

)


(137,293

)


$

4,541,821


$

74,950


$

6,514


$

467,406


$

6,077,626


$

129,970


$

83,892


  $4,046,834   $84,212    $10,877   $204,345   $5,530,281   $228,735    $42,304  


Total revenuesRevenues from external customers separatedallocated between domestic and foreign operations, and by segment, for each of the three years ended December 31, 2011, 20102014, 2013 and 20092012 is as follows:


   2011   2010   2009 
   Domestic   Foreign   Domestic   Foreign   Domestic   Foreign 
   (in thousands) 

Title Insurance and Services

  $3,189,040    $350,087    $3,286,997    $326,593    $3,470,751    $296,604  

Specialty Insurance

   286,982     —       286,566     —       278,376     —    


  $3,476,022    $350,087    $3,573,563    $326,593    $3,749,127    $296,604  


Year Ended December 31,


2014


2013


2012


Domestic


Foreign


Domestic


Foreign


Domestic


Foreign


(in thousands)


Title Insurance and Services

$

3,977,498


$

325,393


$

4,283,067


$

320,413


$

3,865,480


$

332,577


Specialty Insurance


368,666


339,613


313,889


$

4,346,164


$

325,393


$

4,622,680


$

320,413


$

4,179,369


$

332,577


Long-lived assets separatedallocated between domestic and foreign operations, and by segment, as of December 31, 2011, 20102014, 2013 and 20092012 are as follows:


  December 31, 

December 31,


  2011   2010   2009 

2014


2013


2012


  Domestic   Foreign   Domestic   Foreign   Domestic   Foreign 

Domestic


Foreign


Domestic


Foreign


Domestic


Foreign


          (in thousands)         

(in thousands)


Title Insurance and Services

  $1,826,362    $146,213    $1,870,939    $143,284    $1,955,317    $209,801  

$

1,792,387


$

122,045


$

1,610,310


$

135,912


$

1,580,399


$

151,289


Specialty Insurance

   149,105     —       150,328     —       160,599     —    


105,062


105,724


104,698


$

1,897,449


$

122,045


$

1,716,034


$

135,912


$

1,685,097


$

151,289


  $1,975,467    $146,213    $2,021,267    $143,284    $2,115,916    $209,801  


FIRST AMERICAN FINANCIAL CORPORATION

AND SUBSIDIARY COMPANIES

QUARTERLY FINANCIAL DATA

(Unaudited)


   Quarter Ended 
   March 31  June 30  September 30 (2)   December 31 
   (in thousands, except per share amounts) 

2011 (1)


Revenues

  $931,700   $927,343   $964,965    $996,566  

(Loss) income before income taxes

  $(23,449 $49,215   $38,411    $66,116  

Net (loss) income

  $(15,241 $32,147   $21,295    $40,378  

Net income (loss) attributable to noncontrolling interests

  $94   $(194 $252    $151  

Net (loss) income attributable to the Company

  $(15,335 $32,341   $21,043    $40,227  

Net (loss) income per share attributable to the Company’s stockholders (3):


Basic

  $(0.15 $0.31   $0.20    $0.38  

Diluted

  $(0.15 $0.30   $0.20    $0.38  


Quarter Ended


March 31


June 30


September 30


December 31


(in thousands, except per share amounts)


2014


Revenues


$

1,012,799


$

1,149,969


$

1,259,730


$

1,255,451


Income before income taxes


$

35,253


$

76,458


$

115,952


$

122,897


Net income


$

21,852


$

50,688


$

80,937


$

80,738


Net income attributable to noncontrolling interests


$

128


$

94


$

232


$

227


Net income attributable to the Company


$

21,724


$

50,594


$

80,705


$

80,511


Net income per share attributable to the Company’s stockholders (1):


Basic


$

0.20


$

0.47


$

0.75


$

0.75


Diluted


$

0.20


$

0.47


$

0.74


$

0.74


(1)

Net income for the year ended December 31, 2011 includes a net increase of $1.6 million related to certain items that should have been recorded in a prior year. These items increased diluted net income per share attributable to the Company’s stockholders by $0.02 for the year.
(2)Net income for the third quarter ended September 30, 2011 includes a net reduction of $0.9 million related to certain items that should have been recorded in a prior quarter. These items decreased diluted net income per share attributable to the Company’s stockholders by $0.01 for the quarter. The Company assessed these items and concluded that such items were not material to the previously reported consolidated financial statements and are not material to the consolidated financial statements for the year ended December 31, 2011.
(3)

Net income per share attributable to the Company’s stockholders for the four quarters of each fiscal year may not sum to the total for the fiscal year because of the different number of shares outstanding during each period.


Quarter Ended


  Quarter Ended 


March 31


June 30


September 30


December 31 (1)


  March 31 June 30   September 30   December 31 (2) 


(in thousands, except per share amounts)


  (in thousands, except per share amounts) 

2010 (1)


2013


Revenues

  $908,426   $969,924    $1,003,523    $1,024,739  


$

1,146,763


$

1,288,464


$

1,300,978


$

1,219,872


Income before income taxes

  $24,540   $56,995    $55,988    $74,583  


$

59,592


$

59,224


$

107,045


$

84,847


Net income

  $13,729   $34,140    $33,343    $47,744  


$

36,232


$

34,948


$

64,095


$

51,789


Net (loss) income attributable to noncontrolling interests

  $(40 $307    $210    $650  

Net income attributable to noncontrolling interests


$

54


$

276


$

205


$

162


Net income attributable to the Company

  $13,769   $33,833    $33,133    $47,094  


$

36,178


$

34,672


$

63,890


$

51,627


Net income per share attributable to the Company’s stockholders (3) (4):


Net income per share attributable to the Company’s stockholders (2):


Basic

  $0.13   $0.33    $0.32    $0.45  


$

0.34


$

0.32


$

0.60


$

0.49


Diluted

  $0.13   $0.32    $0.31    $0.44  


$

0.33


$

0.31


$

0.59


$

0.48


(1)

Net income for the yearquarter ended December 31, 20102013 includes a net expensereduction of $7.7$4.4 million related to certain items that should have been recorded in a prior year.period. These items decreased diluted net income per share attributable to the Company’s stockholders by $0.06$0.04 for the year.quarter.

(2)

Net income for the fourth quarter ended December 31, 2010 includes net expense of $6.9 million related to certain items that should have been recorded in a prior quarter. These items decreased diluted net income per share attributable to the Company’s stockholders by $0.06 for the quarter.
(3)

Net income per share attributable to the Company’s stockholders for the four quarters of each fiscal year may not sum to the total for the fiscal year because of the different number of shares outstanding during each period.

(4)Per share information was computed using the number of shares of common stock outstanding immediately following the Separation, as if such shares were outstanding for the entire period prior to the Separation.


SCHEDULE I

1 OF 1

FIRST AMERICAN FINANCIAL CORPORATION

AND SUBSIDIARY COMPANIES

SUMMARY OF INVESTMENTS—OTHER THAN INVESTMENTS IN RELATED PARTIES

(in thousands)

December 31, 2014


December 31, 2011

Column A


Column B


Column C


Column D


Column A

  Column B   Column C Column D 

Type of investment

  Cost   Market value Amount at which
shown in the
balance sheet


Cost


Market value


Amount at which
shown in the
balance sheet


Deposits with savings and loan associations and banks:


Deposits with banks:

Deposits with banks:


Consolidated

  $56,201    $56,201   $56,201  

Consolidated

$

21,445


$

21,540


$

21,445


Debt securities:


Debt securities:


U.S. Treasury bonds


U.S. Treasury bonds


Consolidated

  $71,995    $74,231   $74,231  

Consolidated

$

64,195


$

64,982


$

64,982


Municipal bonds


Municipal bonds


Consolidated

  $329,935    $349,123   $349,123  

Consolidated

$

577,703


$

587,677


$

587,677


Foreign bonds


Foreign bonds


Consolidated

  $212,200    $215,020   $215,020  

Consolidated

$

194,749


$

196,750


$

196,750


Governmental agency bonds


Governmental agency bonds


Consolidated

  $195,784    $197,753   $197,753  

Consolidated

$

198,330


$

197,874


$

197,874


Governmental agency mortgage-backed securities


Governmental agency mortgage-backed securities


Consolidated

  $1,066,656    $1,076,547   $1,076,547  

Consolidated

$

1,812,766


$

1,812,162


$

1,812,162


Non-agency mortgage-backed securities


Non-agency mortgage-backed securities


Consolidated

  $42,089    $30,634   $30,634  

Consolidated

$

15,949


$

16,538


$

16,538


Corporate debt securities


Corporate debt securities


Consolidated

  $248,921    $258,603   $258,603  

Consolidated

$

568,774


$

574,269


$

574,269


Total debt securities:


Total debt securities:


Consolidated

  $2,167,580    $2,201,911   $2,201,911  

Consolidated

$

3,432,466


$

3,450,252


$

3,450,252


Equity securities:


Equity securities:


Consolidated

  $231,887    $184,000   $184,000  

Consolidated

$

393,914


$

402,412


$

402,412


Notes receivable, net


Notes receivable, net:

Notes receivable, net:


Consolidated

  $15,581    $14,534   $15,581  

Consolidated

$

6,130


$

3,930


$

6,130


Other long-term investments:


Other long-term investments:


Consolidated

  $185,224    $185,224(1)  $185,224  

Consolidated

$

153,653


$

153,653

(1)


$

153,653


Total investments:


Total investments:


Consolidated

  $2,656,473    $2,642,917   $2,642,917  

Consolidated

$

4,007,608


$

4,031,787


$

4,033,892


(1)

As other long-term investments are not publicly traded, reasonable estimate of the fair values could not be made without incurring excessive costs.


SCHEDULE II

1 OF 45

FIRST AMERICAN FINANCIAL CORPORATION

(Parent Company)

CONDENSED BALANCE SHEETS

(in thousands, except par values)


  December 31,
2011
  December 31,
2010
 

December 31,


2014


2013


Assets


Cash and cash equivalents

  $147,339   $86,417  

$

328,949


$

221,666


Dividends receivable from subsidiaries

   —      30,000  

Due from subsidiaries, net

   7,326    20,929  

Income taxes receivable

   20,431    22,266  


5,547


37,632


Investments

   85,507    123,967  

Investment in subsidiaries

   2,426,856    2,337,361  


3,333,613


2,944,803


Property and equipment, net

   2,237    10,890  

Deferred income taxes

   39,617    96,846  


19,712


27,478


Other assets

   70,953    76,644  


105,344


88,752


  $2,800,266   $2,805,320  


$

3,793,165


$

3,320,331


Liabilities and Equity


Accounts payable and other accrued liabilities

  $27,804   $23,401  

$

55,021


$

75,656


Pension costs and other retirement plans

   415,373    389,597  


451,501


371,671


Due to CoreLogic, net

   35,370    80,468  

Income taxes payable


6,228


Due to subsidiaries, net


77


14,236


Deferred income taxes


95,128


93,362


Notes and contracts payable

   200,000    201,084  


549,166


249,163


Notes and contracts payable to subsidiaries

   86,780    117,049  


60,000


60,000


1,217,121


864,088


   765,327    811,599  


Commitments and contingencies


Stockholders’ equity:


Preferred stock, $0.00001 par value, Authorized-500 shares; Outstanding-none

   —      —    

Common stock, $0.00001 par value:


Authorized—300,000 shares; Outstanding—105,410 shares and 104,457 shares as of December 31, 2011 and 2010, respectively

   1    1  

Preferred stock, $0.00001 par value; Authorized—500 shares;
Outstanding—none


Common stock, $0.00001 par value; Authorized—300,000 shares;


Outstanding—107,541 shares and 105,900 shares


1


1


Additional paid-in capital

   2,081,242    2,057,098  


2,109,712


2,077,828


Retained earnings

   124,816    72,074  


662,310


520,764


Accumulated other comprehensive loss

   (177,459  (149,156


(199,106

)


(145,544

)


Total stockholders’ equity

   2,028,600    1,980,017  


2,572,917


2,453,049


Noncontrolling interests

   6,339    13,704  


3,127


3,194


Total equity

   2,034,939    1,993,721  


2,576,044


2,456,243


$

3,793,165


$

3,320,331


  $2,800,266   $2,805,320  


See notes to condensed financial statements

SCHEDULE II

2 OF 4


SCHEDULE II

2 OF 5

FIRST AMERICAN FINANCIAL CORPORATION

(Parent Company)

CONDENSED STATEMENTS OF INCOME

(in thousands)


Year Ended December 31,


  Year Ended
December 31,
2011
 Seven Months Ended
December 31, 2010
 

2014


2013


2012


Revenues


Dividends from subsidiaries

  $60,600   $136,650  

$

342,488


$

372,996


$

285,141


Other (loss) income

   (3,604  6,323  


Other income


6,412


12,804


29,839


   56,996    142,973  


348,900


385,800


314,980


Expenses


Other expenses

   26,010    24,281  


33,959


36,184


24,569


Income before income taxes and equity in undistributed earnings of subsidiaries

   30,986    118,692  

Income before income taxes and equity in undistributed earnings (losses) of subsidiaries


314,941


349,616


290,411


Income taxes

   12,298    45,660  


104,523


139,127


102,940


Equity in undistributed earnings of subsidiaries

   59,891    19,000  


Equity in undistributed earnings (losses) of subsidiaries


23,797


(23,425

)


114,257


Net income

   78,579    92,032  


234,215


187,064


301,728


Less: Net income attributable to noncontrolling interests

   303    980  


681


697


687


Net income attributable to the Company

  $78,276   $91,052  

$

233,534


$

186,367


$

301,041


See notes to condensed financial statements

SCHEDULE II

3 OF 4


SCHEDULE II

3 OF 5

FIRST AMERICAN FINANCIAL CORPORATION

(Parent Company)

CONDENSED STATEMENTS OF CASH FLOWSCOMPREHENSIVE INCOME

(in thousands)


   Year Ended
December 31,
2011
  Seven Months Ended
December 31, 2010
 

Cash flows from operating activities:


Cash provided by operating activities

  $78,307   $67,444  


Cash flows from investing activities:


Net change in investments

   17,852    12,893  

Purchase of subsidiary shares from/other decreases in noncontrolling interests

   (4,156  —    

Proceeds from sale of property and equipment

   1,056    —    

Capital expenditures

   (29  (3,256


Cash provided by investing activities

   14,723    9,637  


Cash flows from financing activities:


Repayment of debt

   (1,083  (766

Repayment of debt to subsidiaries

   (5,269  (3,636

Excess tax benefits from share-based compensation

   1,145    1,080  

Net proceeds from shares issued in connection with restricted stock unit, option and benefit plans

   1,152    2,430  

Distributions to noncontrolling interests

   (335  —    

Purchase of Company shares

   (2,502  —    

Cash dividends

   (25,216  (12,502


Cash used for financing activities

   (32,108  (13,394


Net increase in cash and cash equivalents

   60,922    63,687  

Cash and cash equivalents—Beginning of period

   86,417    22,730  


Cash and cash equivalents—End of period

  $147,339   $86,417  


Year Ended December 31,


2014


2013


2012


Net income

$

234,215


$

187,064


$

301,728


Other comprehensive income (loss), net of tax:


Unrealized gain (loss) on securities


18,862


(32,992

)


31,445


Unrealized gain on securities for which credit losses have been recognized in earnings


776


2,327


3,902


Foreign currency translation adjustment


(16,694

)


(13,650

)


5,131


Pension benefit adjustment


(56,496

)


49,324


(13,571

)

Total other comprehensive income (loss), net of tax


(53,552

)


5,009


26,907


Comprehensive income


180,663


192,073


328,635


Less: Comprehensive income attributable to noncontrolling interests


691


694


691


Comprehensive income attributable to the Company

$

179,972


$

191,379


$

327,944


See notes to condensed financial statements

SCHEDULE II

4 OF 4


SCHEDULE II

4 OF 5

FIRST AMERICAN FINANCIAL CORPORATION

(Parent Company)

CONDENSED STATEMENTS OF CASH FLOWS

(in thousands)


Year Ended December 31,


2014


2013


2012


Cash flows from operating activities:


Cash provided by (used for) operating activities

$

54,298


$

71,326


$

(38,703

)

Cash flows from investing activities:


Net cash effect of acquisitions


(151,570

)


Proceeds from sales of equity securities


137,823


Contributions to subsidiaries


(11,396

)


(800

)


(10,999

)

Net change in other long-term investments


1,490


6,549


595


Cash (used for) provided by investing activities


(161,476

)


5,749


127,419


Cash flows from financing activities:


Net proceeds from issuance of debt


593,943


249,095


440,000


Repayment of debt


(300,000

)


(160,000

)


(480,000

)

Repayment of debt to subsidiaries


(2,902

)

Excess tax benefits from share-based compensation


6,856


6,202


2,372


Net proceeds in connection with share-based compensation plans


3,601


1,736


12,668


Purchase of Company shares


(64,606

)


Cash dividends


(89,939

)


(51,324

)


(44,705

)

Cash provided by (used for) financing activities


214,461


(18,897

)


(72,567

)

Net increase in cash and cash equivalents


107,283


58,178


16,149


Cash and cash equivalents—Beginning of period


221,666


163,488


147,339


Cash and cash equivalents—End of period

$

328,949


$

221,666


$

163,488


See notes to condensed financial statements


SCHEDULE II

5 OF 5

FIRST AMERICAN FINANCIAL CORPORATION

(Parent Company)

NOTES TO CONDENSED FINANCIAL STATEMENTS


NOTE 1.    Significant Accounting Policies:

Description of the Company:

First American Financial Corporation became a publicly traded company following its spin-off from its prior parent, The First American Corporation (“TFAC”) on June 1, 2010. On that date, TFAC distributed all of First American Financial Corporation’s outstanding shares to the record date shareholders of TFAC on a one-for-one basis. After the distribution, First American Financial Corporation owns TFAC’s financial services businesses and TFAC, which reincorporated and assumed the name CoreLogic, Inc. continues, continued to own its information solutions businesses. As such, in 2010 First American Financial Corporation’s Parent Company opening condensed balance sheet is as of June 1, 2010 and the condensed statements of income and cash flows are for the seven months ended December 31, 2010.

First American Financial Corporation is a holding company that conducts all of its operations through its subsidiaries. The Parent Company Financial Statements should be read in connection with the consolidated financial statements and notes thereto included elsewhere in this Form 10-K.

Supplemental information about non-cash financing activity

In 2013, $23.9 million in tax receivables due from subsidiaries were reduced with a corresponding reduction in notes payable to subsidiaries in noncash transactions.

NOTE 2.    Dividends Received:

The Companyholding company received cash dividends from subsidiaries of $75.6$79.1 million, $125.1 million and $83.8$11.8 million for the years ended December 31, 20112014, 2013 and 2010,2012, respectively.


SCHEDULE III

1 OF 2

FIRST AMERICAN FINANCIAL CORPORATION

AND SUBSIDIARY COMPANIES

SUPPLEMENTARY INSURANCE INFORMATION

(in thousands)

BALANCE SHEET CAPTIONS


Column A


Column B


Column C


Column D


Segment


Deferred
policy
acquisition
costs


Claims
reserves


Deferred
revenues


2014


Title Insurance and Services

$

2,179


$

969,008


$

14,265


Specialty Insurance


25,316


42,772


188,499


Total

$

27,495


$

1,011,780


$

202,764


2013


Title Insurance and Services

$

2,375


$

977,355


$

14,544


Specialty Insurance


24,437


41,010


177,640


Total

$

26,812


$

1,018,365


$

192,184


SUPPLEMENTARY INSURANCE INFORMATION


(in thousands)

BALANCE SHEET CAPTIONS

Column A

  Column B   Column C   Column D 

Segment

  Deferred
policy
acquisition
costs
   Claims
reserves
   Deferred
revenues
 

2011


Title Insurance and Services

  $—      $981,522    $10,261  

Specialty Insurance

   21,800     33,154     145,365  


Total

  $21,800    $1,014,676    $155,626  


2010


Title Insurance and Services

  $—      $1,070,680    $7,603  

Specialty Insurance

   20,639     37,558     137,116  


Total

  $20,639    $1,108,238    $144,719  


SCHEDULE III

2 OF 2

FIRST AMERICAN FINANCIAL CORPORATION

AND SUBSIDIARY COMPANIES

SUPPLEMENTARY INSURANCE INFORMATION

(in thousands)

INCOME STATEMENT CAPTIONS


Column A


Column F


Column G


Column H


Column I


Column J


Column K


Segment


Premiums
and escrow
fees


Net
investment
income (1)


Loss
provision


Amortization
of deferred
policy
acquisition
costs


Other
operating
expenses


Premiums
written


2014


Title Insurance and Services

$

3,603,080


$

83,635


$

253,122


$

2,746


$

761,584


$


Specialty Insurance


353,812


12,594


196,901


(878

)


45,599


364,782


Corporate


6,415


26,528


Eliminations


(1,536

)


(30

)


Total

$

3,956,892


$

101,108


$

450,023


$

1,868


$

833,681


$

364,782


2013


Title Insurance and Services

$

3,900,132


$

79,940


$

343,461


$

1,261


$

816,870


$


Specialty Insurance


329,194


8,767


186,895


(2,529

)


41,725


344,433


Corporate


13,008


27,264


Eliminations


(2,609

)


(54

)


Total

$

4,229,326


$

99,106


$

530,356


$

(1,268

)


$

885,805


$

344,433


2012


Title Insurance and Services

$

3,455,592


$

101,495


$

237,427


$

1,174


$

769,477


$


Specialty Insurance


296,053


17,513


160,290


(108

)


42,395


312,696


Corporate


29,892


24,462


Eliminations


(3,747

)


(15

)


Total

$

3,751,645


$

145,153


$

397,717


$

1,066


$

836,319


$

312,696


(1)

Net investment income includes net investment income, net realized investment gains and net other-than-temporary impairment losses.


SUPPLEMENTARY INSURANCE INFORMATION


(in thousands)

INCOME STATEMENT CAPTIONS

Column A

  Column F   Column G  Column H   Column I  Column J   Column K 

Segment

  Premiums
and escrow
fees
   Net
investment
income
  Loss
provision
   Amortization
of deferred
policy
acquisition
costs
  Other
operating
expenses
   Net
premiums
written
 

2011


Title Insurance and Services

  $2,852,455    $66,721   $270,697    $—     $693,541    $—    

Specialty Insurance

   273,665     11,786    149,439     (1,161  38,106     275,044  

Corporate

   —       (1,660  —       —      22,102     —    

Eliminations

   —       (3,876  —       —      1     —    


Total

  $3,126,120    $72,971   $420,136    $(1,161 $753,750    $275,044  


2010


Title Insurance and Services

  $2,908,797    $76,299   $180,821    $—     $734,901    $—    

Specialty Insurance

   272,863     13,703    140,053     1,887    42,385     271,809  

Corporate

   —       8,252    —       —      26,302     —    

Eliminations

   —       (1,806  —       —      15     —    


Total

  $3,181,660    $96,448   $320,874    $1,887   $803,603    $271,809  


2009


Title Insurance and Services

  $3,014,216    $86,024   $205,819    $—     $849,320    $—    

Specialty Insurance

   270,475     7,901    140,895     2,353    41,975     265,601  

Corporate

   —       1,103    —       —      18,171     —    


Total

  $3,284,691    $95,028   $346,714    $2,353   $909,466    $265,601  


SCHEDULE IV

1 OF 1

FIRST AMERICAN FINANCIAL CORPORATION

AND SUBSIDIARY COMPANIES

REINSURANCE

REINSURANCE

(in thousands, except percentages)


Segment

  Premiums
and escrow
fees before
reinsurance
   Ceded to
other
companies
   Assumed
from
other
companies
   Premiums
and escrow
fees
   Percentage of
amount
assumed to
premiums
and escrow
fees
 

Title Insurance and Services


2011

  $2,861,418    $13,744    $4,781    $2,852,455     0.2


2010

  $2,912,767    $12,457    $8,487    $2,908,797     0.3


2009

  $3,014,368    $4,430    $4,278    $3,014,216     0.1


Specialty Insurance


2011

  $283,885    $10,220    $—      $273,665     0.0


2010

  $281,275    $8,412    $—      $272,863     0.0


2009

  $278,307    $7,832    $—      $270,475     0.0


Segment


Premiums
and escrow
fees before
reinsurance


Ceded to
other
companies


Assumed
from
other
companies


Premiums
and escrow
fees


Percentage of
amount
assumed to
premiums
and escrow
fees


Title Insurance and Services


2014

$

3,627,921


$

28,727


$

3,886


$

3,603,080


0.1

%

2013

$

3,923,117


$

27,483


$

4,498


$

3,900,132


0.1

%

2012

$

3,472,675


$

19,884


$

2,801


$

3,455,592


0.1

%

Specialty Insurance


2014

$

363,044


$

9,232


$


$

353,812


0.0

%

2013

$

338,204


$

9,010


$


$

329,194


0.0

%

2012

$

305,073


$

9,020


$


$

296,053


0.0

%


SCHEDULE V

1 OF 3

FIRST AMERICAN FINANCIAL CORPORATION

AND SUBSIDIARY COMPANIES

VALUATION AND QUALIFYING ACCOUNTS

(in thousands)

Year Ended December 31, 20112014


Column A

  Column B   Column C  Column D  Column E 

Description

  Balance at
beginning
of period
   Additions  Deductions
from
reserve
  Balance
at end
of period
 
    Charged to
costs and
expenses
  Charged
to other
accounts
   

Reserve deducted from accounts receivable:


Consolidated

  $39,904    $1,723    $11,123(A)  $30,504  


Reserve for known and incurred but not reported claims:


Consolidated

  $1,108,238    $420,136   $(10,264 $503,434(B)  $1,014,676  


Reserve deducted from loans receivable:


Consolidated

  $3,271    $900     $4,171  


Reserve deducted from other assets:


Consolidated

  $5,905    $1,026    $2,748   $4,183  


Reserve deducted from deferred income taxes:


Consolidated

  $19,126    $(2,976 $5,276    $21,426  


Column A


Column B


Column C


Column D


Column E


Additions


Description


Balance at
beginning
of period


Charged to
costs and
expenses


Charged
to other
accounts


Deductions
from
reserve


Balance
at end
of period


Reserve deducted from accounts receivable:


Consolidated

$

31,831


$

12,352


$


$

9,521

(A)


$

34,662


Reserve for known and incurred but not reported claims:


Consolidated

$

1,018,365


$

450,023


$

13,142


$

469,750

(B)


$

1,011,780


Reserve deducted from notes receivable:


Consolidated

$

2,584


$

128


$


$

271


$

2,441


Reserve deducted from deferred income taxes:


Consolidated

$

18,119


$


$


$

2,413


$

15,706


Note A—Amount represents accounts written off, net of recoveries.

Note B—Amount represents claim payments, net of recoveries.


SCHEDULE V

2 OF 3

FIRST AMERICAN FINANCIAL CORPORATION

AND SUBSIDIARY COMPANIES

VALUATION AND QUALIFYING ACCOUNTS

(in thousands)

Year Ended December 31, 20102013


Column A

  Column B   Column C   Column D  Column E 

Description

  Balance at
beginning
of period
   Additions   Deductions
from
reserve
  Balance
at end
of period
 
    Charged to
costs and
expenses
  Charged
to other
accounts
    

Reserve deducted from accounts receivable:


Consolidated

  $35,595    $11,046     $6,737(A)  $39,904  


Reserve for known and incurred but not reported claims:


Consolidated

  $1,227,757    $320,874   $15,832    $456,225(B)  $1,108,238  


Reserve deducted from loans receivable:


Consolidated

  $2,071    $1,200      $3,271  


Reserve deducted from other assets:


Consolidated

  $6,679    $1,541     $2,315   $5,905  


Reserve deducted from deferred income taxes:


Consolidated

  $27,045    $(7,919    $19,126  


Column A


Column B


Column C


Column D


Column E


Additions


Description


Balance at
beginning
of period


Charged to
costs and
expenses


Charged
to other
accounts


Deductions
from
reserve


Balance
at end
of period


Reserve deducted from accounts receivable:


Consolidated

$

30,917


$

7,478


$


$

6,564

(A)


$

31,831


Reserve for known and incurred but not reported claims:


Consolidated

$

976,462


$

530,356


$

(9,143

)


$

479,310

(B)


$

1,018,365


Reserve deducted from notes receivable:


Consolidated

$

2,902


$

(132

)


$


$

186


$

2,584


Reserve deducted from deferred income taxes:


Consolidated

$

14,172


$

3,578


$

369


$


$

18,119


Note A—Amount represents accounts written off, net of recoveries.

Note B—Amount represents claim payments, net of recoveries.


SCHEDULE V

3 OF 3

FIRST AMERICAN FINANCIAL CORPORATION

AND SUBSIDIARY COMPANIES

VALUATION AND QUALIFYING ACCOUNTS

(in thousands)

Year Ended December 31, 20092012


Column A

  Column B   Column C   Column D  Column E 

Description

  Balance at
beginning
of period
   Additions   Deductions
from
reserve
  Balance
at end
of period
 
    Charged to
costs and
expenses
   Charged
to other
accounts
    

Reserve deducted from accounts receivable:


Consolidated

  $43,695    $20,377      $28,477(A)  $35,595  


Reserve for known and incurred but not reported claims:


Consolidated

  $1,326,282    $346,714    $6,948    $452,187(B)  $1,227,757  


Reserve deducted from loans receivable:


Consolidated

  $1,600    $471       $2,071  


Reserve deducted from other assets:


Consolidated

  $15,817    $792      $9,930   $6,679  


Reserve deducted from deferred income taxes:


Consolidated

  $19,922    $7,123       $27,045  


Column A


Column B


Column C


Column D


Column E


Additions


Description


Balance at
beginning
of period


Charged to
costs and
expenses


Charged
to other
accounts


Deductions
from
reserve


Balance
at end
of period


Reserve deducted from accounts receivable:


Consolidated

$

30,504


$

4,927


$


$

4,514

(A)


$

30,917


Reserve for known and incurred but not reported claims:


Consolidated

$

1,014,676


$

397,717


$

10,055


$

445,986

(B)


$

976,462


Reserve deducted from notes receivable:


Consolidated

$

4,183


$

462


$


$

1,743


$

2,902


Reserve deducted from deferred income taxes:


Consolidated

$

21,426


$


$

15


$

7,269


$

14,172


Note A—Amount represents accounts written off, net of recoveries.

Note B—Amount represents claim payments, net of recoveries.


Item 9.

Changes in and Disagreements with Accountants on Accounting and Financial Disclosure

None.


Item  9A.

Controls and Procedures

Disclosure Controls and Procedures

The Company’s chief executive officer and chief financial officer have concluded that, as of December 31, 2011,2014, the end of the fiscal year covered by this Annual Report on Form 10-K, the Company’s disclosure controls and procedures, as defined in Rule 13a-15(e) of the Securities Exchange Act of 1934, as amended, were effective, based on the evaluation of these controls and procedures required by Rule 13a-15(b) thereunder.

Management’s Annual Report on Internal Control Over Financial Reporting

Management of the Company is responsible for establishing and maintaining adequate internal control over financial reporting. The Company’s internal control over financial reporting has been designed to provide reasonable assurance regarding the reliability of financial reporting and the preparation of financial statements for external purposes in accordance with accounting principles generally accepted in the United States of America.

The Company’s internal control over financial reporting includes policies and procedures that pertain to the maintenance of records that, in reasonable detail, accurately and fairly reflect transactions and dispositions of assets of the Company; provide reasonable assurance that transactions are recorded as necessary to permit preparation of financial statements in accordance with accounting principles generally accepted in the United States of America, and that receipts and expenditures are being made only in accordance with authorization of management and directors of the Company; and provide reasonable assurance regarding prevention or timely detection of unauthorized acquisition, use or disposition of the Company’s assets that could have a material effect on the Company’s consolidated financial statements.

Because of its inherent limitations, internal control over financial reporting may not prevent or detect misstatements. Also, projections of any evaluation of effectiveness to future periods are subject to the risk that controls may become inadequate because of changes in conditions, or that the degree of compliance with the policies or procedures may deteriorate.

Management assessed the effectiveness of the Company’s internal control over financial reporting as of December 31, 2011.2014. In making this assessment, management used the criteria set forth by the Committee of Sponsoring Organizations of the Treadway Commission (“COSO”) inInternal Control—Integrated Framework (2013). Based on that assessment under the framework inInternal Control—Integrated Framework (2013), management determined that, as of December 31, 2011,2014, the Company’s internal control over financial reporting was effective.

PricewaterhouseCoopers LLP, the independent registered public accounting firm that audited the Company’s consolidated financial statements provided in Item 8, above, has issued a report on the Company’s internal control over financial reporting.

Changes in Internal Control Over Financial Reporting

There was no change in the Company’s internal control over financial reporting during the quarter ended December 31, 2011,2014, that has materially affected, or is reasonably likely to materially affect, the Company’s internal control over financial reporting.


Item  9B.

Other Information

On February 20, 2015, the board of directors amended the Company’s bylaws to add language that (i) requires a director nominee to offer to resign if he or she receives a greater number of “withhold” votes than “for” votes in an uncontested election and (ii) designates Delaware courts as the exclusive forum for the adjudication of certain stockholder disputes.  

The majority voting provision set forth in Section 3.2 of the amended and restated bylaws generally provides that:  (a) in an uncontested election any nominee for director who receives a greater number of “withhold” votes than votes “for” his or her election will promptly tender his or her resignation as a director; (b) the board of directors will decide within ninety


(90) days following certification of the stockholder vote whether to accept or reject the resignation offer; and (c) if the board of directors accepts the resignation offer, it will thereafter determine whether to fill the resulting vacancy or reduce the size of the board of directors.

The forum selection provision set forth in Article IX of the amended and restated bylaws generally provides that, unless the Company otherwise consents in writing, the sole and exclusive forum for any stockholder to bring:  (a) any derivative action or proceeding brought on behalf of the Company, (b) any action asserting a claim of breach of a fiduciary duty to the Company or the Company’s stockholders, (c) any action asserting a claim arising pursuant to any provisions of the Delaware General Corporation Law or the Company’s certificate of incorporation or bylaws, or (d) any action asserting a claim governed by the internal affairs doctrine shall be a state court located within the State of Delaware (or, if no state court located within the State of Delaware has jurisdiction, the federal district court for the District of Delaware). The Company’s board of directors believes that the forum selection amendment is in the best interests of the stockholders because, among other reasons, Delaware courts have developed expertise in resolving disputes regarding corporate litigation and it is the same state in which the Company is incorporated. Focusing litigation in one jurisdiction avoids unnecessary risk, uncertainty and expense from potentially concurrent multi-jurisdictional litigation. The board of directors expects the exclusive forum to result in a more predictable outcome in those legal actions covered by the forum selection amendment and avoid unnecessary expenditure of Company resources. The forum selection amendment does not preclude any type of legal actions against the Company or its directors or officers; rather, it directs certain legal actions to a single jurisdiction that is focused on and experienced with Delaware law, with the goal of securing a more efficient and effective resolution of those legal actions. The forum selection amendment also preserves the ability of the Company to consent to the selection of an alternative forum.

The description of the amendments to the Company's bylaws provided herein is qualified in its entirety by reference to the Company's amended and restated bylaws, which are attached hereto as Exhibit 3.2 and are incorporated by reference into this Item 9B.


Effective as of February 24, 2012, Parker S. Kennedy has resigned as the Company’s executive chairman and has been appointed chairman of the board.


PART III

The information required by Items 10 through 14 of this report is expected to be set forth in the sections entitled “Information Regarding the Nominees for Election,” “Information Regarding the Other Incumbent Directors,” “Election of Class III Directors,” “Executive Officers,” “Section 16(a) Beneficial Ownership Reporting Compliance,” “Board and Committee Meetings,” “Executive Compensation,” “Compensation Discussion and Analysis,” “Director“2014 Director Compensation,” “Codes of Ethics,” “Compensation Committee Interlocks and Insider Participation,” “Compensation Committee Report,” “Securities Authorized for Issuance under Equity Compensation Plans,” “Who are the largest principal stockholders outside of management?,” “Security Ownership of Management,” “Principal Accounting Fees and Services” “Policy on Audit Committee Pre-approval of Audit and Permissible Nonaudit Services of Independent Auditor,” “Transactions with Management and Others” and “Independence of Directors” in the Company’s definitive proxy statement, and is hereby incorporated in this report and made a part hereof by reference. If the definitive proxy statement is not filed within 120 days after the close of the fiscal year, the Company will file an amendment to this Annual Report on Form 10-K to include the information required by Items 10 through 14.


PART IV


PART IV

Item  15.    Exhibits

Exhibits and Financial Statement Schedules


(a

(a)

1. & 2.

Financial Statements and Financial Statement Schedules

The Financial Statements and Financial Statement Schedules filed as part of this report are listed in the accompanying index at page 5948 in Item 8 of Part II of this report.

(a) 3.

Exhibits. See Exhibit Index. (Each management contract or compensatory plan or arrangement in which any director or named executive officer of First American Financial Corporation, as defined by Item 402(a)(3) of Regulation S-K (17 C.F.R. §229.402(a)(3)), participates that is included among the exhibits listed on the Exhibit Index is identified on the Exhibit Index by an asterisk (*).)

SIGNATURES


SIGNATURES

Pursuant to the requirements of Section 13 or 15(d) of the Securities Exchange Act of 1934, the registrant has duly caused this report to be signed on its behalf by the undersigned, thereunto duly authorized.


FIRST AMERICAN FINANCIAL CORPORATION
(Registrant)

(Registrant)

By

/S/s/    DENNIS J. GILMORE


Dennis J. Gilmore

Chief Executive Officer

(Principal Executive Officer)

Date: February 27, 2012

23, 2015

By

/S/s/    MAX O. VALDES        ARK E. SEATON


Mark E. Seaton

Max O. Valdes

Chief Financial Officer

(Principal Financial Officer)

Date: February 27, 201223, 2015

Pursuant to the requirements of the Securities Exchange Act of 1934, this report has been signed below by the following persons on behalf of the registrant and in the capacities and on the dates indicated.


Signature

Title

Date

/S/s/    DENNIS J. GILMORE        

Dennis J. Gilmore

Chief Executive Officer and Director

(Principal Executive Officer)

February 27, 2012

23, 2015

/s/    MAX O. VALDES        

Max O. Valdes

/S/    Mark E. Seaton

Mark E. Seaton

Chief Financial Officer

(Principal Financial Officer)

February 23, 2015

/S/    Matthew F. Wajner

Matthew F. Wajner

Chief Accounting Officer and

(Principal Accounting Officer)

February 27, 2012

23, 2015

/S/s/    PARKER S. KENNEDY           

Parker S. Kennedy

Chairman of the Board of Directors

February 27, 2012

23, 2015

/S/s/    ANTHONY K. ANDERSON          

Anthony K. Anderson

Director

February 23, 2015

/S/    GEORGE L. ARGYROS         

George L. Argyros

Director

February 27, 2012

23, 2015

/s/    WILLIAM G. DAVIS        

William G. Davis

Director

February 27, 2012

/SignatureS

/    JTitleAMES

Date

/s/    JAMES L. DOTI         

James L. Doti

Director

February 27, 2012

23, 2015

/S/s/    LEWIS W. DOUGLAS,  JR.    MICHAEL D. MCKEE           

Lewis W. Douglas, Jr.

Michael D. McKee

Director

February 27, 2012

23, 2015

/s/    MICHAEL D. MCKEE        

Michael D. Mckee

Director

February 27, 2012

/S/s/    THOMAS V. MCKERNAN        

Thomas V. McKernan

Director

February 27, 2012

23, 2015

/s/    FRANK O’BRYAN        

Frank O’Bryan

/S/    Mark C. Oman

Mark C. Oman

Director

February 27, 201223, 2015


Signature

Title

Date

/S/s/    HERBERT B. TASKER           

Herbert B. Tasker

Director

February 27, 2012

23, 2015

/S/s/    VIRGINIA M. UEBERROTH        

Virginia M. Ueberroth

Director

February 27, 201223, 2015


Exhibit No.

Description

Location

3.1

Amended and Restated Certificate of Incorporation of First American Financial Corporation dated May 28, 2010.

Incorporated by reference herein to Exhibit 3.1 to the Current Report on Form 8-K dated June 1, 2010.

3.2

Amended and Restated Bylaws of First American Financial Corporation.Corporation, effective as of February 20, 2015.

Attached.

4.1

Indenture, dated as of January 24, 2013, between  First American Financial Corporation and U.S. Bank National Association, as trustee.

Incorporated by reference herein to Exhibit 3.24.1 to the Form S-3ASR filed January 24, 2013.

4.2

First Supplemental Indenture, dated as of January 29, 2013, between First American Financial Corporation and U.S. Bank National Association.

Incorporated by reference herein to Exhibit 4.2 to the Current Report on Form 8-K dated June 1, 2010.January 29, 2013.

10.1

4.3

Second Supplemental Indenture, dated as of November 10, 2014, between First American Financial Corporation and U.S. Bank National Association.

Incorporated by reference herein to Exhibit 4.2 to the Current Report on Form 8-K dated November 10, 2014.

4.4

Form of 4.30% Senior Notes due 2023.

Incorporated by reference herein to Exhibit A of Exhibit 4.2 to the Current Report on Form 8-K dated January 29, 2013.

4.5

Form of 4.60% Senior Notes due 2024.

Incorporated by reference herein to Exhibit A of Exhibit 4.2 to the Current Report on Form 8-K dated November 10, 2014.

10.1

Separation and Distribution Agreement by and between The First American Corporation (n/k/a CoreLogic, Inc.) and First American Financial Corporation dated as of June 1, 2010.

Incorporated by reference herein to Exhibit 10.1 to the Current Report on Form 8-K dated June 1, 2010.

10.2

Amended and Restated Credit Agreement dated as of April 12, 2010,May 14, 2014, among First American Financial Corporation, the Guarantors party thereto, the Lenders party thereto and JPMorgan Chase Bank, N.A., as Administrative Agent.

Incorporated by reference herein to Exhibit 10(s)10.1 to Amendment No. 3 tothe Quarterly Report on Form 10 filed April10-Q for the quarter ended June 30, 2010.2014.

10.3

Tax Sharing Agreement by and between The First American Corporation (n/k/a CoreLogic, Inc.) and First American Financial Corporation dated as of June 1, 2010.

Incorporated by reference herein to Exhibit 10.2 to the Current Report on Form 8-K dated June 1, 2010.

10.4

Promissory Note of The First American Corporation (n/k/a CoreLogic, Inc.) to First American Financial Corporation dated as of June 1, 2010.Incorporated by reference herein to Exhibit 10.4 to the Annual Report on Form 10-K for the year ended December 31, 2010.
10.5

Third Amended and Restated Secured Promissory Note of First American Financial Corporation to First American Title Insurance Company in the amount of $45,000,000,$60,000,000.00, dated as of December 31, 2011.September 30, 2013.

Attached.
10.6Promissory Note of First American Financial Corporation to First American Home Buyers Protection Corporation in the amount of $8,970,705, dated as of December 14, 2001.

Incorporated by reference herein to Exhibit 10(u)10.1 to Amendment No. 1 tothe Quarterly Report on Form 10 filed February 12, 2010.

10.7Promissory Note of First American Financial Corporation to First American Home Buyers Protection Corporation in10-Q for the amount of $10,000,000, dated as of March 29, 2002.Incorporated by reference herein to Exhibit 10(v) to Amendment No. 1 to Form 10 filed February 12, 2010.
10.8Promissory Note of First American Financial Corporation to First American Home Buyers Protection Corporation in the amount of $10,000,000, dated as of January 31, 2003.Incorporated by reference herein to Exhibit 10(w) to Amendment No. 1 to Form 10 filed February 12, 2010.
10.9Promissory Note of First American Financial Corporation to First American Home Buyers Protection Corporation in the amount of $10,000,000, dated as of January 9, 2004.Incorporated by reference herein to Exhibit 10(x) to Amendment No. 1 to Form 10 filed February 12, 2010.
10.10Promissory Note of First American Financial Corporation to First American Home Buyers Protection Corporation in the amount of $30,000,000, dated as of March 12, 2004.Incorporated by reference herein to Exhibit 10(y) to Amendment No. 1 to Form 10 filed February 12, 2010.
quarter ended September 30, 2013.

Exhibit No.

Description

Location

*10.5

10.11Promissory Note of First American Financial Corporation to First American Home Buyers Protection Corporation in the amount of $10,000,000, dated as of March 7, 2005.Incorporated by reference herein to Exhibit 10(z) to Amendment No. 1 to Form 10 filed February 12, 2010.
*10.12

First American Financial Corporation Executive Supplemental Benefit Plan, amended and restated effective as of January 1, 2011.

Incorporated by reference herein to Exhibit 10.12 to the Annual Report on Form 10-K for the year ended December 31, 2010.

*10.1310.5.1

Amendment No. 1, dated January 21, 2015, to First American Financial Corporation Executive Supplemental Benefit Plan, amended and restated effective as of January 1, 2011.

Attached.

*10.6

First American Financial Corporation Deferred Compensation Plan, amended and restated effective as of January 1, 2012.

Attached.

*10.14First American Financial Corporation 2010 Incentive Compensation Plan, approved May 28, 2010.

Incorporated by reference herein to Exhibit 10.6 to the Current Report on Form 8-K dated June 1, 2010.

*10.15Form of Notice of Restricted Stock Unit Grant (Non-Employee Director) and Restricted Stock Unit Award Agreement (Non-Employee Director), approved February 10, 2009.

Incorporated by reference herein from Exhibit 10(yy) of The First American Corporation (n/k/a CoreLogic, Inc.) Annual Report on Form 10-K for the year ended December 31, 2008.

*10.16Form of Notice of Restricted Stock Unit Grant (Non-Employee Director) and Restricted Stock Unit Award Agreement (Non-Employee Director) for Non-Employee Director Restricted Stock Unit Award approved January 18, 2011.Incorporated by reference herein to Exhibit 10.1510.13 to the Annual Report on Form 10-K for the year ended December 31, 2010.2011.


*10.17

Exhibit No.

Description

Location

*10.7

First American Financial Corporation 2010 Incentive Compensation Plan, effective May 28, 2010.

Incorporated by reference herein to Appendix A to the Definitive Proxy Statement on Schedule 14A filed April 9, 2012.

*10.7.1

Form of Notice of Restricted Stock Unit Grant (Non-Employee Director) and Restricted Stock Unit Award Agreement (Non-Employee Director) for Non-Employee Director Restricted Stock Unit Award approved January 17, 2012.

Incorporated by reference herein to Exhibit 10.17 to the Annual Report on Form 10-K for the year ended December 31, 2011.

*10.7.2

Form of Notice of Restricted Stock Unit Grant (Non-Employee Director) and Restricted Stock Unit Award Agreement (Non-Employee Director) for Non-Employee Director Restricted Stock Unit Award approved January 15, 2013.

Incorporated by reference herein to Exhibit 10.7.4 to the Annual Report on Form 10-K for the year ended December 31, 2012.

*10.7.3

Form of Notice of Restricted Stock Unit Grant (Non-Employee Director) and Restricted Stock Unit Award Agreement (Non-Employee Director) for Non-Employee Director Restricted Stock Unit Award approved January 14, 2014.

Incorporated by reference herein to Exhibit 10.7.4 to the Annual Report on Form 10-K for the year ended December 31, 2013.

*10.7.4

Form of Notice of Restricted Stock Unit Grant (Non-Employee Director) and Restricted Stock Unit Award Agreement (Non-Employee Director) for Non-Employee Director Restricted Stock Unit Award approved January 21, 2015.

Attached.

*10.1810.7.5

Form of Notice of Restricted Stock Unit Grant (Employee) and Restricted Stock Unit Award Agreement (Employee), approved January 25, 2010.

Incorporated by reference herein from Exhibit 10(zz) to The First American Corporation (n/k/a CoreLogic, Inc.) Annual Report on Form 10-K for the year ended December 31, 2009.

*10.1910.7.6

Form of Notice of Restricted Stock Unit Grant and Restricted Stock Unit Award Agreement approved June 10, 2010.

Incorporated by reference herein to Exhibit 10(i) to the Quarterly Report on Form 10-Q for the quarter ended June 30, 2010.

*10.2010.7.7

Form of Notice of Restricted Stock Unit Grant (Employee) and Restricted Stock Unit Award Agreement (Employee), approved February 11, 2011.

Incorporated by reference herein to Exhibit 10.21 to the Annual Report on Form 10-K for the year ended December 31, 2010.

*10.21.110.7.8

Form of Notice of Restricted Stock Unit Grant (Employee) and Restricted Stock Unit Award Agreement (Employee), approved January 17, 2012.

Attached.

Incorporated by reference herein to Exhibit 10.21.1 to the Annual Report on Form 10-K for the year ended December 31, 2011.

*10.21.210.7.9

Form of Notice of Restricted Stock Unit Grant (Valdes)(Employee) and Restricted Stock Unit Award Agreement (Valdes)(Employee), approved February 13,January 15, 2013.

Incorporated by reference herein to Exhibit 10.7.10 to the Annual Report on Form 10-K for the year ended December 31, 2012.

Attached.

Exhibit No.

Description

Location

*10.7.10

Form of Notice of Restricted Stock Unit Grant (Employee) and Restricted Stock Unit Award Agreement (Employee), approved January 14, 2014.

Incorporated by reference herein to Exhibit 10.7.12 to the Annual Report on Form 10-K for the year ended December 31, 2013.

*10.22

*10.7.11

Form of Notice of Restricted Stock Unit Grant (Employee) and Restricted Stock Unit Award Agreement (Employee), approved January 21, 2015.

Attached.

*10.7.12

Form of Notice of Performance Unit Grant and Performance Unit Award Agreement, approved January 25, 2010.15, 2013.

Incorporated by reference herein fromto Exhibit 10(mmm)10.7.15 to The First American Corporation (n/k/a CoreLogic, Inc.)the Annual Report on Form 10-K for the year ended December 31, 2009.2012.


*10.23

Exhibit No.

Form of Notice of Performance Unit Grant and Performance Unit Award Agreement, approved March 7, 2011.

Description

Incorporated by reference herein to Exhibit 10.1 to the Quarterly Report on Form 10-Q for the quarter ended March 31, 2011.

Location

*10.7.13

*10.24

Form of Notice of Performance Unit Grant and Performance Unit Award Agreement, approved January 17, 2012.14, 2014.

Attached.
*10.25Arrangement regarding salaries, bonuses and long term incentive restricted stock units for named executive officers, approved August 25, 2010 and August 31, 2010, respectively.

Incorporated by reference herein to Exhibit 10.7.14 to the description contained in the CurrentAnnual Report on Form 8-K, dated August10-K for the year ended December 31, 2010.2013.

*10.2610.7.14

Arrangement regarding salaries, bonuses

Form of Notice of Performance Unit Grant and long term incentive restricted stock units for named executive officers,Performance Unit Award Agreement, approved March 29, 2011.January 21, 2015.

Incorporated by reference herein to the description contained in the Current Report on Form 8-K filed April 4, 2011.

Attached.

*10.2710.8

Employment Agreement, dated August 30, 2011,May 22, 2014, between First American Financial Corporation and Dennis J. Gilmore.

Incorporated by reference herein to Exhibit 10.110.2 to the Quarterly Report on Form 10-Q for the quarter ended September 30,2011.June 30, 2014.

*10.2810.9

Employment Agreement, dated August 30, 2011,May 22, 2014, between First American Financial Corporation and Kenneth D. DeGiorgio.

Incorporated by reference herein to Exhibit 10. 23 to the Quarterly Report on Form 10-Q for the quarter ended SeptemberJune 30, 2011.2014.

*10.2910.10

Employment Agreement, dated August 30, 2011,May 15, 2014, between First American Financial Corporation and Max O. Valdes.Christopher M. Leavell.

Incorporated by reference herein to Exhibit 10.310.4 to the Quarterly Report on Form 10-Q for the quarter ended September 30,2011.June 30, 2014.

*10.3010.11

Letter

Employment Agreement, amongdated May 15, 2014, between First American Financial Corporation The First American Corporation (n/k/a CoreLogic, Inc.) and Parker S. Kennedy dated as of May 31, 2010.Mark E. Seaton.

Incorporated by reference herein to Exhibit 10.7 to the Current Report on Form 8-K dated June 1, 2010.

*10.31Letter agreement dated October 29, 2010 among First American Financial Corporation, CoreLogic, Inc. and Parker S. Kennedy.Incorporated by reference herein to Exhibit 10(e)10.5 to the Quarterly Report on Form 10-Q for the quarter ended SeptemberJune 30, 2010.2014.

*10.3210.12

Change in Control Agreement effective as of December 31, 2010, by and between First American Financial Corporation and Parker S. Kennedy.Incorporated by reference herein to Exhibit 10(d) to the Quarterly Report on Form 10-Q for the quarter ended September 30, 2010.
*10.33

First American Financial Corporation Form of Amended and Restated Change in Control Agreement effective as of December 31, 2010.

Incorporated by reference herein to Exhibit 10(c) to the Quarterly Report on Form 10-Q for the quarter ended September 30, 2010.

(21)

Subsidiaries of the registrant.

Attached.

(23)

Consent of Independent Registered Public Accounting Firm.

Attached.

Exhibit No.

Description

Location

(31)(a)

(31)(a)

Certification by Chief Executive Officer Pursuant to Rule 13a-14(a) under the Securities Act of 1934.

Attached.

(31)(b)

Certification by Chief Financial Officer Pursuant to Rule 13a-14(a) under the Securities Exchange Act of 1934.

Attached.

(32)(a)

Certification by Chief Executive Officer Pursuant to 18 U.S.C. Section 1350.

Attached.

(32)(b)

Certification by Chief Financial Officer Pursuant to 18 U.S.C. Section 1350.

Attached.

101.INS

XBRL Instance Document.

Attached.

101.SCH

XBRL Taxonomy Extension Schema Document.

Attached.

101.CAL

XBRL Taxonomy Extension Calculation Linkbase Document.

Attached.

101.DEF

XBRL Taxonomy Extension Definition Linkbase Document.

Attached.

101.LAB

XBRL Taxonomy Extension Label Linkbase Document.

Attached.

101.PRE

XBRL Taxonomy Extension Presentation Linkbase Document.

Attached.


146120