| UNITED STATES | ||
| SECURITIES AND EXCHANGE COMMISSION | ||
| Washington, D.C. 20549 | ||
| FORM 10-K | ||
| ANNUAL REPORT PURSUANT TO SECTION 13 OR 15(d) | ||
| OF THE SECURITIES EXCHANGE ACT OF 1934 | ||
| For the fiscal year ended December 31, 2014 | ||
| Commission file number 001-11411 | ||
| Minnesota | 41-1790959 | |
|
| |
| 2100 Highway 55, Medina MN | 55340 | |
| (Address of principal executive offices) | (Zip Code) | |
(763) 542-0500 (Registrant’s telephone number, including area code) Securities registered pursuant to Section 12(b) of the Act: | ||
(763) 542-0500
(Registrant’s telephone number, including area code)
Securities registered pursuant to Section 12(b) of the Act:
Title of Class | Name of Each Exchange on Which Registered | |
| Common Stock, $.01 par value | New York Stock Exchange | |
Securities registered pursuant to Section 12(g) of the Act: None | ||
Securities registered pursuant to Section 12(g) of the Act:
None
DOCUMENTS INCORPORATED BY REFERENCE:
| DOCUMENTS INCORPORATED BY REFERENCE: | ||
Portions of the definitive Proxy Statement for the registrant’s Annual Meeting of Shareholders to be held on April 26, 201230, 2015 to be filed with the Securities and Exchange Commission within 120 days after the end of the fiscal year covered by this report (the “2012“2015 Proxy Statement”), are incorporated by reference into Part III of this Form 10-K.
POLARIS INDUSTRIES INC.
2011 FORM 10-K ANNUAL REPORT
POLARIS INDUSTRIES INC. 2014 FORM 10-K ANNUAL REPORT TABLE OF CONTENTS | ||||||
| Page | ||||||
| Item 1. | ||||||
Item | ||||||
| Item 1B. | ||||||
| Item 2. | ||||||
| Item 3. | ||||||
| Item 4. | ||||||
| PART II | ||||||
| ||||||
| ||||||
| ||||||
| ||||||
| ||||||
Item 5. | ||||||
Item 6. | ||||||
Item 7. | ||||||
Item 7A. | ||||||
Item 8. | ||||||
Item 9. | ||||||
| Item 9A. | ||||||
| Item 9B. | ||||||
| PART III | ||||||
| ||||||
| ||||||
Item 10. | ||||||
Item 11. | ||||||
Item 12. | ||||||
Item 13. | ||||||
Item 14. | ||||||
| PART IV | ||||||
Item 15. | ||||||
2011 2010 2009 Originally conceived as a utility vehicle for northern, rural environments, over time the snowmobile gained popularity as a recreational vehicle. From the mid-1950’s through the late 1960’s, over 100 producers entered the snowmobile market and snowmobile sales reached a peak of approximately 495,000 units in 1971. The Polaris product survived the industry decline in which snowmobile sales fell to a low point of approximately 87,000 units in 1983 and the number of snowmobile manufacturers serving the North American market declined to four: Yamaha, season levels with an estimated 141,000 units sold worldwide. Off-Road Vehicles. We entered the technology, substantially the same equipment and personnel are employed across production in the first quarter of 2015 with completion expected in the first half of 2016. stabilize in 2015. such countries. In 2013, we entered into a partnership with Ariens Company ("Ariens"), a Brillion, Wisconsin based manufacturer of outdoor power equipment. Through the partnership, we anticipate leveraging each other's dealer networks, sharing certain technologies, research and development and supplying Ariens with a highly differentiated work vehicle to sell through its dealer network. In 2014, we began shipping vehicles to Ariens under the terms of the partnership. October 2015. motorcycles expires in January 2018. through our e-commerce sites polaris.com, indianmotorcycle.com, klim.com, kolpin.com, and proarmor.com. rule. 2014. the adoption of, legislation and local ordinances that restrict the use of followed the 2008 announcement. The CARB also has emission regulations for ORVs that we meet. In 2014, CARB finalized additional evaporative emission regulations for ORVs that will take effect beginning in model year 2018. GEM electric vehicles are subject to CARB emissions certification requirements, which they meet. regulations. During Name Title promotional programs, as well as longer warranties in certain geographical markets as determined by local regulations and market conditions. We also provide a limited emission warranty for certain emission-related parts in our ORVs, snowmobiles, and motorcycles as required by the Increases in the cost of raw material, commodity and transportation costs and shortages of certain raw materials could negatively impact our business. our competitors initiate litigation to challenge the validity of our patents, or allege that we infringe their patents, or if we initiate any proceedings to protect our proprietary rights. If the outcome of any such litigation is unfavorable to us, our business, operating results, and financial condition could be adversely affected. Regardless of whether litigation relating to our intellectual property rights is successful, the litigation could significantly increase our costs and divert management’s attention from operation of our business, which could adversely affect our results of operations and financial condition. We also cannot be certain that our products or technologies have not infringed or will not infringe the proprietary rights of others. Any such infringement could cause third parties, including our competitors, to bring claims against us, resulting in significant costs, possible damages and substantial uncertainty. increased costs of customizing products for foreign countries; difficulties in managing and staffing international operations and increases in infrastructure costs including legal, tax, accounting, and information technology; the imposition of additional United States and foreign governmental controls or regulations; the imposition of United States and/or international sanctions against a country, company, person, or entity with whom we do business that would restrict or prohibit our continued business with the sanctioned country, company, person, or entity; international pricing pressures; laws and business practices favoring local companies; adverse currency exchange rate fluctuations; longer payment cycles and difficulties in enforcing agreements and collecting receivables through certain foreign legal systems;(“ORV”)(ORV), including All-Terrain Vehicles (“ATV”)(ATV) and side-by-side vehicles for recreational and utility use, Snowmobiles, and On-Road vehicles, including motorcyclesMotorcycles and Small Electric Vehicles (“SEV”)(SV), together with the related replacement Parts, Garments and Accessories (“PG&A”)(PG&A). These products are sold through dealers and distributors principally located in the United States, Canada and Europe. Sales of ORVs, Snowmobiles, On-Road Vehicles,Motorcycles, SVs and PG&A accounted for the following approximate percentages of our sales for the years ended December 31: ORVs Snowmobiles On-Road PG&A 69 % 11 % 5 % 15 % 69 % 10 % 4 % 17 % 65 % 12 % 3 % 20 % ORVs Snowmobiles Motorcycles Small Vehicles PG&A 2014 65% 7% 8% 3% 17% 2013 67% 8% 6% 3% 16% 2012 69% 9% 6% 2% 14% Off-Road VehiclesORVs include both core ATVs andRANGER® and RZR® side-by-side vehicles. ATVs are four-wheel vehicles with balloon style tires designed for off-road use and traversing rough terrain, swamps and marshland. Side-by-side vehicles are multi-passenger off-road, all-terrain vehicles that can carry up to six passengers in addition to cargo. ORVs are used for recreation, in such sports as fishing and hunting as well asand for trail and dune riding, for utility purposes on farms, ranches, construction sites and the military.for certain military applications.All-Terrain Vehicles(“BRP”("BRP") entered in 1998.1998 with their Can-Am product line. In addition, numerous Chinese and Taiwanese manufacturers of youth and small ATVs exist for which limited industry sales data is available. By 1985, the number of three- and four-wheel ATVs sold in North America had grown to approximately 650,000 units per year, then dropped dramatically to a low of 148,000 in 1989. The ATV industry then grew each year in North America from 1990 until 2005, but has declined in each year sincebetween 2005 and 2011, primarily due to weak overall economic conditions and a move to side-by-side vehicles.vehicles, until returning to modest low single digit percentage growth in 2012 through 2014. Internationally, ATVs are also sold primarily in Western European countries by similar manufacturers as in North America. We estimate that during 20112014 world-wide industry sales declined sevenincreased three percent from 20102013 levels with approximately 396,000an estimated 419,000 ATVs sold worldwide.15seven percent during 20112014 over 20102013 levels with an estimated 275,000413,000 side-by-side vehicles sold worldwide. The side-by-side market is uphas increased consistently over the past several years primarily due to the continued shift by the consumer from ATVs to side-by-side vehicles, new competitors entering the market and continued innovation by existing and new manufacturers. The main competitors for ourRANGER and RZR side-by-side vehicles are Deere & Company (“Deere”), Kawasaki, Yamaha, Arctic Cat, Kubota Tractor Corporation (“Kubota”), Honda and BRP.BRP's Can-Am product line.2011,2014, which includes core ATVs and side-by-side vehicles, increased onefive percent from 20102013 levels with approximately 671,000an estimated 832,000 units sold worldwide.sled”sled,” which became the forerunner of the Polaris snowmobile. Snowmobiles have been manufactured under the Polaris name since 1954.BRP,BRP's Ski-Doo product line, Arctic Cat and Polaris. These four manufacturers also sell snowmobiles in certain overseas markets where the climate is conducive to snowmobile riding. From 1984 to 1997 the industry grew to approximately 260,000 units before gradually declining through the 2012 season, but grew again in 2013. We estimate that during the season ended March 31, 2011,2014,on a worldwide basis were approximately 117,000 units, up threeincreased four percent from the previous season.On-Road Vehicles.Motorcycles. Polaris’ On-Road Vehicles consistMotorcycles division consists of Victory® and, Indian® motorcycles, and Small Electric Vehicles.the all-new three-wheel roadster motorcycle, Slingshot®. Heavyweight motorcycles are utilized as a mode of transportation as well as for recreational purposes. There areThe industry is comprised of four segments: cruisers, touring, sport bikes and standard motorcycles. We entered the heavyweight motorcycle market in 1998 with an initial entryVictory product in the cruiser segment. United StatesWe entered the touring segment in 2000. In 2011, we purchased the Indian Motorcycle brand to complement our Victory brand of motorcycles. In 2013, we re-launched the Indian brand by releasing the first three Indian Motorcycle models engineered by Polaris. In 2014, we introduced the Company's first three-wheeled, roadster motorcycle, Slingshot. The North America heavyweight industry retail cruiser and touring sales more than doubled from 1996 to 2006; however, the motorcycle industry declined in 2007 through 2010 due to weak overall economic conditions. We entered the touring segmentThe motorcycle industry has rebounded with growth beginning in 2000.2011. We estimate that the combined 1,400cc and above cruiser and touring market segments combined increased 4one percent in 20112014 compared to 20102013 levels with approximately 170,000an estimated 186,000 heavyweight cruiser and touring motorcycles sold in the North American market. In 2011, we purchased the Indian Motorcycle brand to complement our Victory brand of motorcycles. Other major heavyweight cruiser and touring motorcycle manufacturers include BMW of North America, LLC (“BMW”), Triumph Harley Davidson,Motorcycles Ltd., Harley-Davidson, Inc., Honda, Yamaha, Kawasaki and Suzuki. We estimate that the worldwide target market for three-wheel motorcycles is approximately $1 billion.SEVSV product, the Polaris Breeze®, in 2009, which iswas an electric powered vehicle primarily used in master planned communities in the Sunbelt region of the United States. In 2011, we ceased production of the Breeze line of products and made two SEVSV acquisitions, Global Electric Motorcars LLC (“GEM”("GEM") and Goupil Industries S.A. (“Goupil”). Both ofWe expanded our SV portfolio in 2013 by acquiring A.M. Holding S.A.S., which operates under the name Aixam Mega S.A.S. ("Aixam"). Aixam is based in France and manufactures and sells enclosed on-road quadricycles and light duty commercial vehicles. Through these acquisitions, add to our growingwe now offer products in the light-duty hauling, people mover and urban/suburban commuting sub-sectors of the small vehicle product line.vehicles industry. We estimate the worldwide target market for small electric vehicles at approximately $4.0 billion in 2011,2014, which includes master planned communities and golf courses, light duty hauling, people movers, and urban/suburban commuting.commuting and related quadricycles. Other major small electric vehicle manufacturers include Textron Inc.’s “E-Z-GO”,“E-Z-GO,” Ingersoll-Rand Plc.’s “Club Car”,Car,” Yamaha and JH Global Services, Inc. (“StarCar”).DrivePlanet's "Ligier."Productsoff-road vehicleORV market in 1985 with an ATV. We currently produce four-wheel ATVs, which provide more stability for the rider than earlier three-wheel versions. In 2000, we introduced our first youth ATV models. In 1998, we introduced the PolarisRANGER,a six-wheeled off-road side-by-side utility vehicle and in 2000, we introduced a four-wheeled version of theRANGERutility vehicle. In 2004, we introduced a military version ATV and side-by-side vehicles with features specifically designed for ultra-light tactical military applications. In 2007, we introduced our first recreational side-by-side vehicle, theRANGERRZR®, and our first six-passenger side-by-side vehicle, theRANGERCrew®. Our standard line of military and government vehicles for 2012model year 2015 consists of 116 models at suggested United States retail prices ranging from approximately $7,000 to $22,000.$163,000. Our full line of ORVs beyond military vehicles consists of 3449 models, including two-, four- and six-wheel drive general purpose, sportcommercial, recreational and side-by-side models, with 20122015 model year suggested United States retail prices ranging from approximately $2,000$2,100 to $20,000.$28,000.shift on-the-flyshift-on-the-fly design. Our ORVs have four-cycle engines and both shaft and concentric chain drive. In 2003,Over the past 11 years, we have introduced the industry’sindustry's first electronic fuel injected ATV, the Sportsman® 700 EFI. In 2005, we introduced the industry’s first independent rear suspension on a sport ATV namedand helped create the Outlawrecreational side-by-side segment through introduction of our RZR vehicles. Our lineup of ORVs has continued to expand over the past years through introduction of electric ORVs and commercial focused ORVs. Our family of ORVs includes utility and recreational Sportsman®. In 2007, we introduced theRANGERRZR, a big bore recreational side-by-side model. In 2008, we celebrated the ATVs, sport-styled Scramblerone millionth unit sale of our Sportsman ATV family, which has been the industry leading big bore ATV for 13 years, by introducing the 100 percent redesigned Sportsman XP®. In 2008, we also introduced an extension of our ATVs, utility and recreational RANGERside-by-side vehicle with the introduction of theRANGERRZR Svehicles, commercial-utility BRUTUS®. side-by-side vehicles and recreational RZR side-by-side vehicles. In 2009,many of these segments, we introduced our first all-electric side-by-side vehicle,offer youth, value, mid-size, trail and high-performance vehicles, which come in both single passenger and multi-passenger seating arrangements. Our key ORV product introductions in 2014 included theRANGEREV. In 2010, we introduced our first four-seat recreational side-by-side, theRANGERRZR 4®,XP 900 trail, RANGER570 with industry-exclusive PRO-FIT™ cab system, and RANGER Dieselmid-sizedRANGERside-by-side with increased power, a four-person mid-sizedRANGERCrew and aRANGERpowered by our first 24 horsepower diesel engine. In addition, shipments to Bobcat Company (“Bobcat”)newly defined category of single-seat, ride-in ATVs, the differentiated utility vehicle produced by us for Bobcat, began in 2010. In 2011, we added to our lineup of recreational vehicles with the addition of the mid-sizedRANGER RZRPolaris ACE®™ 570 and an extreme performance RZR, theRANGER RZR XP®. 900.Snowmobiles. We produce a full line of snowmobiles consisting of 26approximately 32 models, ranging from youth models to utility and economy models to performance and competition models. The 20122015 model year suggested United States retail prices range from approximately $2,600$2,800 to $12,000.$14,000. Polaris snowmobiles are sold principally in the United States, Canada and Europe. We believe our snowmobiles have a long-standing reputation for quality, dependability and performance. We believe that we were the first to develop several features for wide commercial use in snowmobiles, including independent front suspension, long travel rear suspension, hydraulic disc brakes, liquid cooling for brakes and a three cylinder engine. In 2001, we introduced a new, more environmentally-friendly snowmobile featuring a four-stroke engine designed specifically for snowmobiles. In 2009, we introduced the first true progressive-rate rear suspension snowmobile, the Polaris RUSH®. In 2014, we introduced the all-new AXYSOn-Road Vehicles.™ chassis platform for the flatland rider.models,model, the Victory Vision®. In 2009, we expanded our touring product line to include the Victory Cross Roads® and Cross Country® models. In 2011, we acquired Indian Motorcycle Company, America’s first motorcycle company.company, and in 2013 we re-launched the Indian brand by releasing the first three Indian Motorcycle models engineered by Polaris: Indian Chief® Classic, Indian Chief Vintage and Indian Chieftain™. In 2014, we added two new Indian models, including the Roadmaster®, a luxury touring motorcycle, and Scout™, Polaris' first mid-sized motorcycle. We also added a new bagger to the Victory motorcycle line in 2014, the Victory Magnum™. The all-new three-wheel motorcycle, Slingshot was introduced in 2014, and is the Company's first roadster motorcycle. Our 20122015 model year line of motorcycles for both Victory, Indian and IndianSlingshot consists of 20approximately 16 models with suggested U.S. retail prices ranging from approximately $12,500$11,000 to $36,000. $28,500.SEV,SV, the Polaris Breeze. In 2011, we ceased production of the Breeze electric vehicles and acquired GEM and Goupil to add toexpand and complement our small vehicle product line. In 2013, we further expanded our SV division by acquiring Aixam. GEM addresses the people mover segment of low emission vehicles, and Goupil, a French company, addresses the light duty hauling segment.segment and Aixam, also a French company, addresses both the passenger and light duty hauling segments. GEM has 6 SEVten SV models, with retail pricing ranging from $7,600 to $13,500.while Goupil has twoand Aixam each have three base platforms that are modular and can be configured to meet numerous custom needs from park and garden maintenance to delivery and street cleaning.other commercial needs. Additionally, Aixam has four base models of passenger-based quadricycles that are sold primarily in Western Europe. Prices for SVs range from $25,000$8,000 to $35,000$30,000, depending on the model and application.hatshats. In 2012, we acquired Teton Outfitters, LLC (d/b/a Klim), which specializes in premium technical riding gear for our product lines. The apparelthe snowmobile and motorcycle industries. Apparel is designed to our specifications, purchased from independent vendors and sold by us through our dealers and distributors, and online throughunder our e-commerce subsidiary under the Polaris brand name.names. In 2014, we acquired Kolpin Outdoors, Inc. ("Kolpin"), an aftermarket brand delivering purpose-built and universal-fit ORV accessories and lifestyle products. We also acquired certain assets of LSI Products Inc. and Armor Holdings LLC (collectively "Pro Armor"), an aftermarket accessories company that specializes in accessories for performance side-by-side vehicles and all-terrain vehicles. These two 2014 acquisitions added industry leading aftermarket accessory brands to our PG&A activities.that we had decidedour decision to cease manufacturing marine products effective immediately. As technology and the distribution channel evolved, the Marine Products Division’smarine products division’s lack of commonality with our other Polaris product lines created challenges for us and our dealer base. The Marine Products Divisionmarine products division continued to experience escalating costs and increasing competitive pressures and was never profitable.Monterrey, Mexico.various locations across France. Since our product lines incorporate similartheir production.North America. We are vertically integrated in several key components of1991, we acquired a manufacturing facility in Osceola, Wisconsin to manufacture component parts previously produced by third-party suppliers. In 1994, we acquired a manufacturing facility in Spirit Lake, Iowa in order to expand our assembly capacity. Certain operations, including engine assembly and the bending of frame tubes, seat manufacturing, drivetrain and exhaust assembly and stamping, had been conducted at the Osceola, Wisconsin facility. In 1998, Victory motorcycle production began at our Spirit Lake, Iowa facility. The production process in Spirit Lake includes welding, finish painting, and final assembly. In 2002, we completed an expansion and renovation of our Roseau manufacturing facility, which resulted in increased capacity and enhanced production flexibility. In 2010, we announced plans to realign our manufacturing operations. We have created manufacturing centers of excellence for Polarisour products by enhancing the existing Roseau and Spirit Lake production facilities and have established a new manufacturing facility in Monterrey, Mexico, which became operational mid-2011in 2011, that assembles ORVs and certain engines. This realignment led to the sale of part of our Osceola, Wisconsin manufacturing operations, moving frame tube bending into Roseau and Monterrey, and outsourcing some operations including seat manufacturing and stamping. Several of the engines used in our vehicles continue to be manufactured in Osceola. WithOur plant in Opole, Poland facility manufactures ORVs to serve the acquisition ofEuropean market. Goupil we acquired additionalhas its manufacturing operations for their product line in Bourran, France, while Aixam has its manufacturing operations in Aix-les-Bains and Chanas, France. Our Roseau facility primarily manufactures ORVs and snowmobiles and our Monterrey facility primarily manufactures ORVs. Our facilities in Spirit Lake, Iowa and its surrounding areas primarily manufacture ORVs, motorcycles and GEM vehiclesvehicles. In January 2015, we announced plans to build a new production facility in Huntsville, Alabama to provide additional capacity and Indian motorcycles are both manufacturedflexibility. The 600,000 square-foot facility will focus on off-road vehicle production. We will break ground on the facility in our Iowa facilities.1985 and remains a supplier of engines to us. Fuji develops such engines to our specific requirements.In addition, we1985. We had entered into an agreement with Fuji to form Robin Manufacturing, U.S.A. (“Robin”) in 1995. Under the agreement, we made an investment for a 40 percent ownership position in Robin, which built engines in the United States for recreational and industrial products. The Robin facility was closed in 2011 as the production volume of engines made at the facility had declined significantlysignificantly. Since 2011, our reliance on and use of Fuji manufactured engines in recent years. See Note 8our products has steadily declined as our internal engine manufacturing capabilities have expanded. After decreasing from 2011 to 2014, we expect our use of NotesFuji engines in our vehicles to Consolidated Financial Statements for a discussion of the Robin agreement.and for select ORV models since 2001.2001 and for Indian motorcycles since the re-launch in 2013. During 2011,2014, approximately 6580 percent of the total vehicles we produced were powered by engines designed and assembled by us.TaiwanTaiwanese manufacturer to co-design, develop and produce youth ATVs. We have since expanded the agreement with the TaiwanTaiwanese manufacturer in 2004 to include the design, development and production of value-priced smaller adult ATV models and in 2008 to include a youth side-by-side vehicle, theRANGERRZR 170.setupset-up and up-fitting is completed for certain models before shipment to customers.Passy, France; Askim, Norway; Ostersund, Sweden; Birmingham, United Kingdom; Griesheim, Germany;Barcelona, Spain; Ballarat,Derrimut, Australia; Shanghai, China; Rolle, Switzerland; Sao Paulo, Brazil; and New Delhi, India.India; Monterrey, Mexico and in most Western European countries. Our primary wholegoods distribution facilities are in St. Paul, Minnesota; Haviland, Ohio; Altona, Australia; Irving, Texas; and Milford, Iowa. Our primary North American dealer PG&A distribution facility isfacilities are in Vermillion, South Dakota, which distributes PG&A products to our North American dealersDakota; Wilmington, Ohio and weRigby, Idaho. We have various other locations around the world that distribute PG&A to our international dealers and distributors.(“MVP”) with select dealers in North America,(MVP), where ORV orders are placed in approximately two-week intervals for the high volume dealers driven by retail sales trends at the individual dealership. Smaller dealers utilize a similar MVP process, but on a less frequent ordering cycle. Effective in the second half of 2010, the MVP process is nowwas being utilized by all North American ORV dealers. Prior toFor MVP dealers, ORV retail sales activity at the MVP process, most ORVdealer level drives orders were taken from North American dealers twice a year, in the summer and late winter.which are incorporated into each product’s production scheduling. International distributor ORV orders are taken throughout the year. Orders for each year’s production of snowmobiles are placed by the dealersAnnual ordersIn 2012, we began utilizing our Retail Flow Management (RFM) ordering system for Victory motorcycles, are placed by mostand now also use it as the ordering system for Indian motorcycles. In late 2014, we began utilizing RFM for certain ATV dealers. The RFM system allows dealers to order daily, create a segment stocking order, and eventually reduce order fulfillment times to what we expect will be less than 18 days. Prior to RFM, Victory motorcycle dealers would place annual orders in the summer after meetings with dealers. In 2011, Victory began testing a modified version of MVP with a select number of dealers.summer. For non-MVP and RFM dealers and products, units are built to order each year, subject to fluctuations in market conditions and supplier lead times. The anticipated volume of units to be produced is substantially committed to by dealers and distributors prior to production. For MVP dealers, ORV retail sales activity at the dealer level drives orders which are incorporated into each product’s production scheduling.generally manufacture ORVs, motorcycles and SEV’sSV’s year round. We have the ability to mix production of the various products on the existing manufacturing lines as demand dictates.1,5001,750 independent dealers in North America, through 1123 subsidiaries and 65approximately 85 distributors in approximately 130over 100 countries outside of North America.snowbeltsnowbelt regions of the United States and Canada. Many dealers and distributors of our snowmobiles also distribute our ORVs. At the end of 2011,2014, approximately 700800 Polaris dealers were located in areas of the United States where snowmobiles are not regularly sold. UnlikeUnlike our primary competitors, which market their ORV products principally through their affiliated motorcycle dealers, we also sell our ORVs through lawn and garden and farm implement dealers.1999, we acquired certain assets of our distributor in Australia and New Zealand and distribute our products to the dealer network in those countries2011 through a wholly-owned subsidiary. During 2000, we acquired our distributor in France and distribute our products to our dealer network in France through a wholly-owned subsidiary. In 2002, we acquired certain assets of our distributors in the United Kingdom, Sweden and Norway and distribute our products to our dealer networks in the United Kingdom, Sweden and Norway through wholly-owned subsidiaries. During 2007, we established a wholly-owned subsidiary in Germany and distribute our products directly to our dealer network in Germany. In 2008, we established a wholly-owned subsidiary in Spain and distribute our products directly to our dealer network in Spain. In 2010, we established wholly-owned subsidiaries in China and Brazil and distribute our products directly to the dealer network in those countries. In 2011, we established a wholly-owned subsidiary in India to sell direct to dealers. Additionally in 2011,2014, we acquired GEM, Goupil and GoupilAixam in the Small Electric Vehicles segment,SV division and Klim, Kolpin and Pro Armor in PG&A, which each have their own dealer/distributor relationships established. See Notes 1 and 12 of Notes to Consolidated Financial Statements for further discussion of international operations.authorized dealers and distributors, except in Melbourne and Sydney, Australia where we have three Company-owned retail stores. We have a high quality dealer network for our other product lines from which many of the approximately 400450 current North American Victory dealers were selected. Indian motorcycles currently has approximately 20 dealers.175 North American dealers signed up, of which approximately 118 are retailing Indian motorcycles as of the end of 2014. We expect the number of Indian retailing dealerships to continue to increase over the coming years. In 2005, we began selling Victory motorcycles in the United Kingdom. Since 2005, we have been gradually expanding our international sales of Victory motorcycles, primarily in Europe.Europe and Australia. We expect to further expand our motorcycle dealer network over the next few years in North America and internationally. internationally for Victory, Indian and Slingshot motorcycles.GEM and GoupilSV businesses each have their own distribution networks through which their respective vehicles are distributed. GEM has approximately 130 dealers250 dealers. Goupil and Goupil sells directAixam sell directly to customers in France, through subsidiaries in certain Western European countries and through several dealers and distributors for markets outside France. Polaris ceased production of the Breeze electric vehicles in 2011.Polaris’our products under contractual arrangements pursuant to which the dealer or distributor is authorized to market specified products and is required to carry certain replacement parts and perform certain warranty and other services. Changes in dealers and distributors take place from time to time. We believe a sufficient number of qualified dealers and distributors exist in all geographic areas to permit an orderly transition whenever necessary. In addition, we sell military and other Polaris vehicles directly to military and government agencies and other national accounts and we supply a highly differentiated side-by-side vehicle branded Bobcat to their dealerships in North America.(“TDF”)(TDF) to form Polaris Acceptance. Polaris Acceptance provides floor plan financing to our dealers in the United States. Under the partnership agreement, we have a 50 percent equity interest in Polaris Acceptance. We do not guarantee the outstanding indebtedness of Polaris Acceptance. In 2004, TDF was merged with a subsidiary of General Electric Company (“GE”)(GE) and, as a result of that merger, TDF’s name was changed to GE Commercial Distribution Finance Corporation (“GECDF”)(GECDF). No significant change in the Polaris Acceptance relationship resulted from34 and 78 of Notes to Consolidated Financial Statements for a discussion of this financial services arrangement.United StatesNorth American sales of snowmobiles, ORVs, motorcycles, SEVsSVs and related PG&A are financed under arrangements whereby we are paid within a few days of shipment of our product. We participate in the cost of dealer financing and have agreed to repurchase products from the finance companies under certain circumstances and subject to certain limitations. We have not historically been required to repurchase a significant number of units. However,units; however, there can be no assurance that this will continue to be the case. If necessary, we will adjust our sales return allowance at the time of sale should we anticipate material repurchases of units financed through the finance companies. See Note 78 of Notes to Consolidated Financial Statements for a discussion of these financial services arrangements.managesmanaged our private label credit card program under the StarCard label for the purchase of Polaris products. During 2010, Polaris and HSBC extended the term of the agreement on similar terms to October 2013. During 2011 it was announced thatSince then, HSBC’s U.S. Credit Card and Retail Services business would behas been acquired by Capital One. Our current agreement with Capital One subject to regulatory approval. The transaction is expected to closeexpires in the second quarter of 2012. At this time we do not expect any change in the contractual terms governing our StarCard program as a result of the sale, other than an assignment to Capital One. See Note 7 of Notes to Consolidated Financial Statements for a discussion of this financial services arrangement.In October 2010, we extended ourThe current installment credit agreement with Sheffield to February 2016 under which Sheffield will provideprovides exclusive installment credit lending for ORV and Snowmobiles. In November 2010, we extended our installment credit contract with GE Bank to March 2016 under which GE Bank will provide exclusiveORVs, as well as installment credit lending for snowmobiles, motorcycles and certain other Polaris products expires in February 2016.motorcycles. See Note 7 of Notes to Consolidated Financial Statementsand Indian Motorcycles. The current leasing agreement under which Chrome provides exclusive leasing for a discussion of these financial services arrangements.the Polaris brandour brands among the riding and non-riding public and provide a wide range of products for enthusiasts by licensing the name Polaris. We currently license the production and sale of a range of items, including die cast toys, ride onride-on toys and numerous other products.During 2000, a wholly-owned subsidiary of Polaris established an e-commerce site, purepolaris.com, toover the Internet directly to consumers.approximately $178.7$314.4 million, $142.4$270.3 million and $111.1$210.4 million for sales and marketing activities in 2011, 20102014, 2013 and 2009,2012, respectively.450700 employees who are engaged in the development and testing of existing products and research and development of new products and improved production techniques, located primarily in our Roseau and Wyoming, Minnesota facilities and in Burgdorf, Switzerland. Our SV acquisitions of GEM, Goupil and Aixam included research and development resources for their respective product lines. We believe Polaris was the first to develop, for wide commercial use, independent front suspensions for snowmobiles, long travel rear suspensions for snowmobiles, liquid cooled snowmobile brakes, hydraulic brakes for snowmobiles, the three cylinder engine in snowmobiles, the adaptation of the MacPherson strut front suspension, “on demand” all-wheel drive systems and the Concentric Drive System for use in ORVs, the application of a forced air cooled variable power transmission system toin ORVs and the use of electronic fuel injection for ORVs.by our testing teams and for the planning of manufacturing procedures. In addition, we maintain numerous test facilities where each of the products is extensively tested under actual use conditions. In 2005, we completed construction ofWe utilize our 127,000 square-foot research and development facility in Wyoming, Minnesota facility for engineering, design and development personnel for our line of engines and powertrains, ORVs, Victory, Indian and IndianSlingshot motorcycles, andSEV’s. The total cost of the facility was approximately $35.0 million. SVs. In 2010, we acquired Swissauto Powersports Ltd., an engineering company that develops high performance and high efficiency engines and innovative vehicles. In 2011, we acquired GEM and Goupil which included research and development for their respective product lines.approximately $105.6$148.5 million, $84.9$139.2 million, and $63.0$127.4 million for research and development activities in 2011, 20102014, 2013 and 2009,2012, respectively.We hold patents in the United States and foreign countries and apply for patents as applicable. Additionally, we have numerous registered trademarks, trade names and logos in the United States, Canada and international locations.Investment in KTM Power Sports AGIn 2005, we purchased a 25 percent interest in Austrian motorcycle manufacturer KTM and began several important strategic projects with KTM intended to strengthen the competitive position of both companies and provide tangible benefits to our respective customers, dealers, suppliers and shareholders. Additionally, Polaris and KTM’s largest shareholder, Cross Industries AG (“Cross”), entered into an option agreement, which provided that under certain conditions in 2007, either Cross could purchase our interest in KTM or, alternatively, we could purchase Cross’ interest in KTM. In December 2006, Polaris and Cross cancelled the option agreement and entered into a share purchase agreement for the sale by us of approximately 1.38 million shares of KTM, or approximately 80 percent of our investment in KTM, to a subsidiary of Cross. The agreement provided for completion of the sale of the KTM shares in two stages. In the first half of 2007, we completed both stages of our sale of KTM shares generating proceeds of $77.1 million. After the completion of the sale of the KTM shares, we held ownership of approximately 0.34 million shares, representing slightly less than five percent of KTM’s outstanding shares. During the first quarter 2009, we determined that the decline in the market value of the KTM shares owned by us was other than temporary; therefore, we recorded the decrease in the fair value of the investment as a charge to the income statement in the first quarter of 2009 totaling $9.0 million. During the second quarter 2010, we determined that the further decline in the market value of the KTM shares owned by us was other than temporary and, therefore, we recorded a $0.8 million decrease in the fair value of the investment. In the third quarter 2010, we sold our remaining investment in KTM and recorded a gain on securities available for sale of $1.6 million. electric vehicle markets in the United States, Canada and other global markets are highly competitive. Competition in such markets is based upon a number of factors, including price, quality, reliability, styling, product features and warranties. At the dealer level, competition is based on a number of factors, including sales and marketing support programs (such as financing and cooperative advertising). Certain of our competitors are more diversified and have financial and marketing resources that are substantially greater than those of Polaris.(“CPSC”)(CPSC) has federal oversight over product safety issues related to ATVs, snowmobiles and off-road side-by-side vehicles. The National Highway Transportation Safety Administration (“NHTSA”)(NHTSA) has federal oversight over product safety issues related to on-road motorcycles and small electric vehicles.In 1988, Polaris, five competitors and the CPSC entered into a ten-year consent decree settling litigation involving CPSC’s attempt to force an industry-wide recall of all three-wheel ATVs and four-wheel ATVs sold that could be used by youth under 16 years of age. The settlement required, among other things, that ATV purchasers receive “hands on” training. In 1998, this consent decree expired and we entered into a voluntary action plan under which we agreed to continue various activities previously required under the consent decree, including age recommendations, warning labels, point of purchase materials, hands on training and an information and education effort. We also agreed to continue dealer monitoring to ascertain dealer compliance with safety obligations, including age recommendations and training requirements.We do not believe that our voluntary action plan has had or will have a material adverse effect on us or negatively affect our business to any greater degree than those of our competitors who have undertaken similar action plans with the CPSC. Nevertheless, there can be no assurance that future recommendations or regulatory actions by the federal government or individual states would not have an adverse effect on us. We will continue to attempt to assure that our dealers are in compliance with their safety obligations. We have notified our dealers that we may terminate or not renew any dealer we determine has violated such safety obligations. We believe that our ATVs have complied with safety standards relevant to ATVs.In August 2006, the CPSC issued a Notice of Proposed Rulemaking to establish mandatory standards for ATVs and to ban three-wheeled ATVs. The CPSC did not complete this rulemaking process or issue a final rule.passed. The Act includes a provision that requires allpassed which, among other things, required ATV manufacturers and distributors who import into or distribute ATVs in the United States to comply with thepreviously voluntary American National Standards Institute (“ANSI”) ATV(ANSI) safety standards which were previously voluntary. The Act also requiresdeveloped by the same manufacturers and distributors to have ATV action plans filed with the CPSC that are substantially similar to the voluntary action plans that were previously in effect through the voluntary agreement with the CPSC.Specialty Vehicle Institute of America (SVIA). We believe that our products comply with the ANSI/SVIA standardstandards, and we have had an action plan filedon file with the CPSC since 1998 when the consent decree expired. We do not believe the law will negatively affect our business to any greater degree than thoseregarding safetythatwhich requires the CPSC to complete thean ATV rulemaking process it started in August 2006 and issue a final rule regarding ATV safety. The Act requires the CPSC to evaluate certain matters in the final rule, including the safety of the categories of youth ATVs as well as the need for safety standards or increased safety standards for suspension, brakes, speed governors, warning labels, marketing and dynamic stability.The Act also includes provisions that limit the amount of lead paint and previously limited the lead content that can existATVs, which has not yet resulted in the accessible componentsissuance of ATVs and snowmobiles that we sell in the United States for youth 12 years of age and younger. Under the Act, products that have lead content in excess of these limits may not be sold in the United States starting February 10, 2009.In response to a petition from the recreational products industry, the CPSC issued a Stay of Enforcement (“Stay”) providing that the CPSC would not seek to enforce the Act against manufacturers who sell recreationalproducts for youth provided that the metal alloys in these products met certain lead limits and information regarding the lead content of the relevant products was submitted to the CPSC. The Stay was extended by the CPSC through December 31, 2011. We complied with the terms of the Stay and continued to sell youth ATVs and snowmobiles under the terms of the Stay through August 2011.On August 12, 2011, the President signed into law an amendment to the Act (“Amendment”), which exempts off-highway vehicles from the lead content provision and requires the CPSC to issue a final rule regarding ATV safety within one year. Our youth ATVs and snowmobiles therefore are no longer subject to the lead content requirements. The lead paint requirements in the Act remain in effect. We believe all our products comply with the lead paint requirements.(“ROHVA”)(ROHVA), which was established to promote the safe and responsible use of side-by-side vehicles also known as Recreational Off-Highway Vehicles (“ROVs”).(ROVs), a category that includes our RANGER and RZR side-by-side vehicles. Since early 2008, ROHVA has been engaged in a comprehensive process for developing a voluntary standard for equipment, configuration and performance requirements of ROVs through ANSI. Comments on the draft standard were actively solicited from the CPSC and other stakeholders as part of the ANSI process. The standard, which addresses stability, occupant retention, and other safety performance criteria, was approved and published by ANSI in March 2010. The standard was then immediately opened for maintenance2010, revised in 2011, and revisionrevised again in accordance with the ANSI process to evaluate additional safety provisions.Consumer Product Safety CommissionCPSC published an advance notice of proposed rulemaking regarding ROVs. OurRANGERand RZR side-by-side vehicles are included in the ROV category. In its notice, the CPSC stated that it was reviewing the risk of injury associated with ROVs and beginning a rule-making proceduresafety under the Consumer Product Safety Act. TheIn December 2014, the CPSC also noted the draft ANSI standard developed by ROHVA and expressed concerns with the draft standardpublished a Notice of Proposed Rulemaking that includes proposed mandatory safety standards for ROVs in the areas of vehiclelateral stability, vehiclesteering and handling, and occupant retentionretention. Polaris, by itself and protection. We are a member of ROHVA, which submitted written comments and a technical response to the CPSC notice. We, through ROHVA, also met with CPSC Commissionershas expressed concerns about the proposed mandatory standards, whether they would actually reduce ROV incident rates, whether the proposed tests are repeatable and staff on several occasions during 2010appropriate for ROVs, and 2011 to provide updates on ROHVA’s efforts to address CPSC concerns through changes to the voluntary ANSI standard relating to stability, occupant retention and warnings. Comments on these changes were solicitedunintended safety consequences that could result from the CPSC and other stakeholders as part of the ANSI process. The revised standard, which includes dynamic stability, occupant retention, and warning requirements, was approved and published by ANSI in July, 2011.them. We are unable to predict the outcome of the CPSC rule-making procedure andprocess or the ultimate impact of the procedure or any resulting rules on our business and operating results.(“ISMA”)(ISMA), a trade association formed to promote safety in the manufacture and use of snowmobiles, among other things. ISMA members include all of the major snowmobile manufacturers. The ISMA members are also members of the Snowmobile Safety and Certification Committee, which promulgated voluntary sound and safety standards for snowmobiles that have been adopted as regulations in some states of the United States and in Canada. These standards require testing and evaluation by an independent testing laboratory. We believe that our snowmobiles have always complied with safety standards relevant to snowmobiles.Motorcyclessmall electric vehiclesSVs are subject to federal vehicle safety standards administered by the NHTSA and are also subject to various state vehicle safetyequipment standards. Our Slingshot vehicle is classified as a motorcycle under federal law, but may be classified differently in other jurisdictions. We believe that our motorcycles (including Slingshot) and SEVs have compliedSVs comply with applicable federal and state safety standards.SEVs, ATVs, Off-Road side-by-side vehiclesSVs, ORVs and Snowmobilessnowmobiles have complied with applicable safety standards in the United States and other international locations. State Local, state and federal laws and regulations have been promulgated, and at various times, ordinances or are under considerationlegislation is introduced, relating to the use or manner of use of our products. Some states and localitiesmunicipalities have adopted, or are consideringATVs,ORVs and snowmobiles and off-road side-by-side vehicles to specified hours and locations. The federal government also has restrictedlegislative and executive authority to restrict the use of ATVs,ORVs and snowmobiles and side-by-side vehicles in some national parks and federal lands. In several instances, this restriction has been a ban on the recreational use of these vehicles.We are unable to predict the outcome of such actions or the possible effect on our business. We believe that our business would be no more adversely affected than those of our competitors by the adoption of any pending laws or regulations. We continue to monitor these activities in conjunction with industry associations and support balanced and appropriate programs that educate the product user on safe use of our products and how to protect the environment.(“EPA”)(EPA) and the California Air Resources Board (“CARB”)(CARB) have adopted emissions regulations applicable to our products.CARB has emission regulations for ATVs and off-road side-by-side vehicles that we already meet. In 2002, the EPA established new corporate averageEPA's emission standards effective for model years 2006 and later, for off-road recreational engines and vehicles including ATVs, off-road side-by-side vehiclesapply to our ORV's and snowmobiles. We have developed engine and emission technologies along with our existing technology base to meet current and futurethese requirements, including the chassis-based ORV emission requirements that becomebecame effective in model year 2014. Snowmobiles comply using the fleet average provisions of the regulations. In 2008, the EPA announced its intention to issue a future rulemaking on snowmobiles in or around 2010 andwith any new emission standards under this rule would be effectivetaking effect after model year 2012. No further EPA rulemaking activity has followed.IndianSlingshot motorcycles are also subject to EPA and CARB emission standards.standards for on-highway motorcycles. We believe that our motorcycles have compliedthese vehicles comply with thesethe applicable standards. The CARB regulations required additional motorcycle emission reductions in model year 2008, which the Company meets. The EPA adopted the CARB emission limits in a 2004 rulemaking that allowed an additional two model years to meet these new CARB emission requirements on a nationwide basis. We have developed engine and emission technologies and met these requirements nationwide in model year 2010. related to emissions in places where we sell our products outside the United States. Europe currently regulates emissions from certain of our ATV-based products and motorcycles and these products meet such requirements. Canada’s emission regulations for motorcycles, ORVs and snowmobiles are similar to those in the United States.States, and Polaris complies with the applicable Canada requirements. Europe currently regulates emissions from our motorcycles and certain of our ATV-based products for which we obtain whole vehicle type approvals, and these products meet the applicable requirements. In December 2006, Canada proposed a new regulation that would essentially adopt2014, the United States emission standards for ATVs, off-road side-by-side vehiclesEuropean Parliament and snowmobiles. These regulations have not yet beenCouncil finalized but they are not expected to have a material effect on our business. The European Commission proposedthe details of new regulations that will make these European emission requirements more stringent beginning in 2010 that could apply to certain of2016. Emissions from other Polaris off-road products in the Company’s motorcyclesEU will be covered in the future by the non-road mobile machinery directive, which is currently being revised. Polaris is reviewing the technology requirements and ATV-based products as early as 2013. Thesedeveloping compliance solutions for these future EU regulations have not been finalized.motorcycles, ATVs, off-road side-by-side vehicles and snowmobiles have compliedproducts comply with applicable emission standards and related regulations in the United States and internationally. We are unable to predict the ultimate impact of the adopted or proposed new regulations on Polaris and our business. We are currently developing and obtaining engine and emission technologies to meet the requirements of the future emission standards.2011,2014, on a worldwide basis, we employed an average of approximately 3,9007,000 full-time persons, a 30 percent increase from 2010.2013. Approximately 1,6002,900 of our employees are salaried. We consider our relations with our employees to be excellent.www.polarisindustries.com.www.polaris.com. We make available free of charge, on or through our website, our annual, quarterly and current reports, and any amendments to those reports, as soon as reasonably practicable after electronically filing such reports with the Securities and Exchange Commission. We also make available through our website our corporate governance materials, including our Corporate Governance Guidelines, the charters of the Audit Committee, Compensation Committee, Corporate Governance and Nominating Committee and Technology Committee of our Board of Directors and itsour Code of Business Conduct and Ethics. Any shareholder or other interested party wishing to receive a copy of these corporate governance materials should write to Polaris Industries Inc., 2100 Highway 55, Medina, Minnesota 55340, Attention: Investor Relations. Information contained on our website is not part of this report.20112014 Annual Report contains not only historical information, but also “forward-looking statements” intended to qualify for the safe harbor provisions of the Private Securities Litigation Reform Act of 1995. These “forward-looking statements” can generally be identified as such because the context of the statement will include words such as we or our management “believes,” “anticipates,” “expects,” “estimates” or words of similar import. Similarly, statements that describe our future plans, objectives or goals are also forward-looking. Forward-looking statements may also be made from time to time in oral presentations, including telephone conferences and/or webcasts open to the public. Shareholders, potential investors and others are cautioned that all forward-looking statements involve risks and uncertainties that could cause results in future periods to differ materially from those anticipated by some of the statements made in this report, including the risks and uncertainties described below under the heading entitled “Item 1A—Risk Factors” and elsewhere in this report. The risks and uncertainties discussed in this report are not exclusive and other factors that we may consider immaterial or do not anticipate may emerge as significant risks and uncertainties.10, 2012,20, 2015, their ages, titles, the year first appointed as an executive officer, and employment for the past five years: Age Scott W. Wine 4447 Chairman of the Board of Directors and Chief Executive Officer Bennett J. Morgan 4851 President and Chief Operating Officer Kenneth J. Pucel 48 Executive Vice President—Global Operations, Engineering and Lean Michael W. Malone 5356 Vice President—Finance and Chief Financial Officer Todd-Michael Balan 4245 Vice President—Corporate Development Stacy L. Bogart 4851 Vice President—General Counsel, Compliance Officer and Secretary Michael D. Dougherty 4447 Vice President—Asia Pacific and Latin America Stephen L. Eastman 4750 Vice President—Parts, Garments and Accessories William C. Fisher57Vice President and Chief Information OfficerMatthew J. Homan 4043 President—Global Adjacent Markets Michael P. Jonikas 54 Vice President—Snowmobiles and Slingshot Suresh Krishna 46 Vice President—Europe, Middle East and Africa Michael P. Jonikas51Vice President—Snowmobiles, Sales and Corporate MarketingSuresh Krishna43Vice President—Global Operations and IntegrationDavid C. Longren 5356 Vice President—Off-Road Vehicles and Off-Road Vehicles Engineering Scott A. Swenson48Vice President—Small VehiclesJames P. Williams 4952 Vice President—Human Resources 2008.2008, and was named Chairman of the Board of Directors in January 2013. Prior to joining Polaris, Mr. Wine was President of Fire Safety Americas, a division of United Technologies, a provider of high technology products and services to the building systems and aerospace industries, from 2007 to August 2008. Prior to that, Mr. Wine held senior leadership positions at Danaher Corp. in the United States and Europe from 2003 to 2007, including President of its Jacob Vehicle Systems and Veeder-Roots subsidiaries, and Vice President and General Manager, Manufacturing Programs in Europe. From 1996 to 2003, Mr. Wine held a number of operations and executive posts, both international and domestic with Allied Signal Corporations’Corporation's Aerospace Division.Divisiondivision of Polaris. Prior to managing the ATV Division,division, Mr. Morgan was General Manager of the PG&A Division for Polaris from 1997 to 2001. He joined Polaris in 1987 and spent his early career in various product development, marketing and operations management positions of increasing responsibility.Businessbusiness from 2007 to June 2009. Prior to that, Mr. Balan held various marketing, general management, business development, and strategy roles within Danaher Corp. from 2001 to 2007. Mr. Balan’s work history also includes various strategy, marketing, and sales management roles with Emerson Electric and Colfax Corporation.shifted roles in August 2011 tohas been Vice President—Asia Pacific and Latin America from his most recent role as Vice President—Global New Market Development which he held since December 2008.August 2011. Mr. Dougherty joined the company in 1998 as International Sales Manager, and has held several positions, including Vice President of Global New Market Development and Vice President and General Manager of the ATV Divisiondivision during his tenure. Prior to Polaris, Mr. Dougherty was employed at Trident Medical International, a trading company.joined Polaris in February 2012 ashas been Vice President—Parts, Garments and Accessories.Accessories since February 2012. Prior to joining Polaris, Mr. Eastman was President of Target.com for Target Corporation, a general merchandise retailer, from July 2008 to October 2011. Prior to that, Mr. Eastman held several leadership positions at Target Corporation since 1982 in various areas, including General Merchandising, Consumer Electronics, Inventory Management and Merchandise Planning Operations.Mr. Fisher has been Vice President and Chief Information Officer since November 2007, and has been Chief Information Officer since July 1999. He has also served as General Manager of Service overseeing all technical, dealer, and consumer service operations since 2005. Prior to joining Polaris, Mr. Fisher was employed by MTS Systems for 15 years in various positions in information services, software engineering, control product development, and general management. Before that time, Mr. Fisher worked as a civil engineer for Anderson-Nichols and he later joined Autocon Industries, where he developed process control software.appointedpromoted to President—Global Adjacent Markets in July 2014. Mr. Homan has held several key leadership positions at Polaris. Prior to his current role, most recently he was Vice President—Europe, Middle East and Africa inEMEA since August 2011. Prior to this, Mr. Homan was2011, Vice President of the President—Off-Road Vehicles Division since August 2008, and was General Manager of the Side-by-Side DivisionSide-by-Sides since December 2005. Mr. Homan joined Polaris in 2002 as Director of Marketing for the ATV Division.division. Prior to working at Polaris, Mr. Homan spent nearly seven years at General Mills, Inc. working in various marketing and brand management positions.shifted roles in August 2011 tois Vice President—Snowmobiles Sales and Corporate Marketing.Slingshot. Mr. Jonikas has been Vice President of Snowmobiles since August 2011. Mr. Jonikas was Vice President of Sales and Marketing sincebeginning in November 2007 until January 2014 when he assumed the role of Vice President of Snowmobiles and Slingshot. Mr. Jonikas was also previously Vice President—On-Road Vehicles from May 2009 to August 2011. Mr. Jonikas joined Polaris in 2000, and during the past eleven years has held several key roles including Director of Product and Marketing Management for the ATV Divisiondivision and General Manager of the Polaris Side-by-Side Division.Side-by-Sides. Prior to joining Polaris, Mr. Jonikas spent 12 years at General Mills, Inc. in numerous general management positions.joined Polaris Industries Inc. asbecame Vice President—Europe, Middle East and Africa in July 2014. Prior to this, Mr. Krishna was Vice President—Global Operations and Integration since September 2010, and Vice President—Supply Chain and Integration onsince March 29, 2010 and was promoted to Vice President—Global Operations and Integration in September 2010. Prior to joining Polaris,Before Mr. Krishna joined Polaris, he was Vice President Global Operations, Supply Chain and IT for a division of United Technologies Corporation’Corporation's Fire & Security business where he was responsible for significant operations in China, Mexico, the United States and Europe from August 2007 to March 2010. Prior to United Technologies Corporation, Mr. Krishna worked for Diageo, a global producer of famous drink brands as Vice President Supply Chain for theirits North American business from February 2002 to July 2007.Mr. Swenson shifted roles in February 2012 to Vice President—Small Vehicles. Prior to this, Mr. Swenson’s leadership also included PG&A since 2001, and Snowmobiles from 2006 to August 2011. Mr. Swenson joined Polaris in 1998 as Assistant Treasurer. Prior to joining Polaris, Mr. Swenson was employed in various finance positions at General Electric and Shell Oil Company.1996. In 1996 and from 2002 to 2012. From 1996 to 2002, and beginning again in 2012, we purchased excess insurance coverage for catastrophic product liability claims for incidents occurring subsequent to the policy date that exceeded our self-insured retention levels. Since September 2002, due to insurance market conditions resulting in significantly higher proposed premium costs, we have elected not to purchase insurance for product liability losses. The estimated costs resulting from any losses are charged to expense when it is probable a loss has been incurred and the amount of the loss is reasonably determinable.$16.9$17.3 million at December 31, 20112014 for the probable payment of pending claims related to product liability litigation associated with our products. We believe such accrual is adequate. We do not believe the outcome of any pending product liability litigation will have a material adverse effect on our operations. However, no assurance can be given that our historical claims record, which did not include ATVs prior to 1985, or motorcycles and side-by-side vehicles prior to 1998, and SVs prior to 2011, will not change or that material product liability claims against us will not be made in the future. Adverse determination of material product liability claims made against us would have a material adverse effect on our financial condition.theour results of operations.and for a period of one year for our snowmobiles, and motorcycles andfor a period of one or two years for SEVs.our motorcycles depending on brand and model year, and for a two year period for SVs. We may provide longer warranties related to certainUnited States Environmental Protection AgencyEPA and the California Air Resources Board.CARB. Although we employ quality control procedures, sometimes a product is distributed that needs repair or replacement. Our standard warranties require us or our dealers to repair or replace defective products during such warranty periods at no cost to the consumer. Historically, product recalls have been administered through our dealers and distributors. The repair and replacement costs we could incur in connection with a recall could adversely affect our electric vehicle markets are highly competitive. Competition in such markets is based upon a number of factors, including price, quality, reliability, styling, product features and warranties. At the dealer level, competition is based on a number of factors, including sales and marketing support programs (such as financing and cooperative advertising). Certain of our competitors are more diversified and have financial and marketing resources whichthat are substantially greater than ours, which allow these competitors to invest more heavily in intellectual property, product development and advertising. If we are not able to compete with new products or models of our competitors, our future business performance may be materially and adversely affected. Internationally, our products typically face more competition where certain foreign competitors manufacture and market products in their respective countries because thatcountries. This allows those competitors to sell products at lower prices, which could adversely affect our competitiveness. In addition, our products compete with many other recreational products for the discretionary spending of consumers and, to a lesser extent, with other vehicles designed for utility applications. A failure to effectively compete with these other competitors could have a material adverse effect on our performance.Pursuant to ouragreementssupply arrangements with Fuji in Japan, Fuji was the sole manufacturermany of our two-cycle snowmobile engines from 1968 to 1995. Fuji has manufactured engines for our ATV products since their introduction insuppliers. In the springevent of 1985 and remains a supplier of engines to us. Such engines are developed by Fuji to our specific requirements. Although we have alternative sources for our engines and do not currently have knowledge that Fuji intends to terminate supplying engines to us, a termination of the supply relationship with Fuji could adversely affect our production until substitute supply arrangements for the quantity of engines required by us could be established. Therearrangement, there can be no assurance that alternate supply arrangements will be made on satisfactory terms. If we need to enter into supply arrangements on unsatisfactory terms, or if there are any delays to our supply arrangements, it could adversely affect our business and operating results.operations because fluctuationsoperations. Fluctuations in the value of the United States dollar relative to these foreign currencies can adversely affect the price of our products in foreign markets, and the costs we incur to import certain components for our products.products, and the translation of our foreign balance sheets. While we actively manage our exposure to fluctuating foreign currency exchange rates by entering into foreign exchange hedging contracts from time to time, these contracts hedge foreign currency denominated transactions and any change in the fair value of the contracts would be offset by changes in the underlying value of the transactions being hedged.2011,2014, our maximum aggregate repurchase obligation was approximately $91.7$120.8 million. If adverse dealers, suppliers, financing sources and other strategic partners who may be sensitive to economic conditions that could affect their businesses in a manner that adversely affects their relationship with us. distribute our products through numerous dealers and distributors, source component parts and raw materials through numerous suppliers and have relationships with a limited number of sources of product financing for our dealers and consumers. Our sales growth and profitability could be adversely affected if deterioration of economic or business conditions results in a weakening of the financial condition of a material number of our dealers and distributors, suppliers or financing sources, or if uncertainty about the economy or the demand for our products causes these business partners to voluntarily or involuntarily reduce or terminate their relationship with us.Retail credit market deterioration and volatility may restrict the ability of our retail customers to finance the purchase of our products and adversely affect our income from financial services.We have arrangements with each of HSBC, Sheffield and GE Bank to make retail financing available to consumers who purchase our products in the United States. During 2011, consumers financed approximately 34 percent of the vehicles we sold in the United States through the HSBC revolving retail credit, and Sheffield and GE Bank installment retail credit programs. Furthermore, some customers use financing from lenders who do not partner with us. There can be no assurance that retail financing will continue to be available in the same amounts and under the same terms that had previously been available to our customers. If retail financing is not available to customers on satisfactory terms, it is possible that our sales and profitability could be adversely affected.We intend to grow our business through potential acquisitions, alliances and new joint ventures and partnerships, which could be risky and could harm our business.One of our growth strategies is to drive growth in our businesses and accelerate opportunities to expand our global presence through targeted acquisitions, alliances, and new joint ventures and partnerships that add value while considering our existing brands and product portfolio. The benefits of an acquisition or new joint venture or partnership may take more time than expected to develop or integrate into our operations, and we cannot guarantee that acquisitions, alliances, joint ventures, or partnerships will in fact produce any benefits. In addition, acquisitions, alliances, joint ventures, and partnerships involve a number of risks, including:diversion of management’s attention;difficulties in integrating and assimilating the operations and products of an acquired business or in realizing projected efficiencies, cost savings, and synergies;potential loss of key employees or customers of the acquired businesses or adverse effects on existing business relationships with suppliers and customers;adverse impact on overall profitability if acquired businesses do not achieve the financial results projected in our valuation models;reallocation of amounts of capital from other operating initiatives and/or an increase in our leverage and debt service requirements to pay the acquisition purchase prices, which could in turn restrict our ability to access additional capital when needed or to pursue other important elements of our business strategy;inaccurate assessment of undisclosed, contingent or other liabilities or problems, unanticipated costs associated with an acquisition, and an inability to recover or manage such liabilities and costs;incorrect estimates made in the accounting for acquisitions, incurrence of non-recurring charges, and write-off of significant amounts of goodwill or other assets that could adversely affect our operating results;dilution to existing shareholders if our securities are issued as part of transaction consideration or to fund transaction consideration; andinability to direct the management and policies of a joint venture, alliance, or partnership, where other participants may be able to take action contrary to our instructions or requests and against our policies and objectives.Our ability to grow through acquisitions will depend, in part, on the availability of suitable acquisition targets at acceptable prices, terms, and conditions, our ability to compete effectively for these acquisition candidates, and the availability of capital and personnel to complete such acquisitions and run the acquired business effectively. These risks could be heightened if we complete a large acquisition or multiple acquisitions within a relatively short period of time. Any potential acquisition could impair our operating results, and any large acquisition could impair our financial condition, among other things.Our transition to a new dealer ordering process could affect our sales and profitability during the transition period.Over the past several years we have been transitioning our North American ORV dealers to the Maximum Velocity Program (MVP), an enhanced dealer ordering process. Currently 100 percent of our ORV dealers in North America are using the enhanced ordering process. The ordering process negatively impacts sales during the transition period because dealers place smaller, more frequent orders which allow them to operate with lower inventory levels. As a result, our results of operations during the transition period may fluctuate more compared to similar periods in prior years. We began testing a modified version of MVP in select Victory motorcycle dealerships in 2011.We may encounter difficulties in our manufacturing realignment initiatives, which could adversely affect our operating results or financial condition.In May 2010, we announced our plans to realign our manufacturing operations footprint by enhancing our Roseau, Minnesota and Spirit Lake, Iowa production facilities and establishing a new facility in Mexico. The realignment led to the sale of a portion of the Osceola manufacturing facility in Wisconsin in 2011. There are significant risks inherent in our realignment initiatives. The realignment may not be accomplished as quickly as anticipated and the expected cost reductions may not fully materialize. We have and expect to continue to record transition charges in connection with the realignment efforts, including both exit costs and startup costs. Even though we anticipate that the realignment will ultimately result in reduced transportation and logistical expenses and increased operational efficiencies, we give no assurance that we will be successful in implementing the realignment efforts or that the amounts of our transition costs or our cost savings will be as anticipated. Other risks and uncertainties in connection with the realignment initiatives include, but are not limited to, failing to ensure that:there is no negative impact to product quality or delivery to customers as a result of shifting capacity;adequate raw material and other service providers are available to meet the needs at the new production location;adequate supervisory, production and support personnel are available to accommodate the shift in production; andviolence does not impact our ability to produce and transport products from our facility in MexicoIn the event any of the risks or uncertainties related to the manufacturing realignment initiatives occurs, we may not recoup our investment, and we could experience lost future sales and increased operating costs as well as customer relations problems, which could have a material adverse effect on our results of operations.plasticpetroleum-based resins and certain rare earth metals used in our charging systems, as well as diesel fuel to transport the products. Our profitability is affected by significant fluctuations in the prices of the raw materials and commodities we use in our products. We may not be able to pass along any price increases in our raw materials to our customers. As a result, an increase in the cost of raw materials, commodities, labor or other costs associated with the manufacturing of our products could increase our costs of sales and reduce our profitability.Sixteenbeginning in May 2011 began manufacturing products in Mexico.France. We sell our products throughout the world and maintain sales and administration facilities in the United States, Canada, France, Norway, Sweden, United Kingdom, Switzerland Germany, Spain,andfacility isfacilities are in Vermillion, South Dakota, Wilmington, Ohio, and Rigby, Idaho, which distributesdistribute PG&A products to our North American dealers and we have various other locations around the world that distribute PG&A to our international dealers and distributors and one of our significant engine suppliers is located in Japan.distributors. Our total sales outside North America were 15 percent, 16 percent, 15 percent, and 1614 percent of our total sales for fiscal 2011, 2010,2014, 2013, and 2009,2012, respectively. International markets have, and will continue to be, a focus for sales growth. We believe many opportunities exist in the international markets, and over time we intend for international sales to comprise a larger percentage of our total sales. Several factors, including weakened international economic conditions, could adversely affect such growth. Additionally, theIn 2014, we completed construction of a manufacturing facility in Poland. The expansion of our existing international operations and entry into additional international markets require significant management attention and financial resources. Some of the countries in which we manufacture and/or sell our products, or otherwise have an international presence, are to some degree subject to political, economic and/or social instability. Our international operations expose us and our representatives, agents and distributors to risks inherent in operating in foreign jurisdictions. These risks include:
difficulties in enforcing or defending intellectual property rights; and
multiple, changing, and often inconsistent enforcement of laws, rules, and regulations, including rules relating to environmental, health, taxes, and safety matters.
Location Facility Type/Use 2009 Polaris Industries Inc. Russell 2000 Index Recreational Vehicles Industry Group Index—Morningstar Group 2014 Polaris Industries Inc., Period October 1–31, 2011 November 1–30, 2011 December 1–31, 2011 Total (Dollars in millions, except per-share data) Statement of Operations Data Sales Data: Total sales Percent change from prior year Sales mix by product: Off-Road Vehicles Snowmobiles On-Road Vehicles Parts, Garments and Accessories Gross Profit Data: Total gross profit Percent of sales Operating Expense Data: Total operating expenses Percent of sales Operating Income Data: Total operating income Percent of sales Net Income Data: Net income from continuing operations Percent of sales Diluted net income per share from continuing operations Net income Diluted net income per share Cash Flow Data: Cash flow provided by continuing operations Purchase of property and equipment for continuing operations Repurchase and retirement of common stock Cash dividends to shareholders Cash dividends per share Balance Sheet Data (at end of year): Cash and cash equivalents Current assets Total assets Current liabilities Long-term debt Shareholders’ equity (Dollars in millions, except per-share data) Statement of Operations Data Sales Data: Total sales Percent change from prior year Sales mix by product: Off-Road Vehicles Snowmobiles On-Road Vehicles Parts, Garments and Accessories Gross Profit Data: Total gross profit Percent of sales Operating Expense Data: Total operating expenses Percent of sales Operating Income Data: Total operating income Percent of sales Net Income Data: Net income from continuing operations Percent of sales Diluted net income per share from continuing operations Net income Diluted net income per share Cash Flow Data: Cash flow provided by continuing operations Purchase of property and equipment for continuing operations Repurchase and retirement of common stock Cash dividends to shareholders Cash dividends per share Balance Sheet Data (at end of year): Cash and cash equivalents Current assets Total assets Current liabilities Long-term debt Shareholders’ equity acquisitions. Sales were Volume Product mix and price Currency ($ in millions) Off-Road Vehicles Snowmobiles On-Road Vehicles PG&A Total Sales gains. For 2013, the average ORV per unit sales price increased seven percent over 2012's per unit sales price, primarily as a result of the increased sales of models. our value-priced snowmobiles. our consolidated financial statements, which were both acquired in 2014. Sales of PG&A to customers outside of North America increased 13 percent during 2014 compared to 2013. ($ in millions) United States Canada Other foreign countries Total Sales represented and related PG&A, improved pricing and more sales of higher priced side-by-side vehicles. 2012. 2012. ($ in millions) Purchased materials and services Labor and benefits Depreciation and amortization Warranty costs Total Cost of Sales Percentage of sales 2013. ($ in millions) Gross profit dollars Percentage of sales a contract dispute resolution. ($ in millions) Selling and marketing Research and development General and administrative Total operating expenses Percentage of sales sales: April 2013, respectively. ($ in millions) Equity in earnings of Polaris Acceptance Income from Securitization Facility Income from HSBC, Sheffield and GE Bank retail credit agreements Income from other financial services activities Total income from financial services services: contract volume and increased profitability generated from the retail credit portfolios with Sheffield, GE and Capital One, and higher income from dealer inventory financing through Polaris Acceptance. EPPL gains and losses. positions related to our foreign subsidiaries from period to period. The higher income tax rate for 2014 was primarily due to lower income generated from our international operations which generally have lower income tax rates. For 2014 and 2013, the income tax provision that division have been recorded in discontinued operations. No additional charges are expected from this lawsuit. The ($ in millions except per share data) Net Income Diluted net income per share outstanding. At the end of 2014, if all long-term incentive program performance based awards were expected to achieve the maximum payout, we would have recorded an additional $7.5 million of expense in 2014. Fluctuations in our stock price can have a significant effect on reported share-based compensation expenses for liability-based awards. The impact from fluctuations in our stock price is recognized in the period of the change, and is reflected in our gross margin and operating expenses. At December 31, 2014, the accrual for liability-based awards outstanding was $15.2 million, and is included in accrued compensation in the consolidated balance sheets. shareholders. ($ in millions): Total cash provided by (used for): Operating activities Investment activities Financing activities Effect of exchange rate changes on cash balances Increase (decrease) in cash and cash equivalents Activities: Activities: (In millions): Borrowings under credit agreement: Senior Notes Interest expense senior notes Capital leases Operating leases Total 2014: $10.6 million and the estimated future payments of contingent purchase price related to acquisitions which have a fair value of $27.9 million at December 31, 2014, and are expected to be paid at various times in 2015 through 2017. authorized remaining for repurchase will be governed by applicable SEC rules. balances outstanding during the prior calendar year. Our financial exposure under these agreements is limited to the difference between the amounts unpaid by the dealer with respect to the repossessed product plus costs of repossession and the amount received on the resale of the repossessed product. No material losses have been incurred under these agreements. However, an adverse change in retail sales could cause this situation to change and thereby require us to repurchase repossessed units subject to the annual limitation referred to above. and GECDF amended the Polaris Acceptance partnership agreement to extend it through February 2017 with similar terms to the previous agreement. time to time. We actively manage our exposure to fluctuating foreign currency exchange rates by entering into foreign exchange hedging contracts. and net income. net income. respective prior year periods: Based on our current outlook for commodity prices, the total impact of commodities is expected to have a positive impact on our gross margins for 2015 when compared to 2014. 2014. 20, 2015 20, 2015 20, 2015 Current Assets: Cash and cash equivalents Trade receivables, net Inventories, net Prepaid expenses and other Income taxes receivable Deferred tax assets Total current assets Property and Equipment: Land, buildings and improvements Equipment and tooling Less accumulated depreciation Property and equipment, net Investments in finance affiliate Investments in other affiliates Deferred tax assets Goodwill and other intangible assets, net Total Assets Current Liabilities: Current portion of long-term borrowings under credit agreement Current portion of capital lease obligations Accounts payable Accrued expenses: Compensation Warranties Sales promotions and incentives Dealer holdback Other Income taxes payable Total current liabilities Long term income taxes payable Deferred income taxes Capital lease obligations Long-term debt Total liabilities Shareholders’ Equity: Preferred stock $0.01 par value, 20,000 shares authorized, no shares issued and outstanding Common stock $0.01 par value, 160,000 shares authorized, 68,430 and 68,468 shares issued and outstanding Additional paid-in capital Retained earnings Accumulated other comprehensive income, net Total shareholders’ equity Total Liabilities and Shareholders’ Equity Contents Sales Cost of sales Gross profit Operating expenses: Selling and marketing Research and development General and administrative Total operating expenses Income from financial services Operating income Non-operating expense (income): Interest expense (Gain) loss on securities available for sale Other expense (income), net Income before income taxes Provision for income taxes Net income Basic net income per share Diluted net income per share Weighted average shares outstanding: Basic Diluted Balance, December 31, 2008 Employee stock compensation Proceeds from stock issuances under employee plans Tax effect of exercise of stock options Cash dividends declared ($0.78 per share) Repurchase and retirement of common shares Comprehensive income: Net Income Foreign currency translation adjustments, net of tax of $69 Reclassification of unrealized loss on available for sale securities to the income statement, net of tax of $2,277 Unrealized loss on available for sale securities, net of tax benefit of $230 Unrealized gain on derivative instruments, net of tax of $165 Total comprehensive income Balance, December 31, 2009 Employee stock compensation Proceeds from stock issuances under employee plans Tax effect of exercise of stock options Cash dividends declared ($0.80 per share) Repurchase and retirement of common shares Comprehensive income: Net Income Foreign currency translation adjustments, net of tax of $222 Unrealized gain on available for sale securities, net of tax benefit of $230 Unrealized loss on derivative instruments, net of tax benefit of $256 Total comprehensive income Balance, December 31, 2010 Employee stock compensation Proceeds from stock issuances under employee plans Tax effect of exercise of stock options Cash dividends declared ($0.90 per share) Repurchase and retirement of common shares Comprehensive income: Net Income Foreign currency translation adjustments, net of tax benefit of $6,782 Unrealized gain/(loss) on derivative instruments, net of tax of $2,125 Total comprehensive income Balance, December 31, 2011 thousands) Contents Operating Activities: Net income Adjustments to reconcile net income to net cash provided by operating activities: (Gain) loss on securities available for sale Depreciation and amortization Noncash compensation Noncash income from financial services Noncash expense from other affiliates Deferred income taxes Tax effect of share-based compensation exercises Changes in current operating items: Trade receivables Inventories Accounts payable Accrued expenses Income taxes payable/receivable Prepaid expenses and others, net Net cash provided by operating activities Investing Activities: Purchase of property and equipment Investments in finance affiliate Distributions from finance affiliate Investment in other affiliates Proceeds from sale of investments Acquisition of businesses, net of cash acquired Net cash used for investment activities Financing Activities: Borrowings under credit agreement / senior notes Repayments under credit agreement Repurchase and retirement of common shares Cash dividends to shareholders Tax effect of proceeds from share-based compensation exercises Proceeds from stock issuances under employee plans Net cash used for financing activities Impact of currency exchange rates on cash balances Net increase (decrease) in cash and cash equivalents Cash and cash equivalents at beginning of period Cash and cash equivalents at end of period Supplemental Cash Flow Information: Interest paid on debt borrowings Income taxes paid Mexico. marine products division are reported separately as discontinued operations for all periods presented. Asset (Liability) Non-qualified deferred compensation assets Foreign exchange contracts Commodity contracts Total Asset (Liability) Non-qualified deferred compensation assets Interest rate swap agreements Foreign exchange contracts Commodity contracts Total Use of Raw materials and purchased components Service parts, garments and accessories Finished goods Less: reserves Inventories Product Balance at beginning of year Additions to warranty reserve through acquisitions Additions charged to expense Warranty claims paid Balance at end of year Share-based employee Plan (“Option Plan”), the 1999 Broad Based Stock Option Plan, the final cash payout was made in 2014. Beginning in 2012, long term incentive program awards are granted in restricted stock units and therefore treated as equity awards. All remaining conditions of the long term incentive program remained the same as prior to 2012. Option plan Other share-based awards Total share-based compensation before tax Tax benefit Total share-based compensation expense included in Net income follows (in thousands): Balance as of December 31, 2008 Granted Exercised Forfeited Balance as of December 31, 2009 Granted Exercised Forfeited Balance as of December 31, 2010 Granted Exercised Forfeited Balance as of December 31, 2011 Vested or expected to vest as of December 31, 2011 Options exercisable as of December 31, 2011 Range of Exercise Prices $9.90 to $14.25 $14.26 to $21.51 $21.52 to $22.33 $22.34 to $23.21 $23.22 to $29.73 $29.74 to $29.98 $29.99 to $38.46 $38.47 to $64.41 2014 was 6.83 years and 5.17 years, respectively. Weighted-average volatility Expected dividend yield Expected term (in years) Weighted average risk free interest rate Balance as of December 31, 2010 Granted Vested Canceled/Forfeited Balance as of December 31, 2011 Expected to vest as of December 31, 2011 2014: Polaris sponsors a qualified non-leveraged as follows (in thousands): Bank Total borrowings at December 31, Average outstanding borrowings during year Maximum outstanding borrowings during year Interest rate at December 31 2013. Letters of preliminary. Balance as of beginning of year Goodwill acquired during the year Currency translation effect on foreign goodwill balances Balance as of end of year Other intangible assets, beginning Intangible assets acquired during the period Amortization expense Foreign currency translation effect on balances Other intangible assets, ending December 31, 2011 Non-compete agreements Dealer/customer related Developed technology Total amortizable Non-amortizable—brand/trade names Total other intangible assets, net December 31, 2010 Developed technology Total other intangible assets, net (In thousands): United States Foreign Income before income taxes follows (in thousands): (In thousands): Current: Federal State Foreign Deferred Total follows (in thousands): Federal statutory rate State income taxes, net of federal benefit Domestic manufacturing deduction Research tax credit Valuation allowance for foreign subsidiaries net operating losses Other permanent differences Effective income tax rate Current deferred income taxes: Inventories Accrued expenses Derivative instruments Total current Noncurrent net deferred income taxes: Cost in excess of net assets of business acquired Property and equipment Compensation payable in common stock Net unrealized gains in other comprehensive income Total noncurrent Total (In thousands): Balance at January 1, Gross increases for tax positions of prior years Gross decreases for tax positions of prior years Gross increases for tax positions of current year Decreases due to settlements Decreases for lapse of statute of limitations Balance at December 31, Balance at December 31, 2010 Reclassification to the income statement Change in fair value Balance at December 31, 2011 Polaris Board of Directors declared a regular cash dividend of $0.53 per share payable on Weighted average number of common shares outstanding Director Plan and Deferred stock units ESOP Common shares outstanding—basic Dilutive effect of Restricted Plan and Omnibus Plan Dilutive effect of Option Plan and Omnibus Plan Common and potential common shares outstanding—diluted Revenues Interest and operating expenses Net income Finance receivables, net Other assets Total Assets Notes payable/(receivable) Other liabilities Partners’ capital Total Liabilities and Partners’ Capital lease. Lease Obligations 2012 2013 2014 2015 2016 Thereafter Total future minimum lease obligation shareholders’ equity. Derivatives designated as hedging instruments Foreign exchange contracts(2) Total derivatives designated as hedging instruments Commodity contracts(2) Total derivatives not designated as hedging instruments Total Derivatives Derivatives Designated as Hedging Instruments Interest rate contracts(1) Foreign exchange contracts(2) Total derivatives designated as hedging instruments Commodity contracts(2) Total derivatives not designated as hedging instruments Total Derivatives Derivatives in Cash Flow Hedging Relationships Interest rate contracts Foreign currency contracts Total Derivatives in Cash Flow Hedging Relationships Interest rate contracts Foreign currency contracts Foreign currency contracts Total 2013. Canadian subsidiary: Sales Identifiable assets Other foreign countries: Sales Identifiable assets 2011 First Quarter Second Quarter Third Quarter Fourth Quarter Totals 2010 First Quarter Second Quarter Third Quarter Fourth Quarter Totals Part I hereof. Plan category Equity compensation plans approved by security holders Equity compensation plans not approved by security holders 74. Officer (Principal Financial and Accounting Officer) Allowance for Doubtful Accounts (In thousands) 2009: Deducted from asset accounts—Allowance for doubtful accounts receivable 2010: Deducted from asset accounts—Allowance for doubtful accounts receivable 2011: Deducted from asset accounts—Allowance for doubtful accounts receivable Inventory Reserve 2009: Deducted from asset accounts—Allowance for obsolete inventory 2010: Deducted from asset accounts—Allowance for obsolete inventory 2011: Deducted from asset accounts—Allowance for obsolete inventory 2011:2014:
Leased Square
FootageMedina, Minnesota Headquarters Owned 130,000 Spirit Lake, IowaPlymouth, Minnesota Wholegoods manufacturingHeadquarters OwnedPrimarily owned 301,000175,000 Roseau, Minnesota Wholegoods manufacturing and R&D Owned 635,000733,200 Monterrey, Mexico Wholegoods manufacturing LeasedOwned 425,000 Osceola, WisconsinComponent parts manufacturingOwned188,800Osceola, WisconsinEngine manufacturingOwned97,000Roseau, MinnesotaInjection molding manufacturingOwned76,800Wyoming, MinnesotaResearch and development facilityOwned127,000Burgdorf, SwitzerlandResearch and development facilityLeased13,600Vermillion, South DakotaDistribution centerOwned385,000Vermillion, South DakotaDistribution centerLeased33,000Milford, Iowa Wholegoods manufacturing LeasedPrimarily owned 94,000460,400 St. Paul, MinnesotaOpole, Poland Wholegoods distributionmanufacturing Leased 110,000Brooklyn Park, MinnesotaWholegoods distributionLeased25,000E. Syracuse, New YorkWholegoods distributionLeased40,000Redlands, CaliforniaWholegoods distributionLeased40,000Nashville, TennesseeWholegoods distributionLeased37,500Irving, TexasWholegoods distributionLeased140,000Fife, WashingtonWholegoods distributionLeased20,000Haviland, OhioWholegoods distributionLeased30,000Askim, NorwayOffice facilityLeased10,800Barcelona, SpainOffice facilityLeased4,300Birmingham, United KingdomOffice facilityLeased6,500Griesheim, GermanyOffice facilityLeased3,200Rolle, SwitzerlandOffice facilityLeased8,000Sao Paulo, BrazilOffice facilityLeased1,600Shanghai, ChinaOffice facilityLeased2,300Winnipeg, CanadaOffice facilityLeased15,000Plymouth, MinnesotaOffice facilityLeased30,000New Delhi, IndiaOffice facilityLeased2,500Ballarat, AustraliaOffice and distribution facilityLeased9,200Ostersund, SwedenOffice and distribution facilityLeased14,300Passy, FranceOffice and distribution facilityLeased10,000Roseau, MinnesotaWarehouse (various locations)Leased33,600300,000 Spirit Lake, Iowa Warehouse (various locations)Wholegoods manufacturing LeasedOwned 298,400 Osceola, Wisconsin 70,000Component parts & engine manufacturing Owned 285,800 Milford, IowaChanas, France Wholegoods distributionmanufacturing LeasedOwned 100,000Melbourne, AustraliaRetail storeLeased9,600Sydney, AustraliaRetail storeLeased13,000196,000 Bourran, France Wholegoods manufacturing and R&D Leased 100,000 Aix-les-Bains, France Wholegoods manufacturing and R&D Owned 97,800 Wyoming, Minnesota Research and development facility Owned 272,000 Burgdorf, Switzerland Research and development facility Leased 13,600 Wilmington, Ohio Distribution center Leased 429,000 Vermillion, South Dakota Distribution center Primarily owned 418,000 Rigby, Idaho Distribution center and office facility Owned 54,600 Altona, Australia Wholegoods distribution Leased 215,000 St. Paul, Minnesota Wholegoods distribution Leased 160,000 Irving, Texas Wholegoods distribution Leased 157,000 Milford, Iowa Wholegoods distribution Leased 100,000 Haviland, Ohio Wholegoods distribution Leased 100,000 Winnipeg, Canada Office facility Leased 15,000 Rolle, Switzerland Office facility Leased 8,000 On January 5, 2010, Fabiola Esparza (Plaintiff) sued Polaris in California State District Court in Los Angeles County. In her Complaint, Plaintiff alleges that she was injured in a July 4, 2008 accident involving a collision between a 2001 Polaris Virage personal watercraft (PWC) and a boat. Plaintiff was a passenger on the PWC at the time of the accident and incurred serious, permanent injuries as a result of the accident. Plaintiff alleges that the PWC was defective and unreasonably dangerous in that it lacked sufficient steerage while being operated off-throttle and lacked sufficient warnings regarding this alleged condition. Plaintiff is seeking general, special, and punitive damages. The case is currently scheduled for trial on May 8, 2012. Management believes the claim to be without merit and intends to defend vigorously against this action but there can be no assurance that the ultimate outcome of the lawsuit will be favorable to us or that the defense of the suit or its outcome will not have a material adverse effect on our financial condition.isare expected to have a material effect on the financial results of our business.20112014 Annual Report is incorporated herein by reference. On February 16, 2012,18, 2015, the last reported sale price for shares of our common stock on the New York Stock Exchange was $67.96$155.63 per share.threetwo indexes: Russell 2000S&P Midcap 400 Index and Morningstar’s Recreational Vehicles Industry Group Index. The graph assumes the investment of $100 at the close on December 31, 20062009 in common stock of the Company and in each of the indexes, and the reinvestment of all dividends. Points on the graph represent the performance as of the last business day of each of the years indicated.20062011 2006 2007 2008 2009 2010 2011 $ 100.00 $ 104.81 $ 65.28 $ 104.37 $ 191.81 $ 280.15 100.00 98.44 65.75 82.87 105.14 100.73 100.00 73.08 29.70 48.89 68.31 77.15 2009 2010 2011 2012 2013 2014 Polaris Industries Inc. $ 100.00 $ 183.78 $ 268.42 $ 411.47 $ 723.73 $ 761.88 S&P Midcap 400 Index 100.00 126.64 124.45 146.70 195.84 214.97 Recreational Vehicles Industry Group Index—Morningstar Group 100.00 136.37 149.24 205.27 318.26 313.83 Russell 2000S&P Midcap 400 Index and Recreational Vehicles Index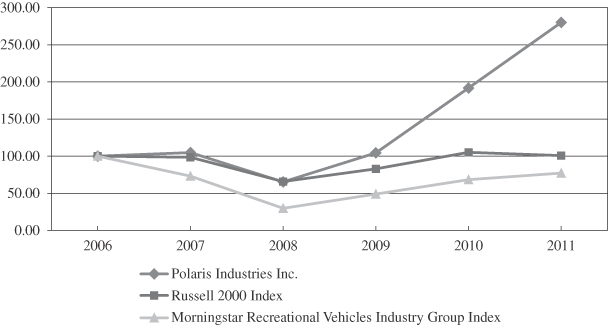
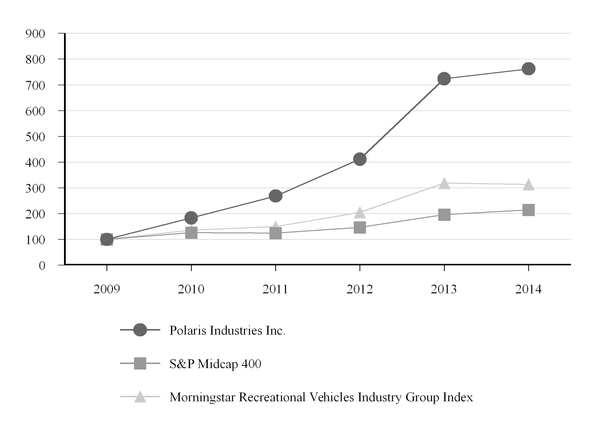
2011.Issuer Purchases of Equity Securities Total Number of
Shares Purchased Average Price Paid
per Share Total Number of
Shares Purchased as
Part of Publicly
Announced Program Maximum Number
of Shares That May
Yet Be Purchased
Under the
Program(1) 365,000 $ 63.98 365,000 4,430,000 — — — 4,430,000 801,000 58.13 801,000 3,629,000 1,166,000 $ 59.96 1,166,000 3,629,000 Period Total Number of
Shares Purchased Average Price Paid
per Share Total Number of Shares Purchased as Part of Publicly Announced Program Maximum Number of Shares That May Yet Be Purchased Under the Program(1) October 1–31, 2014 1,000 $ 148.46 1,000 1,573,000 November 1–30, 2014 — — — 1,573,000 December 1–31, 2014 523,000 148.64 523,000 1,050,000 Total 524,000 $ 148.64 524,000 1,050,000 (1) The Board of Directors previously authorized a share repurchase program to repurchase up to an aggregate of 75.0 million shares of the Company’s common stock (the “Program”). Of that total, 71.473.9 million shares have been repurchased cumulatively from 1996 through December 31, 2011.2014. This Program does not have an expiration date.2011.2014.11-Year Selected Financial Data For the Years Ended December 31, 2011 2010 2009 2008 2007 2006 $ 2,656.9 $ 1,991.1 $ 1,565.9 $ 1,948.3 $ 1,780.0 $ 1,656.5 33 % 27 % -20 % 9 % 7 % -11 % 69 % 69 % 65 % 67 % 67 % 67 % 11 % 10 % 12 % 10 % 10 % 10 % 5 % 4 % 3 % 5 % 6 % 7 % 15 % 17 % 20 % 18 % 17 % 16 % $ 740.6 $ 530.2 $ 393.2 $ 445.7 $ 393.0 $ 359.4 27.9 % 26.6 % 25.1 % 22.9 % 22.1 % 21.7 % $ 414.7 $ 326.3 $ 245.3 $ 284.1 $ 262.3 $ 238.4 15.6 % 16.4 % 15.7 % 14.6 % 14.7 % 14.4 % $ 349.9 $ 220.7 $ 165.0 $ 182.8 $ 176.0 $ 168.1 13.2 % 11.1 % 10.5 % 9.4 % 9.9 % 10.1 % $ 227.6 $ 147.1 $ 101.0 $ 117.4 $ 112.6 $ 112.8 8.6 % 7.4 % 6.5 % 6.0 % 6.3 % 6.8 % $ 3.20 $ 2.14 $ 1.53 $ 1.75 $ 1.55 $ 1.36 $ 227.6 $ 147.1 $ 101.0 $ 117.4 $ 111.7 $ 107.0 $ 3.20 $ 2.14 $ 1.53 $ 1.75 $ 1.54 $ 1.29 $ 302.5 $ 297.9 $ 193.2 $ 176.2 $ 213.2 $ 152.8 84.5 55.7 43.9 76.6 63.7 52.6 132.4 27.5 4.6 107.2 103.1 307.6 61.6 53.0 50.2 49.6 47.7 50.2 $ 0.90 $ 0.80 $ 0.78 $ 0.76 $ 0.68 $ 0.62 $ 325.3 $ 393.9 $ 140.2 $ 27.2 $ 63.3 $ 19.6 878.7 808.1 491.5 443.6 447.6 393.0 1,228.0 1,061.6 763.7 751.1 769.9 778.8 615.5 584.2 343.1 404.8 388.2 361.4 104.6 100.0 200.0 200.0 200.0 250.0 500.1 371.0 204.5 137.0 173.0 167.4 For the Years Ended December 31, 2005 2004 2003 2002 2001 $ 1,869.8 $ 1,773.2 $ 1,552.4 $ 1,468.2 $ 1,427.4 5 % 14 % 6 % 3 % 8 % 66 % 66 % 67 % 64 % 58 % 14 % 16 % 15 % 20 % 26 % 5 % 4 % 4 % 2 % 1 % 15 % 14 % 14 % 14 % 15 % $ 411.0 $ 416.6 $ 356.0 $ 324.6 $ 299.2 22.0 % 23.5 % 22.9 % 22.1 % 21.0 % $ 244.7 $ 242.7 $ 206.0 $ 181.8 $ 164.5 13.1 % 13.7 % 13.3 % 12.4 % 11.5 % $ 205.0 $ 205.9 $ 173.5 $ 157.5 $ 149.0 11.0 % 11.6 % 11.2 % 10.7 % 10.4 % $ 137.7 $ 132.3 $ 115.2 $ 107.1 $ 93.8 7.4 % 7.5 % 7.4 % 7.3 % 6.6 % $ 1.57 $ 1.49 $ 1.29 $ 1.14 $ 0.99 $ 136.7 $ 99.9 $ 106.3 $ 99.4 $ 87.5 $ 1.56 $ 1.12 $ 1.19 $ 1.06 $ 0.93 $ 162.5 $ 237.1 $ 162.5 $ 195.8 $ 192.0 89.8 88.8 59.2 52.3 52.9 132.3 66.8 73.1 76.4 49.2 47.0 38.9 26.7 25.3 22.8 $ 0.56 $ 0.46 $ 0.31 $ 0.28 $ 0.25 $ 19.7 $ 138.5 $ 82.8 $ 81.2 $ 40.5 374.0 465.7 387.7 343.7 305.3 770.6 792.9 674.2 614.4 568.0 375.6 405.2 330.5 313.5 308.3 18.0 18.0 18.0 18.0 18.0 377.0 368.1 325.7 282.8 241.6 2014 2013 2012 2011 2010 Statement of Operations Data Sales Data: Total sales $ 4,479.6 $ 3,777.1 $ 3,209.8 $ 2,656.9 $ 1,991.1 Percent change from prior year 19 % 18 % 21 % 33 % 27 % Sales components: Off-Road Vehicles 65 % 67 % 69 % 69 % 69 % Snowmobiles 7 % 8 % 9 % 11 % 10 % Motorcycles 8 % 6 % 6 % 5 % 4 % Small Vehicles 3 % 3 % 2 % — % — % Parts, Garments and Accessories 17 % 16 % 14 % 15 % 17 % Gross Profit Data: Total gross profit $ 1,319.2 $ 1,120.9 $ 925.3 $ 740.6 $ 530.2 Percent of sales 29.4 % 29.7 % 28.8 % 27.9 % 26.6 % Operating Expense Data: Total operating expenses $ 666.2 $ 588.9 $ 480.8 $ 414.7 $ 326.3 Percent of sales 14.9 % 15.6 % 15.0 % 15.6 % 16.4 % Operating Income Data: Total operating income $ 714.7 $ 577.9 $ 478.4 $ 349.9 $ 220.7 Percent of sales 16.0 % 15.3 % 14.9 % 13.2 % 11.1 % Net Income Data: Net income from continuing operations $ 454.0 $ 381.1 $ 312.3 $ 227.6 $ 147.1 Percent of sales 10.1 % 10.1 % 9.7 % 8.6 % 7.4 % Diluted net income per share from continuing operations $ 6.65 $ 5.40 $ 4.40 $ 3.20 $ 2.14 Net income $ 454.0 $ 377.3 $ 312.3 $ 227.6 $ 147.1 Diluted net income per share $ 6.65 $ 5.35 $ 4.40 $ 3.20 $ 2.14 Cash Flow Data: Cash flow provided by continuing operations $ 529.3 $ 499.2 $ 416.1 $ 302.5 $ 297.9 Purchase of property and equipment 205.1 251.4 103.1 84.5 55.7 Repurchase and retirement of common stock 81.8 530.0 127.5 132.4 27.5 Cash dividends to shareholders 126.9 113.7 101.5 61.6 53.0 Cash dividends per share $ 1.92 $ 1.68 $ 1.48 $ 0.90 $ 0.80 Balance Sheet Data (at end of year): Cash and cash equivalents $ 137.6 $ 92.2 $ 417.0 $ 325.3 $ 393.9 Current assets 1,096.6 865.7 1,017.8 875.0 808.1 Total assets 2,074.9 1,685.5 1,488.5 1,228.0 1,061.6 Current liabilities 850.8 748.1 631.0 586.3 584.2 Long-term debt and capital lease obligations 223.6 284.3 104.3 104.6 100.0 Shareholders’ equity 861.3 535.6 690.5 500.1 371.0 2011,2014, and should be read in conjunction with the Consolidated Financial Statements and the Notes thereto included elsewhere in this report.Our full year 2011earningsnet income, with our fifth straight year of double digit growth rates rapidly accelerated past the record results we delivered in 2010. While the global economy remained difficult,both sales and net income. This growth is fueled by award-winning innovative new products leading to continued market share gainsleadership in ORVside-by-side vehicles and VictoryATVs. In 2014, we also experienced growth in our snowmobiles, motorcycles, coupled with strong international and adjacency growth, enabled us to once again outperform the competition.small vehicles businesses. The overall North American powersports industry was about flat year over year, acontinued its positive trend for the industry compared to the past several years.with mid-single digit percentage growth in 2014. Our full year North AmericanAmerica retail sales were up 14%,to consumers increased 12 percent in 2014, helping to drive total full year Company sales up 19 percent to a record $2.66 billion in 2011, up 33$4.48 billion. Despite the global economy remaining difficult, our international sales increased 16 percent from 2010. Sales growth remained broad based, as sales grew in every product line and in every region of the world. Thanksdue to innovative new products, our ORV business extended theircontinued market share leadership position while contributing significantly togrowth in all product categories and strong results by our sales growth. With Victory hitting its stride in most every respect and the Indian brand now part of Polaris, our motorcycle business was a key contributor to revenue growth. Despite this winter’s lack of snow, last season’s success and our line-up of new products contributed to a very strong 2011 for our snowmobile business, increasing 48 percent in 2011. Ourrecent European business grew sales 37 percent in 2011, supporting total International sales growth of 39 percent in 2011.margin expansion efforts,ongoing product innovation, as we exceeded expectations by delivering a 120 basis point increase in net income margin, to a record 8.619 percent of sales. The combination of rapid sales growth, and expanding marginspartially offset by a decrease in the gross profit percentage of 23 basis points, drove net income from continuing operations up 5519 percent to $227.6$454.0 million, with diluted earnings per share from continuing operations increasing 5023 percent to a record $3.20$6.65 per share.During 2011, Polaris accomplished much more than posting record sales and earnings results. Across the business and around the globe, each of our employees helped to make significant progress towards achieving our first strategic objective, to be the Best in Powersports PLUS. The strongest testimony to this commitment comes from our market share expansion and financial results in ORV, snowmobiles and motorcycles.Growth through Adjacencies moved meaningfully from concept to reality in 2011, as These increases came while we completed three acquisitions, GEM, Goupil and Indian Motorcycles; made small investments in cutting-edge technology companies and greatly expanded our military and Bobcat businesses. GEM and Goupil both hold strong positions in the growing $4.0 billion small electric vehicle industry and our integration and development of Indian Motorcycles is proceeding well.Global Market Leadership is an attractive growth initiative in the company shorter term and our objective is to drive International business to generate at least 25 percent of our sales within the next few years. In 2011, we took an important step and asked two of our most experienced executives to lead our international efforts in the Europe, Middle East and Africa regions and Asia Pacific/Latin America. While these regions are quite different, we look to consistently pursue our strategy of creating organic growth through new product introductions and dealer expansion, while looking for opportunitiescontinued to invest in businessesnumerous longer-term diversification and growth opportunities.augmentreceive benefits from prior investments while continuing to invest in both product development and strategic initiatives. We introduced over twenty new ORV models in 2014, including the all-new RZR® XP 900 trail and RZR XP4 900 trail, several new value models, and two models in a newly defined category of single-seat, ride-in ATVs, the Polaris ACE™. We also introduced nine new snowmobiles in the all-new AXYS™ chassis platform. In our organic growth.Supporting quality growthmotorcycles line, we added two new models to the iconic Indian Motorcycleensuring customer satisfaction are key objectives ofthe Scout™, Polaris' first mid-sized motorcycle. Additionally, we introduced the revolutionary all-new three-wheel motorcycle, Slingshot®, our Operational Excellencefirst roadster motorcycle. We also acquired Kolpin and LEAN initiatives, and in 2011 our operations team made substantial progress. They executed the challenging and complex Monterrey Mexico plant start-up on time and within budget, providing much neededPro Armor, adding two industry leading accessory companies to Polaris' PG&A activities. Operationally, we expanded production capacity to meet rising demand. Additionally, we integrated three acquisitions, increased vehicle productionand capabilities at all assemblymanufacturing facilities in the U.S. and delivered improved productivity forMexico, and completed the second yearconstruction of the manufacturing plant in Opole, Poland, our first manufacturing operation outside of North America, where production began in late 2014.row.Duringnew production facility in Huntsville, Alabama to provide additional capacity and flexibility. The 600,000 square-foot facility will focus on off-road vehicle production. We will break ground on the 2011 thirdfacility in the first quarter of 2015 with completion expected in the Boardfirst half of Directors declared a two-for-one split of our outstanding shares of Common Stock. 2016.September 12, 2011, Polaris shareholders received one additional share of Common Stock for each share they held of record at the close of business on September 2, 2011.On February 2, 2012,January 29, 2015, we announced that our Board of Directors approved a 6410 percent increase in the regular quarterly cash dividend to $0.37$0.53 per share for the first quarter 2012,of 2015, representing the 17th20th consecutive year of increased dividends.dividends to shareholders. This percentage increase is our largest since 1995, reflectingreflects the continued momentum and potential of our business and the strength of our balance sheet.Sales:$2,656.9$4,479.6 million for 2011, in 2014, a 3319 percent increase from $1,991.1$3,777.1 million in sales for the same period in 2010.2013. The following table is an analysis of the percentage change in total Company sales for 20112014 compared to 20102013 and 20102013 compared to 2009: Percent Change in Total
Company Sales for the Years
Ended December 31 2011 vs.
2010 2010 vs.
2009 24 % 21 % 7 % 4 % 2 % 2 % 33 % 27 % Volume for 2011 and 2010 increased 24 and 21 percent compared to 2010 and 2009, respectively. 2012: Percent change in total Company sales compared to the prior year 2014 2013 Volume 14 % 12 % Product mix and price 6 7 Currency (1 ) (1 ) 19 % 18 % increaseincreases in 20112014 and 2010 is due to2013 are primarily the Companyresult of shipping more off-roadORVs, snowmobiles, motorcycles, small vehicles and on-road vehicles, snowmobiles and related PG&A items to dealers than during the prior years, asgiven increased consumer retail demand increased for our products.products worldwide. Product mix and price increasedcontributed six percent and seven percent to the growth for 2014 and 2013, respectively, primarily due to the positive benefit of a greater number of higher priced ORVs sold to dealers relative to our other businesses. The impact from currency rates on our Canadian and other foreign subsidiaries' sales, when translated to U.S. dollars, decreased sales by one percent in both 20112014 and 20102013 compared to the respective prior years primarily due to the increased shipmentsyears.side-by-side vehicles to dealers in both periods. Side-by-side vehicles typically have a higher selling price than our other ORV products. Increased sales of Victory motorcycles also contributed to the improved mix of products in 2011 and 2010 compared to the respective prior years. Additionally, we realized select selling price increases in 2011 and 2010 on several of the new model year products.Total company sales by product line arewere as follows: For the Year Ended December 31, 2011 Percent
of Total
Sales 2010 Percent
of Total
Sales Percent
Change
2011 vs.
2010 2009 Percent
of Total
Sales Percent
Change
2010 vs.
2009 $ 1,822.3 69 % $ 1,376.4 69 % 32 % $ 1,021.1 65 % 35 % 280.1 11 % 188.9 10 % 48 % 179.3 12 % 5 % 146.3 5 % 81.6 4 % 79 % 52.8 3 % 55 % 408.2 15 % 344.2 17 % 19 % 312.7 20 % 10 % $ 2,656.9 100 % $ 1,991.1 100 % 33 % $ 1,565.9 100 % 27 % For the Years Ended December 31, 2014 Percent
of Total
Sales 2013 Percent
of Total
Sales Percent
Change
2014 vs.
2013 2012 Percent
of Total
Sales Percent
Change
2013 vs.
2012Off-Road Vehicles $ 2,909.0 65 % $ 2,521.5 67 % 15 % $ 2,225.8 69 % 13 % Snowmobiles 322.4 7 % 301.7 8 % 7 % 283.0 9 % 7 % Motorcycles 348.7 8 % 219.8 6 % 59 % 195.8 6 % 12 % Small Vehicles 157.4 3 % 122.8 3 % 28 % 44.4 2 % 177 % PG&A 742.1 17 % 611.3 16 % 21 % 460.8 14 % 33 % Total Sales $ 4,479.6 100 % $ 3,777.1 100 % 19 % $ 3,209.8 100 % 18 % $1,822.3$2,909.0 million in 2011,2014, which includes bothinclude core ATV, RANGERandRANGERRZR side-by-side vehicles, and the Company's new ACE category, increased 3215 percent from 2010.2013. This increase reflects continued market share gains for both ATVs and side-by-side vehicles driven by industry leading productstrong consumer enthusiasm for our ORV offerings, including an expanded line-up of innovative new models and good growth in military and shipments to Bobcat.the introduction of the new ACE category. Polaris’ North American ORV unit retail sales to consumers increased mid-teenslow-double digits percent for 20112014 compared to 2010,2013, with ATV unit retail sales growing singlemid-single digits percent and side-by-side vehicle unit retail sales increasing mid-twentiesdouble-digits percent over the prior year. The Company's new ACE category, introduced early in 2014, accelerated its retail sales sequentially throughout 2014. North American dealer inventories of ORVs increased high-teens percent from 2013, in support of dealer stocking levels for premium and value segments for ATV RFM and new ACE categories. ORV sales outside of North America increased mid-teens percent in 2014 compared to 2013 resulting from market share gains. For 2014, the average ORV per unit sales price increased four percent over 2013's per unit sales price, primarily as a result of the increased sales of higher priced side-by-side vehicle models.ATVs continued to decline, decreasing eightORVs increased mid-teens percent from 2010. Side-by-side North American dealer inventories for 2011 were up mid-teens percent to accommodate the2012, in support of continued strong retail demand.demand for side-by-side vehicles and incremental new market segments. ORV sales outside of North America increased 3720112013 compared to a year ago. Given the growth2012 resulting in our ORV business worldwide, we have widened our market share leadership in off-road vehicles in 2011 compared to 2010.$1,376.4 million in 2010, which includes both core ATV andRANGER side-by-side vehicles, increased 35 percent from 2009. This increase reflects continued market share gains for both ATVs andside-by-side vehicles driven by industry leading product offerings. North American dealer inventories of ATVs continued to decline, decreasing 33 percent from 2009. Our North American ORV unit retail sales to consumers increased approximately 15 percent for 2010 compared to the 2009 withhigher priced side-by-side vehicle retail sales increasing in the mid 30 percent range year over year and ATV retail sales about flat with the prior year. Given the growth in our ORV business worldwide, we widened our market share leadership in off-road vehicles in both North America and Europe in 2010 compared to 2009.48seven percent to $280.1$322.4 million for 20112014 compared to 2010.2013. This increase is primarily due to significantly reduced snowmobile dealer inventory levels entering the 2011 – 2012 selling season compared to the prior yearearly snowfall and colder weather in North America and the success of model year 2012the new product introductions resultingAXYS chassis platform models introduced in 2014. Retail sales to consumers for the 2014-2015 season-to-date period through December 31, 2014, increased orders from dealers.high-teens percent. Sales of snowmobiles to customers outside of North America, principally within the Scandinavian region and Russia, also experienced sales growthdecreased 28 percent in 20112014 as compared to a year ago. 2013 due primarily to economic weakness in the region. The average unit sales price in 2014 was approximately flat when compared to 2013.fiveseven percent to $188.9$301.7 million for 20102013 compared to 2009.2012. This increase wasis primarily due to an increase in retaillower dealer inventory coming out of the 2012-2013 snowmobile season and success of the model year 2014 new product introductions. Retail sales resulting from heavy amountsto consumers for the 2013-2014 season-to-date period through December 31, 2013, increased nearly ten percent. Sales of early snowfall in many key riding areas insnowmobiles to customers outside of North America, principally within the Scandinavian region and Russia, increased 18 percent in the 2010 – 2011 selling season and the success2013 as compared to 2012. The average unit sales price in 2013 decreased two percent when compared to 2012, resulting primarily from increased sales of model year 2011 new product introductions.On-Road Vehicles increased 79 percent to $146.3 million for 2011 compared to 2010. In 2011, On-Road Vehicle sales areMotorcycles, which is comprised of Victory and Indian brand motorcycles, as well asand the Company’s SEVall-new roadster, Slingshot, increased 59 percent to $348.7 million for 2014 compared to 2013. The increase in 2014 sales is due to the continued high demand for Indian motorcycles including the new 2015 Roadmaster and the Company's first mid-sized motorcycle, Scout, and initial shipments of GEMthe Slingshot. North American industry heavyweight cruiser and Goupil. The 2011touring motorcycle retail sales increase reflects(which excludes Slingshot) increased Victorylow-single digits percent in 2014 compared to 2013. Over the same period, Polaris North American unit retail sales to consumers increased almost 40 percent, driven primarily by continued strong retail sales for Indian motorcycles and initial retail sales of 22Slingshot. North American Polaris motorcycle dealer inventory increased mid-teens digits percent in 2014 versus 2013 levels primarily due to stocking of the Indian motorcycles and international Victory motorcycle sales up significantly during 2011 whenSlingshot. Sales of motorcycles to customers outside of North America increased over 70 percent in 2014 compared to 2010, resulting2013. The average per unit sales price for the Motorcycles division in continued market share gains.2014 increased nine percent compared to 2013 due to the increased sales of higher priced Indian motorcycles and initial sales of Slingshot.industryretail sales increased mid-single digits percent during 2011. Consumer demand remains strong for Victory’s newest models, the Cross Country Tour and the Victory Hard-Ball. The increase in On-Road Vehicle sales in 2011 also benefited from the SEV acquisitions of GEM and Goupil in 2011. Sales of the On-Road Vehicles Division in 2010, which primarily consist of Victory motorcycles,increased 55 percent to $81.6 million during 20102013 compared to 2009. The sales increase reflected increased Victory2012. Over the same period, Polaris North American unit retail sales to consumers ofincreased over 20 percent, and international Victorydriven by an unprecedented number of new product introductions in 2013, which includes three new Indian Motorcycle models. North American Polaris motorcycle sales up significantly during 2010 whendealer inventory increased high-single digits percent in 2013 versus 2012 levels due to stocking of the new Indian motorcycles. Sales of motorcycles to customers outside of North America increased three percent in 2013 compared to 2009, resulting2012. The average per unit sales price for the Motorcycles division in continued market share gains.Parts, Garments,2013 increased five percent compared to 2012 due to the increased sales of higher priced Indian motorcycles.AccessoriesGoupil vehicles, increased 28 percent to $157.4 million for 2014 compared to 2013. The increase in sales increased 19 percentover the comparable prior year is due to $408.2 million and 10 percent to $344.2 millionthe inclusion of Aixam in our consolidated financial statements for the full year 2011 and 2010, respectively.in 2014, versus eight months in 2013, since it was acquired in April 2013. Also, GEM experienced an increase in sales during 2014 compared to 2013.both 2011 and 2010 wassales over the comparable prior year periods is primarily due to the inclusion of Aixam in our consolidated financial statements since it was acquired in April 2013. Also, both GEM and Goupil experienced an increase in sales during 2013 compared to 2012.Victory motorcycleSmall Vehicles related PG&A, sales including strong international growth. During both 2011 and 2010, we continued to innovate withwhich was primarily driven by the addition of over 200 accessories introduced for400 new model year vehicles2015 accessories, including additions to the family of Lock & Ride® attachments that add comfort, style and utility to ORVs and motorcycles. PG&A sales also increased due to the inclusion of Kolpin and Pro Armor in each respective year.for the 2011, 2010 and 2009 year end periods were as follows: For the Year Ended December 31, 2011 Percent
of Total
Sales 2010 Percent
of Total
Sales Percent
Change
2011 vs.
2010 2009 Percent
of Total
Sales Percent
Change
2010 vs.
2009 $ 1,864.1 70 % $ 1,405.9 71 % 33 % $ 1,074.2 69 % 31 % 368.5 14 % 279.3 14 % 32 % 239.3 15 % 17 % 424.3 16 % 305.9 15 % 39 % 252.4 16 % 21 % $ 2,656.9 100 % $ 1,991.1 100 % 33 % $ 1,565.9 100 % 27 % For the Years Ended December 31, ($ in millions) 2014 Percent of Total Sales 2013 Percent of Total Sales Percent Change 2014 vs. 2013 2012 Percent of Total Sales Percent Change 2013 vs. 2012 United States $ 3,339.9 75 % $ 2,721.3 72 % 23 % $ 2,311.0 72 % 18 % Canada 454.6 10 % 463.3 12 % (2 )% 438.2 14 % 6 % Other foreign countries 685.1 15 % 592.5 16 % 16 % 460.6 14 % 29 % Total sales $ 4,479.6 100 % $ 3,777.1 100 % 19 % $ 3,209.8 100 % 18 % 20112014 increased 3323 percent compared to 2010,2013, primarily resulting from higher shipments in all product lines due to market share gains driven by innovative products.and related PG&A, improved pricing and more sales of higher priced side-by-side vehicles. The United States7075 percent, 7172 percent and 6972 percent of total company sales in 2011, 20102014, 2013 and 2009,2012, respectively. Sales in the United States for 20102013 increased 3118 percent compared to 2009,2012, primarily resulting from higher shipments in all product lines due to market share gains driven by innovative products.increased 32decreased two percent in 20112014 compared to 2010. Fluctuations in the Canadian2013. Negative currency rate compared to the United States dollar accounted for a five percent increase in sales for 2011 compared to 2010. Increased volumemovements was the primary contributor for the remainderdecrease in 2014, which had an unfavorable seven percent impact on sales for 2014 compared to 2013, partially offset by sales of the increase in 2011 due to strong retail sales demandhigher priced side-by-side vehicles and motorcycles. Sales in Canada for our products.represented 10 percent, 12 percent and 14 percent of total company sales in 2014, 2013, and 2012, respectively. Canadian sales increased 176 percent in 20102013 compared to 2009. Fluctuations in the Canadian2012 due to increased shipments of ORVs and snowmobiles, partially offset by currency rate movements, which had an unfavorable three percent impact on sales for 2013 compared to the United States dollar accounted for a nine percent increase in sales for 2010 compared to 2009. Increased volume was the primary contributor for the remainder of the increase in 2010 due to strong retail sales demand in Canada for our products.3916 percent for 20112014 compared to 2010. Favorable currency rates accounted for six percent of the increase for the 2011 year compared to 2010.2013. The remainder of the increase was primarily driven by higher volume largely relatedincreased sales of side-by-side vehicles and motorcycles, as well as the acquisition of Aixam in April 2013. This increase was partially offset by currency rate movements, which had an unfavorable two percent impact on sales for 2014 compared to market share gains for ORV and Victory motorcycles.2013. Sales in other foreign countries, primarily in Europe, increased 2129 percent for 20102013 compared to 2009. Favorable currency rates accounted for two percent of the increase for the 2010 year compared to 2009.2012. The remainder of the increase was primarily driven by higher volume largely relatedthe acquisition of Aixam in April 2013, along with increased sales of side-by-side vehicles and PG&A. This increase was partially offset by currency rate movements, which had an unfavorable one percent impact on sales for 2013 compared to market share gains. For the Year Ended December 31, 2011 Percent of
Total
Cost of Sales 2010 Percent of
Total
Cost of Sales Change
2011 vs.
2010 2009 Percent of
Total Cost of
Sales Change
2010 vs.
2009 $ 1,650.8 86 % $ 1,208.4 83 % 37 % $ 968.6 83 % 25 % 165.5 9 % 151.9 10 % 9 % 108.1 9 % 41 % 53.9 3 % 56.9 4 % (5 )% 55.0 5 % 3 % 46.2 2 % 43.7 3 % 6 % 41.0 3 % 7 % $ 1,916.4 100 % $ 1,460.9 100 % 31 % $ 1,172.7 100 % 25 % 72.1 % 73.4 % -130 basis 74.9 % -150 basis points points For the Years Ended December 31, ($ in millions) 2014 Percent of Total Cost of Sales 2013 Percent of Total Cost of Sales Change 2014 vs. 2013 2012 Percent of
Total
Cost of Sales Change 2013 vs. 2012 Purchased materials and services $ 2,757.6 87 % $ 2,336.1 88 % 18 % $ 2,008.9 88 % 16 % Labor and benefits 244.1 8 % 198.7 8 % 23 % 177.7 8 % 12 % Depreciation and amortization 96.9 3 % 64.5 2 % 50 % 51.8 2 % 25 % Warranty costs 61.9 2 % 56.9 2 % 9 % 46.1 2 % 23 % Total cost of sales $ 3,160.5 100 % $ 2,656.2 100 % 19 % $ 2,284.5 100 % 16 % Percentage of sales 70.6 % 70.3 % +23 basis 71.2 % -85 basis points points 2011,2014, cost of sales increased 3119 percent to $1,916.4$3,160.5 million compared to $1,460.9$2,656.2 million in 2010.2013. The increase in cost of sales in 20112014 resulted primarily from the effect of a 2414 percent increase in sales volume on purchased materials and services and labor and benefits. Additionally, depreciation and amortization increased due to increased capital expenditures to increase production capacity and capabilities.richer mix of products12 percent increase in sales volume on purchased materials and services and labor and benefits, offset somewhat by continued product cost reduction effortsand also includes an unfavorable resolution regarding a contract dispute resulting in 2011. For 2010, cost of sales increased 25 percent to $1,460.9an approximate $10.0 million compared to $1,172.7 millioncharge for additional royalties in 2009. The increase in cost of sales in 2010 resulted primarily from the effect of a 21 percent sales volume increase and a richer mix of products on purchased materials and services, and labor and benefits offset somewhat by continued product cost reduction efforts in 2010.sales for the 2011, 2010 and 2009 year end periods: For the Year Ended December 31, 2011 2010 Change
2011 vs. 2010 2009 Change
2010 vs. 2009 $ 740.6 $ 530.2 40 % $ 393.2 35 % 27.9 % 26.6 % +130 basis points 25.1 % +150 basis points For 2011, gross profit dollars increased 40 percent to $740.6 million compared to 2010. sales: For the Years Ended December 31, ($ in millions) 2014 2013 Change
2014 vs. 2013 2012 Change
2013 vs. 2012 Gross profit dollars $ 1,319.2 $ 1,120.9 18 % $ 925.3 21 % Percentage of sales 29.4 % 29.7 % -23 basis points 28.8 % +85 basis points increased 130was 29.4 percent for 2014, a decrease of 23 basis points from 2013. Gross profit dollars increased 18 percent to 27.9 percent$1,319.2 million in 2014 compared to 26.6 percent for 2010.2013. The increase in gross profit dollars resulted from higher selling prices, mix and product cost reduction efforts partially offset by the negative impact of currency movements. The decrease in gross profit percentage resulted primarily from unfavorable foreign currency fluctuations, new plant start-up costs and higher depreciation and amortization, partially offset by product cost reduction and higher selling prices.130 basis points increase in the gross profit margin percentage in 2011 resulted primarily from continued product cost reduction, efforts, production efficiencies on increased volumes and higher selling prices, partially offset by increasing commodityunfavorable foreign currency fluctuations, higher promotional costs and unfavorable product mix. For 2010, gross profit dollars increased 35 percent to $530.2 million compared to 2009. Gross profit,royalty expenses as a percentageresult of sales, improved 150 basis points to 26.6 percent compared to 25.1 percent for 2009. The increase in gross profit dollars and the 150 basis points increase in the gross profit margin percentage in 2010 resulted primarily from higher volume, continued product cost reduction efforts, higher selling prices and beneficial currency movements. These increases were partially offset by manufacturing realignment costs as well as higher sales promotion costs.sales for the 2011, 2010 and 2009 periods: For the Year Ended December 31, 2011 2010 Change
2011 vs. 2010 2009 Change
2010 vs. 2009 $ 178.7 $ 142.4 25 % $ 111.1 28 % 105.6 84.9 24 % 63.0 35 % 130.4 99.0 32 % 71.2 39 % $ 414.7 $ 326.3 27 % $ 245.3 33 % 15.6 % 16.4 % -80 basis points 15.7 % +70 basis points For the Years Ended December 31, 2014 2013 Change
2014 vs. 2013 2012 Change
2013 vs. 2012Selling and marketing $ 314.5 $ 270.3 16 % $ 210.4 28 % Research and development 148.5 139.2 7 % 127.3 9 % General and administrative 203.2 179.4 13 % 143.1 25 % Total operating expenses $ 666.2 $ 588.9 13 % $ 480.8 22 % Percentage of sales 14.9 % 15.6 % -72 basis points 15.0 % +61 basis points 20112014 increased 2713 percent to $414.7$666.2 million, compared to $326.3$588.9 million for 2010. in 2013. Operating expenses as a percentage of sales decreased 8072 basis points in 2014 to 15.614.9 percent compared to 16.415.6 percent in 2010.2013. Operating expenses in absolute dollars for 2011 increased in 2014 primarily due to an increase in performance-based incentive compensation planhigher selling, marketing and advertising expenses over 2010 driven byrelated to the higher profitability for 2011launch of new model year 2015 products, including Slingshot, and the higher stock price,continued roll-out of Indian motorcycles, as well as increased general and administrative expenses, which reflects our pay for performance compensation philosophy. In addition, incrementalincludes infrastructure investments being made into support global market expansion and new product development initiatives and acquisitions made in 2011 contributed to the increase in operating expenses in 2011.growth initiatives. Operating expenses as a percentagepercent of sales decreased in 2011 compared to 2010declined primarily due to leverage achieved fromlower long-term incentive compensation expenses, partially offset by higher marketing and advertising expenses related to the increased sales volume during the year. launch of various new model year 2015 products.20102013 increased 3322 percent to $326.3$588.9 million, compared to $245.3$480.8 million for 2009.in 2012. Operating expenses as a percentage of sales increased 7061 basis points in 2013 to 16.415.6 percent compared to 15.715.0 percent in 2009.2012. Operating expenses in absolute dollars and as a percentage of sales for 2010 increased in 2013 primarily due to an increasehigher selling, marketing and advertising expenses related, in performance-basedpart, to the re-launch of Indian Motorcycle, increased general and administrative expenses, which includes infrastructure investments being made to support global growth initiatives and higher accrued incentive compensation plan expenses over 2009 driven by the higher profitability for 2010 and thedue to a higher stock price, which reflectsprice. Operating expenses in absolute dollars also increased due to the inclusion of Klim and Aixam operating expenses in our pay for performance compensation philosophyconsolidated financial statements since these companies were acquired in December 2012 and incremental investments made in global market expansion and new product development initiatives.services for the 2011, 2010 and 2009 periods: For the Year Ended December 31, 2011 2010 Change
2011 vs. 2010 2009 Change
2010 vs. 2009 $ 4.4 $ 4.6 -4 % $ 4.0 15 % 7.7 8.0 -4 % 9.6 -17 % 9.1 2.4 279 % 1.1 118 % 2.9 1.9 53 % 2.4 -21 % $ 24.1 $ 16.9 43 % $ 17.1 -1 % For the Years Ended December 31, ($ in millions) 2014 2013 Change
2014 vs. 2013 2012 Change
2013 vs. 2012Income from Polaris Acceptance joint venture $ 30.5 $ 20.2 51 % $ 15.7 29 % Income from retail credit agreements 27.6 22.5 23 % 15.3 47 % Income from other financial services activities 3.6 3.2 13 % 2.9 10 % Total income from financial services $ 61.7 $ 45.9 34 % $ 33.9 35 % Percentage of sales 1.4 % 1.2 % +16 basis points 1.1 % +16 basis points 4334 percent to $24.1$61.7 million in 20112014 compared to $16.9$45.9 million in 2010.2013. The increase wasin 2014 is primarily due to a 16 percent increase in retail credit contract volume and increased profitability generated from the recently extended retail credit arrangementsportfolios with GE, HSBCSheffield, Synchrony Bank, Capital One and SheffieldFreedomRoad, and higher income from dealer inventory financing through Polaris Acceptance, due to increased profitability and a 3023 percent increase in the retail credit volume. financed receivables as of December 31, 2014.decreased oneincreased 35 percent to $16.9$45.9 million in 20102013 compared to $17.1$33.9 million in 2009. This decrease was2012. The increase in 2013 is primarily due to lower wholesale financing income resulting from lower dealer inventories, which was somewhat offset by highera nine percent increase in retail credit income. For the Years Ended December 31, ($ in millions except per share data) 2014 2013 Change
2014 vs. 2013 2012 Change
2013 vs. 2012Interest expense $ 11.2 $ 6.2 81 % $ 5.9 5 % Equity in loss of other affiliates $ 4.1 $ 2.4 71 % $ 0.2 NM Other expense (income), net $ 0.0 $ (5.1 ) NM $ (7.5 ) (32 )% Income before income taxes $ 699.3 $ 574.4 22 % $ 479.8 20 % Provision for income taxes $ 245.3 $ 193.4 27 % $ 167.5 15 % Percentage of income before income taxes 35.1% 33.7% +141 basis points 34.9% -125 basis points Net income from continuing operations $ 454.0 $ 381.1 19 % $ 312.3 22 % Net income $ 454.0 $ 377.3 20 % $ 312.3 21 % Diluted net income per share: Continuing operations $ 6.65 $ 5.40 23 % $ 4.40 23 % Diluted net income $ 6.65 $ 5.35 24 % $ 4.40 22 % Weighted average diluted shares outstanding 68.2 70.5 (3 )% 71.0 (1 )% NM = not meaningful Expense:Expense.Interest expense increased to $4.0 millionThe increase in 20112014 compared to $2.7 million in 2010. This increase2013 is primarily due to higher interest ratesincreased debt levels through borrowings on our existing revolving credit facility and the long-term senior notes issuedadditional borrowing of $100.0 million through our amended Master Note Purchase Agreement in May 2011. Interest expense decreased to $2.7 millionDecember 2013. The increase in 20102013 compared to $4.1 million2012, is primarily related to the increased debt levels through borrowings in 2009. This decrease was due to lower interest ratesthe 2013 fourth quarter on our bankexisting revolving credit facility and additional borrowings duringof $100.0 million through our amended Master Note Purchases Agreement in November 2013 used to partially fund the 2010 period and lower average borrowings$497.5 million buyback of outstanding Polaris shares held by Fuji.2010 compared to 2009.(Gain) Loss on Securities Available for Sale:The net gainloss of $0.8 million in 2010 on securities available for sale resulted from a $1.6 million gain onother affiliates.saleresult of our remaining investment in KTM during the 2010 third quarter offset by a related non-cash impairment charge of $0.8 million during the 2010 second quarter. In the first quarter 2009, we recorded a non-cash impairment charge on securities held for sale of $9.0 million from the declinean increase in the fair valuejoint venture's pre-production activities. We record our proportionate 50 percent share of the KTM shares owned by us as of March 31, 2009, when it was determined that the decline in the fair value of the KTM shares owned by us was other than temporary. Expense (Income), Net:Non-operating other expense (income) was $0.7 million of income, $0.3 million of expense, and $0.7 million of expense for 2011, 2010 and 2009, respectively.,net. The changeschange primarily relaterelates to fluctuations of the U.S. dollarforeign currency exchange rate movements and the resultingcorresponding effects on currency hedging activities and foreign currency transactions and balance sheet positions.Income Taxes:income taxes.rate was similarpositively impacted by the United States Congress extending the research and development income tax credit. However, in 2013 the research and development credit extension was retroactive to 2012, resulting in two years of benefit in 2013. In addition, we also had a favorable impact in 2013 from the release of certain income tax reserves due to favorable conclusions of federal income tax audits. The favorable impact from these items totaled $8.2 million and was recorded as a reduction to income tax expense in the first quarter of 2013.2011, 2010an additional provision for our portion of the jury award and 2009 and reflected an effective ratelegal fees. The liability was fully paid by the end of 34.3, 32.7, and 33.2 percent2013. There was no income or loss from discontinued operations in 2014 or 2012. In September 2004, we announced our decision to cease manufacturing marine products. Since then, any material financial results of pretax income, respectively.Reported Net Income:Weighted average shares outstanding.following table reflects our reported net income fordecrease in the 2011, 2010 and 2009 periods: For the Year Ended December 31, 2011 2010 Change
2011 vs. 2010 2009 Change
2010 vs. 2009 $ 227.6 $ 147.1 55 % $ 101.0 46 % $ 3.20 $ 2.14 50 % $ 1.53 40 % Weighted Average Shares Outstanding:The weighted average diluted shares outstanding for 2011, 2010 and 2009 were 71.1 million, 68.8 million and 66.1is primarily due to the Company's November 2013 purchase of 3.96 million shares respectively. The increase in weighted average diluted shares outstanding for 2011 compared to 2010 is due toof Polaris stock previously held by FHI Heavy Industries Ltd ("Fuji") under a Share Repurchase Agreement with Fuji. This buyback more than offset the issuance of shares under employee compensation plans and resulted in a decrease to the higher dilutive effect of stock options outstanding2014, and to a lesser extent due to a higher stock price in 2011. The increase in the timing of the transaction, the 2013 weighted average diluted shares outstanding for 2010 compared to 2009 is due to no open market share repurchases under our stock repurchase program, the issuance of shares under employee compensation plans, and the higher dilutive effect of stock options outstanding due to a higher stock price in 2010.recognition:recognition. Revenues are recognized at the time of shipment to the dealer, distributor or other customers. Historically, product returns, whether in the normal course of business or resulting from repurchases made under the floorplan financing program, have not been material. However, we have agreed to repurchase products repossessed by the finance companies up to certain limits. Our financial exposure is limited to the difference between the amount paid to the finance companies and the amount received on the resale of the repossessed product. No material losses have been incurred under these agreements. We have not historically recorded any significant sales return allowances because it haswe have not been required to repurchase a significant number of units. However, an adverse change in retail sales could cause this situation to change. Polaris sponsors certain sales incentive programs and accrues liabilities for estimated sales promotion expenses and estimated holdback amounts that are recognized as reductions to sales when products are sold to the dealer or distributor customer.incentives:incentives. We provide for estimated sales promotion and incentive expenses, which are recognized as a reduction to sales at the time of sale to the dealer or distributor. Examples of sales promotion and incentive programs include dealer and consumer rebates, volume incentives, retail financing programs and sales associate incentives. Sales promotion and incentive expenses are estimated based on current programs and historical rates for each product line. We record these amounts as a liability in the consolidated balance sheet until they are ultimately paid. At December 31, 20112014 and 2010,2013, accrued sales promotions and incentives were $81.2$138.6 million and $75.5$123.1 million, respectively, resulting primarily from an increase in the volume of units sold.sold and an increase in the level of dealer inventories in 2014. Actual results may differ from these estimates if market conditions dictate the need to enhance or reduce sales promotion and incentive programs or if the customer usage rate varies from historical trends. Adjustments to sales promotions and incentives accruals are made from time to time as actual usage becomes known in order to properly estimate the amounts necessary to generate consumer demand based on market conditions as of the balance sheet date. Historically, actual sales promotion and incentive expenses have been within our expectations and differences have not been material.programs:programs. Dealer holdback represents a portion of the invoiced sales price that is expected to be subsequently returned to the dealer or distributor as a sales incentive upon the ultimate retail sale of the product. Holdback amounts reduce the ultimate net price of the products purchased by our dealers or distributors and, therefore, reduce the amount of sales we recognize at the time of shipment. The portion of the invoiced sales price estimated as the holdback is recognized as “dealer holdback” liability on our balance sheet until paid or forfeited. The minimal holdback adjustments in the estimated holdback liability due to forfeitures are recognized in net sales. Payments are made to dealers or distributors at various times during the year subject to previously established criteria. Polaris recorded accrued liabilities of $76.5$120.1 million and $79.7$100.6 million for dealer holdback programs in the consolidated balance sheets as of December 31, 20112014 and 2010,2013, respectively.compensation:compensation. We recognize in the financial statements the grant-date fair value of stock options and other equity-based compensation issued to employees. Determining the appropriate fair-value model and calculatingwhichthat will be forfeited due to employee turnover. Changes in the estimated forfeiture rate can have a significant effect on reported share-based compensation, as the effect of adjusting the rate for all expense amortization is recognized in the period the forfeiture estimate is changed. If the actual forfeiture rate is higher or lower than the estimated forfeiture rate, then an adjustment is made to increase or decrease the estimated forfeiture rate, which will result in a decrease or increase to the expense recognized in the financial statements. If forfeiture adjustments are made, they would affect our gross margin and operating expenses. We estimate the likelihood and the rate of achievement for performance sensitive share-based awards, specifically long-term compensation grants of Long Term Incentive Plan units andperformance-based restricted stock.stock awards. Changes in the estimated rate of achievement and fluctuation in the market based stock price can have a significant effect on reported share-based compensation expenses as the effect of a change in the estimated achievement level and fluctuation in the market based stock price is recognized in the period that the likelihood factor and stock price changes. If adjustments in the estimated rate of achievement and fluctuation in the market based stock price are made, they would be reflected in our gross margin and operating expenses.warranties:warranties. We provide a limited warranty for ORVs for a period of six months, and for a period of one year for our snowmobiles, for a period of one or two years for our motorcycles depending on brand and motorcyclesmodel year, and two years for SEVs.SVs. We provide longer warranties in certain geographical markets as determined by local regulations and market conditions and may provide longer warranties related to certain promotional programs. Our standard warranties require us or our dealers to repair or replace defective products during such warranty periods at no cost to the consumers. The warranty reserve is established at the time of sale to the dealer or distributor based on management’s best estimate using historical rates and trends. We record these amounts as a liability in the consolidated balance sheet until they are ultimately paid. At December 31, 20112014 and 2010,2013, the accrued warranty liability was $44.4$53.1 million and $32.7$52.8 million, respectively. Adjustments to the warranty reserve are made from time to time based on actual claims experience in order to properly estimate the amounts necessary to settle future and existing claims on products sold as of the balance sheet date. While management believes that the warranty reserve is adequate and that the judgment applied is appropriate, such amounts estimated to be due and payable could differ materially from what will actuallyultimately transpire in the future.liability:liability. We are subject to product liability claims in the normal course of business. In late 2012, we purchased excess insurance coverage for catastrophic product liability claims for incidents occurring after the policy date. We self-insure our product liability claims.claims up to the purchased catastrophic insurance coverage. The estimated costs resulting from any uninsured losses are charged to operating expenses when it is probable a loss has been incurred and the amount of the loss is reasonably determinable. We utilize historical trends and actuarial analysis tools, along with an analysis of current claims, to assist in determining the appropriate loss reserve levels. At December 31, 20112014 and 2010,2013, we had accruals of $16.9$17.3 million and$13.5 $17.1 million, respectively, for the probable payment of pending claims related to continuing operations product liability litigation associated with our products. These accruals are included in other accrued expenses in the consolidated balance sheets. While management believes the product liability reserves are adequate, adverse determination of material product liability claims made against us could have a material adverse effect on our financial condition.sourcessource of funds havehas been cash provided by operating activities and borrowings under our credit arrangements.activities. Our primary useuses of funds hashave been for repayments under our credit arrangements,acquisitions, repurchase and retirement of common stock, capital investments,investment, new product development and cash dividends to shareholders and new product development.charttable summarizes the cash flows from operating, investing and financing activities for the years ended December 31, 20112014 and 2010: For the Year Ended December 31 2011 2010 Change $ 302.5 $ 297.6 $ 4.9 (141.1 ) (42.1 ) (99.0 ) (227.5 ) (1.8 ) (225.7 ) (2.5 ) — (2.5 ) $ (68.6 ) $ 253.7 $ (322.3 ) ($ in millions) For the Years Ended December 31, 2014 2013 Change Total cash provided by (used for): Operating activities $ 529.3 $ 492.2 $ 37.1 Investing activities (246.8 ) (406.7 ) 159.9 Financing activities (222.6 ) (409.0 ) 186.4 Impact of currency exchange rates on cash balances (14.5 ) (1.3 ) (13.2 ) Increase (decrease) in cash and cash equivalents $ 45.4 $ (324.8 ) $ 370.2 activities:For the year ended December 31, 2011, we generated netActivities:fromprovided by operating activities of $302.5totaled $529.3 million compared to net cash from operating activities of $297.6 and $492.2 million in the same period of 2010, an increase of 2 percent.2014 and 2013, respectively. The $4.9$37.1 million increase in net cash provided by operating activities in 2014 is primarily the result of higher net income compared to 2013, which includes a $35.4 million increase in depreciation and amortization, partially offset by a $44.5 million increase in deferred income taxes and a $15.8 million increase in net working capital. Changes in working capital (as reflected in our statements of cash flows) for the year ended 20112014 was an increase of $15.6 million, compared to the same periodan increase of $0.2 million in 2010 is2013. This was primarily due to a $80.4 millionan increase in net income largelycash used of $106.4 million related to higher inventory required to support the growth in the business, offset by $65.0 million higheran increase in net investment in working capital. This higher working capital resulted primarily from higher investment incash provided related to timing of payments made for accounts receivable and income taxes receivable totaling $32.6payable of $54.3 million and lower cash provided from accrued expenses totaling $26.7the timing of collections of trade receivables of $29.9 million.activities:$141.1$246.8 million for 2011in 2014 compared to cash used totaling $42.1$406.7 million for 2010.in 2013. The primary useuses of cash in 20112014 were the acquisitions of Kolpin and 2010 wasPro Armor and capital expenditures for the investment inpurchase of property and equipmentequipment. In 2014, we made large capital expenditures related to the expansion of $84.5 millionmany of our North America locations, including our manufacturing facilities in Spirit Lake, Iowa; Milford, Iowa; Roseau, Minnesota; and $55.7 million, respectively. Additionally, during 2011, cash was used to complete a numberMonterrey, Mexico, as well as the construction of acquisitions totaling $51.9our new manufacturing facility in Opole, Poland. We expect that capital expenditures for 2015 will be in excess of $250 million.activities:$227.5$222.6 million for 2011 in 2014 compared to $1.8$409.0 million in 2010. In 2011, we used cash for financing activities to pay2013. We paid cash dividends of $61.6$126.9 million and repurchase shares of$113.7 million in 2014 and 2013, respectively. Total common stock repurchased in 2014 and 2013 totaled $81.8 million and $530.0 million, respectively. In November 2013, Polaris repurchased the 3.96 million Polaris shares held by Fuji for $132.4$497.5 million. The repurchase of the Polaris shares held by Fuji was partially funded through additional debt borrowings. In 2014, we had net repayments under our capital lease arrangements and debt arrangements of $82.1 million, and acompared to net repaymentborrowings of debt totaling $102.3$179.2 million offset by proceedsin 2013. Proceeds from the issuance of stock issuances under employee plans were $31.3 million and $26.9 million in 2014 and 2013, respectively.$45.7 million. In 2010, we used cash for financing activitiesproduction and shipments cause working capital requirements to pay cash dividends of $53.0 million and repurchase shares of common stock for $27.5 million, offset by proceeds from stock issuance under employee plans of $68.1 million.In August 2011, Polaris entered into a newfluctuate during the year. We are party to an unsecured $350 million unsecured revolving loan facility. The newvariable interest rate bank lending agreement that expires in August 2016. ThereJanuary 2018. Interest is charged at rates based on LIBOR or "prime." At new facility as of December 31, 2011. Prior to August 2011, Polaris was a party to an unsecured bank agreement comprised of a $250 million revolving loan facility for working capital needs. As part of the previous bank agreement, the Company had a $200 million term loan which was paid off in its entirety in May 2011 with issuance of the Senior Notes described below and $100 million of cash on hand. arrangement.“Senior Notes”"Senior Notes"). The Senior Notes were issued in May 2011. Polaris wasIn December 2013, the Company entered into a First Supplement to Master Note Purchase Agreement, under which the Company issued $100.0 million of 3.13 percentcovenants as of covenants. Our debt to total capital ratio was 21 percent and 35 percent at December 31, 2011.We previously had interest rate swap agreements to manage exposures to fluctuations in interest rates. Each of these interest swaps was designated as2014met the criteria of cash flow hedges. The swaps expired in April 2011.We entered into and settled an interest rate lock contract in November 2010 in connection with the Master Note Purchase Agreement. The interest rate lock settlement resulted in a $0.3 million gain, net of deferred taxes of $0.1 million, which will be amortized into income over the life of the related debt.2011: Total <1 Year 1-3 Years 3-5 Years >5 Years $ 100.0 — — — $ 100.00 38.2 $ 4.4 $ 8.8 $ 8.8 16.2 7.3 2.7 3.6 0.9 0.1 36.9 7.2 10.7 7.4 11.6 $ 182.4 $ 14.3 $ 23.1 $ 17.1 $ 127.9 Total <1 Year 1-3 Years 3-5 Years >5 Years Senior notes $ 200.0 — — $ 25.0 $ 175.0 Interest expense 44.4 $ 7.6 $ 15.1 13.6 8.1 Capital leases 38.3 3.9 6.2 4.6 23.6 Operating leases 22.5 9.6 8.4 3.1 1.4 Total $ 305.2 $ 21.1 $ 29.7 $ 46.3 $ 208.1 2011,2014, we had letters of credit outstanding of $4.5$24.9 million related to purchase obligations for raw materials. Not included in the above table is unrecognized tax benefits of $7.8 million.December 31, 2011.an authorized stock repurchase program. Of that total, approximately 71.473.9 million shares werehave been repurchased cumulatively from 1996 through December 31, 2011. We paid $132.4 million2014. In addition to this stock repurchase authorization, in 2013 the Polaris Board of Directors authorized the one-time repurchase of all the shares of Polaris stock owned by Fuji. On November 12, 2013, Polaris entered into and retire approximately 2.6executed a Share Repurchase Agreement with Fuji pursuant to which Polaris purchased 3.96 million shares of Polaris stock held by Fuji. We repurchased a total of 0.6 million shares of our common stock for $81.8 millionduring 2011. The share repurchase activity during 2011 had a $0.02 beneficial impact on diluted2014, which increased earnings per share for the year ended December 31, 2011.by one cent. We have authorization from our Board of Directors to repurchase up to an additional 3.61.1 million shares of Polarisour common stock at as of December 31, 2011, which represents approximately five percent2014. On January 29, 2015, the Board of Directors approved an increase in the totalCompany’s common stock repurchase authorization by an additional 4.0 million shares. The repurchase of any or all such shares currently outstanding.20112014 and 2010,2013, was approximately $731.3$1,337.2 million and $667.6$1,163.5 million, respectively. We participate in the cost of dealer financing up to certain limits. We have agreed to repurchase products repossessed by the finance companies up to an annual maximum of no more than 15 percent of the average month-endonea wholly owned subsidiary of our wholly-owned subsidiariesPolaris entered into a partnership agreement with an entity that is now a subsidiary of TDFGE Commercial Distribution Finance Corporation (GECDF) to form Polaris Acceptance. In 2004, TDF was merged with a subsidiary of GE and, as a result of that merger, TDF’s name was changed to GECDF. Polaris Acceptance provides floor plan financing to our dealers in the United States. Our subsidiary has a 50 percent equity interest in Polaris Acceptance. In November 2006, Polaris Acceptance sold a majority of its receivable portfolio (the “Securitized Receivables”) to a securitization facility (“Securitization Facility,Facility”) arranged by General Electric Capital Corporation, a GECDF affiliate, and the partnership agreement was amended to provide that Polaris Acceptance would continue to sell portions of its receivable portfolio to the Securitization Facility from time to time on an ongoing basis. At December 31, 2011 and 2010, the outstanding balance of receivables sold by Polaris Acceptance to the Securitization Facility (the “Securitized Receivables”) amounted to approximately $477.6 million and $323.8 million, respectively. The sale of receivables from Polaris Acceptance to the Securitization Facility is accounted for in Polaris Acceptance’s financial statements as a “true-sale” under ASC Topic 860, (originally issued as SFAS No. 140: “Accounting for Transfers and Servicing of Financial Assets and Extinguishments of Liabilities”).860. Polaris Acceptance is not responsible for any continuing servicing costs or obligations with respect to the Securitized Receivables. We have not guaranteed the outstanding indebtedness of Polaris Acceptance or the Securitized Receivables. The remaining portion of the receivable portfolio is recorded on Polaris Acceptance’s books. Thebooks, and is funded through a loan from an affiliate of GECDF and through equity contributions from both partners.ana variable equity cash investment equal to 15 percent ofbased on the sum of the portfolio balance in Polaris Acceptance plus Securitized Receivables.Acceptance. Our total investment in Polaris Acceptance at December 31, 2011 and 20102014 was $42.3$89.1 million and $37.2 million, respectively. The Polaris Acceptance partnership agreement provides for periodic options for renewal, purchase or termination by either party.. Substantially all of our United StatesU.S. sales are financed through Polaris Acceptance and the Securitization Facility whereby we receivePolaris receives payment within a few days of shipment of the product. The partnership agreement provides that all income and losses of the Polaris Acceptance portfolio and income and losses realized by GECDF’s affiliates with respect to the Securitized Receivables are shared 50 percent by our wholly-ownedwholly owned subsidiary and 50 percent by GECDF.GECDF’s subsidiary. Our exposure to losses associated with respect to the Polaris Acceptance Portfoliois limited to our equity in Polaris Acceptance. We have agreed to repurchase products repossessed by Polaris Acceptance up to an annual maximum of 15 percent of the aggregate average month-end balances outstanding during the prior calendar year with respect to receivables retained by Polaris Acceptance and the Securitized ReceivablesReceivables. For calendar year 2015, the potential 15 percent aggregate repurchase obligation is approximately $146.4 million. Our financial exposure under this arrangement is limited to its equity in its wholly-owned subsidiary that is a partner inthe difference between the amount paid to the finance company for repurchases and the amount received on the resale of the repossessed product. No material losses have been incurred under this agreement. During 2011, Polaris Acceptance.Investmentsinvestment in finance affiliate in the accompanying consolidated balance sheets. Our allocable share of the income of Polaris Acceptance and the Securitized Receivables has been included as a component of Incomeincome from financial services in the accompanying consolidated statements of Income.income. At December 31, 2011,2014, Polaris Acceptance’s wholesale portfolio receivables from dealers in the United States (excluding(including the Securitized Receivables) was $90.8$1,141.1 million, a 48 percent decrease from $174.0 million at December 31, 2010 as more receivables have been securitized. Including the Securitized Receivables, the wholesale receivables from dealers in the United States at December 31, 2011 was $568.4 million, a 1423 percent increase from $497.8$928.5 million at December 31, 2010.2013. Credit losses in the Polaris Acceptance portfolio have been modest, averaging less than one percent of the portfolio over the life of the partnership.In August 2005, a wholly-owned subsidiary of Polaris entered into a multi-year contractportfolio.HSBC,Capital One, Sheffield, FreedomRoad, Synchrony Bank, and Chrome under which HSBC manages the Polaris private label credit card program under the StarCard label for thethese financial institutions provide financing to end consumers of Polaris products by consumers. During 2010 Polarisour products. The agreements expire in October 2015, February 2016, February 2016, April 2016, and HSBC extended the term of the agreement to October 2013. During 2011 it was announced that HSBC’s U.S. Credit Card and Retail Services business would be acquired by Capital One, subject to regulatory approval.January 2018, respectively. The transaction is expected to close in the second quarter of 2012. At this time we do not expect any change in the contractual terms governing our StarCard program as a result of the sale, other than an assignment to Capital One. Our income generated from the HSBC agreementthese agreements has been included as a component of Incomeincome from financial services in the accompanying consolidated statements of income.In April 2006, a wholly-owned subsidiary of Polaris entered into a multi-year contract with GE Money Bank (“GE Bank”) under which GE Bank makes available closed-end installment consumer and commercial credit to customers of our dealers for Polaris products. Our income generated from the GE Bank agreement has been included as a component of Income from financial services in the accompanying consolidated statements of income. In November 2010, we extended our installment credit contract to March 2016 under which GE Bank will provide exclusive installment credit lending for Victory motorcycles only.In January 2009, a wholly owned subsidiary of Polaris entered into a multi-year contract with Sheffield Financial (“Sheffield”) pursuant to which Sheffield agreed to make available closed-end installment consumer credit to customers of our dealers for Polaris products in the United States. Our income generated from the Sheffield agreement has been included as a component of Income from financial services in the accompanying consolidated statements of income. In October 2010, we extended our installment credit agreement to February 2016 under which Sheffield will provide exclusive installment credit lending for ORV and Snowmobiles.2011,2014, consumers financed approximately 3432 percent of our vehicles sold in the United States through the combined HSBCCapital One revolving retail credit and GESheffield, Synchrony Bank and SheffieldFreedomRoad installment retail credit arrangements, while thearrangement. The volume of revolving and installment credit contracts written in calendar year 20112014 was $643.9$903.7 million, a 3016 percent increase from 2010.Improvements2013.manufacturing capacity and product development during 2011 included $29.7 millionthe accompanying consolidated statements of tooling expenditures for new product development across all product lines. income.anticipate that capital expenditures for 2012, including tooling and research and development equipment will be approximately $85.0 million, similar to the capital expenditures made in 2011.Management believesbelieve that existing cash balances, cash flowsflow to be generated from operating activities and available borrowing capacity under the existing $350.0 million line of credit arrangement and the new Master Note Purchase Agreement, will be sufficient to fund operations, regularnew product development, cash dividends, share repurchases, acquisitions and capital expenditure requirements for 2012.the foreseeable future. At this time, management iswe are not aware of any factors that would have a material adverse impact on cash flow beyond 2012.Commodity inflation has had an impact on our results of operations in 2011. United StatesU.S. dollar to the Japanese yen, the Mexican Peso, the Canadian dollar, the Australian dollar, the Euro, the Swiss Franc and Japanese yenother foreign currencies have also had a material impact from time-to-time.2011,2014, purchases totaling sixapproximately two percent of our cost of sales were from Japaneseyen-denominated suppliers. Fluctuations in the yen denominated suppliers. The impact of the Japanese yento U.S. dollar exchange rate fluctuation on our raw material purchase prices andprimarily impacts cost of sales and net income.2011 hadthe Mexican peso have continued to increase. We also market and sell to customers in Mexico through a negative financial impact when comparedwholly owned subsidiary. Fluctuations in the peso to 2010. At December 31, 2011, we had no Japanese yen foreign exchange hedging contracts in place. We anticipate that the yen-dollarU.S. dollar exchange rate fluctuation will again have a negative impact onprimarily impacts sales, cost of sales, during 2012 when compared to 2011.wholly-ownedwholly owned subsidiary. SalesThe relationship of the Canadian subsidiary comprised 14 percent of our total sales in 2011. From time to time, we utilize foreign exchange hedging contracts to manage our exposure to the Canadian dollar. The United StatesU.S. dollar weakened overall in relation to the Canadian dollar in 2011, which resulted in a net positive financial impact on ourimpacts both sales and gross margins for the full year 2011 when compared to 2010. At December 31, 2011, we had open Canadian dollar foreign exchange hedging contracts in place for approximately 50 percent of our expected exposure through December 31, 2012 with notional amounts totaling $156.9 million with an average exchange rate of approximately 1.01 United States dollar to Canadian dollar. In view of the current exchange rates and the foreign exchange hedging contracts currently in place, we anticipate that the Canadian dollar exchange rate fluctuation will have approximately neutral impact on sales and gross margins during 2012 when compared to 2011.wholly-ownedwholly owned subsidiaries and also sell to certain distributors in other countries andcountries. We also purchase components from certain suppliers directly fromfor our United StatesU.S. operations in transactions denominated in Euros and other foreign currencies. The fluctuationrelationship of the United StatesU.S. dollar in relation to the Euro andthese other currencies has resulted in a neutralimpacts each of sales, cost of sales and net income.margins for 2011profit when compared to 2010. At December 31, 2011, we had open Swedish Krona, Australian dollar, and Euro foreign exchange contracts in place through December 31, 2012. The open Swedish Krona contracts had notional amounts totaling $6.4 million with an average exchange rate of approximately .15 United States dollar to the Swedish Krona, and the open Australian dollar contracts had notional amounts totaling $10.2 million with an average exchange rate of approximately 1.04 United States dollar to the Australian dollar. The open contracts to purchase Euros had notional amounts totaling $22.9 million with an average exchange rate of approximately 1.38 United States dollar to Euro. In view of the current exchange rates and the foreign exchange hedging contracts currently in place, we anticipate that the exchange rates for other foreign currencies, including the Swedish Krona, Australian Dollar, and Euro, will have a negative impact on sales and gross margins for 2012 when compared to 2011. Foreign currency hedging contracts Currency impact compared to the prior year period Currency Position Notional amounts (in thousands of U.S. dollars) 2014 2015 Australian Dollar Long $ 3,491 $0.91 to 1 AUD Negative Negative Canadian Dollar (CAD) Long 40,550 $0.85 to 1 CAD Negative Negative Euro Long — — Negative Negative Japanese Yen Short 22,201 109.37 Yen to $1 Positive Positive Mexican Peso Short 34,060 14.01 Peso to $1 Slightly positive Positive Norwegian Kroner Long — — Negative Negative Swedish Krona Long — — Negative Negative Swiss Franc Short — — Negative Positive of our foreign entities are translated at the foreign exchange rate in effect at the balance sheet date. Translation gains and losses are reflected as a component of Accumulatedaccumulated other comprehensive income (loss), net in the Shareholders’ Equityshareholders’ equity section of the accompanying consolidated balance sheets. Revenues and expenses in all of our foreign entities are translated at the average foreign exchange rate in effect for each month of the quarter. Certain assets and liabilities related to intercompany positions reported on our consolidated balance sheet that are denominated in a currency other than the entity’s functional currency are translated at the foreign exchange rates at the balance sheet date and the associated gains and losses are included in net income.fuel, natural gaspetroleum-based resins, certain rare earth metals and petroleum-based resins.diesel fuel. In addition, we are a purchaser of components and parts containing various commodities, including steel, aluminum, rubber and others, which are integrated into ourthe Company’s end products. While such materials are typically available from numerous suppliers, commodity raw materials are subject to price fluctuations. We generally buy these commodities and components based upon market prices that are established with the vendor as part of the purchase process.We generally attemptprocess and from time to obtain firm pricing from mosttime will enter into derivative contracts to hedge a portion of our suppliers for volumes consistent with planned production. To the extent thatexposure to commodity prices increase and we do not have firm pricing from our suppliers, or our suppliers are not able to honor such prices, we may experience gross margin declines to the extent we are not able to increase selling prices of our products.risk. At 2011, we had diesel fuel hedging2014, derivative contracts were in place to hedge approximately 34 percent50% of our expected exposure for 2012. These diesel fuel contracts did not meet the criteriaexposures for hedge accounting and the resulting unrealized gain as of December 31, 2011 was $0.2 million pretax, which was included in the consolidated statements of income as a component of Cost of sales. We also have aluminum hedging contracts in place to hedge approximately 50 percent of our expected exposure for 2012.2015. These aluminum contracts did not meet the criteria for hedge accounting and the resulting unrealized loss as of December 31, 20112014 was $1.5$4.8 million pretax,Costcost of sales.20112014, there was no outstanding balance on the revolving loan.We Assuming no additional borrowings or payments on the debt, a one-percent fluctuation in interest rates would have been manufacturing our own engines for selected modelsa $1.6 million impact to interest expense in 2014. Page 4546474849505152(i)(1) pertain to the maintenance of records that, in reasonable detail, accurately and fairly reflect the transactions and dispositions of the assets of the Company; (ii)(2) provide reasonable assurance that transactions are recorded as necessary to permit preparation of financial statements in accordance with generally accepted accounting principles, and that receipts and expenditures of the Company are being made only in accordance with authorizations of management and directors of the Company; and (iii)(3) provide reasonable assurance regarding prevention or timely detection of unauthorized acquisition, use, or disposition of the Company’s assets that could have a material effect on the financial statements. can only provide reasonable assurance and may not prevent or detect misstatements. Also, projections of any evaluation of effectiveness to future periods are subject to the risk that controls may become inadequate because of changes in conditions, or that the degree of compliance with the policies or procedures may deteriorate.2011.2014. In making this evaluation, management used the criteria set forth by the Committee of Sponsoring Organizations of the Treadway Commission (COSO) inInternal Control—2013 Integrated Framework.Based on management’s evaluation and those criteria, management concluded that the Company’s system of internal control over financial reporting was effective as of December 31, 2011.20112014 has been audited by Ernst & Young LLP, an independent registered public accounting firm, as stated in their report appearing on the following page, in which they expressed an unqualified opinion.-s- Scott W. Wine Scott W. WineChairman and Chief Executive Officer -s- Michael W. Malone Michael W. MaloneVice President—Finance and Chief Financial Officer 27, 20122011,2014, based on criteria established in Internal Control—IntegratedControl-Integrated Framework issued by the Committee of Sponsoring Organizations of the Treadway Commission (2013 framework) (the COSO criteria). Polaris Industries Inc.’s management is responsible for maintaining effective internal control over financial reporting, and for its assessment of the effectiveness of internal control over financial reporting included in the accompanying Management’s Report on Internal Control over Financial Reporting. Our responsibility is to express an opinion on the Company’s internal control over financial reporting based on our audit.2011,2014, based on the COSO criteria.20112014 and December 31, 2010,2013, and the related consolidated statements of income, comprehensive income, shareholders’ equity, and comprehensive income, and cash flows for each of the three years in the period ended December 31, 2011,2014 of Polaris Industries Inc., and our report, dated February 27, 201220, 2015, expressed an unqualified opinion thereon.27, 201220112014 and 2010,2013, and the related consolidated statements of income, comprehensive income, shareholders’ equity, and comprehensive income, and cash flows for each of the three years in the period ended December 31, 2011.2014. Our audits also included the financial statement schedule listed in the indexIndex at Item 15. These financial statements and the schedule are the responsibility of the Company’s management. Our responsibility is to express an opinion on these financial statements and schedule based on our audits.20112014 and 2010,2013, and the consolidated results of its operations and its cash flows for each of the three years in the period ended December 31, 2011,2014, in conformity with U.S. generally accepted accounting principles. Also, in our opinion, the related financial statement schedule, when considered in relation to the basic financial statements taken as a whole, presents fairly in all material respects the information set forth therein.2011,2014, based on criteria established in Internal Control—IntegratedControl-Integrated Framework, issued by the Committee of Sponsoring Organizations of the Treadway Commission 2013 framework and our report, dated February 27, 201220, 2015, expressed an unqualified opinion thereon.27, 2012POLARIS INDUSTRIES INC.CONSOLIDATED BALANCE SHEETS(In thousands, except per share data) December 31, 2011 2010 ASSETS $ 325,336 $ 393,927 115,302 89,294 298,042 235,927 37,608 21,628 24,723 — 77,665 67,369 878,676 808,145 123,771 118,831 524,382 488,562 648,153 607,393 (434,375 ) (423,382 ) 213,778 184,011 42,251 37,169 5,000 1,009 10,601 — 77,718 31,313 $ 1,228,024 $ 1,061,647 LIABILITIES AND SHAREHOLDERS’ EQUITY — $ 100,000 $ 2,653 — 146,743 113,248 187,671 126,781 44,355 32,651 81,228 75,494 76,512 79,688 75,730 53,744 639 2,604 615,531 584,210 7,837 5,509 — 937 4,600 — 100,000 100,000 727,968 690,656 — — 684 685 165,518 79,239 321,831 285,169 12,023 5,898 500,056 370,991 $ 1,228,024 $ 1,061,647 Assets December 31, 2014 December 31, 2013 Current Assets: Cash and cash equivalents $ 137,600 $ 92,248 Trade receivables, net 204,876 186,213 Inventories, net 565,685 417,948 Prepaid expenses and other 71,526 63,716 Income taxes receivable 2,691 12,217 Deferred tax assets 114,177 93,356 Total current assets 1,096,555 865,698 Property and equipment: Land, buildings and improvements 272,802 228,916 Equipment and tooling 826,997 701,101 1,099,799 930,017 Less: accumulated depreciation (544,371 ) (474,850 ) Property and equipment, net 555,428 455,167 Investment in finance affiliate 89,107 69,217 Deferred tax assets 41,201 18,616 Goodwill and other intangible assets, net 223,966 229,708 Other long-term assets 68,678 47,082 Total assets $ 2,074,935 $ 1,685,488 Liabilities and Shareholders' Equity Current liabilities: Current portion of capital lease obligations $ 2,528 $ 3,281 Accounts payable 343,470 238,044 Accrued expenses: Compensation 102,379 143,504 Warranties 53,104 52,818 Sales promotions and incentives 138,630 123,089 Dealer holdback 120,093 100,600 Other 79,262 77,480 Income taxes payable 11,344 9,254 Total current liabilities 850,810 748,070 Long-term income taxes payable 10,568 14,292 Capital lease obligations 23,620 3,842 Long-term debt 200,000 280,500 Deferred tax liabilities 18,191 25,028 Other long-term liabilities 96,951 69,730 Total liabilities $ 1,200,140 $ 1,141,462 Deferred compensation 13,528 8,421 Shareholders’ equity: Preferred stock $0.01 par value, 20,000 shares authorized, no shares issued and outstanding — — Common stock $0.01 par value, 160,000 shares authorized, 66,307 and 65,623 shares issued and outstanding, respectively $ 663 $ 656 Additional paid-in capital 486,005 360,616 Retained earnings 401,840 155,572 Accumulated other comprehensive income (loss), net (27,241 ) 18,761 Total shareholders’ equity 861,267 535,605 Total liabilities and shareholders’ equity $ 2,074,935 $ 1,685,488 Shares outstanding, common stock, additional paid-in-capital, retained earnings and per share datahave been adjusted to give effect to the two-for-one stock split declared on July 20, 2011, paid onSeptember 12, 2011 to shareholdersrecord on September 2, 2011.POLARIS INDUSTRIES INC.CONSOLIDATED STATEMENTS OF INCOME(In thousands, except per share data) For the Years Ended December 31, 2011 2010 2009 $ 2,656,949 $ 1,991,139 $ 1,565,887 1,916,366 1,460,926 1,172,668 740,583 530,213 393,219 178,725 142,353 111,137 105,631 84,940 62,999 130,395 99,055 71,184 414,751 326,348 245,320 24,092 16,856 17,071 349,924 220,721 164,970 3,987 2,680 4,111 — (825 ) 8,952 (689 ) 325 733 346,626 218,541 151,174 119,051 71,403 50,157 $ 227,575 $ 147,138 $ 101,017 $ 3.31 $ 2.20 $ 1.56 $ 3.20 $ 2.14 $ 1.53 68,792 66,900 64,798 71,057 68,765 66,148 For the Years Ended December 31, 2014 2013 2012 Sales $ 4,479,648 $ 3,777,068 $ 3,209,782 Cost of sales 3,160,470 2,656,189 2,284,485 Gross profit 1,319,178 1,120,879 925,297 Operating expenses: Selling and marketing 314,449 270,266 210,367 Research and development 148,458 139,193 127,361 General and administrative 203,248 179,407 143,064 Total operating expenses 666,155 588,866 480,792 Income from financial services 61,667 45,901 33,920 Operating income 714,690 577,914 478,425 Non-operating expense (income): Interest expense 11,239 6,210 5,932 Equity in loss of other affiliates 4,124 2,414 179 Other expense (income), net 10 (5,139 ) (7,529 ) Income before income taxes 699,317 574,429 479,843 Provision for income taxes 245,288 193,360 167,533 Net income from continuing operations 454,029 381,069 312,310 Loss from discontinued operations, net of tax — (3,777 ) — Net income $ 454,029 $ 377,292 $ 312,310 Basic net income per share: Continuing operations $ 6.86 $ 5.56 $ 4.54 Loss from discontinued operations — (0.05 ) — Basic net income per share $ 6.86 $ 5.51 $ 4.54 Diluted net income per share: Continuing operations $ 6.65 $ 5.40 $ 4.40 Loss from discontinued operations — (0.05 ) — Diluted net income per share $ 6.65 $ 5.35 $ 4.40 Weighted average shares outstanding: Basic 66,175 68,535 68,849 Diluted 68,229 70,546 71,005 Shares outstanding and per share data have been adjusted to give effect to the two-for-one stock split declared onJuly 20, 2011, paid on September 12, 2011 to shareholdersSHAREHOLDERS’EQUITY AND COMPREHENSIVE INCOMEthousands, except per share data) Number
of Shares Common
Stock Additional
Paid-
In Capital Retained
Earnings Accumulated Other
Comprehensive
Income (Loss) Total 64,984 $ 650 — $ 140,234 $ (3,857 ) $ 137,027 62 1 10,225 10,226 472 4 4,729 4,733 (410 ) (410 ) (50,177 ) (50,177 ) (222 ) (2 ) (4,554 ) (4,556 ) 101,017 115 6,675 (382 ) 273 107,698 65,296 653 9,990 191,074 2,824 204,541 308 3 18,049 18,052 4,066 41 68,064 68,105 10,610 10,610 (53,043 ) (53,043 ) (1,202 ) (12 ) (27,474 ) (27,486 ) 147,138 3,131 382 (439 ) 150,212 68,468 685 79,239 285,169 5,898 370,991 290 3 20,545 20,548 2,280 22 45,632 45,654 23,120 23,120 (61,585 ) (61,585 ) (2,608 ) (26 ) (3,018 ) (129,328 ) (132,372 ) 227,575 2,554 3,571 233,700 68,430 $ 684 $ 165,518 $ 321,831 $ 12,023 $ 500,056 For the Years Ended December 31, 2014 2013 2012 Net income $ 454,029 $ 377,292 $ 312,310 Other comprehensive income (loss), net of tax: Foreign currency translation adjustments, net of tax benefit (expense) of $65, $1,841, and ($182) (44,371 ) 4,913 4,124 Unrealized gain (loss) on derivative instruments, net of tax benefit (expense) of $970, ($950), and $2,325 (1,631 ) 1,610 (3,909 ) Comprehensive income $ 408,027 $ 383,815 $ 312,525 Shares outstanding, common stock, additional paid-in-capital, retained earnings and per share datahave been adjusted to give effect to the two-for-one stock split declared on July 20, 2011, paid onSeptember 12, 2011 to shareholdersrecord on September 2, 2011.POLARIS INDUSTRIES INC.CONSOLIDATED STATEMENTS OF CASH FLOWS(In thousands) For the Year Ended
December 31, 2011 2010 2009 $ 227,575 $ 147,138 $ 101,017 — (825 ) 8,952 66,390 66,519 64,593 20,548 18,052 10,226 (4,444 ) (4,574 ) (4,021 ) 133 1,376 382 (16,946 ) (16,888 ) 13,573 (23,120 ) (10,610 ) 410 (23,115 ) 1,111 8,192 (49,973 ) (56,612 ) 42,997 27,232 37,580 (40,329 ) 80,668 107,363 (24,759 ) (1,343 ) 7,033 7,325 (1,075 ) 956 4,643 302,530 297,619 193,201 (84,484 ) (55,718 ) (43,932 ) (12,588 ) (9,173 ) (3,007 ) 11,950 17,910 17,261 (5,000 ) — — 876 9,061 — (51,899 ) (4,738 ) — (141,145 ) (42,118 ) (29,678 ) 100,000 — 364,000 (202,333 ) — (364,000 ) (132,372 ) (27,486 ) (4,556 ) (61,585 ) (53,043 ) (50,177 ) 23,120 10,610 (410 ) 45,654 68,105 4,733 (227,516 ) (1,814 ) (50,410 ) (2,460 ) — — (68,591 ) 253,687 113,113 393,927 140,240 27,127 $ 325,336 $ 393,927 $ 140,240 $ 3,350 $ 2,813 $ 3,966 $ 132,088 $ 81,142 $ 29,039 Number
of Shares Common
Stock Additional
Paid-
In Capital Retained
Earnings Accumulated Other
Comprehensive
Income (loss) Total Balance, December 31, 2011 68,430 $ 684 $ 165,518 $ 321,831 $ 12,023 $ 500,056 Employee stock compensation 174 2 35,418 — — 35,420 Proceeds from stock issuances under employee plans 1,692 17 41,679 — — 41,696 Tax effect of exercise of stock options — — 29,892 — — 29,892 Cash dividends declared ($1.48 per share) — — — (101,534 ) — (101,534 ) Repurchase and retirement of common shares (1,649 ) (17 ) (3,992 ) (123,516 ) — (127,525 ) Net income — — — 312,310 — 312,310 Other comprehensive income — — — — 215 215 Balance, December 31, 2012 68,647 686 268,515 409,091 12,238 690,530 Employee stock compensation 264 3 57,890 — — 57,893 Deferred compensation — — (4,358 ) (4,063 ) — (8,421 ) Proceeds from stock issuances under employee plans 1,049 10 26,912 — — 26,922 Tax effect of exercise of stock options — — 28,621 — — 28,621 Cash dividends declared ($1.68 per share) — — — (113,722 ) — (113,722 ) Repurchase and retirement of common shares (4,337 ) (43 ) (16,964 ) (513,026 ) — (530,033 ) Net income — — — 377,292 — 377,292 Other comprehensive income — — — — 6,523 6,523 Balance, December 31, 2013 65,623 656 360,616 155,572 18,761 535,605 Employee stock compensation 254 3 63,180 — — 63,183 Deferred compensation — — (3,020 ) (2,087 ) — (5,107 ) Proceeds from stock issuances under employee plans 984 10 31,303 — — 31,313 Tax effect of exercise of stock options — — 36,966 — — 36,966 Cash dividends declared ($1.92 per share) — — — (126,908 ) — (126,908 ) Repurchase and retirement of common shares (554 ) (6 ) (3,040 ) (78,766 ) — (81,812 ) Net income 454,029 — 454,029 Other comprehensive income (loss) — — — — (46,002 ) (46,002 ) Balance, December 31, 2014 66,307 $ 663 $ 486,005 $ 401,840 $ (27,241 ) $ 861,267 For the Year Ended December 31, 2014 2013 2012 Operating Activities: Net income $ 454,029 $ 377,292 $ 312,310 Loss from discontinued operations — 3,777 — Adjustments to reconcile net income to net cash provided by operating activities: Depreciation and amortization 127,507 92,100 70,580 Noncash compensation 63,183 57,893 35,420 Noncash income from financial services (18,645 ) (4,983 ) (3,899 ) Deferred income taxes (50,388 ) (5,892 ) (28,901 ) Tax effect of share-based compensation exercises (36,966 ) (28,621 ) (29,892 ) Other, net 6,124 7,414 179 Changes in operating assets and liabilities: Trade receivables (24,174 ) (54,055 ) 2,413 Inventories (158,476 ) (52,049 ) (36,029 ) Accounts payable 105,783 51,519 21,371 Accrued expenses 30,664 53,278 39,269 Income taxes payable/receivable 45,324 33,398 51,120 Prepaid expenses and others, net (14,695 ) (31,919 ) (17,831 ) Cash provided by continuing operations 529,270 499,152 416,110 Cash used for discontinued operations — (6,912 ) — Net cash provided by operating activities 529,270 492,240 416,110 Investing Activities: Purchase of property and equipment (205,079 ) (251,401 ) (103,083 ) Investment in finance affiliate (32,582 ) (19,251 ) (18,400 ) Distributions from finance affiliate 31,337 12,005 7,562 Investment in other affiliates (12,445 ) (10,934 ) (7,996 ) Acquisition of businesses, net of cash acquired (28,013 ) (137,104 ) (41,135 ) Net cash used for investing activities (246,782 ) (406,685 ) (163,052 ) Financing Activities: Borrowings under debt arrangements / capital lease obligations 2,146,457 776,669 2,437 Repayments under debt arrangements / capital lease obligations (2,228,587 ) (597,492 ) (7,478 ) Repurchase and retirement of common shares (81,812 ) (530,033 ) (127,525 ) Cash dividends to shareholders (126,908 ) (113,722 ) (101,534 ) Proceeds from stock issuances under employee plans 31,313 26,922 41,696 Tax effect of proceeds from share-based compensation exercises 36,966 28,621 29,892 Net cash used for financing activities (222,571 ) (409,035 ) (162,512 ) Impact of currency exchange rates on cash balances (14,565 ) (1,287 ) 1,133 Net increase (decrease) in cash and cash equivalents 45,352 (324,767 ) 91,679 Cash and cash equivalents at beginning of period 92,248 417,015 325,336 Cash and cash equivalents at end of period $ 137,600 $ 92,248 $ 417,015 Noncash Activity: Property and equipment obtained through capital leases $ 24,908 $ — $ — Supplemental Cash Flow Information: Interest paid on debt borrowings $ 11,259 $ 6,076 $ 5,932 Income taxes paid $ 261,550 $ 162,647 $ 143,510 (“ORV”)(ORV), Snowmobiles, and On-Road Vehicles, including motorcyclesMotorcycles and Small Electric Vehicles.Vehicles (SV). Polaris products, together with related parts, garments and accessories are sold worldwide through a network of independent dealers and distributors and its subsidiaries located insubsidiaries. The primary markets for our products are the United States, Canada, France, the United Kingdom,Western Europe, Australia Norway, Sweden, Germany, Spain, China, India and Brazil.presentation:presentation. The accompanying consolidated financial statements include the accounts of Polaris and its wholly-owned subsidiaries. All inter-company transactions and balances have been eliminated in consolidation. Income from financial services is reported as a component of operating income to better reflect income from ongoing operations, of which financial services has a significant impact.During the 2011 third quarter, the Board of Directors declared a two-for-one split of the Company’s outstanding shares of Common Stock. 12, 2011, Polaris shareholders received one additional share2, 2004, the Company announced its decision to discontinue the manufacture of Common Stockmarine products effective immediately. Material financial results for each share they held of record at the close of business on September 2, 2011. All amounts, including shares and per share information, have been adjusted to give effect to the two-for-one stock split.(“ASC”)(ASC) Topic 810. This Topic requires management to evaluate whether an entity or interest is a variable interest entity and whether the company is the primary beneficiary. Polaris used the guidelines to analyze the Company’s relationships, including theits relationship with Polaris Acceptance, and concluded that there were no variable interest entities requiring consolidation by the Company in 2011, 20102014, 2013 and 2009.During 2011,2012.three acquisitions: Indian Motorcycle Company in April, 2011; Global Electric Motorcars LLC (“GEM”an acquisition of Kolpin Outdoors, Inc. ("Kolpin") in June, 2011;, and Goupil Industries S.A. (“Goupil”) in November 2011. The purchase prices totaled approximately $51,899,000,2014, completed the acquisition of which approximately $16,482,000 was allocated to goodwill, $31,106,000 to identifiable intangiblecertain assets of LSI Products Inc. and $4,311,000 to assumed tangible assets, net of liabilities.Armor Holdings, LLC. ("Pro Armor"). Kolpin is a leading aftermarket brand delivering purpose-built and universal-fit ORV accessories and lifestyle products. Pro Armor is an industry-leading brand in performance side-by-side accessories, that operates under the Pro Armor brand. The Company has included the financial results of thesethe acquisitions in its consolidated results of operations beginning on the respective acquisition dates in accordance with ASC 805,Business Combinations;dates; however, the impact of these acquisitions combined, did not have a material impact on Polaris’ consolidated financial position or results of operations. Refer to Note 5 for additional information regarding the acquisitions of Kolpin and Pro Armor.Reclassifications:Certain reclassifications of previously reported balance sheet amounts have been made to conform to the current year presentation. The reclassifications had no impact on operations as previously reported.Fair value measurements:ASC Topic 820 defines fair value as the exchange price that would be received for an asset or paid to transfer a liability (an exit price) in the principal or most advantageous market for the asset or liability in an orderly transaction between market participants on the measurement date. This Topic also establishes a fair value hierarchy which requires classification based on observable and unobservable inputs when measuring fair value. There are three levelsconsolidated statements of inputs that may be used to measure fair value:Level 1 — Quoted prices in active markets for identicalincome, current assets or liabilities.Level 2 — Observable inputs other than Level 1 prices such as quoted prices for similar assets or liabilities; quoted prices in markets that are not active; or other inputs that are observable or can be corroborated by observable market data for substantially the full term of the assets or liabilities.Level 3 — Unobservable inputs that are supported by little or no market activity and that are significant to the fair value of the assets or liabilities.The Company utilizes the market approach to measure fair value for its non-qualified deferred compensation assets, and the income approach for the interest rate swap agreements, foreign currency contracts and commodity contracts. The market approach uses prices and other relevant information generated by market transactions involving identical or comparable assets orcurrent liabilities and for the income approach the Company uses significant other observable inputs to value its derivative instruments used to hedge interest rate volatility, foreign currency and commodity transactions. Assets and liabilities measured at fair value on a recurring basis are summarized below (in thousands): Fair Value Measurements as of
December 31, 2011 Total Level 1 Level 2 Level 3 $ 3,639 $ 3,639 — — 3,578 — $ 3,578 — (1,337 ) — (1,337 ) — $ 5,880 $ 3,639 $ 2,241 — Fair Value Measurements as of
December 31, 2010 Total Level 1 Level 2 Level 3 $ 2,124 $ 2,124 — — (126 ) — $ (126 ) — (2,019 ) — (2,019 ) — 889 — 889 — $ 868 $ 2,124 $ (1,256 ) — Investment in finance affiliate:The caption Investment in finance affiliate in the consolidated balance sheets, represents Polaris’ 50 percent equity interest in Polaris Acceptance, a partnership agreement between GE Commercial Distribution Finance Corporation (“GECDF”) and one of Polaris’ wholly-owned subsidiaries. Polaris Acceptance provides floor plan financing to Polaris dealers in the United States. Polaris’ investment in Polaris Acceptance is accounted for under the equity method, and is recorded as investments in finance affiliate in the consolidated balance sheets. Polaris’ allocable share of the income of Polaris Acceptance and the Securitized Receivables has been included as a component of income from financial services in the consolidated statements of income. Refer to Note 7 for additional information regarding Polaris’ investment in Polaris Acceptance.previously reported.Investment in other affiliates:The caption Investments in other affiliates in the consolidated balance sheets for the period ended December 31, 2011 represents the Company’s October 2011 investment in Brammo, Inc., a privately held manufacturer of electric motorcycles. This investment represents a minority interest in Brammo and is accounted for under the cost method. The amount recorded as of December 31, 2010 represents the Company’s 40 percent equity ownership in Robin Manufacturing, U.S.A. (“Robin”), which assembled engines in the United States for recreational and industrial products. The Robin operations were closed during 2011 as the production volumes of engines made by Robin had declined significantly in recent years.(Gain) Loss on Securities Available for Sale: The net gain of $825,000 in 2010 on securities available for sale resulted from a $1,594,000 gain on the sale of our remaining investment in KTM during the 2010 third quarter offset by a related non-cash impairment charge of $769,000 during the 2010 second quarter. In the first quarter 2009, we recorded a non-cash impairment charge on securities held for sales of $8,952,000 from the decline in the fair value of the KTM shares owned by Polaris as of March 31, 2009, when it was determined that the decline in the fair value of the KTM shares owned by the Company was other than temporary.estimates:estimates. The preparation of financial statements in conformity with accounting principles generally accepted in the United States requires management to make estimates and assumptions that affect the reported amounts of assets and liabilities and disclosure of contingent assets and liabilities at the date of the financial statements and the reported amounts of revenues and expenses during the reporting period. Ultimate results could differ from those estimates. Fair Value Measurements as of December 31, 2014 Asset (Liability) Total Level 1 Level 2 Level 3 Non-qualified deferred compensation assets $ 41,797 $ 41,797 — — Total assets at fair value $ 41,797 $ 41,797 — — Commodity contracts, net $ (4,609 ) — $ (4,609 ) Foreign exchange contracts, net (2,570 ) — (2,570 ) — Non-qualified deferred compensation liabilities (41,797 ) $ (41,797 ) — — Total liabilities at fair value $ (48,976 ) $ (41,797 ) $ (7,179 ) — Fair Value Measurements as of December 31, 2013 Asset (Liability) Total Level 1 Level 2 Level 3 Commodity contracts, net $ 30 — $ 30 — Non-qualified deferred compensation assets 24,711 $ 24,711 — — Total assets at fair value $ 24,741 $ 24,711 $ 30 — Foreign exchange contracts, net $ (9 ) — $ (9 ) — Non-qualified deferred compensation liabilities (24,711 ) $ (24,711 ) — — Total liabilities at fair value $ (24,720 ) $ (24,711 ) $ (9 ) — equivalents:equivalents. Polaris considers all highly liquid investments purchased with an original maturity of 90 days or less to be cash equivalents. Cash equivalents are stated at cost, which approximates fair value. Such investments consist principally of money market mutual funds.accounts:accounts. Polaris’ financial exposure to collection of accounts receivable is limited due to its agreements with certain finance companies. For receivables not serviced through these finance companies, the Company provides a reserve for doubtful accounts based on historical rates and trends. This reserve is adjusted periodically as information about specific accounts becomes available.Inventories:Inventories. Inventory costs include material, labor, and manufacturing overhead costs, including depreciation expense associated with the manufacture and distribution of the Company's products. Inventories are stated at the lower of cost (first-in, first-out method) or market. The major components of inventories are as follows (in thousands): December 31, 2011 2010 $ 61,296 $ 35,580 77,437 60,813 175,252 155,744 (15,943 ) (16,210 ) $ 298,042 $ 235,927 December 31, 2014 December 31, 2013 Raw materials and purchased components $ 165,823 $ 107,496 Service parts, garments and accessories 163,455 125,765 Finished goods 262,578 206,290 Less: reserves (26,171 ) (21,603 ) Inventories $ 565,685 $ 417,948 equipment:equipment. Property and equipment is stated at cost. Depreciation is provided using the straight-line method over the estimated useful life of the respective assets, ranging from 10-40 years for buildings and improvements and from 1-7 years for equipment and tooling. Depreciation of assets recorded under capital leases is included with depreciation expense. Fully depreciated tooling is eliminated from the accounting records annually.assets:assets. ASC Topic 350 prohibits the amortization of goodwill and intangible assets with indefinite useful lives. Topic 350 requires that these assets be reviewed for impairment at least annually. An impairment charge for goodwill is recognized only when the estimated fair value of a reporting unit, including goodwill, is less than its carrying amount. In accordance with Topic 350, the Company completed an impairment analysis as of December 31, 2011 and 2010. Refer to Note 45 for additional information regarding Goodwillgoodwill and other intangible assets.Development Expenses:development expenses. Polaris records research and development expenses in the period in which they are incurred as a component of operating expenses. In the years ended December 31, 2011, 2010, and 2009, Polaris incurred $105,631,000, $84,940,000, and $62,999,000, respectively.Expenses:expenses. Polaris records advertising expenses as a component of selling and marketing expenses in the period in which they are incurred. In the years ended December 31, 2011, 2010,2014, 2013, and 2009,2012, Polaris incurred $48,877,000, $40,833,000$82,600,000, $73,945,000, and $37,433,000,$58,752,000, respectively.Shipping and Handling Costs:Polaris records shipping and handling costs as a component of cost of sales at the time the product is shipped.warranties:warranties. Polaris provides a limited warranty for its ORVs for a period of six months, and for a period of one year for its snowmobiles, for a period of one or two years for its motorcycles depending on brand and motorcyclesmodel year, and for a two year period for SEVs.SVs. Polaris provides longer warranties in certain geographical markets as determined by local regulations and market conditions and may also provide longer warranties related to certain promotional programs. Polaris’ standard warranties require the Company or its dealers to repair or replace defective products during such warranty periods at no cost to the consumer. The warranty reserve is established at the time of sale to the dealer or distributor based on management’s best estimate using historical rates and trends. Adjustments to the warranty reserve are made from time to time as actual claims become known in order to properly estimate the amounts necessary to settle future and existing claims on products sold as of the balance sheet date. Factors that could have an impact on the warranty accrual in any given yearperiod include the following: improved manufacturing quality, shifts in product mix, changes in warranty coverage periods, snowfall and its impact on snowmobile usage, product recalls and any significant changes in sales volume.yearsperiods presented iswas as follows (in thousands): For the Year Ended December 31, 2011 2010 2009 $ 32,651 $ 25,520 $ 28,631 2,727 — — 46,217 43,721 40,977 (37,240 ) (36,590 ) (44,088 ) $ 44,355 $ 32,651 $ 25,520 For the Years Ended December 31, 2014 2013 2012 Balance at beginning of year $ 52,818 $ 47,723 $ 44,355 Additions to warranty reserve through acquisitions 160 1,602 900 Additions charged to expense 61,888 56,857 46,088 Warranty claims paid (61,762 ) (53,364 ) (43,620 ) Balance at end of year $ 53,104 $ 52,818 $ 47,723 Sales promotions and incentives:Polaris provides for estimated sales promotion and incentive expenses, which are recognized as a reduction to sales, at the time of sale to the dealer or distributor. Examples of sales promotion and incentive programs include dealer and consumer rebates, volume incentives, retail financing programs and sales associate incentives. Sales promotion and incentive expenses are estimated based on current programs and historical rates for each product line. Actual results may differ from these estimates if market conditions dictate the need to enhance or reduce sales promotion and incentive programs or if the customer usage rate varies from historical trends. Polaris recorded accrued liabilities of $81,228,000 and $75,494,000 related to various sales promotions and incentive programs as of December 31, 2011 and 2010, respectively. Historically, sales promotion and incentive expenses have been within the Company’s expectations and differences have not been material.Dealer holdback programs: Dealer holdback represents a portion of the invoiced sales price that is expected to be subsequently returned to the dealer or distributor as a sales incentive upon the ultimate retail sale of the product. Holdback amounts reduce the ultimate net price of the products purchased by our dealers or distributors and, therefore, reduce the amount of sales we recognize at the time of shipment. The portion of the invoiced sales price estimated as the holdback is recognized as “dealer holdback” liability on our balance sheet until paid or forfeited. The minimal holdback adjustments in the estimated holdback liability due to forfeitures are recognized in net sales. Payments are made to dealers or distributors at various times during the year subject to previously established criteria. Polaris recorded accrued liabilities of $76,512,000 and $79,688,000, for dealer holdback programs in the consolidated balance sheets as of December 31, 2011 and 2010, respectively.Foreign currency translation:The functional currency for each of the Polaris foreign subsidiaries is their respective local currencies.The assets and liabilities in all Polaris foreign entities are translated at the foreign exchange rate in effect at the balance sheet date. Translation gains and losses are reflected as a component of Accumulated othercomprehensive income in the shareholders’ equity section of the accompanying consolidated balance sheets. Revenues and expenses in all of Polaris’ foreign entities are translated at the average foreign exchange rate in effect for each month of the quarter. Transaction gains and losses including intercompany transactions denominated in a currency other than the functional currency of the entity involved are included in “Other income (expense), net” on our Consolidated statements of income. The net Accumulated other comprehensive income related to translation gains and losses was a net gain of $9,545,000 and $6,991,000 at December 31, 2011 and 2010, respectively.Revenue recognition: Revenues are recognized at the time of shipment to the dealer or distributor or other customers. Product returns, whether in the normal course of business or resulting from repossession under its customer financing program (see Note 7), have not been material. Polaris sponsors certain sales incentive programs and accrues liabilities for estimated sales promotion expenses and estimated holdback amounts that are recognized as reductions to sales when products are sold to the dealer or distributor customer.compensation:compensation. For purposes of determining the estimated fair value of share-based payment awards on the date of grant under ASC Topic 718, Polaris uses the Black-Scholes Model. The Black-Scholes Model requires the input of certain assumptions that require judgment. Because employee stock options and restricted stock awards have characteristics significantly different from those of traded options, and because changes in the input assumptions can materially affect the fair value estimate, the existing models may not provide a reliable single measure of the fair value of the employee stock options or restricted stock awards. Management will continue to assess the assumptions and methodologies used to calculate estimated fair value of share-based compensation. Circumstances may change and additional data may become available over time, which could result in changes to these assumptions and methodologies and thereby materially impact the fair value determination. If factors change and the Company employs different assumptions in the application of Topic 718 in future periods, the compensation expense that was recorded under Topic 718 may differ significantly from what was recorded in the current period. Refer to Note 2 for additional information regarding share-based compensation.sensitive share-based awards, specifically long-term compensation grants of Long Term Incentive Plan and restricted stock.awards. Changes in the estimated rate of achievement and fluctuation in the market based stock price can have a significant effect on reported share-based compensation expenses as the effect of a change in the estimated achievement level and fluctuation in the market based stock price is recognized in the period that the likelihood factor and stock price changes. If adjustments in the estimated rate of achievement and fluctuation in the market based stock price are made, they would be reflected in our gross margin and operating expenses.Accounting for derivativeDerivative instruments and hedging activities:ASC Topic 815 requires that changesactivities. Changes in the derivative’s fair value beof a derivative are recognized currently in earnings unless specificthe derivative qualifies as a hedge. To qualify as a hedge, criteria are met, and requires that a companythe Company must formally document, designate and assess the effectiveness of transactions that receive hedge accounting. The net unrealized gain of the derivative instruments of $2,241,000 at December 31, 2011 and the net unrealized loss of $1,256,000 at December 31, 2010 were recorded in the accompanying balance sheets as other current assets or other current liabilities. Polaris’ derivative instruments consist of foreign exchange and commodity contracts discussed below. The after tax unrealized gains of $2,478,000 and losses of $1,093,000 as of December 31, 2011 and 2010, respectively, were recorded as components of Accumulated other comprehensive income. The Company’s diesel fuel and aluminum contracts in 2011 and 2010 did not meet the criteria for hedge accounting and therefore, the resulting unrealized gains and losses from those contracts are included in the consolidated statements of income in Cost of sales. The unrealized gains for the diesel fuel contracts for 2011 and 2010 totaled $160,000 and $282,000, respectively, pretax, and the unrealized losses for the aluminum contracts for 2011 and gains for 2010 totaled $1,497,000 and $607,000, respectively, pretax. Refer to Note 10 for additional information regarding Derivative Instruments and Hedging Activities.Interest rate swap agreements:At December 31, 2011, Polaris did not have any outstanding interest rate swaps.Foreign exchange contracts:offrom certain of its purchase commitments denominated in foreign currencies and transfers of funds from time to time from its foreign subsidiaries. Polaris does not use any financial contracts for trading purposes. These contracts met the criteria for cash flow hedges. Gains and losses on the Canadian dollar, Norwegian Krone, Swedish Krona and Australian dollar contracts at settlement are recorded in Non-operatingnon-operating other expense (income). Gains in the consolidated income statements, and gains and losses on the Japanese yen, Mexican peso and Euro contracts at settlement are recorded in Costcost of sales.sales in the consolidated income statements. Unrealized gains orand losses after tax, are recorded as a component of Accumulatedaccumulated other comprehensive income in Shareholders’ Equity. The fair value of the foreign exchange contracts was a net asset of $3,578,000 as of December 31, 2011 and a net liability of $2,019,000 as of December 31, 2010.Commodity derivative contracts:(loss).20112014 and 2010,2013, the Company entered into derivative contracts to hedge a portion of the exposure for diesel fuel and aluminum. TheseThe Company's diesel fuel and aluminum hedging contracts diddo not meet the criteria for hedge accounting and therefore, the resulting unrealized gains and losses from those contracts are included in the consolidated statements of income in cost of sales. Refer to Note 11 for additional information regarding derivative instruments and hedging activities.consolidated statementaccompanying balance sheets as other current assets or other current liabilities.incomethe Polaris foreign subsidiaries is their respective local currencies. The assets and liabilities in all Polaris foreign entities are translated at the foreign exchange rate in effect at the balance sheet date. Translation gains and losses are reflected as a component of Cost of sales. The fair valueaccumulated other comprehensive income (loss) in the shareholders’ equity section of the commodity derivative contracts wasaccompanying consolidated balance sheets. Revenues and expenses in all of Polaris’ foreign entities are translated at the average foreign exchange rate in effect for each month of the quarter. Transaction gains and losses including intercompany transactions denominated in a currency other than the functional currency of the entity involved are included in other expense (income), net liabilityin our consolidated statements of $1,337,000 as of December 31, 2011 and a net asset of $889,000 as of December 31, 2010.income.income:income. Components of comprehensive income include net income, foreign currency translation adjustments, and unrealized gains or losses on derivative instruments, and unrealized gains or losses on securities held for sale, net of tax.instruments. The Company has chosen to disclose comprehensive income in the accompanyingseparate consolidated statements of shareholders’ equity and comprehensive income.pronouncements:pronouncements. In June 2011,May 2014, the Financial Accounting Standards Board (FASB) issued Accounting Standards Update (ASU) No. 2011-05, “Comprehensive Income (Topic 220): Presentation2014-09, Revenue from Contracts with Customers. This ASU is a comprehensive new revenue recognition model that requires a company to recognize revenue from the transfer of Comprehensive Income”. The ASU amends guidancegoods or services to customers in an amount that reflects the consideration that the entity expects to receive in exchange for the presentation of comprehensive income. The amended guidance requires an entitythose goods or services. Polaris is required to present components of net income and other comprehensive income in one continuous statement, referred to as the statement of comprehensive income, or in two separate, but consecutive statements. The current option to report other comprehensive income and its components in the statement of shareholders’ equity will be eliminated. Althoughadopt the new guidance changespronouncement on January 1, 2017 using one of two retrospective application methods. The Company is evaluating the presentationapplication method and the impact of comprehensive income, therethis new standard on the financial statements.changes to the componentsother new accounting pronouncements that are recognized in net income or other comprehensive income under existing guidance. This ASUs is effective for the Company in the first quarter of 2012 and retrospective application will be required. This ASU will change the Company’s financial statement presentation of comprehensive income, but will not impact net income, financial position, or cash flows.In September 2011, the FASB issued ASU 2011-08, “Intangibles–Goodwill and Other (Topic 350): Testing Goodwill for Impairment”. This standard simplifies how entities test goodwill for impairment by permitting entities to first assess qualitative factors to determine whether it is more likely than not that the fair value of a reporting unit is less than its carrying amount as a basis for determining whether it is necessary to perform the two-step goodwill impairment test. The ASU is effective for the Company in the first quarter of 2012. The Company does not expect adoptionexpected to have ana significant impact on itsPolaris' consolidated financial statements.Employee Compensationplans:Polaris maintains an Omnibus Incentive Plan (“Omnibus Plan”) under which theplans. The Company grants long-term equity-based incentives and rewards for the benefit of its employees and directors and consultants,under the shareholder approved Polaris Industries Inc. 2007 Omnibus Incentive Plan (as amended) (the “Omnibus Plan”), which were previously provided under several separate incentive and compensatory plans. Upon approval by the shareholders of the Omnibus Plan in April 2007, the Polaris Industries Inc. 1995 Stock Option(“Broad Based Plan”), the Restricted Stock Plan (“Restricted Plan”) and the 2003 Non-Employee Director Stock Option Plan (“Director Stock Option Plan” and collectively with the Option Plan, Restricted Plan and Broad Based Plan, the “Prior Plans”) were frozen and no further grants or awards have since been or will be made under such plans. A maximum of 13,500,000 shares of common stockcancelledcanceled or forfeited under the Prior Plans.106,000138,000 deferred stock units to its non-employee directors under the Omnibus Plan since 2007 (16,000, 20,000(9,000, 12,000 and 32,00012,000 in 2011, 20102014, 2013 and 2009,2012, respectively) which will be converted into common stock when the director’s board service ends or upon a change in control. Restricted shares awarded under the Omnibus Plan to date generally contain restrictions, which lapse after a two to four year period if Polaris achieves certain performance measures.Under the for a maximum of 16,400,000 shares of common stock could be issued to certain employees. Options granted to date generally vest three years from the award date and expire after ten years.Under the Broad Based Plan, incentive stock options for a maximum of 1,400,000 shares of common stock could be issued to substantially all Polaris employees. Options with respect to 1,350,800 shares of common stock were granted under this plan during 1999 at an exercise price of $7.89 and of the options initially granted under the Broad Based Plan, an aggregate of 1,036,800 vested in March 2002. This plan and any outstanding options expired in 2009.Under the Restricted Plan, a maximum of 4,700,000 shares of common stock could be awarded as an incentive to certain employees with no cash payments required from the recipient. The majority of the outstanding awards contain restrictions which lapse after a two to four year period if Polaris achieves certain performance measures.Under the Director Stock Option Plan, which is frozen and contains no unexercised awards as of December 31, 2014, was used to issue nonqualified stock options for a maximum of 400,000 shares of common stock could be issued to non-employee directors. Each non-employee director as of the date of the annual shareholders meetings through 2006 was granted an option to purchase 8,000 shares of common stock at a price per share equal to the fair market value as of the date of grant. Options became exercisable as of the date of the next annual shareholders meeting following the date of grant and must be exercised no later than 10 years from the date of grant.receive annual grants of common stock equivalents and may alsoannually elect to receive additional common stock equivalents in lieu of director’sdirector fees, which will be converted into common stock when board service ends. A maximum of 500,000 shares of common stock has been authorized under this plan of which 248,900101,000 equivalents have been earned and an additional 200,400381,000 shares have been issued to retired directors as of December 31, 2011.2014. As of December 31, 20112014 and 2010,2013, Polaris’ liability under the plan totaled $13,933,000$15,217,000 and $8,992,000,$17,031,000, respectively.Long Term Incentive Planlong term incentive program under which awards are issued to provide incentives for certain employees to attain and maintain the highest standards of performance and to attract and retain employees of outstanding competence and ability with no cash payments required from the recipient. The awards areAwards granted through 2011 were paid in cash and arewere based on certain Company performance measures that are measured over a period of three consecutive calendar years. At the beginning of the plan cycle, participants havehad the option to receive a cash value at the time of awards or a cash value tied to Polaris stock price movement over the three year plan cycle. At December 31, 2011 and 2010,2013, Polaris’ liability under the plan totaled $93,765,000$57,166,000, and $49,745,000, respectively.expense:expense. The amount of compensation cost for share-based awards to be recognized during a period is based on the portion of the awards that are ultimately expected to vest. The Company estimates stock option forfeitures at the time of grant and revises those estimates in subsequent periods if actual forfeitures differ from those estimates. The Company analyzes historical data to estimate pre-vesting forfeitures and records share compensation expense for those awards expected to vest.follows: For the Year Ended
December 31, (In thousands) 2011 2010 2009 $ 9,948 $ 6,132 $ 4,653 63,872 52,807 12,354 73,820 58,939 17,007 27,929 23,039 6,620 $ 45,891 $ 35,900 $ 10,387 For the Years Ended December 31, 2014 2013 2012 Option plan $ 24,428 $ 22,245 $ 16,497 Other share-based awards 26,574 57,640 56,770 Total share-based compensation before tax 51,002 79,885 73,267 Tax benefit 19,039 29,835 27,401 Total share-based compensation expense included in net income $ 31,963 $ 50,050 $ 45,866 Costcost of sales and Operatingoperating expenses in the accompanying consolidated statements of income. For purposes of determining the estimated fair value of option awards on the date of grant under ASC Topic 718, Polaris has used the Black-Scholes option-pricing model. Assumptions utilized in the model are evaluated and revised, as necessary, to reflect market conditions and experience.2011,2014, there was $35,567,000$82,778,000 of total unrecognized share-based compensation expense related to unvested share-based equity awards. Unrecognized share-based compensation expense is expected to be recognized over a weighted-average period of 1.801.50 years. Included in unrecognized share-based compensation is approximately $28,997,000$36,746,000 related to stock options and $6,570,000$46,032,000 for restricted stock.information:information. The following summarizes stock option activity and the weighted average exercise price for the following plans for the each of the three years ended December 31, 2011, 20102014, 2013 and 2009:2012: Option Plan Omnibus Plan Broad Based Plan Director Stock Option Plan Outstanding
Shares Weighted
Average
Exercise
Price Outstanding
Shares Weighted
Average
Exercise
Price Outstanding
Shares Weighted
Average
Exercise
Price Outstanding
Shares Weighted
Average
Exercise
Price 6,811,698 $ 18.71 1,551,800 $ 20.70 73,600 $ 7.89 176,000 $ 23.03 — — 1,334,000 12.58 — — — — (331,652 ) 9.67 — — (67,998 ) 7.89 — — (40,800 ) 22.39 (48,000 ) 20.09 (5,602 ) 7.89 — — 6,439,246 $ 19.15 2,837,800 $ 16.89 — — 176,000 $ 23.03 — — 1,615,812 26.81 — — — — (3,951,986 ) 16.50 (6,000 ) 24.25 — — (72,000 ) $ 24.65 (13,500 ) 21.49 (138,800 ) 18.79 — — — — 2,473,760 $ 23.36 4,308,812 $ 20.54 — — 104,000 $ 21.91 — — 1,276,500 50.52 — — — — (1,373,414 ) 21.98 (865,875 ) 16.30 — — (16,000 ) $ 18.14 (1,800 ) 24.27 (36,700 ) 26.38 — — (8,000 ) $ 13.35 1,098,546 $ 25.08 4,682,737 $ 29.45 — — 80,000 $ 23.52 1,098,546 $ 25.08 4,480,067 $ 29.10 — — 80,000 $ 23.52 1,098,546 $ 25.08 819,725 $ 18.26 — — 80,000 $ 23.52 The following table summarizes information about stock options outstanding at December 31, 2011: Options Outstanding Options Exercisable Number
Outstanding at
12/31/11 Weighted Average
Remaining
Contractual Life Weighted
Average
Exercise Price Number
Exercisable at
12/31/11 Weighted
Average
Exercise Price 613,158 6.25 $ 10.77 246,158 $ 12.00 592,625 6.83 $ 16.79 326,925 $ 17.87 976,390 7.06 $ 22.15 329,838 $ 21.82 614,000 6.14 $ 22.57 224,000 $ 22.53 845,350 4.21 $ 26.11 801,350 $ 26.11 839,860 8.71 $ 29.98 — — 623,400 8.42 $ 37.77 70,000 $ 34.80 756,500 9.80 $ 58.82 — —
(Active)
(Frozen) Director Stock Option Plan
(Frozen) Outstanding
Shares Weighted
Average
Exercise
Price Outstanding
Shares Weighted
Average
Exercise
Price Outstanding
Shares Weighted
Average
Exercise
PriceBalance as of December 31, 2011 4,682,737 $ 29.45 1,098,546 $ 25.08 80,000 $ 23.52 Granted 570,700 66.19 — — — — Exercised (861,397 ) 22.54 (744,974 ) 25.84 (64,000 ) 22.62 Forfeited (61,630 ) 40.95 — — — — Balance as of December 31, 2012 4,330,410 $ 35.50 353,572 $ 23.47 16,000 $ 27.10 Granted 1,037,729 87.06 — — — — Exercised (821,679 ) 24.45 (191,141 ) 23.23 (16,000 ) 27.10 Forfeited (80,380 ) 47.55 — — — — Balance as of December 31, 2013 4,466,080 $ 49.29 162,431 $ 23.74 — — Granted 705,564 130.10 — — — — Exercised (866,917 ) 30.33 (96,398 ) 23.77 — — Forfeited (98,215 ) 65.14 (2,800 ) 22.43 — — Balance as of December 31, 2014 4,206,512 $ 66.38 63,233 $ 23.76 — — Vested or expected to vest as of December 31, 2014 4,206,512 $ 66.38 63,233 $ 23.76 — — Options exercisable as of December 31, 2014 1,640,169 $ 32.52 63,233 $ 23.76 — — was 7.18 yearsoutstanding and exercisable as of December 31, 2011.$18.44, $9.30,$39.97, $30.43, and $2.95$23.40 granted during the years ended December 31, 2011, 2010,2014, 2013, and 2009,2012, respectively: For the Year
Ended December 31, 2011 2010 2009 49 % 48 % 42 % 1.9 % 3.0 % 6.6 % 4.7 5.1 5.7 1.4 % 2.5 % 2.2 % For the Years Ended December 31, 2014 2013 2012 Weighted-average volatility 40 % 49 % 50 % Expected dividend yield 1.5 % 1.9 % 2.2 % Expected term (in years) 4.5 4.4 4.6 Weighted average risk free interest rate 1.6 % 0.9 % 0.7 % 20112014 was $77,736,000.$108,584,000. The total intrinsic value of options outstanding and of options outstanding and exercisable at December 31, 2011, 2010,2014, was $365,160,000 and 2009 was $67,466,000, $40,795,000, and $25,962,000,$202,788,000, respectively. The total intrinsic value at each of December 31, 2011, 2010 and 2009 isvalues are based on the Company’s closing stock price on the last trading day of the applicable year for in-the-money options.2011: Shares
Outstanding Weighted
Average
Grant Price 256,908 $ 21.44 175,340 $ 42.54 (8,000 ) $ 25.42 — — 424,248 $ 30.09 424,248 $ 30.09 Shares
Outstanding Weighted
Average
Grant PriceBalance as of December 31, 2013 770,967 $ 74.47 Granted 407,626 134.34 Vested (65,020 ) 50.29 Canceled/Forfeited (35,842 ) 87.12 Balance as of December 31, 2014 1,077,731 $ 98.15 Expected to vest as of December 31, 2014 895,243 $ 94.80 20112014 was $23,749,000.$135,396,000. The total intrinsic value at December 31, 2011 is based on the Company’s closing stock price on the last trading day of the year. The weighted averageRestricted StockOmnibus Plan for the years ended December 31, 2011, 2010,2014, 2013, and 20092012 were $42.54, $28.95,$134.34, $88.84, and $17.84,$70.12, respectively.employee stock ownership plan (“ESOP”)ESOP under which a maximum of 7,200,000 shares of common stock can be awarded. The shares are allocated to eligible participants accounts based on total cash compensation earned during the calendar year. Shares vest immediatelyAn employee's ESOP account vests equally after two and requirethree years of service and requires no cash payments from the recipient. Participants may instruct Polaris to pay respective dividends directly to the participant in cash or reinvest the dividends into the participants ESOP accounts. Substantially all employees are eligible to participate in the ESOP, with the exception of Company officers. Total expense related to the ESOP was $7,011,000, $8,123,000$10,789,000, $9,224,000, and $0,$7,380,000, in 2011, 20102014, 2013 and 2009,2012, respectively. As of December 31, 20112014 there were 4,659,0003,925,000 shares vestedheld in the plan.avarious defined contribution retirement plans covering substantially all U.S. employees. For the 401(k) defined contribution retirement savings plan under which eligible United Statescovers the majority of U.S. employees, may choose to contribute up to 50 percent of eligible compensation on a pre-tax basis, subject to certain IRS limitations. Thethe Company matches 100 percent of employee contributions up to a maximum of five percent of eligible compensation. MatchingAll contributions vest immediately. The cost of these defined contribution retirement plans was $12,486,000, $10,651,000, and $9,318,000, in 2014, 2013 and 2012, respectively.$8,456,000, $7,073,000, and $6,827,000, in 2011, 2010 and 2009, respectively. Average interest rate at December 31, 2014 Maturity December 31, 2014 December 31, 2013 Revolving loan facility — January 2018 — $ 80,500 Senior notes—fixed rate 3.81% May 2018 $ 25,000 25,000 Senior notes—fixed rate 4.60% May 2021 75,000 75,000 Senior notes—fixed rate 3.13% December 2020 100,000 100,000 Capital lease obligations 5.02% Various through 2029 26,148 7,123 Total debt and capital lease obligations $ 226,148 $ 287,623 Less: current maturities 2,528 3,281 Total long-term debt and capital lease obligations $ 223,620 $ 284,342 Note 3. Financingfinancing:financing. In August 2011, Polaris entered into a new $350,000,000$350,000,000 unsecured revolving loan facility. The new bank agreement expires inIn January 2013, Polaris amended the loan facility to provide more beneficial covenant and interest rate terms and extend the expiration date from August 2016.2016 to January 2018. Interest is charged at rates based on LIBOR or “prime.” The agreement also requires Polaris to maintain certain financial ratios including minimum interest coverage and a maximum leverage ratio. Polaris was in compliance with each of the covenants as of December 31, 2011. There were no borrowings under this revolving loan facility at December 31, 2011. Prior to August 2011, Polaris was a party to an unsecured bank agreement comprised of a $250,000,000 revolving loan facility for working capital needs. As part of the previous bank agreement, the Company had a $200,000,000 term loan outstanding at December 31, 2010, which was paid off in its entirety in May 2011 with the issuance of the Senior Notes described below and $100,000,000 of cash on hand.$25,000,000$25,000,000 of 3.81 percent unsecured senior notes due May 2018 and $75,000,000$75,000,000 of 4.60 percent unsecured senior notes due May 2021 (collectively, the “Senior Notes”). The Senior Notes were issued in May 2011.The In December 2013, the Company entered into and settled an interest rate lock contract in November 2009 in connection with thea First Supplement to Master Note Purchase Agreement. Agreement, under which the Company issued $100,000,000 of unsecured senior notes due December 2020.rate lock settlement resultedcoverage and maximum leverage ratios. Polaris was in a $251,000 gain, netcompliance with all such covenants as of deferred taxes of $149,000, which will be amortized into income over the life of the related debt.December 31, 2014. 2011 2010 2009 $ 100,000 $ 200,000 $ 200,000 $ 133,800 $ 200,000 $ 268,100 $ 200,000 $ 200,000 $ 345,000 4.40 % 0.65 % 0.79 % 2014 2013 2012 Total borrowings at December 31 $ 200,000 $ 280,500 $ 100,000 Average outstanding borrowings during year $ 361,715 $ 138,400 $ 100,000 Maximum outstanding borrowings during year $ 500,000 $ 411,000 $ 100,000 Interest rate at December 31 3.77 % 2.98 % 4.40 % amountsamount of the Company’s long-term debt approximates its fair valevalue as December 31, 20112014 and 2010.Capital Leases: With the acquisition of Goupil in late 2011, the Company assumed capital lease obligations related to certain lease agreements entered into by Goupil. These transactions are classified as capital lease obligations and recorded at fair value. As of December 31, 2011 the Company’s capital lease obligations totaled $7,253,000, which includes $2,653,000 classified as a current liability.credit:credit. At December 31, 2011,2014, Polaris had open letters of credit totaling approximately $4,496,000.$24,894,000. The amounts outstandingare primarily related to inventory purchases and are reduced as inventorythe purchases pertaining to the contracts are received.programs:programs. Certain finance companies, including Polaris Acceptance, an affiliate (see Note 7)8), provide floor plan financing to dealers on the purchase of Polaris products. The amount financed by worldwide dealers under these arrangements at December 31, 2011,2014, was approximately $731,319,000.$1,337,214,000. Polaris has agreed to repurchase products repossessed by the finance companies up to an annual maximum of no more than 15 percent of the average month-end balances outstanding during the prior calendar year. Polaris’ financial exposure under these arrangements is limited to the difference between the amount paid to the finance companies for repurchases and the amount received on the resale of the repossessed product. No material losses have been incurred under these agreements during the periods presented. As a part of its marketing program, Polaris contributes to the cost of dealer financing up to certain limits and subject to certain conditions. Such expenditures are included as an offset to Salessales in the accompanying consolidated statements of income.4.5. Goodwill and Other Intangible AssetsGoodwill and other intangible assets:analysesthe annual impairment test as of December 31,2011 2014 and 2010.2013. The results of the analysesimpairment test indicatedexisted.existed as of the test date. The Company has had no historical impairments of goodwill. In accordance with Topic 350, the Company will continue to complete an impairment analysis on an annual basis.basis or more frequently if an event or circumstance that would more likely than not reduce the fair value of a reporting unit below its carrying amount occurs. Goodwill and other intangible assets, net, consist of $44,668,000$123,031,000 and $28,354,000$126,697,000 of goodwill and $33,050,000$100,935,000 and $2,959,000$103,011,000 of intangible assets, net of accumulated amortization, for the periods ended December 31, 20112014 and December 31, 2010,2013, respectively.20112014 relate primarily to the acquisition of Indian Motorcycle Company, GEMKolpin Outdoors, Inc. ("Kolpin") in April 2014, and Goupil during 2011. Goodwill associated with thesethe acquisition of certain assets of LSI Products Inc. and Armor Holdings, LLC. (collectively, "Pro Armor") in November 2014. Kolpin is a leading aftermarket brand delivering purpose-built and universal-fit ORV accessories and lifestyle products. Pro Armor is an industry-leading brand in performance side-by-side accessories.is tax deductible. Financial results for each of the above acquisitions are included in the Company’s consolidated results from the date of acquisition. Pro forma financial results are not presented as the acquisitions are not material, individually or in the aggregate. Therespective aggregate Goupil purchase price was allocated on a preliminary basis to the assets acquired and liabilities assumed based on their estimated fair values at the date of acquisition. Kolpin and Pro Armor's financial results are included in the Company’s consolidated results from the respective dates of acquisition. Pro forma financial results are not presented as the acquisitions are not material to the consolidated financial statements. As of December 31, 2011, this2014, the purchase price allocation for GoupilPro Armor remains preliminary related to income taxes and capitalized leases.20112014 and 20102013 are as follows (in thousands): 2011 2010 $ 28,354 $ 25,869 16,482 1,985 (168 ) 500 $ 44,668 $ 28,354 2014 2013 Balance as of beginning of year $ 126,697 $ 56,324 Goodwill acquired during the period 7,456 66,085 Currency translation effect on foreign goodwill balances (11,122 ) 4,288 Balance as of end of year $ 123,031 $ 126,697 20112014 and 2010 were2013 are as follows (in thousands): For the Year Ended
December 31, 2011 For the Year Ended
December 31, 2010 Gross
Amount Accumulated
Amortization Gross
Amount Accumulated
Amortization $ 3,147 $ (188 ) — — 31,106 — $ 3,001 — — (1,018 ) — $ (188 ) 3 — 146 — $ 34,256 $ (1,206 ) $ 3,147 $ (188 ) 2014 2013 Gross
Amount Accumulated
Amortization Gross
Amount Accumulated
AmortizationOther intangible assets, beginning $ 116,279 $ (13,268 ) $ 54,907 $ (4,015 ) Intangible assets acquired during the period 16,050 — 57,388 — Amortization expense — (11,599 ) — (9,178 ) Currency translation effect on foreign balances (8,236 ) 1,709 3,984 (75 ) Other intangible assets, ending $ 124,093 $ (23,158 ) $ 116,279 $ (13,268 ) (dollars in(in thousands): Estimated Life
(Years) Gross Carrying
Amount Accumulated
Amortization Net 5 $ 240 $ (24 ) $ 216 7 8,013 (366 ) 7,647 7 8,625 (816 ) 7,809 16,878 (1,206 ) 15,672 17,378 — 17,378 $ 34,256 $ (1,206 ) $ 33,050 Estimated Life
(Years) Gross Carrying
Amount Accumulated
Amortization Net 7 $ 3,147 $ (188 ) $ 2,959 $ 3,147 $ (188 ) $ 2,959 December 31, 2014 Estimated Life
(Years) Gross Carrying
Amount Accumulated
Amortization Net Non-compete agreements 5 $ 540 $ (293 ) $ 247 Dealer/customer related 7 62,758 (16,361 ) 46,397 Developed technology 5-7 14,571 (6,504 ) 8,067 Total amortizable 77,869 (23,158 ) 54,711 Non-amortizable—brand/trade names 46,224 — 46,224 Total other intangible assets, net $ 124,093 $ (23,158 ) $ 100,935 December 31, 2013 Estimated Life
(Years) Gross Carrying
Amount Accumulated
Amortization Net Non-compete agreements 5 $ 540 $ (185 ) $ 355 Dealer/customer related 7 59,244 (8,608 ) 50,636 Developed technology 5-7 15,307 (4,475 ) 10,832 Total amortizable 75,091 (13,268 ) 61,823 Non-amortizable—brand/trade names 41,188 — 41,188 Total other intangible assets, net $ 116,279 $ (13,268 ) $ 103,011 during 2011for the year ended December 31, 2014 and 20102013 was $1,018,000$11,599,000 and $188,000, respectively.$9,178,000. Estimated amortization expense for 2012 to 20162015 through 2019 is as follows: 2012, $2,393,000; 2013, $2,393,000; 2014, $2,393,000; 2015 $2,393,000; , $11,300,000; 2016 $2,369,000;, $11,300,000; 2017, $11,000,000; 2018, $9,500,000; 2019, $8,200,000; and after 2016, $3,731,000.2019, $3,400,000. The preceding expected amortization expense is an estimate and actual amounts could differ due to additional intangible asset acquisitions, changes in foreign currency rates or impairment of intangible assets.5.6. Income TaxesIncomeincome from continuing operations before income taxes was generated from its United States and foreign operations as follows: For the Years Ended December 31, 2011 2010 2009 $ 329,060 $ 210,155 $ 143,483 17,566 8,386 7,691 $ 346,626 $ 218,541 $ 151,174 For the Years Ended December 31, 2014 2013 2012 United States $ 666,323 $ 535,265 $ 458,635 Foreign 32,994 39,164 21,208 Income from continuing operations before income taxes $ 699,317 $ 574,429 $ 479,843 Provisionprovision for income taxes for continuing operations are as follows: For the Years Ended December 31, 2011 2010 2009 $ 113,406 $ 73,597 $ 27,104 10,629 7,381 3,723 6,374 6,783 5,757 (11,358 ) (16,358 ) 13,573 $ 119,051 $ 71,403 $ 50,157 For the Years Ended December 31, 2014 2013 2012 Current: Federal $ 255,299 $ 167,690 $ 169,833 State 20,438 12,942 15,366 Foreign 21,584 15,457 8,593 Deferred (52,033 ) (2,729 ) (26,259 ) Total provision for income taxes for continuing operations $ 245,288 $ 193,360 $ 167,533 For the Years Ended
December 31, 2011 2010 2009 35.0 % 35.0 % 35.0 % 1.8 1.8 2.3 (1.9 ) (1.8 ) (1.1 ) (0.8 ) (1.2 ) (1.2 ) 0.5 0.4 — (0.3 ) (1.5 ) (1.8 ) 34.3 % 32.7 % 33.2 % For the Years Ended December 31, 2014 2013 2012 Federal statutory rate 35.0 % 35.0 % 35.0 % State income taxes, net of federal benefit 1.5 1.5 1.8 Domestic manufacturing deduction (1.1 ) (1.0 ) (1.5 ) Research and development tax credit (1.1 ) (2.2 ) — Valuation allowance for foreign subsidiaries net operating losses — 0.3 — Other permanent differences 0.8 0.1 (0.4 ) Effective income tax rate for continuing operations 35.1 % 33.7 % 34.9 % $44,643,000$105,782,000 and $38,749,000$75,487,000 at December 31, 20112014 and 2010,2013, respectively, are considered to be permanently reinvested; accordingly, no provision for U.S. federal income taxes has been provided thereon. If the Company were to distribute these earnings, it would be subject to both U.S. income taxes (subject to an adjustment for foreign tax credits reflecting the amounts paid to non-U.S. taxing authorities) and withholding taxes payable to the non-U.S. countries. Determination of the unrecognized deferred U.S. income tax liability related to these undistributed earnings is not practicable due to the complexities associated with this hypothetical calculation. December 31, 2011 2010 $ 5,968 $ 6,618 73,171 60,100 (1,474 ) 651 77,665 67,369 2,139 (1,973 ) (21,296 ) (20,786 ) 31,274 30,119 (1,516 ) (8,297 ) 10,601 (937 ) $ 88,266 $ 66,432 December 31, 2014 2013 Current deferred income taxes: Inventories $ 9,034 $ 6,306 Accrued expenses 104,279 87,157 Derivative instruments 864 (107 ) Total current 114,177 93,356 Noncurrent deferred income taxes: Cost in excess of net assets of business acquired (13,111 ) (13,594 ) Property and equipment (28,921 ) (36,069 ) Compensation payable in common stock 58,446 42,528 Net operating loss carryforwards and impairments 12,693 5,782 Valuation allowance (6,097 ) (5,059 ) Total noncurrent 23,010 (6,412 ) Total net deferred income tax asset $ 137,187 $ 86,944 hadclassified liabilities recorded related to unrecognized tax benefits totaling $7,837,000 and $5,509,000 at December 31, 2011 and 2010, respectively. The liabilities were classified as Long termlong-term income taxes payable in the accompanying consolidated balance sheets in accordance with ASC Topic 740. Polaris recognizes potential interest and penalties related to income tax positions as a component of the Provisionprovision for income taxes on the consolidated statements of income. Polaris had reservesReserves related to potential interest of $496,000 and $331,000are recorded as a component of Long termlong-term income taxes payable at December 31, 2011 and 2010, respectively.payable. The entire balance of unrecognized tax benefits at December 31, 2011,2014, if recognized, would affect the Company’s effective tax rate. The Company does not anticipate that total unrecognized tax benefits will materially change in the next twelve months. Tax years 20062010 through 20102014 remain open to examination by certain tax jurisdictions to which the Company is subject. A reconciliation of the beginning and ending amountamounts of unrecognized tax benefits is as follows: For the Years Ended December 31, 2011 2010 $ 5,509 $ 4,988 483 1,259 — — 1,956 1,345 — — (111 ) (2,083 ) $ 7,837 $ 5,509 For the Years Ended December 31, 2014 2013 Balance at January 1, $ 13,199 $ 6,704 Increases due to acquisition opening balance sheet positions — 6,420 Gross increases for tax positions of prior years 55 561 Gross increases for tax positions of current year 1,456 3,755 Decreases due to settlements and other prior year tax positions (2,346 ) (3,310 ) Decreases for lapse of statute of limitations (1,586 ) (1,344 ) Currency translation effect on foreign balances (942 ) 413 Balance at December 31, 9,836 13,199 Reserves related to potential interest at December 31, 732 1,093 Unrecognized tax benefits at December 31, $ 10,568 $ 14,292 6.7. Shareholders’ Equityprogram:program. The Polaris Board of Directors has authorized the cumulative repurchase of up to 75,000,000 shares of the Company’s common stock. In addition, in 2013 the Polaris Board of Directors authorized the one-time repurchase of all the shares of Polaris stock owned by Fuji Heavy Industries Ltd. ("Fuji"). On November 12, 2013, Polaris entered into and executed a Share Repurchase Agreement with Fuji under which Polaris purchased 3,960,000 shares of Polaris stock held by Fuji for an aggregate purchase price of $497,474,000.2011, 3,629,0002014, 1,050,000 shares remain available for repurchases under the Board’s authorization. During 20112014, Polaris paid $132,372,000 to repurchaseand retire approximately 2,608,000 shares. During 2010 Polaris paid $27,486,000$81,812,000 to repurchase and retire approximately 1,202,000 shares and in 2009554,000 shares. During 2013, Polaris paid $4,556,000$530,033,000 to repurchase and retire approximately 222,0004,337,000 shares, and in 2012 Polaris paid $127,525,000 to repurchase and retire approximately 1,649,000 shares.plan:plan. During 2000, the Polaris Board of Directors adopted a shareholder rights plan. Under the plan, a dividend of preferred stock purchase rights will become exercisable if a person or group should acquire 15 percent or more of the Company’s stock. The dividend will consist of one purchase right for each outstanding share of the Company’s common stock held by shareholders of record on June 1, 2000. The shareholder rights plan was amended and restated in April 2010. The amended and restated rights agreement extended the final expiration date of the rights from May 2010 to April 2020, expanded the definition of “Beneficial Owner” to include certain derivative securities relating to the common stock of the Company and increased the purchase price for the rights from $75 to $125 per share. The Board of Directors may redeem the rights earlier for $0.01 per right.Accumulated other comprehensive income: Accumulated other comprehensive income consistedStock purchase plan. Polaris maintains an employee stock purchase plan (“Purchase Plan”). A total of $9,545,0003,000,000 shares of common stock are reserved for this plan. The Purchase Plan permits eligible employees to purchase common stock monthly at 95 percent of the average of the beginning and $6,991,000end of unrealized currency translation gains (net of tax of $1,516,000 and $8,298,000) asmonth stock prices. As of December 31, 20112014, approximately 1,261,000 shares had been purchased under the Purchase Plan.2010, respectively, and unrealized gains of $2,478,000 and unrealized losses of $1,093,000 (net of tax liability of $1,474,000 and tax benefit of $650,000) related to derivative instruments as oftotal year cash dividends declared per common share for the year ended December 31, 20112014 and 2010, respectively.Changes in2013 were as follows: For the Years Ended December 31, 2014 2013 Quarterly dividend declared and paid per common share $ 0.48 $ 0.42 Total dividends declared and paid per common share $ 1.92 $ 1.68 Accumulated other comprehensive income (loss) balances is as follows (in thousands): Foreign
Currency
Items Unrealized Gains
(Losses) on
Securities Net Gains (Losses)
on Cash Flow
Hedging Derivatives Accumulated Other
Comprehensive
Income $ 6,991 — $ (1,093 ) $ 5,898 — — (959 ) (959 ) 2,554 — 4,530 7,084 $ 9,545 — $ 2,478 $ 12,023 share:share. Basic earnings per share is computed by dividing net income available to common shareholders by the weighted average number of common shares outstanding during each year,period, including shares earned under the The Deferred Compensation Plan for Directors (“Director Plan,Plan”), the ESOP and deferred stock units under the 2007 Omnibus Plan.Incentive Plan (“Omnibus Plan”). Diluted earnings per share is computed under the treasury stock method and is calculated to compute the dilutive effect of outstanding stock options issued under the 1995 Stock Option Plan and the 2003 Non-Employee Director Stock Option Plan (collectively, the “Option Plans”) and certain shares issued under the Restricted Plan and Omnibus Plan. A reconciliation of these amounts is as follows (in thousands): 2011 2010 2009 68,315 66,318 64,490 342 326 308 135 256 — 68,792 66,900 64,798 165 132 530 2,100 1,733 820 71,057 68,765 66,148 For the Years Ended December 31, 2014 2013 2012 Weighted average number of common shares outstanding 65,904 68,209 68,409 Director Plan and deferred stock units 196 242 341 ESOP 75 84 99 Common shares outstanding—basic 66,175 68,535 68,849 Dilutive effect of restricted stock awards 359 228 181 Dilutive effect of stock option awards 1,695 1,783 1,975 Common and potential common shares outstanding—diluted 68,229 70,546 71,005 2011, 2010the 2014, 2013 and 2009,2012 the number of options that could potentially dilute earnings per share on a fully diluted basis that were not included in the computation of diluted earnings per share because to do so would have been anti-dilutive was 131,000, 788,000,were 581,000, 23,000 and 3,344,000,872,000, respectively.Stock Purchase Plan: Polaris maintains an employee stock purchase plan (“Purchase Plan”)Accumulated other comprehensive income (loss). A totalChanges in the accumulated other comprehensive income (loss) balance is as follows (in thousands): Foreign
Currency
Items Cash Flow
Hedging Derivatives Accumulated Other
Comprehensive
Income (loss)Balance as of December 31, 2013 $ 18,582 $ 179 $ 18,761 Reclassification to the income statement — (5,469 ) (5,469 ) Change in fair value (44,371 ) 3,838 (40,533 ) Balance as of December 31, 2014 $ (25,789 ) $ (1,452 ) $ (27,241 ) 3,000,000 sharesgains and losses, net of common stock are reservedtax, reclassified from accumulated other comprehensive income (loss) into the income statement for this plan. cash flow derivatives designated as hedging instruments for the year ended December 31, 2014 and 2013 (in thousands): For the Years Ended December 31, 2014 2013 Foreign currency contracts Other (income), net $ (5,641 ) $ (1,671 ) Foreign currency contracts Cost of sales 172 977 Total $ (5,469 ) $ (694 ) Purchase Plan permits eligible employees to purchase common stock at 95 percentnet amount of the average market price each month. As of existing gains or losses at December 31, 2011, approximately 1,198,000 shares had been purchased under2014 that is expected to be reclassified into the Purchase Plan.income statement within the next 12 months is expected to not be material. See Note 11 for further information regarding Polaris' derivative activities.7.8. Financial Services ArrangementsIn 1996, one of Polaris’ wholly-owned subsidiaries entered intopartnership agreement with a subsidiary of Transamericajoint venture between Polaris and GE Commercial Distribution Finance (“TDF”) to form Polaris Acceptance. In 2004, TDF was merged with aCorporation, an indirect subsidiary of General Electric Company and, asCapital Corporation, which is supported by a resultpartnership agreement between their respective wholly owned subsidiaries, finances substantially all of that merger, TDF’s name was changed to GECDF.Polaris' United States sales whereby Polaris receives payment within a few days of shipment of the product. Polaris’ subsidiary has a 50 percent equity interest in Polaris Acceptance. In November 2006, Polaris Acceptance soldsells a majority of its receivable portfolio to thea securitization facility (the "Securitization Facility") arranged by General Electric Capital Corporation, a GECDF affiliate (“Securitization Facility”), and the partnership agreement was amended to provide that Polaris Acceptance would continue to sell portions of its receivable portfolio to a Securitization Facility from time to time on an ongoing basis. At December 31, 2011 and 2010, the outstanding balance of receivables sold by Polaris Acceptance to the Securitization Facility (the “Securitized Receivables”) amounted to approximately $477,604,000 and $323,790,000, respectively.Corporation. The sale of receivables from Polaris Acceptance to the Securitization Facility is accounted for in Polaris Acceptance’s financial statements as a “true-sale” under ASCAccounting Standards Codification Topic 860. Polaris Acceptance is not responsible for any continuing servicing costs or obligations with respect toPolaris’ allocable share of the Securitized Receivables. Polaris has not guaranteed the outstanding indebtednessincome of Polaris Acceptance orhas been included as a component of income from financial services in the Securitized Receivables. Polaris’ subsidiary and GECDF have an income sharing arrangement related to income generated from the Securitization Facility.accompanying consolidated statements of income. The remaining portion of the receivable portfoliopartnership agreement is recorded on Polaris Acceptance’s books. The two partners of Polaris Acceptance share equally an equity cash investment equal to 15 percent of the sum of the portfolio balance in Polaris Acceptance plus Securitized Receivables. effective through February 2017.2011and 2010, was $42,251,0002014 is accounted for under the equity method, and $37,169,000, respectively. The Polaris Acceptance partnership agreement provides for periodic options for renewal, purchase, or termination by either party. Substantially allis recorded in investment in finance affiliate in the accompanying consolidated balance sheets. At December 31, 2014, the outstanding amount of Polaris’ United States sales are financed through Polaris Acceptance and the Securitization Facility whereby Polaris receives payment within a few days of shipment of the product. The net amountreceivables financed for dealers under this arrangement at December 31, 2011, including bothwas $1,141,068,000, which included $337,088,000 in the portfolio balance in Polaris Acceptance portfolio and $803,980,000 of receivables within the Securitization Facility ("Securitized Receivables, was $568,392,000. Receivables").balances outstanding Polaris Acceptance receivables and Securitized Receivables during the prior calendar year. For calendar year 2011,2014, the potential 15 percent aggregate repurchase obligation was approximately $91,693,000.$120,815,000. Polaris’ financial exposure under this arrangement is limited to the difference between the amounts unpaid by the dealer with respect to the repossessed product plus costs of repossession and the amount received on the resale of the repossessed product. No material losses have been incurred under this agreement during the periods presented. Polaris’ trade receivables from Polaris Acceptance were $1,618,000 and $29,000 at December 31, 2011 and 2010, respectively. Polaris’ exposure to losses with respect to the Polaris Acceptance Portfolio and the Securitized Receivables is limited to its equity in its wholly-owned subsidiary that is a partner in Polaris Acceptance.Polaris’ total investment in Polaris Acceptance at December 31, 2011 of $42,251,000 is accounted for under the equity method, and is recorded as Investments in finance affiliate in the accompanying consolidated balance sheets. The partnership agreement provides that all income and losses of the Polaris Acceptance and the Securitized Receivables are shared 50 percent by Polaris’ wholly-owned subsidiary and 50 percent by GECDF. Polaris’ allocable share of the income of Polaris Acceptance and the Securitized Facility has been included as a component of Income from financial services in the accompanying statements of income. For the Year Ended December 31, 2011 2010 2009 $ 13,018 $ 12,459 $ 12,559 4,131 3,311 4,517 $ 8,887 $ 9,148 $ 8,042 As of December 31, 2011 2010 $ 90,788 $ 174,040 73 67 $ 90,861 $ 174,107 $ (2,435 ) $ 92,863 8,794 6,980 84,502 74,264 $ 90,861 $ 174,107 In August 2005, a wholly-owned subsidiary For the Years Ended December 31, 2014 2013 2012 Revenues $ 40,968 $ 13,010 $ 8,811 Interest and operating expenses 3,678 3,044 1,013 Net income $ 37,290 $ 9,966 $ 7,798 As of December 31, 2014 2013 Finance receivables, net $ 337,088 $ 226,742 Other assets 122 172 Total Assets $ 337,210 $ 226,914 Notes payable $ 155,436 $ 85,096 Other liabilities 3,560 3,384 Partners’ capital 178,214 138,434 Total Liabilities and Partners’ Capital $ 337,210 $ 226,914 entered into a multi-year contract with HSBC Bank Nevada, National Association (“HSBC”), formerly known as Household Bank (SB), N.A., under which HSBC is continuing to manage the Polaris private label credit card program under the StarCard label to provide financing for Polaris products. During 2010, Polaris and HSBC extended the term of the agreement on similar terms to October 2013. During 2011 it was announced that HSBC’s U.S. Credit Card and Retail Services business would be acquired by Capital One, subject to regulatory approval. The transaction is expected to close in the second quarter of 2012. Polaris’Polaris' income generated from the HSBC agreementthese agreements has been included as a component of Incomeincome from financial services in the accompanying consolidated statements of income.In April 2006, a wholly-owned subsidiary of Polaris entered into a multi-year contract with GE Money Bank (“GE Bank”) under which GE Bank makes available closed-end installment consumer and commercial credit to customers of Polaris dealers for both Polaris and non-Polaris products. In November 2010, the Company extended its installment credit agreement to March 2016 under which GE Bank will provide exclusive installment credit lending for Victory motorcycles. Polaris’ income generated from the GE Bank agreement has been included as a component of Income from financial services in the accompanying consolidated statements of income.In January 2009, a wholly-owned subsidiary of Polaris entered into a multi-year contract with Sheffield Financial (“Sheffield”) pursuant to which Sheffield agreed to make available closed-end installment consumer and commercial credit to customers of Polaris dealers for Polaris products. In October 2010, Polaris extended its installment credit agreement to February 2016 under which Sheffield will provide exclusive installment credit lending for ORV and Snowmobiles. Polaris’ income generated from the Sheffield agreement has been included as a component of Income from financial services in the accompanying consolidated statements of income.inunder any of these arrangements. Polaris’ service fee income generated from these arrangements has been included as a component of Incomeincome from financial services in the accompanying consolidated statements of income.Income from financial services as included in the consolidated statements8.9. Investment in Other Affiliatescaption InvestmentsCompany has certain investments in Other Affiliatesnonmarketable securities of strategic companies. As of December 31, 2014 and 2013, these investments are comprised of investments in Eicher-Polaris Private Limited (EPPL) and Brammo, Inc. ("Brammo"), and are recorded as components of other long-term assets in the accompanying consolidated balance sheetssheets.periodyears ended December 31, 2011 represents2014 and 2013 was $4,124,000 and $2,414,000, respectively, and is included in equity in loss of other affiliates on the Company’s investment in consolidated statements of income.Inc.,is a privately held manufacturerdesigner and developer of electric motorcycles madevehicles, which Polaris has invested in Octobersince 2011. This $5,000,000The investment represents a minority interest in Brammo and is accounted for under the cost method. The amount recorded as of December 31, 2010 represents the Company’s 40 percent ownership in Robin Manufacturing, U.S.A. (“Robin”), which assembled enginesBrammo is in the United Statesearly stages of designing, developing, and selling electric vehicle powertrains. As such, a risk exists that Brammo may not be able to secure sufficient financing to reach viability through cash flow from operations. In January 2015, Polaris acquired the electric motorcycle business from Brammo. Brammo will continue to be a designer and developer of electric vehicle powertrains.recreationalimpairment, utilizing level 3 fair value inputs. During 2014 and industrial products. The Robin operations were closed during third quarter 2011 as2013, Polaris recorded an immaterial impairment expense within other expense (income), net in the production volumesconsolidated statements of engines made by Robin had declined significantly in recent years. Polaris receivedincome, and reduced the return of its remaining equity investment in Robin during the fourth quarter 2011 as Robin was liquidated.Brammo investment.9.10. Commitments and Contingenciesliability:liability. Polaris is subject to product liability claims in the normal course of business. In 2012, Polaris is currently self-insuredpurchased excess insurance coverage for allcatastrophic product liability claims.claims for incidents occurring after the policy date. Polaris self-insures product liability claims before the policy date and up to the purchased catastrophic insurance coverage after the policy date. The estimated costs resulting from any losses are charged to operating expenses when it is probable a loss has been incurred and the amount of the loss is reasonably determinable. The Company utilizes historical trends and actuarial analysis tools, along with an analysis of current claims, to assist in determining the appropriate loss reserve levels. At December 31, 2011,2014, the Company had an accrual of $16,861,000$17,327,000 for the probable payment of pending claims related to continuing operations product liability litigation associated with Polaris products. This accrual is included as a component of Other Accruedother accrued expenses in the accompanying consolidated balance sheets. Theiswas party to a lawsuit in which the Plaintiff alleges that sheplaintiff was seriously injured in a 2008 accident involving a collision between a 2001 Polaris Virage personal watercraft and a boat. Management believes the claim to be without merit and intends to defend vigorouslyOn July 23, 2013, a Los Angeles County jury returned an unfavorable verdict against the action, but there can be no assurancesCompany. The jury returned a verdict finding that the ultimate outcomeaccident was caused by multiple actions, the majority of which was attributed to the negligence of the lawsuit will be favorableother boat driver, with the balance attributed to the Company or that the defensereckless behavior of the suit ordriver of the Virage and the design of the Virage. The jury awarded approximately $21,000,000 in damages, of which Polaris' liability was $10,000,000. In the third quarter of 2013, the Company reported a loss from discontinued operations, net of tax, of $3,777,000 for an additional provision to accrue Polaris' portion of the jury award and legal fees. The amount was fully paid in 2013. In September 2004, the Company announced its outcome will notdecision to cease manufacturing marine products. Since then, any material financial results of that division have a material adverse effect on the Company’s financial condition. Management is unable to estimate the range of reasonably possible loss associated with this claim. The Companybeen recorded in discontinued the manufacture of marine products in 2004.operations.Litigation:Litigation. Polaris is a defendant in lawsuits and subject to other claims arising in the normal course of business. In the opinion of management, it is unlikely that any legal proceedings pending against or involving Polaris will have a material adverse effect on Polaris’Polaris' financial position or results of operations.Leases:Contingent purchase price. As a component of certain past acquisition agreements, Polaris has committed to make additional payments to certain sellers contingent upon either the passage of time or certain financial performance criteria. Polaris initially records the fair value of each commitment as of the respective opening balance sheet, and each reporting period the fair value is evaluated, using level 3 inputs, with the change in value reflected in the consolidated statements of income. As of December 31, 2014 and 2013 the fair value of contingent purchase price commitments was $27,908,000 and $18,249,000, respectively, recorded in other long-term liabilities in the consolidated balance sheets.$9,184,000, $5,553,000$13,734,000, $10,656,000, and $4,999,000$10,349,000 for 2011, 20102014, 2013 and 2009,2012, respectively. With the acquisition of Goupillate 2011, the Company assumed2013 for a manufacturing facility which Polaris began occupying in Opole, Poland commenced in February 2014. The Poland property lease is accounted for as a capital lease obligations related to certain lease agreements entered into by Goupil. These transactions are classified as capital lease obligations and recorded at fair value. Polaris will make payments totaling $7,253,000 over the next six years.non-cancelablenoncancelable terms in excess of one year as of December 31, 2011, including payments for the Monterrey, Mexico facility operating lease were2014, are as follows (in thousands): Capital
Leases Operating
Leases $ 2,653 $ 7,184 2,190 5,845 1,444 4,857 701 3,899 222 3,460 43 11,644 $ 7,253 $ 36,889 Capital
Leases Operating
Leases2015 $ 3,915 $ 9,576 2016 3,281 5,098 2017 2,903 3,326 2018 2,403 1,945 2019 2,203 1,173 Thereafter 23,639 1,403 Total future minimum lease obligation $ 38,344 $ 22,521 10.11. Derivative Instruments and Hedging ActivitiesTheFrom time to time, the primary risks managed by using derivative instruments are foreign currency risk, interest rate risk and commodity price fluctuations. Forward exchangeDerivative contracts on various currencies are entered into in order to manage foreign currency exposures associated with certain product sourcing activities and intercompany sales.cash flows. Interest rate swaps are entered into from time to time in order to manage interest rate risk associated with the Company’s variable-rate borrowings. Commodity hedging contracts are entered into in order to manage fluctuating market prices of certain purchased commodities and raw materials that are integrated into the Company’s end products.United StatesU.S. dollar cash flows and to reduce the variability of certain cash flows at the subsidiary level. The Company actively manages certain forecasted foreign currency exposures and uses a centralized currency management operation to take advantage of potential opportunities to naturally offset foreign currency exposures against each other. The decision of whether and when to execute derivative instruments, along with the duration of the instrument, can vary from period to period depending on market conditions, the relative costs of the instruments and capacity to hedge. The duration is linked to the timing of the underlying exposure, with the connection between the two being regularly monitored. Polaris does not use any financial contracts for trading purposes.2011,2014, Polaris had the following open Canadian Dollarforeign currency contracts (in thousands):Foreign Currency Net Unrealized Gain (Loss) Australian Dollar $ 3,491 $ 391 Canadian Dollar 40,550 38 Japanese Yen 22,201 (1,008 ) Mexican Peso 34,060 (1,991 ) Total $ 100,302 $ (2,570 ) notional amounts totaling United States $156,941,000 and a net unrealized gain of $3,601,000, open contracts to purchase Euros with notional amounts totaling United States $22,948,000 and an unrealized loss of $819,000, open Swedish Krona contracts with notional amounts totaling United States $6,442,000 and an unrealized gain of $437,000, and open Australian Dollar contracts with notional amounts totaling United States $10,243,000 and a net unrealized gain of $359,000. These contracts have maturities through December 2012. The Company had no open Yen foreign currency derivative contracts31, 2015, met the criteria for cash flow hedges and the unrealized gains or losses, after tax, are recorded as a component of accumulated other comprehensive income (loss) in place at December 31, 2011.has enteredenters into derivative contracts to hedge a portion of the exposure for gallons ofrelated to diesel fuel for 2012 and metric tons of aluminum for 2012.aluminum. These diesel fuel and aluminum derivative contracts didhave not meetmet the criteria for hedge accounting.tablestable below summarizesummarizes the carrying values of derivative instruments as of December 31, 20112014 and 20102013 (in thousands): Carrying Values of Derivative Instruments as of December 31, 2011 Fair Value—Assets Fair Value—(Liabilities) Derivative Net
Carrying Value $ 4,738 $ (1,160 ) $ 3,578 $ 4,738 $ (1,160 ) $ 3,578 $ 193 $ (1,530 ) $ (1,337 ) $ 193 $ (1,530 ) $ (1,337 ) $ 4,931 $ (2,690 ) $ 2,241 Carrying Values of Derivative Instruments as of December 31, 2010 Fair Value—Assets Fair Value—(Liabilities) Derivative Net
Carrying Value — $ (126 ) $ (126 ) $ 39 (2,058 ) (2,019 ) $ 39 $ (2,184 ) $ (2,145 ) $ 889 — $ 889 $ 889 — $ 889 $ 928 $ (2,184 ) $ (1,256 ) Carrying Values of Derivative Instruments as of December 31, 2014 Derivatives designated as hedging instruments Foreign exchange contracts(1) $ 534 $ (3,104 ) $ (2,570 ) Total derivatives designated as hedging instruments $ 534 $ (3,104 ) $ (2,570 ) Commodity contracts(1) $ — $ (4,609 ) $ (4,609 ) Total derivatives not designated as hedging instruments $ — $ (4,609 ) $ (4,609 ) Total derivatives $ 534 $ (7,713 ) $ (7,179 ) Carrying Values of Derivative Instruments as of December 31, 2013 Derivatives designated as hedging instruments Foreign exchange contracts(1) $ 1,194 $ (1,203 ) $ (9 ) Total derivatives designated as hedging instruments $ 1,194 $ (1,203 ) $ (9 ) Commodity contracts(1) $ 46 $ (16 ) $ 30 Total derivatives not designated as hedging instruments $ 46 $ (16 ) $ 30 Total derivatives $ 1,240 $ (1,219 ) $ 21 (1)Included in Other Current Liabilities on the accompanying consolidated balance sheet.(2)(1)Assets are included in Prepaidprepaid expenses and other and liabilities are included in Other Current Liabilitiesother accrued expenses on the accompanying consolidated balance sheet.sheets.a cash flow hedge,hedges, the effective portion of the gain or loss on the derivative is reported as a component of Accumulatedaccumulated other comprehensive income (loss) and reclassified into the income statement in the same period or periods during which the hedged transaction affects the income statement. Gains and losses on the derivative representing either hedge ineffectiveness or hedge components excluded from the assessment of effectiveness are recognized in the statement of income. current income statement.as a component of Accumulatedin accumulated other comprehensive income (loss) for the twelve month periodsyears ended December 31:(In thousands): Amount of Gain (Loss)
Recognized in Accumulated OCI on
Derivative (Effective Portion) Amount of Gain (Loss)
Recognized in Accumulated OCI on
Derivative (Effective Portion) Twelve Months Ended
December 31,
2011 Twelve Months Ended
December 31,
2010 $ 62 $ 609 3,509 (1,048 ) $ 3,571 $ (439 ) The table below provides data31, 2014For the Years Ended December 31, 2014 2013 Interest rate contracts — $ (26 ) Foreign currency contracts $ (1,631 ) 1,636 Total $ (1,631 ) $ 1,610 Accumulatedaccumulated other comprehensive income (loss) into the income onstatement for derivative instruments designated as hedging instruments for the twelve months ended December 31, (in thousands): Location of Gain (Loss)
Reclassified from
Accumulated OCI
Into Income Amount of Gain (Loss)
Reclassified from
Accumulated OCI
into Income Amount of Gain (Loss)
Reclassified from
Accumulated OCI
into Income Twelve Months Ended
December 31,
2011 Twelve Months Ended
December 31,
2010 Interest expense $ (152 ) $ (1,039 ) Other income, net (807 ) (1,133 ) Cost of sales — 24 $ (959 ) $ (2,148 ) The net amount of the existing gains or losses at December 31, 2011 that is expected to be reclassified into the statement of income within the next 12 months is not expected to be material.instruments. The ineffective portion of foreign currency contracts was not material for the twelve monthsyears ended 20112014 and 2010.$1,295,000$4,820,000 and a gain of $643,000$878,000 in Costcost of sales on commodity contracts not designated as hedging instruments for the twelve month period ended December 31, 2011in 2014 and 2010,2013, respectively.Note 11. Manufacturing RealignmentIn May 2010, the Company announced that it was realigning its manufacturing operations. The realignment will consolidate operations into existing operations in Roseau, Minnesota and Spirit Lake, Iowa as well as establish a new facility in Monterrey, Mexico. As partThe following data relatesPolaris’ foreign operations: For the Years Ended December 31, (In thousands) 2011 2010 2009 $ 368,487 $ 279,309 $ 239,240 18,008 42,936 35,462 $ 424,363 $ 305,864 $ 252,419 252,519 145,528 97,771 For the Years Ended December 31, 2014 2013 2012 United States $ 3,339,905 $ 2,721,300 $ 2,310,943 Canada 454,608 463,316 438,208 Other foreign countries 685,135 592,452 460,631 Consolidated sales $ 4,479,648 $ 3,777,068 $ 3,209,782 As of December 31, 2014 2013 United States $ 432,614 $ 349,224 Mexico 49,064 52,450 Other foreign countries 73,750 53,493 Consolidated property and equipment, net $ 555,428 $ 455,167 Sales Gross Profit Net Income Diluted
Net Income
per Share (In thousands, except per share data) $ 537,198 $ 151,835 $ 47,310 $ 0.67 607,921 177,604 48,729 0.68 729,861 206,836 67,637 0.95 781,969 204,308 63,899 0.90 $ 2,656,949 $ 740,583 $ 227,575 $ 3.20 $ 361,708 $ 94,914 $ 19,771 $ 0.29 430,907 113,084 25,624 0.37 580,082 150,699 47,221 0.69 618,442 171,516 54,522 0.78 $ 1,991,139 $ 530,213 $ 147,138 $ 2.14 Sales Gross profit Net income from continuing operations Net income Diluted net income per share from continuing operations Diluted net income per share (In thousands, except per share data) 2014 First Quarter $ 888,346 $ 258,417 $ 80,901 $ 80,901 $ 1.19 $ 1.19 Second Quarter 1,013,959 304,914 96,905 96,905 1.42 1.42 Third Quarter 1,302,343 388,274 140,826 140,826 2.06 2.06 Fourth Quarter 1,275,000 367,573 135,397 135,397 1.98 1.98 Totals $ 4,479,648 $ 1,319,178 $ 454,029 $ 454,029 $ 6.65 $ 6.65 2013 First Quarter $ 745,909 $ 216,648 $ 75,464 $ 75,464 $ 1.07 $ 1.07 Second Quarter 844,800 252,338 80,004 80,004 1.13 1.13 Third Quarter 1,102,649 334,785 116,921 113,144 1.64 1.59 Fourth Quarter 1,083,710 317,108 108,680 108,680 1.56 1.56 Totals $ 3,777,068 $ 1,120,879 $ 381,069 $ 377,292 $ 5.40 $ 5.35 (a) Directors of the Registrantinformation required under this item concerning our directors will be set forth under the caption Proposal 1—“sections entitled "Proposal 1 – Election of Directors—Information Concerning Nominees and Directors” in the Company’s 2012 Proxy Statement incorporated herein by reference.(b) Executive Officers of the RegistrantInformation concerning Executive Officers of the Company is included in this Report after Item 1, under the caption “Executive Officers of the Registrant.”(c) Identification of the Audit Committee; Audit Committee Financial ExpertThe information required under this item concerning our Audit Committee and identification of our Audit Committee Financial Expert will be set forth under the caption “CorporateDirectors," "Corporate Governance—Committees of the Board and Meetings—Audit Committee”Committee" and "Section 16(a) Beneficial Ownership Reporting Compliance" in the Company’s 2012Polaris definitive Proxy Statement to be filed on or about March 13, 2015 (the "2015 Proxy Statement"), are incorporated herein by reference.(d) Section 16(a) Beneficial Ownership Reporting ComplianceThe information required under this item concerning compliance with Section 16(a) See also Item 1 "Executive Officers of the Securities Exchange Act of 1934 will be set forth under the caption “Corporate Governance—Section 16(a) Beneficial Ownership Reporting Compliance”Registrant" on page 12 in the Company’s 2012 Proxy Statement incorporated herein by reference.(e) Code of Ethics.that appliesapplicable to all employees, including our Principal Executive Officer, Principal Financial Officer, Principal Accounting Officer and all other executive officers and the Board of Directors. A copy of the Polaris employees. This Code of Business Conduct and Ethics is postedavailable on our website at www.polarisindustries.com and may be found as follows:www.polaris.com.From our main web page, first click on “Our Company.”Next, highlight “Investor Relations.”Next, scroll down and click on “Corporate Governance.”Finally, click on “Business CodeAny amendments to, or waivers for executive officers or directors of, Conduct and Ethics.”A copy of our Code of Business Conduct and Ethicsthese ethics codes will be furnished to any shareholder or other interested party who submits a written request for it. Such request should be sent to Polaris Industries Inc., 2100 Highway 55, Medina, Minnesota 55340, Attention: Investor Relations.We intend to satisfy the disclosure requirement under Item 5.05 of Form 8-K regarding an amendment to, or waiver from a provision of this Code of Business Conduct and Ethics by posting such informationdisclosed on our website atpromptly following the address and location specified above under the heading “waivers.”information required by this item will be set forth under the captions “Corporate Governance —Compensationsections entitled "Corporate Governance—Compensation Committee Interlocks and Insider Participation,” “Compensation" "Compensation Discussion and Analysis,” “Summary Compensation Table,” “Grants of Plan-Based Awards in 2011,” “Outstanding Equity Awards at 2011Fiscal Year-End,” “Option Exercises" "Compensation Committee Report," "Executive Compensation" and Stock Vested in 2011,” “Nonqualified Deferred Compensation in 2011,” “Potential Payments Upon Termination or Change-in-Control,” “Director Compensation” and “Compensation Committee Report”"Director Compensation" in the Company’s 2012Company's 2015 Proxy Statement are incorporated herein by reference.information under the captionsections entitled “Security Ownership of Certain Beneficial Owners and Management” and "Equity Compensation Plan Information" in the Company’s 20122015 Proxy Statement isare incorporated herein by reference.Equity compensation plan informationEquity Compensation Plans Approved by ShareholdersOur shareholders have approved the Polaris Industries Inc. 1995 Stock Option Plan, the Polaris Industries Inc. Restricted Stock Plan, the Polaris Industries Inc. Employee Stock Purchase Plan, the Polaris Industries Inc. Deferred Compensation Plan for Directors, the 2003 Non-Employee Director Stock Option Plan and the Polaris Industries Inc. Omnibus Incentive Plan.We do not have any equity compensation plans outstanding that have not been approved by shareholders.Summary The following table sets forth certain information as of December 31, 2011, with respect to compensation plans under which shares of our common stock may be issued. Number of securities to be
issued upon exercise of
outstanding options,
warrants and rights Weighted-average exercise
price of outstanding
options,
warrants and rights Number of securities
remaining available for
issuance under equity
compensation plans
(excluding securities
reflected in the first
column 6,215,849 (1)(2) $ 28.55 (3) 9,986,084 (4) None n/a None (1)Includes 5,861,283 shares issuable upon exercise of outstanding stock options, 105,666 shares issuable upon settlement of deferred stock units and accompanying dividend equivalent units issued under the Omnibus Plan to non-employee directors and 248,900 shares issuable upon settlement of common stock equivalents awarded to non-employee directors under the Deferred Compensation Plan for Directors but excludes 424,248 shares of restricted stock issued under the Omnibus Plan.(2)The weighted average remaining contractual life of outstanding options was 7.18 years as of December 31, 2011. Unvested stock options and stock appreciation rights do not receive dividend equivalents.(3)Reflects the weighted-average exercise price of outstanding options. There is no exercise price for outstanding deferred stock units or common stock equivalents.
Contents(4)A total of 50,640 shares were available under the Deferred Compensation Plan, a total of 8,133,386 shares were available under the Omnibus Plan (a fungible ratio of three to one will be applied to the Omnibus Plan pool) and a total of 1,802,058 shares were available under the Employee Stock Purchase Plan.information required by this item will be set forth under the captions “Corporatesections entitled "Corporate Governance—Corporate Governance Guidelines and Independence”Independence" and “Certain"Corporate Governance—Certain Relationships and Related Transactions”Transactions" in the Company’s 20122015 Proxy Statement to be filed within 120 days after the close of the Company’s fiscal year ended December 31, 2011, and isare incorporated herein by reference.information required by this item will be set forth under the caption “Feessection entitled "Fees Paid to Independent Registered Public Accounting Firm”Firm" in the Company’s 20122015 Proxy Statement to be filed within 120 days after the close of the Company’s fiscal year ended December 31, 2011, and is incorporated herein by reference.4438 are included in Part II of this Form 10-K.8170 of this report.8271 to 85.29, 2012,20, 2015, upon receipt from any such person of a written request for any such exhibit. Such request should be sent to Polaris Industries Inc., 2100 Highway 55, Medina, Minnesota 55340, Attention: Investor Relations.27, 2012.20, 2015.POLARIS INDUSTRIES INC. By: Scott W. Wine Chairman and Chief Executive Officer TitleDate/s/ GREGORY R. PALEN DirectorFebruary 27, 2012Gregory R. Palen/s/ SCOTT W. WINE Chief Executive Officer and DirectorFebruary 27, 2012Scott W. WineFebruary 20, 2015 Scott W. Wine s/S/ MICHAEL W. MALONE Vice President — Finance and Chief Financial February 27, 2012Michael W. MaloneFebruary 20, 2015 Michael W. Malone Director February 20, 2015 * Director February 27, 2012Robert L. Caulk*Director February 20, 2015 Brian C. Cornell Director February 20, 2015 * Director February 27, 2012Annette K. Clayton*Director February 20, 2015 Gary E. Hendrickson * Director February 20, 2015 * Director February 27, 2012Gary E. HendricksonDirector February 20, 2015 R. M. Schreck * Lead Director February 20, 2015 * Director February 27, 2012Bernd F. Kessler*DirectorFebruary 27, 2012John R. Menard, Jr.*DirectorFebruary 27, 2012R. M. Schreck*DirectorFebruary 27, 2012William Grant Van DykeSignatureTitleDate*DirectorFebruary 27, 2012John P. Wiehoff*By: February 27, 201220, 2015(Scott W. Wine Attorney-in-Fact) * Scott W. Wine, pursuant to Powers of Attorney executed by each of the officers and directors listed above whose name is marked by an “*” and filed as an exhibit hereto, by signing his name hereto does hereby sign and execute this report of Polaris Industries Inc. on behalf of each of such officers and directors in the capacities in which the names of each appear above. Balance at
Beginning of
Period Additions
Charged to
Costs and
Expenses Additions
Through
Acquisition Other Changes
Add (Deduct)(1) Balance at
End of Period $ 6,098 $ 5,741 — $ (2,246 ) $ 9,593 $ 9,593 $ 1,599 — $ (4,823 ) $ 6,369 $ 6,369 $ 25 $ 532 $ (2,453 ) $ 4,473 Allowance for Doubtful Accounts Balance at
Beginning of
Period Additions
Charged to
Costs and
Expenses Additions
Through
Acquisition Other Changes
Add (Deduct)(1) Balance at
End of Period(In thousands) 2012: Deducted from asset accounts—Allowance for doubtful accounts receivable $ 4,473 $ 375 365 $ (945 ) $ 4,268 2013: Deducted from asset accounts—Allowance for doubtful accounts receivable $ 4,268 $ 75 $ 2,192 $ (640 ) $ 5,895 2014: Deducted from asset accounts—Allowance for doubtful accounts receivable $ 5,895 $ 2,347 $ 265 $ (1,083 ) $ 7,424 (1) Uncollectible accounts receivable written off, net of recoveries. Balance at
Beginning of
Period Additions
Charged to
Costs and
Expenses Additions
Through
Acquisition Other Changes
Add (Deduct)(2) Balance at
End of Period $ 17,216 $ 6,400 — $ (8,023 ) $ 15,593 $ 15,593 $ 5,840 — $ (5,223 ) $ 16,210 $ 16,210 $ 4,611 $ 725 $ (5,603 ) $ 15,943 Balance at
Beginning of
Period Additions
Charged to
Costs and
Expenses Additions
Through
Acquisition Other Changes
Add (Deduct)(2) Balance at
End of Period(In thousands) �� 2012: Deducted from asset accounts—Allowance for obsolete inventory $ 15,943 $ 6,258 $ 15 $ (4,859 ) $ 17,357 2013: Deducted from asset accounts—Allowance for obsolete inventory $ 17,357 $ 9,966 $ 2,423 $ (8,143 ) $ 21,603 2014: Deducted from asset accounts—Allowance for obsolete inventory $ 21,603 $ 12,868 $ 600 $ (8,900 ) $ 26,171 (2) Inventory disposals, net of recoveriesrecoveries.POLARIS INDUSTRIES INC.EXHIBIT INDEX TO ANNUAL REPORT ONFORM 10-KFor Fiscal Year Ended December 31, 2011ExhibitNumberDescriptionExhibit Number 3.a Restated Articles of Incorporation of Polaris Industries Inc. (the “Company”), effective October 24, 2011, incorporated by reference to Exhibit 3.a to the Company’s Quarterly Report on Form 10-Q for the quarter ended September 30, 2011. .b Bylaws of the Company, as amended and restated on April 29, 2010, incorporated by reference to Exhibit 3 to the Company’s Quarterly Report on Form 10-Q for the quarter ended June 30, 2010. 4.a Specimen Stock Certificate of the Company, incorporated by reference to Exhibit 4 to the Company’s Registration Statement on Form S-4,S-4/A, filed November 21, 1994 (No. 033-55769). .b Amended and Restated Rights Agreement, dated as of April 29, 2010 by and between the Company and Wells Fargo Bank Minnesota, N.A., as Rights Agent, incorporated by reference to Exhibit 4.1 to the Company’s Current Report on Form 8-K filed April 30, 2010. .c Master Note Purchase Agreement by and among Polaris Industries Inc. and the purchasers party thereto, dated December 13, 2010, incorporated by reference to Exhibit 4.1 to the Company’s Current Report on Form 8-K filed December 15, 2010. .d First Amendment to Master Note Purchase Agreement effective as of August 18, 2011, incorporated by reference to Exhibit 4.c to the Company’s Quarterly Report on Form 10-Q for the quarter ended September 30, 2011. 10.a .eShareholderFirst Supplement to Master Note Purchase Agreement with Fuji Heavy Industries LTD.,effective as of December 19, 2013, incorporated by reference to Exhibit 10(k)4.1 to the Company’s AnnualCurrent Report on Form 10-K for the year ended8-K, filed December 31, 1994.20, 2013. .b 10.a Amendments to the Polaris Industries Inc. Supplemental Retirement/Savings Plan, as amended and restated effective December 31, 2008,July 23, 2014, incorporated by reference to Exhibit 10.a to the Company’s CurrentQuarterly Report on Form 8-K10-Q filed January 28, 2009.October 29, 2014.* .c.b Polaris Industries Inc. 1995 Stock Option Plan, as amended and restated, incorporated by reference to Exhibit 99.1 to the Company’s Registration Statement on Form S-8, filed October 31, 2005 (No. 333-129335).* .d.c Form of Nonqualified Stock Option Agreement and Notice of Exercise Form for options granted under the Polaris Industries Inc. 1995 Stock Option Plan, as amended and restated, incorporated by reference to Exhibit 99.2 to the Company’s Registration Statement on Form S-8, filed October 31, 2005 (No. 333-129335).* .e.dForm of Nonqualified Stock Option Agreement and Notice of Exercise Form for options grantedAmendment to the Chief Executive Officer under the Polaris Industries Inc. 1995 Stock Option Plan, as amended and restated, incorporated by reference to Annex A to Exhibit 10(q) to the Company’s Current Report on Form 8-K, filed February 2, 2005.* .fPolaris Industries Inc. Deferred Compensation Plan for Directors, as amended and restated, incorporated by reference to Exhibit 10.1 to the Company’s Current Report on Form 8-K filed on May 12, 2009.* .gPolaris Industries Inc. Restricted Stock Plan, as2009, subsequently amended and restated effective January 20, 2005,on July 25, 2012, incorporated by reference to Exhibit 10.n10.a to the Company’s CurrentQuarterly Report on Form 8-K, filed April 26, 2005.10-Q for the quarter ended September 30, 2012.*ExhibitNumberDescription .h Form of Performance Restricted Share Award Agreement for performance restricted shares awarded under the Polaris Industries Inc. Restricted Stock Plan, as amended and restated, incorporated by reference to Exhibit 4.2 to the Company’s Registration Statement on Form S-8, filed June 7, 1996 (No. 333-05463).* .i.e Form of Change of Control Agreement entered into with executive officers of Company, incorporated by reference to Exhibit 10(q) to the Company’s Annual Report on Form 10-K for the year ended December 31, 1996.* .j.f Form of Amendment to the Form of Change in Control Agreement entered into with executive officers of Company, incorporated by reference to Exhibit 10.f to the Company’s Current Report on Form 8-K filed October 31, 2007.* .kPolaris Industries Inc. 2003 Non-Employee Director Stock Option Plan, as amended and restated on January 20, 2010, incorporated by reference to Exhibit 10.qq to the Company’s Annual Report on Form 10-K for the year ended December 31, 2009.* .lPolaris Industries Inc. 2003 Non-Employee Director Stock Option Plan Amended and Restated Stock Option Agreement, amended as of January 20, 2010, incorporated by reference to Exhibit 10.rr to the Company’s Annual Report on Form 10-K for the year ended December 31, 2009.* .m.g Polaris Industries Inc. Senior Executive Annual Incentive Compensation Plan, as amended and restated effective January 22, 2009,April 24, 2014, incorporated by reference to Exhibit 10.3Annex A to the Company’s Current Report on Form 8-KProxy Statement for the 2014 Annual Meeting of Shareholders filed on May 12, 2009.March 7, 2014.* .n.h Polaris Industries Inc. Long Term Incentive Plan, as amended and restated effective January 22, 2009 and as further amended effective January 20, 2011, incorporated by reference to Annex B to the Company’s Proxy Statement for the 2011 Annual Meeting of Shareholders filed March 10, 2011.* .o.i Polaris Industries Inc. 2007 Omnibus Incentive Plan (As Amended and Restated April 28, 2011), incorporated by reference to Annex A to the Company’s Proxy Statement for the 2011 Annual Meeting of Shareholders filed March 10, 2011.* .p.j Form of Performance Based Restricted Share Award Agreement for performance based restricted shares awarded to named executive officers in 2008 under the Polaris Industries IncInc. 2007 Omnibus Incentive Plan, as amended and restated, incorporated by reference to Exhibit 10.A10.a to the Company’s Quarterly Report on Form 10-Q for the quarter ended September 30, 2009.* .q.k Polaris Industries Inc. 2007 Omnibus Incentive Plan (As Amended and Restated April 28, 2011) Performance Based Restricted Share Award Agreement form (Single Trigger), incorporated by reference to Exhibit 10.4 to the Company’s Current Report on Form 8-K filed on May 2,3, 2011.* .r.l Polaris Industries Inc. 2007 Omnibus Incentive Plan (As Amended and Restated April 28, 2011) Performance Based Restricted Share Award Agreement form (Double Trigger), incorporated by reference to Exhibit 10.5 to the Company’s Current Report on Form 8-K filed on May 2,3, 2011.* .s.m Form of Stock Option Agreement and Notice of Exercise Form for options (cliff vesting) granted to executive officers under the Polaris Industries Inc. 2007 Omnibus Incentive Plan, incorporated by reference to Exhibit 10.ff to the Company’s Current Report on Form 8-K filed February 4, 2008.* .t.n Form of Stock Option Agreement and Notice of Exercise Form for options (installment vesting) granted to executive officers under the Polaris Industries Inc. 2007 Omnibus Incentive Plan, incorporated by reference to Exhibit 10.t to the Company’s Annual Report on Form 10-K for the year ended December 31, 2008.* ExhibitNumber Description .u.o Polaris Industries Inc. 2007 Omnibus Incentive Plan (As Amended and Restated April 28, 2011) Nonqualified Stock Option Agreement form (Single Trigger), incorporated by reference to Exhibit 10.2 to the Company’s Current Report on Form 8-K filed on May 2,3, 2011.* .v.p Polaris Industries Inc. 2007 Omnibus Incentive Plan (As Amended and Restated April 28, 2011) Nonqualified Stock Option Agreement form (Double Trigger), incorporated by reference to Exhibit 10.3 to the Company’s Current Report on Form 8-K filed on May 2,3, 2011.* .w.q Polaris Industries Inc. 2007 Omnibus Incentive Plan (As Amended and Restated April 28, 2011) Restricted Stock Award Agreement, incorporated by reference to Exhibit 10.6 to the Company’s Current Report on Form 8-K filed on May 2,3, 2011.* .x.r Form of Deferred Stock Award Agreement for shares of deferred stock granted to non-employee directors in 2007 under the Polaris Industries Inc. 2007 Omnibus Incentive Plan, incorporated by reference to Exhibit 10.t to the Company’s Annual Report on Form 10-K for the year ended December 31, 2007.* .y.s Form of Performance Restricted Stock Unit Award Agreement under the Polaris Industries Inc. 2007 Omnibus Incentive Plan*Plan, incorporated by reference to Exhibit 10.y to the Company’s Annual Report on Form 10-K for the year ended December 31, 2011.* .z .t Employment Offer Letter dated April 4, 2005 by and between the Company and Bennett J. Morgan, incorporated by reference to Exhibit 10.y to the Company’s Current Report on Form 8-K, filed April 18, 2005.* .aa.u Employment Offer Letter Agreement dated July 28, 2008 by and between the Company and Scott W. Wine, incorporated by reference to Exhibit 10.a to the Company’s Current Report on Form 8-K filed August 4, 2008.* .bb.v Employment Offer Letter Agreement dated February 18, 2010 by and between the Company and Suresh Krishna.* .ccEmployment Letter Agreement dated January 12, 2011 by and between the Company and James P. Williams.Williams, incorporated by reference to Exhibit 10.cc to the Company’s Annual Report on Form 10-K for the year ended December 31, 2011.* .dd.w Employment Offer Letter Agreement dated August 18, 2011September 15, 2014 by and between the Company and MatthewKenneth J. Homan.Pucel.* .ee.x Form of Severance Agreement entered into with executive officers of the Company, incorporated by reference to Exhibit 10.dd to the Company’s Current Report on Form 8-K filed January 17, 2008.* .ff.yForm of Severance, Proprietary Information and Noncompetition Agreement entered into with Scott W. Wine, incorporated by reference to Exhibit 10.b to the Company’s Current Report on Form 8-K filed August 4, 2008.* .gg.z Form of Severance Agreement entered into with Bennett J. Morgan, incorporated by reference to Exhibit 10.ee to the Company’s Current Report on Form 8-K filed January 17, 2008.* .hhPolaris Industries Inc. Early Retirement Perquisite Policy for the Chief Executive Officer, incorporated by reference to Exhibit 10.y to the Company’s Annual Report on Form 10-K for the year ended December 31, 2007.* .iiPolaris Industries Inc. Retirement Perquisite Policy for the Chief Executive Officer, incorporated by reference to Exhibit 10.z to the Company’s Annual Report on Form 10-K for the year ended December 31, 2007.* .jjPolaris Industries Inc. Early Retirement Perquisite Policy for executive officers, incorporated by reference to Exhibit 10.aa to the Company’s Annual Report on Form 10-K for the year ended December 31, 2007.*ExhibitNumberDescription .kkPolaris Industries Inc. Retirement Perquisite Policy for executive officers, incorporated by reference to Exhibit 10.bb to the Company’s Annual Report on Form 10-K for the year ended December 31, 2007.* .ll.aa Amended and Restated Joint Venture Agreement dated as of February 28, 2011, by and between the Company and GE Commercial Distribution Finance Corporation, incorporated by reference to Exhibit 10.1 to the Company’s Current Report on Form 8-K filed March 1, 2011. .mm.bb Credit Agreement, dated as of August 18, 2011, by and among the Company, one or more of its foreign subsidiaries designated thereafter as foreign borrowers, the lenders identified therein, U.S. Bank National Association, as Administrative Agent, Lead Arranger and Lead Book Runner, RBC Capital Markets and Wells Fargo Securities, LLC, as Joint Lead Arrangers and Joint Book Runners, RBC Capital Markets and Wells Fargo Bank National Association, as Syndication Agents, and The Bank of Tokyo-Mitsubishi UFJ, LTD.Ltd., as Documentation Agent, incorporated by reference to Exhibit 10.1 to the Company’s Report on Form 8-K filed on August 22, 2011. .nn.cc First Amendment to the Credit Agreement, dated December 20, 2011, by and among the Company, and any designated Foreign Borrower, the lenders from time to time party to the Credit Agreement, and U.S. Bank National Association, as one of the lenders, lead arranger, lead book runner, and administrative agent for the lenders.lenders, incorporated by reference to Exhibit 10.nn to the Company’s Annual Report on Form 10-K for the year ended December 31, 2011. .oo .dd Second Amendment to the Credit Agreement, dated January 31, 2013, by and among the Company, and any designated Foreign Borrower, the lenders from time to time party to the Credit Agreement, and U.S. Bank National Association, as one of the lenders, lead arranger, lead book runner, and administrative agent for the lenders, incorporated by reference to Exhibit 10.nn to the Company’s Annual Report on Form 10-K for the year ended December 31, 2012. .ee Amended and Restated Manufacturer’s Repurchase Agreement dated as of February 28, 2011, by and among the Company, Polaris Industries Inc., a Delaware Corporation, Polaris Sales Inc., and Polaris Acceptance, incorporated by reference to Exhibit 10.2 to the Company’s Current Report on Form 8-K filed March 1, 2011. .ff Share Repurchase Agreement dated November 12, 2013, by and among the Company and Fuji Heavy Industries Ltd., incorporated by reference to Exhibit 10.1 to the Company’s Current Report on Form 8-K filed November 12, 2013. .gg Form of Nonqualified Stock Option Agreement entered into with Kenneth J. Pucel.* .hh Form of Performance Restricted Stock Unit Award Agreement entered into with Kenneth J. Pucel.* .ii Form of Severance Agreement entered into with Kenneth J. Pucel.* .jj Form of Incentive Plan Acknowledgement for David C. Longren.* 13 Portions of the Annual Report to Security Holders for the Year Ended December 31, 20112014 included pursuant to Note 2 to General Instruction G. 21 Subsidiaries of Registrant. 23 Consent of Ernst & Young LLP. 24 Power of Attorney. 31.a Certification of Chief Executive Officer required by Exchange Act Rule 13a-14(a). 31.b Certification of Chief Financial Officer required by Exchange Act Rule 13a-14(a). 32.a Certification furnished pursuant to 18 U.S.C. 1350, as adopted pursuant to Section 906 of the Sarbanes-Oxley Act of 2002. 32.b Certification furnished pursuant to 18 U.S.C. 1350, as adopted pursuant to Section 906 of the Sarbanes-Oxley Act of 2002. 101.INS 101XBRL Instance Document101.SCHXBRL Schema Document101.CALXBRL Calculation Linkbase Document101.DEFXBRL Definition Linkbase Document101.LABXBRL Label Linkbase Document101.PREXBRL Presentation Linkbase Document*Management contract or compensatory plan.85