uncertainty as to changes in North American and European general economic activity and the impact of these changes on the demand for our products and our ability to obtain financing for operations;
fluctuations in the pricing of new original equipment manufacturer (“OEM”) replacement products;
the availability and cost of our inventory;
variations in the number of vehicles sold, vehicle accident rates, or miles driven;
changes in state or federal laws or regulations affecting our business;
changes in the types of replacement parts that insurance carriers will accept in the repair process;
inaccuracies in the data relating to our industry published by independent sources upon which we rely;
increasing competition in the automotive parts industry;
uncertainty as to the impact on our industry of any terrorist attacks or responses to terrorist attacks;
our ability to satisfy our debt obligations and to operate within the limitations imposed by financing arrangements;
our ability to obtain financing on acceptable terms to finance our growth;
declines in the values of our assets;
fluctuations in fuel and other commodity prices;
fluctuations in the prices of scrap metal and other metals;
our ability to develop and implement the operational and financial systems needed to manage our operations;
our ability to identify sufficient acquisition candidates at reasonable prices to maintain our growth objectives;
claims by OEMs or others that attempt to restrict or eliminate the sale of aftermarketalternative automotive products;
termination of business relationships with insurance companies that promote the use of our products;
product liability claims by the end users of our products or claims by other parties who we have promised to indemnify for product liability matters;
costs associated with recalls of the products we sell;
periodic adjustments to estimated contingent purchase price amounts; and
instability in regions in which we operate such as Mexico, that can affect our supply of certain products.
2
addition, all subsequent written and oral forward-looking statements attributable to us or persons acting on our behalf are expressly qualified in their entirety by the cautionary statements mentioned above. You should not place undue reliance on these forward-looking statements. All of these forward-looking statements are based on our expectations as of the date of this Annual Report. We undertake no obligation to publicly update or revise any forward-looking statements, whether as a result of new information, future events or otherwise, except as required by law.
Self Service) into one reportable segment, resulting in two reportable segments: North America and Europe. See and the Netherlands. We believe this acquisition will expand our core and remanufactured product mix and will allow us to expand our product offering to include certain parts also purchased by OEMs. In February 2014, we acquired a wholesale salvage operation and a self service operation in North America, which we believe will expand our market share in the respective markets. businesses that may benefit from our operating offerings. provides us with an additional source of supply and offers lower transaction costs to sellers of low value salvage vehicles. distribution channels. systems also recommend purchases and transfers based on the extent and location of Products As of December 31, 2013, our North American wholesale operations conducted business from 325 facilities. NSF International ("NSF"). CAPA and NSF are associations that evaluate the functional equivalence of aftermarket collision replacement products to OEM collision replacement products. Members of CAPA and NSF include insurance companies, product distributors (including LKQ), collision repair shops and consumers. CAPA and NSF develop engineering specifications for aftermarket collision replacement products based upon examinations of OEM products; certify the factories, manufacturing processes and quality control procedures used by independent manufacturers; and certify the materials, fit and finish of specific aftermarket collision replacement products. Canada. We have business arrangements with manufacturers to produce certain of our the date ordered. Foreign orders typically are shipped in sea containers directly to at auction. than their original purpose. We also extract and sell the precious metals contained in certain of our salvage parts such as catalytic converters. 2013. available, the shop may then use new OEM replacement products. As a body shop looks for products for a repair, the sourcing of products typically begins with a call to one of our recycled operations or one of our competitors. Our recycled sales personnel are encouraged to capture the sale as a We do not consider retail chains that focus on the do-it-yourself market to be our direct competitors since many of our wholesale product sales are paid for by insurance companies rather than the end user. product quality. America, most of which operate under the name "LKQ Pick Your Part." charitable organizations. We typically procure salvage vehicles that are more than in North America. availability. system provides, such as a data warehouse to conduct enhanced analytics and reporting, an integrated budgeting system, an electronic data interchange tool, and eCommerce tools to enhance our online business-to-business initiatives—OrderKeystone.com and Keyless. purposes. We use separate third party provided software for our financial systems such as financial and budget reporting, general ledger accounting, accounts payable, payroll, and fixed assets. We currently protect our local customer, inventory, and corporate consolidated data, such as financial information, e-mail files, and other user files, with daily backups. These backups are stored off site with a third party data protection vendor. Additionally, we restrict access to customer, employee and vendor data to those users that have permission granted to them as part of their job function. Customer credit card information is not stored, and the card information is encrypted when it is processed for authorization. cadmium, chromium, lead, and mercury. Contamination from the refurbishment of chrome plated bumpers can occur from the release of the plating material. Contamination can migrate on-site or off-site which can increase the risk, and the amount, of any potential liability. financial condition and cash flows. In January 2014, Chrysler Group, LLC filed a complaint against us in the U.S. Additionally, as manufacturers convert to raw materials other than steel, it may be more difficult or expensive to source aftermarket parts made with such materials and it may be more difficult for repair shops to work with such materials in the repair process. In addition, there is a limited supply of salvage vehicles in the U.S. As we grow and our demand for salvage vehicles increases, the costs of these incremental vehicles could be higher. to promote the usage of alternative parts. Certain organizations test the quality and safety of vehicle replacement products. If these organizations decide not to test a particular vehicle product or in the event that such organizations decide that a particular vehicle product does not meet applicable quality or safety standards, we may decide to discontinue sales of such product or insurance companies may decide to discontinue authorization of repairs using such product. Such events could adversely affect our business. customers of the acquired company may decide not to purchase products from us; suppliers of the acquired company may decide not to sell products to us; we may experience additional financial and accounting challenges and complexities in areas such as tax planning, treasury management, and financial reporting; we may be held liable for environmental, tax or other risks and liabilities as a result of our acquisitions, some of which we may not have discovered during our due diligence; we may intentionally assume the liabilities of the companies we acquire, which could our existing business may be disrupted or receive insufficient management attention; we may not be able to realize the cost savings or other financial benefits we anticipated, either in the amount or in the time frame that we expect; and we may incur debt or issue equity securities to pay for any future acquisition, the issuance of which could involve the imposition of restrictive covenants or be dilutive to our existing stockholders. could decrease. air, or water; exposure to hazardous materials; and the generation, handling, storage, use, treatment, identification, transportation, and disposal of industrial by-products, waste water, storm water, and mercury and other hazardous materials. We are also required to obtain environmental permits from governmental authorities for certain of our operations. If we violate or fail to obtain or comply with these laws, regulations, or permits, we could be fined or otherwise sanctioned by regulators. We could also become liable if employees or other parties are improperly exposed to hazardous materials. claims and involved in product recalls. 2010 First Quarter Second Quarter Third Quarter Fourth Quarter 2011 First Quarter Second Quarter Third Quarter Fourth Quarter Based on limitations in effect under our senior secured credit agreement and senior notes indenture as of December 31, 2013, the maximum amount of dividends we could pay in a fiscal year is approximately $125 million. The annual limit on the payment of dividends is calculated using historical financial information and will change from period to period. LKQ Corporation NASDAQ Stock Market (U.S.) Index Peer Group 2013 Plan Category Equity compensation plans approved by stockholders Stock options Restricted stock units Total equity compensation plans approved by stockholders Equity compensation plans not approved by stockholders Total is incorporated herein by reference. Statements of Income Data: Revenue Cost of goods sold Gross margin Operating income Other (income) expense Interest, net Other (income) expense, net Income from continuing operations before provision for income taxes Provision for income taxes Income from continuing operations Basic earnings per share from continuing operations Diluted earnings per share from continuing operations Weighted average shares outstanding-basic(f) Weighted average shares outstanding-diluted(f) Other Financial Data: Net cash provided by operating activities Net cash used in investing activities Net cash provided by (used in) financing activities Capital expenditures(g) Depreciation and amortization Balance Sheet Data: Total assets Working capital Long-term obligations, including current portion Stockholders’ equity and Investments In addition to our ECP acquisition, our product cost. materials sold. vehicles. Our cost of goods sold for other revenue will fluctuate based on the prices paid for salvage vehicles, which may be impacted by a variety of factors as discussed above. fees. which generate repairs. customer. through Change in Fair Value of Contingent Consideration Liabilities within Other Expense (Income) on our Consolidated Statements of Income. The fair value measurement of the liability is performed by our corporate accounting department using current information about key assumptions, with the input and oversight of our operational and executive management teams. Each reporting period, we evaluate the performance of the business compared to our previous expectations, along with any changes to our future projections, and update the estimated cash flows accordingly. In addition, we consider changes to our cost of capital and changes to the probability of achieving the earnout payment targets when updating our discount rate on a quarterly basis. 2013 performance period related to our 2011 acquisition of ECP, which we expect to pay in the first quarter of 2014. As of We carrying value. Statements of Income Data: Revenue Cost of goods sold Gross margin Facility and warehouse expenses Distribution expenses Selling, general and administrative expenses Restructuring and acquisition related expenses Depreciation and amortization Operating income Other expense, net Income from continuing operations before provision for income taxes Provision for income taxes Income from continuing operations Income from discontinued operations Net income this Annual Report on Form 10-K for further information on the lawsuit settlements. 2011. Revenue North America. Europe Total revenue EBITDA North America. Europe Total EBITDA Net Income. Includes our revolving credit facility and our receivables securitization facility. financial condition. able to do so on acceptable terms. business each year. year. long term incentive plan. prior year period. Contractual obligations Long-term debt Operating leases Purchase obligations Contingent consideration liabilities Outstanding letters of credit Other asset purchase commitments Purchase price payable Other long-term obligations Self-insurance reserves Deferred compensation plans Long term incentive plan Liabilities for unrecognized tax benefits Total maturity dates to specific debt instruments. Net interest payments or receipts from interest rate swap contracts are included as adjustments to interest expense. All of our interest rate swap contracts have been executed with banks that we believe are creditworthy Current Assets: Cash and equivalents Receivables, net Inventory Deferred income taxes Prepaid income taxes Prepaid expenses and other current assets Total Current Assets Property and Equipment, net Intangible Assets Goodwill Other intangible assets, net Other Assets Total Assets Current Liabilities: Accounts payable Accrued expenses Accrued payroll-related liabilities Self-insurance reserves Other accrued expenses Other current liabilities Current portion of long-term obligations Liabilities of discontinued operations Total Current Liabilities Long-Term Obligations, Excluding Current Portion Deferred Income Taxes Contingent Consideration Liabilities Other Noncurrent Liabilities Commitments and Contingencies Stockholders’ Equity: Common stock, $0.01 par value, 500,000,000 shares authorized, 146,948,608 and 145,466,575 shares issued and outstanding at December 31, 2011 and 2010, respectively. Additional paid-in capital Retained earnings Accumulated other comprehensive (loss) income Total Stockholders’ Equity Total Liabilities and Stockholders’ Equity Revenue Cost of goods sold Gross margin Facility and warehouse expenses Distribution expenses Selling, general and administrative expenses Restructuring and acquisition related expenses Depreciation and amortization Operating income Other expense (income): Interest expense Interest income Gain on bargain purchase Loss on debt extinguishment Change in fair value of contingent consideration liabilities Other income, net Total other expense, net Income from continuing operations before provision for income taxes Provision for income taxes Income from continuing operations Discontinued operations: Income (loss) from discontinued operations, net of taxes Gain on sale of discontinued operations, net of taxes Income from discontinued operations Net income Basic earnings per share(a): Income from continuing operations Income from discontinued operations Total Diluted earnings per share(a): Income from continuing operations Income from discontinued operations Total CASH FLOWS FROM OPERATING ACTIVITIES: Net income Adjustments to reconcile net income to net cash provided by operating activities: Depreciation and amortization Stock-based compensation expense Deferred income taxes Excess tax benefit from stock-based payments Amortization of debt issuance costs Loss on debt extinguishment Gain on sale of discontinued operations Gain on bargain purchase Loss on asset impairment Other Changes in operating assets and liabilities, net of effects from acquisitions and divestitures: Receivables Inventory Prepaid expenses and other assets Accounts payable Accrued expenses Prepaid income taxes/income taxes payable Deferred revenue Other noncurrent liabilities Net cash provided by operating activities CASH FLOWS FROM INVESTING ACTIVITIES: Purchases of property and equipment Proceeds from sales of property and equipment Proceeds from sale of businesses, net of cash sold Cash used in acquisitions, net of cash acquired Net cash used in investing activities CASH FLOWS FROM FINANCING ACTIVITIES: Proceeds from exercise of stock options Excess tax benefit from stock-based payments Debt issuance costs Borrowings under revolving credit facility Repayments under revolving credit facility Borrowings under term loan Repayments under term loans Repayments of other long-term debt Net cash provided by (used in) financing activities Effect of exchange rate changes on cash and equivalents Net (decrease) increase in cash and equivalents Cash and equivalents, beginning of period Cash and equivalents, end of period Supplemental disclosure of cash flow information: Purchase price payable, including notes issued in connection with business acquisitions Contingent consideration liabilities Stock issued in connection with business acquisitions Debt assumed with business acquisitions Cash paid for income taxes, net of refunds Cash paid for interest Property and equipment acquired under capital leases Property and equipment purchases not yet paid BALANCE, January 1, 2009 Net income Unrealized loss on pension plan, net of tax Net reduction of unrealized loss on fair value of interest rate swap agreements, net of tax Foreign currency translation Total comprehensive income Restricted stock granted Stock issued as director compensation Stock-based compensation expense Exercise of stock options Excess tax benefit from BALANCE, December 31, 2009 Net income Reversal of unrealized gain on pension plan, net of tax Net reduction of unrealized loss/increase in unrealized gain on fair value of interest rate swap agreements, net of tax Foreign currency translation Total comprehensive income Stock issued in business acquisitions Stock issued as director compensation Stock-based compensation expense Exercise of stock options Excess tax benefit from BALANCE, December 31, 2010 BALANCE, December 31, 2010 Net income Net reduction of unrealized gain/increase in unrealized loss on fair value of interest rate swap agreements, net of tax Foreign currency translation Total comprehensive income Restricted stock units vested Stock issued as director compensation Stock-based compensation expense Exercise of stock options Excess tax benefit from BALANCE, December 31, 2011 customer. Revenue also includes amounts billed to customers products. Aftermarket and refurbished products Salvage and remanufactured products Core facilities inventory Land improvements Buildings and improvements Furniture, fixtures and equipment Computer equipment and software Vehicles and trailers Land and improvements Buildings and improvements Furniture, fixtures and equipment Computer equipment and software Vehicles and trailers Leasehold improvements Less—Accumulated depreciation Construction in progress compete. Balance as of January 1, 2009 Business acquisitions and adjustments to previously recorded goodwill Exchange rate effects Balance as of December 31, 2009 Business acquisitions and adjustments to previously recorded goodwill Exchange rate effects Balance as of December 31, 2010 Business acquisitions and adjustments to previously recorded goodwill Exchange rate effects Balance as of December 31, 2011 2013 and 2012, respectively. Trade names and trademarks Covenants not to compete Customer relationships Balance as of January 1, 2010 Warranty expense Warranty claims Business acquisitions Balance as of December 31, 2010 Warranty expense Warranty claims Business acquisitions Balance as of December 31, 2011 See Note Revenue Income (loss) before income tax provision (benefit) Income tax provision (benefit) Income (loss) from discontinued operations, net of taxes, before gain on sale of discontinued operations Gain on sale of discontinued operations, net of taxes of $1,015 and $1,452 in 2010 and 2009, respectively Income from discontinued operations, net of taxes The total number of shares approved by our stockholders for issuance under the Equity Incentive Plan is a continued service condition. Shares of restricted stock may not be sold, pledged or otherwise transferred until they vest. Balance, January 1, 2009 Granted Exercised Vested Cancelled Balance, December 31, 2009 Granted Exercised Vested Cancelled Balance, December 31, 2010 Granted Shares Issued for Director Compensation Exercised Vested Cancelled Additional Shares Authorized Balance, December 31, 2011 therefore are not reflected as grants or cancellations in the table above. Stock options RSUs Restricted stock 2013 Range of Exercise Prices $0.75 - $5.00 $5.01 - $10.00 $10.01 - $15.00 $15.01 - $20.00 $20.01 + 2013 Expected life (in years) Risk-free interest rate Volatility Dividend yield Weighted average fair value of options granted Stock options RSUs Restricted stock Stock issued to non-employee directors Total stock-based compensation expense Cost of goods sold Facility and warehouse expenses Selling, general and administrative expenses Income tax benefit Total stock based compensation, net of tax 2012 2013 2014 2015 2016 Total unrecognized compensation expense Senior secured debt financing facility: Term loans payable Revolving credit facility Notes payable through October 2018 at a weighted average interest rate of 2.0% and 2.4% at December 31, 2011 and 2010, respectively Other long-term debt at a weighted average interest rate of 3.2% and 6.6% at December 31, 2011 and 2010, respectively Less current maturities 2012 2013 2014 2015 2016 Thereafter for general corporate purposes. Agreement without penalty. outstanding letters of credit at an applicable rate based on our At December 31, Our interest rate swap contracts have maturity dates ranging from 2015 through 2016. Gain (loss) in Other Comprehensive Income (Loss) Loss reclassified to interest expense Loss from hedge ineffectiveness cash flow hedges to have a material effect on our results of operations. Assets: Cash surrender value of life insurance Total Assets Liabilities: Contingent consideration liabilities Deferred compensation liabilities Interest rate swaps Total Liabilities Assets: Cash surrender value of life insurance Interest rate swaps Total Assets Liabilities: Deferred compensation liabilities Contingent consideration liabilities Interest rate swaps Total Liabilities Balance as of January 1, 2010 Contingent consideration liabilities recorded for business acquisitions Balance as of December 31, 2010 Contingent consideration liabilities recorded for business acquisitions (Gain) loss included in earnings, net Exchange rate effects Balance as of December 31, 2011 Years ending December 31: 2012 2013 2014 2015 2016 Thereafter Future Minimum Lease Payments operations or cash flows. 2013 performance period. We recorded goodwill of Total acquisition date fair value of the consideration for these 20 acquisitions was During the year ended December 31, 2011, we recorded We have recorded preliminary estimates for certain of the items noted above and will record adjustments, if any, to the preliminary amounts upon finalization of the valuations. Receivables Receivable reserves Inventory Prepaid expenses and other current assets Property and equipment Goodwill Other intangibles Other assets Deferred income taxes Current liabilities assumed Debt assumed Other noncurrent liabilities assumed Contingent consideration liabilities Other purchase price obligations Notes issued Stock issued Cash used in acquisitions, net of cash acquired Our subsequent acquisitions in Europe have allowed us to further expand our market presence in this segment, including continental Europe through the Sator acquisition, as well as to widen our product offerings such as paint and related equipment in the U.K. We believe that our Sator acquisition will allow for synergies within our European operations, most notably in procurement, warehousing and product management. These projected synergies contributed to the goodwill recorded on the Sator acquisition. Revenue as reported Revenue of purchased businesses for the period prior to acquisition: ECP Other acquisitions Pro forma revenue Income from continuing operations, as reported Net income of purchased businesses for the period prior to acquisition, including pro forma purchase accounting adjustments: ECP Other acquisitions Pro forma income from continuing operations Basic earnings per share from continuing operations, as reported Effect of purchased businesses for the period prior to acquisition: ECP Other acquisitions Pro forma basic earnings per share from continuing operations(a) Diluted earnings per share from continuing operations, as reported Effect of purchased businesses for the period prior to acquisition: ECP Other acquisitions Pro forma diluted earnings per share from continuing operations(a) Income from continuing operations Denominator for basic earnings per share—Weighted-average shares outstanding Effect of dilutive securities: Stock options RSUs Restricted stock Denominator for diluted earnings per share—Adjusted weighted-average shares outstanding Basic earnings per share from continuing operations Diluted earnings per share from continuing operations Antidilutive securities: Stock options Restricted stock Current: Federal State Foreign Deferred Provision for income taxes Domestic Foreign U.S. federal statutory rate State income taxes, net of state credits and federal tax impact Non-deductible expenses Impact of international operations Federal production incentives and credits Revaluation of deferred taxes Non-taxable gain on bargain purchase Other, net Effective tax rate jurisdictions. Deferred Tax Assets: Inventory Accrued expenses and reserves Accounts receivable Stock based compensation Qualified and nonqualified retirement plans Net operating loss carryforwards Interest rate swaps Long term incentive plan Unrecognized tax benefits Other Less valuation allowance Total deferred tax assets Deferred Tax Liabilities: Goodwill and other intangible assets Property and equipment Trade name Other Total deferred tax liabilities Net deferred tax liability Current deferred tax assets Current deferred tax liabilities Noncurrent deferred tax liabilities Sheets. Balance at January 1 Additions based on tax positions related to the current year Additions for tax positions of prior years Reductions for tax positions of prior years Reductions for tax positions of prior years—timing differences Lapse of statutes of limitations Settlements with taxing authorities Balance at December 31 Balance at January 1, 2009 Pretax income (loss) Income tax benefit Reversal of unrealized loss Reversal of deferred income taxes Balance at December 31, 2009 Pretax income Income tax expense Reversal of unrealized (gain) loss Reversal of deferred income taxes Balance at December 31, 2010 Pretax loss Income tax benefit Reversal of unrealized loss Reversal of deferred income taxes Hedge ineffectiveness Income tax benefit Balance at December 31, 2011 Revenue North America Europe Total revenue EBITDA North America Europe Total EBITDA �� Depreciation and Amortization North America Europe Total depreciation and amortization EBITDA Depreciation and amortization Interest expense, net Loss on debt extinguishment Provision for income taxes Income from continuing operations Capital Expenditures North America Europe Receivables, net North America Europe Total receivables, net Inventory North America Europe Total inventory Property and Equipment, net North America Europe Total property and equipment, net Other unallocated assets Total assets Revenue United States. United Kingdom Other countries Long-lived Assets United States. United Kingdom Other countries Aftermarket, other new and refurbished products Recycled, remanufactured and related products and services Other The following table 2010 Revenue Gross margin Operating income Income from continuing operations Income from discontinued operations Net income Basic earnings per share from continuing operations(1) Diluted earnings per share from continuing operations(1) 2011 Revenue Gross margin Operating income Income from continuing operations Income from discontinued operations Net income Basic earnings per share from continuing operations(1) Diluted earnings per share from continuing operations(1) Commission ("SEC") is recorded, processed, summarized and reported within the time periods specified in the SEC’s rules and forms and that information required to be disclosed is accumulated and communicated to the Company’s management, including our Chief Executive Officer and Chief Financial Officer, as appropriate to allow timely decisions regarding required disclosure. March 3, 2014 2013. accounting firm, who audited and reported on the consolidated financial statements of the Company included in this report, has issued an attestation report on the effectiveness of our internal control over financial reporting as of 2013 Name Position www.lkqcorp.com. Descriptions ALLOWANCE FOR DOUBTFUL ACCOUNTS: Year ended December 31, 2009 Year ended December 31, 2010 Year ended December 31, 2011 ALLOWANCE FOR ESTIMATED RETURNS, DISCOUNTS & ALLOWANCES: Year ended December 31, 2009 Year ended December 31, 2010 Year ended December 31, 2011 Pursuant to the requirements of Section 13 or 15(d) of the Securities Exchange Act of 1934, the registrant has duly caused this report to be signed on its behalf by the undersigned, thereunto duly authorized, on By: Signature Paul M. Meister(“LKQ”("LKQ" or the “Company”"Company") provides replacement parts, components and systems needed to repair vehicles (carscars and trucks).trucks. Buyers of vehicle replacement products have the option to purchase from primarily five sources: new products produced by original equipment manufacturers (“OEMs”("OEMs"), which are commonly known as OEM products;; new products produced by companies other than the OEMs, which are sometimes referred to as “aftermarket”aftermarket products; recycled products originally produced by OEMs, which we refer to as recycled products;obtained from salvage vehicles; used products that have been refurbished; and used products that have been remanufactured.replacement products such as wheels, bumper covers and lights, and remanufactured engines. Collectively, we refer to ourthese products as alternative parts.parts because they are not new OEM products. We are the nation’s largest provider of alternative vehicle collision replacement products and a leading provider of alternative vehicle mechanical replacement products. Ourproducts, with our sales, processing, and distribution facilities reaching most major markets in the United States. Our wholesale operations also reach most major markets in the U.S. and Canada. We are a leading provider of alternative vehicle replacement products in the United Kingdom, and in the second quarter of 2013, we expanded our wholesale operations effective October 1, 2011 with ourinto continental Europe through the acquisition of Euro Car Parts Holdings Limited (“ECP”Sator Beheer B.V. ("Sator"), the largesta leading distributor of automotivevehicle mechanical aftermarket products in the United Kingdom.Benelux region. In addition to our wholesale operations, we operate self service retail facilities across the U.S. that sell recycled automotive products. We also sell recycled heavy-duty truck products and used heavy-duty trucks. We have organized our businesses into fourthree operating segments: Wholesale—Wholesale – North America; Wholesale—Wholesale – Europe; and Self Service;Service. We aggregate our North American operating segments (Wholesale – North America and Heavy-Duty Truck.autoautomotive parts manufacturers and distributors primarily based in the U.S., the U.K. and other European countries, Taiwan Europe and China. We procure recycled automotive products mainly by purchasing salvage vehicles, typically severely damaged by collisions and primarily sold at salvage auctions or pools, and then dismantling and inventorying the parts. The refurbished and remanufactured products that we sell, such as wheels, bumper covers, lights and engines, originate from parts from the salvage vehicles bought at auctions and from parts received in trade at collision shopsfrom customers purchasing replacement products from us, and damaged parts bought through bulk purchases from core sales companiesus.collect damaged parts.The majority of our products and services are sold to collision repair shops, also known as body shops, and mechanical repair shops. Wewe provide customers (and indirectly rely on insurance companies, which ultimately pay for the majority of collision repairs of insured vehicles, to help drive demand. Insurance companies tend to exert significant influence in the vehicle repair decision. Because of their importance to the process, we have formed business relationships with certain insurance companies in North America in which we are designated a preferred products supplier, and we are in the process of establishing business relationships with certain insurance companies in Europe.3We provide customerscompanies) with a value proposition that includes high quality products at a lower cost than new OEM products, extensive product availability due to our expansive distribution network, and responsive service and quick delivery. The breadth of our alternative parts offerings allows us to serve as a “one-stop”"one-stop" solution for our customers looking for the most cost effective way to provide quality repairs.significantly more resources and energy and would generate a substantial amount of additional pollution. In addition, we save landfill space because the parts that we recycle would otherwise be discarded. We also collect materials, such as metals, plastics, fuel and motor oil, from the salvage vehicles that we procure, and use them in our operations or sell them to other users.130170 acquisitions. Today, LKQ is the only supplier of aftermarket and recycled automobile productsalternative parts for the automotive collision and mechanical repair industry with a network and presence spanningserving most major markets in the U.S. and Canada. With our acquisition of ECP in 2011, weWe are also the largesta leading supplier of automotive aftermarket products reaching most major markets in the U.K.autoautomotive collision and mechanical products. We subsequently expanded through acquisitions of aftermarket, recycled, refurbished and remanufactured product suppliers and manufacturers, and also expanded into the self service retail business and heavy-duty truck industry. The most significant increase tobusiness. We expanded our business wasaftermarket automotive products through theour 2007 acquisition of Keystone Automotive Industries, Inc. in October 2007,, which, at the time of acquisition, was the leadingEffective 1, 2011, we acquired ECP, which marksexpanded our entryoperations into the European automotive aftermarket business. ECP operates outbusiness through our acquisition of 90 branches, supported by eight regional hubsEuro Car Parts Holdings Limited ("ECP"). We further expanded our geographic presence into continental Europe in May 2013 through our acquisition of Sator, a vehicle mechanical aftermarket parts distribution company based in the Netherlands, with operations in the Netherlands, Belgium and a national distribution center from which multiple deliveries are made each day. ECP’sNorthern France. Our European product offerings are primarily focused on automotivevehicle aftermarket mechanical products, many of which are sourced from the same suppliers that provide products to the OEMs. The expansion of our geographic presence beyond North America into the European market offers an opportunity to us, as that market has historically had a low penetration of alternative collision parts.ECP,Sator, we made 2019 acquisitions during 2013, including 10 wholesale businesses in North America, in 2011 (127 wholesale businesses five recycled heavy-duty truck products businessesin our European segment and three2 self service retail operations).operations. Our European acquisitions included the purchase of two engine remanufacturers, which expanded our presencefive automotive paint distribution businesses in the remanufacturing industry that we entered in 2010. Additionally, our acquisition of an automotive heating and cooling component distributor supplements our expansion into the automotive heating and cooling aftermarket products market. Our North American wholesale business acquisitions also included the purchase of the U.S. vehicle refinish paint distribution business of Akzo Nobel Automotive and Aerospace Coatings (the “Akzo Nobel paint business”)U.K., which allowed us to increase our paint and related product offerings and expand our geographic presence in the automotive paint market. Our other 2011 acquisitions enabled us to expand our geographic presencecollision product offerings. Our other acquisitions completed during 2013 enabled us to expand into new product lines and enter new markets.We expectmake additional strategic acquisitionsdevelop an alternative vehicle replacement parts business in 2012those countries. Under the terms of the agreement, we will contribute our experience to help establish automotive parts recycling operations and to facilitate the procurement of aftermarket parts, while Suncorp will supply salvage vehicles to the venture as we continuewell as assist in establishing relationships with repair shops as customers. Our investment will expand our geographic presence into Australia and New Zealand and will provide the opportunity to build an integrated distribution network offeringestablish a broad rangeleadership position in the supply of alternative parts in those countries.4strengths, such as the engine remanufacturing business.strengths. We believe a supply network with a broad inventory of quality alternative collision and mechanical repair and other products, high fulfillment rates and superior customer service will provideprovides us with a competitive advantage.offering. offering and more efficient distribution process. and warehouses in major metropolitan areas and employing a distribution system that allows for order fulfillment from regional warehouses located across the U.S. and Canada. By increasing local inventory levels and expanding our network to provide timely access to a greater range of parts, we have increased fulfillment rates beyond the levels that we believe most of our competitors realize, particularly for recycled products. We believe opportunities exist beyond our North American operations to introduce the benefits of an integrated distribution network that supplies alternative parts. Our acquisition of ECP is expected to provide a platform to execute our strategy in the U.K.We believe this strategy is applicable to both the automobile and heavy-duty truck markets. In order to execute this strategy and build on our progress thus far, we will continue to seek to expand into new markets and to improve penetration both organically and through acquisitions in targeted markets.National in placeLKQ hasU.S.major automobile insurance companies, which are generally operated on a national or regional level. The use of our products lowers the cost of repairs, decreases the time required to return the repaired vehicle to the customer, and Canada. Theprovides a replacement product that is of high quality and comparable performance to the part replaced, all of which are favorable to insurance companies. Additionally, the difficulty and time required to obtain proper zoning, as well as dismantling and other environmental permits necessary to operate newly-sited recycled product facilities, would make establishing a new network of recycled locations a challenge for a competitor. In addition, there are difficulties associated with recruiting and hiring an experienced management team that has strong industry knowledge.believe there are growth opportunitiesattempting to utilize a similar strategy in new primaryEurope with our acquisitions of ECP and secondary marketsSator in the U.S.past three years. These companies have a national presence in their respective countries, and Canada. We intendwe are working to expand our market coverage through a combinationintegrate the operations to take advantage of internal developmentshared procurement, warehousing and acquisitions in new regions and adjacent markets. Our broad network allows us to initially enter new, adjacent markets by establishing local redistribution facilities, avoiding the need for significant upfront capital outlays to establish local dismantling capabilities and inventories.Our acquisition of ECP in the fourth quarter of 2011 provides us with an established distribution network reaching most major markets in the U.K. Similar to the development of LKQ’s North American business, we believe this network provides an ideal platform to us as we explore opportunities to expand into new markets and complementary product lines in Europe. collision and mechanical repair shops, suppliers and other industry participants. We believe that insuranceInsurance companies, as payers for many repairs, are increasingly taking moretake active roles in the selection of alternative replacement products for vehicle repairs in order to containminimize the repair portion of the claims costs. On behalf of certain insurance companies, we provide a review of vehicle repair estimates so they may assess the opportunity to increase usage of alternative products in the repair process, thereby reducing their costs. Our employees also provide quotes for our products to assist several insurance companies with their estimatecosts and settlement processes.reduce cycle time. We also work with insurance companies and vehicle manufacturers to procure salvage vehicles directly from them on a selected basis, which5believe we are positioned to take advantage of the increasing importance these industry participants have in the repair process and will continue to look for ways to enhance our relationships with them.Wealso provide quality assurance programs that offer additional product support to autoautomobile insurance companies. These product support programs identify specific subsets of aftermarket products by vendor and product type that can be used in the repair of vehicles that these companies insure. The programs typically offer aftermarket products that have been produced by manufacturers certified by a third party testing lab. We may provide additional validation of the quality of the products beyond our standard warranties, and identification details that make the products traceable back to a manufacturer’smanufacturer's specific production run.To strengthenrelationshipoperations in North America and Europe. The breadth and depth of our inventory reinforces LKQ's ability to provide a "one-stop" solution for our customers' alternative vehicle replacement product needs. Customers place a high value on the availability of a broad range of vehicle replacement products. In our North American operations, we are able to provide the collision and mechanical repair industry with collision shops, we have developed “Keyless,” a programpremium products at costs typically 20% to 50% below new OEM replacement products. The availability of alternative products means that enables collision repair shops to link their estimating systemsautomobiles can be repaired with our aftermarketlower parts costs, and recycled inventory. It is compatible with allin some instances, reduced labor costs. In fact, many insurance companies in North America will not authorize the use of the major estimating systems and provides real-time inventory availability. The system encourageshigher cost, new OEM replacement products if alternative products are available because the use of alternative products by indicatingprovides insurers a method to manage and reduce total repair costs. Some insurance companies designate us as a preferred supplier for their affiliated repair shops because of our ability to provide these products. With our distribution network that reaches most of the collision shopmajor markets in the U.S. and Canada, combined with our extensive range of products, we believe we are the only supplier that is able to support the insurance industry in this manner. We believe we are well-positioned in Europe to develop a similar distribution network of a broad product offering to support insurance companies in that market.applicable alternativereplacement products and also helps us to fill a higher percentage of our customers' requests.ofa vehicle or product arrives at a facility to its placement on a truck for delivery to the estimate. It also provides demandcustomer. With this real-time information, we are able to actively monitor inventory levels throughout our purchasing department and offers sales leads for our sales representatives.handheld computing devicesa proprietary software application that comparecompares the vehicles at the salvage auctions to our current inventory, historical demand, and recent average selling prices to arrive at an estimated maximum bid. This bidding system reduces the likelihood of purchasing unneeded parts that might result in obsolete inventory.deploy inventory management systems at our facilities that are similar to those used by leading distribution companies. We make extensive use of bar code technologyemploy proprietary methodologies and wireless data transmission to track parts from the time a vehicle or product arrives at a facility to its placement on a truck for delivery to the customer. In 2010, we completed the implementation of our LKQX software program at our domestic locations. LKQX is a proprietary program that provides our sales representatives with information on availability of aftermarket inventory as well as recycled inventory to better address our wholesale customers’ alternative parts needs and improve our fulfillment rates. Also in 2010, we completed the implementation of a yard management system for our heavy-duty truck operations. This system provides visibility across our plants, allowing for improved sales by reducing lost sales due to stock-outs. In 2011, we completed the implementation of a standardized point of sale system for our self service locations. Through increased visibility to parts sales across the network, we have been able to respond more quickly to changes in demand and leverage our visibility to price changes across our self service locations. Our newly acquired wholesale business in the U.K. uses an integrated inventory management system that provides up-to-the-minute information on available stock by location to ensure availability of high-demand inventory. Based on daily sales activity, the system directs the needed overnight deliveries to replenish stock levels among the national distribution center, hubs and branch locations.Demand driven procurementWe believe efficient procurement of aftermarket products and salvage vehicles is critical to the growth of the operating results and cash flow of our business. We use information systems and proprietary methodologies to help us identify high demand aftermarket and recycled products. Our aftermarket inventory systems track products sold and sales lost due to a lack of inventory, and make purchase recommendations.recommendations based on this information. The inventory6demand. Our buying team reviews the recommendations and places orders accordingly.demand, as well as other replenishment factors. When we procure aftermarket products or refurbish collision replacement products such as wheels, bumper covers and lights, we focus on products that are in the most demand byat all levels of the automotive parts value chain including the professional repair market, the jobber market and the general insured repair market. Our most popular aftermarket products are collision replacement products, such as hoods and fenders, head lamps, tail lamps, and bumper covers. Because lead times may take 4540 days or more on imported products, sales volume and in-stock inventory are important factors in the procurement process.Our information systems prioritize and recommend bid prices of the salvage vehicles we evaluate for purchase. Our processes and systems help to identify with a high degree of accuracy the value of the parts that can be recycled on a salvage vehicle and recommend a maximum purchase price to achieve our target profitability from the resale of the recycled products. We also use historical sales records of vehicles by model and year to estimate the demand for our products. We also analyze new vehicle designs that are expected to come to market to assure that we are working with suppliers to project future supply and demand trends. Combining this information with proprietary data that aggregate customer requests for products, we are able to source aftermarket products and salvage vehicles at prices that we believe will allow us to sell products profitably.High fulfillment ratesWe have increased local inventory levels and found that it has improved our customer service and allowed for faster deliveries. Improving local order fulfillment rates reduces transfer costs and delivery times, and improves customer satisfaction. Our ability to share inventory on a regional basis increases the availability of replacement products and also helps us to fill a higher percentage of our customers’ requests. We have developed regional trading zones within which we make our inventory available to our local facilities, mostly via overnight product transfers. We manage our purchasing and recycled product inventory on a regional basis to enhance the availability of the products that we believe will be in the highest demand within each region. We believe that our higher than industry average fulfillment rates distinguish us from our competition.Broad product offeringThe breadth and depth of our inventory reinforces LKQ’s ability to provide a “one-stop” solution for our customers’ alternative vehicle replacement product needs. Customers place a high value on the availability of a broad range of vehicle replacement products. We are able to provide the collision and mechanical repair industry with premium products at costs typically 20% to 50% below new OEM replacement products. The availability of alternative products means that automobiles can be repaired at lower costs and contributes to cars being repaired rather than designated as ‘total losses’ by insurance companies. In fact, many insurance companies in North America will not authorize the use of higher cost, new OEM replacement products if alternative products are available. Our ability to supply these products gives insurance companies the confidence to designate LKQ as the preferred supplier for their repair shops. With our distribution network that reaches the major markets in the U.S. and Canada, combined with our extensive range of products, we believe we are the only supplier that is able to support the insurance industry in this manner. We believe we will be positioned to provide similar services to the insurance industry in the U.K. as we expand our collision product offerings and continue to build the national distribution network of our recently acquired U.K. operations.Our aftermarket product offering is particularly broad, with more than 86,000 SKUs sold in North America in 2011. In order to address the multiple needs of our aftermarket customers, we offer our Platinum Plus line of high quality products with lifetime warranties, our Value Line of aftermarket products when cost is the main factor for vehicle repairs, and products certified by independent organizations such as the CertifiedParts Association (“CAPA”) and NSF International (“NSF”). Our 2011 acquisition of the Akzo Nobel paint business allowed us to expand our geographic range in aftermarket automotive paint to better meet our customers’ repair needs. We also offer other repair materials, such as tape, sandpaper, paint guns and frame racks, so that our customers can purchase these at the same time as they are ordering their automotive repair7products. Our U.K. operations also offer a broad range of products, with more than 121,000 individual SKUs sold in 2011.One call awayTo execute our strategy of offering a broad inventory with high fulfillment rates, we offer our customers the choice of aftermarket or recycled products. For many parts, we also offer refurbished or remanufactured product options. If, for example, a customer has a damaged bumper, we may offer that customer the choice of a recycled bumper, a new aftermarket bumper, or a refurbished bumper. Because recycled products are in limited supply, our ability to offer additional alternative product options increases our fulfillment rates and customer satisfaction. Historically, the distribution channels for aftermarket and refurbished products have been separate from those for recycled and remanufactured products; however, we are combining these channels through the sharing of warehousing, inventory, sales and distribution systems so that our repair shop customers need only one source of supply for their alternative repair products.WHOLESALE AUTO PRODUCTS—NORTH AMERICAAs of December 31, 2011, these wholesale operations conducted business from more than 290 facilities.As we haveOur combined the distribution channels for our alternative parts offerings we also leverage our facility and warehouse costs and improve local product availability by locating multiple product operations together. Our aftermarket product operations may include a combination of sales, warehousing and distribution, and in many cases will be co-located with our refurbishing operations. Our salvage operations typically have processing, sales, distribution and administrative operations on site, indoor and outdoor storage areas, and include a large warehouse with multiple bays to dismantle vehicles. Our engine remanufacturing operations which we acquired in the fourth quarter of 2010 and in 2011, are conducted primarily at our facility in Mexico, with sales, warehousing and distribution operations in the U.S.20112013 sales included more than 86,00096,000 SKUs of aftermarket collisionautomotive products, and repair materialsexcluding refurbished products, for the most common models of domestic and foreign automobiles and light trucks, generallyprimarily for the 15 most recent model years.repair of vehicles three to twelve years old. Our principal aftermarket product types consist of those most frequently damaged in collisions, including bumper covers, automotive body panels bumper covers and lights. In 2011,recent years, our expansion ininto complementary product types, such as paint and cooling products, and paint, contributed to the increase in our available products and has allowed us to better meet our customers’customers' repair needs. The sources for our aftermarket products are both foreign and domestic manufacturers and distributors.Aftermarket products provide the collision repair industry with quality products at prices well below new OEM replacement products. Lower costs may help insurers contain collision repair costs, and may result in cars being considered repairable rather than categorized as total losses.We distribute paint and other materials used in repairing damaged vehicles, including sandpaper, abrasives, masking products and plastic filler. The paint and other materials distributed by us are purchased from numerous suppliers in the U.S. and Canada. Certain of these products are distributed under the brand “Keystone.”brandproduct line offered in the Keystone product linebrand of aftermarket products. It offers high quality products at lower costs than new OEM replacement products. The Platinum Plus products are held to high quality standards and tested by quality teams.assurance teams or independent third parties. We providealso developed a warrantyproduct line called "Value Line" for as long as a consumer owns the vehicle on which the product was installed. Manymore value conscious, often self-pay, consumers. Our Value Line products offer quality products at reasonable prices, providing additional choices for repairs or rebuilding of vehicles.Platinum Plus products are used for repairs that are ultimately paid forcertified by insurance companiesindependent organizations such as the Certified Automotive Parts Association ("CAPA") and are part of our quality assurance programs.8In 2011, became the first automotive parts distributor to becomeis certified under the new NSF International Automotive Parts Distributor Certification Program, which addresses the needs of collision repair shops and insurers by maintaining quality management systems to address part traceability, service and quality. This certification program complements the existing parts certification program with NSF under which LKQ has a broad range of certified automotive collision replacement parts. Many major insurance companies have adopted policies recommending or requiring the use of products certified by CAPA or NSF when available.NSF. A number of CAPA and NSF certified products are also marketed under the Platinum Plus brand.In addition to distributing parts certifiedCAPAus are purchased from numerous suppliers in the U.S. and NSF, we actively participate with CAPA, NSF, insurance companies and consumer groups in encouraging independent manufacturers of collision replacement products to seek certifications from these organizations.We have developed a product line called “Value Line” for more value conscious, often self-pay, consumers. Our Value Line products offer quality products at reasonable prices, providing additional choices for repairs or rebuilding of vehicles. The Value Line product line includes most product categories.2011,2013, approximately 53%46% of our aftermarket purchases were made from our top eightfive vendors, with our largest vendor providing approximately 12% of our inventory. We believe we are one of the largest customers of each of these suppliers. NoOutside of this group, no other supplier provided more than 5% of our supply of aftermarket products.products in 2013. We purchased approximately 44% of our aftermarket products in 2013 directly from manufacturers in Taiwan and other Asian countries. Approximately 56% of our aftermarket products were purchased from vendors located in the U.S. and Canada. However,Canada, however, we believe the majority of these products were manufactured in Taiwan, Mexico or other foreign countries.We benefit from an automated procurement system for aftermarket goods that makes order and inventory transfer recommendations using product sales and data for lost sales due to stockouts. Buyers review the system’s recommendations and then place purchase orders or arrange for a redistribution of inventory to areas of higher demand. For new products, we use vehicle volume and registrations by state to influence what new products should be ordered and where the stock should be located. Typically six months after the products are introduced, the automated system has sufficient data to make order recommendations. Platinum Plus products. These agreements automatically renew for additional 12 month periods unless written notice is given. While we compete with other distributors for production capacity, we believe that our sources of supply and our relationships with our suppliers are satisfactory.domestic suppliers. Orders placed with foreign manufacturers generally are received within 45 to 60 days.over halfcertain of our aftermarket locations, and are received within 40 to 65 days from the date ordered. We operate an aftermarket parts warehouse in Taiwan that aggregates inventory from certain of our vendors for shipment to our North American locations. We haveAs of December 31, 2013, we operated 24 regional hubs and three distribution centers. The hub warehousescenters, which act as sources for our other non-container-direct aftermarket warehouse locations that do not receive containers directly and serve as the central stocking point of all slower moving items.redistribution centers for our operations. This structure is designed to maximize our fulfillment rates as smaller branches can have a high fill-rate of next day availability.9Wholesale recycled collision and mechanical products provide high quality, lower-price repair options. most popular recycled products include engines, transmissions, doors, front enddoor assemblies, sheet metal products such as trunk lids, fenders and hoods, lights and bumper assemblies, head and tail lamp assemblies and mirrors.assemblies. Some insurance companies mandate that the recycled products must be of the same model year or newer as the vehicle being repaired. As a result, the majority of the products we sell are from vehicles not more than ten years of age. We have adopted the industry’s grading system based on the condition of the product, and factor product grades into our pricing decisions. Unlike aftermarket products that are individually boxed, recycled products are most frequently sold as subassemblies or as multiple parts already put together. Installing recycled products often means that collision shops not only save on product cost, but, because several products may come pre-assembled, the shops are also able to reduce labor costs.“total losses”"total losses" typically are sold at regional salvage auctions throughout the U.S. and Canada. Salvage auctions charge fees both to the suppliers of vehicles, primarily insurance companies, and to the purchasers, such as LKQ.purchasers. Additionally, we typically pay third parties fees to tow the vehicles from the auction to our facilities.fewseveral years, the frequency with which vehicles are declared total losses has increased as a result¸ we believe, of the rise in repair costs relative to vehicle replacement cost.cost and salvage vehicle prices. In 2000, approximately 9% of accident claims resulted in a total loss; by 2010,2013, this percentage increased to almost 14%. As OEMs offer models thatAdditionally, sales of new vehicles have increasingly complex safety measures such as multiple airbagsincreased since 2010 and vehicle operating sensors,are projected to continue to increase over the cost to repair suchnext five years, which should result in a greater volume of salvage vehicles has risen. Recently, high used car values have reduced the effect of this trend slightly.2011, LKQ2013, we acquired approximately 228,000273,000 salvage vehicles for our wholesale recycled product operations, with approximately 95% purchased atprimarily from salvage auctions. Prior to the scheduled auction date, our salvage buyers may preview the auctions online to investigate the vehicles to be sold and determine our interest in buying them. They obtain key information such as the model and mileage, and perform visual damage assessments to determine which parts on the targeted vehicles are recyclable. With the data from this preview, we deploy a bidding system that performs a valuation calculation for each vehicle. In order to recommend a maximum bid price, the calculation incorporates demand for a vehicle’svehicle's recyclable parts, current inventory levels, average selling prices, auction costs, projected margins and instances of out-of-stock. Using this disciplined supply and demand procurement approach, we place bids on the targeted vehicles. In most cases, we attend auctions in person, although some of our purchasing is done through an online auction system.We acquired approximately 5% of the salvage vehicles we purchased for wholesale parts in 2011 directly from insurance companies, vehicle manufacturers, and other direct sellers. These arrangements eliminate the fees charged to the buyers and sellers by the salvage auction, often providing inventory with a lower initial expenditure of capital. Direct purchase agreements, while usually beneficial, have limited applicability to our procurement because vehicle auctions provide us with the flexibility to focus on sought after vehicles based on our bidding algorithms.10will havehas an inventory report that indicates to the dismantler which parts should be removed and placed in a warehouse for future sales to customers, which parts should be collected in bulk for our refurbishing and remanufacturing operations or for sale to parts remanufacturers, and which parts have value but should remain on the vehicle until sold.Products that are placed directly on our shelves are typically higher sales volume items such as engines, transmissions, doors, hoods, trunk lids, head and tail lamp assemblies, and front and rear bumper covers. Many of the recycled products we sell are subassemblies of multiple parts including quarter panels and front end assemblies. The subassemblies are cut from the vehicle bodies, usually using specific parameters provided by the repair shop at the time of sale.Parts that are not in a condition to be sold as recycled products or that are in surplus supply are separated and refurbished or remanufactured internally, or otherwise sold in bulk to parts remanufacturers. If there is strong demand for products that are currently at high stock levels in our warehouses, we may choose to hold the vehicle for further dismantling at some future date when we are more likely to have a need for the parts. The holding period for partially dismantled car bodies will depend on the rack space available at the site. Once all of the parts of value have been removed, the remaining vehicle frame is crushed and sold to scrap processors.Prior to placement on our warehouse shelves, each inventory item is given a unique bar code tag for identification and entered into our inventory tracking system. We utilize bar coding systems and wireless transmission to keep track of inventory from the time a product is removed and inventoried, to the time it is sold and put on a truck for delivery.2011,2013, we operated 3423 plastic bumper and bumper cover refurbishing plants, a chrome bumper plating plant, 1511 wheel refurbishing plants, onea light refurbishing plant and four engine remanufacturing facilities.majority of our refurbished and remanufactured productsvehicles that are processed from cores obtained from salvage vehicles purchased by our recycled operations, damaged cores collected by our route delivery drivers from vehicles under repair by our customers, and from core brokers. Our sales capacityacquired for these products is limitedresale are typically special purpose or vocational use trucks such as those used for garbage pickup or cement delivery. If requested by the availabilitysellers of coresthe vehicles, we provide an assurance that the vehicles will be sold to refurbish. In additionforeign buyers and exported to countries for use outside of the engines we remanufacture in-house, we sell some remanufactured mechanical products, such as enginesU.S., or to domestic buyers after the vehicles have been reconditioned and transmissions, acquired frommodified for use other mechanical remanufacturers.We began our engine remanufacturing operations through an acquisition in the fourth quarter of 2010, and further expanded these operations with two additional acquisitions in 2011. When identifying the products that we refurbish or remanufacture, we focus on products that have high demand. These products are accumulated from our salvage operations at our central core sorting facility, and are then either sent to our refurbishing or remanufacturing facilities or sold in bulk to other mechanical remanufacturers. Additionally, certain of our wheels may be sent to our smelter operations to be melted and sold as aluminum ingot.“crush only”"crush only" end of life vehicles acquired from other companies, including OEMs, are typically crushed using equipment on site. In other cases, we will hire mobile crushing equipment to crush the vehicles before they are transported to shredders and scrap metal processors. Damaged and unusable wheel cores are melted in our aluminum furnacesfurnace and sold to consumers of aluminum ingot and sow for the production of various automotive products, including wheels.113%2% or more of our revenue in 2011.53,00040,000 collision repair shops, including those owned by new car dealerships, in the U.S. in 2010.2012. The same reports estimate there were approximately 76,00077,000 general (including mechanical) repair garages, but excluding new car dealership service departments, in the U.S. in 2010.2012. The majority of these customers tend to be individually-owned small businesses, although therethe number of independent and dealer-operated collision repair facilities has been a trend toward consolidation, resulting indeclined over the formation of severallast decade, as regional or national and regional repair companies.multiple location operators have increased their geographic presence through acquisitions. We also sell our products to automobile dealerships, car rental companies and fleet management groups.wield significant influence onaffect the demand for our collision products. While insurance companies do not pay for our products directly, they ultimately pay for the repair costs of insured vehicles in excess of any deductible amount. As a result, insurance companies often influence the types of products used in a repair.allmost major markets in the U.S. and Canada gives us a distinctive ability to servicebenefit the major automobile insurance companies. Insurance companies generally operate at a national or regional level. The use of our products provides a direct benefit to these companies by lowering the cost of repairs, decreasing the time required to return the repaired vehicle to the customer, and providing a replacement product that is of high quality and comparable performance to the part replaced.company’scompany's Direct Repair Program (“DRP”("DRP") network. A repair shop participating in a DRP is referred potential work from the insurance company in exchange for providing assurances to the insurance company of quality, timeliness and cost. Industry reports indicate approximately 44%that over half of collision repair shops participateclaims paid for by the top insurance companies in DRPs, and between 40% and 50% of2012 were paid through a repairer’s business is generated through participationDRP, compared to 42% in DRP networks. In 2010, the average repairer participated in approximately three DRPs, an increase from two DRPs per repairer in 2000.2009. To meet the needs of the DRPs, professional repairers have been required to become fluent in claims handling. OurWe offer our repair shop customers access to our proprietary system, Keyless, system assists these repairers by indicatingwhich provides a link between their estimating systems and our inventory to identify the availability of alternative products as replacements for damaged OEM products.use in their repair. This data also helps insurance companies monitor the body shops’shops' compliance with its DRP product guidelines that might, for instance, stipulate the use of the lowest cost products that meet quality specifications. In addition, in some markets insurance companies are able to dispose of low value total loss vehicles directly to us so they can save the transaction fees associated with selling these vehicles through salvage auctions.89%85% of all repairs, insurance companies give collision repair shops directives as to what type of replacement products are eligible for reimbursement. Typically insurance carriers have established a hierarchy or decision tree prioritizing the types of products to be used for repairs. As an example, a protocol may require recycled products if available; if recycled products are not available, then refurbished products; and, if recycled or refurbished products are not available, aftermarket products. If none of these alternative product types is12“one-stop shop”"one-stop shop" and, if recycled products are out of stock, to fill orders from our refurbished or aftermarket product inventory. To support these efforts, we have provided our sales staff with access to both recycled and aftermarket sales systems, and we have developed sales incentive programs that encourage cross selling throughout our wholesale operations.2011,2013, we had approximately 1,7002,150 full-time sales staff in our North American wholesale operating segment. The full time sales personnel are located at sales desks at our facilities or at one of the regional call centers we operate. We deploy a call routing system that redirects overflow calls to alternative call centers, typically located within the same region. We also operate two other call centers, one to support national accounts, and the other to support insurance adjusters’adjusters' needs and questions. Our sales personnel are encouraged to initiate outbound calls in addition to the inbound calls they handle. Our sales staff can use customer estimates from our Keyless estimating system to generate sales leads for both aftermarket and recycled products.customer’scustomer's purchasing volume. We may adjust prices during the year in response to material price changes of new OEM replacement products.customers’customers' requirements more frequently than our competitors and gives us a competitive advantage.over 290325 wholesale plants and warehouses across the U.S. and Canada as of December 31, 2013, of which 5057 function as large hub or cross dock facilities. Our network of facilities allows us to develop and maintain our relationships with local repair shops while providing a level of service that is made possible by our nationwide presence. Our local presence allows us to provide daily deliveries as required by our customers, using drivers who routinely deliver to the same customers. Our sales force and local delivery drivers develop and maintain critical personal relationships with the local280300 transfer runs between our cross dock facilities and our plants and warehouses within our regional trading zones to redistribute our alternative products for delivery on the next day. In addition, we have approximately 2,700 local delivery routes serving our customers each weekday.have begun to integrateare integrating the delivery of multiple product types on the same delivery routes to help minimize distribution costs and improve customer service. We operate a delivery fleet of medium-sized trucks and smaller trucks and vans. Over time, we expect that our delivery vehicles will become more consistent as we reconfigure the fleet to include vehicles that can carry all four product types.13do not consider retail chains that focus on the do-it-yourself market to be our direct competitors. We believe the principal areas of differentiation in our industry include availability of inventory, pricing, product quality and service.as the insurance and repair industries continue to recognize the advantages of using aftermarket, recycled, refurbished and remanufactured products the alternatives to new OEM replacement products will account for a larger percentage of total vehicle replacement product sales. Since 2007, alternative parts usage has increased from approximately 31% to 37% of the collision replacement product market. We compete with OEMs on the basis of price, service and product quality.WHOLESALE AUTO PRODUCTS—EUROPEOur European wholesale operating segment was formed in the fourth quarter of 2011 with our acquisition of ECP, the U.K.’s largest distributor of automotive aftermarket products. We operate 90 branches, supported by eight regional hubs and a national distribution center, which allows us to reach most major markets within the U.K. With its national distribution system and IT infrastructure, we believe ECP will serve as a platform to expand into complementary products to increase market penetration in this region, as well as to further develop a collision repair parts business similar to our North American wholesale operations.InventoryIn 2011, we sold more than 121,000 SKUs of aftermarket products, primarily composed of mechanical aftermarket parts for the repair of vehicles five to 15 years old. Our top selling products include electrical products such as spark plugs and ignition coils, clutches and related parts, steering and suspension parts, and brake pads and sensors. In 2011, our top 10 suppliers represented approximately 38% of our inventory purchases, with our top supplier representing approximately 8% of our purchases. No suppliers outside of our top ten suppliers provided more than 3% of our annual purchases. The aftermarket products we distribute are purchased from vendors located primarily in the U.K. and other European countries. In 2011, we purchased approximately 70% of our aftermarket products from manufacturers in the U.K. and 19% of our products from other European countries. Approximately 11% of our products were procured from vendors located in China.We provide value to our customers by offering aftermarket products that, in many cases, are sourced from the same suppliers used by OEMs. By working directly with the manufacturers, we are able to eliminate many intermediate steps in the parts supply chain to offer the same products for a lower price compared to OEMs. For many of our products, we also offer lower-cost lines for our customers that are more cost conscious.CustomersWe sell the majority of our products to over 32,000 professional repairers, including primarily independent mechanical repair shops and collision repair shops. In addition to our sales to repair shops, we also generate a14portion of our revenue through sales to retail customers from our branch stores, which have historically represented less than 20% of our revenue. No single customer accounted for more than 2% of our revenue in 2011.Sales and MarketingTo place an order, our customers will generally call a sales representative at the nearest branch, or may call our central call center. Using an electronic automotive exchange and our integrated IT platform displaying inventory availability, our sales representatives can locate for our customers to the appropriate replacement part. We set list prices for our products, and then apply a discount off of list, primarily depending on each customer’s purchasing volume. Customer orders are then filled from the local branch, or routed to another location as necessary to fill the order.Similar to our North American wholesale operations, insurance companies significantly influence the purchasing decisions for collision products in the U.K. We believe the historically lowrepairs. Industry sources estimate that alternative collision parts usage percentage, which is currently less than 10%, provides an opportunity for us in this market, particularly as insurance companies look to lower their costs. As a result, we have begun to develop business relationships with insurance companies and implement insurer-based marketing models to bring visibility to the cost savings that can be achieved through the use of alternative parts. As we continue to grow our collision parts offerings over time in this market, we believe we will be well-positioned to serve as a lower-cost alternative for insured repairs in the U.K.DistributionWe employ a central stock replenishment system supported by our integrated IT platformUnited States is approximately 37% to monitor historical demand, lost sales, and orders. Using this information, we are better able to appropriately stock our branches to meet customer requests. Our typical branch location holds between 10% and 20% of our available SKUs, with nightly replenishment from our national distribution center and other distribution hubs. For several of our branches, we can deliver an in-stock part within one hour. In the event that a branch does not have a requested part, the part is supplied by either the hubs or the national distribution center within 24 hours. We deliver parts to our customers on our vans or third party motorcycles with 35,000 daily deliveries, or otherwise by third party carriers.CompetitionWe view all suppliers of replacement repair products as our competitors, including other alternative parts suppliers and OEMs. While we compete with all alternative parts suppliers, there are few with a distribution network reaching most major markets in the U.K. We believe we have been able to distinguish ourselves from other alternative parts suppliers primarily through our distribution network, which allows us to deliver our products quickly, as well as through our product lines and inventory availability, pricing and service.38% currently. We compete with OEMs primarily on the basis of price and, to a lesser extent, on service and availability.SELF SERVICE RETAIL PRODUCTSlightlight-duty trucks directly to consumers. In addition to revenue from the sale of parts, core and scrap, we charge a smallnominal admission fee to access the property. Our self service facilities typically consist of a fenced or enclosed area of several acres with vehicles stored outdoors and a retail building through which customers are able to access the yard. As of December 31, 2011,2013, we conducted our self service retail operations from 4765 facilities in North America.municipality sales, auctions, insurance carriers, the general public, municipality sales, insurance carriers, and15eightseven model years old for our self service retail product operations. These vehicles will typically beare generally older and of lower quality than the salvage vehicles we purchase for our wholesale recycled product operations. In 2011,2013, we purchased approximately 352,000513,000 lower cost self service and crush only"crush only" vehicles.Processing and Placement typically delivered to our locations by the seller, though in some cases,or we will arrange for transportation. Once on our property, minimal labor is required to process the vehicle other than removing the fluids, Freon, catalytic converters and hazardous materials. Vehicles are then placed in the yard for customers to remove parts. The vehicle inventory is usually organized according to domestic and foreignimport cars (further organized by make), passenger vans and trucks. In our self service business, availability of a specific part will depend on which vehicles are currently at the site and to what extent parts may have been previously been removed and sold.Part prices are listed on regularly updated price sheets and will vary by part type, but not by make or model. For instance, four cylinder engines are priced the same amount regardless of vehicle make, model, age or condition. We usually allow customers access to vehicleskeep a vehicle at our facility for 30 to 6075 days, generally depending on the capacity of the yard, before they areit is crushed and sold to scrap metal processors. By maintaining a relatively short turnover period, we ensure that our inventory is continually updated with different car options or removed from the yard when the saleable parts are depleted.“crush only”"crush only" vehicles acquired from other companies, including OEMs, are typically crushed using equipment on site.HEAVY-DUTY TRUCK PRODUCTSLKQ startedheavy-duty recycled truck product operationsregional hubs and branch network with daily replenishment of stock, providing our customers with what we believe to be the highest in-stock rate in 2008 with the purchase of a recycler basedU.K. We continued to expand ECP’s distribution network in Houston, Texas.2013 by opening 15 new ECP locations in the U.K. As of December 31, 2011,2013, we hadoperated 171 selling locations, including aftermarket parts branches and paint distribution locations, supported by a totalnational distribution center and 12 regional hubs (many of 18 facilitieswhich are co-located with selling locations), which allows us to reach most major markets within the U.K.U.S.Netherlands and Canada.Belgium, with the remainder in Northern France and other European countries. The acquisition of Sator expands LKQ's European footprint, further expands our European distribution network and provides a potential platform to capitalize on the large and fragmented mechanical replacement part markets in Europe. Sator also complements our existing ECP operations in the U.K. by allowing for the potential realization of cost savings from the leveraging of our combined purchasing power given the significant overlap in suppliers and product mix.beganbelieve the historically low alternative collision parts usage percentage in Europe, which is currently less than 10%, provides an opportunity for us in this segment, particularly as insurance companies look to lower their costs. To further our recycled truck operations withcommitment to expanding our European alternative collision parts program and becoming a beliefleading one-stop shop supplier to the collision repair industry in the U.K., in August 2013 we acquired five paint distributors that development ofreach most markets within the U.K.network would offerplatform to expand into complementary products to increase market penetration in this segment, as well as to further develop a collision repair parts business throughout Europe similar opportunities to those we have experienced with our wholesale recycled product operations. The development of our network is ongoing, but we have made progress toward integrating the operations and achieving synergies.comprisedprimarily composed of used heavy-mechanical aftermarket parts for the repair of vehicles 3 to 15 years old. Our top selling products include brake pads, discs and medium-duty trucks, usually five years or older, whichsensors; clutches; electrical products such as spark plugs and batteries; oil and automotive fluids; and filters. In 2013, our top six suppliers represented 25% of our inventory purchases, with our topsalvagethe branch locations. This retail component of ECP’s business has historically represented less than 10% of its revenue.truck auctionsother promotional materials and provides software to the repair shops, which the shops need for their operations.or large fleet operators. During 2011,significantly influence the purchasing decisions for collision products in Europe. As a result, we purchased approximately 6,000 vehicles. Depending onare attempting to establish business relationships with insurance companies and implement insurer-based marketing models in the conditionU.K. by emphasizing the cost savings that can be achieved through the use of alternative parts. As we continue to grow our collision parts offerings in the vehicles, they may be dismantled for parts or resold as running vehicles. If certain mechanical parts are damaged, such as transmissions,U.K., we may remanufacture them and offer them to our customers. The vehicles that are acquired for resale are typically special purpose or vocational use trucks such as those used for garbage pickup or cement16delivery. If requested by the sellers of the vehicles,believe we provide an assurance that the vehicles will be soldwell-positioned to foreign buyers and exported toserve as a lower-cost alternative for insured repairs throughout Europe given the majority of U.K. carriers offer coverage in multiple European countries for use outside of the U.S.,U.K.domestic buyers after the vehiclesrepair shop customers. Product is moved through the distribution network on our vans or via common carrier. In our ECP operations, we also sometimes employ a third party motorcycle fleet to deliver parts from our branch locations to nearby repair shop customers; as a result, our ECP branches can deliver certain in-stock parts within one hour.reconditioned and modified for use other than their original purpose.By utilizing a yard management system that we implemented in 2010, we are able to providedistinguish ourselves from other alternative parts suppliers primarily through our yards visibilitydistribution network, efficient stock management systems and proprietary technology which allows us to availabledeliver our products quickly, as well as throughacrossavailability, pricing and service. We compete with OEMs primarily on the network. We believe this system provides an advantage over our competitors who do not typically leverage a broad network to fulfill customer demand for products.CustomersCustomers for recycled heavy-duty truck products are often owner/operators, local cartage companies operating fleets or foreign buyers or exporters seeking low cost parts, most commonly enginesbasis of price, service and transmissions.2011,2013, we had approximately 17,90023,800 employees. We are a party to a collective bargaining agreement with a union that represents 4942 employees at our Totowa, New Jersey facility. Approximately 415680 of our employees at our bumper refurbishing plantand engine remanufacturing operations in Mexico and approximately 215170 of our employees at our recycled parts facility in Quebec City, Canada are also represented by unions. Other than these locations, none of our employees is a member of a union or participates in other collective bargaining arrangements. We consider our employee relations to be good.FACILITIESIn 2011, we moved ourOur corporate headquarters toare located at 500 West Madison Street, Chicago, Illinois 60661, from our previous address at 120 North LaSalle Street, Chicago, Illinois 60602. In addition to our corporate headquarters, we have60661. We operate a field support center in Nashville, Tennessee that performs certain corporatecentralized functions for our North American operations, including accounting, procurement and information systems support. Many of these functions were transferred to the field support center in 2011 from regional offices where they were previously performed. Our European operations maintain procurement, accounting and finance functions as well as a central call center, in Wembley, outside of London, England.England and in Schiedam, Netherlands. In addition to these corporate offices, we have numerous operating facilities that handle wholesale and self service retail and heavy-duty truck products.product operations. We operate out of more than 440570 locations in total, a majoritymost of which are leased. Many of our locations stock multiple product types or serve more than one function.90172 facilities in the U.K., including the 500,000 square foot national distribution center in Tamworth that houses inventory to supply the hubs and branches of our U.K. operations, andoperations. We also operate 30 facilities in Canada, 11 facilities in continental Europe, five facilities in Central America, and two facilitiesa facility in Mexico.INFORMATION TECHNOLOGYIn 2010, Additionally, we completed the installation of a proprietary facility management system called LKQX at our domestic locations that we developedoperate an aftermarket parts warehouse in Taiwan to aggregate inventory for our wholesale recycled product operations to replace a third party system. The new system improves the integration of inventory with the aftermarket system and provides improved control, selling and data analysis features. We believe that a single system that presents a combined view of aftermarket, recycled, refurbished and remanufactured products helps facilitate the sales process, allows for continued implementation of standard operating procedures, and yields improved training efficiency, employee transferability, accessshipment to our national inventory database, management reporting and data storage. It also eliminates the need to create multiple versions of proprietary applications and systems support processes. The system also supports an electronic exchange process for identifying and locating parts at other select recyclers and facilitates brokered sales to fill customer orders for items notlocations in stock.OurNorth America.facilityenterprise management system. Additional third party software packages have been implemented to leverage the centralized data and information that a single17Similarly,The systems used by our aftermarket operations are also used by all of our refurbishing operations.All of our refurbishing Our aftermarket operations in continental Europe use a single facility management system. Our remanufacturing operations,several IT systems, which we acquired at the end of 2010are linked to transfer data between systems, to manage customer orders and further expanded through additional acquisitions in 2011, currently operate on three separate IT systems. We expect to integrate all of our remanufacturing operations onto one IT platform in the next couple of years.In 2011, we completed the installation of a standardized point of sale system in our self service retail operations, which allows enhanced managementinventory movement, and for financial reporting as well as improved system reliability. In 2010, we implemented a single enterprise system for all of our heavy-duty truck operations that supports inter-region sales to reduce the potential for lost sales due to out-of-stock parts.including the maintenance of our delivery vehicles, are subject to extensive federal, statelaws and localregulations relating to environmental protection and health and safety laws and regulations.in the U.S. as well as other countries in which we operate. These environmental laws govern, among other things, the emission and discharge of hazardous materials into the ground, air, or water; exposure to hazardous materials; and the generation, handling, storage, use, treatment, identification, transportation, and disposal of industrial by-products, waste water, storm water, and mercury and other hazardous materials.we cannot assure you that environmental laws will notmay change or become more stringent in the future in a manner that could have a material adverse effect on our business.(“CFCs”("CFCs") from air conditioners, other hazardous materials, or metals such as aluminum,18 “covered”" The Department of Justice has not promulgated rules on this portion of the system, and therefore there has been no progress on the implementation of the system to track and monitor major automotive parts. However, if this system is fully implemented, the requirement to collect the information would place substantial burdens on vehicle recyclers, including us, that otherwise would not normally exist. It would place similar burdens on repair shops, which may further discourage the use by such shops of recycled products. There is no pending initiative to implement the parts registration from a law enforcement point of view. However, there is a risk that a heightened legislative concern over safety of parts might precipitate an effort to push for the implementation of such rules.19owner’sowner's consent regarding the use of aftermarket products in the repair process, and the requirement to have aftermarket products certified by an independent testing organization. Some jurisdictions have laws that regulate the sale of certain recycled products that we provide, such as airbags. Additional laws of this kind may be enacted in the future. An increase in the number of states passing such legislation with prohibitions or restrictions that are more severe than current laws could have a material adverse impact on our business. Additionally, Congress could enact federal legislation restricting the use of aftermarket and recycled automotive products used in the course of collision repair.accidents. In addition, the cost of salvage vehicles may be lower as weather related accidents, which generate a larger supply of total loss vehicles.repairs.ITEM 1A.RISK FACTORSThe decline inU.S. adversely impacted our business.foreseeable future. Such conditions have, in some periods, resulted in fewer miles driven, fewer accident claims, and a reduction of vehicle repairs. repairs, all of which could negatively affect our business. Our sales are also impacted by changes to the economic health of vehicle owners. The economic health of vehicle owners is affected by many factors, including, among others, general business conditions, interest rates, inflation, consumer debt levels, the availability of consumer credit, taxation, fuel prices, unemployment trends and other matters that influence consumer confidence and spending. Many of these factors are outside of our control. If any of these conditions worsen, our business, results of operations, financial condition and cash flows could be adversely affected.the event that the U.S.addition, economic conditions, decline further or do not improve, we expectincluding decreased access to credit, may result in financial difficulties leading to restructurings, bankruptcies, liquidations and other unfavorable events for our customers, suppliers, logistics and other service providers and financial institutions that are counterparties to our credit facilities and interest rate swap transactions. These unfavorable events affecting our business will continue to be negatively affected. We recently expandedpartners could have an adverse effect on our business, results of operations, to include the United Kingdom. To the extent that the economic conditions in the U.K. deteriorate, our new business could be negatively affected.substantially in excess of 50%a majority of collision parts by dollar amount are supplied by OEMs, with the balance being supplied by distributors like us. The OEMs are therefore in a position to exert pricing pressure in the marketplace. We compete with the OEMs primarily on price and to a lesser extent on service and quality. From time to time, OEMs have experimented with reducing prices on specific products to match the lower prices of alternative products. If such price reductions were to become widespread, it could have a material adverse impact on our business.20Patent and Trademark Office records indicateDistrict Court in the Eastern District of Michigan contending that certain aftermarket parts we sell infringe Chrysler design patents relating to the Dodge Ram pickup truck. The Chrysler case is pending.thenthan they have in the past. To the extent that the OEMspast and are successful with intellectual propertyin asserting infringement claims,of these patents and defending their validity, we could be restricted or prohibited from selling certain aftermarket products, which could have an adverse effect on our business. We will likely incur significant expenses investigating and defending intellectual property infringement claims. In addition, aftermarket products certifying organizations may revoke the certification of parts that are the subject of the claims. Lack of certification may negatively impact us because many major insurance companies recommend or require the use of aftermarket products only if they have been certified by an independent certifying organization.hurtimpede our ability to serve our customers.We aremosta large portion of which are located insourced from Taiwan. Although alternative suppliers exist for substantially all aftermarket products distributed by us, the loss of any one supplier could have a material adverse effect on us until alternative suppliers are located and have commenced providing products. Moreover, our operations are subject to the customary risks of doing business abroad, including, among other things, natural disasters, transportation costs and delays, political instability, currency fluctuations and the imposition of tariffs, import and export controls and other non-tariff barriers (including changes in the allocation of quotas), as well as the uncertainty regarding future relations between China, Japan and Taiwan. Because a substantial volume of our sales involves products manufactured from sheet metal, we can be adversely impacted if sheet metal becomes unavailable or is only available at higher prices, which we may not be able to pass on to our customers.anythe auction company.companies. According to industry analysts, a small number of companies control a large percentage of the salvage auction market in the U.S. If an auction company prohibited us from participating in its auctions, began competing with us, or significantly raised its fees, our business could be adversely affected through higher costs or the resulting potential inability to service our customers. Moreover, we are facing increasedface competition in the purchase of salvage vehicles from direct competitors, rebuilders, exporters and others. This largerTo the extent that the number of bidders has caused andincreases, it may continue to causehave the effect of increasing our cost of goods sold for wholesale recycled products to increase.products. Some states regulate bidders to help ensure that salvage vehicles are purchased for legal purposes by qualified buyers. Auction companies have been actively seeking to reduce, circumvent or eliminate these regulations, which would further increase the number of bidders.21If our business relationships withend, we may lose important sales opportunities.In some places that we operate, alternativeAlternative parts usage is low, and therehas generally increased over the past ten years but has stabilized recently. There can be no assurance that such usage will increase.be maintained or will increase in the future. In addition, in some places we operate, alternative parts usage is relatively low. We also rely on business relationships with several insurance companies. These insurance companies encourage vehicle repair facilities to use products we provide. The business relationships include in some cases participation in aftermarket quality and service assurance programs that may result in a higher usage of our aftermarket products than would be the case without the programs. Our arrangements with these companies may be terminated by them at any time, including in connection with their own business concerns relating to the offering, availability, standards or operations of the aftermarket quality and service assurance programs. We rely on these relationships for sales to some collision repair shops, and a termination of these relationships may result in a loss of sales, which could adversely affect our results of operations.(“("Avery v. State Farm”Farm"), a jury decided in October 1999 that State Farm breached certain insurance contracts with its policyholders by using non-OEM replacement products to repair damaged vehicles when use of such products did not restore the vehicle to its “pre-loss"pre-loss condition.”" The jury found that State Farm misled its customers by not disclosing the use of non-OEM replacement products and the alleged inferiority of those products. The jury assessed damages against State Farm of $456 million, and the judge assessed an additional $730 million of disgorgement and punitive damages for violations of the Illinois Consumer Fraud Act. In April 2001, the Illinois Appellate Court upheld the verdict but reduced the damage award by $130 million because of duplicative damage awards. On August 18, 2005, the Illinois Supreme Court reversed the awards made by the circuit court and found, among other things, that the plaintiffs had failed to establish any breach of contract by State Farm. The U.S. Supreme Court declined to hear an appeal of this case. As a result of this case, some insurance companies reduced or eliminated their use of aftermarket products. Our financial results could be adversely affected if insurance companies modified or terminated the arrangements pursuant to which repair shops buy aftermarket or recycled products from us due to a fear of similar claims.wholesale aftermarket, recycled, refurbished or remanufactured products.22company’scompany's or division’sdivision's personnel and operations, which could negatively affect our operating results. In addition:materially and adversely affectresult in material adverse affects on our business;Our credit agreement places restrictions on our business.We have a senior secured debt financing facility with a group of lenders. Our total outstanding indebtedness (including bank financing, letters of credit, and notes payable in connection with acquisitions) as of December 31, 2011 was $991.4 million. The credit agreement contains operating and financial restrictions and requires that we satisfy certain financial and other covenants. The failure to comply with any of these covenants would cause a default under the credit agreement. A default, if not waived, could result in acceleration of our debt, in which case the debt would become immediately due and payable. If this occurs, we may not be able to repay our debt or borrow sufficient funds to refinance it. Even if new financing were available, it may be on terms that are less attractive to us than our existing credit facility or it may be on terms that are not acceptable to us.Our future capital needs may require that we seek debt financing or additional equity funding that, if not available, could cause our business to suffer.We may need to raise additional funds in the future to, among other things, refinance existing debt, fund our existing operations, improve or expand our operations, respond to competitive pressures, or make acquisitions. From time to time, we may raise additional funds through public or private financing, strategic alliances, or other arrangements. However, the [recent] turmoil in the credit markets has resulted in tighter credit conditions, which could affect our ability to raise additional funds. If adequate funds are not available on acceptable terms, we may be unable to meet our business or strategic objectives or compete effectively. If we raise additional funds by issuing equity securities, stockholders may experience dilution of their ownership interests, and the newly issued securities may have rights superior to those of the common stock. If we raise additional funds by issuing debt, we may be subject to higher borrowing costs and further limitations on our operations. If we fail to raise capital when needed, our business may be negatively affected.23All of our“crush only”"crush only" vehicles from other companies, including OEMs, which we dismantle and which generate scrap metal and other metals. The prices of scrap and other metals have historically fluctuated, sometimes significantly, due to market factors. In addition, buyers may stop purchasing metals entirely due to excess supply. To the extent that the prices of metals decrease materially or buyers stop purchasing metals, our revenue from such sales will suffer and a write-down of our inventory value could be required. The cost of our wholesale recycled and our self service retail inventory purchases may also decreasewill change as a result of fallingfluctuating scrap metal and other metals prices. However,In a period of falling metal prices, there can be no assurance that our inventory purchasing cost will decrease the same amount or at the same rate as the scrap metal and other metals prices decline, and there may be a delay between the scrap metal and other metals price reductions and any inventory cost reductions. The price of steel is a component of the cost to manufacture products for our aftermarket business. We incur substantial freight costs to import parts from our suppliers, many of whom are located in Asia. If the cost of steel or freight rose we might not be able to pass the cost increases on to our customers.hasor other intangible assets have become impaired, we may incur significant charges to our pre-tax income.2011,2013, our total goodwill subject to future impairment testing was $1.5 billion.$1.9 billion. For further discussion of our annual impairment test, see “Goodwill Impairment”"Goodwill Impairment" in the Critical Accounting Policies and Estimates section of Item 7 in this Annual Report on Form 10-K.Because ourwholesale recycled, products,remanufactured and refurbished parts. Thus, our business is impacted by factors which influence the number and/or severity of accidents and mechanical failures including, but not limited to, the number of vehicles on the road, the number of miles driven, the ages of drivers, the occurrence and severity of certain weather conditions, the congestion of traffic, the use of cellular telephones and other electronic equipment by drivers, the congestion of traffic, the occurrence and severity of certain weather conditions, the use of alcohol and drugs by drivers, the effectiveness of accident avoidance systems in new vehicles, the reliability of new OEM parts, and the condition of roadways, impact our business. In this regard,roadways. Additionally, an increase in fuel prices may cause the number of vehicles on the road, the number of miles driven, and the need for mechanical repairs and maintenance to decline, as motorists seek alternative transportation options. Mild weather conditions, particularly during winter months, tend to result in a decrease of vehicle accidents. Moreover, a number of states and municipalities have adopted, or are considering adopting, legislation banning the use of handheld cellular telephones or other electronic devices while driving, and such restrictions could lead to a decline in accidents. To the extent OEMs develop or are mandated by law to install new accident avoidance systems, the number and severity of accidents24 Moreover, an increase in fuel prices may cause the number of vehicles on the road to decline and the number of miles driven to decline, as motorists seek alternative transportation options, and this also could lead to a decline in accidents. In addition, the number of new automobiles sold annually in the U.S. has dropped since 2007 compared to the1999 through 2006. Thisyear-to-year. Periods of decreased sales could result in a reduction in the number of vehicles on the road and consequently fewer vehicles involved in accidents.accidents or in need of mechanical repair or maintenance. Substantial further declines in automotive sales in the future could have a material adverse effect on our business, results of operations and/or financial condition. In addition, if vehicle population trends result in a disproportionately high number of older vehicles on the average age of vehicles has been increasing, androad, insurance companies may find it uneconomical to repair oldersuch vehicles or there could be less costly repairs. If vehicle population trends result in a disproportionately high number of newer vehicles on the road, the demand generally for mechanical repairs and maintenance would likely decline due to the newer, longer-lasting parts in the vehicle population and mechanical failures being covered by OEM warranties for the first years of a vehicle's life. Moreover, alternative collision and mechanical parts are less likely to be used on newer vehicles.25predecessors’predecessors' past or present facilities and at independent waste disposal sites. These laws often impose liability even if the owner or operator did not know of, or was not responsible for, the release of such hazardous substances.claims.that could be named as defendants in such lawsuits.and customers against claims and damages relating to product liability and product recalls. The existence of claims or damages for which we must defend and indemnify insurance companiesthese parties could also negatively impact our business, results of operations or financial condition.“covered"covered major part.”" The Department of Justice has not promulgated rules on this portion of the system, and therefore there has been no progress on the implementation of the system to track and monitor major automotive parts. However, if this system is fully implemented, the requirement to collect the information would place substantial burdens on automotive parts recyclers, including us, that otherwise would not normally exist. It would place similar burdens on repair shops, which may further discourage the use of recycled products by such shops.Future adjustments to contingent purchase price related to acquisitions could materially affect our results.From time to time we acquire companies with a component of the purchase consideration being delayed and the payment thereof contingent on certain performance or other factors (the “contingent purchase price”). The accounting principles generally accepted in the United States require that we estimate the amount of the contingent purchase price at the time we complete the acquisition. Each subsequent reporting period (until the contingent purchase price is either paid or no longer potentially payable), we are required to re-evaluate the estimated amount of remaining contingent purchase price that is likely to be paid. If the revised estimate of the future contingent purchase price is higher than the amount accrued, then the difference must be recorded and charged to the income statement in that period. If the revised estimate of the future contingent purchase price is lower than the amount accrued, then the accrual is reduced and the difference is credited to income for the26period. Because some of these payments would not be deductible for tax purposes, it is possible that the expense (or income) would not be tax-effected on our income statements. These adjustments, if required, could be material to our future results of operations.Mexico.Costa Rica, and we may expand our operations into other countries. Our foreign operations expose us to additional risks associated with international business, which could have an adverse effect on our business, results of operations and/or financial condition, including import and export requirements and compliance with anti-corruption laws, such as the U.K. Bribery Act 2010 and the Foreign Corrupt Practices Act. We also incur costs in currencies, other than our functional currencies, in the countries in which we operate. We are thus subject to foreign exchange exposure to the extent that we purchase inventoryoperate in different currencies, than we denominate our sales, as well as exposure to foreign tax and other foreign and domestic laws. In addition, Mexico is currently experiencing a heightened level of criminal activity that could affect our ability to maintain our supply of certain aftermarket products.“securities”"securities") in the future. We may also issue shares of common stock under our equity incentive plan or in connection with future acquisitions. We cannot predict the size of future issuances of securities or the effect, if any, that future issuances and sales of shares of our common stock or other securities will have on the price of our common stock. Sales of substantial amounts of common stock (including shares issued in connection with an acquisition), the issuance of additional debt securities, or the perception that such sales or issuances could occur, may cause the price of our common stock to fall.ITEM 1B.UNRESOLVED STAFF COMMENTSITEM 2.PROPERTIES“Item 1—Business” above,Item 1 of this Annual Report on Form 10-K, and such description is incorporated by reference into this Item 2. Our properties are sufficient to meet our present needs, and we do not anticipate any difficulty in securing additional space to conduct operations or additional office space, as needed, on terms acceptable to us.ITEM 3.LEGAL PROCEEDINGSITEM 4.MINE SAFETY DISCLOSURES27ITEM 5. MARKET FOR REGISTRANT’SREGISTRANT'S COMMON EQUITY, RELATED STOCKHOLDER MATTERS AND ISSUER PURCHASES OF EQUITY SECURITIES“LKQX.”"LKQ." At December 31, 20112013 there were 3326 record holders of our common stock. The following table sets forth, for the periods indicated, the range of the high and low sales prices of shares of our common stock on NASDAQ. High Low $ 20.90 $ 18.02 22.00 17.29 21.09 17.81 23.26 20.31 26.30 22.00 27.27 22.73 27.75 20.38 31.25 22.25 High Low 2012 First Quarter $ 16.78 $ 15.06 Second Quarter 18.67 14.63 Third Quarter 20.02 16.52 Fourth Quarter 22.29 18.38 2013 First Quarter 23.99 20.09 Second Quarter 26.58 20.28 Third Quarter 32.29 25.38 Fourth Quarter 34.32 30.61 facility contains,agreement and our senior notes indenture contain, and future financing agreements may contain, financial covenants and limitations on payment of cash dividends or other distributions of assets.“Peer Group”"Peer Group"): Copart, Inc.; O’ReillyO'Reilly Automotive, Inc.; Genuine Parts Company; and Fastenal Co., for the period beginning on December 31, 20062008 and ending on December 31, 20112013 (which was the last day of our 20112013 fiscal year). The stock price performance in the following graph is not necessarily indicative of future stock price performance. The graph assumes that the value of an investment in each of the Company’sCompany's common stock, the NASDAQ Stock Market (U.S.) Index and the Peer Group was $100 on December 31, 20062008 and that all dividends, where applicable, were reinvested.28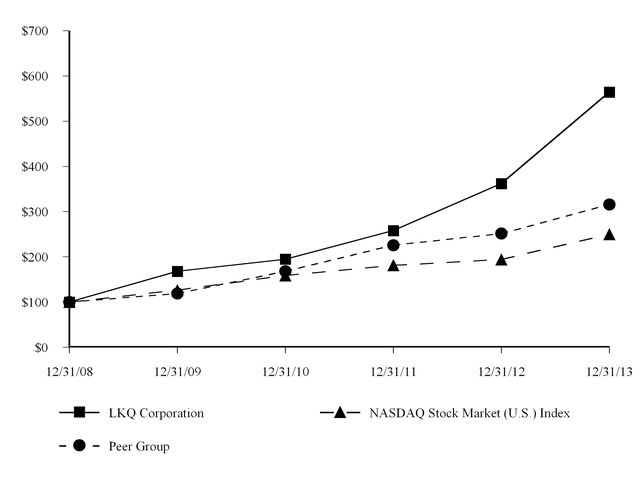
12/31/2008 12/31/2009 12/31/2010 12/31/2011 12/31/2012 12/31/2013 LKQ Corporation $ 100 $ 168 $ 195 $ 258 $ 362 $ 564 NASDAQ Stock Market (U.S.) Index $ 100 $ 126 $ 159 $ 181 $ 194 $ 250 Peer Group $ 100 $ 119 $ 168 $ 226 $ 251 $ 316 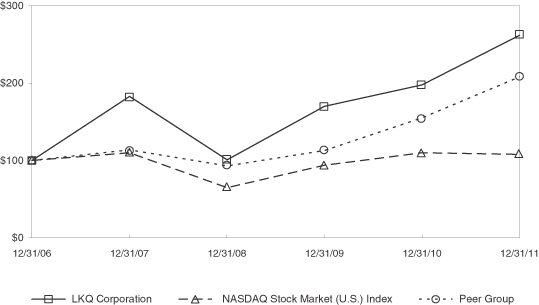
12/31/2006 12/31/2007 12/31/2008 12/31/2009 12/31/2010 12/31/2011 $ 100 $ 183 $ 101 $ 170 $ 198 $ 262 $ 100 $ 110 $ 65 $ 94 $ 110 $ 108 $ 100 $ 114 $ 93 $ 113 $ 155 $ 208 The following table provides informationall of our equity compensation plans as of December 31, 2011.Equity Compensation Plan Information Number of
securities to be issued
upon exercise of
outstanding options,
warrants, and rights
(a) Weighted-average
exercise price of
outstanding options,
warrants, and rights
(b) Number of securities remaining
available for future
issuance under equity
compensation plans (excluding
securities reflected in column (a))
(c) 6,539,046 $ 12.93 716,791 $ — 7,255,837 7,876,185 — $ — — 7,255,837 7,876,185 The number of securities to be issued upon exercise of outstanding options, warrants, and rights includes outstanding stock options and outstanding restricted stock units but excludes restricted stock.29The number of securities remaining for future issuance under equity compensation plans includes 7,331,768 shares under the LKQ Corporation 1998 Equity Incentive Plan and 544,417 shares under the LKQ Corporation Stock Option and Compensation Plan for Non-Employee Directors.See Note 4, “Equity Incentive Plans,” to the consolidated financial statements included in Part II,III, Item 812 of this Annual Report on Form 10-K for further information related to the equity incentive plans listed above.30ITEM 6.SELECTED FINANCIAL DATA“Management’s"Management's Discussion and Analysis of Financial Condition and Results of Operations”Operations" in Item 7 of this Annual Report on Form 10-K and our consolidated financial statements and related notes included in Item 8 of this Annual Report on Form 10-K. In 2009, we reclassified into discontinued operations the results of certain self service retail facilities that we sold, agreed to sell or closed. Statements of Income data for prior periods have been updated to reflect only the continuing operations. Year Ended December 31, (in thousands, except per share data) 2007 2008 2009 2010 2011 (a) (b) (c) (d) (e) $ 1,112,351 $ 1,908,532 $ 2,047,942 $ 2,469,881 $ 3,269,862 614,034 1,064,706 1,120,129 1,376,401 1,877,869 498,317 843,826 927,813 1,093,480 1,391,993 119,051 193,280 231,448 297,877 361,483 16,009 35,522 30,899 28,316 22,447 (1,612 ) (1,375 ) (4,768 ) (564 ) 3,265 104,654 159,133 205,317 270,125 335,771 41,032 62,041 78,180 103,007 125,507 $ 63,622 $ 97,092 $ 127,137 $ 167,118 $ 210,264 $ 0.56 $ 0.71 $ 0.90 $ 1.17 $ 1.44 $ 0.53 $ 0.69 $ 0.88 $ 1.15 $ 1.42 114,161 136,488 140,541 143,271 146,126 119,937 141,023 143,990 145,857 148,375 Year Ended December 31, 2007 2008 2009 2010 2011 $ 54,369 $ 132,961 $ 164,002 $ 159,183 $ 211,772 (905,821 ) (138,910 ) (102,494 ) (191,583 ) (571,607 ) 921,629 11,793 (33,165 ) 18,962 311,411 908,122 143,435 125,624 218,243 700,010 18,018 33,421 38,062 41,428 54,505 $ 1,692,655 $ 1,881,804 $ 2,020,121 $ 2,299,509 $ 3,199,704 389,469 441,705 526,125 611,555 752,042 658,462 642,874 603,045 600,954 956,076 849,777 1,020,506 1,179,434 1,414,161 1,644,085 Year Ended December 31, (in thousands, except per share data) 2013 2012 2011 2010 2009 (a) (b) (c) (d) (e) Statements of Income Data: Revenue $ 5,062,528 $ 4,122,930 $ 3,269,862 $ 2,469,881 $ 2,047,942 Cost of goods sold 2,987,126 2,398,790 1,877,869 1,376,401 1,120,129 Gross margin 2,075,402 1,724,140 1,391,993 1,093,480 927,813 Operating income 530,180 437,953 361,483 297,877 231,448 Other (income) expense Interest expense 51,184 31,429 24,307 29,765 32,252 Other (income) expense, net 3,169 (2,643 ) 1,405 (2,013 ) (6,121 ) Income from continuing operations before provision for income taxes 475,827 409,167 335,771 270,125 205,317 Provision for income taxes 164,204 147,942 125,507 103,007 78,180 Income from continuing operations $ 311,623 $ 261,225 $ 210,264 $ 167,118 $ 127,137 Basic earnings per share from continuing operations $ 1.04 $ 0.88 $ 0.72 $ 0.58 $ 0.45 Diluted earnings per share from continuing operations $ 1.02 $ 0.87 $ 0.71 $ 0.57 $ 0.44 Weighted average shares outstanding-basic 299,574 295,810 292,252 286,542 281,082 Weighted average shares outstanding-diluted 304,131 300,693 296,750 291,714 287,980 Year Ended December 31, 2013 2012 2011 2010 2009 Other Financial Data: Net cash provided by operating activities $ 428,056 $ 206,190 $ 211,772 $ 159,183 $ 164,002 Net cash used in investing activities (505,606 ) (352,534 ) (571,607 ) (191,583 ) (102,494 ) Net cash (used in) provided by financing activities 165,941 157,072 311,411 18,962 (33,165 ) Capital expenditures 90,186 88,255 86,416 61,438 55,870 408,384 265,336 486,934 143,578 65,171 Depreciation and amortization 86,463 70,165 54,505 41,428 38,062 Balance Sheet Data: Total assets $ 4,518,774 $ 3,723,456 $ 3,199,704 $ 2,299,509 $ 2,020,121 Working capital 1,121,864 896,407 752,042 611,555 526,125 Long-term obligations, including current portion 1,305,781 1,118,478 956,076 600,954 603,045 Stockholders' equity 2,350,745 1,964,094 1,644,085 1,414,161 1,179,434 (a) Includes the results of operations of Keystone Automotive Industries, Inc.Sator Beheer B.V. from its acquisition on October 12, 2007effective May 1, 2013 and 1119 other businesses from their respective acquisition dates in 2007.2013. Our 2013 results include a loss on debt extinguishment of $2.8 million related to our execution of a new senior secured credit facility on May 3, 2013. Also in 2013, we recorded a net $2.5 million loss on adjustments to contingent consideration liabilities, which is included in Other expense, net.31(b) Includes the results of operations of Pick-Your-Part Auto Wrecking from its acquisition on August 25, 2008 and seven other30 businesses from their respective acquisition dates in 2008.(c)Includes the2012. Our 2012 results of operations of Greenleaf Auto Recyclers, LLC (“Greenleaf”) from its acquisition on October 1, 2009 and seven other businesses from their respective acquisition dates in 2009. We recorded a gain on bargain purchase for the Greenleaf acquisitioninclude gains totaling $4.3$17.9 million, which isare included in Other income, net.Cost of goods sold, resulting from lawsuit settlements with(d)Includes the results of operations of 20 businesses from their respective acquisition dates in 2010.(e)(c)Includes the results of operations of Euro Car Parts Holdings Limited from its acquisition effective October 1, 2011 and 20 other businesses from their respective acquisition dates in 2011. Our 2011 results include a loss on debt extinguishment of $5.3 million related to our execution of a new senior secured credit facility on March 25, 2011. Also in 2011, we recorded a net $1.4 million gain on adjustments to contingent consideration liabilities. The loss on debt extinguishment and adjustment to contingent consideration liabilities are included in Other expense, net. (d) Includes the results of operations of 20 businesses from their respective acquisition dates in 2010. (e) Includes the results of operations of Greenleaf Auto Recyclers, LLC ("Greenleaf") from its acquisition on October 1, 2009 and seven other businesses from their respective acquisition dates in 2009. We recorded a gain on bargain purchase for the Greenleaf acquisition totaling $4.3 million, which is included in Other income, net. (f) We sold 23,600,000 shares of our common stock on September 19, 2007 in connection with a follow-on public offering. Accordingly, the shares used in the per share calculations for basic and diluted earnings per share in 2007 do not fully reflect the impact of the transactions that occurred during that year.(g)Includes considerationcash paid and payable for acquisitions, and amounts paid and payable for property additions.net of cash acquired.32ITEM 7. MANAGEMENT’SMANAGEMENT'S DISCUSSION AND ANALYSIS OF FINANCIAL CONDITION AND RESULTS OF OPERATIONSvehicles (carscars and trucks).trucks. Buyers of vehicle replacement products have the option to purchase from primarily five sources: new products produced by original equipment manufacturers (“OEMs”("OEMs"), which are commonly known as OEM products; new products produced by companies other than the OEMs, which are sometimes referred to as “aftermarket”aftermarket products; recycled products originally produced by OEMs, which we refer to as recycled products;obtained from salvage vehicles; used products that have been refurbished; and used products that have been remanufactured.replacement products such as wheels, bumper covers and lights, and remanufactured engines. Collectively, we refer to ourthese products as alternative parts.parts because they are not new OEM products. We are the nation’s largest provider of alternative vehicle collision replacement products and a leading provider of alternative vehicle mechanical replacement products. Ourproducts, with our sales, processing, and distribution facilities reaching most major markets in the United States. Our wholesale operations also reach most major markets in the U.S. and Canada. We are a leading provider of alternative vehicle replacement products in the United Kingdom, and in the second quarter of 2013, we expanded our wholesale operations effective October 1, 2011 with ourinto continental Europe through the acquisition of Euro Car Parts Holdings Limited (“ECP”), the largestSator, a leading distributor of automotive aftermarket products in the United Kingdom.Benelux region. In addition to our wholesale operations, we operate self service retail facilities across the U.S. that sell recycled automotive products. We also sell recycled heavy-duty truck products and used heavy-duty trucks. We have organized our businesses into fourthree operating segments: Wholesale—Wholesale - North America; Wholesale—Wholesale - Europe; and Self Service; and Heavy-Duty Truck.Service. We aggregate our North American operating segments (Wholesale—(Wholesale - North America and Self Service and Heavy-Duty Truck)Service) into one reportable segment, resulting in two reportable segments: North America and Europe. Due to these factors, our operating results in future periods can be expected to fluctuate. Accordingly, our historical results of operations may not be indicative of future performance.ofthrough both organic growth and acquisitions. We have pursued acquisitions that we believe will help drive profitability, cash flow and stockholder value. Our principal focus for acquisitions is companies that are market leaders, will expand our geographic presence and enhance our ability to provide a wider choicewide array of automotive products to our customers through our distribution network.productsparts business in those countries. Under the terms of the agreement, we will contribute our experience to help establish automotive parts recycling operations and to facilitate the procurement of aftermarket parts, while Suncorp will supply salvage vehicles to the venture as well as assist in establishing relationships with repair shops as customers. Our investment will expand our customers.Effectivegeographic presence into Australia and New Zealand and will provide the opportunity to establish a leadership position in the supply of alternative parts in those countries. 1, 2011, we acquired ECP, which marksexpanded our entryoperations into the European automotive aftermarket business. ECP operates outbusiness through our acquisition of 90 branches, supported by eight regional hubs and a national distribution center from which multiple deliveries are made each day. ECP’sECP. ECP's product offerings are primarily focused on automotive aftermarket mechanical products, many of which are sourced from the same suppliers that provide products to the OEMs. The expansion of our geographic presence beyond North America into the European market offers an opportunity to us as that market has historically had a low penetration of alternative collision parts.of ECP, we madecompleted 20 acquisitions in North America in 2011 (12(17 wholesale businesses five recycled heavy-duty truck products businesses and three3 self service retail operations). Our acquisitions included the purchase of two engine remanufacturers, which expanded our presence in the remanufacturing industry that we entered in 2010. Additionally, our acquisition of an automotive heating and cooling component distributor supplements our expansion into the automotive heating and cooling aftermarket33products market. Our North American wholesale business acquisitions also included the purchase of the U.S. vehicle refinish paint distribution business of Akzo Nobel Automotive and Aerospace Coatings (the “Akzo Nobel paint business”), which allowed us to increase our paint and related product offerings, and expand our geographic presence in the automotive paint market. Our other 2011 acquisitions enabled us to expand our geographic presence and to enter new markets.In 2010, we made 20 acquisitions in North America (16 wholesale businesses, one recycled heavy-duty truck products business, two self service retail operations and one tire recycling business). Our acquisitions included the purchase of an engine remanufacturer, which allowed us to further vertically integrate our supply chain. We expanded our product offerings through the acquisition of an automotive heating and cooling component business, as well as a tire recycling business. Our 2010 acquisitions have also enabled us to expand our geographic presence, most notably in Canada through our purchase of Cross Canada, an aftermarket product supplier.In 2009, we acquired eight businesses in North America (five wholesale businesses and three recycled heavy-duty truck products businesses). The acquisitions enabled us to increase our geographic presence in the wholesale products business and expand our network of recycled heavy-duty truck products facilities. Our 2009 acquisitions included Greenleaf Auto Recyclers, LLC (“Greenleaf”), which we purchased from Schnitzer Steel Industries, Inc. (“SSI”) in October. This acquisition enabled us to increase our geographic presence and increase our capacity in numerous markets.DivestituresIn October 2009, we sold to SSI four retail oriented self service facilities in Oregon and Washington. We also sold certain business assets to SSI related to two self service retail facilities in Northern California and a self service retail facility in Portland, Oregon. We have closed the two self service retail facilities in Northern California and converted the self service operation in Portland to a wholesale recycling business. We also agreed to sell to SSI two self service retail facilities in Dallas, Texas and closed this portion of the transaction on January 15, 2010. Certain of these facilities qualified for treatment as discontinued operations. The financial results and assets and liabilities of these facilities are segregated from our continuing operations and presented as discontinued operations in the Consolidated Balance Sheets and Consolidated Statements of Income for all periods presented. Unless otherwise noted, this Management’s Discussion and Analysis of Financial Condition and Results of Operations relates only to financial results from continuing operations.threetwo categories: (i) aftermarket, other newparts and refurbished products;services and (ii) recycled, remanufacturedother. Our parts and related products and services; and (iii) other.Ourservices revenue is generated from the sale of vehicle replacement products and related services includes sales ofincluding (i) aftermarket, other new and refurbished products and (ii) recycled, remanufactured and related products and services. During 2011,the year ended December 31, 2013, sales of vehicle replacement products and services represented approximately 84%87% of our consolidated sales. Of these sales, approximately 59% were derived from the sales of aftermarket, other new and refurbished products, while 41% were composed of recycled and remanufactured products and services sales. Our aftermarket, other new and refurbished products revenue includes revenue generated by ECP, an automotive aftermarket products distributor, between the acquisition date and year-end. With our acquisitions of engine remanufacturers in 2010 and 2011, we have begun to vertically integrate our recycled and remanufactured products supply chain by bringing the engine remanufacturing process in house.engines, transmissions, front-ends,sheet metal crash parts such as doors, trunk lids,hoods, and fenders; bumper covers, hoods, fenders, grilles, valances, wheels,covers; engines; head lamps and tail lamps. For an additional fee, we sell extended warranty contracts for certain mechanical products. These contracts cover the cost of partslamps; and labor and are sold for34periods of six months, one year, two years or a non-transferable lifetime warranty. We defer the revenue from such contracts and recognize it ratably over the term of the contracts or three years in the case of lifetime warranties.wheels. The demand for our products and services is influenced by several factors, including the number of vehicles in operation, the number of miles being driven, the frequency and severity of vehicle accidents, the age profile of vehicles in accidents, the availability and pricing of new OEM parts, seasonal weather patterns and local weather conditions. Additionally, automobile insurers exert significant influence over collision repair shops as to how an insured vehicle is repaired and the cost level of the products used in the repair process. Accordingly, we consider automobile insurers to be key demand drivers of our products. While they are not our direct customers, we do provide insurance carriers services in an effort to promote the increased usage of alternative replacement products in the repair process. Such services include the review of vehicle repair order estimates, direct quotation services to insurance company adjusters and an aftermarket parts quality and service assurance program. We neither charge a fee to the insurance carriers for these services nor adjust our pricing of products for our customers when we perform these services for insurance carriers.replacement product prices, the age and mileage of the vehicle from which the part was obtained, competitor pricing and competitor pricing.2011,2013, revenue from other sources represented approximately 16%13% of our consolidated sales. These other sources include scrap sales and sales of aluminum ingots and sows. We derive scrap metal from several sources, including vehicles that have been used in both our wholesale and self service recycling operations and from OEMs and other entities that contract with us to dismantle and scrap certain vehicles (which we refer to as “crush only” vehicles). Revenue from scrap salesfor secure disposal of "crush only" vehicles. Other revenue will vary from period to period based on fluctuations in commodity prices the speed with which they fluctuate and the volume of vehicles we sell for scrap.including labor, fuel expense, and facility and machinery costs related to the purchasing, warehousing and distribution of our inventory.inventory, including labor, facility and equipment costs and depreciation. Our aftermarket products are acquired from a number of vendors. Our cost of goods sold for refurbished products includes the price we pay for inventory,cores, freight, and costs to refurbish the parts, including direct and indirect labor, facility costs including rent and utilities, machinery and equipment costs, including equipment rental, repairs and maintenance, depreciation and other overhead related to our refurbishing operations.towing fees.pricing trends for used vehicles, the number of vehicles designated as “total losses” by insurance companies, the production level of new vehicles (which provides the source from which salvage vehicles ultimately come), and the status of laws regulating bidders or exporters of salvage vehicles. Due to changes relating to these factors, we have seen the prices we pay for salvage vehicles fluctuate over time. Our cost of goods sold also includes labor and other costs we incur to acquire and dismantle such vehicles. Since 2009, ourOur labor and labor-related costs related to acquisition and dismantling have accountedaccount for approximatelybetween 8% and 10% of our cost of goods sold for vehicles we dismantle. We are facing increasing competition in the purchase of salvage vehicles from shredders and scrap recyclers, internet-based buyers, and others. Combined with overall higher demand for used vehicles resulting from the economic decline beginning in late 2008, we have been paying and may continue to pay higher prices for salvage vehicles. The acquisition and dismantling of salvage vehicles is a manual process and, as a result, energy costs are not material. Our cost of goods sold for remanufactured products includes the price we pay for cores, freight,cores; freight; and costs to remanufacture the products, including direct and indirect labor, rent,facility and equipment costs, depreciation and other overhead related to our remanufacturing operations. We also sell separately priced extended warranty contractscertain mechanical products. The expense relatedour wholesale and self service recycled product operations, and therefore, the costs of these sales include the proportionate share of the price we pay for the salvage vehicles as well as the applicable auction, storage and towing fees and internal costs to extended warranty claims is recognized whenpurchase and dismantle the claim is made.35wholesale and heavy-duty truck salvage yards and self service retail facilities. These costs include laborpersonnel expenses such as wages, incentive compensation and employee benefits for plant management and facility and warehouse personnel, and related incentive compensation and employee benefits,as well as rent other facility expenses such as utilities, property insurance, and taxes, and repairs and maintenance costs related tofor our facilities and equipment.related utilities, property taxes, repairs and maintenance. The costs included in facility and warehouse expenses do not relate to inventory processing or conversion activities and, as such, are classified below the gross margin line on our Consolidated Statements of Income.laborpersonnel costs such as wages, employee benefits and incentive compensation for drivers, fuel,drivers; third party freight costs, localcosts; fuel; and expenses related to our delivery and transfer trucktrucks, including vehicle leases, or rentals, vehicle repairs and maintenance supplies and insurance.personnel,personnel; advertising, promotion and marketing costs,costs; credit card fees; telephone and other communication expenses, credit card feesexpenses; and bad debt expense. Since 2009, personnelPersonnel costs have accountedaccount for approximately 80% of our selling and marketing expenses. Most of our product sales personnel are paid on a commission basis. The number and quality of our sales force is critical to our ability to respond to our customers’ needs and increase our sales volume. Our objective is to continually evaluate our sales force, develop and implement training programs, and utilize appropriate measurements to assess our selling effectiveness.financial servicesfield support center, thatwhich provide corporate and field management, treasury, accounting, legal, payroll, business development, human resources and information systems functions. These costsGeneral and administrative expenses include wages and benefits for corporate, regional and administrative personnel,personnel; stock-based compensation and other incentive compensation,compensation; information systems support and maintenance expenses; and accounting, legal and other professional fees, IT system support and maintenance expenses, and telephone and other communication costs.accidents. In addition, the cost of salvage vehicles tends to be lower as more weather related accidents, occur, generating a larger supply of total loss vehicles.impairment, self-insurance programs, contingencies, accounting for income taxes, and stock-based compensation.impairment. We base our estimates on historical experience and on various other assumptions that we believe are reasonable under the circumstances. The results of these estimates form the basis for our judgments about the carrying values of assets and liabilities and our recognition of revenue. Actual results may differ from these estimates.36a reservean allowance for estimated returns, discounts and allowances that management estimates based upon historical information. A product would ordinarily be returned within a few days of shipment. Our customers may earn discounts based upon sales volumes or sales volumes coupled with prompt payment. Allowances are normally given within a few days following product shipment. We analyze historical returns and allowances activity by comparing the items to the original invoice amounts and dates. We use this information to project future returns and allowances on products sold. If actual returns and allowances are higher than our historical experience, there would be an adverse impact on our operating results in the period of occurrence.For an additional fee, we also sell extended warranty contracts for certain mechanical products. Revenuethese contracts is deferredthe sale of scrap, cores, and recognized ratably overother metals when title has transferred, which typically occurs upon delivery to the term of the contracts, or three years in the case of lifetime warranties.Inventory. Aftermarket and refurbished product inventory is recorded at the lower of cost or market.Inventory. Our aftermarket inventory cost is established based on the average price we pay for parts, and includes expenses incurred for freight and overhead costs. For items purchased from foreign sources,companies, import fees and duties and transportation insurance are also included. Our refurbished productRefurbished inventory cost is based on the average price we pay for cores, and also includes expenses incurred for freight, labor and other overhead related to our refurbishing costs and overhead.operations.Inventory. Salvage inventory is recorded at the lower of cost or market.Inventory. Our salvage inventory cost is established based upon the price we pay for a vehicle, including auction, storagetowing and towingstorage fees, as well as expenditures for buying and dismantling.dismantling vehicles. Inventory carrying value is determined using the average cost to sales percentage at each of our facilities and applying that percentage to the facility’sfacility's inventory at expected selling prices.prices, the assessment of which incorporates the sales probability based on a part's days in stock and historical demand. The average cost to sales percentage is derived from each facility’sfacility's historical vehicle profitability for salvage vehicles purchased at auction or from contracted rates for salvage vehicles acquired under direct procurement arrangements.vehicles. Remanufactured inventory cost is based upon the price paid for cores, and also includes expenses incurred for freight, direct manufacturing costs and overhead.overhead related to our remanufacturing operations.our carrying value is recorded at the lower of cost or market and is reduced regularly to reflect the age and current anticipated demand for our products.demand. If actual demand differs from our estimates, additional reductions to our inventory carrying value would be necessary in the period such determination is made.372011,2013, we recorded $82.4$55.7 million of contingent consideration liabilities. Actual payouts under these contingent consideration arrangements will be determined at the end of the performance periods, and ifOf this amount, $49.7 million represents the maximum payments were earned,payment for the total payout would be approximately $110 million.In September 2011, the Financial Accounting Standards Board (“FASB”) issued Accounting Standards Update (“ASU”) No. 2011-08, “Testing GoodwillWhen testing goodwill for Impairment,” which grants entities the option to first perform a qualitative assessment of whether it is more likely than not that a reporting unit’s fair value is less than its carrying value. Under this ASU, if an entity concludes that it is more likely than not that the fair value of a reporting unit is less than its carrying value, the entity is required to perform the two-step impairment, test for the reporting unit. The revised guidance also allows an entity to bypass the qualitative assessment and proceed directly to step one of the two-step impairment analysis where a fair value calculation is performed. This guidance is effective for annual and interim goodwill impairment tests performed for fiscal years beginning after December 15, 2011. Early adoption is also permitted, and we elected to adopt this guidance for our goodwill impairment tests in the fourth quarter of 2011.Under both the qualitative assessment and the two-step quantitative impairment test, we are required to evaluate events and circumstances that may affect the performance of the reporting unit and the extent to which the events and circumstances may impact the future cash flows of the reporting unit to determine whether the fair value of the assets exceed the carrying value. If these assumptions or estimates change in the future, we may be required to record impairment charges for these assets. In response to changes in industry and market conditions, we may be required to strategically realign our resources and consider restructuring, disposing of, or otherwise exiting businesses, which could result in an impairment of goodwill.fourthree operating segments: Wholesale—North America; Wholesale—Europe; and Self Service; and Heavy-Duty Truck.Service. We have also concluded that these fourthree operating segments are reporting units for purposes of goodwill impairment testing in 2011.2013. We perform goodwill impairment tests annually in the fourth quarter and between annual tests whenever events indicate that an impairment may exist. During 2011,2013, we did not identify any events or changes in circumstances that would more likely than not reduce the fair value of our reporting units below their carrying amounts. Therefore, we did not perform any impairment tests other than our annual test in the fourth quarter of 2011.In 2011, we performedqualitative assessment under the guidance of ASU 2011-08 for our Wholesale—North America and Self Service reporting units. Based on our analyses, we determined it was more likely than not that theunit exceeded its estimated fair value. The fair value of each of these reporting units exceeded the respective carrying value, and no adjustments to goodwill were required. After considering the results of the Heavy-Duty Truck 2010 impairment test and the growth in the reporting unit in 2011, we elected to bypass the qualitative assessment and proceed directly to the quantitative two-step goodwill impairment test for this reporting unit. In our step one calculation, weestimates are established the fair value of the reporting unit using weightings of the results of a discounted cash flow methodology and a comparative market multiples approach. We believe that using two methods to determine fair value limits the chances of an unrepresentative valuation. The results of this test indicated that the goodwill was not impaired. A 10% decrease in the fair value estimate of the Heavy-Duty Truck reporting unit would not have changed this determination. Given the limited period of time between the acquisition date of ECP and the date of our impairment test, we updated our quantitative assessment of the reporting unit’s fair value from the acquisition date to the date of our annual goodwill impairment test. Based on the results of this analysis, we concluded that the fair value of the Wholesale—Europe exceeded the carrying value, and no adjustments to goodwill were required.382011,2013, we had a total of $1.5$1.9 billion in goodwill subject to future impairment tests. If we were required to recognize goodwill impairments, we would report those impairment losses as part of our operating results.Self-Insurance Programsself-insure a portion of employee medical benefits under the terms ofdetermined that no adjustments were necessary when we performed our employee health insurance program. We also self-insure a portion of our property and casualty risk, which includes automobile liability, general liability, directors and officers liability, workers’ compensation and property, under deductible insurance programs. We purchase certain stop-loss insurance to limit our liability exposure. The insurance premium costs are expensed over the contract periods.We record an accrual for the claims expense related to our employee medical benefits, automobile liability, general liability, directors and officers liability, workers’ compensation and property claims based upon the expected amount of all such claims. If actual claims are higher than what we anticipated, our accrual might be insufficient to cover our claims costs, and we would increase our claims expense in that period to cover the shortfall.ContingenciesWe are subject to the possibility of various loss contingencies arisingannual impairment testing in the ordinary coursefourth quarter of business resulting from litigation, claims and other commitments, and from a variety of environmental and pollution control laws and regulations. We consider the likelihood of loss or the incurrence of a liability, as well as our ability to reasonably estimate the amount of loss, in determining loss contingencies. We accrue an estimated loss contingency when it is probable that a liability has been incurred and the amount of loss can be reasonably estimated. We determine the amount of reserves, if any, with the assistance of outside legal counsel. We regularly evaluate current information available to us to determine whether the accruals should be adjusted. If the amount of an actual loss were greater than the amount we have accrued, the excess loss would have an adverse impact on our operating resultsperiod thatfair value estimates of the loss occurred. If the loss contingency is subsequently determined to no longer be probable, the amount of loss contingency previously accrued would be included in our operating resultsreporting units in the period suchannual impairment test would not have changed this determination, was made. We do not expect the resolution of loss contingencies to have a material effect on our financial statements.Accounting for Income TaxesAll income tax amounts reflect the useand each of the liability method. Under this method, deferred tax assets and liabilities are determined based upon the expected future tax consequences of temporary differences between the carrying amounts of assets and liabilities for financial and income tax reporting purposes. Deferred tax assets and liabilities are measured using enacted tax rates expected to apply to taxable income in the years in which those temporary differences are expected to be recovered or settled. We operate in multiple tax jurisdictions with different tax rates, and we determine the allocation of income to each of these jurisdictions based upon various estimates and assumptions.We record a provision for taxes based upon our effective income tax rate. We record a valuation allowance to reduce our deferred tax assets to the amount that we expect is more likely than not to be realized. We consider historical taxable income, expectations and risks associated with our estimates of future taxable income and ongoing tax planning strategies in assessing the need for a valuation allowance. Weunits had a valuation allowancesubstantial excess of $1.9 million and $2.6 million at December 31, 2011 and 2010, respectively, against our deferred tax assets. Should we determine that it is more likely than not that we would be able to realize all of our deferred tax assets in the future, an adjustment of $1.9 million to the net deferred tax asset would increase income in the period such determination was made. Conversely, should we determine that it is more likely than not that we would not be able to realize all of our deferred tax assets in the future, an adjustment to the net deferred tax assets would decrease income in the period such determination was made.39We recognize the benefits of uncertain tax positions taken or expected to be taken in tax returns in the provision for income taxes only for those positions that are more likely than not to be realized. We recognize interest and penalties accrued relating to unrecognized tax benefits in our income tax expense. In the normal course of business we will undergo tax audits by various tax jurisdictions. Such audits often require an extended period of time to complete and may result in income tax adjustments if changes to the allocation are required between jurisdictions with different tax rates. Our operations involve dealing with uncertainties and judgments in the application of complex tax regulations in multiple jurisdictions. The final taxes paid are dependent upon many factors, including negotiations with taxing authorities in various jurisdictions and resolution of disputes arising from federal, state and international tax audits. Changes in accruals for uncertainties arising from the resolution of pre-acquisition contingencies and deferred income tax asset valuation allowances of acquired businesses after the measurement period will be recorded in earnings in the period the changes are determined. Adjustments to other tax accruals are generally recognized in the period they are determined.Stock-Based CompensationWe measure compensation cost for all stock-based payments (including employee stock options) at fair value and recognize compensation expense for all awards on a straight-line basis over the requisite service period of the award.Our last option grant was in 2010. For valuing our option grants, we utilized several key factors and assumptions within our valuation model. We have been in existence since February 1998 and have been a public company since October 2003. We elected to use the Black-Scholes valuation model. At the last grant date, we used the simplified method in developing an estimate of expected life of stock options because we lacked sufficient data to calculate an expected life based on historical experience. Our first annual option grant with a full five year vesting period since we became a public company was on January 13, 2006, and these awards became fully vested in January 2011. Additionally, our options have a ten year life while our existence as a public company had been just over six years when the 2010 grant was made. In the event that we issue more options in the future, we will reassess the use of the simplified method based on the additional historical information available. We estimated volatility, which is a measure of the amount by which our stock price is expected to fluctuate during the expected term of the option, based on the historical volatility of our stock. Our forfeiture assumptions were based on voluntary and involuntary termination behavior as well as historical forfeiture rates. We estimated forfeitures at the time of grant and revise our estimates, if necessary, in subsequent periods if actual forfeitures differ from those estimates. The dividend yield represents the dividend rate expected to be paid over the option’s expected term, and we currently have no plans to pay dividends. The risk-free interest rate was based on U.S. Treasury zero-coupon issues available at the time each option is granted that have a remaining life approximately equal to the option’s expected life.“Summary"Summary of Significant Accounting Policies”Policies" to the consolidated financial statements in Part II, Item 8 of this Annual Report on Form 10-K for information related to new accounting standards.16, “Segment13, "Segment and Geographic Information”Information" to the consolidated financial statements in Part II, Item 8 of this Annual Report on Form 10-K for information related to our revenue and long-lived assets by geographic region.40statementsstatement of incomeoperations data as a percentage of total revenue for the periods indicated: Year Ended December 31, 2011 2010 2009 100.0 % 100.0 % 100.0 % 57.4 % 55.7 % 54.7 % 42.6 % 44.3 % 45.3 % 9.0 % 9.5 % 9.8 % 8.8 % 8.6 % 8.9 % 12.0 % 12.6 % 13.5 % 0.2 % 0.0 % 0.1 % 1.5 % 1.5 % 1.7 % 11.1 % 12.1 % 11.3 % 0.8 % 1.1 % 1.3 % 10.3 % 10.9 % 10.0 % 3.8 % 4.2 % 3.8 % 6.4 % 6.8 % 6.2 % 0.0 % 0.1 % 0.0 % 6.4 % 6.8 % 6.2 % Year Ended December 31, 2013 2012 2011 Statements of Income Data: Revenue 100.0 % 100.0 % 100.0 % Cost of goods sold 59.0 % 58.2 % 57.4 % Gross margin 41.0 % 41.8 % 42.6 % Facility and warehouse expenses 8.4 % 8.4 % 9.0 % Distribution expenses 8.5 % 9.1 % 8.8 % Selling, general and administrative expenses 11.8 % 12.0 % 12.0 % Restructuring and acquisition related expenses 0.2 % 0.1 % 0.2 % Depreciation and amortization 1.6 % 1.6 % 1.5 % Operating income 10.5 % 10.6 % 11.1 % Other expense, net 1.1 % 0.7 % 0.8 % Income before provision for income taxes 9.4 % 9.9 % 10.3 % Provision for income taxes 3.2 % 3.6 % 3.8 % Net income 6.2 % 6.3 % 6.4 % 20112012 Compared to Year Ended December 31, 2010201132.4%26.1% to $4.1 billion for the year ended December 31, 2012 from $3.3 billion in 2011 compared to $2.5 billion in 2010.2011. The increase in revenue was primarily due to business acquisitions, the higher volume of products we sold and higher revenue from scrap metal and other metals sales. Our21.9% acquisition related revenue growth of 21.5% includes $138 million of incremental revenue generated by ECP since its acquisition effective October 1, 2011. Our totaland 4.1% organic revenue growth, ratewhich was 10.7%, composed of 7.9% and 28.0% organic growth in6.0% parts and services revenue partially offset by a 5.8% decline in other revenue due to declining scrap steel and other metals prices. Acquisition related revenue respectively. Organic growth in parts and services revenue reflectsfor the increase in salvage revenue over relatively lower levels during the prior year due primarily to volume increases. The prior year period was impacted by the cash for clunkers program, underended December 31, 2012 totaled $716.8 million, which we purchased lower cost, older vehicles that did not have the same parts revenue potential asincluded $481.6 million from our more recent inventory purchases. Additionally, during the firstfourth quarter 2011 acquisition of 2010, we reduced purchases of salvage vehicles due to higher acquisition prices at the salvage auctions, resulting in lower volume of salvage parts available for sale during the first two quarters of 2010. During the second half of 2011, ourECP. Our organic revenue growth rate in partsaftermarket, other new and servicesrefurbished products of 6.2% was primarily a result of higher volumes. Incremental sales volume from ECP's new branches, which we include in organic revenue, of 6.5% reflected the lessening impactcontributed 4.4% of the cash for clunkers programgrowth. The remaining volume increase was primarily attributable to greater customer penetration resulting from our expansion into complementary product lines such as paint and lower buying levels onrelated products. Our organic revenue from the prior year results. Our aftermarket revenue increasedsale of recycled and remanufactured products grew 5.8% primarily due to growth inas a result of higher sales volumes, which resulted from higher inventory purchases that contributed to a greater volume of parts available for sale. TheOrganic revenue growth in other revenue, which includes salesparts and services was negatively affected by milder winter weather conditions in North America in the first quarter and into the beginning of scrap metalthe second quarter of 2012 as the milder winter weather contributed to fewer and other metals, was primarily due to higher metals prices combined with higher volume of scrap sold. We also had a 0.1% favorable impact on revenue derived from foreign exchange on our Canadian operations.less severe vehicle accidents, resulting in lower insurance claims activity.Sold.Sold. Our cost of goods sold increased to 58.2% of revenue in 2012 from 57.4% of revenue in 2011 from 55.7%2011. In 2012, the prices we received for scrap metal declined relative to the cost of revenuethe scrap component of the cars that we crushed, while in 2010. Ofthe prior year scrap metal prices increased relative to the cost component. The resulting margin compression in our Self Service and Wholesale - North America segments contributed 0.6% of the increase in cost of goods sold as a percentage of revenue, 0.8% was due to higher input costs combined with competitive sales pricing pressure in our aftermarket products. Cost of goods sold in 2011 was also impacted by a shift in product mix, which increased cost of goods sold as a percentage of revenue by 0.6%. Certain of our acquisitions toward the end of 2010 and during 2011 increased our revenue in product lines that are complementary to our existing vehicle replacement parts offerings but have lower gross margins, such as remanufactured engines. The product mix effect was also partially generated by sales of scrap aluminum as we41expanded our furnace capacity through an acquisition in August 2010. Our sales of scrap aluminum, which is a by-product of our wheel refinishing operations, generate lower margins than our sales of vehicle products.sold. Our acquisition of ECP, which generates lower gross margins than our North American business because of a greater weighting on lower margin mechanical products, increased our cost of goods sold by 0.3% of revenue. Our cost of goods sold for the year endedpercentageresult of the lower gross margins generated by our precious metals refining and reclamation business that we acquired in the second quarter of 2012. Higher warranty claims experience in 2012, primarily related to our remanufactured engines, increased cost of goods sold by 0.2% of revenue. Our cost of goods sold for 2012 also reflects lower levels of revenue from high margin, "crush only" vehicles compared to the prior year, which increased cost of goods sold by 0.2%. Vehicle acquisition costs in our self service business grew at a greater rate than revenue as purchase costs were driven higher by increased demand for used cars and higher scrap prices. While scrap metal prices declined late in 2011, average vehicle acquisition costs did not fall as suppliers continued to demand higher prices. These vehicle acquisition factors caused a 0.5% increaseincreases in our cost of goods sold as a percentage of revenue compared to 2010. These effects were partially offset by reductionsa 0.2% reduction in cost of goods sold for lower vehicle acquisition costs, primarily in our wholesale salvage costs asWholesale - North America segment. Additionally, we recognized a percentagegain on lawsuit settlements totaling $17.9 million, which reduced cost of revenue as the impactgoods sold by 0.4% of rising vehicle costs driven by higher demand for salvage vehicles was offset by our increased recovery on coresrevenue. See Note 7, "Commitments and benefits of a net increase in scrap prices over prior year levels.Gross Margin. As a percentage of revenue, gross margin decreased to 42.6% from 44.3%. The decrease in our gross margin percentage was due primarilyContingencies" to the factors notedconsolidated financial statements inRevenue andCost Part II, Item 8 of Goods Sold above.Expenses.Expenses. As a percentage of revenue, facility and warehouse expenses declinedfor the year ended December 31, 2012 decreased to 8.4% of revenue compared to 9.0% of revenue in 2011, from 9.5% in 2010. The decreasewhich was driven by a reduction in personnel-related expenses as a percentage of revenue, which fellprimarily due to 4.9% compared to 5.3% in the prior year. As we expanded our product offerings through acquisitions in complementary business lines during 2011, we were able to leverage the fixed component oflower facility and warehouse expenses, suchexpense in our ECP operations as personnel costs, as we integrated the acquisitions into our existing business. The decrease in facility and warehouse expenses as a percentage of revenue was also partially a result of higher other revenue, which grew at a greater rate than personnel expenditures.Distribution Expenses. Distribution expenses as a percentage of revenue increased by 0.2% compared to 2010 as higher fuel and freight costs offset benefits from improved utilization of our distribution employees and equipment. Rising fuel prices increased fuel expense to 1.4% of revenue in 2011 compared to 1.2%North American operations. The branch locations in the prior year. Higher fuel prices also impacted third party freight expense,U.K. are typically smaller and less costly than the warehouse locations in North America since the majority of the inventory is stored in the national distribution center in the U.K., which increased to 1.4%supplies the branch locations daily. In our North American operations, most of revenuethe inventory sold by our locations is stored on site rather than in 2011 from 1.2%regional or national distribution centers. The cost of the national distribution center in 2010. These increases were partially offset by improved leveragingthe U.K. is capitalized into inventory and expensed through cost of our distribution network, including our personnel expenditures and equipment costs, in a period of growing revenue and higher other revenue that did not require additional distribution expenditures.goods sold.Selling, General, and AdministrativeDistribution Expenses. As a percentage of revenue, our selling, general and administrativedistribution expenses decreasedincreased to 12.0%9.1% of revenue in 2012 from 8.8% of revenue in 2011, primarily resulting from 12.6% in 2010. The decline in selling, general and administrative expenses was primarily driven by improved utilizationan increase of these costs in0.2% related to our European operations. Our ECP operations, which generate a periodgreater proportion of rising revenue, including increased revenue from scrap metal and other metals that did not require additional selling or administrative expenditures. The decrease in thesesales to mechanical repair shops compared to our North American operations, incur relatively higher delivery expenses as garage customers demand faster delivery times than our North American collision repair customers. In our North American operations, distribution expenses increased by 0.2% of revenue due to higher compensation costs as a percentage of revenue included a reduction incompared to the prior year. expenses from 7.1% of revenue to 6.8% of revenue. Our general and administrative expenses which include corporate overhead, professional feesfor the year ended December 31, 2012 were consistent with the prior year at 12.0% of revenue. Our ECP operations increased selling, general and information technologyadministrative expenses decreased from 5.5%by 0.2% of revenue, primarily due to 5.2%greater personnel expenditures for the relatively larger sales force compared to our North American operations. The impact of higher selling expenses in our European operations was offset by a reduction in general and administrative personnel expenditures, including incentive compensation, as a percentage of revenue in our North American operations.Expenses. InExpenses. During 2012 and 2011, we incurred $2.8 million and $7.6 million of restructuring and acquisition related expenses, comparedrespectively. In 2012, we incurred $1.1 million to $0.7execute our restructuring plan to consolidate our bumper and wheel refurbishing product lines. We also incurred $1.2 million in 2010.of restructuring expenses related to the integration of certain of our 2011 and 2012 acquisitions into our existing business. Our 2011 expenses includeincluded $4.0 million related to integratingintegration of our 2011 acquisition of the Akzo Nobel paint business in the second quarter of 2011 and our 2010 acquisition of Cross Canada, a Canadian aftermarket business. We also incurred $0.4 million of integration costs related to certain of our other acquisitions. Acquisition related expenses, which consist of external costs such as closing costs and professional fees, totaled $0.5 million and $3.2 million for the years ended December 31, 2012 and 2011, respectively. Our acquisition related expenses in 2011 primarily related to our acquisition of ECP effective as ofon October 1, 2011, totaled $3.2 million in 2011. These acquisition related expenses included professional fees such as accounting, legal, advisory and valuation services. Restructuring charges incurred in 2010 included charges related to integration efforts from 2009 acquisitions. See Note 10, “Restructuring9, "Restructuring and Acquisition Related Expenses,”Expenses" to the consolidated financial statements in Part II, Item 8 of this Annual Report on Form 10-K for further information on our restructuring and integration plans.42both 2011 and 2010. Our2011. Higher expense in 2012 resulting from our increased levels of property and equipment primarily drivenand higher levels of intangible assets as a result of business acquisitions was mostly offset by capital expenditures and acquisitions as well as higher intangible amortization expense, were offset bycontinued leveraging of our existing facilities to growsupport organic revenue and acquisition related revenue growth, respectively.growth.Operating Income. As a percentage of revenue, operating income decreasedOther Expense, Net. Total other expense, net increased to 11.1% in 2011$28.8 million for the year ended December 31, 2012 from 12.1% in 2011. The decrease in operating income as a percentage of revenue$25.7 million for the prior year. This increase was primarily due to a declinean increase in gross margin, offset by improved leveraging of our operating expenses.Other Expense, Net. Total other expense, net decreased to $25.7 million in 2011 from $27.8 million in 2010. In 2011, our net interest expense decreased by $5.9of $7.1 million compared to 2010, which wasthe prior year, partially offset by a $5.3 million loss on debt extinguishment of $5.3 million. On March 25,recognized in 2011 we executed a new senior secured credit agreement, and as a result,related to the unamortized balancewrite off of debt issuance costs relatedin conjunction with the execution of our senior secured credit agreement. The increase in interest expense in 2012 was due to higher average outstanding bank borrowings of $922 million compared to $671 million in 2011, primarily as a result of additional borrowings to finance our acquisition of ECP in the previous credit agreementfourth quarter of 2011. The effect of higher average debt levels was written off. Interest expense decreased due topartially offset by a reduction in theour average effective interest rate on our bank borrowings to 3.1% in 2012 from 3.4% in 2011, from 4.9% in 2010, resulting from lower interest rates under our new credit facility combined withagreement. In 2012, we recognized $1.6 million of expense as a result of fair value adjustments to our contingent payment liabilities, while we recognized a $1.4 million gain in 2011. Adjustments to our contingent consideration liabilities may cause variability in our results of operations, as changes in the assumptions used to measure the fair value of the liabilities may result in net gains or losses from period to period. We increased our collections of fees for late payments in 2012, which increased other income by $1.6 million over the prior year.lower fixed interest rates under our outstanding interest rate swaps compared toforeign currency fluctuations in the prior year. We also recognizedCanadian dollar, the British pound and other currencies was a net gain of $1.4$0.2 million related to adjustments to reduce the fair value estimates of our contingent consideration liabilities. In 2011, we recognized a $0.4 million foreign exchange gain compared to a $0.2loss of $0.4 million loss in the prior year. The current year gain was related to the weakening of the Canadian dollar and the Mexican peso, partially offset by a strengthening of the British pound.inwas 36.2% and 37.4% for the years ended December 31, 2012 and 2011, was 37.4% compared with 38.1% in 2010.respectively. The lower effective income tax rate in 20112012 reflects a benefit of 0.5%1.5% relative to the prior year from our expanding international operations and a 0.3% reduction in our effective state tax rate. Our international operations, which grew in 2011 with the ECP acquisition, contributed to a lower effective tax rate as a larger proportion of our pretax income was generated in lower rate jurisdictions. Additionally, we achieved tax savingsOther rate effects from our financing of foreign acquisitions. Our effective state tax rate declined as a result of a shift in income to lower rate jurisdictions. The effective income tax rate for the comparable prior year period included a discrete benefit of $1.5 million resulting primarily from the revaluation of deferred taxes in connection with a legal entity reorganization. While we had no individually significant discrete items and permanent differences were 0.3% higher in 2011, the total benefit recognized for the year was similar to the benefit from the legal entity reorganization in 2010.Income from Discontinued Operations, Net of Taxes. Income from discontinued operations, net of taxes, was $2.0 million in 2010, which was primarily the result of a gain of $2.7 million ($1.7 million, net of tax) from the sale of two self service retail facilities on January 15, 2010. Our 2011 results do not include any impact from these discontinued operations as the facilities were closed or sold in the first quarter of 2010.Year Ended December 31, 2010 Compared to Year Ended December 31, 2009Revenue.Our revenue increased 20.6% to $2.5 billion for the year ended December 31, 2010, from $2.0 billion for the year ended December 31, 2009. The increase in revenue was primarily due to business acquisitions, higher volume of products we sold and higher revenue from scrap metal and other metals sales. Our parts and services organic revenue growth rate was 6.6%, which was composed of 4.2% organic growth in our recycled products revenue and 8.2% organic growth in our aftermarket products revenue. The higher growth in our aftermarket products organic revenue was driven by greater visibility to aftermarket products by our salvage sales force along with higher inventory levels and improved positioning within our distribution network, which created a greater volume of parts available for sale and higher fulfillment rates. Other revenue had an organic growth rate of 52.2%, primarily attributable to the effects of scrap metal and other metals prices that increased over2012 than the prior year, combined with higher sales volume. We also had a 0.4% favorable impact on revenue derived from foreign exchange on our Canadian operations.year.43Cost of Goods Sold. Our cost of goods sold increased 22.9%, from $1.1 billion in 2009 to $1.4 billion in 2010. As a percentage of revenue, cost of goods sold increased from 54.7% to 55.7%. The increase in our cost of goods sold as a percentage of revenue was due primarily to higher salvage acquisition prices in 2010, combined with an increase in revenue from scrap aluminum, which generates lower margins. Salvage acquisition prices in 2010 increased due to the expiration of the cash for clunkers program and higher overall demand for salvage vehicles at auction. The increase in salvage costs and impact of higher relative revenue from scrap aluminum were partially offset by improved aftermarket margins due to price increases and lower costs on aftermarket products due to vendor competition. Additionally, market conditions in our heavy-duty truck operations began to improve which resulted in lower heavy-duty truck inventory acquisition costs.Gross Margin. Our gross margin increased 17.9%, from $927.8 million in 2009 to $1,093.5 million in 2010. Our gross margin increased primarily due to increased volume. As a percentage of revenue, gross margin decreased from 45.3% to 44.3%. The decrease in our gross margin as a percentage of revenue was due primarily to the factors noted above in Cost of Goods Sold.Facility and Warehouse Expenses. Facility and warehouse expenses increased 16.4%, from $201.1 million in 2009 to $234.0 million in 2010. Our facility and warehouse expenses increased $32.9 million primarily due to incremental expenses of $17.7 million from business acquisitions (principally the acquisition of Greenleaf in October 2009) and the organic growth of our operations. As a percentage of revenue, facility and warehouse expenses decreased from 9.8% to 9.5%, primarily due to higher revenue spread over fixed facility costs.Distribution Expenses. Distribution expenses increased 16.9%, from $181.9 million in 2009 to $212.7 million in 2010. Our distribution expenses increased $30.8 million primarily due to incremental expenses of $10.5 million from business acquisitions, $6.8 million of higher fuel costs, $5.3 million of higher labor and labor-related expenses, and $9.7 million for increased variable expenses such as freight costs and truck rentals resulting from higher parts volume in 2010, partially offset by $1.7 million lower vehicle insurance and claims cost. As a percentage of revenue, our distribution expenses decreased from 8.9% to 8.6%, primarily due to improved leverage of our distribution network, including increased revenue from scrap metal and other metals that did not require additional distribution expense.Selling, General, and Administrative Expenses. Selling, general, and administrative expenses increased 12.1%, from $276.7 million in 2009 to $310.2 million in 2010. Our business acquisitions accounted for $11.6 million of the increase, primarily in labor and labor related costs. The remaining increase in our selling, general and administrative expenses was due primarily to higher labor and labor related expenses of $19.7 million, higher credit card and bank fees of $1.5 million and higher advertising and promotion expenses of $1.2 million, offset by lower legal and claims costs of $3.2 million. As a percentage of revenue, selling, general and administrative expenses decreased from 13.5% to 12.6% primarily due to improved leverage of selling and administrative employees in a period of growing revenue, including revenue from scrap metal and other metals, that did not require additional selling, general and administrative expenditures.Restructuring and Acquisition Related Expenses.Restructuring expenses decreased 73.8% to $0.7 million in 2010, from $2.6 million in 2009. The restructuring expenses in 2010 were the result of the Greenleaf acquisition, while 2009 restructuring expense was related to the integration of Keystone Automotive Industries, Inc. into existing LKQ operations. See Note 10, “Restructuring and Acquisition Related Expenses,” to the consolidated financial statements in Part II, Item 8 of this Annual Report on Form 10-K for a further discussion of restructuring and integration activities related to our acquisitions.Depreciation and Amortization. Depreciation and amortization (including that reported in cost of goods sold above) increased 10.7%, from $37.4 million in 2009 to $41.4 million in 2010. Business acquisitions accounted for $2.2 million of the increase in depreciation and amortization expense, while increased levels of property and equipment accounted for the remaining increase. As a percentage of revenue, depreciation and amortization decreased from 1.7% in 2009 to 1.5% in 2010.44Operating Income. Operating income increased 28.7%, from $231.4 million in 2009 to $297.9 million in 2010. As a percentage of revenue, operating income increased from 11.3% to 12.1%. The increase in operating income as a percentage of revenue was primarily due to improved leveraging of operating expenses over a larger revenue base, partially offset by lower gross margins in 2010 due to higher salvage acquisitions costs and higher relative revenue from scrap aluminum as noted inCost of Goods Sold above.Other (Income) Expense. Total other expense, net increased 6.2%, from $26.1 million in 2009 to $27.8 million in 2010. The increase in other expense, net is primarily due to the absence of a $4.3 million gain on bargain purchase that was recorded in the fourth quarter of 2009 related to the Greenleaf acquisition, partially offset by lower net interest expense. Our average bank borrowings were approximately $43.3 million lower in 2010 compared to 2009 due primarily to voluntary prepayments of our scheduled 2010 repayments combined with our scheduled repayments. In addition, our average effective interest rate on our bank borrowings was 4.86% in 2010 compared to 4.95% in 2009. See Note 9, “Business Combinations,” to the consolidated financial statements in Part II, Item 8 of this Annual Report on Form 10-K for a further discussion of the acquisition of Greenleaf and the related gain on bargain purchase.Provision for Income Taxes. The provision for income taxes increased 31.8%, from $78.2 million in 2009 to $103.0 million in 2010. Our effective income tax rate was 38.1% in both 2010 and 2009. Our effective state tax rate decreased by 0.7% in 2010 as a result of a shift in income to lower rate jurisdictions. The effective rate remained flat compared to the prior year because of the absence of the rate benefit generated from the non-taxable gain on bargain purchase in 2009. The provision for income taxes in both periods was affected by discrete items. In 2009, we recognized a $4.3 million non-taxable gain on bargain purchase related to the Greenleaf acquisition, which lowered the 2009 effective income tax rate by 0.8%. The 2010 effective tax rate included adjustments related to the revaluation of deferred taxes in connection with a legal entity reorganization in the first quarter (0.5% decrease to rate) and the establishment of valuation allowances on state tax credit carryforwards (0.2% increase to rate).Income from Discontinued Operations, Net of Taxes.Our discontinued operations, net of taxes, generated $2.0 million of income in 2010, compared to $0.4 million in 2009. Income from discontinued operations increased primarily due to the gain of $2.7 million ($1.7 million net of tax) from the sale of two self service retail facilities to SSI on January 15, 2010.fourthree operating segments: Wholesale—North America; Wholesale—Europe; and Self Service; and Heavy-Duty Truck.Service. Our operations in North America, which include our Wholesale—North America and Self Service and Heavy-Duty Truck operating segments, are aggregated into one reportable segment because they possess similar economic characteristics and have common products and services, customers, and methods of distribution. Our Wholesale—Europe operating segment formed with our acquisition of ECP effective October 1, 2011, marks our entry into the European automotive aftermarket business, and is presented as a separate reportable segment. Although the Wholesale—Europe operating segment shares many of the characteristics of our North American operations, we have provided separate financial information as we believe this data would be beneficial to users in understanding our results.45from continuing operations, by reportable segment for the periods indicated (in thousands): Year Ended December 31, 2011 2010 2009 $ 3,131,376 $ 2,469,881 $ 2,047,942 138,486 — — $ 3,269,862 $ 2,469,881 $ 2,047,942 $ 405,924 $ 339,869 $ 273,666 12,144 — — $ 418,068 $ 339,869 $ 273,666 Year Ended December 31, 2013 % of Revenue 2012 % of Revenue 2011 % of Revenue Revenue North America $ 3,802,929 $ 3,426,858 $ 3,131,376 Europe 1,259,599 696,072 138,486 Total revenue $ 5,062,528 $ 4,122,930 $ 3,269,862 EBITDA North America $ 484,824 12.7% $ 440,448 12.9% $ 405,924 13.0% Europe 131,086 10.4% 70,099 10.1% 12,144 8.8% Total EBITDA $ 615,910 12.2% $ 510,547 12.4% $ 418,068 12.8% usage. Sinceusage, with shared expenses apportioned based on the European segment was initiated in the fourth quartersegment’s percentage of 2011, its usage of the shared corporate and administrative costs has been minimal.consolidated revenue. Segment EBITDA excludes depreciation, amortization, interest (including loss on debt extinguishment) and taxes. Loss on debt extinguishment is considered a component of interest in calculating EBITDA, as the write-off of debt issuance costs is similar to the treatment of debt issuance cost amortization. See Note 16, “Segment13, "Segment and Geographic Information”Information" to the consolidated financial statements in Part II, Item 8 of this Annual Report on Form 10-K for a reconciliation of total EBITDA to Income from Continuing Operations.andour European segment did not have a full comparative prior year period for the year ended December 31, 2012. For information on the factors that contributed to the results of our North American segment represents 97%operations during 2013 compared to 2012, including the effect of our 2011 segment EBITDA, the discussion of theEuropean operations on our consolidated year over year results, refer to our consolidated results of operations covers the factors driving the year over year performance ofdiscussion above.segment. Resultssegment increased 11.0% to $3.8 billion during the year ended December 31, 2013 from $3.4 billion during the prior year. The increase in revenue reflects 6.4% acquisition related revenue growth and 4.8% organic growth (which included 6.0% organic growth in parts and services revenue offset by 1.6% decrease in other revenue), partially offset by 0.2% unfavorable impact from foreign exchange rates, primarily in our Canadian operations. Our organic growth in parts and services revenue was primarily due to higher sales volumes. In the first half of the prior year, we experienced milder winter weather conditions, which contributed to fewer and less severe vehicle accidents, resulting in lower insurance claims. Additionally, current year sales volumes benefited from higher inventory purchases compared to the prior year, which contributed to a greater volume of parts available for sale. The decrease in other revenue was primarily a result ofnot have a comparative period until the fourth quarter of 2012. Based on these considerations,diminish over time as we integrate Sator into our European operations, which we believe discussionwill result in cost savings, primarily in purchasing synergies. Restructuring and acquisition related expenses decreased EBITDA by 0.6% of revenue, primarily from our Sator acquisition as well as the integration of certain of our resultsother European acquisitions. During 2013, we incurred lower expenses related to the remeasurement of operations atcontingent payment liabilities, which increased EBITDA by 0.3% of revenue compared to the segment level would not provide additional understanding of our overall performance.2012prior year.full year 2012net income from continuing operations and diluted earnings per share from continuing operations,for the year ending December 31, 2014, excluding the impact of any restructuring and acquisition related expenses and any gains or losses related to acquisitions or divestitures (including changes in the fair value of contingent consideration liabilities), will be in the range of $258$400 million to $278$430 million and $1.72$1.30 to $1.85,$1.40, respectively. December 31, 2013 December 31, 2012 Cash and equivalents $ 150,488 $ 59,770 Total debt 1,305,781 1,118,478 Net debt (total debt less cash and equivalents) 1,155,293 1,058,708 Current maturities 41,535 71,716 1,430,000 1,030,000 1,150,603 356,143 Total liquidity (cash and equivalents plus availability on credit facilities) 1,301,091 415,913 ongoing liquidity are cash flows from our operations and our credit facility. On March 25, 2011, we entered into a senior secured credit agreement with a syndicate of banks led by JP Morgan Chase Bank, N.A., Bank of America, N.A., RBS Citizens, N.A. and Wells Fargo Bank, N.A. (the “Original 2011 Credit Agreement”), which was amended on September 30, 2011 (as amended, the “Amended and Restated 2011 Credit Agreement”). While the representations, warranties and covenants under the Amended and Restated 2011 Credit Agreement are customary, they include limitations and conditions on our ability to, among other things, incur indebtedness, make dividend payments, repurchase our stock and make certain investments, and also require us to maintain specified financial covenants.facilities. We were in compliance with all restrictive covenants under the Amended and Restated 2011 Credit Agreement as of December 31, 2011.46The initial use of proceeds under the Original 2011 Credit Agreement included payment in full of amounts outstanding under our previous credit agreement. Under the Amended and Restated 2011 Credit Agreement, we may borrow up to $1.4 billion, consisting of a $950 million revolving credit facility (including up to $500 million available in foreign currencies) and up to $450 million of term loan borrowings. As of December 31, 2011, the outstanding obligations under the facilities were $901.4 million, composed of $240.6 million of term loans and $660.7 million of revolver borrowings, compared to $590.1 million of term loans outstanding at December 31, 2010 under the previous credit agreement. Our acquisition of ECP effective October 1, 2011, for which we drew approximately $325.6 million, contributed to the increase in our outstanding credit facility borrowings. Our availability under the revolver at December 31, 2011, including the impact of outstanding letters of credit of $35.4 million, was $253.9 million. We do not expect to utilize the revolver as a primary source of funding for working capital needs as we expect our cash flows from operations to fund working capital and capital expenditures, with the excess amounts going towards funding acquisitions or paying down outstanding debt. As we have pursued acquisitions as part of our growth strategy, our cash flows from operations have not always been sufficient to cover our investing activities. To fund our acquisitions, we have accessed various forms of debt financing, including our May 2013 transactions to refinance our existing credit facility and to issue $600 million of senior notes.purpose, but we do maintain availability ascurrently have adequate capacity, from time to time, we continuemay need to expandraise additional funds through public or private financing, strategic relationships or other arrangements. There can be no assurance that additional funding, or refinancing of our facilities and network. In addition to the availability under the revolving credit facility, the Amendedif needed, will be available on terms attractive to us, or at all. Furthermore, any additional equity financing may be dilutive to stockholders, and Restated 2011 Credit Agreement provides for updebt financing, if available, may involve restrictive covenants. Our failure to $200 million in incremental term loan borrowings, which we drew in January 2012 to pay downraise capital if and when needed could have a portion ofmaterial adverse impact on our outstanding revolver borrowings. At December 31, 2011, cashbusiness, operating results, and cash equivalents totaled $48.2 million.Amended and Restated 2011 Credit Agreementcredit agreement accrue interest at variable rates, which depend on the currency and the duration of the borrowing, plus an applicable margin rate. The weighted-averageWe hold interest rate swaps to hedge the variable rates on our credit agreement borrowings outstanding against the Amended and Restated 2011 Credit Agreement at December 31, 2011 (after giving effect to the interest rate swap contracts in force,(as described in Note 6, “Derivative5, "Derivative Instruments and Hedging Activities,”Activities" to the consolidated financial statements in Part II, Item 8 of this Annual Report on Form 10-K) was 2.59%. The decline in our, with the effect of fixing the interest rates on the respective notional amounts. After giving effect to these interest rate swap contracts, the weighted average interest rate in 2011 resulted from lower fixed rates underon borrowings outstanding against our outstanding swapscredit agreement at December 31, 2011 compared2013 was 3.05%. Including the borrowings on our senior notes and receivables securitization program, our overall weighted average interest rate on borrowings was 3.85% at December 31, 2013. Cash interest payments were $45.3 million for the year ended December 31, 2013, which included our first semiannual interest payment of $14.2 million related to the prior year-end and lower margins under the Amended and Restated 2011 Credit Agreement. Of oursenior notes. We had outstanding credit agreement borrowings of $901.4$672.6 million and $590.1$974.6 million at December 31, 20112013 and 2010, respectively, $12.5December 31, 2012, respectively. Of these amounts, $22.5 million and $50.0$31.9 million were classified as current maturities at December 31, 2013 and December 31, 2012, respectively. After giving effectWe have scheduled repayments of $5.6 million each quarter on the term loan through its maturity in May 2018 but no other significant principal payments on our credit facilities prior to the additionalmaturity of the receivables securitization program in September 2015. We currently expect that we will extend the receivables securitization facility when the original three year term loan borrowings in January 2012, our 2012 maturitiesexpires, but there can be no assurance that we will be $20.0 million.options offered.terms. Our purchases of aftermarket products totaled approximately $836.3$1.7 billion, $1.3 billion, and $836.3 million $576.7 in 2013, 2012, and 2011, respectively. Aftermarket inventory purchases in 2013 include $198.5 million and $536.6 million in 2011, 2010, and 2009, respectively.related to our May 2013 acquisition of Sator. We normally pay for salvage vehicles acquired at salvage auctions and under some direct procurement arrangements at the time that we take possession of the vehicles. We acquired approximately 228,000, 198,000,281,000, 262,000, and 167,000234,000 wholesale salvage vehicles (cars and trucks) in 2011, 20102013, 2012, and 2009,2011, respectively. In addition, we acquired approximately 352,000, 297,000,513,000, 416,000, and 287,000352,000 lower cost self service and crush only"crush only" vehicles in 2011, 20102013, 2012, and 2009,2011, respectively. We also purchased 39,000 lower cost self service and crush only vehicles for our discontinued operations in 2009. Our heavy-duty truck purchases included 6,000, 4,000, and 4,000 heavy and medium-duty trucks in 2011, 2010, and 2009, respectively.$211.8$428.1 million for the year ended December 31, 2011,2013, compared to $159.2$206.2 million for in 2012. Compared to the same period of 2010. In 2011,prior year, our operating income, excluding depreciation and amortization,2013 EBITDA increased by $76.7$105.4 million, due to both acquisition related growth and organic growth. While we generated greater pretax income during 2013 compared to the prior year. Additionally,year, we reduced our cash interest payments were $6.1for income taxes to $110.9 million lower thanin 2013 from $146.5 million during the prior year period due primarily tobecause we overpaid taxes in 2012, which we offset against our 2013 estimated tax payments. Cash payments for incentive compensation were lower effective interest ratesduring 2013, including $8.0 million lower bonus payments and a $5.9 million payment under our current secured credit agreement. These increases were partially offset by $25.1 millionlong-term incentive plan in higher tax payments primarily driven by the increaseprior year that did not reoccur in pretax income and a higher net investment in2013. Cash outflows for our primary working capital accounts (receivables, inventory and payables). The net totaled $64.3 million during 2013, compared to $123.0 million during 2012, primarily due to the timing of cash outflow forpayments on accounts payable. Cash flows related to our primary working capital accounts increased to $79.6 million forcan be volatile as the year ended December 31, 2011 from $69.9 million for the comparable prior year period, primarily due to increased inventory purchases, partially offset by the timing of cash payments and collections. Wecollections can be timed differently from period to period and can be influenced by factors outside of our control. However, we expect to generatethat the net cash outflows for ourchange in these working capital accounts into 2012items will generally be a cash outflow as we continue to build inventory levels to supportgrow our growing revenue levels, although at a lesser amount than 2011.47$571.6$505.6 million for the year ended December 31, 2011,2013, compared to $191.6$352.5 million for the same period of 2010.2012. We invested $486.9$408.4 million of cash, net of cash acquired, in 21business acquisitions during 2011,2013, including $293.7 million of cash paid, net of cash acquired, for our acquisition of ECPSator for $272.8 million, compared to $265.3 million for business acquisitions in the fourth quarter. Cash payments, netcomparable prior year. In the third quarter of cash acquired,2013, we entered into an agreement with Suncorp Group to develop an alternative vehicle products business in Australia and New Zealand, for which our 20 acquisitions in 2010initial investment totaled $143.6 million. In January 2010, we completed the sale of two of our self service yards, resulting in a cash inflow, net of cash sold, of $12.0$9.1 million. Property and equipment purchases were $86.4$90.2 million in the year ended December 31, 2011, which is $25.0 million greater than the property and equipment purchases in 2010. The growth in capital expenditures was driven by an increase in site improvement and capacity expansion projects2013 compared to $88.3 million in the prior year, as well as expenditures related to planned 2010 projects that carried over into 2011.$311.4$165.9 million for the year ended December 31, 2011,2013, compared to $19.0$157.1 million in 2012. During 2013, we amended our credit facility and issued $600 million in 2010.senior notes. In March 2011,2013, net borrowings were $227.1 million compared to $147.0 million in 2012. In both periods, we entered intoused the Original 2011 Credit Agreement, under which our initial draw of $591.8 million (including $250.0 million of term loanproceeds from the net borrowings and $341.8 million of revolver borrowings) was used to pay off amounts outstanding under the previous credit facility. The Amended and Restated Credit Agreement effective September 30, 2011 provided additional capacity under our revolving credit facility, under which we drew $325.6 millionprimarily to fund acquisitions. In connection with our acquisition of ECP in the fourth quarter. Additionally,2013 financing transactions, we made three scheduled term loan payments totaling $9.4paid $16.9 million in 2011. Related to the execution of the Original 2011 Credit Agreement on March 25, 2011 and the Amended and Restated 2011 Credit Agreement on September 30, 2011, we paid $11.0 million of debt issuance costs. DuringIn March 2013, we made a payment of $33.9 million ($31.5 million included in financing cash flows and $2.4 million included in operating cash flows) for the prior year, we had only one required quarterly term loan2012 earnout period under the contingent payment for $7.5 million dueagreement related to prepayments made in 2009.our 2011 acquisition of ECP. Cash generated from exercises of stock options provided $11.9$15.4 million and $14.0$17.7 million in 2011the years ended December 31, 2013 and 2010,2012, respectively. The excess tax benefit from share-based payment arrangements reduced income taxes payable by $8.0$18.3 million and $15.0$15.7 million in 2011the years ended December 31, 2013 and 2010,2012, respectively.$159.2$206.2 million in 2010, for the year ended December 31, 2012, compared to $164.0$211.8 million in 2009.2011. In 2010,2012, our operating income, excluding depreciation and amortization,EBITDA increased by $69.8$92.5 million relative compared to the sameprior year period, due to both acquisition related growth and organic growth. The increase in 2009, whichEBITDA was partially offset by a higher investment in our primary working capital accounts (receivables, inventory and accounts payable) and higher tax payments of $39.0$43.7 million in 2010 compared to 2009. The netgreater cash outflow for our primary working capital accounts payable as we accelerated payments to take advantage of prompt pay discounts, resulting in a decrease in days payable outstanding in 2012 compared to 2011. In 2012, we also made $33.0 million of higher income tax payments compared to the prior year as a result of greater pretax earnings. Due to higher outstanding debt levels, cash payments for interest exceeded the prior year by $7.7 million. Prepayments for insurance policies and payroll taxes increased from $38.9by $7.3 million in 2009 to $69.9 million in 2010, primarilyover the prior year due to additional insurance policies and the timing of payroll tax payments for our European operations acquired in the fourth quarter of 2011. The year ended December 31, 2012 reflected higher inventory purchases. Our 2010 aftermarket purchases increased duebonus payments of $1.8 million compared to the prior year as well as $5.9 million of incremental payments under our expansion of certain product lines and an increase of on-hand inventory to meet demand for certain products. In 2010, we also purchased a greater volume of wholesale salvage vehicles at higher average prices than 2009. Increased sales volume in our recycled and related products and services product category drove increased volume of wholesale salvage vehicle purchases in 2010, as inventory levels were built up to meet demand. Our 2009 salvage purchase costs also included 20,500 lower-priced cash for clunkers vehicles.$191.6$352.5 million for the year ended December 31, 2010,2012, compared to $102.5$571.6 million for 2009. In 2010, wethe same period of 2011. We invested $143.6$265.3 million of cash, net of cash acquired, in acquisitions. In 2009, we invested $68.3 million, including $38.8 million30 acquisitions and payments for the Greenleaf acquisition in October, and received net proceeds of $3.1 million on settlements of purchase price receivables and payables related to earlier acquisitions. In 2010 and 2009, we completed the sale of certain of our self service yards, resulting2011 acquisitions during 2012, compared to $486.9 million for 21 business acquisitions in the comparable prior year period, including our acquisition of ECP for $293.7 million of cash, inflow, net of cash sold, of $12.0 million and $17.5 million, respectively.acquired. Property and equipment purchases were $61.4$88.3 million in 2010, which is $5.6the year ended December 31, 2012 compared to $86.4 million higher thanin the property and equipment purchases in 2009.$19.0$157.1 million for the year ended December 31, 2010,2012, compared to $33.2$311.4 million net cash used by financing activities for the year ended December 31, 2009. The variance is primarily attributable to debt repayments.in 2011. In 2009,2012, we made our regularly scheduled term loan payments of $14.9 million and also elected to prepay the first three quarters’ term loan payments for 2010, totaling $22.4 million. As a result of the prepayment in 2009, we had only one quarterly payment required in 2010 for $7.5 million. In 2010, we had no activity on our line of credit borrowings, whereas in 2009, we repaid 2009 and earlier line of credit borrowings resulting inborrowed a net cash outflow of $6.7 million. Repayments of other48debt, which primarily consists of notes issued for business acquisitions, were $2.1$147.0 million for 2010,under our credit facilities, compared to $1.7$307.0 million in the prior year. Our 2012 bank borrowings included $200 million of available term loans under the credit agreement and $80 million under the receivables securitization facility executed in September 2012, the proceeds of which were used to fund acquisitions and pay outstanding amounts under our revolving credit facility. Our bank borrowings in 2011 were used primarily to finance the acquisition of ECP in October 2011. Related to the execution of the 2011 credit agreement, we paid $11.0 million of debt issuance costs during 2011. Payments of other obligations, which included primarily acquisition related notes payable, totaled $23.1 million in 2012, compared to $4.5 million during 2011. Cash generated from exercises of stock options provided $14.0$17.7 million and $8.2$11.9 million in 2010the years ended December 31, 2012 and 2009,2011, respectively. The excess tax benefit from stock-basedshare-based payment arrangements reduced income taxes payable by $15.0$15.7 million and $9.6$8.0 million in 2010the years ended December 31, 2012 and 2009,2011, respectively. completed in 2011, we entered into contingent consideration agreements with the selling shareholders. Under the terms of the contingent consideration agreements, additional payments will be made to the former owners if specified future events occur or conditions are met, such as meeting profitability or earnings targets. For our acquisitionAs of ECP, we are required to pay up to an additional £55 million in the event the business achieves certain EBITDA targets during the years ending December 31, 2012 and 2013. Based on2013, the fair value of our evaluation of the likelihood of meeting these performance targets, we recordedcontingent consideration liabilities was $55.7 million, which included a liability for the acquisition date fair valuemaximum remaining payment of $49.7 million (£30 million) under the contingent consideration of $77.5 million (£50.2 million). Thepayment arrangement for our 2011 ECP acquisition, date fair value of our other contingent consideration liabilities totaled $3.7 million. Wewhich we expect to fund these payments throughpay in the first quarter of 2014 either with cash generated from operations or through draws on our revolving credit facility. In addition to these contingent consideration agreements, we issued promissory notes in connection with our business acquisitions totaling approximately $34.2 million, $5.5 million and $1.2 million in 2011, 2010, and 2009, respectively. The notes bear interest at annual rates of 2.0% to 4.0%, and interest is payable at maturity or in monthly installments. Our Amended and Restated 2011 Credit Agreement provides additional sources of liquidity to fund acquisitions, which we expect will support our strategy to supplement our organic growth with acquisitions.We believe that our current cash and equivalents, cash provided by operating activities and funds available under our Amended and Restated 2011 Credit Agreement will be sufficient to meet our current operating and capital requirements. However, we may, from time to time, raise additional funds through public or private financing, strategic relationships or other arrangements. There can be no assurance that additional funding, or refinancing of our credit facility, if needed, will be available on terms attractive to us, or at all. Furthermore, any additional equity financing may be dilutive to stockholders, and debt financing, if available, may involve restrictive covenants. Our failure to raise capital if and when needed could have a material adverse impact on our business, operating results, and financial condition.20122012,2014, excluding business acquisitions, will be between $100$110 million and $115$140 million. We expect to use these funds for several major facility expansions, improvement of current facilities, real estate acquisitions and systems development projects. Maintenance or replacement capital expenditures are expected to be approximately 20% of the total for 2012. We anticipate that net cash provided by operating activities for 20122014 will be in the range of $250 million to $280approximately $375 million. investments in special purpose entities or undisclosed borrowings or debt that would be required to be disclosed pursuant to Item 303 of Regulation S-K under the Securities Exchange Act of 1934. Additionally, we do not have any synthetic leases.4920112013 (in millions): Total Less than
1 Year 1-3 Years 3-5 Years More than
5 Years $ 1,053.7 $ 53.5 $ 124.6 $ 874.5 $ 1.1 450.7 85.0 143.3 99.3 123.1 183.6 68.0 115.6 0.0 0.0 82.4 0.6 81.7 0.1 0.0 35.4 35.1 0.2 0.1 0.0 12.1 11.8 0.3 0.0 0.0 5.9 5.8 0.1 0.0 0.0 37.4 18.2 12.3 4.5 2.4 14.1 0.0 0.0 0.0 14.1 8.8 8.0 0.8 0.0 0.0 5.5 0.9 2.6 0.8 1.2 $ 1,889.6 $ 286.9 $ 481.5 $ 979.3 $ 141.9 Our long-term debt under contractual obligations above includes interest on the balance outstanding under our variable rate credit facility as of December 31, 2011. Total 1-3 Years 3-5 Years Contractual obligations $ 1,634.9 $ 86.4 $ 140.1 $ 679.9 $ 728.5 25.4 4.7 6.2 1.4 13.1 646.3 114.4 188.8 122.7 220.4 142.9 142.9 — — — 55.9 52.5 3.4 — — Outstanding letters of credit 45.6 45.6 — — — Other asset purchase commitments 37.7 25.8 8.0 3.9 — Purchase price payable 2.1 2.1 — — — Other long-term obligations 49.6 22.7 17.0 6.3 3.6 27.2 2.0 — — 25.2 Long term incentive plan 6.9 1.9 5.0 — — Foreign currency forward contracts 21.8 21.8 — — — Liabilities for unrecognized tax benefits 1.8 0.2 0.3 0.7 0.6 Total $ 2,698.1 $ 523.0 $ 368.8 $ 814.9 $ 991.4 (1) Our long-term debt under contractual obligations above includes interest on the balances outstanding as of December 31, 2013. Interest on our senior notes, notes payable, and other long-term debt is calculated based on the respective stated rates. Interest on our variable rate credit facilities is calculated based on the weighted average rates, including the impact of interest rate swaps through their respective expiration dates, in effect for each tranche of borrowings as of December 31, 2013. Estimated interest expense included in the table above represents $49.1 million for obligations maturing in less than one year, $92.4 million for obligations maturing in one to three years, $74.1 million for obligations maturing in three to five years, and $128.3 million for obligations maturing in more than five years. (2) Interest on capital lease obligations is included based on incremental borrowing or implied rates. (3) The operating lease payments above do not include certain tax, insurance and maintenance costs, which are also required contractual obligations under our operating leases but are generally not fixed and can fluctuate from year to year. These expenses historically average approximately 25% of the corresponding lease payments. (4) Our purchase obligations include open purchase orders for aftermarket inventory. (5) Our contingent consideration liabilities reflect the undiscounted estimated payments of additional consideration related to business combinations. The actual payouts will be determined at the end of the applicable performance periods based on the acquired entities' achievement of the targets specified in the purchase agreements. (6) Self-insurance reserves include undiscounted estimated payments, net of estimated insurance recoveries, for our employee medical benefits, automobile liability, general liability, directors and officers liability, workers' compensation and property insurance. (7) Deferred compensation payments are dependent on elected payment dates. While we expect that these payments will be made more than five years from the latest balance sheet date, payments may be made earlier depending on such elections. Our deferred compensation plans are funded through investments in life insurance policies. Other retirement obligations consists of our expected required contributions to Sator's pension plan. We have not included future funding requirements beyond 2014 in the table above, as these funding projections are not practicable to estimate. long term debt obligations in the abovepreceding table include interest computed at the average effective rate of 2.59% as of December 31, 2011.Our purchase obligations include open purchase orders for aftermarket inventory. These amounts include our purchase obligations under the wholesaler agreement we entered into in connection withdoes not reflect our acquisition of Keystone Specialty, which we agreed to acquire on December 5, 2013. The transaction closed on January 3, 2014 after obtaining the Akzo Nobel paint businessnecessary regulatory approvals and completing all closing activities. The purchase price included $422.4 million of cash payments (net of cash acquired) and $31.5 million of notes payable due in 2011. 2015. The purchase price is subject to working capital adjustments, which we expect to finalize in 2014.9, “Business8, "Business Combinations” to the consolidated financial statements in Part II, Item 8 of this Annual Report on Form 10-K for furthermore information onregarding our acquisition of the Akzo Nobel paint business.Our contingent consideration liabilities above reflect the discounted estimated payments of additional consideration related to business combinations. The actual payouts will be determined at the end of the applicable performance periods based on the acquired entities’ achievement of the targets specified in the purchase agreements.Deferred compensation payments are dependent on elected payment dates. While we expect that these payments will be made more than five years from the latest balance sheet date, payments may be made earlier depending on such elections. Our deferred compensation plans are funded through investments in life insurance policies. Refer to Note 11, “Retirement Plans,” to the consolidated financial statements in Part II, Item 8 of this Annual Report on Form 10-K for further information related to the deferred compensation plans and related investments.Self-insurance reserves include estimated payments for our employee medical benefits, automobile liability, general liability, directors and officers liability, workers’ compensation and property insurance.ITEM 7A. QUANTITATIVE AND QUALITATIVE DISCLOSURES ABOUT MARKET RISK the London InterBank Offered Rate,LIBOR or the Canadian Dealer Offered Rate. In March 2008,CDOR. Therefore, we implemented a policy to manage our exposure to variable interest rates on a portion of our outstanding variable rate debt instruments through the use of interest rate swap contracts. These contracts convert a portion of our variable rate debt to fixed rate debt, matching the currency, effective dates and50(JP Morgan ChaseBank,(Wells Fargo Bank, N.A., Bank of America, N.A., and RBS Citizens, N.A.) and are denominated in currency that matches the underlying debt instrument. Net interest payments or receipts from interest rate swap contracts will be included as adjustments to interest expense in our consolidated income statement. .2011,2013, we held sevensix interest rate swap contracts representing a total of$520 $420 million of U.S. dollar-denominated notional amount debt, £50 million of pound sterling-denominated notional amount debt, and CAD $25 million of Canadian dollar-denominated notional amount debt. In total, we had 69% and 76% of our variableOur interest rate debt on our credit facility at fixed rates at December 31, 2011 and 2010, respectively. These swaps have maturity dates ranging from October 2013 through December 2016. Theseswap contracts are designated as cash flow hedges and modify the variable rate nature of that portion of our variable rate debt. These swaps have maturity dates ranging from October 2015 through December 2016. In total, we had 78% and 64% of our variable rate debt under our credit facility at fixed rates at 2011,2013, the fair market value of our swapsthese swap contracts was a net liability of $10.6 million.$8.5 million. The valuevalues of such contracts isare subject to changes in interest rates.2011,2013, we had unhedged$146 million of variable rate debt that was not hedged, and in January 2014, we increased our revolver borrowings by $370 million and our receivables securitization borrowings by $80 million related to our acquisition of $279.2 million. Using sensitivity analysis to measure the impact ofKeystone Specialty. Including these subsequent borrowings, a 100 basis point movement in the interest rate,rates would change interest expense would change by $2.8$6 million over the next twelve months. To the extent that we have cash investments earning interest, a portion of the increase in interest expense resulting from a variable rate change would be mitigated by higher interest income.During the first quarter of 2010, the steep increase in metals prices contributed to higher margins as we sold off lower cost inventory acquired in late 2009. The continuing increase in metal prices throughout 2010 and 2011 contributed to increased revenue during the year ended December 31, 2011. If market prices were to fall at a greater rate than our salvagevehicle acquisition costs, we could experience a decline in gross margin rate.Additionally,margin. As of are exposedheld short-term metals forward contracts to currency fluctuations with respect to the purchase of aftermarket products from foreign countries. The majority of our foreign inventory purchases are with manufacturers based in Taiwan. While our transactions with manufacturers based in Taiwan are conducted in U.S. dollars, changes in the relationship between the U.S. dollar and the Taiwan dollar might impact the purchase price of aftermarket products. Our aftermarket operations in Canada, which also purchase inventory from Taiwan in U.S. dollars, are further subject to changes in the relationship between the U.S. dollar and the Canadian dollar. Our recently acquired aftermarket operations in the United Kingdom also sourcemitigate a portion of their inventory from Taiwan, as well as from other European countries and China, resulting in exposure to changes in the relationship of the pound sterling against the euro and the U.S. dollar. With our acquisition of ECP in the fourth quarter, we began hedging our exposure to foreign currency fluctuations for certain ofin metals prices specifically related to our purchases for our U.K. operations. As of December 31, 2011, we held foreign currency forward contracts on aprecious metals refining and reclamation business acquired in 2012. The notional amount of €10.4 million and $1.5 million. The fair value of these foreign currency forward contracts at December 31, 2011 was2013 were immaterial. We do not currently attempt to hedge our foreign currency exposure related to our foreign currency denominated inventory purchases in our North American operations, and we may not be able to pass on any price increases to our customers.Other than a portion of our foreign currency denominated inventory purchases in the U.K., we do not attempt to hedge our foreign currency risk related to our foreign operations. Under the terms of our Amended and Restated 2011 Credit Agreement, we have amounts outstanding against our revolver facility denominated in pounds sterling for £67.0 million and Canadian dollars for CAD $36.3 million as of December 31, 2011. We have elected not to hedge the foreign currency risk related to these borrowings as we generate pound sterling and Canadian dollar cash flows that can be used to fund debt payments.51ITEM 8.FINANCIAL STATEMENTS AND SUPPLEMENTARY DATA Page PageLKQ CORPORATION AND SUBSIDIARIES LKQ CORPORATION AND SUBSIDIARIES53545556575952“Company”"Company") as of December 31, 20112013 and 2010,2012, and the related consolidated statements of income, stockholders’ equity and other comprehensive income, and cash flows and stockholders' equity for each of the three years in the period ended December 31, 2011.2013. Our audits also included the financial statement schedule listed in the Index at Item 15. These consolidated financial statements and financial statement schedule are the responsibility of the Company’sCompany's management. Our responsibility is to express an opinion on the financial statements and financial statement schedule based on our audits.20112013 and 2010,2012, and the results of their operations and their cash flows for each of the three years in the period ended December 31, 2011,2013, in conformity with accounting principles generally accepted in the United States of America. Also, in our opinion, such financial statement schedule, when considered in relation to the basic consolidated financial statements taken as a whole, presents fairly, in all material respects, the information set forth therein.Company’sCompany's internal control over financial reporting as of December 31, 2011,2013, based on the criteria established inInternal Control—Integrated Framework (1992) issued by the Committee of Sponsoring Organizations of the Treadway Commission and our report dated February 27, 2012March 3, 2014 expressed an unqualified opinion on the Company’sCompany's internal control over financial reporting./s/ DELOITTE & TOUCHE LLP Deloitte & Touche LLPFebruary 27, 201253LKQ CORPORATION AND SUBSIDIARIESConsolidated Balance Sheets(In thousands, except share and per share data) December 31, 2011 2010 Assets $ 48,247 $ 95,689 281,764 191,085 736,846 492,688 45,690 32,506 17,597 10,923 19,591 13,985 1,149,735 836,876 424,098 331,312 1,476,063 1,032,973 108,910 69,302 40,898 29,046 $ 3,199,704 $ 2,299,509 Liabilities and Stockholders’ Equity $ 210,875 $ 76,437 53,256 41,376 18,226 16,820 59,543 25,832 24,481 9,224 29,524 52,888 1,788 2,744 397,693 225,321 926,552 548,066 88,796 66,059 81,782 1,500 60,796 44,402 1,470 1,455 902,782 869,798 748,794 538,530 (8,961 ) 4,378 1,644,085 1,414,161 $ 3,199,704 $ 2,299,509 December 31, 2013 2012 Assets Current Assets: Cash and equivalents $ 150,488 $ 59,770 Receivables, net 458,094 311,808 Inventory 1,076,952 900,803 Deferred income taxes 63,938 53,485 Prepaid income taxes 8,069 29,537 Prepaid expenses and other current assets 42,276 28,948 Total Current Assets 1,799,817 1,384,351 Property and Equipment, net 546,651 494,379 Intangible Assets: Goodwill 1,937,444 1,690,284 Other intangibles, net 153,739 106,715 Other Assets 81,123 47,727 Total Assets $ 4,518,774 $ 3,723,456 Liabilities and Stockholders’ Equity Current Liabilities: Accounts payable $ 349,069 $ 219,335 Accrued expenses: Accrued payroll-related liabilities 58,695 44,400 Other accrued expenses 140,074 90,422 Income taxes payable 17,440 2,748 Contingent consideration liabilities 52,465 42,255 Other current liabilities 18,675 17,068 Current portion of long-term obligations 41,535 71,716 Total Current Liabilities 677,953 487,944 Long-Term Obligations, Excluding Current Portion 1,264,246 1,046,762 Deferred Income Taxes 133,822 102,275 Contingent Consideration Liabilities 3,188 47,754 Other Noncurrent Liabilities 88,820 74,627 Commitments and Contingencies Stockholders’ Equity: Common stock, $0.01 par value,1,000,000,000 and 500,000,000 shares authorized, 300,805,276 and 297,810,896 shares issued and outstanding at December 31, 2013 and 2012, respectively 3,008 2,978 Additional paid-in capital 1,006,084 950,338 Retained earnings 1,321,642 1,010,019 Accumulated other comprehensive income 20,011 759 Total Stockholders’ Equity 2,350,745 1,964,094 Total Liabilities and Stockholders’ Equity $ 4,518,774 $ 3,723,456 54LKQ CORPORATION AND SUBSIDIARIESConsolidated Statements of Income(In thousands, except per share data) Year Ended December 31, 2011 2010 2009 $ 3,269,862 $ 2,469,881 $ 2,047,942 1,877,869 1,376,401 1,120,129 1,391,993 1,093,480 927,813 293,423 233,993 201,056 287,626 212,718 181,919 391,942 310,228 276,723 7,590 668 2,554 49,929 37,996 34,113 361,483 297,877 231,448 24,307 29,765 32,252 (1,860 ) (1,449 ) (1,353 ) — — (4,339 ) 5,345 — — (1,408 ) — — (672 ) (564 ) (429 ) 25,712 27,752 26,131 335,771 270,125 205,317 125,507 103,007 78,180 210,264 167,118 127,137 — 224 (2,088 ) — 1,729 2,472 — 1,953 384 $ 210,264 $ 169,071 $ 127,521 $ 1.44 $ 1.17 $ 0.90 — 0.01 0.00 $ 1.44 $ 1.18 $ 0.91 $ 1.42 $ 1.15 $ 0.88 — 0.01 0.00 $ 1.42 $ 1.16 $ 0.89 (a)The sum of the individual earnings per share amounts may not equal the total due to rounding. Year Ended December 31, 2013 2012 2011 Revenue $ 5,062,528 $ 4,122,930 $ 3,269,862 Cost of goods sold 2,987,126 2,398,790 1,877,869 Gross margin 2,075,402 1,724,140 1,391,993 Facility and warehouse expenses 425,081 347,917 293,423 Distribution expenses 431,947 375,835 287,626 Selling, general and administrative expenses 597,052 495,591 391,942 Restructuring and acquisition related expenses 10,173 2,751 7,590 Depreciation and amortization 80,969 64,093 49,929 Operating income 530,180 437,953 361,483 Other expense (income): Interest expense 51,184 31,429 24,307 Loss on debt extinguishment 2,795 — 5,345 Change in fair value of contingent consideration liabilities 2,504 1,643 (1,408 ) Interest and other income, net (2,130 ) (4,286 ) (2,532 ) Total other expense, net 54,353 28,786 25,712 Income before provision for income taxes 475,827 409,167 335,771 Provision for income taxes 164,204 147,942 125,507 Net income $ 311,623 $ 261,225 $ 210,264 Earnings per share: Basic $ 1.04 $ 0.88 $ 0.72 Diluted $ 1.02 $ 0.87 $ 0.71 Year Ended December 31, 2013 2012 2011 Net income $ 311,623 $ 261,225 $ 210,264 Other comprehensive income (loss), net of tax: Foreign currency translation 14,056 12,921 (4,273 ) Net change in unrecognized gains/losses on derivative instruments, net of tax 4,495 (3,201 ) (9,066 ) Unrealized gain on pension plan, net of tax 701 — — Total other comprehensive income (loss) 19,252 9,720 (13,339 ) Total comprehensive income $ 330,875 $ 270,945 $ 196,925 55LKQ CORPORATION AND SUBSIDIARIESConsolidated Statements of Cash Flows(In thousands) Year Ended December 31, 2011 2010 2009 $ 210,264 $ 169,071 $ 127,521 54,505 41,428 38,062 13,107 9,974 7,283 9,302 8,963 5,882 (7,973 ) (15,000 ) (9,628 ) 2,013 2,322 2,457 5,345 — — — (2,744 ) (3,924 ) — — (4,339 ) — 1,265 3,539 (802 ) (890 ) 678 (18,074 ) (12,309 ) (384 ) (90,091 ) (67,795 ) (20,428 ) (5,094 ) (5,240 ) (5,358 ) 28,589 10,156 (18,067 ) (3,338 ) 8,257 9,107 2,251 7,492 24,111 35 (201 ) 1,386 11,733 4,434 6,104 211,772 159,183 164,002 (86,416 ) (61,438 ) (55,870 ) 1,743 1,441 1,070 — 11,992 17,477 (486,934 ) (143,578 ) (65,171 ) (571,607 ) (191,583 ) (102,494 ) 11,919 13,962 8,247 7,973 15,000 9,628 (11,048 ) (419 ) (310 ) 1,111,369 — 2,309 (453,867 ) — (9,045 ) 250,000 — — (600,464 ) (7,476 ) (42,291 ) (4,471 ) (2,105 ) (1,703 ) 311,411 18,962 (33,165 ) 982 221 1,496 (47,442 ) (13,217 ) 29,839 95,689 108,906 79,067 $ 48,247 $ 95,689 $ 108,906 $ 42,865 $ 11,889 $ 2,324 81,239 2,000 — — 14,945 — 13,564 — — 113,433 88,294 49,287 21,354 27,421 29,530 414 — 3,404 3,567 1,425 87 Year Ended December 31, 2013 2012 2011 CASH FLOWS FROM OPERATING ACTIVITIES: Net income $ 311,623 $ 261,225 $ 210,264 Adjustments to reconcile net income to net cash provided by operating activities: Depreciation and amortization 86,463 70,165 54,505 Stock-based compensation expense 22,036 15,634 13,107 Deferred income taxes 4,279 4,222 9,302 Excess tax benefit from stock-based payments (18,348 ) (15,737 ) (7,973 ) Other 9,630 4,515 6,556 Changes in operating assets and liabilities, net of effects from acquisitions: Receivables (44,670 ) (12,813 ) (18,074 ) Inventory (69,222 ) (95,042 ) (90,091 ) Prepaid expenses and other assets (5,224 ) (18,952 ) (5,094 ) Prepaid income taxes/income taxes payable 49,993 (774 ) 2,251 Accounts payable 49,641 (15,097 ) 28,589 Accrued expenses and other current liabilities 23,256 2,208 (3,303 ) Other noncurrent liabilities 8,599 6,636 11,733 Net cash provided by operating activities 428,056 206,190 211,772 CASH FLOWS FROM INVESTING ACTIVITIES: Purchases of property and equipment (90,186 ) (88,255 ) (86,416 ) Proceeds from sales of property and equipment 2,100 1,057 1,743 Investment in unconsolidated subsidiary (9,136 ) — — Acquisitions, net of cash acquired (408,384 ) (265,336 ) (486,934 ) Net cash used in investing activities (505,606 ) (352,534 ) (571,607 ) CASH FLOWS FROM FINANCING ACTIVITIES: Proceeds from exercise of stock options 15,392 17,693 11,919 Excess tax benefit from stock-based payments 18,348 15,737 7,973 Debt issuance costs (16,940 ) (253 ) (11,048 ) Proceeds from issuance of senior notes 600,000 — — Borrowings under revolving credit facility 437,023 742,381 1,111,369 Repayments under revolving credit facility (748,086 ) (855,402 ) (453,867 ) Borrowings under term loans 35,000 200,000 250,000 Repayments under term loans (16,875 ) (20,000 ) (600,464 ) Borrowings under receivables securitization facility 41,500 82,700 — Repayments under receivables securitization facility (121,500 ) (2,700 ) — Repayments of other long-term debt (45,062 ) (18,791 ) (4,471 ) Payments of other obligations (32,859 ) (4,293 ) — Net cash provided by financing activities 165,941 157,072 311,411 Effect of exchange rate changes on cash and equivalents 2,327 795 982 Net increase (decrease) in cash and equivalents 90,718 11,523 (47,442 ) Cash and equivalents, beginning of period 59,770 48,247 95,689 Cash and equivalents, end of period $ 150,488 $ 59,770 $ 48,247 Supplemental disclosure of cash paid for: Income taxes, net of refunds $ 110,862 $ 146,478 $ 113,433 Interest 45,253 29,026 21,354 Supplemental disclosure of noncash investing and financing activities: Notes payable and long-term obligations, including notes issued in connection with business acquisitions $ 8,360 $ 21,626 $ 56,429 Contingent consideration liabilities 3,854 5,456 81,239 Non-cash property and equipment additions 6,615 21,031 3,981 56LKQ CORPORATION AND SUBSIDIARIESConsolidated Statements of Stockholders’ Equity and Other Comprehensive Income(In thousands) Common Stock Additional
Paid-In
Capital Retained
Earnings Accumulated
Other
Comprehensive
Income (Loss) Total
Stockholders’
Equity Shares
Issued Amount 139,921 $ 1,399 $ 790,933 $ 241,938 $ (13,764 ) $ 1,020,506 — — — 127,521 — 127,521 — — — — (129 ) (129 ) — — — — 2,305 2,305 — — — — 4,191 4,191 — — — — — 133,888 50 1 (1 ) — — — 18 — 290 — — 290 — — 6,993 — — 6,993 2,016 20 8,227 — — 8,247
stock-based payments — — 9,510 — — 9,510 142,005 $ 1,420 $ 815,952 $ 369,459 $ (7,397 ) $ 1,179,434 — — — 169,071 — 169,071 — — — — (15 ) (15 ) — — — — 8,712 8,712 — — — — 3,078 3,078 — — — — — 180,846 690 7 14,938 — — 14,945 14 — 290 — — 290 — — 9,684 — — 9,684 2,758 28 13,934 — — 13,962
stock-based payments — — 15,000 — — 15,000 145,467 $ 1,455 $ 869,798 $ 538,530 $ 4,378 $ 1,414,161 57LKQ CORPORATION AND SUBSIDIARIESConsolidated Statements of Stockholders’ Equity and Other Comprehensive Income—(Continued)(In thousands) Common Stock Additional
Paid-In
Capital Retained
Earnings Accumulated
Other
Comprehensive
Income (Loss) Total
Stockholders’
Equity Shares
Issued Amount 145,467 $ 1,455 $ 869,798 $ 538,530 $ 4,378 $ 1,414,161 — — — 210,264 — 210,264 — — — — (9,066 ) (9,066 ) — — — — (4,273 ) (4,273 ) — — — — — 196,925 82 1 (1 ) — — — 16 — 399 — — 399 — — 12,708 — — 12,708 1,384 14 11,905 — — 11,919
stock-based payments — — 7,973 — — 7,973 146,949 $ 1,470 $ 902,782 $ 748,794 $ (8,961 ) $ 1,644,085 Common Stock Additional Paid-In Capital Amount BALANCE, January 1, 2011 290,933 $ 2,909 $ 868,344 $ 538,530 $ 4,378 $ 1,414,161 Net income — — — 210,264 — 210,264 Other comprehensive loss — — — — (13,339 ) (13,339 ) Restricted stock units vested 164 2 (2 ) — — — Stock issued as director compensation 32 — 399 — — 399 Stock-based compensation expense — — 12,708 — — 12,708 Exercise of stock options 2,768 28 11,891 — — 11,919 Excess tax benefit from stock-based payments — — 7,973 — — 7,973 BALANCE, December 31, 2011 293,897 $ 2,939 $ 901,313 $ 748,794 $ (8,961 ) $ 1,644,085 Net income — — — 261,225 — 261,225 Other comprehensive income — — — — 9,720 9,720 Restricted stock units vested 467 5 (5 ) — — — Stock-based compensation expense — — 15,634 — — 15,634 Exercise of stock options 3,447 34 17,659 — — 17,693 Excess tax benefit from stock-based payments — — 15,737 — — 15,737 BALANCE, December 31, 2012 297,811 $ 2,978 $ 950,338 $ 1,010,019 $ 759 $ 1,964,094 Net income — — — 311,623 — 311,623 Other comprehensive income — — — — 19,252 19,252 Restricted stock units vested 595 6 (6 ) — — — Stock-based compensation expense — — 22,036 — — 22,036 Exercise of stock options 2,399 24 15,368 — — 15,392 Excess tax benefit from stock-based payments — — 18,348 — — 18,348 BALANCE, December 31, 2013 300,805 $ 3,008 $ 1,006,084 $ 1,321,642 $ 20,011 $ 2,350,745 58Note 1. BusinessNote 1. Business “the"LKQ," "the Company,” “we,” “us,”" "we," "us," or “our”"our" are used in this document, those terms refer to LKQ Corporation and its consolidated subsidiaries.vehicles (carscars and trucks).trucks. We are the nation’snation's largest provider of alternative vehicle collision replacement products, and a leading provider of alternative vehicle mechanical replacement products. We also have operations in the United Kingdom, the Netherlands, Belgium, Northern France, Canada, Mexico and Central America. In total, we operate more than 440570 facilities.As described in Note 3, “Discontinued Operations,” during 2009, we sold, agreed to sell or closed certainself service facilities. These facilities qualified for treatment as discontinued operations.common stock. The financial results and assets and liabilities of these facilities are segregated from our continuing operations and presented as discontinued operationsstock split was completed in the form of a stock dividend that was issued on September 18, 2012 to stockholders of record at the close of business on August 28, 2012. The stock began trading on a split adjusted basis on September 19, 2012. The Company’s historical share and per share information within this Annual Report on Form 10-K has been retroactively adjusted to give effect to this stock split.Sheets and Consolidated StatementsSheet as of Income for all periods presented.December 31, 2013.Note 2. Summary of Significant Accounting PoliciesNote 2. Summary of Significant Accounting Policies aftermarket and recycled products.vehicle parts. Revenue is recognized when the products are shipped, delivered to or picked up by customers and title has transferred, subject to an allowance for estimated returns, discounts and allowances that we estimate based upon historical information. We recorded a reserve for estimated returns, discounts and allowances of approximately $22.8$26.6 million and $18.2$24.7 million at December 31, 20112013 and 2010,2012, respectively. We present taxes assessed by governmental authorities collected from customers on a net basis. Therefore, the taxes are excluded from revenue on our Consolidated Statements of Income and are shown as a current liability on our Consolidated Balance SheetSheets until remitted. RevenueWe recognize revenue from the sale of separately-priced extended warranty contracts is reported as deferred revenuescrap, cores and recognized ratably overother metals when title has transferred, which typically occurs upon delivery to the term of the contracts or three years in the case of lifetime warranties.Shipping & Handlingrelated tofor shipping and handling of approximately $23.9 million, $17.3 million and $15.5 million during the years ended December 31, 2011, 2010 and 2009, respectively.handling. Distribution expenses in the accompanying Consolidated Statements of Income are the costs incurred to prepare and deliver products to customers.59Cash and EquivalentsWe consider all highly liquid investments with original maturities of 90 days or less to be cash equivalents. Cash equivalents are carried at cost, which approximates market value. Our cash equivalents primarily include holdings in money market funds and overnight securities. We did not hold any cash equivalents at December 31, 2011, while cash equivalents at December 31, 2010 were $57.2 million.customer’scustomer's credit history. We recorded a reserve for uncollectible accounts of approximately $8.3$14.4 million and $6.9$9.5 million at December 31, 20112013 and 2010,2012, respectively. The reserve is based upon the aging of the accounts receivable, our assessment of the collectability of specific customer accounts and historical experience. Receivables are written off once collection efforts have been exhausted. Recoveries of receivables previously written off are recorded when received.Ourincludesinto the following categories: aftermarket and refurbished vehicle replacement products,products; and salvage and remanufactured vehicle replacement products and core facilities inventory. A core is a recycled automotive part that is not suitable for sale as a replacement part without further refurbishing or remanufacturing work.andwhich are recycled automotive parts that are not suitable for sale as a replacement part without further processing. The cost of our refurbished inventory also includes expenses incurred for freight, refurbishing costslabor and other overhead. Salvage inventory is recorded at the lower of cost or market. Cost is established based upon the price we pay for a vehicle, including auction, storage and towing fees, as well as expenditures for buying and dismantling. Inventory carrying value is determined using the average cost to sales percentage at each of our facilities and applying that percentage to the facility’sfacility's inventory at expected selling prices.prices, the assessment of which incorporates the sales probability based on a part's days in stock and historical demand. The average cost to sales percentage is derived from each facility’sfacility's historical vehicle profitability for salvage vehicles purchased at auction or from contracted rates for salvage vehicles acquired under certain direct procurement arrangements.vehicles. Remanufactured inventory cost is based upon the price paid for cores, and also includes expenses incurred for freight, direct manufacturing costs and overhead.reduced regularly torecorded at the lower of cost or market and is reduced to reflect the age of the inventory and current anticipated demand. If actual demand differs from our estimates, additional reductions to inventory carrying value would be necessary in the period such determination is made.60 December 31, 2011 2010 $ 445,787 $ 274,728 282,106 209,514 8,953 8,446 $ 736,846 $ 492,688 December 31, 2013 2012 Aftermarket and refurbished products $ 706,600 $ 523,677 Salvage and remanufactured products 370,352 377,126 $ 1,076,952 $ 900,803 cost.cost less accumulated depreciation. Expenditures for major additions and improvements that extend the useful life of the related asset are capitalized. As property and equipment are sold or retired, the applicable cost and accumulated depreciation are removed from the accounts and any resulting gain or loss thereon is recognized. Construction in progress consists primarily of building and land improvements at our existing facilities. Depreciation is calculated using the straight-line method over the estimated useful lives or, in the case of leasehold improvements, the term of the related lease and reasonably assured renewal periods, if shorter.The internal and external costs incurred to develop internal use computer software during the application development stage of the implementation, including the design of the chosen path, are capitalized. Other costs, including expenses incurred during the preliminary project stage, training expenses, data conversion costs and expenses incurred in the post implementation stage are expensed in the period incurred. Capitalized costs are amortized ratably over the useful life of the software when the software becomes operational. Upgrades and enhancements to internal use software are capitalized only if the costs result in additional functionality. We do not plan to sell or market our internal use computer software to third parties.10-20 years 20-40 years 3-20 years 3-10 years 3-10 years December 31, 2011 2010 $ 81,170 $ 71,931 119,414 103,198 192,514 145,196 79,195 63,341 40,825 27,218 69,079 41,939 582,197 452,823 (179,950 ) (142,401 ) 21,851 20,890 $ 424,098 $ 331,312 61 December 31, 2013 2012 Land and improvements $ 101,018 $ 87,720 Buildings and improvements 143,535 133,368 Furniture, fixtures and equipment 282,862 243,565 Computer equipment and software 108,424 91,588 Vehicles and trailers 64,381 51,187 Leasehold improvements 108,625 91,280 808,845 698,708 Less—Accumulated depreciation (294,183 ) (231,130 ) Construction in progress 31,989 26,801 $ 546,651 $ 494,379 , and other specifically identifiable intangible assets, such as trade names, trademarks, customer relationships and covenants not to compete and customer relationships.2011, 20102013, 2012 and 2009. With the decision to sell a portion of our self service operations (as described in Note 3, “Discontinued Operations”), we also conducted a goodwill impairment test as of September 30, 2009 for both the allocated goodwill associated with the facilities to be disposed of and our ongoing self service reporting unit.2011. The results of all of these tests indicated that goodwill was not impaired. $ 907,218 26,137 5,428 $ 938,783 91,757 2,433 $ 1,032,973 442,208 882 $ 1,476,063 North America Europe Total Balance as of January 1, 2011 $ 1,032,973 $ — $ 1,032,973 Business acquisitions and adjustments to previously recorded goodwill 105,177 337,031 442,208 Exchange rate effects (1,520 ) 2,402 882 Balance as of December 31, 2011 $ 1,136,630 $ 339,433 $ 1,476,063 Business acquisitions and adjustments to previously recorded goodwill 201,742 (4,140 ) 197,602 Exchange rate effects 1,459 15,160 16,619 Balance as of December 31, 2012 $ 1,339,831 $ 350,453 $ 1,690,284 Business acquisitions and adjustments to previously recorded goodwill 27,035 208,412 235,447 Exchange rate effects (7,929 ) 19,642 11,713 Balance as of December 31, 2013 $ 1,358,937 $ 578,507 $ 1,937,444 2009, we adjusted previously recorded goodwill related to the Pick-Your-Part Auto Wrecking (“PYP”) acquisition by $3.2 million, primarily related to various pre-acquisition liabilities.In 2011,2013 and 2012, we finalized the valuation of certain intangible assets acquired related to our 2010 acquisitions.2012 and 2011 acquisitions, respectively. As these adjustments did not have a material impact on our financial position or results of operations, we recorded these adjustments to goodwill and amortization expense in 2011. December 31, 2011 December 31, 2010 Gross
Carrying
Amount Accumulated
Amortization Net Gross
Carrying
Amount Accumulated
Amortization Net $ 115,954 $ (16,305 ) $ 99,649 $ 75,661 $ (12,020 ) $ 63,641 3,194 (918 ) 2,276 2,688 (1,382 ) 1,306 10,050 (3,065 ) 6,985 4,355 — 4,355 $ 129,198 $ (20,288 ) $ 108,910 $ 82,704 $ (13,402 ) $ 69,302 In 2011, December 31, 2013 December 31, 2012 Net Net Trade names and trademarks $ 143,577 $ (27,950 ) $ 115,627 $ 118,422 $ (21,599 ) $ 96,823 Customer relationships 29,583 (10,770 ) 18,813 14,426 (6,642 ) 7,784 Software and other technology related assets 20,384 (2,718 ) 17,666 — — — Covenants not to compete 3,979 (2,346 ) 1,633 3,654 (1,546 ) 2,108 $ 197,523 $ (43,784 ) $ 153,739 $ 136,502 $ (29,787 ) $ 106,715 $40.1$23.9 million of trade names, $1.5$19.3 million of software and technology related assets, $14.1 million of customer relationships and $0.3 million of covenants not to compete and $5.7 million of customer relationships resulting from our 20112013 acquisitions and adjustments to certain preliminary intangible asset valuations from our 20102012 acquisitions. The trade names, software and technology related assets, and customer relationships recorded in 20112013 included $39.3$23.5 million, for the Euro Car Parts trade name$19.3 million and $2.5 million, respectively, related to our acquisition of Euro Car Parts Holdings Limited (“ECP”Sator Beheer B.V. ("Sator") effective October 1, 2011.as discussed in Note 8, "Business Combinations." We also recognized $11.4 million of customer relationships related to our acquisitions of five automotive paint distributors in 2013. In 2010,2012, we recognized $0.9recorded $0.6 million of trade names, $1.0$4.1 million of customer relationships and $0.6 million of covenants not to compete and $4.4 million of customer relationships resulting from our 2012 acquisitions during the year. and adjustments to certain preliminary intangible asset valuations from our 2011 acquisitions. years on a straight-line basis. Covenants not to compete are62amortized over the lives of the respective agreements, which range from one to fivebenefitted (5benefited (5 to 1013 years) on either a straight-line or accelerated basis. Software and other technology related assets are amortized on a straight-line basis over the expected period to be benefited (five years). Covenants not to compete are amortized over the lives of the respective agreements, which range from one to five years, on a straight-line basis. Amortization expense for intangibles was approximately $7.9$13.8 million $4.2, $9.5 million and $4.1$7.9 million during the years ended December 31, 2011, 20102013, 2012 and 2009,2011, respectively. Estimated amortization expense for each of the five years in the period ending December 31, 20162018 is $8.4$17.0 million $7.7, $15.1 million $7.0, $13.9 million $6.3, $13.2 million and $5.6$10.1 million, respectively.During the year ended December 31, 2010, we recognized impairment charges on certain long-lived assets during the normal course of business of $1.3 million. There were no material adjustments to the carrying value of long-lived assets of continuing operations during the years ended December 31, 20112013, 2012 or 2009.Fair Value of Financial Instruments2011Our debt is reflected on the balance sheet at cost. As discussed in Note 5, “Long-Term Obligations,” we entered into a new senior secured credit agreement on March 25, 2011, which was subsequently amended and restated effective September 30, 2011. Based on current market conditions, our interest rate margins are below the rate available in the market, which causes the fair value of our debt to fall below the carrying value. The fair value of our credit facility borrowings is approximately $893 million at December 31, 2011, as compared to the carrying value of $901.4 million. At December 31, 2010, the fair value of our borrowings under the previous credit agreement reasonably approximated the carrying value of $590.1 million. We estimated the fair value of our credit facility borrowings by calculating the upfront cash payment a market participant would require to assume our obligations. The upfront cash payment, excluding any issuance costs, is the amount that a market participant would be able to lend at December 31, 2011 and 2010 to an entity with a credit rating similar to ours and achieve sufficient cash inflows to cover the scheduled cash outflows under our credit facility.The carrying amounts of our cash and equivalents, net trade receivables and accounts payable approximate fair value.We apply the market and income approaches to value our financial assets and liabilities, which include the cash surrender value of life insurance, deferred compensation liabilities, interest rate swaps and contingent consideration liabilities. Required fair value disclosures are included in Note 7, “Fair Value Measurements.”Product Warranties.activity and related expenses.activity. The changes in the warranty reserve are as follows (in thousands): $ 604 9,351 (8,882 ) 990 $ 2,063 22,364 (20,802 ) 3,722 $ 7,347 63Our 2011 and 2010 warranty expense reflects $8.5 million and $0.2 million of expense related to our engine remanufacturing operations, which we began in 2010 through an acquisition in the fourth quarter, and subsequently expanded through two additional acquisitions in 2011.Balance as of January 1, 2012 $ 7,347 Warranty expense 29,628 Warranty claims (27,514 ) Business acquisitions 1,113 Balance as of December 31, 2012 $ 10,574 Warranty expense 29,674 Warranty claims (27,801 ) Balance as of December 31, 2013 $ 12,447 workers’workers' compensation and property coverage, under deductible insurance programs. The insurance premium costs are expensed over the contract periods. A reserve for liabilities associated with these losses is established for claims filed and claims incurred but not yet reported based upon our estimate of ultimate cost, which is calculated using analyses of historical data. We monitor new claims and claim development as well as trends related to the claims incurred but not reported in order to assess the adequacy of our insurance reserves. Total self-insurance reserves were $37.4$55.6 million and $32.9$44.1 million, including $18.2$25.8 million and $16.8$21.5 million classified in current liabilities,as Other Accrued Expenses, as of December 31, 20112013 and 2010,2012, respectively. The remaining balances of self-insurance reserves are classified as Other Noncurrent Liabilities, which reflects management’smanagement's estimates of when claims will be paid. The reserves presented on the Consolidated Balance Sheets are net of claims deposits of $0.5$0.5 million and $0.6 million, at both December 31, 20112013 and 2010, respectively.2012. In addition to these claims deposits, we had outstanding letters of credit of $31.8$43.0 million and $24.2$37.1 million at December 31, 20112013 and 2010,2012, respectively, to guarantee self-insurance claims payments. While we do not expect the amounts ultimately paidmanagement’smanagement's intent that such earnings will remain invested in those subsidiaries or other foreign subsidiaries. Taxes will be provided on these earnings in the period in which a decision is made to repatriate the earnings.ourand furnace operations and our distribution centers.64stockholders’stockholders' equity.In September 2011, the Financial Accounting Standards Board (“FASB”) issued Accounting Standards Update (“ASU”) No. 2011-08, “Testing Goodwill for Impairment,” which grants entities the option to first perform a qualitative assessment of whether it is more likely than not that a reporting unit’s fair value is less than its carrying value. If an entity concludes that it is more likely than not that the fair value of a reporting unit is less than its carrying amount, the entity would be required to perform the two-step impairment test for the reporting unit. The ASU is effective for annual and interim goodwill impairment tests performed for fiscal years beginning after December 15, 2011. Early adoption is permitted, andelected to early adopt this guidance for our 2011 annual impairment test during the fourth quarter. Since this ASU did not change the accounting guidance for testing goodwill if the “more likely than not” qualitative threshold is met, the adoption of this guidance did not affect our financial position, results of operations or cash flows.In June 2011,adopted the FASB released ASU No. 2011-05, “Presentation2013-02, “Reporting of Amounts Reclassified Out of Accumulated Other Comprehensive Income,Income.” which eliminates the option to present the components of other comprehensive income in the statement of changes in stockholders’ equity. Instead, entities will have the option to present the components of net income, the components of other comprehensive income and total comprehensive income in a single continuous statement or in two separate but consecutive statements. In addition, thisThis update requires entities to present the reclassification adjustmentsdisclosure of amounts reclassified out of accumulated other comprehensive income ("AOCI") by componentcomponent. In addition, an entity is required to present, either on the face of the financial statements or in both the statement wherenotes, significant amounts reclassified out of AOCI by the respective line items of net income. For amounts that are not required to be reclassified in their entirety to net income, an entity is presented and the statement whererequired to cross-reference to other comprehensive income is presented. However, in December 2011, the FASB issued ASU No. 2011-12, “Deferral of the Effective Date for Amendments to the Presentation of Reclassifications of Items Out of Accumulated Other Comprehensive Income in Accounting Standards Update No. 2011-05,” which indefinitely deferred this provision of ASU 2011-05.disclosures that provide additional details about those amounts. The amendments doupdate does not change the items reported in otherThis guidance is effective for fiscal years, and interim periods within those years, beginning after December 15, 2011, and will be applied retrospectively. As this guidance only revises the presentation and disclosures related to the reclassification of comprehensive income,items out of AOCI, the adoption of this guidance will not affect our financial position, results of operations or cash flows.In May 2011, the FASB issued ASU No. 2011-04, “Amendments to Achieve Common Fair Value Measurement and Disclosure Requirements in U.S. GAAP and IFRSs.” This update provides clarification on existing fair value measurement requirements, amends existing guidance primarily related to fair value measurements for financial instruments, and requires enhanced disclosures on fair value measurements. The additional disclosures are specific to Level 3 fair value measurements, transfers between Level 1 and Level 2 of the fair value hierarchy, financial instruments not measured at fair value and use of an asset measured or disclosed at fair value differing from its highest and best use. This ASU is effective for interim and annual periods beginning after December 15, 2011, and will be applied prospectively. We are currently assessing the impact that the adoption of ASU No. 2011-04 will have on our financial position, results of operations and cash flows.Effective January 1, 2011, we adopted FASB ASU 2010-29, “Disclosure of Supplementary Pro Forma Information for Business Combinations,” which clarifies the disclosure requirements for pro forma financial65information related to a material business combination or a series of immaterial business combinations that are material in the aggregate. The guidance clarifies that the pro forma disclosures are prepared assuming the business combination occurred at the start of the prior annual reporting period. Additionally, a narrative description of the nature and amount of material, non-recurring pro forma adjustments would be required. As this newly issued accounting standard only requires enhanced disclosure, the adoption of this standard did not impact our financial position, results of operations or cash flows.3. Discontinued OperationsOn October 1, 2009, we sold to Schnitzer Steel Industries, Inc. (“SSI”) four self service retail facilities in Oregon and Washington and certain business assets related to two self service facilities in Northern California and a self service facility in Portland, Oregon for $17.5 million, net of cash sold. We recognized a gain on the sale of approximately $2.5 million, net of tax, in our fourth quarter 2009 results. Goodwill totaling $9.9 million was included in the cost basis of net assets disposed when determining the gain on sale. In the fourth quarter of 2009, we closed the two self service facilities in Northern California and converted the self service operation in Portland to a wholesale recycling business.On January 15, 2010, we also sold to SSI two self service retail facilities in Dallas, Texas for $12.0 million. We recognized a gain on the sale of approximately $1.7 million, net of tax, in our first quarter 2010 results. Goodwill totaling $6.7 million was included in the cost basis of net assets disposed when determining the gain on sale.The self service facilities that we sold or closed are reported as discontinued operations for all periods presented. As of December 31, 2011 and 2010, we had accrued liabilities applicable to discontinued operations of $1.8 million and $2.7 million, respectively, included in the Consolidated Condensed Balance Sheets. These liabilities were primarily composed of accrued restructuring expenses12, "Accumulated Other Comprehensive Income (Loss)" for the excess lease payments (net of estimated sublease income) and facility closure costs related to two of the closed self service facilities.Results of operations for the discontinued operations are as follows (in thousands): Year Ended December 31, 2011 2010 2009 $ — $ 686 $ 23,957 $ — $ 355 $ (3,314 ) — 131 (1,226 ) — 224 (2,088 ) — 1,729 2,472 $ — $ 1,953 $ 384 Our decision to close the two self service facilities in Northern California represented a triggering event thatadditional required us to evaluate the long-lived assets at these facilities for impairment. The pretax loss from discontinued operations in the year ended December 31, 2009 includes a fixed asset impairment charge of $3.5 million primarily related to leasehold improvements that are not recoverable.Note 3. Equity Incentive Plans Note 4. Equity Incentive PlansWe have two stock-based compensation plans, the Stock OptionIn order to attract and Compensation Plan for Non-Employee Directors (the “Director Plan”retain employees, non-employee directors, consultants, and other persons associated with us, we may grant qualified and nonqualified stock options, stock appreciation rights, restricted stock, restricted stock units (“RSUs”), performance shares and performance units under the LKQ Corporation 1998 Equity Incentive Plan (the “Equity Incentive Plan”). Under the Director Plan, which was adopted by our Board of Directors in June 2003 and approved by our stockholders in September 2003, shares of LKQ common stock may be issued to directors in lieu of cash compensation. In February 1998, we adopted the Equity Incentive Plan to attract and retain employees and66consultants. Under the Equity Incentive Plan, both qualified and nonqualified stock options, stock appreciation rights, restricted stock, performance shares and performance units may be granted. On January 13, 2011, the Compensation Committee amended the Equity Incentive Plan to allow the grant of restricted stock units (“RSUs”).34.469.9 million shares, subject to antidilution and other adjustment provisions, which includes 6.4 millionprovisions. We have granted RSUs, stock options, and restricted stock under the Equity Incentive Plan. Of the shares authorized in May 2011.Stock options issuedapproved by our stockholders for issuance under the Equity Incentive Plan, expire ten years from the date they are granted. Most14 million shares remained available for issuance as of December 31, 2013. We expect to issue new shares of common stock to cover past and future equity grants.RSUs and shares of restricted stock granted underall also doubled; and the Equity Incentive Planexercise prices of outstanding stock options were reduced to 50% of the exercise prices prior to the stock split. a periodperiods of up to five years. Vesting of the awards is years, subject to a continued service condition. Each RSU converts into one share of LKQ common stock on the applicable vesting date. Shares of restricted stock may not be sold, pledged or otherwise transferred until they vest. We expectThe grant date fair value of RSUs is based on the market price of LKQ stock on the grant date.issue new sharescertain adjustments, during the year ending December 31, 2013. In addition, these RSUs retain the same remaining time-based vesting conditions as the canceled RSUs (vesting in equal tranches each six months beginning July 2013 through either January 2016 or January 2017). The remaining 275,400 RSUs granted in March 2013 include a performance-based condition that the Company reports positive diluted earnings per share, subject to certain adjustments, during any fiscal year period within five years following the grant date. In addition, these RSUs include a time-based vesting condition, vesting in equal tranches each six months beginning July 2013 through January 2016. In all cases, both conditions must be met before any RSUs vest. If the applicable performance-based condition of commonan RSU is not met, the RSU is forfeited. If and when the performance-based condition is met, all applicable RSUs that had previously met the time-based vesting condition will vest immediately and the remaining RSUs will vest according to the remaining schedule of the time-based condition.cover future equity grants under these plans. Shares
Available For
Grant Stock Options RSUs Restricted Stock Number
Outstanding Weighted
Average
Exercise
Price Number
Outstanding Weighted
Average
Grant Date
Fair Value Number
Outstanding Weighted
Average
Grant Date
Fair Value 5,374,928 9,663,588 $ 7.27 — $ — 190,000 $ 19.14 (1,886,400 ) 1,836,400 12.15 — — 50,000 18.60 — (2,016,306 ) 4.09 — — — — — — — — — (38,000 ) 19.14 154,275 (154,275 ) 13.82 — — — — 3,642,803 9,329,407 $ 8.81 — $ — 202,000 $ 19.00 (1,711,533 ) 1,711,533 19.95 — — — — — (2,758,155 ) 5.06 — — — — — — — — — (48,000 ) 19.02 208,820 (208,820 ) 16.11 — — — — 2,140,090 8,073,965 $ 12.27 — $ — 154,000 $ 19.00 (821,674 ) — — 821,674 23.60 — — (15,583 ) — — — — — — — (1,384,019 ) 8.61 — — — — — — — (82,431 ) 23.68 (48,000 ) 19.02 173,352 (150,900 ) 16.87 (22,452 ) 23.54 — — 6,400,000 — — — — — — 7,876,185 6,539,046 $ 12.93 716,791 $ 23.59 106,000 $ 18.98 In 2012, our Board RSUs Stock Options Restricted Stock Balance, January 1, 2011 4,280,180 — $ — 16,147,930 $ 6.14 308,000 $ 9.50 Granted (1,643,348 ) 1,643,348 11.80 — — — — Shares Issued for Director Compensation (31,166 ) — — — — — — Exercised — — — (2,768,038 ) 4.31 �� — — Vested — (164,862 ) 11.84 — — (96,000 ) 9.51 Canceled 346,704 (44,904 ) 11.77 (301,800 ) 8.44 — — Additional Shares Authorized 12,800,000 — — — — — — Balance, December 31, 2011 15,752,370 1,433,582 $ 11.80 13,078,092 $ 6.47 212,000 $ 9.49 Granted (1,504,410 ) 1,504,410 15.86 — — — — Exercised — — — (3,446,472 ) 5.13 — — Vested — (467,208 ) 13.09 — — (96,000 ) 9.51 Canceled 395,972 (119,422 ) 14.03 (276,550 ) 8.30 — — Balance, December 31, 2012 14,643,932 2,351,362 $ 14.02 9,355,070 $ 6.90 116,000 $ 9.47 Granted (924,312 ) 924,312 22.18 — — — — Exercised — — — (2,399,419 ) 6.41 — — Vested — (594,961 ) 15.05 — — (96,000 ) 9.51 Canceled 245,820 (122,500 ) 16.25 (123,320 ) 8.89 — — Balance, December 31, 2013 13,965,440 2,558,213 $ 16.63 6,832,331 $ 7.04 20,000 $ 9.30 Directors granted 721,100canceled RSUs to employeeswere accounted for as a modification of the original awards, and directors.67options, RSUs and restricted stock, and vested and expected to vest options at December 31, 2011: Shares Weighted
Average
Remaining
Contractual
Life (Yrs) Intrinsic
Value
(in thousands) Weighted
Average
Exercise
Price 6,526,736 5.6 $ 111,978 $ 12.92 697,667 4.0 20,986 — 106,000 1.5 3,188 — Shares RSUs 2,462,273 2.8 $ 81,009 $ — Stock options 6,776,241 4.2 175,394 7.02 Restricted stock 20,000 0.8 658 — $30.08$32.90 on December 31, 2011.2013. This amount changes based upon the fair market value of our common stock. The aggregate intrinsic value of total outstanding RSUs and restricted stock was $21.6$84.2 million and $3.2$0.7 million at December 31, 2011,2013, respectively.2011: Outstanding Exercisable Shares Weighted
Average
Remaining
Contractual
Life (Yrs) Weighted
Average
Exercise
Price Shares Weighted
Average
Remaining
Contractual
Life (Yrs) Weighted
Average
Exercise
Price 1,369,911 2.2 $ 3.85 1,369,911 2.2 $ 3.85 536,180 4.0 9.24 536,180 4.0 9.24 1,999,260 6.4 11.39 1,190,810 6.1 11.14 2,611,695 7.2 19.57 1,136,909 6.8 19.39 22,000 6.4 21.28 14,850 6.4 21.31 6,539,046 5.6 $ 12.93 4,248,660 4.8 $ 10.79 Outstanding Exercisable Range of Exercise Prices Shares Shares $1.50 - $3.50 791,646 0.9 $ 2.20 791,646 0.9 $ 2.20 $3.51 - $5.50 1,381,400 2.5 4.84 1,381,400 2.5 4.84 $5.51 - $7.50 1,575,714 5.0 5.98 1,342,293 5.0 5.98 $7.51 - $9.50 203,166 5.1 9.23 175,366 5.0 9.24 $9.51 + 2,880,405 5.4 9.85 2,060,757 5.2 9.81 6,832,331 4.2 $ 7.04 5,751,462 3.9 $ 6.65 20112013 was $112.1$176.7 million and $81.9$151.0 million, respectively.Thevaluevalues of the RSUs immediately before and restrictedafter the modification were the same. As a result, there was no charge recorded in 2013 and the expense for these RSUs was continued at the grant date fair value. During the year ended December 31, 2013, we recognized $8.3 million of stock based compensation expense related to the RSUs containing a performance-based vesting condition. For all other awards, which are subject to only a time-based vesting condition, we recognize compensation expense on a straight-line basis over the requisite service period of the entire award.based on the market price of LKQ stock on the date of issuance.adjusted to reflect estimated forfeitures. When estimating forfeitures, we consider voluntary and involuntary termination behavior as well as analysis of historical forfeitures. For valuing RSUs and restricted stock, we used a forfeiture rate of 8% for grants to employees and a forfeiture rate of 0% for grants to directors and executive officers.We did not grant any stock options during the year ended December 31, 2011. For the stock options granted during 2010 and 2009, the fair value was estimated using the Black-Scholes option-pricing model. The following table summarizes the weighted average assumptions used to compute the fair value of stock option grants: Year Ended
December 31, 2010 2009 6.4 6.3 3.17 % 1.87 % 43.9 % 44.6 % 0 % 0 % $ 9.54 $ 5.57 Expected life—The expected life represents the period that our stock-based awards are expected to be outstanding. At the last grant date (in 2010), we used the simplified method in developing an estimate of68expected life of stock options because we lacked sufficient data to calculate an expected life based on historical experience. Our first annual option grant with a full five year vesting period since we became a public company was on January 13, 2006, and these awards became fully vested in January 2011. Additionally, our options have a ten year life while our existence as a public company had been just over six years when the 2010 grant was made. Therefore, we use the simplified expected term method as permitted by the Securities and Exchange Commission Staff Accounting Bulletin No. 107, as amended by Staff Accounting Bulletin No. 110.Risk-free interest rate—We base the risk-free interest rate used in the Black-Scholes option-pricing model on the implied yield available on U.S. Treasury zero-coupon issues with the same or substantially equivalent remaining term.Expected volatility—We use the trading history and historical volatility of our common stock in determining an estimated volatility factor for the Black-Scholes option-pricing model.Expected dividend yield—We have not declared and have no plans to declare dividends and have therefore used a zero value for the expected dividend yield in the Black-Scholes option-pricing model.Estimated forfeitures—When estimating forfeitures, we consider voluntary and involuntary termination behavior as well as analysis of historical forfeitures. A forfeiture rate of 9.0% has been used for valuing employee option grants, while a forfeiture rate of 0% has been used for valuing director and executive officer option grants.The total grant-date fair value of options that vested during the years ended December 31, 2011, 2010 and 2009 was approximately $8.6 million, $7.7 million and $5.3 million, respectively. The total intrinsic value (market value of stock less option exercise price) of stock options exercised was $24.8 million, $43.2 million and $27.2 million during the years ended December 31, 2011, 2010 and 2009, respectively.The fair value of RSUs that vested during the year ended December 31, 2011 was $2.2 million, while there were no RSU vestings during the years ended December 31, 2010 and 2009 as we did not issue RSUs prior to 2011. The fair value of restricted stock that vested during the years ended December 31, 2011, 2010 and 2009 was approximately $1.1 million, $1.0 million and $0.4 million, respectively.We recognize compensation expense on a straight-line basis over the requisite service period of the award. pretaxpre-tax stock-based compensation expense are as follows (in thousands): Year Ended December 31, 2011 2010 2009 $ 8,129 $ 8,771 $ 6,219 3,666 — — 913 913 774 399 290 290 $ 13,107 $ 9,974 $ 7,283 Year Ended December 31, 2013 2012 2011 RSUs $ 17,299 $ 8,411 $ 3,666 Stock options 4,529 6,310 8,129 Restricted stock 208 913 913 Stock issued to non-employee directors — — 399 Total stock-based compensation expense $ 22,036 $ 15,634 $ 13,107 Year Ended December 31, 2011 2010 2009 $ 327 $ 278 $ 47 2,391 2,069 2,620 10,389 7,627 4,616 13,107 9,974 7,283 (5,059 ) (3,920 ) (2,862 ) $ 8,048 $ 6,054 $ 4,421 69 Year Ended December 31, 2013 2012 2011 Cost of goods sold $ 392 $ 376 $ 327 Facility and warehouse expenses 2,745 2,465 2,391 Selling, general and administrative expenses 18,899 12,793 10,389 22,036 15,634 13,107 Income tax benefit (8,594 ) (6,097 ) (5,059 ) Total stock-based compensation expense, net of tax $ 13,442 $ 9,537 $ 8,048 costcosts during the years ended December 31, 2011, 20102013, 2012 or 2009.2011.2011,2013, unrecognized compensation expense related to unvested RSUs, stock options RSUs and restricted stock is expected to be recognized as follows (in thousands): Stock
Options RSUs Restricted
Stock Total $ 6,883 $ 3,791 $ 913 $ 11,587 4,722 3,702 208 8,632 3,116 3,639 139 6,894 78 3,602 — 3,680 — 162 — 162 $ 14,799 $ 14,896 $ 1,260 $ 30,955 RSUs Total 2014 $ 12,522 $ 2,724 $ 139 $ 15,385 2015 9,123 69 — 9,192 2016 5,611 — — 5,611 2017 2,666 — — 2,666 2018 118 — — 118 Total unrecognized compensation expense $ 30,040 $ 2,793 $ 139 $ 32,972 Note 5. Note 4. Long-Term Obligations Long-term obligations consist of the following (in thousands): December 31, 2011 2010 $ 240,625 $ 590,099 660,730 — 38,338 6,869 16,383 3,986 956,076 600,954 (29,524 ) (52,888 ) $ 926,552 $ 548,066 December 31, 2013 2012 Senior secured credit agreement: Term loans payable $ 438,750 $ 420,625 Revolving credit facility 233,804 553,964 Senior notes 600,000 — Receivables securitization facility — 80,000 Notes payable through October 2018 at weighted average interest rates of 1.1% and 1.7%, respectively 15,730 42,398 Other long-term debt at weighted average interest rates of 3.5% and 3.3%, respectively 17,497 21,491 1,305,781 1,118,478 Less current maturities (41,535 ) (71,716 ) $ 1,264,246 $ 1,046,762 20112013 are as follows (in thousands): $ 29,524 51,013 27,105 35,514 811,841 1,079 $ 956,076 We obtained a senior secured debt financing facility from Lehman Brothers Inc. and Deutsche Bank Securities, Inc. on October 12, 2007 (as amended, the “20072014 $ 41,535 2015 27,934 2016 25,240 2017 23,334 2018 583,140 Thereafter 604,598 $ 1,305,781 Agreement”). The 2007 Credit Agreement was scheduled to mature on October 12, 2013 and included a $610 million term loan, a $40 million Canadian currency term loan, an $85 million U.S. dollar revolving credit facility, and a $15 million dual currency revolving facility for drawings of either U.S. dollars or Canadian dollars. The 2007 Credit Agreement also provided for (i) the issuance70of letters of credit of up to $35 million in U.S. dollars and up to $10 million in either U.S. or Canadian dollars, and (ii) the opportunity for us to add additional term loan facilities and/or increase the $100 million revolving credit facility’s commitments, subject to certain requirements.March 25, 2011,May 3, 2013, we entered into aan amended and restated credit agreement (the “Original 2011 Credit Agreement”"Credit Agreement") with the several lenders from time to time party thereto, JPMorgan ChaseWells Fargo Bank, N.A.,National Association, as administrative agent, Bank of America N.A., as syndication agent, The Bank of Tokyo-Mitsubishi UFJ, LTD ("BTMU") and RBS Citizens, N.A. and Wells Fargo Bank, National Association,, as co-documentation agents, and J.P. MorganWells Fargo Securities, LLC, Merrill Lynch, Pierce, Fenner & Smith Incorporated, BTMU, and RBS Citizens, N.A. and Wells Fargo Securities, LLC,, as joint lead arrangers and joint bookrunners, which was amended on September 30, 2011 (as amended, the “Amended and Restated 2011 Credit Agreement”).bookrunners. The Original 2011 Credit Agreement provided for borrowings up to $1 billion, consisting of (1) a five-year $750 million revolving credit facility (the “Revolving Credit Facility”), and (2) a five-year $250 million term loan facility (the “Term Loan Facility”). Under the Revolving Credit Facility, we were permitted to draw up to the U.S. dollar equivalent of $300 million in Canadian dollars, pounds sterling, euros, and other agreed-upon currencies. The Original 2011 Credit Agreement also provided for (a) the issuance of up to $75 million of letters of credit under the Revolving Credit Facility in agreed-upon currencies, (b) the issuance of up to $25 million of swing line loans under the Revolving Credit Facility, and (c) the opportunity to increase the amount of the Revolving Credit Facility or obtain incremental term loans up to $400 million. Outstanding letters of credit and swing line loans are taken into account when determining availability under the Revolving Credit Facility. We used the initial proceeds from the Original 2011 Credit Agreement to pay off outstanding amounts of $591.1 million under the 2007 Credit Agreement.The Amended and Restated 2011 Credit Agreement retains mostmany of the terms of the OriginalCompany's amended and restated credit agreement dated September 30, 2011 (the “Original Credit AgreementAgreement”) while also modifying certain terms to (1) provide an additional term loan facility of upextend the maturity date by approximately two years to $200 million (“New Term Loan Facility”);May 3, 2018; (2) increase the total availability under the Revolving Credit Facility by $200 millionAgreement from $1.4 billion to $950 million (the increase was applied to$1.8 billion (composed of $1.2 billion in the revolving credit facility's multicurrency component, $150 million in the revolving credit facility's US dollar component, and $450 million of the Revolving Credit Facility, thus increasing the foreign currency availability to $500 million from $300 million)term loans); (3) increase the amount of letters of credit that may be issued under the Revolving Credit Facilityrevolving credit facility to $125$150 million from $75$125 million; (4) raise the amount of the swing line loans available under the revolving credit facility to $50 million from $25 million; (5) increase the maximum net leverage ratio covenant; (6) add certain subsidiaries as additional borrowers under the Revolving Credit Facility;(5)(7) make other immaterial or clarifying modifications and amendments to the terms of the Original 2011 Credit Agreement. The Amended and Restated 2011 Credit Agreement maintains our opportunityallows the Company to increase the amount of the Revolving Credit Facilityrevolving credit facility or obtain incremental term loans up to the greater of $400 million. Wemillion or the amount that may be borrowed while maintaining a senior secured leverage ratio of less than or equal to 2.50 to 1.00, subject to the agreement of the lenders. The proceeds of the Credit Agreement were used the initial proceeds from a drawto repay amounts outstanding under the increased RevolvingOriginal Credit Facility for the acquisition of ECP in October 2011, as discussed in more detail in Note 9, “Business Combinations.” As of December 31, 2011, we had not drawn any amounts under the New Term Loan Facility, but in January 2012, we borrowed the full $200 million available under the New Term Loan Facility, which we usedAgreement, to pay down a portion of our Revolving Credit Facility borrowings.The obligations underfees related to the Amendedamendment and Restated 2011 Credit Agreement are unconditionally guaranteed by our directrestatement, and indirect domestic subsidiaries and certain foreign subsidiaries. Obligations under the Amended and Restated 2011 Credit Agreement, including the related guarantees, are collateralized by a security interest and lien on a majority of the existing and future personal property of, and a security interest in 100% of our equity interest in, each of our existing and future direct and indirect domestic and foreign subsidiaries, provided that if a pledge of 100% of a foreign subsidiary’s voting equity interests gives rise to an adverse tax consequence, such pledge shall be limited to 65% of the voting equity interest of the first tier foreign subsidiary. In the event that we obtain and maintain certain ratings from S&P (BBB- or better, with stable or better outlook) or Moody’s (Baa3 or better, with stable or better outlook), and upon our request, the security interests in and liens on the collateral described above shall be released. In October 2011, Moody’s and S&P affirmed our credit ratings at Ba2 and BB+, respectively, with a stable outlook.Revolving Credit Facility will berevolving credit facility are due and payable upon maturity of the Amended and Restated 2011 Credit Agreement in March 2016.on May 3, 2018. Amounts under the Term Loan Facilityinitial and additional term borrowings are due and payable in71quarterly installments, with the annual payments equal to 5% of the original principal amount in the first and second years, 10% of the original principal amount in the third and fourth years, and 15% of the original principal amount in the fifth year. The remaining balance under the Term Loan Facility will be due and payable on the maturity date of the Amended and Restated 2011 Credit Agreement. Amounts under the New Term Loan Facility will be due and payable in quarterly installments equal to 1.25% of the original principal amount atbeginning on September 30, 2013 with the end of each of the eight quarters subsequent to the first quarter of 2012, 2.5% at the end of each of the following eight quarters, and 3.75% each quarter thereafter. The remaining balance under the New Term Loan Facility will be due and payable on the maturity date of the Amended and Restated 2011 Credit Agreement. We are required to prepay the Term Loan Facility and the New Term Loan Facilityterm loan by amounts equal to proceeds from the sale or disposition of certain assets if the proceeds are not reinvested within twelve months. We also have the option to prepay outstanding amounts under the Amended and Restated 2011 Credit Agreement. Amended and Restated 2011 Credit Agreement contains customary representations and warranties, and contains customary covenants that provide limitations and conditions on our ability to among other things (i) incur indebtedness, (ii) incur liens, (iii) enter into any merger, consolidation, amalgamation, or otherwise liquidate or dissolve the Company, (iv) dispose of certain property, (v) make dividend payments, repurchase our stock, or enter into derivative contracts indexed to the value of our common stock, (vi) make certain investments, including the acquisition of assets constituting a business or the stock of a business designated as a non-guarantor, (vii) make optional prepayments of subordinated debt, (viii) enter into sale-leaseback transactions, (ix) issue preferred stock, redeemable stock, convertible stock or other similar equity instruments, and (x) enter into hedge agreements for speculative purposes or otherwise not in the ordinary course of business.transactions. The Amended and Restated 2011 Credit Agreement also contains financial and affirmative covenants under which we (i) may not exceed a maximum net leverage ratio of 3.50 to 1.00 (an increase from 3.00 to 1.00 under the Original Credit Agreement), except in connection with permitted acquisitions with aggregate consideration in excess of $200 million during any period of four consecutive fiscal quarters in which case the maximum net leverage ratio may increase to 3.504.00 to 1.00 for the subsequent four fiscal quarters (an increase from 3.50 to 1.00 under the Original Credit Agreement) and (ii) are required to maintain a minimum interest coverage ratio of 3.00 to 1.00. We were in compliance with all restrictive covenants under the Amended and Restated 2011 Credit Agreement and the 2007 Credit Agreement as of December 31, 2011 and 2010, respectively.The Amended and Restated 2011 Credit Agreement contains events of default that include (i) our failure to pay principal when due or interest, fees, or other amounts after grace periods, (ii) our material breach of any representation or warranty, (iii) covenant defaults, (iv) cross defaults to certain other indebtedness, (v) bankruptcy, (vi) certain ERISA events, (vii) material judgments, (viii) change of control, and (ix) failure of subordinated indebtedness to be validly and sufficiently subordinated.Concurrently with the payment of amounts outstanding under the 2007 Credit Agreement, we incurred a loss on debt extinguishment related to the write off of the unamortized balance of capitalized debt issuance costs of $5.3 million. The amount of the write off excludes debt issuance cost amortization, which is recorded as a component of interest expense. We incurred $8.2 million in fees related to the execution of the Original 2011 Credit Agreement and an additional $2.8 million related to the execution of the Amended and Restated 2011 Credit Agreement. These fees were capitalized within Other Assets on our Consolidated Balance Sheet and are amortized over the term of the agreement. Amended and Restated 2011 Credit Agreement bear interest at variable rates, which depend on the currency and duration of the borrowing elected, plus an applicable margin. The applicable margin is subject to change in increments of 0.25% depending on our totalnet leverage ratio. Interest payments are due quarterly in arrears for the term loans and on the last day of the selected interest period or quarterly in arrears depending on revolver borrowings.the type of borrowing. Including the effect of the interest rate swap agreements described in Note 6, “Derivative5, "Derivative Instruments and Hedging Activities,”" the weighted average interest raterates on borrowings outstanding against the Amended and Restated 2011 Credit Agreement at December 31, 2011 was 2.59%.2013 and 2012 were 3.05% and 2.85%, respectively. We also pay a commitment fee based on the average daily unused amount of the Revolving Credit Facility.revolving credit facility. The commitment fee is subject to change in increments of 0.05% depending on our totalnet leverage ratio. In addition, we pay a participation commission on72totalnet leverage ratio, as well as a fronting fee of 0.125% to the issuing bank, which are due quarterly in arrears. Beginning on December 1, 2011 through January 31, 2012, the date we drew the New Term Loan Facility, we incurred a ticking fee on the unfunded balance of the New Term Loan Facility. The ticking fee is calculated based on variable rates ranging from 0.25% to 0.50%, which are determined based on our total leverage ratio. The ticking fees are payable in arrears on December 31, 2011 and March 31, 2012. Borrowings under the Amended and Restated 2011 Credit Agreement totaled 2011 totaled $901.4 million,2013 and 2012, respectively, of which $12.5$22.5 million was and $31.9 million were classified as current maturities.maturities, respectively. As of December 31, 2011,2013, there were $35.4 million of outstanding letters of credit.credit outstanding in the aggregate amount of $45.6 million. The amounts available under the Revolving Credit Facilityrevolving credit facility are reduced by the amounts outstanding under letters of credit, and thus availability on the Revolving Credit Facilityrevolving credit facility at December 31, 20112013 was $253.9 million. After giving effect$1.1 billion. In January 2014, we increased our borrowings under the Credit Agreement by $370 million in connection with our acquisition of Keystone Specialty, as described in Note 8, "Business Combinations."additional $200execution of the Credit Agreement, we incurred $7.2 million of availabilityfees, of which $6.1 million were capitalized within Other Assets on our Consolidated Balance Sheet and are amortized over the term of the agreement. The remaining $1.1 million of fees were expensed, together with $1.7 million of capitalized debt issuance costs related to the Original Credit Agreement, as a loss on debt extinguishment in our Consolidated Statements of Income for the year ended December 31, 2013.New Term Loan Facility, total availabilitySecurities Act of 1933. The proceeds from the offering were used to repay revolver borrowings under our Credit Agreement, including amounts borrowed to finance our acquisition of Sator in May 2013 as discussed further in Note 8, "Business Combinations," to pay related fees and expenses and for general corporate purposes. The Notes are governed by the Indenture dated as of May 9, 2013 among LKQ Corporation, certain of our subsidiaries (the "Guarantors") and U.S. Bank National Association, as trustee.2011 AmendedSecurities Act of 1933, with terms substantially identical to those of the Notes (except that the exchange notes will not contain terms with respect to additional interest, registration rights, or certain transfer restrictions); (ii) use their commercially reasonable efforts to consummate the exchange offer within 365 days after the issue date of the Notes; and Restated Credit Facility was $453.9 million at December 31, 2011.Borrowings(iii) in certain circumstances, file a shelf registration statement for the resale of the Notes. If the Company and the Guarantors fail to consummate the exchange offer within 365 days of the issue date of the Notes or otherwise fail to satisfy their registration obligations under the 2007 CreditRegistration Rights Agreement, accrued interest at variable rates, which depended onthen the currency and the duration of the borrowing elected, plus an applicable margin. Including the effect of the interest rate swap agreements, the weighted averageannual interest rate on the Notes will increase by 0.25% per annum and by an additional 0.25% per annum for each subsequent 90-day period during which the registration default continues, up to a maximum additional interest rate of 1.0% per annum.2007 Credit Agreement atreceivables facility as of December 31, 2010 was 3.97%.2013. In January 2014, we borrowed the maximum amount of $80 million in connection with our acquisition of Keystone Automotive Holdings, Inc. (“Keystone Specialty”), as described in Note 8, "Business Combinations."paidpay a commitment feesfee on the unused portionexcess of our revolving credit facilities, which ranged from 0.38% to 0.50%the investment maximum over the average daily outstanding investment, payable monthly in arrears. As of December 31, 2012, the interest rate under the receivables facility was based on our total leverage ratio. Borrowings undercommercial paper rates and was 1.05%. During 2012, we also incurred $0.3 million of arrangement fees and other related transaction costs which were capitalized within Other Assets on the 2007 Credit Agreement atConsolidated Balance Sheets and are amortized over the term of the facility. The outstanding balance of $80 million as of December 31, 2010 totaled $590.1 million, of which $50.0 million2012 was classified as current maturities.As part oflong-term on the consideration for business acquisitions completed during 2011, 2010Consolidated Balance Sheets because we have the ability and 2009, we issued promissory notes totaling approximately $34.2 million, $5.5 million and $1.2 million, respectively. The notes bear interest at annual rates of 2.0%intent to 4.0%, and interest is payable at maturity or in monthly installments.Note 6. Derivative Instruments and Hedging ActivitiesNote 5. Derivative Instruments and Hedging Activities debt. With our acquisition of ECP in October 2011, we also usedebt, changing foreign exchange rates for certain short-term foreign currency forward contracts to manage our exposure to variability in foreign currency denominated transactions. We do not attempt to hedge our commodity price risks.transactions and changes in metals prices. We do not hold or issue derivatives for trading purposes.Interest Rate Swaps2011,2013, we had interest rate swap agreements in place to hedge a portion of the variable interest rate risk on our variable rate borrowings under our credit agreement,Credit Agreement, with the objective of minimizing the impact of interest rate fluctuations and stabilizing cash flows. Under the terms of the interest rate swap agreements, we pay the fixed interest rate and have received and will receive payment at a variable rate of interest based on the London InterBank Offered Rate (“LIBOR”)LIBOR or the Canadian Dealer Offered Rate (“CDOR”) for the respective currency of each interest rate swap agreement’s notional amount. The interest rate swap agreements qualify as cash flow hedges, and we have elected to apply hedge accounting for these swap agreements. As a result, the effective portion of changes in the fair value of the interest rate swap agreements is recorded in Accumulated Other Comprehensive Income (Loss) and is reclassified to interest expense when the underlying interest payment has an impact on earnings. The ineffective portion of changes in the fair value of the interest rate swap agreements is reported in interest expense.73termsnotional amounts and fair values of our designated cash flow hedges of December 31, 2013 (in thousands): Notional Amount Fair Value at December 31, 2013 (USD) Fair Value at December 31, 2012 (USD) December 31, 2013 December 31, 2012 Other Accrued Expenses Other Noncurrent Liabilities Other Accrued Expenses Other Noncurrent Liabilities Interest rate swap agreements USD denominated $ 420,000 $ 520,000 $ — $ 8,099 $ 705 $ 12,791 GBP denominated £ 50,000 £ 50,000 — 345 — 2,135 CAD denominated C$ 25,000 C$ 25,000 — 26 — 12 Foreign currency forward contracts EUR denominated € 149,976 — 11,632 — — — GBP denominated £ 70,000 — 10,186 — — — Total cash flow hedges $ 21,818 $ 8,470 $ 705 $ 14,938 agreementscontracts, which expired in October 2013, no longer being designated as of December 31, 2011:Notional AmountEffective DateMaturity DateFixed Interest Rate*USD $250,000,000October 14, 2010October 14, 20153.06%USD $100,000,000April 14, 2011October 14, 20132.61%USD $60,000,000November 30, 2011October 31, 20162.70%USD $60,000,000November 30, 2011October 31, 20162.69%USD $50,000,000December 30, 2011December 30, 20162.69%GBP £50,000,000November 30, 2011October 30, 20162.86%CAD $25,000,000December 30, 2011March 24, 20162.92%*Includes applicable margin of 1.50% per annum on LIBOR or CDOR-based debt in effect as of December 31, 2011 under the Amended and Restated 2011 Credit Agreement.On March 25, 2011, Deutsche Bank AG, the former counterparty on our $100 million notional amount interest rate swap, assigned its obligation under the swap contract to Bank of America N.A because Deutsche Bank AG was not a secured lender under the Amended and Restated 2011 Credit Agreement. We believe Bank of America N.A. is creditworthy to perform its obligation as the counterparty to the swap.As of December 31, 2011, the fair market values of these swap contracts was a liability of $10.6 million included in Other Noncurrent Liabilities on our Consolidated Balance Sheet. As of December 31, 2010, we held the $250 million notional amount swap and the $100 million notional amount swap. The fair market value of these contracts was an asset of $4.8 million included in Other Assets. At December 31, 2010, we also held a $200 million notional amount swap that was a liability of $1.4 million included in Other Accrued Expenses.The activity related to our interest rate swap agreements is as follows (in thousands): Year Ended December 31, 2011 2010 2009 $ (19,391 ) $ 3,230 $ (7,994 ) (5,641 ) (10,377 ) (11,595 ) (225 ) — — In connection with the execution of the Original 2011 Credit Agreement on March 25, 2011 as discussed in Note 5, “Long-Term Obligations,” we temporarily experienced differences in critical terms between the interest rate swaps and the underlying debt.effective cash flow hedge. As a result, we incurred a lossexperienced an immaterial amount of $0.2 millionhedge ineffectiveness during the year ended December 31, 2013. Hedge ineffectiveness related to hedge ineffectiveness in 2011. Beginning on April 14, 2011, we have held, andour foreign currency forward contracts was immaterial to our results of operations during 2013. We do not expect to continue to hold through the maturity of the respective interest rate swap agreements, at least the notional amount of each agreement in the respective variable-rate debt, such that future ineffectiveness will be immaterial and the swaps will continuerelated to be highly effective in hedging our variable rate debt.2011,2013, we estimate that $3.4$4.0 million of derivative losses (net of tax) included in Accumulated Other Comprehensive Income (Loss) will be reclassified into interest expenseour Consolidated Statements of Income within the next 12 months.Foreign Currency Forward ContractsIn orderthe risk of changes in exchange rates associated with certain foreign currency transactions in our European operations, such as ourexposure to variability related to purchases of inventory denominatedinvoiced in a non-functional currency other than the pound sterling, we have entered into short-term foreign currency forward contracts. Asand to metals prices in certain of December 31, 2011, we had nine contracts outstanding to purchase up to €10.4 million for £8.8 million and two contracts to purchase $1.5 million for £0.9 million, all of which expire during the first half of 2012. These contracts are74adjusted to fair value each balance sheet date. As weour operations. We have elected not to apply hedge accounting for these transactions, and thereforechanges incontracts are adjusted to fair value are recordedthrough our results of operations as of each balance sheet date, which could result in Other Income, net.volatility in our earnings. The notional amount and fair value of these contracts at December 31, 20112013 and 2012, along with the effect on our results of operations for the year ended December 31, 2011in 2013 and 2012, were immaterial.Note 7.Note 6. Fair Value Measurements Measurementsthere were no changes in valuation techniques during the year ended December 31, 2011. The tables below present information about our2013, there were no significant changes in valuation techniques or inputs related to the financial assets andor liabilities that are measuredwe have historically recorded at fair value on a recurring basisvalue. During the year ended December 31, 2013, we entered into several foreign currency forward contracts as described in Note 5, "Derivative Instruments and indicate theHedging Activities," which are recorded at fair value hierarchy of the valuation techniques we utilized to determine such fairmarket value. The tiers in the fair value hierarchy include: Level 1, defined as observable inputs such as quoted market prices in active markets; Level 2, defined as inputs other than quoted prices in active markets that are either directly or indirectly observable; and Level 3, defined as unobservable inputs in which little or no market data exists, therefore requiring an entity to develop its own assumptions. Balance as of December 31, 2013 Fair Value Measurements as of December 31, 2013 Level 1 Level 2 Level 3 Assets: Cash surrender value of life insurance $ 25,745 $ — $ 25,745 $ — Total Assets $ 25,745 $ — $ 25,745 $ — Liabilities: Contingent consideration liabilities $ 55,653 $ — $ — $ 55,653 Deferred compensation liabilities 25,232 — 25,232 — Foreign currency forward contracts 21,818 21,818 Interest rate swaps 8,470 — 8,470 — Total Liabilities $ 111,173 $ — $ 55,520 $ 55,653 Balance as of December 31, 2012 Fair Value Measurements as of December 31, 2012 Level 1 Level 2 Level 3 Assets: Cash surrender value of life insurance $ 19,492 $ — $ 19,492 $ — Total Assets $ 19,492 $ — $ 19,492 $ — Liabilities: Contingent consideration liabilities $ 90,009 $ — $ — $ 90,009 Deferred compensation liabilities 19,843 — 19,843 — Interest rate swaps 15,643 — 15,643 — Total Liabilities $ 125,495 $ — $ 35,486 $ 90,009 the interest rate swapsour derivative instruments using a third party valuation model that performs a discounted cash flow analysis based on the terms of the contracts and market observable inputs such as LIBORcurrent and forward interest rates and current and forward foreign exchange rates. We determinedfair valueterms of the contingent consideration obligations usingagreements, payments may be made at specified future dates depending on the income approach. The key assumptions used in determining the fair value are the projected resultsperformance of the acquired business and our assessment ofsubsequent to the probabilities surroundingacquisition. The liabilities for these payments are classified as Level 3 liabilities because the achievement of targets detailed in the respective agreements, which are used to determine the estimated undiscounted cash payments, and a discount rate that approximates our debt credit rating. Therelated fair value measurement, which is based upondetermined using an income approach, includes significant inputs not observable in the market. These unobservable inputs include internally-developed assumptions of the probabilities of achieving specified targets, which are used to determine the resulting cash flows and the applicable discount rate. Our Level 3 fair value measurements are established and updated quarterly by our corporate accounting department using current information about these key assumptions, with the input and oversight of our operational and executive management teams. We evaluate the performance of the business during the period compared to our previous expectations, along with any changes to our future projections, and update the estimated cash flows accordingly. In addition, we consider changes to our cost of capital and changes to the probability of achieving the earnout payment targets when updating our discount rate on a quarterly basis. December 31, 2013 2012 Unobservable Input (Weighted Average) Probability of achieving payout targets 70.6 % 79.7 % Discount rate 6.5 % 6.6 % valuevalues of the obligationliabilities are recorded in Change in Fair Value of Contingent Consideration Liabilities within Other Expense (Income) on our Consolidated Statements of Income.The following tables present information about our financial assets and liabilities measured at fair value on a recurring basis as of December 31, 2011 and 2010 (in thousands): Balance as
of December 31,
2011 Fair Value Measurements as of December 31, 2011 Level 1 Level 2 Level 3 $ 13,413 $ — $ 13,413 $ — $ 13,413 $ — $ 13,413 $ — $ 82,382 $ — $ — $ 82,382 14,071 — 14,071 — 10,576 — 10,576 — $ 107,029 $ — $ 24,647 $ 82,382 75 Balance as
of December 31,
2010 Fair Value Measurements as of December 31, 2010 Level 1 Level 2 Level 3 $ 10,517 $ — $ 10,517 $ — 4,815 — 4,815 — $ 15,332 $ — $ 15,332 $ — $ 11,245 $ — $ 11,245 $ — 2,000 — — 2,000 1,416 — 1,416 — $ 14,661 $ — $ 12,661 $ 2,000 The cash surrender value of life insurance and deferred compensation liabilities are included in Other Assets and Other Noncurrent Liabilities, respectively, on our Consolidated Balance Sheets. The contingent consideration liabilities are classified as a separate line item in noncurrent liabilities except for $0.6 million and $0.5 million as of December 31, 2011 and 2010, respectively, which are included in Other Accrued Expenses on our Consolidated Balance Sheets as they are expected to be paid in the next 12 month period.Level 3 contingent consideration obligations are as follows: $ — 2,000 $ 2,000 81,239 (1,408 ) 551 $ 82,382 Balance as of January 1, 2012 $ 82,382 Contingent consideration liabilities recorded for business acquisitions 5,456 Payments (3,100 ) Increase in fair value included in earnings 1,643 Exchange rate effects 3,628 Balance as of December 31, 2012 $ 90,009 Contingent consideration liabilities recorded for business acquisitions 3,854 Payments (39,117 ) Increase in fair value included in earnings 2,504 Exchange rate effects (1,597 ) Balance as of December 31, 2013 $ 55,653 Note 8. Commitments and ContingenciesNote 7. Commitments and Contingencies 20112013 are as follows (in thousands): $ 84,977 77,306 66,013 56,116 43,179 123,137 $ 450,728 Years ending December 31: 2014 $ 114,405 2015 103,038 2016 85,821 2017 68,173 2018 54,550 Thereafter 220,358 Future Minimum Lease Payments $ 646,345 $83.7$122.4 million $66.9, $101.1 million and $57.2$83.7 million during the years ended December 31, 2011, 20102013, 2012 and 2009,2011, respectively.762011,2013, our portion of the guaranteed residual value would have totaled approximately $35.7 million.$24.6 million. We have not recorded a liability for the guaranteed residual value of equipment under operating leases as the recovery on disposition of the equipment under the leases is expected to approximate the guaranteed residual value.In December 2005 and May 2008, Ford Global Technologies, LLC filed complaints with the International Trade Commission against us and others alleging that certain aftermarket parts imported into the U.S. infringed on Ford design patents. The parties settled these matters in April 2009 pursuant to a settlement arrangement that was scheduled to expire in September 2011. In July 2011, we entered into a new agreement with Ford (which became effective October 1, 2011) to continue our arrangement through March 2015 with substantially the same terms as the 2009 agreement. Pursuant to the settlement, we (and our designees) became the sole distributor in the U.S. of aftermarket automotive parts that correspond to Ford collision parts that are covered by a U.S. design patent. We paid Ford an upfront fee at the commencement of both the 2009 and 2011 agreements for these rights and pay a royalty for each such part we sell. The amortization of the upfront fee and the royalty expenses are reflected in Cost of Goods Sold on the accompanying Consolidated Statements of Income.In JanuaryDuring 2012, we reached a settlementrecognized gains totaling $17.9 million resulting from settlements with onecertain of the defendants. These gains were recorded as a reduction of Cost of Goods Sold on our Consolidated Statements of Income. The class action is still pending against two defendants, and a settlement with the other vendors is subject to court approval. Our recovery isresults of which are not expected to be approximately $15 million in the aggregate, netmaterial to our results of legal fees. We will recognize the gains from these settlements when substantially all uncertainties regarding the timing and the amount of the settlements are resolved. other contingencies resulting from litigation, claims and other commitments and are subject to a variety of environmental and pollution control laws and regulations incident to the ordinary course of business. We currentlyNote 9. Business CombinationsNote 8. Business Combinations October 3, 2011, LKQ Corporation, LKQ Euro Limited (“LKQ Euro”),May 1, 2013, we acquired the shares of Sator, a subsidiaryvehicle mechanical aftermarket parts distribution company based in the Netherlands, with operations in the Netherlands, Belgium and Northern France. With the acquisition of LKQ Corporation, and Draco Limited (“Draco”) enteredSator, we expanded our geographic presence in the European vehicle mechanical aftermarket products market into an Agreementcontinental Europe to complement our existing U.K. operations. Total acquisition date fair value of the consideration for the Saleacquisition of Sator was €209.8 million ($272.8 million) of cash, net of cash acquired. We recorded $142.7 million of goodwill related to our acquisition of Sator, which we do not expect will be deductible for income tax purposes. In the period between May 1, 2013 and PurchaseDecember 31, 2013, Sator generated approximately $265.1 million of Sharesrevenue and $7.3 million of Euro Car Parts Holdings Limited (the “Salenet income.Purchase Agreement”). Under the terms of the Sale and Purchase Agreement, effective October 1, 2011, LKQ Euro acquired all of the shares in the capital of ECP, an2 self service retail operations. Our European acquisitions included five automotive aftermarket products distributorpaint distribution businesses in the U.K., from Dracowhich enabled us to expand our collision product offerings. Our other acquisitions completed during 2013 enabled us to expand into new product lines and enter new markets. Total acquisition date fair value of the consideration for these additional 2013 acquisitions was $146.1 million, composed of $134.6 million of cash (net of cash acquired), $7.5 million of notes payable, $0.2 million of other shareholderspurchase price obligations (non-interest bearing) and $3.9 million for the estimated value of ECP. Withcontingent payments to former owners (with maximum potential payments totaling $5.0 million). During the year ended December 31, 2013, we recorded $92.7 million of goodwill related to these acquisitions and immaterial adjustments to preliminary purchase price allocations related to certain of our 2012 acquisitions. We expect $18.3 million of the $92.7 million of goodwill recorded to be deductible for income tax purposes. In the period between the acquisition dates and December 31, 2013, these acquisitions generated $108.5 million of revenue and $3.7 million of net income.ECP,a U.S. based distributor of automotive cores as well as new and remanufactured mechanical automotive replacement parts. We believe this acquisition will expand our core and remanufactured product mix, and will allow us to expand our product offering to include certain parts also purchased by OEMs. In February 2014, we have expandedacquired a wholesale salvage operation and a self service operation in North America, which we believe will expand our market share in the respective markets.beyond North Americaand enter new markets. Additionally, two of our acquisitions were completed with a goal of improving the recovery from scrap and other metals harvested from the vehicles we purchase: a precious metals refining and reclamation business and a scrap metal shredder. Total acquisition date fair value of the consideration for the 2012 acquisitions was $284.6 million, composed of $261.5 million of cash (net of cash acquired), $16.0 million of notes payable, $1.6 millionof other purchase price obligations (non-interest bearing) and$5.5 million of contingent payments to former owners. The contingent consideration arrangements made in connection with our 2012 acquisitions have maximum potential payouts totaling $6.5 million. During the year ended December 31, 2012, we recorded $197.6 million of goodwill related to these acquisitions and immaterial adjustments to preliminary purchase price allocations related to certain of our 2011 acquisitions. We expect $157.8 million of the $197.6 million of goodwill recorded to be deductible for income tax purposes.market. Ourautomotive aftermarket business through our acquisition of ECP established our Wholesale – Europe operating segment.ECP. ECP's product offerings are primarily focused on automotive aftermarket mechanical products, many of which are sourced from the same suppliers that provide products to the OEMs. Total acquisition date fair value of the consideration for the ECP acquisition was £261.6 million ($($403.7 million)million), composed of £190.3 million ($($293.7 million)million) of cash (net of cash acquired), £18.4 million ($($28.3 million)million) of notes payable, £2.7 million ($($4.1 million)million) of other purchase pricea contingent paymentpayments of up to £55 million to the former owners of ECP. Under the contingent consideration agreement,ECP if certain annual EBITDAperformance targets arewere met we may pay between £22 million and £25 million and between £23 million and £30 million forin the years endingended December 31, 20122013 and 2013, respectively.2012. We have assesseddetermined the acquisition date fair value of these contingent payments to be £50.2 million ($($77.5 million at the exchange rate on October 3, 2011). For all subsequent reporting periods untilAs discussed in Note 6, "Fair Value Measurements," we made the contingency is resolved,full payment related to the 2012 performance period, and in the first quarter of 2014, we will reassessmake the fair value of this contingentfull payment and any changes in fair value will be recognized in our Consolidated Statements of Income. There was not a material change inrelated to the assessed fair value of the contingent payment between October 3, 2011 and December 31, 2011.77$337.0 In the period between October 1, 2011 and December 31, 2011, ECP generated approximately $138.5 million of revenue and $10.1 million of operating income.madecompleted 20 acquisitions in North America in 2011 (12(17 wholesale businesses five recycled heavy-duty truck products businesses and three3 self service retail operations). Our acquisitions included the purchase of two engine remanufacturers, which expanded our presence in the remanufacturing industry that we entered in 2010. Additionally, our acquisition of an automotive heating and cooling component distributor supplements our expansion into the automotive heating and cooling aftermarket products market. Our North American wholesale business acquisitions also included the purchase of the U.S. vehicle refinish paint distribution business of Akzo Nobel Automotive and Aerospace Coatings (the “Akzo Nobel paint business”), which allowed us to increase our paint and related product offerings, and expand our geographic presence in the automotive paint market. Our other 2011 acquisitions enabled us to expand our geographic presence and enter new markets.$207.3$193.2$193.2 million of cash (net of cash acquired), $5.9$5.9 million of notes payable, $4.5$4.5 million of other purchase price obligations (non-interest bearing) and $3.7$3.7 million of contingent payments to former owners. In conjunction with the acquisition of the Akzo Nobel paint business on May 26, 2011, we entered into a wholesaler agreement under which we became an authorized distributor of Akzo Nobel products in the acquired markets. Included in this agreement is a requirement to make an additional payment to Akzo Nobel in the event that our purchases of Akzo Nobel product do not meet specified thresholds from June 1, 2011 to May 31, 2014. This contingent payment will be calculated as the difference between our actual purchases and the targeted purchase levels outlined in the agreement for the specified period with a maximum payment of $21.0 million. The contingent consideration liability recorded in 2011 also includes two additional arrangements that have a maximum potential payout of $4.6 million. The acquisition date fair value of these contingent consideration agreements is immaterial.$105.2$88.3$88.3 million is expected to be deductible for income tax purposes. In the period between the acquisition dates and December 31, 2011, these 20 acquisitions generated approximately $189.8 million of revenue and $9.1 million of operating income.In 2010, we made 20 acquisitions in North America (16 wholesale businesses, one recycled heavy-duty truck products business, two self service retail operations and one tire recycling business). included the purchase of an engine remanufacturer, which allowed us to further vertically integrate our supply chain. We expanded our product offerings through the acquisition of an automotive heating and cooling component business, as well as a tire recycling business. Our 2010 acquisitions have also enabled us to expand our geographic presence, most notably in Canada through our purchase of Cross Canada, an aftermarket product supplier.Total acquisition date fair value of the consideration for the 2010 acquisitions was $170.4 million, composed of $143.6 million of cash (net of cash acquired), $5.5 million of notes payable, $4.4 million of other purchase price obligations (non-interest bearing), $2.0 million of contingent payments to former owners and $14.9 million in stock issued (689,655 shares). The fair value of the contingent payment was adjusted downward by $2.0 million in 2011 as a result of changes in the likelihood of meeting the specified performance targets. This adjustment was included in Change in Fair Value of Contingent Consideration Liabilities on our Consolidated Statements of Income for the year ended December 31, 2011. The $14.9 million of common stock was issued in connection with our acquisition of Cross Canada on November 1, 2010. The fair value of common stock issued was based on the market price of LKQ stock on the date of issuance. We recorded goodwill of $91.8 million for the 2010 acquisitions, of which $74.9 million is expected to be deductible for income tax purposes.78On October 1, 2009, we acquired Greenleaf Auto Recyclers, LLC (“Greenleaf”) from SSI for $38.8 million, net of cash acquired. Greenleaf is the entity through which SSI operated its wholesale recycling business. We recorded a gain on bargain purchase for the Greenleaf acquisition totaling $4.3 million in our results of operations for 2009. We believe that we were able to acquire Greenleaf for less than the fair value of its assets because of (i) our unique position as market leader in the wholesale recycled auto products market and (ii) SSI’s intent to exit its Greenleaf operations. Greenleaf generally was an unprofitable venture throughout its history, which included several different ownership groups, and SSI approached us in an effort to sell Greenleaf and exit the wholesale recycled auto products business that no longer fit its strategy. With SSI’s intent to exit the wholesale recycled auto products business and our position as the market leader, we were able to agree on a favorable purchase price. We finalized the valuation of acquired inventory, accrued liabilities and deferred taxes in 2010. As a result, we identified certain immaterial adjustments to the opening balance sheet, which were recorded through the results of operations in 2010.Also in 2009, we acquired four North American wholesale businesses and three recycled heavy-duty truck products businesses. The aggregate acquisition date fair value of the consideration for these seven businesses totaled approximately $29.5 million in cash, net of cash acquired, and $1.2 million of debt issued.The acquisitions are being accounted for under the purchase method of accounting and are included in our consolidated financial statements from the dates of acquisition. The purchase prices were allocated to the net assets acquired based upon estimated fair market values at the dates of acquisition. In connection with the 2011of thereceivables, inventories and fixed assets acquired; 2) valuation amounts for certain intangible assets acquired; 3) the acquisition date fair value of certain liabilities assumed; and 4) the final estimation of the tax basis of the entities acquired.20112013 and 20102012 are as follows (in thousands): December 31, 2011 2010
(Final) ECP
(Preliminary) Other Acquisitions
(Preliminary) Total
(Preliminary) $ 54,225 $ 23,538 $ 77,763 $ 27,774 (3,832 ) (1,121 ) (4,953 ) (2,186 ) 93,835 59,846 153,681 38,121 3,189 2,820 6,009 1,480 41,830 10,614 52,444 18,517 337,031 105,177 442,208 91,757 39,583 7,683 47,266 6,163 13 9,420 9,433 1,529 (13,218 ) 7,235 (5,983 ) 2,922 (135,390 ) (17,257 ) (152,647 ) (15,665 ) (13,564 ) — (13,564 ) — — (619 ) (619 ) — (77,539 ) (3,700 ) (81,239 ) (2,000 ) (4,136 ) (4,510 ) (8,646 ) (4,359 ) (28,302 ) (5,917 ) (34,219 ) (5,530 ) — — — (14,945 ) $ 293,725 $ 193,209 $ 486,934 $ 143,578 79 Year Ended December 31, 2013 (Preliminary) Year Ended Sator Other Acquisitions Total December 31, 2012 Receivables $ 61,639 $ 38,685 $ 100,324 $ 15,473 Receivable reserves (8,563 ) (3,246 ) (11,809 ) (1,459 ) Inventory 71,784 26,455 98,239 62,305 Prepaid expenses and other current assets 7,184 1,933 9,117 201 Property and equipment 19,484 14,015 33,499 31,930 Goodwill 142,721 92,726 235,447 201,742 Other intangibles 45,293 12,353 57,646 655 Other assets 2,049 1,251 3,300 187 Deferred income taxes (14,100 ) (564 ) (14,664 ) 428 Current liabilities assumed (49,593 ) (36,799 ) (86,392 ) (22,910 ) Debt assumed — (664 ) (664 ) (3,989 ) Other noncurrent liabilities assumed (5,074 ) — (5,074 ) — Contingent consideration liabilities — (3,854 ) (3,854 ) (5,456 ) Other purchase price obligations — (214 ) (214 ) (1,647 ) Notes issued — (7,482 ) (7,482 ) (15,990 ) Cash used in acquisitions, net of cash acquired $ 272,824 $ 134,595 $ 407,419 $ 261,470 2011, 20102013, 2012 and 20092011 was to leverage our strategy of becoming a one-stop provider for alternative vehicle replacement products. These acquisitions enabled us to expand our market presence, expand our product offerings and enter new markets. These factors contributed to purchase prices that included, in many cases, a significant amount of goodwill.Most notably, our acquisition of ECP in 2011 marksmarkets, including our entry into the European automotive aftermarket business, whichmarket beginning in 2011 with our purchase of ECP. Our acquisition of ECP provides an opportunity to us as thatthe European automotive market has historically had a low penetration of alternative collision parts. Additionally,By acquiring ECP, is a leading distributor of alternative automotive products, reaching most major marketswe were able to gain access to the European market in U.K., with a developed distribution network, experienced management team and established workforce. These factorsworkforce, contributed to the $337$332.9 million of goodwill recognized related to this acquisition.yearsyear ended December 31, 2011 and 20102013 as though the businesses had been acquired as of January 1, 2010,2012, the businesses acquired during the year ended December 31, 2012 as though they had been acquired as of January 1, 2011 and isthe businesses acquired during the year ended December 31, 2011 as though they had been acquired as of January 1, 2010. The pro forma adjustments are based upon unaudited financial information of the acquired entities (in thousands, except per share data): Year ended December 31, 2011 2010 $ 3,269,862 $ 2,469,881 407,042 420,769 127,275 504,044 $ 3,804,179 $ 3,394,694 $ 210,264 $ 167,118 22,266 9,669 6,578 12,996 $ 239,108 $ 189,783 $ 1.44 $ 1.17 0.15 0.07 0.05 0.09 $ 1.64 $ 1.32 $ 1.42 $ 1.15 0.15 0.07 0.04 0.09 $ 1.61 $ 1.30 (a)The sum of the individual earnings per share amounts may not equal the total due to rounding. Year Ended December 31, 2013 2012 2011 Revenue, as reported $ 5,062,528 $ 4,122,930 $ 3,269,862 Revenue of purchased businesses for the period prior to acquisition: Sator 126,309 369,934 — ECP — — 407,042 Other acquisitions 130,093 440,938 466,002 Pro forma revenue $ 5,318,930 $ 4,933,802 $ 4,142,906 Net income, as reported $ 311,623 $ 261,225 $ 210,264 Net income of purchased businesses for the period prior to acquisition, including pro forma purchase accounting adjustments: Sator 5,293 6,032 — ECP — — 21,858 Other acquisitions 7,591 18,363 27,396 Pro forma net income $ 324,507 $ 285,620 $ 259,518 Earnings per share-basic, as reported $ 1.04 $ 0.88 $ 0.72 Effect of purchased businesses for the period prior to acquisition: Sator 0.02 0.02 — ECP — — 0.07 Other acquisitions 0.03 0.06 0.09 $ 1.08 $ 0.97 $ 0.89 Earnings per share-diluted, as reported $ 1.02 $ 0.87 $ 0.71 Effect of purchased businesses for the period prior to acquisition: Sator 0.02 0.02 — ECP — — 0.07 Other acquisitions 0.02 0.06 0.09 $ 1.07 $ 0.95 $ 0.87 periodperiods presented or of future results.80Note 10. Note 9. Restructuring and Acquisition Related Expenses Akzo Nobel Paint Business IntegrationWithAkzo Nobel paintyear endedDecember 31, 2013, we incurred $2.1 million of restructuring expenses related to the integration of certain of our 2013 European acquisitions. These integration activities included the closure of duplicate facilities, termination of employees in connection with the consolidation of overlapping facilities with our existing business, and moving expenses. Future expenses to complete these integration plans in the second quarterfirst half of 2014, including expenses for additional closures of overlapping facilities and termination of duplicate headcount, are not expected to exceed $1 million.we initiated certaintotaled $1.2 million and $4.4 million, respectively. Of the expenses incurred in 2011, $2.6 million related to restructuring activities to integrate the Akzo Nobel acquired paint distribution locations into our existing business.business, including primarily charges for excess facility costs, which were expensed at the cease-use date for the facilities. Our restructuring plan included the closure of duplicate facilities, elimination of overlapping delivery routes and termination of employees in connection with the consolidation of the overlapping facilities and delivery routes. During the year ended December 31, 2011, we incurred $2.6 million of charges primarily related to excess facility costs, which were expensed at the cease-use date for the facilities. While we haveWe substantially completed the integration activities related to the Akzo Nobel paint business acquisition as of December 31, 2011,2011.may record adjustmentsinitiated a restructuring plan to improve the operational efficiency of our refurbished product operations and to reduce the cost structure of the related excess facility reserves if we determine revisions are required torefurbished bumper and wheel product lines. As part of the underlying assumptions.Cross Canada IntegrationWe undertook certain restructuring activities in connection with our acquisition of Cross Canada in the fourth quarter of 2010. The restructuring plan, we consolidated certain of our bumper and wheel refurbishing operations, with a focus on increasing output at the remaining operations to improve economies of scale. Restructuring costs included the integrationwrite off of our existing Canadian aftermarket operations into the Cross Canada business, as well as the transitiondisposed assets, severance costs for termination of certain corporate functions to our corporate headquarters and our field support center in Nashville. Based on our analysis of the overlapping facilities, we identified aftermarket warehouses and corporate locations that were closed in order to eliminate duplicate facilities. Related to the facilities that will be closed, we terminated certain personnel including drivers, other facility personnel and corporate employees. During the year ended December 31, 2011, we incurred $1.4 million related to these integration efforts, including $1.2 million for facility closure and movingheadcount, costs and $0.2 million for severance and benefits for terminated employees. The restructuring activities related to the Cross Canada acquisition were substantially completed in 2011.Greenleaf IntegrationIn 2009, we commenced restructuring and integration efforts in connection with our acquisition of Greenleaf on October 1, 2009. The restructuring plan included the integration of the acquired Greenleaf operations into our existing salvage business, which resulted in the combination or closure of duplicate facilities and delivery routes. Restructuring and integration expenses associated with the Greenleaf acquisition totaled approximately $0.7 million and $0.6 million for the years ended December 31, 2010 and 2009, respectively. These charges reflected costs related to the closure of facilities and severance and related benefits for terminated personnel. The restructuring activities related to the Greenleaf acquisition were substantially completed in 2010.Keystone IntegrationIn 2009, we incurred restructuring and integration expenses associated with our acquisition of Keystone Automotive Industries, Inc. (“Keystone”). The restructuring plan included the integration of our existing aftermarket operations into the Keystone business. For the year ended December 31, 2009, related restructuring charges of $1.9 million included $0.5 million to move inventory between facilitiesequipment and migrate the systems utilized by the LKQ facilities to the Keystone system, $0.5 million of severance and related benefit costs and $0.9 million of excess facility costs. Our Keystone restructuring plan was completed in 2009.Other Restructuring ExpensesIn 2011, we incurred approximately $0.4 million of restructuring expenses resulting from the integration of our other 2010 and 2011 acquisitions into our existing business. The restructuring expenses included primarily excess facility costs, which were expensed at the cease-use date for the facilities, and moving expenses for the closure of duplicate facilities. We expect approximately $0.3 million of additional charges, primarily for moving costsinventory, and excess facility reserves, as we complete our integration plans in 2012.81Acquisition Related ExpensesAcquisition related expenses consist of external costs directly related to our acquisitions, such as closing costs and advisory, legal, accounting, valuation and other professional fees.costs. These costs are expensed as incurred.incurred, when the costs meet the criteria to be accrued, or, in the case of non-performing lease reserves, at the cease-use date of the facility. During the 2011,2012, we incurred $3.2$1.1 million of acquisition related expenses, primarily related to our acquisition of ECP that was effective as of October 1, 2011.Note 11. Retirement Plans401(k) PlanWe sponsor a 401(k) defined contribution plan that covers substantially all of our eligible, full time U.S. employees. Contributions to the plan are made by both the employee and us. Our contributions are based on the level of employee contributions and are subject to certain vesting provisions based upon years of service. Expensesexpense related to this plan totaled approximately $5.3 million, $4.8 million and $3.7 million during 2011, 2010 and 2009, respectively.Nonqualified Deferred Compensation PlanWe also offer a nonqualified deferred compensation plan to eligible employees who, due to Internal Revenue Service (“IRS”) guidelines, may not take full advantage of our 401(k) defined contributionrestructuring plan. The plan allows participants to defer eligible compensation, subject to certain limitations. We will match 50% of the portion of the employee’s contributions that does not exceed 6% of the employee’s eligible deferrals. The deferred compensation, together with our matching contributions and accumulated earnings, is accrued and is payable after retirement or termination of employment, subject to vesting provisions. Participants may also elect to receive amounts deferredThese restructuring activities were substantially completed in a given year on any plan anniversary five or more years subsequent to the year of deferral. Our matching contributions vest over a four year period and totaled $0.8 million, $0.7 million and $0.5 million in 2011, 2010 and 2009, respectively, net of allowable transfers into our 401(k) defined contribution plan. Total deferred compensation liabilities were approximately $14.1 million and $11.2 million at December 31, 2011 and 2010, respectively.The nonqualified deferred compensation plan is funded under a trust agreement whereby we pay to the trust amounts deferred by employees, together with our match, with such amounts invested in life insurance policies carried to meet the obligations under the deferred compensation plan. As of December 31, 2011 and 2010, we held 184 and 166 contracts with a face value of $80.6 million and $72.7 million, respectively. The cash surrender value of these policies was approximately $13.4 million and $10.5 million at December 31, 2011 and 2010, respectively.Note 12. Earnings per ShareNote 10. Earnings Per Share and restricted stock were excluded from the calculation of diluted earnings per share because they were antidilutive, but these equity instruments could be dilutive in the future.82tablechart sets forth the computation of earnings per share (in thousands, except per share amounts): Year Ended December 31, 2011 2010 2009 $ 210,264 $ 167,118 $ 127,137 146,126 143,271 140,541 2,125 2,559 3,438 91 — — 33 27 11 148,375 145,857 143,990 $ 1.44 $ 1.17 $ 0.90 $ 1.42 $ 1.15 $ 0.88 Year Ended December 31, 2013 2012 2011 Net Income $ 311,623 $ 261,225 $ 210,264 Denominator for basic earnings per share—Weighted-average shares outstanding 299,574 295,810 292,252 Effect of dilutive securities: RSUs 845 479 182 Stock options 3,696 4,346 4,250 Restricted stock 16 58 66 Denominator for diluted earnings per share—Adjusted weighted-average shares outstanding 304,131 300,693 296,750 Earnings per share, basic $ 1.04 $ 0.88 $ 0.72 Earnings per share, diluted $ 1.02 $ 0.87 $ 0.71 charttable sets forth the number of employee stock-based compensation awards outstanding but not included in the computation of diluted earnings per share because their effect would have been antidilutive (in thousands): Year Ended December 31, 2011 2010 2009 1,170 2,857 1,398 — 40 — Note 13. Income Taxes Year Ended December 31, 2013 2012 2011 Antidilutive securities: Stock options — — 2,340 Note 11. Income Taxes Year Ended December 31, 2011 2010 2009 $ 97,887 $ 75,009 $ 58,854 14,435 16,552 12,619 3,883 2,483 825 116,205 94,044 72,298 9,302 8,963 5,882 $ 125,507 $ 103,007 $ 78,180 Year Ended December 31, 2013 2012 2011 Current: Federal $ 115,150 $ 110,825 $ 97,887 State 20,869 19,693 14,435 Foreign 23,906 13,202 3,883 $ 159,925 $ 143,720 $ 116,205 Deferred: Federal $ 6,225 $ 5,824 $ 8,376 State (550 ) (647 ) 919 Foreign (1,396 ) (955 ) 7 $ 4,279 $ 4,222 $ 9,302 Provision for income taxes $ 164,204 $ 147,942 $ 125,507 from continuing operations before provision for income taxes (in thousands): Year Ended December 31, 2011 2010 2009 $ 319,305 $ 264,438 $ 202,558 16,466 5,687 2,759 $ 335,771 $ 270,125 $ 205,317 83 Year Ended December 31, 2013 2012 2011 Domestic $ 361,283 $ 348,150 $ 319,305 Foreign 114,544 61,017 16,466 $ 475,827 $ 409,167 $ 335,771 Year Ended December 31, 2011 2010 2009 35.0 % 35.0 % 35.0 % 3.1 3.4 4.1 0.7 0.3 0.5 (0.8 ) (0.3 ) (0.2 ) (0.4 ) (0.2 ) (0.4 ) — (0.5 ) — — — (0.8 ) (0.2 ) 0.4 (0.1 ) 37.4 % 38.1 % 38.1 % We do not provide Year Ended December 31, 2013 2012 2011 U.S. federal statutory rate 35.0 % 35.0 % 35.0 % State income taxes, net of state credits and federal tax impact 2.9 % 3.1 % 3.1 % Impact of international operations (3.7 )% (2.3 )% (0.8 )% Non-deductible expenses 0.9 % 0.8 % 0.7 % Federal production incentives and credits (0.3 )% (0.3 )% (0.4 )% Revaluation of deferred taxes (0.3 )% (0.3 )% — % Other, net 0.0 % 0.2 % (0.2 )% Effective tax rate 34.5 % 36.2 % 37.4 % federal income taxes onhas been provided thereon. Upon repatriation of those earnings, in the undistributed earningsform of dividends or otherwise, the Company would be subject to both U.S. income taxes (subject to adjustment for foreign tax credits) and potential withholding taxes payable to the various foreign countries. Determination of the amount of unrecognized deferred U.S. income tax liability is not practicable due to the complexities associated with its hypothetical calculation; however, unrecognized foreign tax credits would be available to reduce materially any U.S. liability.foreign subsidiaries because such earnings are reinvested and it isexpanding international operations as a larger proportion of our intention that the earnings will be reinvested indefinitely.We had no individually significant discrete items includedpretax income was generated in our 2011 effective tax rate. The 2010 effective taxlower rate included a $1.5 million adjustment related to the revaluation of deferred taxes in connection with a legal entity reorganization in the first quarter. The 2009 effective tax rate included a benefit related to the recognition of a $4.3 million non-taxable gain on a bargain purchase for our acquisition of Greenleaf in October 2009. December 31, 2011 2010 $ 22,267 $ 16,409 18,357 17,379 10,860 9,330 8,945 6,609 5,157 4,422 4,722 4,681 3,679 — 3,260 1,889 1,669 1,657 3,692 2,015 82,608 64,391 (1,911 ) (2,607 ) $ 80,697 $ 61,784 $ 46,373 $ 38,648 44,535 29,049 32,592 23,695 1,864 3,945 $ 125,364 $ 95,337 $ (44,667 ) $ (33,553 ) 84 December 31, 2013 2012 Deferred Tax Assets: Inventory $ 30,880 $ 29,523 Accrued expenses and reserves 29,970 27,361 Stock-based compensation 11,519 9,442 Accounts receivable 11,161 10,037 Qualified and nonqualified retirement plans 10,210 7,476 Net operating loss carryforwards 5,181 4,451 Interest rate swaps 3,070 5,461 Other 4,777 4,711 106,768 98,462 Less valuation allowance (1,092 ) (1,631 ) Total deferred tax assets $ 105,676 $ 96,831 Deferred Tax Liabilities: Goodwill and other intangible assets $ 83,097 $ 64,704 Property and equipment 50,695 48,994 Trade name 40,929 30,336 Other 2,693 1,428 Total deferred tax liabilities $ 177,414 $ 145,462 Net deferred tax liability $ (71,738 ) $ (48,631 ) December 31, 2011 2010 $ 45,690 $ 32,506 1,561 — 88,796 66,059 December 31, 2013 2012 Current deferred tax assets $ 63,938 $ 53,485 Noncurrent deferred tax assets 1,501 164 Current deferred tax liabilities 3,355 5 Noncurrent deferred tax liabilities 133,822 102,275 of $1.6 million wereare included in Other Assets and Other Current Liabilities, respectively, on our Consolidated Balance Sheet as of December 31, 2011.$4.7$5.1 million and $4.5 million at December 31, 20112013 and 2010,2012, respectively. At December 31, 20112013 and 2010,2012, we also had tax credit carryforwards of $1.1 million and $1.0 million, and $1.4 million, respectively, primarily related to certain of our state tax jurisdictions. As of December 31, 20112013 and 2010,2012, a valuation allowance of $1.9$1.1 million and $2.6$1.6 million, respectively, was recognized for a portion of the deferred tax assets related to net operating loss and tax credit carryforwards. The valuation allowance for net operating loss and tax credit carryforwards decreased by $0.7$0.5 million during the year endedDecember 31, 2013 due to current utilization of some of the underlying tax benefits as well as a change in judgment regarding the realization of the remaining carryforwards. The net operating loss carryforwards expire over the period from 20122014 through 2030,2031, while nearly all of the tax credit carryforwards have no expiration. Realization of these deferred tax assets is dependent on the generation of sufficient taxable income prior to the expiration dates. Based on historical and projected operating results, we believe that it is more likely than not that earnings will be sufficient to realize the deferred tax assets for which valuation allowances have not been provided. While we expect to realize the deferred tax assets, net of valuation allowances, changes in estimates of future taxable income or in tax laws may alter this expectation. 2011 2010 2009 $ 5,441 $ 8,526 $ 7,949 952 713 1,811 192 281 483 — (86 ) (90 ) — (2,041 ) — (892 ) (1,952 ) (1,489 ) (196 ) — (138 ) $ 5,497 $ 5,441 $ 8,526 2013 2012 2011 Balance at January 1 $ 2,303 $ 5,497 $ 5,441 Additions based on tax positions related to the current year 348 973 952 Additions for tax positions of prior years 62 167 192 Reductions for tax positions of prior years — (2,379 ) — Lapse of statutes of limitations (872 ) (998 ) (892 ) Settlements with taxing authorities — (957 ) (196 ) Balance at December 31 $ 1,841 $ 2,303 $ 5,497 20112013 and 2010,2012, we havehad accumulated interest and penalties included in gross unrecognized tax benefits of $1.2$0.4 million and $0.6 million, respectively. During the years ended December 31, 2013, 2012, and 2011, $0.1 million, $0.2 million and $1.1 million, respectively. Of these amounts, $0.2 million, wasrespectively, of interest and penalties were recorded through the income tax provision, during each of the years ended December 31, 2011 and 2010, prior to any reversals for lapses in the statutes of limitations. We had a deferred tax assetassets of $0.2$0.1 million and $0.3 million related to the accumulated interest balance as of both December 31, 20112013 and 2010, respectively.2012. The amount of the unrecognized tax benefits, which if resolved favorably (in whole or in part) would reduce our effective tax rate, is approximately $3.8$1.3 million and $1.6 million at both December 31, 20112013 and 2010.2012, respectively. The balance of unrecognized tax benefits at December 31, 20112013 and 20102012 also includes $1.7$0.6 million and $1.6$0.7 million, respectively, of tax benefits that, if recognized, would result in adjustments to deferred taxes.852012,2014, it is reasonably possible that we will reduce gross unrecognized tax benefits by up to approximately $0.6$0.2 million, of which approximately $0.4$0.1 million would impact our effective tax rate, primarily as a result of the expiration of certain statutes of limitations.Tax years after 2007 remainby the IRS. In the U.K.,in our primary tax jurisdictions for tax years through 2009 are no longer open to inquiry. We are currently2009. In the subjectU.S., the Internal Revenue Service has commenced an examination of incomeour U.S. federal consolidated tax audits by various statesreturns for prior2011 and 2012. For certain of our Canadian subsidiaries, tax years as well as an audit of thefrom 2009 tax year by the IRS.to 2012 are under examination. Adjustments from such audits,examinations, if any, are not expected to have a material effect on our consolidated financial statements.Note 14.Note 12. Accumulated Other Comprehensive Income (Loss) The components of accumulated other comprehensive income (loss) are as follows (in thousands): Foreign
Currency
Translation Unrealized Gain
(Loss)
on Pension Plan Unrealized (Loss)
Gain
on Interest Rate
Swaps Accumulated
Other
Comprehensive
Income (Loss) $ (5,067 ) $ 144 $ (8,841 ) $ (13,764 ) 4,191 (211 ) (7,994 ) (4,014 ) — 82 2,878 2,960 — — 11,595 11,595 — — (4,174 ) (4,174 ) (876 ) 15 (6,536 ) (7,397 ) 3,078 — 3,230 6,308 — — (1,054 ) (1,054 ) — (15 ) 10,377 10,362 — — (3,841 ) (3,841 ) 2,202 — 2,176 4,378 (4,273 ) — (19,391 ) (23,664 ) — — 6,847 6,847 — — 5,641 5,641 — — (2,019 ) (2,019 ) — — (225 ) (225 ) — — 81 81 $ (2,071 ) $ — $ (6,890 ) $ (8,961 ) Note 15. Long Term Incentive PlanOn January 26, 2006, Foreign
Currency
Translation Unrealized Gain (Loss)
on Cash Flow Hedges Unrealized Gain
on Pension Plan Accumulated
Other
Comprehensive
Income (Loss)Balance at January 1, 2011 $ 2,202 $ 2,176 $ — $ 4,378 Pretax loss (4,273 ) (19,391 ) — (23,664 ) Income tax effect — 6,847 — 6,847 Reclassification of unrealized loss — 5,641 — 5,641 Reclassification of deferred income taxes — (2,019 ) — (2,019 ) Hedge ineffectiveness — (225 ) — (225 ) Income tax effect — 81 — 81 Balance at December 31, 2011 $ (2,071 ) $ (6,890 ) $ — $ (8,961 ) Pretax income (loss) 12,921 (11,313 ) — 1,608 Income tax effect — 3,962 — 3,962 Reclassification of unrealized loss — 6,439 — 6,439 Reclassification of deferred income taxes — (2,289 ) — (2,289 ) Balance at December 31, 2012 $ 10,850 $ (10,091 ) $ — $ 759 Pretax income (loss) 14,056 (21,250 ) 935 (6,259 ) Income tax effect — 7,984 (234 ) 7,750 Reclassification of unrealized loss — 27,481 — 27,481 Reclassification of deferred income taxes — (10,011 ) — (10,011 ) Hedge ineffectiveness — 460 — 460 Income tax effect — (169 ) — (169 ) Balance at December 31, 2013 $ 24,906 $ (5,596 ) $ 701 $ 20,011 Boardforeign currency forward contracts totaling $21.3 million were reclassified to other expense in our Consolidated Statements of Directors approved, and our stockholders approved at the annual meeting on May 8, 2006, the LKQ Corporation Long Term Incentive Plan. At our annual meeting on May 2, 2011, the stockholders reapproved this plan. The purpose of the Long Term Incentive Plan is to offer certain key employees the opportunity to receive long-term performance rewards. Performance periods begin on January 1 and end on December 31 of the third calendar year thereafter. Performance awards are equal to the participant’s base salary (at the end of the applicable performance period) multiplied by an “Award Percentage.” A participant’s Award Percentage is determined by three components: the growth over the performance period of each of the Company’s earnings per share; total revenue; and return on equity. The Compensation Committee of our Board of Directors determines for each participant the range of Award Percentages based on different growth scenarios of the components. One half of any performance award achieved is payable promptly after the end of the performance period. A participant must be an employee of the Company at the end of the performance period to be eligible for this first payment. The other half of the performance award is deferred and vests in three equal installments on each one year anniversary of the end of the performance period. A participant must be an employee (or in some cases a consultant for us) on each such anniversary date to be eligible for the respective86deferred payment, unless the participant is not an employee as a result of death, total disability or normal retirement at age 65, in which case the participant (or his or her estate) will be entitled to all of the deferred payments upon such death, disability or retirement. Interest on the deferred portion of the performance award accrues at the prime rate and is payable to the participant at the same time as the deferred installments are paid. We have recorded expense related to this plan totaling approximately $3.7 million, $3.5 million and $3.4 millionIncome during the yearsyear ended December 31, 2011, 20102013. These losses offset the remeasurement of certain of our intercompany balances as discussed in Note 5, "Derivative Instruments and 2009, respectively.Note 16. Segment and Geographic InformationNote 13. Segment and Geographic Information fourthree operating segments: Wholesale—Wholesale – North America; Wholesale—Wholesale – Europe; and Self Service; and Heavy-Duty Truck.Service. Our operations in North America, which include our Wholesale—Wholesale – North America and Self Service and Heavy-Duty Truck operating segments, are aggregated into one reportable segment because they possess similar economic characteristics and have common products and services, customers, and methods of distribution. Our Wholesale—Wholesale – Europe operating segment formed with our acquisition of ECP effective October 1, 2011, marks our entry into the European automotive aftermarket business, and is presented as a separate reportable segment. Although the Wholesale—Europe operating segment shares many of the characteristics of our North American operations, including types of products offered, distribution methods, and procurement, we have provided separate financial information as we believe this data would be beneficial to users in understanding our results. Therefore, we present our reportable segments on a geographic basis. from continuing operations,, and depreciation and amortization from continuing operations by reportable segment for the periods indicated (in thousands): Year Ended December 31, 2011 2010 2009 $ 3,131,376 $ 2,469,881 $ 2,047,942 138,486 — — $ 3,269,862 $ 2,469,881 $ 2,047,942 $ 405,924 $ 339,869 $ 273,666 12,144 — — $ 418,068 $ 339,869 $ 273,666 $ 52,481 $ 41,428 $ 37,450 2,024 — — $ 54,505 $ 41,428 $ 37,450 Year Ended December 31, 2013 2012 2011 Revenue North America $ 3,802,929 $ 3,426,858 $ 3,131,376 Europe 1,259,599 696,072 138,486 Total revenue $ 5,062,528 $ 4,122,930 $ 3,269,862 EBITDA North America $ 484,824 $ 440,448 $ 405,924 Europe 131,086 70,099 12,144 Total EBITDA $ 615,910 $ 510,547 $ 418,068 Depreciation and Amortization North America $ 65,606 $ 59,132 $ 52,481 Europe 20,857 11,033 2,024 Total depreciation and amortization $ 86,463 $ 70,165 $ 54,505 from Continuing Operations (in thousands): Year Ended December 31, 2011 2010 2009 $ 418,068 $ 339,869 $ 273,666 54,505 41,428 37,450 22,447 28,316 30,899 5,345 — — 125,507 103,007 78,180 $ 210,264 $ 167,118 $ 127,137 87 Year Ended December 31, 2013 2012 2011 EBITDA $ 615,910 $ 510,547 $ 418,068 Depreciation and amortization 86,463 70,165 54,505 Interest expense, net 50,825 31,215 22,447 Loss on debt extinguishment 2,795 — 5,345 Provision for income taxes 164,204 147,942 125,507 Net income $ 311,623 $ 261,225 $ 210,264 usage. Sinceusage, with shared expenses apportioned based on the European segment was initiated in the fourth quartersegment’s percentage of 2011, its usage of the shared corporate and administrative costs has been minimal.consolidated revenue. Segment EBITDA excludes depreciation, amortization, interest (including loss on debt extinguishment) and taxes. Loss on debt extinguishment is considered a component of interest in calculating EBITDA, as the write-off of debt issuance costs is similar to the treatment of debt issuance cost amortization.representsincludes additions to property and equipment, by reportable segment (in thousands): Year Ended December 31, 2011 2010 2009 $ 84,856 $ 61,438 $ 55,870 1,560 — — $ 86,416 $ 61,438 $ 55,870 Year Ended December 31, 2013 2012 2011 Capital Expenditures North America $ 66,288 $ 73,331 $ 84,856 Europe 23,898 14,924 1,560 $ 90,186 $ 88,255 $ 86,416 December 31, 2011 2010 2009 $ 230,871 $ 191,085 $ 152,443 50,893 — — 281,764 191,085 152,443 636,145 492,688 385,686 100,701 — — 736,846 492,688 385,686 380,282 331,312 289,902 43,816 — — 424,098 331,312 289,902 1,756,996 1,284,424 1,192,090 $ 3,199,704 $ 2,299,509 $ 2,020,121 December 31, 2013 2012 2011 Receivables, net North America $ 277,395 $ 241,627 $ 230,871 Europe 180,699 70,181 50,893 Total receivables, net 458,094 311,808 281,764 Inventory North America 748,167 750,565 636,145 Europe 328,785 150,238 100,701 Total inventory 1,076,952 900,803 736,846 Property and Equipment, net North America 447,528 434,010 380,282 Europe 99,123 60,369 43,816 Total property and equipment, net 546,651 494,379 424,098 Other unallocated assets 2,437,077 2,016,466 1,756,996 Total assets $ 4,518,774 $ 3,723,456 $ 3,199,704 which we started with the acquisition of ECP in the fourth quarter of 2011, are located in the U.K. We have, the Netherlands, Belgium and France. Our operations in other countries include recycled and aftermarket product operations in Canada, which were expandedengine remanufacturing and bumper refurbishing operations in 2010 through the acquisition of Cross Canada,Mexico, an aftermarket product supplier. We also haveparts freight consolidation warehouse in Taiwan, and other alternative parts operations in Mexico, Guatemala and Costa Rica. Our locations in Mexico include an engine remanufacturer and a bumper refurbishingrevenue is attributed to geographic area based on the location of the selling operation.88 Year Ended December 31, 2011 2010 2009 $ 2,952,620 $ 2,366,224 $ 1,971,654 138,486 — — 178,756 103,657 76,288 $ 3,269,862 $ 2,469,881 $ 2,047,942 Year Ended December 31, 2013 2012 2011 Revenue United States $ 3,544,360 $ 3,209,024 $ 2,952,620 United Kingdom 981,585 696,072 138,486 Other countries 536,583 217,834 178,756 $ 5,062,528 $ 4,122,930 $ 3,269,862 including primarily property and equipment, by geographic area (in thousands): December 31, 2011 2010 $ 360,961 $ 316,002 43,816 — 19,321 15,310 $ 424,098 $ 331,312 December 31, 2013 2012 Long-lived Assets United States $ 418,869 $ 408,244 United Kingdom 77,827 60,369 Other countries 49,955 25,766 $ 546,651 $ 494,379 Year Ended December 31, 2011 2010 2009 $ 1,634,003 $ 1,236,806 $ 1,093,157 1,115,088 888,320 749,012 520,771 344,755 205,773 $ 3,269,862 $ 2,469,881 $ 2,047,942 All of the product categories reflect revenue from our Year Ended December 31, 2013 2012 2011 Aftermarket, other new and refurbished products $ 3,034,599 $ 2,286,853 $ 1,634,003 Recycled, remanufactured and related products and services 1,394,981 1,277,023 1,115,088 Other 632,948 559,054 520,771 $ 5,062,528 $ 4,122,930 $ 3,269,862 which is composed of ECP, an automotive aftermarket products distributor, only generates revenue primarily from the sale of aftermarket products. Revenue from other sources includes scrap sales, bulk sales to mechanical remanufacturers (including cores) and sales of aluminum ingots and sows from our furnace operations.Note 14. Selected Quarterly Data (unaudited) Note 17. Selected Quarterly Data (unaudited)representspresents unaudited selected quarterly financial data for the two years ended December 31, 2011.2013. Beginning with the quarter ended June 30, 2013, the selected quarterly financial data includes the results of Sator, which was acquired effective May 1, 2013. The operating results for any quarter are not necessarily indicative of the results for any future period. Quarter Ended Mar. 31 Jun. 30 Sep. 30 Dec. 31 (In thousands, except per share data) $ 603,516 $ 584,681 $ 607,621 $ 674,063 283,290 261,266 261,424 287,500 89,929 69,609 65,207 73,132 51,983 37,906 35,901 41,328 1,953 — — — 53,936 37,906 35,901 41,328 0.37 0.27 0.25 0.29 0.36 0.26 0.25 0.28 89 Quarter Ended (In thousands, except per share data) Mar. 31 Jun. 30 Sep. 30 Dec. 31 2012 Revenue $ 1,031,777 $ 1,006,531 $ 1,016,707 $ 1,067,915 447,383 421,931 409,705 445,121 133,608 108,567 91,434 104,344 80,991 63,998 54,048 62,188 $ 0.28 $ 0.22 $ 0.18 $ 0.21 $ 0.27 $ 0.21 $ 0.18 $ 0.21 Quarter Ended Mar. 31 Jun. 30 Sep. 30 Dec. 31(2) (In thousands, except per share data) $ 786,648 $ 759,684 $ 783,898 $ 939,632 343,646 322,236 334,322 391,789 107,371 78,486 85,488 90,138 58,182 46,706 49,231 56,145 — — — — 58,182 46,706 49,231 56,145 0.40 0.32 0.34 0.38 0.39 0.32 0.33 0.38 Quarter Ended (In thousands, except per share data) Mar. 31 Jun. 30 Sep. 30 Dec. 31 2013 Revenue $ 1,195,997 $ 1,251,748 $ 1,298,094 $ 1,316,689 Gross margin 501,949 509,873 517,907 545,673 Operating income 141,588 131,378 123,395 133,819 84,592 75,722 73,445 77,864 $ 0.28 $ 0.25 $ 0.24 $ 0.26 $ 0.28 $ 0.25 $ 0.24 $ 0.26 (1) (2) (3) The sum of the quarters may not equal the total of the respective year’syear's earnings per share on either a basic or diluted basis due to changes in weighted average shares outstanding throughout the year.(2)Results for the quarter ended December 31, 2011 include the results of ECP from the acquisition effective as of October 1, 2011 through the end of the quarter.Note 15. Condensed Consolidating Financial Information 90 December 31, 2013 Parent Guarantors Non-Guarantors Eliminations Consolidated Assets Current Assets: Cash and equivalents $ 77,926 $ 13,693 $ 58,869 $ — $ 150,488 Receivables, net — 126,926 331,168 — 458,094 Intercompany receivables, net 2,275 6,923 — (9,198 ) — Inventory — 687,164 389,788 — 1,076,952 Deferred income taxes 3,189 57,422 3,327 — 63,938 Prepaid income taxes 6,429 — 1,640 — 8,069 Prepaid expenses and other current assets 1,495 24,190 16,591 — 42,276 Total Current Assets 91,314 916,318 801,383 (9,198 ) 1,799,817 Property and Equipment, net 668 419,617 126,366 — 546,651 Intangible Assets: Goodwill — 1,248,746 688,698 — 1,937,444 Other intangibles, net — 56,069 97,670 — 153,739 Investment in Subsidiaries 2,364,586 264,815 — (2,629,401 ) — Intercompany Notes Receivable 959,185 118,740 — (1,077,925 ) — Other Assets 49,218 20,133 17,241 (5,469 ) 81,123 Total Assets $ 3,464,971 $ 3,044,438 $ 1,731,358 $ (3,721,993 ) $ 4,518,774 Liabilities and Stockholders’ Equity Current Liabilities: Accounts payable $ 314 $ 147,708 $ 201,047 $ — $ 349,069 Intercompany payables, net — — 9,198 (9,198 ) — Accrued expenses: Accrued payroll-related liabilities 5,236 32,850 20,609 — 58,695 Other accrued expenses 26,714 56,877 56,483 — 140,074 Income taxes payable 2,517 — 14,923 — 17,440 Contingent consideration liabilities — 1,923 50,542 — 52,465 Other current liabilities 286 13,039 5,350 — 18,675 Current portion of long-term obligations 24,421 3,030 14,084 — 41,535 Total Current Liabilities 59,488 255,427 372,236 (9,198 ) 677,953 Long-Term Obligations, Excluding Current Portion 1,016,249 6,554 241,443 — 1,264,246 Intercompany Notes Payable — 611,274 466,651 (1,077,925 ) — Deferred Income Taxes — 110,110 29,181 (5,469 ) 133,822 Contingent Consideration Liabilities — 877 2,311 — 3,188 Other Noncurrent Liabilities 38,489 45,540 4,791 — 88,820 Stockholders’ Equity 2,350,745 2,014,656 614,745 (2,629,401 ) 2,350,745 Total Liabilities and Stockholders’ Equity $ 3,464,971 $ 3,044,438 $ 1,731,358 $ (3,721,993 ) $ 4,518,774 December 31, 2012 Parent Guarantors Non-Guarantors Eliminations Consolidated Assets Current Assets: Cash and equivalents $ 18,396 $ 18,253 $ 23,121 $ — $ 59,770 Receivables, net — 94,435 217,373 — 311,808 Intercompany receivables, net 1,781 5,970 — (7,751 ) — Inventory — 690,365 210,438 — 900,803 Deferred income taxes 4,778 45,255 3,452 — 53,485 Prepaid income taxes 26,538 — 2,999 — 29,537 Prepaid expenses and other current assets 1,065 16,608 11,275 — 28,948 Total Current Assets 52,558 870,886 468,658 (7,751 ) 1,384,351 Property and Equipment, net 970 408,944 84,465 — 494,379 Intangible Assets: Goodwill — 1,226,718 463,566 — 1,690,284 Other intangibles, net — 61,815 44,900 — 106,715 Investment in Subsidiaries 1,923,997 142,334 — (2,066,331 ) — Intercompany Notes Receivable 711,624 39,239 — (750,863 ) — Other Assets 41,692 17,830 3,528 (15,323 ) 47,727 Total Assets $ 2,730,841 $ 2,767,766 $ 1,065,117 $ (2,840,268 ) $ 3,723,456 Liabilities and Stockholders’ Equity Current Liabilities: Accounts payable $ 52 $ 97,678 $ 121,605 $ — $ 219,335 Intercompany payables, net — — 7,751 (7,751 ) — Accrued expenses: Accrued payroll-related liabilities 3,731 25,697 14,972 — 44,400 Other accrued expenses 2,258 48,805 39,359 — 90,422 Income taxes payable — — 2,748 — 2,748 Contingent consideration liabilities — 1,518 40,737 — 42,255 Other current liabilities 286 16,241 541 — 17,068 Current portion of long-term obligations 32,300 9,940 29,476 — 71,716 Total Current Liabilities 38,627 199,879 257,189 (7,751 ) 487,944 Long-Term Obligations, Excluding Current Portion 691,670 7,549 347,543 — 1,046,762 Intercompany Notes Payable — 681,275 69,588 (750,863 ) — Deferred Income Taxes — 102,702 14,896 (15,323 ) 102,275 Contingent Consideration Liabilities — 2,500 45,254 — 47,754 Other Noncurrent Liabilities 36,450 35,383 2,794 — 74,627 Stockholders’ Equity 1,964,094 1,738,478 327,853 (2,066,331 ) 1,964,094 Total Liabilities and Stockholders’ Equity $ 2,730,841 $ 2,767,766 $ 1,065,117 $ (2,840,268 ) $ 3,723,456 Year Ended December 31, 2013 Parent Guarantors Non-Guarantors Eliminations Consolidated Revenue $ — $ 3,576,269 $ 1,598,832 $ (112,573 ) $ 5,062,528 Cost of goods sold — 2,100,804 998,895 (112,573 ) 2,987,126 Gross margin — 1,475,465 599,937 — 2,075,402 Facility and warehouse expenses — 323,042 102,039 — 425,081 Distribution expenses — 297,908 134,039 — 431,947 Selling, general and administrative expenses 26,778 377,481 192,793 — 597,052 Restructuring and acquisition related expenses — 1,406 8,767 — 10,173 Depreciation and amortization 250 55,802 24,917 — 80,969 Operating (loss) income (27,028 ) 419,826 137,382 — 530,180 Other expense (income): Interest expense 42,442 640 8,102 — 51,184 Intercompany interest (income) expense, net (45,459 ) 21,978 23,481 — — Loss on debt extinguishment 2,795 — — — 2,795 Change in fair value of contingent consideration liabilities — (744 ) 3,248 — 2,504 Interest and other expense (income), net 252 (2,858 ) 476 — (2,130 ) Total other expense, net 30 19,016 35,307 — 54,353 (Loss) income before (benefit) provision for income taxes (27,058 ) 400,810 102,075 — 475,827 (Benefit) provision for income taxes (7,193 ) 151,369 20,028 — 164,204 Equity in earnings of subsidiaries 331,488 22,050 — (353,538 ) — Net income $ 311,623 $ 271,491 $ 82,047 $ (353,538 ) $ 311,623 Year Ended December 31, 2012 Parent Guarantors Non-Guarantors Eliminations Consolidated Revenue $ — $ 3,236,507 $ 976,710 $ (90,287 ) $ 4,122,930 Cost of goods sold — 1,886,098 602,979 (90,287 ) 2,398,790 Gross margin — 1,350,409 373,731 — 1,724,140 Facility and warehouse expenses — 287,036 60,881 — 347,917 Distribution expenses — 281,011 94,824 — 375,835 Selling, general and administrative expenses 21,098 346,596 127,897 — 495,591 Restructuring and acquisition related expenses — 1,812 939 — 2,751 Depreciation and amortization 296 49,782 14,015 — 64,093 Operating (loss) income (21,394 ) 384,172 75,175 — 437,953 Other (income) expense: Interest expense 24,272 308 6,849 — 31,429 Intercompany interest (income) expense, net (37,491 ) 27,377 10,114 — — Change in fair value of contingent consideration liabilities — (1,943 ) 3,586 — 1,643 Interest and other income, net (43 ) (3,638 ) (605 ) — (4,286 ) Total other (income) expense, net (13,262 ) 22,104 19,944 — 28,786 (Loss) income before (benefit) provision for income taxes (8,132 ) 362,068 55,231 — 409,167 (Benefit) provision for income taxes (3,287 ) 140,150 11,079 — 147,942 Equity in earnings of subsidiaries 266,070 12,481 — (278,551 ) — Net income $ 261,225 $ 234,399 $ 44,152 $ (278,551 ) $ 261,225 Year Ended December 31, 2011 Parent Guarantors Non-Guarantors Eliminations Consolidated Revenue $ — $ 2,975,275 $ 370,912 $ (76,325 ) 3,269,862 Cost of goods sold — 1,721,419 232,775 (76,325 ) 1,877,869 Gross margin — 1,253,856 138,137 — 1,391,993 Facility and warehouse expenses — 261,260 32,163 — 293,423 Distribution expenses — 257,395 30,231 — 287,626 Selling, general and administrative expenses 22,680 321,403 47,859 — 391,942 Restructuring and acquisition related expenses — 3,438 4,152 — 7,590 Depreciation and amortization 239 44,724 4,966 — 49,929 Operating (loss) income (22,919 ) 365,636 18,766 — 361,483 Other (income) expense: Interest expense 21,839 99 2,369 — 24,307 Intercompany interest (income) expense, net (36,018 ) 31,036 4,982 — — Loss on debt extinguishment 5,345 — — — 5,345 Change in fair value of contingent consideration liabilities (2,000 ) 11 581 — (1,408 ) Interest and other income, net (332 ) (1,979 ) (221 ) — (2,532 ) Total other (income) expense, net (11,166 ) 29,167 7,711 — 25,712 (Loss) income before (benefit) provision for income taxes (11,753 ) 336,469 11,055 — 335,771 (Benefit) provision for income taxes (6,034 ) 128,930 2,611 — 125,507 Equity in earnings of subsidiaries 215,983 3,036 — (219,019 ) — Net income $ 210,264 $ 210,575 $ 8,444 $ (219,019 ) $ 210,264 Year Ended December 31, 2013 Parent Guarantors Non-Guarantors Eliminations Consolidated Net income $ 311,623 $ 271,491 $ 82,047 $ (353,538 ) $ 311,623 Other comprehensive income, net of tax: Foreign currency translation 14,056 7,168 15,495 (22,663 ) 14,056 Net change in unrecognized gains/losses on derivative instruments, net of tax 4,495 — 1,322 (1,322 ) 4,495 Unrealized gain on pension plan, net of tax 701 — 701 (701 ) 701 Total other comprehensive income 19,252 7,168 17,518 (24,686 ) 19,252 Total comprehensive income $ 330,875 $ 278,659 $ 99,565 $ (378,224 ) $ 330,875 Year Ended December 31, 2012 Parent Guarantors Non-Guarantors Eliminations Consolidated Net income $ 261,225 $ 234,399 $ 44,152 $ (278,551 ) $ 261,225 Other comprehensive income (loss), net of tax: Foreign currency translation 12,921 5,278 12,334 (17,612 ) 12,921 Net change in unrecognized gains/losses on derivative instruments, net of tax (3,201 ) — (519 ) 519 (3,201 ) Total other comprehensive income 9,720 5,278 11,815 (17,093 ) 9,720 Total comprehensive income $ 270,945 $ 239,677 $ 55,967 $ (295,644 ) $ 270,945 Year Ended December 31, 2011 Parent Guarantors Non-Guarantors Eliminations Consolidated Net income $ 210,264 $ 210,575 $ 8,444 $ (219,019 ) $ 210,264 Other comprehensive loss, net of tax: Foreign currency translation (4,273 ) (1,440 ) (3,790 ) 5,230 (4,273 ) Net change in unrecognized gains/losses on derivative instruments, net of tax (9,066 ) — (1,042 ) 1,042 (9,066 ) Total other comprehensive loss (13,339 ) (1,440 ) (4,832 ) 6,272 (13,339 ) Total comprehensive income $ 196,925 $ 209,135 $ 3,612 $ (212,747 ) $ 196,925 Year Ended December 31, 2013 Parent Guarantors Non-Guarantors Eliminations Consolidated CASH FLOWS FROM OPERATING ACTIVITIES: Net cash provided by operating activities $ 160,620 $ 260,567 $ 126,681 $ (119,812 ) $ 428,056 CASH FLOWS FROM INVESTING ACTIVITIES: Purchases of property and equipment — (57,219 ) (32,967 ) — (90,186 ) Proceeds from sales of property and equipment — 1,191 909 — 2,100 Investment in unconsolidated subsidiary — — (9,136 ) — (9,136 ) Investment and intercompany note activity with subsidiaries (434,172 ) (84,894 ) — 519,066 — Acquisitions, net of cash acquired — (33,436 ) (374,948 ) — (408,384 ) Net cash used in investing activities (434,172 ) (174,358 ) (416,142 ) 519,066 (505,606 ) CASH FLOWS FROM FINANCING ACTIVITIES: Proceeds from exercise of stock options 15,392 — — — 15,392 Excess tax benefit from stock-based payments 18,348 — — — 18,348 Debt issuance costs (16,858 ) — (82 ) — (16,940 ) Proceeds from issuance of senior notes 600,000 — — — 600,000 Borrowings under revolving credit facility 315,000 — 122,023 — 437,023 Repayments under revolving credit facility (616,000 ) — (132,086 ) — (748,086 ) Borrowings under term loans 35,000 — — — 35,000 Repayments under term loans (16,875 ) — — — (16,875 ) Borrowings under receivables securitization facility — — 41,500 — 41,500 Repayments under receivables securitization facility — — (121,500 ) — (121,500 ) Repayments of other long-term debt (925 ) (8,930 ) (35,207 ) — (45,062 ) Payments of other obligations — (473 ) (32,386 ) — (32,859 ) Investment and intercompany note activity with parent — 38,446 480,620 (519,066 ) — Dividends — (119,812 ) — 119,812 — Net cash provided by (used in) financing activities 333,082 (90,769 ) 322,882 (399,254 ) 165,941 Effect of exchange rate changes on cash and equivalents — — 2,327 — 2,327 Net increase (decrease) in cash and equivalents 59,530 (4,560 ) 35,748 — 90,718 Cash and equivalents, beginning of period 18,396 18,253 23,121 — 59,770 Cash and equivalents, end of period $ 77,926 $ 13,693 $ 58,869 $ — $ 150,488 Year Ended December 31, 2012 Parent Guarantors Non-Guarantors Eliminations Consolidated CASH FLOWS FROM OPERATING ACTIVITIES: Net cash provided by (used in) operating activities $ 150,309 $ 289,013 $ (74,085 ) $ (159,047 ) $ 206,190 CASH FLOWS FROM INVESTING ACTIVITIES: Purchases of property and equipment (150 ) (68,344 ) (19,761 ) — (88,255 ) Proceeds from sales of property and equipment — 699 358 — 1,057 Investment and intercompany note activity with subsidiaries (132,006 ) — — 132,006 — Acquisitions, net of cash acquired — (183,716 ) (81,620 ) — (265,336 ) Net cash used in investing activities (132,156 ) (251,361 ) (101,023 ) 132,006 (352,534 ) CASH FLOWS FROM FINANCING ACTIVITIES: Proceeds from exercise of stock options 17,693 — — — 17,693 Excess tax benefit from stock-based payments 15,737 — — — 15,737 Debt issuance costs (30 ) — (223 ) — (253 ) Borrowings under revolving credit facility 612,700 — 129,681 — 742,381 Repayments under revolving credit facility (832,700 ) — (22,702 ) — (855,402 ) Borrowings under term loans 200,000 — — — 200,000 Repayments under term loans (20,000 ) — — — (20,000 ) Borrowings under receivables securitization facility — — 82,700 — 82,700 Repayments under receivables securitization facility — — (2,700 ) — (2,700 ) Repayments of other long-term debt (3,065 ) (2,568 ) (13,158 ) — (18,791 ) Payments of other obligations — (4,293 ) — — (4,293 ) Investment and intercompany note activity with parent — 129,076 2,930 (132,006 ) — Dividends — (159,047 ) — 159,047 — Net cash (used in) provided by financing activities (9,665 ) (36,832 ) 176,528 27,041 157,072 Effect of exchange rate changes on cash and equivalents — — 795 — 795 Net increase in cash and equivalents 8,488 820 2,215 — 11,523 Cash and equivalents, beginning of period 9,908 17,433 20,906 — 48,247 Cash and equivalents, end of period $ 18,396 $ 18,253 $ 23,121 $ — $ 59,770 Year Ended December 31, 2011 Parent Guarantors Non-Guarantors Eliminations Consolidated CASH FLOWS FROM OPERATING ACTIVITIES: Net cash provided by operating activities $ 72,199 $ 201,029 $ 4,341 $ (65,797 ) $ 211,772 CASH FLOWS FROM INVESTING ACTIVITIES: Purchases of property and equipment (922 ) (79,474 ) (6,020 ) — (86,416 ) Proceeds from sales of property and equipment 2 1,557 184 — 1,743 Investment and intercompany note activity with subsidiaries (347,005 ) (93,985 ) — 440,990 — Acquisitions, net of cash acquired — (193,292 ) (293,642 ) — (486,934 ) Net cash used in investing activities (347,925 ) (365,194 ) (299,478 ) 440,990 (571,607 ) CASH FLOWS FROM FINANCING ACTIVITIES: Proceeds from exercise of stock options 11,919 — — — 11,919 Excess tax benefit from stock-based payments 7,973 — — — 7,973 Debt issuance costs (10,874 ) — (174 ) — (11,048 ) Borrowings under revolving credit facility 748,329 — 363,040 — 1,111,369 Repayments under revolving credit facility (227,329 ) — (226,538 ) — (453,867 ) Borrowings under term loans 250,000 — — — 250,000 Repayments under term loans (563,079 ) — (37,385 ) — (600,464 ) Repayments of other long-term debt (1,640 ) (849 ) (1,982 ) — (4,471 ) Investment and intercompany note activity with parent — 226,872 214,118 (440,990 ) — Dividends — (65,797 ) — 65,797 — Net cash provided by financing activities 215,299 160,226 311,079 (375,193 ) 311,411 Effect of exchange rate changes on cash and equivalents — — 982 — 982 Net (decrease) increase in cash and equivalents (60,427 ) (3,939 ) 16,924 — (47,442 ) Cash and equivalents, beginning of period 70,335 21,372 3,982 — 95,689 Cash and equivalents, end of period $ 9,908 $ 17,433 $ 20,906 $ — $ 48,247 ITEM 9. CHANGES IN AND DISAGREEMENTS WITH ACCOUNTANTS ON ACCOUNTING AND FINANCIAL DISCLOSURE ITEM 9A.CONTROLS AND PROCEDURES2011,2013, the end of the period covered by this report, an evaluation was carried out under the supervision and with the participation of LKQ Corporation’sCorporation's management, including our Chief Executive Officer and our Chief Financial Officer, of our “disclosure"disclosure controls and procedures”procedures" (as defined in Rule 13a-15(e) under the Securities Exchange Act of 1934). Based upon that evaluation, our Chief Executive Officer and Chief Financial Officer concluded that the design and operation of theseCompany's disclosure controls and procedures were effective to ensure that the Company is able to collect, process and disclose, within the required time periods, the information we are required to disclosebe disclosed in the reports we file with the Securities and Exchange Commission.February 27, 2012“Company”"Company") is responsible for establishing and maintaining adequate internal control over financial reporting as defined in Rules 13a-15(f) and 15d-15(f) under the Securities Exchange Act of 1934. The Company’sCompany's internal control over financial reporting is a process designed to provide reasonable assurance regarding the reliability of financial reporting and the preparation of financial statements for external purposes in accordance with accounting principles generally accepted in the United States. Internal control over financial reporting includes those policies and procedures that (i) pertain to the maintenance of records that, in reasonable detail, accurately and fairly reflect the transactions and dispositions of the assets of the Company, (ii) provide reasonable assurance that transactions are recorded as necessary to permit preparation of financial statements in accordance with generally accepted accounting principles, and that receipts and expenditures of the Company are being made only in accordance with authorizations of management and directors of the Company, and (iii) provide reasonable assurance regarding prevention or timely detection of unauthorized acquisition, use, or disposition of the Company’sCompany's assets that could have a material effect on the Company’sCompany's financial statements.Euro Car Parts Holdings Limited (“ECP”Sator Beheer B.V. ("Sator"), which was acquired effective OctoberMay 1, 2011,2013, and whose financial statements constitute 13%4% and 19%9% of net and total assets, respectively, 4%5% of revenue, and 3%2% of net income from continuing operations of the consolidated financial statement amounts as of and for the year ended December 31, 2011.Company’sCompany's internal control over financial reporting as of December 31, 2011.2013. Management based this assessment on criteria for effective internal control over financial reporting described inInternal Control—Integrated Framework (1992) issued by the Committee of Sponsoring Organizations of the Treadway Commission. Management’sManagement's assessment included an evaluation of the design of the Company’sCompany's internal control over financial reporting and testing of the operational effectiveness of its internal control over financial reporting. Management reviewed the results of its assessment with the Audit Committee of the Company’sCompany's Board of Directors.2011,2013, the Company maintained effective internal control over financial reporting. Deloitte & Touche LLP, independent registered public912011.Other than the change in internal control resulting from the acquisition of ECP effective October 1, 2011, there92“Company”"Company") as of December 31, 2011,2013, based on criteria established inInternal Control—Integrated Framework (1992)issued by the Committee of Sponsoring Organizations of the Treadway Commission. As described inReport of Management on Internal Control over Financial Reporting dated February 27, 2012March 3, 2014, management excluded from its assessment the internal control over financial reporting at Euro Car Parts Holdings, Limited (“ECP”)Sator Beheer B.V., which was acquired effective Octoberon May 1, 2011,2013 and whose financial statements constitute 13%4% and 19%9% of net and total assets, respectively, 4%5% of revenue and 3%2% of net income from continuing operations of the consolidated financial statement amounts as of and for the year ended December 31, 2011.2013. Accordingly, our audit did not include the internal control over financial reporting at ECP.Sator Beheer B.V. The Company’sCompany's management is responsible for maintaining effective internal control over financial reporting and for its assessment of the effectiveness of internal control over financial reporting, included in the accompanying Report of Management on Internal Control over Financial Reporting. Our responsibility is to express an opinion on the Company’sCompany's internal control over financial reporting based on our audit.company’scompany's internal control over financial reporting is a process designed by, or under the supervision of, the company’scompany's principal executive and principal financial officers, or persons performing similar functions, and effected by the company’scompany's board of directors, management, and other personnel to provide reasonable assurance regarding the reliability of financial reporting and the preparation of financial statements for external purposes in accordance with generally accepted accounting principles. A company’scompany's internal control over financial reporting includes those policies and procedures that (1) pertain to the maintenance of records that, in reasonable detail, accurately and fairly reflect the transactions and dispositions of the assets of the company; (2) provide reasonable assurance that transactions are recorded as necessary to permit preparation of financial statements in accordance with generally accepted accounting principles, and that receipts and expenditures of the company are being made only in accordance with authorizations of management and directors of the company; and (3) provide reasonable assurance regarding prevention or timely detection of unauthorized acquisition, use, or disposition of the company’scompany's assets that could have a material effect on the financial statements.2011,2013, based on the criteria established inInternal Control—Integrated Framework (1992)issued by the Committee of Sponsoring Organizations of the Treadway Commission.9320112013 and our report dated February 27, 2012March 3, 2014 expressed an unqualified opinion on those financial statements and financial statement schedule./s/ DELOITTE & TOUCHE LLP Deloitte & Touche LLPFebruary 27, 201294ITEM 9B.OTHER INFORMATION95ITEM 10.DIRECTORS, EXECUTIVE OFFICERS AND CORPORATE GOVERNANCE“Election"Election of our Board of Directors”Directors" in our Proxy Statement for the Annual Meeting of Stockholders to be held May 7, 20125, 2014 (the “Proxy Statement”"Proxy Statement") is incorporated herein by reference.2011,2013, and their positions with us are set forth below. Our executive officers are elected by and serve at the discretion of our Board of Directors. Age Robert L. Wagman 4749 President, Chief Executive Officer and Director John S. Quinn 5355 Executive Vice President and Chief Financial Officer Victor M. Casini 4951 Senior Vice President, General Counsel and Corporate Secretary and DirectorWalter P. Hanley 4547 Senior Vice President—Development Steven Greenspan 5052 Senior Vice President of Operations—Wholesale Parts Division Michael S. Clark 3739 Vice President—Finance and Controller has beenwas a member of our Board of Directors sincefrom May 2010.2010 until May 2012. From July 1992 to December 2011, Mr. Casini was the Executive Vice President and General Counsel of Flynn Enterprises, Inc., a venture capital, hedging and consulting firm. Mr. Casini served as Senior Vice President, General Counsel and Corporate Secretary of Discovery Zone, Inc., an operator and franchisorfranchiser of family entertainment centers, from July 1992 until May 1995. Prior to July 1992, Mr. Casini practiced corporate and securities law with the law firm of Bell, Boyd & Lloyd LLP (now known as K&L Gates LLP) in Chicago, Illinois for more than five years.96 In January 2001, the Illinois Gaming Board issued an initial decision seeking to revoke Emerald’s license. In July 2002, certain creditors filed a bankruptcy petition against Emerald. The bankruptcy court confirmed a plan of reorganization in July 2004. The Illinois Gaming Board reversed its initial decision to support the plan of reorganization and in May 2005 revoked Emerald’s license. The bankruptcy case and a related adversary proceeding (in which Mr. Hanley is a defendant) are pending. Mr. Hanley served as Senior Vice President, General Counsel and Secretary of Blue Chip Casino, Inc., an owner and operator of a riverboat gaming vessel in Michigan City, Indiana, from July 1996 until November 1999. Mr. Hanley served as Vice President and Associate General Counsel of Flynn Enterprises, Inc. from May 1995 until February 1998 and as Associate General Counsel of Discovery Zone, Inc. from March 1993 until May 1995. Prior to March 1993, Mr. Hanley practiced corporate and securities law with the law firm of Bell, Boyd & Lloyd LLP (now known as K&L Gates LLP) in Chicago, Illinois.www.lkqcorp.com.“Other"Other Information—Section 16(a) Beneficial Ownership Reporting Compliance”Compliance" in the Proxy Statement is incorporated herein by reference.“Corporate"Corporate Governance—Meetings and Committees of the Board—Audit Committee”Committee" in the Proxy Statement is incorporated herein by reference.ITEM 11.EXECUTIVE COMPENSATION“Director"Director Compensation—Director Compensation Table,” “Executive" "Executive Compensation—Compensation Discussion and Analysis,” “Corporate" "Corporate Governance—Compensation Committee Interlocks and Insider Participation”Participation" and “Executive"Executive Compensation—Compensation Tables”Tables" in the Proxy Statement is incorporated herein by reference.97ITEM 12. SECURITY OWNERSHIP OF CERTAIN BENEFICIAL OWNERS AND MANAGEMENT AND RELATED STOCKHOLDER MATTERS “Other"Other Information—Principal Stockholders”Stockholders" in the Proxy Statement and appearingis incorporated herein by reference.the caption “Equityour equity compensation plans as of December 31, 2013.Information”InformationPlan Category
compensation plans (excluding
securities reflected in column (a))
(c)Equity compensation plans approved by stockholders Stock options 6,832,331 $ 7.04 Restricted stock units 2,558,213 $ — Total equity compensation plans approved by stockholders 9,390,544 13,965,440 Equity compensation plans not approved by stockholders — $ — — Total 9,390,544 13,965,440 58 of this Annual Report is incorporated herein by reference.on Form 10-K for further information related to the equity incentive plans listed above.ITEM 13. CERTAIN RELATIONSHIPS AND RELATED TRANSACTIONS, AND DIRECTOR INDEPENDENCE captions “Othercaption "Other Information—Certain Transactions,” “Election" "Election of Ourour Board of Directors”Directors" and “Corporate Governance—"Corporate Governance - Director Independence”Independence" in the Proxy Statement is incorporated herein by reference.ITEM 14.PRINCIPAL ACCOUNTANT FEES AND SERVICES“Appointment"Appointment of Our Independent Registered Public Accounting Firm—Audit Fees and Non-Audit Fees”Fees" and “Appointment"Appointment of Our Independent Registered Public Accounting Firm—Policy on Audit Committee Approval of Audit and Non-Audit Services”Services" in the Proxy Statement is incorporated herein by reference.98ITEM 15.EXHIBITS, FINANCIAL STATEMENT SCHEDULES Balance at
Beginning of
Period Additions
Charged to
Costs and
Expenses Acquisitions and
Other Deductions Balance at End
of Period (in thousands) $ 5,757 $ 5,102 $ 831 $ (5,183 ) $ 6,507 6,507 4,326 1,125 (5,063 ) 6,895 6,895 5,084 2,199 (5,831 ) 8,347 $ 11,169 $ 469,178 $ 1,915 $ (466,460 ) $ 15,802 15,802 541,314 1,061 (539,992 ) 18,185 18,185 668,936 2,754 (667,071 ) 22,804 Descriptions Balance at
Beginning of
Period Additions
Charged to
Costs and
Expenses Acquisitions and
Other Deductions Balance at End
of Period (in thousands) ALLOWANCE FOR DOUBTFUL ACCOUNTS: Year ended December 31, 2011 $ 6,895 $ 5,084 $ 2,199 $ (5,831 ) $ 8,347 Year ended December 31, 2012 8,347 5,928 308 (5,113 ) 9,470 Year ended December 31, 2013 9,470 7,148 3,633 (5,891 ) 14,360 ALLOWANCE FOR ESTIMATED RETURNS, DISCOUNTS & ALLOWANCES: Year ended December 31, 2011 $ 18,185 $ 668,936 $ 2,754 $ (667,071 ) $ 22,804 Year ended December 31, 2012 22,804 714,880 1,151 (714,143 ) 24,692 Year ended December 31, 2013 24,692 797,380 825 (796,261 ) 26,636 10.1LKQ Corporation Amended and Restated Stock Option and Compensation Plan for Non-Employee Directors, as amended.10.2LKQ Corporation 1998 Equity Incentive Plan, as amended.10.3LKQ Corporation 401(k) Plus Plan dated August 1, 1999.10.4Amendment to LKQ Corporation 401(k) Plus Plan.10.5Trust for LKQ Corporation 401(k) Plus Plan.10.610.1 LKQ Corporation Employees’ Retirement Plan, as amended and restated as of January 1, 2012. 10.2 LKQ Corporation 401(k) Plus Plan dated August 1, 1999. 10.710.3Amendment to LKQ Corporation 401(k) Plus Plan. 10.4 Trust Agreement for LKQ Corporation Employees’ Retirement401(k) Plus Plan.10.810.5 LKQ Corporation 401(k) Plus Plan II, as amended and restated effective as of January 1, 2011. 10.6 LKQ Corporation 1998 Equity Incentive Plan, as amended. 10.910.7 Form of LKQ Corporation Award Agreement for options granted under the 1998 Equity Incentive Plan. 10.8 Form of LKQ Corporation Restricted Stock Agreement. 10.9 Form of LKQ Corporation Restricted Stock Unit Agreement for Non-Employee Directors. 10.10 Form of LKQ Corporation Restricted Stock Unit Agreement. 10.11 Form of LKQ Corporation performance-based Restricted Stock Unit Agreement for first tranche of restricted stock units granted in March 2013. 10.12 10.13 10.14 LKQ Corporation Amended and Restated Stock Option and Compensation Plan for Non-Employee Directors, as amended. 10.15 Form of Indemnification AgreementsAgreement between directors and officers of LKQ Corporation and LKQ Corporation.9910.16 LKQ Management Incentive Plan. 10.1110.17 Form of LKQ Corporation Executive Officer 20102012 Bonus Program.Program Award Memorandum.10.12LKQ Management Incentive Plan.10.1310.18 Form of LKQ Corporation Executive Officer 20112013 Bonus Program Award Memorandum.10.19 Form of LKQ Corporation Executive Officer 2014 Bonus Program Award Memorandum. 10.1410.20 LKQ Corporation Long Term Incentive Plan. 10.15Form of LKQ Corporation Restricted Stock Agreement.10.16Form of Restricted Stock Unit Agreement for Non-Employee Directors.10.1710.21 Consulting Agreement, as amended and restated, dated as of May 21, 2009 between LKQ Corporation and Joseph M. Holsten. 10.1810.22 Amendment Agreement dated as of January 31, 2011 to the Consulting Agreement between LKQ Corporation and Joseph M. Holsten dated as of May 21, 2009. 10.2210.28 Change of Control Agreement dated as of December 6, 2010 between LKQ Corporation and Joseph M. Holsten.10.23Change of Control Agreement dated as of December 6, 2010 between LKQ Corporation and Robert
L. Wagman.Wagman, as amended and restated as of March 21, 2012.10.2410.29 Change of Control Agreement dated as of December 6, 2010 between LKQ Corporation and John
S. Quinn.10.2510.30 Change of Control Agreement dated as of December 6, 2010 between LKQ Corporation and Walter
P. Hanley.10.2610.31 Change of Control Agreement dated as of December 6, 2010 between LKQ Corporation and Victor
M. Casini.10.2710.32 Change of Control Agreement dated as of March 24,14, 2011 between LKQ Corporation and Michael
S. Clark.10.33 Change of Control Agreement dated as of December 6, 2010 between LKQ Corporation and Steven Greenspan. 10.28Form of LKQ Corporation Restricted Stock Unit Agreement.(b) Exhibits3.1 Certificate of Incorporation of LKQ Corporation, as amended to date (incorporated herein by reference to Exhibit 3.1 (iii) to the Company’s report on Form 10-K for the fiscal year ended December 31, 2003).date.3.2 Amended and Restated Bylaws of LKQ Corporation (incorporated herein by reference to Exhibit 3.1 to the Company’s report on Form 8-K filed with the SEC on November 3, 2010)6, 2013).4.1 Specimen of common stock certificate (incorporated herein by reference to Exhibit 4.1 to the Company’s Registration Statement on Form S-1/A, Registration No. 333-107417 filed with the SEC on September 12, 2003). 4.2 Amendment and Restatement Agreement dated as of September 30, 2011May 3, 2013 by and among LKQ Corporation, LKQ Delaware LLP, and certain additional subsidiaries of LKQ Corporation, as borrowers, certain financial institutions, as lenders, and JP Morgan ChaseWells Fargo Bank, N.A.,National Association, as administrative agent (incorporated herein by reference to Exhibit 4.1 to the Company’s report on Form 10-Q filed with the SEC on October 28, 2011). 10.1LKQ Corporation Amended and Restated Stock Option and Compensation Plan for Non-Employee Directors, as amended (incorporated herein by reference to Exhibit 10.5 to the Company’s report on Form 10-Q filed with the SEC on November 7, 2008).100 10.2LKQ Corporation 1998 Equity Incentive Plan, as amended (incorporated herein by reference to Exhibit 99.1 to the Company’sCompany's report on Form 8-K filed with the SEC on April 26, 2011)May 6, 2013). 10.34.3Indenture dated as of May 9, 2013 among LKQ Corporation, as Issuer, the Guarantors, and U.S. Bank National Association, as Trustee (incorporated herein by reference to Exhibit 4.1 to the Company's report on Form 8-K filed with the SEC on May 10, 2013). 10.1 LKQ Corporation Employees’ Retirement Plan, as amended and restated as of January 1, 2012 (incorporated herein by reference to Exhibit 10.6 to the Company’s report on Form 10-K filed with the SEC on February 27, 2012). 10.2 LKQ Corporation 401(k) Plus Plan dated August 1, 1999 (incorporated herein by reference to Exhibit 10.23 to the Company’s Registration Statement on Form S-1, Registration No. 333-107417 filed with the SEC on July 28, 2003). 10.410.3 Amendment to LKQ Corporation 401(k) Plus Plan (incorporated herein by reference to Exhibit 10.24 to the Company’s Registration Statement on Form S-1, Registration No. 333-107417 filed with the SEC on July 28, 2003). 10.510.4 Trust for LKQ Corporation 401(k) Plus Plan (incorporated herein by reference to Exhibit 10.25 to the Company’s Registration Statement on Form S-1, Registration No. 333-107417 filed with the SEC on July 28, 2003). 10.6LKQ Corporation Employees’ Retirement Plan, as amended and restated as of January 1, 2012. 10.7Trust Agreement for LKQ Corporation Employees’ Retirement Plan (incorporated herein by reference to Exhibit 10.10 to the Company’s report on Form 10-K for the year ended December 31, 2008). 10.810.5 LKQ Corporation 401(k) Plus Plan II, as amended and restated effective as of January 1, 2011 (incorporated herein by reference to Exhibit 10.8 to the Company’s report on Form 10-K for the year ended December 31, 2010). 10.6 LKQ Corporation 1998 Equity Incentive Plan, as amended (incorporated by reference to Exhibit 10.6 to the Company’s report on Form 10-K filed with the SEC on March 1, 2013). 10.910.7 Form of LKQ Corporation Award Agreement for options granted under the 1998 Equity Incentive Plan (incorporated herein by reference to Exhibit 99.1 to the Company’s report on Form 8-K filed with the SEC on January 11, 2005). 10.8 Form of LKQ Corporation Restricted Stock Agreement (incorporated herein by reference to Exhibit 10.1 to the Company’s report on Form 8-K filed with the SEC on January 17, 2008). 10.9 Form of LKQ Corporation Restricted Stock Unit Agreement for Non-Employee Directors (incorporated herein by reference to Exhibit 10.4 to the Company’s report on Form 10-Q filed with the SEC on August 2, 2013). 10.10 Form of LKQ Corporation Restricted Stock Unit Agreement (incorporated herein by reference to Exhibit 10.5 to the Company’s report on Form 10-Q filed with the SEC on August 2, 2013). 10.11 Form of LKQ Corporation performance-based Restricted Stock Unit Agreement for first tranche of restricted stock units granted in March 2013 (incorporated by reference to Exhibit 10.1 to the Company’s report on Form 8-K filed with the SEC on March 8, 2013). 10.12 Form of LKQ Corporation performance-based Restricted Stock Unit Agreement for second tranche of restricted stock units granted in March 2013 (incorporated by reference to Exhibit 10.2 to the Company’s report on Form 8-K filed with the SEC on March 8, 2013). 10.13 Form of LKQ Corporation performance-based Restricted Stock Unit Agreement for third tranche of restricted stock units granted in March 2013 (incorporated by reference to Exhibit 10.3 to the Company’s report on Form 8-K filed with the SEC on March 8, 2013). 10.14 LKQ Corporation Amended and Restated Stock Option and Compensation Plan for Non-Employee Directors, as amended (incorporated herein by reference to Exhibit 10.5 to the Company’s report on Form 10-Q filed with the SEC on November 7, 2008). 10.15 Form of Indemnification Agreement between directors and officers of LKQ Corporation and LKQ Corporation (incorporated herein by reference to Exhibit 10.30 to the Company’s Registration Statement on Form S-1, Registration No. 333-107417 filed with the SEC on July 28, 2003). 10.11Form of LKQ Corporation Executive Officer 2010 Bonus Program (incorporated herein by reference to Exhibit 99.1 to the Company’s report on Form 8-K filed with the SEC on March 5, 2010). 10.1210.16 LKQ Management Incentive Plan (incorporated herein by reference to Appendix A to the Company’s Proxy Statement for its Annual Meeting of Stockholders on May 2, 2011 filed on March 17, 2011). 10.1310.17 Form of LKQ Corporation Executive Officer 20112012 Bonus Program Award Memorandum (incorporated herein by reference to Exhibit 99.110.15 to the Company’s report on Form 8-K10-K filed with the SEC on May 6, 2011)March 1, 2013).10.18 Form of LKQ Corporation Executive Officer 2013 Bonus Program Award Memorandum (incorporated by reference to Exhibit 10.16 to the Company’s report on Form 10-K filed with the SEC on March 1, 2013). 10.1410.19Form of LKQ Corporation Executive Officer 2014 Bonus Program Award Memorandum. 10.20 LKQ Corporation Long Term Incentive Plan (incorporated herein by reference to Exhibit 10.1Appendix B to the Company’s report on Form 8-K filed with the SECProxy. Statement for its Annual Meeting of Stockholders on May 12, 2006)7, 2012 filed on March 23, 2012). 10.15Form of LKQ Corporation Restricted Stock Agreement (incorporated herein by reference to Exhibit 10.1 to the Company’s report on Form 8-K filed with the SEC on January 17, 2008). 10.16Form of Restricted Stock Unit Agreement for Non-Employee Directors (incorporated herein by reference to Exhibit 10.1 to the Company’s report on Form 10-Q filed with the SEC on July 29, 2011). 10.1710.21 Consulting Agreement, as amended and restated, dated as of May 21, 2009 between LKQ Corporation and Joseph M. Holsten (incorporated herein by reference to Exhibit 10.2 to the Company’s report on Form 8-K filed with the SEC on May 21, 2009). 10.1810.22 Amendment Agreement dated as of January 31, 2011 to the Consulting Agreement between LKQ Corporation and Joseph M. Holsten dated as of May 21, 2009 (incorporated herein by reference to Exhibit 10.1 to the Company’s report on Form 8-K filed with the SEC on February 2, 2011). 101 10.1910.23 ISDA 2002 Master Agreement between Bank of America, N.A. and LKQ Corporation, and related Schedule (incorporated herein by reference to Exhibit 10.1 to the Company’s report on Form 10-Q filed with the SEC on April 29, 2011).Schedule. 10.2010.24 ISDA 2002 Master Agreement between JP Morgan ChaseCitizens Bank National Associationof Pennsylvania and LKQ Corporation, and related Schedule (incorporated herein by reference to Exhibit 10.1 to the Company’s report on Form 10-Q filed with the SEC on May 9, 2008).Schedule. 10.2110.25 ISDA 2002 Master Agreement between RBS Citizens, N.A. and LKQ Corporation, and related Schedule. 10.26 10.22Change of ControlISDA 2002 Master Agreement dated as of December 6, 2010 between Fifth Third Bank and LKQ Corporation, and Joseph M. Holstenrelated Schedule.10.27 ISDA 2002 Master Agreement between Wells Fargo Bank, National Association and LKQ Corporation, and related Schedule (incorporated by reference to Exhibit 10.1910.3 to the Company’s report on Form 10-K10-Q filed with the SEC on February 25, 2011)August 2, 2013). 10.2310.28 Change of Control Agreement dated as of December 6, 2010 between LKQ Corporation and Robert L. Wagman, as amended and restated as of March 21, 2012 (incorporated herein by reference to Exhibit 10.2010.1 to the Company’s report on Form 10-K8-K filed with the SEC on February 25, 2011)March 23, 2012). 10.2410.29 Change of Control Agreement dated as of December 6, 2010 between LKQ Corporation and John S. Quinn (incorporated herein by reference to Exhibit 10.21 to the Company’s report on Form 10-K filed with the SEC on February 25, 2011). 10.2510.30 Change of Control Agreement dated as of December 6, 2010 between LKQ Corporation and Walter P. Hanley (incorporated herein by reference to Exhibit 10.22 to the Company’s report on Form 10-K filed with the SEC on February 25, 2011). 10.2610.31 Change of Control Agreement dated as of December 6, 2010 between LKQ Corporation and Victor M. Casini (incorporated herein by reference to Exhibit 10.23 to the Company’s report on Form 10-K filed with the SEC on February 25, 2011). 10.2710.32 Change of Control Agreement dated as of March 14, 2011 between LKQ Corporation and Michael S. Clark (incorporated herein by reference to Exhibit 10.1 to the Company’s report on Form 8-K filed with the SEC on March 15, 2011). 10.33 10.28FormChange of Control Agreement dated as of December 6, 2010 between LKQ Corporation Restricted Stock Unit Agreementand Steven Greenspan. (incorporated herein by reference to Exhibit 10.2410.28 to the Company’s report on Form 10-K filed with the SEC on February 25, 2011)March 1, 2013)10.34 Receivables Sale Agreement dated as of September 28, 2012 among Keystone Automotive Industries, Inc., as an Originator, Greenleaf Auto Recyclers, LLC, as an Originator, and LKQ Receivables Finance Company, LLC, as Buyer (incorporated herein by reference to Exhibit 10.1 to the Company’s report on Form 8-K filed with the SEC on October 4, 2012). 10.35 Receivables Purchase Agreement dated as of September 28, 2012 among LKQ Receivables Finance Company, LLC, as Seller, LKQ Corporation, as Servicer, Victory Receivables Corporation, as a Conduit and The Bank of Tokyo-Mitsubishi UFJ, Ltd., as a Financial Institution, as Administrative Agent and as a Managing Agent (incorporated herein by reference to Exhibit 10.2 to the Company’s report on Form 8-K filed with the SEC on October 4, 2012). 10.2910.36Performance Undertaking, dated as of September 28, 2012 by LKQ Corporation in favor of LKQ Receivables Finance Company, LLC (incorporated herein by reference to Exhibit 10.3 to the Company’s report on Form 8-K filed with the SEC on October 4, 2012). 10.37 Agreement for the Sale and Purchase of Shares in the Capital of Euro Car Parts Holdings LimitedSator Beheer B.V. dated October 3, 2011April 23, 2013 by and among H2 Sator B.V., Cooperatieve H2 Sator U.A., Holding Sator Management B.V. and LKQ Corporation,Netherlands B.V. (incorporated by reference to Exhibit 10.1 to the Company’s report on Form 10-Q filed with the SEC on August 2, 2013).10.38 Proposed Activity Agreement dated April 22, 2013 between Draco Limited, LKQ Euro Limited and Draco Limited.LKQ Corporation (incorporated by reference to Exhibit 10.2 to the Company’s report on Form 10-Q filed with the SEC on August 2, 2013).10.39 Registration Rights Agreement dated as of May 9, 2013 among LKQ Corporation, the Guarantors, and Merrill Lynch, Pierce, Fenner & Smith Incorporated, as Representative of Initial Purchasers (incorporated herein by reference to Exhibit 10.6 to the Company's report on Form 8-K filed with the SEC on May 10, 2013). 12.110.40Agreement and Plan of Merger dated as of December 5, 2013 among Keystone Automotive Holdings, Inc., LKQ Corporation, KAH Acquisition Sub, Inc., certain stockholders of Keystone Automotive Holdings, Inc., and the Equityholders Representative. 12.1 Computation of Ratio of Earnings to Fixed Charges. 14.1 LKQ Corporation Code of Ethics (incorporated by reference to Exhibit 14.1 to the Company’s report on Form 10-Q filed with the SEC on August 2, 2013). 21.1 List of subsidiaries, jurisdictions and assumed names. 23.1Consent of Deloitte & Touche LLP. 31.123.1Consent of Independent Registered Public Accounting Firm. 31.1 Certification of Chief Executive Officer Pursuant to Rule 13a-14(a) or Rule 15d-14(a), as adopted pursuant to Section 302 of the Sarbanes-Oxley Act of 2002. 31.2 Certification of Chief Financial Officer Pursuant to Rule 13a-14(a) or Rule 15d-14(a), as adopted pursuant to Section 302 of the Sarbanes-Oxley Act of 2002. 32.1 Certification of Chief Executive Officer Pursuant to 18 U.S.C. Section 1350, as adopted pursuant to Section 906 of the Sarbanes-Oxley Act of 2002. 32.2 Certification of Chief Financial Officer Pursuant to 18 U.S.C. Section 1350, as adopted pursuant to Section 906 of the Sarbanes-Oxley Act of 2002. 101.INS XBRL Instance Document 101.SCH XBRL Taxonomy Extension Schema Document 102101.CAL XBRL Taxonomy Extension Calculation Linkbase Document 101.DEF XBRL Taxonomy Extension Definition Linkbase Document 101.LAB XBRL Taxonomy Extension Label Linkbase Document 101.PRE XBRL Taxonomy Extension Presentation Linkbase Document 103SIGNATURESFebruary 27, 2012.LKQ CORPORATIONBy:LKQ CORPORATION S/s/ ROBERT L. WAGMANRobert L. Wagman President and Chief Executive Officer February 27, 2012.March 3, 2014.SignatureTitlePrincipal Executive Officer:Title Principal Executive Officer: Robert L. WagmanPresident and Chief Executive Officer Robert L. Wagman Principal Financial Officer: John S. QuinnExecutive Vice President and Chief Financial Officer John S. Quinn Principal Accounting Officer: Michael S. ClarkVice President—Finance and Controller Michael S. Clark A Majority of the Directors: A.A. CLINTON ALLENA. Clinton AllenDirector A. Clinton Allen VICTOR M. CASINIRVictor M. CasiniONALD G. FOSTER Director Ronald G. Foster KEVIN F. FLYNNJKevin F. FlynnOSEPH M. HOLSTEN Director Joseph M. Holsten RONALD G. FOSTERBRonald G. FosterLYTHE J. MCGARVIE Director Blythe J. McGarvie JOSEPHPAUL M. HOLSTENMJoseph M. HolstenEISTERDirector /s/ PAUL M. MEISTER Director John F. O'Brien JOHN F. O’BRIENGJohn F. O’BrienUHAN SUBRAMANIAN Director Guhan Subramanian Robert L. WagmanDirector Robert L. Wagman , IVDirector William M. Webster, IV Director104