UNITED STATES SECURITIES AND EXCHANGE COMMISSION
Washington, D.C. 20549
Form 10-K
ANNUAL REPORT PURSUANT TO SECTION 13 OR 15(d) OF
OF THE SECURITIES EXCHANGE ACT OF 1934
For the fiscal year ended December 31, | Commission File Number: 001-14965 |
The Goldman Sachs Group, Inc.
(Exact name of registrant as specified in its charter)
| Delaware | 13-4019460 | |
(State or other jurisdiction of incorporation or organization) | (I.R.S. Employer Identification No.) | |
200 West Street | 10282 | |
New York, N.Y. |
| |
| (Address of principal executive offices) | (Zip Code) | |
(212) 902-1000
(Registrant’s telephone number, including area code)
Securities registered pursuant to Section 12(b) of the Act:
| Title of each class: | Name of each exchange on which registered: | |
Common stock, par value $.01 per share | New York Stock Exchange | |
Depositary Shares, Each Representing 1/1,000th Interest in a Share of Floating Rate Non-Cumulative Preferred Stock, Series A | New York Stock Exchange | |
Depositary Shares, Each Representing 1/1,000th Interest in a Share of 6.20% Non-Cumulative Preferred Stock, Series B | New York Stock Exchange | |
Depositary Shares, Each Representing 1/1,000th Interest in a Share of Floating Rate Non-Cumulative Preferred Stock, Series C | New York Stock Exchange | |
Depositary Shares, Each Representing 1/1,000th Interest in a Share of Floating Rate Non-Cumulative Preferred Stock, Series D | New York Stock Exchange | |
Depositary Shares, Each Representing 1/1,000th Interest in a Share of Floating Rate Non-Cumulative Preferred Stock, Series I | New York Stock Exchange | |
Depositary Shares, Each Representing 1/1,000th Interest in a Share of 5.50% Fixed-to-Floating Rate Non-Cumulative Preferred Stock, Series | New York Stock Exchange | |
Depositary Shares, Each Representing 1/1,000th Interest in a Share of 6.375% Fixed-to-Floating Rate Non-Cumulative Preferred Stock, Series K | New York Stock Exchange | |
| ||
| ||
| ||
| ||
| ||
| ||
| ||
|
Securities registered pursuant to Section 12(g) of the Act: None
Indicate by check mark if the registrant is a well-known seasoned issuer, as defined in Rule 405 of the Securities Act.
Yesx NoYes¨ No
Indicate by check mark if the registrant is not required to file reports pursuant to Section 13 or 15(d) of the Act.
Yes¨ NoYesx No
Indicate by check mark whether the registrant (1) has filed all reports required to be filed by Section 13 or 15(d) of the Securities Exchange Act of 1934 during the preceding 12 months (or for such shorter period that the registrant was required to file such reports), and (2) has been subject to such filing requirements for the past 90 days.
Yesx NoYes¨ No
Indicate by check mark whether the registrant has submitted electronically and posted on its corporate Web site, if any, every Interactive Data File required to be submitted and posted pursuant to Rule 405 of Regulation S-T during the preceding 12 months (or for such shorter period that the registrant was required to submit and post such files).
Yesx NoYes¨ No
Indicate by check mark if disclosure of delinquent filers pursuant to Item 405 of Regulation S-K is not contained herein, and will not be contained, to the best of registrant’s knowledge, in definitive proxy or information statements incorporated by reference in Part III of the Annual Report on Form 10-K or any amendment to the Annual Report on Form 10-K.x
Indicate by check mark whether the registrant is a large accelerated filer, an accelerated filer, a non-accelerated filer, or a smaller reporting company. See the definitions of “large accelerated filer,” “accelerated filer” and “smaller reporting company” in Rule 12b-2 of the Exchange Act.
Large accelerated filer x | Accelerated filer ¨ | Non-accelerated filer ¨ | Smaller reporting company ¨ | |||
(Do not check if a smaller reporting company) | ||||||
Indicate by check mark whether the registrant is a shell company (as defined in Rule 12b-2 of the Exchange Act). Yes¨ NoYesx No
As of June 30, 2011,2014, the aggregate market value of the common stock of the registrant held by non-affiliates of the registrant was approximately $66.6$72.4 billion.
As of February 17, 2012,6, 2015, there were 494,904,018435,621,157 shares of the registrant’s common stock outstanding.
Documents incorporated by reference: Portions of The Goldman Sachs Group, Inc.’s Proxy Statement for its 20122015 Annual Meeting of Shareholders are incorporated by reference in the Annual Report on Form 10-K in response to Part III, Items 10, 11, 12, 13 and 14.
THE GOLDMAN SACHS GROUP, INC.
ANNUAL REPORT ON FORM 10-K FOR THE FISCAL YEAR ENDED DECEMBER 31, 20112014
| Form 10-K Item Number | Page No. | |||||
| 1 | ||||||
| 1 | ||||||
| 1 | ||||||
| 1 | ||||||
| 2 | ||||||
| 3 | ||||||
| 5 | ||||||
| 5 | ||||||
| 6 | ||||||
| 6 | ||||||
| 6 | ||||||
| 8 | ||||||
| 23 | ||||||
Cautionary Statement Pursuant to the U.S. Private Securities Litigation Reform Act of 1995 | 24 | |||||
| 44 | ||||||
| 45 | ||||||
Management’s Discussion and Analysis of Financial Condition and Results of Operations | ||||||
Changes in and Disagreements with Accountants on Accounting and Financial Disclosure | ||||||
Security Ownership of Certain Beneficial Owners and Management and Related Stockholder Matters | ||||||
Certain Relationships and Related Transactions, and Director Independence | ||||||
| II-1 | ||||||
THE GOLDMAN SACHS GROUP, INC. AND SUBSIDIARIES
Goldman Sachs is a leading global investment banking, securities and investment management firm that provides a wide range of financial services to a substantial and diversified client base that includes corporations, financial institutions, governments and high-net-worth individuals.
When we use the terms “Goldman Sachs,” “the firm,” “we,” “us” and “our,” we mean The Goldman Sachs Group, Inc. (Group Inc.), a Delaware corporation, and its consolidated subsidiaries.
References to “this“the 2014 Form 10-K” are to our Annual Report on Form 10-K for the fiscal year ended December 31, 2011.2014. All references to 2011, 20102014, 2013 and 20092012 refer to our fiscal years ended, or the dates, as the context requires, December 31, 2011,2014, December 31, 20102013 and December 31, 2009,2012, respectively.
Group Inc. is a bank holding company and a financial holding company regulated by the Board of Governors of the Federal Reserve System (Federal Reserve Board). Our U.S. depository institution subsidiary, Goldman Sachs Bank USA (GS Bank USA), is a New York State-chartered bank.
As of December 2011,2014, we had offices in over 30 countries and 48%49% of our total staff was based outside the Americas (which includes the countries in North and South America).Americas. Our clients are located worldwide, and we are an active participant in financial markets around the world. In 2011,2014, we generated 38%42% of our net revenues outside the Americas. For more information onabout our geographic results, see Note 25 to the consolidated financial statements in Part II, Item 8 of this the 2014Form 10-K.
Our Business Segments and Segment Operating Results
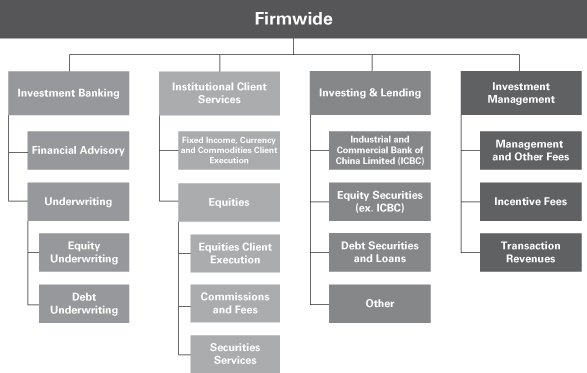
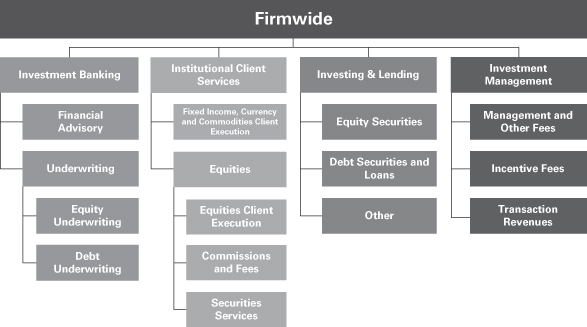
We report our activities in four business segments: Investment Banking, Institutional Client Services, Investing & Lending and Investment Management. The chart below presents our four business segments.
| Goldman Sachs | 1 |
THE GOLDMAN SACHS GROUP, INC. AND SUBSIDIARIES
The table below presents our segment operating results.
| Year Ended December 1 | % of 2011 | Year Ended December 1 | % of 2014 | |||||||||||||||||||||||||||||||
| $ in millions | 2011 | 2010 | 2009 | Net Revenues | 2014 | 2013 | 2012 | | Net Revenues | | ||||||||||||||||||||||||
Investment Banking | Net revenues | $ | 4,355 | $ | 4,810 | $ | 4,984 | 15 | % | |||||||||||||||||||||||||
Net revenues | $ 6,464 | $ 6,004 | $ 4,926 | 19% | ||||||||||||||||||||||||||||||
| Operating expenses | 2,962 | 3,511 | 3,482 | |||||||||||||||||||||||||||||||
Operating expenses | 3,688 | 3,479 | 3,333 | |||||||||||||||||||||||||||||||
Pre-tax earnings | $ 2,776 | $ 2,525 | $ 1,593 | |||||||||||||||||||||||||||||||
Institutional Client Services |
Institutional Client Services |
| ||||||||||||||||||||||||||||||||
Net revenues | $15,197 | $15,721 | $18,124 | 44% | ||||||||||||||||||||||||||||||
| Pre-tax earnings | $ | 1,393 | $ | 1,299 | $ | 1,502 | ||||||||||||||||||||||||||||
Operating expenses | 10,880 | 11,792 | 12,490 | |||||||||||||||||||||||||||||||
Pre-tax earnings | $ 4,317 | $ 3,929 | $ 5,634 | |||||||||||||||||||||||||||||||
Investing & Lending | ||||||||||||||||||||||||||||||||||
Net revenues | $ 6,825 | $ 7,018 | $ 5,891 | 20% | ||||||||||||||||||||||||||||||
Institutional Client Services | Net revenues | $ | 17,280 | $ | 21,796 | $ | 32,719 | 60 | % | |||||||||||||||||||||||||
Operating expenses | 2,819 | 2,686 | 2,668 | |||||||||||||||||||||||||||||||
Pre-tax earnings | $ 4,006 | $ 4,332 | $ 3,223 | |||||||||||||||||||||||||||||||
Investment Management |
Investment Management |
| ||||||||||||||||||||||||||||||||
Net revenues | $ 6,042 | $ 5,463 | $ 5,222 | 17% | ||||||||||||||||||||||||||||||
| Operating expenses | 12,697 | 14,291 | 13,691 | |||||||||||||||||||||||||||||||
Operating expenses | 4,647 | 4,357 | 4,296 | |||||||||||||||||||||||||||||||
Pre-tax earnings | $ 1,395 | $ 1,106 | $ 926 | |||||||||||||||||||||||||||||||
Total net revenues | $34,528 | $34,206 | $34,163 | |||||||||||||||||||||||||||||||
| Pre-tax earnings | $ | 4,583 | $ | 7,505 | $ | 19,028 | ||||||||||||||||||||||||||||
Investing & Lending | Net revenues | $ | 2,142 | $ | 7,541 | $ | 2,863 | 7 | % | |||||||||||||||||||||||||
| Operating expenses | 2,673 | 3,361 | 3,523 | |||||||||||||||||||||||||||||||
| Pre-tax earnings/(loss) | $ | (531 | ) | $ | 4,180 | $ | (660 | ) | ||||||||||||||||||||||||||
Investment Management | Net revenues | $ | 5,034 | $ | 5,014 | $ | 4,607 | 18 | % | |||||||||||||||||||||||||
| Operating expenses | 4,018 | 4,051 | 3,673 | |||||||||||||||||||||||||||||||
| Pre-tax earnings | $ | 1,016 | $ | 963 | $ | 934 | ||||||||||||||||||||||||||||
Total | Net revenues | $ | 28,811 | $ | 39,161 | $ | 45,173 | |||||||||||||||||||||||||||
| Operating expenses 2 | 22,642 | 26,269 | 25,344 | |||||||||||||||||||||||||||||||
| Pre-tax earnings | $ | 6,169 | $ | 12,892 | $ | 19,829 | ||||||||||||||||||||||||||||
Total operating expenses 2 | 22,171 | 22,469 | 22,956 | |||||||||||||||||||||||||||||||
Total pre-tax earnings | $12,357 | $11,737 | $11,207 | |||||||||||||||||||||||||||||||
| 1. | Financial information concerning our business segments for |
| 2. | Includes |
Investment Banking serves corporatepublic and governmentprivate sector clients around the world. We provide financial advisory services and help companies raise capital to strengthen and grow their businesses. We seek to develop and maintain long-term relationships with a diverse global group of institutional clients, including governments, states and municipalities. Our goal is to deliver to our institutional clients the entire resources of the firm in a seamless fashion, with investment banking serving as the main initial point of contact with Goldman Sachs.
Financial AdvisoryAdvisory.. Financial Advisory includes strategic advisory assignments with respect to mergers and acquisitions, divestitures, corporate defense activities, restructurings, spin-offs and risk management, restructurings and spin-offs.management. In particular, we help clients execute large, complex transactions for which we provide multiple services, including “one-stop” acquisition financing and cross-border structuring expertise. Financial Advisory also includes revenues from derivative transactions directly related to these client advisory assignments.
We also assist our clients in managing their asset and liability exposures and their capital. In addition, we may provide lending commitments and bank loan and bridge loan facilities in connection with our advisory assignments.
UnderwritingUnderwriting.. The other core activity of Investment Banking is helping companies raise capital to fund their businesses. As a financial intermediary, our job is to match the capital of our investing clients — who aim to grow the savings of millions of people — with the needs of our corporatepublic and governmentprivate sector clients — who need financing to generate growth, create jobs and deliver products and services. Our underwriting activities include public offerings and private placements, including domesticlocal and cross-border transactions, of a wide range of securities and other financial instruments. Underwriting also includes revenues from derivative transactions entered into with institutionalpublic and private sector clients in connection with our underwriting activities.
THE GOLDMAN SACHS GROUP, INC. AND SUBSIDIARIES
Equity Underwriting. We underwrite common and preferred stock and convertible and exchangeable securities. We regularly receive mandates for large, complex transactions and have held a leading position in worldwide public common stock offerings and worldwide initial public offerings for many years.
Debt Underwriting.We underwrite and originate various types of debt instruments, including investment-grade and high-yield debt, bank loans and bridge loans, and emerging- and growth-market debt, which may be issued by, among others, corporate, sovereign, municipal and agency issuers. In addition, we underwrite and originate structured securities, which include mortgage-related securities and other asset-backed securities.
| 2 | Goldman Sachs 2014 Form 10-K | |||
THE GOLDMAN SACHS GROUP, INC. AND SUBSIDIARIES
Institutional Client Services serves our clients who come to the firm to buy and sell financial products, raise funding and manage risk. We do this by acting as a market maker and offering market expertise on a global basis. Institutional Client Services makes markets and facilitates client transactions in fixed income, equity, currency and commodity products. In addition, we make markets in and clear client transactions on major stock, options and futures exchanges worldwide. Market makers provide liquidity and play a critical role in price discovery, which contributes to the overall efficiency of the capital markets. Our willingness to make markets, commit capital and take risk in a broad range of products is crucial to our client relationships.
Our clients are primarily institutions that are professional market participants, including investment entities whose ultimate customers include individual investors investing for their retirement, buying insurance or putting aside surplus cash in a deposit account.
Through our global sales force, we maintain relationships with our clients, receiving orders and distributing investment research, trading ideas, market information and analysis. As a market maker, we provide prices to clients globally across thousands of products in all major asset classes and markets. At times we take the other side of transactions ourselves if a buyer or seller is not readily available and at other times we connect our clients to other parties who want to transact. Much of this connectivity between the firm and its clients is maintained on technology platforms and operates globally wherever and whenever markets are open for trading.
Institutional Client Services and our other businesses are supported by our Global Investment Research division, which, as of December 2011,2014, provided fundamental research on more than 3,7003,600 companies worldwide and more than 40 national economies, as well as on industries, currencies and commodities.
Institutional Client Services generates revenues in four ways:
| Ÿ | In large, highly liquid markets (such as markets for U.S. Treasury bills, large capitalization S&P 500 stocks or certain mortgage pass-through securities), we execute a high volume of transactions for our clients for modest spreads and |
| Ÿ | In less liquid markets (such as mid-cap corporate bonds, growth market currencies |
| Ÿ | We also structure and execute transactions involving customized or tailor-made products that address our clients’ risk exposures, investment objectives or other complex needs (such as a jet fuel hedge for an airline) |
| Ÿ | We provide financing to our clients for their securities trading activities, as well as securities lending and other prime brokerage services. |
Institutional Client Services activities are organized by asset class and include both “cash” and “derivative” instruments. “Cash” refers to trading the underlying instrument (such as a stock, bond or barrel of oil). “Derivative” refers to instruments that derive their value from underlying asset prices, indices, reference rates and other inputs, or a combination of these factors (such as an option, which is the right or obligation to buy or sell a certain bond or stock index on a specified date in the future at a certain price, or an interest rate swap, which is the agreement to convert a fixed rate of interest into a floating rate or vice versa).
| Goldman Sachs | 3 |
THE GOLDMAN SACHS GROUP, INC. AND SUBSIDIARIES
Fixed Income, Currency and Commodities Client Execution. Includes interest rate products, credit products, mortgages, currencies and commodities.
| Ÿ | Interest Rate Products. Government bonds, money market instruments such as commercial paper, treasury bills, repurchase agreements and other highly liquid securities and instruments, as well as interest rate swaps, options and other derivatives. |
| Ÿ | Credit Products.Investment-grade corporate securities, high-yield securities, credit derivatives, bank and |
| Ÿ | Mortgages.Commercial mortgage-related securities, loans and derivatives, residential mortgage-related securities, loans and derivatives (including U.S. government agency-issued collateralized mortgage obligations, other prime, subprime and Alt-A securities and loans), and other asset-backed securities, loans and derivatives. |
| Ÿ | Currencies.Most currencies, including growth-market currencies. |
| Ÿ | Commodities. |
Equities.Includes equityequities client execution, commissions and fees, and securities services.
Equities Client Execution.Execution.We make markets in equity securities and equity-related products, including convertible securities, options, futures and over-the-counter (OTC) derivative instruments, on a global basis. As a principal, we facilitate client transactions by providing liquidity to our clients with large blocks of stocks or options,derivatives, requiring the commitment of our capital. In addition, we engage in insurance activities where we reinsure and purchase portfolios of insurance risk and pension liabilities.
We also structure and executemake markets in derivatives on indices, industry groups, financial measures and individual company stocks. We develop strategies and provide information about portfolio hedging and restructuring and asset allocation transactions for our clients. We also work with our clients to create specially tailored instruments to enable sophisticated investors to establish or liquidate
investment positions or undertake hedging strategies. We are one of the leading participants in the trading and development of equity derivative instruments.
Our exchange-based market-making activities include making markets in stocks and exchange-traded funds. In the United States, we are one of the leading Designated Market Makers (DMMs) for stocks traded on the NYSE. For ETFs, we are registered market makers on NYSE Arca. In listed options, we are registered as a primary or lead market maker or otherwise make markets on the International Securities Exchange, the Chicago Board Options Exchange, NYSE Arca, the Boston Options Exchange, the Philadelphia Stock Exchange and NYSE Amex. Infunds, futures and options on futures, we are market makers on the Chicago Mercantile Exchange and the Chicago Board of Trade.major exchanges worldwide.
Commissions and Fees. We generate commissions and fees from executing and clearing institutional client transactions on major stock, options and futures exchanges worldwide.worldwide, as well as OTC transactions. We increasingly provide our clients with access to a broad spectrum of equity execution services, including electronic “low-touch” equity trading platforms,access and electronic trades account formore traditional “high-touch” execution. While the majority of our equity trading activity. However, aactivity is “low-touch,” the majority of our net revenues in these activities continue to be derived from our traditional “high-touch” handling of more complex trades.activity. We expect both types of activity to remain important.
Securities Services.Includes financing, securities lending and other prime brokerage services.
| Ÿ | Financing Services.We provide financing to our clients for their securities trading activities through margin loans that are collateralized by securities, cash or other acceptable collateral. We earn a spread equal to the difference between the amount we pay for funds and the amount we receive from our client. |
| Ÿ | Securities Lending Services.We provide services that principally involve borrowing and lending securities to cover institutional clients’ short sales and borrowing securities to cover our short sales and otherwise to make deliveries into the market. In addition, we are an active participant in broker-to-broker securities lending and third-party agency lending activities. |
| Ÿ | Other Prime Brokerage Services. We earn fees by providing clearing, settlement and custody services globally. In addition, we provide our hedge fund and other clients with a technology platform and reporting which enables them to monitor their security portfolios and manage risk exposures. |
| 4 | Goldman Sachs |
THE GOLDMAN SACHS GROUP, INC. AND SUBSIDIARIES
|
Our investing and lending activities, which are typically longer-term, include the firm’s investing and relationship lending activities across various asset classes, primarily including debt securities and loans, public and private equity securities, and real estate. These activities include investing directly in publicly and privately traded securities and in loans, and also through certain investment funds that we manage. We also provide financing to our clients. We manage a diversified global portfolio of investments in equity securities and debt securities and other investments in privately negotiated transactions, leveraged buyouts, acquisitions and investments in funds managed by external parties.
ICBC. We have an investment in the ordinary shares of ICBC, the largest bank in China.also provide financing to our clients.
Equity Securities (excluding ICBC)Securities.. We make corporate, real estate and infrastructure equity-related investments.
Debt Securities and LoansLoans.. We make corporate, real estate, infrastructure and infrastructureother debt security-related investments. In addition, we provide credit to corporate clients through loan facilities and to high-net-worth individuals primarily through secured loans.
OtherOther.. Our other investments primarily include our consolidated investment entities,investments, for which are entities we hold for investment purposes strictly for capital appreciation. These entities have a definedan exit strategy and which are engaged in activities that are not closely related to our principal businesses. We also invest directly in distressed assets, currencies, commodities and other assets, including power generation facilities.
Investment Management provides investment and wealth advisory services to help clients preserve and grow their financial assets. Our clients include institutions and high-net-worth individuals, as well as retail investors who access our products through a network of third-party distributors around the world.
We manage client assets across a broad range of asset classes and investment strategies, including equity, fixed income and alternative investments. Alternative investments primarily include hedge funds, credit funds, private equity, real estate, currencies, commodities, and asset allocation strategies. Our investment offerings include those managed on a fiduciary basis by our portfolio managers as well as strategies managed by third-party managers. We offer our investments in a variety of structures, including separately managed accounts, mutual funds, private partnerships, and other commingled vehicles.
We also provide customized investment advisory solutions designed to address our clients’ investment needs. These solutions begin with identifying clients’ objectives and continue through portfolio construction, ongoing asset allocation and risk management and investment realization. We draw from a variety of third-party managers as well as our proprietary offerings to implement solutions for clients.
We supplement our investment advisory solutions for high-net-worth clients with wealth advisory services that include income and liability management, trust and estate planning, philanthropic giving and tax planning. We also use the firm’s global securities and derivatives market-making capabilities to address clients’ specific investment needs.
Management and Other Fees. The majority of revenues in management and other fees is comprised of asset-based management fees on client assets. The fees that we charge vary by asset class and are affected by investment performance as well as asset inflows and redemptions. Other fees we receive include financial counseling fees generated through our wealth advisory services and fees related to the administration of real estate assets.
THE GOLDMAN SACHS GROUP, INC. AND SUBSIDIARIES
Assets under supervision include assets under management and other client assets. Assets under management include only those client assets where we earn a fee for managing assets on a discretionary basis. This includes net assets in our mutual funds, hedge funds, credit funds and private equity funds (including real estate funds), and separately managed accounts for institutional and individual investors. Other client assets include client assets invested with third-party managers, bank deposits and advisory relationships where we earn a fee for advisory and other services, but do not have investment discretion. Assets under managementsupervision do not include the self-directed brokerage assets of our clients, including brokerage accounts, or interest-bearing deposits held through ourclients. Long-term assets under supervision represent assets under supervision excluding liquidity products. Liquidity products represent money markets and bank depository institution subsidiaries.deposit assets.
| Goldman Sachs 2014 Form 10-K | 5 |
THE GOLDMAN SACHS GROUP, INC. AND SUBSIDIARIES
Incentive Fees.In certain circumstances, we are also entitled to receive incentive fees based on a percentage of a fund’s or a separately managed account’s return, or when the return exceeds a specified benchmark or other performance targets. Such fees include overrides, which
consist of the increased share of the income and gains derived primarily from our private equity funds when the return on a fund’s investments over the life of the fund exceeds certain threshold returns. Incentive fees are recognized only when all material contingencies are resolved.
Transaction Revenues.We receive commissions and net spreads for facilitating transactional activity in high-net-worth client accounts. In addition, we earn net interest income primarily associated with client deposits and margin lending activity undertaken by such clients.
The tables below present assets under management by asset class and by distribution channel and client category.
| As of December | ||||||||||||
| in billions | 2011 | 2010 | 2009 | |||||||||
Alternative investments | $ | 142 | $ | 148 | $ | 146 | ||||||
Equity | 126 | 144 | 146 | |||||||||
Fixed income | 340 | 340 | 315 | |||||||||
Total non-money market assets | 608 | 632 | 607 | |||||||||
Money markets | 220 | 208 | 264 | |||||||||
Total assets under management | $ | 828 | $ | 840 | $ | 871 | ||||||
| As of December | ||||||||||||
| in billions | 2011 | 2010 | 2009 | |||||||||
Directly Distributed: | ||||||||||||
Institutional | $ | 283 | $ | 286 | $ | 297 | ||||||
High-net-worth individuals | 227 | 229 | 231 | |||||||||
Third-Party Distributed: | ||||||||||||
Institutional, high-net-worth individuals and retail | 318 | 325 | 343 | |||||||||
Total | $ | 828 | $ | 840 | $ | 871 | ||||||
Business Continuity and Information Security
Business continuity and information security, including cybersecurity,cyber security, are high priorities for Goldman Sachs. Their importance has been highlighted by Hurricane Sandy and several recent highly publicized cyber attacks against financial institutions and large consumer-based companies that resulted in the unauthorized disclosure of personal information of clients and/or customers, as well as other cyber attacks involving the theft and destruction of corporate information.
Our Business Continuity Program has been developed to provide reasonable assurance of business continuity in the event of disruptions at the firm’s critical facilities and to comply with regulatory requirements, including those of FINRA. Because we are a bank holding company, our Business Continuity Program is also subject to review by the Federal Reserve Board. The key elements of the program are crisis planning and management, people recovery, facilities, business recovery, systems and data recovery, and process improvement. In the area of information security, we have developed and implemented a framework of principles,
policies and technology to protect the information assets provided to us by our clients and thosethat of the firm from cyber attacks and other misappropriation, corruption or loss. Safeguards are applied to maintain the confidentiality, integrity and availability of information resources.information.
Management believes that a major strength and principal reason for the success of Goldman Sachs is the quality and dedication of our people and the shared sense of being part of a team. We strive to maintain a work environment that fosters professionalism, excellence, diversity, cooperation among our employees worldwide and high standards of business ethics.
THE GOLDMAN SACHS GROUP, INC. AND SUBSIDIARIES
Instilling the Goldman Sachs culture in all employees is a continuous process, in which training plays an important part. All employees are offered the opportunity to participate in education and periodic seminars that we sponsor at various locations throughout the world. Another important part of instilling the Goldman Sachs culture is our employee review process. Employees are reviewed by supervisors, co-workers and employees they supervise in a 360-degree review process that is integral to our team approach, and includes an evaluation of an employee’s performance with respect to risk management, compliance and diversity.
As of December 2011,2014, we had 33,30034,000 total staff, excluding staff at consolidated entities held for investment purposes. See “Management’s Discussion and Analysis of Financial Condition and Results of Operations — Results of Operations — Operating Expenses” in Part II, Item 7 of this Form 10-K for additional information on our consolidated entities held for investment purposes.staff.
The financial services industry — and all of our businesses — are intensely competitive, and we expect them to remain so. Our competitors are other entities that provide investment banking, securities and investment management services, as well as those entities that make investments in securities, commodities, derivatives, real estate, loans and other financial assets. These entities include brokers and dealers, investment banking firms, commercial banks, insurance companies, investment advisers, mutual funds, hedge funds, private equity funds and merchant banks. We compete with some entities globally and with others on a regional, product or niche basis. Our competition is based on a number of factors, including transaction execution, products and services, innovation, reputation and price.
We also face intense competition in attracting and retaining qualified employees. Our ability to continue to compete effectively will depend upon our ability to attract new employees, retain and motivate our existing employees and to continue to compensate employees competitively amid intense public and regulatory scrutiny on the compensation practices of large financial institutions. Our pay practices and those of our principal competitors are subject to review by, and the standards of, the Federal Reserve Board and regulators outside the United States, including the Financial Services Authority (FSA) in the United Kingdom. See “Regulation — Banking Regulation” and “Regulation — Compensation Practices” below and “Risk Factors — Our businesses may be adversely affected if we are unable to hire and retain qualified employees” in Part I, Item 1A of this Form 10-K for more information on the regulation of our compensation practices.
| 6 | Goldman Sachs 2014 Form 10-K |
THE GOLDMAN SACHS GROUP, INC. AND SUBSIDIARIES
Over time, there has been substantial consolidation and convergence among companies in the financial services industry. This trend acceleratedindustry and, in recent years asparticular, the credit crisis caused numerous mergers and asset acquisitions among industry participants. Many commercial banks and other broad-based financial services firms have the ability to support investment banking and securities products with commercial banking, insurance and other financial services revenues in an effortEfforts by our competitors to gain market share which hashave resulted in pricing pressure in our investment banking and client execution businesses and could result in pricing pressure in other of our businesses.
Moreover, we have faced, and expect to continue to face, pressure to retain market share by committing capital to businesses or transactions on terms that offer returns that may not be commensurate with their risks. In particular, corporate clients seek such commitments (such as agreements to participate in their commercial paper backstop or other loan facilities) from financial services firms in connection with investment banking and other assignments.
THE GOLDMAN SACHS GROUP, INC. AND SUBSIDIARIES
Consolidation and convergence have significantly increased the capital base and geographic reach of some of our competitors, and have also hastened the globalization of the securities and other financial services markets. As a result, we have had to commit capital to support our international operations and to execute large global transactions. To take advantage of some of our most significant opportunities, we will have to compete successfully with financial institutions that are larger and have more capital and that may have a stronger local presence and longer operating history outside the United States. We also compete with smaller institutions that offer more targeted services, such as independent advisory firms. Some clients may perceive these firms to be less susceptible to potential conflicts of interest than we are, and, as discussed below, our ability to effectively compete with them could be affected by regulations and limitations on activities that apply to us but may not apply to them.
We have experienced intense price competition in some of our businesses in recent years. For example, over the past several years the increasing volume of trades executed electronically, through the internet and through alternative trading systems, has increased the pressure on trading commissions, in that commissions for “low-touch” electronic trading are generally lower than for “high-touch” non-electronic trading. It appears that this trend toward electronic and other “low-touch,” low-commission trading will continue. In addition, we believe that we will continue to experience competitive pressures in these and other areas in the future as some of our competitors seek to obtain market share by further reducing prices.
The provisions of the U.S. Dodd-Frank Wall Street Reform and Consumer Protection Act (Dodd-Frank Act), the requirements promulgated by the Basel Committee on Banking Supervision (Basel Committee) and other financial regulation could affect our competitive position to the extent that limitations on activities, increased fees and compliance costs or other regulatory requirements do not apply, or do not apply equally, to all of our competitors or are not implemented uniformly across different jurisdictions. For example, the provisions of the Dodd-Frank Act that prohibit proprietary trading and restrict investments in certain hedge and private equity funds differentiate between U.S.-based and non-U.S.-based banking organizations and give non-U.S.-based banking organizations greater flexibility to trade outside of the United States and to form and invest in funds outside the United States. Likewise, the obligations with respect to derivative transactions under Title VII of the Dodd-Frank Act depend, in part, on the location of the counterparties to the transaction. The impact of the Dodd-Frank Act and other regulatory developments on our competitive position will depend to a large extent on the manner in which the required rulemaking and regulatory guidance evolve, the extent of international convergence, and the development of market practice and structures under the new regulatory regimes as discussed further under “Regulation” below.
We also face intense competition in attracting and retaining qualified employees. Our ability to continue to compete effectively will depend upon our ability to attract new employees, retain and motivate our existing employees and to continue to compensate employees competitively amid intense public and regulatory scrutiny on the compensation practices of large financial institutions. Our pay practices and those of certain of our competitors are subject to review by, and the standards of, the Federal Reserve Board and regulators outside the United States, including the Prudential Regulation Authority (PRA) and the Financial Conduct Authority (FCA) in the United Kingdom. We also compete for employees with institutions whose pay practices are not subject to regulatory oversight. See “Regulation — Bank Holding Company Regulation” and “Regulation — Compensation Practices” below and “Risk Factors — Our businesses may be adversely affected if we are unable to hire and retain qualified employees” in Part I, Item 1A of the 2014 Form 10-K for more information about the regulation of our compensation practices.
| Goldman Sachs 2014 Form 10-K | 7 |
THE GOLDMAN SACHS GROUP, INC. AND SUBSIDIARIES
As a participant in the banking, securities, investment management, OTCand derivatives futures and options and insurance industries, we are subject to extensive regulation worldwide. Regulatory bodies around the world are generally charged with safeguarding the integrity of the securities and other financial markets and with protecting the interests of the customers of market participants, including depositors in banking entities and the customers of broker-dealers.banks, broker-dealers, investment advisers, swap dealers and security-based swap dealers.
The financial services industry has been the subject of intense regulatory scrutiny in recent years. Our businesses have been subject to increasing regulation and supervision in the United States and other countries, and we expect this trend to continue in the future. In particular, the Dodd-Frank Act, which was enacted in July 2010, significantly altered the financial regulatory regime within which we operate. Not all the rules required or expected to be implemented under the Dodd-Frank Act have been proposed or adopted, and certain of the rules that have been proposed or adopted under the Dodd-Frank Act are subject to phase-in or transitional periods. The implications of the Dodd-Frank Act for our businesses willcontinue to depend to a large extent on the rules that will be adoptedimplementation of the legislation by the Federal Reserve Board, the FDIC, the SEC, the CFTCU.S. Commodity Futures Trading Commission (CFTC) and other agencies, to implement the legislation, as well as the development of market practices and structures under the regime established by the legislation and the implementing rules. SimilarOther reforms have been adopted or are being considered by other regulators and policy makers worldwide, as discussed further throughout this section. We will continue to assessupdate our business, risk management, and compliance practices to conform to developments in the regulatory environment.
BankingBank Holding Company Regulation
Group Inc. is a bank holding company under the Bank Holding Company Act of 1956 (BHC Act) and a financial holding company under amendments to the BHC Act effected by the U.S. Gramm-Leach-Bliley Act of 1999 (GLB Act).
THE GOLDMAN SACHS GROUP, INC. AND SUBSIDIARIES
Supervision and Regulation
As a bank holding company and a financial holding company under the BHC Act, Group Inc. is subject to supervision and examination by the Federal Reserve Board. Under the system of “functional regulation” established under the BHC Act, the Federal Reserve Board serves as the primary regulator of our consolidated organization, but generally defers to the primary regulators of our U.S. non-bank subsidiaries with respect to the activities of those subsidiaries. Such “functionally regulated” U.S. non-bank subsidiaries include broker-dealers registered with the SEC, such as our principal U.S. broker-dealer, Goldman, Sachs & Co. (GS&Co.), insurance companiesentities registered with or regulated by state insurance authorities,the CFTC with respect to futures-related and swaps-related activities and investment advisers registered with the SEC with respect to their investment advisory activitiesactivities.
As discussed further below, our principal U.S. bank subsidiary, GS Bank USA, is supervised and entities regulated by the CFTC with respectFederal Reserve Board, the FDIC, the New York State Department of Financial Services and the Consumer Financial Protection Bureau (CFPB). In addition, Group Inc. has two limited purpose trust company subsidiaries that are not permitted to certain futures-related activities.accept deposits or make loans (other than as incidental to their trust activities) and are not insured by the FDIC. The Goldman Sachs Trust Company, N.A., a national banking association that is limited to fiduciary activities, is regulated by the Office of the Comptroller of the Currency and is a member bank of the Federal Reserve System. The Goldman Sachs Trust Company of Delaware, a Delaware limited purpose trust company, is regulated by the Office of the Delaware State Bank Commissioner.
| 8 | Goldman Sachs 2014 Form 10-K |
THE GOLDMAN SACHS GROUP, INC. AND SUBSIDIARIES
Activities
The BHC Act generally restricts bank holding companies from engaging in business activities other than the business of banking and certain closely related activities. As a financialFinancial holding company, we maycompanies, however, generally can engage in a broader range of financial and related activities than are otherwise permissible for bank holding companies as long as wethey continue to meet the eligibility requirements for financial holding companies. These requirements include Group Inc.that the financial holding company and oureach of its U.S. depository institution subsidiaries (currently GS Bank USA and our national bank trust company subsidiary) each maintainingmaintain their respective status as “well-capitalized” and “well-managed.” The broader range of permissible activities for financial holding companies
includes underwriting, dealing and making markets in securities insurance underwriting and making investments in nonfinancialnon-financial companies. In addition, wefinancial holding companies are permitted under the GLB Act to continue to engage in certain commodities activities in the United States that may otherwise be impermissible for bank holding companies, so long as the assets held pursuant to these activities do not equal 5% or more of ourtheir consolidated assets.
AsThe Federal Reserve Board, however, has the authority to limit our ability to conduct activities that would otherwise be permissible for a bankfinancial holding company, and will do so if we do not satisfactorily meet certain requirements of the Federal Reserve Board. In addition, we are required to obtain prior Federal Reserve Board approval before engaging in certain banking and other financial activities both in the United States and abroad.
We expectVolcker Rule
In December 2013, the final rules to face additional limitations on our activities upon implementation of thoseimplement the provisions of the Dodd-Frank Act referred to as the “Volcker Rule” were adopted.
The Volcker Rule prohibits “proprietary trading,” which will prohibit “proprietary trading” (but will allowbut permits activities such as underwriting, market-making related activitiesmarket making and risk-mitigation hedging activities)hedging. We are also required to calculate daily quantitative metrics on covered trading activities (as defined in the rule) and will limitprovide these metrics to regulators on a monthly basis. In addition, the Volcker Rule limits the sponsorship of, and investment in, hedge funds and private equity funds“covered funds” (as defined in the rule) by banking entities, including bank holding companies.Group Inc. and its subsidiaries. It also limits certain types of transactions between us and our sponsored funds, similar to the limitations on transactions between depository institutions and their affiliates as described below under “Regulation of GS Bank USA — Transactions with Affiliates.” Covered funds include our private equity funds, certain of our credit and real estate funds, our hedge funds and certain other investment structures.
We are required to be in compliance with the prohibition on proprietary trading and to develop an extensive compliance program by July 2015. In October 2011, federal regulators proposed rulesDecember 2014, the Federal Reserve Board extended the compliance period through July 2016 for investments in, and relationships with, covered funds that were in place prior to implementDecember 31, 2013, and indicated that it intends to further extend the compliance period through July 2017.
The limitation on investments in covered funds requires us to reduce our investment in each such fund to 3% or less of the fund’s net asset value, and to reduce our aggregate investment in all such funds to 3% or less of our Tier 1 capital. In anticipation of the final rule, we limited our initial investment in certain new covered funds to 3% of the fund’s net asset value.
We continue to manage our existing funds, taking into account the transition periods under the Volcker RuleRule. We plan to continue to conduct our investing and lending activities in ways that included an extensive request for comments onare permissible under the proposal. The proposed rules are highly complex,Volcker Rule.
See “Management’s Discussion and many aspectsAnalysis of Financial Condition and Results of Operations — Regulatory Developments — Volcker Rule” in Part II, Item 7 of the Volcker Rule remain unclear. The full impact on us will not be known with certainty until the rules are finalized. The Volcker Rule provisions are scheduled to take effect no later than July 2012, and companies will be required to come into compliance within two years after the effective date (subject to possible extensions).2014 Form 10-K for information about our investments in covered funds.
| Goldman Sachs | 9 |
THE GOLDMAN SACHS GROUP, INC. AND SUBSIDIARIES
While many aspectsLeveraged Lending
During the past several years, the U.S. federal bank regulatory agencies have raised concerns over origination and other practices in leveraged lending markets. The agencies have issued guidance that focuses on transaction structures and risk management frameworks and outlined high-level principles for safe-and-sound leveraged lending, including underwriting standards, valuation and stress testing. Although the full impact of the Volcker Rule remain unclear, we evaluated the prohibition on “proprietary trading”guidance remains uncertain, implementation of this guidance and determined that businesses that engage in “bright line” proprietary trading are most likely to be prohibited. In 2011 and 2010, we liquidated substantially all of our Principal Strategies and global macro proprietary trading positions.
In addition, we evaluated the limitations on sponsorship of, and investments in, hedge funds and private equity funds. The firm earns management fees and incentive fees for investment management services from private equity and hedge funds, which are included in our Investment Management segment. The firm also makes investments in funds, and the gains and losses from such investments are included in our Investing & Lending segment; these gains and losses will be impacted by the Volcker Rule. The Volcker Rule limitation on investments in hedge funds and private equity funds requires the firm to reduce its investment in each private equity and hedge fund to 3% or less of net asset value, and to reduce the firm’s aggregate investment in all such funds to 3% or less of the firm’s Tier 1 capital. Over the period from 1999 through 2011, the firm’s aggregate net revenues from its investments in hedge funds and private equity funds were not material to the firm’s aggregate total net revenues over the same period. We are continuing to manage our existing private equity funds, taking into account the transition periods under the Volcker Rule. With respect to our hedge funds, we currently plan to comply with the Volcker Rule by redeeming certain of our interestsany related changes in the funds. We currently expect to redeem up to approximately 10% of certain hedge funds’ total redeemable units per quarter over ten consecutive quarters, beginning in the quarter ending March 2012 and ending in June 2014. In addition, we have limited the firm’s initial investment to 3% for certain new funds.
The Dodd-Frank Act also establishes a Bureau of Consumer Financial Protection having broad authority to regulate providers of credit, payment and other consumer financial products and services, and this Bureau has oversight over certain ofleveraged lending market could adversely affect our products and services.leveraged lending business.
Capital and Liquidity Requirements
As a bank holding company, we are subject to consolidated regulatory capital requirements administered by the Federal Reserve Board.Board, and GS Bank USA is subject to broadlysubstantially similar capital requirements as(as discussed below. below), also administered by the Federal Reserve Board.
Under the Federal Reserve Board’s capital adequacy requirements, and the regulatory framework for prompt corrective action that is applicable to GS Bank USA, both Group Inc. and GS Bank USA must meet specific regulatory capital requirements that involve quantitative measures of assets, liabilities and certain off-balance-sheet items. The sufficiency of our capital levels and those of GS Bank USA, as well as GS Bank USA’s prompt corrective action classification, areis also subject to qualitative judgments by regulators.
Other regulated subsidiaries, including GS&Co. and Goldman Sachs International (GSI), are also subject to capital requirements. We expect Group Inc., GS Bank USA, GS&Co., GSI and other regulated subsidiaries to become subject to increased capital requirements over time.
Capital Ratios. Since January 1, 2014, we have been subject to the Federal Reserve Board’s revised risk-based capital and leverage ratio regulations, inclusive of certain transitional provisions (Revised Capital Framework). These regulations are largely based on the Basel Committee’s final capital framework for strengthening international capital standards (Basel III), and also implement certain provisions of the Dodd-Frank Act. The Revised Capital Framework also introduces a new Tier 1 Leveragesupplementary leverage ratio (supplementary leverage ratio) for Advanced approach banking organizations.
See “Management’s Discussion and Basel 1Analysis of Financial Condition and Results of Operations — Equity Capital Ratios.SeeManagement and Regulatory Capital” in Part II, Item 7 of the 2014 Form 10-K and Note 20 to the consolidated financial statements in Part II, Item 8 of this the 2014Form 10-K for the aspects of the Revised Capital Framework that are most relevant to us as an Advanced approach banking organization, including information onabout our Common Equity Tier 1 (CET1), CET1 ratio, Tier 1 capital, Tier 1 capital ratio, Total capital, Total capital ratio, risk-weighted assets (RWAs), Tier 1 capital, total capital, risk-weighted assetsleverage ratio and Tier 1supplementary leverage ratio, and for a discussion of minimum required ratios. For information on our Tier 1 common ratio, see “— Equity Capital — Consolidated Regulatory Capital Ratios” in Part II, Item 7 of this Form 10-K.
Pending Changes in Capital Requirements.We are currently working to implement the requirements set out in the Federal Reserve Board’s Risk-Based Capital Standards: Advanced Capital Adequacy Framework — Basel 2, as applicable to us as a bank holding company (Basel 2), which are based on the advanced approaches under the Revised Framework for the International Convergence of Capital Measurement and Capital Standards issued by the Basel Committee. U.S. banking regulators have incorporated the Basel 2 framework into the existing risk-based capital requirements by requiring that internationally active banking organizations, such as us, adopt Basel 2, once approved to do so by regulators. As required by the Dodd-Frank Act, U.S. banking regulators have adopted a rule that requires large banking organizations, upon adoption of Basel 2, to continue to calculate risk-based capital ratios under both Basel 2 and the Federal Reserve Board’s regulatory requirements currently applicable to bank holding companies (Basel 1), which are based on the 1988 Capital Accord of the Basel Committee. For each of the Tier 1 and Total capital ratios, the lower of the Basel 1 and Basel 2 ratios calculated will be used to determine whether the bank meets its minimum risk-based capital requirements.
| 10 | Goldman Sachs |
THE GOLDMAN SACHS GROUP, INC. AND SUBSIDIARIES
The U.S. federal bank regulatory agencies have issued revised proposals to modify their market risk regulatory capital requirements for banking organizations in the United States that have significant trading activities. These modifications are designed to address the adjustments to the market risk framework that were announced by the Basel Committee in June 2010 (Basel 2.5), as well as the prohibition on the use of credit ratings, as required by the Dodd-Frank Act. Once implemented, it is likely that these changes will result in increased capital requirements for market risk.
Additionally, the guidelines issued by the Basel Committee in December 2010 (Basel 3) revise the definition of Tier 1 capital, introduce Tier 1 common equity as a regulatory metric, set new minimum capital ratios (including a new “capital conservation buffer,” which must be composed exclusively of Tier 1 common equity and will be in addition to the minimum capital ratios), introduce a Tier 1 leverage ratio within international guidelines for the first time, and make substantial revisions to the computation of risk-weighted assets (RWAs) for credit exposures. Implementation of the new requirements is expected to take place over the next several years. The federal banking agencies have not yet proposed rules to implement the Basel 3 guidelines in the United States.
In addition, both the Basel Committee and U.S. banking regulators implementing the Dodd-Frank Act have indicated that they will impose more stringent capital standards on systemically important financial institutions. In November 2011, the Basel Committee published its final provisions for assessing the global systemic importance of banking institutions and the range of additional Tier 1 common equity that should be maintained by banking institutions deemed to be globally systemically important. The additional capital for these institutions would initially range from 1% to 2.5% of Tier 1 common equity and could be as much as 3.5% for a bank that increases its systemic footprint (e.g., by increasing total assets). The firm was one of 29 institutions identified by the Financial Stability Board (established at the direction of the Group of 20) as globally systemically important under the Basel Committee’s methodology. Therefore, depending upon the manner and timing of the U.S. banking regulators’ implementation of the Basel Committee’s methodology, we expect that the minimum Tier 1 common ratio requirement applicable to us will include this additional capital assessment. The final determination of whether an institution is classified as globally systemically important and the calculation of the required additional capital amount is expected to be disclosed by the Basel Committee no later than November 2014 based on data through the end of 2013.
In December 2011, the Federal Reserve Board proposed rules to implement the enhanced prudential standards and early remediation requirements contemplated by the Dodd-Frank Act. The proposed rules would apply to bank holding companies with $50 billion or more in total consolidated assets such as us, as well as systemically important nonbank financial institutions. With respect to the enhanced prudential standards, the proposed rules address risk-based capital and leverage requirements, liquidity requirements, overall risk management requirements and concentration/credit exposure limits. The proposed rules do not include the additional capital requirements for globally systemically important banking institutions but contemplate the Federal Reserve Board’s adopting such requirements. The proposed rules require increased involvement by boards of directors in liquidity and risk management and stress testing, single-counterparty credit limits (including more stringent requirements for credit exposure among major financial institutions) and public disclosure of the Federal Reserve Board’s annual stress tests and a bank holding company’s annual and semi-annual internal stress tests. The proposed early remediation rules are modeled after the prompt corrective action regime, described below, but are designed to require action beginning in earlier stages of a company’s financial distress by mandating action on the basis of a range of triggers, including capital and leverage, stress test results, liquidity and risk management.
The Dodd-Frank Act will subject us at a firmwide level to the same leverage and risk-based capital requirements that apply to depository institutions and directs banking regulators to impose additional capital requirements. The Federal Reserve Board is expected to adopt the new leverage and risk-based capital regulations in 2012. As a consequence of these changes, Tier 1 capital treatment for our junior subordinated debt issued to trusts will be phased out over a three-year period beginning on January 1, 2013. The interaction among the Dodd-Frank Act, the Basel Committee’s proposed changes and other proposed or announced changes from other governmental entities and regulators adds further uncertainty to our future capital requirements and those of our subsidiaries.
THE GOLDMAN SACHS GROUP, INC. AND SUBSIDIARIES
Liquidity Ratios under Basel 3.III.Historically, regulation and monitoring of bank and bank holding company liquidity has been addressed as a supervisory matter, both in the United States and internationally, without required formulaic measures. Basel 3 will requireIII, which is subject to implementation by national regulators, requires banks and bank holding companies to measure their liquidity against two specific liquidity tests that, although similar in some respects to liquidity measures historically applied by banks and regulators for management and supervisory purposes, will be mandated by regulation. One test, referred to as the liquidity coverage ratio (LCR), is designed to ensure that the banking entity maintains an adequate level of unencumbered high-quality liquid assets equal to the entity’s expected net cash outflow for a 30-day time horizon (or, if greater, 25% of its expected total cash outflow) under an acute short-term liquidity stress scenario. The other, referred to as the net stable funding ratio (NSFR), is designed to promote more medium- and long-term stable funding of the assets and off-balance-sheet activities of bankingthese entities over a one-year time horizon. These requirements may incentivize banking entities to increase their holdings of U.S. Treasury securities and certain other sovereign debtthat qualify as a component ofhigh-quality liquid assets and increase the use of long-term debt as a funding source. The liquidity coverage ratio is not expected
During 2014, the U.S. federal bank regulatory agencies approved final rules implementing the LCR for Advanced approach banking organizations that are generally consistent with the Basel Committee’s framework as described above, but which include accelerated transitional provisions and more stringent requirements related to be introducedboth the range of assets that qualify as a requirement untilhigh-quality liquid assets and cash outflow assumptions for certain types of funding. Under the accelerated transition timeline, the LCR became effective in the United States on January 1, 2015, with a phase-in period whereby firms must meet an 80% minimum ratio in 2015, which will increase 10% per year until 2017. See “Management’s Discussion and Analysis of Financial Condition and Results of Operations — Liquidity Risk Management” in Part II, Item 7 of the net stable funding ratio is not expected to2014Form 10-K for information about the LCR.
During 2014, the Basel Committee issued its final framework for calculation of the NSFR. Under the Basel Committee framework, the NSFR will be introduced as a requirement untileffective on January 1, 2018. WhileThe U.S. federal bank regulatory agencies have not yet proposed rules implementing the principles behindNSFR for U.S. banking organizations. We are currently evaluating the new framework are broadly consistent with our current liquidity management framework, it is possible thatimpact of the refinement andBasel Committee’s NSFR framework.
The implementation of these standards, and any amendments or modifications adopted by the U.S. federal bank regulatory agencies, could impact our liquidity and funding requirements and practices.
We also expect that liquidity requirements applicable to us and several of our subsidiaries will be impactedpractices in the future byfuture.
Stress Tests. The Federal Reserve Board has issued final rules implementing the various developments arising from the Basel Committee,requirements of the Dodd-Frank Act and actions by other governmental entities and regulators.
Payment of Dividends and Stock Repurchases
Dividend payments by Group Inc.concerning the Dodd-Frank Act supervisory stress tests to its shareholders and stock repurchases by Group Inc. are subject to the oversight of the Federal Reserve Board. Under rules adoptedbe conducted by the Federal Reserve Board and semi-annual company-run stress tests for bank holding companies with total consolidated assets of $50 billion or more. The stress test rules require increased involvement by boards of directors in November 2011,stress testing and public disclosure of the dividendresults of both the Federal Reserve Board’s annual stress tests and share repurchase policiesa bank holding company’s annual supervisory stress tests, and semi-annual internal stress tests. Certain stress test requirements are also applicable to GS Bank USA, as discussed below.
Our internally developed severely adverse scenario is designed to stress the firm’s risks and idiosyncratic vulnerabilities and assess the firm’s pro-forma capital position and ratios under the hypothetical stressed environment. We publish summaries of our annual and mid-cycle stress tests results on our web site as described under “Available Information” below. Our annual Dodd-Frank Act stress test submission is incorporated into the annual capital plans that we are required to submit to the Federal Reserve Board as part of the Comprehensive Capital Analysis and Review (CCAR). The purpose of CCAR is to ensure that large bank holding companies
such as Group Inc., are reviewed by the Federal Reserve Board based on capital plans and stress tests submitted by the bank holding company, and will be assessed against, among other things, the bank holding company’s ability to meet and exceed minimum regulatory capital ratios, its expected sources and uses of capital over the planning horizon (generally a period of two years) under baseline and stressed scenarios, and any potential impact of changes to its business plan and activities on its capital adequacy and liquidity. The purpose of the capital plan review is to ensure that these institutions have robust, forward-looking capital planning processes that account for each institution’s unique risks and that permit continued operations during times of economic and financial stress. As part of the capital plan review,CCAR, the Federal Reserve Board will evaluateevaluates an institution’s plan to make capital distributions, such as repurchasing or redeeming stock or increasing dividend payments.payments, across a range of macro-economic and firm-specific assumptions.
| Goldman Sachs 2014 Form 10-K | 11 |
THE GOLDMAN SACHS GROUP, INC. AND SUBSIDIARIES
Federal
Payment of Dividends and state law impose limitations on the payment of dividendsStock Repurchases. Dividend payments by our depository institution subsidiaries to Group Inc. to its shareholders and stock repurchases by Group Inc. are subject to the oversight of the Federal Reserve Board. The dividend and share repurchase policies of large bank holding companies, such as Group Inc., are reviewed by the Federal Reserve Board, through the CCAR process, based on capital plans and stress tests submitted by the bank holding company, and are assessed against, among other things, the bank holding company’s ability to meet and exceed minimum regulatory capital ratios under stressed scenarios, its expected sources and uses of capital over the planning horizon under baseline and stressed scenarios, and any potential impact of changes to its business plan and activities on its capital adequacy and liquidity.
In general,October 2014, the Federal Reserve Board issued a final rule modifying the regulations for capital planning and stress testing. The modifications change the dates for submitting the capital plan and stress test results beginning with the 2016 cycle and include a limitation on capital distributions to the extent that actual capital issuances are less than the amount indicated in the capital plan submission.
The Federal Reserve Board informed us that it did not object to our proposed capital actions through the first quarter of dividends that may be paid by GS Bank USA or2015, including the repurchase of outstanding common stock, an increase in our national bank trust company subsidiary is limitedquarterly common stock dividend, and the possible issuance, redemption and modification of other capital securities. We submitted our 2015 capital plan and proposed capital actions to the lesserFederal Reserve Board in January 2015 and expect to publish a summary of our annual Dodd-Frank Act stress test results in March 2015.
Enhanced Prudential Standards. In February 2014, the Federal Reserve Board adopted rules to implement certain of the amounts calculated under a “recent earnings” test and an “undivided profits” test. Under the recent earnings test, a dividend may not be paid if the total of all dividends declaredenhanced prudential standards contemplated by the entityDodd-Frank Act. Effective on January 1, 2015, the rules require bank holding companies with $50 billion or more in any calendar yeartotal consolidated assets to comply with enhanced liquidity and overall risk management standards, including a buffer of highly liquid assets based on projected funding needs for 30 days, and increased involvement by boards of directors in liquidity and overall risk management. Although the liquidity buffer under these rules has some similarities to the LCR (and is described by the agencies as complementary to the LCR), it is a separate requirement that is in excessaddition to the LCR. See “Management’s Discussion and Analysis of Financial Condition and Results of Operations — Risk Management and Risk Factors — Overview and Structure of Risk Management” and “— Liquidity Risk Management” in Part II, Item 7 of the current year’s net income combined with the retained net income of the two preceding years, unless the entity obtains prior regulatory approval. Under the undivided profits test, a dividend may not be paid in excess of the entity’s “undivided profits” (generally, accumulated net profits that have not been paid out as dividends or transferred to surplus). The payment of all dividends is subject to approval by the banking regulators, which have authority to prohibit or limit the payment if, in the banking regulator’s opinion, payment of a dividend would constitute an unsafe or unsound practice in light of the financial condition of the banking organization.2014 Form 10-K for information about our risk management practices and liquidity.
Regulatory Proposals
In addition certainto the regulatory rule changes that have already been adopted (as discussed above), both the Federal Reserve Board and the Basel Committee have proposed other changes, which are discussed below. The full impact of Group Inc.’s non-bank subsidiariesthese proposals on the firm will not be known with certainty until after any resulting rules are subjectfinalized and market practices develop under the final rules. Furthermore, these proposals, the Dodd-Frank Act, other reform initiatives proposed and announced by the U.S. federal bank regulatory agencies, the Basel Committee, and other governmental entities and regulators (including the European Union (EU), the PRA and the FCA) are not in all cases consistent with one another, which adds further uncertainty to separate regulatory limitations on dividendsour future capital, leverage and distributions, includingliquidity requirements, and those of our broker-dealer and our insurance subsidiaries as described below.subsidiaries.
| 12 | Goldman Sachs |
THE GOLDMAN SACHS GROUP, INC. AND SUBSIDIARIES
Federal Reserve Board Proposals. In December 2014, the Federal Reserve Board proposed a rule to establish risk-based capital surcharges for U.S. Global Systemically Important Banks (G-SIBs). For these institutions, the proposed rule would implement the framework developed by the Basel Committee for assessing the global systemic importance of banking institutions and determining the range of additional CET1 that should be maintained by those deemed to be G-SIBs. Under the Basel Committee’s framework, the required amount of additional CET1 forG-SIBs will initially range from 1% to 2.5% and could be higher in the future for a banking institution that increases its systemic footprint (e.g., by increasing total assets). The Federal Reserve Board stated that its framework would result in surcharges higher than those calculated under the methodology published by the Basel Committee, with expected surcharges ranging from 1% to 4.5%. The proposed rule treats the Basel Committee’s methodology as a floor and introduces an alternative calculation to determine the applicable surcharge, which includes a significantly higher surcharge for systemic risk and, as part of the calculation of the applicable surcharge, a new factor based on a G-SIB’s use of short-term wholesale funding. Under the Federal Reserve Board’s proposed rule, U.S.G-SIBs would be required to meet the capital surcharges on a phased-in basis beginning in 2016 through 2019. See “Management’s Discussion and Analysis of Financial Condition and Results of Operations — Equity Capital Management and Regulatory Capital” in Part II, Item 7 of the 2014 Form 10-K for additional information about our minimum capital ratios and capital buffers.
In December 2011, the Federal Reserve Board proposed rules to implement the enhanced prudential standards and early remediation requirements contemplated by the Dodd-Frank Act. Although most components of these proposals have now been addressed in final rules that are described above, the single-counterparty credit limits and early remediation requirements are still under consideration. The proposed single-counterparty credit limits impose more stringent requirements for credit exposure among major financial institutions, which (together with other provisions incorporated into the Basel III capital rules) may affect our ability to transact or hedge with other financial institutions. The proposed early remediation rules are modeled on the prompt corrective action regime, described below, but are designed to require action to begin in earlier stages of a company’s financial distress, based on a range of triggers, including capital and leverage, stress test results, liquidity and risk management.
Basel Committee and Financial Stability Board Proposals. The Basel Committee published its final guidelines for calculating incremental capital requirements for domestic systemically important banking institutions (D-SIBs). These guidelines are complementary to the framework outlined above for G-SIBs, but are more principles-based in order to provide an appropriate degree of national discretion. The impact of these guidelines on the regulatory capital requirements of GS Bank USA, GSI and other of our subsidiaries will depend on how they are implemented by the banking and non-banking regulators in the United States and other jurisdictions.
The Basel Committee has recently issued several updates which propose further changes to capital regulations. In particular, it has finalized a revised standard approach for calculating RWAs for counterparty credit risk on derivatives exposures (“Standardized Approach for measuring Counterparty Credit Risk exposures,” known as “SA-CCR”). In addition, it has published guidelines for measuring and controlling large exposures (“Supervisory Framework for measuring and controlling Large Exposures”), and issued an updated framework for regulatory capital treatment of banking book securitizations.
The Basel Committee has also issued consultation papers on a “Fundamental Review of the Trading Book” and on the design of a capital floor framework based on the standardized approach. The impact of all of these developments on the firm (including RWAs and regulatory capital ratios) will not be known until after any resulting rules are finalized by the U.S. federal bank regulatory agencies.
In November 2014, the Financial Stability Board issued a set of principles and a term sheet on a new minimum standard for “total loss-absorbing capacity” of G-SIBs and indicated that it expects to finalize its proposal by late 2015. The proposal would require G-SIBs to maintain minimum ratios of regulatory capital plus certain types of debt instruments to RWAs and leverage exposure. Under the proposal, the requirements will be effective no earlier than January 1, 2019. The proposal is subject to change, and its impact on us will depend on, among other things, how it is implemented by the U.S. federal bank regulatory agencies.
| Goldman Sachs 2014 Form 10-K | 13 |
THE GOLDMAN SACHS GROUP, INC. AND SUBSIDIARIES
Resolution and Recovery Plans
As required by the Dodd-Frank Act, the Federal Reserve Board and FDIC have jointly issued a rule requiring each bank holding company with over $50 billion in assets and each designated systemically important financial institution to provide to regulators an annual plan for its rapid and orderly resolution in the event of material financial distress or failure (resolution plan). Our resolution plan must, among other things, demonstrate that GS Bank USA is adequately protected from risks arising from our other entities. The regulators’ joint rule sets specific standards for the resolution plans, including requiring a detailed resolution strategy and analyses of the company’s material entities, organizational structure, interconnections and interdependencies, and management information systems, among other elements. Group Inc. submitted resolution plans to its regulators in 2012, 2013 and 2014. In August 2014, the Federal Reserve Board and the FDIC indicated that Group Inc. and other large industry participants had certain shortcomings in the 2013 resolution plans that must be addressed in the 2015 resolution plans, which are required to be submitted on or before July 1, 2015. If we fail to cure the deficiencies in a timely manner and the Federal Reserve Board and the FDIC jointly determine that our resolution plan, after any permitted resubmission, is not credible, the Federal Reserve Board and the FDIC may jointly impose more stringent capital, leverage or liquidity requirements on us or restrictions on our growth, activities or operations until we submit a plan that remedies the deficiencies. If the Federal Reserve Board and the FDIC ultimately determine that we have been unable to remedy the deficiencies, they may jointly order us to divest assets or operations in order to facilitate our orderly resolution in the event of our failure.
Group Inc. is also required by the Federal Reserve Board to submit, on an annual basis, a global recovery plan that outlines the steps that management could take to reduce risk, maintain sufficient liquidity, and conserve capital in times of prolonged stress. We have been submitting plans annually since 2010.
The European Banking Authority and the national resolution authorities of the EU are in the process of implementing the Bank Recovery and Resolution Directive (BRRD), which will impact the firm’s EU-regulated entities. Certain of the provisions of BRRD, including the requirements for contractual recognition of the “bail-in” powers of EU resolution authorities to recapitalize a failing entity by writing down its unsecured debt or converting its unsecured debt into equity, came into force on January 1, 2015, and the remainder of the BRRD’s provisions are expected to be implemented by January 2016.
Source of Strength
Federal Reserve Board policy historically has required bank holding companies to act as a source of strength to their bank subsidiaries and to commit capital and financial resources to support those subsidiaries. The Dodd-Frank Act codifies this policy as a statutory requirement. This support may be required by the Federal Reserve Board at times when we might otherwise determine not to provide it. Capital loans by a bank holding company to a subsidiary bank are subordinate in right of payment to deposits and to certain other indebtedness of the subsidiary bank. In addition, if a bank holding company commits to a federal bank regulator that it will maintain the capital of its bank subsidiary, whether in response to the Federal Reserve Board’s invoking its source-of-strength authority or in response to other regulatory measures, that commitment will be assumed by the bankruptcy trustee and the bank will be entitled to priority payment in respect of that commitment, ahead of other creditors of the bank holding company.
The BHC Act provides for regulation of bank holding company activities by various functional regulators and prohibits the Federal Reserve Board from requiring a payment by a holding company subsidiary to a depository institution if the functional regulator of that subsidiary objects to such payment. In such a case, the Federal Reserve Board could instead require the divestiture of the depository institution and impose operating restrictions pending the divestiture.
Compensation Practices
Our compensation practices are subject to oversight by the Federal Reserve Board and, with respect to some of our subsidiaries and employees, by other financial regulatory bodies worldwide. The scope and content of compensation regulation in the financial industry are continuing to develop, and we expect that these policiesregulations and resulting market practices will evolve over a number of years.
In June 2010, the Federal Reserve Board and other financial regulators jointly issued
| 14 | Goldman Sachs 2014 Form 10-K |
THE GOLDMAN SACHS GROUP, INC. AND SUBSIDIARIES
The U.S. federal bank regulatory agencies have provided guidance designed to ensure that incentive compensation arrangements at banking organizations take into account risk and are consistent with safe and sound practices. The guidance sets forth the following three key principles with respect to incentive compensation arrangements: (i) the arrangements should provide employees with incentives that appropriately balance risk and financial results in a manner that does not encourage employees to expose their organizations to imprudent risk; (ii) the arrangements should be compatible with effective controls and risk management; and (iii) the arrangements should
be supported by strong corporate governance. In addition, the Federal Reserve Board has conducted a review of the incentive compensation policies and practices of a number of large, complex banking organizations, including us. The June 2010 guidance provides that supervisory findings with respect to incentive compensation will be incorporated, as appropriate, into the organization’s supervisory ratings, which can affect its ability to make acquisitions or perform other actions. The guidance also provides that enforcement actions may be taken against a banking organization if its incentive compensation arrangements or related risk management, control or governance processes pose a risk to the organization’s safety and soundness.
The Financial Stability Board has released standards for implementing certain compensation principles for banks and other financial companies designed to encourage sound compensation practices. These standards are to be implemented by local regulators. The European Parliament has adopted amendments toIn the EU, the Fourth Capital Requirements Directive (CRD4) includes compensation provisions designed to implement the Financial Stability Board’s compensation standards withinstandards. These rules have been implemented by EU member states and, among other things, limit the EU. Regulators inratio of variable to fixed compensation of certain employees, including those identified as having a numbermaterial impact on the risk profile of countries,EU-regulated entities, including the United Kingdom, France and Germany, have proposed or adopted compensation policies or regulations applicable to financial institutions pursuant to the Capital Requirements Directive.GSI. These requirements are in addition to the guidance issued by U.S. financial regulators discussed above and the Dodd-Frank Act provision discussed below.
The Dodd-Frank Act requires the U.S. financial regulators, including the Federal Reserve Board, to establish joint regulations or guidelines prohibiting incentive-based payment arrangements at specified regulated entities having at least $1 billion in total assets (which would include Group Inc. and some of its depository institution, broker-dealer and investment advisor subsidiaries) that encourage inappropriate risks by providing an executive officer, employee, director or principal shareholder with excessive compensation, fees, or benefits or that could lead to material financial loss to the entity. In addition, these regulators must establish regulations or guidelines requiring enhanced disclosure to regulators of incentive-based compensation arrangements. The initial version of these regulations was proposed by the U.S. financial regulators in early 2011 andbut the regulations may become effective in 2012.have not yet been finalized. The proposed regulations incorporate the three key principles from the June 2010 regulatory guidance discussed above. If the regulations are adopted in the form initially proposed, they will impose limitations onmay restrict our flexibility with respect to the manner in which we may structure compensation for our executives.
THE GOLDMAN SACHS GROUP, INC. AND SUBSIDIARIES
Regulation of GS Bank USA
Our subsidiary, GS Bank USA, an FDIC-insured, New York State-chartered bank and a member of the Federal Reserve System, is supervised and regulated by the Federal Reserve Board, the FDIC, and the New York State Department of Financial Services (formerlyand the New York State Banking Department)CFPB, and is subject to minimum capital requirements (described below) that are calculated in a manner similar to those applicable to bank holding companies. A number of our activities are conducted partially or entirely through GS Bank USA and its subsidiaries, including: origination of and market making in bank loans; interest rate, credit, currency and other derivatives; leveraged finance; commercial mortgage origination and trading;origination; structured finance; and agency lending, custody and hedge fund administration services. These activities are subject to regulationlending.
Under rules adopted by the Federal Reserve Board in 2012 under the Dodd-Frank Act, GS Bank USA is required to conduct stress tests on an annual basis, to submit the results to the Federal Reserve Board, and to make a summary of those results public. The rules require that the board of directors of GS Bank USA, among other things, consider the results of the stress tests in the normal course of the bank’s business including, but not limited to, its capital planning, assessment of capital adequacy and risk management practices.
In addition, New York State Departmentbanking law imposes lending limits (which take into account credit exposure from derivative transactions) and other requirements that could impact the manner and scope of Financial Services and the FDIC.
The Dodd-Frank Act contains “derivative push-out” provisions that, beginning in July 2012, may prevent us from conducting certain swaps-related activities through GS Bank USA or another insured depository institution subsidiary, subject to exceptions for certain interest rate and currency swaps and for hedging or risk mitigation activities directly related to the bank’s business. These precluded activities may be conducted elsewhere within the firm, subject to certain requirements.USA’s activities.
| Goldman Sachs 2014 Form 10-K | 15 |
THE GOLDMAN SACHS GROUP, INC. AND SUBSIDIARIES
Transactions with AffiliatesAffiliates.
Transactions between GS Bank USA or its subsidiaries, on the one hand, and Group Inc. or its other subsidiaries and affiliates, on the other hand, are regulated by the Federal Reserve Board. These regulations generally limit the types and amounts of transactions (including loans to and credit extensions from GS Bank USA or its subsidiaries to Group Inc. or its other subsidiaries and affiliates) that may take place and generally require those transactions to be on an arm’s-length basis.market terms or better to GS Bank USA. These regulations generally do not apply to transactions between GS Bank USA and its subsidiaries. The Dodd-Frank Act significantly expandsexpanded the coverage and scope of thethese regulations, that limit affiliate transactions within a banking organization, including by applying these regulationsthem to the credit exposure arising under derivative transactions, repurchase and reverse repurchase agreements, and securities borrowing and lending transactions,transactions.
Federal and transactions with sponsored hedge funds and private equity funds.
state laws impose limitations on the payment of dividends by our depository institution subsidiaries to Group Inc. has, subject to certain exceptions, guaranteedIn general, the payment obligationsamount of dividends that may be paid by GS Bank USA alongor our national bank trust company subsidiary is limited to the lesser of the amounts calculated under a “recent earnings” test and an “undivided profits” test. Under the recent earnings test, a dividend may not be paid if the total of all dividends declared by the entity in any calendar year is in excess of the current year’s net income combined with thosethe retained net income of GS&Co., Goldman Sachs Bank (Europe) plc (GS Bank Europe) and Goldman Sachs Execution & Clearing, L.P. (GSEC)the two preceding years, unless the entity obtains prior regulatory approval. Under the undivided profits test, a dividend may not be paid in excess of the entity’s “undivided profits” (generally, accumulated net profits that have not been paid out as dividends or transferred to surplus). The banking regulators have authority to prohibit or limit the payment of dividends if, in the banking regulator’s opinion, payment of a dividend would constitute an unsafe or unsound practice in light of the financial condition of the banking organization.
“Living Will”
As required by the Dodd-Frank Act, the Federal Reserve Board and FDIC have jointly issued a rule that requires each bank holding company with more than $50 billion in assets and each designated systemically important financial institution to prepare and provide to regulators an annual plan (a so-called “living will”) for its rapid and orderly resolution in the event of material financial distress or failure. The firm’s resolution plan must, among other things, ensure that GS Bank USA is adequately protected from risks arising from our other entities. The regulators’ joint rule sets specific standards for the resolution plans, including requiring a detailed resolution strategy and analyses of the company’s material entities, organizational structure, interconnections and interdependencies, and management information systems, among other elements. We have commenced work on our first resolution plan, which we must submit to the regulators by July 1, 2012. GS Bank USA is also required by the FDIC to submit a plan for its rapid and orderly resolution in the event of material financial distress or failure by July 1, 2012.
Deposit InsuranceInsurance.
GS Bank USA accepts deposits, and those deposits have the benefit of FDIC insurance up to the applicable limits. The FDIC’s Deposit Insurance Fund is funded by assessments on insured depository institutions, such as GS Bank USA. The amounts of these assessments for larger depository institutions (generally those that have $10 billion in assets or more), such as GS Bank USA, are currently based on the average total consolidated assets less the average tangible equity of the insured depository institution during the assessment period, andthe supervisory ratings of the insured depository institution and specified forward-looking financial measures used to calculate the assessment rate. The assessment rate which is subject to adjustmentsadjustment by the FDIC. The FDIC required all insured depository institutions to prepay estimated assessments for all of 2010, 2011 and 2012 on December 30, 2009. The FDIC may increase or decrease the assessment rate schedule on a semi-annual basis.
Prompt Corrective Action and Capital Ratios.
The U.S. Federal Deposit Insurance Corporation Improvement Act of 1991 (FDICIA), among other things, requires the federal banking agencies to take “prompt corrective action” in respect of depository institutions that do not meet specified capital requirements. FDICIA establishes five capital categories for FDIC-insured banks: well-capitalized, adequately capitalized, undercapitalized, significantly undercapitalized and critically undercapitalized.
THE GOLDMAN SACHS GROUP, INC. AND SUBSIDIARIES
A depository institution is generally deemed to be “well-capitalized,” the highest category, if it has aGS Bank USA computes its CET1, Tier 1 capital, ratio of at least 6%, a totalTotal capital ratio of at least 10% and a Tier 1 leverage ratio of at least 5%.ratios in accordance with the Revised Capital Framework. In addition, commencing January 1, 2018, GS Bank USA has agreed with the Federal Reserve Boardwill be subject to maintain minimum capital ratios in excess of these “well-capitalized” levels.supplementary leverage ratio requirements.
See Note 20 to the consolidated financial statements in Part II, Item 8 of thisthe 2014 Form 10-K and “Management’s Discussion and Analysis of Financial Condition and Results of Operations — Equity Capital Management and Regulatory Capital” in Part II, Item 7 of the 2014Form 10-Kfor information on the calculation ofabout GS Bank USA’s regulatory capital ratios under Basel 1 and for a discussion of minimum required ratios.supplementary leverage ratio.
| 16 | Goldman Sachs 2014 Form 10-K |
THE GOLDMAN SACHS GROUP, INC. AND SUBSIDIARIES
GS Bank USA computes its capital ratios in accordance with the regulatory capital requirements currently applicable to state member banks, which are based on Basel 1 as implemented by the Federal Reserve Board.
An institution may be downgraded to, or deemed to be in, a capital category that is lower than is indicated by its capital ratios if it is determined to be in an unsafe or unsound condition or if it receives an unsatisfactory examination rating with respect to certain matters. FDICIA imposes progressively more restrictive constraints on operations, management and capital distributions, as the capital category of an institution declines. Failure to meet the capital requirements could also subjectrequire a depository institution to capital raising requirements.raise capital. Ultimately, critically undercapitalized institutions are subject to the appointment of a receiver or conservator, as described under “— Insolvency of an Insured Depository Institution or a Bank Holding Company” below.
The prompt corrective action regulations apply only to depository institutions and not to bank holding companies such as Group Inc. However, the Federal Reserve Board is authorized to take appropriate action at the holding company level, based upon the undercapitalized status of the holding company’s depository institution subsidiaries. In certain instances relating to an undercapitalized depository institution subsidiary, the bank holding company would be required to guarantee the performance of the undercapitalized subsidiary’s capital restoration plan and might be liable for civil money damages for failure to fulfill its commitments on that guarantee. Furthermore, in the event of the bankruptcy of the holding company, the guarantee would take priority over the holding company’s general unsecured creditors, as described under “— Source of Strength” above.
Resolution Plan. The FDIC issued a rule requiring each insured depository institution with $50 billion or more in assets, such as GS Bank USA, to provide a resolution plan. Similar to our resolution plan for Group Inc., our resolution plan for GS Bank USA must, among other things, demonstrate that it is adequately protected from risks arising from our other entities. GS Bank USA submitted its 2013 resolution plan to its regulators in September 2013 and its 2014 resolution plan in June 2014. In December 2014, the FDIC issued guidance relating to insured depository institutions’ resolution plans. GS Bank USA’s 2015 resolution plan is required to be submitted on or before July 1, 2015.
Insolvency of an Insured Depository Institution or a Bank Holding Company
IfUnder the Federal Deposit Insurance Act of 1950, if the FDIC is appointed as conservator or receiver for an insured depository institution such as GS Bank USA, upon its insolvency or in certain other events, the FDIC has broad powers, including the power:
| Ÿ |
|
| Ÿ |
|
| Ÿ |
|
In addition, under federal law, the claims of holders of domestic deposit liabilities and certain claims for administrative expenses against an insured depository institution would be afforded a priority over other general unsecured claims, against such an institution, including deposits at non-U.S. branches and claims of debt holders of the institution, in the “liquidation or other resolution” of such an institution by any receiver. As a result, whether or not the FDIC ever sought to repudiate any debt obligations of GS Bank USA, the debt holders (other than depositors) would be treated differently from, and could receive, if anything, substantially less than, the depositors of GS Bank USA.
The Dodd-Frank Act created a new resolution regime (known as “orderly liquidation authority”) for bank holding companies and their affiliates andthat are systemically important and certain non-bank financial companies. Under the orderly liquidation authority, the FDIC may be appointed as receiver for the systemically important institution and its failed non-bank subsidiaries for purposes of liquidating the entity if, among other conditions, it is determined at the time of the institution’s failure that it is in default or in danger of default and the failure poses a risk to the stability of the U.S. financial system.
| Goldman Sachs |
THE GOLDMAN SACHS GROUP, INC. AND SUBSIDIARIES
If the FDIC is appointed as receiver under the orderly liquidation authority, then the powers of the receiver, and the rights and obligations of creditors and other parties who have dealt with the institution, would be determined under the Dodd-Frank Act provisions,orderly liquidation authority, and not under the bankruptcy or insolvency law that would otherwise apply. The powers of the receiver under the orderly liquidation authority were generally based on the powers of the FDIC as receiver for depository institutions under the Federal Deposit Insurance Act (FDIA). However, the provisions governing the rights of creditors under the orderly liquidation authority were modified from the FDIA regime in certain respects to reduce disparities with the treatment of creditors’ claims under the U.S. Bankruptcy Code as compared to the treatment of those claims under the new authority. Nonetheless, substantialAct. Substantial differences in the rights of creditors exist between these two regimes,the orderly liquidation authority and the U.S. Bankruptcy Code, including the right of the FDIC under the Dodd-Frank Act provisionsorderly liquidation authority to disregard the strict priority of creditor claims in some circumstances, the use of an administrative claims procedure to determine creditors’ claims (as opposed to the judicial procedure utilized in bankruptcy proceedings), and the right of the FDIC to transfer claims to a “bridge” entity. In addition, the orderly liquidation authority limits the ability of creditors to enforce certain contractual cross-defaults against affiliates of the institution in receivership.
The orderly liquidation authority provisions of the Dodd-Frank Act became effective upon enactment. However, a number of rulemakings are required under the terms of the Act, and a number of provisions of the new authority require clarification. The FDIC has completed its initial phase of rulemakingseveral rulemakings and taken other actions under the orderly liquidation authority, but may provide additional guidance. New guidance may affectincluding the mannerissuance of a notice in whichDecember 2013 describing some elements of its “single point of entry” or “SPOE” strategy pursuant to the neworderly liquidation authority is applied, particularly with respect to broker-dealer and futures commission merchant subsidiaries of bank holding companies.
Trust Companies
Group Inc.’s two limited purpose trust company subsidiaries are not permitted to and do not accept deposits or make loans (other than as incidental to their trust activities) and, as a result, are not insured by the FDIC. The Goldman Sachs Trust Company, N.A., a national banking association that is limited to fiduciary activities, is regulated by the Officeprovisions of the ComptrollerDodd-Frank Act. Under this strategy, the FDIC would, among other things, resolve a failed financial holding company by transferring its assets to a “bridge” holding company.
In November 2014, we, along with a number of other major global banking organizations, adhered to a new International Swaps and Derivatives Association Resolution Stay Protocol (the ISDA Protocol) that was developed in coordination with the CurrencyFinancial Stability Board and that took effect in January 2015. The ISDA Protocol imposes a stay on certain cross-default and early termination rights within standard ISDA derivatives contracts between adhering parties in the event that one of them is subject to resolution in its home jurisdiction, including a member bankresolution under the orderly liquidation authority in the United States. The ISDA Protocol is expected to be adopted more broadly in the future, following the adoption of regulations by banking regulators, and expanded to include instances where a U.S. financial holding company becomes subject to proceedings under the Federal Reserve System. The Goldman Sachs Trust Company of Delaware, a Delaware limited purpose trust company, is regulated by the Office of the Delaware State Bank Commissioner.U.S. bankruptcy code.
U.S.Broker-Dealer and Securities and Commodities Regulation
Goldman Sachs’ broker-dealer subsidiaries are subject to regulations that cover all aspects of the securities business, including sales methods, trade practices, use and safekeeping of clients’ funds and securities, capital structure, recordkeeping, the financing of clients’ purchases, and the conduct of directors, officers and employees. In the United States, the SEC is the federal agency responsible for the administration of the federal securities laws. GS&Co. is registered as a broker-dealer, a municipal advisor and an investment adviser with the SEC and as a broker-dealer in all 50 states and the District of Columbia. Self-regulatory organizations, such as FINRA and the NYSE, adopt rules that apply to, and examine, broker-dealers such as GS&Co.
In addition, state securities and other regulators also have regulatory or oversight authority over GS&Co. Similarly, our businesses are also subject to regulation by various non-U.S. governmental and regulatory bodies and self-regulatory authorities in virtually all countries where we have offices.offices, as discussed further under “Other Regulation” below. GSEC and one of its subsidiaries are registered U.S. broker-dealers and are regulated by the SEC, the NYSE and FINRA. Goldman Sachs Financial Markets, L.P. is registered with the SEC as an OTC derivatives dealer and conducts certain OTC derivatives activities.
The commodity futures and commodity options industry in the United States is subject to regulation under the U.S. Commodity Exchange Act (CEA). The CFTC is the federal agency charged with the administration of the CEA. Several of Goldman Sachs’ subsidiaries, including GS&Co. and GSEC, are registered with the CFTC and act as futures commission merchants, commodity pool operators or commodity trading advisors and are subject to CEA regulations. The rules and regulations of various self-regulatory organizations, such as the Chicago Board of Trade and the Chicago Mercantile Exchange, other futures exchanges and the National Futures Association, also govern the commodity futures and commodity options activities of these entities.
For a discussion of net capital requirements applicable to GS&Co. and GSEC, see Note 20 to the consolidated financial statements in Part II, Item 8 of thisthe 2014 Form 10-K.
THE GOLDMAN SACHS GROUP, INC. AND SUBSIDIARIES
Our exchange-based market-making activities are subject to extensive regulation by a number of securities exchanges. As a DMM on the NYSE and as a market maker on other exchanges, we are required to maintain orderly markets in the securities to which we are assigned. Under the NYSE’s DMM rules, this may require us to supply liquidity to these markets in certain circumstances.
J. Aron & Company is authorized by the U.S. Federal Energy Regulatory Commission (FERC) to sell wholesale physical power at market-based rates. As a FERC-authorized power marketer, J. Aron & Company is subject to regulation under the U.S. Federal Power Act and FERC regulations and to the oversight of FERC. As a result of our investing activities, GS&Co. is also an “exempt holding company” under the U.S. Public Utility Holding Company Act of 2005 and applicable FERC rules.
In addition, as a result of our power-related and commodities activities, we are subject to extensive and evolving energy, environmental and other governmental laws and regulations, as discussed under “Risk Factors — Our commodities activities, particularly our power generation interests and our physical commodities activities, subject us to extensive regulation, potential catastrophic events and environmental, reputational and other risks that may expose us to significant liabilities and costs” in Part I, Item 1A of this Form 10-K.
The Dodd-Frank Act will result in additional regulation by the CFTC,SEC, the SECCFTC and other regulators of our broker-dealer and regulated subsidiaries in a number of respects. The legislation calls for the imposition of expanded standards of care by market participants in dealing with clients and customers, including by providing the SEC with authority to adopt rules establishing fiduciary duties for broker-dealers and directing the SEC to examine and improve sales practices and disclosure by broker-dealers and investment advisers. The Dodd-Frank Act
| 18 | Goldman Sachs 2014 Form 10-K |
THE GOLDMAN SACHS GROUP, INC. AND SUBSIDIARIES
Our broker-dealer and other subsidiaries will also contains provisions designedbe affected by rules recently adopted by federal agencies pursuant to increase transparency in over-the-counter derivatives markets, including by requiring the registration of all swap dealers and security-based swap dealers, and the clearing and execution of swaps through regulated facilities (subject to limited exceptions, including swaps with non-financial end users and swaps that are not cleared by a clearing agency), in accordance with CFTC and SEC rulemaking. Furthermore, federal banking agencies are required under the Dodd-Frank Act to develop rules whereby anyonethat require any person who organizes or initiates an asset-backed security transaction mustto retain a portion (generally, at least five percent) of any credit risk that the person conveys to a third party.
In Securitizations will also be affected by rules proposed by the SEC in September 2011 the SEC proposed rules to implement the Dodd-Frank Act’s prohibition against securitization participants’participants engaging in any transaction that would involve or result in any material conflict of interest with an investor in a securitization transaction. The proposed rules would exceptexempt bona fide market-making activities and risk-mitigating hedging activities in connection with securitization activities from the general prohibition.
InsuranceThe SEC, FINRA and regulators in various non-U.S. jurisdictions have imposed both conduct-based and disclosure-based requirements with respect to research reports and research analysts and may impose additional regulations.
Swaps, Derivatives and Commodities Regulation
The commodity futures, commodity options and swaps industry in the United States is subject to regulation under the U.S. Commodity Exchange Act. The CFTC is the federal agency charged with the administration of the CEA. In addition, the SEC is the federal agency charged with the regulation of security-based swaps. Several of Goldman Sachs’ subsidiaries, including GS&Co. and GSEC, are registered with the CFTC and act as futures commission merchants, commodity pool operators, commodity trading advisors or (as discussed below) swap dealers, and are subject to CFTC regulations. The rules and regulations of various self-regulatory organizations, such as the Chicago Board of Trade and the Chicago Mercantile Exchange, other futures exchanges and the National Futures Association, also govern the commodity futures, commodity options and swaps activities of these entities. In addition, Goldman Sachs Financial Markets, L.P. is registered with the SEC as an OTC derivatives dealer and conducts certain OTC derivatives activities.
The Dodd-Frank Act provides for significantly increased regulation of, and restrictions on, derivative markets and transactions. In particular, the Dodd-Frank Act imposes the following requirements relating to swaps and security-based swaps:
| Ÿ | Real-time public and regulatory reporting of trade information for swaps and security-based swaps and large trader reporting for swaps; |
| Ÿ | Registration of swap dealers and major swap participants with the CFTC and of security-based swap dealers and major security-based swap participants with the SEC; |
| Ÿ | Position limits that cap exposure to derivatives on certain physical commodities; |
| Ÿ | Mandated clearing through central counterparties and execution through regulated exchanges or electronic facilities for certain swaps and security-based swaps; |
| Ÿ | New business conduct standards and other requirements for swap dealers, major swap participants, security-based swap dealers and major security-based swap participants, covering their relationships with counterparties, internal oversight and compliance structures, conflict of interest rules, internal information barriers, general and trade-specific record-keeping and risk management; |
| Ÿ | Margin requirements for trades that are not cleared through a central counterparty; and |
| Ÿ | Entity-level capital requirements for swap dealers, major swap participants, security-based swap dealers, and major security-based swap participants. |
The terms “swaps” and “security-based swaps” are generally defined broadly for purposes of these requirements, and can include a wide variety of derivative instruments in addition to those conventionally called swaps. The definition includes certain forward contracts, options, certain loan participations and guarantees of swaps, subject to certain exceptions, and relates to a wide variety of underlying assets or obligations, including currencies, commodities, interest or other monetary rates, yields, indices, securities, credit events, loans and other financial obligations.
| Goldman Sachs 2014 Form 10-K | 19 |
THE GOLDMAN SACHS GROUP, INC. AND SUBSIDIARIES
The CFTC is responsible for issuing rules relating to swaps, swap dealers and major swap participants, and the SEC is responsible for issuing rules relating to security-based swaps, security-based swap dealers and major security-based swap participants. Although the CFTC has not yet finalized its margin requirements or capital regulations, certain of the requirements, including registration of swap dealers, mandatory clearing of certain swaps, business conduct standards and real-time public trade reporting, have taken effect already under CFTC rules, and the SEC and the CFTC have finalized the definitions of a number of key terms. Finally, the CFTC has commenced making determinations regarding which swaps must be traded on swap execution facilities or exchanges, and certain interest rate swaps and credit default swaps are now subject to these trade-execution requirements. The CFTC is expected to continue to make such determinations during 2015.
In September 2014, the U.S. federal bank regulatory agencies (acting jointly) and the CFTC issued separate but similar proposals that would impose mandatory margining requirements for certain swaps that are not cleared.
The SEC has proposed rules to impose margin, capital and segregation requirements for security-based swap dealers and major security-based swap participants. The SEC has also proposed rules relating to registration of security-based swap dealers and major security-based swap participants, trade reporting and real-time reporting, and business conduct requirements for security-based swap dealers and major security-based swap participants. The SEC has proposed, but not yet finalized, rules that would govern the design of new trading venues for security-based swaps and establish the process for determining which products must be traded on these venues.
We have registered certain subsidiaries as “swap dealers” under the CFTC rules, including GS&Co., GS Bank USA, GSI and J. Aron & Company. We expect that these entities, and our businesses more broadly, will be subject to significant and developing regulation and regulatory oversight in connection with swap-related activities.
Similar regulations have been proposed or adopted in jurisdictions outside the United States, including the adoption of standardized execution and clearing, margining and reporting requirements for OTC derivatives. For instance, the EU has established regulatory requirements for OTC derivatives activities under the European Market Infrastructure Regulation, including requirements relating to portfolio reconciliation and reporting, which have already taken effect, as well as requirements relating to clearing and margining for uncleared derivatives, which are currently expected to be finalized during 2015.
The full application of new derivatives rules across different national and regulatory jurisdictions has not yet been fully established. In July 2013, the CFTC finalized guidance and timing on the cross-border regulation of swaps and announced that it had reached an understanding with the European Commission regarding the cross-border regulation of derivatives and the common goals underlying their respective regulations. In June 2014, the SEC issued rules and guidance on cross-border security-based swap activities. However, specific determinations of the extent to which regulators in each of the relevant jurisdictions will defer to regulations in other jurisdictions have not yet been completed. The full impact of the various U.S. and non-U.S. regulatory developments in this area will not be known with certainty until all the rules are finalized and implemented and market practices and structures develop under the final rules.
J. Aron & Company is authorized by the U.S. Federal Energy Regulatory Commission (FERC) to sell wholesale physical power at market-based rates. As a FERC-authorized power marketer, J. Aron & Company is subject to regulation under the U.S. Federal Power Act and FERC regulations and to the oversight of FERC. As a result of our investing activities, Group Inc. is also an “exempt holding company” under the U.S. Public Utility Holding Company Act of 2005 and applicable FERC rules.
In addition, as a result of our power-related and commodities activities, we are subject to energy, environmental and other governmental laws and regulations, as discussed under “Risk Factors — Our commodities activities, particularly our physical commodities activities, subject us to extensive regulation and involve certain potential risks, including environmental, reputational and other risks that may expose us to significant liabilities and costs” in Part I, Item 1A of the 2014 Form 10-K.
| 20 | Goldman Sachs 2014 Form 10-K |
THE GOLDMAN SACHS GROUP, INC. AND SUBSIDIARIES
Investment Management Regulation
Our investment management business is subject to significant regulation in numerous jurisdictions around the world relating to, among other things, the safeguarding of client assets, offerings of funds, marketing activities, transactions among affiliates and our management of client funds.
Certain of our subsidiaries are registered with, and subject to oversight by, the SEC as investment advisers. In July 2014, the SEC adopted amendments to the rules that govern SEC-registered money market mutual funds. The new rules require institutional prime money market funds to value their portfolio securities using market-based factors and to sell and redeem their shares based on a floating net asset value. In addition, the rules allow, in certain circumstances, for the board of directors of money market mutual funds to impose liquidity fees and redemption gates and also require additional disclosure, reporting and stress testing. We are currently evaluating the impact of the rules. The firm’s money market mutual funds will be required to comply with the amendments relating to floating net asset value, fees and redemption gates in 2016, with certain reporting requirements becoming effective in 2015.
Other Regulation
OurThe U.S. insurance subsidiaries are subject toand non-U.S. government agencies, regulatory bodies and self-regulatory organizations, as well as state insurance regulationsecurities commissions and oversightother state regulators in the statesUnited States, are empowered to conduct administrative proceedings that can result in which they are domiciled and incensure, fine, the other states in which they are licensed, and Group Inc. is subject to oversight as an insurance holding company in states where our insurance subsidiaries are domiciled. State insurance regulations limitissuance of cease-and-desist orders, or the abilitysuspension or expulsion of our insurance subsidiaries to pay dividends to Group Inc. in certain circumstances, and could require regulatory approval for any change in “control” of Group Inc., which may include control of 10%a regulated entity or more of our voting stock.its directors, officers or employees. In addition, a number of our other activities require us to obtain licenses, adhere to applicable regulations and be subject to the oversight of various regulators in the statesjurisdictions in which we conduct these activities.
Regulation Outside Regulatory oversight has been increasing, as well as the United Stateslevel of fines and penalties imposed by regulatory agencies. Our subsidiaries are subject to various and numerous requests for information, investigations and proceedings, and sanctions have been imposed for infractions of various regulations relating to our activities.
Goldman Sachs providesIn Europe, we provide investment services outside the United States that are subject to oversight by national regulators as well as the EU.EU regulators. These investment services are regulated in accordance with national laws, many of which implement EU directives, and increasingly by directly applicable EU regulations. These national and EU laws require, among other things, compliance with certain capital adequacy standards, customer protection requirements and market conduct and trade reporting rules.
Goldman Sachs providesWe provide investment services in and from the United Kingdom under the regulation of the FSA. Goldman Sachs International (GSI),PRA and the FCA. GSI, our regulated U.K. broker-dealer subsidiary, is subject to the capital requirements imposed by the FSA.PRA. Other subsidiaries, including Goldman Sachs International Bank (GSIB), our regulated U.K. bank, and Rothesay Life Limited (Rothesay Life), our U.K. insurance subsidiary, are also regulated by the FSA.PRA and the FCA. As of December 2011,2014, GSI GSIB and Rothesay LifeGSIB were in compliance with the FSAPRA capital requirements. See “Management’s Discussion and Analysis of Financial Condition and Results of Operations — Equity Capital Management and Regulatory Capital — Subsidiary Capital Requirements” in Part II, Item 7 of the 2014 Form 10-K for information about GSI’s capital ratios.
THE GOLDMAN SACHS GROUP, INC. AND SUBSIDIARIES
Various of our other Goldman Sachs entities are regulated by the banking insurance and securities regulatory authorities of the European countries in which they operate, including, among others, the Federal Financial Supervisory Authority (BaFin) and the Bundesbank in Germany, the Autorité de Contrôle Prudentiel and the Autorité des Marchés Financiers in France, Banca d’Italia and the Commissione Nazionale per le Società e la Borsa (CONSOB) in Italy, the Federal Financial Markets Service and the Central Bank of the Russian Federation and the Swiss Financial Market Supervisory Authority. GS Bank Europe, our regulated Irish bank, is subject to minimum capital requirements imposed byIn November 2014, a new Single Supervisory Mechanism became effective, under which the European Central Bank and national supervisors both have certain regulatory responsibilities for banks in participating EU member states. While the U.K. does not participate in this new mechanism, it gives new powers to the European Central Bank to take regulatory action with regard to the firm’s banks in Germany and France.
| Goldman Sachs 2014 Form 10-K | 21 |
THE GOLDMAN SACHS GROUP, INC. AND SUBSIDIARIES
The EU finalized the Markets in Financial Instruments Regulation and a revision of Ireland. Asthe Markets in Financial Instruments Directive, both of December 2011, this bank waswhich will become effective in compliance with allJanuary 2017. These will include new market structure-related, reporting, investor protection-related and organizational requirements, including requirements on pre- and post-trade transparency, requirements to use certain venues when trading financial instruments (which includes certain derivative instruments), requirements affecting the way investment managers can obtain research, powers of regulators to impose position limits and provisions on regulatory capital requirements.sanctions.
The EU and national financial legislators and regulators have proposed or adopted numerous further market reforms that may impact our businesses. These include stricter capital and liquidity requirements, (including the adoption ofincluding finalized legislation to implement Basel 2.5, which has resulted in increasedIII capital requirements for market risk for certain of our EU subsidiaries); risk retention and enhanced disclosure requirements for asset-backed security offerings, reporting requirements and restrictions on short selling and credit default swaps, the introduction of standardized execution and clearing, margining and reporting requirements for OTC derivatives, and additional obligations and restrictionssubsidiaries (such as GSI). These market reforms also include rules on the managementseparation of certain trading activities from deposit taking and marketing of funds in the EU.on indices that are used as benchmarks for financial instruments or funds. In addition, the European Commission, the European Securities Market Authority and the European Banking Authority and the European Insurance and Occupational Pensions Authorityhave announced or are formulating regulatory standards and other measures which will be of increasing importance forimpact our European operations. Certain Goldman Sachs entities are also regulated by the European securities, derivatives and commodities exchanges of which they are members.
In September 2011, the European Commission published a draft proposal for a common system of financial transactions tax. The proposed financial transactions tax is broad in scope and would apply to transactions in a wide variety of financial instruments and derivatives. The draft legislation is still subject to agreement by the EU member states, as well as legislative approval, and the full impact of the proposal will not be known until the legislation is finalized.
Goldman Sachs Japan Co., Ltd. (GSJCL), our regulated Japanese broker-dealer, is subject to the capital requirements imposed by Japan’s Financial Services Agency. As of December 2011,2014, GSJCL was in compliance with its capital adequacy requirements. GSJCL is also regulated by the Tokyo Stock Exchange, the Osaka Securities Exchange, the Tokyo Financial Exchange, the Japan Securities Dealers Association, the Tokyo Commodity Exchange, Securities and Exchange Surveillance Commission, Bank of Japan, the Ministry of Finance and the Ministry of Economy, Trade and Industry, among others.
Also, the Securities and Futures Commission in Hong Kong, the Monetary Authority of Singapore, the China Securities Regulatory Commission, the Korean Financial Supervisory Service, the Reserve Bank of India, the Securities and Exchange Board of India, the Australian Securities and Investments Commission and the Australian Securities Exchange, among others, regulate various of our subsidiaries and also have capital standards and other requirements comparable to the rules of the SEC.
Various other Goldman Sachs entities are regulated by the banking and regulatory authorities in countriesjurisdictions in which Goldman Sachs operates, including, among others, Brazil and Dubai. In addition, certain of our insurance subsidiaries are regulated by the Bermuda Monetary Authority.
Regulations Applicable in and Outside the United States
The U.S. and non-U.S. government agencies, regulatory bodies and self-regulatory organizations, as well as state securities commissions and other state regulators in the United States, are empowered to conduct administrative proceedings that can result in censure, fine, the issuance of cease and desist orders, or the suspension or expulsion of a broker-dealer or its directors, officers or employees. From time to time, our subsidiaries have been subject to investigations and proceedings, and sanctions have been imposed for infractions of various regulations relating to our activities.
THE GOLDMAN SACHS GROUP, INC. AND SUBSIDIARIES
The U.S. Bank Secrecy Act (BSA), as amended by the USA PATRIOT Act of 2001 (PATRIOT Act), contains anti-money laundering and financial transparency laws and mandated the implementation of various regulations applicable to all financial institutions, including standards for verifying client identification at account opening, and obligations to monitor client transactions and report suspicious activities. Through these and other provisions, the BSA and the PATRIOT Act seek to promote the identification of parties that may be involved in terrorism, money laundering or other suspicious activities. Anti-money laundering laws outside the United States contain some similar provisions.
| 22 | Goldman Sachs 2014 Form 10-K |
THE GOLDMAN SACHS GROUP, INC. AND SUBSIDIARIES
In addition, we are subject to laws and regulations worldwide, including the U.S. Foreign Corrupt Practices Act and the U.K. Bribery Act, relating to corrupt and illegal payments to, and hiring practices with regard to, government officials and others. The obligation of financial institutions, including Goldman Sachs, to identify their clients, to monitor for and report suspicious transactions, to monitor direct and indirect payments to government officials, to respond to requests for information by regulatory authorities and law enforcement agencies, and to share information with other financial institutions, has required the implementation and maintenance of internal practices, procedures and controls that have increased, and may continue to increase, our costs, and any failure with respect to our programs in this area could subject us to substantial liability and regulatory fines.
The SEC, FINRA and regulators in various non-U.S. jurisdictions have imposed both conduct-based and disclosure-based requirements with respect to research reports and research analysts and may impose additional regulations.
Our investment management business is subject to significant regulation in numerous jurisdictions around the world relating to, among other things, the safeguarding of client assets and our management of client funds.
As discussed above, many of our subsidiaries are subject to regulatory capital requirements in jurisdictions throughout the world. Subsidiaries not subject to separate regulation may hold capital to satisfy local tax guidelines, rating agency requirements or internal policies, including policies concerning the minimum amount of capital a subsidiary should hold based upon its underlying risk.
Certain of our businesses are subject to compliance with regulations enacted by U.S. federal and state governments, the EU or other jurisdictions and/or enacted by various regulatory organizations or exchanges relating to the privacy of the information of clients, employees or others, and any failure to comply with these regulations could expose us to liability and/or reputational damage.
Our internet address iswww.gs.com and the investor relations section of our web site is located atwww.gs.com/shareholders. We make available free of charge through the investor relations section of our web site, annual reports on Form 10-K, quarterly reports on Form 10-Q and current reports on Form 8-K and amendments to those reports filed or furnished pursuant to Section 13(a) or 15(d) of the U.S. Securities Exchange Act of 1934 (Exchange Act), as well as proxy statements, as soon as reasonably practicable after we electronically file such material with, or furnish it to, the SEC. Also posted on our web site, and available in print upon request of any shareholder to our Investor Relations Department, are our certificate of incorporation and by-laws, charters for our Audit Committee, Risk Committee, Compensation Committee, and Corporate Governance, Nominating and NominatingPublic Responsibilities Committee, our Policy Regarding Director Independence Determinations, our Policy on Reporting of Concerns Regarding Accounting and Other Matters, our Corporate Governance Guidelines and our Code of Business Conduct and Ethics governing our directors, officers and employees. Within the time period required by the SEC, we will post on our web site any amendment to the Code of Business Conduct and Ethics and any waiver applicable to any executive officer, director or senior financial officer.
In addition, our web site includes information concerning purchases and sales of our equity securities by our executive officers and directors, as well as disclosure relating to certain non-GAAP financial measures (as defined in the SEC’s Regulation G) that we may make public orally, telephonically, by webcast, by broadcast or by similar means from time to time.concerning:
| Ÿ | Purchases and sales of our equity securities by our executive officers and directors; |
| Ÿ | Disclosure relating to certain non-GAAP financial measures (as defined in the SEC’s Regulation G) that we may make public orally, telephonically, by webcast, by broadcast or by similar means from time to time; |
| Ÿ | Dodd-Frank Act stress test results; and |
| Ÿ | The firm’s risk management practices and regulatory capital ratios, as required under the disclosure-related provisions of the Revised Capital Framework, which are based on the third pillar of Basel III. |
Our Investor Relations Department can be contacted at The Goldman Sachs Group, Inc., 200 West Street, 29th Floor, New York, New York 10282, Attn: Investor Relations, telephone: 212-902-0300, e-mail:gs-investor-relations@gs.com.
| Goldman Sachs |
THE GOLDMAN SACHS GROUP, INC. AND SUBSIDIARIES
Cautionary Statement Pursuant to the U.S. Private Securities Litigation Reform Act of 1995 |
We have included or incorporated by reference in thisthe 2014 Form 10-K, and from time to time our management may make, statements that may constitute “forward-looking statements” within the meaning of the safe harbor provisions of the U.S. Private Securities Litigation Reform Act of 1995. Forward-looking statements are not historical facts, but instead represent only our beliefs regarding future events, many of which, by their nature, are inherently uncertain and outside our control. These statements include statements other than historical information or statements of current condition and may relate to our future plans and objectives and results, among other things, and may also include our belief regardingstatements about the effect of changes to the capital and leverage rules applicable to banks and bank holding companies, the impact of the Dodd-Frank Act on our businesses and operations, and various legal proceedings or mortgage-related contingencies as set forth under “Legal Proceedings” and “Certain Mortgage-Related Contingencies” in NoteNotes 27 and 18, respectively, to the consolidated financial statements in Part II, Item 8 of thisthe 2014 Form 10-K, as well as statements about the results of our Dodd-Frank Act and firm stress tests, statements about the objectives and effectiveness of our business continuity plan, information security program, risk management and liquidity policies, statements about trends in or growth opportunities for our businesses, statements about our future status, activities or reporting under U.S. or non-U.S. banking and financial regulation, and statements about our investment banking transaction backlog.
By identifying these statements for you in this manner, we are alerting you to the possibility that our actual results and financial condition may differ, possibly materially, from the anticipated results and financial condition indicated in these forward-looking statements. Important factors that could cause our actual results and financial condition to differ from those indicated in the forward-looking statements include, among others, those discussed below and under “Risk Factors” in Part I, Item 1A of this the 2014Form 10-K.
In the case of statements about our investment banking transaction backlog, such statements are subject to the risk that the terms of these transactions may be modified or that they may not be completed at all; therefore, the net revenues, if any, that we actually earn from these transactions may differ, possibly materially, from those currently expected. Important factors that could result in a modification of the terms of a transaction or a transaction not being completed include, in the case of underwriting transactions, a decline or continued weakness in general economic conditions, outbreak of hostilities, volatility in the securities markets generally or an adverse development with respect to the issuer of the securities and, in the case of financial advisory transactions, a decline in the securities markets, an inability to obtain adequate financing, an adverse development with respect to a party to the transaction or a failure to obtain a required regulatory approval. For a discussion of other important factors that could adversely affect our investment banking transactions, see “Risk Factors” in Part I, Item 1A of this the 2014Form 10-K.
We have voluntarily provided in this filing information regarding the firm’s capital ratios, including the estimated CET1 ratios under the Advanced and Standardized approaches on a fully phased-in basis, as well as the LCR and estimated supplementary leverage ratios for the firm and GS Bank USA. The statements with respect to these estimated ratios are forward-looking statements, based on our current interpretation, expectations and understandings of the relevant regulatory rules and guidance, and reflect significant assumptions concerning the treatment of various assets and liabilities and the manner in which the ratios are calculated. As a result, the methods used to calculate these ratios may differ, possibly materially, from those used in calculating the estimates for any future voluntary disclosures as well as those used when such ratios are required to be disclosed. The ultimate methods of calculating the ratios will depend on, among other things, implementation guidance or further rulemaking from the U.S. federal bank regulatory agencies and the development of market practices and standards.
| Goldman Sachs |
THE GOLDMAN SACHS GROUP, INC. AND SUBSIDIARIES
We face a variety of risks that are substantial and inherent in our businesses, including market, liquidity, credit, operational, legal, regulatory and reputational risks. The following are some of the more important factors that could affect our businesses.
Our businesses have been and may continue to be adversely affected by conditions in the global financial markets and economic conditions generally.
Our businesses, by their nature, do not produce predictable earnings, and all of our businesses are materially affected by conditions in the global financial markets and economic conditions generally. In the past several years, thesegenerally, both directly and through their impact on client activity levels. These conditions have changedcan change suddenly and for a period of time, very negatively. In 2008 and through early 2009, the financial services industry and the securities markets generally were materially and adversely affected by significant declines in the values of nearly all asset classes and by a serious lack of liquidity. In 2011, concerns about European sovereign debt risk and its impact on the European banking system, and about U.S. growth and uncertainty regarding the U.S. federal debt ceiling, resulted in significant volatility and declines in the prices of most financial asset classes. In addition, declines in the value of sovereign debt held by financial institutions, as well as increased capital and other regulatory requirements and higher funding costs, have negatively impacted the cost of borrowing and access to debt markets for many financial institutions, including us. Such developments have negatively affected client activity.
Since 2008, governments, regulators and central banks in the United States and worldwide have taken numerous steps to increase liquidity and to restore investor and public confidence. In addition, there are numerous legislative and regulatory actions that have been taken to deal with what regulators, politicians and others believe to be the root causes of the financial crisis, including laws and regulations relating to financial institution capital requirements and compensation practices, restrictions on the type of activities
in which financial institutions are permitted to engage, and generally increased regulatory scrutiny. In some cases, additional taxes have been (or have been proposed to be) imposed on us and certain other financial institutions. Many of the regulations that are required to implement this legislation (including the Dodd-Frank Act) are still being drafted or are not yet in effect; therefore, the exact impact that these regulations will have on our businesses, results of operations and cash flows is presently unclear.
National and local governments continue to face difficult financial conditions due to significant reductions in tax revenues, particularly from corporate and personal income taxes, as well as increased outlays for unemployment benefits due to high unemployment levels and the cost of stimulus programs.
Declines in asset values, the lack of liquidity, general uncertainty about economic and market activities and a lack of consumer, investor and CEO confidence have negatively impacted many of our businesses.
Our financial performance is highly dependent on the environment in which our businesses operate. A favorable business environment is generally characterized by, among other factors, high global gross domestic product growth, transparent, liquid and efficient capital markets, low inflation, high business and investor confidence, stable geopolitical conditions, regulatory certainty and strong business earnings. Unfavorable or uncertain economic and market conditions can be caused by: concerns about sovereign defaults; uncertainty in U.S. federal fiscal or monetary policy, the U.S. federal debt ceiling and the continued funding of the U.S. government; uncertainty about the timing and nature of regulatory reforms; declines in economic growth, business activity or investor or business confidence; limitations on the availability or increases in the cost of credit and capital; increases in inflation, interest rates, exchange rate volatility, default rates or the price of basic commodities; outbreaks of hostilities or other geopolitical instability; corporate, political or other scandals that reduce investor confidence in capital markets; extreme weather events or other natural disasters or pandemics; or a combination of these or other factors.
In 2008 and through early 2009, the financial services industry and the securities markets generally were materially and adversely affected by significant declines in the values of nearly all asset classes and by a serious lack of liquidity. Since 2011, concerns about European sovereign debt risk and its impact on the European banking system, and about changes in market conditions or actual changes in market conditions, have resulted, at times, in significant volatility while negatively impacting the levels of client activity.
General uncertainty about economic, political and market activities, and the timing and final implementation of regulatory reform, as well as weak consumer, investor and CEO confidence resulting in large part from such uncertainty, continues to negatively impact client activity, which adversely affects many of our businesses. Periods of low volatility and periods of high volatility combined with a lack of liquidity, have at times had an unfavorable impact on our market-making businesses.
Our revenues and profitability and those of our competitors have been and will continue to be impacted by requirements relating to capital, leverage, minimum liquidity and long-term funding levels, requirements related to resolution and recovery planning, derivatives clearing and margin rules and levels of regulatory oversight, as well as limitations on whether and how certain business activities may be carried out by financial institutions. Although interest rates are at or near historically low levels, financial institution returns have also been negatively impacted by increased funding costs due in part to the withdrawal of perceived government support of such institutions in the event of future financial crises. In addition, liquidity in the financial markets may also be negatively impacted as market participants and market practices and structures adjust to new regulations.
The degree to which these and other changes resulting from the financial crisis will have a long-term impact on the profitability of financial institutions will depend on the final interpretation and implementation of new regulations, the manner in which markets, market participants and financial institutions adapt to the new landscape, and the prevailing economic and financial market conditions. However, there is a risk that such changes will, at least in the near-term, continue to negatively impact the absolute level of revenues, profitability and return on equity at our firm and at other financial institutions.
| Goldman Sachs |
THE GOLDMAN SACHS GROUP, INC. AND SUBSIDIARIES
Our businesses and those of our clients are subject to extensive and pervasive regulation around the world.
As a participant in the financial services industry and a systemically important financial institution, we are subject to extensive regulation in jurisdictions around the world. We face the risk of significant intervention by regulatory and taxing authorities in all jurisdictions in which we conduct our businesses. Among other things, as a result of regulators or private parties challenging our compliance with existing laws and regulations, we could be fined, prohibited from engaging in some of our business activities, subject to limitations or conditions on our business activities or subjected to new or substantially higher taxes or other governmental charges in connection with the conduct of our businesses or with respect to our employees. In many cases, our activities may be subject to overlapping and divergent regulation in different jurisdictions.
There is also the risk that new laws or regulations or changes in enforcement of existing laws or regulations applicable to our businesses or those of our clients, including capital, liquidity, leverage and margin requirements, restrictions on leveraged lending or other business practices, reporting requirements, tax burdens and compensation restrictions, could be imposed on a limited subset of financial institutions (either based on size, activities, geography or other criteria), which may adversely affect our ability to compete effectively with other institutions that are not affected in the same way. In addition, regulation imposed on financial institutions or market participants generally, such as taxes on financial transactions, could adversely impact levels of market activity more broadly, and thus impact our businesses.
These developments could impact our profitability in the affected jurisdictions, or even make it uneconomic for us to continue to conduct all or certain of our businesses in such jurisdictions, or could cause us to incur significant costs associated with changing our business practices, restructuring our businesses, moving all or certain of our businesses and our employees to other locations or complying with applicable capital requirements, including liquidating assets or raising capital in a manner that adversely increases our funding costs or otherwise adversely affects our shareholders and creditors.
U.S. and non-U.S. regulatory developments, in particular the Dodd-Frank Act and Basel III, have significantly altered the regulatory framework within which we operate and may adversely affect our competitive position and profitability. As discussed further under “Business — Regulation,” in Part I, Item 1 of the 2014 Form 10-K, in December 2013, final rules were adopted to implement the provisions of the Dodd-Frank Act referred to as the “Volcker Rule,” which will prohibit proprietary trading and will limit our sponsorship of, and investment in, covered funds. Based on what we know as of the date of this filing, we do not expect the impact of the prohibition on proprietary trading to be material to our financial condition, results of operations or cash flows.
However, given that the rule is highly complex, and its full impact will not be known until market practices are fully developed, the implementation of the rule and the related market changes could negatively impact our businesses and expose us to increased liability for inadvertent breaches and reporting failures. Among the other aspects of the Dodd-Frank Act most likely to affect our businesses are: increased capital, liquidity and reporting requirements; increased regulation of and restrictions on OTC derivatives markets and transactions; limitations on incentive compensation; limitations on affiliate transactions; requirements to reorganize or limit activities in connection with recovery and resolution planning; increased deposit insurance assessments; and increased standards of care for broker-dealers in dealing with clients. The implementation of higher capital requirements, the liquidity coverage ratio and the net stable funding ratio under Basel III may also adversely affect our profitability and competitive position, particularly if the requirements do not apply, or do not apply equally, to our competitors or are not implemented uniformly across jurisdictions.
As discussed under “Business — Regulation — Capital and Liquidity Requirements — Payment of Dividends and Stock Repurchases” in Part I, Item 1 of the 2014 Form 10-K, Group Inc.’s proposed capital actions and capital plan are reviewed by the Federal Reserve Board as part of the CCAR process. If the Federal Reserve Board objects to our proposed capital actions in our capital plan, Group Inc. could be prohibited from taking such capital actions, including increasing or paying dividends on common or preferred stock or repurchasing common stock or other capital securities. Our inability to carry out our proposed capital actions could, among other things, prevent us from returning capital to our shareholders and impact our return on equity.
| 26 | Goldman Sachs 2014 Form 10-K |
THE GOLDMAN SACHS GROUP, INC. AND SUBSIDIARIES
We are also subject to laws and regulations relating to the privacy of the information of clients, employees or others, and any failure to comply with these regulations could expose us to liability and/or reputational damage. In addition, our businesses are increasingly subject to laws and regulations relating to surveillance, encryption and data on-shoring in the jurisdictions in which we operate. Compliance with these laws and regulations may require us to change our policies, procedures and technology for information security (including cyber security), which could, among other things, make us more vulnerable to cyber attacks and misappropriation, corruption or loss of information or technology.
In addition, the attorneys general of a number of states have filed lawsuits against financial institutions alleging, among other things, that the centralized system of recording mortgages and designating a common entity as the mortgage holder is in violation of state law, and other authorities have brought similar actions or indicated that they are contemplating bringing such actions. If this system and related practices are deemed invalid, it may call into question the validity or enforceability of certain mortgage-related obligations under securitizations and other transactions in which we have participated, negatively impact the market for mortgages and mortgage-related products and our mortgage-related activities, or subject us to additional costs or penalties.
Increasingly, regulators and courts have sought to hold financial institutions liable for the misconduct of their clients where such regulators and courts have determined that the financial institution should have detected that the client was engaged in wrongdoing, even though the financial institution had no direct knowledge of the activities engaged in by its client. Regulators and courts have also increasingly found liability as a “control person” for activities of entities in which financial institutions or funds controlled by financial institutions have an investment, but which they do not actively manage. In addition, regulators and courts continue to seek to establish “fiduciary” obligations to counterparties to which no such duty had been assumed to exist. To the extent that such efforts are successful, the cost of, and liabilities associated with, engaging in brokerage, clearing, market-making, prime brokerage, investing and other similar activities could increase significantly.
For a discussion of the extensive regulation to which our businesses are subject, see “Business — Regulation” in Part I, Item 1 of the 2014 Form 10-K.
Our businesses have been and may be adversely affected by declining asset values. This is particularly true for those businesses in which we have net “long” positions, receive fees based on the value of assets managed, or receive or post collateral.
Many of our businesses have net “long” positions in debt securities, loans, derivatives, mortgages, equities (including private equity and real estate) and most other asset classes. These include positions we take when we act as a principal to facilitate our clients’ activities, including our exchange-based market-making activities, or commit large amounts of capital to maintain positions in interest rate and credit products, as well as through our currencies, commodities, equities and equitiesmortgage-related activities. Because nearlysubstantially all of these investing, lending and market-making positions are marked-to-market on a daily basis, declines in asset values directly and immediately impact our earnings, unless we have effectively “hedged” our exposures to such declines.
In certain circumstances (particularly in the case of leveraged loans and private equities or other securities that are
not freely tradable or lack established and liquid trading markets), it may not be possible or economic to hedge such exposures and to the extent that we do so the hedge may be ineffective or may greatly reduce our ability to profit from increases in the values of the assets. Sudden declines and significant volatility in the prices of assets may substantially curtail or eliminate the trading markets for certain assets, which may make it very difficult to sell, hedge or value such assets. The inability to sell or effectively hedge assets reduces our ability to limit losses in such positions and the difficulty in valuing assets may negatively affect our capital, liquidity or leverage ratios, increase our funding costs and generally require us to maintain additional capital and increase our funding costs.capital.
In our exchange-based market-making activities, we are obligated by stock exchange rules to maintain an orderly market, including by purchasing sharessecurities in a declining market. In markets where asset values are declining and in volatile markets, this results in losses and an increased need for liquidity.
We receive asset-based management fees based on the value of our clients’ portfolios or investment in funds managed by us and, in some cases, we also receive incentive fees based on increases in the value of such investments. Declines in asset values reduce the value of our clients’ portfolios or fund assets, which in turn reduce the fees we earn for managing such assets.
If financial markets decline, revenues from our variable annuity products are likely to decrease. In addition, unanticipated changes in reinvestment returns, policy lapses or mortality rates may also impact earnings from our insurance activities.
| Goldman Sachs 2014 Form 10-K | 27 |
THE GOLDMAN SACHS GROUP, INC. AND SUBSIDIARIES
We post collateral to support our obligations and receive collateral to support the obligations of our clients and counterparties in connection with our client execution businesses. When the value of the assets posted as collateral declines, the party posting the collateral may need to provide additional collateral or, if possible, reduce its trading position. A classic example of such a situation is a “margin call” in connection with a brokerage account. Therefore, declines in the value of asset classes used as collateral mean that either the cost of funding positions is increased or the size of positions is decreased. If we are the party providing collateral, this can increase our costs and reduce our profitability and if we are the party receiving collateral, this can also reduce our profitability by reducing the level of business done with our clients and counterparties. In addition, volatile or less liquid markets increase the difficulty of valuing assets which can lead to costly and time-consuming disputes over asset values and the level of required collateral, as well as increased credit risk to the recipient of the collateral due to delays in receiving adequate collateral.
THE GOLDMAN SACHS GROUP, INC. AND SUBSIDIARIES
Our businesses have been and may be adversely affected by disruptions in the credit markets, including reduced access to credit and higher costs of obtaining credit.
Widening credit spreads, as well as significant declines in the availability of credit, have in the past adversely affected our ability to borrow on a secured and unsecured basis and may do so in the future. We fund ourselves on an unsecured basis by issuing long-term debt, by accepting deposits at our bank subsidiaries, by issuing promissory notes and commercial paperhybrid financial instruments, or by obtaining bank loans or lines of credit. We seek to finance many of our assets on a secured basis, including by entering into repurchase agreements.basis. Any disruptions in the credit markets may make it harder and more expensive to obtain funding for our businesses. If our available funding is limited or we are forced to fund our operations at a higher cost, these conditions may require us to curtail our business activities and increase our cost of funding, both of which could reduce our profitability, particularly in our businesses that involve investing, lending and market making.
Our clients engaging in mergers and acquisitions often rely on access to the secured and unsecured credit markets to finance their transactions. A lack of available credit or an increased cost of credit can adversely affect the size, volume and timing of our clients’ merger and acquisition transactions — particularly large transactions — and adversely affect our financial advisory and underwriting businesses.
In addition, we may incur significant unrealized gains or losses due solely to changes in our credit spreads or those of third parties, as these changes may affect the fair value of our derivative instruments and the debt securities that we hold or issue.issue, which may in turn adversely affect our results of operations and capital ratios.
Our market-making activities have been and may be affected by changes in the levels of market volatility.
Certain of our market-making activities depend on market volatility to provide trading and arbitrage opportunities to our clients, and decreases in volatility may reduce these opportunities and adversely affect the results of these activities. On the other hand, increased volatility, while it can increase trading volumes and spreads, also increases risk as measured by Value-at-Risk (VaR) and may expose us to increased risks in connection with our market-making activities or cause us to reduce our market-making positions in order to avoid increasing our VaR. Limiting the size of our market-making positions can adversely affect our profitability, even though spreads are widening and we may earn more on each trade.profitability. In periods when volatility is increasing, but asset values are declining significantly, it
may not be possible to sell assets at all or it may only be possible to do so at steep discounts. In such circumstances we may be forced to either take on additional risk or to incur losses in order to decrease our VaR. In addition, increases in volatility increase the level of our risk weighted assets and increaseRWAs, which increases our capital requirements, both of which in turn increase our funding costs.requirements.
Our investment banking, client execution and investment management businesses have been adversely affected and may continue to be adversely affected by market uncertainty or lack of confidence among investors and CEOs due to general declines in economic activity and other unfavorable economic, geopolitical or market conditions.
Our investment banking business has been and may continue to be adversely affected by market conditions. Poor economic conditions and other adverse geopolitical conditions can adversely affect and have in the past adversely affected investor and CEO confidence, resulting in significant industry-wide declines in the size and number of underwritings and of financial advisory transactions, which could have an adverse effect on our revenues and our profit margins. In particular, because a significant portion of our investment banking revenues is derived from our participation in large transactions, a decline in the number of large transactions would adversely affect our investment banking business.
| 28 | Goldman Sachs 2014 Form 10-K |
THE GOLDMAN SACHS GROUP, INC. AND SUBSIDIARIES
In certain circumstances, market uncertainty or general declines in market or economic activity may affect our client execution businesses by decreasing levels of overall activity or by decreasing volatility, but at other times market uncertainty and even declining economic activity may result in higher trading volumes or higher spreads or both.
Market uncertainty, volatility and adverse economic conditions, as well as declines in asset values, may cause our clients to transfer their assets out of our funds or other products or their brokerage accounts and result in reduced net revenues, principally in our investment management business. To the extent that clients do not withdraw their funds, they may invest them in products that generate less fee income.
THE GOLDMAN SACHS GROUP, INC. AND SUBSIDIARIES
Our investment management business may be affected by the poor investment performance of our investment products.
Poor investment returns in our investment management business, due to either general market conditions or underperformance (relative to our competitors or to benchmarks) by funds or accounts that we manage or investment products that we design or sell, affects our ability to retain existing assets and to attract new clients or additional assets from existing clients. This could affect the management and incentive fees that we earn on assets under managementsupervision or the commissions and net spreads that we earn for selling other investment products, such as structured notes or derivatives.
We may incur losses as a result of ineffective risk management processes and strategies.
We seek to monitor and control our risk exposure through a risk and control framework encompassing a variety of separate but complementary financial, credit, operational, compliance and legal reporting systems, internal controls, management review processes and other mechanisms. Our risk management process seeks to balance our ability to profit from market-making, investing or lending positions with our exposure to potential losses. While we employ a broad and diversified set of risk monitoring and risk mitigation techniques, those techniques and the judgments that accompany their application cannot anticipate every economic and financial outcome or the specifics and timing of such outcomes. Thus, we may, in the course of our activities, incur losses. Market conditions in recent years have involved unprecedented dislocations and highlight the limitations inherent in using historical data to manage risk.
The models that we use to assess and control our risk exposures reflect assumptions about the degrees of correlation or lack thereof among prices of various asset classes or other market indicators. In times of market stress or other unforeseen circumstances, such as occurred during 2008 and early 2009, and to some extent insince 2011, previously uncorrelated indicators may become correlated, or conversely previously correlated indicators may move in different directions. These types of market movements have at times limited the effectiveness of our hedging strategies and have caused us to incur significant losses, and they may do so in the future. These changes in correlation can be exacerbated where other market participants are using risk or trading models with assumptions or algorithms that are similar to ours. In these and other cases, it may be difficult to reduce our risk positions due to the activity of other
market participants or widespread market dislocations, including circumstances where asset values are declining significantly or no market exists for certain assets.
To the extent that we have positions through our market-making or origination activities or we make investments directly through our investing activities, in securities, including private equity, that do not have an established liquid trading market or are otherwise subject to restrictions on sale or hedging, we may not be able to reduce our positions and therefore reduce our risk associated with such positions. In addition, to the extent permitted by applicable law and regulation, we invest our own capital in private equity, debt,credit, real estate and hedge funds that we manage and limitations on our ability to withdraw some or all of our investments in these funds, whether for legal, reputational or other reasons, may make it more difficult for us to control the risk exposures relating to these investments.
| Goldman Sachs 2014 Form 10-K | 29 |
THE GOLDMAN SACHS GROUP, INC. AND SUBSIDIARIES
Prudent risk management, as well as regulatory restrictions, may cause us to limit our exposure to counterparties, geographic areas or markets, which may limit our business opportunities and increase the cost of our funding or hedging activities.
For a further discussion of our risk management policies and procedures, see “Management’s Discussion and Analysis of Financial Condition and Results of Operations — Risk Management”Management and Risk Factors” in Part II, Item 7 of thisthe 2014 Form 10-K.
Our liquidity, profitability and businesses may be adversely affected by an inability to access the debt capital markets or to sell assets or by a reduction in our credit ratings or by an increase in our credit spreads.
Liquidity is essential to our businesses. Our liquidity may be impaired by an inability to access secured and/or unsecured debt markets, an inability to access funds from our subsidiaries, an inability to sell assets or redeem our investments, or unforeseen outflows of cash or collateral. This situation may arise due to circumstances that we may be unable to control, such as a general market disruption or an operational problem that affects third parties or us, or even by the perception among market participants that we, or other market participants, are experiencing greater liquidity risk.
The financial instruments that we hold and the contracts to which we are a party are often complex, as we employ structured products to benefit our clients and ourselves,hedge our own risks, and these complex structured products often do not have readily available markets to access in times of liquidity stress. Our investing and lending activities may lead to situations where the holdings from these activities represent a significant portion of specific markets, which could restrict liquidity for our positions.
THE GOLDMAN SACHS GROUP, INC. AND SUBSIDIARIES
Further, our ability to sell assets may be impaired if other market participants are seeking to sell similar assets at the same time, as is likely to occur in a liquidity or other market crisis.crisis or in response to changes to rules or regulations. In addition, financial institutions with which we interact may exercise set-off rights or the right to require additional collateral, including in difficult market conditions, which could further impair our access to liquidity.
Our credit ratings are important to our liquidity. A reduction in our credit ratings could adversely affect our liquidity and competitive position, increase our borrowing costs, limit our access to the capital markets or trigger our obligations under certain provisions in some of our trading and collateralized financing contracts. Under these provisions, counterparties could be permitted to terminate contracts with Goldman Sachs or require us to post additional collateral. Termination of our trading and collateralized financing contracts could cause us to sustain losses and impair our liquidity by requiring us to find other sources of financing or to make significant cash payments or securities movements. Certain rating agencies have indicated that the Dodd-Frank Act could result in the rating agencies reducing their assumed level of government support and therefore result in ratings downgrades for certain large financial institutions, including Goldman Sachs. As of December 2011,2014, each of Moody’s Investors Service, Standard & Poor’s Ratings Services and Ratings and Investment Information, Inc. had issued a negative outlook on our long-term credit ratings. As of December 2011,2014, in the event of a one-notch and two-notch downgrade of our credit ratings our counterparties could have called for additional collateral or termination payments related to our net derivative liabilities under bilateral agreements in an aggregate amount of $1.30$1.07 billion and $2.18$2.82 billion, respectively. A downgrade by any one rating agency, depending on the agency’s relative ratings of the firm at the time of the downgrade, may have an impact which is comparable to the impact of a downgrade by all rating agencies. For a further discussion of our credit ratings, see “Management’s Discussion and Analysis of Financial Condition and Results of Operations — Liquidity Risk Management — Credit Ratings” in Part II, Item 7 of the 2014 Form 10-K.
| 30 | Goldman Sachs 2014 Form 10-K |
THE GOLDMAN SACHS GROUP, INC. AND SUBSIDIARIES
Our cost of obtaining long-term unsecured funding is directly related to our credit spreads (the amount in excess of the interest rate of U.S. Treasury securities (or other benchmark securities) of the same maturity that we need to pay to our debt investors). Increases in our credit spreads can significantly increase our cost of this funding. Changes in credit spreads are continuous, market-driven, and subject at times to unpredictable and highly volatile movements. CreditOur credit spreads are also influenced by market perceptions of our creditworthiness. In addition, our credit spreads may be influenced by movements in the costs to purchasers of credit default swaps referenced to our long-term debt. The market for credit default swaps, although very large, has proven to be extremely volatile and currently lacksat times may lack a high degree of structure or transparency.
Regulatory changes relating to liquidity may also negatively impact our results of operations and competitive position. Recently, numerous regulations have been adopted or proposed, and additional regulations are under consideration, to introduce more stringent liquidity requirements for large financial institutions. These regulations and others being considered address, among other matters, liquidity stress testing, minimum liquidity requirements, wholesale funding, limitations on the issuance of short-term debt and structured notes. These may overlap with, and be impacted by, other regulatory changes, including new guidance on the treatment of brokered deposits and the capital, leverage and resolution and recovery frameworks applicable to large financial institutions, as well as proposals relating to minimum long-term debt requirements and total loss-absorbing capacity. Given the overlap and complex interactions among these new and prospective regulations, they may have unintended cumulative effects, and their full impact will remain uncertain until implementation of post-financial crisis regulatory reform is complete.
Conflicts of interest are increasing and aA failure to appropriately identify and address potential conflicts of interest could adversely affect our businesses.
As we have expandedDue to the broad scope of our businesses and our client base, we increasingly mustregularly address potential conflicts of interest, including situations where our services to a particular client or our own investments or other interests conflict, or are perceived to conflict, with the interests of another client, as well as situations where one or more of our businesses have access to material non-public information that may not be shared with other businesses within the firm and situations where we may be a creditor of an entity with which we also have an advisory or other relationship.
In addition, our status as a bank holding company subjects us to heightened regulation and increased regulatory scrutiny by the Federal Reserve Board with respect to transactions between GS Bank USA and entities that are or could be viewed as affiliates of ours.
We have extensive procedures and controls that are designed to identify and address conflicts of interest, including those designed to prevent the improper sharing of information among our businesses. However, appropriately identifying and dealing with conflicts of interest is complex and difficult, and our reputation, which is one of our most important assets, could be damaged and the willingness of clients to enter into transactions with us may be affected if we fail, or appear to fail, to identify, disclose and deal appropriately with conflicts of interest. In addition, potential or perceived conflicts could give rise to litigation or regulatory enforcement actions.
THE GOLDMAN SACHS GROUP, INC. AND SUBSIDIARIES
Group Inc. is a holding company and is dependent for liquidity on payments from its subsidiaries, many of which are subject to restrictions.
Group Inc. is a holding company and, therefore, depends on dividends, distributions and other payments from its subsidiaries to fund dividend payments and to fund all payments on its obligations, including debt obligations. Many of our subsidiaries, including our broker-dealer bank and insurancebank subsidiaries, are subject to laws that restrict dividend payments or authorize regulatory bodies to block or reduce the flow of funds from those subsidiaries to Group Inc.
| Goldman Sachs 2014 Form 10-K | 31 |
THE GOLDMAN SACHS GROUP, INC. AND SUBSIDIARIES
In addition, our broker-dealer bank and insurancebank subsidiaries are subject to restrictions on their ability to lend or transact with affiliates and to minimum regulatory capital and other requirements, as well as restrictions on their ability to use funds deposited with them in brokerage or bank accounts to fund their businesses. Additional restrictions on related-party transactions, increased capital and liquidity requirements and additional limitations on the use of funds on deposit in bank or brokerage accounts, as well as lower earnings, can reduce the amount of funds available to meet the obligations of Group Inc., including under the Federal Reserve Board’s source of strength policy, and even require Group Inc. to provide additional funding to such subsidiaries. Restrictions or regulatory action of that kind could impede access to funds that Group Inc. needs to make payments on its obligations, including debt obligations, or dividend payments. In addition, Group Inc.’s right to participate in a distribution of assets upon a subsidiary’s liquidation or reorganization is subject to the prior claims of the subsidiary’s creditors.
As a result of the 2008 financial crisis, there has been a trend towards increased regulation and supervision of our subsidiaries by the governments and regulators in the countries in which those subsidiaries are located or do business. Concerns about protecting clients and creditors of financial institutions that are controlled by persons or entities located outside of the country in which such entities are located or do business have caused or may cause a number of governments and regulators to take additional steps to “ring fence” such entities in order to protect clients and creditors of such entities in the event of financial difficulties involving such entities. The result has been and may continue to be additional limitations on our ability to efficiently move capital and liquidity among our affiliated entities, thereby increasing the overall level of capital and liquidity required by the firm on a consolidated basis.
Furthermore, Group Inc. has guaranteed the payment obligations of certain of its subsidiaries, including GS&Co., GS Bank USA GS Bank Europe and GSEC subject to certain exceptions, and has pledged significant assets to GS Bank USA to support obligations to GS Bank USA. In addition, Group Inc. guarantees many of the obligations of its other consolidated subsidiaries on a transaction-by-transaction basis, as negotiated with counterparties. These guarantees may require Group Inc. to provide substantial funds or assets to its subsidiaries or their creditors or counterparties at a time when Group Inc. is in need of liquidity to fund its own obligations.
The requirements for Group Inc. and GS Bank USA to develop and submit recovery and resolution plans to regulators, and the incorporation of feedback received from regulators, may require us to reduce our reliance on short-term funding, increase capital or liquidity levels at Group Inc. or particular subsidiaries or otherwise incur additional or duplicative operational or other costs at multiple entities, and may reduce our ability to provide Group Inc. guarantees of the obligations of our subsidiaries or raise debt at Group Inc. Resolution planning may also impair our ability to structure our intercompany and external activities in a manner that we may otherwise deem most operationally efficient. Furthermore, we may incur additional taxes. Any such limitations or requirements would be in addition to the legal and regulatory restrictions discussed above on our ability to engage in capital actions or make intercompany dividends or payments.
See “Business — Regulation” in Part I, Item 1 of thisthe 2014 Form 10-K for a further discussion of regulatory restrictions.
| 32 | Goldman Sachs 2014 Form 10-K |
THE GOLDMAN SACHS GROUP, INC. AND SUBSIDIARIES
The application of regulatory strategies and requirements in the United States and non-U.S. jurisdictions to facilitate the orderly resolution of large financial institutions could create greater risk of loss for Group Inc.’s security holders.
As discussed under “Business — Regulation — Insolvency of an Insured Depository Institution or a Bank Holding Company,” if the FDIC is appointed as receiver under the orderly liquidation authority, the rights of Group Inc.’s creditors would be determined under the orderly liquidation authority, and substantial differences exist in the rights of creditors between the orderly liquidation authority and the U.S. Bankruptcy Code, including the right of the FDIC under the orderly liquidation authority to disregard the strict priority of creditor claims in some circumstances, which could have a material adverse effect on debt holders.
Although the FDIC’s single point of entry strategy is intended to result in better outcomes for creditors in connection with the resolution of a large financial institution, it is possible that this may not occur. One goal of the FDIC’s single point of entry strategy is to resolve a large financial institution in a manner that would, among other things, impose losses on shareholders, debt holders (including holders of structured notes) and other creditors of the top-tier holding company and permit the holding company’s subsidiaries to continue to operate. It is possible that the application of the single point of entry strategy could result in greater losses to Group Inc.’s security holders, including holders of structured notes and other debt securities, than the losses that could result from the application of a bankruptcy proceeding or a different resolution strategy for the firm.
In addition, certain jurisdictions, including the United Kingdom and the EU, have implemented, or are considering, changes to resolution regimes to provide resolution authorities with the ability to recapitalize a failing entity by writing down its unsecured debt or converting its unsecured debt into equity. Such “bail-in” powers are intended to enable the recapitalization of a failing institution by allocating losses to its shareholders and unsecured debt holders. U.S. and non-U.S. regulators are also considering requirements that large financial institutions and certain of their subsidiaries maintain minimum amounts of equity and debt (total loss-absorbing capacity) that would absorb losses in the event of failure.
Our resolution plan assumes that, in certain adverse scenarios, Group Inc. would recapitalize certain major subsidiaries, including through the forgiveness of intercompany indebtedness. If these recapitalization actions were unsuccessful in stabilizing these subsidiaries, Group Inc.’s financial condition would be adversely impacted and equity and debt holders of Group Inc. may as a consequence be in a worse position than if the recapitalizations did not occur.
In August 2014, the Federal Reserve Board and the FDIC indicated that Group Inc., along with other large industry participants, had certain shortcomings in the 2013 resolution plans that must be addressed in the 2015 resolution plans. If Group Inc. is unable to effectively address these shortcomings, the Federal Reserve Board and the FDIC could, after any permitted resubmission, find our resolution plan not credible and require us to hold more capital, change our business structure or dispose of businesses, which could have a negative impact on our ability to return capital to shareholders, financial condition, results of operations or competitive position.
| Goldman Sachs 2014 Form 10-K | 33 |
THE GOLDMAN SACHS GROUP, INC. AND SUBSIDIARIES
Our businesses, profitability and liquidity may be adversely affected by deterioration in the credit quality of, or defaults by, third parties who owe us money, securities or other assets or whose securities or obligations we hold.
We are exposed to the risk that third parties that owe us money, securities or other assets will not perform their obligations. These parties may default on their obligations to us due to bankruptcy, lack of liquidity, operational failure or other reasons. A failure of a significant market participant, or even concerns about a default by such an institution, could lead to significant liquidity problems, losses or defaults by other institutions, which in turn could adversely affect us.
We are also subject to the risk that our rights against third parties may not be enforceable in all circumstances. In addition, deterioration in the credit quality of third parties whose securities or obligations we hold, including a deterioration in the value of collateral posted by third parties to secure their obligations to us under derivatives contracts and loan agreements, could result in losses and/or adversely affect our ability to rehypothecate or otherwise use those securities or obligations for liquidity purposes.
A significant downgrade in the credit ratings of our counterparties could also have a negative impact on our results. While in many cases we are permitted to require additional collateral from counterparties that experience financial difficulty, disputes may arise as to the amount of collateral we are entitled to receive and the value of pledged assets. The termination of contracts and the foreclosure on collateral may subject us to claims for the improper exercise of our rights. Default rates, downgrades and disputes with counterparties as to the valuation of collateral increase significantly in times of market stress and illiquidity.
As part of our clearing and prime brokerage activities, we finance our clients’ positions, and we could be held responsible for the defaults or misconduct of our clients. Although we regularly review credit exposures to specific clients and counterparties and to specific industries, countries and regions that we believe may present credit concerns, default risk may arise from events or circumstances that are difficult to detect or foresee.
THE GOLDMAN SACHS GROUP, INC. AND SUBSIDIARIES
Concentration of risk increases the potential for significant losses in our market-making, underwriting, investing and lending activities.
Concentration of risk increases the potential for significant losses in our market-making, underwriting, investing and lending activities. The number and size of such transactions may affect our results of operations in a given period. Moreover, because of concentration of risk, we may suffer losses even when economic and market conditions are generally favorable for our competitors. Disruptions in the credit markets can make it difficult to hedge these credit exposures effectively or economically. In addition, we extend large commitments as part of our credit origination activities. The
Rules adopted under the Dodd-Frank Act will require issuers of asset-backed securities and any person who organizes and initiates an asset-backed securities transaction to retain economic exposure to the asset, which couldis likely to significantly increase the cost to us of engaging in securitization activities. Our inability to reduce our credit risk by selling, syndicating or securitizing these positions, including during periods of market stress, could negatively affect our results of operations due to a decrease in the fair value of the positions, including due to the insolvency or bankruptcy of the borrower, as well as the loss of revenues associated with selling such securities or loans.
In the ordinary course of business, we may be subject to a concentration of credit risk to a particular counterparty, borrower, or issuer, including sovereign issuers, or geographic area or group of related countries, such as the EU, and a failure or downgrade of, or default by, such entity could negatively impact our businesses, perhaps materially, and the systems by which we set limits and monitor the level of our credit exposure to individual entities, industries and countries may not function as we have anticipated. While our activities expose us to many different industries, counterparties and counterparties,countries, we routinely execute a high volume of transactions with counterparties engaged in financial services activities, including brokers and dealers, commercial banks, clearing houses, exchanges and investment funds. This has resulted in significant credit concentration with respect to these counterparties. Provisions of the Dodd-Frank Act are expected to lead to increased centralization of trading activity through particular clearing houses, central agents or exchanges, which may increase our concentration of risk with respect to these entities.
| 34 | Goldman Sachs 2014 Form 10-K |
THE GOLDMAN SACHS GROUP, INC. AND SUBSIDIARIES
The financial services industry is both highly competitive.competitive and interrelated.
The financial services industry and all of our businesses are intensely competitive, and we expect them to remain so. We compete on the basis of a number of factors, including transaction execution, our products and services, innovation, reputation, creditworthiness and price. Over time, there has been substantial consolidation and convergence among companies in the financial services industry. This trend accelerated over recent years as a result of numerous mergers and asset acquisitions among industry participants. This trend has also hastened the globalization of the securities and other financial services markets.
As a result, we have had to commit capital to support our international operations and to execute large global transactions. To the extent we expand into new business areas and new geographic regions, we will face competitors with more experience and more established relationships with clients, regulators and industry participants in the relevant market, which could adversely affect our ability to expand. Governments and regulators have recently adopted regulations, imposed taxes, adopted compensation restrictions or otherwise put forward various proposals that have or may impact our ability to conduct certain of our businesses in a cost-effective manner or at all in certain or all jurisdictions, including proposals relating to restrictions on the type of activities in which financial institutions are permitted to engage. These or other similar rules, many of which do not apply to all our U.S. or non-U.S. competitors, could impact our ability to compete effectively.
Pricing and other competitive pressures in our businesses have continued to increase, particularly in situations where some of our competitors may seek to increase market share by reducing prices. For example, in connection with investment banking and other assignments, we have experienced pressure to extend and price credit at levels that may not always fully compensate us for the risks we take.
The financial services industry is highly interrelated in that a very significant volume of transactions occur among members of that industry. Many transactions are syndicated to other financial institutions and financial institutions are often counterparties in transactions. This has led to claims by other market participants and regulators that such institutions have colluded in order to manipulate markets or market prices, including allegations that antitrust laws have been violated. While we have extensive procedures and controls that are designed to identify and prevent such activities, allegations of such activities, particularly by regulators, can have a very negative reputational impact and, if we are found to have engaged in such activities, subject us to large fines and settlements, and potentially very significant penalties, including treble damages.
THE GOLDMAN SACHS GROUP, INC. AND SUBSIDIARIES
We face enhanced risks as new business initiatives lead us to transact with a broader array of clients and counterparties and expose us to new asset classes and new markets.
A number of our recent and planned business initiatives and expansions of existing businesses may bring us into contact, directly or indirectly, with individuals and entities that are not within our traditional client and counterparty base and expose us to new asset classes and new markets. For example, we are increasingly transactingcontinue to transact business and investinginvest in new regions, including a widerwide range of emerging and growth markets. Furthermore, in a number of our businesses, including where we make markets, invest and lend, we directly or indirectly own interests in, or otherwise become affiliated with the ownership and operation of public services, such as airports, toll roads and shipping ports, as well as power generation facilities, physical commodities, mines, commodity warehouses and other commodities infrastructure components, both within and outside the United States. RecentDeteriorating market conditions may lead to an increase in opportunities to acquire distressed assets and we may determine opportunistically to increase our exposure to these types of assets.
These activities expose us to new and enhanced risks, including risks associated with dealing with governmental entities, reputational concerns arising from dealing with less sophisticated counterparties and investors, greater regulatory scrutiny of these activities, increased credit-related, market, sovereign and operational risks, risks arising from accidents or acts of terrorism, and reputational concerns with the manner in which these assets are being operated or held.
| Goldman Sachs 2014 Form 10-K | 35 |
THE GOLDMAN SACHS GROUP, INC. AND SUBSIDIARIES
Derivative transactions and delayed settlements may expose us to unexpected risk and potential losses.
We are party to a large number of derivative transactions, including credit derivatives. Many of these derivative instruments are individually negotiated and non-standardized, which can make exiting, transferring or settling positions difficult. Many credit derivatives require that we deliver to the counterparty the underlying security, loan or other obligation in order to receive payment. In a number of cases, we do not hold the underlying security, loan or other obligation and may not be able to obtain the underlying security, loan or other obligation. This could cause us to forfeit the payments due to us under these contracts or result in settlement delays with the attendant credit and operational risk as well as increased costs to the firm.
Derivative transactions may also involve the risk that they are not authorized or appropriate for a counterparty,
that documentation has not been properly executed, or that executed agreements may not be enforceable against the counterparty, or that obligations under such agreements may not be able to be “netted” against other obligations with such counterparty. In addition, counterparties may claim that such transactions were not appropriate or authorized.
As a signatory to the ISDA Protocol, we may not be able to exercise remedies against counterparties and, as this new regime has not yet been tested, we may suffer risks or losses that we would not have expected to suffer if we could immediately close out transactions upon a termination event. The ISDA Protocol contemplates adoption of implementing regulations by various U.S. and non-U.S. regulators, and the ISDA Protocol’s impact will depend on, among other things, how it is implemented.
Derivative contracts and other transactions, including secondary bank loan purchases and sales, entered into with third parties are not always confirmed by the counterparties or settled on a timely basis. While the transaction remains unconfirmed or during any delay in settlement, we are subject to heightened credit and operational risk and in the event of a default may find it more difficult to enforce our rights. In addition, as new and more complex derivative products are created, covering a wider array of underlying credit and other instruments, disputes about the terms of the underlying contracts could arise, which could impair our ability to effectively manage our risk exposures from these products and subject us to increased costs. The provisions of the Dodd-Frank Act requiring central clearing of credit derivatives and other OTC derivatives, or a market shift toward standardized derivatives, could reduce the risk associated with such transactions, but under certain circumstances could also limit our ability to develop derivatives that best suit the needs of our clients and ourselvesto hedge our own risks, and could adversely affect our profitability and increase our credit exposure to such platform.
Our businesses may be adversely affected if we are unable to hire and retain qualified employees.
Our performance is largely dependent on the talents and efforts of highly skilled individuals; therefore, our continued ability to compete effectively in our businesses, to manage our businesses effectively and to expand into new businesses and geographic areas depends on our ability to attract new talented and diverse employees and to retain and motivate our existing employees. Factors that affect our ability to attract and retain such employees include our compensation and benefits, and our reputation as a successful business with a culture of fairly hiring, training and promoting qualified employees.
Competition from within the financial services industry and from businesses outside the financial services industry for qualified employees has often been intense. This is particularly the case in emerging and growth markets, where we are often competing for qualified employees with entities that have a significantly greater presence or more extensive experience in the region.
Changes in law or regulation in jurisdictions in which our operations are located that affect taxes on our employees’ income, or the amount or composition of compensation, may also adversely affect our ability to hire and retain qualified employees in those jurisdictions.
| Goldman Sachs |
THE GOLDMAN SACHS GROUP, INC. AND SUBSIDIARIES
As described further in “Business — Regulation — BankingBank Holding Company Regulation” and “Regulation“ — Regulation — Compensation Practices” in Part I, Item 1 of thisthe 2014 Form 10-K, our compensation practices are subject to review by, and the standards of, the Federal Reserve Board. As a large financial and banking institution, we are subject to limitations on compensation practices (which may or may not affect our competitors) by the Federal Reserve Board, the FSA,PRA, the FCA, the FDIC orand other regulators worldwide. These limitations, including any imposed by or as a result of future legislation or regulation, may require us to alter our compensation practices in ways that could adversely affect our ability to attract and retain talented employees. We may also be required to make additional disclosure with respect to the compensation of employees, including non-executive officers, in a manner that directly or indirectly results in the identity of such employees and their compensation being made public. Any such additional public disclosure of employee compensation may also make it difficult to attract and retain talented employees.
Our businesses and those of our clients are subject to extensive and pervasive regulation around the world.
As a participant in the financial services industry and a bank holding company, we are subject to extensive regulation in jurisdictions around the world. We face the risk of significant intervention by regulatory and taxing authorities in all jurisdictions in which we conduct our businesses. Among other things, as a result of regulators enforcing existing laws and regulations, we could be fined, prohibited from engaging in some of our business activities, subject to limitations or conditions on our business activities or subjected to new or substantially higher taxes or other governmental charges in connection with the conduct of our business or with respect to our employees.
There is also the risk that new laws or regulations or changes in enforcement of existing laws or regulations applicable to our businesses or those of our clients, including capital, liquidity and margin requirements, tax burdens and compensation restrictions, could be imposed on a limited subset of financial institutions (either based on size, activities, geography or other criteria), which may adversely affect our ability to compete effectively with other institutions that are not affected in the same way. In addition, regulation imposed on financial institutions or market participants generally, such as taxes on financial transactions, could adversely impact levels of market activity more broadly, and thus impact our businesses.
The impact of such developments could impact our profitability in the affected jurisdictions, or even make it uneconomic for us to continue to conduct all or certain of our businesses in such jurisdictions, or could cause us to incur significant costs associated with changing our business practices, restructuring our businesses, moving all or certain of our businesses and our employees to other locations or complying with applicable capital requirements, including liquidating assets or raising capital in a manner that adversely increases our funding costs or otherwise adversely affects our shareholders and creditors.
U.S. and non-U.S. regulatory developments, in particular the Dodd-Frank Act and Basel 3, will significantly alter the regulatory framework within which we operate and may adversely affect our competitive position and profitability. Among the aspects of the Dodd-Frank Act most likely to affect our businesses are: the prohibition on proprietary trading and the limitation on the sponsorship of, and investment in, hedge funds and private equity funds by bank holding companies and other banking entities; increased capital requirements; increased regulation of and restrictions on over-the-counter derivatives markets and transactions; limitations on incentive compensation; the prohibition on certain swaps-based activities through an insured depository institution; limitations on affiliate transactions; the establishment and annual updating of a resolution plan; the creation of a new systemic oversight body, the FSOC; increased deposit insurance assessments; and increased standards of care for broker-dealers in dealing with clients. The implementation of higher capital requirements, the liquidity coverage ratio and the net stable funding ratio under Basel 3 may adversely affect our profitability and competitive position, particularly if the requirements do not apply, or do not apply equally, to our competitors or are not implemented uniformly across jurisdictions.
THE GOLDMAN SACHS GROUP, INC. AND SUBSIDIARIES
In addition, the attorneys general of a number of states have filed lawsuits against financial institutions alleging, among other things, that the centralized system of recording mortgages and designating a common entity as the mortgage holder is in violation of state law, and other authorities have indicated that they are contemplating similar actions. If this system and related practices are deemed invalid, it may call into question the validity or enforceability of certain mortgage-related obligations under securitizations and other transactions in which we have participated, negatively impact the market for mortgages and mortgage-related products and our mortgage-related activities, or subject us to additional costs or penalties.
For a discussion of the extensive regulation to which our businesses are subject, see “Business — Regulation” in Part I, Item 1 of this Form 10-K.
We may be adversely affected by increased governmental and regulatory scrutiny or negative publicity.
Governmental scrutiny from regulators, legislative bodies and law enforcement agencies with respect to matters relating to compensation, our business practices, our past actions and other matters has increased dramatically in the past several years. The financial crisis and the current political and public sentiment regarding financial institutions has resulted in a significant amount of adverse press coverage, as well as adverse statements or charges by regulators or other government officials. Press coverage and other public statements that assert some form of wrongdoing often result in some type of investigation by regulators, legislators and law enforcement officials or in lawsuits.
Responding to these investigations and lawsuits, regardless of the ultimate outcome of the proceeding, is time consumingtime-consuming and expensive and can divert the time and effort of our senior management from our business. Penalties and fines sought by regulatory authorities have increased substantially over the last several years, and certain regulators have been more likely in recent years to commence enforcement actions or to advance or support legislation targeted at the financial services industry. Adverse publicity, governmental scrutiny and legal and enforcement proceedings can also have a negative impact on our reputation and on the morale and performance of our employees, which could adversely affect our businesses and results of operations.
Certain regulators, including the SEC, have announced policies that make it more likely that they will seek an admission of wrongdoing as part of any settlement of a matter brought by them against a regulated entity or individual, which could lead to increased exposure to civil litigation and could adversely affect our reputation and ability to do business in certain jurisdictions with so-called “bad actor” disqualification laws and could have other negative effects.
A failure in our operational systems or infrastructure, or those of third parties, as well as cyber attacks and human error, could impair our liquidity, disrupt our businesses, result in the disclosure of confidential information, damage our reputation and cause losses.
Our businesses are highly dependent on our ability to process and monitor, on a daily basis, a very large number of transactions, many of which are highly complex and occur at very high volumes and frequencies, across numerous and diverse markets in many currencies. These transactions, as well as the information technology services we provide to clients, often must adhere to client-specific guidelines, as well as legal and regulatory standards.
As our client base, and our geographical reach expands, and the volume, speed, frequency and complexity of transactions, especially electronic transactions (as well as the requirements to report such transactions on a real-time basis to clients, regulators and exchanges) increases, developing and maintaining our operational systems and infrastructure becomes increasingly challenging. more challenging, and the risk of systems or human error in connection with such transactions increases, as well as the potential consequences of such errors due to the speed and volume of transactions involved and the potential difficulty associated with discovering such errors quickly enough to limit the resulting consequences.
Our financial, accounting, data processing or other operational systems and facilities may fail to operate properly or become disabled as a result of events that are wholly or partially beyond our control, such as a spike in transaction volume, adversely affecting our ability to process these transactions or provide these services. We must continuously update these systems to support our operations and growth and to respond to changes in regulations and markets. This updating entailsmarkets, and invest heavily in systemic controls and training to ensure that such transactions do not violate applicable rules and regulations or, due to errors in processing such transactions, adversely affect markets, our clients and counterparties or the firm.
| Goldman Sachs 2014 Form 10-K | 37 |
THE GOLDMAN SACHS GROUP, INC. AND SUBSIDIARIES
Systems enhancements and updates, as well as the requisite training, entail significant costs and createscreate risks associated with implementing new systems and integrating them with existing ones.
In addition, we also face the risk of operational failure, termination or capacity constraints of any of the clearing agents, exchanges, clearing houses or other financial intermediaries we use to facilitate our securities and derivatives transactions, and as our interconnectivity with our clients grows, we increasingly face the risk of operational failure with respect to our clients’ systems.
THE GOLDMAN SACHS GROUP, INC. AND SUBSIDIARIES
In recent years, there has been significant consolidation among clearing agents, exchanges and clearing houses and an increasing number of derivative transactions are now or in the near future will be cleared on exchanges, which has increased our exposure to operational failure, termination or capacity constraints of the particular financial intermediaries that we use and could affect our ability to find adequate and cost-effective alternatives in the event of any such failure, termination or constraint. Industry consolidation, whether among market participants or financial intermediaries, increases the risk of operational failure as disparate complex systems need to be integrated, often on an accelerated basis.
Furthermore, the interconnectivity of multiple financial institutions with central agents, exchanges and clearing houses, and the increased centrality of these entities, increases the risk that an operational failure at one institution or entity may cause an industry-wide operational failure that could materially impact our ability to conduct business. Any such failure, termination or constraint could adversely affect our ability to effect transactions, service our clients, manage our exposure to risk or expand our businesses or result in financial loss or liability to our clients, impairment of our liquidity, disruption of our businesses, regulatory intervention or reputational damage.
Despite the resiliency plans and facilities we have in place, our ability to conduct business may be adversely impacted by a disruption in the infrastructure that supports our businesses and the communities in which we are located. This may include a disruption involving electrical, satellite, undersea cable or other communications, internet, transportation or other services facilities used by us or third parties with which we conduct business. These disruptions may occur as a result of events that affect only our buildings or systems or those of such third parties, or as a result of events with a broader impact globally, regionally or in the cities where those buildings or systems are located.located, including, but not limited, to natural disasters, war, civil unrest, economic or political developments, pandemics and weather events.
Nearly all of our employees in our primary locations, including the New York metropolitan area, London, Bangalore,Bengaluru, Hong Kong, Tokyo and Salt Lake City, work in close proximity to one another, in one or more buildings. Notwithstanding our efforts to maintain business continuity, given that our headquarters and the largest concentration of our employees are in the New York metropolitan area and our two principal office buildings in the New York area both are located on the waterfront of the Hudson River, depending on the intensity and longevity of the event, a catastrophic event impacting our New York metropolitan area offices, including a terrorist attack, extreme weather event or other hostile or catastrophic event, could very negatively affect our
business. If a disruption occurs in one location and our employees in that location are unable to occupy our offices or communicate with or travel to other locations, our ability to service and interact with our clients may suffer, and we may not be able to successfully implement contingency plans that depend on communication or travel.
Our operations rely on the secure processing, storage and transmission of confidential and other information in our computer systems and networks. There have been several recent highly publicized cases involving financial services and consumer-based companies reporting the unauthorized disclosure of client or customer information, as well as cyber attacks involving the dissemination, theft and destruction of corporate information or other assets, as a result of failure to follow procedures by employees or contractors or as a result of actions by third-parties, including actions by foreign governments.
| 38 | Goldman Sachs 2014 Form 10-K |
THE GOLDMAN SACHS GROUP, INC. AND SUBSIDIARIES
We are regularly the target of attempted cyber attacks, including denial-of-service attacks, and must continuously monitor and develop our systems to protect our technology infrastructure and data from misappropriation or corruption. In addition, due to our interconnectivity with third-party vendors, central agents, exchanges, clearing houses and other financial institutions, we could be adversely impacted if any of them is subject to a successful cyber attack or other information security event. Although we take protective measures and endeavor to modify them as circumstances warrant, our computer systems, software and networks may be vulnerable to unauthorized access, misuse, computer viruses or other malicious code and other events that could have a security impact. If one or more of such events occur, this potentially could jeopardize our or our clients’ or counterparties’ confidential and other information processed and stored in, and transmitted through, our computer systems and networks, or otherwise cause interruptions or malfunctions in our, our clients’, our counterparties’ or third parties’ operations, which could impact their ability to transact with us or otherwise result in significant losses or reputational damage.
The increased use of mobile and cloud technologies can heighten these and other operational risks. We expect to expend significant additional resources on an ongoing basis to modify our protective measures and to investigate and remediate vulnerabilities or other exposures, and we may be subject to litigation and financial losses that are either not insured against or not fully covered through any insurance maintained by us.
We routinely transmit and receive personal, confidential and proprietary information by email and other electronic means. We have discussed and worked with clients, vendors, service providers, counterparties and other third parties to develop secure transmission capabilities and preventprotect against cyber attacks, but we do not have, and may be unable to put in place, secure capabilities with all of our clients, vendors, service providers, counterparties and other third parties and we may not be able to ensure that these third parties have appropriate controls in place to protect the confidentiality of the information. An interception, misuse or mishandling of personal, confidential or proprietary information being sent to or received from a client, vendor, service provider, counterparty or other third party could result in legal liability, regulatory action and reputational harm.
Notwithstanding the proliferation of technology and technology-based risk and control systems, our businesses ultimately rely on human beings as our greatest resource, and from time-to-time, they make mistakes that are not always caught immediately by our technological processes or by our other procedures which are intended to prevent and detect such errors. These can include calculation errors, mistakes in addressing emails, errors in software development or implementation, or simple errors in judgment. We strive to eliminate such human errors through training, supervision, technology and by redundant processes and controls. Human errors, even if promptly discovered and remediated, can result in material losses and liabilities for the firm.
THE GOLDMAN SACHS GROUP, INC. AND SUBSIDIARIES
Substantial legal liability or significant regulatory action against us could have material adverse financial effects or cause us significant reputational harm, which in turn could seriously harm our business prospects.
We face significant legal risks in our businesses, and the volume of claims and amount of damages and penalties claimed in litigation and regulatory proceedings against financial institutions remain high. See “Legal Proceedings”Note 27 to the consolidated financial statements in Part I,II, Item 38 of thisthe 2014 Form 10-K for a discussion of certain legal proceedings in which we are involved.involved and Note 18 to the consolidated financial statements in Part II, Item 8 of the 2014 Form 10-K for information regarding certain mortgage-related contingencies. Our experience has been that legal claims by customers and clients increase in a market downturn and that employment-related claims increase following periods in which we have reduced our staff. Additionally, governmental entities are plaintiffs in certain of the legal proceedings in which we are involved, and we may face future actions or claims by the same or other governmental entities.
| Goldman Sachs 2014 Form 10-K | 39 |
THE GOLDMAN SACHS GROUP, INC. AND SUBSIDIARIES
Recently, significant settlements by several large financial institutions with governmental entities have been publicly announced. The trend of large settlements with governmental entities may adversely affect the outcomes for other financial institutions in similar actions, especially where governmental officials have announced that the large settlements will be used as the basis or a template for other settlements. The uncertain regulatory enforcement environment makes it difficult to estimate probable losses, which can lead to substantial disparities between legal reserves and subsequent actual settlements or penalties. Further, the SEC has announced a policy of seeking admissions of liability in certain settled cases, which could adversely impact the defense of private litigation or result in penalties or limitations in business under “bad actor” statutes in jurisdictions in which we operate.
The growth of electronic trading and the introduction of new trading technology may adversely affect our business and may increase competition.
Technology is fundamental to our business and our industry. The growth of electronic trading and the introduction of new technologies is changing our businesses and presenting us with new challenges. Securities, futures and options transactions are increasingly occurring electronically, both on our own systems and through other alternative trading systems, and it appears that the trend toward alternative trading systems will continue and probably accelerate. Some of these alternative trading systems compete with us, particularly our exchange-based market-making activities, and we may experience continued competitive pressures in these and other areas. In addition, the increased use by our clients of low-cost electronic trading systems and direct electronic access to trading markets could cause a reduction in commissions and spreads. As our clients increasingly use our systems to trade directly in the markets, we may incur liabilities as a result of their use of our order routing and execution infrastructure. We have invested significant resources into the development of electronic trading systems and expect to continue to do so, but there is no assurance that the revenues generated by these systems will yield an adequate return on our investment, particularly given the relatively lower commissions arising from electronic trades.
Our commodities activities, particularly our power generation interests and our physical commodities activities, subject us to extensive regulation and involve certain potential catastrophic events andrisks, including environmental, reputational and other risks that may expose us to significant liabilities and costs.
We engage in, orAs part of our commodities business, we purchase and sell certain physical commodities and arrange for their storage and transport. In our investing and lending businesses, we invest in entities that engage in the production, storage, transportation, marketing and trading of numerous commodities. The commodities includinginvolved in these activities and investments may include crude oil, oil products, natural gas, electric power, agricultural products, metals (base and precious), minerals (including unenriched uranium), emission credits, coal, freight, liquefied natural gas and related products and indices.
These activities subject us and/or the entities in which we invest to extensive and evolving federal, state and local energy, environmental, antitrust and other governmental laws and regulations worldwide, including environmental laws and regulations relating to, among others, air quality, water quality, waste management, transportation of hazardous substances, natural resources, site remediation and health and safety. Additionally, rising climate change concerns may lead to additional regulation that could increase the operating costs and profitability of our investments.
WeThere may incurbe substantial costs in complying with current or future laws and regulations relating to our commodities-related activities and investments, particularly electric power generation, transportation and storage of physical commodities and wholesale sales and trading of electricity and natural gas.investments. Compliance with these laws and regulations could require us to commit significant commitments of capital toward environmental monitoring, installation of pollution control equipment, renovation of storage facilities or transport vessels, payment of emission fees and carbon or other taxes, and application for, and holding of, permits and licenses.
| Goldman Sachs |
THE GOLDMAN SACHS GROUP, INC. AND SUBSIDIARIES
Our commodities-relatedCommodities involved in our intermediation activities and investments are also subject to the risk of unforeseen or catastrophic events, many of which are likely to be outside of our control, including those arising from the breakdown or failure of power generation equipment, transmission lines, transport vessels, storage facilities or other equipment or processes or other mechanical malfunctions, fires, leaks, spills or release of hazardous substances, performance below expected levels of output or efficiency, terrorist attacks, extreme weather events or other natural disasters or other hostile or catastrophic events. In addition, we rely on third-party suppliers or service providers to perform their contractual obligations and any failure on their part, including the failure to obtain raw materials at reasonable prices or to safely transport or store commodities, could adversely affect our activities.expose us to costs or losses. Also, while we seek to insure against potential risks, we may not be able to obtain insurance to cover some of these risks and the insurance that we have may be inadequate to cover our losses.
The occurrence of any of such events may prevent us from performing under our agreements with clients, may impair our operations or financial results and may result in litigation, regulatory action, negative publicity or other reputational harm.
We may also be required to divest or discontinue certain of these activities for regulatory or legal reasons. If that occurs, the firm may receive a value that is less than the then carrying value, as the firm may be unable to exit these activities in an orderly transaction.
In conducting our businesses around the world, we are subject to political, economic, legal, operational and other risks that are inherent in operating in many countries.
In conducting our businesses and maintaining and supporting our global operations, we are subject to risks of possible nationalization, expropriation, price controls, capital controls, exchange controls and other restrictive governmental actions, as well as the outbreak of hostilities or acts of terrorism. For example, there has recently been significant conflict between Russia and Ukraine, and sanctions have been imposed by the U.S. and EU on certain individuals and companies in Russia. In many countries, the laws and regulations applicable to the securities and financial services industries and many of the transactions in which we are involved are uncertain and evolving, and it may be difficult for us to determine the exact requirements of local laws in every market. Any determination by local regulators that we have not acted in compliance with the application of local laws in a particular market or our failure to develop effective working relationships with local regulators could have a significant and negative effect not only on our businesses in that market but also on our reputation generally. We are also subject to the enhanced risk that transactions we structure might not be legally enforceable in all cases.
Our businesses and operations are increasingly expanding into new regions throughout the world, including emerging and growth markets, and we expect this trend to continue. Various emerging and growth market countries have experienced severe economic and financial disruptions, including significant devaluations of their currencies, defaults or threatened defaults on sovereign debt, capital and currency exchange controls, and low or negative growth rates in their economies, as well as military activity, civil unrest or acts of terrorism. The possible effects of any of these conditions include an adverse impact on our businesses and increased volatility in financial markets generally.
| Goldman Sachs 2014 Form 10-K | 41 |
THE GOLDMAN SACHS GROUP, INC. AND SUBSIDIARIES
While business and other practices throughout the world differ, our principal legal entities are subject in their operations worldwide to rules and regulations relating to corrupt and illegal payments, hiring practices and money laundering, as well as laws relating to doing business with certain individuals, groups and countries, such as the U.S. Foreign Corrupt Practices Act, the USA PATRIOT Act and U.K. Bribery Act. While we have invested and continue to invest significant resources in training and in compliance monitoring, the geographical diversity of our operations, employees, clients and customers, as well as the vendors and other third parties that we deal with, greatly increases the risk that we may be found in violation of such rules or regulations and any such violation could subject us to significant penalties or adversely affect our reputation.
In addition, there have been a number of highly publicized cases around the world, involving actual or alleged fraud or other misconduct by employees in the financial services industry in recent years, and we run the risk that employee misconduct could occur. This misconduct has included and may include in the future the theft of proprietary information, including proprietary software. It is not always possible to deter or prevent employee misconduct and the precautions we take to prevent and detect this activity have not been and may not be effective in all cases.
We may incur losses as a result of unforeseen or catastrophic events, including the emergence of a pandemic, terrorist attacks, extreme weather events or other natural disasters.
The occurrence of unforeseen or catastrophic events, including the emergence of a pandemic, such as Ebola, or other widespread health emergency (or concerns over the possibility of such an emergency), terrorist attacks, extreme terrestrial or solar weather events or other natural disasters, could create economic and financial disruptions, and could lead to operational difficulties (including travel limitations) that could impair our ability to manage our businesses.
| 42 | Goldman Sachs |
THE GOLDMAN SACHS GROUP, INC. AND SUBSIDIARIES
In our life and our property catastrophe insurance activities, losses related to unforeseen or catastrophic events could significantly exceed the related reserves and reinsurance proceeds.
Item 1B. Unresolved Staff Comments
There are no material unresolved written comments that were received from the SEC staff 180 days or more before the end of our fiscal year relating to our periodic or current reports under the Exchange Act.
Our principal executive offices are located at 200 West Street, New York, New York and comprise approximately 2.1 million gross square feet. The building is located on a parcel leased from Battery Park City Authority pursuant to a ground lease. Under the lease, Battery Park City Authority holds title to all improvements, including the office building, subject to Goldman Sachs’ right of exclusive possession and use until June 2069, the expiration date of the lease. Under the terms of the ground lease, we made a lump sum ground rent payment in June 2007 of $161 million for rent through the term of the lease.
We have offices at 30 Hudson Street in Jersey City, New Jersey, which we own and which include approximately 1.6 million gross square feet of office space, and we own over 700,000 square feet of additional commercial space spread among four locations in New York and New Jersey. We lease approximately 1.1 million rentable square feet in the New York Metropolitan Area.space.
We have additional offices and commercial space in the U.S.United States and elsewhere in the Americas, which together comprise approximately 2.22.5 million rentable square feet of leased and owned space.
In Europe, the Middle East and Africa, we have offices that total approximately 2.01.5 million rentable square feet of leased and owned space. Our European headquarters is located in London at Peterborough Court, pursuant to a lease expiring in 2026. In total, we leasehave offices with approximately 1.61.1 million rentable square feet in London, through various leases, relating to various properties.
In Asia (including India), Australia and New Zealand, we have offices that totalwith approximately 2.11.9 million rentable square feet. Our headquarters in this region are in Tokyo, at the Roppongi Hills Mori Tower, and in Hong Kong, at the Cheung Kong Center. In Tokyo,Japan, we currently leasehave offices with approximately 400,000 rentable220,000 square feet, the majority of which have leases that will expire in 2018. In Hong Kong, we currently leasehave offices with approximately 340,000 rentable315,000 square feet, under lease agreements, the majority of which have leases that will expire in 2017.
In the preceding paragraphs, square footage figures are provided only for properties that are used in the operation of our businesses.
See “Management’s Discussion and Analysis of Financial Condition and Results of Operations — Off-Balance-Sheet Arrangements and Contractual Obligations — Contractual Obligations” in Part II, Item 7 of thisthe 2014 Form 10-K for a discussion of exit costs we may incur in the future to the extent we (i) reduce our space capacity or (ii) commit to, or occupy, new properties in the locations in which we operate and, consequently, dispose of existing space that had been held for potential growth.
We are involved in a number of judicial, regulatory and arbitration proceedings concerning matters arising in connection with the conduct of our businesses. Many of these proceedings are at preliminaryin early stages, and many of these cases seek an indeterminate amount of damages. However, we believe, based on currently available information, that the results of such proceedings, in the aggregate, will not have a material adverse effect on our financial condition, but may be material to our operating results for any particular period, depending, in part, upon the operating results for such period. Given the range of litigation and investigations presently under way, our litigation expenses can be expected to remain high. See “Management’s Discussion and Analysis of Financial Condition and Results of Operations — Use of Estimates” in Part II, Item 7 of thisthe 2014 Form 10-K. See Note 27 to the consolidated financial statements in Part II, Item 8 of thisthe 2014 Form 10-K for information onabout certain judicial, regulatory and legal proceedings.
Item 4. Mine Safety Disclosures
Not applicable.
| Goldman Sachs | 43 |
THE GOLDMAN SACHS GROUP, INC. AND SUBSIDIARIES
Set forth below are the name, age, present title, principal occupation and certain biographical information as of February 1, 2012 for our executive officers. All of our executive officers have been appointed by and serve at the pleasure of our board of directors.
Lloyd C. Blankfein, 5760
Mr. Blankfein has been our Chairman and Chief Executive Officer since June 2006, and a director since April 2003. Previously, he had been our President and Chief Operating Officer since January 2004. Prior to that, from April 2002 until January 2004, he was a Vice Chairman of Goldman Sachs, with management responsibility for Goldman Sachs’ Fixed Income, Currency and Commodities Division (FICC) and Equities Division (Equities). Prior to becoming a Vice Chairman, he had served as co-head of FICC since its formation in 1997. From 1994 to 1997, he headed or co-headed the Currency and Commodities Division. Mr. Blankfein is not currently on the board of any public company other than Goldman Sachs. He is affiliated with certain non-profit organizations, including as a member of the Dean’s Advisory Board at Harvard Law School, the Dean’s Council at Harvard University and the Advisory Board of the Tsinghua University School of Economics and Management, an overseer of the Weill Medical College of Cornell University, and a member of the Board of Directors of the Partnership for New York City.
Alan M. Cohen, 6164
Mr. Cohen has been an Executive Vice President of Goldman Sachs and our Global Head of Compliance since February 2004. From 1991 until January 2004, he was a partner in the law firm of O’Melveny & Myers LLP. He is affiliated with certain non-profit organizations, including as a board member of the New York Stem Cell Foundation.
Gary D. Cohn, 5154
Mr. Cohn has been our President and Chief Operating Officer (or Co-Chief Operating Officer) and a director since June 2006. From December 2003 to June 2006, he was the co-head of our global Securities businesses, having been the co-head of FICC since September 2002. Prior to that, Mr. Cohn served as co-chief operating officer of FICC after having been responsible for Commodities and a number of other FICC businesses from 1999 to 2002. He was the head of Commodities from 1996 to 1999. Mr. Cohn is not currently on the board of any public company other than Goldman Sachs. He is affiliated with certain non-profit organizations, including NYU Hospital, NYU Medical School, the Harlem Children’s Zone and American University.
Edith W. Cooper, 5053
Ms. Cooper has been an Executive Vice President of Goldman Sachs since April 2011 and our Global Head of Human Capital Management since March 2008. From 2002 to 2008, she served in various positions at the firm, including sales management within the Securities Division. In 2002, she was responsible for the firm’s Futures business and, prior to that, she was co-head of the commodities business in Europe and Asia.
J. Michael Evans, 54
Mr. Evans has been the global head of Growth Markets since January 2011, a Vice Chairman of Goldman Sachs since February 2008 and chairman of Goldman Sachs Asia since 2004. Prior to becoming a Vice Chairman, he had served as global co-head of Goldman Sachs’ securities business since 2003. Previously, he had been co-head of the Equities Division since 2001. Mr. Evans serves as a trustee of the Bendheim Center for Finance at Princeton University, serves as Chairman of the Board of Right to Play, USA, is a member of the Board of City Harvest and is a trustee of The Asia Society.
THE GOLDMAN SACHS GROUP, INC. AND SUBSIDIARIES
Gregory K. Palm, 6366
Mr. Palm has been an Executive Vice President of Goldman Sachs since May 1999, and our General Counsel and head or co-head of the Legal Department since May 1992.
John F.W. Rogers, 5558
Mr. Rogers has been an Executive Vice President of Goldman Sachs since April 2011 and Chief of Staff and Secretary to the Board of Directors of Goldman Sachs since NovemberDecember 2001. He joined the firm in 1994 in the Fixed Income division and served in various positions from 1994 to 2001. Prior to joining Goldman Sachs, he was a senior fellow at the Baker Institute at Rice University, having served as Under Secretary of State for Management at the U.S. Department of State from 1991 to 1993. From 1988 to 1991, he was
Harvey M. Schwartz, 50
Mr. Schwartz has been an Executive Vice President of the Oliver Carr CompanyGoldman Sachs and priorour Chief Financial Officer since January 2013. From February 2008 to that, Assistant SecretaryJanuary 2013, Mr. Schwartz was global co-head of the Treasury from 1985 to 1987 and Assistant to the President for Management and Administration from 1981 to 1985. Securities Division.
Mark Schwartz, 60
Mr. Rogers is chairmanSchwartz has been a Vice Chairman of the boards of the Goldman Sachs Foundation and Chairman of Goldman Sachs Gives.Asia Pacific since rejoining the firm in June 2012. From 2006 to June 2012, he was Chairman of MissionPoint Capital Partners, an investment firm he co-founded.
Michael S. Sherwood, 4649
Mr. Sherwood has been a Vice Chairman of Goldman Sachs since February 2008 and co-chief executive officer of Goldman Sachs International since 2005. Prior to becoming a Vice Chairman, he had served as global co-head of Goldman Sachs’ securities business since 2003. Prior to that, he had been head of the Fixed Income, Currency and Commodities Division in Europe since 2001.
David A. Viniar, 56
Mr. Viniar has been an Executive Vice President of Goldman Sachs and our Chief Financial Officer since May 1999. He has been the head of Operations, Technology, Finance and Services Division since December 2002. He was head of the Finance Division and co-head of Credit Risk Management and Advisory and Firmwide Risk from December 2001 to December 2002. Mr. Viniar was co-head of Operations, Finance and Resources from March 1999 to December 2001. He was Chief Financial Officer of The Goldman Sachs Group, L.P. from March 1999 to May 1999. From July 1998 until March 1999, he was Deputy Chief Financial Officer and from 1994 until July 1998, he was head of Finance, withassumed responsibility for Controllerscoordinating the firm’s business and Treasury. From 1992 to 1994, he was head of Treasury and prior to that wasactivities around Growth Markets in the Structured Finance Department of Investment Banking. He also serves on the Board of Trustees of Union College.November 2013.
John S. Weinberg, 5458
Mr. Weinberg has been a Vice Chairman of Goldman Sachs since June 2006. He has beencurrently focuses on client development and initiatives across our major divisions. He was a co-head of Goldman Sachs’ Investment Banking Division sincefrom December 2002. From January 2002 to December 2002, he was co-head of the Investment Banking Division in the Americas. Prior to that, he served as co-head of the Investment Banking Services Department since 1997. He is affiliated with certain non-profit organizations, including as a trustee of New York-Presbyterian Hospital and the Brunswick School, and as a member of the Board of Directors of The Steppingstone Foundation. Mr. Weinberg also serves on the Visiting Committee for Harvard Business School.2014.
| Goldman Sachs |
THE GOLDMAN SACHS GROUP, INC. AND SUBSIDIARIES
Item 5. Market for Registrant’s Common Equity, Related Stockholder Matters and Issuer Purchases of Equity Securities
The principal market on which our common stock is traded is the NYSE. Information relating to the high and low sales prices per share of our common stock, as reported by the Consolidated Tape Association, for each full quarterly period during fiscal 20102012, 2013 and 20112014 is set forth under the heading “Supplemental Financial Information — Common Stock Price Range” in Part II, Item 8 of thisthe 2014 Form 10-K. As of February 17, 2012,6, 2015, there were 13,34010,230 holders of record of our common stock.
During fiscal 20102013 and fiscal 2011,2014, dividends of $0.35$0.50 per common share were declared on January 19, 2010,15, 2013, April 19, 2010,15, 2013 and July 19, 2010,15, 2013, dividends of $0.55 per common share were declared on October 18, 2010,16, 2013, January 18, 2011,15, 2014, April 18, 2011,16, 2014 and July 18, 201114, 2014 and a dividend of $0.60 per common share was declared on October 17, 2011.15, 2014. The holders of our common stock share proportionately on a per share basis in all dividends and other distributions on common stock declared by the Board of Directors of Group Inc. (Board).
The declaration of dividends by Goldman SachsGroup Inc. is subject to the discretion of our Board. Our Board will take into account such matters as general business conditions, our financial results, capital requirements, contractual, legal and regulatory restrictions on the payment of dividends by us to our shareholders or by our subsidiaries to us, the effect on our debt ratings and such other factors as our Board may deem relevant. See “Business — Regulation” in Part I, Item 1 of thisthe 2014 Form 10-K for a discussion of potential regulatory limitations on our receipt of funds from our regulated subsidiaries and our payment of dividends to shareholders of Group Inc.
The table below sets forth the information with respect to purchases made by or on behalf of Group Inc. or any “affiliated purchaser” (as defined in Rule 10b-18(a)(3) under the Exchange Act), of our common stock during the fourth quarter of our fiscal year ended December 2011.2014.
Period | Total Number of Shares Purchased | Average Price Paid per Share | Total Number of Shares Purchased as Part of Publicly Announced Plans or Programs 1 | Maximum Number of Shares That May Yet Be Purchased Under the Plans or Programs 1 | ||||||||||||
Month #1 (October 1, 2011 to October 31, 2011) | 1,700,868 | $ | 105.83 | 1,700,868 | 71,038,522 | |||||||||||
Month #2 (November 1, 2011 to November 30, 2011) | 5,219,606 | $ | 96.59 | 5,219,606 | 65,818,916 | |||||||||||
Month #3 (December 1, 2011 to December 31, 2011) | 2,295,716 | $ | 97.58 | 2,295,577 | 63,523,339 | |||||||||||
Total | 9,216,190 | 9,216,051 | ||||||||||||||
| | Total Number of Shares Purchased | | Average Price Paid Per Share |
| Total Number of Shares |
|
| Maximum Number of Shares |
| |||||
| Month #1 (October 1, 2014 to October 31, 2014) | 1,759,498 | $181.86 | 1,759,498 | 30,235,389 | ||||||||||
| Month #2 (November 1, 2014 to November 30, 2014) | 2,728,586 | 189.98 | 2,728,586 | 27,506,803 | ||||||||||
| Month #3 (December 1, 2014 to December 31, 2014) | 2,156,373 | 2 | 190.95 | 2,155,759 | 25,351,044 | |||||||||
| Total | 6,644,457 | 6,643,843 | ||||||||||||
| 1. | On March 21, 2000, we announced that our Board had approved a repurchase program, pursuant to which up to 15 million shares of our common stock may be repurchased. This repurchase program was increased by an aggregate of |
| 2. | Includes 614 shares remitted by employees to satisfy minimum statutory withholding taxes on equity-based awards that were delivered to employees during the period. |
Information relating to compensation plans under which our equity securities are authorized for issuance is presented in Part III, Item 12 of thisthe 2014 Form 10-K.
Item 6. Selected Financial Data
The Selected Financial Data table is set forth under Part II, Item 8 of thisthe 2014 Form 10-K.
| Goldman Sachs |
Item 7. Management’s Discussion and Analysis of Financial Condition and Results of Operations
| Page No. | ||||
| 53 | ||||
| 67 | ||||
| 74 | ||||
| 81 | ||||
| 85 | ||||
| 98 | ||||
| 104 | ||||
| Goldman Sachs |
THE GOLDMAN SACHS GROUP, INC. AND SUBSIDIARIES
Management’s Discussion and Analysis
The Goldman Sachs Group, Inc. (Group Inc.) is a leading global investment banking, securities and investment management firm that provides a wide range of financial services to a substantial and diversified client base that includes corporations, financial institutions, governments and high-net-worth individuals. Founded in 1869, the firm is headquartered in New York and maintains offices in all major financial centers around the world.
We report our activities in four business segments: Investment Banking, Institutional Client Services, Investing & Lending and Investment Management. See “Results of Operations” below for further information about our business segments.
When we use the terms “Goldman Sachs,” “the firm,” “we,” “us” and “our,” we mean Group Inc., a Delaware corporation, and its consolidated subsidiaries.
References to “this“the 2014 Form 10-K” are to our Annual Report on Form 10-K for the year ended December 31, 2011.2014. All references to 2011, 2010“the consolidated financial statements” or “Supplemental Financial Information” are to Part II, Item 8 of our Annual Report on Form 10-K for the year ended December 31, 2014. All references to 2014, 2013 and 20092012 refer to our years ended, or the dates, as the context requires, December 31, 2011,2014, December 31, 20102013 and December 31, 2009,2012, respectively. Any reference to a future year refers to a year ending on December 31 of that year. Certain reclassifications have been made to previously reported amounts to conform to the current presentation.
In this discussion and analysis of our financial condition and results of operations, we have included information that may constitute “forward-looking statements” within the meaning of the safe harbor provisions of the U.S. Private Securities Litigation Reform Act of 1995. Forward-looking statements are not historical facts, but instead represent only our beliefs regarding future events, many of which, by their nature, are inherently uncertain and outside our control. This information includes statements other than historical information or statements of current condition and may relate to our future plans and objectives and results, among other things, and may also include statements about the effect of changes to the capital and leverage rules applicable to banks and bank holding companies, the impact of the Dodd-Frank Act on our businesses and operations, and various legal proceedings or mortgage-related contingencies as set forth under “Legal Proceedings” and “Certain Mortgage-Related Contingencies” in Notes 27 and 18, respectively, to the consolidated financial statements, as well as statements about the results of our Dodd-Frank Act and firm stress tests, statements about the objectives and effectiveness of our business continuity plan, information security program, risk management and liquidity policies, statements about trends in or growth opportunities for our businesses, statements about our future status, activities or reporting under U.S. or non-U.S. banking and financial regulation, and statements about our investment banking transaction backlog.
By identifying these statements for you in this manner, we are alerting you to the possibility that our actual results and financial condition may differ, possibly materially, from the anticipated results and financial condition indicated in these forward-looking statements. Important factors that could cause our actual results and financial condition to differ from those indicated in these forward-looking statements include, among others, those discussed below under “Certain Risk Factors That May Affect Our Businesses” as well as “Risk Factors” in Part I, Item 1A of thisthe 2014 Form 10-K and “Cautionary Statement Pursuant to the U.S. Private Securities Litigation Reform Act of 1995” in Part I, Item 1 of thisthe 2014 Form 10-K.
| Goldman Sachs |
THE GOLDMAN SACHS GROUP, INC. AND SUBSIDIARIES
Management’s Discussion and Analysis
2014 versus 2013.The firm generated net earnings of $4.44$8.48 billion for 2011, compared with $8.35 billion and $13.39 billion for 2010 and 2009, respectively. Our diluted earnings per common share were $4.51of $17.07 for the year ended December 2011,2014, an increase of 5% and 10%, respectively, compared with $13.181$8.04 billion and $15.46 per share for the year ended December 2010 and $22.13 for the year ended December 2009.2013. Return on average common shareholders’ equity (ROE)2 was 3.7%11.2% for 2011,2014, compared with 11.5%111.0% for 2010 and 22.5% for 2009. During 2011, we redeemed the 50,000 shares of our 10% Cumulative Perpetual Preferred Stock, Series G (Series G Preferred Stock) held by Berkshire Hathaway Inc. and certain of its subsidiaries (collectively, Berkshire Hathaway). Excluding the impact of the $1.64 billion preferred dividend related to this redemption, diluted earnings per common share were $7.463 and ROE was 5.9%3 for 2011.
2013. Book value per common share was $130.31$163.01 and tangible book value per common share41 was $119.72$153.79 as of December 2011,2014, both approximately 1%7% higher compared with the end of 2010.2013.
Net revenues were $34.53 billion for 2014, essentially unchanged compared with 2013, as higher net revenues in both Investment Management and Investment Banking, reflecting strong performances in these businesses, were largely offset by slightly lower net revenues in both Institutional Client Services and Investing & Lending.
Operating expenses were $22.17 billion for 2014, essentially unchanged compared with 2013. Non-compensation expenses were slightly lower compared with the prior year, primarily reflecting lower net provisions for litigation and regulatory proceedings, while compensation and benefits expenses were essentially unchanged.
During 2014, as part of a firmwide initiative to reduce activities with lower returns, total assets were reduced by $55 billion to $856 billion as of December 2014, while pre-tax margin improved approximately 150 basis points to 35.8%.
We also maintained strong capital ratios and liquidity, while returning $6.52 billion of capital to shareholders during 2014. During the year, the firm repurchased 47.031.8 million shares of its common stock for a total cost of $6.04$5.47 billion and paid common dividends of $1.05 billion. Our Common Equity Tier 1 capital ratio under Basel 1 was 13.8% and our Tier 1 common ratio under Basel 152 was 12.1%12.2% as of December 2011.2014, under the Basel III Advanced approach reflecting the applicable transitional provisions. In addition, our global core liquid assets 3were $183 billion as of December 2014.
20112013 versus 2010.2012. The firm generated net earnings of $8.04 billion and diluted earnings per common share of $15.46 for 2013, an increase of 8% and 9%, respectively, compared with $7.48 billion and $14.13 per share for 2012. ROE was 11.0% for 2013, compared with 10.7% for 2012. Book value per common share increased approximately 5% to $152.48 and tangible book value per common share 1 increased approximately 7% to $143.11 compared with the end of 2012.
Net revenues of $28.81were $34.21 billion for 2011. These results reflected2013, essentially unchanged compared with 2012, as significantly lower net revenues in Investing & Lending and Institutional Client Services, as well as lowerhigher net revenues in Investment Banking compared with 2010. Netand higher net revenues in both Investing & Lending and Investment Management were essentially unchanged compared with 2010.
An overview of net revenues for each of our business segments is provided below.
Investment Banking
The decrease in Investment Banking primarily reflected lower net revenues in our Underwriting business. Net revenues in equity underwriting were significantly lower than 2010, principally due to a decline in industry-wide activity. Net revenues in debt underwriting were essentially unchanged compared with 2010. Net revenues in Financial Advisory decreased slightly compared with 2010.
Institutional Client Services
The decrease in Institutional Client Services compared with 2010 reflected significantly lower net revenues in Fixed Income, Currency and Commodities Client Execution. Although activity levels in Fixed Income, Currency and Commodities Client Execution during 2011 were generally consistent with 2010 levels, and results were solid during the first quarter of 2011, the environment during the remainder of 2011 was characterized by broad market concerns and uncertainty, resulting in volatile markets and significantly wider credit spreads, which contributed to difficult market-making conditions and led to reductions in risk by us and our clients. As a result of these conditions, net revenues across the franchise were lower, including significant declines in mortgages and credit products, compared with 2010.
Net revenues in Equities were slightly higher compared with 2010. During 2011, average volatility levels increased and equity prices in Europe and Asia declined significantly, particularly during the third quarter. The increase in net revenues reflected higher commissions and fees, primarily due to higher transaction volumes, particularly during the third quarter of 2011. In addition, net revenues in securities services increased compared with 2010, reflecting the impact of higher average customer balances. Equities client execution net revenues were lower than 2010, primarily reflecting significantly lower net revenues in shares.
|
|
|
|
|
THE GOLDMAN SACHS GROUP, INC. AND SUBSIDIARIES
Management’s Discussion and Analysis
Investing & Lending
Net revenues in Investing & Lending were $2.14 billion and $7.54 billion for 2011 and 2010, respectively. Results for 2011 included a loss of $517 million from our investment in the ordinary shares of Industrial and Commercial Bank of China Limited (ICBC) and net gains of $1.12 billion from other investments in equities, primarily in private equity positions, partially offset by losses from public equities. In addition, Investing & Lending included net revenues of $96 million from debt securities and loans. This amount includes approximately $1 billion of unrealized losses related to relationship lending activities, including the effect of hedges, offset by net interest income and net gains from other debt securities and loans. Results for 2011 also included other net revenues of $1.44 billion, principally related to our consolidated entities held for investment purposes.
Investment Management
Net revenues in Investment Management were essentially unchanged compared with 2010, primarily due to higher management and other fees, reflecting favorable changes in the mix of assets under management, offset by lower incentive fees. During the year, assets under management decreased $12 billion to $828 billion, reflecting net outflows of $17 billion, partially offset by net market appreciation of $5 billion. Net outflows primarily reflected outflows in fixed income and equity assets, partially offset by inflows in money market assets.
2010 versus 2009.The firm generated net revenues of $39.16 billion for 2010, despite a challenging operating environment. These results reflected significantly lower net revenues in Institutional Client ServicesServices.
Operating expenses were $22.47 billion for 2013, 2% lower than 2012, as both compensation and slightlybenefits expenses and non-compensation expenses decreased slightly. The decline in non-compensation expenses reflected the sale of a majority stake in our Americas reinsurance business and lower net revenues in Investment Banking compared with 2009. These decreases weredepreciation and amortization expenses, partially offset by significantly higher net revenues in Investing & Lendingprovisions for litigation and higherregulatory proceedings.
During 2013, the firm repurchased 39.3 million shares of its common stock for a total cost of $6.17 billion, while maintaining strong capital levels. In addition, our global core liquid assets 3 were $184 billion as of December 2013.
See “Results of Operations — Segment Operating Results” below for information about net revenues in Investment Management.
An overview of net revenuesand pre-tax earnings for each of our business segments is provided below.
Investment Banking
The decrease in Investment Banking reflected lower net revenues in our Underwriting business, partially offset by higher net revenues in Financial Advisory. The decline in Underwriting reflected lower net revenues in equity underwriting, principally due to a decline in client activity in comparison to 2009, which included significant capital-raising activity by financial institution clients. Net revenues in debt underwriting were essentially unchanged compared with 2009. The increase in Financial Advisory primarily reflected an increase in client activity.
Institutional Client Services
The decrease in Institutional Client Services reflected significantly lower net revenues in Fixed Income, Currency and Commodities Client Execution and, to a lesser extent, Equities. During 2010, Fixed Income, Currency and Commodities Client Execution operated in a challenging environment characterized by lower client activity levels, which reflected broad market concerns including European sovereign debt risk and uncertainty over regulatory reform, as well as tighter bid/offer spreads. The decrease in net revenues compared with a particularly strong 2009 primarily reflected significantly lower results in interest rate products, credit products, commodities and, to a lesser extent, currencies. These decreases were partially offset by higher net revenues in mortgages, as 2009 included approximately $1 billion of losses related to commercial mortgage loans.
The decline in Equities compared with 2009 primarily reflected significantly lower net revenues in equities client execution, principally due to significantly lower results in derivatives and shares. Commissions and fees were also lower than 2009, primarily reflecting lower client activity levels. In addition, securities services net revenues were significantly lower compared with 2009, primarily reflecting tighter securities lending spreads, principally due to the impact of changes in the composition of customer balances, partially offset by the impact of higher average customer balances. During 2010, although equity markets were volatile during the first half of the year, equity prices generally improved and volatility levels declined in the second half of the year.
THE GOLDMAN SACHS GROUP, INC. AND SUBSIDIARIES
Management’s Discussion and Analysis
Investing & Lending
Net revenues in Investing & Lending were $7.54 billion and $2.86 billion for 2010 and 2009, respectively. During 2010, an increase in global equity markets and tighter credit spreads provided a favorable backdrop for our Investing & Lending business. Results in Investing & Lending for 2010 included a gain of $747 million from our investment in the ordinary shares of ICBC, a net gain of $2.69 billion from other investments in equities, a net gain of $2.60 billion from debt securities and loans and other net revenues of $1.51 billion, principally related to our consolidated entities held for investment purposes.
Investment Management
The increase in Investment Management primarily reflected higher incentive fees across our alternative investment products. Management and other fees also increased, reflecting favorable changes in the mix of assets under management, as well as the impact of appreciation in the value of client assets. During 2010, assets under management decreased 4% to $840 billion, primarily reflecting outflows in money market assets, consistent with industry trends.segments.
Our business,businesses, by itstheir nature, doesdo not produce predictable earnings. Our results in any given period can be materially affected by conditions in global financial markets, economic conditions generally and other factors. For a further discussion of the factors that may affect our future operating results, see “Certain Risk Factors That May Affect Our Businesses” below, as well as “Risk Factors” in Part I, Item 1A of thisthe 2014 Form 10-K.
| 1. | Tangible book value per common share is a non-GAAP measure and may not be comparable to similar non-GAAP measures used by other companies. See “Balance Sheet and Funding Sources — Balance Sheet Analysis and Metrics” below for further information about our calculation of tangible book value per common share. |
| 2. | See Note 20 to the consolidated financial statements for further information about our capital ratios. |
| 3. | See “Risk Management and Risk Factors — Liquidity Risk Management” for further information about our global core liquid assets. |
| Goldman Sachs |
THE GOLDMAN SACHS GROUP, INC. AND SUBSIDIARIES
Management’s Discussion and Analysis
Global economic growth generally moderated in 2011, asDuring 2014, real gross domestic product (GDP) grewgrowth appeared stable and subdued in most major economies, supported by solid private sector growth in the United States and emergingthe reduction of fiscal headwinds, particularly in the United States and the Euro area. Ongoing U.S. labor market improvements and robust U.S. consumer activity were notable trends in 2014. Monetary policy generally remained accommodative, helping most major advanced-economy equity markets but at a slower pace than in 2010. Certain unfavorable market conditions that emerged in 2010 continuedto increase during the year, including concerns about European sovereign debt risk and uncertainty regarding financial regulatory reform. Additional concerns that emerged during the first half of the year that affected our businesses included political unrest in the Middle East, the earthquake and tsunami in Japan and inflation in emerging markets.while longer-dated government bond yields generally declined. During the second half of 2014, the U.S. dollar strengthened and oil prices declined. Although macroeconomic conditions were fairly stable, U.S. equity market volatility increased towards the end of the year, concerns about European sovereign debt risk and its impact on the European banking system intensified, while concerns about U.S. growthalongside political uncertainty, particularly in Greece, Russia and the uncertainty regarding the U.S. federalMiddle East, as well as short-lived Ebola concerns. In investment banking, industry-wide underwriting activity remained strong in both equity and debt, ceiling emerged, contributing to higher volatility levels, significantly lower global equity prices and significantly wider corporate credit spreads. This prompted the U.S. Federal Reserveindustry-wide completed mergers and the European Central Bank to announce easing measures in order to stimulate economic growth in the U.S. and to alleviate concerns about Europe.acquisitions activity increased compared with 2013. Industry-wide completed and announced mergers and acquisitions volumesactivity significantly increased compared with 2010, but declined during the second half of the year. Industry-wide equity and equity-related offerings and industry-wide debt offerings both decreased compared with 2010, including significant declines during the second half of the year.2013. For a further discussion of how market conditions may affect our businesses, see “Certain Risk Factors That May Affect Our Businesses” below, as well as “Risk Factors” in Part I, Item 1A of thisthe 2014 Form 10-K.
Global
During 2011,2014, real GDP growth appeared to improve in advanced economies and slow in emerging markets. Developed market growth improvements were largest in the United Kingdom and Euro area, while Japan’s growth declined and the United States’ growth improvement was modest. In emerging markets, headwinds from slowing domestic demand offset improving current account balances and contributed to a general slowdown in growth. Unemployment rates in both the United States and United Kingdom declined in most major economies2014 and emerging markets.at faster paces than in 2013. The slowdownEuro area unemployment rate declined in economic growth primarily reflected slower growth2014, following an increase in domestic demand compared with 2010, while international trade continued to grow strongly during 2011. Unemployment levels declined slightly compared with 2010, although the rate of unemployment remained
elevated in some economies. During 2011, the2013. The U.S. Federal Reserve ended its monthly asset purchase program in the fourth quarter of 2014, after tapering its purchases for several months. The European Central Bank of England(ECB) reduced its policy interest rate twice during the year, and along with the Bank of Japan left interest rates unchanged, while the European Central Bank increased and then reduced its interest rate during the year, ending the year unchanged compared with 2010. In addition, the People’s Bank of China increased its one-year benchmark lending rate during the year. The price of crude oil increased during 2011. The U.S. dollar strengthened against the Euro and was essentially unchanged against the British pound, while it weakened against the Japanese yen.(BOJ), announced further easing policies.
United States
In the United States, real GDP increased by 1.7%2.4% in 2011,2014, compared with an increase of 3.0%2.2% in 2010. Growth moderated,2013. Consumer expenditures growth and business fixed investment growth both improved, while residential investment growth slowed. The pickup in consumer expenditures was primarily reflecting a decline in government spending and reduceddriven by growth in exports, although business investment and consumer expenditure increased. Business andreal disposable income, which contracted in 2013. Measures of consumer confidence declined during most ofimproved, as the year, primarily reflecting increased global economic concerns and uncertainties. In addition, residential investment remained weak and measures of core inflation increasedunemployment rate fell during the year from low levels. Growthyear. House prices, housing starts and house sales increased in industrial production decreased, primarily reflecting2014, but the impactpace of supply-chain disruptions associatedimprovements, particularly for starts and sales, slowed compared with Japan earlier in the year. The unemployment rate declined slightly2013. Measures of inflation were mostly stable during the year, although it remained high.2014. The U.S. Federal Reserve maintained its federal funds rate at a target range of zero to 0.25% during the year. In addition, the U.S. Federal Reserve concluded quantitative easing measures that included theyear, ended its monthly program to purchase of significant amounts of U.S. Treasury debtsecurities and announced further easing measures by extendingmortgage-backed securities in the durationfourth quarter of the U.S. Treasury debt it holds.2014 and kept forward guidance broadly unchanged. The yield on the 10-year U.S. Treasury note felldeclined by 14187 basis points during 20112014 to 1.89%2.17%. In equity markets, the NASDAQ Composite Index, the S&P 500 Index and the Dow Jones Industrial Average increased by 13%, 11% and 8%, respectively, during 2014.
Europe
In the Euro area, real GDP increased by 0.9% in 2014, compared with a contraction of 0.4% in 2013. While an improvement from 2013, growth remained at a suppressed level. Fixed investment and consumer spending both grew modestly in 2014, after contracting in 2013, and measures of inflation remain subdued. The ECB cut the main refinancing operations and deposit rates by 20 basis points to 0.05% and (0.20)%, respectively, announced a purchase program for asset-backed securities and covered bonds in the fourth quarter of 2014, and discussed the possibility of a quantitative easing program targeting sovereign bonds. The Euro depreciated by 12% against the U.S. dollar. In the United Kingdom, real GDP increased by 2.6% in 2014, compared with an increase of 1.7% in 2013. The Bank of England maintained its official bank rate at 0.50%. The British pound depreciated by 6% against the U.S. dollar. Yields on 10-year government bonds in the region generally fell during the year. In equity markets, the DAX Index and the Euro Stoxx 50 Index increased by 3% and 1%, respectively, while the NASDAQ CompositeFTSE 100 Index and the CAC 40 Index decreased by 2%3% and the S&P 500 Index ended the year essentially unchanged.1%, respectively, during 2014.
| Goldman Sachs |
THE GOLDMAN SACHS GROUP, INC. AND SUBSIDIARIES
Management’s Discussion and Analysis
Europe
Real GDP in the Euro area economies increased by an estimated 1.6% in 2011, compared with an increase of 1.8% in 2010. Growth moderated slightly, primarily reflecting reduced growth in consumer expenditure and exports, although fixed investment increased. Surveys of business and consumer confidence deteriorated over the course of the year. Measures of core inflation increased during the year from low levels. Concerns about fiscal challenges in several Euro area economies intensified during the year, weighing on economic growth in these economies and on risk appetite more broadly. In addition, concerns about European sovereign debt risk contributed to higher market volatility and funding pressures. The European Central Bank and governments in the Euro area took a range of policy measures to address these issues. The European Central Bank increased its main refinancing operations rate by 25 basis points during both the second and third quarters, but reversed these increases during the fourth quarter, such that the rate ended the year at 1.00%, unchanged compared with the end of 2010. In the United Kingdom, real GDP increased by 0.8% for 2011, compared with an increase of 2.1% in 2010. The Bank of England maintained its official bank rate at 0.50% during the year. Long-term government bond yields generally declined during the year, although long-term government bond yields in certain Euro area economies increased significantly. In addition, spreads between German bond yields and those of most Euro area economies widened during the year. The Euro depreciated by 3% and the British pound was essentially unchanged against the U.S. dollar. The Euro Stoxx 50 Index and the CAC 40 Index both declined by 17%, while the DAX Index and the FTSE 100 Index decreased by 15% and 6%, respectively, compared with the end of 2010.
Asia
In Japan, real GDP decreased by 0.9%had no growth in 2011,2014, a sharp slowdown compared with an increase of 4.4%1.6% in 2010. Net exports and business investment declined2013. Real GDP contracted significantly during the year due tosecond and third quarters of 2014, as consumer expenditures fell, in part resulting from a consumption tax hike in April. However, real GDP picked up again in the economicfourth quarter of 2014. Although measures of inflation increased in 2014, inflation remained below the BOJ’s 2% inflation target excluding the impact of the earthquakeconsumption tax hike. During the fourth quarter of 2014, the BOJ announced further quantitative and tsunami inqualitative monetary easing and removed the first quarter. Measures of inflation remained negative during 2011. The Bank of Japan maintained its2-year timing target overnight call rate at a range of zero to 0.10% andfor achieving 2% price stability, making the timeframe open ended. During the year, the yield on 10-year Japanese government bonds felldeclined, the U.S. dollar appreciated by 14 basis points to 0.99%. The14% against the Japanese yen appreciated by 5% againstand, in equity markets, the U.S. dollar. The Nikkei 225 Index decreasedincreased by 17% during the year. 7%.
In China, real GDP increased by 9.2%7.4% in 20112014, compared with an increase of 10.4%7.7% in 2010. Growth moderated, primarily reflecting a slowdown in net exports and fixed investment growth, although consumer spending increased.2013. Measures of inflation increased significantly during 2011, reflectingremained moderate and the impact of higher food and energy prices, but decreased towards the end of the year. The People’s Bank of China raisedcut its one-year benchmark lending rate by 75 basis points to 6.56% and increased the reserve requirement ratio by 25040 basis points during the year. In addition,fourth quarter of 2014. The U.S. dollar appreciated by 2% against the Chinese yuan appreciated by 4% against the U.S. dollar and, in equity markets, the Shanghai Composite Index decreasedincreased by 22% during 2011. 53%, as regulatory changes influenced sentiment. In contrast, in Hong Kong, the Hang Seng Index increased by 1%.
In India, real GDP increased by an estimated 6.9%at a solid pace in 2011 compared with an increase of 8.5% in 2010. Growth moderated, primarily reflecting a slowdown in consumer expenditureboth 2014 and fixed investment growth.2013. The rate of wholesale inflation remained at elevated levels, but decreased duringdeclined compared with 2013. The U.S. dollar appreciated by 2% against the year. The Indian rupee depreciated by 19% against the U.S. dollar. Equity marketsand, in Hong Kong and India declined significantly and equity markets, in South Korea ended the year lower.BSE Sensex Index increased by 30% during 2014.
Other Markets
In Brazil, estimated real GDP increased by an estimated 3.0%had no growth in 2011,2014, compared with an increase of 7.5%2.5% in 2010. Growth moderated, primarily reflecting a slowdown in2013, as private consumption growth decelerated and fixed investment and consumer expenditure growth.spending contracted. The U.S. dollar appreciated by 12% against the Brazilian real weakened againstand, in equity markets, the U.S. dollar. Brazilian equity prices ended the year significantly lower compared with the end of 2010.Bovespa Index decreased by 3%. In Russia, real GDP increased by an estimated 4.2%0.6% in 2011,2014, compared with an increase of 4.0%1.3% in 2010. Growth was driven by an increase2013. Tensions related to the political situation in domestic demand, particularlyUkraine and Russia generated concern during the second half of the year. The U.S. dollar appreciated by 76% against the Russian ruble weakened againstand, in equity markets, the U.S. dollar and Russian equity prices ended the year significantly lower compared with the end of 2010.MICEX Index decreased by 7% during 2014.
THE GOLDMAN SACHS GROUP, INC. AND SUBSIDIARIES
Management’s Discussion and Analysis
Fair Value
Fair Value Hierarchy.Financial instruments owned, at fair value and Financial instruments sold, but not yet purchased, at fair value (i.e., inventory), as well as certain other financial assets and financial liabilities, are reflected in our consolidated statements of financial condition at fair value (i.e., marked-to-market), with related gains or losses generally recognized in our consolidated statements of earnings. The use of fair value to measure financial instruments is fundamental to our risk management practices and is our most critical accounting policy.
The fair value of a financial instrument is the amount that would be received to sell an asset or paid to transfer a liability in an orderly transaction between market participants at the measurement date. We measure certain financial assets and financial liabilities as a portfolio (i.e., based on its net exposure to market and/or credit risks). In determining fair value, the hierarchy under U.S. generally accepted accounting principles (U.S. GAAP) gives (i) the highest priority to unadjusted quoted prices in active markets for identical, unrestricted assets or liabilities (level 1 inputs), (ii) the next priority to inputs other than level 1 inputs that are observable, either directly or indirectly (level 2 inputs), and (iii) the lowest priority to inputs that cannot be observed in market activity (level 3 inputs). Assets and liabilities are classified in their entirety based on the lowest level of input that is significant to their fair value measurement.
The fair values for substantially all of our financial assets and financial liabilities are based on observable prices and inputs and are classified in levels 1 and 2 of the fair value hierarchy. Certain level 2 and level 3 financial assets and financial liabilities may require appropriate valuation adjustments that a market participant would require to arrive at fair value for factors such as counterparty and the firm’s credit quality, funding risk, transfer restrictions, liquidity and bid/offer spreads. Valuation adjustments are generally based on market evidence.
| 50 | Goldman Sachs 2014 Form 10-K |
THE GOLDMAN SACHS GROUP, INC. AND SUBSIDIARIES
Management’s Discussion and Analysis
Instruments categorized within level 3 of the fair value hierarchy are those which represent approximately 5% of the firm’s total assets, require one or more significant inputs that are not observable. As of December 2014 and December 2013, level 3 financial assets represented 4.9% and 4.4%, respectively, of our total assets. Absent evidence to the contrary, instruments classified within level 3 of the fair value hierarchy are initially valued at transaction price, which is considered to be the best initial estimate of fair value. Subsequent to the transaction date, we use other methodologies to determine fair value, which vary based on the type of instrument. Estimating the fair value of level 3 financial instruments requires judgments to be made. These judgments include:
| Ÿ |
|
| Ÿ |
|
| Ÿ |
|
Regardless of the methodology, valuation inputs and assumptions are only changed when corroborated by substantive evidence.
Controls Over Valuation of Financial Instruments.Market makers and investment professionals in our revenue-producing units are responsible for pricing our financial instruments. Our control infrastructure is independent of the revenue-producing units and is fundamental to ensuring that all of our financial instruments are appropriately valued at market-clearing levels. In the event that there is a difference of opinion in situations where estimating the fair value of financial instruments requires judgment (e.g., calibration to market comparables or trade comparison, as described below), the final valuation decision is made by senior managers in control and support functions that are independent of the revenue-producing units (independent control and support functions).units. This independent price verification is critical to ensuring that our financial instruments are properly valued.
THE GOLDMAN SACHS GROUP, INC. AND SUBSIDIARIES
Management’s Discussion and Analysis
Price Verification. All financial instruments at fair value in levels 1, 2 and 3 of the fair value hierarchy are subject to our independent price verification process. The objective of price verification is to have an informed and independent opinion with regard to the valuation of financial instruments under review. Instruments that have one or more significant inputs which cannot be corroborated by external market data are classified within level 3 of the fair value hierarchy. Price verification strategies utilized by our independent control and support functions include:
| Ÿ | Trade |
| Ÿ | External Price |
| Ÿ | Calibration to Market |
| Ÿ | Relative Value |
| Ÿ | Collateral |
| Ÿ | Execution of |
| Ÿ |
|
See Notes 5 through 8 to the consolidated financial statements in Part II, Item 8 of this Form 10-K for further information about fair value measurements.
| Goldman Sachs 2014 Form 10-K | 51 |
THE GOLDMAN SACHS GROUP, INC. AND SUBSIDIARIES
Management’s Discussion and Analysis
Review of Net Revenues.Independent control and support functions ensure adherence to our pricing policy through a combination of daily procedures, including the explanation and attribution of net revenues based on the underlying factors. Through this process we independently validate net revenues, identify and resolve potential fair value or trade booking issues on a timely basis and seek to ensure that risks are being properly categorized and quantified.
Review of Valuation Models.Quantitative The firm’s independent model validation group, consisting of quantitative professionals within our Market Risk Management department (Market Risk Management) performwho are separate from model developers, performs an independent model approval process. This process incorporates a review of a diverse set of model and trade parameters across a broad range of values (including extreme and/or improbable conditions) in order to critically evaluate:
| Ÿ |
|
| Ÿ |
|
| Ÿ |
|
| Ÿ |
|
| Ÿ |
|
New or changed models are reviewed and approved.approved prior to being put into use. Models are evaluated and re-approved annually to assess the impact of any changes in the product or market and any market developments in pricing theories.
THE GOLDMAN SACHS GROUP, INC. AND SUBSIDIARIES
Management’s Discussion and Analysis
Level 3 Financial Assets at Fair ValueValue.. The table below presents financial assets measured at fair value and the amount of such assets that are classified within level 3 of the fair value hierarchy.
Total level 3 financial assets were $47.94$42.01 billion and $45.38$40.01 billion as of December 20112014 and December 2010,2013, respectively.
See Notes 5 through 8 to the consolidated financial statements in Part II, Item 8 of this Form 10-K for further information about level 3 financial assets, including changes in level 3 financial assets and related fair value measurements.
| As of December 2011 | As of December 2010 | |||||||||||||||||
| in millions | Total at Fair Value | Level 3 Total | Total at Fair Value | Level 3 Total | ||||||||||||||
Commercial paper, certificates of deposit, time deposits | $ | 13,440 | $ | — | $ | 11,262 | $ | — | ||||||||||
U.S. government and federal agency obligations | 87,040 | — | 84,928 | — | ||||||||||||||
Non-U.S. government obligations | 49,205 | 148 | 40,675 | — | ||||||||||||||
Mortgage and other asset-backed loans and securities: Loans and securities backed by commercial real estate | 6,699 | 3,346 | 7,510 | 3,976 | ||||||||||||||
Loans and securities backed by residential real estate | 7,592 | 1,709 | 9,532 | 2,501 | ||||||||||||||
Bank loans and bridge loans | 19,745 | 11,285 | 18,039 | 9,905 | ||||||||||||||
Corporate debt securities | 22,131 | 2,480 | 24,719 | 2,737 | ||||||||||||||
State and municipal obligations | 3,089 | 599 | 2,792 | 754 | ||||||||||||||
Other debt obligations | 4,362 | 1,451 | 3,232 | 1,274 | ||||||||||||||
Equities and convertible debentures | 65,113 | 13,667 | 67,833 | 11,060 | ||||||||||||||
Commodities | 5,762 | — | 13,138 | — | ||||||||||||||
Total cash instruments | 284,178 | 34,685 | 283,660 | 32,207 | ||||||||||||||
Derivatives | 80,028 | 11,900 | 73,293 | 12,772 | ||||||||||||||
Financial instruments owned, at fair value | 364,206 | 46,585 | 356,953 | 44,979 | ||||||||||||||
Securities segregated for regulatory and other purposes | 42,014 | — | 36,182 | — | ||||||||||||||
Securities purchased under agreements to resell | 187,789 | 557 | 188,355 | 100 | ||||||||||||||
Securities borrowed | 47,621 | — | 48,822 | — | ||||||||||||||
Receivables from customers and counterparties | 9,682 | 795 | 7,202 | 298 | ||||||||||||||
Total | $ | 651,312 | $ | 47,937 | $ | 637,514 | $ | 45,377 | ||||||||||
THE GOLDMAN SACHS GROUP, INC. AND SUBSIDIARIES
Management’s Discussion and Analysis
Goodwill and Identifiable Intangible Assets
Goodwill. Goodwill is the cost of acquired companies in excess of the fair value of net assets, including identifiable intangible assets, at the acquisition date. Goodwill is assessed annually in the fourth quarter for impairment, or more frequently if events occur or circumstances change that indicate an impairment may exist, by first assessing qualitative factors to determine whether it is more likely than not that the fair value of a reporting unit is less than its carrying amount. If the results of the qualitative assessment are not conclusive, a quantitative goodwill impairment test iswould be performed by comparing the estimated fair value of each reporting unit with its estimated net book value. We derive
During the fair value basedfourth quarter of 2014, we assessed goodwill for impairment. The qualitative assessment required management to make judgments and to evaluate several factors, which included, but were not limited to, macroeconomic conditions, industry and market considerations, cost factors, overall financial performance, entity-specific events, events affecting reporting units and sustained changes in our stock price. Based on valuation techniquesour evaluation of these factors, we believe market participants would use (i.e., observable price-to-earnings multiples and price-to-book multiples). We derive the net book value by estimating the amount of shareholders’ equity required to support the activities of each reporting unit. Estimatingdetermined that it was more likely than not that the fair value of oureach of the reporting units requires management to make judgments. Critical inputs include (i) projected earnings, (ii) estimated long-term growth ratesexceeded its respective carrying amount, and (iii) cost of equity.
During the second half of 2011, consistent with the decline in stock prices in the broader financial services sector, our stock price declined and throughout most of this period, our market capitalization was below book value. Accordingly,therefore, we performed a quantitative impairment test during the fourth quarter of 2011 and determined that goodwill was not impaired. The estimated fair value of our reporting units in whichimpaired and that a quantitative goodwill impairment test was not required.
If we hold substantially all of our goodwill significantly exceeded the estimated carrying values. We believe that it is appropriate to consider market capitalization, among other factors, as an indicator of fair value overexperience a reasonable period of time.
If the current economic market conditions persist and if there is a prolonged or severe period of weakness in the business environment andor financial markets, our earnings maygoodwill could be adversely affected, which could result in an impairment of goodwillimpaired in the future. In addition, significant changes to other critical inputs of the quantitative goodwill impairment test (e.g., cost of equity) could cause the estimated fair value of our reporting units to decline, which could result in an impairment of goodwill in the future.
See Note 3 to the consolidated financial statements in Part II, Item 8 of this Form 10-K for information about amendments to the accounting guidance for goodwill impairment testing and Note 13 to the consolidated financial statements in Part II, Item 8 of this Form 10-K for the carrying value offurther information about our goodwill.
| 52 | Goldman Sachs 2014 Form 10-K |
THE GOLDMAN SACHS GROUP, INC. AND SUBSIDIARIES
Management’s Discussion and Analysis
Identifiable Intangible Assets. We amortize our identifiable intangible assets (i) over their estimated useful lives (ii)using the straight-line method or based on economic usage or (iii) in proportion to estimated gross profits or premium revenues.for certain commodities-related intangibles. Identifiable intangible assets are tested for impairment whenever events or changes in circumstances suggest that an asset’s or asset group’s carrying value may not be fully recoverable.
An impairment loss, generally calculated as the difference between the estimated fair value and the carrying value of an asset or asset group, is recognized if the sum of the estimated undiscounted cash flows relating to the asset or asset group is less than the corresponding carrying value. See Note 13 to the consolidated financial statements in Part II, Item 8 of this Form 10-K for the carrying value and estimated remaining useful lives of our identifiable intangible assets by major asset class and impairments of our identifiable intangible assets.class.
A prolonged or severe period of market weakness, or significant changes in regulation could adversely impact our businesses and impair the value of our identifiable intangible assets. In addition, certain events could indicate a potential impairment of our identifiable intangible assets, including (i)weaker business performance resulting in a decrease in our customer base and decreases in revenues from commodity-relatedcommodities-related transportation rights, customer contracts and relationships, (ii) decreases in cash receipts from television broadcast royalties, (iii) an adverse action or assessment by a regulator or (iv) adverse actual experience on the contracts in our variable annuity and life insurance business.relationships. Management judgment is required to evaluate whether indications of potential impairment have occurred, and to test intangiblesintangible assets for impairment if required.
THE GOLDMAN SACHS GROUP, INC. AND SUBSIDIARIES
See Note 13 to the consolidated financial statements for information about impairments of our identifiable intangible assets.
Management’s Discussion and AnalysisRecent Accounting Developments
See Note 3 to the consolidated financial statements for information about Recent Accounting Developments.
The use of generally accepted accounting principles requires management to make certain estimates and assumptions. In addition to the estimates we make in connection with fair value measurements, and the accounting for goodwill and identifiable intangible assets, the use of estimates and assumptions is also important in determining provisions for losses that may arise from litigation, regulatory proceedings and tax audits.
We estimate and provide for potential losses that may arise out of litigation and regulatory proceedings to the extent that such losses are probable and can be reasonably estimated. In accounting for income taxes,addition, we estimate the upper end of the range of reasonably possible aggregate loss in excess of the related reserves for litigation proceedings where the firm believes the risk of loss is more than slight. See Notes 18 and provide for potential liabilities that may arise out of tax audits to the extent that uncertain tax positions fail to meet the recognition standard under FASB Accounting Standards
Codification 740. See Note 2427 to the consolidated financial statements in Part II, Item 8 of this Form 10-K for further information about accounting for income taxes.certain judicial, regulatory and legal proceedings.
Significant judgment is required in making these estimates and our final liabilities may ultimately be materially different. Our total estimated liability in respect of litigation and regulatory proceedings is determined on a case-by-case basis and represents an estimate of probable losses after considering, among other factors, the progress of each case or proceeding, our experience and the experience of others in similar cases or proceedings, and the opinions and views of legal counsel.
In accounting for income taxes, we recognize tax positions in the financial statements only when it is more likely than not that the position will be sustained on examination by the relevant taxing authority based on the technical merits of the position. See Notes 18 and 27Note 24 to the consolidated financial statements in Part II, Item 8 of this Form 10-K for further information on certain judicial, regulatory and legal proceedings.about accounting for income taxes.
| Goldman Sachs |
THE GOLDMAN SACHS GROUP, INC. AND SUBSIDIARIES
Management’s Discussion and Analysis
The composition of our net revenues has varied over time as financial markets and the scope of our operations have changed. The composition of net revenues can also vary over the shorter term due to fluctuations in U.S. and global economic and market conditions. See “Certain Risk Factors That May Affect Our Businesses” below and “Risk
Factors” in Part I, Item 1A of thisthe 2014 Form 10-K for a further discussion of the impact of economic and market conditions on our results of operations.
Financial Overview
The table below presents an overview of our financial results.
| Year Ended December | ||||||||||||||||||||||||
| $ in millions, except per share amounts | 2011 | 2010 | 2009 | Year Ended December | ||||||||||||||||||||
$ in millions, except per share amounts | 2014 | 2013 | 2012 | |||||||||||||||||||||
| $ | 28,811 | $ | 39,161 | $ | 45,173 | $34,528 | $34,206 | $34,163 | ||||||||||||||||
Pre-tax earnings | 6,169 | 12,892 | 19,829 | 12,357 | 11,737 | 11,207 | ||||||||||||||||||
Net earnings | 4,442 | 8,354 | 13,385 | 8,477 | 8,040 | 7,475 | ||||||||||||||||||
Net earnings applicable to common shareholders | 2,510 | 7,713 | 12,192 | 8,077 | 7,726 | 7,292 | ||||||||||||||||||
Diluted earnings per common share | 4.51 | 13.18 | 22.13 | 17.07 | 15.46 | 14.13 | ||||||||||||||||||
Return on average common shareholders’ equity 1 | 3.7 | % | 11.5 | % | 22.5 | % | 11.2% | 11.0% | 10.7% | |||||||||||||||
Diluted earnings per common share, excluding the impact of the Series G Preferred Stock dividend 2 | $ | 7.46 | N/A | N/A | ||||||||||||||||||||
Return on average common shareholders’ equity, excluding the impact of the Series G Preferred Stock dividend 2 | 5.9 | % | N/A | N/A | ||||||||||||||||||||
Diluted earnings per common share, excluding the impact of the U.K. bank payroll tax, the SEC settlement and the NYSE DMM rights impairment 3 | N/A | $ | 15.22 | N/A | ||||||||||||||||||||
Return on average common shareholders’ equity, excluding the impact of the U.K. bank payroll tax, the SEC settlement and the NYSE DMM rights impairment 3 | N/A | 13.1 | % | N/A | ||||||||||||||||||||
| 1. | ROE is computed by dividing net earnings applicable to common shareholders by average monthly common shareholders’ equity. The table below presents our average common shareholders’ equity. |
Average for the Year Ended December | Average for the Year Ended December | |||||||||||||||||||||||
| in millions | 2011 | 2010 | 2009 | |||||||||||||||||||||
| $ in millions | 2014 | 2013 | 2012 | |||||||||||||||||||||
Total shareholders’ equity | $ | 72,708 | $ | 74,257 | $ | 65,527 | $80,839 | $77,353 | $72,530 | |||||||||||||||
Preferred stock | (3,990 | ) | (6,957 | ) | (11,363 | ) | (8,585 | ) | (6,892 | ) | (4,392 | ) | ||||||||||||
Common shareholders’ equity | $ | 68,718 | $ | 67,300 | $ | 54,164 | $72,254 | $70,461 | $68,138 | |||||||||||||||
The table below presents selected financial ratios.
| Year Ended December | ||||||||||||
| 2014 | 2013 | 2012 | ||||||||||
Net earnings to average assets | 0.9% | 0.9% | 0.8% | |||||||||
Return on average total shareholders’ equity 1 | 10.5% | 10.4% | 10.3% | |||||||||
Total average equity to average assets | 9.0% | 8.2% | 7.7% | |||||||||
Dividend payout ratio 2 | 13.2% | 13.3% | 12.5% | |||||||||
| 1. | Return on average total shareholders’ equity is computed by dividing net earnings by average monthly total shareholders’ equity. |
| 2. |
|
Net Revenues
The table below presents our net revenues by line item on the consolidated statements of earnings.
| Year Ended December | ||||||||||||
| $ in millions | 2014 | 2013 | 2012 | |||||||||
Investment banking | $ 6,464 | $ 6,004 | $ 4,941 | |||||||||
Investment management | 5,748 | 5,194 | 4,968 | |||||||||
Commissions and fees | 3,316 | 3,255 | 3,161 | |||||||||
Market making | 8,365 | 9,368 | 11,348 | |||||||||
Other principal transactions | 6,588 | 6,993 | 5,865 | |||||||||
Total non-interest revenues | 30,481 | 30,814 | 30,283 | |||||||||
Interest income | 9,604 | 10,060 | 11,381 | |||||||||
Interest expense | 5,557 | 6,668 | 7,501 | |||||||||
Net interest income | 4,047 | 3,392 | 3,880 | |||||||||
Total net revenues | $34,528 | $34,206 | $34,163 | |||||||||
In the table above:
| Ÿ | “Investment banking” is comprised of revenues (excluding net interest) from financial advisory and |
| ||||
| ||||
| ||||
| ||||
|
“Commissions and fees” is comprised of revenues from executing and clearing client transactions on major stock, options and futures exchanges worldwide, as well as over-the-counter (OTC) transactions. These activities are included in our Institutional Client Services and Investment Management segments. |
“Market making” is comprised of revenues (excluding net interest) from client execution activities related to making markets in interest rate products, credit products, mortgages, currencies, commodities and equity products. These activities are included in our Institutional Client Services segment. |
| ||||
| ||||
| ||||
| ||||
|
| Goldman Sachs |
THE GOLDMAN SACHS GROUP, INC. AND SUBSIDIARIES
Management’s Discussion and Analysis
|
| ||||
| ||||
| ||||
| ||||
| ||||
| ||||
| ||||
| ||||
| ||||
| ||||
| ||||
| ||||
| ||||
| ||||
| ||||
| ||||
2014 versus 2013
Net revenues on the consolidated statements of earnings were $34.53 billion for 2014, essentially unchanged compared with 2013, reflecting higher net interest income, investment management revenues and investment banking revenues, as well as slightly higher commissions and fees, largely offset by lower market-making revenues and other principal transactions revenues.
During 2014, the operating environment was favorable for investment banking activities, as industry-wide underwriting activity was strong and industry-wide mergers and acquisitions activity increased. Improved asset prices resulted in appreciation in the value of client assets in investment management. In addition, other principal transactions were impacted by favorable company-specific events and strong corporate performance. However, the operating environment remained challenging for market-making activities as economic uncertainty and low volatility levels contributed to generally low levels of activity, particularly in fixed income products. If macroeconomic concerns continue over the long term, and client activity levels in investment banking broadly decline or market-making activity levels remain low, or if asset prices were to decline, net revenues would likely be negatively impacted. See “Segment Operating Results” below for further information about material trends and uncertainties that may impact our results of operations.
Non-Interest Revenues. Investment banking revenues on the consolidated statements of earnings were $6.46 billion for 2014, 8% higher than 2013, due to significantly higher revenues in financial advisory, reflecting an increase in industry-wide completed mergers and acquisitions, primarily in the United States. Revenues in underwriting were essentially unchanged compared with a strong 2013, as industry-wide activity levels remained high. Revenues in debt underwriting were slightly lower compared with 2013, reflecting lower revenues from commercial mortgage-related activity, while revenues in equity underwriting were slightly higher, principally from initial public offerings.
Investment management revenues on the consolidated statements of earnings were $5.75 billion for 2014, 11% higher than 2013, reflecting higher management and other fees, primarily due to higher average assets under supervision, as well as higher incentive fees and transaction revenues.
Commissions and fees on the consolidated statements of earnings were $3.32 billion for 2014, 2% higher than 2013, due to higher commissions and fees in both Europe and the United States, reflecting generally higher client activity, consistent with increases in listed cash equity market volumes in these regions.
Market-making revenues on the consolidated statements of earnings were $8.37 billion for 2014, 11% lower than 2013. Results for 2014 included a gain of $289 million ($270 million of which was recorded at extinguishment in the third quarter) related to the extinguishment of certain of our junior subordinated debt. Excluding this gain and a gain of $211 million on the sale of a majority stake in our European insurance business in 2013, the decrease in market-making revenues compared with 2013 reflected significantly lower revenues in both credit products and equity derivatives, lower revenues in mortgages and the sale of our Americas reinsurance business in 2013. These decreases were partially offset by significantly higher revenues in commodities, as well as higher revenues in equity cash products, currencies and interest rate products.
Other principal transactions revenues on the consolidated statements of earnings were $6.59 billion for 2014, 6% lower than 2013. Net gains from investments in equity securities were slightly lower due to a significant decrease in net gains from investments in public equities, as movements in global equity prices during 2014 were less favorable compared with 2013, partially offset by an increase in net gains from investments in private equities, primarily driven by company-specific events. Net gains from debt securities and loans were slightly higher than 2013, primarily due to sales of certain investments during 2014. Revenues related to our consolidated investments were significantly lower compared with 2013, reflecting a decrease in operating revenues from commodities-related consolidated investments.
Net Interest Income. Net interest income on the consolidated statements of earnings was $4.05 billion for 2014, 19% higher than 2013. The increase compared with 2013 was primarily due to lower interest expense resulting from a reduction in our total liabilities, lower costs of long-term funding due to a decline in interest rates and the impact of rebates in the securities services business, partially offset by lower interest income due to a reduction in our total assets. See “Supplemental Financial Information — Statistical Disclosures — Distribution of Assets, Liabilities and Shareholders’ Equity” for further information about our sources of net interest income.
2013 versus 2012
Net revenues on the consolidated statements of earnings were $34.21 billion for 2013, essentially unchanged compared with 2012. 2013 included significantly higher investment banking revenues, as well as higher other principal transactions revenues and investment management revenues. In addition, commissions and fees were slightly higher compared with 2012. These increases were offset by lower market-making revenues and lower net interest income compared with 2012.
| Goldman Sachs |
THE GOLDMAN SACHS GROUP, INC. AND SUBSIDIARIES
Management’s Discussion and Analysis
Net RevenuesDuring 2013, a significant increase in global equity prices contributed to improved industry-wide equity underwriting activity in investment banking, appreciation in the value of client assets in investment management and net gains from investments in public equities in other principal transactions. Other principal transactions were also impacted by favorable company-specific events and strong corporate performance, and industry-wide debt underwriting activity in investment banking remained solid, as interest rates remained low. However, macroeconomic concerns continued to weigh on industry-wide mergers and acquisitions activity in investment banking, and contributed to a challenging operating environment for market-making activities, resulting in fluctuations in activity levels during 2013. See “Segment Operating Results” below for further information about material trends and uncertainties that may impact our results of operations.
2011 versus 2010.Non-Interest Revenues.Net Investment banking revenues on the consolidated statements of earnings were $28.81$6.00 billion for 2011, 26% lower2013, 22% higher than 2010,2012, reflecting significantly lower nethigher revenues in Investing & Lending and Institutional Client Services, as well as lower netunderwriting, due to strong revenues in Investment Banking. Net revenuesboth equity and debt underwriting. Revenues in Investment Managementequity underwriting were significantly higher compared with 2012, reflecting an increase in client activity, particularly in initial public offerings. Revenues in debt underwriting were significantly higher compared with 2012, principally due to leveraged finance activity. Revenues in financial advisory were essentially unchanged compared with 2010.2012.
2010 versus 2009.NetInvestment management revenues on the consolidated statements of earnings were $39.16$5.19 billion for 2010, 13%2013, 5% higher than 2012, reflecting higher management and other fees, primarily due to higher average assets under supervision.
Commissions and fees on the consolidated statements of earnings were $3.26 billion for 2013, slightly higher than 2012, primarily reflecting higher commissions and fees in Asia and Europe. During 2013, our average daily volumes were higher in Asia and Europe and lower in the United States compared with 2012, consistent with listed cash equity market volumes.
Market-making revenues on the consolidated statements of earnings were $9.37 billion for 2013, 17% lower than 2009, reflecting2012. The decrease compared with 2012 was primarily due to significantly lower net revenues in Institutional Client Servicesequity products, mortgages and slightlyinterest rate products, as well as lower net revenues in Investment Banking. These decreases werecurrencies. The decrease in equity products was due to the sale of our Americas reinsurance business in 2013, the sale of our hedge fund administration business in 2012 (2012 included a gain on sale of $494 million) and lower revenues in derivatives, partially offset by significantly higher net revenues in Investing & Lending andcash products compared with 2012. Revenues in commodities were higher, netwhile revenues in Investment Management.credit products were essentially unchanged compared with 2012. In December 2013, we completed the sale of a majority stake in our European insurance business and recognized a gain of $211 million.
Other principal transactions revenues on the consolidated statements of earnings were $6.99 billion for 2013, 19% higher than 2012, reflecting a significant increase in net gains from investments in equity securities, driven by company-specific events and stronger corporate performance, as well as significantly higher global equity prices. In addition, net gains from debt securities and loans were slightly higher, while revenues related to our consolidated investments were lower compared with 2012.
Net Interest Income
2011 versus 2010.Income.Net interest income on the consolidated statements of earnings was $5.19$3.39 billion for 2011, 6%2013, 13% lower than 2010.2012. The decrease compared with 20102012 was primarily due to higherlower average yields on financial instruments owned, at fair value, partially offset by lower interest expense related to our long-term borrowings and higher dividend expense related toon financial instruments sold, but not yet purchased, partially offset by an increase inat fair value and collateralized financings. See “Supplemental Financial Information — Statistical Disclosures — Distribution of Assets, Liabilities and Shareholders’ Equity” for further information about our sources of net interest income from higher yielding collateralized agreements.
2010 versus 2009.Net interest income was $5.50 billion for 2010, 26% lower than 2009. The decrease compared with 2009 was primarily due to lower average fixed income assets, most notably U.S. federal agency obligations, higher interest expense related to our long-term borrowings and tighter securities lending spreads.
Non-interest Revenues
Investment banking
Investment banking revenues reflected an operating environment generally characterized by significant declines in industry-wide underwriting and mergers and acquisitions activity levels during the second half of 2011. These declines reflected increased concerns regarding the weakened state of global economies, including heightened European sovereign debt risk, which contributed to a significant widening in credit spreads, a sharp increase in volatility levels and a significant decline in global equity markets during the second half of 2011. If these concerns continue or if equity markets decline further, resulting in lower levels of client activity, revenues in investment banking would likely continue to be negatively impacted.
2011 versus 2010.Investment banking revenues on the consolidated statement of earnings were $4.36 billion for 2011, 9% lower than 2010, primarily reflecting lower revenues in our underwriting business. Revenues in equity underwriting were significantly lower than 2010, principally due to a decline in industry-wide activity. Revenues in debt underwriting were essentially unchanged compared with 2010. Revenues in financial advisory decreased slightly compared with 2010.
2010 versus 2009.Investment banking revenues on the consolidated statement of earnings were $4.81 billion for 2010, 3% lower than 2009, reflecting lower revenues in our underwriting business, partially offset by higher revenues in financial advisory. The decline in underwriting reflected lower revenues in equity underwriting, principally due to a decline in client activity in comparison to 2009, which included significant capital-raising activity by financial institution clients. Revenues in debt underwriting were essentially unchanged compared with 2009. Revenues in financial advisory increased compared with 2009, primarily reflecting an increase in client activity.
Investment management
During the first half of 2011, investment management revenues reflected an operating environment generally characterized by improved asset prices and a shift in investor assets away from money markets in favor of asset classes with potentially higher risk and returns. However, during the second half of 2011, asset prices declined, particularly in equities, in part driven by increased uncertainty regarding the global economic outlook. Declining asset prices and economic uncertainty contributed to investors shifting assets away from asset classes with potentially higher risk and returns to asset classes with lower risk and returns. If asset prices continue to decline or investors continue to favor lower risk asset classes or withdraw their assets, investment management revenues would likely continue to be negatively impacted.
2011 versus 2010.Investment management revenues on the consolidated statement of earnings were $4.69 billion for 2011, essentially unchanged compared with 2010, primarily due to higher management and other fees, reflecting favorable changes in the mix of assets under management, offset by lower incentive fees.income.
| Goldman Sachs |
THE GOLDMAN SACHS GROUP, INC. AND SUBSIDIARIES
Management’s Discussion and Analysis
2010 versus 2009.Investment management revenues on the consolidated statement of earnings were $4.67 billion for 2010, 10% higher than 2009, primarily reflecting higher incentive fees across our alternative investment products. Management and other fees also increased, reflecting favorable changes in the mix of assets under management, as well as the impact of appreciation in the value of client assets.
Commissions and fees
Broad market concerns and uncertainties that emerged during 2010, including concerns about European sovereign debt risk and the weakened state of global economies, heightened during 2011. These concerns and uncertainties resulted in an increase in average volatility levels and significantly lower equity prices in Europe and Asia, particularly during the third quarter of 2011. The macro challenges during the year resulted in volatile markets, which contributed to higher transaction volumes and fees. If these concerns and uncertainties continue, but were to result in lower transaction volumes, commissions and fees would likely be negatively impacted.
2011 versus 2010.Commissions and fees on the consolidated statement of earnings were $3.77 billion for 2011, 6% higher than 2010, reflecting higher transaction volumes, particularly during the third quarter of 2011.
2010 versus 2009.Commissions and fees on the consolidated statement of earnings were $3.57 billion for 2010, 7% lower than 2009, primarily reflecting lower client activity levels.
Market making
During 2011, market-making revenues were negatively impacted by increased concerns regarding the weakened state of global economies, including heightened European sovereign debt risk, and its impact on the European banking system and global financial institutions. These conditions also impacted expectations for economic prospects in the U.S. and were reflected in equity and debt markets more broadly. In addition, the downgrade in credit ratings of the U.S. government and federal agencies and many financial institutions during the second half of 2011 contributed to further uncertainty in the markets. These concerns, as well as other broad market concerns, such as uncertainty over financial regulatory reform, continued to have a negative impact on market-making revenues during 2011. If these concerns continue, and market-making conditions remain challenging, market-making revenues would likely continue to be negatively impacted.
2011 versus 2010. Market-making revenues on the consolidated statement of earnings were $9.29 billion for 2011, 32% lower than 2010. Although activity levels during 2011 were generally consistent with 2010 levels, and results were solid during the first quarter of 2011, the environment during the remainder of 2011 was characterized by broad market concerns and uncertainty, resulting in volatile markets and significantly wider credit spreads, which contributed to difficult market-making conditions and led to reductions in risk by us and our clients. As a result of these conditions, revenues across most of our major market-making activities were lower during 2011 compared with 2010.
2010 versus 2009.Market-making revenues on the consolidated statement of earnings were $13.68 billion for 2010, 38% lower than 2009. During 2010, market-making revenues were negatively impacted by lower client activity levels, which reflected broad market concerns including European sovereign debt risk and uncertainty over regulatory reform, as well as tighter bid/offer spreads. The decrease in revenues compared with a particularly strong 2009 primarily reflected lower results across most of our major market-making activities. These decreases were partially offset by higher revenues in mortgages, as 2009 included significant losses related to commercial mortgage loans.
Other principal transactions
During 2011, other principal transactions results reflected an operating environment characterized by a significant decline in equity markets in Europe and Asia, and unfavorable credit markets that were negatively impacted by increased concerns regarding the weakened state of global economies, including heightened European sovereign debt risk. If equity markets decline further and credit spreads widen further, other principal transactions revenues would likely continue to be negatively impacted.
THE GOLDMAN SACHS GROUP, INC. AND SUBSIDIARIES
Management’s Discussion and Analysis
2011 versus 2010.Other principal transactions revenues on the consolidated statements of earnings were $1.51 billion and $6.93 billion for 2011 and 2010, respectively. Results for 2011 included a loss from our investment in the ordinary shares of ICBC and net gains from other investments in equities, primarily in private equity positions, partially offset by losses from public equities. In addition, revenues in other principal transactions included net losses from debt securities and loans, primarily reflecting approximately $1 billion of unrealized losses related to relationship lending activities, including the effect of hedges, partially offset by net gains from other debt securities and loans. Results for 2011 also included revenues related to our consolidated entities held for investment purposes.
2010 versus 2009.Other principal transactions revenues on the consolidated statements of earnings were $6.93 billion and $2.62 billion for 2010 and 2009, respectively. During 2010, an increase in global equity markets and tighter credit spreads provided a favorable backdrop for other principal transactions revenues. Results for 2010 included a gain from our investment in the ordinary shares of ICBC, net gains from other investments in equities, net gains from debt securities and loans and revenues related to our consolidated entities held for investment purposes. Results for 2009 included a gain from our investment in the ordinary shares of ICBC, net gains from debt securities and loans, and revenues related to our consolidated entities held for investment purposes, partially offset by net losses from other investments in equities. During 2009, continued weakness in commercial real estate markets negatively impacted our results.
Operating Expenses
Our operating expenses are primarily influenced by compensation, headcount and levels of business activity. In addition, see “Use of Estimates” for expenses that may arise from litigation and regulatory proceedings. Compensation and benefits includes salaries, discretionary compensation, amortization of equity awards and other items such as benefits. Discretionary compensation is significantly impacted by, among other factors, the level of net revenues, overall financial performance, prevailing labor markets, business mix, the structure of our share-based compensation programs and the external environment.
In the context of more difficult economic and financial conditions, the firm launched an initiative during the second quarter of 2011 to identify areas where we can operate more efficiently and reduce our operating expenses. We targeted approximately $1.4 billion in annual run rate compensation and non-compensation reductions and will continue to monitor our expense run rate closely and make further adjustments as needed.
THE GOLDMAN SACHS GROUP, INC. AND SUBSIDIARIES
Management’s Discussion and Analysis
The table below presents our operating expenses and total staff.staff (which includes employees, consultants and temporary staff).
Year Ended December | Year Ended December | ||||||||||||||||||||
| $ in millions | 2011 | 2010 | 2009 | 2014 | 2013 | 2012 | |||||||||||||||
Compensation and benefits | $12,223 | $15,376 | $16,193 | $12,691 | $12,613 | $12,944 | |||||||||||||||
U.K. bank payroll tax | — | 465 | — | ||||||||||||||||||
Brokerage, clearing, exchange and distribution fees | 2,463 | 2,281 | 2,298 | 2,501 | 2,341 | 2,208 | |||||||||||||||
Market development | 640 | 530 | 342 | 549 | 541 | 509 | |||||||||||||||
Communications and technology | 828 | 758 | 709 | 779 | 776 | 782 | |||||||||||||||
Depreciation and amortization | 1,865 | 1,889 | 1,734 | 1,337 | 1,322 | 1,738 | |||||||||||||||
Occupancy | 1,030 | 1,086 | 950 | 827 | 839 | 875 | |||||||||||||||
Professional fees | 992 | 927 | 678 | 902 | 930 | 867 | |||||||||||||||
Insurance reserves 1 | 529 | 398 | 334 | — | 176 | 598 | |||||||||||||||
Other expenses | 2,072 | 2,559 | 2,106 | 2,585 | 2,931 | 2,435 | |||||||||||||||
Total non-compensation expenses | 10,419 | 10,428 | 9,151 | 9,480 | 9,856 | 10,012 | |||||||||||||||
Total operating expenses | $22,642 | $26,269 | $25,344 | $22,171 | $22,469 | $22,956 | |||||||||||||||
Total staff at period-end 2 | 33,300 | 35,700 | 32,500 | ||||||||||||||||||
Total staff at period-end including consolidated entities held for investment purposes 3 | 34,700 | 38,700 | 36,200 | ||||||||||||||||||
Total staff at period-end | 34,000 | 32,900 | 32,400 | ||||||||||||||||||
| 1. |
|
|
|
20112014 versus 2010.2013.Operating expenses on the consolidated statements of earnings were $22.64$22.17 billion for 2011, 14% lower than 2010.2014, essentially unchanged compared with 2013. Compensation and benefits expenses on the consolidated statements of earnings were $12.22$12.69 billion for 2011, a 21% decline2014, essentially unchanged compared with $15.38 billion for 2010.2013. The ratio of compensation and benefits to net revenues for 20112014 was 42.4%,36.8% compared with 39.3% 1 (which excludes the impact of the
U.K. bank payroll tax)36.9% for 2010. Operating expenses for 2010 included $465 million related to the U.K. bank payroll tax.2013. Total staff decreased 7%increased 3% during 2011. Total staff including consolidated entities held for investment purposes decreased 10% during 2011.2014.
|
| ||||
| ||||
| ||||
| ||||
| ||||
THE GOLDMAN SACHS GROUP, INC. AND SUBSIDIARIES
Management’s Discussion and Analysis
Non-compensation expenses on the consolidated statements of earnings were $10.42$9.48 billion for 2011, essentially unchanged2014, 4% lower than 2013. The decrease compared with 2010. Non-compensation expenses for 20112013 included higher brokerage, clearing, exchange and distribution fees, increased reserves related to our insurance business and higher market development expenses compared with 2010. These increases were offset by lower other expenses during 2011. Thea decrease in other expenses, primarily reflecteddue to lower net provisions for litigation and regulatory proceedings (2010 included $550 million related to a settlement with the SEC). In addition, non-compensationand lower operating expenses during 2011 included impairment charges of approximately $440 million, primarily related to consolidated investments, as well as a decline in insurance reserves, reflecting the sale of our Americas reinsurance business in 2013. These decreases were partially offset by an increase in brokerage, clearing, exchange and Litton Loan Servicing LP. Charitable contributionsdistribution fees. Net provisions for litigation and regulatory proceedings for 2014 were $163$754 million during 2011,compared with $962 million for 2013 (both primarily including $78comprised of net provisions for mortgage-related matters). 2014 included a charitable contribution of $137 million to Goldman Sachs Gives, our donor-advised fund, and $25 million to The Goldman Sachs Foundation.fund. Compensation was reduced to fund thethis charitable contribution to Goldman Sachs Gives. The $78 million contribution is in addition to prior year contributions made to Goldman Sachs Gives. The firm asks its participating managing directors to make recommendations regarding potential charitable recipients for this contribution.
20102013 versus 2009.2012.Operating expenses on the consolidated statements of earnings were $26.27$22.47 billion for 2010, 4% higher2013, 2% lower than 2009.2012. Compensation and benefits expenses on the consolidated statements of earnings were $15.38$12.61 billion for 2010, a 5% decline2013, 3% lower compared with $16.19$12.94 billion for 2009, due to lower net revenues.2012. The ratio of compensation and benefits to net revenues for 20102013 was 39.3% (which excludes the impact of the $465 million U.K. bank payroll tax),36.9% compared with 35.8%37.9% for 2009.2012. Total staff increased 10%2% during 2010. Total staff including consolidated entities held for investment purposes increased 7% during 2010.2013.
During 2010, the United Kingdom enacted legislation that imposed a non-deductible 50% tax on certain financial institutions in respect of discretionary bonuses in excess of £25,000 awarded under arrangements made between December 9, 2009 and April 5, 2010 to “relevant banking employees.” Our operating expenses for 2010 included $465 million related to this tax.
Non-compensation expenses on the consolidated statements of earnings were $10.43$9.86 billion for 2010, 14%2013, 2% lower than 2012. The decrease compared with 2012 included a decline in insurance reserves, reflecting the sale of our Americas reinsurance business, and a decrease in depreciation and amortization expenses, primarily reflecting lower impairment charges and lower operating expenses related to consolidated investments. These decreases were partially offset by an increase in other expenses, due to higher than 2009. This increase was primarily attributable to the impact of net provisions for litigation and regulatory proceedings, and higher brokerage, clearing, exchange and distribution fees. Net provisions for litigation and regulatory proceedings for 2013 were $962 million (primarily comprised of $682net provisions for mortgage-related matters) compared with $448 million for 2012 (including $550 million related to a settlement with the SEC), and an impairmentBoard of our NYSE DMM rights of $305 million, each during 2010. The remainderGovernors of the increase compared with 2009 generally reflected higher professional fees, market development expenses and occupancy expenses. These increases were partially offset byFederal Reserve System (Federal Reserve Board) regarding the impactindependent foreclosure review). 2013 included a charitable contribution of significantly higher real estate impairment charges during 2009 related to our consolidated entities held for investment purposes, as well as higher charitable contributions during 2009. The real estate impairment charges, which were measured based on discounted cash flow analyses, are included in our Investing & Lending segment and reflected weakness in the commercial real estate markets. Charitable contributions were approximately $420 million during 2010, primarily including $25 million to The Goldman Sachs Foundation and $320$155 million to Goldman Sachs Gives, our donor-advised fund. Compensation was reduced to fund thethis charitable contribution to Goldman Sachs Gives. The firm asks its participating managing directors to make recommendations regarding potential charitable recipients for this contribution.
| Goldman Sachs | 57 |
THE GOLDMAN SACHS GROUP, INC. AND SUBSIDIARIES
Management’s Discussion and Analysis
Provision for Taxes
The effective income tax rate for 20112014 was 28.0%31.4%, down from 35.2%essentially unchanged compared with 31.5% for 2010. Excluding the impact of the $465 million U.K. bank payroll tax and the $550 million SEC settlement, substantially all of which was non-deductible, the effective income tax rate for 2010 was 32.7% 1. The decrease from 32.7% to 28.0% was primarily due to an increase in permanent benefits as a percentage of earnings and the earnings mix.2013.
The effective income tax rate for 2010 of 32.7% 12013 was essentially unchanged31.5%, down from the effective income tax rate33.3% for 2009 of 32.5%.2012. The decrease from 33.3% to 31.5% was primarily due to a determination that certain non-U.S. earnings will be permanently reinvested abroad.
In December 2010,2014, the rules related to the deferral of U.S. tax on certain non-repatriated active financing income were extended retroactively to January 1, 20102014 through December 31, 2011. If2014. The expiration of these rules areeffective December 31, 2014 is not extended, the expiration may materially increaseexpected to have a material impact on our effective income tax rate beginningfor 2015.
In March 2014, New York State enacted executive budget legislation for the 2014-2015 fiscal year which changes the taxation of corporations doing business in 2013.the state. This change did not have a material impact on our effective tax rate for 2014, and we do not expect it will have a material impact on our effective tax rate for 2015.
|
| Year Ended December 2010 | ||||||||||||
| $ in millions | Pre-tax earnings | Provision for taxes | Effective income tax rate | |||||||||
As reported | $12,892 | $4,538 | 35.2 | % | ||||||||
Add back: Impact of the U.K. bank payroll tax | 465 | — | ||||||||||
Impact of the SEC settlement | 550 | 6 | ||||||||||
As adjusted | $13,907 | $4,544 | 32.7 | % | ||||||||
THE GOLDMAN SACHS GROUP, INC. AND SUBSIDIARIES
Management’s Discussion and Analysis
Segment Operating Results
The table below presents the net revenues, operating expenses and pre-tax earnings of our segments.
| Year Ended December | ||||||||||||||
| in millions | 2011 | 2010 | 2009 | |||||||||||
Investment Banking | Net revenues | $ | 4,355 | $ | 4,810 | $ | 4,984 | |||||||
| Operating expenses | 2,962 | 3,511 | 3,482 | |||||||||||
| Pre-tax earnings | $ | 1,393 | $ | 1,299 | $ | 1,502 | ||||||||
Institutional Client Services | Net revenues | $ | 17,280 | $ | 21,796 | $ | 32,719 | |||||||
| Operating expenses | 12,697 | 14,291 | 13,691 | |||||||||||
| Pre-tax earnings | $ | 4,583 | $ | 7,505 | $ | 19,028 | ||||||||
Investing & Lending | Net revenues | $ | 2,142 | $ | 7,541 | $ | 2,863 | |||||||
| Operating expenses | 2,673 | 3,361 | 3,523 | |||||||||||
| Pre-tax earnings/(loss) | $ | (531 | ) | $ | 4,180 | $ | (660 | ) | ||||||
Investment Management | Net revenues | $ | 5,034 | $ | 5,014 | $ | 4,607 | |||||||
| Operating expenses | 4,018 | 4,051 | 3,673 | |||||||||||
| Pre-tax earnings | $ | 1,016 | $ | 963 | $ | 934 | ||||||||
Total | Net revenues | $ | 28,811 | $ | 39,161 | $ | 45,173 | |||||||
| Operating expenses | 22,642 | 26,269 | 25,344 | |||||||||||
| Pre-tax earnings | $ | 6,169 | $ | 12,892 | $ | 19,829 | ||||||||
Operating expenses in the table above include the following expenses that have not been allocated to our segments:
| Year Ended December | ||||||||||||
| $ in millions | 2014 | 2013 | 2012 | |||||||||
Investment Banking | ||||||||||||
Net revenues | $ 6,464 | $ 6,004 | $ 4,926 | |||||||||
Operating expenses | 3,688 | 3,479 | 3,333 | |||||||||
Pre-tax earnings | $ 2,776 | $ 2,525 | $ 1,593 | |||||||||
Institutional Client Services | ||||||||||||
Net revenues | $15,197 | $15,721 | $18,124 | |||||||||
Operating expenses | 10,880 | 11,792 | 12,490 | |||||||||
Pre-tax earnings | $ 4,317 | $ 3,929 | $ 5,634 | |||||||||
Investing & Lending | ||||||||||||
Net revenues | $ 6,825 | $ 7,018 | $ 5,891 | |||||||||
Operating expenses | 2,819 | 2,686 | 2,668 | |||||||||
Pre-tax earnings | $ 4,006 | $ 4,332 | $ 3,223 | |||||||||
Investment Management | ||||||||||||
Net revenues | $ 6,042 | $ 5,463 | $ 5,222 | |||||||||
Operating expenses | 4,647 | 4,357 | 4,296 | |||||||||
Pre-tax earnings | $ 1,395 | $ 1,106 | $ 926 | |||||||||
Total net revenues | $34,528 | $34,206 | $34,163 | |||||||||
Total operating expenses 1 | 22,171 | 22,469 | 22,956 | |||||||||
Total pre-tax earnings | $12,357 | $11,737 | $11,207 | |||||||||
| 1. |
|
|
$169 million for 2012. Operating expenses related to real estate-related exit costs, previously not allocated to our segments, have now been allocated. This allocation reflects the change in the manner in which management views the performance of |
Net revenues in our segments include allocations of interest income and interest expense to specific securities, commodities and other positions in relation to the cash generated by, or funding requirements of, such underlying positions. See Note 25 to the consolidated financial statements in Part II, Item 8 of this Form 10-K for further information about our business segments.
The cost drivers of Goldman Sachs taken as a whole — compensation, headcount and levels of business activity — are broadly similar in each of our business segments. Compensation and benefits expenses within our segments reflect, among other factors, the overall performance of Goldman Sachs as well as the performance of individual businesses. Consequently, pre-tax margins in one segment of our business may be significantly affected by the performance of our other business segments. A discussion of segment operating results follows.
| 58 | Goldman Sachs |
THE GOLDMAN SACHS GROUP, INC. AND SUBSIDIARIES
Management’s Discussion and Analysis
Investment Banking
Our Investment Banking segment is comprised of:
Financial Advisory.Includes strategic advisory assignments with respect to mergers and acquisitions, divestitures, corporate defense activities, restructurings, spin-offs, risk management restructurings and spin-offs, and derivative transactions directly related to these client advisory assignments.
Underwriting.Includes public offerings and private placements, including local and cross-border transactions, of a wide range of securities, loans and other financial instruments, and derivative transactions directly related to these client underwriting activities.
The table below presents the operating results of our Investment Banking segment.
| Year Ended December | Year Ended December | |||||||||||||||||||||||
| in millions | 2011 | 2010 | 2009 | |||||||||||||||||||||
| $ in millions | 2014 | 2013 | 2012 | |||||||||||||||||||||
Financial Advisory | $ | 1,987 | $ | 2,062 | $ | 1,897 | $2,474 | $1,978 | $1,975 | |||||||||||||||
Equity underwriting | 1,085 | 1,462 | 1,797 | 1,750 | 1,659 | 987 | ||||||||||||||||||
Debt underwriting | 1,283 | 1,286 | 1,290 | 2,240 | 2,367 | 1,964 | ||||||||||||||||||
Total Underwriting | 2,368 | 2,748 | 3,087 | 3,990 | 4,026 | 2,951 | ||||||||||||||||||
Total net revenues | 4,355 | 4,810 | 4,984 | 6,464 | 6,004 | 4,926 | ||||||||||||||||||
Operating expenses | 2,962 | 3,511 | 3,482 | 3,688 | 3,479 | 3,333 | ||||||||||||||||||
Pre-tax earnings | $ | 1,393 | $ | 1,299 | $ | 1,502 | $2,776 | $2,525 | $1,593 | |||||||||||||||
The table below presents our financial advisory and underwriting transaction volumes. 1
| Year Ended December | Year Ended December | |||||||||||||||||||||||
| in billions | 2011 | 2010 | 2009 | |||||||||||||||||||||
| $ in billions | 2014 | 2013 | 2012 | |||||||||||||||||||||
Announced mergers and acquisitions | $ | 638 | $ | 494 | $ | 543 | $1,002 | $ 620 | $ 745 | |||||||||||||||
Completed mergers and acquisitions | 635 | 436 | 593 | 659 | 632 | 575 | ||||||||||||||||||
Equity and equity-related offerings 2 | 55 | 67 | 84 | 78 | 91 | 58 | ||||||||||||||||||
Debt offerings 3 | 203 | 234 | 256 | 268 | 280 | 243 | ||||||||||||||||||
| 1. | Source: Thomson Reuters. Announced and completed mergers and acquisitions volumes are based on full credit to each of the advisors in a transaction. Equity and equity-related offerings and debt offerings are based on full credit for single book managers and equal credit for joint book managers. Transaction volumes may not be indicative of net revenues in a given period. In addition, transaction volumes for prior periods may vary from amounts previously reported due to the subsequent withdrawal or a change in the value of a transaction. |
| 2. | Includes Rule 144A and public common stock offerings, convertible offerings and rights offerings. |
| 3. | Includes non-convertible preferred stock, mortgage-backed securities, asset-backed securities and taxable municipal debt. Includes publicly registered and Rule 144A issues. Excludes leveraged loans. |
20112014 versus 2010.2013.Net revenues in Investment Banking were $4.36$6.46 billion for 2011, 9% lower2014, 8% higher than 2010.2013.
Net revenues in Financial Advisory were $1.99$2.47 billion, 4% lower25% higher than 2010.2013, reflecting an increase in industry-wide completed mergers and acquisitions, primarily in the United States. Net revenues in our Underwriting business were $2.37$3.99 billion, 14% lower than 2010, reflecting significantly lower net revenues in equity underwriting, principally due toessentially unchanged compared with a decline instrong 2013, as industry-wide activity.activity levels remained high. Net revenues in debt underwriting were essentially unchangedslightly lower compared with 2010.2013, reflecting lower net revenues from commercial mortgage-related activity, while net revenues in equity underwriting were slightly higher, principally from initial public offerings.
During 2014, Investment Banking operated in an environment generally characterized by significant declinesstrong industry-wide underwriting activity in both equity and debt, and an increase in industry-wide underwriting andcompleted mergers and acquisitions activity levels duringcompared with 2013. Industry-wide announced mergers and acquisitions activity significantly increased compared with 2013. In the second half of 2011. These declines reflected increased concerns regarding the weakened state of global economies, including heightened European sovereign debt risk, which contributed to a significant widening in credit spreads, a sharp increase in volatility levelsfuture, if market conditions become less favorable, and a significant decline in global equity markets during the second half of 2011. If these concerns continue or if equity markets decline further, resulting in lower levels of client activity levels broadly decline, net revenues in Investment Banking would likely continue to be negatively impacted.
OurDuring 2014, our investment banking transaction backlog increased significantly due to a significant increase in estimated net revenues from potential advisory transactions. Estimated net revenues from potential underwriting transactions were lower compared with the end of 2010. The increase compared with the end of 2010 was due to an increase2013, as a significant decrease in estimated net revenues from potential equity underwriting transactions, primarily reflectingparticularly in initial public offerings, was partially offset by an increase in client mandates to underwrite initial public offerings. Estimatedestimated net revenues from potential debt underwriting transactions, decreased slightly compared with the end of 2010. Estimated net revenues from potential advisory transactions were essentially unchanged compared with the end of 2010.reflecting increases across most products.
| Goldman Sachs | 59 |
THE GOLDMAN SACHS GROUP, INC. AND SUBSIDIARIES
Management’s Discussion and Analysis
Our investment banking transaction backlog represents an estimate of our future net revenues from investment banking transactions where we believe that future revenue realization is more likely than not. We believe changes in our investment banking transaction backlog may be a useful indicator of client activity levels which, over the long term, impact our net revenues. However, the timeframetime frame for completion and corresponding revenue recognition of transactions in our backlog varies based on the nature of the assignment, as certain transactions may remain in our backlog for longer periods of time and others may enter and leave within the same reporting period. In addition, our transaction backlog is subject to certain limitations, such as assumptions about the likelihood that individual client transactions will occur in the future. Transactions may be cancelled or modified, and transactions not included in the estimate may also occur.
Operating expenses were $2.96$3.69 billion for 2011, 16% lower2014, 6% higher than 2010,2013, primarily due to decreasedincreased compensation and benefits expenses, primarily resulting from lowerreflecting higher net revenues. Pre-tax earnings were $1.39$2.78 billion in 2011, 7%2014, 10% higher than 2010.2013.
20102013 versus 2009.2012. Net revenues in Investment Banking were $4.81$6.00 billion for 2010, 3% lower2013, 22% higher than 2009.2012.
Net revenues in Financial Advisory were $2.06$1.98 billion, 9%essentially unchanged compared with 2012. Net revenues in Underwriting were $4.03 billion, 36% higher than 2009, primarily2012, due to strong net revenues in both equity and debt underwriting. Net revenues in equity underwriting were significantly higher compared with 2012, reflecting an increase in client activity. Net revenuesactivity, particularly in our Underwriting business were $2.75 billion, 11% lower than 2009, reflecting lower net revenues in equity underwriting, principally due to a decline in client activity in comparison to 2009, which included significant capital-raising activity by financial institution clients.initial public offerings. Net revenues in debt underwriting were essentially unchangedsignificantly higher compared with 2009.2012, principally due to leveraged finance activity.
During 2010,2013, Investment Banking operated in an environment generally characterized by a continuation of low levels ofimproved industry-wide equity underwriting activity, particularly in initial public offerings, as global equity prices significantly increased during the year. In addition, industry-wide debt underwriting activity remained solid, and included significantly higher leveraged finance activity, as interest rates remained low. However, ongoing macroeconomic concerns continued to weigh on investment banking activity as industry-wide mergers and acquisitions activity reflecting heightened uncertainty regarding the global economic outlook. Although certain additional unfavorable market conditions emerged in the first half of 2010, including lower equity prices and wider corporate credit spreads, interest rates remained low throughout the year and underwriting activity improved during the second half of the year as global equity prices recovered and corporate credit spreads narrowed.declined compared with 2012.
OurDuring 2013, our investment banking transaction backlog decreased compared with the end of 2009.increased significantly due to significantly higher estimated net revenues from both potential advisory transactions and potential underwriting transactions. The decrease compared with the end of 2009 reflected a declineincrease in underwriting reflects significantly higher estimated net revenues from potential equity underwriting transactions, primarily in initial public offerings, and higher estimated net revenues from potential debt and equity underwriting transactions, primarily related to client mandates to underwriteprincipally from leveraged finance transactions and common stock offerings. This decrease was partially offset by an increase in estimated net revenues from potential advisory transactions.activity.
Operating expenses were $3.51$3.48 billion for 2010, essentially unchanged2013, 4% higher than 2012, due to increased compensation and benefits expenses, primarily resulting from 2009.higher net revenues. Pre-tax earnings were $1.30$2.53 billion in 2010, 14% lower2013, 59% higher than 2009.2012.
| 60 | Goldman Sachs 2014 Form 10-K |
THE GOLDMAN SACHS GROUP, INC. AND SUBSIDIARIES
Management’s Discussion and Analysis
Institutional Client Services
Our Institutional Client Services segment is comprised of:
Fixed Income, Currency and Commodities Client Execution.Includes client execution activities related to making markets in interest rate products, credit products, mortgages, currencies and commodities.
We generate market-making revenues in these activities, in three ways:
| Ÿ |
|
| Ÿ |
|
| Ÿ |
|
Given the focus on the mortgage market, our mortgage activities are further described below.
Our activities in mortgages include commercial mortgage-related securities, loans and derivatives, residential mortgage-related securities, loans and derivatives (including U.S. government agency-issued collateralized mortgage obligations, other prime, subprime and Alt-A securities and loans), and other asset-backed securities, loans and derivatives.
Currencies. Most currencies, including growth-market currencies. |
| Ÿ | Commodities. Crude oil and petroleum products, natural gas, base, precious and other metals, electricity, coal, agricultural and other commodity products. |
THE GOLDMAN SACHS GROUP, INC. AND SUBSIDIARIES
Management’s Discussion and Analysis
We buy, hold and sell long and short mortgage positions, primarily for market making for our clients. Our inventory therefore changes based on client demands and is generally held for short-term periods.
See Notes 18 and 27 to the consolidated financial statements in Part II, Item 8 of this Form 10-K for information about exposure to mortgage repurchase requests, mortgage rescissions and mortgage-related litigation.
Equities. Includes client execution activities related to making markets in equity products as well asand commissions and fees from executing and clearing institutional client transactions on major stock, options and futures exchanges worldwide.worldwide, as well as OTC transactions. Equities also includes our securities services business, which provides financing, securities lending and other prime brokerage services to institutional clients, including hedge funds, mutual funds, pension funds and foundations, and generates revenues primarily in the form of interest rate spreads or fees, and revenues related to our insurance activities.fees.
The table below presents the operating results of our Institutional Client Services segment.
| Year Ended December | Year Ended December | |||||||||||||||||||||||
| in millions | 2011 | 2010 | 2009 | |||||||||||||||||||||
| $ in millions | 2014 | 2013 | 2012 | |||||||||||||||||||||
Fixed Income, Currency and Commodities Client Execution | $ | 9,018 | $ | 13,707 | $ | 21,883 | $ 8,461 | $ 8,651 | $ 9,914 | |||||||||||||||
Equities client execution | 3,031 | 3,231 | 5,237 | |||||||||||||||||||||
Equities client execution 1 | 2,079 | 2,594 | 3,171 | |||||||||||||||||||||
Commissions and fees | 3,633 | 3,426 | 3,680 | 3,153 | 3,103 | 3,053 | ||||||||||||||||||
Securities services | 1,598 | 1,432 | 1,919 | 1,504 | 1,373 | 1,986 | ||||||||||||||||||
Total Equities | 8,262 | 8,089 | 10,836 | 6,736 | 7,070 | 8,210 | ||||||||||||||||||
Total net revenues | 17,280 | 21,796 | 32,719 | 15,197 | 15,721 | 18,124 | ||||||||||||||||||
Operating expenses | 12,697 | 14,291 | 13,691 | 10,880 | 11,792 | 12,490 | ||||||||||||||||||
Pre-tax earnings | $ | 4,583 | $ | 7,505 | $ | 19,028 | $ 4,317 | $ 3,929 | $ 5,634 | |||||||||||||||
| 1. | Net revenues related to the Americas reinsurance business were $317 million for 2013 and $1.08 billion for 2012. In April 2013, we completed the sale of a majority stake in our Americas reinsurance business and no longer consolidate this business. |
| Goldman Sachs 2014 Form 10-K | 61 |
THE GOLDMAN SACHS GROUP, INC. AND SUBSIDIARIES
2011Management’s Discussion and Analysis
2014 versus 2010.2013.Net revenues in Institutional Client Services were $17.28$15.20 billion for 2011, 21%2014, 3% lower than 2010.2013. Results for 2014 included a gain of $289 million ($270 million of which was recorded at extinguishment in the third quarter) related to the extinguishment of certain of our junior subordinated debt, of which $168 million was included in Fixed Income, Currency and Commodities Client Execution and $121 million in Equities ($30 million and $91 million included in equities client execution and securities services, respectively).
Net revenues in Fixed Income, Currency and Commodities Client Execution were $9.02$8.46 billion for 2011, 34%2014, 2% lower than 2010. Although activity2013. Excluding the gain related to the extinguishment of debt in 2014 and a gain of $211 million on the sale of a majority stake in our European insurance business in 2013, net revenues in Fixed Income, Currency and Commodities Client Execution were slightly lower compared with 2013. This decline reflected significantly lower net revenues in credit products and slightly lower net revenues in both interest rate products and mortgages. The decrease in credit products primarily reflected difficult market-making conditions, particularly during the second half of 2014, and generally low levels during 2011 were generally consistent with 2010 levels, andof activity. These results were solidlargely offset by significantly higher net revenues in commodities and higher net revenues in currencies. The increase in commodities reflected more favorable market-making conditions in certain energy products, primarily during the first quarter of 2011,2014. The increase in currencies reflected a stronger performance towards the environment duringend of the remainder of 2011year, as activity levels improved and volatility was characterized by broad market concerns and uncertainty, resulting in volatile markets and significantly wider credit spreads, which contributed to difficult market-making conditions and led to reductions in risk by us and our clients. As a result of these conditions, net revenues across the franchise were lower, including significant declines in mortgages and credit products, compared with 2010.higher.
Net revenues in Equities were $8.26$6.74 billion for 2011, 2% higher2014, 5% lower than 2010. During 2011, average volatility levels increased2013. Excluding the gain related to the extinguishment of debt in 2014 and equity prices in Europe and Asia declined significantly, particularly during the third quarter. The increase in net revenues of $317 million related to the sale of a majority stake in our Americas reinsurance business in 2013, net revenues in Equities were slightly lower compared with 2013. This decline reflected lower net revenues in derivatives, partially offset by slightly higher commissions and fees primarily due toand slightly higher transaction volumes, particularly during the third quarter of 2011. In addition, net revenues in securities services. The increase in securities services increased compared with 2010, reflectingnet revenues reflected the impact of higher average customer balances. EquitiesThe increase in commissions and fees was due to higher commissions and fees in both Europe and the United States, reflecting generally higher client execution net revenues were lower than 2010, primarily reflecting significantly lower net revenuesactivity, consistent with increases in shares.listed cash equity market volumes in these regions.
The net gain attributable to the impact of changes in our own credit spreads on borrowings for which the fair value option was elected was $596$144 million ($108 million and $198$36 million related to Fixed Income, Currency and Commodities Client Execution and equities client execution, respectively) for 20112014, compared with a net loss of $296 million ($220 million and 2010, respectively.$76 million related to Fixed Income, Currency and Commodities Client Execution and equities client execution, respectively) for 2013.
During 2014, Institutional Client Services operatedcontinued to operate in ana challenging environment, as economic uncertainty contributed to subdued risk appetite for our clients and generally characterized bylow levels of activity, particularly in credit products, interest rate products and mortgages. In addition, volatility levels remained low, although volatility increased concerns regardingin certain businesses towards the weakened stateend of global economies, including heightened European sovereign debt risk, and its impact on the European banking system and global financial institutions. These conditionsyear. Debt markets were also impacted expectations for economic prospectsby the widening of high-yield credit spreads and the decline in the U.S. and were reflected in equity and debt markets more broadly. In addition, the downgrade in credit ratings of the U.S. government and federal agencies and many financial institutionsoil prices during the second half of 2011the year, which contributed to further uncertaintylow liquidity, particularly in credit. Equity markets, however, generally increased during the markets. These concerns, as well as other broad market concerns, such as uncertainty over financial regulatory reform, continued to have a negative impact on our net revenues during 2011.year. If thesemacroeconomic concerns continue over the long term and market-making conditionsactivity levels remain challenging,low, net revenues in Fixed Income, Currency and Commodities Client Execution and Equities would likely continue to be negatively impacted.
Operating expenses were $12.70$10.88 billion for 2011, 11%2014, 8% lower than 2010,2013, due to decreased compensation and benefits expenses, primarily resulting fromreflecting lower net revenues, the impactlower net provisions for litigation and regulatory proceedings, and lower expenses as a result of the U.K. bank payroll tax during 2010, as well as an impairmentsale of a majority stake in our NYSE DMM rights of $305 million during 2010. These decreases were partially offset by higher brokerage, clearing, exchange and distribution fees, principally reflecting higher transaction volumes in Equities.Americas reinsurance business. Pre-tax earnings were $4.58$4.32 billion in 2011, 39% lower2014, 10% higher than 2010.2013.
| 62 | Goldman Sachs |
THE GOLDMAN SACHS GROUP, INC. AND SUBSIDIARIES
Management’s Discussion and Analysis
20102013 versus 2009.2012.Net revenues in Institutional Client Services were $21.80$15.72 billion for 2010, 33%2013, 13% lower than 2009.2012.
Net revenues in Fixed Income, Currency and Commodities Client Execution were $13.71$8.65 billion for 2010, 37%2013, 13% lower than a particularly strong 2009. During 2010, Fixed Income, Currency and Commodities Client Execution operated in a challenging environment characterized by lower client activity levels, which reflected broad market concerns including European sovereign debt risk and uncertainty over regulatory reform, as well as tighter bid/offer spreads. The decrease in net revenues compared with 2009 primarily reflected significantly lower results in interest rate products, credit products, commodities and, to a lesser extent, currencies. These decreases were partially offset by higher net revenues in mortgages, as 2009 included approximately $1 billion of losses related to commercial mortgage loans.
Net revenues in Equities were $8.09 billion for 2010, 25% lower than 2009, primarily2012, reflecting significantly lower net revenues in interest rate products compared with a solid 2012, and significantly lower net revenues in mortgages compared with a strong 2012. The decrease in interest rate products and mortgages primarily reflected the impact of a more challenging environment and lower activity levels compared with 2012. In addition, net revenues in currencies were slightly lower, while net revenues in credit products and commodities were essentially unchanged compared with 2012. In December 2013, we completed the sale of a majority stake in our European insurance business and recognized a gain of $211 million.
Net revenues in Equities were $7.07 billion for 2013, 14% lower compared with 2012, due to the sale of our Americas reinsurance business1 in 2013 and the sale of our hedge fund administration business in 2012. Net revenues in equities client execution principally due to(excluding net revenues from our Americas reinsurance business) were higher compared with 2012, including significantly higher net revenues in cash products, partially offset by significantly lower resultsnet revenues in derivatives and shares.derivatives. Commissions and fees were alsoslightly higher compared with 2012, reflecting higher commissions and fees in Asia and Europe, partially offset by lower than 2009, primarily reflectingcommissions and fees in the United States. Our average daily volumes during 2013 were higher in Asia and Europe and lower client activity levels. In addition, securitiesin the United States compared with 2012, consistent with listed cash equity market volumes. Securities services net revenues were significantly lower compared with 2009,2012, primarily reflecting tighter securities lending spreads, principally due to the impactsale of changesour hedge fund administration business in the composition2012 (2012 included a gain on sale of customer balances, partially offset$494 million). During 2013, Equities operated in an environment characterized by the impact of higher average customer balances. During 2010, although equity markets were volatile during the first half of the year,a significant increase in global equity prices, particularly in Japan and the U.S., and generally improved andlower volatility levels declined in the second half of the year.levels.
The net gain/(loss)loss attributable to the impact of changes in our own credit spreads on borrowings for which the fair value option was elected was $198$296 million ($220 million and $(1.10) billion$76 million related to Fixed Income, Currency and Commodities Client Execution and equities client execution, respectively) for 20102013, compared with a net loss of $714 million ($433 million and 2009, respectively.$281 million related to Fixed Income, Currency and Commodities Client Execution and equities client execution, respectively) for 2012.
Results inDuring 2013, Institutional Client Services operated in a challenging environment that required continual reassessment of the outlook for 2010 were negatively impacted by a general decrease in client activity levels from very strong levels seen in 2009. Certain unfavorable conditions emerged during the second quarter of 2010 that madeglobal economy, as uncertainty about when the environment more challenging for our businesses, resulting in lower client activity levels. These conditions included broad market concerns, suchU.S. Federal Reserve would begin tapering its asset purchase program, as
European sovereign debt well as constant global political risk and uncertainty, regarding financial regulatory reform, sharply higher equity volatilitywere interspersed with improvements in the U.S. economy over the course of the year. As a result, our clients’ risk appetite and activity levels fluctuated during 2013. Compared with 2012, activity levels were generally lower, global equity prices significantly increased and wider corporate credit spreads. During the second half of 2010, some of these conditions reversed as equity volatility levels decreased, global equity prices recovered, corporate credit spreads narrowed and commercial real estate asset prices began to improve. However, lower client activity levels, reflecting broad market concerns, including European sovereign debt risk and uncertainty over regulatory reform, continued to negatively impact our results. In addition, bid/offer spreads remained tight relative to 2009, as financial markets continued to stabilize, the availability of funding improved and volatility levels in both corporate credit spreads and commodity prices declined.tightened.
Operating expenses were $14.29$11.79 billion for 2010, 4% higher2013, 6% lower than 2009,2012, due to the impactdecreased compensation and benefits expenses, primarily resulting from lower net revenues, and lower expenses as a result of the U.K. bank payroll tax, as well as an impairmentsale of a majority stake in our NYSE DMM rights of $305 million.Americas reinsurance business in April 2013. These increasesdecreases were partially offset by lower compensationincreased net provisions for litigation and benefits expenses, resulting from lower levelsregulatory proceedings, primarily comprised of discretionary compensation.net provisions for mortgage-related matters, and higher brokerage, clearing, exchange and distribution fees. Pre-tax earnings were $7.51$3.93 billion in 2010, 61%2013, 30% lower than 2009.2012.
| 1. | Net revenues related to the Americas reinsurance business were $317 million for 2013 and $1.08 billion for 2012. In April 2013, we completed the sale of a majority stake in our Americas reinsurance business and no longer consolidate this business. |
| Goldman Sachs 2014 Form 10-K | 63 |
THE GOLDMAN SACHS GROUP, INC. AND SUBSIDIARIES
Management’s Discussion and Analysis
Investing & Lending
Investing & Lending includes our investing activities and the origination of loans to provide financing to clients. These investments and loans are typically longer-term in nature. We make investments, some of which are consolidated, directly and indirectly through funds that we manage, in debt securities and loans, public and private equity securities, and real estate consolidated investment entities and power generation facilities.entities.
The table below presents the operating results of our Investing & Lending segment.
| Year Ended December | Year Ended December | |||||||||||||||||||||||
| in millions | 2011 | 2010 | 2009 | |||||||||||||||||||||
ICBC | $ | (517 | ) | $ | 747 | $ | 1,582 | |||||||||||||||||
Equity securities (excluding ICBC) | 1,120 | 2,692 | (596 | ) | ||||||||||||||||||||
| $ in millions | 2014 | 2013 | 2012 | |||||||||||||||||||||
Equity securities | $3,813 | $3,930 | $2,800 | |||||||||||||||||||||
Debt securities and loans | 96 | 2,597 | 1,045 | 2,165 | 1,947 | 1,850 | ||||||||||||||||||
Other 1 | 1,443 | 1,505 | 832 | 847 | 1,141 | 1,241 | ||||||||||||||||||
Total net revenues | 2,142 | 7,541 | 2,863 | 6,825 | 7,018 | 5,891 | ||||||||||||||||||
Operating expenses | 2,673 | 3,361 | 3,523 | 2,819 | 2,686 | 2,668 | ||||||||||||||||||
Pre-tax earnings/(loss) | $ | (531 | ) | $ | 4,180 | $ | (660 | ) | ||||||||||||||||
Pre-tax earnings | $4,006 | $4,332 | $3,223 | |||||||||||||||||||||
| 1. |
|
2014 versus 2013. Net revenues in Investing & Lending were $6.83 billion for 2014, 3% lower than 2013. Net gains from investments in equity securities were slightly lower due to a significant decrease in net gains from investments in public equities, as movements in global equity prices during 2014 were less favorable compared with 2013, partially offset by an increase in net gains from investments in private equities, primarily driven by company-specific events. Net revenues from debt securities and loans were higher than 2013, reflecting a significant increase in net interest income, primarily driven by increased lending, and a slight increase in net gains, primarily due to sales of certain investments during 2014. Other net revenues, related to our consolidated investments, were significantly lower compared with 2013, reflecting a decrease in operating revenues from commodities-related consolidated investments.
During 2014, net revenues in Investing & Lending generally reflected favorable company-specific events, including initial public offerings and financings, and strong corporate performance, as well as net gains from sales of certain investments. However, concerns about the outlook for the global economy and uncertainty over the impact of financial regulatory reform continue to be meaningful considerations for the global marketplace. If equity markets decline or credit spreads widen, net revenues in Investing & Lending would likely be negatively impacted.
Operating expenses were $2.82 billion for 2014, 5% higher than 2013, reflecting higher compensation and benefits expenses, partially offset by lower expenses related to consolidated investments. Pre-tax earnings were $4.01 billion in 2014, 8% lower than 2013.
2013 versus 2012. Net revenues in Investing & Lending were $7.02 billion for 2013, 19% higher than 2012, reflecting a significant increase in net gains from investments in equity securities, driven by company-specific events and stronger corporate performance, as well as significantly higher global equity prices. In addition, net gains and net interest income from debt securities and loans were slightly higher, while other net revenues, related to our consolidated investments, were lower compared with 2012.
During 2013, net revenues in Investing & Lending generally reflected favorable company-specific events and strong corporate performance, as well as the impact of significantly higher global equity prices and tighter corporate credit spreads.
Operating expenses were $2.69 billion for 2013, essentially unchanged compared with 2012. Operating expenses during 2013 included lower impairment charges and lower operating expenses related to consolidated investments, partially offset by increased compensation and benefits expenses due to higher net revenues compared with 2012. Pre-tax earnings were $4.33 billion in 2013, 34% higher than 2012.
| Goldman Sachs |
THE GOLDMAN SACHS GROUP, INC. AND SUBSIDIARIES
Management’s Discussion and Analysis
2011 versus 2010.Net revenues in Investing & Lending were $2.14 billion and $7.54 billion for 2011 and 2010, respectively. During 2011, Investing & Lending results reflected an operating environment characterized by a significant decline in equity markets in Europe and Asia, and unfavorable credit markets that were negatively impacted by increased concerns regarding the weakened state of global economies, including heightened European sovereign debt risk. Results for 2011 included a loss of $517 million from our investment in the ordinary shares of ICBC and net gains of $1.12 billion from other investments in equities, primarily in private equity positions, partially offset by losses from public equities. In addition, Investing & Lending included net revenues of $96 million from debt securities and loans. This amount includes approximately $1 billion of unrealized losses related to relationship lending activities, including the effect of hedges, offset by net interest income and net gains from other debt securities and loans. Results for 2011 also included other net revenues of $1.44 billion, principally related to our consolidated entities held for investment purposes. If equity markets decline further and credit spreads widen further, net revenues in Investing & Lending would likely continue to be negatively impacted.
Operating expenses were $2.67 billion for 2011, 20% lower than 2010, due to decreased compensation and benefits expenses, primarily resulting from lower net revenues. This decrease was partially offset by the impact of impairment charges related to consolidated investments during 2011. Pre-tax loss was $531 million in 2011, compared with pre-tax earnings of $4.18 billion in 2010.
2010 versus 2009.Net revenues in Investing & Lending were $7.54 billion and $2.86 billion for 2010 and 2009, respectively. Results for 2010 included a gain of $747 million from our investment in the ordinary shares of ICBC, a net gain of $2.69 billion from other investments in equities, a net gain of $2.60 billion from debt securities and loans and other net revenues of $1.51 billion, principally related to our consolidated entities held for investment purposes. The net gain from other investments in equities was primarily driven by an increase in global equity markets, which resulted in appreciation of both our public and private equity positions and provided favorable conditions for initial public offerings. The net gains and net interest from debt securities and loans primarily reflected the impact of tighter credit spreads and favorable credit markets during the year, which provided favorable conditions for borrowers to refinance.
Results for 2009 included a gain of $1.58 billion from our investment in the ordinary shares of ICBC, a net gain of $1.05 billion from debt securities and loans, and other net revenues of $832 million, principally related to our consolidated entities held for investment purposes, partially offset by a net loss of $596 million from other investments in equities. During 2009, continued weakness in commercial real estate markets negatively impacted our results.
Operating expenses were $3.36 billion for 2010, 5% lower than 2009, due to the impact of significantly higher real estate impairment charges during 2009 related to consolidated entities held for investment purposes, as well as decreased compensation and benefits expenses, resulting from lower levels of discretionary compensation. Pre-tax earnings were $4.18 billion in 2010, compared with a pre-tax loss of $660 million for 2009.
Investment Management
Investment Management provides investment management services and offers investment products (primarily through separately managed accounts and commingled vehicles, such as mutual funds and private investment funds) across all major asset classes to a diverse set of institutional and individual clients. Investment Management also offers wealth advisory services, including portfolio management and financial counseling, and brokerage and other transaction services to high-net-worth individuals and families.
Assets under supervision include assets under management and other client assets. Assets under management include client assets where we earn a fee for managing assets on a discretionary basis. This includes net assets in our mutual funds, hedge funds, credit funds and private equity funds (including real estate funds), and separately managed accounts for institutional and individual investors. Other client assets include client assets invested with third-party managers, bank deposits and advisory relationships where we earn a fee for advisory and other services, but do not have investment discretion. Assets under supervision do not include the self-directed brokerage assets of our clients. Long-term assets under supervision represent assets under supervision excluding liquidity products. Liquidity products represent money markets and bank deposit assets.
Assets under supervision typically generate fees as a percentage of net asset value, which vary by asset class and are affected by investment performance as well as asset inflows and redemptions. Asset classes such as alternative investment and equity assets typically generate higher fees relative to fixed income and liquidity product assets. The average effective management fee (which excludes non-asset-based fees) we earned on our assets under supervision was 40 basis points for both 2014 and 2013, and 39 basis points for 2012.
In certain circumstances, we are also entitled to receive incentive fees based on a percentage of a fund’s or a separately managed account’s return, or when the return exceeds a specified benchmark or other performance targets. Incentive fees are recognized only when all material contingencies are resolved.
THE GOLDMAN SACHS GROUP, INC. AND SUBSIDIARIES
Management’s Discussion and Analysis
The table below presents the operating results of our Investment Management segment.
| Year Ended December | ||||||||||||
| in millions | 2011 | 2010 | 2009 | |||||||||
Management and other fees | $ | 4,188 | $ | 3,956 | $ | 3,860 | ||||||
Incentive fees | 323 | 527 | 180 | |||||||||
Transaction revenues | 523 | 531 | 567 | |||||||||
Total net revenues | 5,034 | 5,014 | 4,607 | |||||||||
Operating expenses | 4,018 | 4,051 | 3,673 | |||||||||
Pre-tax earnings | $ | 1,016 | $ | 963 | $ | 934 | ||||||
Assets under management include only client assets where we earn a fee for managing assets on a discretionary basis. This includes net assets in our mutual funds, hedge funds and private equity funds (including real estate funds), and separately managed accounts for institutional and individual investors. Assets under management do not include the self-directed assets of our clients, including brokerage accounts, or interest-bearing deposits held through our bank depository institution subsidiaries.
| Year Ended December | ||||||||||||
| $ in millions | 2014 | 2013 | 2012 | |||||||||
Management and other fees | $4,800 | $4,386 | $4,105 | |||||||||
Incentive fees | 776 | 662 | 701 | |||||||||
Transaction revenues | 466 | 415 | 416 | |||||||||
Total net revenues | 6,042 | 5,463 | 5,222 | |||||||||
Operating expenses | 4,647 | 4,357 | 4,296 | |||||||||
Pre-tax earnings | $1,395 | $1,106 | $ 926 | |||||||||
The tables below present our period-end assets under managementsupervision (AUS) by asset class and a summary of the changes in our assets under management.by distribution channel.
| As of December 31, | ||||||||||||
| in billions | 2011 | 2010 | 2009 | |||||||||
Alternative investments 1 | $ | 142 | $ | 148 | $ | 146 | ||||||
Equity | 126 | 144 | 146 | |||||||||
Fixed income | 340 | 340 | 315 | |||||||||
Total non-money market assets | 608 | 632 | 607 | |||||||||
Money markets | 220 | 208 | 264 | |||||||||
Total assets under management | $ | 828 | $ | 840 | $ | 871 | ||||||
| As of December | ||||||||||||
| $ in billions | 2014 | 2013 | 2012 | |||||||||
Assets under management | $1,027 | $ 919 | $ 854 | |||||||||
Other client assets | 151 | 123 | 111 | |||||||||
Total AUS | $1,178 | $1,042 | $ 965 | |||||||||
Asset Class | ||||||||||||
Alternative investments 1 | $ 143 | $ 142 | $ 151 | |||||||||
Equity | 236 | 208 | 153 | |||||||||
Fixed income | 516 | 446 | 411 | |||||||||
Long-term AUS | 895 | 796 | 715 | |||||||||
Liquidity products | 283 | 246 | 250 | |||||||||
Total AUS | $1,178 | $1,042 | $ 965 | |||||||||
Distribution Channel | ||||||||||||
Directly distributed: | ||||||||||||
Institutional | $ 412 | $ 363 | $ 343 | |||||||||
High-net-worth individuals | 363 | 330 | 294 | |||||||||
Third-party distributed: | ||||||||||||
Institutional, high-net-worth individuals and retail | 403 | 349 | 328 | |||||||||
Total AUS | $1,178 | $1,042 | $ 965 | |||||||||
| 1. | Primarily includes hedge funds, credit funds, private equity, real estate, currencies, commodities and asset allocation strategies. |
| Year Ended December 31, | ||||||||||||
| in billions | 2011 | 2010 | 2009 | |||||||||
Balance, beginning of year | $ | 840 | $ | 871 | $ | 798 | ||||||
Net inflows/(outflows) | ||||||||||||
Alternative investments | (5 | ) | (1 | ) | (5 | ) | ||||||
Equity | (9 | ) | (21 | ) | (2 | ) | ||||||
Fixed income | (15 | ) | 7 | 26 | ||||||||
Total non-money market net inflows/(outflows) | (29 | ) | (15 | ) | 19 | |||||||
Money markets | 12 | (56 | ) | (22 | ) | |||||||
Total net inflows/(outflows) | (17 | ) 1 | (71 | ) | (3 | ) | ||||||
Net market appreciation/(depreciation) | 5 | 40 | 76 | |||||||||
Balance, end of year | $ | 828 | $ | 840 | $ | 871 | ||||||
| Goldman Sachs 2014 Form 10-K | 65 |
THE GOLDMAN SACHS GROUP, INC. AND SUBSIDIARIES
Management’s Discussion and Analysis
The table below presents a summary of the changes in our assets under supervision.
| Year Ended December | ||||||||||||
| $ in billions | 2014 | 2013 | 2012 | |||||||||
Balance, beginning of year | $1,042 | $ 965 | $895 | |||||||||
Net inflows/(outflows) | ||||||||||||
Alternative investments | 1 | (13 | ) | 1 | ||||||||
Equity | 15 | 13 | (17 | ) | ||||||||
Fixed income | 58 | 41 | 34 | |||||||||
Long-term AUS net inflows/(outflows) | 74 | 41 | 2 | 18 | 3 | |||||||
Liquidity products | 37 | (4 | ) | 3 | ||||||||
Total AUS net inflows/(outflows) | 111 | 1 | 37 | 21 | ||||||||
Net market appreciation/(depreciation) | 25 | 40 | 49 | |||||||||
Balance, end of year | $1,178 | $1,042 | $965 | |||||||||
| 1. |
|
| 2. | Fixed income flows include $10 billion in assets managed by the firm related to our Americas reinsurance business, in which a majority stake was sold in April 2013, that were previously excluded from assets under supervision as they were assets of a consolidated subsidiary. |
| 3. | Includes $34 billion of fixed income asset inflows in connection with our acquisition of Dwight Asset Management Company LLC and $5 billion of fixed income and equity asset outflows related to our liquidation of Goldman Sachs |
The table below presents our average monthly assets under supervision by asset class.
Average for the Year Ended December | ||||||||||||
| $ in billions | 2014 | 2013 | 2012 | |||||||||
Alternative investments | $ 145 | $ 145 | $149 | |||||||||
Equity | 225 | 180 | 153 | |||||||||
Fixed income | 499 | 425 | 384 | |||||||||
Long-term AUS | 869 | 750 | 686 | |||||||||
Liquidity products | 248 | 235 | 238 | |||||||||
Total AUS | $1,117 | $ 985 | $924 | |||||||||
20112014 versus 2010.2013.Net revenues in Investment Management were $5.03$6.04 billion for 2011, essentially unchanged compared with 2010, primarily due to2014, 11% higher than 2013, reflecting higher management and other fees, reflecting favorable changes in the mix ofprimarily due to higher average assets under management, offset by lowersupervision, as well as higher incentive fees.fees and transaction revenues. During the year, total assets under management decreased $12supervision increased $136 billion to $828$1.18 trillion. Long-term assets under supervision increased $99 billion, reflectingincluding net outflowsinflows of $17$74 billion partially offset by(including $19 billion of fixed income asset inflows in connection with our acquisition of Deutsche Asset & Wealth Management’s stable value business) and net market appreciation of $5 billion. Net outflows$25 billion, both primarily reflected outflows in fixed income and equity assets, partially offset byassets. In addition, liquidity products increased $37 billion (including $6 billion of inflows in connection with our acquisition of RBS Asset Management’s money market assets.funds).
During the first half of 2011,2014, Investment Management operated in an environment generally characterized by improved asset prices, primarily in equity and a shiftfixed income assets, resulting in investorappreciation in the value of client assets. In addition, the mix of average assets awayunder supervision shifted slightly from money marketsliquidity products to long-term assets under supervision, due to growth in favor of asset classesfixed income and equity assets, compared with potentially higher risk and returns. However, during2013. In the second half of 2011,future, if asset prices declined, particularly in equities, in part driven by increased uncertainty regarding the global economic outlook. Declining asset prices and economic uncertainty contributed to investors shifting assets away from asset classes with potentially higher risk and returns to asset classes with lower risk and returns. If asset prices continuewere to decline, or investors continue to favor lower risk asset classes that typically generate lower fees or investors withdraw their assets, net revenues in Investment Management would likely continue to be negatively impacted. In addition, concerns about the global economic outlook could result in downward pressure on assets under supervision.
Operating expenses were $4.02$4.65 billion for 2011, essentially unchanged compared with 2010.2014, 7% higher than 2013, primarily due to increased compensation and benefits expenses, reflecting higher net revenues, and higher fund distribution fees. Pre-tax earnings were $1.02$1.40 billion in 2011, 6%2014, 26% higher than 2010.
THE GOLDMAN SACHS GROUP, INC. AND SUBSIDIARIES
2013.
Management’s Discussion and Analysis
20102013 versus 2009.2012.Net revenues in Investment Management were $5.01$5.46 billion for 2010, 9%2013, 5% higher than 2009, primarily2012, reflecting higher incentive fees across our alternative investment products. Managementmanagement and other fees, also increased, reflecting favorable changes in the mix ofprimarily due to higher average assets under management, as well as the impact of appreciation in the value of client assets.supervision. During 2010,2013, total assets under management decreased 4%supervision increased $77 billion to $840$1.04 trillion. Long-term assets under supervision increased $81 billion, primarilyincluding net inflows of $41 billion (including $10 billion of fixed income asset inflows managed by the firm related to our Americas reinsurance business, in which a majority stake was sold in April 2013, that were previously excluded from assets under supervision as they were assets of a consolidated subsidiary), reflecting inflows in fixed income and equity assets, partially offset by outflows in moneyalternative investment assets. Net market assets, consistent with industry trends.appreciation of $40 billion during 2013 was primarily in equity assets. Liquidity products decreased $4 billion.
During 2010,2013, Investment Management operated in an environment generally characterized by a continuation of industry trends that emerged during 2009, as financial markets began to stabilize,improved asset prices, improved and investors began to shift assets away from money marketsparticularly in favor of asset classes with potentially higher risk and returns. This trend resultedequities, resulting in favorable changes in the mix of assets under management, as well as appreciation in the value of client assets. In addition, the mix of average assets under supervision shifted slightly compared with 2012 from liquidity products to long-term assets under supervision, primarily due to growth in equity and fixed income assets.
Operating expenses were $4.05$4.36 billion for 2010, 10%2013, up slightly compared to 2012, due to increased compensation and benefits expenses, primarily resulting from higher than 2009, primarily reflecting increased staff levels and the impact of growth initiatives.net revenues. Pre-tax earnings were $963 million$1.11 billion in 2010, 3%2013, 19% higher than 2009.2012.
Geographic Data
See Note 25 to the consolidated financial statements in Part II, Item 8 of this Form 10-K for a summary of our total net revenues, pre-tax earnings and net earnings by geographic region.
Regulatory Developments
The U.S. Dodd-Frank Wall Street Reform and Consumer Protection Act (Dodd-Frank Act), enacted in July 2010, significantly altered the financial regulatory regime within which we operate. The implications of the Dodd-Frank Act for our businesses will depend to a large extent on the rules that will be adopted by the Board of Governors of the Federal Reserve System (Federal Reserve Board), the Federal Deposit Insurance Corporation (FDIC), the SEC, the U.S. Commodity Futures Trading Commission (CFTC) and other agencies to implement the legislation, as well as the development of market practices and structures under the regime established by the legislation and the implementing rules. Similar reforms are being considered by other regulators and policy makers worldwide and these reforms may affect our businesses. We expect that the principal areas of impact from regulatory reform for us will be:
|
|
|
THE GOLDMAN SACHS GROUP, INC. AND SUBSIDIARIES
Management’s Discussion and Analysis
In October 2011, the proposed rules to implement the Volcker Rule were issued and included an extensive request for comments on the proposal. The proposed rules are highly complex and many aspects of the Volcker Rule remain unclear. The full impact of the rule will depend upon the detailed scope of the prohibitions, permitted activities, exceptions and exclusions, and the full impact on the firm will not be known with certainty until the rules are finalized.
While many aspects of the Volcker Rule remain unclear, we evaluated the prohibition on “proprietary trading” and determined that businesses that engage in “bright line” proprietary trading are most likely to be prohibited. In 2011 and 2010, we liquidated substantially all of our Principal Strategies and global macro proprietary trading positions.
In addition, we evaluated the limitations on sponsorship of, and investments in, hedge funds and private equity funds. The firm earns management fees and incentive fees for investment management services from private equity and hedge funds, which are included in our Investment Management segment. The firm also makes investments in funds and the gains and losses from such investments are included in our Investing & Lending segment; these gains and losses will be impacted by the Volcker Rule. The Volcker Rule limitation on investments in hedge funds and private equity funds requires the firm to reduce its investment in each private equity and hedge fund to 3% or less of net asset value, and to reduce the firm’s aggregate investment in all such funds to 3% or less of the firm’s Tier 1 capital. Over the period from 1999 through 2011, the firm’s aggregate net revenues from its investments in hedge funds and private equity funds were not material to the firm’s aggregate total net revenues over the same period. We continue to manage our existing private equity funds taking into account the transition periods under the Volcker Rule. With respect to our hedge funds, we currently plan to comply with the Volcker Rule by redeeming certain of our interests in the funds. We currently expect to redeem up to approximately 10% of certain hedge funds’ total redeemable units per quarter over ten consecutive quarters, beginning March 2012 and ending June 2014. In addition, we have limited the firm’s initial investment to 3% for certain new funds.
As required by the Dodd-Frank Act, the Federal Reserve Board and FDIC have jointly issued a rule requiring each bank holding company with over $50 billion in assets and each designated systemically important financial institution to provide to regulators an annual plan for its rapid and orderly resolution in the event of material financial distress or failure (resolution plan). Our resolution plan must, among other things, ensure that Goldman Sachs Bank USA (GS Bank USA) is adequately protected from risks arising from our other entities. The regulators’ joint rule sets specific standards for the resolution plans, including requiring a detailed resolution strategy and analyses of the company’s material entities, organizational structure, interconnections and interdependencies, and management information systems, among other elements. We have commenced work on our first resolution plan, which we must submit to the regulators by July 1, 2012. GS Bank USA is also required by the FDIC to submit a plan for its rapid and orderly resolution in the event of material financial distress or failure by July 1, 2012.
In September 2011, the SEC proposed rules to implement the Dodd-Frank Act’s prohibition against securitization participants’ engaging in any transaction that would involve or result in any material conflict of interest with an investor in a securitization transaction. The proposed rules would except bona fide market-making activities and risk-mitigating hedging activities in connection with securitization activities from the general prohibition.
In December 2011, the Federal Reserve Board proposed regulations designed to strengthen the regulation and supervision of large bank holding companies and systemically important nonbank financial firms. These proposals address risk-based capital and leverage requirements, liquidity requirements, stress tests, single counterparty limits and early remediation requirements that are designed to address financial weakness at an early stage. Although many of the proposals mirror initiatives to which bank holding companies are already subject, their full impact on the firm will not be known with certainty until the rules are finalized.
| 66 | Goldman Sachs |
THE GOLDMAN SACHS GROUP, INC. AND SUBSIDIARIES
Management’s Discussion and Analysis
In addition, the U.S. federal bank regulatory agencies issued revised proposals to modify their market risk regulatory capital requirements for banking organizations in the United States that have significant trading activities. The modifications are designed to address the adjustments to the market risk framework that were announced by the Basel Committee in June 2010 (Basel 2.5), as well as the prohibition on the use of credit ratings, as required by the Dodd-Frank Act. We expect the federal banking agencies to propose further modifications to their capital adequacy regulations to address both Basel 3 and other aspects of the Dodd-Frank Act, including requirements for global systemically important banks. Once implemented, it is likely that these changes will result in increased capital requirements, although their full impact will not be known until the U.S. federal bank regulatory agencies publish their final rules.
The Dodd-Frank Act also establishes a Bureau of Consumer Financial Protection having broad authority to regulate providers of credit, payment and other consumer financial products and services, and this Bureau has oversight over certain of our products and services.
See “Business—Regulation” in Part I, Item 1 of this Form 10-K for more information.
Balance Sheet and Funding Sources
Balance Sheet Management
One of our most important risk management disciplines is our ability to manage the size and composition of our balance sheet. While our asset base changes due to client activity, market fluctuations and business opportunities, the size and composition of our balance sheet reflect (i) our overall risk tolerance, (ii) our ability to access stable funding sources and (iii) the amount of equity capital we hold. See “Equity Capital Management and Regulatory Capital — Equity Capital Management” for information about our equity capital management process.
Although our balance sheet fluctuates on a day-to-day basis, our total assets and adjusted assets at quarterly and year-end dates are generally not materially different from those occurring within our reporting periods.
In order to ensure appropriate risk management, we seek to maintain a liquid balance sheet and have processes in place to dynamically manage our assets and liabilities which include:
|
|
|
include (i) quarterly planning, (ii) business-specific limits, (iii) monitoring of key metrics and (iv) scenario analyses. |
Quarterly Planning. We prepare a quarterly balance sheet plan that combines our projected total assets and composition of assets with our expected funding sources and capital levels for the upcoming quarter. The objectives of this quarterly planning process are:
| Ÿ |
|
| Ÿ | To determine the target amount, tenor and type of funding to |
| Ÿ |
|
To prepare our quarterly balance sheet plan, business risk managers and managers from our independent control and support functions meet with business managers to review current and prior period metrics and discuss expectations for the upcoming quarter. The specific metrics reviewed include asset and liability size and composition, aged inventory, limit utilization, risk and performance measures, and capital usage.
Our consolidated quarterly plan, including our balance sheet plans by business, funding and capital projections, and projected capital and liquiditykey metrics, is reviewed by the Firmwide Finance Committee. See “Overview and Structure of Risk Management.”Management” for an overview of our risk management structure.
THE GOLDMAN SACHS GROUP, INC. AND SUBSIDIARIES
Management’s Discussion and Analysis
Business-Specific Limits. The Firmwide Finance Committee sets asset and liability limits for each business and aged inventory limits for certain financial instruments as a disincentive to hold inventory over longer periods of time. These limits are set at levels which are close to actual operating levels in order to ensure prompt escalation and discussion among business managers and managers in our independent control and support functions on a routine basis. The Firmwide Finance Committee reviews and approves balance sheet limits on a quarterly basis and may also approve changes in limits on an ad hoc basis in response to changing business needs or market conditions. Requests for changes in limits are evaluated after giving consideration to their impact on key firm metrics. Compliance with limits is monitored on a daily basis by business risk managers, as well as managers in our independent control and support functions.
Monitoring of Key Metrics. We monitor key balance sheet metrics daily both by business and on a consolidated basis, including asset and liability size and composition, aged inventory, limit utilization, risk measures and capital usage. We allocate assets to businesses and review and analyze movements resulting from new business activity as well as market fluctuations.
| Goldman Sachs 2014 Form 10-K | 67 |
THE GOLDMAN SACHS GROUP, INC. AND SUBSIDIARIES
Management’s Discussion and Analysis
Scenario Analyses. We conduct scenario analyses including as part of the Comprehensive Capital Analysis and Review (CCAR) and Dodd-Frank Act Stress Tests (DFAST) as well as our resolution and recovery planning. See “Equity Capital Management and Regulatory Capital — Equity Capital Management” below for further information. These scenarios cover short-term and long-term time horizons using various macroeconomic and firm-specific assumptions, based on a range of economic scenarios. We use these analyses to determine how we would manageassist us in developing our longer-term balance sheet management strategy, including the sizelevel and composition of our balance sheetassets, funding and maintainequity capital. Additionally, these analyses help us develop approaches for maintaining appropriate funding, liquidity and capital positions inacross a variety of situations:situations, including a severely stressed environment.
|
|
Balance Sheet Allocation
In addition to preparing our consolidated statementstatements of financial condition in accordance with U.S. GAAP, we prepare a balance sheet that generally allocates assets to our businesses, which is a non-GAAP presentation and may not be comparable to similar non-GAAP presentations used by other companies. We believe that presenting our assets on this basis is meaningful because it is consistent with the way management views and manages risks associated with the firm’s assets and better enables investors to assess the liquidity of the firm’s assets. The table below presents a summary of thisour balance sheet allocation.
| As of December | As of December | |||||||||||||||
| in millions | 2011 | 2010 | ||||||||||||||
Excess liquidity (Global Core Excess) | $ | 171,581 | $ | 174,776 | ||||||||||||
| $ in millions | 2014 | 2013 | ||||||||||||||
Global Core Liquid Assets (GCLA) | $182,947 | $184,070 | ||||||||||||||
Other cash | 7,888 | 7,565 | 7,805 | 5,793 | ||||||||||||
Excess liquidity and cash | 179,469 | 182,341 | ||||||||||||||
GCLA and cash | 190,752 | 189,863 | ||||||||||||||
Secured client financing | 283,707 | 279,291 | 210,641 | 263,386 | ||||||||||||
Inventory | 273,640 | 260,406 | 230,667 | 255,534 | ||||||||||||
Secured financing agreements | 71,103 | 70,921 | 74,767 | 79,635 | ||||||||||||
Receivables | 35,769 | 32,396 | 47,317 | 39,557 | ||||||||||||
Institutional Client Services | 380,512 | 363,723 | 352,751 | 374,726 | ||||||||||||
ICBC | 4,713 | 7,589 | ||||||||||||||
Equity (excluding ICBC) | 23,041 | 22,972 | ||||||||||||||
Debt | 23,311 | 24,066 | ||||||||||||||
Receivables and other | 5,320 | 3,291 | ||||||||||||||
Public equity | 4,041 | 4,308 | ||||||||||||||
Private equity | 17,979 | 16,236 | ||||||||||||||
Debt 1 | 24,768 | 23,274 | ||||||||||||||
Loans receivable 2 | 28,938 | 14,895 | ||||||||||||||
Other | 3,771 | 2,310 | ||||||||||||||
Investing & Lending | 56,385 | 57,918 | 79,497 | 61,023 | ||||||||||||
Total inventory and related assets | 436,897 | 421,641 | 432,248 | 435,749 | ||||||||||||
Other assets | 23,152 | 28,059 | 22,599 | 22,509 | ||||||||||||
Total assets | $ | 923,225 | $ | 911,332 | $856,240 | $911,507 | ||||||||||
| 1. | Includes $18.24 billion and $15.76 billion as of December 2014 and December 2013, respectively, of direct loans primarily extended to corporate and private wealth management clients that are accounted for at fair value. |
| 2. | See Note 9 to the consolidated financial statements for further information about loans receivable. |
Below is a description of the captions in the table above.
| Ÿ | Global Core Liquid Assets and Cash. We maintain substantial liquidity to meet a broad range of potential cash outflows and collateral needs in the event of a stressed environment. See “Liquidity Risk Management” below for details on the composition and sizing of our “Global Core Liquid Assets” (GCLA), previously Global Core Excess (GCE). In addition to our GCLA, we maintain other operating cash balances, primarily for use in specific currencies, entities, or jurisdictions where we do not have immediate access to parent company liquidity. |
| Ÿ | Secured Client Financing. We provide collateralized financing for client positions, including margin loans secured by client collateral, securities borrowed, and resale agreements primarily collateralized by government obligations. As a result of client activities, we are required to segregate cash and securities to satisfy regulatory requirements. Our secured client financing arrangements, which are generally short-term, are accounted for at fair value or at amounts that approximate fair value, and include daily margin requirements to mitigate counterparty credit risk. |
| Ÿ | Institutional Client Services. In Institutional Client Services, we maintain inventory positions to facilitate market-making in fixed income, equity, currency and commodity products. Additionally, as part of market-making activities, we enter into resale or securities borrowing arrangements to obtain securities which we can use to cover transactions in which we or our clients have sold securities that have not yet been purchased. The receivables in Institutional Client Services primarily relate to securities transactions. |
| Ÿ | Investing & Lending. In Investing & Lending, we make investments and originate loans to provide financing to clients. These investments and loans are typically longer-term in nature. We make investments, directly and indirectly through funds that we manage, in debt securities, loans, public and private equity securities, real estate entities and other investments. |
| Ÿ | Other Assets. Other assets are generally less liquid, non-financial assets, including property, leasehold improvements and equipment, goodwill and identifiable intangible assets, income tax-related receivables, equity-method investments, assets classified as held for sale and miscellaneous receivables. |
| 68 | Goldman Sachs |
THE GOLDMAN SACHS GROUP, INC. AND SUBSIDIARIES
Management’s Discussion and Analysis
The following is a description of the captions in the table above.
Excess Liquidity and Cash.We maintain substantial excess liquidity to meet a broad range of potential cash outflows and collateral needs in the event of a stressed environment. See “Liquidity Risk Management” below for details on the composition and sizing of our excess liquidity pool or “Global Core Excess” (GCE). In addition to our excess liquidity, we maintain other operating cash balances, primarily for use in specific currencies, entities, or jurisdictions where we do not have immediate access to parent company liquidity.
Secured Client Financing. We provide collateralized financing for client positions, including margin loans secured by client collateral, securities borrowed, and resale agreements primarily collateralized by government obligations. As a result of client activities, we are required to segregate cash and securities to satisfy regulatory requirements. Our secured client financing arrangements, which are generally short-term, are accounted for at fair value or at amounts that approximate fair value, and include daily margin requirements to mitigate counterparty credit risk.
Institutional Client Services. In Institutional Client Services, we maintain inventory positions to facilitate market-making in fixed income, equity, currency and commodity products. Additionally, as part of client market-making activities, we enter into resale or securities borrowing arrangements to obtain securities which we can use to cover transactions in which we or our clients have sold securities that have not yet been purchased. The receivables in Institutional Client Services primarily relate to securities transactions.
Investing & Lending. In Investing & Lending, we make investments and originate loans to provide financing to clients. These investments and loans are typically longer-term in nature. We make investments, directly and indirectly through funds that we manage, in debt securities, loans, public and private equity securities, real estate and other investments.
Other Assets.Other assets are generally less liquid, non-financial assets, including property, leasehold improvements and equipment, goodwill and identifiable intangible assets, income tax-related receivables, equity-method investments and miscellaneous receivables.
THE GOLDMAN SACHS GROUP, INC. AND SUBSIDIARIES
Management’s Discussion and Analysis
The tables below present the reconciliation of this balance sheet allocation to our U.S. GAAP balance sheet. In the tables below, total assets for Institutional Client Services and Investing & Lending represent the inventory and related assets. These amounts differ from total assets by
business segment disclosed in Note 25 to the consolidated financial
statements in Part II, Item 8 of this Form 10-K because total assets disclosed in Note 25 include allocations of our excess liquidityGCLA and cash, secured client financing and other assets. See “Balance Sheet Analysis and Metrics” below for explanations on the changes in our balance sheet from December 2013 to December 2014.
| As of December 2011 | As of December 2014 | |||||||||||||||||||||||||||||||||||||||||||||||
| in millions | Excess Liquidity and Cash 1 | Secured Client Financing | Institutional Client Services | Investing & Lending | Other Assets | Total Assets | ||||||||||||||||||||||||||||||||||||||||||
| $ in millions | | GCLA and Cash | 1 | | Secured Client Financing | | | Institutional Client Services | | | Investing & Lending | | | Other Assets | | | Total Assets | | ||||||||||||||||||||||||||||||
Cash and cash equivalents | $ | 56,008 | $ | — | $ | — | $ | — | $ | — | $ | 56,008 | $ 57,600 | $ — | $ — | $ — | $ — | $ 57,600 | ||||||||||||||||||||||||||||||
Cash and securities segregated for regulatory and other purposes | — | 64,264 | — | — | — | 64,264 | — | 51,716 | — | — | — | 51,716 | ||||||||||||||||||||||||||||||||||||
Securities purchased under agreements to resell and federal funds sold | 70,220 | 98,445 | 18,671 | 453 | — | 187,789 | 66,928 | 34,506 | 24,940 | 1,564 | — | 127,938 | ||||||||||||||||||||||||||||||||||||
Securities borrowed | 14,919 | 85,990 | 52,432 | — | — | 153,341 | 32,311 | 78,584 | 49,827 | — | — | 160,722 | ||||||||||||||||||||||||||||||||||||
Receivables from brokers, dealers and clearing organizations | — | 3,252 | 10,612 | 340 | — | 14,204 | — | 8,908 | 21,656 | 107 | — | 30,671 | ||||||||||||||||||||||||||||||||||||
Receivables from customers and counterparties | — | 31,756 | 25,157 | 3,348 | — | 60,261 | — | 36,927 | 25,661 | 1,220 | — | 63,808 | ||||||||||||||||||||||||||||||||||||
Loans receivable | — | — | — | 28,938 | — | 28,938 | ||||||||||||||||||||||||||||||||||||||||||
Financial instruments owned, at fair value | 38,322 | — | 273,640 | 52,244 | — | 364,206 | 33,913 | — | 230,667 | 47,668 | — | 312,248 | ||||||||||||||||||||||||||||||||||||
Other assets | — | — | — | — | 23,152 | 23,152 | — | — | — | — | 22,599 | 22,599 | ||||||||||||||||||||||||||||||||||||
Total assets | $ | 179,469 | $ | 283,707 | $ | 380,512 | $ | 56,385 | $ | 23,152 | $ | 923,225 | $190,752 | $210,641 | $352,751 | $79,497 | $22,599 | $856,240 | ||||||||||||||||||||||||||||||
| As of December 2010 | As of December 2013 | |||||||||||||||||||||||||||||||||||||||||||||||
| in millions | Excess Liquidity and Cash 1 | Secured Client Financing | Institutional Client Services | Investing & Lending | Other Assets | Total Assets | ||||||||||||||||||||||||||||||||||||||||||
| $ in millions | | GCLA and Cash | 1 | | Secured Client Financing | | | Institutional Client Services | | | Investing & Lending | | | Other Assets | | | Total Assets | | ||||||||||||||||||||||||||||||
Cash and cash equivalents | $ | 39,788 | $ | — | $ | — | $ | — | $ | — | $ | 39,788 | $ 61,133 | $ — | $ — | $ — | $ — | $ 61,133 | ||||||||||||||||||||||||||||||
Cash and securities segregated for regulatory and other purposes | — | 53,731 | — | — | — | 53,731 | — | 49,671 | — | — | — | 49,671 | ||||||||||||||||||||||||||||||||||||
Securities purchased under agreements to resell and federal funds sold | 62,854 | 102,537 | 22,866 | 98 | — | 188,355 | 64,595 | 61,510 | 35,081 | 546 | — | 161,732 | ||||||||||||||||||||||||||||||||||||
Securities borrowed | 37,938 | 80,313 | 48,055 | — | — | 166,306 | 25,113 | 94,899 | 44,554 | — | — | 164,566 | ||||||||||||||||||||||||||||||||||||
Receivables from brokers, dealers and clearing organizations | — | 3,702 | 6,698 | 37 | — | 10,437 | — | 6,650 | 17,098 | 92 | — | 23,840 | ||||||||||||||||||||||||||||||||||||
Receivables from customers and counterparties | — | 39,008 | 25,698 | 2,997 | — | 67,703 | — | 50,656 | 22,459 | 925 | — | 74,040 | ||||||||||||||||||||||||||||||||||||
Loans receivable | — | — | — | 14,895 | — | 14,895 | ||||||||||||||||||||||||||||||||||||||||||
Financial instruments owned, at fair value | 41,761 | — | 260,406 | 54,786 | — | 356,953 | 39,022 | — | 255,534 | 44,565 | — | 339,121 | ||||||||||||||||||||||||||||||||||||
Other assets | — | — | — | — | 28,059 | 28,059 | — | — | — | — | 22,509 | 22,509 | ||||||||||||||||||||||||||||||||||||
Total assets | $ | 182,341 | $ | 279,291 | $ | 363,723 | $ | 57,918 | $ | 28,059 | $ | 911,332 | $189,863 | $263,386 | $374,726 | $61,023 | $22,509 | $911,507 | ||||||||||||||||||||||||||||||
| 1. | Includes unencumbered cash, U.S. government and federal agency obligations (including highly liquid U.S. federal agency mortgage-backed obligations), and German, French, Japanese and United Kingdom government obligations. |
| Goldman Sachs | 69 |
THE GOLDMAN SACHS GROUP, INC. AND SUBSIDIARIES
Management’s Discussion and Analysis
Less Liquid Inventory Composition
We seek to maintain a liquid balance sheet comprised of assets that can be readily sold or funded on a secured basis. However, we do hold certain financial instruments that may be more difficult to sell, or fund on a secured basis, especially during times of market stress. We focus on funding these assets with liabilities that have longer-term contractual maturities to reduce the need to refinance in periods of market stress. The table below presents our aggregate holdings in these categories of financial instruments.
| As of December | ||||||||
| in millions | 2011 | 2010 | ||||||
Bank loans and bridge loans 1 | $ | 19,745 | $ | 18,039 | ||||
Private equity investments and restricted public equity securities 2 | 15,463 | 14,923 | ||||||
Mortgage and other asset-backed loans and securities | 14,291 | 17,042 | ||||||
High-yield and other debt obligations | 11,118 | 11,553 | ||||||
ICBC ordinary shares 3 | 4,713 | 7,589 | ||||||
Emerging market debt securities | 4,624 | 3,931 | ||||||
Emerging market equity securities | 3,922 | 5,784 | ||||||
Other investments in funds 4 | 3,394 | 3,212 | ||||||
|
|
|
|
See Notes 4 through 6 to the consolidated financial statements in Part II, Item 8 of this Form 10-K for further information about the financial instruments we hold.
Balance Sheet Analysis and Metrics
During 2014, we undertook an initiative to reduce our balance sheet in response to regulatory developments, to improve the overall efficiency of our balance sheet and to position the firm to provide additional risk capacity to our clients. We performed a comprehensive analysis of our balance sheet and identified opportunities for reduction, primarily related to lower return activities within our matched book and other secured client financing activities.
As of December 2011,2014, total assets on our consolidated statementstatements of financial condition were $923.23$856.24 billion, an increasea decrease of $11.89$55.27 billion from December 2010.2013. This increasedecrease was primarily due to (i) an increasea decrease in cashcollateralized agreements of $37.64 billion, principally reflecting a decline in the matched book and cash equivalents of $16.22 billion, primarily due to increases in interest-bearing deposits with banks, (ii) an increase in cash and securities segregated for regulatory and other purposes of $10.53 billion, primarily due to an increase in reserve balances held by broker-dealer subsidiaries related to client activity, and (iii) an increasea decrease in financial instruments owned, at fair value of $7.25$26.87 billion, primarily due to increases in non-U.S. government obligations and derivatives, partially offset by a decrease in commodities.U.S. government and federal agency obligations. These increasesdecreases were partially offset by decreasesan increase in (i) collateralized agreementsloans receivable of $13.53 billion, primarily due to decreases in client and firm activity, and (ii) receivables from customers and counterparties of $7.44 billion, primarily due to decreases in client activity in secured client financing.$14.04 billion.
As of December 2011,2014, total liabilities on our consolidated statementstatements of financial condition were $852.85$773.44 billion, an increasea decrease of $18.87$59.60 billion from December 2010.2013. This increasedecrease was primarily due to (i)a decrease in collateralized financings of $91.75 billion, due to client activity and firm financing activity, including a decline in the matched book. This decrease was partially offset by an increase in deposits of $7.54$12.20 billion primarily dueused to increasesfund the growth in client activity and (ii)our loans receivable, an increase in payables to customers and counterparties of $7.36$7.52 billion primarily due to increasesand an increase in client activity.unsecured long-term borrowings of $6.61 billion.
As of December 2011,2014, our total securities sold under agreements to repurchase, accounted for as collateralized financings, were $164.50$88.22 billion, which was 7%3% lower and 26% lower than the daily average amount of repurchase agreements during the quarter ended and year ended December 2014, respectively. The decrease in our repurchase agreements relative to the daily average during 2014 resulted from a decrease in client and firm financing activity during the second half of the year, including a reduction in our matched book, primarily resulting from a firmwide initiative to reduce activities with lower returns.
As of December 2013, our total securities sold under agreements to repurchase, accounted for as collateralized financings, were $164.78 billion, which was 5% higher and 3%4% higher than the daily average amount of repurchase agreements during the quarter ended and year ended December 2011,2013, respectively. As of December 2011, theThe increase in our repurchase agreements relative to the daily average during the quarter and year2013 was primarily due to increases in client activity at the end of the year. As of December 2010, our total securities sold under agreements to repurchase, accounted for as collateralized financings, were $162.35 billion, which was 2% higher and 10% higher than the daily average amount of repurchase agreements during the quarter ended and year ended December 2010, respectively. As of December 2010, the increase in our repurchase agreements relative to the daily average during the quarter and year was due to an increase in client activity at the end of the year and an increase in firm financing activities. period.
The level of our repurchase agreements fluctuates between and within periods, primarily due to providing clients with access to highly liquid collateral, such as U.S. government and federal agency, and investment-grade sovereign obligations through collateralized financing activities.
| 70 | Goldman Sachs |
THE GOLDMAN SACHS GROUP, INC. AND SUBSIDIARIES
Management’s Discussion and Analysis
The table below presents information about our assets, unsecured long-term borrowings, shareholders’ equity and leverage ratios.
| As of December | ||||||||
| $ in millions | 2014 | 2013 | ||||||
Total assets | $856,240 | $911,507 | ||||||
Unsecured long-term borrowings | $167,571 | $160,965 | ||||||
Total shareholders’ equity | $ 82,797 | $ 78,467 | ||||||
Leverage ratio | 10.3x | 11.6x | ||||||
Debt to equity ratio | 2.0x | 2.1x | ||||||
In the table above:
| Ÿ | The leverage ratio equals total assets divided by total shareholders’ equity and measures the proportion of equity and debt the firm is using to finance assets. This ratio is different from the Tier 1 leverage ratio included in Note 20 to the consolidated financial statements. |
| Ÿ | The debt to equity ratio equals unsecured long-term borrowings divided by total shareholders’ equity. |
The table below presents information about our shareholders’ equity and book value per common share, including the reconciliation of total shareholders’ equity to tangible common shareholders’ equity.
| As of December | ||||||||
| $ in millions, except per share amounts | 2014 | 2013 | ||||||
Total shareholders’ equity | $ 82,797 | $ 78,467 | ||||||
Deduct: Preferred stock | (9,200 | ) | (7,200 | ) | ||||
Common shareholders’ equity | 73,597 | 71,267 | ||||||
Deduct: Goodwill and identifiable intangible assets | (4,160 | ) | (4,376 | ) | ||||
Tangible common shareholders’ equity | $ 69,437 | $ 66,891 | ||||||
Book value per common share | $ 163.01 | $ 152.48 | ||||||
Tangible book value per common share | 153.79 | 143.11 | ||||||
In the table above:
| Ÿ | Tangible common shareholders’ equity equals total shareholders’ equity less preferred stock, goodwill and identifiable intangible assets. We believe that tangible common shareholders’ equity is meaningful because it is a measure that we and investors use to assess capital adequacy. Tangible common shareholders’ equity is a non-GAAP measure and may not be comparable to similar non-GAAP measures used by other companies. |
| Ÿ | Book value per common share and tangible book value per common share are based on common shares outstanding, including restricted stock units (RSUs) granted to employees with no future service requirements, of 451.5 million and 467.4 million as of December 2014 and December 2013, respectively. We believe that tangible book value per common share (tangible common shareholders’ equity divided by common shares outstanding, including RSUs granted to employees with no future service requirements) is meaningful because it is a measure that we and investors use to assess capital adequacy. Tangible book value per common share is a non-GAAP measure and may not be comparable to similar non-GAAP measures used by other companies. |
| Goldman Sachs 2014 Form 10-K | 71 |
THE GOLDMAN SACHS GROUP, INC. AND SUBSIDIARIES
Management’s Discussion and Analysis
The table below presents information on our assets, unsecured long-term borrowings, shareholders’ equity and leverage ratios.
| As of December | ||||||||
| $ in millions | 2011 | 2010 | ||||||
Total assets | $ | 923,225 | $ | 911,332 | ||||
Adjusted assets | $ | 604,391 | $ | 588,927 | ||||
Unsecured long-term borrowings | $ | 173,545 | $ | 174,399 | ||||
Total shareholders’ equity | $ | 70,379 | $ | 77,356 | ||||
Leverage ratio | 13.1x | 11.8x | ||||||
Adjusted leverage ratio | 8.6x | 7.6x | ||||||
Debt to equity ratio | 2.5x | 2.3x | ||||||
Adjusted assets.Adjusted assets equals total assets less (i) low-risk collateralized assets generally associated with our secured client financing transactions, federal funds sold and excess liquidity (which includes financial instruments sold, but not yet purchased, at fair value, less derivative liabilities) and (ii) cash and securities we segregate for regulatory and other purposes. Adjusted assets is a non-GAAP measure and may not be comparable to similar non-GAAP measures used by other companies.
The table below presents the reconciliation of total assets to adjusted assets.
| As of December | ||||||||||
in millions | 2011 | 2010 | ||||||||
Total assets | $ | 923,225 | $ | 911,332 | ||||||
Deduct: | Securities borrowed | (153,341 | ) | (166,306 | ) | |||||
Securities purchased under agreements to resell and federal funds sold | (187,789 | ) | (188,355 | ) | ||||||
Add: | Financial instruments sold, but not yet purchased, at fair value | 145,013 | 140,717 | |||||||
Less derivative liabilities | (58,453 | ) | (54,730 | ) | ||||||
Subtotal | (254,570 | ) | (268,674 | ) | ||||||
Deduct: | Cash and securities segregated for regulatory and other purposes | (64,264 | ) | (53,731 | ) | |||||
Adjusted assets | $ | 604,391 | $ | 588,927 | ||||||
Leverage ratio.The leverage ratio equals total assets divided by total shareholders’ equity and measures the proportion of equity and debt the firm is using to finance assets. This ratio is different from the Tier 1 leverage ratio included in “Equity Capital — Consolidated Regulatory Capital Ratios” below, and further described in Note 20 to the consolidated financial statements in Part II, Item 8 of this Form 10-K.
Adjusted leverage ratio.The adjusted leverage ratio equals adjusted assets divided by total shareholders’ equity. We believe that the adjusted leverage ratio is a more meaningful measure of our capital adequacy than the leverage ratio because it excludes certain low-risk collateralized assets that are generally supported with little or no capital. The adjusted leverage ratio is a non-GAAP measure and may not be comparable to similar non-GAAP measures used by other companies.
Our adjusted leverage ratio increased to 8.6x as of December 2011 from 7.6x as of December 2010 as our adjusted assets increased and our total shareholders’ equity decreased, primarily reflecting the redemption of the firm’s Series G Preferred Stock and the repurchase of 47.0 million shares of our common stock.
Debt to equity ratio.The debt to equity ratio equals unsecured long-term borrowings divided by total shareholders’ equity.
Funding Sources
Our primary sources of funding are secured financings, unsecured long-term and short-term borrowings, and deposits. We seek to maintain broad and diversified funding sources globally.globally across products, programs, markets, currencies and creditors to avoid funding concentrations.
We raise funding through a number of different products, including:
| Ÿ |
|
| Ÿ |
|
| Ÿ |
|
| Ÿ |
|
THE GOLDMAN SACHS GROUP, INC. AND SUBSIDIARIES
Management’s DiscussionOur funding is primarily raised in U.S. dollar, Euro, British pound and Analysis
Japanese yen. We generally distribute our funding products through our own sales force and third-party distributors, to a large, diverse creditor base in a variety of markets in the Americas, Europe and Asia. We believe that our relationships with our creditors are critical to our liquidity. Our creditors include banks, governments, securities lenders, pension funds, insurance companies, mutual funds and individuals. We have imposed various internal guidelines to monitor creditor concentration across our funding programs.
Secured Funding.We fund a significant amount of our inventory on a secured basis. Secured funding is less sensitive to changes in our credit quality than unsecured funding, due to the natureour posting of the collateral we post to our lenders. However, becauseNonetheless, we continually analyze the terms or availabilityrefinancing risk of our secured funding particularly short-dated funding, can deteriorate rapidly in a difficult environment, we generally do not rely on short-datedactivities, taking into account trade tenors, maturity profiles, counterparty concentrations, collateral eligibility and counterparty rollover probabilities. We seek to mitigate our refinancing risk by executing term trades with staggered maturities, diversifying counterparties, raising excess secured funding, unless it isand pre-funding residual risk through our GCLA.
We seek to raise secured funding with a term appropriate for the liquidity of the assets that are being financed, and we seek longer maturities for secured funding collateralized with highly liquid securities such as government obligations.
by asset classes that may be harder to fund on a secured basis especially during times of market stress. Substantially all of our other secured funding, excluding funding collateralized by liquid government obligations, is executed for tenors of one month or greater. Additionally, we monitor counterparty concentrationAssets that may be harder to fund on a secured basis during times of market stress include certain financial instruments in the following categories: mortgage and holdother asset-backed loans and securities, non-investment-grade corporate debt securities, equities and convertible debentures and emerging market securities. Assets that are classified as level 3 in the fair value hierarchy are generally funded on an unsecured basis. See Notes 5 and 6 to the consolidated financial statements for further information about the classification of financial instruments in the fair value hierarchy and “— Unsecured Long-Term Borrowings” below for further information about the use of unsecured long-term borrowings as a portionsource of
our GCE for refinancing risk associated with our secured funding transactions. We seek longer terms for secured funding collateralized by lower-quality assets because these funding transactions may pose greater refinancing risk. funding.
The weighted average maturity of our secured funding, excluding funding collateralized by highly liquid securities eligible for inclusion in our GCE,GCLA, exceeded 100120 days as of December 2011.2014.
A majority of our secured funding for securities not eligible for inclusion in the GCEGCLA is executed through term repurchase agreements and securities lending contracts. We also raise financing through other types of collateralized financings, such as secured loans and notes.
Unsecured Long-Term Borrowings.We issue unsecured long-term borrowings as a source of In December 2014, Goldman Sachs Bank USA (GS Bank USA) received approval to access funding for inventory and other assets and to finance a portion of our GCE. We issue in different tenors, currencies, and products to maximizefrom the diversification of our investor base. The table below presents our quarterly unsecured long-term borrowings maturity profile through 2017 as of December 2011.
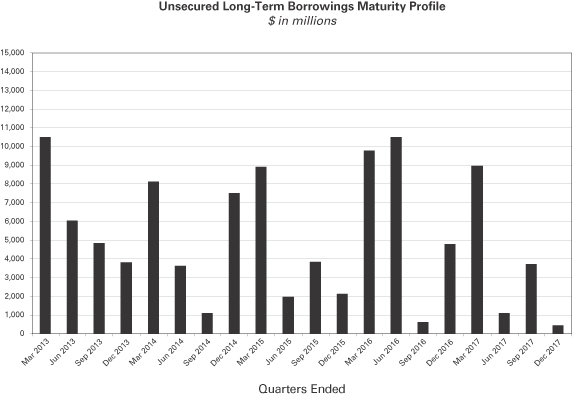
THE GOLDMAN SACHS GROUP, INC. AND SUBSIDIARIES
Management’s Discussion and Analysis
The weighted average maturity of our unsecured long-term borrowings as of December 2011 was approximately eight years. To mitigate refinancing risk, we seek to limit the principal amount of debt maturing on any one day or during any week or year. We enter into interest rate swaps to convert a substantial portion of our long-term borrowings into floating-rate obligations in order to manage our exposure to interest rates. See Note 16 to the consolidated financial statements in Part II, Item 8 of this Form 10-K for further information about our unsecured long-term borrowings.
Temporary Liquidity Guarantee Program (TLGP).Federal Home Loan Bank. As of December 2011,2014, we had $8.53 billion of senior unsecured short-term debt outstanding guaranteed by the FDIC under the TLGP, all of which will mature on or prior to June 15, 2012. We have not issued long-term debt under the TLGP since March 2009 and the program has expired for new issuances.
Deposits.As of December 2011, our bank depository institution subsidiaries had $46.11 billion in customer deposits, including $13.27 billion of certificates of deposit and other time deposits with a weighted average maturity of three years, and $32.84 billion of other deposits, substantially all of which were from cash sweep programs. We utilize deposits to finance lending activities in our bank subsidiaries and to support potential outflows, such as draws on unfunded commitments.
Unsecured Short-Term Borrowings.A significant portion of our short-term borrowings were originally long-term debt that is scheduled to mature within one year of the reporting date. We use short-term borrowings to finance liquid assets and for other cash management purposes. We primarily issue commercial paper, promissory notes, and other hybrid instruments.
As of December 2011, our unsecured short-term borrowings, including the current portion of unsecured long-term borrowings, were $49.04 billion. See Note 15 to the consolidated financial statements in Part II, Item 8 ofaccessed this Form 10-K for further information about our unsecured short-term borrowings.
funding. In addition, GS Bank USA has access to funding through the Federal Reserve Bank discount window. While we do not rely on this funding in our liquidity planning and stress testing, we maintain policies and procedures necessary to access this funding and test discount window borrowing procedures.
| 72 | Goldman Sachs 2014 Form 10-K |
THE GOLDMAN SACHS GROUP, INC. AND SUBSIDIARIES
Management’s Discussion and Analysis
Unsecured Long-Term Borrowings. We issue unsecured long-term borrowings as a source of funding for inventory and other assets and to finance a portion of our GCLA. We issue in different tenors, currencies and products to
maximize the diversification of our investor base. The chart below presents our quarterly unsecured long-term borrowings maturity profile through the fourth quarter of 2020 as of December 2014.
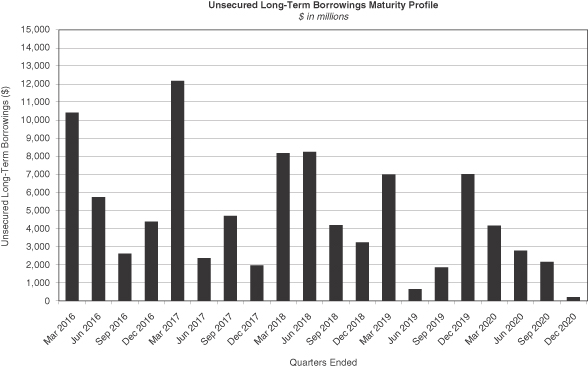
The weighted average maturity of our unsecured long-term borrowings as of December 2014 was approximately eight years. To mitigate refinancing risk, we seek to limit the principal amount of debt maturing on any one day or during any week or year. We enter into interest rate swaps
to convert a substantial portion of our unsecured long-term borrowings into floating-rate obligations in order to manage our exposure to interest rates. See Note 16 to the consolidated financial statements for further information about our unsecured long-term borrowings.
| Goldman Sachs 2014 Form 10-K | 73 |
THE GOLDMAN SACHS GROUP, INC. AND SUBSIDIARIES
Management’s Discussion and Analysis
Deposits. As part of our efforts to diversify our funding base, we raise deposits mainly through GS Bank USA and Goldman Sachs International Bank (GSIB). The tables below present the types and sources of our deposits.
| As of December 2014 | ||||||||||||
| $ in millions | | Savings and Demand | 1 | Time | 2 | Total | ||||||
Private bank deposits 3 | $33,590 | $ 1,609 | $35,199 | |||||||||
Certificates of deposit | — | 25,908 | 25,908 | |||||||||
Deposit sweep programs 4 | 15,691 | — | 15,691 | |||||||||
Institutional | 12 | 6,198 | 6,210 | |||||||||
Total 5 | $49,293 | $33,715 | $83,008 | |||||||||
| As of December 2013 | ||||||||||||
| $ in millions | | Savings and Demand | 1 | Time | 2 | Total | ||||||
Private bank deposits 3 | $30,475 | $ 212 | $30,687 | |||||||||
Certificates of deposit | — | 19,709 | 19,709 | |||||||||
Deposit sweep programs 4 | 15,511 | — | 15,511 | |||||||||
Institutional | 33 | 4,867 | 4,900 | |||||||||
Total 5 | $46,019 | $24,788 | $70,807 | |||||||||
| 1. | Represents deposits with no stated maturity. |
| 2. | Weighted average maturity of approximately three years as of both December 2014 and December 2013. |
| 3. | Substantially all were from overnight deposit sweep programs related to private wealth management clients. |
| 4. | Represents long-term contractual agreements with several U.S. broker-dealers who sweep client cash to FDIC-insured deposits. |
| 5. | Deposits insured by the FDIC as of December 2014 and December 2013 were approximately $45.72 billion and $41.22 billion, respectively. |
Unsecured Short-Term Borrowings. A significant portion of our unsecured short-term borrowings was originally long-term debt that is scheduled to mature within one year of the reporting date. We use unsecured short-term borrowings to finance liquid assets and for other cash management purposes. We issue hybrid financial instruments, commercial paper and promissory notes.
As of December 2014 and December 2013, our unsecured short-term borrowings, including the current portion of unsecured long-term borrowings, were $44.54 billion and $44.69 billion, respectively. See Note 15 to the consolidated financial statements for further information about our unsecured short-term borrowings.
Equity Capital Management and Regulatory Capital
Capital adequacy is of critical importance to us. Our principal objective is to be conservatively capitalized in terms of the amount and composition of our equity base.base, both relative to our risk exposures and compared to external requirements and benchmarks. Accordingly, we have in place a comprehensive capital management policy that serves asprovides a guideframework and set of guidelines to determineassist us in determining the amountlevel and composition of equity capital that we target and maintain.
TheEquity Capital Management
We determine the appropriate level and composition of our equity capital are determined by considering multiple factors including our current and future consolidated regulatory capital requirements, the results of our capital planning and ICAAP,stress testing process and may also be influenced by other factors such as rating agency guidelines, subsidiary capital requirements, the business environment, conditions in the financial markets, and assessments of potential future losses due to adverse changes in our business and market environments. In addition, we maintain a capital plan which projects sources and uses of capital given a range of business environments, and a contingency capital plan which provides a framework for analyzing and responding to an actual or perceived capital shortfall.
Effective December 2011, as part of the Federal Reserve Board’s annual Comprehensive Capital Analysis and Review, U.S. bank holding companies with total consolidated assets of $50 billion or greater, are required to submit annual capital plans for review by the Federal Reserve Board. The capital plans should demonstrate the ability of a bank holding company to maintain its capital ratios above minimum regulatory capital requirements and above a Tier 1 common ratio of 5% on a pro forma basis under expected and stressed scenarios. The purpose of the Federal Reserve Board’s review is to ensure that these institutions have robust, forward-lookingOur capital planning processes that account for their unique risks and that permit continued operations during times of economicstress testing process incorporates our internally designed stress tests and financial stress. As part of the capital plan review, the Federal Reserve Board evaluates an institution’s plan to make capital distributions, such as increasing dividend payments or repurchasing or redeeming stock, across a range of macro-economicthose required under CCAR and firm-specific assumptions. The Federal Reserve Board began the annual capital plan reviews in early 2012.
Our consolidated regulatory capital requirements are determined by the Federal Reserve Board, as described below. Our ICAAP incorporates an internal risk-based capital assessmentDFAST rules, and is also designed to identify and measure material risks associated with our business activities, including market risk, credit risk and operational risk. We project sources and uses of capital given a range of business environments, including stressed conditions. In addition, as part of our comprehensive capital management policy, we maintain a contingency capital plan that provides a framework for analyzing and responding to an actual or perceived capital shortfall.
We principally manage the level and composition of our equity capital through issuances and repurchases of our common stock. We may also, from time to time, issue or repurchase our preferred stock, junior subordinated debt issued to trusts, and other subordinated debt or other forms of capital as business conditions warrant. Prior to any repurchases, we must receive confirmation that the Federal Reserve Board does not object to such capital actions. We manage our capital requirements and the levels of our capital usage principally by setting limits on balance sheet assets and/or limits on risk, in a manner that is closely aligned witheach case both at the consolidated and business levels. See Notes 16 and 19 to the consolidated financial statements for further information about our risk management practices. Our internal risk-based capital assessment is supplemented with the results of stress tests.preferred stock, junior subordinated debt issued to trusts and other subordinated debt.
| 74 | Goldman Sachs |
THE GOLDMAN SACHS GROUP, INC. AND SUBSIDIARIES
Management’s Discussion and Analysis
Capital Planning and Stress Testing Process.Our capital planning and stress testing process incorporates our internally designed stress tests and those required under CCAR and DFAST. The process is designed to identify and measure material risks associated with our business activities. We also perform an internal risk-based capital assessment, attribute capital usage to each of our businesses and maintain a contingency capital plan. The following is a description of our capital planning and stress testing process:
| Ÿ | Stress Testing. Our stress testing process incorporates an internal capital adequacy assessment with the objective of ensuring that the firm is appropriately capitalized relative to the risks in our business. As part of our assessment, we project sources and uses of capital given a range of business environments, including stressed conditions. Our stress tests incorporate our internally designed stress scenarios, including our internally developed severely adverse scenario, and those required under CCAR and DFAST rules, and are designed to capture our specific vulnerabilities and risks and to analyze whether we hold an appropriate amount of capital. Our goal is to hold sufficient capital to ensure we remain adequately capitalized after experiencing a severe stress event. Our assessment of capital adequacy is viewed in tandem with our assessment of liquidity adequacy and is integrated into our overall risk management structure, governance and policy framework. We provide additional information about our stress test processes and a summary of the results on our web site as described under “Business — Available Information” in Part I, Item 1 of the 2014 Form 10-K. |
| Ÿ | Internal Risk-Based Capital Assessment. Our capital planning process includes an internal risk-based capital assessment. This assessment incorporates market risk, credit risk and operational risk. Market risk is calculated by using Value-at-Risk (VaR) calculations supplemented by risk-based add-ons which include risks related to rare events (tail risks). Credit risk utilizes assumptions about our counterparties’ probability of default and the size of our losses in the event of a default. Operational risk is calculated based on scenarios incorporating multiple types of operational failures as well as incorporating internal and external actual loss experience. Backtesting is used to gauge the effectiveness of models at capturing and measuring relevant risks. |
| Ÿ | Capital Attribution. We attribute capital usage to each of our businesses based upon regulatory capital requirements as well as our internal risk-based capital assessment. We manage the levels of our capital usage based upon balance sheet and risk limits, as well as capital return analyses of our businesses based on our capital attribution. We also attribute risk-weighted assets (RWAs) to our business segments. As of December 2014, approximately 70% of RWAs calculated under the Basel III Advanced Rules, subject to transitional provisions, were attributed to our Institutional Client Services segment and substantially all of the remaining RWAs were attributed to our Investing & Lending segment. |
| Ÿ | Contingency Capital Plan. As part of our comprehensive capital management policy, we maintain a contingency capital plan. Our contingency capital plan provides a framework for analyzing and responding to a perceived or actual capital deficiency, including, but not limited to, identification of drivers of a capital deficiency, as well as mitigants and potential actions. It outlines the appropriate communication procedures to follow during a crisis period, including internal dissemination of information as well as timely communication with external stakeholders. |
As required by the Federal Reserve Board’s annual CCAR rules, we submit a capital plan for review by the Federal Reserve Board. The purpose of the Federal Reserve Board’s review is to ensure that we have a robust, forward-looking capital planning process that accounts for our unique risks and that permits continued operation during times of economic and financial stress.
| Goldman Sachs 2014 Form 10-K | 75 |
THE GOLDMAN SACHS GROUP, INC. AND SUBSIDIARIES
Management’s Discussion and Analysis
The Federal Reserve Board evaluates us based, in part, on whether we have the capital necessary to continue operating under the baseline and stress scenarios provided by the Federal Reserve Board and those developed internally. This evaluation also takes into account our process for identifying risk, our controls and governance for capital planning, and our guidelines for making capital planning decisions. In addition, the Federal Reserve Board evaluates our plan to make capital distributions (i.e., dividend payments and repurchases or redemptions of stock, subordinated debt or other capital securities) and issue capital, across a range of macroeconomic scenarios and firm-specific assumptions.
In addition, the DFAST rules require us to conduct stress tests on a semi-annual basis and publish a summary of certain results. The annual DFAST submission is incorporated into our CCAR submission. The Federal Reserve Board also conducts its own annual stress tests and publishes a summary of certain results.
We submitted our initial 2014 CCAR to the Federal Reserve Board in January 2014 and, based on the Federal Reserve Board feedback, we submitted revised capital actions in March 2014. The Federal Reserve Board informed us that it did not object to our revised capital actions, including the repurchase of outstanding common stock, an increase in our quarterly common stock dividend and the possible issuance, redemption and modification of other capital securities through the first quarter of 2015. We published a summary of our annual DFAST results in March 2014. See “Business — Available Information” in Part I, Item 1 of the 2014 Form 10-K. We submitted our 2015 CCAR to the Federal Reserve Board in January 2015 and expect to publish a summary of our annual DFAST results in March 2015.
In addition, we submitted the results of our mid-cycle DFAST to the Federal Reserve Board in July 2014 and published a summary of our mid-cycle DFAST results under our internally developed severely adverse scenario in September 2014. We provide additional information on our internal stress test processes, our internally developed severely adverse scenario used for mid-cycle DFAST and a summary of the results on our web site as described under “Business — Available Information” in Part I, Item 1 of the 2014 Form 10-K.
In October 2014, the Federal Reserve Board issued a final rule modifying the regulations for capital planning and stress testing. The modifications change the dates for submitting the capital plan and stress test results beginning with the 2016 cycle and include a limitation on capital distributions to the extent that actual capital issuances are less than the amount indicated in the capital plan submission.
In addition, the rules adopted by the Federal Reserve Board under the U.S. Dodd-Frank Wall Street Reform and Consumer Protection Act (Dodd-Frank Act) require GS Bank USA to conduct stress tests on an annual basis and publish a summary of certain results. GS Bank USA submitted its 2014 annual DFAST stress results to the Federal Reserve Board in January 2014 and published a summary of its results in March 2014. See “Business — Available Information” in Part I, Item 1 of the 2014 Form 10-K. GS Bank USA submitted its 2015 annual DFAST results to the Federal Reserve Board in January 2015 and expects to publish a summary of its results in March 2015.
Share Repurchase Program. We use our share repurchase program to help maintain the appropriate level of common equity. The repurchase program is effected primarily through regular open-market purchases (which may include repurchase plans designed to comply with Rule 10b5-1), the amounts and timing of which are determined primarily by our current and projected capital position, but which may also be influenced by general market conditions and the prevailing price and trading volumes of our common stock.
As of December 2011, our total shareholders’ equity was $70.38 billion (consisting2014, under the share repurchase program approved by the Board of Directors of Group Inc. (Board), we can repurchase up to 25.4 million additional shares of common shareholders’ equitystock; however, prior to any such repurchases, we must receive confirmation that the Federal Reserve Board does not object to such capital actions. See “Market for Registrant’s Common Equity, Related Stockholder Matters and Issuer Purchases of $67.28 billionEquity Securities” in Part II, Item 5 of the 2014 Form 10-K and preferred stockNote 19 to the consolidated financial statements for additional information about our share repurchase program and see above for information about our capital planning and stress testing process.
| 76 | Goldman Sachs 2014 Form 10-K |
THE GOLDMAN SACHS GROUP, INC. AND SUBSIDIARIES
Management’s Discussion and Analysis
Resolution and Recovery Plans
We are required by the Federal Reserve Board and the FDIC to submit an annual plan that describes our strategy for a rapid and orderly resolution in the event of $3.10 billion)material financial distress or failure (resolution plan). AsWe are also required by the Federal Reserve Board to submit, on an annual basis, a global recovery plan that outlines the steps that management could take to reduce risk, maintain sufficient liquidity, and conserve capital in times of December 2010,prolonged stress. We submitted our total shareholders’ equity was $77.36 billion (consisting of common shareholders’ equity of $70.40 billion2013 resolution plan in September 2013 and preferred stock of $6.96 billion). our 2014 resolution plan in June 2014. In August 2014, the Federal Reserve Board and the FDIC indicated that we and other large industry participants had certain shortcomings in the 2013 resolution plans that must be addressed in the 2015 resolution plans, which are required to be submitted on or before July 1, 2015.
In addition, our $5.00 billionGS Bank USA is required by the FDIC to submit a resolution plan. GS Bank USA submitted its 2013 resolution plan in September 2013 and its 2014 resolution plan in June 2014. GS Bank USA’s 2015 resolution plan is required to be submitted on or before July 1, 2015.
Rating Agency Guidelines
The credit rating agencies assign credit ratings to the obligations of junior subordinatedGroup Inc., which directly issues or guarantees substantially all of the firm’s senior unsecured obligations. Goldman, Sachs & Co. (GS&Co.), Goldman Sachs International (GSI) and GSIB have been assigned long- and short-term issuer ratings by certain credit rating agencies. GS Bank USA has also been assigned long- and short-term issuer ratings, as well as ratings on its long-term and short-term bank deposits. In addition, credit rating agencies have assigned ratings to debt issued to trusts qualifies asobligations of certain other subsidiaries of Group Inc.
The level and composition of our equity capital are among the many factors considered in determining our credit ratings. Each agency has its own definition of eligible capital and methodology for regulatoryevaluating capital adequacy, and certain rating agency purposes.assessments are generally based on a combination of factors rather than a single calculation. See “— Consolidated Regulatory Capital Ratios” below“Liquidity Risk Management — Credit Ratings” for further information regarding the impactabout credit ratings of regulatory developments.Group Inc., GS Bank USA, GSIB, GS&Co. and GSI.
Consolidated Regulatory CapitalRating Agency Guidelines
The Federal Reserve Board iscredit rating agencies assign credit ratings to the primary regulatorobligations of Group Inc., a bank holding company and a financial holding company under the U.S. Bank Holding Company Act of 1956. As a bank holding company, we are subject to consolidated regulatory capital requirements that are computed in accordance with the Federal Reserve Board’s capital adequacy regulations currently applicable to bank holding companies (which are based on the ‘Basel 1’ Capital Accord of the Basel Committee on Banking Supervision (Basel Committee)). These capital requirements are expressed as capital ratios that compare measures of capital to risk-weighted assets (RWAs). See Note 20 to the consolidated financial statements in Part II, Item 8 of this Form 10-K for additional information regarding the firm’s RWAs. The firm’s capital levels are also subject to qualitative judgments by its regulators about components, risk weightings and other factors.
Federal Reserve Board regulations require bank holding companies to maintain a minimum Tier 1 capital ratio of 4% and a minimum total capital ratio of 8%. The required minimum Tier 1 capital ratio and total capital ratio in order to be considered a “well-capitalized” bank holding company under the Federal Reserve Board guidelines are 6% and 10%, respectively. Bank holding companies may be expected to maintain ratios well above the minimum levels, depending on their particular condition, risk profile and growth plans. The minimum Tier 1 leverage ratio is 3% for bank holding companies that have received the highest supervisory rating under Federal Reserve Board guidelineswhich directly issues or that have implemented the Federal Reserve Board’s risk-based capital measure for market risk. Other bank holding companies must have a minimum Tier 1 leverage ratio of 4%.
Consolidated Regulatory Capital Ratios
The table below presents information about our regulatory capital ratios.
| As of December | ||||||||
| $ in millions | 2011 | 2010 | ||||||
Common shareholders’ equity | $ | 67,279 | $ | 70,399 | ||||
Less: Goodwill | (3,802 | ) | (3,495 | ) | ||||
Less: Disallowable intangible assets | (1,666 | ) | (2,027 | ) | ||||
Less: Other deductions 1 | (6,649 | ) | (5,601 | ) | ||||
Tier 1 Common Capital | 55,162 | 59,276 | ||||||
Preferred stock | 3,100 | 6,957 | ||||||
Junior subordinated debt issued to trusts | 5,000 | 5,000 | ||||||
Tier 1 Capital | 63,262 | 71,233 | ||||||
Qualifying subordinated debt 2 | 13,828 | 13,880 | ||||||
Other adjustments | 53 | (220 | ) | |||||
Tier 2 Capital | 13,881 | 13,660 | ||||||
Total Capital | $ | 77,143 | $ | 84,893 | ||||
Risk-Weighted Assets 3 | $ | 457,027 | $ | 444,290 | ||||
Tier 1 Capital Ratio | 13.8 | % | 16.0 | % | ||||
Total Capital Ratio | 16.9 | % | 19.1 | % | ||||
Tier 1 Leverage Ratio 3 | 7.0 | % | 8.0 | % | ||||
Tier 1 Common Ratio 4 | 12.1 | % | 13.3 | % | ||||
|
|
|
|
Our Tier 1 capital ratio decreased to 13.8% as of December 2011 from 16.0% as of December 2010. Our Tier 1 leverage ratio decreased to 7.0% as of December 2011 from 8.0% as of December 2010. These decreases reflected a reduction in our Tier 1 capital primarily due to the impact of the redemption of the firm’s Series G Preferred Stocksenior unsecured obligations. Goldman, Sachs & Co. (GS&Co.), Goldman Sachs International (GSI) and the repurchase of 47.0 million shares of our common stock, partially offsetGSIB have been assigned long- and short-term issuer ratings by net earnings.
THE GOLDMAN SACHS GROUP, INC. AND SUBSIDIARIES
Management’s Discussioncertain credit rating agencies. GS Bank USA has also been assigned long- and Analysis
We are currently working to implement the requirements set out in the Federal Reserve Board’s Risk-Based Capital Standards: Advanced Capital Adequacy Framework — Basel 2, as applicable to us as a bank holding company (Basel 2), which are based on the advanced approaches under the Revised Framework for the International Convergence of Capital Measurement and Capital Standards issued by the Basel Committee. U.S. banking regulators have incorporated the Basel 2 framework into the existing risk-based capital requirements by requiring that internationally active banking organizations, such as us, adopt Basel 2, once approved to do so by regulators. As required by the Dodd-Frank Act, U.S. banking regulators have adopted a rule that requires large banking organizations, upon adoption of Basel 2, to continue to calculate risk-based capital ratios under both Basel 1 and Basel 2. For each of the Tier 1 and Total capital ratios, the lower of the Basel 1 and Basel 2 ratios calculated will be used to determine whether the bank meets its minimum risk-based capital requirements.
The U.S. federal bank regulatory agencies have issued revised proposals to modify their market risk regulatory capital requirements for banking organizations in the United States that have significant trading activities. These modifications are designed to address the adjustments to Basel 2.5,short-term issuer ratings, as well as ratings on its long-term and short-term bank deposits. In addition, credit rating agencies have assigned ratings to debt obligations of certain other subsidiaries of Group Inc.
The level and composition of our equity capital are among the prohibitionmany factors considered in determining our credit ratings. Each agency has its own definition of eligible capital and methodology for evaluating capital adequacy, and assessments are generally based on the usea combination of factors rather than a single calculation. See “Liquidity Risk Management — Credit Ratings” for further information about credit ratings as required by the Dodd-Frank Act. Once implemented, it is likely that these changes will result in increased capital requirements for market risk.
Additionally, the guidelines issued by the Basel Committee in December 2010 (Basel 3) revise the definition of Tier 1 capital, introduce Tier 1 common equity as a regulatory metric, set new minimum capital ratios (including a new “capital conservation buffer,” which must be composed exclusively of Tier 1 common equityGroup Inc., GS Bank USA, GSIB, GS&Co. and will be in addition to the minimum capital ratios), introduce a Tier 1 leverage ratio within international guidelines for the first time, and make substantial revisions to the computation of RWAs for credit exposures. Implementation of the new requirements is expected to take place over the next several years. Although the U.S. federal banking agencies have now issued proposed rules that are intended to implement certain aspects of the Basel 2.5 guidelines, they have not yet addressed all aspects of those guidelines or the Basel 3 changes.GSI.
The Basel Committee has published its final provisions for assessing the global systemic importance of banking institutions and the range of additional Tier 1 common equity that should be maintained by banking institutions deemed to be globally systemically important. The additional capital for these institutions would initially range from 1% to 2.5% of Tier 1 common equity and could be as much as 3.5% for a bank that increases its systemic footprint (e.g., by increasing total assets). The firm was one of 29 institutions identified by the Financial Stability Board (established at the direction of the leaders of the Group of 20) as globally systemically important under the Basel Committee’s methodology. Therefore, depending upon the manner and timing of the U.S. banking regulators’ implementation of the Basel Committee’s methodology, we expect that the minimum Tier 1 common ratio requirement applicable to us will include this additional capital assessment. The final determination of whether an institution is classified as globally systemically important and the calculation of the required additional capital amount is expected to be disclosed by the Basel Committee no later than November 2014 based on data through the end of 2013.
The Dodd-Frank Act will subject us at a firmwide level to the same leverage and risk-based capital requirements that apply to depository institutions and directs banking regulators to impose additional capital requirements as disclosed above. The Federal Reserve Board is expected to adopt the new leverage and risk-based capital regulations in 2012. As a consequence of these changes, Tier 1 capital treatment for our junior subordinated debt issued to trusts will be phased out over a three-year period beginning on January 1, 2013. The interaction among the Dodd-Frank Act, the Basel Committee’s proposed changes and other proposed or announced changes from other governmental entities and regulators adds further uncertainty to our future capital requirements.
THE GOLDMAN SACHS GROUP, INC. AND SUBSIDIARIES
Management’s Discussion and Analysis
See “Business — Regulation” in Part I, Item 1 of this Form 10-K and Note 20 to the consolidated financial statements in Part II, Item 8 of this Form 10-K for additional information about our regulatory capital ratios and the related regulatory requirements.
Internal Capital Adequacy Assessment Process
We perform an ICAAP with the objective of ensuring that the firm is appropriately capitalized relative to the risks in our business.
As part of our ICAAP, we perform an internal risk-based capital assessment. This assessment incorporates market risk, credit risk and operational risk. Market risk is calculated by using Value-at-Risk (VaR) calculations supplemented by risk-based add-ons which include risks related to rare events (tail risks). Credit risk utilizes assumptions about our counterparties’ probability of default, the size of our losses in the event of a default and the maturity of our counterparties’ contractual obligations to us. Operational risk is calculated based on scenarios incorporating multiple types of operational failures. Backtesting is used to gauge the effectiveness of models at capturing and measuring relevant risks.
We evaluate capital adequacy based on the result of our internal risk-based capital assessment, supplemented with the results of stress tests which measure the firm’s performance under various market conditions. Our goal is to hold sufficient capital, under our internal risk-based capital framework, to ensure we remain adequately capitalized after experiencing a severe stress event. Our assessment of capital adequacy is viewed in tandem with our assessment of liquidity adequacy and integrated into the overall risk management structure, governance and policy framework of the firm.
We attribute capital usage to each of our businesses based upon our internal risk-based capital and regulatory frameworks and manage the levels of usage based upon the balance sheet and risk limits established.
Rating Agency Guidelines
The credit rating agencies assign credit ratings to the obligations of Group Inc., which directly issues or guarantees substantially all of the firm’s senior unsecured obligations. Goldman, Sachs & Co. (GS&Co.) and, Goldman Sachs International (GSI) and GSIB have been assigned long- and short-term issuer ratings by certain credit rating agencies. GS Bank USA has also been assigned long-termlong- and short-term issuer ratings, as well as ratings on its long-term and short-term bank deposits. In addition, credit rating agencies have assigned ratings to debt obligations of certain other subsidiaries of Group Inc.
The level and composition of our equity capital are among the many factors considered in determining our credit ratings. Each agency has its own definition of eligible capital and methodology for evaluating capital adequacy, and assessments are generally based on a combination of factors rather than a single calculation. See “Liquidity Risk Management — Credit Ratings” for further information about credit ratings of Group Inc., GS Bank USA, GSIB, GS&Co. and GSI.
Consolidated Regulatory Capital
As of December 2013, we were subject to the risk-based capital regulations of the Federal Reserve Board that were based on the Basel I Capital Accord of the Basel Committee on Banking Supervision (Basel Committee), GSI and GS Bank USA.incorporated the revised market risk regulatory capital requirements (together, the Prior Capital Rules).
As of January 1, 2014, we became subject to the Federal Reserve Board’s revised risk-based capital and leverage regulations, subject to certain transitional provisions (Revised Capital Framework). These regulations are largely based on the Basel Committee’s final capital framework for strengthening international capital standards (Basel III) and also implement certain provisions of the Dodd-Frank Act. Under the Revised Capital Framework, we are an “Advanced approach” banking organization.
We were notified in the first quarter of 2014 that we had completed a “parallel run” to the satisfaction of the Federal Reserve Board, as required under the Revised Capital Framework. As such, additional changes in our capital requirements became effective on April 1, 2014.
Beginning on January 1, 2014, regulatory capital was calculated based on the Revised Capital Framework. Beginning on April 1, 2014, there were no changes to the calculation of regulatory capital, but RWAs were calculated using (i) the Prior Capital Rules, adjusted for certain items related to capital deductions under the previous definition of regulatory capital and for the phase-in of new capital deductions (Hybrid Capital Rules), and (ii) the Advanced approach and market risk rules set out in the Revised Capital Framework (together, the Basel III Advanced Rules). The lower of the ratios calculated under the Hybrid Capital Rules and those calculated under the Basel III Advanced Rules are our binding regulatory capital requirements.
As a result of the changes in the applicable capital framework in 2014, our capital ratios as of December 2014 and those as of December 2013 included in Note 20 to the consolidated financial statements were calculated on a different basis and, accordingly, are not comparable. See Note 20 to the consolidated financial statements for our capital ratios as of December 2013, a description of the Prior Capital Rules, and for additional information about the Revised Capital Framework, including the transitional arrangements related to new deductions from Common Equity Tier 1 (CET1) and information about RWAs.
| Goldman Sachs 2014 Form 10-K | 77 |
THE GOLDMAN SACHS GROUP, INC. AND SUBSIDIARIES
Management’s Discussion and Analysis
Effective on January 1, 2015, regulatory capital continues to be calculated under the Revised Capital Framework, but RWAs are required to be calculated under the Basel III Advanced Rules, as well as the Standardized approach and market risk rules set out in the Revised Capital Framework (together, the Standardized Capital Rules) as discussed in Note 20 to the consolidated financial statements. The lower of the ratios calculated under the Basel III Advanced Rules and those calculated under the Standardized Capital Rules are our binding regulatory capital requirements.
Minimum Capital Ratios and Capital Buffers
The table below presents the minimum ratios under the Revised Capital Framework as of December 2014 and January 2015, as well as the minimum ratios that we expect will apply at the end of the transitional provisions beginning January 2019.
| | December 2014 Minimum Ratio | 1 | | January 2015 Minimum Ratio | 1 | | January 2019 Minimum Ratio | | ||||
CET1 ratio | 4.0% | 4.5% | 8.5% | 4 | ||||||||
Tier 1 capital ratio | 5.5% | 6.0% | 10.0% | 4 | ||||||||
Total capital ratio | 8.0% | 3 | 8.0% | 3 | 12.0% | 4 | ||||||
Tier 1 leverage ratio 2 | 4.0% | 4.0% | 4.0% | |||||||||
| 1. | Does not reflect the capital conservation buffer or provisional Global Systemically Important Banks (G-SIB) buffer discussed below. |
| 2. | Tier 1 leverage ratio is defined as Tier 1 capital divided by average adjusted total assets (which includes adjustments for goodwill and identifiable intangible assets, and certain investments in nonconsolidated financial institutions). |
| 3. | In order to meet the quantitative requirements for being “well-capitalized” under the Federal Reserve Board’s capital regulations, the firm must meet a higher required minimum Total capital ratio of 10.0%. |
| 4. | Includes the required increases in minimum ratios on January 1, 2015, the capital conservation buffer of 2.5% and a provisional G-SIB buffer of 1.5% under the Basel Committee’s methodology discussed below. |
The table below presents the supplementary leverage ratio. See “Supplementary Leverage Ratio” below for further information.
| January 2018 Minimum Ratio | ||||
Supplementary leverage ratio | 5.0% | 1 |
| 1. | Includes the minimum requirement of 3.0% and a buffer of 2.0% discussed below. |
Under the Revised Capital Framework, on January 1, 2015, the minimum CET1 ratio increased from 4.0% to 4.5% and the minimum Tier 1 capital ratio increased from 5.5% to 6.0%. In addition, these minimum ratios will be supplemented by a new capital conservation buffer, consisting entirely of capital that qualifies as CET1, that phases in, beginning on January 1, 2016, in increments of 0.625% per year until it reaches 2.5% of RWAs on January 1, 2019.
The January 2019 minimum ratios in the table above assume the future implementation of an additional preliminary buffer for G-SIBs. Under the methodology published by the Basel Committee, the required amount of additional CET1 for these institutions will initially range from 1% to 2.5% and could be higher in the future for a banking institution that increases its systemic footprint (e.g., by increasing total assets). In November 2014, the Financial Stability Board (established at the direction of the leaders of the Group of 20) indicated that, based on our 2013 financial data, we would be required to hold an additional 1.5% of CET1 as a G-SIB.
In December 2014, the Federal Reserve Board proposed a rule which would establish risk-based capital surcharges for U.S. G-SIBs that are higher than those required by the Basel Committee. Under the proposed rule, U.S. G-SIBs would be required to meet these higher capital surcharges on a phased-in basis, beginning in 2016 through 2019. The proposed rule treats the Basel Committee’s methodology as a floor and introduces an alternative calculation to determine the applicable surcharge, which includes a significantly higher surcharge for systemic risk and, as part of the calculation of the applicable surcharge, a new factor based on a G-SIB’s use of short-term wholesale funding. Under a preliminary assessment of the proposed rule, our surcharge has been estimated to be 100 basis points higher than the 1.5% surcharge under the Basel Committee’s methodology. The table above does not reflect this additional surcharge. This preliminary estimate is subject to significant interpretive assumptions and may change in the future, perhaps materially, due to, among other things (i) any changes in the final rule, the interpretations we have made, or data used in the calculation; (ii) changes in foreign exchange rates, which may have the effect of increasing or decreasing the proportion of the systemic risk measures applicable to U.S. G-SIBs; (iii) increases or decreases in any of the indicators used in the assessment of our systemic risk, including our use of short-term wholesale funding; or (iv) increases or decreases in indicators at any of the other banks that are included in the Basel Committee’s methodology.
The Revised Capital Framework also provides a new counter-cyclical capital buffer of up to 2.5% (and also consisting entirely of CET1), to be imposed in the event that national supervisors deem it necessary in order to counteract excessive credit growth. The table above does not reflect this buffer.
Our regulators could change these buffers in the future. As a result, the minimum ratios we are subject to as of January 1, 2019 could be higher than the amounts presented in the table above.
| 78 | Goldman Sachs 2014 Form 10-K |
THE GOLDMAN SACHS GROUP, INC. AND SUBSIDIARIES
Management’s Discussion and Analysis
Fully Phased-in Capital Ratios
The table below presents our estimated ratio of CET1 to RWAs calculated under the Basel III Advanced Rules and the Standardized Capital Rules on a fully phased-in basis.
| As of December | ||||||||
| $ in millions | 2014 | 2013 | ||||||
Common shareholders’ equity | $ 73,597 | $ 71,267 | ||||||
Deductions for goodwill and identifiable intangible assets, net of deferred tax liabilities | (3,196 | ) | (3,468 | ) | ||||
Deductions for investments in nonconsolidated financial institutions | (4,928 | ) | (9,091 | ) | ||||
Other adjustments | (1,213 | ) | (489 | ) | ||||
CET1 | $ 64,260 | $ 58,219 | ||||||
Basel III Advanced RWAs | $577,869 | $594,662 | ||||||
Basel III Advanced CET1 ratio | 11.1% | 9.8% | ||||||
Standardized RWAs | $627,444 | $635,092 | ||||||
Standardized CET1 ratio | 10.2% | 9.2% | ||||||
Although the fully phased-in capital ratios are not applicable until 2019, we believe that the estimated ratios in the table above are meaningful because they are measures that we, our regulators and investors use to assess our ability to meet future regulatory capital requirements. The estimated fully phased-in Basel III Advanced and Standardized CET1 ratios are non-GAAP measures as of both December 2014 and December 2013 and may not be comparable to similar non-GAAP measures used by other companies (as of those dates). These estimated ratios are based on our current interpretation, expectations and understanding of the Revised Capital Framework and may evolve as we discuss its interpretation and application with our regulators.
See Note 20 to the consolidated financial statements for information about our transitional capital ratios, which represent our binding ratios as of December 2014.
In the table above:
| Ÿ | The deduction for goodwill and identifiable intangible assets, net of deferred tax liabilities, represents goodwill of $3.65 billion and $3.71 billion as of December 2014 and December 2013, respectively, and identifiable intangible assets of $515 million and $671 million as of December 2014 and December 2013, respectively, net of associated deferred tax liabilities of $964 million and $908 million as of December 2014 and December 2013, respectively. |
| Ÿ | The deduction for investments in nonconsolidated financial institutions represents the amount by which our investments in the capital of nonconsolidated financial institutions exceed certain prescribed thresholds. The decrease from December 2013 to December 2014 primarily reflects reductions in our fund investments. |
| Ÿ | Other adjustments primarily include the overfunded portion of our defined benefit pension plan obligation, net of associated deferred tax liabilities, and disallowed deferred tax assets, credit valuation adjustments on derivative liabilities and debt valuation adjustments, as well as other required credit risk-based deductions. |
Supplementary Leverage Ratio
The Revised Capital Framework introduces a new supplementary leverage ratio for Advanced approach banking organizations. Under amendments to the Revised Capital Framework, the U.S. federal bank regulatory agencies approved a final rule that implements the supplementary leverage ratio aligned with the definition of leverage established by the Basel Committee. The supplementary leverage ratio compares Tier 1 capital to a measure of leverage exposure, defined as the sum of our quarterly average assets less certain deductions plus certain off-balance-sheet exposures, including a measure of derivatives exposures and commitments. The Revised Capital Framework requires a minimum supplementary leverage ratio of 5.0% (comprised of the minimum requirement of 3.0% and a 2.0% buffer) for U.S. banks deemed to be G-SIBs, effective on January 1, 2018. Certain disclosures regarding the supplementary leverage ratio are required beginning in the first quarter of 2015.
As of December 2014, our estimated supplementary leverage ratio was 5.0%, including Tier 1 capital on a fully phased-in basis of $73.17 billion (CET1 of $64.26 billion plus perpetual non-cumulative preferred stock of $9.20 billion less other adjustments of $290 million) divided by total leverage exposure of $1.45 trillion (total quarterly average assets of $873 billion plus adjustments of $579 billion, primarily comprised of off-balance-sheet exposure related to derivatives and commitments).
We believe that the estimated supplementary leverage ratio is meaningful because it is a measure that we, our regulators and investors use to assess our ability to meet future regulatory capital requirements. The supplementary leverage ratio is a non-GAAP measure and may not be comparable to similar non-GAAP measures used by other companies.
This estimated supplementary leverage ratio is based on our current interpretation and understanding of the U.S. federal bank regulatory agencies’ final rule and may evolve as we discuss its interpretation and application with our regulators.
| Goldman Sachs 2014 Form 10-K | 79 |
THE GOLDMAN SACHS GROUP, INC. AND SUBSIDIARIES
Management’s Discussion and Analysis
Subsidiary Capital Requirements
Many of our subsidiaries, including GS Bank USA and our broker-dealer subsidiaries, are subject to separate regulation and capital requirements of the jurisdictions in jurisdictions throughout the world. For purposes of assessing the adequacy of its capital,which they operate.
GS Bank USA. GS Bank USA has established an ICAAP which is subject to minimum capital requirements that are calculated in a manner similar to that used by Group Inc.those applicable to bank holding companies and computes its capital ratios in accordance with the regulatory capital requirements applicable to state member banks, which are based on the Revised Capital Framework. The capital regulations also include requirements with respect to leverage. See Note 20 to the consolidated financial statements for further information about the Revised Capital Framework as it relates to GS Bank USA, including GS Bank USA’s capital levelsratios and prompt corrective action classificationrequired minimum ratios.
The Basel Committee published its final guidelines for calculating incremental capital requirements for domestic systemically important banking institutions. These guidelines are complementary to the framework outlined above for G-SIBs. The impact of these guidelines on the regulatory capital requirements of GS Bank USA will depend on how they are implemented by the banking regulators in the United States.
In addition, under Federal Reserve Board rules, commencing on January 1, 2018, in order to be considered a “well-capitalized” depository institution, GS Bank USA must have a supplementary leverage ratio of 6.0% or greater. As of December 2014, GS Bank USA’s estimated supplementary leverage ratio under this rule and on a fully phased-in basis was 6.0%. This estimated supplementary leverage ratio is based on our current interpretation and understanding of this rule and may evolve as we discuss its interpretation and application with our regulators.
GSI. Our regulated U.K. broker-dealer, GSI, is one of the firm’s principal non-U.S. regulated subsidiaries and is regulated by the Prudential Regulation Authority (PRA) and the Financial Conduct Authority (FCA). Effective on January 1, 2014, GSI became subject to qualitative judgmentscapital regulations which are largely based on Basel III as implemented in the European Union (EU) through the Capital Requirements Directives and which, similar to the Revised Capital Framework, also introduce leverage ratio reporting requirements in the future. As of December 2014, GSI had an estimated CET1 ratio of 9.7%, an estimated Tier 1 capital ratio of 9.7% and an estimated Total capital ratio of 12.7% (all including approximately 80 basis points of 2014 unaudited results). These ratios will be finalized upon the completion of the 2014 GSI audit. Under PRA rules, as of December 2014, GSI is required to maintain a minimum CET1 ratio of 4.0%, Tier 1 capital ratio of 5.5%, and Total capital ratio of 8.0%. In January 2015, the minimum CET1 ratio requirement increased to 4.5%, and the minimum Tier 1 capital ratio requirement increased to 6.0%. GSI’s future capital requirements may also be impacted by its regulators about components,developments such as the introduction of capital buffers as described above in “— Minimum Capital Ratios and Capital Buffers.”
As of December 2013, GSI was subject to capital regulations, which were based on the Basel Committee’s June 2006 Framework (Basel II) as modified by the Basel Committee’s February 2011 Revisions to the Basel II market risk weightingsframework and other factors.as implemented in the EU through the Capital Requirements Directives. As of December 2013, GSI had a Tier 1 capital ratio of 14.4% and a Total capital ratio of 18.5%.
| 80 | Goldman Sachs 2014 Form 10-K |
THE GOLDMAN SACHS GROUP, INC. AND SUBSIDIARIES
Management’s Discussion and Analysis
Other Subsidiaries.We expect that the capital requirements of several of our subsidiaries will be impactedare likely to increase in the future bydue to the various developments arising from the Basel Committee, the Dodd-Frank Act, and other governmental entities and regulators.
See Note 20 to the consolidated financial statements in Part II, Item 8 of this Form 10-K for information about GS Bank USA’s capital ratios under Basel 1 as implemented by the Federal Reserve Board, and for further information about the capital requirements of our other regulated subsidiaries and the potential impact of regulatory reform.subsidiaries.
Subsidiaries not subject to separate regulatory capital requirements may hold capital to satisfy local tax and legal guidelines, rating agency requirements (for entities with assigned credit ratings) or internal policies, including policies concerning the minimum amount of capital a subsidiary should hold based on its underlying level of risk. In certain instances, Group Inc. may be limited in its ability to access capital held at certain subsidiaries as a result of regulatory, tax or other constraints. As of December 20112014 and December 2010,2013, Group Inc.’s equity investment in subsidiaries was $67.70$79.70 billion and $71.30$73.39 billion, respectively, compared with its total shareholders’ equity of $70.38$82.80 billion and $77.36$78.47 billion, respectively.
THE GOLDMAN SACHS GROUP, INC. AND SUBSIDIARIES
Our capital invested in non-U.S. subsidiaries is generally exposed to foreign exchange risk, substantially all of which is managed through a combination of derivatives and non-U.S. denominated debt.
Management’s Discussion and AnalysisGuarantees of Subsidiaries.
Group Inc. has guaranteed the payment obligations of GS&Co., GS Bank USA, Goldman Sachs Bank (Europe) plc and Goldman Sachs Execution & Clearing, L.P. (GSEC), in each case subject to certain exceptions. In November 2008, Group Inc. contributed subsidiaries into GS Bank USA, and Group Inc. agreed to guarantee certain losses, including credit-related losses, relating to assets held by the contributed entities. In connection with this guarantee, Group Inc. also agreed to pledge to GS Bank USA certain collateral, including interests in subsidiaries and other illiquid assets.
Our capital invested in non-U.S. subsidiaries is generally exposed to foreign exchange risk, substantially all of which is managed through a combination of derivatives and non-U.S. denominated debt.
Contingency Capital PlanRegulatory Developments
Our contingency capital plan provides a framework for analyzing and responding to a perceived or actual capital deficiency, including, but not limited to, identification of drivers of a capital deficiency, as well as mitigants and potential actions. It outlines the appropriate communication procedures to follow during a crisis period, including internal dissemination of information as well as ensuring timely communication with external stakeholders.
Equity Capital Management
Our objective is to maintain a sufficient level and optimal composition of equity capital. We principally manage our capital through issuances and repurchases of our common stock. We may also, from time to time, issue or repurchase our preferred stock, junior subordinated debt issued to trusts and other subordinated debt or other forms of capital as business conditions warrant and subject to any regulatory approvals. We manage our capital requirements principally by setting limits on balance sheet assets and/or limits on risk, in each case both at the consolidated and business levels. We attribute capital usage to each of our businesses based upon our internal risk-based capital and regulatory frameworks and manage the levels of usage based upon the balance sheet and risk limits established.
Preferred Stock. During 2011, we redeemed the 50,000 shares of our Series G Preferred Stock held by Berkshire Hathaway for the stated redemption price of $5.50 billion ($110,000 per share), plus accrued and unpaid dividends. In connection with this redemption, we recognized a preferred dividend of $1.64 billion (calculated as the difference between the carrying value and the redemption value of the preferred stock), which is included in the consolidated statement of earnings for 2011. Berkshire Hathaway continues to hold a five-year warrant, issued in October 2008, to purchase up to 43.5 million shares of common stock at an exercise price of $115.00 per share.
Share Repurchase Program.We seek to use our share repurchase program to help maintain the appropriate level of common equity and to substantially offset increases in share count over time resulting from employee share-based compensation. The repurchase program is effected primarily through regular open-market purchases, the amounts and timing of which are determined primarily by our current and projected capital positions (i.e., comparisons of our desired level and composition of capital to our actual level and composition of capital) and the issuance of shares resulting from employee share-based compensation, but which may also be influenced by general market conditions and the prevailing price and trading volumes of our common stock.
As of December 2011, under the share repurchase program approved by the Board of Directors of Group Inc. (Board), we can repurchase up to 63.5 million additional shares of common stock; however, any such repurchases are subject to significant and evolving regulation. The Dodd-Frank Act, enacted in July 2010, significantly altered the approvalfinancial regulatory regime within which we operate. In addition, other reforms have been adopted or are being considered by other regulators and policy makers worldwide. We expect that the principal areas of impact from regulatory reform for us will be increased regulatory capital requirements and increased regulation and restriction on certain activities. However, given that many of the Federal Reserve Board. new and proposed rules are highly complex, the full impact of regulatory reform will not be known until the rules are implemented and market practices develop under the final regulations.
There has been increased regulation of, and limitations on, our activities, including the Dodd-Frank Act prohibition on “proprietary trading” and the limitation on the sponsorship of, and investment in, covered funds (as defined in the Volcker Rule). In addition, there is increased regulation of, and restrictions on, OTC derivatives markets and transactions, particularly related to swaps and security-based swaps.
See “Market for Registrant’s Common Equity, Related Stockholder Matters and Issuer Purchases of Equity Securities”“Business — Regulation” in Part II,I, Item 51 of the 2014 Form 10-K for more information about the laws, rules and regulations and proposed laws, rules and regulations that apply to us and our operations. In addition, see Note 1920 to the consolidated financial statements in Part II, Item��8 of this Form 10-K for additional information on our repurchase program.
See Notes 16 and 19 to the consolidated financial statements in Part II, Item 8 of this Form 10-K for further information about regulatory developments as they relate to our preferred stock, junior subordinated debt issued to trustsregulatory capital and other subordinated debt.leverage ratios, and “Liquidity Risk Management — Liquidity Regulatory Framework” below for information about the U.S. federal bank regulatory agencies’ final rules implementing the liquidity coverage ratio.
| Goldman Sachs | 81 |
THE GOLDMAN SACHS GROUP, INC. AND SUBSIDIARIES
Management’s Discussion and Analysis
Volcker Rule
In December 2013, the final rules to implement the provisions of the Dodd-Frank Act referred to as the “Volcker Rule” were adopted.
The Volcker Rule prohibits “proprietary trading,” but permits activities such as underwriting, market making and risk-mitigation hedging. We are also required to calculate daily quantitative metrics on covered trading activities (as defined in the rule) and provide these metrics to regulators on a monthly basis. We are required to be in compliance with the prohibition on proprietary trading and to develop an extensive compliance program by July 2015. Based on what we know as of the date of this filing, we do not expect the impact of the prohibition on proprietary trading to be material to our financial condition, results of operations or cash flows. However, the rule is highly complex, and its impact will not be known until market practices are fully developed.
In addition to the prohibition on proprietary trading, the Volcker Rule limits the sponsorship of, and investment in, “covered funds” (as defined in the rule) by banking entities, including Group Inc. and its subsidiaries. It also limits certain types of transactions between us and our sponsored funds, similar to the limitations on transactions between depository institutions and their affiliates as described in “Business — Regulation” in Part I, Item 1 of the 2014 Form 10-K. Covered funds include our private equity funds, certain of our credit and real estate funds, our hedge funds and certain other investment structures. The limitation on investments in covered funds requires us to reduce our investment in each such fund to 3% or less of the fund’s net asset value, and to reduce our aggregate investment in all such funds to 3% or less of our Tier 1 capital. In anticipation of the final rule, we limited our initial investment in certain new covered funds to 3% of the fund’s net asset value.
We continue to manage our existing funds, taking into account the transition periods under the Volcker Rule. We plan to continue to conduct our investing and lending activities in ways that are permissible under the Volcker Rule.
Our current investment in funds that are calculated using NAV is $9.84 billion as disclosed in Note 6 to the consolidated financial statements. In order to be compliant with the Volcker Rule, we will be required to reduce most of our interests in these funds by the prescribed compliance date. The Federal Reserve Board extended the conformance period through July 2016 for investments in, and relationships with, covered funds that were in place prior to December 31, 2013, and indicated that it intends to further extend the conformance period through July 2017. We currently expect to be able to exit substantially all such interests in these funds in orderly transactions prior to July 2017, subject to market conditions. However, to the extent that the underlying investments of particular funds are not sold, we may be required to sell our interests in such funds. If that occurs, we may receive a value for our interests that is less than the then carrying value as there could be a limited secondary market for these investments and we may be unable to sell them in orderly transactions.
Although our net revenues from our interests in private equity, credit, real estate and hedge funds may vary from period to period, our aggregate net revenues from these investments were approximately 3% and 6% of our aggregate total net revenues over the last 10 years and 5 years, respectively.
| 82 | Goldman Sachs 2014 Form 10-K |
THE GOLDMAN SACHS GROUP, INC. AND SUBSIDIARIES
Management’s Discussion and Analysis
Other Capital Metrics
The table below presents information on our shareholders’ equity and book value per common share.
| As of December | ||||||||
| $ in millions, except per share amounts | 2011 | 2010 | ||||||
Total shareholders’ equity | $ | 70,379 | $ | 77,356 | ||||
Common shareholders’ equity | 67,279 | 70,399 | ||||||
Tangible common shareholders’ equity | 61,811 | 64,877 | ||||||
Book value per common share | 130.31 | 128.72 | ||||||
Tangible book value per common share | 119.72 | 118.63 | ||||||
Tangible common shareholders’ equity. Tangible common shareholders’ equity equals total shareholders’ equity less preferred stock, goodwill and identifiable intangible assets. We believe that tangible common shareholders’ equity is meaningful because it is a measure that we and investors use to assess capital adequacy. Tangible common shareholders’ equity is a non-GAAP measure and may not be comparable to similar non-GAAP measures used by other companies.
The table below presents the reconciliation of total shareholders’ equity to tangible common shareholders’ equity.
| As of December | ||||||||
| in millions | 2011 | 2010 | ||||||
Total shareholders’ equity | $ | 70,379 | $ | 77,356 | ||||
Deduct: Preferred stock | (3,100 | ) | (6,957 | ) | ||||
Common shareholders’ equity | 67,279 | 70,399 | ||||||
Deduct: Goodwill and identifiable | (5,468 | ) | (5,522 | ) | ||||
Tangible common shareholders’ equity | $ | 61,811 | $ | 64,877 | ||||
Book value and tangible book value per common share.Book value and tangible book value per common share are based on common shares outstanding, including restricted stock units granted to employees with no future service requirements, of 516.3 million and 546.9 million as of December 2011 and December 2010, respectively. We believe that tangible book value per common share (tangible common shareholders’ equity divided by common shares outstanding) is meaningful because it is a measure that we and investors use to assess capital adequacy. Tangible book value per common share is a non-GAAP measure and may not be comparable to similar non-GAAP measures used by other companies.
Off-Balance-Sheet Arrangements
and Contractual Obligations
Off-Balance-Sheet Arrangements
We have various types of off-balance-sheet arrangements that we enter into in the ordinary course of business. Our involvement in these arrangements can take many different forms, including:
| Ÿ |
|
| Ÿ |
|
| Ÿ |
|
| Ÿ |
|
| Ÿ |
|
We enter into these arrangements for a variety of business purposes, including securitizations. The securitization vehicles that purchase mortgages, corporate bonds, and other types of financial assets are critical to the functioning of several significant investor markets, including the mortgage-backed and other asset-backed securities markets, since they offer investors access to specific cash flows and risks created through the securitization process.
We also enter into these arrangements to underwrite client securitization transactions; provide secondary market liquidity; make investments in performing and nonperforming debt, equity, real estate and other assets; provide investors with credit-linked and asset-repackaged notes; and receive or provide letters of credit to satisfy margin requirements and to facilitate the clearance and settlement process.
THE GOLDMAN SACHS GROUP, INC. AND SUBSIDIARIES
Management’s Discussion and Analysis
Our financial interests in, and derivative transactions with, such nonconsolidated entities are generally accounted for at fair value, in the same manner as our other financial instruments, except in cases where we apply the equity method of accounting.
The table below presents where a discussion of our various off-balance-sheet arrangements may be found in Part II, Items 7 and 8 of thisthe 2014 Form 10-K. In addition, see Note 3 to the consolidated financial statements in Part II, Item 8 of this Form 10-K for a discussion of our consolidation policies.
| Type of Off-Balance-Sheet Arrangement | Disclosure in Form 10-K | |||
Variable interests and other obligations, including contingent obligations, arising from variable interests in nonconsolidated VIEs | See Note | |||
Leases, letters of credit, and lending and other commitments | See “Contractual Obligations” below and Note 18 to the consolidated financial | |||
Guarantees | See “Contractual Obligations” below and Note 18 to the consolidated financial | |||
Derivatives | See “Credit Risk Management — Credit Exposures — OTC Derivatives” below and Notes 4, 5, 7 and 18 to the consolidated financial | |||
| Goldman Sachs | 83 |
THE GOLDMAN SACHS GROUP, INC. AND SUBSIDIARIES
Management’s Discussion and Analysis
Contractual Obligations
We have certain contractual obligations which require us to make future cash payments. These contractual obligations include our unsecured long-term borrowings, secured long-term financings, time deposits and contractual interest payments, and insurance agreements, all of which are included in our consolidated statementstatements of financial condition. Our obligations to make
future cash payments
also include certain off-balance-sheet contractual obligations such as purchase obligations, minimum rental payments under noncancelable leases and commitments and guarantees.
The table below presents our contractual obligations, commitments and guarantees as of December 2011.2014.
| in millions | 2012 | 2013-2014 | 2015-2016 | 2017- Thereafter | Total | |||||||||||||||||||||||||||||||||||
| $ in millions | 2015 | | 2016 - 2017 | | | 2018 - 2019 | | | 2020 - Thereafter | | Total | |||||||||||||||||||||||||||||
Amounts related to on-balance-sheet obligations | ||||||||||||||||||||||||||||||||||||||||
Time deposits 1 | $ | — | $ | 4,558 | $ | 1,754 | $ | 2,120 | $ | 8,432 | ||||||||||||||||||||||||||||||
Secured long-term financings 2 | — | 5,479 | 1,020 | 1,680 | 8,179 | |||||||||||||||||||||||||||||||||||
Unsecured long-term borrowings 3 | — | 45,548 | 42,520 | 85,477 | 173,545 | |||||||||||||||||||||||||||||||||||
Contractual interest payments 4 | 6,892 | 12,603 | 9,617 | 33,784 | 62,896 | |||||||||||||||||||||||||||||||||||
Insurance liabilities 5 | 1,211 | 2,191 | 1,823 | 18,118 | 23,343 | |||||||||||||||||||||||||||||||||||
Time deposits | $ — | $ 7,830 | $ 5,308 | $ 5,704 | $ 18,842 | |||||||||||||||||||||||||||||||||||
Secured long-term financings | — | 5,104 | 1,403 | 742 | 7,249 | |||||||||||||||||||||||||||||||||||
Unsecured long-term borrowings | — | 44,342 | 40,345 | 82,884 | 167,571 | |||||||||||||||||||||||||||||||||||
Contractual interest payments | 6,859 | 12,172 | 4,850 | 37,535 | 61,416 | |||||||||||||||||||||||||||||||||||
Subordinated liabilities issued by consolidated VIEs | 47 | 36 | — | 1,007 | 1,090 | 3 | — | — | 840 | 843 | ||||||||||||||||||||||||||||||
Amounts related to off-balance-sheet arrangements | ||||||||||||||||||||||||||||||||||||||||
Commitments to extend credit | 12,172 | 14,685 | 37,692 | 1,196 | 65,745 | 15,154 | 23,235 | 50,423 | 7,137 | 95,949 | ||||||||||||||||||||||||||||||
Contingent and forward starting resale and securities borrowing agreements | 54,522 | — | — | — | 54,522 | 34,343 | 557 | 325 | — | 35,225 | ||||||||||||||||||||||||||||||
Forward starting repurchase and secured lending agreements | 17,964 | — | — | — | 17,964 | 8,180 | — | — | — | 8,180 | ||||||||||||||||||||||||||||||
Letters of credit | 1,145 | 58 | 145 | 5 | 1,353 | 280 | 14 | 10 | 4 | 308 | ||||||||||||||||||||||||||||||
Investment commitments | 2,455 | 4,764 | 439 | 1,460 | 9,118 | |||||||||||||||||||||||||||||||||||
Investment commitments 1 | 1,684 | 2,818 | 25 | 637 | 5,164 | |||||||||||||||||||||||||||||||||||
Other commitments | 5,200 | 101 | 34 | 7 | 5,342 | 6,136 | 87 | 42 | 56 | 6,321 | ||||||||||||||||||||||||||||||
Minimum rental payments | 440 | 805 | 638 | 1,380 | 3,263 | 321 | 566 | 416 | 870 | 2,173 | ||||||||||||||||||||||||||||||
Derivative guarantees | 486,244 | 206,853 | 53,743 | 49,576 | 796,416 | 351,308 | 150,989 | 51,927 | 58,511 | 612,735 | ||||||||||||||||||||||||||||||
Securities lending indemnifications | 27,798 | — | — | — | 27,798 | 27,567 | — | — | — | 27,567 | ||||||||||||||||||||||||||||||
Other financial guarantees | 625 | 795 | 1,209 | 939 | 3,568 | 471 | 935 | 1,390 | 1,690 | 4,486 | ||||||||||||||||||||||||||||||
| 1. |
|
|
|
|
|
THE GOLDMAN SACHS GROUP, INC. AND SUBSIDIARIES
Management’s Discussion and Analysis
In the table above:
| Ÿ | Obligations maturing within one year of our financial statement date or redeemable within one year of our financial statement date at the option of the holder are excluded and are treated as short-term obligations. |
| Ÿ | Obligations that are repayable prior to maturity at our option are reflected at their contractual maturity dates and obligations that are redeemable prior to maturity at the option of the holders are reflected at the dates such options become exercisable. |
| Ÿ | Amounts included in the table do not necessarily reflect the actual future cash flow requirements for these arrangements because commitments and guarantees represent notional amounts and may expire unused or be reduced or cancelled at the counterparty’s request. |
| Ÿ | Due to the uncertainty of the timing and amounts that will ultimately be paid, our liability for unrecognized tax benefits has been excluded. See Note 24 to the consolidated financial statements |
| Ÿ | Unsecured long-term borrowings includes $9.54 billion of adjustments to the carrying value of certain unsecured long-term borrowings resulting from the application of hedge accounting. |
| Ÿ | The aggregate contractual principal amount of secured long-term financings and unsecured long-term borrowings for which the fair value option was elected exceeded the related fair value by $203 million and $163 million, respectively. |
| Ÿ | Contractual interest payments represents estimated future interest payments related to unsecured long-term borrowings, secured long-term financings and time deposits based on applicable interest rates as of December 2014, and includes stated coupons, if any, on structured notes. |
| 84 | Goldman Sachs 2014 Form 10-K |
THE GOLDMAN SACHS GROUP, INC. AND SUBSIDIARIES
Management’s Discussion and Analysis
See Notes 15 and 18 to the consolidated financial statements in Part II, Item 8 of this Form 10-K for further information about our short-term borrowings and commitments and guarantees.guarantees, respectively.
As of December 2011,2014, our unsecured long-term borrowings were $173.55$167.57 billion, with maturities extending to 2061, and consisted principally of senior borrowings. See Note 16 to the consolidated financial statements in Part II, Item 8 of this Form 10-K for further information about our unsecured long-term borrowings.
As of December 2011,2014, our future minimum rental payments, net of minimum sublease rentals under noncancelable leases, were $3.26$2.17 billion. These lease commitments, principally for office space, expire on various dates through 2069. Certain agreements are subject to periodic escalation provisions for increases in real estate taxes and other charges. See Note 18 to the consolidated financial statements in Part II, Item 8 of this Form 10-K for further information about our leases.
Our occupancy expenses include costs associated with office space held in excess of our current requirements. This excess space, the cost of which is charged to earnings as
incurred, is being held for potential growth or to replace currently occupied space that we may exit in the future. We regularly evaluate our current and future space capacity in relation to current and projected staffing levels. For the year ended December 2011,2014, total occupancy expenses for space held in excess of our current requirements were $85 million, which includes costs related to the transition to our new headquarters in New York City. In addition, for the year ended December 2011, we incurredand exit costs of $14 million related to our office space.space were not material. We may incur exit costs in the future to the extent we (i) reduce our space capacity or (ii) commit to, or occupy, new properties in the locations in which we operate and, consequently, dispose of existing space that had been held for potential growth. These exit costs may be material to our results of operations in a given period.
Risk Management and Risk Factors
Risks are inherent in our business and include liquidity, market, credit, operational, legal, regulatory and reputational risks. For a further discussion of our risk management processes, see “— Overview and Structure of Risk Management” below. Our risks include the risks across our risk categories, regions or global businesses, as well as those which have uncertain outcomes and have the potential to materially impact our financial results, our liquidity and our reputation. For a further discussion of our areas of risk, see “— Liquidity Risk Management,” “— Market Risk Management,” “— Credit Risk Management,” “— Operational Risk Management” and “— Certain Risk Factors That May Affect Our Businesses” below.
| Goldman Sachs 2014 Form 10-K | 85 |
THE GOLDMAN SACHS GROUP, INC. AND SUBSIDIARIES
Management’s Discussion and Analysis
Overview and Structure of Risk
Management
Overview
We believe that effective risk management is of primary importance to the success of the firm. Accordingly, we have comprehensive risk management processes through which we monitor, evaluate and manage the risks we assume in conducting our activities. These include market, credit, liquidity, operational, legal, regulatory and reputational risk exposures. Our risk management framework is built around three core components: governance, processes and people.
Governance.Risk management governance starts with our Board, which plays an important role in reviewing and approving risk management policies and practices, both directly and through its committees, including its Risk Committee, which consists of all of our independent directors.Committee. The Board also receives periodic updatesregular briefings on firmwide risks, including market risk, liquidity risk, credit risk and operational risk from our independent control and support functions.functions, including the chief risk officer, and on matters impacting our reputation from the chair of our Firmwide Client and Business Standards Committee. The chief risk officer, as part of the review of the firmwide risk portfolio, regularly advises the Risk Committee of the Board of relevant risk metrics and material exposures. Next, at the most senior levels of the firm, our leaders are experienced risk managers, with a sophisticated and detailed understanding of the risks we take. Our senior managers lead and participate in risk-oriented committees, as do the leaders of our independent control and support functions — including those in internal audit, compliance, controllers, credit risk management, human capital management, legal, market risk management, operations, operational risk management, tax, technologyCompliance, Controllers, our Credit Risk Management department (Credit Risk Management), Human Capital Management, Legal, our Market Risk Management department (Market Risk Management), Operations, our Operational Risk Management department (Operational Risk Management), Tax, Technology and treasury.
THE GOLDMAN SACHS GROUP, INC. AND SUBSIDIARIES
Management’s Discussion and AnalysisTreasury.
The firm’sOur governance structure provides the protocol and responsibility for decision-making on risk management issues and ensures implementation of those decisions. We make extensive use of risk-related committees that meet regularly and serve as an important means to facilitate and foster ongoing discussions to identify, manage and mitigate risks.
We maintain strong communication about risk and we have a culture of collaboration in decision-making among the revenue-producing units, independent control and support functions, committees and senior management. While we believe that the first line of defense in managing risk rests with the managers in our revenue-producing units, we dedicate extensive resources to independent control and support functions in order to ensure a strong oversight structure and an appropriate segregation of duties. We regularly reinforce our strong culture of escalation and accountability across all divisions and functions.
Processes.We maintain various processes and procedures that are critical components of our risk management. First and foremost is our daily discipline of marking substantially all of the firm’sour inventory to current market levels. Goldman Sachs carries its inventory at fair value, with changes in valuation reflected immediately in our risk management systems and in net revenues. We do so because we believe this discipline is one of the most effective tools for assessing and managing risk and that it provides transparent and realistic insight into our financial exposures.
We also apply a rigorous framework of limits to control risk across multiple transactions, products, businesses and markets. This includes setting credit and market risk limits at a variety of levels and monitoring these limits on a daily basis. Limits are typically set at levels that will be periodically exceeded, rather than at levels which reflect our maximum risk appetite. This fosters an ongoing dialogue on risk among revenue-producing units, independent control and support functions, committees and senior management, as well as rapid escalation of risk-related matters. See “Market Risk Management” and “Credit Risk Management” for further information onabout our risk limits.
Active management of our positions is another important process. Proactive mitigation of our market and credit exposures minimizes the risk that we will be required to take outsized actions during periods of stress.
| 86 | Goldman Sachs 2014 Form 10-K |
THE GOLDMAN SACHS GROUP, INC. AND SUBSIDIARIES
Management’s Discussion and Analysis
We also focus on the rigor and effectiveness of the firm’sour risk systems. The goal of our risk management technology is to get the right information to the right people at the right time, which requires systems that are comprehensive, reliable and timely. We devote significant time and resources to our risk management technology to ensure that it consistently provides us with complete, accurate and timely information.
People. Even the best technology serves only as a tool for helping to make informed decisions in real time about the risks we are taking. Ultimately, effective risk management requires our people to interpret our risk data on an ongoing and timely basis and adjust risk positions accordingly. In both our revenue-producing units and our independent control and support functions, the experience of our professionals, and their understanding of the nuances and limitations of each risk measure, guide the firmus in assessing exposures and maintaining them within prudent levels.
We reinforce a culture of effective risk management in our training and development programs as well as the way we evaluate performance, and recognize and reward our people. Our training and development programs, including certain sessions led by our most senior leaders, are focused on the importance of risk management, client relationships and reputational excellence. As part of our annual performance review process, we assess reputational excellence including how an employee exercises good risk management and reputational judgment, and adheres to our code of conduct and compliance policies. Our review and reward processes are designed to communicate and reinforce to our professionals the link between behavior and how people are recognized, the need to focus on our clients and our reputation, and the need to always act in accordance with the highest standards of the firm.
Structure
Ultimate oversight of risk is the responsibility of the firm’sour Board. The Board oversees risk both directly and through its committees, including its Risk Committee. Within the firm, a series of committees with specific risk management mandates have oversight or decision-making responsibilities for risk management activities. Committee membership generally consists of senior managers from both our revenue-producing units and our independent control and support functions. We have established procedures for these committees to ensure that appropriate information barriers are in place. Our primary risk committees, most of which also have additional sub-committees or working groups, are described below. In addition to these committees, we have other risk-oriented committees which provide oversight for different businesses, activities, products, regions and legal entities. All of our firmwide, regional and divisional committees have responsibility for considering the impact of transactions and activities which they oversee on our reputation.
Membership of the firm’sour risk committees is reviewed regularly and updated to reflect changes in the responsibilities of the committee members. Accordingly, the length of time that members serve on the respective committees varies as determined by the committee chairs and based on the responsibilities of the members within the firm.
In addition, independent control and support functions, which report to the chief financial officer, the chief risk officer, the general counsel and the chief administrative officer, or in the case of Internal Audit, to the Audit Committee of the Board, are responsible for day-to-day oversight or monitoring of risk, as discussed in greater detail in the following sections. Internal Audit, which reports to the Audit Committee of the Board and includes professionals with a broad range of audit and industry experience, including risk management expertise, is responsible for independently assessing and validating key controls within the risk management framework.
| Goldman Sachs |
THE GOLDMAN SACHS GROUP, INC. AND SUBSIDIARIES
Management’s Discussion and Analysis
The chart below presents an overview of our risk management governance structure, highlighting the oversight
oversight of our Board, our key risk-related committees and the independence of our control and support functions.
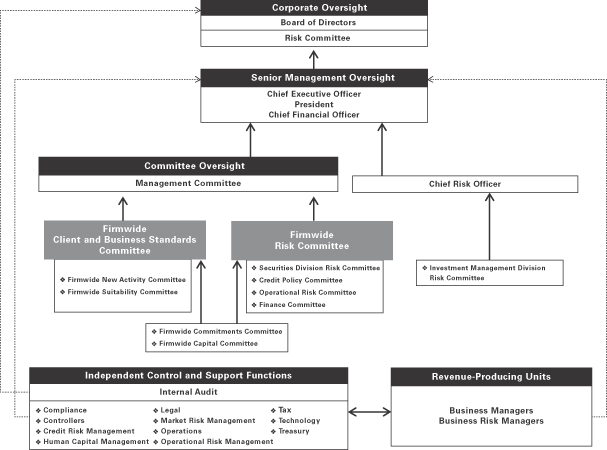
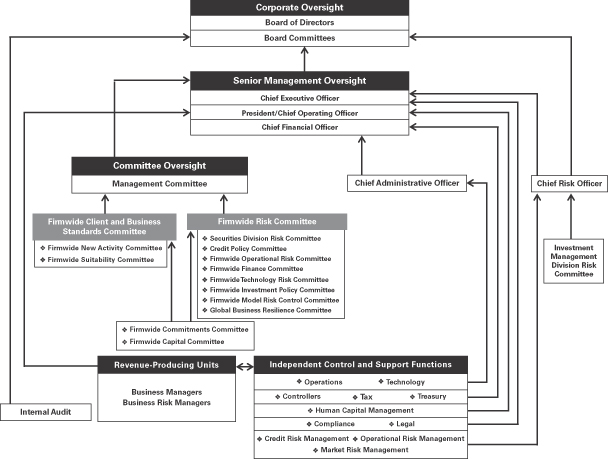
Management Committee.The Management Committee oversees theour global activities, of the firm, including all of the firm’sour independent control and support functions. It provides this oversight directly and through authority delegated to committees it has established. This committee is comprised of theour most senior leaders, of the firm, and is chaired by the firm’sour chief executive officer. The Management Committee has established various committees with delegated authority and the chairperson of the Management Committee appoints the chairpersons of these committees. Most members of the Management Committee are also members of other firmwide, divisional and regional committees. The following are the committees that are principally involved in firmwide risk management.
Firmwide Client and Business Standards Committee.The Firmwide Client and Business Standards Committee assesses and makes determinations regarding business standards and practices, reputational risk management, client relationships and client service, is chaired by the firm’sour president and chief operating officer, and reports to the Management Committee. This committee also has responsibility for overseeing the implementation of the recommendations of the Business Standards Committee. This committee periodically updates and receives guidance from the Public Responsibilities Subcommittee of the Corporate Governance, Nominating and Public Responsibilities Committee of the Board. This committee has established the following two risk-related committees that report to it:
| Goldman Sachs |
THE GOLDMAN SACHS GROUP, INC. AND SUBSIDIARIES
Management’s Discussion and Analysis
| Ÿ | Firmwide New Activity Committee.The Firmwide New Activity Committee is responsible for reviewing new activities and for establishing a process to identify and review previously approved activities that are significant and that have changed in complexity and/or structure or present different reputational and suitability concerns over time to consider whether these activities remain appropriate. This committee is co-chaired by |
| Ÿ | Firmwide Suitability Committee. The Firmwide Suitability Committee is responsible for setting standards and policies for product, transaction and client suitability and providing a forum for consistency across divisions, regions and products on suitability assessments. This committee also reviews suitability matters escalated from other |
Firmwide Risk Committee. The Firmwide Risk Committee is globally responsible for the ongoing monitoring and controlmanagement of the firm’s globalour financial risks. Through both direct and delegated authority, the Firmwide Risk Committee approves firmwide, product, divisional and business-level limits for both market and credit risks, approves sovereign credit risk limits and reviews results of stress tests and scenario analyses. This committee is co-chaired by the firm’sour chief financial officer and a senior managing director from the firm’s executive office,our chief risk officer, and reports to the Management Committee. The following fourare the primary committees that report to the Firmwide Risk Committee, which is responsible for appointing theCommittee. The chairperson of eachthe Securities Division Risk Committee is appointed by the chairpersons of these committees:the Firmwide Risk Committee; the chairpersons of the Credit Policy and Firmwide Operational Risk Committees are appointed by our chief risk officer; the chairpersons of the Firmwide Finance Committee, the Firmwide Technology Risk Committee, the Firmwide Model Risk Control Committee and the Global Business Resilience Committee are appointed by the Firmwide Risk Committee; and the chairpersons of the Firmwide Investment Policy Committee are appointed by our president and chief operating officer in conjunction with our chief financial officer.
| Ÿ | Securities Division Risk Committee.The Securities Division Risk Committee sets market risk limits, subject to overall firmwide risk limits, for |
| Ÿ | Credit Policy Committee.The Credit Policy Committee establishes and reviews broad firmwide credit policies and parameters that are implemented by |
| Ÿ | Firmwide Operational Risk Committee.The Firmwide Operational Risk Committee provides oversight of the ongoing development and implementation of our operational risk policies, framework and methodologies, and monitors the effectiveness of operational risk management. This committee is |
| Ÿ | Firmwide Finance Committee. The Firmwide Finance Committee has oversight |
| Ÿ | Firmwide Technology Risk Committee. The Firmwide Technology Risk Committee reviews matters related to the design, development, deployment and use of technology. This committee oversees cyber security matters, as well as technology risk management frameworks and methodologies, and monitors their effectiveness. This committee is co-chaired by our chief information officer and the head of Global Investment Research. |
| Ÿ | Firmwide Investment Policy Committee. The Firmwide Investment Policy Committee reviews, approves and sets policies, and provides oversight, for certain illiquid principal investments. This committee is co-chaired by the |
| Goldman Sachs 2014 Form 10-K | 89 |
THE GOLDMAN SACHS GROUP, INC. AND SUBSIDIARIES
Management’s Discussion and Analysis
| Ÿ | Firmwide Model Risk Control Committee. The Firmwide Model Risk Control Committee is responsible for oversight of the development and implementation of model risk controls, which includes governance, policies and procedures related to our reliance on financial models. This committee is chaired by our chief |
| Ÿ | Global Business Resilience Committee. The Global Business Resilience Committee is responsible for oversight of business resilience initiatives, promoting increased levels of security and |
The following committees report jointly to the Firmwide Risk Committee and the Firmwide Client and Business Standards Committee.Committee:
| Ÿ | Firmwide Commitments Committee.The Firmwide Commitments Committee reviews |
THE GOLDMAN SACHS GROUP, INC. AND SUBSIDIARIES
Management’s Discussion and Analysis
| Ÿ | Firmwide Capital Committee.The Firmwide Capital Committee provides approval and oversight of debt-related |
Investment Management Division Risk Committee. The Investment Management Division Risk Committee is responsible for the ongoing monitoring and control of global market, counterparty credit and liquidity risks associated with the activities of our investment management businesses. The head of risk management for the Investment Management Division risk management is the chair of this committee. The Investment Management Division Risk Committee reports to the firm’sour chief risk officer.
Conflicts Management
Conflicts of interest and our approach to dealing with them are fundamental to our client relationships, our reputation and our long-term success. The term “conflict of interest” does not have a universally accepted meaning, and conflicts can arise in many forms within a business or between businesses. The responsibility for identifying potential conflicts, as well as complying with our policies and procedures, is shared by the entire firm.
We have a multilayered approach to resolving conflicts and addressing reputational risk. Our senior management oversees policies related to conflicts resolution, and, in conjunction with the Business Selection and Conflicts Resolution Group, the Legal Department and Compliance Division, the Firmwide Client and Business Standards Committee, and other internal committees, formulates policies, standards and principles, and assists in making judgments regarding the appropriate resolution of particular conflicts. Resolving potential conflicts necessarily depends on the facts and circumstances of a particular situation and the application of experienced and informed judgment.
As a general matter, the Business Selection and Conflicts Resolution Group reviews all financing and advisory assignments in Investment Banking and certain investing, lending and other activities of the firm. In addition, we have various transaction oversight committees, such as the Firmwide Capital, Commitments and Suitability Committees and other committees across the firm that also review new underwritings, loans, investments and structured products. These groups and committees work with internal and external counsel and the Compliance Division to evaluate and address any actual or potential conflicts.
We regularly assess our policies and procedures that address conflicts of interest in an effort to conduct our business in accordance with the highest ethical standards and in compliance with all applicable laws, rules, and regulations.
| 90 | Goldman Sachs 2014 Form 10-K |
THE GOLDMAN SACHS GROUP, INC. AND SUBSIDIARIES
Management’s Discussion and Analysis
Liquidity is of critical importance to financial institutions. Most of the recent failures of financial institutions have occurred in large part due to insufficient liquidity. Accordingly, the firm haswe have in place a comprehensive and conservative set of liquidity and funding policies to address both firm-specific and broader industry or market liquidity events. Our principal objective is to be able to fund the firm and to enable our core businesses to continue to serve clients and generate revenues, even under adverse circumstances.
We manage liquidity risk according to the following principles:
Excess Liquidity.Global Core Liquid Assets.We maintain substantial excess liquidity (GCLA, previously GCE) to meet a broad range of potential cash outflows and collateral needs in a stressed environment.
Asset-Liability Management.We assess anticipated holding periods for our assets and their expected liquidity in a stressed environment. We manage the maturities and diversity of our funding across markets, products and counterparties, and seek to maintain liabilities of appropriate tenor relative to our asset base.
Contingency Funding Plan.We maintain a contingency funding plan to provide a framework for analyzing and responding to a liquidity crisis situation or periods of market stress. This framework sets forth the plan of action to fund normal business activity in emergency and stress situations. These principles are discussed in more detail below.
Excess LiquidityGlobal Core Liquid Assets
Our most important liquidity policy is to pre-fund our estimated potential cash and collateral needs during a liquidity crisis and hold this excess liquidity in the form of unencumbered, highly liquid securities and cash. We believe that the securities held in our global core excessGCLA would be readily convertible to cash in a matter of days, through liquidation, by entering into repurchase agreements or from maturities of reverse repurchaseresale agreements, and that this cash would allow us to meet immediate obligations without needing to sell other assets or depend on additional funding from credit-sensitive markets.
As of December 20112014 and December 2010,2013, the fair value of the securities and certain overnight cash deposits included in our GCEGCLA, totaled $171.58$182.95 billion and $174.78$184.07 billion, respectively. Based on the results of our internal liquidity risk model,models, discussed below, as well as our consideration of other factors including, but not limited to, an assessment of our potential intraday liquidity needs and a qualitative assessment of the condition of the financial markets and the firm, we believe our liquidity position as of both December 20112014 and December 2013 was appropriate.
The table below presents the fair value of the securities and certain overnight cash deposits that are included in our GCE.GCLA.
Average for the Year Ended December | ||||||
| in millions | 2011 | 2010 | ||||
U.S. dollar-denominated | $125,668 | $130,072 | ||||
Non-U.S. dollar-denominated | 40,291 | 37,942 | ||||
Total | $165,959 | $168,014 | ||||
THE GOLDMAN SACHS GROUP, INC. AND SUBSIDIARIES
Management’s Discussion and Analysis
Average for the Year Ended December | ||||||||
| $ in millions | 2014 | 2013 | ||||||
U.S. dollar-denominated | $134,223 | $136,824 | ||||||
Non-U.S. dollar-denominated | 45,410 | 45,826 | ||||||
Total | $179,633 | $182,650 | ||||||
The U.S. dollar-denominated excessGCLA is composed of (i) unencumbered U.S. government and federal agency obligations (including highly liquid U.S. federal agency mortgage-backed obligations), all of which are eligible as collateral in Federal Reserve open market operations and (ii) certain overnight U.S. dollar cash deposits. The non-U.S. dollar-denominated excessGCLA is composed of only unencumbered German, French, Japanese and United Kingdom government obligations and certain overnight cash deposits in highly liquid currencies. We strictly limit our excess liquidityGCLA to this narrowly defined list of securities and cash because they are highly liquid, even in a difficult funding environment. We do not include other potential sources of excess liquidity in our GCLA, such as lower-qualityless liquid unencumbered securities or committed credit facilities, in our GCE.facilities.
| Goldman Sachs 2014 Form 10-K | 91 |
THE GOLDMAN SACHS GROUP, INC. AND SUBSIDIARIES
Management’s Discussion and Analysis
The table below presents the fair value of our GCEGCLA by asset class.
Average for the Year Ended December | ||||||||
| in millions | 2011 | 2010 | ||||||
Overnight cash deposits | $ | 34,622 | $ | 25,040 | ||||
Federal funds sold | — | 75 | ||||||
U.S. government obligations | 88,528 | 102,937 | ||||||
U.S. federal agency obligations, including highly liquid U.S. federal agency mortgage-backed obligations | 5,018 | 3,194 | ||||||
German, French, Japanese and United Kingdom government obligations | 37,791 | 36,768 | ||||||
Total | $ | 165,959 | $ | 168,014 | ||||
Average for the Year Ended December | ||||||||
| $ in millions | 2014 | 2013 | ||||||
Overnight cash deposits | $ 57,177 | $ 61,265 | ||||||
U.S. government obligations | 62,838 | 76,019 | ||||||
U.S. federal agency obligations, | 16,722 | 2,551 | ||||||
German, French, Japanese | 42,896 | 42,815 | ||||||
Total | $179,633 | $182,650 | ||||||
The GCE is held attable below presents the GCLA of Group Inc. and our major broker-dealer and bank subsidiaries, as presented in the table below.subsidiaries.
Average for the Year Ended December | Average for the Year Ended December | |||||||||||||||
| in millions | 2011 | 2010 | ||||||||||||||
| $ in millions | 2014 | 2013 | ||||||||||||||
Group Inc. | $ | 49,548 | $ | 53,757 | $ 37,699 | $ 29,752 | ||||||||||
Major broker-dealer subsidiaries | 75,086 | 69,223 | 89,549 | 93,103 | ||||||||||||
Major bank subsidiaries | 41,325 | 45,034 | 52,385 | 59,795 | ||||||||||||
Total | $ | 165,959 | $ | 168,014 | $179,633 | $182,650 | ||||||||||
Our GCEGCLA reflects the following principles:
| Ÿ | The first days or weeks of a liquidity crisis are the most critical to a company’s |
| Ÿ | Focus must be maintained on all potential cash and collateral outflows, not just disruptions to financing flows. Our businesses are diverse, and our liquidity needs are determined by many factors, including market movements, collateral requirements and client commitments, all of which can change dramatically in a difficult funding |
| Ÿ | During a liquidity crisis, credit-sensitive funding, including unsecured debt and some types of secured financing agreements, may be unavailable, and the terms (e.g., interest rates, collateral provisions and tenor) or availability of other types of secured financing may |
| Ÿ | As a result of our policy to pre-fund liquidity that we estimate may be needed in a crisis, we hold more unencumbered securities and have larger debt balances than our businesses would otherwise require. We believe that our liquidity is stronger with greater balances of highly liquid unencumbered securities, even though it increases our total assets and our funding costs. |
We believe that our GCEGCLA provides us with a resilient source of funds that would be available in advance of potential cash and collateral outflows and gives us significant flexibility in managing through a difficult funding environment.
In order to determine the appropriate size of our GCE,GCLA, we use an internal liquidity model, referred to as the Modeled Liquidity Outflow, which captures and quantifies the firm’sour liquidity risks. We also consider other factors including, but not limited to, an assessment of our potential intraday liquidity needs through an additional internal liquidity model, referred to as the Intraday Liquidity Model, and a qualitative assessment of the condition of the financial markets and the firm.
We distribute our GCEGCLA across subsidiaries,entities, asset types, and clearing agents to provide us with sufficient operating liquidity to ensure timely settlement in all major markets, even in a difficult funding environment.
We maintain our GCEGCLA to enable us to meet current and potential liquidity requirements of our parent company, Group Inc., and our major broker-dealer and bankits subsidiaries. TheOur Modeled Liquidity Outflow incorporatesand Intraday Liquidity Model incorporate a consolidated requirement for Group Inc. as well as a standalone requirement for each of our major broker-dealer and bank subsidiaries. Liquidity held directly in each of these major subsidiaries is intended for use only by that subsidiary to meet its liquidity requirements and is assumed not to be available to Group Inc. unless (i) legally provided for and (ii) there are no additional regulatory, tax or other restrictions. WeIn addition, the Modeled Liquidity Outflow and Intraday Liquidity Model also incorporate a broader assessment of standalone liquidity requirements for other subsidiaries and we hold a portion of our GCEGCLA directly at Group Inc. to support consolidated requirements not accounted for in the major subsidiaries.such requirements. In addition to the GCE,GCLA, we maintain operating cash balances in several of our other operating entities, primarily for use in specific currencies, entities, or jurisdictions where we do not have immediate access to parent company liquidity.
THE GOLDMAN SACHS GROUP, INC. AND SUBSIDIARIES
Management’s Discussion and Analysis
In addition to our GCE,GCLA, we have a significant amount of other unencumbered cash and financial“Financial instruments owned, at fair value,” including other government obligations, high-grade money market securities, corporate obligations, marginable equities, loans and cash deposits not included in our GCE.GCLA. The fair value of these assets averaged $83.32 billion and $72.98$94.52 billion for the years ended December 20112014 and December 2010, respectively.$90.77 billion for 2013. We do not consider these assets liquid enough to be eligible for our GCE liquidity poolGCLA.
| 92 | Goldman Sachs 2014 Form 10-K |
THE GOLDMAN SACHS GROUP, INC. AND SUBSIDIARIES
Management’s Discussion and therefore conservatively do not assume we will generate liquidity from these assets in our Modeled Liquidity Outflow.Analysis
Modeled Liquidity Outflow.Our Modeled Liquidity Outflow is based on a scenarioconducting multiple scenarios that includes both ainclude combinations of market-wide stress and a firm-specific stress,stress. These scenarios are characterized by some or all of the following qualitative elements:
| Ÿ |
|
|
|
| Ÿ | A firm-specific crisis potentially triggered by material losses, reputational damage, litigation, executive departure, and/or a ratings downgrade. |
The following are the critical modeling parameters of the Modeled Liquidity Outflow:
| Ÿ | Liquidity needs over a 30-day |
| Ÿ | A two-notch downgrade of |
| Ÿ | A combination of contractual outflows, such as upcoming maturities of unsecured debt, and contingent outflows (e.g., actions though not contractually required, we may deem necessary in a crisis). We assume that most contingent outflows will occur within the initial days and weeks of a |
| Ÿ | No issuance of equity or unsecured |
| Ÿ | No support from government funding facilities. Although we have access to various central bank funding programs, we do not assume reliance on them as a source of funding in a liquidity |
|
| Ÿ |
|
The Modeled Liquidity Outflow is calculated and reported to senior management on a daily basis. We regularly refine our model to reflect changes in market or economic conditions and the firm’sour business mix.
The potential contractual and contingent cash and collateral outflows covered in our Modeled Liquidity Outflow include:
Unsecured Funding
| Ÿ | Contractual: All upcoming maturities of unsecured long-term debt, commercial paper, promissory notes and other unsecured funding products. We assume that we will be unable to issue new unsecured debt or rollover any maturing debt. |
| Ÿ | Contingent: Repurchases of our outstanding long-term debt, commercial paper and hybrid financial instruments in the ordinary course of business as a market maker. |
Deposits
| Ÿ | Contractual: All upcoming maturities of term deposits. We assume that we will be unable to raise new term deposits or rollover any maturing term deposits. |
| Ÿ | Contingent: Withdrawals of bank deposits that have no contractual maturity. The withdrawal assumptions reflect, among other factors, the type of deposit, whether the deposit is insured or uninsured, and |
Secured Funding
| Ÿ | Contractual: A portion of upcoming contractual maturities of secured funding due to either the inability to refinance or the ability to refinance only at wider haircuts (i.e., on terms which require us to post additional collateral). Our assumptions reflect, among other factors, the quality of the underlying collateral, counterparty roll probabilities (our assessment of the counterparty’s likelihood of continuing to provide funding on a secured basis at the maturity of the trade) and counterparty concentration. |
| Ÿ | Contingent: |
THE GOLDMAN SACHS GROUP, INC. AND SUBSIDIARIES
Management’s Discussion and Analysis
OTC Derivatives
| Ÿ | Contingent: Collateral postings to counterparties due to adverse changes in the value of our OTC |
| Ÿ | Contingent: Other outflows of cash or collateral related to OTC derivatives, excluding OTC-cleared, including the impact of trade terminations, collateral substitutions, collateral disputes, loss of rehypothecation rights, collateral calls or termination payments required by a two-notch downgrade in our credit ratings, and collateral that has not been called by counterparties, but is available to them. |
| Goldman Sachs 2014 Form 10-K | 93 |
THE GOLDMAN SACHS GROUP, INC. AND SUBSIDIARIES
Management’s Discussion and Analysis
Exchange-Traded and OTC-cleared Derivatives
| Ÿ | Contingent: Variation margin postings required due to adverse changes in the value of our outstanding exchange-traded and OTC-cleared derivatives. |
| Ÿ | Contingent: An increase in initial margin and guaranty fund requirements by derivative clearing houses. |
Customer Cash and Securities
| Ÿ | Contingent: Liquidity outflows associated with our prime brokerage business, including withdrawals of customer credit balances, and a reduction in customer short positions, which may serve as a funding source for long positions. |
Firm Securities
| Ÿ | Contingent: Liquidity outflows associated with a reduction or composition change in firm short positions, which may serve as a funding source for long positions. |
Unfunded Commitments
| Ÿ | Contingent: Draws on our unfunded commitments. Draw assumptions reflect, among other things, the type of commitment and counterparty. |
Other
| Ÿ | Other upcoming large cash outflows, such as tax payments. |
Intraday Liquidity Model. Our Intraday Liquidity Model measures our intraday liquidity needs using a scenario analysis characterized by the same qualitative elements as our Modeled Liquidity Outflow. The model assesses the risk of increased intraday liquidity requirements during a scenario where access to sources of intraday liquidity may become constrained.
The following are key modeling elements of the Intraday Liquidity Model:
| Ÿ | Liquidity needs over a one-day settlement period; |
| Ÿ | Delays in receipt of counterparty cash payments; |
| Ÿ | A reduction in the availability of intraday credit lines at our third-party clearing agents; and |
| Ÿ | Higher settlement volumes due to an increase in activity. |
We regularly refine our model to reflect changes in market conditions, business mix and operational processes.
Asset-Liability Management
Our liquidity risk management policies are designed to ensure we have a sufficient amount of financing, even when funding markets experience persistent stress. We seek to maintain a long-dated and diversified funding profile, taking into consideration the characteristics and liquidity profile of our assets.
Our approach to asset-liability management includes:
| Ÿ | Conservatively managing the overall characteristics of our funding book, with a focus on maintaining long-term, diversified sources of funding in excess of our current requirements. See “Balance Sheet and Funding Sources — Funding Sources” for additional |
| Ÿ | Actively managing and monitoring our asset base, with particular focus on the liquidity, holding period and our ability to fund assets on a secured basis. This enables us to determine the most appropriate funding products and tenors. |
| Ÿ | Raising secured and unsecured financing that has a |
Our goal is to haveensure that we maintain sufficient liquidity to fund our assets and meet our contractual and contingent obligations in normal times as well as during periods of market stress. Through our dynamic balance sheet management process, we use actual and projected asset balances to determine secured and unsecured funding requirements. Funding plans are reviewed and approved by the Firmwide Finance Committee on a quarterly basis. In addition, senior managers in our independent control and support functions regularly analyze, and the Firmwide Finance Committee reviews, our consolidated total capital position (unsecured long-term borrowings plus total shareholders’ equity) so that we canmaintain a level of long-term funding that is sufficient to meet our long-term financing requirements. In a liquidity crisis, we would first use our GCLA in order to avoid reliance on asset sales (other than our GCE)GCLA). However, we recognize that orderly asset sales may be prudent or necessary in a severe or persistent liquidity crisis. The target amount of our total capital is based on an internal funding model which incorporates the following long-term financing requirements:
|
|
|
|
|
| 94 | Goldman Sachs |
THE GOLDMAN SACHS GROUP, INC. AND SUBSIDIARIES
Management’s Discussion and Analysis
Subsidiary Funding Policies.The majority of our unsecured funding is raised by Group Inc. which lends the necessary funds to its subsidiaries, some of which are regulated, to meet their asset financing, liquidity and capital requirements. In addition, Group Inc. provides its regulated subsidiaries with the necessary capital to meet their regulatory requirements. The benefits of this approach to subsidiary funding are enhanced control and greater flexibility to meet the funding requirements of our subsidiaries. Funding is also raised at the subsidiary level through a variety of products, including secured funding, unsecured borrowings and deposits.
Our intercompany funding policies assume that, unless legally provided for, a subsidiary’s funds or securities are not freely available to its parent company or other subsidiaries. In particular, many of our subsidiaries are subject to laws that authorize regulatory bodies to block or reduce the flow of funds from those subsidiaries to Group Inc. Regulatory action of that kind could impede access to funds that Group Inc. needs to make payments on its obligations. Accordingly, we assume that the capital provided to our regulated subsidiaries is not available to Group Inc. or other subsidiaries and any other financing provided to our regulated subsidiaries is not available until the maturity of such financing.
Group Inc. has provided substantial amounts of equity and subordinated indebtedness, directly or indirectly, to its regulated subsidiaries. For example, as of December 2011,2014, Group Inc. had $28.16$29.90 billion of equity and subordinated indebtedness invested in GS&Co., its principal U.S. registered broker-dealer; $28.43$27.68 billion invested in GSI, a regulated U.K. broker-dealer; $2.67$2.28 billion invested in GSEC, a U.S. registered broker-dealer; $4.28$2.68 billion invested in Goldman Sachs Japan Co., Ltd. (GSJCL), a regulated Japanese broker-dealer; and $19.23$23.50 billion invested in GS Bank USA, a regulated New York State-chartered bank; and $3.53 billion invested in GSIB, a regulated U.K. bank. Group Inc. also provided, directly or indirectly, $84.83$80.23 billion of unsubordinated loans and $6.12$8.61 billion of collateral to these entities, substantially all of which was to GS&Co., GSI, GSJCL and GSI,GS Bank USA, as of December 2011.2014. In addition, as of December 2011,2014, Group Inc. had significant amounts of capital invested in and loans to its other regulated subsidiaries.
Contingency Funding Plan
The Goldman Sachs contingency funding planContingency Funding Plan sets out the plan of action we would use to fund business activity in crisis situations and periods of market stress. The contingency funding plan outlines a list of potential risk factors, key reports and metrics that are reviewed on an ongoing basis to assist in assessing the severity of, and managing through, a liquidity crisis and/or market dislocation. The contingency funding plan also describes in detail the firm’sour potential responses if our assessments indicate that the firm haswe have entered a liquidity crisis, which include pre-funding for what we estimate will be our potential cash and collateral needs as well as utilizing secondary sources of liquidity. Mitigants and action items to address specific risks which may arise are also described and assigned to individuals responsible for execution.
The contingency funding plan identifies key groups of individuals to foster effective coordination, control and distribution of information, all of which are critical in the management of a crisis or period of market stress. The contingency funding plan also details the responsibilities of these groups and individuals, which include making and disseminating key decisions, coordinating all contingency activities throughout the duration of the crisis or period of market stress, implementing liquidity maintenance activities and managing internal and external communication.
Liquidity Regulatory Framework
The Basel Committee’s international framework for liquidity risk measurement, standards and monitoring calls for a liquidity coverage ratio (LCR), designed to ensure that banks and bank holding companies maintain an adequate level of unencumbered high-quality liquid assets based on expected net cash outflows under an acute short-term liquidity stress scenario.
| Goldman Sachs | 95 |
THE GOLDMAN SACHS GROUP, INC. AND SUBSIDIARIES
Management’s Discussion and Analysis
During 2014, the Office of the Comptroller of the Currency, the Federal Reserve Board and the FDIC approved the final rules on minimum liquidity standards that are generally consistent with the Basel Committee’s framework as described above, but include accelerated transition provisions, and more stringent requirements related to both the range of assets that qualify as high-quality liquid assets and cash outflow assumptions for certain types of funding and other liquidity risks. Under the accelerated transition timeline, the LCR became effective in the United States on January 1, 2015, with a phase-in period whereby firms have an 80% minimum in 2015, which will increase by 10% per year until 2017. As of December 2014, our calculation of the LCR exceeds the fully phased-in minimum requirement, however this is based on our interpretation and understanding of the finalized framework and may evolve as we review our interpretation and application with our regulators.
The Basel Committee’s international framework for liquidity risk measurement, standards and monitoring also calls for a net stable funding ratio (NSFR), designed to promote more medium- and long-term stable funding of the assets and off-balance-sheet activities of banks and bank holding companies over a one-year time horizon. In 2014, the Basel Committee issued the final rules on the calculation of the NSFR which requires banks and bank holding companies to maintain a stable funding profile in relation to the composition of their assets and off-balance-sheet activities. Under the Basel Committee framework, the NSFR will be effective on January 1, 2018. The U.S. federal bank regulatory agencies have not yet proposed rules implementing the NSFR for U.S. banking organizations. We are currently evaluating the impact of the Basel Committee’s NSFR framework.
The implementation of these rules, and any amendments adopted by the U.S. federal bank regulatory agencies, could impact our liquidity and funding requirements and practices in the future.
Credit Ratings
The table below presents our unsecured credit ratings (excluding debt guaranteed by the FDIC under the TLGP) and outlook.
|
|
|
|
|
| |||||||||||||||||||
| ||||||||||||||||||||||||
| ||||||||||||||||||||||||
| ||||||||||||||||||||||||
| ||||||||||||||||||||||||
| ||||||||||||||||||||||||
|
|
|
|
|
|
|
|
|
|
|
During the fourth quarter of 2011, after revising its global rating methodology for banks, Standard & Poor’s Ratings Services lowered Group Inc.’s ratings on long-term debt (from A to A-), short-term debt (from A-1 to A-2), subordinated debt (from A- to BBB+), trust preferred (from BBB- to BB+) and preferred stock (from BBB- to BB+), and retained its outlook of “negative.” In addition, as part of a global review of financial institutions, Fitch, Inc. lowered Group Inc.’s ratings on long-term debt (from A+ to A), short-term debt (from F1+ to F1), subordinated debt (from A to A-), trust preferred (from A- to BBB+) and preferred stock (from A- to BBB+), and retained its outlook of “stable.”
On February 10, 2012, Standard & Poor’s Ratings Services assigned GS Bank USA, a rating of A-1 as a short-term issuer and A as a long-term issuer.
On February 15, 2012, Moody’s Investors Service placed the long- and short-term debt ratings of Group Inc. under review for downgrade as part of a global review of financial institutions.
We rely on the short-term and long-term debt capital markets to fund a significant portion of our day-to-day operations and the cost and availability of debt financing is influenced by our credit ratings. Credit ratings are also important when we are competing in certain markets, such as OTC derivatives, and when we seek to engage in longer-term transactions. See “Certain Risk Factors That May Affect Our Businesses” below and “Risk Factors” in Part I, Item 1A of thisthe 2014 Form 10-K for a discussion of the risks associated with a reduction in our credit ratings.
The table below presents the unsecured credit ratings by DBRS, Inc. (DBRS), Fitch, Inc. (Fitch), Moody’s Investors Service (Moody’s), Standard & Poor’s Ratings Services (S&P), and Rating and Investment Information, Inc. (R&I) and outlook of Group Inc.
| As of December 2014 | ||||||||||||||||||||
| DBRS | Fitch | Moody’s | S&P | R&I | ||||||||||||||||
Short-term Debt | R-1 (middle | ) | F1 | P-2 | A-2 | a-1 | ||||||||||||||
Long-term Debt 1 | A (high | ) | A | Baa1 | A- | A+ | ||||||||||||||
Subordinated Debt | A | A- | Baa2 | BBB+ | A | |||||||||||||||
Trust Preferred 2 | A | BBB- | Baa3 | BB | N/A | |||||||||||||||
Preferred Stock 3 | BBB (high | ) | BB+ | Ba2 | BB | N/A | ||||||||||||||
Ratings Outlook | Stable | Stable | Stable | Negative | Negative | |||||||||||||||
| 1. | Fitch, Moody’s and S&P include the senior guaranteed trust securities issued by Murray Street Investment Trust I and Vesey Street Investment Trust I. |
| 2. | Trust preferred securities issued by Goldman Sachs Capital I. |
| 3. | DBRS, Fitch, Moody’s and S&P include Group Inc.’s non-cumulative preferred stock and the APEX issued by Goldman Sachs Capital II and Goldman Sachs Capital III. |
The table below presents the unsecured credit ratings of GS Bank USA, GSIB, GS&Co. and GSI. During the fourth quarter of 2014, S&P raised its outlook of GS Bank USA, GSIB, GS&Co. and GSI from negative to stable as a result of its review of these subsidiaries’ operating trends in the current regulatory environment.
| As of December 2014 | ||||||||||||
| Fitch | Moody’s | S&P | ||||||||||
GS Bank USA | ||||||||||||
Short-term Debt | F1 | P-1 | A-1 | |||||||||
Long-term Debt | A | A2 | A | |||||||||
Short-term Bank Deposits | F1 | P-1 | N/A | |||||||||
Long-term Bank Deposits | A+ | A2 | N/A | |||||||||
Ratings Outlook | Stable | Stable | Stable | |||||||||
GSIB | ||||||||||||
Short-term Debt | F1 | P-1 | A-1 | |||||||||
Long-term Debt | A | A2 | A | |||||||||
Short-term Bank Deposits | F1 | P-1 | N/A | |||||||||
Long-term Bank Deposits | A | A2 | N/A | |||||||||
Ratings Outlook | Stable | Stable | Stable | |||||||||
GS&Co. | ||||||||||||
Short-term Debt | F1 | N/A | A-1 | |||||||||
Long-term Debt | A | N/A | A | |||||||||
Ratings Outlook | Stable | N/A | Stable | |||||||||
GSI | ||||||||||||
Short-term Debt | F1 | P-1 | A-1 | |||||||||
Long-term Debt | A | A2 | A | |||||||||
Ratings Outlook | Stable | Stable | Stable | |||||||||
| 96 | Goldman Sachs 2014 Form 10-K |
THE GOLDMAN SACHS GROUP, INC. AND SUBSIDIARIES
Management’s Discussion and Analysis
We believe our credit ratings are primarily based on the credit rating agencies’ assessment of:
| Ÿ |
|
| Ÿ |
|
| Ÿ |
|
| Ÿ |
|
| Ÿ |
|
| Ÿ |
|
THE GOLDMAN SACHS GROUP, INC. AND SUBSIDIARIES
Management’s Discussion and Analysis
Certain of our derivatives have been transacted under bilateral agreements with counterparties who may require us to post collateral or terminate the transactions based on changes in our credit ratings. We assess the impact of these bilateral agreements by determining the collateral or termination payments that would occur assuming a downgrade by all rating agencies. A downgrade by any one rating agency, depending on the agency’s relative ratings of us at the time of the downgrade, may have an impact which is comparable to the impact of a downgrade by all rating agencies. We allocate a portion of our GCEGCLA to ensure we would be able to make the additional collateral or termination payments that may be required in the event of a two-notch reduction in our long-term credit ratings, as well as collateral that has not been called by counterparties, but is available to them. The table below presents the additional collateral or termination payments related to our net derivative liabilities under bilateral agreements that could have been called at the reporting date by counterparties in the event of a one-notch and two-notch downgrade in our credit ratings.
| As of December | ||||||||
| in millions | 2011 | 2010 | ||||||
Additional collateral or termination payments for a one-notch downgrade | $ | 1,303 | $ | 1,353 | ||||
Additional collateral or termination payments for a two-notch downgrade | 2,183 | 2,781 | ||||||
The Basel Committee on Banking Supervision’s international framework for liquidity risk measurement, standards and monitoring calls for imposition of a liquidity coverage ratio, designed to ensure that the banking entity maintains an adequate level of unencumbered high-quality liquid assets based on expected cash outflows under an acute liquidity stress scenario, and a net stable funding ratio, designed to promote more medium- and long-term funding of the assets and activities of banking entities over a one-year time horizon. The liquidity coverage ratio is not expected to be introduced as a requirement until January 1, 2015, and the net stable funding ratio is not expected to be introduced as a requirement until January 1, 2018. While the principles behind the new framework are broadly consistent with our current liquidity management framework, it is possible that the implementation of these standards could impact our liquidity and funding requirements and practices.
| As of December | ||||||||
| $ in millions | 2014 | 2013 | ||||||
Additional collateral or termination | $1,072 | $ 911 | ||||||
Additional collateral or termination | 2,815 | 2,989 | ||||||
Cash Flows
As a global financial institution, our cash flows are complex and bear little relation to our net earnings and net assets. Consequently, we believe that traditional cash flow analysis is less meaningful in evaluating our liquidity position than the excess liquidity and asset-liability management policies described above. Cash flow analysis may, however, be helpful in highlighting certain macro trends and strategic initiatives in our businesses.
Year Ended December 2011.2014.Our cash and cash equivalents increaseddecreased by $16.22$3.53 billion to $56.01$57.60 billion at the end of 2011.2014. We generated $23.13used $22.53 billion in net cash fromfor operating and investing activities. We used net cashactivities, which reflects an initiative to reduce our balance sheet, and the funding of $6.91 billion for financing activities, primarily for repurchases of our Series G Preferred Stock and common stock, partially offset by an increase in bank deposits.
Year Ended December 2010.Our cash and cash equivalents increased by $1.50 billion to $39.79 billion at the end of 2010.loans receivable. We generated $7.84$19.00 billion in net cash from financing activities primarily from an increase in bank deposits and net proceeds from issuances of short-term secured financings. We used net cash of $6.34 billion for operating and investing activities, primarily to fund an increase in securities purchased under agreements to resell and an increase in cash and securities segregated for regulatory and other purposes,unsecured long-term borrowings, partially offset by cash generated from a decrease in securities borrowed.repurchases of common stock.
Year Ended December 2009.2013.Our cash and cash equivalents increaseddecreased by $24.49$11.54 billion to $38.29$61.13 billion at the end of 2009.2013. We generated $48.88$4.54 billion in net cash from operating activities. We used net cash of $24.39$16.08 billion for investing and financing activities, primarily for net repayments in unsecuredto fund loans receivable and secured short-term borrowings and the repurchases of Series H Preferred Stockcommon stock.
Year Ended December 2012.Our cash and cash equivalents increased by $16.66 billion to $72.67 billion at the related common stock warrantend of 2012. We generated $9.14 billion in net cash from the U.S. Treasury, partially offset byoperating and investing activities. We generated $7.52 billion in net cash from financing activities from an increase in bank deposits, partially offset by net repayments of unsecured and the issuance of common stock.secured long-term borrowings.
| Goldman Sachs | 97 |
THE GOLDMAN SACHS GROUP, INC. AND SUBSIDIARIES
Management’s Discussion and Analysis
Overview
Market risk is the risk of loss in the value of our inventory, as well as certain other financial assets and financial liabilities, due to changes in market prices.conditions. We employ a variety of risk measures, each described in the respective sections below, to monitor market risk. We hold inventory primarily for market making for our clients and for our investing and lending activities. Our inventory therefore changes based on client demands and our investment opportunities. Our inventory is accounted for at fair value and therefore fluctuates on a daily basis.basis, with the related gains and losses included in “Market making,” and “Other principal transactions.” Categories of market risk include the following:
| Ÿ | Interest rate risk: results from exposures to changes in the level, slope and curvature of yield curves, the volatilities of interest rates, mortgage prepayment speeds and credit |
| Ÿ | Equity price risk: results from exposures to changes in prices and volatilities of individual equities, baskets of equities and equity |
| Ÿ | Currency rate risk: results from exposures to changes in spot prices, forward prices and volatilities of currency |
| Ÿ | Commodity price risk: results from exposures to changes in spot prices, forward prices and volatilities of commodities, such as |
Market Risk Management Process
We manage our market risk by diversifying exposures, controlling position sizes and establishing economic hedges in related securities or derivatives. This includes:
| Ÿ |
|
| Ÿ |
|
| Ÿ |
|
Market Risk Management, which is independent of the revenue-producing units and reports to the firm’sour chief risk officer, has primary responsibility for assessing, monitoring and managing market risk at the firm. We monitor and control risks through strong firmwide oversight and independent control and support functions across the firm’sour global businesses.
Managers in revenue-producing units are accountable for managing risk within prescribed limits. These managers have in-depth knowledge of their positions, of markets and the instruments available to hedge their exposures.
Managers in revenue-producing units and Market Risk Management discuss market information, positions and estimated risk and loss scenarios on an ongoing basis.
Risk Measures
Market Risk Management produces risk measures and monitors them against market risk limits set by our firm’s risk committees. These measures reflect an extensive range of scenarios and the results are aggregated at trading desk, business and firmwide levels.
We use a variety of risk measures to estimate the size of potential losses for both moderate and more extreme market moves over both short-term and long-term time horizons. RiskOur primary risk measures are VaR, which is used for shorter-term periods, include VaR and sensitivity metrics. For longer-term horizons, our primary risk measures are stress tests. Our risk reports detail key risks, drivers and changes for each desk and business, and are distributed daily to senior management of both our revenue-producing units and our independent control and support functions.
Systems
We have made a significant investment in technology to monitor market risk including:
|
|
|
|
|
THE GOLDMAN SACHS GROUP, INC. AND SUBSIDIARIES
Management’s Discussion and Analysis
Value-at-Risk
VaR is the potential loss in value of inventory positions due to adverse market movements over a defined time horizon with a specified confidence level. For positions included in VaR, see “— Financial Statement Linkages to Market Risk Measures.” We typically employ a one-day time horizon with a 95% confidence level. TheWe use a single VaR model which captures risks including interest rates, equity prices, currency rates and commodity prices. As such, VaR facilitates comparison across portfolios of different risk characteristics. VaR also captures the diversification of aggregated risk at the firmwide level.
| 98 | Goldman Sachs 2014 Form 10-K |
THE GOLDMAN SACHS GROUP, INC. AND SUBSIDIARIES
Management’s Discussion and Analysis
We are aware of the inherent limitations to VaR and therefore use a variety of risk measures in our market risk management process. Inherent limitations to VaR include:
| Ÿ | VaR does not estimate potential losses over longer time horizons where moves may be |
| Ÿ | VaR does not take account of the relative liquidity of different risk |
| Ÿ | Previous moves in market risk factors may not produce accurate predictions of all future market moves. |
When calculating VaR, we use historical simulations with full valuation of approximately 70,000 market factors. VaR is calculated at a position level based on simultaneously shocking the relevant market risk factors for that position. We sample from five years of historical data to generate the scenarios for our VaR calculation. The historical data used in our VaR calculation is weighted to giveso that the relative importance of the data reduces over time. This gives greater importance to more recent observations and reflectreflects current asset volatilities. Thisvolatilities, which improves the accuracy of our estimates of potential loss. As a result, even if our inventory positions included in VaR were unchanged, our VaR would increase with increasing market volatility and vice versa.
Given its reliance on historical data, VaR is most effective in estimating risk exposures in markets in which there are no sudden fundamental changes or shifts in market conditions.
We evaluate the accuracy of our VaR model through daily backtesting (i.e., comparing daily trading net revenues to the VaR measure calculated as of the prior business day) at the firmwide level and for each of our businesses and major regulated subsidiaries.
Our VaR measure does not include:
| Ÿ |
|
| Ÿ |
|
Stress Testing
Stress testing is a method of determining the effect of various hypothetical stress scenarios. We use stress testing to examine risks of specific portfolios as well as the potential impact of significant risk exposures across the firm. We use a variety of scenariosstress testing techniques to calculate the potential loss from a wide range of market moves on the firm’s portfolios. These scenarios include the defaultour portfolios, including sensitivity analysis, scenario analysis and firmwide stress tests. The results of single corporate or sovereign entities,our various stress tests are analyzed together for risk management purposes.
Sensitivity analysis is used to quantify the impact of a market move in a single risk factor across all positions (e.g., equity prices or credit spreads) using a variety of defined market shocks, ranging from those that could be expected over a one-day time horizon up to those that could take many months to occur. We also use sensitivity analysis to quantify the impact of the default of a single corporate entity, which captures the risk of large or concentrated exposures.
Scenario analysis is used to quantify the impact of a combinationspecified event, including how the event impacts multiple risk factors simultaneously. For example, for sovereign stress testing we calculate potential direct exposure associated with our sovereign inventory as well as the corresponding debt, equity and currency exposures associated with our non-sovereign inventory that may be impacted by the sovereign distress. When conducting scenario analysis, we typically consider a number of two or morepossible outcomes for each scenario, ranging from moderate to severely adverse market impacts. In addition, these stress tests are constructed using both historical events and forward-looking hypothetical scenarios.
Firmwide stress testing combines market, credit, operational and liquidity risks into a single combined scenario. Firmwide stress tests are primarily used to assess capital adequacy as part of our capital planning and stress testing process; however, we also ensure that firmwide stress testing is integrated into our risk factors.governance framework. This includes selecting appropriate scenarios to use for our capital planning and stress testing process. See “Equity Capital Management and Regulatory Capital — Equity Capital Management” above for further information.
| Goldman Sachs 2014 Form 10-K | 99 |
THE GOLDMAN SACHS GROUP, INC. AND SUBSIDIARIES
Management’s Discussion and Analysis
Unlike VaR measures, which have an implied probability because they are calculated at a specified confidence level, there is generally no implied probability that our stress test scenarios will occur. Instead, stress tests are used to model both moderate and more extreme moves in underlying market factors. When estimating potential loss, we generally assume that our positions cannot be reduced or hedged (although experience demonstrates that we are generally able to do so).
Stress test scenarios are conducted on a regular basis as part of the firm’sour routine risk management process and on an ad hoc basis in response to market events or concerns. Stress testing is an important part of the firm’sour risk management process because it allows us to quantify our exposure to tail risks, highlight potential loss concentrations, undertake risk/reward analysis, and assess and mitigate our risk positions.
Limits
We use risk limits at various levels in the firm (including firmwide, product and business) to govern risk appetite by controlling the size of our exposures to market risk. Limits are set based on VaR and on a range of stress tests relevant to our exposures. Limits are reviewed frequently and amended on a permanent or temporary basis to reflect changing market conditions, business conditions or tolerance for risk.
The Firmwide Risk Committee sets market risk limits at firmwide and product levels and our Securities Division Risk Committee sets sub-limits for market-making and investing activities at a business level. The purpose of the firmwide limits is to assist senior management in controlling the firm’sour overall risk profile. Sub-limits set the desired maximum amount of exposure that may be managed by any particular business on a day-to-day basis without additional levels of senior management approval, effectively leaving day-to-day trading decisions to individual desk managers and traders. Accordingly, sub-limits are a management tool designed to ensure appropriate escalation rather than to establish maximum risk tolerance. Sub-limits also distribute risk among various businesses in a manner that is consistent with their level of activity and client demand, taking into account the relative performance of each area.
THE GOLDMAN SACHS GROUP, INC. AND SUBSIDIARIES
Management’s Discussion and Analysis
Our market risk limits are monitored daily by Market Risk Management, which is responsible for identifying and escalating, on a timely basis, instances where limits have been exceeded. The business-level limits that are set by the Securities Division Risk Committee are subject to the same scrutiny and limit escalation policy as the firmwide limits.
When a risk limit has been exceeded (e.g., due to changes in market conditions, such as increased volatilities or changes in correlations), it is reported to the appropriate risk committee and a discussion takes place with the relevant desk managers, after which either the risk position is reduced or the risk limit is temporarily or permanently increased.
Model Review and Validation
Our VaR and stress testing models are subject to review and validation by our independent model validation group. This review includes:
| Ÿ | A critical evaluation of the model, its theoretical soundness and adequacy for intended use; |
| Ÿ | Verification of the testing strategy utilized by the model developers to ensure that the model functions as intended; and |
| Ÿ | Verification of the suitability of the calculation techniques incorporated in the model. |
Our VaR and stress testing models are regularly reviewed and enhanced in order to incorporate changes in the composition of positions included in our market risk measures, as well as variations in market conditions. Prior to implementing significant changes to our assumptions and/or models, we perform model validation and test runs. Significant changes to our VaR and stress testing models are reviewed with our chief risk officer and chief financial officer, and approved by the Firmwide Risk Committee.
We evaluate the accuracy of our VaR model through daily backtesting (i.e., by comparing daily trading net revenues to the VaR measure calculated as of the prior business day) at the firmwide level and for each of our businesses and major regulated subsidiaries.
| 100 | Goldman Sachs 2014 Form 10-K |
THE GOLDMAN SACHS GROUP, INC. AND SUBSIDIARIES
Management’s Discussion and Analysis
Systems
We have made a significant investment in technology to monitor market risk including:
| Ÿ | An independent calculation of VaR and stress measures; |
| Ÿ | Risk measures calculated at individual position levels; |
| Ÿ | Attribution of risk measures to individual risk factors of each position; |
| Ÿ | The ability to report many different views of the risk measures (e.g., by desk, business, product type or legal entity); and |
| Ÿ | The ability to produce ad hoc analyses in a timely manner. |
Metrics
We analyze VaR at the firmwide level and a variety of more detailed levels, including by risk category, business, and region. The tables below present, by risk category, average daily VaR and year-endperiod-end VaR, byas well as the high and low VaR for the period. Diversification effect in the tables below represents the difference between total VaR and the sum of the VaRs for the four risk category.categories. This effect arises because the four market risk categories are not perfectly correlated.
Average Daily VaRThe following table presents average daily VaR.
| in millions | Year Ended December | |||||||||||||||||||||||
| Risk Categories | 2011 | 2010 | 2009 | |||||||||||||||||||||
$ in millions
Risk Categories | Year Ended December | |||||||||||||||||||||||
| 2014 | 2013 | 2012 | ||||||||||||||||||||||
Interest rates | $ | 94 | $ | 93 | $ | 176 | $ 51 | $ 63 | $ 78 | |||||||||||||||
Equity prices | 33 | 68 | 66 | 26 | 32 | 26 | ||||||||||||||||||
Currency rates | 20 | 32 | 36 | 19 | 17 | 14 | ||||||||||||||||||
Commodity prices | 32 | 33 | 36 | 21 | 19 | 22 | ||||||||||||||||||
Diversification effect 1 | (66 | ) | (92 | ) | (96 | ) | ||||||||||||||||||
Diversification effect | (45 | ) | (51 | ) | (54 | ) | ||||||||||||||||||
Total | $ | 113 | $ | 134 | $ | 218 | $ 72 | $ 80 | $ 86 | |||||||||||||||
|
Our average daily VaR decreased to $113$72 million in 20112014 from $134$80 million in 2010,2013, primarily reflecting decreasesa decrease in the interest rates category due to decreased exposures and lower levels of volatility, and a decrease in the equity prices and currency rates categories,category principally due to reduced exposures.lower levels of volatility. These decreases were partially offset by a decrease in the diversification benefit across risk categories.
Our average daily VaR decreased to $134$80 million in 20102013 from $218$86 million in 2009, principally due to2012, primarily reflecting a decrease in the interest rates category which was primarilyprincipally due to reduced exposures, lower levels of volatility and tighter spreads.
Year-End VaR and High and Low VaR
| in millions | As of December | Year Ended December 2011 | ||||||||||||||||
| Risk Categories | 2011 | 2010 | High | Low | ||||||||||||||
Interest rates | $ | 100 | $ | 78 | $ | 147 | $ | 69 | ||||||||||
Equity prices | 31 | 51 | 119 | 14 | ||||||||||||||
Currency rates | 14 | 27 | 31 | 10 | ||||||||||||||
Commodity prices | 23 | 25 | 53 | 20 | ||||||||||||||
Diversification effect 1 | (69 | ) | (70 | ) | ||||||||||||||
Total | $ | 99 | $ | 111 | $ | 169 | $ | 82 | ||||||||||
|
Our daily VaR decreased to $99 million as of December 2011 from $111 million as of December 2010, primarily reflecting decreases in the equity prices and currency rates categories, principally due to reduced exposures. These decreases wereThis decrease was partially offset by an increase in the interestequity prices category principally due to increased exposures.
The following table presents year-end VaR, and high and low VaR.
$ in millions
Risk Categories | As of December | Year Ended December 2014 | ||||||||||||||||
| 2014 | 2013 | High | Low | |||||||||||||||
Interest rates | $ 53 | $ 59 | $ 71 | $37 | ||||||||||||||
Equity prices | 19 | 35 | 80 | 16 | ||||||||||||||
Currency rates | 24 | 16 | 36 | 10 | ||||||||||||||
Commodity prices | 23 | 20 | 30 | 15 | ||||||||||||||
Diversification effect | (42 | ) | (45 | ) | ||||||||||||||
Total | $ 77 | $ 85 | $116 | $51 | ||||||||||||||
Our daily VaR decreased to $77 million as of December 2014 from $85 million as of December 2013, primarily reflecting a decrease in the equity prices category principally due to decreased exposures. This decrease was partially offset by an increase in the currency rates category primarilyprincipally due to higher levels of volatility and wider credit spreads.increased exposures.
During the year ended December 2011,2014, the firmwide VaR risk limit was not exceeded, on one occasion. It was resolved by a temporary increase in the firmwide VaR risk limit, which was subsequently made permanent due to higher levels of volatility. The firmwide VaR risk limit had previously been reduced on one occasion in 2011, reflecting lower risk utilization and the market environment.raised or reduced.
During the year ended December 2010,2013, the firmwide VaR risk limit was not exceeded on one occasion in order to facilitate a client transaction and was resolved by a reduction in the risk position on the following day. Separately, during the year ended December 2010, the firmwide VaR risk limit was reduced on one occasion reflectingdue to lower risk utilization.levels of volatility.
| Goldman Sachs |
THE GOLDMAN SACHS GROUP, INC. AND SUBSIDIARIES
Management’s Discussion and Analysis
The chart below reflects theour daily VaR over the last four quarters.
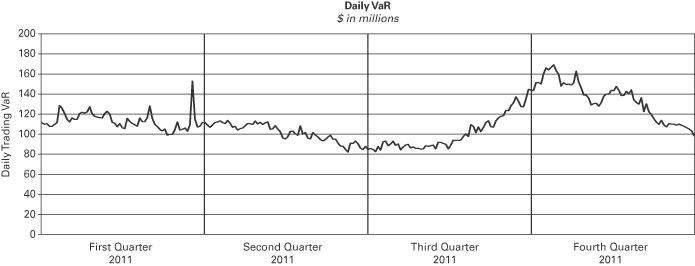
The chart below presents the frequency distribution of our daily trading net revenues for substantially all
inventory positions included in VaR for the year ended December 2011.
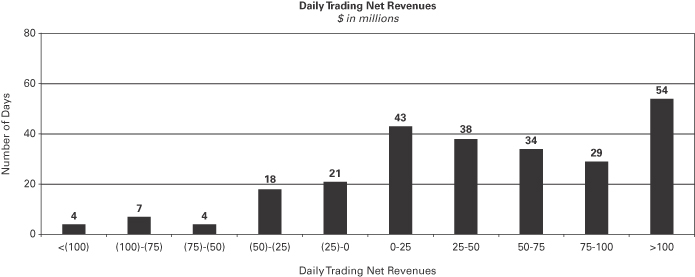
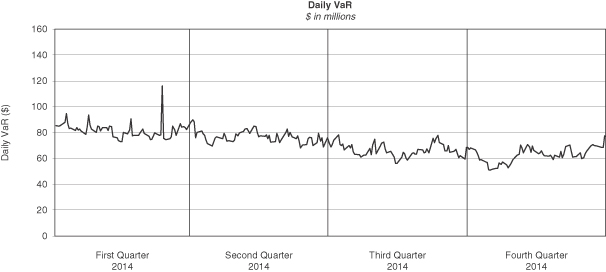
Daily trading net revenues are compared with VaR calculated as of the end of the prior business day. The firmTrading losses incurred trading losses on a single day in excess ofexceeded our 95%
one-day VaR on one occasion during 2014 (i.e., a VaR exception). Trading losses incurred on three occasionsa single day did not exceed our 95% one-day VaR during 2011 and on two occasions during 2010.2013.
THE GOLDMAN SACHS GROUP, INC. AND SUBSIDIARIES
Management’s Discussion and Analysis
During periods in which the firm haswe have significantly more positive net revenue days than net revenue loss days, we expect to have fewer VaR exceptions because, under normal conditions, our business model generally produces positive
net revenues. In periods in which our franchise revenues are adversely affected, we generally have more loss days, resulting in more VaR exceptions. In addition, VaR backtesting is performed against totalThe daily market-making revenues used to determine VaR exceptions reflect the impact of any intraday activity, including bid/offer net revenues, which are more likely than not to be positive by their nature.
The chart below presents the frequency distribution of our daily trading net revenues for substantially all positions included in VaR for 2014.
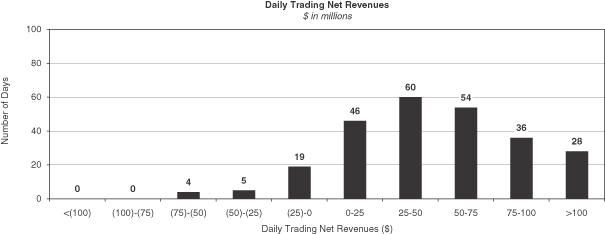
| 102 | Goldman Sachs 2014 Form 10-K |
THE GOLDMAN SACHS GROUP, INC. AND SUBSIDIARIES
Management’s Discussion and Analysis
Sensitivity Measures
Certain portfolios and individual positions are not included in VaR because VaR is not the most appropriate risk measure. Other sensitivity measures we use to analyze market risk are described below.
10% Sensitivity Measures. The table below presents market risk for inventory positions that are not included in VaR. The market risk of these positions is determined by estimating the potential reduction in net revenues of a 10% decline in the underlying asset value.
The table Equity positions below presents market risk for positionsrelate to private and restricted public equity securities, including interests in funds that invest in corporate equities and real estate and interests in hedge funds, which are not included in VaR.“Financial instruments owned, at fair value.” Debt positions include interests in funds that invest in corporate mezzanine and senior debt instruments, loans backed by commercial and residential real estate, corporate bank loans and other corporate debt, including acquired portfolios of distressed loans. These debt positions are included in “Financial instruments owned, at fair value.” See Note 6 to the consolidated financial statements for further information about cash instruments. These measures do not reflect diversification benefits across asset categories and therefore have not been aggregated.or across other market risk measures.
| Asset Categories | 10% Sensitivity | |||||||
| Amount as of December | ||||||||
| in millions | 2011 | 2010 | ||||||
ICBC 1 | $ 212 | $ 286 | ||||||
Equity (excluding ICBC) 2 | 2,458 | 2,529 | ||||||
Debt 3 | 1,521 | 1,655 | ||||||
$ in millions
Asset Categories | As of December | |||||||
| 2014 | 2013 | |||||||
Equity | $2,132 | $2,256 | ||||||
Debt | 1,686 | 1,522 | ||||||
Total | $3,818 | $3,778 | ||||||
|
|
|
Credit Spread Sensitivity on Derivatives and Borrowings.VaR excludes the impact of changes in counterparty and our own credit spreads on derivatives as well as changes in our own credit spreads on unsecured borrowings for which the fair value option was elected. The estimated sensitivity to a one basis point increase in credit spreads (counterparty and our own) on derivatives was a gain of $3 million and $4 million gain(including hedges) as of December 2011.2014 and December 2013, respectively. In addition, the estimated sensitivity to a one basis point increase in our own credit spreads on unsecured borrowings for which the fair value option was elected was a $7gain of $10 million gainand $8 million (including hedges) as of December 2011.2014 and December 2013, respectively. However, the actual net impact of a change in our own credit spreads is also affected by the liquidity, duration and convexity (as the sensitivity is not linear to changes in yields) of those unsecured borrowings for which the fair value option was elected, as well as the relative performance of any hedges undertaken.
The firm engages in insurance activities where we reinsure and purchase portfolios of insurance risk and pension liabilities. The risks associated with these activities include, but are not limited to: equity, interest rate, reinvestment and mortality risk. The firm mitigates risks associated with insurance activities through the use of reinsurance and hedging. Certain of the assets associated with the firm’s insurance activities are included in VaR. In addition to the positions included in VaR we held $4.86 billion of securities accounted for as available-for-saleInterest Rate Sensitivity. “Loans receivable” as of December 2011,2014 and December 2013 were $28.94 billion and $14.90 billion, respectively, substantially all of which support the firm’s insurance subsidiaries.had floating interest rates. As of December 2011, our available-for-sale securities primarily consisted2014 and December 2013, the estimated sensitivity to a 100 basis point increase in interest rates on such loans was $254 million and $136 million, respectively, of $1.81 billionadditional interest income over a 12-month period, which does not take into account the potential impact of corporate debt securities with an average yield of 5%,increase in costs to fund such loans. See Note 9 to the majority of which will mature after five years, $1.42 billion of mortgage and other asset-backedconsolidated financial statements for further information about loans and securities with an average yield of 10%, the majority of which will mature after ten years, and $662 million of U.S. government and federal agency obligations with an average yield of 3%, the majority of which will mature after ten years. As of December 2010, we held $3.67 billion of securities accounted for as available-for-sale primarily consisting of $1.69 billion of corporate debt securities with an average yield of 6%, the majority of which will mature after five years, $670 million of mortgage and other asset-backed loans and securities with an average yield of 11%, which will mature after ten years, and $637 million of U.S. government and federal agency obligations with an average yield of 4%, the majority of which will mature after ten years.receivable.
Other Market Risk Considerations
In addition, as of December 20112014 and December 2010,2013, we had commitments and held loans under the William Streetfor which we have obtained credit extension program. As of December 2010, we also held money market instruments under this program.loss protection from Sumitomo Mitsui Financial Group, Inc. See Note 18 to the consolidated financial statements in Part II, Item 8 of this Form 10-K for further information about our William Street credit extension program.such lending commitments.
Additionally, we make investments accounted for under the equity method and we also make direct investments in real estate, both of which are included in “Other assets” in the consolidated statements of financial condition.assets.” Direct investments in real estate are accounted for at cost less accumulated depreciation. See Note 1213 to the consolidated financial statements in Part II, Item 8 of this Form 10-K for information onabout “Other assets.”
| Goldman Sachs |
THE GOLDMAN SACHS GROUP, INC. AND SUBSIDIARIES
Management’s Discussion and Analysis
Financial Statement Linkages to Market Risk Measures
We employ a variety of risk measures, each described in the respective sections above, to monitor market risk across the consolidated statements of financial condition and consolidated statements of earnings. The related gains and losses on these positions are included in “Market making,” “Other principal transactions,” “Interest income” and “Interest expense.” The table below presents certain categories in our consolidated statements of financial condition and the market risk measures used to assess those assets and liabilities. Certain categories on the consolidated statements of financial condition are incorporated in more than one risk measure.
Categories on the | Market Risk Measures | |
Securities segregated for regulatory and other purposes, at fair value | Ÿ VaR | |
Collateralized agreements Ÿ Securities purchased under agreements to resell, at fair value Ÿ Securities borrowed, at fair value | Ÿ VaR | |
Receivables from customers and counterparties | ||
Ÿ Certain secured loans, at fair value | Ÿ VaR | |
Ÿ Loans receivable | Ÿ Interest Rate Sensitivity | |
Financial instruments owned, at fair value | Ÿ VaR Ÿ 10% Sensitivity Measures Ÿ Credit Spread | |
Collateralized financings Ÿ Securities sold under agreements to repurchase, at fair value Ÿ Securities loaned, at Ÿ Other secured financings, at fair value | Ÿ VaR | |
Financial instruments sold, but | Ÿ VaR Ÿ Credit Spread | |
Unsecured short-term borrowings and unsecuredlong-term borrowings, | Ÿ VaR Ÿ Credit Spread |
Overview
Credit risk represents the potential for loss due to the default or deterioration in credit quality of a counterparty (e.g., an OTC derivatives counterparty or a borrower) or an issuer of securities or other instruments we hold. Our exposure to credit risk comes mostly from client transactions in OTC derivatives and loans and lending commitments. Credit risk also comes from cash placed with banks, securities financing transactions (i.e., resale and repurchase agreements and securities borrowing and lending activities) and receivables from brokers, dealers, clearing organizations, customers and counterparties.
Credit Risk Management, which is independent of the revenue-producing units and reports to the firm’sour chief risk officer, has primary responsibility for assessing, monitoring and managing credit risk at the firm. The Credit Policy Committee and the Firmwide Risk Committee establish and review credit policies and parameters. In addition, we hold other positions that give rise to credit risk (e.g., bonds held in our inventory and secondary bank loans). These credit risks are captured as a component of market risk measures, which are monitored and managed by Market Risk Management, consistent with other inventory positions. We also enter into derivatives to manage market risk exposures. Such derivatives also give rise to credit risk which is monitored and managed by Credit Risk Management.
Policies authorized by the Firmwide Risk Committee and the Credit Policy Committee prescribe the level of formal approval required for the firmus to assume credit exposure to a counterparty across all product areas, taking into account any enforceableapplicable netting provisions, collateral or other credit risk mitigants.
| 104 | Goldman Sachs 2014 Form 10-K |
THE GOLDMAN SACHS GROUP, INC. AND SUBSIDIARIES
Management’s Discussion and Analysis
Credit Risk Management Process
Effective management of credit risk requires accurate and timely information, a high level of communication and knowledge of customers, countries, industries and products. Our process for managing credit risk includes:
| Ÿ |
|
| Ÿ |
|
| Ÿ |
|
| Ÿ |
|
| Ÿ |
|
| Ÿ |
|
| Ÿ |
|
As part of the risk assessment process, Credit Risk Management performs credit reviews which include initial and ongoing analyses of our counterparties. A credit review is an independent judgment about the capacity and willingness of a counterparty to meet its financial obligations. For substantially all of our credit exposures, the core of our process is an annual counterparty credit review. A counterpartycredit review is a writtenan independent analysis of the capacity and willingness of a counterparty’s business profile andcounterparty to meet its financial strengthobligations, resulting in an internal credit rating which represents the probability of default on financial obligations to the firm.rating. The determination of internal credit ratings also incorporates assumptions with respect to the counterparty’s future business performance, the nature of and outlook for the counterparty’s industry, and the economic environment. Senior personnel within Credit Risk Management, with expertise in specific industries, inspect and approve credit reviews and internal credit ratings.
Our global credit risk management systems capture credit exposure to individual counterparties and on an aggregate basis to counterparties and their subsidiaries (economic groups). These systems also provide management with comprehensive information on our aggregate credit risk by product, internal credit rating, industry, country and region.
Risk Measures and Limits
We measure our credit risk based on the potential loss in an event of non-payment by a counterparty. For derivatives and securities financing transactions, the primary measure is potential exposure, which is our estimate of the future exposure that could arise over the life of a transaction based on market movements within a specified confidence level. Potential exposure takes into account netting and collateral arrangements. For loans and lending commitments, the primary measure is a function of the notional amount of the position. We also monitor credit risk in terms of current exposure, which is the amount presently owed to the firmus after taking into account applicable netting and collateral.
THE GOLDMAN SACHS GROUP, INC. AND SUBSIDIARIES
Management’s Discussion and Analysis
We use credit limits at various levels (counterparty, economic group, industry, country) to control the size of our credit exposures. Limits for counterparties and economic groups are reviewed regularly and revised to reflect changing risk appetites for a given counterparty or group of counterparties. Limits for industries and countries are based on the firm’sour risk tolerance and are designed to allow for regular monitoring, review, escalation and management of credit risk concentrations.
Stress Tests/Scenario Analysis
We use regular stress tests to calculate the credit exposures, including potential concentrations that would result from applying shocks to counterparty credit ratings or credit risk factors (e.g., currency rates, interest rates, equity prices). These shocks include a wide range of moderate and more extreme market movements. Some of our stress tests include shocks to multiple risk factors, consistent with the occurrence of a severe market or economic event (e.g.,event. In the case of sovereign debt default).default, we estimate the direct impact of the default on our sovereign credit exposures, changes to our credit exposures arising from potential market moves in response to the default, and the impact of credit market deterioration on corporate borrowers and counterparties that may result from the sovereign default. Unlike potential exposure, which is calculated within a specified confidence level, with a stress test there is generally no assumed probability of these events occurring.
We run stress tests on a regular basis as part of our routine risk management processes and conduct tailored stress tests on an ad hoc basis in response to market developments. Stress tests are regularly conducted jointly with the firm’sour market and liquidity risk functions.
| Goldman Sachs 2014 Form 10-K | 105 |
THE GOLDMAN SACHS GROUP, INC. AND SUBSIDIARIES
Management’s Discussion and Analysis
Risk Mitigants
To reduce our credit exposures on derivatives and securities financing transactions, we may enter into netting agreements with counterparties that permit us to offset receivables and payables with such counterparties. We may also reduce credit risk with counterparties by entering into agreements that enable us to obtain collateral from them on an upfront or contingent basis and/or to terminate transactions if the counterparty’s credit rating falls below a specified level. We monitor the fair value of the collateral on a daily basis to ensure that our credit exposures are appropriately collateralized. We seek to minimize exposures where there is a significant positive correlation between the creditworthiness of our counterparties and the market value of collateral we receive.
For loans and lending commitments, we typically employ a variety of potential risk mitigants, depending on the credit quality of the borrower and other characteristics of the transaction.transaction, we employ a variety of potential risk mitigants. Risk mitigants include: collateral provisions, guarantees, covenants, structural seniority of the bank loan claims and, for certain lending commitments, provisions in the legal documentation that allow the firmus to adjust loan amounts, pricing, structure and other terms as market conditions change. The type and structure of risk mitigants employed can significantly influence the degree of credit risk involved in a loan.loan or lending commitment.
When we do not have sufficient visibility into a counterparty’s financial strength or when we believe a counterparty requires support from its parent company, we may obtain third-party guarantees of the counterparty’s obligations. We may also mitigate our credit risk using credit derivatives or participation agreements.
Credit Exposures
The firm’s credit exposures are described further below.
Cash and Cash Equivalents. Cash and cash equivalents include both interest-bearing and non-interest bearing deposits. To mitigate the risk of credit loss, we place substantially all of our deposits with highly rated banks and central banks.
OTC Derivatives.Derivatives are reported on a net-by-counterparty basis (i.e., the net payable or receivable for derivative assets and liabilities for a given counterparty) when a legal right of setoff exists under an enforceable netting agreement.
Derivatives are accounted for at fair value net of cash collateral received or posted under credit support agreements. As credit risk is an essential component of fair value, the firm includes a credit valuation adjustment (CVA) in the fair value of derivatives to reflect counterparty credit risk, as described in Note 7 to the consolidated financial statements in Part II, Item 8 of this Form 10-K. CVA is a function of the present value of expected exposure, the probability of counterparty default and the assumed recovery upon default.
THE GOLDMAN SACHS GROUP, INC. AND SUBSIDIARIES
Management’s Discussion and Analysis
The tables below present the distribution of our exposure to OTC derivatives by tenor, based on expected duration for mortgage-related credit derivatives and generally on remaining contractual maturity for other derivatives, both before and after the effect of collateral and netting agreements. Receivable and payable balances for the same counterparty across tenor categories are netted under
enforceable netting agreements, and cash collateral received is netted under credit support agreements. Receivable and payable balances with the same counterparty in the same tenor category are netted within such tenor category. The categories shown reflect our internally determined public rating agency equivalents.
| As of December 2011 | ||||||||||||||||||||||||||||
in millions Credit Rating Equivalent | 0 - 12 Months | 1 - 5 Years | 5 Years or Greater | Total | Netting | Exposure | Exposure Net of Collateral | |||||||||||||||||||||
AAA/Aaa | $ | 727 | $ | 786 | $ 2,297 | $ | 3,810 | $ | (729 | ) | $ 3,081 | $ 2,770 | ||||||||||||||||
AA/Aa2 | 4,661 | 10,198 | 28,094 | 42,953 | (22,972 | ) | 19,981 | 12,954 | ||||||||||||||||||||
A/A2 | 17,704 | 36,553 | 50,787 | 105,044 | (73,873 | ) | 31,171 | 17,109 | ||||||||||||||||||||
BBB/Baa2 | 7,376 | 14,222 | 25,612 | 47,210 | (36,214 | ) | 10,996 | 6,895 | ||||||||||||||||||||
BB/Ba2 or lower | 2,896 | 4,497 | 6,597 | 13,990 | (6,729 | ) | 7,261 | 4,527 | ||||||||||||||||||||
Unrated | 752 | 664 | 391 | 1,807 | (149 | ) | 1,658 | 1,064 | ||||||||||||||||||||
Total | $ | 34,116 | $ | 66,920 | $113,778 | $ | 214,814 | $ | (140,666 | ) | $74,148 | $45,319 | ||||||||||||||||
| As of December 2010 | ||||||||||||||||||||||||||||
in millions Credit Rating Equivalent | 0 - 12 Months | 1 - 5 Years | 5 Years or Greater | Total | Netting | Exposure | Exposure Net of Collateral | |||||||||||||||||||||
AAA/Aaa | $ | 504 | $ | 728 | $ 2,597 | $ | 3,829 | $ | (491 | ) | $ 3,338 | $ 3,088 | ||||||||||||||||
AA/Aa2 | 5,234 | 8,875 | 15,579 | 29,688 | (18,167 | ) | 11,521 | 6,935 | ||||||||||||||||||||
A/A2 | 13,556 | 38,522 | 49,568 | 101,646 | (74,650 | ) | 26,996 | 16,839 | ||||||||||||||||||||
BBB/Baa2 | 3,818 | 18,062 | 19,625 | 41,505 | (27,832 | ) | 13,673 | 8,182 | ||||||||||||||||||||
BB/Ba2 or lower | 3,583 | 5,382 | 3,650 | 12,615 | (4,553 | ) | 8,062 | 5,439 | ||||||||||||||||||||
Unrated | 709 | 1,081 | 332 | 2,122 | (20 | ) | 2,102 | 1,539 | ||||||||||||||||||||
Total | $ | 27,404 | $ | 72,650 | $91,351 | $ | 191,405 | $ | (125,713 | ) | $65,692 | $42,022 | ||||||||||||||||
THE GOLDMAN SACHS GROUP, INC. AND SUBSIDIARIES
Management’s Discussion and Analysis
Lending Activities. We manage the firm’s traditional credit origination activities, including funded loans, lending commitments and the William Street credit extension program, using the credit risk process, measures and limits described above. Other lending positions, including secondary trading positions, are risk-managed as a component of market risk.
Other Credit Exposures. The firm is exposed to credit risk from its receivables from brokers, dealers and clearing organizations and customers and counterparties. Receivables from brokers, dealers and clearing organizations are primarily comprised of initial margin placed with clearing organizations and receivables related to sales of securities which have traded, but not yet settled. These receivables have minimal credit risk due to the low probability of clearing organization default and the short-term nature of receivables related to securities settlements. Receivables from customers and counterparties are generally comprised of collateralized receivables related to customer securities transactions and have minimal credit risk due to both the value of the collateral received and the short-term nature of these receivables.
Credit Exposures
During the year endedAs of December 2011,2014, our credit exposures increased as compared with December 2013, primarily reflecting growthincreases in loans and lending activity and OTC derivatives, and increased cash balances. While credit spreads widened during the year ended December 2011, thecommitments. The percentage of our credit exposure arising from non-investment-grade counterparties (based on our internally determined public rating agency equivalents) increased from December 2013, primarily reflecting an increase in loans and lending commitments. During 2014, the number of counterparty defaults was essentially unchanged from December 2010. Counterparty defaults and the associated credit losses have remained at low levels during the year ended December 2011 as compared with the same prior year period.
The tables below present the firm’s credit exposures related to cash, OTC derivatives,2013, and such defaults primarily occurred within loans and lending commitmentscommitments. The total number of counterparty defaults remained low, representing less than 0.5% of all counterparties. Estimated losses associated with traditionalcounterparty defaults were higher compared with the prior year. However, such estimated losses were not material to the firm. Our credit origination activities broken down by industry, regionexposures are described further below.
Cash and internalCash Equivalents. Cash and cash equivalents include both interest-bearing and non-interest-bearing deposits. To mitigate the risk of credit rating.loss, we place substantially all of our deposits with highly-rated banks and central banks.
OTC Derivatives. Our credit exposure on OTC derivatives arises primarily from our market-making activities. As a market maker, we enter into derivative transactions to provide liquidity to clients and to facilitate the transfer and hedging of their risks. We also enter into derivatives to manage market risk exposures. We manage our credit exposure on OTC derivatives using the credit risk process, measures, limits and risk mitigants described above.
Derivatives are reported on a net-by-counterparty basis (i.e., the net payable or receivable for derivative assets and liabilities for a given counterparty) when a legal right of setoff exists under an enforceable netting agreement. Derivatives are accounted for at fair value, net of cash collateral received or posted under enforceable credit support agreements. We generally enter into OTC derivatives transactions under bilateral collateral arrangements with daily exchange of collateral.
As credit risk is an essential component of fair value, we include a credit valuation adjustment (CVA) in the fair value of derivatives to reflect counterparty credit risk, as described in Note 7 to the consolidated financial statements. CVA is a function of the present value of expected exposure, the probability of counterparty default and the assumed recovery upon default.
| 106 | Goldman Sachs |
THE GOLDMAN SACHS GROUP, INC. AND SUBSIDIARIES
Management’s Discussion and Analysis
The tables below present the distribution of our exposure to OTC derivatives by tenor, based on expected duration for mortgage-related credit derivatives and generally on remaining contractual maturity for other derivatives, both before and after the effect of collateral and netting agreements. Receivable and payable balances for the same counterparty across tenor categories are netted under enforceable netting agreements, and cash collateral received is netted under enforceable credit support agreements. Receivable and payable balances with the same counterparty in the same tenor category are netted within
such tenor category. Net credit exposure in the tables below represents OTC derivative assets, all of which are included in “Financial instruments owned, at fair value,” less cash collateral and the fair value of securities collateral, primarily U.S. government and federal agency obligations and non-U.S. government and agency obligations, received under credit support agreements, which management considers when determining credit risk, but such collateral is not eligible for netting under U.S. GAAP. The categories shown reflect our internally determined public rating agency equivalents.
| As of December 2014 | ||||||||||||||||||||||||||||
$ in millions
Credit Rating Equivalent | | 0 - 12 Months | | | 1 - 5 Years | | | 5 Years or Greater | | Total | Netting | | OTC Derivative Assets | | | Net Credit Exposure | | |||||||||||
AAA/Aaa | $ 1,119 | $ 898 | $ 3,500 | $ 5,517 | $ (2,163 | ) | $ 3,354 | $ 3,135 | ||||||||||||||||||||
AA/Aa2 | 8,260 | 12,182 | 40,443 | 60,885 | (42,513 | ) | 18,372 | 12,453 | ||||||||||||||||||||
A/A2 | 13,719 | 18,949 | 26,649 | 59,317 | (44,147 | ) | 15,170 | 9,493 | ||||||||||||||||||||
BBB/Baa2 | 7,049 | 8,758 | 26,087 | 41,894 | (28,321 | ) | 13,573 | 9,577 | ||||||||||||||||||||
BB/Ba2 or lower | 4,959 | 6,226 | 5,660 | 16,845 | (7,062 | ) | 9,783 | 8,506 | ||||||||||||||||||||
Unrated | 79 | 363 | 160 | 602 | (117 | ) | 485 | 188 | ||||||||||||||||||||
Total | $35,185 | $47,376 | $102,499 | $185,060 | $(124,323 | ) | $60,737 | $43,352 | ||||||||||||||||||||
| As of December 2013 | ||||||||||||||||||||||||||||
$ in millions
Credit Rating Equivalent | | 0 - 12 Months | | | 1 - 5 Years | | | 5 Years or Greater | | Total | Netting | | OTC Derivative Assets | | | Net Credit Exposure | | |||||||||||
AAA/Aaa | $ 473 | $ 1,470 | $ 2,450 | $ 4,393 | $ (2,087 | ) | $ 2,306 | $ 2,159 | ||||||||||||||||||||
AA/Aa2 | 3,463 | 7,642 | 29,926 | 41,031 | (27,918 | ) | 13,113 | 8,596 | ||||||||||||||||||||
A/A2 | 12,693 | 25,666 | 29,701 | 68,060 | (48,803 | ) | 19,257 | 11,188 | ||||||||||||||||||||
BBB/Baa2 | 4,377 | 10,112 | 24,013 | 38,502 | (29,213 | ) | 9,289 | 5,952 | ||||||||||||||||||||
BB/Ba2 or lower | 2,972 | 6,188 | 4,271 | 13,431 | (5,357 | ) | 8,074 | 6,381 | ||||||||||||||||||||
Unrated | 1,289 | 45 | 238 | 1,572 | (9 | ) | 1,563 | 1,144 | ||||||||||||||||||||
Total | $25,267 | $51,123 | $ 90,599 | $166,989 | $(113,387 | ) | $53,602 | $35,420 | ||||||||||||||||||||
| Goldman Sachs 2014 Form 10-K | 107 |
THE GOLDMAN SACHS GROUP, INC. AND SUBSIDIARIES
Management’s Discussion and Analysis
Credit Exposure by Industry
| Cash | OTC Derivatives | Loans and Lending Commitments 1 | ||||||||||||||||||||||||
| As of December | As of December | As of December | ||||||||||||||||||||||||
| in millions | 2011 | 2010 | 2011 | 2010 | 2011 | 2010 | ||||||||||||||||||||
Asset Managers & Funds | $ | 64 | $ | — | $ | 10,582 | $ | 8,760 | $ | 1,290 | $ | 1,317 | ||||||||||||||
Banks, Brokers & Other Financial Institutions | 12,535 | 11,020 | 25,041 | 23,255 | 3,591 | 3,485 | ||||||||||||||||||||
Consumer Products, Non-Durables, and Retail | 11 | — | 1,031 | 1,082 | 12,685 | 8,141 | ||||||||||||||||||||
Government & Central Banks | 43,389 | 28,766 | 16,642 | 11,705 | 1,828 | 1,370 | ||||||||||||||||||||
Healthcare & Education | — | — | 2,962 | 2,161 | 7,158 | 5,754 | ||||||||||||||||||||
Insurance | — | 1 | 2,828 | 2,462 | 2,891 | 3,054 | ||||||||||||||||||||
Natural Resources & Utilities | — | — | 4,803 | 5,259 | 14,795 | 11,021 | ||||||||||||||||||||
Real Estate | — | — | 327 | 528 | 2,695 | 1,523 | ||||||||||||||||||||
Technology, Media, Telecommunications & Services | 2 | 1 | 2,124 | 1,694 | 12,646 | 7,690 | ||||||||||||||||||||
Transportation | — | — | 1,104 | 962 | 5,753 | 3,822 | ||||||||||||||||||||
Other | 7 | — | 6,704 | 7,824 | 5,759 | 6,007 | ||||||||||||||||||||
Total 2 | $ | 56,008 | $ | 39,788 | $ | 74,148 | $ | 65,692 | $ | 71,091 | $ | 53,184 | ||||||||||||||
Credit Exposure by RegionLending and Financing Activities. We manage our lending and financing activities using the credit risk process, measures, limits and risk mitigants described above. Other lending positions, including secondary trading positions, are risk-managed as a component of market risk.
| Cash | OTC Derivatives | Loans and Lending Commitments 1 | ||||||||||||||||||||||||
| As of December | As of December | As of December | ||||||||||||||||||||||||
| in millions | 2011 | 2010 | 2011 | 2010 | 2011 | 2010 | ||||||||||||||||||||
Americas | $ | 48,543 | $ | 34,528 | $ | 36,591 | $ | 34,468 | $ | 52,755 | $ | 38,151 | ||||||||||||||
EMEA 3 | 1,800 | 810 | 29,549 | 23,396 | 16,989 | 14,451 | ||||||||||||||||||||
Asia | 5,665 | 4,450 | 8,008 | 7,828 | 1,347 | 582 | ||||||||||||||||||||
Total 2 | $ | 56,008 | $ | 39,788 | $ | 74,148 | $ | 65,692 | $ | 71,091 | $ | 53,184 | ||||||||||||||
Credit Exposure by Credit Quality
| Cash | OTC Derivatives | Loans and Lending Commitments 1 | ||||||||||||||||||||||||
| As of December | As of December | As of December | ||||||||||||||||||||||||
| in millions | 2011 | 2010 | 2011 | 2010 | 2011 | 2010 | ||||||||||||||||||||
Credit Rating Equivalent | ||||||||||||||||||||||||||
AAA/Aaa | $ | 40,559 | $ | 27,851 | $ | 3,081 | $ | 3,338 | $ | 2,192 | $ | 1,783 | ||||||||||||||
AA/Aa2 | 7,463 | 4,547 | 19,981 | 11,521 | 7,026 | 5,273 | ||||||||||||||||||||
A/A2 | 6,464 | 5,603 | 31,171 | 26,996 | 21,055 | 15,766 | ||||||||||||||||||||
BBB/Baa2 | 195 | 1,007 | 10,996 | 13,673 | 22,937 | 17,544 | ||||||||||||||||||||
BB/Ba2 or lower | 1,209 | 764 | 7,261 | 8,062 | 17,820 | 12,774 | ||||||||||||||||||||
Unrated | 118 | 16 | 1,658 | 2,102 | 61 | 44 | ||||||||||||||||||||
Total 2 | $ | 56,008 | $ | 39,788 | $ | 74,148 | $ | 65,692 | $ | 71,091 | $ | 53,184 | ||||||||||||||
|
|
| Ÿ | Other Credit Exposures. We are exposed to credit risk from our receivables from brokers, dealers and clearing organizations and customers and counterparties. Receivables from brokers, dealers and clearing organizations are primarily comprised of initial cash margin placed with clearing organizations and receivables related to sales of securities which have traded, but not yet settled. These receivables generally have minimal credit risk due to the low probability of clearing organization default and the short-term nature of receivables related to securities settlements. Receivables from customers and counterparties are generally comprised of collateralized receivables related to customer securities transactions and generally have minimal credit risk due to both the value of the collateral received and the short-term nature of these receivables. Our net credit exposure related to these activities was approximately $26 billion and $18 billion as of December 2014 and December 2013, respectively, and was primarily comprised of initial margin (both cash and securities) placed with investment-grade clearing organizations. The regional breakdown of our net credit exposure related to these activities was approximately 48% and 55% in the Americas, approximately 13% and 10% in Asia, and approximately 39% and 35% in EMEA as of December 2014 and December 2013, respectively. |
|
| Goldman Sachs |
THE GOLDMAN SACHS GROUP, INC. AND SUBSIDIARIES
Management’s Discussion and Analysis
Credit Exposure by Industry, Region and Credit Quality
The tables below present our credit exposures related to cash, OTC derivatives, and loans and lending commitments (excluding credit exposures described above in “Securities Financing Transactions” and “Other Credit Exposures”) broken down by industry, region and credit quality. In the “Credit Exposure by Industry” table below, to be
consistent with changes in the manner in which management views credit exposure, we introduced new industries, aggregated certain industries and realigned exposures between industry classifications. Reclassifications have been made for December 2013 to conform to the current presentation.
$ in millions
Credit Exposure by Industry | Cash as of December | OTC Derivatives as of December | Loans and Lending as of December | |||||||||||||||||||||||||
| 2014 | 2013 | 2014 | 2013 | 2014 | 2013 | |||||||||||||||||||||||
Funds | $ 96 | $ 109 | $13,114 | $10,063 | $ 1,706 | $ 727 | ||||||||||||||||||||||
Financial Institutions | 12,469 | 9,994 | 15,051 | 16,374 | 11,316 | 9,910 | ||||||||||||||||||||||
Consumer, Retail & Healthcare | — | — | 3,325 | 5,041 | 30,216 | 27,891 | ||||||||||||||||||||||
Sovereign | 45,029 | 51,024 | 10,004 | 8,603 | 450 | 276 | ||||||||||||||||||||||
Municipalities & Nonprofit | — | — | 4,303 | 2,902 | 541 | 458 | ||||||||||||||||||||||
Natural Resources & Utilities | — | — | 5,741 | 1 | 5,295 | 24,275 | 1 | 21,478 | ||||||||||||||||||||
Real Estate | 6 | 6 | 407 | 388 | 12,366 | 8,550 | ||||||||||||||||||||||
Technology, Media & Telecommunications | — | — | 2,995 | 2,123 | 20,633 | 14,962 | ||||||||||||||||||||||
Diversified Industrials | — | — | 4,321 | 1,733 | 16,392 | 16,085 | ||||||||||||||||||||||
Other | — | — | 1,476 | 1,080 | 11,998 | 4,988 | ||||||||||||||||||||||
Total | $57,600 | $61,133 | $60,737 | $53,602 | $129,893 | $105,325 | ||||||||||||||||||||||
| 1. | See “— Selected Country and Industry Exposures — Industry Exposures” below for information about our credit and market exposure to the oil and gas industry. |
$ in millions
Credit Exposure by Region | Cash as of December | OTC Derivatives as of December | Loans and Lending as of December | |||||||||||||||||||||||||
| 2014 | 2013 | 2014 | 2013 | 2014 | 2013 | |||||||||||||||||||||||
Americas | $45,599 | $54,470 | $22,032 | $21,423 | $ 91,378 | $ 77,710 | ||||||||||||||||||||||
EMEA | 1,666 | 2,143 | 31,295 | 25,983 | 34,397 | 25,222 | ||||||||||||||||||||||
Asia | 10,335 | 4,520 | 7,410 | 6,196 | 4,118 | 2,393 | ||||||||||||||||||||||
Total | $57,600 | $61,133 | $60,737 | $53,602 | $129,893 | $105,325 | ||||||||||||||||||||||
$ in millions
Credit Exposure by Credit Quality (Credit Rating Equivalent) | Cash as of December | OTC Derivatives as of December | Loans and Lending as of December | |||||||||||||||||||||||||
| 2014 | 2013 | 2014 | 2013 | 2014 | 2013 | |||||||||||||||||||||||
AAA/Aaa | $38,778 | $50,519 | $ 3,354 | $ 2,306 | $ 3,969 | $ 3,079 | ||||||||||||||||||||||
AA/Aa2 | 4,598 | 2,748 | 18,372 | 13,113 | 8,097 | 7,001 | ||||||||||||||||||||||
A/A2 | 13,346 | 6,821 | 15,170 | 19,257 | 22,623 | 23,250 | ||||||||||||||||||||||
BBB/Baa2 | 730 | 527 | 13,573 | 9,289 | 35,706 | 30,496 | ||||||||||||||||||||||
BB/Ba2 or lower | 148 | 518 | 9,783 | 8,074 | 58,670 | 41,114 | ||||||||||||||||||||||
Unrated | — | — | 485 | 1,563 | 828 | 385 | ||||||||||||||||||||||
Total | $57,600 | $61,133 | $60,737 | $53,602 | $129,893 | $105,325 | ||||||||||||||||||||||
| Goldman Sachs 2014 Form 10-K | 109 |
THE GOLDMAN SACHS GROUP, INC. AND SUBSIDIARIES
Management’s Discussion and Analysis
Selected Country and Industry Exposures
During 2011 and continuing into 2012, there have been concernsThe section below provides information about European sovereign debt risk and its impact on the European banking system and a number of European member states have been experiencing significant credit deterioration. The most pronounced market concerns relate to Greece, Ireland, Italy, Portugal and Spain. The table below presents our credit exposure (both gross and net of hedges) to all sovereigns, financial institutions and corporate counterparties or borrowers in these countries. In
addition, the table includes the market exposure to certain countries and industries that have had heightened focus due to recent events and broad market concerns. Credit exposure represents the potential for loss due to the default or deterioration in credit quality of a counterparty or borrower. Market exposure represents the potential for loss in value of our long and short inventory due to changes in whichmarket prices. There is no overlap between the issuer or underlier is locatedcredit and market exposures in these countries.
Thethe amounts below. We determine the country of risk is determined by the location of the counterparty, issuer or underlier’s assets, where they generate revenue, the country in which they are headquartered, and/or the government whose policies affect their ability to repay their obligations.
Country Exposures. During 2014, the political situations in Iraq, Russia and Ukraine have negatively affected market sentiment toward those countries. In addition, the U.S. and the EU have imposed sanctions against certain Russian individuals and institutions, and Argentina has defaulted on its sovereign debt. The decline in oil prices has also raised substantial concerns about Venezuela and its sovereign debt. In addition, recent events in Greece have led to renewed concerns about its economic and financial stability.
As of December 2014, our total credit exposure to Russia was $416 million and was substantially all with non-sovereign counterparties or borrowers. Such exposure was comprised of $257 million (including the benefit of $14 million of cash and securities collateral) related to securities financing transactions and other secured receivables, $104 million related to loans and lending commitments and $55 million (including the benefit of $190 million of cash collateral) related to OTC derivatives. In addition, our total market exposure to Russia as of December 2014 was $447 million, which was primarily with non-sovereign issuers or underliers. Such exposure was comprised of $309 million related to credit derivatives, $117 million related to debt and $21 million related to equities. Subsequent to December 2014, Russia’s sovereign debt was downgraded by S&P and Fitch. These downgrades did not have a material effect on our financial condition, results of operations, liquidity or capital resources.
As of December 2014, our total credit exposure to Greece was $1.0 billion and was primarily with non-sovereign counterparties or borrowers. Such exposure was comprised of $694 million (including the benefit of $1.2 billion of cash and securities collateral) related to securities financing transactions and other secured receivables and $317 million (including the benefit of $590 million of cash collateral) related to OTC derivatives. In addition, our total market exposure to Greece as of December 2014 was $54 million, which was primarily with non-sovereign issuers or underliers.
| As of December 2011 | ||||||||||||||||||||||||||||||||||||||||||||||||||
| Credit Exposure | Market Exposure | |||||||||||||||||||||||||||||||||||||||||||||||||
| in billions | Loans | OTC Derivatives | Other | Gross Funded | Hedges | Total Net Funded Exposure | Unfunded Credit | Total Credit Exposure | Bonds | Equities Other | Credit Derivatives | Total Market Exposure | ||||||||||||||||||||||||||||||||||||||
Greece | ||||||||||||||||||||||||||||||||||||||||||||||||||
Sovereign | $ | — | $ | — | $ | — | $ | — | $ | — | $ | — | $ | — | $ | — | $ | 0.33 | $ | — | $ | (0.02 | ) | $ | 0.31 | |||||||||||||||||||||||||
Non-Sovereign | 0.02 | 0.05 | — | 0.07 | — | 0.07 | — | 0.07 | 0.03 | 0.01 | 0.02 | 0.06 | ||||||||||||||||||||||||||||||||||||||
Total Greece | 0.02 | 0.05 | — | 0.07 | — | 0.07 | — | 0.07 | 0.36 | 0.01 | — | 0.37 | ||||||||||||||||||||||||||||||||||||||
Ireland | ||||||||||||||||||||||||||||||||||||||||||||||||||
Sovereign | — | — | 0.25 | 0.25 | — | 0.25 | — | 0.25 | 0.41 | — | (0.35 | ) | 0.06 | |||||||||||||||||||||||||||||||||||||
Non-Sovereign | — | 0.54 | 0.07 | 0.61 | (0.01 | ) | 0.60 | 0.06 | 0.66 | 0.41 | 0.09 | 0.11 | 0.61 | |||||||||||||||||||||||||||||||||||||
Total Ireland | — | 0.54 | 0.32 | 0.86 | (0.01 | ) | 0.85 | 0.06 | 0.91 | 0.82 | 0.09 | (0.24 | ) | 0.67 | ||||||||||||||||||||||||||||||||||||
Italy | ||||||||||||||||||||||||||||||||||||||||||||||||||
Sovereign | — | 1.67 | — | 1.67 | (1.41 | ) | 0.26 | — | 0.26 | 0.21 | — | 0.20 | 0.41 | |||||||||||||||||||||||||||||||||||||
Non-Sovereign | 0.13 | 0.45 | — | 0.58 | (0.02 | ) | 0.56 | 0.40 | 0.96 | 0.19 | 0.30 | (0.90 | ) | (0.41 | ) | |||||||||||||||||||||||||||||||||||
Total Italy | 0.13 | 2.12 | — | 2.25 | (1.43 | ) | 0.82 | 0.40 | 1.22 | 0.40 | 0.30 | (0.70 | ) | — | ||||||||||||||||||||||||||||||||||||
Portugal | ||||||||||||||||||||||||||||||||||||||||||||||||||
Sovereign | — | 0.15 | — | 0.15 | — | 0.15 | — | 0.15 | (0.10 | ) | — | 0.02 | (0.08 | ) | ||||||||||||||||||||||||||||||||||||
Non-Sovereign | — | 0.06 | — | 0.06 | — | 0.06 | — | 0.06 | 0.23 | 0.01 | (0.18 | ) | 0.06 | |||||||||||||||||||||||||||||||||||||
Total Portugal | — | 0.21 | — | 0.21 | — | 0.21 | — | 0.21 | 0.13 | 0.01 | (0.16 | ) | (0.02 | ) | ||||||||||||||||||||||||||||||||||||
Spain | ||||||||||||||||||||||||||||||||||||||||||||||||||
Sovereign | — | 0.09 | — | 0.09 | — | 0.09 | — | 0.09 | 0.15 | — | (0.55 | ) | (0.40 | ) | ||||||||||||||||||||||||||||||||||||
Non-Sovereign | 0.15 | 0.25 | 0.02 | 0.42 | (0.14 | ) | 0.28 | 0.15 | 0.43 | 0.35 | 0.24 | (0.63 | ) | (0.04 | ) | |||||||||||||||||||||||||||||||||||
Total Spain | 0.15 | 0.34 | 0.02 | 0.51 | (0.14 | ) | 0.37 | 0.15 | 0.52 | 0.50 | 0.24 | (1.18 | ) | (0.44 | ) | |||||||||||||||||||||||||||||||||||
Subtotal | $ | 0.30 | $ | 3.26 | 1 | $ | 0.34 | $ | 3.90 | 1 | $ | (1.58 | ) | $ | 2.32 | $ | 0.61 | $ | 2.93 | $ | 2.21 | $ | 0.65 | $ | (2.28 | ) 2 | $ | 0.58 | ||||||||||||||||||||||
Our total credit and market exposure to Argentina, Iraq, Ukraine and Venezuela as of December 2014 was not material.
|
|
We economically hedge our exposure to written credit derivatives by entering into offsetting purchased credit derivatives with identical underlyings.underliers. Where possible, we endeavor to match the tenor and credit default terms of such hedges to that of our written credit derivatives. Substantially all purchased credit derivatives included aboverelated to Russia and Greece are both bought from investment-grade counterparties domiciled outside of these countries and are collateralized with cash or U.S. Treasury securities. Thecash. As of December 2014, the gross purchased and written credit derivative notionals across the above countries for single-name and index credit default swaps (included in credit derivatives above) were
$147.3 $21.1 billion and $142.4$21.7 billion, respectively.respectively, related to Russia and $2.2 billion and $2.1 billion, respectively, related to Greece. Including netting under legally enforceable netting agreements, within each and across all of the countries above, the purchased and written credit derivative notionals for single-name and index credit default swaps were $21.1$3.6 billion and $16.2$4.3 billion, respectively.respectively, related to Russia and $908 million and $812 million, respectively, related to Greece as of December 2014. These notionals are not representative of our exposure because they exclude available netting under legally enforceable netting agreements on other derivatives outside of these countries and collateral received or posted under credit support agreements.
THE GOLDMAN SACHS GROUP, INC. AND SUBSIDIARIES
Management’s Discussion and Analysis
For information about the nature of or payout under trigger events related to written and purchased credit protection contracts see Note 7 to the consolidated financial statementsstatements.
| 110 | Goldman Sachs 2014 Form 10-K |
THE GOLDMAN SACHS GROUP, INC. AND SUBSIDIARIES
Management’s Discussion and Analysis
During 2012, and continuing into early 2013, there were concerns about European sovereign debt risk and its impact on the European banking system, as a number of European member states, including Ireland, Italy, Portugal and Spain, experienced significant credit deterioration. Although many of the immediate concerns have subsided, some of the countries in Part II, Item 8the region face long-term economic and financial challenges. As of this Form 10-K.December 2014, our aggregate credit and market exposure to these four European countries was $10.1 billion ($8.8 billion of credit exposure and $1.3 billion of market exposure), including $4.0 billion to Ireland, $3.1 billion to Italy, $439 million to Portugal and $2.6 billion to Spain. We continue to closely monitor our risk exposure to these four countries as part of our risk management process.
To supplement our regular stress tests, we conduct tailored stress tests on an ad hoc basis in response to specific market events that we deem significant. For example, in response to the Euro area debt crisis, we conducted stress tests intended to estimate the direct and indirect impact that might result from a variety of possible events involving certain European member states, including sovereign defaults and the exit of one or more countries from the Euro area. In the stress tests, described in “Market Risk Management — Stress Testing” and “Credit Risk Management — Stress Tests/Scenario Analysis,” we estimated the direct impact of the event on our credit and market exposures resulting from shocks to risk factors including, but not limited to, currency rates, interest rates, and equity prices. The parameters of these shocks varied based on the scenario reflected in each stress test. We evaluatealso estimated the indirect impact on our exposures arising from potential market moves in response to the event, such as the impact of credit market deterioration on corporate borrowers and monitorcounterparties along with the effectsshocks to the risk factors described above. We reviewed estimated losses produced by the stress tests in order to understand their magnitude, highlight potential loss concentrations, and assess and mitigate our exposures where necessary.
The Euro area exit scenarios included analysis of indirectthe impacts on exposure that might result from the redenomination of assets in the exiting country or countries. We also tested our operational and risk management readiness and capability to respond to a redenomination event. Constructing stress tests for these countries. scenarios requires many assumptions about how exposures might be directly impacted and how resulting secondary market moves would indirectly impact such exposures. Given the multiple parameters involved in such scenarios, losses from such events are inherently difficult to quantify and may materially differ from our estimates.
See “Liquidity Risk Management — Global Core Liquid Assets — Modeled Liquidity Outflow,” “Market Risk Management — Stress Testing” and “Credit Risk Management — Stress Tests/Scenario Analysis” for further discussion.
On January 13, 2012, Standard & Poor’s Ratings Services loweredIndustry Exposures. Significant declines in the sovereign debt ratings on Italy from Aprice of oil have led to BBB+, Portugal from BBB-market concerns regarding the creditworthiness of certain companies in the oil and gas industry. As of December 2014, our credit exposure to BB,oil and Spain from AA-gas companies related to A. On January 27, 2012, Fitch, Inc. loweredloans and lending commitments was $10.9 billion ($2.1 billion of loans and $8.8 billion of lending commitments). Such exposure included $5.1 billion of exposure to non-investment-grade counterparties ($1.9 billion related to loans and $3.2 billion related to lending commitments). Our clients in the sovereign debt ratings on Italy from A+oil and gas industry also use derivatives to A-,hedge their exposure to oil prices. As of December 2014, our credit exposure related to derivatives and Spain from AA-receivables with oil and gas companies was $1.7 billion, substantially all of which were with investment-grade counterparties. As of December 2014, our market exposure related to A. On February 13, 2012, Moody’s Investors Service lowered the sovereign debt ratings on Italy from A2oil and gas companies was $805 million, substantially all of which was to A3, Portugal from Ba2 to Ba3,non-investment-grade issuers or underliers.
| Goldman Sachs 2014 Form 10-K | 111 |
THE GOLDMAN SACHS GROUP, INC. AND SUBSIDIARIES
Management’s Discussion and Spain from A1 to A3. On February 22, 2012, Fitch, Inc. lowered the sovereign debt ratings on Greece from CCC to C. These downgrades did not have a material effect on our financial condition, results of operations, liquidity or capital resources.Analysis
Overview
Operational risk is the risk of loss resulting from inadequate or failed internal processes, people and systems or from external events. Our exposure to operational risk arises from routine processing errors as well as extraordinary incidents, such as major systems failures. Potential types of loss events related to internal and external operational risk include:
| Ÿ |
|
| Ÿ |
|
| Ÿ |
|
| Ÿ |
|
| Ÿ |
|
| Ÿ |
|
| Ÿ |
|
The firm maintainsWe maintain a comprehensive control framework designed to provide a well-controlled environment to minimize operational risks. The Firmwide Operational Risk Committee, along with the support of regional or entity-specific working groups or committees, provides oversight of the ongoing development and implementation of our operational risk policies and framework. Our Operational Risk Management
department (Operational Risk Management) is a risk management function independent of our revenue-producing units, reports to the firm’sour chief risk officer, and is responsible for developing and implementing policies, methodologies and a formalized framework for operational risk management with the goal of minimizing our exposure to operational risk.
Operational Risk Management Process
Managing operational risk requires timely and accurate information as well as a strong control culture. We seek to manage our operational risk through:
| Ÿ |
|
| Ÿ |
|
| Ÿ |
|
| Ÿ |
|
| Ÿ |
|
We combine top-down and bottom-up approaches to manage and measure operational risk. From a top-down perspective, the firm’sour senior management assesses firmwide and business level operational risk profiles. From a bottom-up perspective, revenue-producing units and independent control and support functions are responsible for risk management on a day-to-day basis, including identifying, mitigating, and escalating operational risks to senior management.
Our operational risk framework is in part designed to comply with the operational risk measurement rules under Basel 2III and has evolved based on the changing needs of our businesses and regulatory guidance. Our framework includescomprises the following practices:
| Ÿ | Risk identification and reporting; |
| Ÿ | Risk measurement; and |
| Ÿ | Risk monitoring. |
Internal Audit performs aan independent review of our operational risk framework, including our key controls, processes and applications, on an annual basis to ensureassess the effectiveness of our framework.
| Goldman Sachs |
THE GOLDMAN SACHS GROUP, INC. AND SUBSIDIARIES
Management’s Discussion and Analysis
Risk Identification and Reporting
The core of our operational risk management framework is risk identification and reporting. We have a comprehensive data collection process, including firmwide policies and procedures, for operational risk events.
We have established policies that require managers in our revenue-producing units and our independent control and support functions to escalate operational risk events. When operational risk events are identified, our policies require that the events be documented and analyzed to determine whether changes are required in the firm’sour systems and/or processes to further mitigate the risk of future events.
In addition, our firmwide systems capture internal operational risk event data, key metrics such as transaction volumes, and statistical information such as performance trends. We use an internally-developed operational risk management application to aggregate and organize this information. Managers from both revenue-producing units and independent control and support functions analyze the information to evaluate operational risk exposures and identify businesses, activities or products with heightened levels of operational risk. We also provide periodic operational risk reports to senior management, risk committees and the Board periodically.Board.
Risk Measurement
We measure the firm’sour operational risk exposure over a twelve-month time horizon using both statistical modeling and scenario analyses, which involve qualitative assessments of the potential frequency and extent of potential operational risk losses, for each of the firm’sour businesses. Operational risk measurement incorporates qualitative and quantitative assessments of factors including:
| Ÿ |
|
| Ÿ |
|
| Ÿ |
|
| Ÿ |
|
| Ÿ |
|
| Ÿ |
|
| Ÿ |
|
| Ÿ |
|
The results from these scenario analyses are used to monitor changes in operational risk and to determine business lines that may have heightened exposure to operational risk. These analyses ultimately are used to determinein the determination of the appropriate level of operational risk capital to hold.
Risk Monitoring
We evaluate changes in the operational risk profile of the firm and its businesses, including changes in business mix or jurisdictions in which the firm operates,we operate, by monitoring thesethe factors noted above at a firmwide entity and business level. The firm hasWe have both detective and preventive internal controls, which are designed to reduce the frequency and severity of operational risk losses and the probability of operational risk events. We monitor the results of assessments and independent internal audits of these internal controls.
Recent Accounting Developments
See Note 3 to the consolidated financial statements in Part II, Item 8 of this Form 10-K for information about Recent Accounting Developments.
Certain Risk Factors That May Affect Our Businesses
We face a variety of risks that are substantial and inherent in our businesses, including market, liquidity, credit, operational, legal, regulatory and reputational risks. For a discussion of how management seeks to manage some of these risks, see “Overview and Structure of Risk Management.” A summary of the more important factors that could affect our businesses follows. For a further discussion of these and other important factors that could affect our businesses, financial condition, results of operations, cash flows and liquidity, see “Risk Factors” in Part I, Item 1A of thisthe 2014 Form 10-K.
| Ÿ | Our businesses have been and may continue to be adversely affected by conditions in the global financial markets and economic conditions generally. |
| Ÿ | Our businesses and those of our clients are subject to extensive and pervasive regulation around the world. |
| Ÿ | Our businesses have been and may be adversely affected by declining asset values. This is particularly true for those businesses in which we have net “long” positions, receive fees based on the value of assets managed, or receive or post collateral. |
| Ÿ | Our businesses have been and may be adversely affected by disruptions in the credit markets, including reduced access to credit and higher costs of obtaining credit. |
THE GOLDMAN SACHS GROUP, INC. AND SUBSIDIARIES
Management’s Discussion and Analysis
| Ÿ | Our market-making activities have been and may be affected by changes in the levels of market volatility. |
| Goldman Sachs 2014 Form 10-K | 113 |
THE GOLDMAN SACHS GROUP, INC. AND SUBSIDIARIES
Management’s Discussion and Analysis
| Ÿ | Our investment banking, client execution and investment management businesses have been adversely affected and may continue to be adversely affected by market uncertainty or lack of confidence among investors and CEOs due to general declines in economic activity and other unfavorable economic, geopolitical or market conditions. |
| Ÿ | Our investment management business may be affected by the poor investment performance of our investment products. |
| Ÿ | We may incur losses as a result of ineffective risk management processes and strategies. |
| Ÿ | Our liquidity, profitability and businesses may be adversely affected by an inability to access the debt capital markets or to sell assets or by a reduction in our credit ratings or by an increase in our credit spreads. |
| Ÿ |
|
| Ÿ | Group Inc. is a holding company and is dependent for liquidity on payments from its subsidiaries, many of which are subject to restrictions. |
| Ÿ | The application of regulatory strategies and requirements in the United States and non-U.S. jurisdictions to facilitate the orderly resolution of large financial institutions could create greater risk of loss for Group Inc.’s security holders. |
| Ÿ | Our businesses, profitability and liquidity may be adversely affected by deterioration in the credit quality of, or defaults by, third parties who owe us money, securities or other assets or whose securities or obligations we hold. |
| Ÿ | Concentration of risk increases the potential for significant losses in our market-making, underwriting, investing and lending activities. |
| Ÿ | The financial services industry is both highly |
| Ÿ | We face enhanced risks as new business initiatives lead us to transact with a broader array of clients and counterparties and expose us to new asset classes and new markets. |
| Ÿ | Derivative transactions and delayed settlements may expose us to unexpected risk and potential losses. |
| Ÿ | Our businesses may be adversely affected if we are unable to hire and retain qualified employees. |
| Ÿ |
|
We may be adversely affected by increased governmental and regulatory scrutiny or negative publicity. |
| Ÿ | A failure in our operational systems or infrastructure, or those of third parties, as well as cyber attacks and human error, could impair our liquidity, disrupt our businesses, result in the disclosure of confidential information, damage our reputation and cause losses. |
| Ÿ | Substantial legal liability or significant regulatory action against us could have material adverse financial effects or cause us significant reputational harm, which in turn could seriously harm our business prospects. |
| Ÿ | The growth of electronic trading and the introduction of new trading technology may adversely affect our business and may increase competition. |
| Ÿ | Our commodities activities, particularly our |
| Ÿ | In conducting our businesses around the world, we are subject to political, economic, legal, operational and other risks that are inherent in operating in many countries. |
| Ÿ | We may incur losses as a result of unforeseen or catastrophic events, including the emergence of a pandemic, terrorist attacks, extreme weather events or other natural disasters. |
Item 7A. Quantitative and Qualitative Disclosures About Market Risk
Quantitative and qualitative disclosures about market risk are set forth under “Management’s Discussion and Analysis of Financial Condition and Results of Operations — Overview and Structure of Risk Management” in Part II, Item 7 of thisthe 2014 Form 10-K.
| Goldman Sachs |
Item 8. Financial Statements and Supplementary Data
| Goldman Sachs |
Management’s Report on Internal Control over Financial Reporting
Management of The Goldman Sachs Group, Inc., together with its consolidated subsidiaries (the firm), is responsible for establishing and maintaining adequate internal control over financial reporting. The firm’s internal control over financial reporting is a process designed under the supervision of the firm’s principal executive and principal financial officers to provide reasonable assurance regarding the reliability of financial reporting and the preparation of the firm’s financial statements for external reporting purposes in accordance with U.S. generally accepted accounting principles.
As of December 31, 2011,2014, management conducted an assessment of the firm’s internal control over financial reporting based on the framework established inInternal Control — Integrated Framework (2013) issued by the Committee of Sponsoring Organizations of the Treadway Commission (COSO). Based on this assessment, management has determined that the firm’s internal control over financial reporting as of December 31, 20112014 was effective.
Our internal control over financial reporting includes policies and procedures that pertain to the maintenance of records that, in reasonable detail, accurately and fairly reflect transactions and dispositions of assets; provide reasonable assurancesassurance that transactions are recorded as necessary to permit preparation of financial statements in accordance with U.S. generally accepted accounting principles, and that receipts and expenditures are being made only in accordance with authorizations of management and the directors of the firm; and provide reasonable assurance regarding prevention or timely detection of unauthorized acquisition, use or disposition of the firm’s assets that could have a material effect on our financial statements.
The firm’s internal control over financial reporting as of December 31, 20112014 has been audited by PricewaterhouseCoopers LLP, an independent registered public accounting firm, as stated in their report appearing on page 109,117, which expresses an unqualified opinion on the effectiveness of the firm’s internal control over financial reporting as of December 31, 2011.2014.
| Goldman Sachs |
Report of Independent Registered Public Accounting Firm
To the Board of Directors and the Shareholders of
The Goldman Sachs Group, Inc.:
In our opinion, the consolidated financial statements listed in the accompanying index present fairly, in all material respects, the financial position of The Goldman Sachs Group, Inc. and its subsidiaries (the Company) at December 31, 20112014 and 2010,2013, and the results of its operations and its cash flows for each of the three years in the period ended December 31, 2011,2014, in conformity with accounting principles generally accepted in the United States of America. Also in our opinion, the Company maintained, in all material respects, effective internal control over financial reporting as of December 31, 2011,2014, based on criteria established inInternal Control — Integrated Framework (2013) issued by the Committee of Sponsoring Organizations of the Treadway Commission (COSO). The Company’s management is responsible for these financial statements, for maintaining effective internal control over financial reporting and for its assessment of the effectiveness of internal control over financial reporting, included in Management’s Report on Internal Control over Financial Reporting appearing on page 108.116. Our responsibility is to express opinions on these financial statements and on the Company’s internal control over financial reporting based on our audits. We conducted our audits in accordance with the standards of the Public Company Accounting Oversight Board (United States). Those standards require that we plan and perform the audits to obtain reasonable assurance about whether the financial statements are free of material misstatement and whether effective internal control over financial reporting was maintained in all material respects. Our audits of the financial statements included examining, on a test basis, evidence supporting the amounts and disclosures in the financial statements, assessing the accounting principles used and significant estimates made by management, and evaluating the overall financial statement presentation. Our audit of internal control over financial reporting included obtaining an understanding of internal control over financial reporting, assessing the risk that a material weakness exists, and testing and evaluating the design and operating effectiveness of internal control based on the assessed risk. Our audits also included performing such other procedures as we considered necessary in the circumstances. We believe that our audits provide a reasonable basis for our opinions.
A company’s internal control over financial reporting is a process designed to provide reasonable assurance regarding the reliability of financial reporting and the preparation of financial statements for external purposes in accordance with generally accepted accounting principles. A company’s internal control over financial reporting includes those policies and procedures that (i) pertain to the maintenance of records that, in reasonable detail, accurately and fairly reflect the transactions and dispositions of the assets of the company; (ii) provide reasonable assurance that transactions are recorded as necessary to permit preparation of financial statements in accordance with generally accepted accounting principles, and that receipts and expenditures of the company are being made only in accordance with authorizations of management and directors of the company; and (iii) provide reasonable assurance regarding prevention or timely detection of unauthorized acquisition, use, or disposition of the company’s assets that could have a material effect on the financial statements.
Because of its inherent limitations, internal control over financial reporting may not prevent or detect misstatements. Also, projections of any evaluation of effectiveness to future periods are subject to the risk that controls may become inadequate because of changes in conditions, or that the degree of compliance with the policies or procedures may deteriorate.
/s/ PRICEWATERHOUSECOOPERS LLP
New York, New York
February 28, 201220, 2015
| Goldman Sachs |
THE GOLDMAN SACHS GROUP, INC. AND SUBSIDIARIES
Consolidated Statements of Earnings
| Year Ended December | ||||||||||||
| in millions, except per share amounts | 2014 | 2013 | 2012 | |||||||||
Revenues | ||||||||||||
Investment banking | $ 6,464 | $ 6,004 | $ 4,941 | |||||||||
Investment management | 5,748 | 5,194 | 4,968 | |||||||||
Commissions and fees | 3,316 | 3,255 | 3,161 | |||||||||
Market making | 8,365 | 9,368 | 11,348 | |||||||||
Other principal transactions | 6,588 | 6,993 | 5,865 | |||||||||
Total non-interest revenues | 30,481 | 30,814 | 30,283 | |||||||||
Interest income | 9,604 | 10,060 | 11,381 | |||||||||
Interest expense | 5,557 | 6,668 | 7,501 | |||||||||
Net interest income | 4,047 | 3,392 | 3,880 | |||||||||
Net revenues, including net interest income | 34,528 | 34,206 | 34,163 | |||||||||
Operating expenses | ||||||||||||
Compensation and benefits | 12,691 | 12,613 | 12,944 | |||||||||
Brokerage, clearing, exchange and distribution fees | 2,501 | 2,341 | 2,208 | |||||||||
Market development | 549 | 541 | 509 | |||||||||
Communications and technology | 779 | 776 | 782 | |||||||||
Depreciation and amortization | 1,337 | 1,322 | 1,738 | |||||||||
Occupancy | 827 | 839 | 875 | |||||||||
Professional fees | 902 | 930 | 867 | |||||||||
Insurance reserves | — | 176 | 598 | |||||||||
Other expenses | 2,585 | 2,931 | 2,435 | |||||||||
Total non-compensation expenses | 9,480 | 9,856 | 10,012 | |||||||||
Total operating expenses | 22,171 | 22,469 | 22,956 | |||||||||
Pre-tax earnings | 12,357 | 11,737 | 11,207 | |||||||||
Provision for taxes | 3,880 | 3,697 | 3,732 | |||||||||
Net earnings | 8,477 | 8,040 | 7,475 | |||||||||
Preferred stock dividends | 400 | 314 | 183 | |||||||||
Net earnings applicable to common shareholders | $ 8,077 | $ 7,726 | $ 7,292 | |||||||||
Earnings per common share | ||||||||||||
Basic | $ 17.55 | $ 16.34 | $ 14.63 | |||||||||
Diluted | 17.07 | 15.46 | 14.13 | |||||||||
Average common shares outstanding | ||||||||||||
Basic | 458.9 | 471.3 | 496.2 | |||||||||
Diluted | 473.2 | 499.6 | 516.1 | |||||||||
The accompanying notes are an integral part of these consolidated financial statements.
| 118 | Goldman Sachs 2014 Form 10-K |
THE GOLDMAN SACHS GROUP, INC. AND SUBSIDIARIES
Consolidated Statements of EarningsComprehensive Income
| Year Ended December | ||||||||||||
| in millions, except per share amounts | 2011 | 2010 | 2009 | |||||||||
Revenues Investment banking | $ | 4,361 | $ | 4,810 | $ | 4,984 | ||||||
Investment management | 4,691 | 4,669 | 4,233 | |||||||||
Commissions and fees | 3,773 | 3,569 | 3,840 | |||||||||
Market making | 9,287 | 13,678 | 22,088 | |||||||||
Other principal transactions | 1,507 | 6,932 | 2,621 | |||||||||
Total non-interest revenues | 23,619 | 33,658 | 37,766 | |||||||||
Interest income | 13,174 | 12,309 | 13,907 | |||||||||
Interest expense | 7,982 | 6,806 | 6,500 | |||||||||
Net interest income | 5,192 | 5,503 | 7,407 | |||||||||
Net revenues, including net interest income | 28,811 | 39,161 | 45,173 | |||||||||
Operating expenses Compensation and benefits | 12,223 | 15,376 | 16,193 | |||||||||
U.K. bank payroll tax | — | 465 | — | |||||||||
Brokerage, clearing, exchange and distribution fees | 2,463 | 2,281 | 2,298 | |||||||||
Market development | 640 | 530 | 342 | |||||||||
Communications and technology | 828 | 758 | 709 | |||||||||
Depreciation and amortization | 1,865 | 1,889 | 1,734 | |||||||||
Occupancy | 1,030 | 1,086 | 950 | |||||||||
Professional fees | 992 | 927 | 678 | |||||||||
Insurance reserves | 529 | 398 | 334 | |||||||||
Other expenses | 2,072 | 2,559 | 2,106 | |||||||||
Total non-compensation expenses | 10,419 | 10,428 | 9,151 | |||||||||
Total operating expenses | 22,642 | 26,269 | 25,344 | |||||||||
Pre-tax earnings | 6,169 | 12,892 | 19,829 | |||||||||
Provision for taxes | 1,727 | 4,538 | 6,444 | |||||||||
Net earnings | 4,442 | 8,354 | 13,385 | |||||||||
Preferred stock dividends | 1,932 | 641 | 1,193 | |||||||||
Net earnings applicable to common shareholders | $ | 2,510 | $ | 7,713 | $ | 12,192 | ||||||
Earnings per common share | ||||||||||||
Basic | $ | 4.71 | $ | 14.15 | $ | 23.74 | ||||||
Diluted | 4.51 | 13.18 | 22.13 | |||||||||
Average common shares outstanding | ||||||||||||
Basic | 524.6 | 542.0 | 512.3 | |||||||||
Diluted | 556.9 | 585.3 | 550.9 | |||||||||
| Year Ended December | ||||||||||||
| $ in millions | 2014 | 2013 | 2012 | |||||||||
Net earnings | $8,477 | $8,040 | $7,475 | |||||||||
Other comprehensive income/(loss) adjustments, net of tax: | ||||||||||||
Currency translation | (109 | ) | (50 | ) | (89 | ) | ||||||
Pension and postretirement liabilities | (102 | ) | 38 | 168 | ||||||||
Available-for-sale securities | — | (327 | ) | 244 | ||||||||
Cash flow hedges | (8 | ) | 8 | — | ||||||||
Other comprehensive income/(loss) | (219 | ) | (331 | ) | 323 | |||||||
Comprehensive income | $8,258 | $7,709 | $7,798 | |||||||||
The accompanying notes are an integral part of these consolidated financial statements.
| Goldman Sachs | 119 |
THE GOLDMAN SACHS GROUP, INC. AND SUBSIDIARIES
Consolidated Statements of Financial Condition
| As of December | ||||||||
| in millions, except share and per share amounts | 2011 | 2010 | ||||||
Assets Cash and cash equivalents | $ | 56,008 | $ | 39,788 | ||||
Cash and securities segregated for regulatory and other purposes (includes $42,014 and $36,182 at fair value as of December 2011 and December 2010, respectively) | 64,264 | 53,731 | ||||||
Collateralized agreements: Securities purchased under agreements to resell and federal funds sold (includes $187,789 and $188,355 at fair value as of December 2011 and December 2010, respectively) | 187,789 | 188,355 | ||||||
Securities borrowed (includes $47,621 and $48,822 at fair value as of December 2011 and December 2010, respectively) | 153,341 | 166,306 | ||||||
Receivables from brokers, dealers and clearing organizations | 14,204 | 10,437 | ||||||
Receivables from customers and counterparties (includes $9,682 and $7,202 at fair value as of December 2011 and December 2010, respectively) | 60,261 | 67,703 | ||||||
Financial instruments owned, at fair value (includes $53,989 and $51,010 pledged as collateral as of December 2011 and December 2010, respectively) | 364,206 | 356,953 | ||||||
Other assets | 23,152 | 28,059 | ||||||
Total assets | $ | 923,225 | $ | 911,332 | ||||
Liabilities and shareholders’ equity Deposits (includes $4,526 and $1,975 at fair value as of December 2011 and December 2010, respectively) | $ | 46,109 | $ | 38,569 | ||||
Collateralized financings: Securities sold under agreements to repurchase, at fair value | 164,502 | 162,345 | ||||||
Securities loaned (includes $107 and $1,514 at fair value as of December 2011 and December 2010, respectively) | 7,182 | 11,212 | ||||||
Other secured financings (includes $30,019 and $31,794 at fair value as of December 2011 and December 2010, respectively) | 37,364 | 38,377 | ||||||
Payables to brokers, dealers and clearing organizations | 3,667 | 3,234 | ||||||
Payables to customers and counterparties | 194,625 | 187,270 | ||||||
Financial instruments sold, but not yet purchased, at fair value | 145,013 | 140,717 | ||||||
Unsecured short-term borrowings, including the current portion of unsecured long-term borrowings (includes $17,854 and $22,116 at fair value as of December 2011 and December 2010, respectively) | 49,038 | 47,842 | ||||||
Unsecured long-term borrowings (includes $17,162 and $18,171 at fair value as of December 2011 and | 173,545 | 174,399 | ||||||
Other liabilities and accrued expenses (includes $9,486 and $2,972 at fair value as of December 2011 and December 2010, respectively) | 31,801 | 30,011 | ||||||
Total liabilities | 852,846 | 833,976 | ||||||
Commitments, contingencies and guarantees Shareholders’ equity Preferred stock, par value $0.01 per share; aggregate liquidation preference of $3,100 and $8,100 as of December 2011 and December 2010, respectively | 3,100 | 6,957 | ||||||
Common stock, par value $0.01 per share; 4,000,000,000 shares authorized, 795,555,310 and 770,949,268 shares issued as of December 2011 and December 2010, respectively, and 485,467,565 and 507,530,772 shares outstanding as of December 2011 and December 2010, respectively | 8 | 8 | ||||||
Restricted stock units and employee stock options | 5,681 | 7,706 | ||||||
Nonvoting common stock, par value $0.01 per share; 200,000,000 shares authorized, no shares issued and outstanding | — | — | ||||||
Additional paid-in capital | 45,553 | 42,103 | ||||||
Retained earnings | 58,834 | 57,163 | ||||||
Accumulated other comprehensive loss | (516 | ) | (286 | ) | ||||
Stock held in treasury, at cost, par value $0.01 per share; 310,087,747 and 263,418,498 shares as of December 2011 and December 2010, respectively | (42,281 | ) | (36,295 | ) | ||||
Total shareholders’ equity | 70,379 | 77,356 | ||||||
Total liabilities and shareholders’ equity | $ | 923,225 | $ | 911,332 | ||||
| As of December | ||||||||
| $ in millions, except per share amounts | 2014 | 2013 | ||||||
Assets | ||||||||
Cash and cash equivalents | $ 57,600 | $ 61,133 | ||||||
Cash and securities segregated for regulatory and other purposes (includes $34,291 and $31,937 at fair value as of December 2014 and December 2013, respectively) | 51,716 | 49,671 | ||||||
Collateralized agreements: | ||||||||
Securities purchased under agreements to resell and federal funds sold (includes $126,036 and $161,297 at fair value as of December 2014 and December 2013, respectively) | 127,938 | 161,732 | ||||||
Securities borrowed (includes $66,769 and $60,384 at fair value as of December 2014 and December 2013, respectively) | 160,722 | 164,566 | ||||||
Receivables: | ||||||||
Brokers, dealers and clearing organizations | 30,671 | 23,840 | ||||||
Customers and counterparties (includes $6,944 and $7,416 at fair value as of December 2014 and December 2013, respectively) | 63,808 | 74,040 | ||||||
Loans receivable | 28,938 | 14,895 | ||||||
Financial instruments owned, at fair value (includes $64,473 and $62,348 pledged as collateral as of December 2014 and December 2013, respectively) | 312,248 | 339,121 | ||||||
Other assets (includes $18 at fair value as of December 2013) | 22,599 | 22,509 | ||||||
Total assets | $856,240 | $911,507 | ||||||
Liabilities and shareholders’ equity | ||||||||
Deposits (includes $13,523 and $7,255 at fair value as of December 2014 and December 2013, respectively) | $ 83,008 | $ 70,807 | ||||||
Collateralized financings: | ||||||||
Securities sold under agreements to repurchase, at fair value | 88,215 | 164,782 | ||||||
Securities loaned (includes $765 and $973 at fair value as of December 2014 and December 2013, respectively) | 5,570 | 18,745 | ||||||
Other secured financings (includes $21,450 and $23,591 at fair value as of December 2014 and December 2013, respectively) | 22,809 | 24,814 | ||||||
Payables: | ||||||||
Brokers, dealers and clearing organizations | 6,636 | 5,349 | ||||||
Customers and counterparties | 206,936 | 199,416 | ||||||
Financial instruments sold, but not yet purchased, at fair value | 132,083 | 127,426 | ||||||
Unsecured short-term borrowings, including the current portion of unsecured long-term borrowings (includes $18,826 and $19,067 at fair value as of December 2014 and December 2013, respectively) | 44,540 | 44,692 | ||||||
Unsecured long-term borrowings (includes $16,005 and $11,691 at fair value as of December 2014 and December 2013, respectively) | 167,571 | 160,965 | ||||||
Other liabilities and accrued expenses (includes $831 and $388 at fair value as of December 2014 and December 2013, respectively) | 16,075 | 16,044 | ||||||
Total liabilities | 773,443 | 833,040 | ||||||
Commitments, contingencies and guarantees | ||||||||
Shareholders’ equity | ||||||||
Preferred stock, par value $0.01 per share; aggregate liquidation preference of $9,200 and $7,200 as of December 2014 and December 2013, respectively | 9,200 | 7,200 | ||||||
Common stock, par value $0.01 per share; 4,000,000,000 shares authorized, 852,784,764 and 837,219,068 shares issued as of December 2014 and December 2013, respectively, and 430,259,102 and 446,359,012 shares outstanding as of December 2014 and December 2013, respectively | 9 | 8 | ||||||
Share-based awards | 3,766 | 3,839 | ||||||
Nonvoting common stock, par value $0.01 per share; 200,000,000 shares authorized, no shares issued and outstanding | — | — | ||||||
Additional paid-in capital | 50,049 | 48,998 | ||||||
Retained earnings | 78,984 | 71,961 | ||||||
Accumulated other comprehensive loss | (743 | ) | (524 | ) | ||||
Stock held in treasury, at cost, par value $0.01 per share; 422,525,664 and 390,860,058 shares as of December 2014 and December 2013, respectively | (58,468 | ) | (53,015 | ) | ||||
Total shareholders’ equity | 82,797 | 78,467 | ||||||
Total liabilities and shareholders’ equity | $856,240 | $911,507 | ||||||
The accompanying notes are an integral part of these consolidated financial statements.
| 120 | Goldman Sachs 2014 Form 10-K |
THE GOLDMAN SACHS GROUP, INC. AND SUBSIDIARIES
Consolidated Statements of Changes in Shareholders’ Equity
| Year Ended December | ||||||||||||
| $ in millions | 2014 | 2013 | 2012 | |||||||||
Preferred stock | ||||||||||||
Balance, beginning of year | $ 7,200 | $ 6,200 | $ 3,100 | |||||||||
Issued | 2,000 | 1,000 | 3,100 | |||||||||
Balance, end of year | 9,200 | 7,200 | 6,200 | |||||||||
Common stock | ||||||||||||
Balance, beginning of year | 8 | 8 | 8 | |||||||||
Issued | 1 | — | — | |||||||||
Balance, end of year | 9 | 8 | 8 | |||||||||
Share-based awards | ||||||||||||
Balance, beginning of year | 3,839 | 3,298 | 5,681 | |||||||||
Issuance and amortization of share-based awards | 2,079 | 2,017 | 1,368 | |||||||||
Delivery of common stock underlying share-based awards | (1,725 | ) | (1,378 | ) | (3,659 | ) | ||||||
Forfeiture of share-based awards | (92 | ) | (79 | ) | (90 | ) | ||||||
Exercise of share-based awards | (335 | ) | (19 | ) | (2 | ) | ||||||
Balance, end of year | 3,766 | 3,839 | 3,298 | |||||||||
Additional paid-in capital | ||||||||||||
Balance, beginning of year | 48,998 | 48,030 | 45,553 | |||||||||
Delivery of common stock underlying share-based awards | 2,206 | 1,483 | 3,939 | |||||||||
Cancellation of share-based awards in satisfaction of withholding tax requirements | (1,922 | ) | (599 | ) | (1,437 | ) | ||||||
Preferred stock issuance costs | (20 | ) | (9 | ) | (13 | ) | ||||||
Excess net tax benefit/(provision) related to share-based awards | 788 | 94 | (11 | ) | ||||||||
Cash settlement of share-based awards | (1 | ) | (1 | ) | (1 | ) | ||||||
Balance, end of year | 50,049 | 48,998 | 48,030 | |||||||||
Retained earnings | ||||||||||||
Balance, beginning of year | 71,961 | 65,223 | 58,834 | |||||||||
Net earnings | 8,477 | 8,040 | 7,475 | |||||||||
Dividends and dividend equivalents declared on common stock and share-based awards | (1,054 | ) | (988 | ) | (903 | ) | ||||||
Dividends declared on preferred stock | (400 | ) | (314 | ) | (183 | ) | ||||||
Balance, end of year | 78,984 | 71,961 | 65,223 | |||||||||
Accumulated other comprehensive loss | ||||||||||||
Balance, beginning of year | (524 | ) | (193 | ) | (516 | ) | ||||||
Other comprehensive income/(loss) | (219 | ) | (331 | ) | 323 | |||||||
Balance, end of year | (743 | ) | (524 | ) | (193 | ) | ||||||
Stock held in treasury, at cost | ||||||||||||
Balance, beginning of year | (53,015 | ) | (46,850 | ) | (42,281 | ) | ||||||
Repurchased | (5,469 | ) | (6,175 | ) | (4,637 | ) | ||||||
Reissued | 49 | 40 | 77 | |||||||||
Other | (33 | ) | (30 | ) | (9 | ) | ||||||
Balance, end of year | (58,468 | ) | (53,015 | ) | (46,850 | ) | ||||||
Total shareholders’ equity | $ 82,797 | $ 78,467 | $ 75,716 | |||||||||
The accompanying notes are an integral part of these consolidated financial statements.
| Goldman Sachs |
THE GOLDMAN SACHS GROUP, INC. AND SUBSIDIARIES
Consolidated Statements of Changes in Shareholders’ EquityCash Flows
| Year Ended December | ||||||||||||
| $ in millions | 2014 | 2013 | 2012 | |||||||||
Cash flows from operating activities | ||||||||||||
Net earnings | $ 8,477 | $ 8,040 | $ 7,475 | |||||||||
Adjustments to reconcile net earnings to net cash provided by/(used for) operating activities | ||||||||||||
Depreciation and amortization | 1,337 | 1,322 | 1,738 | |||||||||
Deferred income taxes | 495 | 29 | (356 | ) | ||||||||
Share-based compensation | 2,085 | 2,015 | 1,319 | |||||||||
Gain on sale of hedge fund administration business | — | — | (494 | ) | ||||||||
Gain on sale of European insurance business | — | (211 | ) | — | ||||||||
Gain on extinguishment of junior subordinated debt | (289 | ) | — | — | ||||||||
Changes in operating assets and liabilities | ||||||||||||
Cash and securities segregated for regulatory and other purposes | (2,046 | ) | (143 | ) | 10,817 | |||||||
Receivables and payables (excluding loans receivable), net | 12,328 | (3,682 | ) | (20,499 | ) | |||||||
Collateralized transactions (excluding other secured financings), net | (52,104 | ) | (51,669 | ) | 76,558 | |||||||
Financial instruments owned, at fair value | 27,547 | 51,079 | (48,783 | ) | ||||||||
Financial instruments sold, but not yet purchased, at fair value | 4,642 | 933 | (18,867 | ) | ||||||||
Other, net | (10,095 | ) | (3,170 | ) | 3,971 | |||||||
Net cash provided by/(used for) operating activities | (7,623 | ) | 4,543 | 12,879 | ||||||||
Cash flows from investing activities | ||||||||||||
Purchase of property, leasehold improvements and equipment | (678 | ) | (706 | ) | (961 | ) | ||||||
Proceeds from sales of property, leasehold improvements and equipment | 30 | 62 | 49 | |||||||||
Business acquisitions, net of cash acquired | (1,732 | ) | (2,274 | ) | (593 | ) | ||||||
Proceeds from sales of investments | 1,514 | 2,503 | 1,195 | |||||||||
Purchase of available-for-sale securities | — | (738 | ) | (5,220 | ) | |||||||
Proceeds from sales of available-for-sale securities | — | 817 | 4,537 | |||||||||
Loans receivable, net | (14,043 | ) | (8,392 | ) | (2,741 | ) | ||||||
Net cash used for investing activities | (14,909 | ) | (8,728 | ) | (3,734 | ) | ||||||
Cash flows from financing activities | ||||||||||||
Unsecured short-term borrowings, net | 1,659 | 1,336 | (1,952 | ) | ||||||||
Other secured financings (short-term), net | (837 | ) | (7,272 | ) | 1,540 | |||||||
Proceeds from issuance of other secured financings (long-term) | 6,900 | 6,604 | 4,687 | |||||||||
Repayment of other secured financings (long-term), including the current portion | (7,636 | ) | (3,630 | ) | (11,576 | ) | ||||||
Proceeds from issuance of unsecured long-term borrowings | 39,857 | 30,851 | 27,734 | |||||||||
Repayment of unsecured long-term borrowings, including the current portion | (28,138 | ) | (30,473 | ) | (36,435 | ) | ||||||
Purchase of trust preferred securities | (1,611 | ) | — | — | ||||||||
Derivative contracts with a financing element, net | 643 | 874 | 1,696 | |||||||||
Deposits, net | 12,201 | 683 | 24,015 | |||||||||
Common stock repurchased | (5,469 | ) | (6,175 | ) | (4,640 | ) | ||||||
Dividends and dividend equivalents paid on common stock, preferred stock and share-based awards | (1,454 | ) | (1,302 | ) | (1,086 | ) | ||||||
Proceeds from issuance of preferred stock, net of issuance costs | 1,980 | 991 | 3,087 | |||||||||
Proceeds from issuance of common stock, including exercise of share-based awards | 123 | 65 | 317 | |||||||||
Excess tax benefit related to share-based awards | 782 | 98 | 130 | |||||||||
Cash settlement of share-based awards | (1 | ) | (1 | ) | (1 | ) | ||||||
Net cash provided by/(used for) financing activities | 18,999 | (7,351 | ) | 7,516 | ||||||||
Net increase/(decrease) in cash and cash equivalents | (3,533 | ) | (11,536 | ) | 16,661 | |||||||
Cash and cash equivalents, beginning of year | 61,133 | 72,669 | 56,008 | |||||||||
Cash and cash equivalents, end of year | $ 57,600 | $ 61,133 | $ 72,669 | |||||||||
| Year Ended December | ||||||||||||
| in millions | 2011 | 2010 | 2009 | |||||||||
Preferred stock Balance, beginning of year | $ | 6,957 | $ | 6,957 | $ | 16,483 | ||||||
Accretion | — | — | 48 | |||||||||
Repurchased | (3,857 | ) | — | (9,574 | ) | |||||||
Balance, end of year | 3,100 | 6,957 | 6,957 | |||||||||
Common stock Balance, beginning of year | 8 | 8 | 7 | |||||||||
Issued | — | — | 1 | |||||||||
Balance, end of year | 8 | 8 | 8 | |||||||||
Restricted stock units and employee stock options Balance, beginning of year | 7,706 | 6,245 | 9,463 | |||||||||
Issuance and amortization of restricted stock units and employee stock options | 2,863 | 4,137 | 2,064 | |||||||||
Delivery of common stock underlying restricted stock units | (4,791 | ) | (2,521 | ) | (5,206 | ) | ||||||
Forfeiture of restricted stock units and employee stock options | (93 | ) | (149 | ) | (73 | ) | ||||||
Exercise of employee stock options | (4 | ) | (6 | ) | (3 | ) | ||||||
Balance, end of year | 5,681 | 7,706 | 6,245 | |||||||||
Additional paid-in capital Balance, beginning of year | 42,103 | 39,770 | 31,070 | |||||||||
Issuance of common stock | 103 | — | 5,750 | |||||||||
Repurchase of common stock warrants | — | — | (1,100 | ) | ||||||||
Delivery of common stock underlying share-based awards | 5,160 | 3,067 | 5,708 | |||||||||
Cancellation of restricted stock units in satisfaction of withholding tax requirements | (1,911 | ) | (972 | ) | (863 | ) | ||||||
Excess net tax benefit/(provision) related to share-based awards | 138 | 239 | (793 | ) | ||||||||
Cash settlement of share-based compensation | (40 | ) | (1 | ) | (2 | ) | ||||||
Balance, end of year | 45,553 | 42,103 | 39,770 | |||||||||
Retained earnings Balance, beginning of year | 57,163 | 50,252 | 38,579 | |||||||||
Net earnings | 4,442 | 8,354 | 13,385 | |||||||||
Dividends and dividend equivalents declared on common stock and restricted stock units | (769 | ) | (802 | ) | (588 | ) | ||||||
Dividends on preferred stock | (2,002 | ) | (641 | ) | (1,076 | ) | ||||||
Preferred stock accretion | — | — | (48 | ) | ||||||||
Balance, end of year | 58,834 | 57,163 | 50,252 | |||||||||
Accumulated other comprehensive income/(loss) Balance, beginning of year | (286 | ) | (362 | ) | (372 | ) | ||||||
Currency translation adjustment, net of tax | (55 | ) | (38 | ) | (70 | ) | ||||||
Pension and postretirement liability adjustments, net of tax | (145 | ) | 88 | (17 | ) | |||||||
Net unrealized gains/(losses) on available-for-sale securities, net of tax | (30 | ) | 26 | 97 | ||||||||
Balance, end of year | (516 | ) | (286 | ) | (362 | ) | ||||||
Stock held in treasury, at cost Balance, beginning of year | (36,295 | ) | (32,156 | ) | (32,176 | ) | ||||||
Repurchased | (6,051 | ) | (4,185 | ) | (2 | ) 1 | ||||||
Reissued | 65 | 46 | 22 | |||||||||
Balance, end of year | (42,281 | ) | (36,295 | ) | (32,156 | ) | ||||||
Total shareholders’ equity | $ | 70,379 | $ | 77,356 | $ | 70,714 | ||||||
|
SUPPLEMENTAL DISCLOSURES:
Cash payments for interest, net of capitalized interest, were $6.43 billion, $5.69 billion and $9.25 billion for 2014, 2013 and 2012, respectively.
Cash payments for income taxes, net of refunds, were $3.05 billion, $4.07 billion and $1.88 billion for 2014, 2013 and 2012, respectively.
Non-cash activities:
During 2014, the firm exchanged $1.58 billion of Trust Preferred Securities, common beneficial interests and senior guaranteed trust securities held by the firm for $1.87 billion of the firm’s junior subordinated debt held by the issuing trusts. Following the exchange, this junior subordinated debt was extinguished.
During 2014, the firm sold certain consolidated investments and provided seller financing, which resulted in a non-cash increase to loans receivable of $115 million.
During 2012, the firm assumed $77 million of debt in connection with business acquisitions.
The accompanying notes are an integral part of these consolidated financial statements.
| Goldman Sachs |
THE GOLDMAN SACHS GROUP, INC. AND SUBSIDIARIES
Consolidated Statements of Cash Flows
| Year Ended December | ||||||||||||
| in millions | 2011 | 2010 | 2009 | |||||||||
Cash flows from operating activities Net earnings | $ | 4,442 | $ | 8,354 | $ | 13,385 | ||||||
Non-cash items included in net earnings Depreciation and amortization | 1,869 | 1,904 | 1,943 | |||||||||
Deferred income taxes | 726 | 1,339 | (431 | ) | ||||||||
Share-based compensation | 2,849 | 4,035 | 2,009 | |||||||||
Changes in operating assets and liabilities Cash and securities segregated for regulatory and other purposes | (10,532 | ) | (17,094 | ) | 76,531 | |||||||
Net receivables from brokers, dealers and clearing organizations | (3,780 | ) | 201 | 6,265 | ||||||||
Net payables to customers and counterparties | 13,027 | (5,437 | ) | (47,414 | ) | |||||||
Securities borrowed, net of securities loaned | 8,940 | 19,638 | 7,033 | |||||||||
Securities sold under agreements to repurchase, net of securities purchased under agreements to resell and federal funds sold | 122 | (10,092 | ) | (146,807 | ) | |||||||
Financial instruments owned, at fair value | 5,085 | (9,231 | ) | 186,295 | ||||||||
Financial instruments sold, but not yet purchased, at fair value | 4,243 | 11,602 | (57,010 | ) | ||||||||
Other, net | (5,346 | ) | (11,376 | ) | 7,076 | |||||||
Net cash provided by/(used for) operating activities | 21,645 | (6,157 | ) | 48,875 | ||||||||
Cash flows from investing activities Purchase of property, leasehold improvements and equipment | (1,184 | ) | (1,227 | ) | (1,556 | ) | ||||||
Proceeds from sales of property, leasehold improvements and equipment | 78 | 72 | 82 | |||||||||
Business acquisitions, net of cash acquired | (431 | ) | (804 | ) | (221 | ) | ||||||
Proceeds from sales of investments | 2,645 | 1,371 | 303 | |||||||||
Purchase of available-for-sale securities | (2,752 | ) | (1,885 | ) | (2,722 | ) | ||||||
Proceeds from sales of available-for-sale securities | 3,129 | 2,288 | 2,553 | |||||||||
Net cash provided by/(used for) investing activities | 1,485 | (185 | ) | (1,561 | ) | |||||||
Cash flows from financing activities Unsecured short-term borrowings, net | (3,780 | ) | 1,196 | (9,790 | ) | |||||||
Other secured financings (short-term), net | (1,195 | ) | 12,689 | (10,451 | ) | |||||||
Proceeds from issuance of other secured financings (long-term) | 9,809 | 5,500 | 4,767 | |||||||||
Repayment of other secured financings (long-term), including the current portion | (8,878 | ) | (4,849 | ) | (6,667 | ) | ||||||
Proceeds from issuance of unsecured long-term borrowings | 29,169 | 20,231 | 25,363 | |||||||||
Repayment of unsecured long-term borrowings, including the current portion | (29,187 | ) | (22,607 | ) | (29,018 | ) | ||||||
Repurchase of common stock warrants | — | — | (1,100 | ) | ||||||||
Derivative contracts with a financing element, net | 1,602 | 1,222 | 2,168 | |||||||||
Deposits, net | 7,540 | (849 | ) | 7,288 | ||||||||
Preferred stock repurchased | (3,857 | ) | — | (9,574 | ) | |||||||
Common stock repurchased | (6,048 | ) | (4,183 | ) | (2 | ) | ||||||
Dividends and dividend equivalents paid on common stock, preferred stock and restricted stock units | (2,771 | ) | (1,443 | ) | (2,205 | ) | ||||||
Proceeds from issuance of common stock, including stock option exercises | 368 | 581 | 6,260 | |||||||||
Excess tax benefit related to share-based compensation | 358 | 352 | 135 | |||||||||
Cash settlement of share-based compensation | (40 | ) | (1 | ) | (2 | ) | ||||||
Net cash provided by/(used for) financing activities | (6,910 | ) | 7,839 | (22,828 | ) | |||||||
Net increase in cash and cash equivalents | 16,220 | 1,497 | 24,486 | |||||||||
Cash and cash equivalents, beginning of year | 39,788 | 38,291 | 13,805 | |||||||||
Cash and cash equivalents, end of year | $ | 56,008 | $ | 39,788 | $ | 38,291 | ||||||
SUPPLEMENTAL DISCLOSURES:
Cash payments for interest, net of capitalized interest, were $8.05 billion, $6.74 billion and $7.32 billion for the years ended December 2011, December 2010 and December 2009, respectively.
Cash payments for income taxes, net of refunds, were $1.78 billion, $4.48 billion and $4.78 billion for the years ended December 2011, December 2010 and December 2009, respectively.
Non-cash activities:
During the year ended December 2011, the firm assumed $2.09 billion of debt and issued $103 million of common stock in connection with the acquisition of Goldman Sachs Australia Pty Ltd (GS Australia), formerly Goldman Sachs & Partners Australia Group Holdings Pty Ltd. During the years ended December 2010 and December 2009, the firm assumed $90 million and $16 million, respectively, of debt in connection with business acquisitions. In addition, in the first quarter of 2010, the firm recorded an increase of approximately $3 billion in both assets (primarily financial instruments owned, at fair value) and liabilities (primarily unsecured short-term borrowings and other liabilities) upon adoption of Accounting Standards Update (ASU) No. 2009-17, “Consolidations (Topic 810) — Improvements to Financial Reporting by Enterprises Involved with Variable Interest Entities.”
The accompanying notes are an integral part of these consolidated financial statements.
THE GOLDMAN SACHS GROUP, INC. AND SUBSIDIARIES
Consolidated Statements of Comprehensive Income
| Year Ended December | ||||||||||||
| in millions | 2011 | 2010 | 2009 | |||||||||
Net earnings | $ | 4,442 | $ | 8,354 | $ | 13,385 | ||||||
Currency translation adjustment, net of tax | (55 | ) | (38 | ) | (70 | ) | ||||||
Pension and postretirement liability adjustments, net of tax | (145 | ) | 88 | (17 | ) | |||||||
Net unrealized gains/(losses) on available-for-sale securities, net of tax | (30 | ) | 26 | 97 | ||||||||
Comprehensive income | $ | 4,212 | $ | 8,430 | $ | 13,395 | ||||||
The accompanying notes are an integral part of these consolidated financial statements.
THE GOLDMAN SACHS GROUP, INC. AND SUBSIDIARIES
Notes to Consolidated Financial Statements
Description of Business
The Goldman Sachs Group, Inc. (Group Inc.), a Delaware corporation, together with its consolidated subsidiaries (collectively, the firm), is a leading global investment banking, securities and investment management firm that provides a wide range of financial services to a substantial and diversified client base that includes corporations, financial institutions, governments and high-net-worth individuals. Founded in 1869, the firm is headquartered in New York and maintains offices in all major financial centers around the world.
The firm reports its activities in the following four business segments:
Investment Banking
The firm provides a broad range of investment banking services to a diverse group of corporations, financial institutions, investment funds and governments. Services include strategic advisory assignments with respect to mergers and acquisitions, divestitures, corporate defense activities, restructurings, spin-offs and risk management, restructurings and spin-offs, and debt and equity underwriting of public offerings and private placements, including local and cross-border transactions, as well as derivative transactions directly related to these activities.
Institutional Client Services
The firm facilitates client transactions and makes markets in fixed income, equity, currency and commodity products, primarily with institutional clients such as corporates,corporations, financial institutions, investment funds and governments. The firm also makes markets in and clears client transactions on major stock, options and futures exchanges worldwide and provides financing, securities lending and other prime brokerage services to institutional clients.
Investing & Lending
The firm invests in and originates loans to provide financing to clients. These investments and loans are typically longer-term in nature. The firm makes investments, some of which are consolidated, directly and indirectly through funds that the firm manages, in debt securities and loans, public and private equity securities, and real estate consolidated investment entities and power generation facilities.entities.
Investment Management
The firm provides investment management services and offers investment products (primarily through separately managed accounts and commingled vehicles, such as mutual funds and private investment funds) across all major asset classes to a diverse set of institutional and individual clients. The firm also offers wealth advisory services, including portfolio management and financial counseling, and brokerage and other transaction services to high-net-worth individuals and families.
Basis of Presentation
These consolidated financial statements are prepared in accordance with accounting principles generally accepted in the United States (U.S. GAAP) and include the accounts of Group Inc. and all other entities in which the firm has a controlling financial interest. Intercompany transactions and balances have been eliminated.
All references to 2011, 20102014, 2013 and 20092012 refer to the firm’s years ended, or the dates, as the context requires, December 31, 2011,2014, December 31, 20102013 and December 31, 2009,2012, respectively. In connection with becoming a bank holding company in 2008, the firm was required to change its fiscal year-end from November to December. The beginning of the year ended December 2009 is December 27, 2008. Any reference to a future year refers to a year ending on December 31 of that year. Certain reclassifications have been made to previously reported amounts to conform to the current presentation.
| Goldman Sachs |
THE GOLDMAN SACHS GROUP, INC. AND SUBSIDIARIES
Notes to Consolidated Financial Statements
Significant Accounting Policies
The firm’s significant accounting policies include when and how to measure the fair value of assets and liabilities, accounting for goodwill and identifiable intangible assets, and when to consolidate an entity. See Notes 5 through 8 for policies on fair value measurements, Note 13 for policies on goodwill and identifiable intangible assets, and below and Note 1112 for policies on consolidation accounting. All other significant accounting policies are either discussed below or included in the following footnotes:
Financial Instruments Owned, at Fair Value and Financial Instruments Sold, But Not Yet Purchased, at Fair Value | Note 4 | |||
Fair Value Measurements | Note 5 | |||
Cash Instruments | Note 6 | |||
Derivatives and Hedging Activities | Note 7 | |||
Fair Value Option | Note 8 | |||
Loans Receivable | Note 9 | |||
Collateralized Agreements and Financings | Note | |||
Securitization Activities | Note | |||
Variable Interest Entities | Note | |||
Other Assets, | ||||
including Goodwill and Identifiable Intangible Assets | Note 13 | |||
Deposits | Note 14 | |||
Short-Term Borrowings | Note 15 | |||
Long-Term Borrowings | Note 16 | |||
Other Liabilities and Accrued Expenses | Note 17 | |||
Commitments, Contingencies and Guarantees | Note 18 | |||
Shareholders’ Equity | Note 19 | |||
Regulation and Capital Adequacy | Note 20 | |||
Earnings Per Common Share | Note 21 | |||
Transactions with Affiliated Funds | Note 22 | |||
Interest Income and Interest Expense | Note 23 | |||
Income Taxes | Note 24 | |||
Business Segments | Note 25 | |||
Credit Concentrations | Note 26 | |||
Legal Proceedings | Note 27 | |||
Employee Benefit Plans | Note 28 | |||
Employee Incentive Plans | Note 29 | |||
Parent Company | Note 30 | |||
Consolidation
The firm consolidates entities in which the firm has a controlling financial interest. The firm determines whether it has a controlling financial interest in an entity by first evaluating whether the entity is a voting interest entity or a variable interest entity (VIE).
Voting Interest Entities.Voting interest entities are entities in which (i) the total equity investment at risk is sufficient to enable the entity to finance its activities independently and (ii) the equity holders have the power to direct the activities of the entity that most significantly impact its economic performance, the obligation to absorb the losses of the entity and the right to receive the residual returns of the entity. The usual condition for a controlling financial interest in a voting interest entity is ownership of a majority voting interest. If the firm has a majority voting interest in a voting interest entity, the entity is consolidated.
Variable Interest Entities.A VIE is an entity that lacks one or more of the characteristics of a voting interest entity. The firm has a controlling financial interest in a VIE when the firm has a variable interest or interests that provide it with (i) the power to direct the activities of the VIE that most significantly impact the VIE’s economic performance and (ii) the obligation to absorb losses of the VIE or the right to receive benefits from the VIE that could potentially be significant to the VIE. See Note 1112 for further information about VIEs.
Equity-Method InvestmentsInvestments.. When the firm does not have a controlling financial interest in an entity but can exert significant influence over the entity’s operating and financial policies, the investment is accounted for either (i) under the equity method of accounting or (ii) at fair value by electing the fair value option available under U.S. GAAP. Significant influence generally exists when the firm owns 20% to 50% of the entity’s common stock or in-substance common stock.
THE GOLDMAN SACHS GROUP, INC. AND SUBSIDIARIES
Notes to Consolidated Financial Statements
In general, the firm accounts for investments acquired subsequent to November 24, 2006, whenafter the fair value option became available, at fair value. In certain cases, the firm applies the equity method of accounting to new investments that are strategic in nature or closely related to the firm’s principal business activities, when the firm has a significant degree of involvement in the cash flows or operations of the investee or when cost-benefit considerations are less significant. See Note 1213 for further information about equity-method investments.
| 124 | Goldman Sachs 2014 Form 10-K |
THE GOLDMAN SACHS GROUP, INC. AND SUBSIDIARIES
Notes to Consolidated Financial Statements
Investment Funds. The firm has formed numerous investment funds with third-party investors. These funds are typically organized as limited partnerships or limited liability companies for which the firm acts as general partner or manager. Generally, the firm does not hold a majority of the economic interests in these funds. These funds are usually voting interest entities and generally are not consolidated because third-party investors typically have rights to terminate the funds or to remove the firm as general partner or manager. Investments in these funds are included in “Financial instruments owned, at fair value.” See Notes 6, 18 and 22 for further information about investments in funds.
Use of Estimates
Preparation of these consolidated financial statements requires management to make certain estimates and assumptions, the most important of which relate to fair value measurements, accounting for goodwill and identifiable intangible assets, and the provisionprovisions for losses that may arise from litigation, regulatory proceedings and tax audits. These estimates and assumptions are based on the best available information but actual results could be materially different.
Revenue Recognition
Financial Assets and Financial Liabilities at Fair Value.Financial instruments owned, at fair value and Financial instruments sold, but not yet purchased, at fair value are recorded at fair value either under the fair value option or in accordance with other U.S. GAAP. In addition, the firm has elected to account for certain of its other financial assets and financial liabilities at fair value by electing the fair value option. The fair value of a financial instrument is the amount that would be received to sell an asset or paid to
transfer a liability in an orderly transaction between market participants at the measurement date. Financial assets are marked to bid prices and financial liabilities are marked to offer prices. Fair value measurements do not include transaction costs. Fair value gains or losses are generally included in “Market making” for positions in Institutional Client Services and “Other principal transactions” for positions in Investing & Lending. See Notes 5 through 8 for further information about fair value measurements.
Investment Banking.Banking. Fees from financial advisory assignments and underwriting revenues are recognized in earnings when the services related to the underlying transaction are completed under the terms of the assignment. Expenses associated with such transactions are deferred until the related revenue is recognized or the assignment is otherwise concluded. Expenses associated with financial advisory assignments are recorded as non-compensation expenses, net of client reimbursements. Underwriting revenues are presented net of related expenses.
Investment Management.The firm earns management fees and incentive fees for investment management services. Management fees for mutual funds are calculated as a percentage of daily net asset value and are received monthly. Management fees for hedge funds and separately managed accounts are calculated as a percentage of month-end net asset value and are generally received quarterly. Management fees for private equity funds are calculated as a percentage of monthly invested capital or commitments and are received quarterly, semi-annually or annually, depending on the fund. All management fees are recognized over the period that the related service is provided. Incentive fees are calculated as a percentage of a fund’s or separately managed account’s return, or excess return above a specified benchmark or other performance target. Incentive fees are generally based on investment performance over a 12-month period or over the life of a fund. Fees that are based on performance over a 12-month period are subject to adjustment prior to the end of the measurement period. For fees that are based on investment performance over the life of the fund, future investment underperformance may require fees previously distributed to the firm to be returned to the fund. Incentive fees are recognized only when all material contingencies have been resolved. Management and incentive fee revenues are included in “Investment management” revenues.
The firm makes payments to brokers and advisors related to the placement of the firm’s investment funds. These payments are computed based on either a percentage of the management fee or the investment fund’s net asset value. Where the firm is principal to the arrangement, such costs are recorded on a gross basis and included in “Brokerage, clearing, exchange and distribution fees,” and where the firm is agent to the arrangement, such costs are recorded on a net basis in “Investment management” revenues.
| Goldman Sachs 2014 Form 10-K | 125 |
THE GOLDMAN SACHS GROUP, INC. AND SUBSIDIARIES
Notes to Consolidated Financial Statements
Commissions and Fees.The firm earns “Commissions and fees” from executing and clearing client transactions on stock, options and futures markets.markets, as well as over-the-counter (OTC) transactions. Commissions and fees are recognized on the day the trade is executed.
THE GOLDMAN SACHS GROUP, INC. AND SUBSIDIARIES
Notes to Consolidated Financial Statements
Transfers of Assets
Transfers of assets are accounted for as sales when the firm has relinquished control over the assets transferred. For transfers of assets accounted for as sales, any related gains or losses are recognized in net revenues. Assets or liabilities that arise from the firm’s continuing involvement with transferred assets are measured at fair value. For transfers of assets that are not accounted for as sales, the assets remain in “Financial instruments owned, at fair value” and the transfer is accounted for as a collateralized financing, with the related interest expense recognized over the life of the transaction. See Note 910 for further information about transfers of assets accounted for as collateralized financings and Note 1011 for further information about transfers of assets accounted for as sales.
Cash and Cash Equivalents
The firm defines cash equivalents as highly liquid overnight deposits held in the ordinary course of business. As of December 2014 and December 2013, “Cash and cash equivalents” included $5.79 billion and $4.14 billion, respectively, of cash and due from banks, and $51.81 billion and $56.99 billion, respectively, of interest-bearing deposits with banks.
Receivables from Customers and Counterparties
Receivables from customers and counterparties generally relate to collateralized transactions. Such receivables are primarily comprised of customer margin loans, certain transfers of assets accounted for as secured loans rather than purchases at fair value and collateral posted in connection with certain derivative transactions. Certain of the firm’s receivables from customers and counterparties are accounted for at fair value under the fair value option, with changes in fair value generally included in “Market making” revenues. See Note 8 for further information about receivables from customers and counterparties accounted for at fair value under the fair values of these receivables. value option.
Receivables from customers and counterparties not accounted for at fair value are accounted for at amortized cost net of estimated uncollectible amounts, which generally approximates fair value. While these items are carried at amounts that approximate fair value, they are not accounted for at fair value under the fair value option or at fair value in accordance with other U.S. GAAP and therefore are not included in the firm’s fair value hierarchy in Notes 6 through 8. Had these items been included in the firm’s fair value hierarchy, substantially all would have been classified in level 2 as of December 2014 and December 2013. Interest on receivables from customers and counterparties is recognized over the life of the transaction and included in “Interest income.”
Insurance ActivitiesReceivables from and Payables to Brokers, Dealers and Clearing Organizations
Certain of the firm’s insuranceReceivables from and reinsurance contractspayables to brokers, dealers and clearing organizations are accounted for at cost plus accrued interest, which generally approximates fair value. While these receivables and payables are carried at amounts that approximate fair value, they are not accounted for at fair value under the fair value option with changes inor at fair value in accordance with other U.S. GAAP and therefore are not included in “Market making” revenues. See Note 8the firm’s fair value hierarchy in Notes 6 through 8. Had these receivables and payables been included in the firm’s fair value hierarchy, substantially all would have been classified in level 2 as of December 2014 and December 2013.
Payables to Customers and Counterparties
Payables to customers and counterparties primarily consist of customer credit balances related to the firm’s prime brokerage activities. Payables to customers and counterparties are accounted for further information about theat cost plus accrued interest, which generally approximates fair values ofvalue. While these insurance and reinsurance contracts.
Revenues from variable annuity and life insurance and reinsurance contractspayables are carried at amounts that approximate fair value, they are not accounted for at fair value generally consistunder the fair value option or at fair value in accordance with other U.S. GAAP and therefore are not included in the firm’s fair value hierarchy in Notes 6 through 8. Had these payables been included in the firm’s fair value hierarchy, substantially all would have been classified in level 2 as of fees assessedDecember 2014 and December 2013. Interest on contract holder account balances for mortality charges, policy administration feespayables to customers and surrender charges. These revenues arecounterparties is recognized in earnings over the periodlife of the transaction and included in “Interest expense.”
| 126 | Goldman Sachs 2014 Form 10-K |
THE GOLDMAN SACHS GROUP, INC. AND SUBSIDIARIES
Notes to Consolidated Financial Statements
Offsetting Assets and Liabilities
To reduce credit exposures on derivatives and securities financing transactions, the firm may enter into master netting agreements or similar arrangements (collectively, netting agreements) with counterparties that servicespermit it to offset receivables and payables with such counterparties. A netting agreement is a contract with a counterparty that permits net settlement of multiple transactions with that counterparty, including upon the exercise of termination rights by a non-defaulting party. Upon exercise of such termination rights, all transactions governed by the netting agreement are providedterminated and a net settlement amount is calculated. In addition, the firm receives and posts cash and securities collateral with respect to its derivatives and securities financing transactions, subject to the terms of the related credit support agreements or similar arrangements (collectively, credit support agreements). An enforceable credit support agreement grants the non-defaulting party exercising termination rights the right to liquidate the collateral and apply the proceeds to any amounts owed. In order to assess enforceability of the firm’s right of setoff under netting and credit support agreements, the firm evaluates various factors including applicable bankruptcy laws, local statutes and regulatory provisions in the jurisdiction of the parties to the agreement.
Derivatives are reported on a net-by-counterparty basis (i.e., the net payable or receivable for derivative assets and liabilities for a given counterparty) in the consolidated statements of financial condition when a legal right of setoff exists under an enforceable netting agreement. Resale and repurchase agreements and securities borrowed and loaned transactions with the same term and currency are presented on a net-by-counterparty basis in the consolidated statements of financial condition when such transactions meet certain settlement criteria and are included in “Market making” revenues. Changes in reserves, including interest creditedsubject to policyholder account balances,netting agreements.
In the consolidated statements of financial condition, derivatives are recognized in “Insurance reserves.”
Premiums earned for underwriting property catastrophe reinsurance are recognized in earnings over the coverage period,reported net of premiums ceded forcash collateral received and posted under enforceable credit support agreements, when transacted under an enforceable netting agreement. In the costconsolidated statements of reinsurance,financial condition, resale and repurchase agreements, and securities borrowed and loaned, are included in “Market making” revenues. Expenses for liabilities related to property catastrophe reinsurance claims, including estimates of losses that have been incurred but not reported are included in “Insurance reserves.”net of the related cash and securities received or posted as collateral. See Note 10 for further information about collateral received and pledged, including rights to deliver or repledge collateral. See Notes 7 and 10 for further information about offsetting.
Foreign Currency Translation
Assets and liabilities denominated in non-U.S. currencies are translated at rates of exchange prevailing on the date of the consolidated statements of financial condition and revenues and expenses are translated at average rates of exchange for the period. Foreign currency remeasurement gains or losses on transactions in nonfunctional currencies are recognized in earnings. Gains or losses on translation of the financial statements of a non-U.S. operation, when the functional currency is other than the U.S. dollar, are included, net of hedges and taxes, in the consolidated statements of comprehensive income.
Cash and Cash Equivalents
The firm defines cash equivalents as highly liquid overnight deposits held in the ordinary course of business. As of December 2011 and December 2010, “Cash and cash equivalents” included $7.95 billion and $5.75 billion, respectively, of cash and due from banks, and $48.05 billion and $34.04 billion, respectively, of interest-bearing deposits with banks.
THE GOLDMAN SACHS GROUP, INC. AND SUBSIDIARIES
Notes to Consolidated Financial Statements
Recent Accounting Developments
Improving Disclosures about Fair Value Measurements (FASB Accounting Standards Codification (ASC) 820)Investment Companies (ASC 946).In January 2010,June 2013, the FASB issued ASU No. 2010-06, “Fair Value Measurements2013-08, “Financial Services — Investment Companies (Topic 946) — Amendments to the Scope, Measurement, and Disclosures (Topic 820) — Improving Disclosures about Fair Value Measurements.Disclosure Requirements.” ASU No. 2010-062013-08 clarifies the approach to be used for determining whether an entity is an investment company and provides amendednew measurement and disclosure requirements related to fair value measurements. Certain of these disclosure requirements becamerequirements. ASU No. 2013-08 was effective for the firm beginninginterim and annual reporting periods in the first quarterfiscal years that began after December 15, 2013. Adoption of 2010, while others became effective for the firm beginning in the first quarter of 2011. Since these amended principles require only additional disclosures concerning fair value measurements, adoptionASU No. 2013-08 on January 1, 2014 did not affect the firm’s financial condition, results of operations, or cash flows.
ReconsiderationInclusion of the Fed Funds Effective ControlSwap Rate (or Overnight Index Swap Rate) as a Benchmark Interest Rate for Repurchase AgreementsHedge Accounting Purposes (ASC 860)815).. In April 2011,July 2013, the FASB issued ASU No. 2011-03, “Transfers2013-10, “Derivatives and ServicingHedging (Topic 860)815) — ReconsiderationInclusion of the Fed Funds Effective ControlSwap Rate (or Overnight Index Swap Rate) as a Benchmark Interest Rate for Repurchase Agreements.Hedge Accounting Purposes.” ASU No. 2011-03 changes2013-10 permits the assessmentuse of effective control by removing (i) the criterion that requiresFed Funds Effective Swap Rate (OIS) as a U.S. benchmark interest rate for hedge accounting purposes. The ASU also removes the transferor to have the ability to repurchase or redeem financial assetsrestriction on substantially the agreed terms, even in the event of default by the transferee, and (ii) the collateral maintenance implementation guidance related to that criterion.using different benchmark rates for similar hedges. ASU No. 2011-03 is2013-10 was effective for periods beginning after December 15, 2011. The adoption of ASU No. 2011-03 will not affect the firm’s financial condition, results of operationsqualifying new or cash flows.
Amendments to Achieve Common Fair Value Measurement and Disclosure Requirements in U.S. GAAP and IFRSs (ASC 820).In May 2011, the FASB issued ASU No. 2011-04, “Fair Value Measurements and Disclosures (Topic 820) — Amendments to Achieve Common Fair Value Measurement and Disclosure Requirements in U.S. GAAP and IFRSs.” ASU No. 2011-04 clarifies the application of existing fair value measurement and disclosure requirements, changes certain principles related to measuring fair value, and requires additional disclosures about fair value measurements. ASU No. 2011-04 is effective for periods beginning after December 15, 2011. Adoption of ASU No. 2011-04 will not materially affect the firm’s financial condition, results of operations or cash flows.
Testing Goodwill for Impairment (ASC 350). In September 2011, the FASB issued ASU No. 2011-08, “Intangibles — Goodwill and Other (Topic 350) — Testing Goodwill for Impairment.” ASU No. 2011-08 simplifies how entities test goodwill for impairment by permitting an entity to first assess qualitative factors to determine whether it is more likely than not that the fair value of a reporting unit is less than its carrying amount as a basis for determining whether it is necessary to perform the quantitative, two-step goodwill impairment test. ASU No. 2011-08 is effective for annual and interim goodwill impairment tests performed for fiscal years beginning after December 15, 2011. Early adoption is permitted. The firm adopted these amended principles in conjunction with its goodwill impairment test performed in the fourth quarter of 2011. The adoption of ASU No. 2011-08 did not affect the firm’s financial condition, results of operations or cash flows.
Derecognition of in Substance Real Estate (ASC 360). In December 2011, the FASB issued ASU No. 2011-10, “Property, Plant, and Equipment (Topic 360) — Derecognition of in Substance Real Estate — a Scope Clarification.” ASU No. 2011-10 clarifies that in order to deconsolidate a subsidiary (that is in substance real estate) as a result of a parent no longer controlling the subsidiary due to a default on the subsidiary’s nonrecourse debt, the parent also must satisfy the sale criteria in ASC 360-20, “Property, Plant, and Equipment — Real Estate Sales.” The ASU is effective for fiscal years beginningredesignated hedging relationships entered into on or after June 15, 2012. The firm will apply the provisions of the ASU to such events occurring on or after January 1, 2013. Adoption is not expected to materially affect the firm’s financial condition, results of operations or cash flows.
Disclosures about Offsetting Assets and Liabilities (ASC 210).In December 2011, the FASB issued ASU No. 2011-11, “Balance Sheet (Topic 210) — Disclosures about Offsetting Assets and Liabilities.” ASU No. 2011-11 will require disclosure of the effect or potential effect of offsetting arrangements on the firm’s financial position as well as enhanced disclosure of the rights of setoff associated with the firm’s recognized assets and recognized liabilities. ASU No. 2011-11 is effective for annual reporting periods beginning on or after January 1,July 17, 2013 and interim periods within those annual periods. Since these amended principles require only additional disclosures concerning offsetting and related arrangements, adoption willdid not materially affect the firm’s financial condition, results of operations, or cash flows.
| Goldman Sachs |
THE GOLDMAN SACHS GROUP, INC. AND SUBSIDIARIES
Notes to Consolidated Financial Statements
Reporting Discontinued Operations and Disclosures of Disposals of Components of an Entity. In April 2014, the FASB issued ASU No. 2014-08, “Presentation of Financial Statements (Topic 205) and Property, Plant, and Equipment (Topic 360) — Reporting Discontinued Operations and Disclosures of Disposals of Components of an Entity.” ASU No. 2014-08 limits discontinued operations reporting to disposals of components of an entity that represent strategic shifts that have (or will have) a major effect on an entity’s operations and financial results. The ASU requires expanded disclosures for discontinued operations and disposals of individually significant components of an entity that do not qualify for discontinued operations reporting. The ASU is effective for disposals and components classified as held for sale that occur within annual periods beginning on or after December 15, 2014, and interim periods within those years. Early adoption is permitted. The firm early adopted ASU No. 2014-08 in 2014 and adoption did not materially affect the firm’s financial condition, results of operations, or cash flows.
Revenue from Contracts with Customers (ASC 606).In May 2014, the FASB issued ASU No. 2014-09, “Revenue from Contracts with Customers (Topic 606).” ASU No. 2014-09 provides comprehensive guidance on the recognition of revenue from customers arising from the transfer of goods and services. The ASU also provides guidance on accounting for certain contract costs, and requires new disclosures. ASU No. 2014-09 is effective for annual reporting periods beginning after December 15, 2016, including interim periods within that reporting period. Early adoption is not permitted. The firm is still evaluating the effect of the ASU on its financial condition, results of operations, and cash flows.
Measuring the Financial Assets and the Financial Liabilities of a Consolidated Collateralized Financing Entity (ASC 810).In August 2014, the FASB issued ASU No. 2014-13, “Consolidation (Topic 810) — Measuring the Financial Assets and the Financial Liabilities of a Consolidated Collateralized Financing Entity (CFE).” ASU No. 2014-13 provides an alternative to reflect changes in the fair value of the financial assets and the financial liabilities of the CFE by measuring either the fair value of the assets or liabilities, whichever is more observable. ASU No. 2014-13 provides new disclosure requirements for those electing this approach, and is effective for interim and annual periods beginning after December 15, 2015. Early adoption is permitted. Adoption of ASU No. 2014-13 will not materially affect the firm’s financial condition, results of operations, or cash flows.
Repurchase-to-Maturity Transactions, Repurchase Financings, and Disclosures (ASC 860). In June 2014, the FASB issued ASU No. 2014-11, “Transfers and Servicing (Topic 860) — Repurchase-to-Maturity Transactions, Repurchase Financings, and Disclosures.” ASU No. 2014-11 changes the accounting for repurchase- and resale-to-maturity agreements by requiring that such agreements be recognized as financing arrangements, and requires that a transfer of a financial asset and a repurchase agreement entered into contemporaneously be accounted for separately. ASU No. 2014-11 also requires additional disclosures about certain transferred financial assets accounted for as sales and certain securities financing transactions. The accounting changes and additional disclosures about certain transferred financial assets accounted for as sales are effective for the first interim and annual reporting periods beginning after December 15, 2014. The additional disclosures for securities financing transactions are required for annual reporting periods beginning after December 15, 2014 and for interim reporting periods beginning after March 15, 2015. Adoption of the accounting changes in ASU No. 2014-11 on January 1, 2015 did not materially affect the firm’s financial condition, results of operations, or cash flows.
Amendments to the Consolidation Analysis (ASC 810). In February 2015, the FASB issued ASU No. 2015-02, “Consolidation (Topic 810) — Amendments to the Consolidation Analysis.” ASU No. 2015-02 eliminates the deferral of the requirements of ASU No. 2009-17, “Consolidations (Topic 810) — Improvements to Financial Reporting by Enterprises Involved with Variable Interest Entities” for certain interests in investment funds and provides a scope exception from Topic 810 for certain investments in money market funds. The ASU also makes several modifications to the consolidation guidance for VIEs and general partners’ investments in limited partnerships, as well as modifications to the evaluation of whether limited partnerships are VIEs or voting interest entities. ASU No. 2015-02 is effective for interim and annual reporting periods beginning after December 15, 2015. Early adoption is permitted. Adoption of ASU No. 2015-02 is not expected to materially affect the firm’s financial condition, results of operations, or cash flows.
| 128 | Goldman Sachs 2014 Form 10-K |
THE GOLDMAN SACHS GROUP, INC. AND SUBSIDIARIES
Notes to Consolidated Financial Statements
Financial Instruments Owned, at Fair Value and Financial Instruments Sold, But Not Yet Purchased, at Fair Value
Financial Instruments Owned, at Fair Value and Financial Instruments Sold, But Not Yet Purchased, at Fair Value |
Financial instruments owned, at fair value and financial instruments sold, but not yet purchased, at fair value are accounted for at fair value either under the fair value option or in accordance with other U.S. GAAP. See Note 8 for further information about other financial assets and
financial liabilities accounted for at fair value primarily under the fair value option. The table below presents the firm’s financial instruments owned, at fair value, including those pledged as collateral, and
financial instruments sold, but not yet purchased, at fair value. Financial instruments owned, at fair value included $4.86 billion and $3.67 billion as of December 2011 and December 2010, respectively, of securities accounted for as available-for-sale, substantially all of which are held in the firm’s insurance subsidiaries.
| As of December 2011 | As of December 2010 | As of December 2014 | As of December 2013 | |||||||||||||||||||||||||||||||||
| in millions | Financial Instruments Owned | Financial Not Yet | Financial Instruments Owned | Financial Not Yet | ||||||||||||||||||||||||||||||||
| $ in millions | | Financial Instruments Owned | | | Financial Instruments Sold, But Not Yet Purchased | | | Financial Instruments Owned | | | Financial Instruments Sold, But Not Yet Purchased | | ||||||||||||||||||||||||
Commercial paper, certificates of deposit, time deposits and other money market instruments | $ | 13,440 | $ | — | $ | 11,262 | 3 | $ | — | $ 3,654 | $ — | $ 8,608 | $ — | |||||||||||||||||||||||
U.S. government and federal agency obligations | 87,040 | 21,006 | 84,928 | 23,264 | 48,002 | 12,762 | 71,072 | 20,920 | ||||||||||||||||||||||||||||
Non-U.S. government obligations | 49,205 | 34,886 | 40,675 | 29,009 | ||||||||||||||||||||||||||||||||
Mortgage and other asset-backed loans and securities: Loans and securities backed by commercial real estate | 6,699 | 27 | 7,510 | 5 | ||||||||||||||||||||||||||||||||
Non-U.S. government and agency obligations | 37,059 | 20,500 | 40,944 | 26,999 | ||||||||||||||||||||||||||||||||
Mortgage and other asset-backed loans and securities: | ||||||||||||||||||||||||||||||||||||
Loans and securities backed by commercial real estate | 6,582 | 1 | 1 | 6,596 | 1 | 1 | ||||||||||||||||||||||||||||||
Loans and securities backed by residential real estate | 7,592 | 3 | 9,532 | 6 | 11,717 | 2 | — | 9,025 | 2 | 2 | ||||||||||||||||||||||||||
Bank loans and bridge loans | 19,745 | 2,756 | 2 | 18,039 | 1,487 | 2 | 15,613 | 464 | 4 | 17,400 | 925 | 4 | ||||||||||||||||||||||||
Corporate debt securities | 22,131 | 6,553 | 24,719 | 7,219 | 21,603 | 5,800 | 17,412 | 5,253 | ||||||||||||||||||||||||||||
State and municipal obligations | 3,089 | 3 | 2,792 | — | 1,203 | — | 1,476 | 51 | ||||||||||||||||||||||||||||
Other debt obligations | 4,362 | — | 3,232 | — | 3,257 | 3 | 2 | 3,129 | 3 | 4 | ||||||||||||||||||||||||||
Equities and convertible debentures | 65,113 | 21,326 | 67,833 | 24,988 | 96,442 | 28,314 | 101,024 | 22,583 | ||||||||||||||||||||||||||||
Commodities | 5,762 | — | 13,138 | 9 | 3,846 | 1,224 | 4,556 | 966 | ||||||||||||||||||||||||||||
Derivatives 1 | 80,028 | 58,453 | 73,293 | 54,730 | ||||||||||||||||||||||||||||||||
Subtotal | 248,978 | 69,067 | 281,242 | 77,704 | ||||||||||||||||||||||||||||||||
Derivatives | 63,270 | 63,016 | 57,879 | 49,722 | ||||||||||||||||||||||||||||||||
Total | $ | 364,206 | $ | 145,013 | $ | 356,953 | $ | 140,717 | $312,248 | $132,083 | $339,121 | $127,426 | ||||||||||||||||||||||||
| 1. |
|
| 2. | Includes |
| 3. | Includes |
| 4. | Primarily relates to the fair value of |
| Goldman Sachs | 129 |
THE GOLDMAN SACHS GROUP, INC. AND SUBSIDIARIES
Notes to Consolidated Financial Statements
Gains and Losses from Market Making and Other Principal Transactions
The table below presents “Market making” revenues by major product type, the firm’s “Market making” andas well as “Other principal transactions” revenues. These gains/(losses) are primarily related to the firm’s financial instruments owned, at fair value and financial instruments sold, but not yet purchased, at fair value, including both derivative and non-derivative financial instruments. These gains/(losses) exclude related interest income and interest expense. See Note 23 for further information about interest income and interest expense.
The gains/(losses) in the table below are not representative of the manner in which the firm manages its business activities because many of the firm’s market-making and client facilitation and investing and lending strategies utilize financial instruments across various product types. Accordingly, gains or losses in one product type frequently offset gains or losses in other product types. For example, most of the firm’s longer-term derivatives across product types are sensitive to changes in interest rates and may be economically hedged with interest rate swaps. Similarly, a significant portion of the firm’s cash instruments and derivatives across product types has exposure to foreign currencies and may be economically hedged with foreign currency contracts.
$ in millions
Product Type | Year Ended December | |||||||||||
| 2014 | 2013 | 2012 | ||||||||||
Interest rates | $ (5,316 | ) 2 | $ 930 | $ 4,445 | ||||||||
Credit | 2,982 | 1,845 | 4,263 | |||||||||
Currencies | 6,566 | 2,446 | (1,001 | ) | ||||||||
Equities | 2,683 | 2,655 | 2,482 | |||||||||
Commodities | 1,450 | 902 | 492 | |||||||||
Other | — | 590 | 3 | 667 | 4 | |||||||
Market making | 8,365 | 9,368 | 11,348 | |||||||||
Other principal transactions 1 | 6,588 | 6,993 | 5,865 | |||||||||
Total | $14,953 | $16,361 | $17,213 | |||||||||
| Year Ended December | ||||||||||||
| in millions | 2011 | 2010 | 2009 | |||||||||
Interest rates | $ | 1,557 | $ | (2,042 | ) | $ | 6,540 | |||||
Credit | 2,715 | 8,679 | 6,691 | |||||||||
Currencies | 901 | 3,219 | (817 | ) | ||||||||
Equities | 2,788 | 6,862 | 6,128 | |||||||||
Commodities | 1,588 | 1,567 | 4,591 | |||||||||
Other | 1,245 | 2,325 | 1,576 | |||||||||
Total | $ | 10,794 | $ | 20,610 | $ | 24,709 | ||||||
| 1. | Other principal transactions are included in the firm’s Investing & Lending segment. See Note 25 for net revenues, including net interest income, by product type for Investing & Lending, as well as the amount of net interest income included in Investing & Lending. The “Other” category in Note 25 relates to the firm’s consolidated investments, and primarily includes commodities and real estate-related net revenues. |
| 2. | Includes a gain of $289 million ($270 million of which was recorded at extinguishment in the third quarter) related to the extinguishment of certain of the firm’s junior subordinated debt. See Note 16 for further information. |
| 3. | Includes a gain of $211 million on the sale of a majority stake in the firm’s European insurance business. |
| 4. | Includes a gain of $494 million on the sale of the firm’s hedge fund administration business. |
Fair Value Measurements
The fair value of a financial instrument is the amount that would be received to sell an asset or paid to transfer a liability in an orderly transaction between market participants at the measurement date. Financial assets are marked to bid prices and financial liabilities are marked to offer prices. Fair value measurements do not include transaction costs. The firm measures certain financial assets and financial liabilities as a portfolio (i.e., based on its net exposure to market and/or credit risks).
The best evidence of fair value is a quoted price in an active market. If listedquoted prices or quotationsin active markets are not available, fair value is determined by reference to prices for similar instruments, quoted prices or recent transactions in less active markets, or internally developed models that primarily use as inputs market-based or independently sourced parameters as inputs including, but not limited to, interest rates, volatilities, equity or debt prices, foreign exchange rates, commoditiescommodity prices, credit curvesspreads and funding rates.spreads (i.e., the spread, or difference, between the interest rate at which a borrower could finance a given financial instrument relative to a benchmark interest rate).
U.S. GAAP has a three-level fair value hierarchy for disclosure of fair value measurements. The fair value hierarchy prioritizes inputs to the valuation techniques used to measure fair value, giving the highest priority to level 1 inputs and the lowest priority to level 3 inputs. A financial instrument’s level in the fair value hierarchy is based on the lowest level of input that is significant to its fair value measurement.
| 130 | Goldman Sachs 2014 Form 10-K |
THE GOLDMAN SACHS GROUP, INC. AND SUBSIDIARIES
Notes to Consolidated Financial Statements
The fair value hierarchy is as follows:
Level 1.Inputs are unadjusted quoted prices in active markets to which the firm had access at the measurement date for identical, unrestricted assets or liabilities.
Level 2.Inputs to valuation techniques are observable, either directly or indirectly.
Level 3.One or more inputs to valuation techniques are significant and unobservable.
The fair values for substantially all of ourthe firm’s financial assets and financial liabilities are based on observable prices and inputs and are classified in levels 1 and 2 of the fair value hierarchy. Certain level 2 and level 3 financial assets and financial liabilities may require appropriate valuation adjustments that a market participant would require to arrive at fair value for factors such as counterparty and the firm’s credit quality, funding risk, transfer restrictions, liquidity and bid/offer spreads. Valuation adjustments are generally based on market evidence. See Notes 6, 7 and 8 for further information about valuation adjustments.
See Notes 6 and 7through 8 for further information about fair value measurements of cash instruments and derivatives, respectively, included in “Financial instruments owned, at fair value” and “Financial instruments sold, but not yet purchased, at fair value,” and Note 8 for further information about other financial assets and financial liabilities accounted for at fair value under the fair value option.
THE GOLDMAN SACHS GROUP, INC. AND SUBSIDIARIES
Notes to Consolidated Financial Statements
Financial assets and financial liabilities at fair value are summarized below.
| As of December | ||||||||
| $ in millions | 2011 | 2010 | ||||||
Total level 1 financial assets | $ | 136,780 | $ | 137,687 | ||||
Total level 2 financial assets | 587,416 | 566,535 | ||||||
Total level 3 financial assets | 47,937 | 45,377 | ||||||
Netting and collateral 1 | (120,821 | ) | (112,085 | ) | ||||
Total financial assets at fair value | $ | 651,312 | $ | 637,514 | ||||
Total assets | $ | 923,225 | $ | 911,332 | ||||
Total level 3 financial assets as a percentage of Total assets | 5.2 | % | 5.0 | % | ||||
Total level 3 financial assets as a percentage of Total financial assets at fair value | 7.4 | % | 7.1 | % | ||||
Total level 3 financial liabilities at fair value | $ | 25,498 | $ | 24,054 | ||||
Total financial liabilities at fair value | $ | 388,669 | $ | 381,604 | ||||
Total level 3 financial liabilities as a percentage of Total financial liabilities at fair value | 6.6 | % | 6.3 | % | ||||
|
The increase in level 3 financial assets during the year ended December 2011 primarily reflected an increase in private equity investments, principally due to purchases and net transfers from level 2, partially offset by sales. Level 3 bank loans and bridge loans also increased, primarily reflecting purchases, partially offset by sales, settlements and net transfers to level 2.
See Notes 6, 7 and 8 for further information about level 3 cash instruments, derivatives and other financial assets and financial liabilities accounted for at fair value primarily under the fair value option respectively, including(including information about significant unrealized gains/(losses)gains and significantlosses related to level 3 financial assets and financial liabilities, and transfers in orand out of level 3.3), respectively.
The table below presents financial assets and financial liabilities accounted for at fair value under the fair value option or in accordance with other U.S. GAAP. In the table below, counterparty and cash collateral netting represents the impact on derivatives of netting across levels of the fair value hierarchy. Netting among positions classified in the same level is included in that level.
| As of December | ||||||||
| $ in millions | 2014 | 2013 | ||||||
Total level 1 financial assets | $ 140,221 | $156,030 | ||||||
Total level 2 financial assets | 468,678 | 499,480 | ||||||
Total level 3 financial assets | 42,005 | 40,013 | ||||||
Counterparty and cash collateral netting | (104,616 | ) | (95,350 | ) | ||||
Total financial assets at fair value | $ 546,288 | $600,173 | ||||||
Total assets 1 | $ 856,240 | $911,507 | ||||||
Total level 3 financial assets as a percentage of Total assets | 4.9% | 4.4% | ||||||
Total level 3 financial assets as a percentage of Total financial assets at fair value | 7.7% | 6.7% | ||||||
Total level 1 financial liabilities | $ 59,697 | $ 68,412 | ||||||
Total level 2 financial liabilities | 253,364 | 300,583 | ||||||
Total level 3 financial liabilities | 15,904 | 12,046 | ||||||
Counterparty and cash collateral netting | (37,267 | ) | (25,868 | ) | ||||
Total financial liabilities at fair value | $ 291,698 | $355,173 | ||||||
Total level 3 financial liabilities as a percentage of Total financial liabilities at fair value | 5.5% | 3.4% | ||||||
| 1. | Includes approximately $834 billion and $890 billion as of December 2014 and December 2013, respectively, that is carried at fair value or at amounts that generally approximate fair value. |
The table below presents a summary of Total level 3 financial assets. See Notes 6 through 8 for further information about level 3 financial assets.
Level 3 Financial Assets as of December | ||||||||
| $ in millions | 2014 | 2013 | ||||||
Cash instruments | $34,875 | $32,639 | ||||||
Derivatives | 7,074 | 7,076 | ||||||
Other financial assets | 56 | 298 | ||||||
Total | $42,005 | $40,013 | ||||||
Level 3 financial assets as of December 2014 increased compared with December 2013, reflecting an increase in cash instruments. See Note 6 for further information about changes in level 3 cash instruments.
| Goldman Sachs | 131 |
THE GOLDMAN SACHS GROUP, INC. AND SUBSIDIARIES
Notes to Consolidated Financial Statements
Cash Instruments
Cash instruments include U.S. government and federal agency obligations, non-U.S. government and agency obligations, bank loans and bridge loans, corporate debt securities, equities and convertible debentures, and other non-derivative financial instruments owned and financial instruments sold, but not yet purchased. See below for the types of cash instruments included in each level of the fair value hierarchy and the valuation techniques and significant inputs used to determine their fair values. See Note 5 for an overview of the firm’s fair value measurement policies.
Level 1 Cash Instruments
Level 1 cash instruments include U.S. government obligations and most non-U.S. government obligations, actively traded listed equities, certain government agency obligations and certain money market instruments. These instruments are valued using quoted prices for identical unrestricted instruments in active markets.
The firm defines active markets for equity instruments based on the average daily trading volume both in absolute terms and relative to the market capitalization for the instrument. The firm defines active markets for debt instruments based on both the average daily trading volume and the number of days with trading activity.
The fair value of a level 1 instrument is calculated as quantity held multiplied by quoted market price. U.S. GAAP prohibits valuation adjustments being applied to level 1 instruments even in situations where the firm holds a large position and a sale could impact the quoted price.
Level 2 Cash Instruments
Level 2 cash instruments include commercial paper, certificates of deposit, time deposits, most government agency obligations, certain non-U.S. government obligations, most corporate debt securities, commodities, certain mortgage-backed loans and securities, certain bank loans and bridge loans, restricted or less liquid publicly listed equities, most state and municipal obligations and certain money market instruments and lending commitments.
Valuations of level 2 cash instruments can be verified to quoted prices, recent trading activity for identical or similar instruments, broker or dealer quotations or alternative pricing sources with reasonable levels of price transparency. Consideration is given to the nature of the quotations (e.g., indicative or firm) and the relationship of recent market activity to the prices provided from alternative pricing sources.
Valuation adjustments are typically made to level 2 cash instruments (i) if the cash instrument is subject to transfer restrictions and/or (ii) for other premiums and liquidity discounts that a market participant would require to arrive at fair value. Valuation adjustments are generally based on market evidence.
Level 3 Cash Instruments
Level 3 cash instruments have one or more significant valuation inputs that are not observable. Absent evidence to the contrary, level 3 cash instruments are initially valued at transaction price, which is considered to be the best initial estimate of fair value. Subsequently, the firm uses other methodologies to determine fair value, which vary based on the type of instrument. Valuation inputs and assumptions are changed when corroborated by substantive observable evidence, including values realized on sales of level 3 financial assets.
| 132 | Goldman Sachs 2014 Form 10-K |
THE GOLDMAN SACHS GROUP, INC. AND SUBSIDIARIES
Notes to Consolidated Financial Statements
Valuation Techniques and Significant Inputs
The table below presents the valuation techniques and the nature of significant inputs. These valuation techniques and
significant inputs are generally used to determine the fair values of each classtype of level 3 cash instrument.
THE GOLDMAN SACHS GROUP, INC. AND SUBSIDIARIES
Notes to Consolidated Financial Statements
| Level 3 Cash | Valuation Techniques and Significant Inputs | |
Loans and securities backed by commercial real estate
Ÿ Collateralized by a single commercial real estate property or a portfolio of properties
Ÿ May include tranches of varying levels of subordination |
Valuation techniques vary by instrument, but are generally based on discounted cash flow techniques. | |
Significant inputs | ||
Ÿ Transaction prices in both the underlying collateral and instruments with the same or similar underlying collateral and the basis, or price difference, to such prices | ||
Ÿ | ||
Ÿ
| ||
Ÿ
| ||
Loans and securities backed by residential real estate
Ÿ Collateralized by portfolios of residential real estate
Ÿ May include tranches of varying levels of subordination |
Valuation techniques vary by instrument, but are generally based on | |
Significant inputs are generally determined based on relative value analyses, which incorporate comparisons to instruments with similar collateral and risk | ||
Ÿ
| ||
Ÿ Market yields implied by transactions of similar or related assets | ||
Ÿ Cumulative loss expectations, driven by default rates, home price projections, residential property liquidation timelines and related costs | ||
Ÿ Duration, driven by underlying loan prepayment speeds and residential property liquidation timelines
| ||
Bank loans and bridge loans | Valuation techniques vary by instrument, but are generally based on discounted cash flow techniques. | |
Significant inputs are generally determined based on relative value analyses, which incorporate comparisons both to prices of credit default swaps that reference the same or similar underlying instrument or entity and to other debt instruments for the same issuer for which observable prices or broker quotations are available. Significant inputs include: | ||
Ÿ Market yields implied by transactions of similar or related assets and/or current levels and trends of market indices such as CDX and LCDX (indices that track the performance of corporate credit and loans, respectively) | ||
Ÿ Current performance and recovery assumptions and, where the firm uses credit default swaps to value the related cash instrument, the cost of borrowing the underlying reference obligation | ||
Ÿ Duration | ||
Non-U.S. government and agency obligations
Corporate debt securities
State and municipal obligations
Other debt obligations |
Valuation techniques vary by instrument, but are generally based on discounted cash flow techniques. | |
Significant inputs are generally determined based on relative value analyses, which incorporate comparisons both to prices of credit default swaps that reference the same or similar underlying | ||
Ÿ | ||
Ÿ Current performance and recovery assumptions and, where the firm uses credit default swaps to value the related cash instrument, the cost of borrowing the underlying reference obligation | ||
Ÿ Duration
| ||
Equities and convertible debentures
|
Recent third-party | |
Ÿ Industry multiples (primarily EBITDA multiples) and public comparables | ||
Ÿ Transactions in similar instruments | ||
Ÿ Discounted cash flow techniques | ||
Ÿ Third-party appraisals | ||
Ÿ | ||
| ||
Ÿ Market and transaction multiples | ||
| ||
Ÿ
|
| Goldman Sachs | 133 |
THE GOLDMAN SACHS GROUP, INC. AND SUBSIDIARIES
Notes to Consolidated Financial Statements
Significant Unobservable Inputs
The tables below present the ranges of significant unobservable inputs used to value the firm’s level 3 cash instruments. These ranges represent the significant unobservable inputs that were used in the valuation of each type of cash instrument. Weighted averages in the tables below are calculated by weighting each input by the relative fair value of the respective financial instruments. The ranges and weighted averages of these inputs are not representative of the appropriate inputs to use when
calculating the fair value of any one cash instrument. For example, the highest multiple presented in the tables below for private equity investments is appropriate for valuing a specific private equity investment but may not be appropriate for valuing any other private equity investment. Accordingly, the ranges of inputs presented below do not represent uncertainty in, or possible ranges of, fair value measurements of the firm’s level 3 cash instruments.
Level 3 Cash Instruments | Level 3 Assets as of December 2014 ($ in millions) | Valuation Techniques and Significant Unobservable Inputs | Range of Significant Unobservable Inputs (Weighted Average) as of December 2014 | |||
Loans and securities backed by commercial real estate Ÿ Collateralized by a single commercial real estate property or a portfolio of properties Ÿ May include tranches of varying levels of subordination | $3,394 | Discounted cash flows: | ||||
Ÿ Yield | 3.2% to 20.0% (10.5%) | |||||
Ÿ Recovery rate | 24.9% to 100.0% (68.3%) | |||||
Ÿ Duration (years) | 0.3 to 4.7 (2.0) | |||||
Ÿ Basis | (8) points to 13 points (2 points) | |||||
Loans and securities backed by residential real estate Ÿ Collateralized by portfolios of residential real estate Ÿ May include tranches of varying levels of subordination | $2,545 | Discounted cash flows: | ||||
Ÿ Yield | 1.9% to 17.5% (7.6%) | |||||
Ÿ Cumulative loss rate | 0.0% to 95.1% (24.4%) | |||||
Ÿ Duration (years) | 0.5 to 13.0 (4.3) | |||||
Bank loans and bridge loans | $7,346 | Discounted cash flows: | ||||
Ÿ Yield | 1.4% to 29.5% (8.7%) | |||||
Ÿ Recovery rate | 26.6% to 92.5% (60.6%) | |||||
Ÿ Duration (years) | 0.3 to 7.8 (2.5) | |||||
Non-U.S. government and agency obligations Corporate debt securities State and municipal obligations Other debt obligations | $4,931 | Discounted cash flows: | ||||
Ÿ Yield | 0.9% to 24.4% (9.2%) | |||||
Ÿ Recovery rate | 0.0% to 71.9% (59.2%) | |||||
Ÿ Duration (years) | 0.5 to 19.6 (3.7) | |||||
Equities and convertible debentures (including private equity investments and investments in real estate entities) | $16,659 1 | Comparable multiples: | ||||
Ÿ Multiples | 0.8x to 16.6x (6.5x) | |||||
Discounted cash flows: | ||||||
Ÿ Discount rate/yield | 3.7% to 30.0% (14.4%) | |||||
Ÿ Long-term growth rate/compound annual growth rate | 1.0% to 10.0% (6.0%) | |||||
Ÿ Capitalization rate | 3.8% to 13.0% (7.6%) |
| 1. | The fair value of any one instrument may be determined using multiple valuation techniques. For example, market comparables and discounted cash flows may be used together to determine fair value. Therefore, the level 3 balance encompasses both of these techniques. |
| 134 | Goldman Sachs 2014 Form 10-K |
THE GOLDMAN SACHS GROUP, INC. AND SUBSIDIARIES
Notes to Consolidated Financial Statements
Level 3 Cash Instruments | Level 3 Assets as of December 2013 ($ in millions) | Valuation Techniques and Significant Unobservable Inputs | Range of Significant Unobservable Inputs (Weighted Average) as of December 2013 | |||
Loans and securities backed by commercial real estate Ÿ Collateralized by a single commercial real estate property or a portfolio of properties Ÿ May include tranches of varying levels of subordination | $2,692 | Discounted cash flows: | ||||
Ÿ Yield | 2.7% to 29.1% (10.1%) | |||||
Ÿ Recovery rate | 26.2% to 88.1% (74.4%) | |||||
Ÿ Duration (years) | 0.6 to 5.7 (2.0) | |||||
Ÿ Basis | (9) points to 20 points (5 points) | |||||
Loans and securities backed by residential real estate Ÿ Collateralized by portfolios of residential real estate Ÿ May include tranches of varying levels of subordination | $1,961 | Discounted cash flows: | ||||
Ÿ Yield | 2.6% to 25.8% (10.1%) | |||||
Ÿ Cumulative loss rate | 9.8% to 56.6% (24.9%) | |||||
Ÿ Duration (years) | 1.4 to 16.7 (3.6) | |||||
Bank loans and bridge loans | $9,324 | Discounted cash flows: | ||||
Ÿ Yield | 1.0% to 39.6% (9.3%) | |||||
Ÿ Recovery rate | 40.0% to 85.0% (54.9%) | |||||
Ÿ Duration (years) | 0.5 to 5.3 (2.1) | |||||
Non-U.S. government and agency obligations Corporate debt securities State and municipal obligations Other debt obligations | $3,977 | Discounted cash flows: | ||||
Ÿ Yield | 1.5% to 40.2% (8.9%) | |||||
Ÿ Recovery rate | 0.0% to 70.0% (61.9%) | |||||
Ÿ Duration (years) | 0.6 to 16.1 (4.2) | |||||
Equities and convertible debentures (including private equity investments and investments in real estate entities) | $14,685 1 | Comparable multiples: | ||||
Ÿ Multiples | 0.6x to 18.8x (6.9x) | |||||
Discounted cash flows: | ||||||
Ÿ Discount rate/yield | 6.0% to 29.1% (14.6%) | |||||
Ÿ Long-term growth rate/ | 1.0% to 19.0% (8.1%) | |||||
Ÿ Capitalization rate | 4.6% to 11.3% (7.1%) |
| 1. | The fair value of any one instrument may be determined using multiple valuation techniques. For example, market comparables and discounted cash flows may be used together to determine fair value. Therefore, the level 3 balance encompasses both of these techniques. |
Increases in yield, discount rate, capitalization rate, duration or cumulative loss rate used in the valuation of the firm’s level 3 cash instruments would result in a lower fair value measurement, while increases in recovery rate, basis, multiples, long-term growth rate or compound annual
growth rate would result in a higher fair value measurement. Due to the distinctive nature of each of the firm’s level 3 cash instruments, the interrelationship of inputs is not necessarily uniform within each product type.
| Goldman Sachs 2014 Form 10-K | 135 |
THE GOLDMAN SACHS GROUP, INC. AND SUBSIDIARIES
Notes to Consolidated Financial Statements
Fair Value of Cash Instruments by Level
The tables below present, by level within the fair value hierarchy, cash instrument assets and liabilities, at fair value. Cash instrument assets and liabilities are included in
“Financial instruments owned, at fair value” and “Financial instruments sold, but not yet purchased, at fair value,” respectively.
| Cash Instrument Assets at Fair Value as of December 2011 | Cash Instrument Assets at Fair Value as of December 2014 | |||||||||||||||||||||||||||||||
| in millions | Level 1 | Level 2 | Level 3 | Total | ||||||||||||||||||||||||||||
| $ in millions | Level 1 | Level 2 | Level 3 | Total | ||||||||||||||||||||||||||||
Commercial paper, certificates of deposit, time deposits and other money market instruments | $ | 3,255 | $ | 10,185 | $ | — | $ | 13,440 | $ — | $ 3,654 | $ — | $ 3,654 | ||||||||||||||||||||
U.S. government and federal agency obligations | 29,263 | 57,777 | — | 87,040 | 18,540 | 29,462 | — | 48,002 | ||||||||||||||||||||||||
Non-U.S. government obligations | 42,854 | 6,203 | 148 | 49,205 | ||||||||||||||||||||||||||||
Mortgage and other asset-backed loans and securities 1: | — | 3,353 | 3,346 | 6,699 | ||||||||||||||||||||||||||||
Non-U.S. government and agency obligations | 30,255 | 6,668 | 136 | 37,059 | ||||||||||||||||||||||||||||
Mortgage and other asset-backed loans and securities: | ||||||||||||||||||||||||||||||||
Loans and securities backed by commercial real estate | — | 3,188 | 3,394 | 6,582 | ||||||||||||||||||||||||||||
Loans and securities backed by residential real estate | — | 5,883 | 1,709 | 7,592 | — | 9,172 | 2,545 | 11,717 | ||||||||||||||||||||||||
Bank loans and bridge loans | — | 8,460 | 11,285 | 19,745 | — | 8,267 | 7,346 | 15,613 | ||||||||||||||||||||||||
Corporate debt securities 2 | 133 | 19,518 | 2,480 | 22,131 | ||||||||||||||||||||||||||||
Corporate debt securities | 249 | 17,539 | 3,815 | 21,603 | ||||||||||||||||||||||||||||
State and municipal obligations | — | 2,490 | 599 | 3,089 | — | 1,093 | 110 | 1,203 | ||||||||||||||||||||||||
Other debt obligations 2 | — | 2,911 | 1,451 | 4,362 | ||||||||||||||||||||||||||||
Other debt obligations | — | 2,387 | 870 | 3,257 | ||||||||||||||||||||||||||||
Equities and convertible debentures | 39,955 | 3 | 11,491 | 4 | 13,667 | 5 | 65,113 | 69,711 | 10,072 | 16,659 | 2 | 96,442 | ||||||||||||||||||||
Commodities | — | 3,846 | — | 3,846 | ||||||||||||||||||||||||||||
Total 1 | $118,755 | $95,348 | $34,875 | $248,978 | ||||||||||||||||||||||||||||
| Cash Instrument Liabilities at Fair Value as of December 2014 | ||||||||||||||||||||||||||||||||
| $ in millions | Level 1 | Level 2 | Level 3 | Total | ||||||||||||||||||||||||||||
U.S. government and federal agency obligations | $ 12,746 | $ 16 | $ — | $ 12,762 | ||||||||||||||||||||||||||||
Non-U.S. government and agency obligations | 19,256 | 1,244 | — | 20,500 | ||||||||||||||||||||||||||||
Mortgage and other asset-backed loans and securities: | ||||||||||||||||||||||||||||||||
Loans and securities backed by commercial real estate | — | 1 | — | 1 | ||||||||||||||||||||||||||||
Bank loans and bridge loans | — | 286 | 178 | 464 | ||||||||||||||||||||||||||||
Corporate debt securities | — | 5,741 | 59 | 5,800 | ||||||||||||||||||||||||||||
Other debt obligations | — | — | 2 | 2 | ||||||||||||||||||||||||||||
Equities and convertible debentures | 27,587 | 722 | 5 | 28,314 | ||||||||||||||||||||||||||||
Commodities | — | 5,762 | — | 5,762 | — | 1,224 | — | 1,224 | ||||||||||||||||||||||||
Total | $ | 115,460 | $ | 134,033 | $ | 34,685 | $ | 284,178 | $ 59,589 | $ 9,234 | $ 244 | $ 69,067 | ||||||||||||||||||||
| Cash Instrument Liabilities at Fair Value as of December 2011 | ||||||||||||||||||||||||||||||||
| in millions | Level 1 | Level 2 | Level 3 | Total | ||||||||||||||||||||||||||||
U.S. government and federal agency obligations | $ | 20,940 | $ | 66 | $ | — | $ | 21,006 | ||||||||||||||||||||||||
Non-U.S. government obligations | 34,339 | 547 | — | 34,886 | ||||||||||||||||||||||||||||
Mortgage and other asset-backed loans and securities: Loans and securities backed by commercial real estate | — | 27 | — | 27 | ||||||||||||||||||||||||||||
Loans and securities backed by residential real estate | — | 3 | — | 3 | ||||||||||||||||||||||||||||
Bank loans and bridge loans | — | 1,891 | 865 | 2,756 | ||||||||||||||||||||||||||||
Corporate debt securities 6 | — | 6,522 | 31 | 6,553 | ||||||||||||||||||||||||||||
State and municipal obligations | — | 3 | — | 3 | ||||||||||||||||||||||||||||
Equities and convertible debentures | 20,069 | 3 | 1,248 | 4 | 9 | 21,326 | ||||||||||||||||||||||||||
Total | $ | 75,348 | $ | 10,307 | $ | 905 | $ | 86,560 | ||||||||||||||||||||||||
| 1. | Includes |
| 2. | Includes |
|
|
|
|
| 136 | Goldman Sachs |
THE GOLDMAN SACHS GROUP, INC. AND SUBSIDIARIES
Notes to Consolidated Financial Statements
| Cash Instrument Assets at Fair Value as of December 2010 | Cash Instrument Assets at Fair Value as of December 2013 | |||||||||||||||||||||||||||||||
| in millions | Level 1 | Level 2 | Level 3 | Total | ||||||||||||||||||||||||||||
| $ in millions | Level 1 | Level 2 | Level 3 | Total | ||||||||||||||||||||||||||||
Commercial paper, certificates of deposit, time deposits and other | $ | 4,344 | $ | 6,918 | $ | — | $ | 11,262 | $ 216 | $ 8,392 | $ — | $ 8,608 | ||||||||||||||||||||
U.S. government and federal agency obligations | 36,184 | 48,744 | — | 84,928 | 29,582 | 41,490 | — | 71,072 | ||||||||||||||||||||||||
Non-U.S. government obligations | 35,504 | 5,171 | — | 40,675 | ||||||||||||||||||||||||||||
Mortgage and other asset-backed loans and securities 1: Loans and securities backed by commercial real estate | — | 3,534 | 3,976 | 7,510 | ||||||||||||||||||||||||||||
Non-U.S. government and agency obligations | 29,451 | 11,453 | 40 | 40,944 | ||||||||||||||||||||||||||||
Mortgage and other asset-backed loans and securities: | ||||||||||||||||||||||||||||||||
Loans and securities backed by commercial real estate | — | 3,904 | 2,692 | 6,596 | ||||||||||||||||||||||||||||
Loans and securities backed by residential real estate | — | 7,031 | 2,501 | 9,532 | — | 7,064 | 1,961 | 9,025 | ||||||||||||||||||||||||
Bank loans and bridge loans | — | 8,134 | 9,905 | 18,039 | — | 8,076 | 9,324 | 17,400 | ||||||||||||||||||||||||
Corporate debt securities 2 | 108 | 21,874 | 2,737 | 24,719 | ||||||||||||||||||||||||||||
Corporate debt securities | 240 | 14,299 | 2,873 | 17,412 | ||||||||||||||||||||||||||||
State and municipal obligations | — | 2,038 | 754 | 2,792 | — | 1,219 | 257 | 1,476 | ||||||||||||||||||||||||
Other debt obligations | — | 1,958 | 1,274 | 3,232 | — | 2,322 | 807 | 3,129 | ||||||||||||||||||||||||
Equities and convertible debentures | 41,660 | 3 | 15,113 | 4 | 11,060 | 5 | 67,833 | 76,945 | 9,394 | 14,685 | 2 | 101,024 | ||||||||||||||||||||
Commodities | — | 4,556 | — | 4,556 | ||||||||||||||||||||||||||||
Total 1 | $136,434 | $112,169 | $32,639 | $281,242 | ||||||||||||||||||||||||||||
| Cash Instrument Liabilities at Fair Value as of December 2013 | ||||||||||||||||||||||||||||||||
| $ in millions | Level 1 | Level 2 | Level 3 | Total | ||||||||||||||||||||||||||||
U.S. government and federal agency obligations | $ 20,871 | $ 49 | $ — | $ 20,920 | ||||||||||||||||||||||||||||
Non-U.S. government and agency obligations | 25,325 | 1,674 | — | 26,999 | ||||||||||||||||||||||||||||
Mortgage and other asset-backed loans and securities: | ||||||||||||||||||||||||||||||||
Loans and securities backed by commercial real estate | — | — | 1 | 1 | ||||||||||||||||||||||||||||
Loans and securities backed by residential real estate | — | 2 | — | 2 | ||||||||||||||||||||||||||||
Bank loans and bridge loans | — | 641 | 284 | 925 | ||||||||||||||||||||||||||||
Corporate debt securities | 10 | 5,241 | 2 | 5,253 | ||||||||||||||||||||||||||||
State and municipal obligations | — | 50 | 1 | 51 | ||||||||||||||||||||||||||||
Other debt obligations | — | 3 | 1 | 4 | ||||||||||||||||||||||||||||
Equities and convertible debentures | 22,107 | 468 | 8 | 22,583 | ||||||||||||||||||||||||||||
Commodities | — | 13,138 | — | 13,138 | — | 966 | — | 966 | ||||||||||||||||||||||||
Total | $ | 117,800 | $ | 133,653 | $ | 32,207 | $ | 283,660 | $ 68,313 | $ 9,094 | $ 297 | $ 77,704 | ||||||||||||||||||||
| Cash Instrument Liabilities at Fair Value as of December 2010 | ||||||||||||||||||||||||||||||||
| in millions | Level 1 | Level 2 | Level 3 | Total | ||||||||||||||||||||||||||||
U.S. government and federal agency obligations | $ | 23,191 | $ | 73 | $ | — | $ | 23,264 | ||||||||||||||||||||||||
Non-U.S. government obligations | 28,168 | 841 | — | 29,009 | ||||||||||||||||||||||||||||
Mortgage and other asset-backed loans and securities: Loans and securities backed by commercial real estate | — | 5 | — | 5 | ||||||||||||||||||||||||||||
Loans and securities backed by residential real estate | — | 6 | — | 6 | ||||||||||||||||||||||||||||
Bank loans and bridge loans | — | 1,107 | 380 | 1,487 | ||||||||||||||||||||||||||||
Corporate debt securities 6 | 26 | 7,133 | 60 | 7,219 | ||||||||||||||||||||||||||||
Equities and convertible debentures | 24,283 | 3 | 699 | 4 | 6 | 24,988 | ||||||||||||||||||||||||||
Commodities | — | 9 | — | 9 | ||||||||||||||||||||||||||||
Total | $ | 75,668 | $ | 9,873 | $ | 446 | $ | 85,987 | ||||||||||||||||||||||||
| 1. | Includes |
| 2. | Includes |
|
|
|
Transfers Between Levels of the Fair Value Hierarchy
|
Transfers between levels of the fair value hierarchy are reported at the beginning of the reporting period in which they occur. During 2014, transfers into level 2 from level 1 of cash instruments were $60 million, including $47 million of public equity securities and $13 million of U.S. government and federal agency obligations due to decreased market activity in these instruments. Transfers into level 1 from level 2 of cash instruments were $92 million, reflecting transfers of public equity securities due to increased market activity in these instruments.
During 2013, transfers into level 2 from level 1 of cash instruments were $1 million, reflecting transfers of public equity securities due to decreased market activity in these instruments. Transfers into level 1 from level 2 of cash instruments were $79 million, reflecting transfers of public equity securities, primarily due to increased market activity in these instruments.
See level 3 rollforward below for information about transfers between level 2 and level 3.
| Goldman Sachs | 137 |
THE GOLDMAN SACHS GROUP, INC. AND SUBSIDIARIES
Notes to Consolidated Financial Statements
Level 3 Rollforward
If a cash instrument asset or liability was transferred to level 3 during a reporting period, its entire gain or loss for the period is included in level 3. Transfers between levels are reported at the beginning of the reporting period in which they occur.
Level 3 cash instruments are frequently economically hedged with level 1 and level 2 cash instruments and/or level 1, level 2 or level 3 derivatives. Accordingly, gains or losses that are reported in level 3 can be partially offset by
gains or losses attributable to level 1 or level 2 cash
instruments and/or level 1, level 2 or level 3 derivatives. As a result, gains or losses included in the level 3 rollforward below do not necessarily represent the overall impact on the firm’s results of operations, liquidity or capital resources.
The tables below present changes in fair value for all cash instrument assets and liabilities categorized as level 3 as of the end of the year. Purchases in the tables below include both originations and secondary market purchases.
| Level 3 Cash Instrument Assets at Fair Value for the Year Ended December 2011 | ||||||||||||||||||||||||||||||||
| in millions | Balance, beginning of year | Net realized gains/ (losses) | Net unrealized year-end | Purchases 1 | Sales | Settlements | Net transfers in and/or (out) of level 3 | Balance, end of year | ||||||||||||||||||||||||
Non-U.S. government obligations | $ | — | $ | 25 | $ | (63 | ) | $ | 27 | $ | (123 | ) | $ | (8 | ) | $ | 290 | $ | 148 | |||||||||||||
Mortgage and other asset-backed loans and securities: Loans and securities backed by commercial real estate | 3,976 | 222 | 80 | 1,099 | (1,124 | ) | (831 | ) | (76 | ) | 3,346 | |||||||||||||||||||||
Loans and securities backed by residential real estate | 2,501 | 253 | (81 | ) | 768 | (702 | ) | (456 | ) | (574 | ) | 1,709 | ||||||||||||||||||||
Bank loans and bridge loans | 9,905 | 540 | (216 | ) | 6,725 | (2,329 | ) | (1,554 | ) | (1,786 | ) | 11,285 | ||||||||||||||||||||
Corporate debt securities | 2,737 | 391 | (132 | ) | 1,319 | (1,137 | ) | (697 | ) | (1 | ) | 2,480 | ||||||||||||||||||||
State and municipal obligations | 754 | 12 | (1 | ) | 448 | (591 | ) | (13 | ) | (10 | ) | 599 | ||||||||||||||||||||
Other debt obligations | 1,274 | 124 | (17 | ) | 560 | (388 | ) | (212 | ) | 110 | 1,451 | |||||||||||||||||||||
Equities and convertible debentures | 11,060 | 240 | 338 | 2,731 | (1,196 | ) | (855 | ) | 1,349 | 13,667 | ||||||||||||||||||||||
Total | $ | 32,207 | $ | 1,807 | 2 | $ | (92 | ) 2 | $ | 13,677 | $ | (7,590 | ) | $ | (4,626 | ) | $ | (698 | ) | $ | 34,685 | |||||||||||
| Level 3 Cash Instrument Liabilities at Fair Value for the Year Ended December 2011 | ||||||||||||||||||||||||||||||||
| in millions | Balance, beginning of year | Net realized (gains)/ losses | Net unrealized (gains)/losses relating to instruments still held at year-end | Purchases | Sales | Settlements | Net level 3 | Balance, end of year | ||||||||||||||||||||||||
Total | $ | 446 | $ | (27 | ) | $ | 218 | $ | (491 | ) | $ | 475 | $ | 272 | $ | 12 | $ | 905 | ||||||||||||||
|
|
The net unrealized loss on level 3 cash instrument assets and liabilities of $310 million for the year ended December 2011 primarily consisted of losses on bank loans and bridge loans and corporate debt securities, primarily reflecting the impact of unfavorable credit markets and losses on relationship lending. These losses were partially offset by gains in private equity investments, where prices were generally corroborated through market transactions in similar financial instruments during the year.
Significant transfers in or out of level 3 cash instrument assets during the year ended December 2011 included:
|
THE GOLDMAN SACHS GROUP, INC. AND SUBSIDIARIES
Notes to Consolidated Financial Statements
|
|
There were no significant transfers in or out of level 3 cash instrument liabilities during the year ended December 2011.
| Level 3 Cash Instrument Assets at Fair Value for the Year Ended December 2010 | Level 3 Cash Instrument Assets at Fair Value for the Year Ended December 2014 | |||||||||||||||||||||||||||||||||||||||||||||||||||||||||||
| in millions | Balance, beginning of year | Net realized gains/ (losses) | Net unrealized year-end | Net purchases, sales and settlements | Net transfers in and/or (out) of level 3 | Balance, end of year | ||||||||||||||||||||||||||||||||||||||||||||||||||||||
Mortgage and other asset-backed loans and securities: Loans and securities backed by commercial real estate | $ | 5,794 | $ | 239 | $ | 108 | $ | (1,335 | ) | $ | (830 | ) | $ | 3,976 | ||||||||||||||||||||||||||||||||||||||||||||||
| $ in millions | | Balance, beginning of year | | | Net realized gains/ (losses) | | | Net unrealized gains/(losses) relating to instruments still held at year-end | | Purchases | Sales | Settlements | | Transfers into level 3 | | | Transfers out of level 3 | | | Balance, end of year | | |||||||||||||||||||||||||||||||||||||||
Non-U.S. government and agency obligations | $ 40 | $ 7 | $ 3 | $ 95 | $ (20 | ) | $ 3 | $ 8 | $ — | $ 136 | ||||||||||||||||||||||||||||||||||||||||||||||||||
Mortgage and other asset-backed loans and securities: | ||||||||||||||||||||||||||||||||||||||||||||||||||||||||||||
Loans and securities backed by commercial real estate | 2,692 | 173 | 64 | 1,891 | (436 | ) | (977 | ) | 176 | (189 | ) | 3,394 | ||||||||||||||||||||||||||||||||||||||||||||||||
Loans and securities backed by residential real estate | 2,070 | 178 | 37 | 163 | 53 | 2,501 | 1,961 | 123 | 224 | 1,008 | (363 | ) | (497 | ) | 235 | (146 | ) | 2,545 | ||||||||||||||||||||||||||||||||||||||||||
Bank loans and bridge loans | 9,560 | 687 | 482 | (735 | ) | (89 | ) | 9,905 | 9,324 | 696 | (194 | ) | 3,863 | (1,367 | ) | (4,673 | ) | 294 | (597 | ) | 7,346 | |||||||||||||||||||||||||||||||||||||||
Corporate debt securities | 2,235 | 239 | 348 | 488 | (573 | ) | 2,737 | 2,873 | 252 | (9 | ) | 2,645 | (1,031 | ) | (926 | ) | 427 | (416 | ) | 3,815 | ||||||||||||||||||||||||||||||||||||||||
State and municipal obligations | 1,114 | 1 | (25 | ) | (393 | ) | 57 | 754 | 257 | 4 | 3 | 12 | (112 | ) | (2 | ) | 25 | (77 | ) | 110 | ||||||||||||||||||||||||||||||||||||||||
Other debt obligations | 2,235 | 4 | 159 | (263 | ) | (861 | ) | 1,274 | 807 | 24 | 41 | 448 | (212 | ) | (164 | ) | 21 | (95 | ) | 870 | ||||||||||||||||||||||||||||||||||||||||
Equities and convertible debentures | 11,871 | 119 | 548 | (847 | ) | (631 | ) | 11,060 | 14,685 | 131 | 2,557 | 3,596 | (1,902 | ) | (1,443 | ) | 1,300 | (2,265 | ) | 16,659 | ||||||||||||||||||||||||||||||||||||||||
Total | $ | 34,879 | $ | 1,467 | 1 | $ | 1,657 | 1 | $ | (2,922 | ) | $ | (2,874 | ) | $ | 32,207 | $32,639 | $1,410 | 1 | $2,689 | 1 | $13,558 | $(5,443 | ) | $(8,679 | ) | $2,486 | $(3,785 | ) | $34,875 | ||||||||||||||||||||||||||||||
| Level 3 Cash Instrument Liabilities at Fair Value for the Year Ended December 2010 | Level 3 Cash Instrument Liabilities at Fair Value for the Year Ended December 2014 | |||||||||||||||||||||||||||||||||||||||||||||||||||||||||||
| in millions | Balance, beginning of year | Net realized (gains)/ losses | Net unrealized year-end | Net purchases, sales and settlements | Net transfers in and/or (out) of level 3 | Balance, end of year | ||||||||||||||||||||||||||||||||||||||||||||||||||||||
| $ in millions | | Balance, beginning of year | | | Net realized (gains)/ losses | | | Net unrealized (gains)/losses relating to instruments still held at year-end | | Purchases | Sales | Settlements | | Transfers into level 3 | | | Transfers out of level 3 | | | Balance, end of year | | |||||||||||||||||||||||||||||||||||||||
Total | $ | 572 | $ | 5 | $ | (17 | ) | $ | (97 | ) | $ | (17 | ) | $ | 446 | $ 297 | $ (12 | ) | $ 1 | $ (223 | ) | $ 121 | $ 23 | $ 49 | $ (12 | ) | $ 244 | |||||||||||||||||||||||||||||||||
| 1. | The aggregate amounts include gains of approximately |
The net unrealized gain on level 3 cash instruments of $2.69 billion (reflecting a $2.69 billion gain on cash instrument assets and liabilities of $1.67 billiona $1 million loss on cash instrument liabilities) for the year ended December 20102014 primarily consisted of unrealizedreflected gains on private equity investments principally driven by company-specific events and strong corporate performance.
Transfers into level 3 during 2014 primarily reflected transfers of certain private equity investments and corporate debt securities from level 2 principally due to reduced price transparency as a result of a lack of market evidence, including fewer market transactions in these instruments.
Transfers out of level 3 during 2014 primarily reflected transfers of certain private equity investments, bank loansloan and bridge loans and corporate debt securities where prices were generally corroborated through sales and partial salesto level 2 principally due to increased price transparency as a result of similar assetsmarket evidence, including market transactions in these asset classes during the period.instruments.
Significant transfers in or out of level 3 cash instrument assets during the year ended December 2010 included:
|
|
|
|
| Goldman Sachs |
THE GOLDMAN SACHS GROUP, INC. AND SUBSIDIARIES
Notes to Consolidated Financial Statements
| Level 3 Cash Instrument Assets at Fair Value for the Year Ended December 2013 | ||||||||||||||||||||||||||||||||||||
| $ in millions | | Balance, beginning of year | | | Net realized gains/ (losses) | | | Net unrealized gains/(losses) relating to instruments still held at year-end | | Purchases | Sales | Settlements | | Transfers into level 3 | | | Transfers out of level 3 | | | Balance, end of year | | |||||||||||||||
Non-U.S. government and agency obligations | $ 26 | $ 7 | $ 5 | $ 12 | $ (20 | ) | $ — | $ 10 | $ — | $ 40 | ||||||||||||||||||||||||||
Mortgage and other asset-backed loans and securities: | ||||||||||||||||||||||||||||||||||||
Loans and securities backed by commercial real estate | 3,389 | 206 | 224 | 733 | (894 | ) | (1,055 | ) | 262 | (173 | ) | 2,692 | ||||||||||||||||||||||||
Loans and securities backed by residential real estate | 1,619 | 143 | 150 | 660 | (467 | ) | (269 | ) | 209 | (84 | ) | 1,961 | ||||||||||||||||||||||||
Bank loans and bridge loans | 11,235 | 529 | 444 | 3,725 | (2,390 | ) | (4,778 | ) | 942 | (383 | ) | 9,324 | ||||||||||||||||||||||||
Corporate debt securities | 2,821 | 407 | 398 | 1,140 | (1,584 | ) | (576 | ) | 404 | (137 | ) | 2,873 | ||||||||||||||||||||||||
State and municipal obligations | 619 | 6 | (2 | ) | 134 | (492 | ) | (2 | ) | 6 | (12 | ) | 257 | |||||||||||||||||||||||
Other debt obligations | 1,185 | 47 | 38 | 648 | (445 | ) | (161 | ) | 14 | (519 | ) | 807 | ||||||||||||||||||||||||
Equities and convertible debentures | 14,855 | 189 | 1,709 | 1,866 | (862 | ) | (1,610 | ) | 882 | (2,344 | ) | 14,685 | ||||||||||||||||||||||||
Total | $35,749 | $1,534 | 1 | $2,966 | 1 | $8,918 | $(7,154 | ) | $(8,451 | ) | $2,729 | $(3,652 | ) | $32,639 | ||||||||||||||||||||||
| Level 3 Cash Instrument Liabilities at Fair Value for the Year Ended December 2013 | ||||||||||||||||||||||||||||||||||||
| $ in millions | | Balance, beginning of year | | | Net realized (gains)/ losses | | | Net unrealized (gains)/losses relating to instruments still held at year-end | | Purchases | Sales | Settlements | | Transfers into level 3 | | | Transfers out of level 3 | | | Balance, end of year | | |||||||||||||||
Total | $ 642 | $ (1 | ) | $ (64 | ) | $ (432 | ) | $ 269 | $ 8 | $ 35 | $ (160 | ) | $ 297 | |||||||||||||||||||||||
| 1. | The aggregate amounts include gains of approximately $1.09 billion, $2.69 billion and $723 million reported in “Market making,” “Other principal transactions” and “Interest income,” respectively. |
The net unrealized gain on level 3 cash instruments of $3.03 billion (reflecting $2.97 billion on cash instrument assets and $64 million on cash instrument liabilities) for 2013 primarily consisted of gains on private equity investments, principally driven by strong corporate performance, bank loans and bridge loans, primarily due to tighter credit spreads and favorable company-specific events, and corporate debt securities, primarily due to tighter credit spreads.
Transfers into level 3 during 2013 primarily reflected transfers of certain bank loans and bridge loans and private equity investments from level 2, principally due to a lack of market transactions in these instruments.
Transfers out of level 3 during 2013 primarily reflected transfers of certain private equity investments to level 2, principally due to increased transparency of market prices as a result of market transactions in these instruments.
| Goldman Sachs 2014 Form 10-K | 139 |
THE GOLDMAN SACHS GROUP, INC. AND SUBSIDIARIES
Notes to Consolidated Financial Statements
Investments in Funds That Calculate Net Asset
Value Per Share
Investments in Funds That Are Calculated Using Net Asset Value Per Share |
Cash instruments at fair value include investments in funds that are valuedcalculated based on the net asset value per share (NAV) of the investment fund. The firm uses NAV as its measure of fair value for fund investments when (i) the fund investment does not have a readily determinable fair value and (ii) the NAV of the investment fund is calculated in a manner consistent with the measurement principles of investment company accounting, including measurement of the underlying investments at fair value.
The firm’s investments in funds that calculateare calculated using NAV primarily consist of investments in firm-sponsored private equity, credit, real estate and hedge funds where the firm co-invests with third-party investors.
Private equity funds primarily invest in a broad range of industries worldwide in a variety of situations, including leveraged buyouts, recapitalizations, growth investments and distressed investments. Credit funds generally invest in loans and other fixed income instruments and are focused on providing private high-yield capital for mid- to large-sized leveraged and management buyout transactions, recapitalizations, financings, refinancings, acquisitions and restructurings for private equity firms, private family companies and corporate issuers. Real estate funds invest globally, primarily in real estate companies, loan portfolios, debt recapitalizations and property. The private equity, private debtcredit and real estate funds are primarily closed-end funds in which the firm’s investments are generally not eligible for redemption. Distributions will be received from these funds as the underlying assets are
liquidated or distributed.
The firm also invests in hedge funds, primarily multi-disciplinary hedge funds that employ a fundamental bottom-up investment approach across various asset classes and it is estimated that substantially allstrategies including long/short equity, credit, convertibles, risk arbitrage, special situations and capital structure arbitrage. As of December 2014, the firm’s investments in hedge funds primarily include interests where the underlying assets are illiquid in nature, and proceeds from redemptions will not be received until the underlying assets are liquidated or distributed.
Many of existingthe funds will be liquidated over the next 10 years. The firm continues to manage its existing private equity funds taking into account the transition periods underdescribed above are “covered funds” as defined by the Volcker Rule of the U.S. Dodd-Frank Wall Street Reform and Consumer Protection Act (Dodd-Frank Act), although. The Board of Governors of the rules have not yet been finalized.Federal Reserve System (Federal Reserve Board) extended the conformance period through July 2016 for investments in, and relationships with, covered funds that were in place prior to December 31, 2013, and indicated that it intends to further extend the conformance period through July 2017.
The firm’s investments in hedgefirm continues to manage its existing funds, are generally redeemable on a quarterly basis with 91 days’ notice, subject to a maximum redemption level of 25% oftaking into account the firm’s initial investments at any quarter-end. Theextension outlined above. Since March 2012, the firm currently plans to comply with the Volcker Rule by redeeming certainhas redeemed $2.97 billion of its interests in hedge funds.funds, including $762 million during 2014 and $1.15 billion during 2013. In order to be compliant with the Volcker Rule, the firm will be required to reduce most of its interests in the funds in the table below by the prescribed compliance date.
The tabletables below presentspresent the fair value of the firm’s investments in, and unfunded commitments to, funds that calculateare calculated using NAV.
| As of December 2011 | As of December 2010 | |||||||||||||||||
| in millions | Fair Value of Investments | Unfunded Commitments | Fair Value of Investments | Unfunded Commitments | ||||||||||||||
Private equity funds 1 | $ 8,074 | $3,514 | $ 7,911 | $ 4,816 | ||||||||||||||
Private debt funds 2 | 3,596 | 3,568 | 4,267 | 3,721 | ||||||||||||||
Hedge funds 3 | 3,165 | — | 3,169 | — | ||||||||||||||
Real estate and other funds 4 | 1,531 | 1,613 | 1,424 | 1,931 | ||||||||||||||
Total | $16,366 | $8,695 | $16,771 | $10,468 | ||||||||||||||
| As of December 2014 | ||||||||
| $ in millions | | Fair Value of Investments | | | Unfunded Commitments | | ||
Private equity funds | $ 6,356 | $2,181 | ||||||
Credit funds 1 | 1,021 | 390 | ||||||
Hedge funds | 863 | — | ||||||
Real estate funds | 1,604 | 344 | ||||||
Total | $ 9,844 | $2,915 | ||||||
| As of December 2013 | ||||||||
| $ in millions | | Fair Value of Investments | | | Unfunded Commitments | | ||
Private equity funds | $ 7,446 | $2,575 | ||||||
Credit funds 1 | 3,624 | 2,515 | ||||||
Hedge funds | 1,394 | — | ||||||
Real estate funds | 1,908 | 471 | ||||||
Total | $14,372 | $5,561 | ||||||
| 1. |
|
|
|
|
| 140 | Goldman Sachs |
THE GOLDMAN SACHS GROUP, INC. AND SUBSIDIARIES
Notes to Consolidated Financial Statements
Derivatives and Hedging Activities
Derivative Activities
Derivatives are instruments that derive their value from underlying asset prices, indices, reference rates and other inputs, or a combination of these factors. Derivatives may be traded on an exchange (exchange-traded) or they may be privately negotiated contracts, which are usually referred to as over-the-counter (OTC)OTC derivatives. Certain of the firm’s OTC derivatives or they may be listedare cleared and traded on an exchange (exchange-traded)settled through central clearing counterparties (OTC-cleared), while others are bilateral contracts between two counterparties (bilateral OTC).
Market-Making.As a market maker, the firm enters into derivative transactions with clients and other market participants to provide liquidity to clients and to facilitate the transfer and hedging of risk.their risks. In this capacity, the firm typically acts as principal and is consequently required to commit capital to provide execution. As a market maker, it is essential to maintain an inventory of financial instruments sufficient to meet expected client and market demands.
Risk Management. The firm also enters into derivatives to actively manage risk exposures that arise from its market-making and investing and lending activities in derivative and cash instruments. The firm’s holdings and exposures are hedged, in many cases, on either a portfolio or risk-specific basis, as opposed to an instrument-by-instrument basis. The offsetting impact of this economic hedging is reflected in the same business segment as the related revenues. In addition, the firm may enter into derivatives designated as hedges under U.S. GAAP. These derivatives are used to manage interest rate exposure in certain fixed-rate unsecured long-term and short-term borrowings, and deposits, to manage foreign currency exposure on the net investment in certain non-U.S. operations, and to manage interest ratethe exposure to the variability in cash flows associated with the forecasted sales of certain fixed-rate unsecured long-term and short-term borrowings, and certificatesenergy commodities by one of deposit.the firm’s consolidated investments.
The firm enters into various types of derivatives, including:
| Ÿ | Futures and Forwards. Contracts that commit counterparties to purchase or sell financial instruments, commodities or currencies in the future. |
| Ÿ | Swaps. Contracts that require counterparties to exchange cash flows such as currency or interest payment streams. The amounts exchanged are based on the specific terms of the contract with reference to specified rates, financial instruments, commodities, currencies or indices. |
| Ÿ | Options. Contracts in which the option purchaser has the right, but not the obligation, to purchase from or sell to the option writer financial instruments, commodities or currencies within a defined time period for a specified price. |
Derivatives are accounted for at fair value, net of cash collateral received or posted under credit support agreements. Derivatives are reported on a net-by-counterparty basis (i.e., the net payable or receivable for derivative assets and liabilities for a given counterparty) when a legal right of setoff exists under an enforceable netting agreement.agreement (counterparty netting). Derivatives are accounted for at fair value, net of cash collateral received or posted under enforceable credit support agreements (cash collateral netting). Derivative assets and liabilities are included in “Financial instruments owned, at fair value” and “Financial instruments sold, but not yet purchased, at fair value,” respectively.
Substantially all gains and losses on derivatives not designated as hedges under ASC 815 are included in “Market making” and “Other principal transactions.”
The tables below present the fair value of derivatives on a net-by-counterparty basis.
| As of December 2014 | ||||||||
| $ in millions | | Derivative Assets | | | Derivative Liabilities | | ||
Exchange-traded | $ 2,533 | $ 2,070 | ||||||
OTC | 60,737 | 60,946 | ||||||
Total | $63,270 | $63,016 | ||||||
| As of December 2013 | ||||||||
| $ in millions | | Derivative Assets | | | Derivative Liabilities | | ||
Exchange-traded | $ 4,277 | $ 6,366 | ||||||
OTC | 53,602 | 43,356 | ||||||
Total | $57,879 | $49,722 | ||||||
| Goldman Sachs | 141 |
THE GOLDMAN SACHS GROUP, INC. AND SUBSIDIARIES
Notes to Consolidated Financial Statements
The table below presents the fair value of derivatives on a net-by-counterparty basis.
| As of December 2011 | As of December 2010 | |||||||||||||||||
| in millions | Derivative Assets | Derivative Liabilities | Derivative Assets | Derivative Liabilities | ||||||||||||||
Exchange-traded | $ 5,880 | $ 3,172 | $ 7,601 | $ 2,794 | ||||||||||||||
Over-the-counter | 74,148 | 55,281 | 65,692 | 51,936 | ||||||||||||||
Total | $80,028 | $58,453 | $73,293 | $54,730 | ||||||||||||||
The table below presents the fair value and the numbernotional amount of derivative contracts by major product type on a gross basis. Gross fair values in the table below exclude the effects of both counterparty netting under enforceable netting agreements and
netting of cash collateral, received or posted under credit support agreements, and therefore are not representative of the firm’s exposure. The table below also presents the amounts of counterparty and cash collateral netting in the consolidated statements of financial condition, as well as cash and securities collateral posted and received under enforceable credit support agreements
that do not meet the criteria for netting under U.S. GAAP. Where the firm has received or posted collateral under credit support agreements, but has not yet determined such agreements are enforceable, the related collateral has not been netted in the table below. Notional amounts, which represent the sum of gross long and short derivative contracts, provide an indication of the volume of the firm’s derivative activity and do not represent anticipated losses.
| As of December 2011 |
| As of December 2010 | ||||||||||||||||||||||||
| in millions, except number of contracts | Derivative Assets | Derivative Liabilities | Number of Contracts | Derivative Assets | Derivative Liabilities | Number of Contracts | ||||||||||||||||||||
Derivatives not accounted for as hedges Interest rates | $ | 624,189 | $ | 582,608 | 287,351 | $ | 463,145 | $ | 422,514 | 272,279 | ||||||||||||||||
Credit | 150,816 | 130,659 | 362,407 | 127,153 | 104,407 | 367,779 | ||||||||||||||||||||
Currencies | 88,654 | 71,736 | 203,205 | 87,959 | 70,273 | 222,706 | ||||||||||||||||||||
Commodities | 35,966 | 38,050 | 93,755 | 36,689 | 41,666 | 70,890 | ||||||||||||||||||||
Equities | 64,135 | 51,928 | 332,273 | 65,815 | 51,948 | 289,059 | ||||||||||||||||||||
Subtotal | 963,760 | 874,981 | 1,278,991 | 780,761 | 690,808 | 1,222,713 | ||||||||||||||||||||
Derivatives accounted for as hedges Interest rates | 21,981 | 13 | 1,125 | 23,396 | 33 | 997 | ||||||||||||||||||||
Currencies | 124 | 21 | 71 | 6 | 162 | 72 | ||||||||||||||||||||
Subtotal | 22,105 | 34 | 1,196 | 23,402 | 195 | 1,069 | ||||||||||||||||||||
Gross fair value of derivatives | $ | 985,865 | $ | 875,015 | 1,280,187 | $ | 804,163 | $ | 691,003 | 1,223,782 | ||||||||||||||||
Counterparty netting 1 | (787,733 | ) | (787,733 | ) | (620,553 | ) | (620,553 | ) | ||||||||||||||||||
Cash collateral netting 2 | (118,104 | ) | (28,829 | ) | (110,317 | ) | (15,720 | ) | ||||||||||||||||||
Fair value included in financial instruments owned | $ | 80,028 | $ | 73,293 | ||||||||||||||||||||||
Fair value included in financial instruments sold, but not yet purchased | $ | 58,453 | $ | 54,730 | ||||||||||||||||||||||
| As of December 2014 | As of December 2013 | |||||||||||||||||||||||||
| $ in millions |
| Derivative Assets |
|
| Derivative Liabilities |
|
| Notional Amount |
|
| Derivative Assets |
|
| Derivative Liabilities |
|
| Notional Amount |
| ||||||||
Derivatives not accounted for as hedges | ||||||||||||||||||||||||||
Interest rates | $ 786,362 | $739,607 | $47,112,518 | $ 641,186 | $587,110 | $44,110,483 | ||||||||||||||||||||
Exchange-traded | 228 | 238 | 3,151,865 | 157 | 271 | 2,366,448 | ||||||||||||||||||||
OTC-cleared | 351,801 | 330,298 | 30,408,636 | 266,230 | 252,596 | 24,888,301 | ||||||||||||||||||||
Bilateral OTC | 434,333 | 409,071 | 13,552,017 | 374,799 | 334,243 | 16,855,734 | ||||||||||||||||||||
Credit | 54,848 | 50,154 | 2,500,958 | 60,751 | 56,340 | 2,946,376 | ||||||||||||||||||||
OTC-cleared | 5,812 | 5,663 | 378,099 | 3,943 | 4,482 | 348,848 | ||||||||||||||||||||
Bilateral OTC | 49,036 | 44,491 | 2,122,859 | 56,808 | 51,858 | 2,597,528 | ||||||||||||||||||||
Currencies | 109,916 | 108,607 | 5,566,203 | 70,757 | 63,659 | 4,311,971 | ||||||||||||||||||||
Exchange-traded | 69 | 69 | 17,214 | 98 | 122 | 23,908 | ||||||||||||||||||||
OTC-cleared | 100 | 96 | 13,304 | 88 | 97 | 11,319 | ||||||||||||||||||||
Bilateral OTC | 109,747 | 108,442 | 5,535,685 | 70,571 | 63,440 | 4,276,744 | ||||||||||||||||||||
Commodities | 28,990 | 28,546 | 669,479 | 18,007 | 18,228 | 701,101 | ||||||||||||||||||||
Exchange-traded | 7,683 | 7,166 | 321,378 | 4,323 | 3,661 | 346,057 | ||||||||||||||||||||
OTC-cleared | 313 | 315 | 3,036 | 11 | 12 | 135 | ||||||||||||||||||||
Bilateral OTC | 20,994 | 21,065 | 345,065 | 13,673 | 14,555 | 354,909 | ||||||||||||||||||||
Equities | 58,931 | 58,649 | 1,525,495 | 56,719 | 55,472 | 1,406,499 | ||||||||||||||||||||
Exchange-traded | 9,592 | 9,636 | 541,711 | 10,544 | 13,157 | 534,840 | ||||||||||||||||||||
Bilateral OTC | 49,339 | 49,013 | 983,784 | 46,175 | 42,315 | 871,659 | ||||||||||||||||||||
Subtotal | 1,039,047 | 985,563 | 57,374,653 | 847,420 | 780,809 | 53,476,430 | ||||||||||||||||||||
Derivatives accounted for as hedges | ||||||||||||||||||||||||||
Interest rates | 14,272 | 262 | 126,498 | 11,403 | 429 | 132,879 | ||||||||||||||||||||
OTC-cleared | 2,713 | 228 | 31,109 | 1,327 | 27 | 10,637 | ||||||||||||||||||||
Bilateral OTC | 11,559 | 34 | 95,389 | 10,076 | 402 | 122,242 | ||||||||||||||||||||
Currencies | 125 | 16 | 9,636 | 74 | 56 | 9,296 | ||||||||||||||||||||
OTC-cleared | 12 | 3 | 1,205 | 1 | 10 | 869 | ||||||||||||||||||||
Bilateral OTC | 113 | 13 | 8,431 | 73 | 46 | 8,427 | ||||||||||||||||||||
Commodities | — | — | — | 36 | — | 335 | ||||||||||||||||||||
Exchange-traded | — | — | — | — | — | 23 | ||||||||||||||||||||
Bilateral OTC | — | — | — | 36 | — | 312 | ||||||||||||||||||||
Subtotal | 14,397 | 278 | 136,134 | 11,513 | 485 | 142,510 | ||||||||||||||||||||
Gross fair value/notional amount of derivatives | $1,053,444 | 1 | $985,841 | 1 | $57,510,787 | $858,933 | 1 | $781,294 | 1 | $53,618,940 | ||||||||||||||||
Amounts that have been offset in the consolidated statements of financial condition | ||||||||||||||||||||||||||
Counterparty netting | (886,670 | ) | (886,670 | ) | (707,411 | ) | (707,411 | ) | ||||||||||||||||||
Exchange-traded | (15,039 | ) | (15,039 | ) | (10,845 | ) | (10,845 | ) | ||||||||||||||||||
OTC-cleared | (335,792 | ) | (335,792 | ) | (254,756 | ) | (254,756 | ) | ||||||||||||||||||
Bilateral OTC | (535,839 | ) | (535,839 | ) | (441,810 | ) | (441,810 | ) | ||||||||||||||||||
Cash collateral netting | (103,504 | ) | (36,155 | ) | (93,643 | ) | (24,161 | ) | ||||||||||||||||||
OTC-cleared | (24,801 | ) | (738 | ) | (16,353 | ) | (2,515 | ) | ||||||||||||||||||
Bilateral OTC | (78,703 | ) | (35,417 | ) | (77,290 | ) | (21,646 | ) | ||||||||||||||||||
Fair value included in financial instruments owned/financial instruments sold, but not yet purchased | $ 63,270 | $ 63,016 | $ 57,879 | $ 49,722 | ||||||||||||||||||||||
Amounts that have not been offset in the consolidated statements of financial condition | ||||||||||||||||||||||||||
Cash collateral received/posted | (980 | ) | (2,940 | ) | (636 | ) | (2,806 | ) | ||||||||||||||||||
Securities collateral received/posted | (14,742 | ) | (18,159 | ) | (13,225 | ) | (10,521 | ) | ||||||||||||||||||
Total | $ 47,548 | $ 41,917 | $ 44,018 | $ 36,395 | ||||||||||||||||||||||
| 1. |
|
|
| 142 | Goldman Sachs |
THE GOLDMAN SACHS GROUP, INC. AND SUBSIDIARIES
Notes to Consolidated Financial Statements
Valuation Techniques for Derivatives
The firm’s level 2 and level 3 derivatives are valued using derivative pricing models (e.g., discounted cash flow models, correlation models, and models that incorporate option pricing methodologies, such as Monte Carlo simulations). Price transparency of derivatives can generally be characterized by product type.
| Ÿ | Interest Rate. In general, the key inputs used to value interest rate derivatives are transparent, even for most long-dated contracts. Interest rate swaps and options denominated in the currencies of leading industrialized nations are characterized by high trading volumes and tight bid/offer spreads. Interest rate derivatives that reference indices, such as an inflation index, or the shape of the yield curve (e.g., 10-year swap rate vs. 2-year swap rate) are more complex, but the key inputs are generally observable. |
| Ÿ | Credit. Price transparency for credit default swaps, including both single names and baskets of credits, varies by market and underlying reference entity or obligation. Credit default swaps that reference indices, large corporates and major sovereigns generally exhibit the most price transparency. For credit default swaps with other underliers, price transparency varies based on credit rating, the cost of borrowing the underlying reference obligations, and the availability of the underlying reference obligations for delivery upon the default of the issuer. Credit default swaps that reference loans, asset-backed securities and emerging market debt instruments tend to have less price transparency than those that reference corporate bonds. In addition, more complex credit derivatives, such as those sensitive to the correlation between two or more underlying reference obligations, generally have less price transparency. |
| Ÿ | Currency. Prices for currency derivatives based on the exchange rates of leading industrialized nations, including those with longer tenors, are generally transparent. The primary difference between the price transparency of developed and emerging market currency derivatives is that emerging markets tend to be observable for contracts with shorter tenors. |
| Ÿ | Commodity. Commodity derivatives include transactions referenced to energy (e.g., oil and natural gas), metals (e.g., precious and base) and soft commodities (e.g., agricultural). Price transparency varies based on the underlying commodity, delivery location, tenor and product quality (e.g., diesel fuel compared to unleaded gasoline). In general, price transparency for commodity derivatives is greater for contracts with shorter tenors and contracts that are more closely aligned with major and/or benchmark commodity indices. |
| Ÿ | Equity. Price transparency for equity derivatives varies by market and underlier. Options on indices and the common stock of corporates included in major equity indices exhibit the most price transparency. Equity derivatives generally have observable market prices, except for contracts with long tenors or reference prices that differ significantly from current market prices. More complex equity derivatives, such as those sensitive to the correlation between two or more individual stocks, generally have less price transparency. |
Liquidity is essential to observability of all product types. If transaction volumes decline, previously transparent prices and other inputs may become unobservable. Conversely, even highly structured products may at times have trading volumes large enough to provide observability of prices and other inputs. See Note 5 for an overview of the firm’s fair value measurement policies.
Level 1 Derivatives
Exchange-tradedLevel 1 derivatives fall withininclude short-term contracts for future delivery of securities when the underlying security is a level 1 instrument, and exchange-traded derivatives if they are actively traded and are valued at their quoted market price.
Level 2 Derivatives
Level 2 derivatives include exchange-traded derivatives that are not actively traded and OTC derivatives for which all significant valuation inputs are corroborated by market evidence.
Level 2evidence and exchange-traded derivatives that are not actively traded and/or that are valued using models that calibrate to market-clearing levels of OTC derivatives. InputsIn evaluating the significance of a valuation input, the firm considers, among other factors, a portfolio’s net risk exposure to that input.
| Goldman Sachs 2014 Form 10-K | 143 |
THE GOLDMAN SACHS GROUP, INC. AND SUBSIDIARIES
Notes to Consolidated Financial Statements
The selection of a particular model to value a derivative depends on the contractual terms of and specific risks inherent in the instrument, as well as the availability of pricing information in the market. For derivatives that trade in liquid markets, model selection does not involve significant management judgment because outputs of models can be calibrated to market-clearing levels.
Valuation models require a variety of inputs, such as contractual terms, market prices, yield curves, discount rates (including those derived from interest rates on collateral received and posted as specified in credit support agreements for collateralized derivatives), credit curves, measures of volatility, prepayment rates, loss severity rates and correlations of such inputs. Significant inputs to the valuations of level 2 OTC derivatives can be verified to market-clearingmarket transactions, broker or dealer quotations or other alternative pricing sources with reasonable levels of price transparency. Consideration is given to the nature of the quotations (e.g., indicative or firm) and the relationship of recent market activity to the prices provided from alternative pricing sources.
Where models are used, the selection of a particular model to value an OTC derivative depends on the contractual terms of and specific risks inherent in the instrument, as well as the availability of pricing information in the market. Valuation models require a variety of inputs, including contractual terms, market prices, yield curves, credit curves, measures of volatility, prepayment rates, loss severity rates and correlations of such inputs. For OTC derivatives that trade in liquid markets, model selection does not involve significant management judgment because outputs of models can be calibrated to market-clearing levels.
Price transparency of OTC derivatives can generally be characterized by product type.
Interest Rate.In general, the prices and other inputs used to value interest rate derivatives are transparent, even for long-dated contracts. Interest rate swaps and options denominated in the currencies of leading industrialized nations are characterized by high trading volumes and tight bid/offer spreads. Interest rate derivatives that reference indices, such as an inflation index, or the shape of the yield curve (e.g., 10-year swap rate vs. 2-year swap rate), are more complex and are therefore less transparent, but the prices and other inputs are generally observable.
Credit.Price transparency for credit default swaps, including both single names and baskets of credits, varies by market and underlying reference entity or obligation. Credit default swaps that reference indices, large corporates and major sovereigns generally exhibit the most price transparency. For credit default swaps with other underliers, price transparency varies based on credit rating, the cost of borrowing the underlying reference obligations, and the availability of the underlying reference obligations for delivery upon the default of the issuer. Credit default swaps that reference loans, asset-backed securities and emerging market debt instruments tend to be less transparent than those that reference corporate bonds. In addition, more complex credit derivatives, such as those sensitive to the correlation between two or more underlying reference obligations, generally have less price transparency.
Currency.Prices for currency derivatives based on the exchange rates of leading industrialized nations, including those with longer tenors, are generally transparent. The primary difference between the transparency of developed and emerging market currency derivatives is that emerging markets tend to be observable for contracts with shorter tenors.
Commodity.Commodity derivatives include transactions referenced to energy (e.g., oil and natural gas), metals (e.g., precious and base) and soft commodities (e.g., agricultural). Price transparency varies based on the underlying commodity, delivery location, tenor and product quality (e.g., diesel fuel compared to unleaded gasoline). In general, price transparency for commodity derivatives is greater for contracts with shorter tenors and contracts that are more closely aligned with major and/or benchmark commodity indices.
THE GOLDMAN SACHS GROUP, INC. AND SUBSIDIARIES
Notes to Consolidated Financial Statements
Equity.Price transparency for equity derivatives varies by market and underlier. Options on indices and the common stock of corporates included in major equity indices exhibit the most price transparency. Exchange-traded and OTC equity derivatives generally have observable market prices, except for contracts with long tenors or reference prices that differ significantly from current market prices. More complex equity derivatives, such as those sensitive to the correlation between two or more individual stocks, generally have less price transparency.
Liquidity is essential to observability of all product types. If transaction volumes decline, previously transparent prices and other inputs may become unobservable. Conversely, even highly structured products may at times have trading volumes large enough to provide observability of prices and other inputs.
Level 3 Derivatives
Level 3 OTC derivatives are valued using models which utilize observable level 1 and/or level 2 inputs, as well as unobservable level 3 inputs.
| Ÿ | For the majority of the firm’s interest rate and currency derivatives classified within level 3, |
| Ÿ | For level 3 credit derivatives, |
| Ÿ | For level 3 equity derivatives, significant |
| Ÿ | For level 3 commodity derivatives, significant |
Subsequent to the initial valuation of a level 3 OTC derivative, the firm updates the level 1 and level 2 inputs to reflect observable market changes and any resulting gains and losses are recorded in level 3. Level 3 inputs are changed when corroborated by evidence such as similar market transactions, third-party pricing services and/or broker or dealer quotations or other empirical market data. In circumstances where the firm cannot verify the model value by reference to market transactions, it is possible that a different valuation model could produce a materially different estimate of fair value. See below for further information about significant unobservable inputs used in the valuation of level 3 derivatives.
Valuation Adjustments
Valuation adjustments are integral to determining the fair value of derivativesderivative portfolios and are used to adjust the mid-market valuations produced by derivative pricing models to the appropriate exit price valuation. These adjustments incorporate bid/offer spreads, the cost of liquidity, on illiquid positions, credit valuation adjustments (CVA) and funding valuation adjustments, which account for the credit and funding risk inherent in the uncollateralized portion of derivative portfolios. The firm also makes funding valuation adjustments to collateralized derivatives where the terms of the agreement do not permit the firm to deliver or repledge collateral received. Market-based inputs are generally used when calibrating valuation adjustments to market-clearing levels.
In addition, for derivatives that include significant unobservable inputs, the firm makes model or exit price adjustments to account for the valuation uncertainty present in the transaction.
| 144 | Goldman Sachs |
THE GOLDMAN SACHS GROUP, INC. AND SUBSIDIARIES
Notes to Consolidated Financial Statements
Significant Unobservable Inputs
The tables below present the ranges of significant unobservable inputs used to value the firm’s level 3 derivatives as well as averages and medians of these inputs. The ranges represent the significant unobservable inputs that were used in the valuation of each type of derivative. Averages represent the arithmetic average of the inputs and are not weighted by the relative fair value or notional of the respective financial instruments. An average greater than the median indicates that the majority of inputs are below the average. The ranges, averages and medians of these
inputs are not representative of the appropriate inputs to use when calculating the fair value of any one derivative. For example, the highest correlation presented in the tables below for interest rate derivatives is appropriate for valuing a specific interest rate derivative but may not be appropriate for valuing any other interest rate derivative. Accordingly, the ranges of inputs presented below do not represent uncertainty in, or possible ranges of, fair value measurements of the firm’s level 3 derivatives.
Level 3 Derivative Product Type | Net Level 3 Assets/(Liabilities) as of December 2014 ($ in millions) | Valuation Techniques and Significant Unobservable Inputs | Range of Significant UnobservableInputs(Average / Median) as of December 2014 | |||
Interest rates | $(40) | Option pricing models: Correlation1 Volatility | (16)% to 84% (37% / 40%) 36 basis points per annum (bpa) to 156 bpa (100 bpa / 115 bpa) | |||
Credit | $3,530 | Option pricing models, correlation models and discounted cash flows models 2: | ||||
Correlation1 | 5% to 99% (71% / 72%) | |||||
Credit spreads | 1 basis points (bps) to 700 bps (116 bps / 79 bps)3 | |||||
Upfront credit points | 0 points to 99 points (40 points / 30 points) | |||||
Recovery rates | 14% to 87% (44% / 40%) | |||||
Currencies | $(267) | Option pricing models: Correlation1 | 55% to 80% (69% / 73%) | |||
Commodities | $(1,142) | Option pricing models and discounted cash flows models 2: | ||||
Volatility | 16% to 68% (33% / 32%) | |||||
Spread per million British Thermal units (MMBTU) of natural gas | $(1.66) to $4.45 ($(0.13) / $(0.03)) 3 | |||||
Spread per Metric Tonne (MT) of coal | $(10.50) to $3.00 ($(4.04) / $(6.74)) | |||||
Spread per barrel of oil and refined products | $(15.35) to $80.55 ($22.32 / $13.50) 3 | |||||
Equities | $(1,375) | Option pricing models: Correlation1 Volatility | 30% to 99% (62% / 55%) 5% to 90% (23% / 21%) |
| 1. | The range of unobservable inputs for correlation across derivative product types (i.e., cross-asset correlation) was (34)% to 80% (Average: 33% / Median: 35%) as of December 2014. |
| 2. | The fair value of any one instrument may be determined using multiple valuation techniques. For example, option pricing models and discounted cash flows models are typically used together to determine fair value. Therefore, the level 3 balance encompasses both of these techniques. |
| 3. | The difference between the average and the median for these spread inputs indicates that the majority of the inputs fall in the lower end of the range. |
| Goldman Sachs 2014 Form 10-K | 145 |
THE GOLDMAN SACHS GROUP, INC. AND SUBSIDIARIES
Notes to Consolidated Financial Statements
Level 3 Derivative Product Type | Net Level 3 Assets/(Liabilities) as of December 2013 ($ in millions) | Valuation Techniques and Significant Unobservable Inputs | Range of Significant UnobservableInputs(Average / Median) as of December 2013 | |||
Interest rates | $(86) | Option pricing models: Correlation 1 Volatility | 22% to 84% (58% / 60%) 36 bpa to 165 bpa (107 bpa / 112 bpa) | |||
Credit | $4,176 | Option pricing models, correlation models and discounted cash flows models 2: | ||||
Correlation 1 | 5% to 93% (61% / 61%) | |||||
Credit spreads | 1 bps to 1,395 bps (153 bps / 116 bps) 3 | |||||
Upfront credit points | 0 points to 100 points (46 points / 43 points) | |||||
Recovery rates | 20% to 85% (50% / 40%) | |||||
Currencies | $(200) | Option pricing models: Correlation 1 | 65% to 79% (72% / 72%) | |||
Commodities | $60 | Option pricing models and discounted cash flows models 2: | ||||
Volatility | 15% to 52% (23% / 21%) | |||||
Spread per MMBTU of natural gas | $(1.74) to $5.62 ($(0.11) / $(0.04)) | |||||
Spread per MT of coal | $(17.00) to $0.50 ($(6.54) / $(5.00)) | |||||
Equities | $(959) | Option pricing models: Correlation 1 Volatility | 23% to 99% (58% / 59%) 6% to 63% (20% / 20%) |
| 1. | The range of unobservable inputs for correlation across derivative product types (i.e., cross-asset correlation) was (42)% to 78% (Average: 25% / Median: 30%) as of December 2013. |
| 2. | The fair value of any one instrument may be determined using multiple valuation techniques. For example, option pricing models and discounted cash flows models are typically used together to determine fair value. Therefore, the level 3 balance encompasses both of these techniques. |
| 3. | The difference between the average and the median for these credit spread inputs indicates that the majority of the inputs fall in the lower end of the range. |
| 146 | Goldman Sachs 2014 Form 10-K |
THE GOLDMAN SACHS GROUP, INC. AND SUBSIDIARIES
Notes to Consolidated Financial Statements
Range of Significant Unobservable Inputs
The following provides further information about the ranges of significant unobservable inputs used to value the firm’s level 3 derivative instruments.
| Ÿ | Correlation. Ranges for correlation cover a variety of underliers both within one market (e.g., equity index and equity single stock names) and across markets (e.g., correlation of an interest rate and a foreign exchange rate), as well as across regions. Generally, cross-asset correlation inputs are used to value more complex instruments and are lower than correlation inputs on assets within the same derivative product type. |
| Ÿ | Volatility. Ranges for volatility cover numerous underliers across a variety of markets, maturities and strike prices. For example, volatility of equity indices is generally lower than volatility of single stocks. |
| Ÿ | Credit spreads, upfront credit points and recovery rates. The ranges for credit spreads, upfront credit points and recovery rates cover a variety of underliers (index and single names), regions, sectors, maturities and credit qualities (high-yield and investment-grade). The broad range of this population gives rise to the width of the ranges of significant unobservable inputs. |
| Ÿ | Commodity prices and spreads. The ranges for commodity prices and spreads cover variability in products, maturities and locations. |
Sensitivity of Fair Value Measurement to Changes in Significant Unobservable Inputs
The following provides a description of the directional sensitivity of the firm’s level 3 fair value measurements to changes in significant unobservable inputs, in isolation. Due to the distinctive nature of each of the firm’s level 3 derivatives, the interrelationship of inputs is not necessarily uniform within each product type.
| Ÿ | Correlation. In general, for contracts where the holder benefits from the convergence of the underlying asset or index prices (e.g., interest rates, credit spreads, foreign exchange rates, inflation rates and equity prices), an increase in correlation results in a higher fair value measurement. |
| Ÿ | Volatility. In general, for purchased options an increase in volatility results in a higher fair value measurement. |
| Ÿ | Credit spreads, upfront credit points and recovery rates. In general, the fair value of purchased credit protection increases as credit spreads or upfront credit points increase or recovery rates decrease. Credit spreads, upfront credit points and recovery rates are strongly related to distinctive risk factors of the underlying reference obligations, which include reference entity-specific factors such as leverage, volatility and industry, market-based risk factors, such as borrowing costs or liquidity of the underlying reference obligation, and macroeconomic conditions. |
| Ÿ | Commodity prices and spreads. In general, for contracts where the holder is receiving a commodity, an increase in the spread (price difference from a benchmark index due to differences in quality or delivery location) or price results in a higher fair value measurement. |
| Goldman Sachs 2014 Form 10-K | 147 |
THE GOLDMAN SACHS GROUP, INC. AND SUBSIDIARIES
Notes to Consolidated Financial Statements
Fair Value of Derivatives by Level
The tables below present the fair value of derivatives on a gross basis by level and major product type. Grosstype as well as the impact of netting. The gross fair values in the tables below exclude the effects of both counterparty netting under enforceableand collateral netting, agreements and netting of cash
received or posted under credit support agreements both in and across levels of the fair value hierarchy, and therefore are not representative of the firm’s exposure.
Counterparty netting is reflected in each level to the extent that receivable and payable balances are netted within the same level and is included in “Counterparty and cash collateral netting.” Where the counterparty netting is across levels, the netting is reflected in “Cross-Level Netting.”
| Derivative Assets at Fair Value as of December 2011 | ||||||||||||||||||||
| in millions | Level 1 | Level 2 | Level 3 | Cross-Level Netting | Total | |||||||||||||||
Interest rates | $33 | $ | 645,923 | $ | 214 | $ — | $ | 646,170 | ||||||||||||
Credit | — | 137,110 | 13,706 | — | 150,816 | |||||||||||||||
Currencies | — | 86,752 | 2,026 | — | 88,778 | |||||||||||||||
Commodities | — | 35,062 | 904 | — | 35,966 | |||||||||||||||
Equities | 24 | 62,684 | 1,427 | — | 64,135 | |||||||||||||||
Gross fair value of derivative assets | 57 | 967,531 | 18,277 | — | 985,865 | |||||||||||||||
Counterparty netting 1 | — | (778,639 | ) | (6,377 | ) | (2,717 | ) 3 | (787,733 | ) | |||||||||||
Subtotal | $57 | $ | 188,892 | $ | 11,900 | $(2,717 | ) | $ | 198,132 | |||||||||||
Cash collateral netting 2 | (118,104 | ) | ||||||||||||||||||
Fair value included in financial instruments owned | $ | 80,028 | ||||||||||||||||||
| Derivative Liabilities at Fair Value as of December 2011 | ||||||||||||||||||||
| in millions | Level 1 | Level 2 | Level 3 | Cross-Level Netting | Total | |||||||||||||||
Interest rates | $ 24 | $ | 582,012 | $ | 585 | $ — | $ | 582,621 | ||||||||||||
Credit | — | 123,253 | 7,406 | — | 130,659 | |||||||||||||||
Currencies | — | 70,573 | 1,184 | — | 71,757 | |||||||||||||||
Commodities | — | 36,541 | 1,509 | — | 38,050 | |||||||||||||||
Equities | 185 | 49,884 | 1,859 | — | 51,928 | |||||||||||||||
Gross fair value of derivative liabilities | 209 | 862,263 | 12,543 | — | 875,015 | |||||||||||||||
Counterparty netting 1 | — | (778,639 | ) | (6,377 | ) | (2,717 | ) 3 | (787,733 | ) | |||||||||||
Subtotal | $209 | $ | 83,624 | $ | 6,166 | $(2,717 | ) | $ | 87,282 | |||||||||||
Cash collateral netting 2 | (28,829 | ) | ||||||||||||||||||
Fair value included in financial instruments sold, | $ | 58,453 | ||||||||||||||||||
|
|
|
| Derivative Assets at Fair Value as of December 2014 | ||||||||||||||||||||||||
| $ in millions | Level 1 | Level 2 | Level 3 | | Cross-Level Netting | | | Cash Collateral Netting | | Total | ||||||||||||||
Interest rates | $123 | $ 800,028 | $ 483 | $ — | $ — | $ 800,634 | ||||||||||||||||||
Credit | — | 47,190 | 7,658 | — | — | 54,848 | ||||||||||||||||||
Currencies | — | 109,891 | 150 | — | — | 110,041 | ||||||||||||||||||
Commodities | — | 28,124 | 866 | — | — | 28,990 | ||||||||||||||||||
Equities | 175 | 58,122 | 634 | — | — | 58,931 | ||||||||||||||||||
Gross fair value of derivative assets | 298 | 1,043,355 | 9,791 | — | — | 1,053,444 | ||||||||||||||||||
Counterparty and cash collateral netting | — | (882,841 | ) | (2,717 | ) | (1,112 | ) | (103,504 | ) | (990,174 | ) | |||||||||||||
Fair value included in financial instruments owned | $298 | $ 160,514 | $ 7,074 | $(1,112 | ) | $(103,504 | ) | $ 63,270 | ||||||||||||||||
| Derivative Liabilities at Fair Value as of December 2014 | ||||||||||||||||||||||||
| $ in millions | Level 1 | Level 2 | Level 3 | | Cross-Level Netting | | | Cash Collateral Netting | | Total | ||||||||||||||
Interest rates | $ 14 | $ 739,332 | $ 523 | $ — | $ — | $ 739,869 | ||||||||||||||||||
Credit | — | 46,026 | 4,128 | — | — | 50,154 | ||||||||||||||||||
Currencies | — | 108,206 | 417 | — | — | 108,623 | ||||||||||||||||||
Commodities | — | 26,538 | 2,008 | — | — | 28,546 | ||||||||||||||||||
Equities | 94 | 56,546 | 2,009 | — | — | 58,649 | ||||||||||||||||||
Gross fair value of derivative liabilities | 108 | 976,648 | 9,085 | — | — | 985,841 | ||||||||||||||||||
Counterparty and cash collateral netting | — | (882,841 | ) | (2,717 | ) | (1,112 | ) | (36,155 | ) | (922,825 | ) | |||||||||||||
Fair value included in financial instruments sold, | $108 | $ 93,807 | $ 6,368 | $(1,112 | ) | $ (36,155 | ) | $ 63,016 | ||||||||||||||||
| Derivative Assets at Fair Value as of December 2013 | ||||||||||||||||||||||||
| $ in millions | Level 1 | Level 2 | Level 3 | | Cross-Level Netting | | | Cash Collateral Netting | | Total | ||||||||||||||
Interest rates | $ 91 | $ 652,104 | $ 394 | $ — | $ — | $ 652,589 | ||||||||||||||||||
Credit | — | 52,834 | 7,917 | — | — | 60,751 | ||||||||||||||||||
Currencies | — | 70,481 | 350 | — | — | 70,831 | ||||||||||||||||||
Commodities | — | 17,517 | 526 | — | — | 18,043 | ||||||||||||||||||
Equities | 3 | 55,826 | 890 | — | — | 56,719 | ||||||||||||||||||
Gross fair value of derivative assets | 94 | 848,762 | 10,077 | — | — | 858,933 | ||||||||||||||||||
Counterparty and cash collateral netting | — | (702,703 | ) | (3,001 | ) | (1,707 | ) | (93,643 | ) | (801,054 | ) | |||||||||||||
Fair value included in financial instruments owned | $ 94 | $ 146,059 | $ 7,076 | $(1,707 | ) | $ (93,643 | ) | $ 57,879 | ||||||||||||||||
| Derivative Liabilities at Fair Value as of December 2013 | ||||||||||||||||||||||||
| $ in millions | Level 1 | Level 2 | Level 3 | | Cross-Level Netting | | | Cash Collateral Netting | | Total | ||||||||||||||
Interest rates | $ 93 | $ 586,966 | $ 480 | $ — | $ — | $ 587,539 | ||||||||||||||||||
Credit | — | 52,599 | 3,741 | — | — | 56,340 | ||||||||||||||||||
Currencies | — | 63,165 | 550 | — | — | 63,715 | ||||||||||||||||||
Commodities | — | 17,762 | 466 | — | — | 18,228 | ||||||||||||||||||
Equities | 6 | 53,617 | 1,849 | — | — | 55,472 | ||||||||||||||||||
Gross fair value of derivative liabilities | 99 | 774,109 | 7,086 | — | — | 781,294 | ||||||||||||||||||
Counterparty and cash collateral netting | — | (702,703 | ) | (3,001 | ) | (1,707 | ) | (24,161 | ) | (731,572 | ) | |||||||||||||
Fair value included in financial instruments sold, | $ 99 | $ 71,406 | $ 4,085 | $(1,707 | ) | $ (24,161 | ) | $ 49,722 | ||||||||||||||||
| Goldman Sachs |
THE GOLDMAN SACHS GROUP, INC. AND SUBSIDIARIES
Notes to Consolidated Financial Statements
| Derivative Assets at Fair Value as of December 2010 | ||||||||||||||||||||
| in millions | Level 1 | Level 2 | Level 3 | Cross-Level Netting | Total | |||||||||||||||
Interest rates | $ | 49 | $ | 486,037 | $ | 455 | $ | — | $ | 486,541 | ||||||||||
Credit | — | 115,519 | 11,634 | — | 127,153 | |||||||||||||||
Currencies | — | 86,158 | 1,807 | — | 87,965 | |||||||||||||||
Commodities | — | 34,511 | 2,178 | — | 36,689 | |||||||||||||||
Equities | 44 | 64,267 | 1,504 | — | 65,815 | |||||||||||||||
Gross fair value of derivative assets | 93 | 786,492 | 17,578 | — | 804,163 | |||||||||||||||
Counterparty netting 1 | — | (613,979 | ) | (4,806 | ) | (1,768 | ) 3 | (620,553 | ) | |||||||||||
Subtotal | $ | 93 | $ | 172,513 | $ | 12,772 | $ | (1,768 | ) | $ | 183,610 | |||||||||
Cash collateral netting 2 | (110,317 | ) | ||||||||||||||||||
Fair value included in financial instruments owned | $ | 73,293 | ||||||||||||||||||
| Derivative Liabilities at Fair Value as of December 2010 | ||||||||||||||||||||
| in millions | Level 1 | Level 2 | Level 3 | Cross-Level Netting | Total | |||||||||||||||
Interest rates | $ | 18 | $ | 422,267 | $ | 262 | $ | — | $ | 422,547 | ||||||||||
Credit | — | 99,813 | 4,594 | — | 104,407 | |||||||||||||||
Currencies | — | 69,726 | 709 | — | 70,435 | |||||||||||||||
Commodities | — | 39,709 | 1,957 | — | 41,666 | |||||||||||||||
Equities | 27 | 49,427 | 2,494 | — | 51,948 | |||||||||||||||
Gross fair value of derivative liabilities | 45 | 680,942 | 10,016 | — | 691,003 | |||||||||||||||
Counterparty netting 1 | — | (613,979 | ) | (4,806 | ) | (1,768 | ) 3 | (620,553 | ) | |||||||||||
Subtotal | $ | 45 | $ | 66,963 | $ | 5,210 | $ | (1,768 | ) | $ | 70,450 | |||||||||
Cash collateral netting 2 | (15,720 | ) | ||||||||||||||||||
Fair value included in financial instruments sold, but not yet purchased | $ | 54,730 | ||||||||||||||||||
|
|
|
THE GOLDMAN SACHS GROUP, INC. AND SUBSIDIARIES
Notes to Consolidated Financial Statements
Level 3 Rollforward
If a derivative was transferred to level 3 during a reporting period, its entire gain or loss for the period is included in level 3. Transfers between levels are reported at the beginning of the reporting period in which they occur. In the tables below, negative amounts for transfers into level 3 and positive amounts for transfers out of level 3 represent net transfers of derivative liabilities.
Gains and losses on level 3 derivatives should be considered in the context of the following:
| Ÿ | A derivative with level 1 and/or level 2 inputs is classified in level 3 in its entirety if it has at least one significant |
| Ÿ | If there is one significant level 3 input, the entire gain or loss from adjusting only observable inputs (i.e., level 1 and level 2 inputs) is classified as level 3. |
| Ÿ | Gains or losses that have been reported in level 3 resulting from changes in level 1 or level 2 inputs are frequently offset by gains or losses attributable to level 1 or level 2 derivatives and/or level 1, level 2 and level 3 cash instruments. As a result, gains/(losses) included in the level 3 rollforward below do not necessarily represent the overall impact on the firm’s results of operations, liquidity or capital resources. |
The tables below present changes in fair value for all derivatives categorized as level 3 as of the end of the year.
| Level 3 Derivative Assets and Liabilities at Fair Value for the Year Ended December 2011 | Level 3 Derivative Assets and Liabilities at Fair Value for the Year Ended December 2014 | |||||||||||||||||||||||||||||||||||||||||||||||||||||||||||||||||||
| in millions | Asset/ (liability) | Net realized | Net unrealized gains/(losses) relating to instruments still held at year-end | Purchases | Sales | Settlements | Net transfers in and/or (out) of level 3 | Asset/ (liability) balance, year | ||||||||||||||||||||||||||||||||||||||||||||||||||||||||||||
| $ in millions | | Asset/ (liability) balance, beginning of year | | | Net realized gains/ (losses) | | | Net unrealized gains/(losses) relating to instruments still held at year-end | | Purchases | Sales | Settlements | | Transfers into level 3 | | | Transfers out of level 3 | | | Asset/ (liability) balance, end of year | | |||||||||||||||||||||||||||||||||||||||||||||||
Interest rates — net | $ | 194 | $ | (38 | ) | $ | (305 | ) | $ | 23 | $ | (29 | ) | $ | 84 | $ | (300 | ) | $ | (371 | ) | $ (86 | ) | $ (50 | ) | $ (101 | ) | $ 97 | $ (2 | ) | $ 92 | $ 14 | $ (4 | ) | $ (40 | ) | ||||||||||||||||||||||||||||||||
Credit — net | 7,040 | 46 | 2,525 | 348 | (1,310 | ) | (1,713 | ) | (636 | ) | 6,300 | 4,176 | 64 | 1,625 | 151 | (138 | ) | (1,693 | ) | (194 | ) | (461 | ) | 3,530 | ||||||||||||||||||||||||||||||||||||||||||||
Currencies — net | 1,098 | (26 | ) | (351 | ) | 29 | (25 | ) | (54 | ) | 171 | 842 | (200 | ) | (70 | ) | (175 | ) | 19 | — | 172 | (9 | ) | (4 | ) | (267 | ) | |||||||||||||||||||||||||||||||||||||||||
Commodities — net | 220 | (35 | ) | 259 | 125 | (835 | ) | 150 | (489 | ) | (605 | ) | 60 | (19 | ) | (1,096 | ) | 38 | (272 | ) | 95 | 84 | (32 | ) | (1,142 | ) | ||||||||||||||||||||||||||||||||||||||||||
Equities — net | (990 | ) | 184 | 151 | 382 | (683 | ) | 159 | 365 | (432 | ) | (959 | ) | (48 | ) | (436 | ) | 344 | (979 | ) | 270 | (115 | ) | 548 | (1,375 | ) | ||||||||||||||||||||||||||||||||||||||||||
Total derivatives — net | $ | 7,562 | $ | 131 | 1 | $ | 2,279 | 1, 2 | $ | 907 | $ | (2,882 | ) | $ | (1,374 | ) | $ | (889 | ) | $ | 5,734 | $2,991 | $(123 | ) 1 | $ (183 | ) 1 | $649 | $(1,391 | ) | $(1,064 | ) | $(220 | ) | $ 47 | $ 706 | |||||||||||||||||||||||||||||||||
| 1. | The aggregate amounts include losses of approximately |
|
The net unrealized gainloss on level 3 derivatives of $2.28 billion$183 million for the year ended December 20112014 was primarily attributable to the impact of a decrease in commodity prices on certain commodity derivatives, a decrease in equity prices on certain equity derivatives, and the impact of changes in foreign exchange rates on certain currency derivatives, largely offset by the impact of tighter credit spreads and a decrease in interest rates and exchange rates underlyingon certain credit derivatives. Unrealized gains on
Transfers into level 3 derivatives were substantially offset by unrealized losses on derivatives classified withinduring 2014 primarily reflected transfers of certain credit derivative liabilities from level 2, which economically hedgeprincipally due to unobservable credit spread inputs becoming significant to the valuation of these derivatives classified withinand transfers of certain equity derivative liabilities from level 3.2, primarily due to reduced transparency of volatility inputs used to value these derivatives.
Significant transfers in orTransfers out of level 3 derivatives during 2014 primarily reflected transfers of certain equity derivative liabilities to level 2, principally due to unobservable correlation inputs no longer being significant to the year ended December 2011 included:valuation of these derivatives, and transfers of certain credit derivative assets to level 2, principally due to unobservable credit spread inputs no longer being significant to the net risk of certain portfolios.
|
|
|
| Goldman Sachs | 149 |
THE GOLDMAN SACHS GROUP, INC. AND SUBSIDIARIES
Notes to Consolidated Financial Statements
| Level 3 Derivative Assets and Liabilities at Fair Value for the Year Ended December 2010 | Level 3 Derivative Assets and Liabilities at Fair Value for the Year Ended December 2013 | |||||||||||||||||||||||||||||||||||||||||||||||||||||||||||
| in millions | Asset/ (liability) | Net realized | Net unrealized year-end | Net purchases, sales and settlements | Net and/or (out) | Asset/ (liability) balance, end of year | ||||||||||||||||||||||||||||||||||||||||||||||||||||||
| $ in millions | | Asset/ (liability) balance, beginning of year | | | Net realized gains/ (losses) | | | Net unrealized gains/(losses) relating to instruments still held at year-end | | Purchases | Sales | Settlements | | Transfers into level 3 | | | Transfers out of level 3 | | | Asset/ (liability) balance, end of year | | |||||||||||||||||||||||||||||||||||||||
Interest rates — net | $ | (71 | ) | $ | (79 | ) | $ | 156 | $ | (118 | ) | $ | 306 | $ | 194 | $ (355 | ) | $ (78 | ) | $ 168 | $ 1 | $ (8 | ) | $ 196 | $ (9 | ) | $ (1 | ) | $ (86 | ) | ||||||||||||||||||||||||||||||
Credit — net | 6,366 | 8 | 4,393 | (2,663 | ) | (1,064 | ) | 7,040 | 6,228 | (1 | ) | (977 | ) | 201 | (315 | ) | (1,508 | ) | 695 | (147 | ) | 4,176 | ||||||||||||||||||||||||||||||||||||||
Currencies — net | 215 | (83 | ) | 317 | 110 | 539 | 1,098 | 35 | (93 | ) | (419 | ) | 22 | (6 | ) | 169 | 139 | (47 | ) | (200 | ) | |||||||||||||||||||||||||||||||||||||||
Commodities — net | (90 | ) | 48 | 312 | 33 | (83 | ) | 220 | (304 | ) | (6 | ) | 58 | 21 | (48 | ) | 281 | 50 | 8 | 60 | ||||||||||||||||||||||||||||||||||||||||
Equities — net | (1,224 | ) | (38 | ) | 6 | 43 | 223 | (990 | ) | (1,248 | ) | (67 | ) | (202 | ) | 77 | (472 | ) | 1,020 | (15 | ) | (52 | ) | (959 | ) | |||||||||||||||||||||||||||||||||||
Total derivatives — net | $ | 5,196 | $ | (144 | ) 1 | $ | 5,184 | 1, 2 | $ | (2,595 | ) | $ | (79 | ) | $ | 7,562 | $4,356 | $(245 | ) 1 | $(1,372 | ) 1 | $322 | $(849 | ) | $ 158 | $860 | $(239 | ) | $2,991 | |||||||||||||||||||||||||||||||
| 1. | The aggregate amounts include losses of approximately |
|
The net unrealized gainloss on level 3 derivatives of $5.18$1.37 billion for the year ended December 20102013 principally resulted from changes in level 2 inputs and was primarily attributable to lower interest rates underlyinglosses on certain credit derivatives. These unrealized gains were substantially offset by unrealizedderivatives, principally due to the impact of tighter credit spreads, and losses on certain currency interest rate andderivatives, primarily due to changes in foreign exchange rates.
Transfers into level 3 derivatives during 2013 primarily reflected transfers of credit derivatives categorized inderivative assets from level 2, which economically hedge level 3principally due to reduced transparency of upfront credit points and correlation inputs used to value these derivatives.
Significant transfers in orTransfers out of level 3 derivatives during 2013 primarily reflected transfers of certain credit derivatives to level 2, principally due to unobservable credit spread and correlation inputs no longer being significant to the year ended December 2010 included:valuation of these derivatives and unobservable inputs not being significant to the net risk of certain portfolios.
|
|
Impact of Credit Spreads on Derivatives
On an ongoing basis, the firm realizes gains or losses relating to changes in credit risk through the unwind of derivative contracts and changes in credit mitigants.
The net gaingain/(loss), including hedges, attributable to the impact of changes in credit exposure and credit spreads (counterparty and the firm’s) on derivatives was $573 million, $68 million and $572$135 million for the years ended December 2011, December 20102014, $(66) million for 2013 and December 2009, respectively.$(735) million for 2012.
Bifurcated Embedded Derivatives
The table below presents derivatives, primarily equitythe fair value and interest rate products,the notional amount of derivatives that have been bifurcated from their related borrowings. These derivatives, which are recorded at fair value, primarily consist of interest rate, equity and commodity products and are included in “Unsecured short-term borrowings” and “Unsecured long-term borrowings” with the related borrowings.” See Note 8 for further information.
| As of December | ||||||||
| in millions, except number of contracts | 2011 | 2010 | ||||||
Fair value of assets | $ | 422 | $ | 383 | ||||
Fair value of liabilities | 304 | 267 | ||||||
Net | $ | 118 | $ | 116 | ||||
Number of contracts | 333 | 338 | ||||||
| As of December | ||||||||
| $ in millions | 2014 | 2013 | ||||||
Fair value of assets | $ 390 | $ 285 | ||||||
Fair value of liabilities | 690 | 373 | ||||||
Net liability | $ 300 | $ 88 | ||||||
Notional amount | $7,735 | $7,580 | ||||||
| 150 | Goldman Sachs |
THE GOLDMAN SACHS GROUP, INC. AND SUBSIDIARIES
Notes to Consolidated Financial Statements
OTC Derivatives
The tables below present the fair values of OTC derivative assets and liabilities by tenor and bymajor product type. Tenor is based on expected duration for mortgage-related credit
derivatives and generally on remaining contractual maturity for other derivatives. Counterparty netting within the same product type and tenor category is included within
such product type and tenor category. Counterparty netting across product types within the same tenor category is included in “Counterparty and cash collateral netting.” Where the counterparty netting is across tenor categories, the netting is reflected in “Cross-Tenor Netting.”
| in millions | OTC Derivatives as of December 2011 | |||||||||||||||
Assets Product Type | 0 - 12 Months | 1 - 5 Years | 5 Years or Greater | Total | ||||||||||||
Interest rates | $ | 10,931 | $ | 32,194 | $ | 82,480 | $ | 125,605 | ||||||||
Credit | 3,054 | 15,468 | 13,687 | 32,209 | ||||||||||||
Currencies | 11,253 | 11,592 | 16,023 | 38,868 | ||||||||||||
Commodities | 5,286 | 5,931 | 147 | 11,364 | ||||||||||||
Equities | 6,663 | 7,768 | 7,468 | 21,899 | ||||||||||||
Netting across product types 1 | (3,071 | ) | (6,033 | ) | (6,027 | ) | (15,131 | ) | ||||||||
Subtotal | $ | 34,116 | $ | 66,920 | $ | 113,778 | 214,814 | |||||||||
Cross maturity netting 2 | (22,562 | ) | ||||||||||||||
Cash collateral netting 3 | (118,104 | ) | ||||||||||||||
Total | $ | 74,148 | ||||||||||||||
Liabilities Product Type | 0 - 12 Months | 1 - 5 Years | 5 Years or Greater | Total | ||||||||||||
Interest rates | $ | 5,787 | $ | 18,607 | $ | 37,739 | $ | 62,133 | ||||||||
Credit | 1,200 | 6,957 | 3,894 | 12,051 | ||||||||||||
Currencies | 9,826 | 5,514 | 6,502 | 21,842 | ||||||||||||
Commodities | 6,322 | 5,174 | 2,727 | 14,223 | ||||||||||||
Equities | 3,290 | 4,018 | 4,246 | 11,554 | ||||||||||||
Netting across product types 1 | (3,071 | ) | (6,033 | ) | (6,027 | ) | (15,131 | ) | ||||||||
Subtotal | $ | 23,354 | $ | 34,237 | $ | 49,081 | 106,672 | |||||||||
Cross maturity netting 2 | (22,562 | ) | ||||||||||||||
Cash collateral netting 3 | (28,829 | ) | ||||||||||||||
Total | $ | 55,281 | ||||||||||||||
|
|
|
| OTC Derivative Assets as of December 2014 | ||||||||||||||||||||||||
| $ in millions | | 0 - 12 Months | | | 1 - 5 Years | | | 5 Years or Greater | | | Cross-Tenor Netting | | | Cash Collateral Netting | | Total | ||||||||
Interest rates | $ 7,064 | $25,049 | $ 90,553 | $ — | $ — | $ 122,666 | ||||||||||||||||||
Credit | 1,696 | 6,093 | 5,707 | — | — | 13,496 | ||||||||||||||||||
Currencies | 17,835 | 9,897 | 6,386 | — | — | 34,118 | ||||||||||||||||||
Commodities | 8,298 | 4,068 | 161 | — | — | 12,527 | ||||||||||||||||||
Equities | 4,771 | 9,285 | 3,750 | — | — | 17,806 | ||||||||||||||||||
Counterparty and cash collateral netting | (4,479 | ) | (7,016 | ) | (4,058 | ) | (20,819 | ) | (103,504 | ) | (139,876 | ) | ||||||||||||
Total | $35,185 | $47,376 | $102,499 | $(20,819 | ) | $ (103,504 | ) | $ 60,737 | ||||||||||||||||
| OTC Derivative Liabilities as of December 2014 | ||||||||||||||||||||||||
| $ in millions | | 0 - 12 Months | | | 1 - 5 Years | | | 5 Years or Greater | | | Cross-Tenor Netting | | | Cash Collateral Netting | | Total | ||||||||
Interest rates | $ 7,001 | $17,649 | $ 37,242 | $ — | $ — | $ 61,892 | ||||||||||||||||||
Credit | 2,154 | 4,942 | 1,706 | — | — | 8,802 | ||||||||||||||||||
Currencies | 18,549 | 7,667 | 6,482 | — | — | 32,698 | ||||||||||||||||||
Commodities | 5,686 | 4,105 | 2,810 | — | — | 12,601 | ||||||||||||||||||
Equities | 7,064 | 6,845 | 3,571 | — | — | 17,480 | ||||||||||||||||||
Counterparty and cash collateral netting | (4,479 | ) | (7,016 | ) | (4,058 | ) | (20,819 | ) | (36,155 | ) | (72,527 | ) | ||||||||||||
Total | $35,975 | $34,192 | $ 47,753 | $(20,819 | ) | $ (36,155 | ) | $ 60,946 | ||||||||||||||||
| OTC Derivative Assets as of December 2013 | ||||||||||||||||||||||||
| $ in millions | | 0 - 12 Months | | | 1 - 5 Years | | | 5 Years or Greater | | | Cross-Tenor Netting | | | Cash Collateral Netting | | Total | ||||||||
Interest rates | $ 7,235 | $26,029 | $ 75,731 | $ — | $ — | $ 108,995 | ||||||||||||||||||
Credit | 1,233 | 8,410 | 5,787 | — | — | 15,430 | ||||||||||||||||||
Currencies | 9,499 | 8,478 | 7,361 | — | — | 25,338 | ||||||||||||||||||
Commodities | 2,843 | 4,040 | 143 | — | — | 7,026 | ||||||||||||||||||
Equities | 7,016 | 9,229 | 4,972 | — | — | 21,217 | ||||||||||||||||||
Counterparty and cash collateral netting | (2,559 | ) | (5,063 | ) | (3,395 | ) | (19,744 | ) | (93,643 | ) | (124,404 | ) | ||||||||||||
Total | $25,267 | $51,123 | $ 90,599 | $(19,744 | ) | $ (93,643 | ) | $ 53,602 | ||||||||||||||||
| OTC Derivative Liabilities as of December 2013 | ||||||||||||||||||||||||
| $ in millions | | 0 - 12 Months | | | 1 - 5 Years | | | 5 Years or Greater | | | Cross-Tenor Netting | | | Cash Collateral Netting | | Total | ||||||||
Interest rates | $ 5,019 | $16,910 | $ 21,903 | $ — | $ — | $ 43,832 | ||||||||||||||||||
Credit | 2,339 | 6,778 | 1,901 | — | — | 11,018 | ||||||||||||||||||
Currencies | 8,843 | 5,042 | 4,313 | — | — | 18,198 | ||||||||||||||||||
Commodities | 3,062 | 2,424 | 2,387 | — | — | 7,873 | ||||||||||||||||||
Equities | 6,325 | 6,964 | 4,068 | — | — | 17,357 | ||||||||||||||||||
Counterparty and cash collateral netting | (2,559 | ) | (5,063 | ) | (3,395 | ) | (19,744 | ) | (24,161 | ) | (54,922 | ) | ||||||||||||
Total | $23,029 | $33,055 | $ 31,177 | $(19,744 | ) | $ (24,161 | ) | $ 43,356 | ||||||||||||||||
| Goldman Sachs | 151 |
THE GOLDMAN SACHS GROUP, INC. AND SUBSIDIARIES
Notes to Consolidated Financial Statements
| in millions | OTC Derivatives as of December 2010 | |||||||||||||||
Assets
Product Type | 0 - 12 Months | 1 - 5 Years | 5 Years or Greater | Total | ||||||||||||
Interest rates | $ | 7,137 | $ | 34,384 | $ | 60,750 | $ | 102,271 | ||||||||
Credit | 2,777 | 16,145 | 13,525 | 32,447 | ||||||||||||
Currencies | 9,968 | 10,696 | 14,868 | 35,532 | ||||||||||||
Commodities | 5,664 | 5,996 | 248 | 11,908 | ||||||||||||
Equities | 4,795 | 10,942 | 7,037 | 22,774 | ||||||||||||
Netting across product types 1 | (2,937 | ) | (5,513 | ) | (5,077 | ) | (13,527 | ) | ||||||||
Subtotal | $ | 27,404 | $ | 72,650 | $ | 91,351 | $ | 191,405 | ||||||||
Cross maturity netting 2 | (15,396 | ) | ||||||||||||||
Cash collateral netting 3 | (110,317 | ) | ||||||||||||||
Total | $ | 65,692 | ||||||||||||||
Liabilities
Product Type | 0 - 12 Months | 1 - 5 Years | 5 Years or Greater | Total | ||||||||||||
Interest rates | $ | 4,470 | $ | 14,072 | $ | 19,760 | $ | 38,302 | ||||||||
Credit | 1,024 | 4,862 | 3,816 | 9,702 | ||||||||||||
Currencies | 8,036 | 5,219 | 4,986 | 18,241 | ||||||||||||
Commodities | 7,279 | 7,838 | 2,528 | 17,645 | ||||||||||||
Equities | 3,962 | 4,977 | 3,750 | 12,689 | ||||||||||||
Netting across product types 1 | (2,937 | ) | (5,513 | ) | (5,077 | ) | (13,527 | ) | ||||||||
Subtotal | $ | 21,834 | $ | 31,455 | $ | 29,763 | $ | 83,052 | ||||||||
Cross maturity netting 2 | (15,396 | ) | ||||||||||||||
Cash collateral netting 3 | (15,720 | ) | ||||||||||||||
Total | $ | 51,936 | ||||||||||||||
|
|
|
THE GOLDMAN SACHS GROUP, INC. AND SUBSIDIARIES
Notes to Consolidated Financial Statements
Derivatives with Credit-Related Contingent Features
Certain of the firm’s derivatives have been transacted under bilateral agreements with counterparties who may require the firm to post collateral or terminate the transactions based on changes in the firm’s credit ratings. The firm assesses the impact of these bilateral agreements by determining the collateral or termination payments that would occur assuming a downgrade by all rating agencies. A downgrade by any one rating agency, depending on the agency’s relative ratings of the firm at the time of the downgrade, may have an impact which is comparable to the impact of a downgrade by all rating agencies.
The table below presents the aggregate fair value of net derivative liabilities under such agreements (excluding application of collateral posted to reduce these liabilities), the related aggregate fair value of the assets posted as collateral, and the additional collateral or termination payments that could have been called at the reporting date by counterparties in the event of a one-notch and two-notch downgrade in the firm’s credit ratings.
| As of December | As of December | |||||||||||||||
| in millions | 2011 | 2010 | ||||||||||||||
| $ in millions | 2014 | 2013 | ||||||||||||||
Net derivative liabilities under bilateral agreements | $ | 35,066 | $ | 23,843 | $35,764 | $22,176 | ||||||||||
Collateral posted | 29,002 | 16,640 | 30,824 | 18,178 | ||||||||||||
Additional collateral or termination payments for a one-notch downgrade | 1,303 | 1,353 | 1,072 | 911 | ||||||||||||
Additional collateral or termination payments for a two-notch downgrade | 2,183 | 2,781 | 2,815 | 2,989 | ||||||||||||
Credit Derivatives
The firm enters into a broad array of credit derivatives in locations around the world to facilitate client transactions and to manage the credit risk associated with market-making and investing and lending activities. Credit derivatives are actively managed based on the firm’s net risk position.
Credit derivatives are individually negotiated contracts and can have various settlement and payment conventions. Credit events include failure to pay, bankruptcy, acceleration of indebtedness, restructuring, repudiation and dissolution of the reference entity.
Credit Default Swaps.Single-name credit default swaps protect the buyer against the loss of principal on one or more bonds, loans or mortgages (reference obligations) in the event the issuer (reference entity) of the reference obligations suffers a credit event. The buyer of protection pays an initial or periodic premium to the seller and receives protection for the period of the contract. If there is no credit event, as defined in the contract, the seller of protection makes no payments to the buyer of protection. However, if a credit event occurs, the seller of protection is required to make a payment to the buyer of protection, which is calculated in accordance with the terms of the contract.
Credit Indices, Baskets and Tranches.Credit derivatives may reference a basket of single-name credit default swaps or a broad-based index. If a credit event occurs in one of the underlying reference obligations, the protection seller pays the protection buyer. The payment is typically a pro-rata portion of the transaction’s total notional amount based on the underlying defaulted reference obligation. In certain transactions, the credit risk of a basket or index is separated into various portions (tranches), each having different levels of subordination. The most junior tranches cover initial defaults and once losses exceed the notional amount of these junior tranches, any excess loss is covered by the next most senior tranche in the capital structure.
Total Return Swaps. A total return swap transfers the risks relating to economic performance of a reference obligation from the protection buyer to the protection seller. Typically, the protection buyer receives from the protection seller a floating rate of interest and protection against any reduction in fair value of the reference obligation, and in return the protection seller receives the cash flows associated with the reference obligation, plus any increase in the fair value of the reference obligation.
| Goldman Sachs |
THE GOLDMAN SACHS GROUP, INC. AND SUBSIDIARIES
Notes to Consolidated Financial Statements
Credit Options.In a credit option, the option writer assumes the obligation to purchase or sell a reference obligation at a specified price or credit spread. The option purchaser buys the right, but does not assume the obligation, to sell the reference obligation to, or purchase it from, the option writer. The payments on credit options depend either on a particular credit spread or the price of the reference obligation.
The firm economically hedges its exposure to written credit derivatives primarily by entering into offsetting purchased credit derivatives with identical underlyings.underliers. Substantially all of the firm’s purchased credit derivative transactions are with financial institutions and are subject to stringent collateral thresholds. In addition, upon the occurrence of a specified trigger event, the firm may take possession of the reference obligations underlying a particular written credit derivative, and consequently may, upon liquidation of the reference obligations, recover amounts on the underlying reference obligations in the event of default.
As of December 2011,2014, written and purchased credit derivatives had total gross notional amounts of $1.96$1.22 trillion and $2.08$1.28 trillion, respectively, for total net notional purchased protection of $116.93$59.35 billion. As of December 2010,2013, written and purchased credit derivatives had total gross notional amounts of $2.05$1.43 trillion and $2.19$1.52 trillion, respectively, for total net notional purchased protection of $140.63$81.55 billion. Substantially all of the firm’s written and purchased credit derivatives are in the form of credit default swaps.
The table below presents certain information about credit derivatives. In the table below:
| Ÿ |
|
| Ÿ |
|
| Ÿ |
|
Maximum Payout/Notional Amount of Written Credit Derivatives by Tenor | Maximum Payout/Notional Amount of Purchased Credit Derivatives | Fair Value of Written Credit Derivatives | ||||||||||||||||||||||||||||||||||||||
| $ in millions | 0 - 12 Months | 1 - 5 Years | 5 Years or Greater | Total | Offsetting Purchased Credit Derivatives 1 | Other Purchased Credit Derivatives 2 | Asset | Liability | Net Asset/ (Liability) | |||||||||||||||||||||||||||||||
As of December 2011 | ||||||||||||||||||||||||||||||||||||||||
Credit spread on underlying (basis points) | ||||||||||||||||||||||||||||||||||||||||
0-250 | $ | 282,851 | $ | 794,193 | $ | 141,688 | $ | 1,218,732 | $ | 1,122,296 | $ | 180,316 | $ | 17,572 | $ | 16,907 | $ | 665 | ||||||||||||||||||||||
251-500 | 42,682 | 269,687 | 69,864 | 382,233 | 345,942 | 47,739 | 4,517 | 20,810 | (16,293 | ) | ||||||||||||||||||||||||||||||
501-1,000 | 29,377 | 140,389 | 21,819 | 191,585 | 181,003 | 23,176 | 138 | 15,398 | (15,260 | ) | ||||||||||||||||||||||||||||||
Greater than 1,000 | 30,244 | 114,103 | 22,995 | 167,342 | 147,614 | 28,734 | 512 | 57,201 | (56,689 | ) | ||||||||||||||||||||||||||||||
Total | $ | 385,154 | $ | 1,318,372 | $ | 256,366 | $ | 1,959,892 | $ | 1,796,855 | $ | 279,965 | $ | 22,739 | $ | 110,316 | $ | (87,577 | ) | |||||||||||||||||||||
As of December 2010 | ||||||||||||||||||||||||||||||||||||||||
Credit spread on underlying (basis points) | ||||||||||||||||||||||||||||||||||||||||
0-250 | $ | 235,798 | $ | 1,094,308 | $ | 288,851 | $ | 1,618,957 | $ | 1,511,113 | $ | 232,506 | $ | 32,071 | $ | 14,780 | $ | 17,291 | ||||||||||||||||||||||
251-500 | 14,412 | 144,448 | 52,072 | 210,932 | 183,613 | 36,713 | 7,368 | 7,739 | (371 | ) | ||||||||||||||||||||||||||||||
501-1,000 | 6,384 | 89,212 | 33,553 | 129,149 | 110,019 | 18,686 | 2,571 | 11,256 | (8,685 | ) | ||||||||||||||||||||||||||||||
Greater than 1,000 | 11,721 | 63,982 | 12,022 | 87,725 | 70,945 | 23,795 | 483 | 33,670 | (33,187 | ) | ||||||||||||||||||||||||||||||
Total | $ | 268,315 | $ | 1,391,950 | $ | 386,498 | $ | 2,046,763 | $ | 1,875,690 | $ | 311,700 | $ | 42,493 | $ | 67,445 | $ | (24,952 | ) | |||||||||||||||||||||
Maximum Payout/Notional Amount of Written Credit Derivatives by Tenor | Maximum Payout/Notional Credit Derivatives | Fair Value of Written Credit Derivatives | ||||||||||||||||||||||||||||||||||||||
| $ in millions | | 0 - 12 Months | |
| 1 - 5 Years |
| | 5 Years or Greater | | Total | | Offsetting Purchased Credit Derivatives | 1 | | Other Purchased Credit Derivatives | 2 | Asset | Liability | | Net Asset/ (Liability) | | |||||||||||||||||||
As of December 2014 | ||||||||||||||||||||||||||||||||||||||||
Credit spread on underlier (basis points) |
| |||||||||||||||||||||||||||||||||||||||
0 - 250 | $261,591 | $ 775,784 | $68,830 | $1,106,205 | $1,012,874 | $152,465 | $28,004 | $ 3,629 | $ 24,375 | |||||||||||||||||||||||||||||||
251 - 500 | 7,726 | 37,255 | 5,042 | 50,023 | 41,657 | 8,426 | 1,542 | 2,266 | (724 | ) | ||||||||||||||||||||||||||||||
501 - 1,000 | 8,449 | 18,046 | 1,309 | 27,804 | 26,240 | 1,949 | 112 | 1,909 | (1,797 | ) | ||||||||||||||||||||||||||||||
Greater than 1,000 | 8,728 | 26,834 | 1,279 | 36,841 | 33,112 | 3,499 | 82 | 13,943 | (13,861 | ) | ||||||||||||||||||||||||||||||
Total | $286,494 | $ 857,919 | $76,460 | $1,220,873 | $1,113,883 | $166,339 | $29,740 | $21,747 | $ 7,993 | |||||||||||||||||||||||||||||||
As of December 2013 | ||||||||||||||||||||||||||||||||||||||||
Credit spread on underlier (basis points) | ||||||||||||||||||||||||||||||||||||||||
0 - 250 | $286,029 | $ 950,126 | $79,241 | $1,315,396 | $1,208,334 | $183,665 | $ 32,508 | $ 4,396 | $ 28,112 | |||||||||||||||||||||||||||||||
251 - 500 | 7,148 | 42,570 | 10,086 | 59,804 | 44,642 | 16,884 | 2,837 | 1,147 | 1,690 | |||||||||||||||||||||||||||||||
501 - 1,000 | 3,968 | 18,637 | 1,854 | 24,459 | 22,748 | 2,992 | 101 | 1,762 | (1,661 | ) | ||||||||||||||||||||||||||||||
Greater than 1,000 | 5,600 | 27,911 | 1,226 | 34,737 | 30,510 | 6,169 | 514 | 12,436 | (11,922 | ) | ||||||||||||||||||||||||||||||
Total | $302,745 | $1,039,244 | $92,407 | $1,434,396 | $1,306,234 | $209,710 | $ 35,960 | $19,741 | $ 16,219 | |||||||||||||||||||||||||||||||
| 1. | Offsetting purchased credit derivatives represent the notional amount of purchased credit derivatives |
| 2. | This purchased protection represents the notional amount of all other purchased credit derivatives |
| Goldman Sachs |
THE GOLDMAN SACHS GROUP, INC. AND SUBSIDIARIES
Notes to Consolidated Financial Statements
Hedge Accounting
The firm applies hedge accounting for (i) certain interest rate swaps used to manage the interest rate exposure of certain fixed-rate unsecured long-term and short-term borrowings and certain fixed-rate certificates of deposit, and (ii) certain foreign currency forward contracts and foreign currency-denominated debt used to manage foreign currency exposures on the firm’s net investment in certain non-U.S. operations.operations and (iii) certain commodities-related swap and forward contracts used to manage the exposure to the variability in cash flows associated with the forecasted sales of certain energy commodities by one of the firm’s consolidated investments.
To qualify for hedge accounting, the derivative hedge must be highly effective at reducing the risk from the exposure being hedged. Additionally, the firm must formally document the hedging relationship at inception and test the hedging relationship at least on a quarterly basis to ensure the derivative hedge continues to be highly effective over the life of the hedging relationship.
Interest RateFair Value Hedges
The firm designates certain interest rate swaps as fair value hedges. These interest rate swaps hedge changes in fair value attributable to the relevantdesignated benchmark interest rate (e.g., London Interbank Offered Rate (LIBOR)) or OIS), effectively converting a substantial portion of fixed-rate obligations into floating-rate obligations.
The firm applies the “long-haul method” ina statistical method that utilizes regression analysis when assessing the effectiveness of its fair value hedging relationships in achieving offsetting changes in the fair values of the hedging instrument and the risk being hedged (i.e., interest rate risk).
During the three months ended March 2010, the firm changed its method of prospectively and retrospectively assessing the effectiveness of all of its fair value hedging relationships from a dollar-offset method, which is a non-statistical method, to regression analysis, which is a statistical method.
An interest rate swap is considered highly effective in offsetting changes in fair value attributable to changes in the hedged risk when the regression analysis results in a coefficient of determination of 80% or greater and a slope between 80% and 125%.
The dollar-offset method compared the change in the fair value of the hedging instrument to the change in the fair value of the hedged item, excluding the effect of the passage of time. The prospective dollar-offset assessment used scenario analyses to test hedge effectiveness through simulations of numerous parallel and slope shifts of the relevant yield curve. Parallel shifts changed the interest rate of all maturities by identical amounts. Slope shifts changed the curvature of the yield curve. For both the prospective assessment, in response to each of the simulated yield curve shifts, and the retrospective assessment, a hedging relationship was considered effective if the fair value of the hedging instrument and the hedged item changed inversely within a range of 80% to 125%.
For qualifying fair value hedges, gains or losses on derivatives are included in “Interest expense.” The change in fair value of the hedged item attributable to the risk being hedged is reported as an adjustment to its carrying value and is subsequently amortized into interest expense over its remaining life. Gains or losses resulting from hedge ineffectiveness are included in “Interest expense.” When a derivative is no longer designated as a hedge, any remaining difference between the carrying value and par value of the hedged item is amortized to interest expense over the remaining life of the hedged item using the effective interest method. See Note 23 for further information about interest income and interest expense.
ForThe table below presents the years ended December 2011, December 2010 and December 2009, the gain/(loss) recognized ongains/(losses) from interest rate derivatives accounted for as hedges, was $4.68 billion, $1.62 billion and $(10.07) billion, respectively, and the related gain/(loss) recognized on the hedged borrowings and bank deposits, was $(6.30) billion, $(3.45) billion and $9.95 billion, respectively. Thethe hedge ineffectiveness recognized on these derivatives, for the years ended December 2011 and December 2010 was a losswhich primarily consists of $1.62 billion and $1.84 billion, respectively, and was not material for the year ended December 2009. These losses consisted primarily of the amortization of prepaid credit spreads. The gain/(loss) excludedspreads resulting from the assessmentpassage of hedge effectiveness was not material for the years ended December 2011 and December 2010, and was a loss of $1.23 billion for the year ended December 2009.time.
| Year Ended December | ||||||||||||
| $ in millions | 2014 | 2013 | 2012 | |||||||||
Interest rate hedges | $ 1,936 | $(8,683 | ) | $(2,383 | ) | |||||||
Hedged borrowings and bank deposits | (2,451 | ) | 6,999 | 665 | ||||||||
Hedge ineffectiveness | $ (515 | ) | $(1,684 | ) | $(1,718 | ) | ||||||
| Goldman Sachs |
THE GOLDMAN SACHS GROUP, INC. AND SUBSIDIARIES
Notes to Consolidated Financial Statements
Net Investment Hedges
The firm seeks to reduce the impact of fluctuations in foreign exchange rates on its net investment in certain non-U.S. operations through the use of foreign currency forward contracts and foreign currency-denominated debt. For foreign currency forward contracts designated as hedges, the effectiveness of the hedge is assessed based on the overall changes in the fair value of the forward contracts (i.e., based on changes in forward rates). For foreign currency-denominated debt designated as a hedge, the effectiveness of the hedge is assessed based on changes in spot rates.
For qualifying net investment hedges, the gains or losses on the hedging instruments, to the extent effective, are included in “Currency translation” within the consolidated statements of comprehensive income.
The table below presents the gains/(losses) from net investment hedging. The gains/(losses) below are included in “Currency translation adjustment, net of tax.”
| Year Ended December | ||||||||||||
| in millions | 2011 | 2010 | 2009 | |||||||||
Currency hedges | $ | 160 | $ | (261 | ) | $ | (495 | ) | ||||
Foreign currency-denominated debt | (147 | ) | (498 | ) | 106 | |||||||
| Year Ended December | ||||||||||||
| $ in millions | 2014 | 2013 | 2012 | |||||||||
Foreign currency forward contract hedges | $576 | $150 | $(233 | ) | ||||||||
Foreign currency-denominated debt hedges | 202 | 470 | 347 | |||||||||
The gain/(loss) related to ineffectiveness was not material forand the years ended December 2011, December 2010 and December 2009. The lossgain/(loss) reclassified to earnings from accumulated other comprehensive income was $186 million for the year ended December 2011 and wasincome/(loss) were not material for the years ended December 2010 and December 2009.2014, 2013 or 2012.
As of December 20112014 and December 2010,2013, the firm had designated $3.11$1.36 billion and $3.88$1.97 billion, respectively, of foreign currency-denominated debt, included in “Unsecured long-term borrowings” and “Unsecured short-term borrowings,” as hedges of net investments in non-U.S. subsidiaries.
Fair Value OptionCash Flow Hedges
Beginning in 2013, the firm designated certain commodities-related swap and forward contracts as cash flow hedges. These swap and forward contracts hedged the firm’s exposure to the variability in cash flows associated with the forecasted sales of certain energy commodities by one of the firm’s consolidated investments. During the fourth quarter of 2014, the firm de-designated these swaps and forward contracts as cash flow hedges as it became probable that the hedged forecasted sales would not occur.
Prior to de-designation, the firm applied a statistical method that utilized regression analysis when assessing hedge effectiveness. A cash flow hedge was considered highly effective in offsetting changes in forecasted cash flows attributable to the hedged risk when the regression analysis resulted in a coefficient of determination of 80% or greater and a slope between 80% and 125%.
For qualifying cash flow hedges, the gains or losses on derivatives, to the extent effective, were included in “Cash flow hedges” within the consolidated statements of comprehensive income. Such gains or losses were reclassified to “Other principal transactions” within the consolidated statements of earnings when it became probable that the hedged forecasted sales would not occur. Gains or losses resulting from hedge ineffectiveness were included in “Other principal transactions.”
The effective portion of the gains recognized on these cash flow hedges, gains reclassified to earnings from accumulated other comprehensive income and gains related to hedge ineffectiveness were not material for 2014 and 2013. There were no gains/(losses) excluded from the assessment of hedge effectiveness for 2014 and 2013.
| Goldman Sachs 2014 Form 10-K | 155 |
THE GOLDMAN SACHS GROUP, INC. AND SUBSIDIARIES
Notes to Consolidated Financial Statements
Fair Value Option
Other Financial Assets and Financial Liabilities at Fair Value |
In addition to all cash and derivative instruments included in “Financial instruments owned, at fair value” and “Financial instruments sold, but not yet purchased, at fair value,” the firm has elected to accountaccounts for certain of its other financial assets and financial liabilities at fair value primarily under the fair value option.
The primary reasons for electing the fair value option are to:
| Ÿ |
|
| Ÿ |
|
| Ÿ |
|
Hybrid financial instruments are instruments that contain bifurcatable embedded derivatives and do not require settlement by physical delivery of non-financial assets (e.g., physical commodities). If the firm elects to bifurcate the embedded derivative from the associated debt, the derivative is accounted for at fair value and the host contract is accounted for at amortized cost, adjusted for the effective portion of any fair value hedges. If the firm does not elect to bifurcate, the entire hybrid financial instrument is accounted for at fair value under the fair value option.
Other financial assets and financial liabilities accounted for at fair value under the fair value option include:
| Ÿ |
|
| Ÿ |
|
THE GOLDMAN SACHS GROUP, INC. AND SUBSIDIARIES
Notes to Consolidated Financial Statements
| Ÿ |
|
| Ÿ |
|
| Ÿ |
|
| Ÿ |
|
| Ÿ |
|
|
|
| Ÿ | Certain subordinated liabilities issued by consolidated VIEs. |
These financial assets and financial liabilities at fair value are generally valued based on discounted cash flow techniques, which incorporate inputs with reasonable levels of price transparency, and are generally classified as level 2 because the inputs are observable. Valuation adjustments may be made for liquidity and for counterparty and the firm’s credit quality.
Significant
| 156 | Goldman Sachs 2014 Form 10-K |
THE GOLDMAN SACHS GROUP, INC. AND SUBSIDIARIES
Notes to Consolidated Financial Statements
See below for information about the significant inputs forused to value other financial assets and financial liabilities at fair value, including the ranges of significant unobservable inputs used to value the level 3 instruments within these categories. These ranges represent the significant unobservable inputs that were used in the valuation of each categorytype of other financial assets and financial liabilities at fair value. The ranges and weighted averages of these inputs are not representative of the appropriate inputs to use when calculating the fair value are as follows:of any one instrument. For example, the highest yield presented below for resale and repurchase agreements is appropriate for valuing a specific agreement in that category but may not be appropriate for valuing any other agreements in that category. Accordingly, the ranges of inputs presented below do not represent uncertainty in, or possible ranges of, fair value measurements of the firm’s level 3 other financial assets and financial liabilities.
Resale and Repurchase Agreements and Securities Borrowed and Loaned.The significant inputs to the valuation of resale and repurchase agreements and securities borrowed and loaned are funding spreads, the amount and timing of expected future cash flows and interest ratesrates. As of both December 2014 and collateral funding spreads.December 2013, there were no level 3 securities borrowed or securities loaned. As of December 2014, the firm’s level 3 resale and repurchase agreements were not material. The range of significant unobservable inputs used to value level 3 resale and repurchase agreements as of December 2013 was 1.3% to 3.9% (weighted average: 1.4%) for yield, and 0.2 years to 2.7 years (weighted average: 2.5 years) for duration. Generally, increases in yield or duration, in isolation, would result in a lower fair value measurement. Due to the distinctive nature of each of the firm’s level 3 resale and repurchase agreements, the interrelationship of inputs is not necessarily uniform across such agreements. See Note 910 for further information.information about collateralized agreements and financings.
Other Secured Financings. The significant inputs to the valuation of other secured financings at fair value are the amount and timing of expected future cash flows, interest rates, funding spreads, the fair value of the collateral delivered by the firm (which is determined using the amount and timing of expected future cash flows, market prices, market yields and recovery assumptions), and the frequency of additional collateral calls andcalls. The ranges of significant unobservable inputs used to value level 3 other secured financings are as follows:
As of December 2014:
| Ÿ | Funding spreads: 210 bps to 325 bps (weighted average: 278 bps) |
| Ÿ | Yield: 1.1% to 10.0% (weighted average: 3.1%) |
| Ÿ | Duration: 0.7 to 3.8 years (weighted average: 2.6 years) |
As of December 2013:
| Ÿ | Funding spreads: 40 bps to 250 bps (weighted average: 162 bps) |
| Ÿ | Yield: 0.9% to 14.3% (weighted average: 5.0%) |
| Ÿ | Duration: 0.8 to 16.1 years (weighted average: 3.7 years) |
Generally, increases in funding spreads, yield or duration, in isolation, would result in a lower fair value measurement. Due to the credit spreadsdistinctive nature of each of the firm.firm’s level 3 other secured financings, the interrelationship of inputs is not necessarily uniform across such financings. See Note 910 for further information.information about collateralized agreements and financings.
| Goldman Sachs 2014 Form 10-K | 157 |
THE GOLDMAN SACHS GROUP, INC. AND SUBSIDIARIES
Notes to Consolidated Financial Statements
Unsecured Short-term and Long-term Borrowings.The significant inputs to the valuation of unsecured short-term and long-term borrowings at fair value are the amount and timing of expected future cash flows, interest rates, the credit spreads of the firm, as well as commodity prices in the case of prepaid commodity transactions and, for certaintransactions. The inputs used to value the embedded derivative component of hybrid financial instruments equity prices, inflation rates and index levels.are consistent with the inputs used to value the firm’s other derivative instruments. See Note 7 for further information about derivatives. See Notes 15 and 16 for further information.information about unsecured short-term and long-term borrowings, respectively.
Certain of the firm’s unsecured short-term and long-term instruments are included in level 3, substantially all of which are hybrid financial instruments. As the significant unobservable inputs used to value hybrid financial instruments primarily relate to the embedded derivative component of these borrowings, these inputs are incorporated in the firm’s derivative disclosures related to unobservable inputs in Note 7.
Receivables from Customers and Counterparties. Receivables from customers and counterparties at fair value are primarily comprised of transfers of assets accounted for as secured loans rather than purchases. The significant inputs to the valuation of certainsuch receivables are commodity prices, interest rates, the amount and timing of expected future cash flows and funding spreads. As of December 2014, the firm’s level 3 receivables from customers and counterparties were not material. The range of significant unobservable inputs used to value level 3 secured loans as of December 2013 was 40 bps to 477 bps (weighted average: 142 bps) for funding spreads. Generally, an increase in funding spreads would result in a lower fair value measurement.
Deposits. The significant inputs to the valuation of time deposits are commodity prices, interest rates and the amount and timing of expected future cash flows. The inputs used to value the embedded derivative component of hybrid financial instruments are consistent with the inputs used to value the firm’s other derivative instruments. See Note 7 for further information about derivatives. See Note 14 for further information about deposits.
Insurance and Reinsurance Contracts.Insurance and reinsurance contracts at fair valueThe firm’s deposits that are included in “Receivables from customers and counterparties” and “Other liabilities and accrued expenses.” The insurance and reinsurance contracts for which the firm has elected the fair value optionlevel 3 are contracts that can be settled only in cash and that qualify for the fair value option because they are recognizedhybrid financial instruments. These contracts are valued using market transactions and other market evidence where possible, including market-based inputs to models, calibration to market-clearing transactions or other alternative pricing sources with reasonable levels of price transparency. Significant level 2 inputs typically include interest rates and inflation risk. Significant level 3 inputs typically include mortality or funding benefit assumptions. WhenAs the significant unobservable inputs used to a valuation model are significantvalue hybrid financial instruments primarily relate to the fair value measurementembedded derivative component of an instrument,these deposits, these inputs are incorporated in the instrument is classifiedfirm’s derivative disclosures related to unobservable inputs in level 3.
Deposits.The significant inputs to the valuation of deposits are interest rates.Note 7.
| Goldman Sachs |
THE GOLDMAN SACHS GROUP, INC. AND SUBSIDIARIES
Notes to Consolidated Financial Statements
Fair Value of Other Financial Assets and Financial
Liabilities by Level
Fair Value of Other Financial Assets and Financial Liabilities by Level |
The tables below present, by level within the fair value hierarchy, other financial assets and financial liabilities
accounted for at fair value primarily under the fair value option.
| Other Financial Assets at Fair Value as of December 2011 | Other Financial Assets at Fair Value as of December 2014 | |||||||||||||||||||||||||||||||
| in millions | Level 1 | Level 2 | Level 3 | Total | ||||||||||||||||||||||||||||
| $ in millions | Level 1 | Level 2 | Level 3 | Total | ||||||||||||||||||||||||||||
Securities segregated for regulatory and other purposes 1 | $ | 21,263 | $ | 20,751 | $ | — | $ | 42,014 | $21,168 | $ 13,123 | $ — | $ 34,291 | ||||||||||||||||||||
Securities purchased under agreements to resell | — | 187,232 | 557 | 187,789 | — | 126,036 | — | 126,036 | ||||||||||||||||||||||||
Securities borrowed | — | 47,621 | — | 47,621 | — | 66,769 | — | 66,769 | ||||||||||||||||||||||||
Receivables from customers and counterparties | — | 8,887 | 795 | 9,682 | — | 6,888 | 56 | 6,944 | ||||||||||||||||||||||||
Total | $ | 21,263 | $ | 264,491 | $ | 1,352 | $ | 287,106 | $21,168 | $212,816 | $ 56 | $234,040 | ||||||||||||||||||||
| Other Financial Liabilities at Fair Value as of December 2011 | Other Financial Liabilities at Fair Value as of December 2014 | |||||||||||||||||||||||||||||||
| in millions | Level 1 | Level 2 | Level 3 | Total | ||||||||||||||||||||||||||||
| $ in millions | Level 1 | Level 2 | Level 3 | Total | ||||||||||||||||||||||||||||
Deposits | $ | — | $ | 4,513 | $ | 13 | $ | 4,526 | $ — | $ 12,458 | $1,065 | $ 13,523 | ||||||||||||||||||||
Securities sold under agreements to repurchase | — | 162,321 | 2,181 | 164,502 | — | 88,091 | 124 | 88,215 | ||||||||||||||||||||||||
Securities loaned | — | 107 | — | 107 | — | 765 | — | 765 | ||||||||||||||||||||||||
Other secured financings | — | 28,267 | 1,752 | 30,019 | — | 20,359 | 1,091 | 21,450 | ||||||||||||||||||||||||
Unsecured short-term borrowings | — | 14,560 | 3,294 | 17,854 | — | 15,114 | 3,712 | 18,826 | ||||||||||||||||||||||||
Unsecured long-term borrowings | — | 14,971 | 2,191 | 17,162 | — | 13,420 | 2,585 | 16,005 | ||||||||||||||||||||||||
Other liabilities and accrued expenses | — | 490 | 8,996 | 9,486 | — | 116 | 715 | 831 | ||||||||||||||||||||||||
Total | $ | — | $ | 225,229 | $ | 18,427 | $ | 243,656 | $ — | $150,323 | $9,292 | $159,615 | ||||||||||||||||||||
| Other Financial Assets at Fair Value as of December 2013 | ||||||||||||||||||||||||||||||||
| $ in millions | Level 1 | Level 2 | Level 3 | Total | ||||||||||||||||||||||||||||
Securities segregated for regulatory and other purposes 1 | $19,502 | $ 12,435 | $ — | $ 31,937 | ||||||||||||||||||||||||||||
Securities purchased under agreements to resell | — | 161,234 | 63 | 161,297 | ||||||||||||||||||||||||||||
Securities borrowed | — | 60,384 | — | 60,384 | ||||||||||||||||||||||||||||
Receivables from customers and counterparties | — | 7,181 | 235 | 7,416 | ||||||||||||||||||||||||||||
Other assets | — | 18 | — | 18 | ||||||||||||||||||||||||||||
Total | $19,502 | $241,252 | $ 298 | $261,052 | ||||||||||||||||||||||||||||
| Other Financial Liabilities at Fair Value as of December 2013 | ||||||||||||||||||||||||||||||||
| $ in millions | Level 1 | Level 2 | Level 3 | Total | ||||||||||||||||||||||||||||
Deposits | $ — | $ 6,870 | $ 385 | $ 7,255 | ||||||||||||||||||||||||||||
Securities sold under agreements to repurchase | — | 163,772 | 1,010 | 164,782 | ||||||||||||||||||||||||||||
Securities loaned | — | 973 | — | 973 | ||||||||||||||||||||||||||||
Other secured financings | — | 22,572 | 1,019 | 23,591 | ||||||||||||||||||||||||||||
Unsecured short-term borrowings | — | 15,680 | 3,387 | 19,067 | ||||||||||||||||||||||||||||
Unsecured long-term borrowings | — | 9,854 | 1,837 | 11,691 | ||||||||||||||||||||||||||||
Other liabilities and accrued expenses | — | 362 | 26 | 388 | ||||||||||||||||||||||||||||
Total | $ — | $220,083 | $7,664 | $227,747 | ||||||||||||||||||||||||||||
| 1. | Includes securities segregated for regulatory and other purposes accounted for at fair value under the fair value option, which consists of securities borrowed and resale agreements. |
THE GOLDMAN SACHS GROUP, INC. AND SUBSIDIARIES
Notes to Consolidated Financial StatementsTransfers Between Levels of the Fair Value Hierarchy
Transfers between levels of the fair value hierarchy are reported at the beginning of the reporting period in which they occur. There were no transfers of other financial assets and financial liabilities between level 1 and level 2 during 2014 or 2013. The tables below present information about transfers between level 2 and level 3.
Other Financial Assets at Fair Value as of December 2010 | ||||||||||||
| in millions | Level 1 | Level 2 | Level 3 | Total | ||||||||
Securities segregated for regulatory and other purposes 1 | $19,794 | $ 16,388 | $ — | $ 36,182 | ||||||||
Securities purchased under agreements to resell | — | 188,255 | 100 | 188,355 | ||||||||
Securities borrowed | — | 48,822 | — | 48,822 | ||||||||
Receivables from customers and counterparties | — | 6,904 | 298 | 7,202 | ||||||||
Total | $19,794 | $260,369 | $398 | $280,561 | ||||||||
Other Financial Liabilities at Fair Value as of December 2010 | ||||||||||||
| in millions | Level 1 | Level 2 | Level 3 | Total | ||||||||
Deposits | $— | $ 1,975 | $ — | $ 1,975 | ||||||||
Securities sold under agreements to repurchase | — | 160,285 | 2,060 | 162,345 | ||||||||
Securities loaned | — | 1,514 | — | 1,514 | ||||||||
Other secured financings | — | 23,445 | 8,349 | 31,794 | ||||||||
Unsecured short-term borrowings | — | 18,640 | 3,476 | 22,116 | ||||||||
Unsecured long-term borrowings | — | 16,067 | 2,104 | 18,171 | ||||||||
Other liabilities and accrued expenses | — | 563 | 2,409 | 2,972 | ||||||||
Total | $— | $222,489 | $18,398 | $240,887 | ||||||||
|
THE GOLDMAN SACHS GROUP, INC. AND SUBSIDIARIES
Notes to Consolidated Financial Statements
Level 3 Rollforward
If a financial asset or financial liability was transferred to level 3 during a reporting period,year, its entire gain or loss for the periodyear is included in level 3. Transfers between levels are recognized at the beginning of the reporting period in which they occur.
| Goldman Sachs 2014 Form 10-K | 159 |
THE GOLDMAN SACHS GROUP, INC. AND SUBSIDIARIES
Notes to Consolidated Financial Statements
The tables below present changes in fair value for other financial assets and financial liabilities accounted for at fair value under the fair value option categorized as level 3 as of the end of the year.
Level 3 other financial assets and liabilities are frequently economically hedged with cash instruments and derivatives. Accordingly, gains or losses that are reported in level 3 can
be partially offset by gains or losses attributable to level 1, 2 or 3 cash instruments or derivatives. As a result, gains or losses included in the level 3 rollforward below do not necessarily represent the overall impact on the firm’s results of operations, liquidity or capital resources.
Level 3 Other Financial Assets at Fair Value for the Year Ended December 2011 | ||||||||||||||||||||||||
| in millions | Balance, beginning of year | Net realized gains/ (losses) | Net unrealized year-end | Purchases | Sales | Settlements | Net level 3 | Balance, end of year | ||||||||||||||||
Securities purchased under agreements to resell | $100 | $ 2 | $— | $ 620 | $— | $(165) | $— | $ 557 | ||||||||||||||||
Receivables from customers and counterparties | 298 | — | 54 | 468 | — | (25) | — | 795 | ||||||||||||||||
Total | $398 | $ 2 | $54 | $1,088 | $— | $(190) | $— | $1,352 | ||||||||||||||||
Level 3 Other Financial Liabilities at Fair Value for the Year Ended December 2011 | |||||||||||||||||||||||||||
| in millions | Balance, beginning of year | Net realized (gains)/ losses | Net unrealized year-end | Purchases | Sales | Issuances | Settlements | Net level 3 | Balance, year | ||||||||||||||||||
Deposits | $ — | $ — | $ — | $ — | $— | $ 13 | $ — | $ — | $ 13 | ||||||||||||||||||
Securities sold under agreements to repurchase, at fair value | 2,060 | — | — | — | — | 299 | (178) | — | 2,181 | ||||||||||||||||||
Other secured financings | 8,349 | 8 | 3 | — | — | 483 | (4,062) | (3,029) | 1,752 | ||||||||||||||||||
Unsecured short-term borrowings | 3,476 | (15) | (340) | (5) | — | 815 | (1,080) | 443 | 3,294 | ||||||||||||||||||
Unsecured long-term borrowings | 2,104 | 25 | 5 | — | — | 441 | (193) | (191) | 2,191 | ||||||||||||||||||
Other liabilities and accrued expenses | 2,409 | — | 1,095 | 5,840 | — | — | (348) | — | 8,996 | ||||||||||||||||||
Total | $18,398 | $ 18 | $ 763 | $5,835 | $— | $2,051 | $(5,861) | $(2,777) | $18,427 | ||||||||||||||||||
| Level 3 Other Financial Assets at Fair Value for the Year Ended December 2014 | ||||||||||||||||||||||||||||||||||||||||
| $ in millions | | Balance, beginning of year | | | Net realized gains/ (losses) | | | Net unrealized gains/(losses) relating to instruments still held at year-end | | Purchases | Sales | Issuances | Settlements | | Transfers into level 3 | | | Transfers out of level 3 | | | Balance, end of year | | ||||||||||||||||||
Securities purchased under agreements to resell | $ 63 | $ — | $ — | $ — | $ — | $ — | $ (63 | ) | $ — | $ — | $ — | |||||||||||||||||||||||||||||
Receivables from customers and counterparties | 235 | 3 | 2 | 29 | — | — | (33 | ) | — | (180 | ) | 56 | ||||||||||||||||||||||||||||
Total | $ 298 | $ 3 | 1 | $ 2 | 1 | $29 | $ — | $ — | $ (96 | ) | $ — | $ (180 | ) | $ 56 | ||||||||||||||||||||||||||
| 1. | ||||
Included in “Market making.” |
THE GOLDMAN SACHS GROUP, INC. AND SUBSIDIARIES
| Level 3 Other Financial Liabilities at Fair Value for the Year Ended December 2014 | ||||||||||||||||||||||||||||||||||||||||
| $ in millions | | Balance, beginning of year | | | Net realized (gains)/ losses | | | Net unrealized (gains)/losses relating to instruments still held at year-end | | Purchases | Sales | Issuances | Settlements | | Transfers into level 3 | | | Transfers out of level 3 | | | Balance, end of year | | ||||||||||||||||||
Deposits | $ 385 | $ — | $ 21 | $(5) | $ — | $ 442 | $ (6 | ) | $ 280 | $ (52) | $1,065 | |||||||||||||||||||||||||||||
Securities sold under agreements to repurchase | 1,010 | — | — | — | — | — | (886 | ) | — | — | 124 | |||||||||||||||||||||||||||||
Other secured financings | 1,019 | 31 | (27 | ) | 20 | — | 402 | (521 | ) | 364 | (197 | ) | 1,091 | |||||||||||||||||||||||||||
Unsecured short-term borrowings | 3,387 | 11 | 251 | 5 | — | 2,246 | (1,828 | ) | 981 | (1,341 | ) | 3,712 | ||||||||||||||||||||||||||||
Unsecured long-term borrowings | 1,837 | 46 | (56 | ) | (3) | — | 1,221 | (446 | ) | 1,344 | (1,358 | ) | 2,585 | |||||||||||||||||||||||||||
Other liabilities and accrued expenses | 26 | 5 | 434 | — | 19 | — | (20 | ) | 301 | (50 | ) | 715 | ||||||||||||||||||||||||||||
Total | $7,664 | $93 | 1 | $ 623 | 1 | $17 | $19 | $4,311 | $(3,707 | ) | $3,270 | $(2,998 | ) | $9,292 | ||||||||||||||||||||||||||
Notes to Consolidated Financial Statements
| 1. | The aggregate amounts include (gains)/losses of approximately $(150) million, $833 million and $33 million reported in “Market making,” “Other principal transactions” and “Interest expense,” respectively. |
The net unrealized loss on level 3 other financial assets and liabilities at fair value of $709$621 million for the year ended December 2011 primarily consisted(reflecting $2 million of gains on other financial assets and $623 million of losses on other financial liabilities) for 2014 primarily reflected losses on certain subordinated liabilities included in other liabilities and accrued expenses, primarily attributableprincipally due to changes in the impactmarket value of a changethe related underlying investments, and certain hybrid financial instruments included in interest rates on certain insurance liabilities. These losses were partially offset by gains on unsecured short-term borrowings, primarily reflecting gains on certain equity-linked notes, principally due to a declinean increase in global equity markets.prices.
Significant transfers in orTransfers out of level 3 of other financial assets during 2014 primarily reflected transfers of certain secured loans included in receivables from customers and counterparties to level 2, principally due to unobservable inputs not being significant to the year ended December 2011 included:net risk of the portfolio.
Transfers into level 3 of other financial liabilities during 2014 primarily reflected transfers of certain hybrid financial instruments included in unsecured long-term and short-term borrowings from level 2, principally due to unobservable inputs being significant to the valuation of these instruments, and transfers from level 3 unsecured long-term borrowings to level 3 unsecured short-term borrowings, as these borrowings neared maturity.
|
|
| Level 3 Other Financial Assets at Fair Value for the Year Ended December 2010 | ||||||||||||||||||||||||
| in millions | Balance, beginning of year | Net realized gains/ (losses) | Net unrealized year-end | Net purchases, sales and settlements | Net transfers in and/or (out) of level 3 | Balance, year | ||||||||||||||||||
Securities purchased under agreements to resell | $ — | $ 3 | $ — | $ 97 | $ — | $ 100 | ||||||||||||||||||
Receivables from customers and counterparties | — | 22 | (58 | ) | — | 334 | 298 | |||||||||||||||||
Total | $ — | $ 25 | $ (58 | ) | $ 97 | $ 334 | $ 398 | |||||||||||||||||
| Level 3 Other Financial Liabilities at Fair Value for the Year Ended December 2010 | ||||||||||||||||||||||||
| in millions | Balance, beginning of year | Net realized (gains)/ losses | Net unrealized year-end | Net purchases, sales, issuances and settlements | Net transfers in and/or (out) of level 3 | Balance, year | ||||||||||||||||||
Securities sold under agreements to repurchase, at fair value | $ 394 | $ — | $ — | $1,666 | $ — | $ 2,060 | ||||||||||||||||||
Other secured financings | 6,756 | (1 | ) | 25 | 1,605 | (36 | ) | 8,349 | ||||||||||||||||
Unsecured short-term borrowings | 2,310 | 91 | 35 | (300 | ) | 1,340 | 3,476 | |||||||||||||||||
Unsecured long-term borrowings | 3,077 | 23 | 41 | 216 | (1,253 | ) | 2,104 | |||||||||||||||||
Other liabilities and accrued expenses | 1,913 | 10 | 54 | (155 | ) | 587 | 2,409 | |||||||||||||||||
Total | $14,450 | $123 | $155 | $3,032 | $ 638 | $18,398 | ||||||||||||||||||
Significant transfers in orTransfers out of level 3 of other financial liabilities during the year ended December 2010, which were2014 primarily reflected transfers of certain hybrid financial instruments included in unsecured long-term and short-term borrowings to level 2, principally due to the consolidationincreased transparency of certain VIEs upon adoptioncorrelation and volatility inputs used to value these instruments, transfers of ASU No. 2009-17certain other hybrid financial instruments included in unsecured short-term borrowings to level 2, principally due to certain unobservable inputs not being significant to the valuation of these hybrid financial instruments, and transfers to level 3 unsecured short-term borrowings from level 3 unsecured long-term borrowings, as of January 1, 2010, included:these borrowings neared maturity.
|
|
|
| Goldman Sachs |
THE GOLDMAN SACHS GROUP, INC. AND SUBSIDIARIES
Notes to Consolidated Financial Statements
| Level 3 Other Financial Assets at Fair Value for the Year Ended December 2013 | ||||||||||||||||||||||||||||||||||||||||
| $ in millions | | Balance, beginning of year | | | Net realized gains/ (losses) | | | Net unrealized gains/(losses) relating to instruments still held at year-end | | Purchases | Sales | Issuances | Settlements | | Transfers into level 3 | | | Transfers out of level 3 | | | Balance, end of year | | ||||||||||||||||||
Securities purchased under agreements to resell | $ 278 | $ 4 | $ — | $ — | $ — | $ — | $ (16 | ) | $ — | $ (203 | ) | $ 63 | ||||||||||||||||||||||||||||
Receivables from customers and counterparties | 641 | 1 | 14 | 54 | (474 | ) | — | (1 | ) | — | — | 235 | ||||||||||||||||||||||||||||
Other assets | 507 | — | — | — | (507 | ) | — | — | — | — | — | |||||||||||||||||||||||||||||
Total | $ 1,426 | $ 5 | 1 | $ 14 | 1 | $54 | $ (981 | ) | $ — | $ (17 | ) | $ — | $ (203 | ) | $ 298 | |||||||||||||||||||||||||
| 1. | The aggregate amounts include gains of approximately $14 million, $1 million and $4 million reported in “Market making,” “Other principal transactions” and “Interest income,” respectively. |
| Level 3 Other Financial Liabilities at Fair Value for the Year Ended December 2013 | ||||||||||||||||||||||||||||||||||||||||
| $ in millions | | Balance, beginning of year | | | Net realized (gains)/ losses | | | Net unrealized (gains)/losses relating to instruments still held at year-end | | Purchases | Sales | Issuances | Settlements | | Transfers into level 3 | | | Transfers out of level 3 | | | Balance, end of year | | ||||||||||||||||||
Deposits | $ 359 | $ — | $ (6 | ) | $ — | $ — | $ 109 | $ (6 | ) | $ — | $ (71) | $ 385 | ||||||||||||||||||||||||||||
Securities sold under agreements to repurchase | 1,927 | — | — | — | — | — | (917 | ) | — | — | 1,010 | |||||||||||||||||||||||||||||
Other secured financings | 1,412 | 10 | 2 | — | — | 708 | (894 | ) | 126 | (345 | ) | 1,019 | ||||||||||||||||||||||||||||
Unsecured short-term borrowings | 2,584 | 1 | 239 | — | — | 1,624 | (1,502 | ) | 714 | (273 | ) | 3,387 | ||||||||||||||||||||||||||||
Unsecured long-term borrowings | 1,917 | 22 | 43 | (3 | ) | — | 470 | (558 | ) | 671 | (725 | ) | 1,837 | |||||||||||||||||||||||||||
Other liabilities and accrued expenses | 11,274 | (29 | ) | (2 | ) | — | (10,288 | ) | — | (426 | ) | — | (503 | ) | 26 | |||||||||||||||||||||||||
Total | $19,473 | $ 4 | 1 | $276 | 1 | $ (3 | ) | $(10,288 | ) | $2,911 | $(4,303 | ) | $1,511 | $(1,917 | ) | $7,664 | ||||||||||||||||||||||||
| 1. | The aggregate amounts include losses of approximately $184 million, $88 million and $8 million reported in “Market making,” “Other principal transactions” and “Interest expense,” respectively. |
The net unrealized loss on level 3 other financial assets and liabilities of $262 million (reflecting $14 million of gains on other financial assets and $276 million of losses on other financial liabilities) for 2013 primarily reflected losses on certain hybrid financial instruments included in unsecured short-term borrowings, principally due to an increase in global equity prices.
Sales of other liabilities and accrued expenses during 2013 primarily reflected the sale of a majority stake in the firm’s European insurance business.
Transfers out of level 3 of other financial assets during 2013 primarily reflected transfers of certain resale agreements to level 2, principally due to increased price transparency as a result of market transactions in similar instruments.
Transfers into level 3 of other financial liabilities during 2013 primarily reflected transfers of certain hybrid financial instruments included in unsecured short-term and long-term borrowings from level 2, principally due to decreased transparency of certain correlation and volatility inputs used to value these instruments.
Transfers out of level 3 of other financial liabilities during 2013 primarily reflected transfers of certain hybrid financial instruments included in unsecured short-term and long-term borrowings to level 2, principally due to increased transparency of certain correlation and volatility inputs used to value these instruments, and transfers of subordinated liabilities included in other liabilities and accrued expenses to level 2, principally due to increased price transparency as a result of market transactions in the related underlying investments.
| Goldman Sachs 2014 Form 10-K | 161 |
THE GOLDMAN SACHS GROUP, INC. AND SUBSIDIARIES
Notes to Consolidated Financial Statements
Gains and Losses on Other Financial Assets and
Financial Liabilities Accounted for at Fair Value Under the Fair Value Option
The “Fair Value Option” columns in the table below presentpresents the gains and losses recognized as a result of the firm electing to apply the fair value option to certain financial assets and financial liabilities. These gains and losses are included in “Market making” and “Other principal transactions.” The table below also includes gains and losses on the embedded derivative component of hybrid financial instruments included in unsecured short-term borrowings, unsecured long-term borrowings and deposits. These gains and losses would have been recognized under other U.S. GAAP even if the firm had not elected to account for the entire hybrid financial instrument at fair value.
The amounts in the table exclude contractual interest, which is included in “Interest income” and “Interest expense,” for all instruments other than hybrid financial instruments. See Note 23 for further information about interest income and interest expense. The table also excludes gains and losses related to financial instruments owned, at fair value and financial instruments sold, but not yet purchased, at fair value.
Included in the “Other” columns in the table below are:
| Gains/(Losses) on Financial Assets and Financial Liabilities at Fair Value Under the Fair Value Option | ||||||||||||
| Year Ended December | ||||||||||||
| $ in millions | 2014 | 2013 | 2012 | |||||||||
Unsecured short-term | $(1,180 | ) | $(1,145 | ) | $ (973 | ) | ||||||
Unsecured long-term | (592 | ) | 683 | (1,523 | ) | |||||||
Other liabilities and | (441 | ) | (167 | ) | (1,486 | ) | ||||||
Other 4 | (366 | ) | (443 | ) | (81 | ) | ||||||
Total | $(2,579 | ) | $(1,072 | ) | $(4,063 | ) | ||||||
| 1. |
|
|
|
|
| Gains/(Losses) on Other Financial Assets and Financial Liabilities at Fair Value | ||||||||||||||||||||||||||||
| Year Ended December | ||||||||||||||||||||||||||||
| 2011 | 2010 | 2009 | ||||||||||||||||||||||||||
| in millions | Fair Value | Other | Fair Value Option | Other | Fair Value | Other | ||||||||||||||||||||||
Receivables from customers and counterparties 1 | $ (11 | ) | $ 442 | $(106 | ) | $ 558 | $ 255 | $ — | ||||||||||||||||||||
Other secured financings | 123 | (1,199 | ) | (35 | ) | (996 | ) | (822 | ) | 48 | ||||||||||||||||||
Unsecured short-term borrowings | 144 | 2,005 | 33 | (1,488 | ) | (182 | ) | (3,150 | ) | |||||||||||||||||||
Unsecured long-term borrowings | 535 | 1,801 | 152 | (1,321 | ) | (884 | ) | (4,150 | ) | |||||||||||||||||||
Other liabilities and accrued expenses 2 | (994 | ) | 83 | (88 | ) | 138 | (214 | ) | — | |||||||||||||||||||
Other 3 | 90 | — | (10 | ) | — | 79 | — | |||||||||||||||||||||
Total | $(113 | ) | $ 3,132 | $ (54 | ) | $(3,109 | ) | $(1,768 | ) | $(7,252 | ) | |||||||||||||||||
|
| 2. |
|
| 3. | Includes gains/(losses) on certain subordinated liabilities issued by consolidated VIEs. Gains/(losses) for 2013 and 2012 also includes gains on certain insurance contracts. |
Primarily consists of gains/(losses) on |
Excluding the gains and losses on the instruments accounted for under the fair value option described above, “Market making” and “Other principal transactions”
primarily representsrepresent gains and losses on “Financial instruments owned, at fair value” and “Financial instruments sold, but not yet purchased, at fair value.”
THE GOLDMAN SACHS GROUP, INC. AND SUBSIDIARIES
Notes to Consolidated Financial Statements
Loans and Lending Commitments
The table below presents the difference between the aggregate fair value and the aggregate contractual principal amount for loans and long-term receivables for which the fair value option was elected.
| As of December | ||||||||||
| in millions | 2011 | 2010 | ||||||||
Aggregate contractual principal amount | $ | 3,826 | $ | 3,090 | ||||||
Aggregate contractual principal amount | 23,034 | 26,653 | ||||||||
Total 1 | $ | 26,860 | $ | 29,743 | ||||||
Aggregate fair value of loans on nonaccrual status and/or more than 90 days past due | $ | 3,174 | $ | 3,994 | ||||||
| As of December | ||||||||
| $ in millions | 2014 | 2013 | ||||||
Performing loans and long-term receivables | ||||||||
Aggregate contractual principal in excess of the related fair value | $1,699 | $3,106 | ||||||
Loans on nonaccrual status and/or more than 90 days past due 1 | ||||||||
Aggregate contractual principal in excess of the related fair value (excluding loans carried at zero fair value and considered uncollectible) | 13,106 | 11,041 | ||||||
Aggregate fair value of loans on nonaccrual status and/or more than 90 days past due | 3,333 | 2,781 | ||||||
| 1. | The aggregate contractual principal amount of these loans exceeds the related fair value primarily because the firm regularly purchases loans, such as distressed loans, at values significantly below contractual principal amounts. |
As of December 20112014 and December 2010,2013, the fair value of unfunded lending commitments for which the fair value option was elected was a liability of $2.82 billion$402 million and $1.26$1.22 billion, respectively, and the related total contractual amount of these lending commitments was $66.12$26.19 billion and $51.20$51.54 billion, respectively. See Note 18 for further information about lending commitments.
| 162 | Goldman Sachs 2014 Form 10-K |
THE GOLDMAN SACHS GROUP, INC. AND SUBSIDIARIES
Long-termNotes to Consolidated Financial Statements
Long-Term Debt Instruments
The aggregate contractual principal amount of long-term debt instruments (principal and non-principal protected)other secured financings for which the fair value option was elected exceeded the related fair value by $932$203 million and $701$154 million as of December 20112014 and December 2010,2013, respectively. Of these amounts, $693The aggregate contractual principal amount of unsecured long-term borrowings for which the fair value option was elected exceeded the related fair value by $163 million and $349$92 million as of December 20112014 and December 2010, respectively, related to unsecured2013, respectively. The amounts above include both principal and non-principal-protected long-term borrowings and the remainder related to long-term other secured financings.borrowings.
Impact of Credit Spreads on Loans and Lending Commitments
The estimated net gain/(loss)gain attributable to changes in instrument-specific credit spreads on loans and lending commitments for which the fair value option was elected was $(805) million, $1.85 billion and $1.65$1.83 billion for the years ended December 2011, December 20102014, $2.69 billion for 2013 and December 2009,$3.07 billion for 2012, respectively. Changes in the fair value of loans and lending commitments are primarily attributable to changes in instrument-specific credit spreads. Substantially all of the firm’s performing loans and lending commitments are floating-rate.
Impact of Credit Spreads on Borrowings
The table below presents the net gains/(losses) attributable to the impact of changes in the firm’s own credit spreads on borrowings for which the fair value option was elected. The firm calculates the fair value of borrowings by discounting future cash flows at a rate which incorporates the firm’s credit spreads.
| Year Ended December | ||||||||||||
| $ in millions | 2014 | 2013 | 2012 | |||||||||
Net gains/(losses) including hedges | $144 | $(296 | ) | $(714 | ) | |||||||
Net gains/(losses) excluding hedges | 142 | (317 | ) | (800 | ) | |||||||
Loans Receivable
Loans receivable is comprised of loans held for investment that are accounted for at amortized cost net of allowance for loan losses. Interest on such loans is recognized over the life of the loan and is recorded on an accrual basis. The table below presents details about loans receivable.
| Year Ended December | |||||||||||||||
| in millions | 2011 | 2010 | 2009 | ||||||||||||
Net gains/(losses) including hedges | $ | 596 | $ | 198 | $ | (1,103 | ) | ||||||||
Net gains/(losses) excluding hedges | 714 | 199 | (1,116 | ) | |||||||||||
| As of December | ||||||||
| $ in millions | 2014 | 2013 | ||||||
Corporate loans | $15,044 | $ 7,667 | ||||||
Loans to private wealth management clients | 11,289 | 6,558 | ||||||
Loans backed by commercial real estate | 1,705 | 809 | ||||||
Other loans | 1,128 | — | ||||||
Subtotal | 29,166 | 15,034 | ||||||
Allowance for loan losses | (228 | ) | (139 | ) | ||||
Total loans receivable | $28,938 | $14,895 | ||||||
As of December 2014 and December 2013, the fair value of “Loans receivable” was $28.90 billion and $14.91 billion, respectively. As of December 2014, had these loans been carried at fair value and included in the fair value hierarchy, $13.75 billion and $15.15 billion would have been classified in level 2 and level 3, respectively. As of December 2013, had these loans been carried at fair value and included in the fair value hierarchy, $6.16 billion and $8.75 billion would have been classified in level 2 and level 3, respectively.
The firm also extends lending commitments that are held for investment and accounted for on an accrual basis. As of December 2014 and December 2013, such lending commitments were $66.22 billion and $35.66 billion, respectively, substantially all of which were extended to corporate borrowers. The carrying value and the estimated fair value of such lending commitments were liabilities of $199 million and $1.86 billion, respectively, as of December 2014, and $132 million and $1.02 billion, respectively, as of December 2013. Had these commitments been included in the firm’s fair value hierarchy, they would have primarily been classified in level 3 as of both December 2014 and December 2013.
| Goldman Sachs | 163 |
THE GOLDMAN SACHS GROUP, INC. AND SUBSIDIARIES
Notes to Consolidated Financial Statements
Below is a description of the captions in the table above.
| Ÿ | Corporate Loans. Corporate loans include term loans, revolving lines of credit, letter of credit facilities and bridge loans, and are principally used for operating liquidity and general corporate purposes, or in connection with acquisitions. Corporate loans may be secured or unsecured, depending on the loan purpose, the risk profile of the borrower and other factors. The majority of these loans have maturities between one year and five years and carry a floating interest rate. |
| Ÿ | Loans to Private Wealth Management Clients. Loans to the firm’s private wealth management clients include loans used by clients to finance private asset purchases, employ leverage for strategic investments in real or financial assets, bridge cash flow timing gaps or provide liquidity for other needs. Such loans are primarily secured by securities or other assets. The majority of these loans are demand or short-term loans and carry a floating interest rate. |
| Ÿ | Loans Backed by Commercial Real Estate. Loans backed by commercial real estate include loans collateralized by hotels, retail stores, multifamily housing complexes and commercial and industrial properties. The majority of these loans have maturities between one year and five years and carry a floating interest rate. |
| Ÿ | Other Loans. Other loans primarily include loans secured by consumer loans, residential real estate and other assets. The majority of these loans have maturities between one year and five years and carry a floating interest rate. |
Credit Quality
The firm’s risk assessment process includes evaluating the credit quality of its loans receivable. The firm performs credit reviews which include initial and ongoing analyses of its borrowers. A credit review is an independent analysis of the capacity and willingness of a borrower to meet its financial obligations, resulting in an internal credit rating. The determination of internal credit ratings also incorporates assumptions with respect to the nature of and outlook for the borrower’s industry, and the economic environment. The firm also assigns a regulatory risk rating to such loans based on the definitions provided by the U.S. federal bank regulatory agencies.
As of December 2014 and December 2013, loans receivable were primarily extended to non-investment-grade borrowers and lending commitments held for investment and accounted for on an accrual basis were primarily extended to investment-grade borrowers. Substantially all of these loans and lending commitments align with the U.S. federal bank regulatory agencies’ definition of Pass. Loans and lending commitments meet the definition of Pass when they are performing and/or do not demonstrate adverse characteristics that are likely to result in a credit loss.
Impaired Loans and Loans on Non-Accrual Status
A loan is determined to be impaired when it is probable that the firm will not be able to collect all principal and interest due under the contractual terms of the loan. At that time, loans are placed on non-accrual status and all accrued but uncollected interest is reversed against interest income and interest subsequently collected is recognized on a cash basis to the extent the loan balance is deemed collectible. Otherwise all cash received is used to reduce the outstanding loan balance. As of December 2014 and December 2013, impaired loans receivable in non-accrual status were not material.
Allowance for Losses on Loans and Lending Commitments
The firm’s allowance for loan losses is comprised of two components: specific loan level reserves and a collective, portfolio level reserve. Specific loan level reserves are determined on loans that exhibit credit quality weakness and are therefore individually evaluated for impairment. Portfolio level reserves are determined on the remaining loans, not deemed impaired, by aggregating groups of loans with similar risk characteristics and estimating the probable loss inherent in the portfolio. As of December 2014 and December 2013, substantially all of the firm’s loans receivable were evaluated for impairment at the portfolio level.
| 164 | Goldman Sachs 2014 Form 10-K |
THE GOLDMAN SACHS GROUP, INC. AND SUBSIDIARIES
Notes to Consolidated Financial Statements
The allowance for loan losses is determined using various inputs, including industry default and Financingsloss data, current macroeconomic indicators, borrower’s capacity to meet its financial obligations, borrower’s country of risk, loan seniority, and collateral type. Management’s estimate of loan losses entails judgment about loan collectability based on available information at the reporting dates, and there are uncertainties inherent in those judgments. While management uses the best information available to determine this estimate, future adjustments to the allowance may be necessary based on, among other things, changes in the economic environment or variances between actual results and the original assumptions used. Loans are charged off against the allowance for loan losses when they are deemed to be uncollectible.
The firm also records an allowance for losses on lending commitments that are held for investment and accounted for on an accrual basis. Such allowance is determined using the same methodology as the allowance for loan losses, while also taking into consideration the probability of drawdowns or funding and is included in “Other liabilities and accrued expenses” in the consolidated statements of financial condition. As of December 2014 and December 2013, substantially all of such lending commitments were evaluated for impairment at the portfolio level.
The tables below present the changes in allowance for loan losses, and allowance for losses on lending commitments for the years ended December 2014 and December 2013.
$ in millions
Allowance for loan losses | Year Ended December | |||||||
| 2014 | 2013 | |||||||
Balance, beginning of year | $139 | $ 24 | ||||||
Charge-offs | (3 | ) | — | |||||
Provision for loan losses | 92 | 115 | ||||||
Balance, end of year | $228 | $139 | ||||||
$ in millions
Allowance for losses on lending commitments | Year Ended December | |||||||
| 2014 | 2013 | |||||||
Balance, beginning of year | $ 57 | $ 28 | ||||||
Provision for losses on lending commitments | 29 | 29 | ||||||
Balance, end of year | $ 86 | $ 57 | ||||||
The provision for losses on loans and lending commitments is included in “Other principal transactions” in the consolidated statements of earnings. As of December 2014 and December 2013, substantially all of the allowance for loan losses and allowance for losses on lending commitments were related to corporate loans and corporate lending commitments. Substantially all of these allowances were determined at the portfolio level.
Collateralized Agreements and Financings
Collateralized agreements are securities purchased under agreements to resell (resale agreements or reverse repurchase agreements) and securities borrowed. Collateralized financings are securities sold under agreements to repurchase (repurchase agreements), securities loaned and other secured financings. The firm enters into these transactions in order to, among other things, facilitate client activities, invest excess cash, acquire securities to cover short positions and finance certain firm activities.
Collateralized agreements and financings are presented on a net-by-counterparty basis when a legal right of setoff exists. Interest on collateralized agreements and collateralized financings is recognized over the life of the transaction and included in “Interest income” and “Interest expense,” respectively. See Note 23 for further information about interest income and interest expense.
The table below presents the carrying value of resale and repurchase agreements and securities borrowed and loaned transactions.
| As of December | ||||||||
| in millions | 2011 | 2010 | ||||||
Securities purchased under agreements | $ | 187,789 | $ | 188,355 | ||||
Securities borrowed 2 | 153,341 | 166,306 | ||||||
Securities sold under agreements | 164,502 | 162,345 | ||||||
Securities loaned 2 | �� | 7,182 | 11,212 | |||||
| As of December | ||||||||
| $ in millions | 2014 | 2013 | ||||||
Securities purchased under agreements to resell 1 | $127,938 | $161,732 | ||||||
Securities borrowed 2 | 160,722 | 164,566 | ||||||
Securities sold under agreements to repurchase 1 | 88,215 | 164,782 | ||||||
Securities loaned 2 | 5,570 | 18,745 | ||||||
| 1. |
|
| 2. | As of December |
| Goldman Sachs 2014 Form 10-K | 165 |
THE GOLDMAN SACHS GROUP, INC. AND SUBSIDIARIES
Notes to Consolidated Financial Statements
Resale and Repurchase Agreements
A resale agreement is a transaction in which the firm purchases financial instruments from a seller, typically in exchange for cash, and simultaneously enters into an agreement to resell the same or substantially the same financial instruments to the seller at a stated price plus accrued interest at a future date.
A repurchase agreement is a transaction in which the firm sells financial instruments to a buyer, typically in exchange for cash, and simultaneously enters into an agreement to repurchase the same or substantially the same financial instruments from the buyer at a stated price plus accrued interest at a future date.
The financial instruments purchased or sold in resale and repurchase agreements typically include U.S. government and federal agency, and investment-grade sovereign obligations.
The firm receives financial instruments purchased under resale agreements, makes delivery of financial instruments sold under repurchase agreements, monitors the market value of these financial instruments on a daily basis, and delivers or obtains additional collateral due to changes in the market value of the financial instruments, as appropriate. For resale agreements, the firm typically requires delivery of collateral with a fair value approximately equal to the carrying value of the relevant assets in the consolidated statements of financial condition.
Even though repurchase and resale agreements involve the legal transfer of ownership of financial instruments, they are accounted for as financing arrangements because they require the financial instruments to be repurchased or resold at the maturity of the agreement. However, “repos to maturity”“repos-to-maturity” are accounted for as sales. A repo to maturityrepo-to-maturity is a transaction in which the firm transfers a security under an agreement to repurchase the security where the maturity date of the repurchase agreement matches the maturity date of the underlying security. Therefore, the firm effectively no longer has a repurchase obligation and has relinquished control over the underlying security and, accordingly, accounts for the transaction as a sale. See Note 3 for information about changes to the accounting for repos-to-maturity which became effective in January 2015. The firm had no repos to maturityrepos-to-maturity outstanding as of December 2011 or2014 and December 2010.2013.
THE GOLDMAN SACHS GROUP, INC. AND SUBSIDIARIES
Notes to Consolidated Financial Statements
Securities Borrowed and Loaned Transactions
In a securities borrowed transaction, the firm borrows securities from a counterparty in exchange for cash.cash or securities. When the firm returns the securities, the counterparty returns the cash.cash or securities. Interest is generally paid periodically over the life of the transaction.
In a securities loaned transaction, the firm lends securities to a counterparty typically in exchange for cash or securities, or a letter of credit.securities. When the counterparty returns the securities, the firm returns the cash or securities posted as collateral. Interest is generally paid periodically over the life of the transaction.
The firm receives securities borrowed, makes delivery of securities loaned, monitors the market value of these securities on a daily basis, and delivers or obtains additional collateral due to changes in the market value of the securities, as appropriate. For securities borrowed transactions, the firm typically requires delivery of collateral with a fair value approximately equal to the carrying value of the securities borrowed transaction.
Securities borrowed and loaned within Fixed Income, Currency and Commodities Client Execution are recorded at fair value under the fair value option. See Note 8 for further information about securities borrowed and loaned accounted for at fair value.
Securities borrowed and loaned within Securities Services are recorded based on the amount of cash collateral advanced or received plus accrued interest. As these arrangements generally can be terminated on demand, they exhibit little, if any, sensitivity to changes in interest rates.
As Therefore, the carrying value of such arrangements approximates fair value. While these arrangements are carried at amounts that approximate fair value, they are not accounted for at fair value under the fair value option or at fair value in accordance with other U.S. GAAP and therefore are not included in the firm’s fair value hierarchy in Notes 6 through 8. Had these arrangements been included in the firm’s fair value hierarchy, they would have been classified in level 2 as of December 20112014 and December 2010,2013.
| 166 | Goldman Sachs 2014 Form 10-K |
THE GOLDMAN SACHS GROUP, INC. AND SUBSIDIARIES
Notes to Consolidated Financial Statements
Offsetting Arrangements
The tables below present the firm had $20.22 billiongross and $12.86 billion, respectively, of securities received undernet resale and repurchase agreements and securities borrowed and loaned transactions, that were segregated to satisfy certain regulatory requirements. These securities areand the related amount of netting with the same counterparty under enforceable netting agreements (i.e., counterparty netting) included in “Cashthe consolidated statements of financial condition. Substantially all of the gross carrying values of these arrangements are subject to enforceable netting agreements. The tables below also present the amounts not offset in the consolidated statements of financial condition including counterparty netting that does not meet the criteria for netting under U.S. GAAP and the fair value of cash or securities collateral received or posted subject to enforceable credit support agreements. Where the firm has received or posted collateral under credit support agreements, but has not yet determined such agreements are enforceable, the related collateral has not been netted in the tables below.
| As of December 2014 | ||||||||||||||||||
| Assets | Liabilities | |||||||||||||||||
| $ in millions | | Resale agreements | | | Securities borrowed | | | Repurchase agreements | | | Securities loaned | | ||||||
Amounts included in the consolidated statements of financial condition | ||||||||||||||||||
Gross carrying value | $ 160,644 | $ 171,384 | $ 114,879 | $ 9,150 | ||||||||||||||
Counterparty netting | (26,664 | ) | (3,580 | ) | (26,664 | ) | (3,580 | ) | ||||||||||
Total | 133,980 | 1 | 167,804 | 1 | 88,215 | 5,570 | ||||||||||||
Amounts not offset in the consolidated statements of financial condition | ||||||||||||||||||
Counterparty netting | (3,834 | ) | (641 | ) | (3,834 | ) | (641 | ) | ||||||||||
Collateral | (124,528 | ) | (154,058 | ) | (78,457 | ) | (4,882 | ) | ||||||||||
Total | $ 5,618 | $ 13,105 | $ 5,924 | $ 47 | ||||||||||||||
| As of December 2013 | ||||||||||||||||||
| Assets | Liabilities | |||||||||||||||||
| $ in millions | | Resale agreements | | | Securities borrowed | | | Repurchase agreements | | | Securities loaned | | ||||||
Amounts included in the consolidated statements of financial condition | ||||||||||||||||||
Gross carrying value | $ 190,536 | $ 172,283 | $ 183,913 | $ 23,700 | ||||||||||||||
Counterparty netting | (19,131 | ) | (4,955 | ) | (19,131 | ) | (4,955 | ) | ||||||||||
Total | 171,405 | 1 | 167,328 | 1 | 164,782 | 18,745 | ||||||||||||
Amounts not offset in the consolidated statements of financial condition | ||||||||||||||||||
Counterparty netting | (10,725 | ) | (2,224 | ) | (10,725 | ) | (2,224 | ) | ||||||||||
Collateral | (152,914 | ) | (147,223 | ) | (141,300 | ) | (16,278 | ) | ||||||||||
Total | $ 7,766 | $ 17,881 | $ 12,757 | $ 243 | ||||||||||||||
| 1. | As of December 2014 and December 2013, the firm had $6.04 billion and $9.67 billion, respectively, of securities received under resale agreements, and $7.08 billion and $2.77 billion, respectively, of securities borrowed transactions that were segregated to satisfy certain regulatory requirements. These securities are included in “Cash and securities segregated for regulatory and other purposes.” |
Other Secured Financings
In addition to repurchase agreements and securities lending transactions, the firm funds certain assets through the use of other secured financings and pledges financial instruments and other assets as collateral in these transactions. These other secured financings consist of:
| Ÿ |
|
| Ÿ |
|
|
| Ÿ |
|
Other secured financings include arrangements that are nonrecourse. As of December 20112014 and December 2010,2013, nonrecourse other secured financings were $3.14$1.94 billion and $8.42$1.54 billion, respectively.
The firm has elected to apply the fair value option to the followingsubstantially all other secured financings because the use of fair value eliminates non-economic volatility in earnings that would arise from using different measurement attributes:
|
|
|
attributes. See Note 8 for further information about other secured financings that are accounted for at fair value.
Other secured financings that are not recorded at fair value are recorded based on the amount of cash received plus accrued interest, which generally approximates fair value. While these financings are carried at amounts that approximate fair value, they are not accounted for at fair value under the fair value option or at fair value in accordance with other U.S. GAAP and therefore are not included in the firm’s fair value hierarchy in Notes 6 through 8. Had these financings been included in the firm’s fair value hierarchy, they would have primarily been classified in level 2 as of December 2014 and December 2013.
| Goldman Sachs | 167 |
THE GOLDMAN SACHS GROUP, INC. AND SUBSIDIARIES
Notes to Consolidated Financial Statements
The tabletables below presentspresent information about other secured financings.
| As of December 2014 | ||||||||||||
| $ in millions | | U.S. Dollar | | | Non-U.S. Dollar | | Total | |||||
Other secured financings(short-term): | ||||||||||||
At fair value | $ 7,887 | $ 7,668 | $15,555 | |||||||||
At amortized cost | 5 | — | 5 | |||||||||
Weighted average interest rates | 4.33% | —% | ||||||||||
Other secured financings(long-term): | ||||||||||||
At fair value | 3,290 | 2,605 | 5,895 | |||||||||
At amortized cost | 580 | 774 | 1,354 | |||||||||
Weighted average interest rates | 2.69% | 2.31% | ||||||||||
Total 1 | $11,762 | $11,047 | $22,809 | |||||||||
Amount of other secured financings collateralized by: | ||||||||||||
Financial instruments 2 | $11,460 | $10,483 | $21,943 | |||||||||
Other assets | 302 | 564 | 866 | |||||||||
| As of December 2013 | ||||||||||||
| $ in millions | | U.S. Dollar | | | Non-U.S. Dollar | | Total | |||||
Other secured financings(short-term): | ||||||||||||
At fair value | $ 9,374 | $ 7,828 | $17,202 | |||||||||
At amortized cost | 88 | — | 88 | |||||||||
Weighted average interest rates | 2.86% | —% | ||||||||||
Other secured financings(long-term): | ||||||||||||
At fair value | 3,711 | 2,678 | 6,389 | |||||||||
At amortized cost | 372 | 763 | 1,135 | |||||||||
Weighted average interest rates | 3.78% | 1.53% | ||||||||||
Total 1 | $13,545 | $11,269 | $24,814 | |||||||||
Amount of other secured financings collateralized by: | ||||||||||||
Financial instruments 2 | $13,366 | $10,880 | $24,246 | |||||||||
Other assets | 179 | 389 | 568 | |||||||||
| 1. | Includes $974 million and $1.54 billion related to transfers of financial assets accounted for as financings rather than sales as of December 2014 and December 2013, respectively. Such financings were collateralized by financial assets included in “Financial instruments owned, at fair value” of $995 million and $1.58 billion as of December 2014 and December 2013, respectively. |
| 2. | Includes $10.24 billion and $14.75 billion of other secured financings collateralized by financial instruments owned, at fair value as of December 2014 and December 2013, respectively, and includes $11.70 billion and $9.50 billion of other secured financings collateralized by financial instruments received as collateral and repledged as of December 2014 and December 2013, respectively. |
In the table below:tables above:
| Ÿ |
|
| Ÿ |
|
| Ÿ |
|
| As of December 2011 | As of December 2010 | |||||||||||||||||||||||||
| $ in millions | U.S. Dollar | Non-U.S. Dollar | Total | U.S. Dollar | Non-U.S. Dollar | Total | ||||||||||||||||||||
Other secured financings (short-term): At fair value | $ | 18,519 | $ | 5,140 | $ | 23,659 | $ | 16,404 | $ | 3,684 | $ | 20,088 | ||||||||||||||
At amortized cost | 155 | 5,371 | 5,526 | 99 | 4,342 | 4,441 | ||||||||||||||||||||
Interest rates 1 | 3.85 | % | 0.22 | % | 2.96 | % | 0.71 | % | ||||||||||||||||||
Other secured financings (long-term): At fair value | 4,305 | 2,055 | 6,360 | 9,594 | 2,112 | 11,706 | ||||||||||||||||||||
At amortized cost | 1,024 | 795 | 1,819 | 1,565 | 577 | 2,142 | ||||||||||||||||||||
Interest rates 1 | 1.88 | % | 3.28 | % | 2.14 | % | 1.94 | % | ||||||||||||||||||
Total 2 | $ | 24,003 | $ | 13,361 | $ | 37,364 | $ | 27,662 | $ | 10,715 | $ | 38,377 | ||||||||||||||
Amount of other secured financings collateralized by: Financial instruments 3 | $ | 23,703 | $ | 12,169 | $ | 35,872 | $ | 27,014 | $ | 8,760 | $ | 35,774 | ||||||||||||||
Other assets 4 | 300 | 1,192 | 1,492 | 648 | 1,955 | 2,603 | ||||||||||||||||||||
|
|
|
|
The table below presents other secured financings by maturity.
| $ in millions | | As of December 2014 | | |
Other secured financings (short-term) | $15,560 | |||
Other secured financings (long-term): | ||||
2016 | 3,304 | |||
2017 | 1,800 | |||
2018 | 938 | |||
2019 | 465 | |||
2020-thereafter | 742 | |||
Total other secured financings (long-term) | 7,249 | |||
Total other secured financings | $22,809 | |||
| in millions | As of December 2011 | |||
Other secured financings (short-term) | $29,185 | |||
Other secured financings (long-term): 2013 | 1,852 | |||
2014 | 3,627 | |||
2015 | 583 | |||
2016 | 437 | |||
2017-thereafter | 1,680 | |||
Total other secured financings (long-term) | 8,179 | |||
Total other secured financings | $37,364 | |||
| 168 | Goldman Sachs 2014 Form 10-K |
THE GOLDMAN SACHS GROUP, INC. AND SUBSIDIARIES
Notes to Consolidated Financial Statements
The aggregate contractual principal amount of other secured financings (long-term) for which the fair value option was elected exceeded the related fair value by $239 million and $352 million as of December 2011 and December 2010, respectively.
Collateral Received and Pledged
The firm receives financial instrumentscash and securities (e.g., U.S. government and federal agency, other sovereign and corporate obligations, as well as equities and convertible debentures) as collateral, primarily in connection with resale agreements, securities borrowed, derivative transactions and customer margin loans.
THE GOLDMAN SACHS GROUP, INC. AND SUBSIDIARIES
Notes The firm obtains cash and securities as collateral on an upfront or contingent basis for derivative instruments and collateralized agreements to Consolidated Financial Statementsreduce its credit exposure to individual counterparties.
In many cases, the firm is permitted to deliver or repledge these financial instruments received as collateral when entering into repurchase agreements and securities lending agreements, primarily in connection with secured client financing activities. The firm is also permitted to deliver or repledge these financial instruments in connection with other secured financings, collateralizing derivative transactions and meeting firm or customer settlement requirements.
The table below presents financial instruments at fair value received as collateral that were available to be delivered or repledged and were delivered or repledged by the firm.
| As of December | ||||||||
| in millions | 2011 | 2010 | ||||||
Collateral available to be delivered | $ | 622,926 | $ | 618,423 | ||||
Collateral that was delivered or repledged | 454,604 | 447,882 | ||||||
The firm also pledges certain financial instruments owned, at fair value in connection with repurchase agreements, securities lending agreements and other secured financings, and other assets (primarily real estate and cash) in connection with other secured financings to counterparties who may or may not have the right to deliver or repledge them.
The table below presents financial instruments at fair value received as collateral that were available to be delivered or repledged and were delivered or repledged by the firm.
| As of December | ||||||||
| $ in millions | 2014 | 2013 | ||||||
Collateral available to be delivered or repledged 1 | $630,046 | $608,390 | ||||||
Collateral that was delivered or repledged | 474,057 | 450,127 | ||||||
| 1. | As of December 2014 and December 2013, amounts exclude $6.04 billion and $9.67 billion, respectively, of securities received under resale agreements, and $7.08 billion and $2.77 billion, respectively, of securities borrowed transactions that contractually had the right to be delivered or repledged, but were segregated to satisfy certain regulatory requirements. |
The table below presents information about assets pledged by the firm.pledged.
| As of December | ||||||||
| in millions | 2011 | 2010 | ||||||
Financial instruments owned, at fair value pledged to counterparties that: Had the right to deliver or repledge | $ | 53,989 | $ | 51,010 | ||||
Did not have the right to deliver or repledge | 110,949 | 112,750 | ||||||
Other assets pledged to counterparties that: Did not have the right to deliver or repledge | 3,444 | 4,482 | ||||||
| As of December | ||||||||
| $ in millions | 2014 | 2013 | ||||||
Financial instruments owned, at fair value pledged to counterparties that: | ||||||||
Had the right to deliver or repledge | $64,473 | $62,348 | ||||||
Did not have the right to deliver or repledge | 68,027 | 84,799 | ||||||
Other assets pledged to counterparties that: | ||||||||
Did not have the right to deliver or repledge | 1,304 | 769 | ||||||
Securitization Activities
The firm securitizes residential and commercial mortgages, corporate bonds, loans and other types of financial assets by selling these assets to securitization vehicles (e.g., trusts, corporate entities and limited liability companies) andor through a resecuritization. The firm acts as underwriter of the beneficial interests that are sold to investors. The firm’s residential mortgage securitizations are substantially all in connection with government agency securitizations.
Beneficial interests issued by securitization entities are debt or equity securities that give the investors rights to receive all or portions of specified cash inflows to a securitization vehicle and include senior and subordinated shares ofinterests in principal, interest and/or other cash inflows. The proceeds from the sale of beneficial interests are used to pay the transferor for the financial assets sold to the securitization vehicle or to purchase securities which serve as collateral.
The firm accounts for a securitization as a sale when it has relinquished control over the transferred assets. Prior to securitization, the firm accounts for assets pending transfer at fair value and therefore does not typically recognize significant gains or losses upon the transfer of assets. Net revenues from underwriting activities are recognized in connection with the sales of the underlying beneficial interests to investors.
For transfers of assets that are not accounted for as sales, the assets remain in “Financial instruments owned, at fair value” and the transfer is accounted for as a collateralized financing, with the related interest expense recognized over the life of the transaction. See Notes 910 and 23 for further information about collateralized financings and interest expense, respectively.
| Goldman Sachs 2014 Form 10-K | 169 |
THE GOLDMAN SACHS GROUP, INC. AND SUBSIDIARIES
Notes to Consolidated Financial Statements
The firm generally receives cash in exchange for the transferred assets but may also have continuing involvement with transferred assets, including ownership of beneficial interests in securitized financial assets, primarily in the form of senior or subordinated securities, and servicing rights that the firm retains at the time of securitization.securities. The firm may also purchase senior or subordinated securities issued by securitization vehicles (which are typically VIEs) in connection with secondary market-making activities.
THE GOLDMAN SACHS GROUP, INC. AND SUBSIDIARIES
Notes to Consolidated Financial Statements
The primary risks included in beneficial interests and other interests from the firm’s continuing involvement with securitization vehicles are the performance of the underlying collateral, the position of the firm’s investment in the capital structure of the securitization vehicle and the market yield for the security. These interests are accounted for at fair value, and are included in “Financial instruments owned, at fair value” and are generallysubstantially all classified in level 2 of the fair value hierarchy. See Notes 5 through 8 for further information about fair value measurements.
The table below presents the amount of financial assets securitized and the cash flows received on retained interests in securitization entities in which the firm had continuing involvement.
| Year Ended December | Year Ended December | |||||||||||||||||||||||
| in millions | 2011 | 2010 | 2009 | |||||||||||||||||||||
| $ in millions | 2014 | 2013 | 2012 | |||||||||||||||||||||
Residential mortgages | $ | 40,131 | $ | 47,803 | $ | 45,846 | $19,099 | $29,772 | $33,755 | |||||||||||||||
Commercial mortgages | — | 1,451 | — | 2,810 | 6,086 | 300 | ||||||||||||||||||
Other financial assets | 269 | 12 | 691 | 1,009 | — | — | ||||||||||||||||||
Total | $ | 40,400 | $ | 49,266 | $ | 46,537 | $22,918 | $35,858 | $34,055 | |||||||||||||||
Cash flows on retained interests | $ | 569 | $ | 517 | $ | 507 | $ 215 | $ 249 | $ 389 | |||||||||||||||
The tabletables below presentspresent the firm’s continuing involvement in nonconsolidated securitization entities to which the firm sold assets, as well as the total outstanding principal amount of transferred assets in which the firm has continuing involvement. In this table:these tables:
| Ÿ |
|
| Ÿ |
|
| Ÿ |
|
| As of December 2011 | As of December 2010 | |||||||||||||||||||||||||
| in millions | Outstanding Principal Amount | Fair Value of Retained Interests | Fair Value of Purchased | Outstanding Principal Amount | Fair Value of Retained Interests | Fair Value of Purchased | ||||||||||||||||||||
U.S. government agency-issued collateralized mortgage obligations 1 | $ | 70,448 | $ | 5,038 | $ | — | $ | 60,352 | $ | 5,929 | $ | — | ||||||||||||||
Other residential mortgage-backed 2 | 4,459 | 101 | 3 | 13,318 | 125 | 5 | ||||||||||||||||||||
Commercial mortgage-backed 3 | 3,398 | 606 | 331 | 5,040 | 849 | 82 | ||||||||||||||||||||
CDOs, CLOs and other 4 | 9,972 | 32 | 211 | 12,872 | 62 | 229 | ||||||||||||||||||||
Total 5 | $ | 88,277 | $ | 5,777 | $ | 545 | $ | 91,582 | $ | 6,965 | $ | 316 | ||||||||||||||
| As of December 2014 | ||||||||||||
| $ in millions |
| Outstanding Principal Amount |
|
| Fair Value of Retained Interests |
|
| Fair Value of Purchased Interests |
| |||
U.S. governmentagency-issued collateralized mortgage obligations | $56,792 | $2,140 | $ — | |||||||||
Other residential mortgage-backed | 2,273 | 144 | 5 | |||||||||
Other commercial mortgage-backed | 3,313 | 86 | 45 | |||||||||
CDOs, CLOs and other | 4,299 | 59 | 17 | |||||||||
Total | $66,677 | $2,429 | $ 67 | |||||||||
| As of December 2013 | ||||||||||||
| $ in millions |
| Outstanding Principal Amount |
|
| Fair Value of Retained Interests |
|
| Fair Value of Purchased Interests |
| |||
U.S. governmentagency-issued collateralized mortgage obligations | $61,543 | $3,455 | $ — | |||||||||
Other residential mortgage-backed | 2,072 | 46 | — | |||||||||
Other commercial mortgage-backed | 7,087 | 140 | 153 | |||||||||
CDOs, CLOs and other | 6,861 | 86 | 8 | |||||||||
Total 1 | $77,563 | $3,727 | $161 | |||||||||
| 1. | Outstanding principal amount |
|
|
|
|
| 170 | Goldman Sachs |
THE GOLDMAN SACHS GROUP, INC. AND SUBSIDIARIES
Notes to Consolidated Financial Statements
In addition, the outstanding principal and fair value of retained interests in the tables above relate to the following types of securitizations and vintage as described:
| Ÿ | The outstanding principal amount and fair value of retained interests for U.S. government agency-issued collateralized mortgage obligations as of December 2014 primarily relate to securitizations during 2014 and 2013, and as of December 2013 primarily relate to securitizations during 2013 and 2012. |
| Ÿ | The outstanding principal amount and fair value of retained interests for other residential mortgage-backed obligations as of December 2014 primarily relate to resecuritizations during 2014, and prime and Alt-A securitizations during 2007, and as of December 2013 primarily relate to prime and Alt-A securitizations during 2007 and 2006. |
| Ÿ | The outstanding principal amount and fair value of retained interests for other commercial mortgage-backed obligations as of December 2014 primarily relate to securitizations during 2014, and as of December 2013 primarily relate to securitizations during 2013. |
| Ÿ | The outstanding principal amount and fair value of retained interests for CDOs, CLOs and other as of December 2014 primarily relate to securitizations during 2014 and 2007, and as of December 2013 primarily relate to securitizations during 2007. |
In addition to the interests in the tabletables above, the firm had other continuing involvement in the form of derivative transactions and guarantees with certain nonconsolidated VIEs. The carrying value of these derivatives and guarantees was a net liabilityasset of $52$115 million and $98$26 million as of December 20112014 and December 2010,2013, respectively. The notional amounts of these derivatives and guarantees are included in maximum exposure to loss in the nonconsolidated VIE tables in Note 11.12.
The tabletables below presentspresent the weighted average key economic assumptions used in measuring the fair value of retained interests and the sensitivity of this fair value to immediate adverse changes of 10% and 20% in those assumptions.
| As of December 2014 | ||||||||
| Type of Retained Interests | ||||||||
| $ in millions | Mortgage-Backed | Other | 1 | |||||
Fair value of retained interests | $ 2,370 | $ 59 | ||||||
Weighted average life (years) | 7.6 | 3.6 | ||||||
Constant prepayment rate | 13.2% | N.M. | ||||||
Impact of 10% adverse change | $ (33 | ) | N.M. | |||||
Impact of 20% adverse change | (66 | ) | N.M. | |||||
Discount rate | 4.1% | N.M. | ||||||
Impact of 10% adverse change | $ (50 | ) | N.M. | |||||
Impact of 20% adverse change | (97 | ) | N.M. | |||||
| As of December 2011 | As of December 2010 | As of December 2013 | ||||||||||||||||||||||||
| Type of Retained Interests | Type of Retained Interests | Type of Retained Interests | ||||||||||||||||||||||||
| $ in millions | Mortgage-Backed | Other 1 | Mortgage-Backed | Other 1 | Mortgage-Backed | Other | 1 | |||||||||||||||||||
Fair value of retained interests | $ | 5,745 | $ | 32 | $ | 6,903 | $ | 62 | $3,641 | $ 86 | ||||||||||||||||
Weighted average life (years) | 7.1 | 4.7 | 7.4 | 4.2 | 8.3 | 1.9 | ||||||||||||||||||||
Constant prepayment rate 2 | 14.1 | % | N.M. | 11.6 | % | N.M. | ||||||||||||||||||||
Impact of 10% adverse change 2 | $ | (55 | ) | N.M. | $ | (62 | ) | N.M. | ||||||||||||||||||
Impact of 20% adverse change 2 | (108 | ) | N.M. | (128 | ) | N.M. | ||||||||||||||||||||
Constant prepayment rate | 7.5% | N.M. | ||||||||||||||||||||||||
Discount rate 3 | 5.4 | % | N.M. | 5.3 | % | N.M. | ||||||||||||||||||||
Impact of 10% adverse change | $ | (125 | ) | N.M. | $ | (175 | ) | N.M. | $ (36 | ) | N.M. | |||||||||||||||
Impact of 20% adverse change | (240 | ) | N.M. | (341 | ) | N.M. | (64 | ) | N.M. | |||||||||||||||||
Discount rate | 3.9% | N.M. | ||||||||||||||||||||||||
Impact of 10% adverse change | $ (85 | ) | N.M. | |||||||||||||||||||||||
Impact of 20% adverse change | (164 | ) | N.M. | |||||||||||||||||||||||
| 1. | Due to the nature and current fair value of certain of these retained interests, the weighted average assumptions for constant prepayment and discount rates and the related sensitivity to adverse changes are not meaningful as of December |
In the tables above:
| Ÿ | Amounts do not reflect the benefit of other financial instruments that are held to mitigate risks inherent in these retained interests. |
|
| Ÿ | The impact of a change in a particular assumption is calculated independently of changes in any other assumption. In practice, simultaneous changes in assumptions might magnify or counteract the sensitivities disclosed above. |
| Ÿ | The constant prepayment rate is included only for positions for which |
The |
| Ÿ | Expected credit loss assumptions are reflected in the discount |
The preceding table does not give effect to the offsetting benefit of other financial instruments that are held to mitigate risks inherent in these retained interests. Changes in fair value based on an adverse variation in assumptions generally cannot be extrapolated because the relationship of the change in assumptions to the change in fair value is
not usually linear. In addition, the impact of a change in a particular assumption in the preceding table is calculated independently of changes in any other assumption. In practice, simultaneous changes in assumptions might magnify or counteract the sensitivities disclosed above.
| Goldman Sachs | 171 |
THE GOLDMAN SACHS GROUP, INC. AND SUBSIDIARIES
Notes to Consolidated Financial Statements
Variable Interest Entities
VIEs generally finance the purchase of assets by issuing debt and equity securities that are either collateralized by or indexed to the assets held by the VIE. The debt and equity securities issued by a VIE may include tranches of varying levels of subordination. The firm’s involvement with VIEs includes securitization of financial assets, as described in Note 10,11, and investments in and loans to other types of VIEs, as described below. See Note 1011 for additional information about securitization activities, including the definition of beneficial interests. See Note 3 for the firm’s consolidation policies, including the definition of a VIE.
The firm is principally involved with VIEs through the following business activities:
Mortgage-Backed VIEs and Corporate CDO and CLO VIEs.The firm sells residential and commercial mortgage loans and securities to mortgage-backed VIEs and corporate bonds and loans to corporate CDO and CLO VIEs and may retain beneficial interests in the assets sold to these VIEs. The firm purchases and sells beneficial interests issued by mortgage-backed and corporate CDO and CLO VIEs in connection with market-making activities. In addition, the firm may enter into derivatives with certain of these VIEs, primarily interest rate swaps, which are typically not variable interests. The firm generally enters into derivatives with other counterparties to mitigate its risk from derivatives with these VIEs.
Certain mortgage-backed and corporate CDO and CLO VIEs, usually referred to as synthetic CDOs or credit-linked note VIEs, synthetically create the exposure for the beneficial interests they issue by entering into credit derivatives, rather than purchasing the underlying assets. These credit derivatives may reference a single asset, an index, or a portfolio/basket of assets or indices. See Note 7 for further information about credit derivatives. These VIEs use the funds from the sale of beneficial interests and the premiums received from credit derivative counterparties to purchase securities which serve to collateralize the beneficial interest holders and/or the credit derivative counterparty. These VIEs may enter into other derivatives, primarily interest rate swaps, which are typically not variable interests. The firm may be a counterparty to derivatives with these VIEs and generally enters into derivatives with other counterparties to mitigate its risk.
Real Estate, Credit-Related and Other Investing VIEs. The firm purchases equity and debt securities issued by and makes loans to VIEs that hold real estate, performing and nonperforming debt, distressed loans and equity securities. The firm typically does not sell assets to, or enter into derivatives with, these VIEs.
Other Asset-Backed VIEs. The firm structures VIEs that issue notes to clients, and purchases and sells beneficial interests issued by other asset-backed VIEs in connection with market-making activities. In addition, the firm may enter into derivatives with certain other asset-backed VIEs, primarily total return swaps on the collateral assets held by these VIEs under which the firm pays the VIE the return due to the note holders and receives the return on the collateral assets owned by the VIE. The firm generally can be removed as the total return swap counterparty. The firm generally enters into derivatives with other counterparties to mitigate its risk from derivatives with these VIEs. The firm typically does not sell assets to the other asset-backed VIEs it structures.
Power-Related VIEs.The firm purchases debt and equity securities issued by and may provide guarantees to VIEs that hold power-related assets. The firm typically does not sell assets to or enter into derivatives with these VIEs.
Investment Funds. The firm purchases equity securities issued by and may provide guarantees to certain of the investment funds it manages. The firm typically does not sell assets to or enter into derivatives with these VIEs.
Principal-Protected Note VIEs. The firm structures VIEs that issue principal-protected notes to clients. These VIEs own portfolios of assets, principally with exposure to hedge funds. Substantially all of the principal protection on the notes issued by these VIEs is provided by the asset portfolio rebalancing that is required under the terms of the notes. The firm enters into total return swaps with these VIEs under which the firm pays the VIE the return due to the principal-protected note holders and receives the return on the assets owned by the VIE. The firm may enter into derivatives with other counterparties to mitigate the risk it has from the derivatives it enters into with these VIEs. The firm also obtains funding through these VIEs.
Other VIEs. Other primarily includes nonconsolidated power-related and investment fund VIEs. The firm purchases debt and equity securities issued by VIEs that hold power-related assets, and may provide commitments to these VIEs. The firm also makes equity investments in certain of the investment fund VIEs it manages, and is entitled to receive fees from these VIEs. The firm typically does not sell assets to, or enter into derivatives with, these VIEs.
| 172 | Goldman Sachs |
THE GOLDMAN SACHS GROUP, INC. AND SUBSIDIARIES
Notes to Consolidated Financial Statements
Municipal Bond Securitizations. The firm sold municipal securities to VIEs that issued short-term qualifying tax-exempt securities. During 2011, the firm dissolved these VIEs after having redeemed and/or purchased the outstanding securities issued.
VIE Consolidation Analysis
A variable interest in a VIE is an investment (e.g., debt or equity securities) or other interest (e.g., derivatives or loans and lending commitments) in a VIE that will absorb portions of the VIE’s expected losses and/or receive portions of the VIE’s expected residual returns.
The firm’s variable interests in VIEs include senior and subordinated debt in residential and commercial mortgage-backed and other asset-backed securitization entities, CDOs and CLOs; loans and lending commitments; limited and general partnership interests; preferred and common equity; derivatives that may include foreign currency, equity and/or credit risk; guarantees; and certain of the fees the firm receives from investment funds. Certain interest rate, foreign currency and credit derivatives the firm enters into with VIEs are not variable interests because they create rather than absorb risk.
The enterprise with a controlling financial interest in a VIE is known as the primary beneficiary and consolidates the VIE. The firm determines whether it is the primary beneficiary of a VIE by performing an analysis that principally considers:
| Ÿ |
|
| Ÿ |
|
| Ÿ |
|
| Ÿ |
|
| Ÿ |
|
| Ÿ |
|
The firm reassesses its initial evaluation of whether an entity is a VIE when certain reconsideration events occur. The firm reassesses its determination of whether it is the primary beneficiary of a VIE on an ongoing basis based on current facts and circumstances.
Nonconsolidated VIEs
The firm’s exposure to the obligations of VIEs is generally limited to its interests in these entities. In certain instances, the firm provides guarantees, including derivative guarantees, to VIEs or holders of variable interests in VIEs.
The tables below present information about nonconsolidated VIEs in which the firm holds variable interests. Nonconsolidated VIEs are aggregated based on principal business activity. The nature of the firm’s variable interests can take different forms, as described in the rows under maximum exposure to loss. In the tables below:
| Ÿ | The maximum exposure to loss excludes the benefit of offsetting financial instruments that are held to mitigate the risks associated with these variable interests. |
| Ÿ | For retained and purchased interests, and loans and investments, the maximum exposure to loss is the carrying value of these interests. |
| Ÿ | For commitments and guarantees, and derivatives, the maximum exposure to loss is the notional amount, which does not represent anticipated losses and also has not been reduced by unrealized losses already recorded. As a result, the maximum exposure to loss exceeds liabilities recorded for commitments and guarantees, and derivatives provided to VIEs. |
The carrying values of the firm’s variable interests in nonconsolidated VIEs are included in the consolidated statement of financial condition as follows:
| Ÿ | Substantially all assets held by the firm related to mortgage-backed, corporate CDO and CLO, and other asset-backed VIEs |
THE GOLDMAN SACHS GROUP, INC. AND SUBSIDIARIES
Notes to Consolidated Financial Statements
| Ÿ |
|
| Ÿ |
|
| Goldman Sachs 2014 Form 10-K | 173 |
THE GOLDMAN SACHS GROUP, INC. AND SUBSIDIARIES
Notes to Consolidated Financial Statements
| Nonconsolidated VIEs | Nonconsolidated VIEs as of December 2014 | |||||||||||||||||||||||||||||||||||||||||||||||||||
| $ in millions | | Mortgage- backed | | | Corporate CDOs and CLOs | | | Real estate, credit-related and other investing | | | Other asset- backed | | Other | Total | ||||||||||||||||||||||||||||||||||||||
Assets in VIE | $78,107 | 2 | $ 8,317 | $8,720 | $8,253 | $5,677 | $109,074 | |||||||||||||||||||||||||||||||||||||||||||||
| As of December 2011 | ||||||||||||||||||||||||||||||||||||||||||||||||||||
| in millions | Mortgage- backed | Corporate CDOs and CLOs | Real estate, related and | Other backed | Power- related | Investment funds | Total | |||||||||||||||||||||||||||||||||||||||||||||
Assets in VIE | $ | 94,047 | 2 | $ | 20,340 | $ | 8,974 | $ | 4,593 | $ | 519 | $ | 2,208 | $ | 130,681 | |||||||||||||||||||||||||||||||||||||
Carrying Value of the Firm’s Variable Interests | ||||||||||||||||||||||||||||||||||||||||||||||||||||
Assets | 7,004 | 911 | 1,495 | 352 | 289 | 5 | 10,056 | 4,348 | 463 | 3,051 | 509 | 290 | 8,661 | |||||||||||||||||||||||||||||||||||||||
Liabilities | — | 63 | 3 | 24 | 2 | — | 92 | — | 3 | 3 | 16 | — | 22 | |||||||||||||||||||||||||||||||||||||||
Maximum Exposure to Loss in Nonconsolidated VIEs | ||||||||||||||||||||||||||||||||||||||||||||||||||||
Retained interests | 5,745 | 32 | — | — | — | — | 5,777 | 2,370 | 4 | — | 55 | — | 2,429 | |||||||||||||||||||||||||||||||||||||||
Purchased interests | 962 | 368 | — | 333 | — | — | 1,663 | 1,978 | 184 | — | 322 | — | 2,484 | |||||||||||||||||||||||||||||||||||||||
Commitments and guarantees 1 | — | 1 | 373 | — | 46 | — | 420 | |||||||||||||||||||||||||||||||||||||||||||||
Commitments and guarantees | — | — | 604 | 213 | 307 | 1,124 | ||||||||||||||||||||||||||||||||||||||||||||||
Derivatives 1 | 2,469 | 7,529 | — | 1,221 | — | — | 11,219 | 392 | 2,053 | — | 3,221 | 88 | 5,754 | |||||||||||||||||||||||||||||||||||||||
Loans and investments | 82 | — | 1,495 | — | 288 | 5 | 1,870 | — | — | 3,051 | — | 290 | 3,341 | |||||||||||||||||||||||||||||||||||||||
Total | $ | 9,258 | 2 | $ | 7,930 | $ | 1,868 | $ | 1,554 | $ | 334 | $ | 5 | $ | 20,949 | $ 4,740 | 2 | $ 2,241 | $3,655 | $3,811 | $ 685 | $ 15,132 | ||||||||||||||||||||||||||||||
| Nonconsolidated VIEs | Nonconsolidated VIEs as of December 2013 | |||||||||||||||||||||||||||||||||||||||||||||||||||
| $ in millions | | Mortgage- backed | | | Corporate CDOs and CLOs | | | Real estate, credit-related and other investing | | | Other asset- backed | | Other | Total | ||||||||||||||||||||||||||||||||||||||
Assets in VIE | $86,562 | 2 | $19,761 | $8,599 | $4,401 | $2,925 | $122,248 | |||||||||||||||||||||||||||||||||||||||||||||
| As of December 2010 | ||||||||||||||||||||||||||||||||||||||||||||||||||||
| in millions | Mortgage- backed | Corporate CDOs and CLOs | Real estate, related and | Other backed | Power- related | Investment funds | Total | |||||||||||||||||||||||||||||||||||||||||||||
Assets in VIE | $ | 88,755 | 2 | $ | 21,644 | $ | 12,568 | $ | 5,513 | $ | 552 | $ | 2,330 | $ | 131,362 | |||||||||||||||||||||||||||||||||||||
Carrying Value of the Firm’s Variable Interests | ||||||||||||||||||||||||||||||||||||||||||||||||||||
Assets | 8,076 | 909 | 1,063 | 266 | 239 | 5 | 10,558 | 5,269 | 1,063 | 2,756 | 284 | 165 | 9,537 | |||||||||||||||||||||||||||||||||||||||
Liabilities | — | 114 | 1 | 19 | 14 | — | 148 | — | 3 | 2 | 40 | — | 45 | |||||||||||||||||||||||||||||||||||||||
Maximum Exposure to Loss in Nonconsolidated VIEs | ||||||||||||||||||||||||||||||||||||||||||||||||||||
Retained interests | 6,887 | 50 | — | 12 | — | — | 6,949 | 3,641 | 80 | — | 6 | — | 3,727 | |||||||||||||||||||||||||||||||||||||||
Purchased interests | 839 | 353 | — | 247 | — | — | 1,439 | 1,627 | 659 | — | 142 | — | 2,428 | |||||||||||||||||||||||||||||||||||||||
Commitments and guarantees 1 | — | 1 | 125 | — | 69 | — | 195 | |||||||||||||||||||||||||||||||||||||||||||||
Commitments and guarantees | — | — | 485 | — | 281 | 766 | ||||||||||||||||||||||||||||||||||||||||||||||
Derivatives 1 | 3,128 | 7,593 | — | 1,105 | — | — | 11,826 | 586 | 4,809 | — | 2,115 | — | 7,510 | |||||||||||||||||||||||||||||||||||||||
Loans and investments | 104 | — | 1,063 | — | 239 | 5 | 1,411 | — | — | 2,756 | — | 165 | 2,921 | |||||||||||||||||||||||||||||||||||||||
Total | $ | 10,958 | 2 | $ | 7,997 | $ | 1,188 | $ | 1,364 | $ | 308 | $ | 5 | $ | 21,820 | $ 5,854 | 2 | $ 5,548 | $3,241 | $2,263 | $ 446 | $ 17,352 | ||||||||||||||||||||||||||||||
| 1. | The aggregate amounts include |
| 2. | Assets in VIE and maximum exposure to loss include |
| 174 | Goldman Sachs |
THE GOLDMAN SACHS GROUP, INC. AND SUBSIDIARIES
Notes to Consolidated Financial Statements
Consolidated VIEs
The tables below present the carrying amount and classification of assets and liabilities in consolidated VIEs, excluding the benefit of offsetting financial instruments that are held to mitigate the risks associated with the firm’s variable interests. Consolidated VIEs are aggregated based on principal business activity and their assets and liabilities are presented net of intercompany eliminations. The majority of the assets in principal-protected notes VIEs are intercompany and are eliminated in consolidation.
Substantially all the assets in consolidated VIEs can only be used to settle obligations of the VIE.
The tables below exclude VIEs in which the firm holds a majority voting interest if (i) the VIE meets the definition of a business and (ii) the VIE’s assets can be used for purposes other than the settlement of its obligations.
The liabilities of real estate, credit-related and other investing VIEs, and CDOs, mortgage-backed and other asset-backed VIEs do not have recourse to the general credit of the firm.
| Consolidated VIEs | Consolidated VIEs as of December 2014 | |||||||||||||||||||||||||||||||
| As of December 2011 | ||||||||||||||||||||||||||||||||
| in millions | Real estate, credit-related and other investing | CDOs, mortgage-backed and other asset-backed | Principal- protected notes | Total | ||||||||||||||||||||||||||||
| $ in millions | | Real estate, credit-related and other investing | | | CDOs, mortgage-backed and other asset-backed | | | Principal- protected notes | | Total | ||||||||||||||||||||||
Assets | ||||||||||||||||||||||||||||||||
Cash and cash equivalents | $ | 660 | $ | 51 | $ | 1 | $ | 712 | $ 218 | $ — | $ — | $ 218 | ||||||||||||||||||||
Cash and securities segregated for regulatory and other purposes | 139 | — | — | 139 | 19 | — | 31 | 50 | ||||||||||||||||||||||||
Receivables from brokers, dealers and clearing organizations | 4 | — | — | 4 | ||||||||||||||||||||||||||||
Receivables from customers and counterparties | — | 16 | — | 16 | ||||||||||||||||||||||||||||
Loans receivable | 589 | — | — | 589 | ||||||||||||||||||||||||||||
Financial instruments owned, at fair value | 2,369 | 352 | 112 | 2,833 | 2,608 | 121 | 276 | 3,005 | ||||||||||||||||||||||||
Other assets | 1,552 | 437 | — | 1,989 | 349 | — | — | 349 | ||||||||||||||||||||||||
Total | $ | 4,724 | $ | 856 | $ | 113 | $ | 5,693 | $3,783 | $121 | $ 307 | $4,211 | ||||||||||||||||||||
Liabilities | ||||||||||||||||||||||||||||||||
Other secured financings | $ | 1,418 | $ | 298 | $ | 3,208 | $ | 4,924 | $ 419 | $ 99 | $ 439 | $ 957 | ||||||||||||||||||||
Payables to customers and counterparties | — | 9 | — | 9 | ||||||||||||||||||||||||||||
Financial instruments sold, but not yet purchased, at fair value | — | — | 2 | 2 | 10 | 8 | — | 18 | ||||||||||||||||||||||||
Unsecured short-term borrowings, including the current portion of | 185 | — | 1,941 | 2,126 | — | — | 1,090 | 1,090 | ||||||||||||||||||||||||
Unsecured long-term borrowings | 4 | — | 269 | 273 | 12 | — | 103 | 115 | ||||||||||||||||||||||||
Other liabilities and accrued expenses | 2,046 | 40 | — | 2,086 | 906 | — | — | 906 | ||||||||||||||||||||||||
Total | $ | 3,653 | $ | 347 | $ | 5,420 | $ | 9,420 | $1,347 | $107 | $1,632 | $3,086 | ||||||||||||||||||||
| Consolidated VIEs as of December 2013 | ||||||||||||||||||||||||||||||||
| $ in millions | | Real estate, credit-related and other investing | | | CDOs, mortgage-backed and other asset-backed | | | Principal- protected notes | | Total | ||||||||||||||||||||||
Assets | ||||||||||||||||||||||||||||||||
Cash and cash equivalents | $ 183 | $ — | $ — | $ 183 | ||||||||||||||||||||||||||||
Cash and securities segregated for regulatory and other purposes | 84 | — | 63 | 147 | ||||||||||||||||||||||||||||
Loans receivable | 50 | — | — | 50 | ||||||||||||||||||||||||||||
Financial instruments owned, at fair value | 1,309 | 310 | 155 | 1,774 | ||||||||||||||||||||||||||||
Other assets | 921 | — | — | 921 | ||||||||||||||||||||||||||||
Total | $2,547 | $310 | $ 218 | $3,075 | ||||||||||||||||||||||||||||
Liabilities | ||||||||||||||||||||||||||||||||
Other secured financings | $ 417 | $198 | $ 404 | $1,019 | ||||||||||||||||||||||||||||
Unsecured short-term borrowings, including the current portion of unsecured long-term borrowings | — | — | 1,258 | 1,258 | ||||||||||||||||||||||||||||
Unsecured long-term borrowings | 57 | — | 193 | 250 | ||||||||||||||||||||||||||||
Other liabilities and accrued expenses | 556 | — | — | 556 | ||||||||||||||||||||||||||||
Total | $1,030 | $198 | $1,855 | $3,083 | ||||||||||||||||||||||||||||
| Goldman Sachs | 175 |
THE GOLDMAN SACHS GROUP, INC. AND SUBSIDIARIES
Notes to Consolidated Financial Statements
| Consolidated VIEs | ||||||||||||||||||||
| As of December 2010 | ||||||||||||||||||||
| in millions | Real estate, credit-related and other investing | Municipal bond securitizations | CDOs, mortgage-backed asset-backed | Principal- protected notes | Total | |||||||||||||||
Assets | ||||||||||||||||||||
Cash and cash equivalents | $ | 248 | $ | — | $ | 39 | $ | 52 | $ | 339 | ||||||||||
Cash and securities segregated for regulatory and other purposes | 205 | — | — | — | 205 | |||||||||||||||
Receivables from brokers, dealers and clearing organizations | 4 | — | — | — | 4 | |||||||||||||||
Receivables from customers and counterparties | 1 | — | 27 | — | 28 | |||||||||||||||
Financial instruments owned, at fair value | 2,531 | 547 | 550 | 648 | 4,276 | |||||||||||||||
Other assets | 3,369 | — | 499 | — | 3,868 | |||||||||||||||
Total | $ | 6,358 | $ | 547 | $ | 1,115 | $ | 700 | $ | 8,720 | ||||||||||
Liabilities | ||||||||||||||||||||
Other secured financings | $ | 2,434 | $ | 630 | $ | 417 | $ | 3,224 | $ | 6,705 | ||||||||||
Payables to customers and counterparties | — | — | 12 | — | 12 | |||||||||||||||
Financial instruments sold, but not yet purchased, at fair value | — | — | 55 | — | 55 | |||||||||||||||
Unsecured short-term borrowings, including the current portion of unsecured long-term borrowings | 302 | — | — | 2,359 | 2,661 | |||||||||||||||
Unsecured long-term borrowings | 6 | — | — | — | 6 | |||||||||||||||
Other liabilities and accrued expenses | 2,004 | — | 32 | — | 2,036 | |||||||||||||||
Total | $ | 4,746 | $ | 630 | $ | 516 | $ | 5,583 | $ | 11,475 | ||||||||||
THE GOLDMAN SACHS GROUP, INC. AND SUBSIDIARIES
Notes to Consolidated Financial Statements
Other Assets
Other assets are generally less liquid, non-financial assets. The table below presents other assets by type.
| As of December | ||||||||
| in millions | 2011 | 2010 | ||||||
Property, leasehold improvements and equipment 1 | $ | 8,697 | $ | 11,106 | ||||
Goodwill and identifiable intangible assets 2 | 5,468 | 5,522 | ||||||
Income tax-related assets 3 | 5,017 | 6,239 | ||||||
Equity-method investments 4 | 664 | 1,445 | ||||||
Miscellaneous receivables and other | 3,306 | 3,747 | ||||||
Total | $ | 23,152 | $ | 28,059 | ||||
| As of December | ||||||||
| $ in millions | 2014 | 2013 | ||||||
Property, leasehold improvements and equipment | $ 9,344 | $ 9,196 | ||||||
Goodwill and identifiable intangible assets | 4,160 | 4,376 | ||||||
Income tax-related assets | 5,181 | 5,241 | ||||||
Equity-method investments 1 | 360 | 417 | ||||||
Miscellaneous receivables and other 2 | 3,554 | 3,279 | ||||||
Total | $22,599 | $22,509 | ||||||
| 1. |
|
|
|
Excludes investments accounted for at fair value under the fair value option where the firm would otherwise apply the equity method of accounting of |
| 2. | Includes $461 million related to investments in qualified affordable housing projects as of December 2014. |
Property, Leasehold Improvements and Equipment
Property, leasehold improvements and equipment included $6.48in the table above is presented net of accumulated depreciation and amortization of $8.98 billion and $6.44$9.04 billion as of December 20112014 and December 2010,2013, respectively. Property, leasehold improvements and equipment included $5.81 billion and $6.02 billion as of December 2014 and December 2013, respectively, related to property, leasehold improvements and equipment that the firm uses in connection with its operations. The remainder is held by investment entities, including VIEs, consolidated by the firm.
Substantially all property and equipment are depreciated on a straight-line basis over the useful life of the asset.
Leasehold improvements are amortized on a straight-line basis over the useful life of the improvement or the term of the lease, whichever is shorter.
Certain costs of software developed or obtained for internal use are capitalized and amortized on a straight-line basis over the useful life of the software.
Property, leasehold improvements and equipment are tested for impairment whenever events or changes in circumstances suggest that an asset’s or asset group’s carrying value may not be fully recoverable. The firm’s policy for impairment testing of property, leasehold improvements and equipment is the same as is used for identifiable intangible assets with finite lives. See Note 13 for further information.
Impairments
In the first quarter of 2011, the firm classified certain assets as held for sale, primarily related to Litton Loan Servicing LP (Litton) and recognized impairment losses of approximately $220 million, principally in the firm’s Institutional Client Services segment. These impairment losses, which were included in “Depreciation and amortization,” represent the excess of (i) the carrying value of these assets over (ii) their estimated fair value less estimated cost to sell. These assets were sold in the third quarter of 2011. The firm received total consideration that approximated the firm’s adjusted carrying value for Litton. See Note 18 for further information about the sale of Litton.
As a result of a decline in the market conditions in which certain of the firm’s consolidated investments operate, during 2011 the firm tested certain commodity-related intangible assets and property, leasehold improvements and equipment associated with these investments for impairment in accordance with ASC 360. The carrying value of these assets exceeded the projected undiscounted cash flows over the estimated remaining useful lives of these assets; as such, the firm determined the assets were impaired and recorded an impairment loss of approximately $220 million ($120 million related to commodity-related intangible assets and $100 million related to property, leasehold improvements and equipment), which was included in “Depreciation and amortization” in the firm’s Investing & Lending segment. This impairment loss represented the excess of the carrying value of these assets over their estimated fair value, which is a level 3 measurement, using a combination of discounted cash flow analyses and relative value analyses, including the estimated cash flows expected to be received from the disposition of certain of these assets.
THE GOLDMAN SACHS GROUP, INC. AND SUBSIDIARIES
Notes to Consolidated Financial Statements
During the fourth quarter of 2010, as a result of continuing weak operating results in the firm’s NYSE DMM business, the firm tested its NYSE DMM rights for impairment in accordance with ASC 360. Because the carrying value of the firm’s NYSE DMM rights exceeded the projected undiscounted cash flows over the estimated remaining useful life of the firm’s NYSE DMM rights, the firm determined that the rights were impaired. The firm recorded an impairment loss of $305 million, which was included in “Depreciation and amortization” in the firm’s Institutional Client Services segment in the fourth quarter of 2010. This impairment loss represented the excess of the carrying value of the firm’s NYSE DMM rights over their estimated fair value. The firm estimated this fair value, which is a level 3 measurement, using a relative value analysis which incorporated a comparison to another DMM portfolio that was transacted between third parties.
Goodwill and Identifiable Intangible Assets
The tables below present the carrying values of goodwill and identifiable intangible assets, which are included in “Other assets.”
Goodwill As of December | Goodwill as of December | |||||||||||
| in millions | 2011 | 2010 | ||||||||||
| $ in millions | 2014 | 2013 | ||||||||||
Investment Banking: | ||||||||||||
Financial Advisory 1 | $ 104 | $ — | ||||||||||
Underwriting 1 | 186 | 125 | ||||||||||
Financial Advisory | $ 98 | $ 98 | ||||||||||
Underwriting | 183 | 183 | ||||||||||
Institutional Client Services: | ||||||||||||
Fixed Income, Currency and Commodities Client Execution 2 | 284 | 159 | ||||||||||
Equities Client Execution 1 | 2,390 | 2,361 | ||||||||||
Fixed Income, Currency and | 269 | 269 | ||||||||||
Equities Client Execution | 2,403 | 2,404 | ||||||||||
Securities Services | 117 | 117 | 105 | 105 | ||||||||
Investing & Lending | 147 | 172 | ||||||||||
Investing & Lending 1 | — | 60 | ||||||||||
Investment Management | 574 | 561 | 587 | 586 | ||||||||
Total | $3,802 | $3,495 | $3,645 | $3,705 | ||||||||
Identifiable Intangible Assets | Identifiable Intangible Assets as of December | |||||||||||
| in millions | 2011 | 2010 | ||||||||||
Investment Banking: | ||||||||||||
Financial Advisory | $ 4 | $ — | ||||||||||
Underwriting | 1 | — | ||||||||||
| $ in millions | 2014 | 2013 | ||||||||||
Institutional Client Services: | ||||||||||||
Fixed Income, Currency and Commodities Client Execution | 488 | 608 | ||||||||||
Equities Client Execution | 677 | 718 | ||||||||||
Investing & Lending | 369 | 579 | ||||||||||
Fixed Income, Currency and | $ 138 | $ 35 | ||||||||||
Equities Client Execution 3 | 246 | 348 | ||||||||||
Investing & Lending 1 | 18 | 180 | ||||||||||
Investment Management | 127 | 122 | 113 | 108 | ||||||||
Total | $1,666 | $2,027 | $ 515 | $ 671 | ||||||||
| 1. | The |
| 2. | The increase from December |
| 3. | The decrease from December 2013 to December 2014 reflects an impairment related to the |
| 176 | Goldman Sachs 2014 Form 10-K |
THE GOLDMAN SACHS GROUP, INC. AND SUBSIDIARIES
GoodwillNotes to Consolidated Financial Statements
Goodwill.Goodwill is the cost of acquired companies in excess of the fair value of net assets, including identifiable intangible assets, at the acquisition date.
Goodwill is assessed annually in the fourth quarter for impairment or more frequently if events occur or circumstances change that indicate an impairment may exist. QualitativeWhen assessing goodwill for impairment, first, qualitative factors are assessed to determine whether it is more likely than not that the fair value of a reporting unit is less than its carrying amount. If results of the qualitative assessment are not conclusive, a quantitative goodwill impairment test iswould be performed. See Note 3 for information about amended accounting principles for goodwill impairment testing.
The quantitative goodwill impairment test consists of two steps.steps:
| Ÿ | The first step compares the estimated fair value of each reporting unit with its estimated net book value (including goodwill and |
| Ÿ | If the estimated fair value of a reporting unit is less than its estimated net book value, the second step of the goodwill impairment test is performed to measure the amount of impairment, |
Goodwill was tested for impairment, usingThe firm performed a quantitative goodwill impairment test during the fourth quarter of 2011 and2012 (2012 quantitative goodwill was not impaired.
To estimatetest). When performing this test, the firm estimated the fair value of each reporting unit bothand compared it to the respective reporting unit’s net book value (estimated carrying value). The reporting units were valued using relative value and residual income valuation techniques are used because the firm believes market participants would use these techniques to value the firm’s reporting units.
Relative value techniques apply average observable price-to-earnings multiples of comparable competitors to certain reporting units’ net earnings. For other reporting units, fair value is estimated using price-to-book multiples based on residual income techniques, which consider a reporting unit’s return on equity in excess of the firm’s cost of equity capital. The net book value of each reporting unit reflectsreflected an allocation of total shareholders’ equity and represented the estimated amount of shareholders’ equity required to support the activities of the reporting unit.unit under guidelines issued by the Basel Committee on Banking Supervision (Basel Committee) in December 2010. In performing its 2012 quantitative goodwill test, the firm determined that goodwill was not impaired, and the estimated fair value of the firm’s reporting units, in which substantially all of the firm’s goodwill is held, significantly exceeded their estimated carrying values.
During the fourth quarter of 2014, the firm assessed goodwill for impairment. Multiple factors were assessed with respect to each of the firm’s reporting units to determine whether it was more likely than not that the fair value of any of the reporting units was less than its carrying amount. The qualitative assessment also considered changes since the 2012 quantitative goodwill test.
In accordance with ASC 350, the firm considered the following factors in the 2014 qualitative assessment performed in the fourth quarter when evaluating whether it was more likely than not that the fair value of a reporting unit was less than its carrying amount:
| Ÿ | Macroeconomic conditions. Since the 2012 quantitative goodwill test was performed, the firm’s general operating environment improved as credit spreads tightened, global equity prices increased significantly, and industry-wide mergers and acquisitions activity, and industry-wide debt and equity underwriting activity, improved. |
| Ÿ | Industry and market considerations. Since the 2012 quantitative goodwill test was performed, industry-wide metrics have trended positively and most publicly-traded industry participants, including the firm, experienced increases in stock price, price-to-book multiples and price-to-earnings multiples. In addition, clarity was obtained on a number of regulations and other reforms have been adopted or proposed by regulators. Many of these rules are highly complex and their full impact will not be known until the rules are implemented and market practices develop under the final regulations. However, the firm does not expect compliance to have a significant negative impact on reporting unit results. |
| Ÿ | Cost factors. Although certain expenses increased, there were no significant negative changes to the firm’s overall cost structure since the 2012 quantitative goodwill test was performed. |
| Ÿ | Overall financial performance. During 2014, the firm’s net earnings, pre-tax margin, diluted earnings per common share, return on average common shareholders’ equity and book value per common share increased as compared with 2012. |
| Goldman Sachs |
THE GOLDMAN SACHS GROUP, INC. AND SUBSIDIARIES
Notes to Consolidated Financial Statements
| Ÿ | Entity-specific events. There were no entity-specific events since the 2012 quantitative goodwill test was performed that would have had a significant negative impact on the valuation of the firm’s reporting units. |
| Ÿ | Events affecting reporting units. There were no events since the 2012 quantitative goodwill test was performed that would have had a significant negative impact on the valuation of the firm’s reporting units. |
| Ÿ | Sustained changes in stock price. Since the 2012 quantitative goodwill test was performed, the firm’s stock price has increased significantly. In addition, the stock price exceeded book value per common share throughout most of 2013 and 2014. |
The firm also considered other factors in its qualitative assessment, including changes in the book value of reporting units, the estimated excess of the fair values as compared with the carrying values for the reporting units in the 2012 quantitative goodwill test, projected earnings and the cost of equity. The firm considered all of the above factors in the aggregate as part of its qualitative assessment.
As a result of the 2014 qualitative assessment, the firm determined that it was more likely than not that the fair value of each of the reporting units exceeded its respective carrying amount. Therefore, the firm determined that goodwill was not impaired and that a quantitative goodwill impairment test was not required.
Identifiable Intangible AssetsAssets.
The table below presents the gross carrying amount, accumulated amortization and net carrying amount of
identifiable intangible assets and their weighted average remaining useful lives.
| As of December | ||||||||||||
| $ in millions | 2011 | Weighted Average Remaining Lives (years) | 2010 | |||||||||
Customer lists | Gross carrying amount | $ | 1,119 | $ | 1,104 | |||||||
| Accumulated amortization | (593 | ) | (529 | ) | ||||||||
| Net carrying amount | $ | 526 | 9 | $ | 575 | |||||||
Commodities-related intangibles 1 | Gross carrying amount | $ | 595 | $ | 667 | |||||||
| Accumulated amortization | (237 | ) | (52 | ) | ||||||||
| Net carrying amount | $ | 358 | 11 | $ | 615 | |||||||
Broadcast royalties 2 | Gross carrying amount | $ | 560 | $ | 560 | |||||||
| Accumulated amortization | (123 | ) | (61 | ) | ||||||||
| Net carrying amount | $ | 437 | 7 | $ | 499 | |||||||
Insurance-related intangibles 3 | Gross carrying amount | $ | 292 | $ | 292 | |||||||
| Accumulated amortization | (146 | ) | (146 | ) | ||||||||
| Net carrying amount | $ | 146 | 7 | $ | 146 | |||||||
Other 4 | Gross carrying amount | $ | 950 | $ | 953 | |||||||
| Accumulated amortization | (751 | ) | (761 | ) | ||||||||
| Net carrying amount | $ | 199 | 12 | $ | 192 | |||||||
Total | Gross carrying amount | $ | 3,516 | $ | 3,576 | |||||||
| Accumulated amortization | (1,850 | ) | (1,549 | ) | ||||||||
| Net carrying amount | $ | 1,666 | 9 | $ | 2,027 | |||||||
| As of December | ||||||||||
| $ in millions | 2014 | Weighted Average Remaining Useful Lives(years) | 2013 | |||||||
Customer lists | ||||||||||
Gross carrying amount | $1,036 | $ 1,102 | ||||||||
Accumulated amortization | (715 | ) | (706 | ) | ||||||
Net carrying amount | 321 | 6 | 396 | |||||||
Commodities-related 1 | ||||||||||
Gross carrying amount | 216 | 510 | ||||||||
Accumulated amortization | (78 | ) | (341 | ) | ||||||
Net carrying amount | 138 | 8 | 169 | |||||||
Other | ||||||||||
Gross carrying amount 2 | 200 | 906 | ||||||||
Accumulated amortization 2 | (144 | ) | (800 | ) | ||||||
Net carrying amount | 56 | 5 | 106 | |||||||
Total | ||||||||||
Gross carrying amount | 1,452 | 2,518 | ||||||||
Accumulated amortization | (937 | ) | (1,847 | ) | ||||||
Net carrying amount | $ 515 | 7 | $ 671 | |||||||
| 1. |
|
| 2. |
|
|
|
Substantially all of the firm’s identifiable intangible assets are considered to have finite useful lives and are amortized (i) over their estimated useful lives (ii)using the straight-line method or based on economic usage for certain commodity-related intangibles or (iii) in proportioncommodities-related intangibles.
toThe tables below present amortization for 2014, 2013 and 2012, and the estimated gross profits or premium revenues. Amortization expensefuture amortization through 2019 for identifiable intangible assets.
| Year Ended December | ||||||||||||
| $ in millions | 2014 | 2013 | 2012 | |||||||||
Amortization | $217 | $205 | $338 | |||||||||
$ in millions Estimated future amortization | | As of December 2014 | | |
2015 | $117 | |||
2016 | 106 | |||
2017 | 96 | |||
2018 | 81 | |||
2019 | 53 | |||
| 178 | Goldman Sachs 2014 Form 10-K |
THE GOLDMAN SACHS GROUP, INC. AND SUBSIDIARIES
Notes to Consolidated Financial Statements
Impairments
The firm tests property, leasehold improvements and equipment, identifiable intangible assets and other assets for impairment whenever events or changes in circumstances suggest that an asset’s or asset group’s carrying value may not be fully recoverable. To the extent the carrying value of an asset exceeds the projected undiscounted cash flows expected to result from the use and eventual disposal of the asset or asset group, the firm determines the asset is impaired and records an impairment equal to the difference between the estimated fair value and the carrying value of the asset or asset group. In addition, the firm will recognize an impairment prior to the sale of an asset if the carrying value of the asset exceeds its estimated fair value.
During 2014 and 2013, primarily as a result of deterioration in market and operating conditions related to certain of the firm’s consolidated investments and the firm’s LMM rights, the firm determined that certain assets were impaired and recorded impairments of $360 million and $216 million, respectively.
| Ÿ | In 2014, these impairments consisted of $268 million related to property, leasehold improvements and equipment, substantially all of which was attributable to a consolidated investment in Latin America, $70 million related to identifiable intangible assets, primarily attributable to the firm’s LMM rights, and $22 million related to goodwill as a result of the sale of Metro. The impairments related to property, leasehold improvements and equipment and goodwill were included in the firm’s Investing & Lending segment and the impairments related to identifiable intangible assets were principally included in the firm’s Institutional Client Services segment. |
| Ÿ | In 2013, these impairments consisted of $160 million related to property, leasehold improvements and equipment and $56 million related to identifiable intangible assets primarily attributable to a consolidated investment in Latin America. Substantially all of these impairments were included in the firm’s Investing & Lending segment. |
The impairments in both 2014 and 2013 were included in “Depreciation and amortization.”amortization” and represented the excess of the carrying values of these assets over their estimated fair values, substantially all of which are calculated using level 3 measurements. These fair values were calculated using a combination of discounted cash flow analyses and relative value analyses, including the estimated cash flows expected to result from the use and eventual disposition of these assets.
| Goldman Sachs | 179 |
THE GOLDMAN SACHS GROUP, INC. AND SUBSIDIARIES
Notes to Consolidated Financial Statements
The tables below present amortization expense for identifiable intangible assets for the years ended December 2011, December 2010 and December 2009, and the estimated future amortization expense through 2016 for identifiable intangible assets as of December 2011.
| Year Ended December | ||||||||||||
| in millions | 2011 | 2010 | 2009 | |||||||||
Amortization expense | $389 | $ | 520 | $ | 96 | |||||||
| in millions | As of December 2011 | |||
Estimated future amortization expense: | ||||
2012 | $ | 258 | ||
2013 | 234 | |||
2014 | 203 | |||
2015 | 170 | |||
2016 | 167 | |||
Identifiable intangible assets are tested for recoverability whenever events or changes in circumstances indicate that an asset’s or asset group’s carrying value may not be recoverable.
If a recoverability test is necessary, the carrying value of an asset or asset group is compared to the total of the undiscounted cash flows expected to be received over the remaining useful life and from the disposition of the asset or asset group.
|
|
See Note 12 for information about impairments of our identifiable intangible assets.
THE GOLDMAN SACHS GROUP, INC. AND SUBSIDIARIES
Notes to Consolidated Financial Statements
Deposits
The tablestable below presentpresents deposits held in U.S. and non-U.S. offices, and the maturitiessubstantially all of time deposits.which were interest-bearing. Substantially all U.S. deposits were held at Goldman Sachs Bank USA (GS Bank USA) and were interest-bearing and substantially all non-U.S. deposits were held at Goldman Sachs International Bank (Europe) plc (GS Bank Europe) and were interest-bearing.(GSIB).
| As of December | ||||||||
| $ in millions | 2014 | 2013 | ||||||
U.S. offices | $69,270 | $61,016 | ||||||
Non-U.S. offices | 13,738 | 9,791 | ||||||
Total | $83,008 | $70,807 | ||||||
The table below presents maturities of time deposits held in U.S. and non-U.S. offices.
| As of December | ||||||||
| in millions | 2011 | 2010 | ||||||
U.S. offices | $ | 38,477 | $ | 32,353 | ||||
Non-U.S. offices | 7,632 | 6,216 | ||||||
Total | $ | 46,109 | $ | 38,569 | ||||
| As of December 2011 | ||||||||||||
| in millions | U.S. | Non-U.S. | Total | |||||||||
2012 | $ | 2,487 | $ | 2,347 | $ | 4,834 | ||||||
2013 | 3,252 | — | 3,252 | |||||||||
2014 | 1,306 | — | 1,306 | |||||||||
2015 | 1,031 | — | 1,031 | |||||||||
2016 | 723 | — | 723 | |||||||||
2017 - thereafter | 2,120 | — | 2,120 | |||||||||
Total | $ | 10,919 | 1 | $ | 2,347 | 2 | $ | 13,266 | ||||
| As of December 2014 | ||||||||||||
| $ in millions | U.S. | Non-U.S. | Total | |||||||||
2015 | $ 6,478 | $8,395 | $14,873 | |||||||||
2016 | 3,755 | 8 | 3,763 | |||||||||
2017 | 4,067 | — | 4,067 | |||||||||
2018 | 2,410 | — | 2,410 | |||||||||
2019 | 2,898 | — | 2,898 | |||||||||
2020 - thereafter | 5,661 | 43 | 5,704 | |||||||||
Total | $25,269 | 1 | $8,446 | 2 | $33,715 | 3 | ||||||
| 1. | Includes |
| 2. |
|
| 3. | Includes $13.52 billion of time deposits accounted for at fair value under the fair value option. See Note 8 for further information about deposits accounted for at fair value. |
As of December 2014 and December 2013, deposits include $49.29 billion and $46.02 billion, respectively, of savings and demand deposits, which have no stated maturity, and were recorded based on the amount of cash received plus accrued interest, which approximates fair value. In addition, the firm designates certain derivatives as fair value hedges to convert substantially all of its time deposits not accounted for at fair value from fixed-rate obligations into floating-rate obligations. Accordingly, the carrying value of time deposits approximated fair value as of December 2014 and December 2013. While these savings and demand deposits and time deposits are carried at amounts that approximate fair value, they are not accounted for at fair value under the fair value option or at fair value in accordance with other U.S. GAAP and therefore are not included in the firm’s fair value hierarchy in Notes 6 through 8. Had these deposits been included in the firm’s fair value hierarchy, they would have been classified in level 2 as of December 2014 and December 2013.
Short-Term Borrowings
Short-term borrowings were comprised ofThe table below presents details about the following:firm’s short-term borrowings.
As of December | As of December | |||||||||||
| in millions | 2011 | 2010 | ||||||||||
| $ in millions | 2014 | 2013 | ||||||||||
Other secured financings (short-term) | $29,185 | $24,529 | $15,560 | $17,290 | ||||||||
Unsecured short-term borrowings | 49,038 | 47,842 | 44,540 | 44,692 | ||||||||
Total | $78,223 | $72,371 | $60,100 | $61,982 | ||||||||
See Note 910 for further information about other secured financings.
Unsecured short-term borrowings include the portion of unsecured long-term borrowings maturing within one year of the financial statement date and unsecured long-term borrowings that are redeemable within one year of the financial statement date at the option of the holder.
The firm accounts for promissory notes, commercial paper and certain hybrid financial instruments at fair value under the fair value option. See Note 8 for further information about unsecured short-term borrowings that are accounted for at fair value. Short-termThe carrying value of unsecured short-term borrowings that are not recorded at fair value are recorded based on the amount of cash received plus accrued interest, and such amounts approximategenerally approximates fair value due to the short-term nature of the obligations. While these unsecured short-term borrowings are carried at amounts that approximate fair value, they are not accounted for at fair value under the fair value option or at fair value in accordance with other U.S. GAAP and therefore are not included in the firm’s fair value hierarchy in Notes 6 through 8. Had these borrowings been included in the firm’s fair value hierarchy, substantially all would have been classified in level 2 as of December 2014 and December 2013.
The table below presents details about the firm’s unsecured short-term borrowings.
| As of December | As of December | |||||||||||||||
| in millions | 2011 | 2010 | ||||||||||||||
Current portion of unsecured long-term borrowings 1, 2 | $28,836 | $25,396 | ||||||||||||||
| $ in millions | 2014 | 2013 | ||||||||||||||
Current portion of unsecured long-term borrowings 1 | $25,126 | $25,312 | ||||||||||||||
Hybrid financial instruments | 11,526 | 13,223 | 14,083 | 13,391 | ||||||||||||
Promissory notes | 1,328 | 3,265 | 338 | 292 | ||||||||||||
Commercial paper | 1,491 | 1,306 | 617 | 1,011 | ||||||||||||
Other short-term borrowings | 5,857 | 4,652 | 4,376 | 4,686 | ||||||||||||
Total | $49,038 | $47,842 | $44,540 | $44,692 | ||||||||||||
Weighted average interest rate 3 | 1.89 | % | 1.77 | % | ||||||||||||
Weighted average interest rate 2 | 1.52% | 1.65% | ||||||||||||||
| 1. | Includes |
|
The weighted average interest rates for these borrowings include the effect of hedging activities and exclude financial instruments accounted for at fair value under the fair value option. See Note 7 for further information about hedging activities. |
| Goldman Sachs |
THE GOLDMAN SACHS GROUP, INC. AND SUBSIDIARIES
Notes to Consolidated Financial Statements
Long-Term Borrowings
Long-term borrowings were comprised of
The table below presents details about the following:firm’s long-term borrowings.
| As of December | ||||||||
| in millions | 2011 | 2010 | ||||||
Other secured financings (long-term) | $ | 8,179 | $ | 13,848 | ||||
Unsecured long-term borrowings | 173,545 | 174,399 | ||||||
Total | $ | 181,724 | $ | 188,247 | ||||
| As of December | ||||||||
| $ in millions | 2014 | 2013 | ||||||
Other secured financings (long-term) | $ 7,249 | $ 7,524 | ||||||
Unsecured long-term borrowings | 167,571 | 160,965 | ||||||
Total | $174,820 | $168,489 | ||||||
See Note 910 for further information about other secured financings. The tabletables below presentspresent unsecured long-term
borrowings extending through 2061 and consisting principally of senior borrowings.
| As of December 2011 | As of December 2010 | |||||||||||||||||||||||||
| in millions | U.S. Dollar | Non-U.S. Dollar | Total | U.S. Dollar | Non-U.S. Dollar | Total | ||||||||||||||||||||
Fixed-rate obligations 1 Group Inc. | $ | 82,396 | $ | 38,012 | $ | 120,408 | $ | 81,192 | $ | 35,353 | $ | 116,545 | ||||||||||||||
Subsidiaries | 1,662 | 557 | 2,219 | 1,622 | 532 | 2,154 | ||||||||||||||||||||
Floating-rate obligations 2 Group Inc. | 19,936 | 25,878 | 45,814 | 23,700 | 27,374 | 51,074 | ||||||||||||||||||||
Subsidiaries | 3,500 | 1,604 | 5,104 | 3,616 | 1,010 | 4,626 | ||||||||||||||||||||
Total 3 | $ | 107,494 | $ | 66,051 | $ | 173,545 | $ | 110,130 | $ | 64,269 | $ | 174,399 | ||||||||||||||
| As of December 2014 | ||||||||||||
| $ in millions | | U.S. Dollar | | | Non-U.S. Dollar | | Total | |||||
Fixed-rate obligations 1 | ||||||||||||
Group Inc. | $ 86,403 | $34,146 | $120,549 | |||||||||
Subsidiaries | 3,074 | 711 | 3,785 | |||||||||
Floating-rate obligations 2 | ||||||||||||
Group Inc. | 23,402 | 14,615 | 38,017 | |||||||||
Subsidiaries | 4,139 | 1,081 | 5,220 | |||||||||
Total | $117,018 | $50,553 | $167,571 | |||||||||
| As of December 2013 | ||||||||||||
| $ in millions |
| U.S. Dollar |
| | Non-U.S. Dollar | | Total | |||||
Fixed-rate obligations 1 | ||||||||||||
Group Inc. | $ 83,537 | $34,362 | $117,899 | |||||||||
Subsidiaries | 1,978 | 989 | 2,967 | |||||||||
Floating-rate obligations 2 | ||||||||||||
Group Inc. | 19,446 | 16,168 | 35,614 | |||||||||
Subsidiaries | 3,144 | 1,341 | 4,485 | |||||||||
Total | $108,105 | $52,860 | $160,965 | |||||||||
| 1. | Interest rates on U.S. dollar-denominated debt ranged from |
| 2. | Floating interest rates generally are based on LIBOR or |
|
THE GOLDMAN SACHS GROUP, INC. AND SUBSIDIARIES
Notes to Consolidated Financial Statements
The table below presents unsecured long-term borrowings by maturity date.
| As of December 2014 | ||||||||||||
| $ in millions | Group Inc. | Subsidiaries | Total | |||||||||
2016 | $ 22,368 | $ 789 | $ 23,157 | |||||||||
2017 | 20,818 | 367 | 21,185 | |||||||||
2018 | 22,564 | 1,272 | 23,836 | |||||||||
2019 | 14,718 | 1,791 | 16,509 | |||||||||
2020 - thereafter | 78,098 | 4,786 | 82,884 | |||||||||
Total 1 | $158,566 | $9,005 | $167,571 | |||||||||
| 1. | Includes $9.54 billion of adjustments to the carrying value of certain unsecured long-term borrowings resulting from the application of hedge accounting by year of maturity as follows: $485 million in 2016, $738 million in 2017, $816 million in 2018, $459 million in 2019 and $7.04 billion in 2020 and thereafter. |
In the table below:above:
| Ÿ |
|
| Ÿ |
|
| Ÿ |
|
As of December 2011 | ||||||
| in millions | Group Inc. | Subsidiaries | Total | |||
2013 | $ 25,024 | $ 185 | $ 25,209 | |||
2014 | 19,981 | 358 | 20,339 | |||
2015 | 16,578 | 272 | 16,850 | |||
2016 | 25,507 | 163 | 25,670 | |||
2017 - thereafter | 79,132 | 6,345 | 85,477 | |||
Total 1 | $166,222 | $7,323 | $173,545 | |||
|
The aggregate contractual principal amount of unsecured long-term borrowings (principal and non-principal protected) for which the fair value option was elected exceeded the related fair value by $693 million and $349 million as of December 2011 and December 2010, respectively.
The firm designates certain derivatives as fair value hedges to effectively convert a substantial portion of its fixed-rate unsecured long-term borrowings which are not accounted for at fair value into floating-rate obligations. Accordingly, excluding the cumulative impact of changes in the firm’s credit spreads, the carrying value of unsecured long-term borrowings approximated fair value as of December 20112014 and December 2010.2013. See Note 7 for further information about hedging activities. For unsecured long-term borrowings for which the firm did not elect the fair value option, the cumulative impact due to changes in the firm’s own credit spreads would be a reductionan increase of 2% and 3% in the carrying value of total unsecured long-term borrowings of less than 4% as of both December 20112014 and December 2010. See Note 72013, respectively. As these borrowings are not accounted for further information about hedging activities.at fair value under the fair value option or at fair value in accordance with other U.S. GAAP, their fair value is not included in the firm’s fair value hierarchy in Notes 6 through 8. Had these borrowings been included in the firm’s fair value hierarchy, substantially all would have been classified in level 2 as of December 2014 and December 2013.
| Goldman Sachs 2014 Form 10-K | 181 |
THE GOLDMAN SACHS GROUP, INC. AND SUBSIDIARIES
Notes to Consolidated Financial Statements
The tabletables below presentspresent unsecured long-term borrowings, after giving effect to hedging activities that converted a substantial portion of fixed-rate obligations to floating-rate obligations.
| As of December 2011 | As of December 2010 | |||||||||||||||||||||||||||||
| in millions | Group Inc. | Subsidiaries | Total | Group Inc. | Subsidiaries | Total | ||||||||||||||||||||||||
Fixed-rate obligations | ||||||||||||||||||||||||||||||
At fair value | $ | 10 | $ | 66 | $ | 76 | $ | 16 | $ | 6 | $ | 22 | ||||||||||||||||||
At amortized cost 1, 2 | 26,839 | 1,934 | 28,773 | 3,956 | 1,921 | 5,877 | ||||||||||||||||||||||||
Floating-rate obligations At fair value | 12,903 | 4,183 | 17,086 | 13,428 | 4,720 | 18,148 | ||||||||||||||||||||||||
At amortized cost 1, 2 | 126,470 | 1,140 | 127,610 | 150,219 | 133 | 150,352 | ||||||||||||||||||||||||
Total | $ | 166,222 | $ | 7,323 | $ | 173,545 | $ | 167,619 | $ | 6,780 | $ | 174,399 | ||||||||||||||||||
| As of December 2014 | ||||||||||||
| $ in millions | Group Inc. | Subsidiaries | Total | |||||||||
Fixed-rate obligations | ||||||||||||
At fair value | $ — | $ 861 | $ 861 | |||||||||
At amortized cost 1 | 31,296 | 2,452 | 33,748 | |||||||||
Floating-rate obligations | ||||||||||||
At fair value | 11,661 | 3,483 | 15,144 | |||||||||
At amortized cost 1 | 115,609 | 2,209 | 117,818 | |||||||||
Total | $158,566 | $9,005 | $167,571 | |||||||||
| As of December 2013 | ||||||||||||
| $ in millions | Group Inc. | Subsidiaries | Total | |||||||||
Fixed-rate obligations | ||||||||||||
At fair value | $ — | $ 471 | $ 471 | |||||||||
At amortized cost 1 | 31,741 | 1,959 | 33,700 | |||||||||
Floating-rate obligations | ||||||||||||
At fair value | 8,671 | 2,549 | 11,220 | |||||||||
At amortized cost 1 | 113,101 | 2,473 | 115,574 | |||||||||
Total | $153,513 | $7,452 | $160,965 | |||||||||
| 1. | The weighted average interest rates on the aggregate amounts were |
|
THE GOLDMAN SACHS GROUP, INC. AND SUBSIDIARIES
Notes to Consolidated Financial Statements
Subordinated Borrowings
Unsecured long-term borrowings include subordinated debt and junior subordinated debt. Junior subordinated debt is junior in right of payment to other subordinated borrowings, which are junior to senior borrowings. As of December 20112014 and
December 2010,2013, subordinated debt had maturities ranging from 2017 to 2038, and 20122015 to 2038, respectively. The tabletables below presentspresent subordinated borrowings.
| As of December 2011 | As of December 2010 | As of December 2014 | ||||||||||||||||||||||||||||||||||||
| in millions | Par Amount | Carrying Amount | Rate 1 | Par Amount | Carrying Amount | Rate 1 | ||||||||||||||||||||||||||||||||
| $ in millions | | Par Amount | | | Carrying Amount | | Rate | 1 | ||||||||||||||||||||||||||||||
Subordinated debt 2 | $ | 14,310 | $17,362 | 4.39 | % 3 | $ | 14,345 | $ | 16,977 | 1.19 | % | $14,254 | $17,241 | 3.77% | ||||||||||||||||||||||||
Junior subordinated debt | 5,085 | 6,533 | 2.43 | % | 5,082 | 5,716 | 2.50 | % | 1,582 | 2,122 | 6.21% | |||||||||||||||||||||||||||
Total subordinated borrowings | $ | 19,395 | $23,895 | 3.87 | % | $ | 19,427 | $ | 22,693 | 1.54 | % | $15,836 | $19,363 | 4.02% | ||||||||||||||||||||||||
| As of December 2013 | ||||||||||||||||||||||||||||||||||||||
| $ in millions | | Par Amount | | | Carrying Amount | | Rate | 1 | ||||||||||||||||||||||||||||||
Subordinated debt 2 | $14,508 | $16,982 | 4.16% | |||||||||||||||||||||||||||||||||||
Junior subordinated debt | 2,835 | 3,760 | 4.79% | |||||||||||||||||||||||||||||||||||
Total subordinated borrowings | $17,343 | $20,742 | 4.26% | |||||||||||||||||||||||||||||||||||
| 1. | Weighted average interest |
| 2. | Par amount and carrying amount of subordinated debt issued by Group Inc. |
|
Junior Subordinated Debt
Junior Subordinated Debt Issued to APEXHeld by 2012 Trusts. In 2007, Group Inc.2012, the Vesey Street Investment Trust I and the Murray Street Investment Trust I (together, the 2012 Trusts) issued a totalan aggregate of $2.25 billion of remarketablesenior guaranteed trust securities to third parties. The proceeds of that offering were used to purchase $1.75 billion of junior subordinated debt toissued by Group Inc. that pays interest semi-annually at a fixed annual rate of 4.647% and matures on March 9, 2017, and $500 million of junior subordinated debt issued by Group Inc. that pays interest semi-annually at a fixed annual rate of 4.404% and matures on September 1, 2016. During 2014, the firm exchanged $175 million of the senior guaranteed trust securities held by the firm for $175 million of junior subordinated debt held by the Murray Street Investment Trust I. Following the exchange, these senior guaranteed trust securities and junior subordinated debt were extinguished.
The 2012 Trusts purchased the junior subordinated debt from Goldman Sachs Capital II and Goldman Sachs Capital III (APEX Trusts), Delaware statutory trusts.. The APEX Trusts issued $2.25 billion of guaranteed perpetual Normal Automatic Preferred Enhanced Capital Securities (APEX)used the proceeds from such sales to third parties and a de minimis amount of common securities to Group Inc. Group Inc. also entered into contracts with the APEX Trusts to sell $2.25 billionpurchase shares of Group Inc. perpetual non-cumulative preferred stock (the stock purchase contracts)’s Perpetual Non-Cumulative Preferred Stock, Series E (Series E Preferred Stock) and Perpetual Non-Cumulative Preferred Stock, Series F (Series F Preferred Stock). See Note 19 for more information about the preferred stock that Group Inc. will issue in connection with the stock purchase contracts.Series E and Series F Preferred Stock.
The APEX2012 Trusts are wholly-owned finance subsidiaries ofrequired to pay distributions on their senior guaranteed trust securities in the firm for regulatorysame amounts and legal purposes buton the same dates that they are not consolidated for accounting purposes.
The firm accounted forscheduled to receive interest on the stock purchase contracts as equity instruments and, accordingly, recorded the cost of the stock purchase contracts as a reduction to additional paid-in capital.
The firm pays interest semi-annually on $1.75 billion of junior subordinated debt issuedthey hold, and are required to Goldman Sachs Capital II at a fixed annual rateredeem their respective senior guaranteed trust securities upon the maturity or earlier redemption of 5.59% and the debt matures on June 1, 2043. The firm pays interest quarterly on $500 million of junior subordinated debt issued to Goldman Sachs Capital III at a rate per annum equal to
three-month LIBOR plus 0.57% and the debt matures on September 1, 2043. In addition, the firm makes contract payments at a rate of 0.20% per annum on the stock purchase contracts held by the APEX Trusts.they hold.
The firm has the right to defer payments on the junior subordinated debt, and the stock purchase contracts, subject to limitations, and therefore cause payment on the APEX to be deferred.limitations. During any such extensiondeferral period, the firm will not be permitted to, among other things, pay dividends on or make certain repurchases of its common or preferred stock. However, as Group Inc. fully and unconditionally guarantees the payment of the distribution and redemption amounts when due on a senior basis on the senior guaranteed trust securities issued by the 2012 Trusts, if the 2012 Trusts are unable to make scheduled distributions to the holders of the senior guaranteed trust securities, under the guarantee, Group Inc. would be obligated to make those payments. As such, the $2.08 billion of junior subordinated debt held by the 2012 Trusts for the benefit of investors, included in “Unsecured long-term borrowings” in the consolidated statements of financial condition, is not classified as subordinated borrowings.
| 182 | Goldman Sachs 2014 Form 10-K |
THE GOLDMAN SACHS GROUP, INC. AND SUBSIDIARIES
In connection withNotes to Consolidated Financial Statements
The APEX Trusts and the APEX issuance,2012 Trusts are Delaware statutory trusts sponsored by the firm and wholly-owned finance subsidiaries of the firm for regulatory and legal purposes but are not consolidated for accounting purposes.
The firm has covenanted in favor of certain of its debtholders, who were initially and are currently the holders of Group Inc.’s 6.345% Junior Subordinated Debenturesjunior subordinated debt due February 15, 2034, that, subject to certain exceptions, the firm wouldwill not redeem or purchase (i) Group Inc.’s junior subordinated debtthe capital securities issued toby the APEX Trusts prior to the applicable stock purchase date or (ii) APEX or shares of Group Inc.’s perpetual Non-CumulativeSeries E or Series F Preferred Stock Series E (Series E Preferred Stock) or perpetual Non-Cumulative Preferred Stock, Series F (Series F Preferred Stock) prior to the datespecified dates in 2022 for a price that is ten years after the applicable stock purchase date, unless the applicable redemption or purchase price does not exceedexceeds a maximum amount determined by reference to the aggregate amount of net cash proceeds that the firm has received from the sale of qualifying equity securities during the 180-day period preceding the redemption or purchase.securities.
THE GOLDMAN SACHS GROUP, INC. AND SUBSIDIARIES
Notes to Consolidated Financial Statements
Junior Subordinated Debt Issued in Connection with Trust Preferred Securities.Group Inc. issued $2.84 billion of junior subordinated debenturesdebt in 2004 to Goldman Sachs Capital I (Trust), a Delaware statutory trust. The Trust issued $2.75 billion of guaranteed preferred beneficial interests (Trust Preferred Securities) to third parties and $85 million of common beneficial interests to Group Inc. and used the proceeds from the issuances to purchase the junior subordinated debenturesdebt from Group Inc. During the second quarter of 2014, the firm purchased $1.22 billion (par amount) of Trust Preferred Securities and delivered these securities, along with $37.6 million of common beneficial interests, to the Trust in the third quarter of 2014 in exchange for a corresponding par amount of the junior subordinated debt. Following the exchange, these Trust Preferred Securities, common beneficial interests and junior subordinated debt were extinguished and the firm recognized a gain of $289 million ($270 million of which was recorded at extinguishment in the third quarter of 2014), which is included in “Market making” in the consolidated statements of earnings. Subsequent to this exchange, during the second half of 2014, the firm purchased $214 million (par amount) of Trust Preferred Securities and delivered these securities, along with $6.6 million of common beneficial interests, to the Trust in February 2015 in exchange for a corresponding par amount of the junior subordinated debt. The Trust is a wholly-owned finance subsidiary of the firm for regulatory and legal purposes but is not consolidated for accounting purposes.
The firm pays interest semi-annually on the debenturesjunior subordinated debt at an annual rate of 6.345% and the debentures maturedebt matures on February 15, 2034. The coupon rate and the payment dates applicable to the beneficial interests are the same as the interest rate and payment dates for the debentures.junior subordinated debt. The firm has the right, from time to time, to defer payment of interest on the debentures,junior subordinated debt, and therefore cause payment on the Trust’s preferred beneficial interests to be deferred, in each case up to ten consecutive semi-annual periods. During any such extensiondeferral period, the firm will not be permitted to, among other things, pay dividends on or make certain repurchases of its common stock. The Trust is not permitted to pay any distributions on the common beneficial interests held by Group Inc. unless all dividends payable on the preferred beneficial interests have been paid in full.
Other Liabilities and Accrued Expenses
The table below presents other liabilities and accrued expenses by type.
| As of December | As of December | |||||||||||||||
| in millions | 2011 | 2010 | ||||||||||||||
| $ in millions | 2014 | 2013 | ||||||||||||||
Compensation and benefits | $ | 5,701 | $ | 9,089 | $ 8,368 | $ 7,874 | ||||||||||
Insurance-related liabilities | 18,614 | 11,381 | ||||||||||||||
Noncontrolling interests 1 | 1,450 | 872 | 404 | 326 | ||||||||||||
Income tax-related liabilities 2 | 533 | 2,042 | ||||||||||||||
Income tax-related liabilities | 1,533 | 1,974 | ||||||||||||||
Employee interests in consolidated funds | 305 | 451 | 176 | 210 | ||||||||||||
Subordinated liabilities issued | 1,090 | 1,526 | 843 | 477 | ||||||||||||
Accrued expenses and other | 4,108 | 4,650 | 4,751 | 5,183 | ||||||||||||
Total | $ | 31,801 | $ | 30,011 | $16,075 | $16,044 | ||||||||||
| 1. |
|
|
The table below presents insurance-related liabilities by type.
| As of December | ||||||||
| in millions | 2011 | 2010 | ||||||
Separate account liabilities | $ | 3,296 | $ | 4,024 | ||||
Liabilities for future benefits | 14,213 | 6,308 | ||||||
Contract holder account balances | 835 | 801 | ||||||
Reserves for guaranteed minimum death | 270 | 248 | ||||||
Total | $ | 18,614 | $ | 11,381 | ||||
|
Separate account liabilities are supported by separate account assets, representing segregated contract holder funds under variable annuity and life insurance contracts. Separate account assets are included in “Cash and securities segregated for regulatory and other purposes.”
Liabilities for future benefits and unpaid claims include liabilities arising from reinsurance provided by the firm to other insurers. The firm had a receivable of $1.30 billion and $1.26 billion as of December 2011 and December 2010, respectively, related to such reinsurance contracts, which is reported in “Receivables from customers and counterparties.” In addition, the firm has ceded risks to reinsurers related to certain of its liabilities for future benefits and unpaid claims and had a receivable of $648 million and $839 million as of December 2011 and December 2010, respectively, related to such reinsurance contracts, which is reported in “Receivables from customers and counterparties.” Contracts to cede risks to reinsurers do not relieve the firm of its obligations to contract holders. Liabilities for future benefits and unpaid claims include $8.75 billion and $2.05 billion carried at fair value under the fair value option as of December 2011 and December 2010, respectively.
Reserves for guaranteed minimum death and income benefits represent a liability for the expected value of guaranteed benefits in excess of projected annuity account balances. These reserves are based on total payments expected to be made less total fees expected to be assessed over the life of the contract.
| Goldman Sachs | 183 |
THE GOLDMAN SACHS GROUP, INC. AND SUBSIDIARIES
Notes to Consolidated Financial Statements
Commitments, Contingencies and Guarantees
Commitments
The table below presents the firm’s commitments.
Commitment Amount by Period of Expiration as of December 2011 | Total Commitments as of December | |||||||||||||||||||||||||
| in millions | 2012 | 2013- 2014 | 2015- 2016 | 2017- Thereafter | 2011 | 2010 | ||||||||||||||||||||
Commitments to extend credit 1 Commercial lending: Investment-grade | $ | 5,014 | $ | 4,266 | $ | 10,344 | $ | 45 | $ | 19,669 | $ | 12,330 | ||||||||||||||
Non-investment-grade | 1,585 | 3,939 | 7,608 | 761 | 13,893 | 11,919 | ||||||||||||||||||||
William Street credit extension program | 5,515 | 6,291 | 19,740 | 390 | 31,936 | 27,383 | ||||||||||||||||||||
Warehouse financing | 58 | 189 | — | — | 247 | 265 | ||||||||||||||||||||
Total commitments to extend credit | 12,172 | 14,685 | 37,692 | 1,196 | 65,745 | 51,897 | ||||||||||||||||||||
Contingent and forward starting resale and securities borrowing agreements 2 | 54,522 | — | — | — | 54,522 | 46,886 | ||||||||||||||||||||
Forward starting repurchase and secured lending agreements 2 | 17,964 | — | — | — | 17,964 | 12,509 | ||||||||||||||||||||
Underwriting commitments | — | — | — | — | — | 835 | ||||||||||||||||||||
Letters of credit 3 | 1,145 | 58 | 145 | 5 | 1,353 | 2,210 | ||||||||||||||||||||
Investment commitments | 2,455 | 4,764 | 439 | 1,460 | 9,118 | 11,093 | ||||||||||||||||||||
Other | 5,200 | 101 | 34 | 7 | 5,342 | 4,396 | ||||||||||||||||||||
Total commitments | $ | 93,458 | $ | 19,608 | $ | 38,310 | $ | 2,668 | $ | 154,044 | $ | 129,826 | ||||||||||||||
|
|
|
Commitment Amount by Period of Expiration as of December 2014 | Total Commitments as of December | |||||||||||||||||||||||||
| $ in millions | 2015 | | 2016 - 2017 | | | 2018 - 2019 | | | 2020 - Thereafter | | 2014 | 2013 | ||||||||||||||
Commitments to extend credit | ||||||||||||||||||||||||||
Commercial lending: | ||||||||||||||||||||||||||
Investment-grade | $ 9,712 | $15,003 | $36,200 | $2,719 | $ 63,634 | $ 60,499 | ||||||||||||||||||||
Non-investment-grade | 4,136 | 7,080 | 14,111 | 4,278 | 29,605 | 25,412 | ||||||||||||||||||||
Warehouse financing | 1,306 | 1,152 | 112 | 140 | 2,710 | 1,716 | ||||||||||||||||||||
Total commitments to extend credit | 15,154 | 23,235 | 50,423 | 7,137 | 95,949 | 87,627 | ||||||||||||||||||||
Contingent and forward starting resale and securities borrowing agreements | 34,343 | 557 | 325 | — | 35,225 | 34,410 | ||||||||||||||||||||
Forward starting repurchase and secured lending agreements | 8,180 | — | — | — | 8,180 | 8,256 | ||||||||||||||||||||
Letters of credit | 280 | 14 | 10 | 4 | 308 | 501 | ||||||||||||||||||||
Investment commitments | 1,684 | 2,818 | 25 | 637 | 5,164 | 7,116 | ||||||||||||||||||||
Other | 6,136 | 87 | 42 | 56 | 6,321 | 3,955 | ||||||||||||||||||||
Total commitments | $65,777 | $26,711 | $50,825 | $7,834 | $151,147 | $141,865 | ||||||||||||||||||||
Commitments to Extend Credit
The firm’s commitments to extend credit are agreements to lend with fixed termination dates and depend on the satisfaction of all contractual conditions to borrowing. These commitments are presented net of amounts syndicated to third parties. The total commitment amount does not necessarily reflect actual future cash flows because the firm may syndicate all or substantial additional portions of these commitments andcommitments. In addition, commitments can expire unused or be reduced or cancelled at the counterparty’s request.
As of December 2014 and December 2013, $66.22 billion and $35.66 billion, respectively, of the firm’s lending commitments were held for investment and were accounted for on an accrual basis. See Note 9 for further information about such commitments.
The firm generally accounts for the remaining commitments to extend credit at fair value. Losses, if any, are generally recorded, net of any fees in “Other principal transactions.”
Commercial Lending.The firm’s commercial lending commitments are generally extended to investment-grade and non-investment-grade corporate borrowers. Commitments to investment-grade corporate borrowers are principally used for operating liquidity and general corporate purposes. The firm also extends lending commitments in connection with contingent acquisition financing and other types of corporate lending as well as commercial real estate financing. Commitments that are extended for contingent
acquisition financing are often intended to be short-term in nature, as borrowers often seek to replace them with other funding sources.
William Street Credit Extension Program.Substantially all of the commitments provided under the William Street credit extension program are to investment-grade corporate borrowers. Commitments under the program are principally extended by GS Bank USA and its subsidiaries, including William Street Commitment Corporation (Commitment Corp.). Historically, commitments extended by Commitment Corp. were supported, in part, by funding raised by Funding Corp., another consolidated wholly-owned subsidiary of GS Bank USA. As of April 26, 2011, the funding raised by Funding Corp. had been repaid in its entirety. The commitments extended by Commitment Corp. that had been supported by this funding are now supported by funding from GS Bank USA.
| 184 | Goldman Sachs |
THE GOLDMAN SACHS GROUP, INC. AND SUBSIDIARIES
Notes to Consolidated Financial Statements
The assets and liabilities of Commitment Corp. are legally separated from other assets and liabilities of the firm. The assets of Commitment Corp. will not be available to its shareholders until the claims of its creditors have been paid. In addition, no affiliate of Commitment Corp., except in limited cases as expressly agreed in writing, is responsible for any obligation of Commitment Corp.
Sumitomo Mitsui Financial Group, Inc. (SMFG) provides the firm with credit loss protection thaton certain approved loan commitments (primarily investment-grade commercial lending commitments). The notional amount of such loan commitments was $27.51 billion and $29.24 billion as of December 2014 and December 2013, respectively. The credit loss protection on loan commitments provided by SMFG is generally limited to 95% of the first loss the firm realizes on approved loansuch commitments, up to a maximum of approximately $950 million, with respect to most of the William Street commitments.million. In addition, subject to the satisfaction of certain conditions, upon the firm’s request, SMFG will provide protection for 70% of additional losses on such commitments, up to a maximum of $1.13 billion, of which $300$768 million and $375$870 million of protection had been provided as of December 20112014 and December 2010,2013, respectively. The firm also uses other financial instruments to mitigate credit risks related to certain William Street commitments not covered by SMFG. These instruments primarily include credit default swaps that reference the same or similar underlying instrument or entity, or credit default swaps that reference a market index.
Warehouse Financing.The firm provides financing to clients who warehouse financial assets. These arrangements are secured by the warehoused assets, primarily consisting of residentialcorporate loans and commercial mortgages.mortgage loans.
Contingent and Forward Starting Resale and Securities Borrowing Agreements/Forward Starting Repurchase and Secured Lending Agreements
The firm enters into resale and securities borrowing agreements and repurchase and secured lending agreements that settle at a future date.date, generally within three business days. The firm also enters into commitments to provide contingent financing to its clients and counterparties through resale agreements. The firm’s funding of these commitments depends on the satisfaction of all contractual conditions to the resale agreement and these commitments can expire unused.
Letters of Credit
The firm has commitments under letters of credit issued by various banks which the firm provides to counterparties in lieu of securities or cash to satisfy various collateral and margin deposit requirements.
Investment Commitments
The firm’s investment commitments consist of $5.16 billion and $7.12 billion as of December 2014 and December 2013, respectively, include commitments to invest in private equity, real estate and other assets directly and through funds that the firm raises and manages. These commitments include $1.62Of these amounts, $2.87 billion and $1.97$5.48 billion as of December 20112014 and December 2010, respectively, related to real estate private investments and $7.50 billion and $9.12 billion as of December 2011 and December 2010, respectively, related to corporate and other private investments. Of these amounts, $8.38 billion and $10.10 billion as of December 2011 and December 2010,2013, respectively, relate to commitments to invest in funds managed by the firm, which willfirm. If these commitments are called, they would be funded at market value on the date of investment.
Leases
The firm has contractual obligations under long-term noncancelable lease agreements, principally for office space, expiring on various dates through 2069. Certain agreements are subject to periodic escalation provisions for increases in real estate taxes and other charges. The table below presents future minimum rental payments, net of minimum sublease rentals.
| in millions | As of December 2011 | |||
2012 | $ | 440 | ||
2013 | 420 | |||
2014 | 385 | |||
2015 | 337 | |||
2016 | 301 | |||
2017 - thereafter | 1,380 | |||
Total | $ | 3,263 | ||
| $ in millions | | As of December 2014 | | |
2015 | $ 321 | |||
2016 | 292 | |||
2017 | 274 | |||
2018 | 226 | |||
2019 | 190 | |||
2020 - thereafter | 870 | |||
Total | $2,173 | |||
Rent charged to operating expense was $309 million for the years ended December 2011, December 20102014, $324 million for 2013 and December 2009 was $475$374 million $508 million and $434 million, respectively.for 2012.
Operating leases include office space held in excess of current requirements. Rent expense relating to space held for growth is included in “Occupancy.” The firm records a liability, based on the fair value of the remaining lease rentals reduced by any potential or existing sublease rentals, for leases where the firm has ceased using the space and management has concluded that the firm will not derive any future economic benefits. Costs to terminate a lease before the end of its term are recognized and measured at fair value on termination.
| Goldman Sachs | 185 |
THE GOLDMAN SACHS GROUP, INC. AND SUBSIDIARIES
Notes to Consolidated Financial Statements
Contingencies
Legal Proceedings. See Note 27 for information about legal proceedings, including certain mortgage-related matters.matters, and agreements the firm has entered into to toll the statute of limitations.
Certain Mortgage-Related Contingencies. There are multiple areas of focus by regulators, governmental agencies and others within the mortgage market that may impact originators, issuers, servicers and investors. There remains significant uncertainty surrounding the nature and extent of any potential exposure for participants in this market.
| Ÿ | Representations and Warranties.The firm has not been a significant originator of residential mortgage loans. The firm did purchase loans originated by others and generally received loan-level representations of the type described below from the originators. During the period 2005 through 2008, the firm sold approximately $10 billion of loans to government-sponsored enterprises and approximately $11 billion of loans to other third parties. In addition, the firm transferred loans to trusts and other mortgage securitization vehicles. As of December |
The loan level representations made in connection with the sale or securitization of mortgage loans varied among transactions but were generally detailed representations applicable to each loan in the portfolio and addressed matters relating to the property, the borrower and the note. These representations generally included, but were not limited to, the following: (i) certain attributes of the borrower’s financial status; (ii) loan-to-value ratios, owner occupancy status and certain other characteristics of the property; (iii) the lien position; (iv) the fact that the loan was originated in compliance with law; and (v) completeness of the loan documentation. |
The loan level representations made in connection with the sale or securitization of mortgage loans varied among transactions but were generally detailed representations applicable to each loan in the portfolio and addressed matters relating to the property, the borrower and the note. These representations generally included, but were not limited to, the following: (i) certain attributes of the borrower’s financial status; (ii) loan-to-value ratios, owner occupancy status and certain other characteristics of the property; (iii) the lien position; (iv) the fact that the loan was originated in compliance with law; and (v) completeness of the loan documentation.
The firm has received repurchase claims for residential mortgage loans based on alleged breaches of representations from government-sponsored enterprises, other third parties, trusts and other mortgage securitization vehicles, which have not been significant. During both the years ended December 2014 and December 2013, the firm repurchased loans with an unpaid principal balance of less than $10 million and related losses were not material. The firm has received a communication from counsel purporting to represent certain institutional investors in portions of Goldman Sachs-issued securitizations between 2003 and 2007, such securitizations having a total original notional face amount of approximately $150 billion, offering to enter into a “settlement dialogue” with respect to alleged breaches of representations made by Goldman Sachs in connection with such offerings. |
To date, repurchase claims and actual repurchases of residential mortgage loans based upon alleged breaches of representations have not been significant and have mainly involved government-sponsored enterprises. During the year ended December 2011, the firm repurchased loans with an unpaid principal balance of less than $10 million. During the year ended December 2010, the firm repurchased loans with an unpaid principal balance of less than $50 million. The loss related to the repurchase of these loans was not material for the years ended December 2011 and December 2010.
Ultimately, the firm’s exposure to claims for repurchase of residential mortgage loans based on alleged breaches of representations will depend on a number of factors including the following: (i) the extent to which these claims are actually made; (ii) the extent to which there are underlying breaches of representations that give rise to valid claims for repurchase; (iii) in the case of loans originated by others, the extent to which the firm could be held liable and, if it is, the firm’s ability to pursue and collect on any claims against the parties who made representations to the firm; (iv) macro-economic factors, including developments in the residential real estate market; and (v) legal and regulatory developments.
Ultimately, the firm’s exposure to claims for repurchase of residential mortgage loans based on alleged breaches of representations will depend on a number of factors including the following: (i) the extent to which these claims are actually made within the statute of limitations taking into consideration the agreements to toll the statute of limitations the firm has entered into with trustees representing trusts; (ii) the extent to which there are underlying breaches of representations that give rise to valid claims for repurchase; (iii) in the case of loans originated by others, the extent to which the firm could be held liable and, if it is, the firm’s ability to pursue and collect on any claims against the parties who made representations to the firm; (iv) macroeconomic factors, including developments in the residential real estate market; and (v) legal and regulatory developments. Based upon the large number of defaults in residential mortgages, including those sold or securitized by the firm, there is a potential for increasing claims for repurchases. However, the firm is not in a position to make a meaningful estimate of that exposure at this time. |
| 186 | Goldman Sachs |
THE GOLDMAN SACHS GROUP, INC. AND SUBSIDIARIES
Notes to Consolidated Financial Statements
| Ÿ | Foreclosure and Other Mortgage Loan Servicing Practices and Procedures.The firm had received a number of requests for information from regulators and other agencies, including state attorneys general and banking regulators, as part of an industry-wide focus on the practices of lenders and servicers in connection with foreclosure proceedings and other aspects of mortgage loan servicing practices and procedures. The requests sought information about the foreclosure and servicing protocols and activities of Litton Loan Servicing LP (Litton), a residential mortgage servicing subsidiary sold by the firm to |
In connection with the sale of Litton, the firm |
The firm further agreed to provide indemnities |
Under the Litton sale agreement the firm also retained liabilities associated with claims related to Litton’s failure to maintain lender-placed mortgage insurance, obligations to repurchase certain loans from government-sponsored enterprises, subpoenas from one of |
On September 1, 2011, Group Inc. and GS Bank USA entered into a Consent Order (the Order) with the Board of Governors of the Federal Reserve System (Federal Reserve Board) relating to the servicing of residential mortgage loans. The terms of the Order are substantially similar and, in many respects, identical to the orders entered into with the Federal Reserve Board by other large U.S. financial institutions. The Order sets forth various allegations of
improper conduct in servicing by Litton, requires that Group Inc. and GS Bank USA cease and desist such conduct, and requires that Group Inc. and GS Bank USA, and their boards of directors, take various affirmative steps. The Order requires (i) Group Inc. and GS Bank USA to engage a third-party consultant to conduct a review of certain foreclosure actions or proceedings that occurred or were pending between January 1, 2009 and December 31, 2010; (ii) the adoption of policies and procedures related to management of third parties used to outsource residential mortgage servicing, loss mitigation or foreclosure; (iii) a “validation report” from an independent third-party consultant regarding compliance with the Order for the first year; and (iv) submission of quarterly progress reports as to compliance with the Order by the boards of directors (or committees thereof) of Group Inc. and GS Bank USA.
In addition, on September 1, 2011, GS Bank USA entered into an Agreement on Mortgage Servicing Practices with the New York State Banking Department, Litton and the acquirer of Litton relating to the servicing of residential mortgage loans, and, in a related agreement with the New York State Banking Department, Group Inc. agreed to forgive 25% of the unpaid principal balance on certain delinquent first lien residential mortgage loans owned by Group Inc. or a subsidiary, totaling approximately $13 million in principal forgiveness.
Guaranteed Minimum Death and Income Benefits.Other Contingencies.In connection with its insurance business,the sale of Metro, the firm is contingently liableprovided customary representations and warranties, and indemnities for breaches of these representations and warranties, to the buyer. The firm further agreed to provide guaranteed minimum death and income benefitsindemnities to certain contract holders and has established a reserve relatedthe buyer, which primarily relate to $5.52 billion and $6.11 billionpotential liabilities for legal or regulatory proceedings arising out of contract holder account balances asthe conduct of December 2011 and December 2010, respectively, for such benefits. The weighted average attained age of these contract holdersMetro’s business while it was 69 years for both December 2011 and December 2010.owned by the firm.
The net amount at risk, representing guaranteed minimum death and income benefits in excess of contract holder account balances, was $1.51 billion and $1.60 billion as of December 2011 and December 2010, respectively. See Note 17 for further information about insurance liabilities.
| Goldman Sachs | 187 |
THE GOLDMAN SACHS GROUP, INC. AND SUBSIDIARIES
Notes to Consolidated Financial Statements
Guarantees
Derivative Guarantees.The firm enters into various derivatives that meet the definition of a guarantee under U.S. GAAP, including written equity and commodity put options, written currency contracts and interest rate caps, floors and swaptions. These derivatives are risk managed together with derivatives that do not meet the definition of a guarantee, and therefore the amounts in the tables below do not reflect the firm’s overall risk related to its derivative activities. Disclosures about derivatives are not required if they may be cash settled and the firm has no basis to conclude it is probable that the counterparties held the underlying instruments at inception of the contract. The firm has concluded that these conditions have been met for certain large, internationally active commercial and investment bank counterparties, central clearing counterparties and certain other counterparties. Accordingly, the firm has not included such contracts in the tabletables below.
Derivatives are accounted for at fair value and therefore the carrying value is considered the best indication of payment/performance risk for individual contracts. However, the carrying values in the tables below exclude the effect of counterparty and cash collateral netting.
Securities Lending Indemnifications.The firm, in its capacity as an agency lender, indemnifies most of its securities lending customers against losses incurred in the event that borrowers do not return securities and the collateral held is insufficient to cover the market value of the securities borrowed. Collateral held by the lenders in connection with securities lending indemnifications was $28.49 billion and $27.14 billion as of December 2014 and December 2013, respectively. Because the contractual nature of these arrangements requires the firm to obtain collateral with a market value that exceeds the value of the securities lent to the borrower, there is minimal performance risk associated with these guarantees.
Other Financial Guarantees.In the ordinary course of business, the firm provides other financial guarantees of the obligations of third parties (e.g., standby letters of credit and other guarantees to enable
clients to complete transactions and fund-related guarantees). These guarantees represent obligations to make payments to beneficiaries if the guaranteed party fails to fulfill its obligation under a contractual arrangement with that beneficiary.
The tabletables below presents certainpresent information about certain derivatives that meet the definition of a guarantee, securities lending indemnifications and certain other guarantees. The maximum payout in the tabletables below is based on the notional amount of the contract and therefore does not represent anticipated losses. See Note 7 for further information about credit derivatives that meet the definition of a guarantee which are not included below. The tables below also exclude certain commitments to issue standby letters of credit that are included in “Commitments to extend credit.” See the table in “Commitments” above for a summary of the firm’s commitments.
Because derivatives are accounted for at fair value, the carrying value is considered the best indication of payment/performance risk for individual contracts. However, the carrying values below exclude the effect of a legal right of setoff that may exist under an enforceable netting agreement and the effect of netting of cash collateral posted under credit support agreements.
| As of December 2014 | ||||||||||||
| $ in millions | Derivatives | | Securities lending indemnifications | | | Other financial guarantees | | |||||
Carrying Value of Net Liability | $ 11,201 | $ — | $ 119 | |||||||||
Maximum Payout/Notional Amount by Period of Expiration |
| |||||||||||
2015 | $351,308 | $27,567 | $ 471 | |||||||||
2016 - 2017 | 150,989 | — | 935 | |||||||||
2018 - 2019 | 51,927 | — | 1,390 | |||||||||
2020 - Thereafter | 58,511 | — | 1,690 | |||||||||
Total | $612,735 | $27,567 | $4,486 | |||||||||
| As of December 2013 | ||||||||||||
| $ in millions | Derivatives | | Securities lending | | | Other financial guarantees | | |||||
Carrying Value of Net Liability | $ 7,634 | $ — | $ 213 | |||||||||
Maximum Payout/Notional Amount by Period of Expiration |
| |||||||||||
2014 | $517,634 | $26,384 | $1,361 | |||||||||
2015 - 2016 | 180,543 | — | 620 | |||||||||
2017 - 2018 | 39,367 | — | 1,140 | |||||||||
2019 - Thereafter | 57,736 | — | 1,046 | |||||||||
Total | $795,280 | $26,384 | $4,167 | |||||||||
| As of December 2011 | ||||||||||||||||||||||||
| Maximum Payout/Notional Amount by Period of Expiration | ||||||||||||||||||||||||
| in millions | Carrying Net Liability | 2012 | 2013- 2014 | 2015- 2016 | 2017- Thereafter | Total | ||||||||||||||||||
Derivatives 1 | $ | 11,881 | $ | 486,244 | $ | 206,853 | $ | 53,743 | $ | 49,576 | $ | 796,416 | ||||||||||||
Securities lending indemnifications 2 | — | 27,798 | — | — | — | 27,798 | ||||||||||||||||||
Other financial guarantees 3 | 205 | 625 | 795 | 1,209 | 939 | 3,568 | ||||||||||||||||||
|
|
|
| 188 | Goldman Sachs |
THE GOLDMAN SACHS GROUP, INC. AND SUBSIDIARIES
Notes to Consolidated Financial Statements
Guarantees of Securities Issued by Trusts.The firm has established trusts, including Goldman Sachs Capital I, II and III,the APEX Trusts, the 2012 Trusts, and other entities for the limited purpose of issuing securities to third parties, lending the proceeds to the firm and entering into contractual arrangements with the firm and third parties related to this purpose. The firm does not consolidate these entities. See Note 16 for further information about the transactions involving Goldman Sachs Capital I, IIthe APEX Trusts, and III.the 2012 Trusts.
The firm effectively provides for the full and unconditional guarantee of the securities issued by these entities. Timely payment by the firm of amounts due to these entities under the guarantee, borrowing, preferred stock and related contractual arrangements will be sufficient to cover payments due on the securities issued by these entities.
Management believes that it is unlikely that any circumstances will occur, such as nonperformance on the part of paying agents or other service providers, that would make it necessary for the firm to make payments related to these entities other than those required under the terms of the guarantee, borrowing, preferred stock and related contractual arrangements and in connection with certain expenses incurred by these entities.
Indemnities and Guarantees of Service Providers.In the ordinary course of business, the firm indemnifies and guarantees certain service providers, such as clearing and custody agents, trustees and administrators, against specified potential losses in connection with their acting as an agent of, or providing services to, the firm or its affiliates.
The firm may also indemnifiesbe liable to some clients against potentialor other parties, for losses incurred in the event specifiedarising from its custodial role or caused by acts or omissions of third-party service providers, including sub-custodians and third-party brokers, improperly execute transactions.brokers. In certain cases, the firm has the right to seek indemnification from these third-party service providers for certain relevant losses incurred by the firm. In addition, the firm is a member of payment, clearing and settlement networks as well as securities exchanges around the world that may require the firm to meet the obligations of such networks and exchanges in the event of member defaults.defaults and other loss scenarios.
In connection with its prime brokerage and clearing businesses, the firm agrees to clear and settle on behalf of its clients the transactions entered into by them with other
brokerage firms. The firm’s obligations in respect of such transactions are secured by the assets in the client’s account as well as any proceeds received from the transactions cleared and settled by the firm on behalf of the client. In connection with joint venture investments, the firm may issue loan guarantees under which it may be liable in the event of fraud, misappropriation, environmental liabilities and certain other matters involving the borrower.
The firm is unable to develop an estimate of the maximum payout under these guarantees and indemnifications. However, management believes that it is unlikely the firm will have to make any material payments under these arrangements, and no material liabilities related to these guarantees and indemnifications have been recognized in the consolidated statements of financial condition as of December 20112014 and December 2010.2013.
Other Representations, Warranties and Indemnifications.The firm provides representations and warranties to counterparties in connection with a variety of commercial transactions and occasionally indemnifies them against potential losses caused by the breach of those representations and warranties. The firm may also provide indemnifications protecting against changes in or adverse application of certain U.S. tax laws in connection with ordinary-course transactions such as securities issuances, borrowings or derivatives.
In addition, the firm may provide indemnifications to some counterparties to protect them in the event additional taxes are owed or payments are withheld, due either to a change in or an adverse application of certain non-U.S. tax laws.
These indemnifications generally are standard contractual terms and are entered into in the ordinary course of business. Generally, there are no stated or notional amounts included in these indemnifications, and the contingencies triggering the obligation to indemnify are not expected to occur. The firm is unable to develop an estimate of the maximum payout under these guarantees and indemnifications. However, management believes that it is unlikely the firm will have to make any material payments under these arrangements, and no material liabilities related to these arrangements have been recognized in the consolidated statements of financial condition as of December 20112014 and December 2010.2013.
| Goldman Sachs | 189 |
THE GOLDMAN SACHS GROUP, INC. AND SUBSIDIARIES
Notes to Consolidated Financial Statements
Guarantees of Subsidiaries.Group Inc. fully and unconditionally guarantees the securities issued by GS Finance Corp., a wholly-owned finance subsidiary of the firm.
Group Inc. has guaranteed the payment obligations of Goldman, Sachs & Co. (GS&Co.), GS Bank USA GS Bank Europe and Goldman Sachs Execution & Clearing, L.P. (GSEC), subject to certain exceptions.
In November 2008, the firm contributed subsidiaries into GS Bank USA, and Group Inc. agreed to guarantee the reimbursement of certain losses, including credit-related losses, relating to assets held by the contributed entities. In connection with this guarantee, Group Inc. also agreed to pledge to GS Bank USA certain collateral, including interests in subsidiaries and other illiquid assets.
In addition, Group Inc. guarantees many of the obligations of its other consolidated subsidiaries on a transaction-by-transaction basis, as negotiated with counterparties. Group Inc. is unable to develop an estimate of the maximum payout under its subsidiary guarantees; however, because these guaranteed obligations are also obligations of consolidated subsidiaries, included in the table above, Group Inc.’s liabilities as guarantor are not separately disclosed.
Group Inc. has established a program for the issuance of securities by Goldman Sachs Secured Finance Limited insured by GS Secured Guaranty Company Limited (SGCL), a wholly-owned subsidiary of Group Inc. that is a financial guaranty insurer organized under the laws of Bermuda. The funds raised by SGCL are used to enter into repurchase transactions with GS&Co. and Goldman Sachs International (GSI). Group Inc. has fully and unconditionally guaranteed the securities issued by Goldman Sachs Secured Finance Limited, as well as the obligations of GS&Co. and GSI under their respective repurchase transactions. Group Inc. has not guaranteed the obligations of SGCL. The assets and liabilities of SGCL are legally separated from other assets and liabilities of the firm. The assets of SGCL will not be available to any holder of its capital stock until the claims of creditors have been paid.
Shareholders’ Equity
Common Equity
Dividends declared per common share were $1.40$2.25 in 2011, $1.402014, $2.05 in 20102013 and $1.05$1.77 in 2009.2012. On January 17, 2012,15, 2015, Group Inc. declared a dividend of $0.35$0.60 per common share to be paid on March 29, 201230, 2015 to common shareholders of record on March 1, 2012.
On July 1, 2011, the firm issued $103 million of common stock (774,823 shares) in connection with the acquisition of GS Australia.2, 2015.
The firm’s share repurchase program is intended to help maintain the appropriate level of common equity and to substantially offset increases inequity. The share count over time resulting from employee share-based compensation. The repurchase program is effected primarily through regular open-market purchases (which may include repurchase plans designed to comply with Rule 10b5-1), the amounts and timing of which are determined primarily by the firm’s current and projected capital positions (i.e., comparisons of the firm’s desired level and composition of capital to its actual level and composition of capital) and the issuance of shares resulting from employee share-based compensation,position, but which may also be influenced by general market conditions and the prevailing price and trading volumes of the firm’s common stock. Any repurchase of the firm’sPrior to repurchasing common stock, requires approval bythe firm must receive confirmation that the Federal Reserve Board.Board does not object to such capital actions.
During 2011, 2010 and 2009,The table below presents the amount of common stock repurchased by the firm repurchased 47.0 million, 25.3 million and 19,578 shares of its common stock at an average cost per share of $128.33, $164.48 and $80.83, for a total cost of $6.04 billion, $4.16 billion and $2 million, respectively, under the share repurchase program. In addition, pursuantprogram during 2014, 2013 and 2012.
| Year Ended December | ||||||||||||
| in millions, except per share amounts | 2014 | 2013 | 2012 | |||||||||
Common share repurchases | 31.8 | 39.3 | 42.0 | |||||||||
Average cost per share | $171.79 | $157.11 | $110.31 | |||||||||
Total cost of common share repurchases | $ 5,469 | $ 6,175 | $ 4,637 | |||||||||
Pursuant to the terms of certain share-based compensation plans, employees may remit shares to the firm or the firm may cancel restricted stock units (RSUs) or stock options to satisfy minimum statutory employee tax withholding requirements.requirements and the exercise price of stock options. Under these plans, during 2011, 20102014, 2013 and 2009,2012, employees remitted 75,517174,489 shares, 164,172161,211 shares and 4,50633,477 shares with a total value of $12$31 million, $25 million and $342,153$3 million, and the firm cancelled 12.05.8 million, 6.24.0 million and 11.212.7 million of RSUs with a total value of $1.91 billion, $972$974 million, $599 million and $863$1.44 billion. Under these plans, the firm also cancelled 15.6 million respectively.stock options with a total value of $2.65 billion during 2014.
| 190 | Goldman Sachs |
THE GOLDMAN SACHS GROUP, INC. AND SUBSIDIARIES
Notes to Consolidated Financial Statements
Preferred Equity
The tabletables below presentspresent details about the perpetual preferred stock issued and outstanding.outstanding as of December 2014.
| Series | | Shares Authorized | | | Shares Issued | | | Shares Outstanding | | | Depositary Shares Per Share | | ||||
A | 50,000 | 30,000 | 29,999 | 1,000 | ||||||||||||
B | 50,000 | 32,000 | 32,000 | 1,000 | ||||||||||||
C | 25,000 | 8,000 | 8,000 | 1,000 | ||||||||||||
D | 60,000 | 54,000 | 53,999 | 1,000 | ||||||||||||
E | 17,500 | 17,500 | 17,500 | N/A | ||||||||||||
F | 5,000 | 5,000 | 5,000 | N/A | ||||||||||||
I | 34,500 | 34,000 | 34,000 | 1,000 | ||||||||||||
J | 46,000 | 40,000 | 40,000 | 1,000 | ||||||||||||
K 1 | 32,200 | 28,000 | 28,000 | 1,000 | ||||||||||||
L 1 | 52,000 | 52,000 | 52,000 | 25 | ||||||||||||
Total | 372,200 | 300,500 | 300,498 | |||||||||||||
| Series | Shares Authorized | Shares Issued | Shares Outstanding | Dividend Rate | Earliest Redemption Date | Redemption (in millions) | ||||||||||||||||
A | 50,000 | 30,000 | 29,999 | 3 month LIBOR + 0.75%, with floor of 3.75% per annum | April 25, 2010 | $ | 750 | |||||||||||||||
B | 50,000 | 32,000 | 32,000 | 6.20% per annum | October 31, 2010 | 800 | ||||||||||||||||
C | 25,000 | 8,000 | 8,000 | 3 month LIBOR + 0.75%, with floor of 4.00% per annum | October 31, 2010 | 200 | ||||||||||||||||
D | 60,000 | 54,000 | 53,999 | 3 month LIBOR + 0.67%, with floor of 4.00% per annum | May 24, 2011 | 1,350 | ||||||||||||||||
| 185,000 | 124,000 | 123,998 | $ | 3,100 | ||||||||||||||||||
| 1. | In April 2014, Group Inc. issued 28,000 shares of Series K perpetual 6.375% Fixed-to-Floating Rate Non-Cumulative Preferred Stock (Series K Preferred Stock) and 52,000 shares of Series L perpetual 5.70% Fixed-to-Floating Rate Non-Cumulative Preferred Stock (Series L Preferred Stock). |
| Series | | Liquidation Preference | | Redemption Price Per Share |
| Redemption Value ($ in millions) |
| |||
A | $ 25,000 | $25,000 plus declared and unpaid dividends | $ 750 | |||||||
B | 25,000 | $25,000 plus declared and unpaid dividends | 800 | |||||||
C | 25,000 | $25,000 plus declared and unpaid dividends | 200 | |||||||
D | 25,000 | $25,000 plus declared and unpaid dividends | 1,350 | |||||||
E | 100,000 | $100,000 plus declared and unpaid dividends | 1,750 | |||||||
F | 100,000 | $100,000 plus declared and unpaid dividends | 500 | |||||||
I | 25,000 | $25,000 plus accrued and unpaid dividends | 850 | |||||||
J | 25,000 | $25,000 plus accrued and unpaid dividends | 1,000 | |||||||
K | 25,000 | $25,000 plus accrued and unpaid dividends | 700 | |||||||
L | 25,000 | $25,000 plus accrued and unpaid dividends | 1,300 | |||||||
Total | $9,200 | |||||||||
Each share of non-cumulative Series A Preferred Stock, Series B Preferred Stock, Series C Preferred Stock and Series D Preferred Stock issued and outstanding has a par value of $0.01, has a liquidation preference of $25,000, is represented by 1,000 depositary shares and is redeemable atIn the tables above:
| Ÿ | Each share of non-cumulative Series A, Series B, Series C and Series D Preferred Stock issued and outstanding is redeemable at the firm’s option. |
| Ÿ | Each share of non-cumulative Series E and Series F Preferred Stock issued and outstanding is redeemable at the firm’s option, subject to certain covenant restrictions governing the firm’s ability to redeem or purchase the preferred stock without issuing common stock or other instruments with equity-like characteristics. See Note 16 for information about the replacement capital covenants applicable to the Series E and Series F Preferred Stock. |
| Ÿ | Each share of non-cumulative Series I Preferred Stock issued and outstanding is redeemable at the firm’s option beginning November 10, 2017. |
| Ÿ | Each share of non-cumulative Series J Preferred Stock issued and outstanding is redeemable at the firm’s option beginning May 10, 2023. |
| Ÿ | Each share of non-cumulative Series K Preferred Stock issued and outstanding is redeemable at the firm’s option beginning May 10, 2024. |
| Ÿ | Each share of non-cumulative Series L Preferred Stock issued and outstanding is redeemable at the firm’s option beginning May 10, 2019. |
| Ÿ | All shares of preferred stock have a par value of $0.01 per share and, where applicable, each share of preferred stock is represented by the specified number of depositary shares. |
Prior to redeeming preferred stock, the approval offirm must receive confirmation that the Federal Reserve Board at a redemption price equaldoes not object to $25,000 plus declared and unpaid dividends.
such capital actions. All series of preferred stock are pari passu and have a preference over the firm’s common stock on liquidation. Dividends on each series of preferred stock, excluding Series L Preferred Stock, if declared, are payable quarterly in arrears. Dividends on Series L Preferred Stock, if declared, are payable semi-annually in arrears from the issuance date to, but excluding, May 10, 2019, and quarterly thereafter. The firm’s ability to declare or pay dividends on, or purchase, redeem or otherwise acquire, its common stock is subject to certain restrictions in the event that the firm fails to pay or set aside full dividends on the preferred stock for the latest completed dividend period.
In 2007,The table below presents the Boarddividend rates of Directors of Group Inc. (Board) authorized 17,500.1 shares of Series E Preferred Stock, and 5,000.1 shares of Series F Preferred Stock, in connection with the APEX Trusts. See Note 16 for further information about the APEX Trusts.
Under the stock purchase contracts with the APEX Trusts, Group Inc. will issue $2.25 billion offirm’s perpetual preferred stock in the aggregate, on the relevant stock purchase dates (on or before June 1, 2013 and September 1, 2013 for Series E and Series F Preferred Stock, respectively), comprisedas of one share of Series E and Series F Preferred Stock to Goldman Sachs Capital II and III, respectively, for each $100,000 principal amount of subordinated debt held by these trusts. When issued, each share of Series E and Series F Preferred Stock will have a par value of $0.01 and a liquidation preference of $100,000 per share.
Dividends on Series E Preferred Stock, if declared, will be payable semi-annually at a fixed annual rate of 5.79% if the stock is issued prior to June 1, 2012 and quarterly thereafter, at a rate per annum equal to the greater of (i) three-month LIBOR plus 0.77% and (ii) 4.00%.December 2014.
Dividends on Series F Preferred Stock, if declared, will be payable quarterly at a rate per annum equal to three-month LIBOR plus 0.77% if the stock is issued prior to September 1, 2012 and quarterly thereafter, at a rate per annum equal to the greater of (i) three-month LIBOR plus 0.77% and (ii) 4.00%.
The preferred stock may be redeemed at the option of the firm on the stock purchase dates or any day thereafter, subject to approval from the Federal Reserve Board and certain covenant restrictions governing the firm’s ability to redeem or purchase the preferred stock without issuing common stock or other instruments with equity-like characteristics.
| Series | Dividend Rate | |
A | 3 month LIBOR + 0.75%, with floor of 3.75% per annum | |
B | 6.20% per annum | |
C | 3 month LIBOR + 0.75%, with floor of 4.00% per annum | |
D | 3 month LIBOR + 0.67%, with floor of 4.00% per annum | |
E | 3 month LIBOR + 0.77%, with floor of 4.00% per annum | |
F | 3 month LIBOR + 0.77%, with floor of 4.00% per annum | |
I | 5.95% per annum | |
J | 5.50% per annum to, but excluding, May 10, 2023; 3 month LIBOR + 3.64% per annum thereafter | |
K | 6.375% per annum to, but excluding, May 10, 2024; 3 month LIBOR + 3.55% per annum thereafter | |
L | 5.70% per annum to, but excluding, May 10, 2019; 3 month LIBOR + 3.884% per annum thereafter | |
| Goldman Sachs | 191 |
THE GOLDMAN SACHS GROUP, INC. AND SUBSIDIARIES
Notes to Consolidated Financial Statements
In June 2009, Group Inc. repurchased from the U.S. Treasury the 10.0 million shares of the Company’s Fixed Rate Cumulative Perpetual Preferred Stock, Series H (Series H Preferred Stock), that were issued to the U.S. Treasury pursuant to the U.S. Treasury’s TARP Capital Purchase Program. The repurchase resulted in atables below present preferred dividend of $426 million (calculated as the difference between the carrying value and redemption value of the preferred stock), which is included in the consolidated statement of earnings for 2009. The repurchase also resulted in the payment of $44 million of accrued dividends. In connection with the issuance of the Series H Preferred Stock in October 2008, the firm issued a 10-year warrant to the U.S. Treasury to purchase up to 12.2 million shares of common stock at an exercise price of $122.90 per share. The firm repurchased this warrant in full in July 2009 for $1.1 billion. This amount was recorded as a reduction to additional paid-in capital.
During 2011, the firm redeemed the 50,000 shares ofdividends declared on the firm’s 10% Cumulative Perpetual Preferred Stock, Series G (Series G Preferred Stock) held by Berkshire Hathaway Inc.preferred stock.
| Year Ended December 2014 | ||||||||
| Series | per share | $ in millions | ||||||
A | $ 945.32 | $ 28 | ||||||
B | 1,550.00 | 50 | ||||||
C | 1,008.34 | 8 | ||||||
D | 1,008.34 | 54 | ||||||
E | 4,044.44 | 71 | ||||||
F | 4,044.44 | 20 | ||||||
I | 1,487.52 | 51 | ||||||
J | 1,375.00 | 55 | ||||||
K | 850.00 | 24 | ||||||
L | 760.00 | 39 | ||||||
Total | $400 | |||||||
| Year Ended December 2013 | ||||||||
| Series | per share | $ in millions | ||||||
A | $ 947.92 | $ 28 | ||||||
B | 1,550.00 | 50 | ||||||
C | 1,011.11 | 8 | ||||||
D | 1,011.11 | 54 | ||||||
E | 4,044.44 | 71 | ||||||
F | 4,044.44 | 20 | ||||||
I | 1,553.63 | 53 | ||||||
J | 744.79 | 30 | ||||||
Total | $314 | |||||||
| Year Ended December 2012 | ||||||||
| Series | per share | $ in millions | ||||||
A | $ 960.94 | $ 29 | ||||||
B | 1,550.00 | 50 | ||||||
C | 1,025.01 | 8 | ||||||
D | 1,025.01 | 55 | ||||||
E | 2,055.56 | 36 | ||||||
F | 1,000.00 | 5 | ||||||
Total | $183 | |||||||
and certain of its subsidiaries (collectively, Berkshire Hathaway) for the stated redemption price of $5.50 billion ($110,000 per share), plus accrued and unpaid dividends. In connection with this redemption, the firm recognized a preferred dividend of $1.64 billion (calculated as the difference between the carrying value and the redemption value of the preferred stock), which is included in the consolidated statement of earnings for 2011. Berkshire Hathaway continues to hold a five-year warrant, issued in October 2008, to purchase up to 43.5 million shares of common stock at an exercise price of $115.00 per share.
On January 12, 2012,7, 2015, Group Inc. declared dividends of $239.58, $387.50, $255.56, $255.56, $371.88, $343.75 and $255.56$398.44 per share of Series A Preferred Stock, Series B Preferred Stock, Series C Preferred Stock, Series D Preferred Stock, Series I Preferred Stock, Series J Preferred Stock and Series DK Preferred Stock, respectively, to be paid on February 10, 20122015 to preferred shareholders of record on January 26, 2012.
The table below presents2015. In addition, the firm declared dividends of $1,011.11 per each share of Series E Preferred Stock and Series F Preferred Stock, to be paid on March 2, 2015 to preferred dividends declaredshareholders of record on preferred stock.February 15, 2015.
| Year Ended December | ||||||||||||||||||||||||||||
| 2011 | 2010 | 2009 | ||||||||||||||||||||||||||
| per share | in millions | per share | in millions | per share | in millions | |||||||||||||||||||||||
Series A | $ | 950.51 | $ | 28 | $ | 950.51 | $ | 28 | $ | 710.94 | $ | 21 | ||||||||||||||||
Series B | 1,550.00 | 50 | 1,550.00 | 50 | 1,162.50 | 38 | ||||||||||||||||||||||
Series C | 1,013.90 | 8 | 1,013.90 | 8 | 758.34 | 6 | ||||||||||||||||||||||
Series D | 1,013.90 | 55 | 1,013.90 | 55 | 758.34 | 41 | ||||||||||||||||||||||
Series G 1 | 2,500.00 | 125 | 10,000.00 | 500 | 7,500.00 | 375 | ||||||||||||||||||||||
Series H 2 | — | — | — | — | 12.50 | 125 | ||||||||||||||||||||||
Total | $ | 266 | $ | 641 | $ | 606 | ||||||||||||||||||||||
|
|
Accumulated Other Comprehensive Income/(Loss)Loss
The tabletables below presentspresent accumulated other comprehensive income/(loss)loss, net of tax by type.
| As of December | ||||||||
| in millions | 2011 | 2010 | ||||||
Currency translation adjustment, net of tax | $ | (225 | ) | $ | (170 | ) | ||
Pension and postretirement liability adjustments, net of tax | (374 | ) | (229 | ) | ||||
Net unrealized gains on available-for-sale securities, net of tax 1 | 83 | 113 | ||||||
Total accumulated other comprehensive loss, net of tax | $ | (516 | ) | $ | (286 | ) | ||
|
| December 2014 | ||||||||||||
| $ in millions | | Balance, beginning of year | | | Other comprehensive income/(loss) adjustments, net of tax | | | Balance, end of year | | |||
Currency translation | $(364 | ) | $(109 | ) | $(473 | ) | ||||||
Pension and postretirement liabilities | (168 | ) | (102 | ) | (270 | ) | ||||||
Cash flow hedges | 8 | (8 | ) | — | ||||||||
Accumulated other comprehensive loss, net of tax | $(524 | ) | $(219 | ) | $(743 | ) | ||||||
| December 2013 | ||||||||||||
| $ in millions | | Balance, beginning of year | | | Other comprehensive income/(loss) adjustments, net of tax | | | Balance, end of year | | |||
Currency translation | $(314 | ) | $ (50 | ) | $(364 | ) | ||||||
Pension and postretirement liabilities | (206 | ) | 38 | (168 | ) | |||||||
Available-for-sale securities | 327 | (327 | ) | — | ||||||||
Cash flow hedges | — | 8 | 8 | |||||||||
Accumulated other comprehensive loss, net of tax | $(193 | ) | $(331 | ) | $(524 | ) | ||||||
| 192 | Goldman Sachs |
THE GOLDMAN SACHS GROUP, INC. AND SUBSIDIARIES
Notes to Consolidated Financial Statements
Regulation and Capital Adequacy
The Federal Reserve Board is the primary regulator of Group Inc., a bank holding company under the Bank Holding Company Act of 1956 (BHC Act) and a financial holding company under amendments to the U.S. Bank Holding Company Act of 1956.BHC Act. As a bank holding company, the firm is subject to consolidated risk-based regulatory capital requirements thatwhich are computed in accordance with the applicable risk-based capital regulations of the Federal Reserve Board’s capital adequacy regulations currently applicable to bank holding companies (which are based on the ‘Basel 1’ Capital Accord of the Basel Committee on Banking Supervision (Basel Committee)). Board.
These capital requirements are expressed as capital ratios that compare measures of regulatory capital to risk-weighted assets (RWAs). The firm’s bank depository institution subsidiaries, including GS Bank USA,capital levels are subject to similar capital requirements.
Under the Federal Reserve Board’s capital adequacy requirements and the regulatory framework for prompt corrective action that is applicable to GS Bank USA, the firm and its bank depository institution subsidiaries must meet specific capital requirements that involve quantitative measures of assets, liabilities and certain off-balance-sheet items as calculated under regulatory reporting practices. The firm and its bank depository institution subsidiaries’ capital amounts, as well as GS Bank USA’s prompt corrective action classification, are also subject to qualitative judgments by the regulators about components of capital, risk weightings and other factors. In addition, the firm is subject to requirements with respect to leverage.
ManyFurthermore, certain of the firm’s subsidiaries, including GS&Co. and the firm’s other broker-dealer subsidiaries are subject to separate regulationregulations and capital requirements as described below.
Group Inc.Applicable Capital Framework
Federal Reserve BoardAs of December 2013, the firm was subject to the risk-based capital regulations require bank holding companies to maintain a minimum Tier 1 capital ratio of 4% and a minimum total capital ratio of 8%. The required minimum Tier 1 capital ratio and total capital ratio in order to be considered a “well-capitalized” bank holding company under the Federal Reserve Board guidelines are 6%that were based on the Basel I Capital Accord of the Basel Committee on Banking Supervision (Basel Committee), and 10%, respectively. Bank holding companies may be expectedincorporated the revised market risk regulatory capital requirements (together, the Prior Capital Rules).
As of January 1, 2014, the firm became subject to maintain ratios well above the minimum levels, depending on their particular condition, risk profile
and growth plans. The minimum Tier 1 leverage ratio is 3% for bank holding companies that have received the highest supervisory rating under Federal Reserve Board guidelines or that have implemented the Federal Reserve Board’s revised risk-based capital measureand leverage regulations, subject to certain transitional provisions (Revised Capital Framework). These regulations are largely based on the Basel Committee’s final capital framework for market risk. Other bank holding companies must havestrengthening international capital standards (Basel III) and also implement certain provisions of the Dodd-Frank Act. Under the Revised Capital Framework, the firm is an “Advanced approach” banking organization.
The firm was notified in the first quarter of 2014 that it had completed a minimum Tier 1 leverage ratio“parallel run” to the satisfaction of 4%.
The table below presents information regarding Group Inc.’s regulatory capital ratios.
| As of December | ||||||||
| $ in millions | 2011 | 2010 | ||||||
Tier 1 capital | $ | 63,262 | $ | 71,233 | ||||
Tier 2 capital | $ | 13,881 | $ | 13,660 | ||||
Total capital | $ | 77,143 | $ | 84,893 | ||||
Risk-weighted assets | $ | 457,027 | $ | 444,290 | ||||
Tier 1 capital ratio | 13.8 | % | 16.0 | % | ||||
Total capital ratio | 16.9 | % | 19.1 | % | ||||
Tier 1 leverage ratio | 7.0 | % | 8.0 | % | ||||
RWAs under the Federal Reserve Board’s risk-basedBoard, as required under the Revised Capital Framework. As such, additional changes in the firm’s capital guidelines arerequirements became effective on April 1, 2014.
Beginning on January 1, 2014, regulatory capital was calculated based on the amountRevised Capital Framework. Beginning April 1, 2014, there were no changes to the calculation of regulatory capital, but RWAs were calculated using (i) the Prior Capital Rules, adjusted for certain items related to capital deductions under the previous definition of regulatory capital and for the phase-in of new capital deductions (Hybrid Capital Rules), and (ii) the Advanced approach and market risk rules set out in the Revised Capital Framework (together, the Basel III Advanced Rules). The lower of the ratios calculated under the Hybrid Capital Rules and credit risk. RWAsthose calculated under the Basel III Advanced Rules are the binding regulatory capital requirements for market risk are determined by reference tothe firm. The ratios calculated under the Basel III Advanced Rules were lower than those calculated under the Hybrid Capital Rules and therefore were the binding ratios for the firm as of December 2014.
As a result of the changes in the applicable capital framework in 2014, the firm’s Value-at-Risk (VaR) models, supplemented by other measures to capture riskscapital ratios as of December 2014 and those as of December 2013 were calculated on a different basis and, accordingly, are not reflected in VaR models. Credit risk for on-balance sheet assets is based on the balance sheet value. For off-balance sheet exposures, including OTC derivatives and commitments, a credit equivalent amount is calculated based on the notional amount of each trade. All such assets and amounts are then assigned a risk weight depending on, among other things, whether the counterparty is a sovereign, bank or qualifying securities firm or other entity (or if collateral is held, depending on the nature of the collateral).
Tier 1 leverage ratio is defined as Tier 1 capital under Basel 1 divided by average adjusted total assets (which includes adjustments for disallowed goodwill and intangible assets, and the carrying value of equity investments in non-financial companies that are subject to deductions from Tier 1 capital).comparable.
| Goldman Sachs | 193 |
THE GOLDMAN SACHS GROUP, INC. AND SUBSIDIARIES
Notes to Consolidated Financial Statements
Regulatory Reform
The firm is currently workingEffective on January 1, 2015, regulatory capital continues to implementbe calculated under the requirementsRevised Capital Framework, but RWAs are required to be calculated under the Basel III Advanced Rules, as well as the Standardized approach and market risk rules set out in the Federal Reserve Board’s Risk-BasedRevised Capital Standards:Framework (together, the Standardized Capital Rules). The lower of the ratios calculated under the Basel III Advanced Rules and those calculated under the Standardized Capital AdequacyRules are the binding regulatory capital requirements for the firm.
The Basel III Advanced Rules, Hybrid Capital Rules and Standardized Capital Rules are discussed in more detail below.
Regulatory Capital and Capital Ratios. The Revised Capital Framework — Basel 2, aschanged the definition of regulatory capital to include a new capital measure called Common Equity Tier 1 (CET1) and the related regulatory capital ratio of CET1 to RWAs (CET1 ratio), and changed the definition of Tier 1 capital. The Revised Capital Framework also increased the level of certain minimum risk-based capital and leverage ratios applicable to Group Inc.the firm.
The table below presents the minimum ratios applicable to the firm as a bank holding company (Basel 2), which are based onof December 2014 and January 2015. Failure to comply with these capital requirements could result in restrictions being imposed by the advanced approachesfirm’s regulators.
| | December 2014 Minimum Ratio | | | January 2015 Minimum Ratio | | |||
CET1 ratio | 4.0% | 4.5% | ||||||
Tier 1 capital ratio | 5.5% | 6.0% | ||||||
Total capital ratio 1 | 8.0% | 8.0% | ||||||
Tier 1 leverage ratio 2 | 4.0% | 4.0% | ||||||
| 1. | In order to meet the quantitative requirements for being “well-capitalized” under the Federal Reserve Board’s capital regulations, the firm must meet a higher required minimum Total capital ratio of 10.0% |
| 2. | Tier 1 leverage ratio is defined as Tier 1 capital divided by average adjusted total assets (which includes adjustments for goodwill and identifiable intangible assets, and certain investments in nonconsolidated financial institutions). |
Certain aspects of the Revised Framework forCapital Framework’s requirements phase in over time (transitional provisions). These include increases in the International Convergenceminimum capital ratio requirements and the introduction of Capital Measurementnew capital buffers and Capital Standardscertain deductions from regulatory capital (such as investments in nonconsolidated financial institutions). In addition, junior subordinated debt issued by the Basel Committee. U.S. banking regulators have incorporated the Basel 2 framework into the existing risk-based capital requirements by requiring that internationally active banking organizations, such as Group Inc., adopt Basel 2, once approved to do so by regulators. As required by the Dodd-Frank Act, U.S. banking regulators have adopted a rule that requires large banking organizations, upon adoptiontrusts is being phased out of Basel 2, to continue to calculate risk-based capital ratios under both Basel 1 and Basel 2. For each of theregulatory capital. The minimum CET1, Tier 1 and Total capital ratios the lower of the Basel 1 and Basel 2 ratios calculated will be used to determine whether the bank meets its minimum risk-based capital requirements.
In December 2011, the U.S. federal bank regulatory agencies issued revised proposals to modify their market risk regulatory capital requirements for banking organizations in the United States that have significant trading activities. These modifications are designed to address the adjustments to the market risk framework that were announced by the Basel Committee in June 2010 (Basel 2.5), as well as the prohibition in the use of credit ratings, as required by the Dodd-Frank Act. Once implemented, it is likely that these changes will result in increased capital requirements for market risk.
Additionally, the guidelines issued by the Basel Committee in December 2010 (Basel 3) revise the definition of Tier 1 capital, introduce Tier 1 common equity as a regulatory metric, set new minimum capital ratios (including a new “capital conservation buffer,” which must be composed exclusively of Tier 1 common equity and will be in addition to the minimum capital ratios), introduce a Tier 1 leverage ratio within international guidelines for the first time, and make substantial revisions to the computation of RWAs for credit exposures. Implementation of the new requirements is expected to take place over the next several years. The federal banking agencies have not yet proposed rules to implement the Basel 3 guidelines in the United States.
The Basel Committee has published its final provisions for assessing the global systemic importance of banking institutions and the range of additional Tier 1 common equity that should be maintained by banking institutions deemed to be globally systemically important. The additional capital for these institutions would initially range from 1% to 2.5% of Tier 1 common equity and could be as much as 3.5% for a bank that increases its systemic footprint (e.g., by increasing total assets). The firm was one of 29 institutions identified by the Financial Stability Board (established at the direction of the leaders of the Group of 20) as globally systemically important under the Basel Committee’s methodology. Therefore, depending upon the manner and timing of the U.S. banking regulators’ implementation of the Basel Committee’s methodology, the firm expects that the minimum Tier 1 common ratio requirement applicable to the firm will include this additionalincrease as the transitional provisions phase in and new capital assessment. The final determinationbuffers are introduced.
Definition of whether an institution is classified as globally systemically importantRisk-Weighted Assets. As of December 2014, RWAs were calculated under both the Basel III Advanced Rules and the calculation ofHybrid Capital Rules. Under both the Basel III Advanced Rules and the Hybrid Capital Rules, certain amounts not required additional capital amount is expected to be disclosed bydeducted from CET1 under the Basel Committee no later than November 2014 based on data through the end of 2013.
The Federal Reserve Board has proposed regulations designed to strengthen the regulation and supervision of large bank holding companies and systemically important nonbank financial firms. These proposals address risk-based capital and leverage requirements, liquidity requirements, stress tests, single counterparty limits and early remediation requirements thattransitional provisions are designed to address financial weakness at an early stage. Although many of the proposals mirror initiatives to which bank holding companies are already subject, their full impact on the firm will not be known with certainty until the rules are finalized.
The Dodd-Frank Act will subject the firm at a firmwide level to the same leverage and risk-based capital requirements that apply to depository institutions and directs banking regulators to impose additional capital requirements as disclosed above. The Federal Reserve Board is expected to adopt the new leverage and risk-based capital regulations in 2012. As a consequence of these changes,either deducted from Tier 1 capital treatment for the firm’s junior subordinated debt issued to trusts will be phased out over a three-year period beginning on January 1, 2013. or are risk weighted.
The interaction among the Dodd-Frank Act,primary difference between the Basel Committee’s proposed changesIII Advanced Rules and the Hybrid Capital Rules is that the latter utilizes prescribed risk-weightings for credit RWAs and does not contemplate the use of internal models to compute exposure for credit risk on derivatives and securities financing transactions, whereas the Basel III Advanced Rules permit the use of such models, subject to supervisory approval. In addition, RWAs under the Hybrid Capital Rules depend largely on the type of counterparty (e.g., whether the counterparty is a sovereign, bank, broker-dealer or other proposed or announced changes from other governmental entities and regulators adds further uncertainty toentity), rather than on internal assessments of each counterparty’s creditworthiness. Furthermore, the firm’s futureHybrid Capital Rules do not include a capital requirements and thoserequirement for operational risk.
As of our subsidiaries.December 2013, the firm calculated RWAs under the Prior Capital Rules.
| 194 | Goldman Sachs |
THE GOLDMAN SACHS GROUP, INC. AND SUBSIDIARIES
Notes to Consolidated Financial Statements
Credit Risk
Credit RWAs are calculated based upon measures of exposure, which are then risk weighted. The exposure amount is generally based on the following:
| Ÿ | For on-balance-sheet assets, the carrying value; and |
| Ÿ | For off-balance-sheet exposures, including commitments and guarantees, a credit equivalent exposure amount is calculated based on the notional amount of each exposure multiplied by a credit conversion factor. |
Counterparty credit risk is a component of total credit risk, and includes credit exposure arising from derivatives, securities financing transactions and eligible margin loans.
| Ÿ | For the Basel III Advanced Rules, the firm uses the Internal Models Methodology for the measurement of exposure on derivatives, securities financing transactions and eligible margin loans. The Revised Capital Framework requires that a bank holding company obtain prior written agreement from its regulators before using the Internal Models Methodology; and |
| Ÿ | For the Hybrid and Prior Capital Rules, the exposure amount for derivatives is based on a combination of positive net exposure and a percentage of the notional amount for each trade, and includes the effect of counterparty netting and collateral, as applicable; for securities financing transactions and eligible margin loans, it is based on the carrying value. |
All exposures are then assigned a risk weight computed as follows:
| Ÿ | For the Basel III Advanced Rules, the firm has been given permission by its supervisors to compute risk weights for certain exposures in accordance with the Advanced Internal Ratings-Based approach, which utilizes internal assessments of each counterparty’s creditworthiness. Key inputs to the risk weight calculation are the probability of default, loss given default and the effective maturity. RWAs for securitization and equity exposures are calculated using specific required formula approaches; and |
| Ÿ | For the Hybrid and Prior Capital Rules, a standard risk weight is assigned depending on, among other things, whether the counterparty is a sovereign, bank or a qualifying securities firm or other entity (and if collateral is held, the risk weight may depend on the nature of the collateral). |
The Standardized Capital Rules utilize prescribed risk-weightings for credit RWAs and do not contemplate the use of internal models to compute exposure for credit risk on derivatives and securities financing transactions. The exposure measure for securities financing transactions is calculated to reflect adjustments for potential price volatility, the size of which depends on factors such as the type of and maturity of the security, and whether it is denominated in the same currency as the other side of the financing transaction. In addition, RWAs under the Standardized Capital Rules depend largely on the type of counterparty (e.g., whether the counterparty is a sovereign, bank, broker-dealer or other entity), rather than on internal assessments of each counterparty’s creditworthiness.
Market Risk
RWAs for market risk are determined using measures for Value-at-Risk (VaR), stressed VaR, incremental risk and comprehensive risk based on internal models, and a standardized measurement method for specific risk. The market risk regulatory capital rules require that a bank holding company obtain prior written agreement from its regulators before using any internal model to calculate its risk-based capital requirement.
| Ÿ | VaR is the potential loss in value of inventory positions, as well as certain other financial assets and financial liabilities, due to adverse market movements over a defined time horizon with a specified confidence level. For both risk management purposes and regulatory capital calculations the firm uses a single VaR model which captures risks including those related to interest rates, equity prices, currency rates and commodity prices. However, VaR used for regulatory capital requirements (regulatory VaR) differs from risk management VaR due to different time horizons and confidence levels (10-day and 99% for regulatory VaR vs. one-day and 95% for risk management VaR), as well as differences in the scope of positions on which VaR is calculated. In addition, the daily trading net revenues used to determine risk management VaR exceptions (i.e., comparing the daily trading net revenues to the VaR measure calculated as of the prior business day) include intraday activity, whereas the Federal Reserve Board’s regulatory capital regulations require that intraday activity be excluded from daily trading net revenues when calculating regulatory VaR exceptions. Intraday activity includes bid/offer net revenues, which are more likely than not to be positive. Under these regulations, the firm’s positional losses observed on a single day exceeded its 99% one-day regulatory VaR on three occasions during 2014. There was no change in the VaR multiplier used to calculate Market RWAs; |
| Goldman Sachs 2014 Form 10-K | 195 |
THE GOLDMAN SACHS GROUP, INC. AND SUBSIDIARIES
Notes to Consolidated Financial Statements
| Ÿ | Stressed VaR is the potential loss in value of inventory positions during a period of significant market stress; |
| Ÿ | Incremental risk is the potential loss in value of non-securitized inventory positions due to the default or credit migration of issuers of financial instruments over a one-year time horizon; and |
| Ÿ | Comprehensive risk is the potential loss in value, due to price risk and defaults, within the firm’s credit correlation positions. |
The standardized measurement method is used to determine RWAs for specific risk on certain positions by applying supervisory defined risk-weighting factors to such positions after applicable netting is performed.
RWAs for market risk under the Standardized Capital Rules are calculated in a manner that is generally consistent with the RWAs calculated under the Basel III Advanced Rules.
Operational Risk
The Basel III Advanced Rules include a capital requirement for operational risk. The firm has been given permission by its supervisors to compute operational RWAs in accordance with the “Advanced Measurement Approach” of the Revised Capital Framework. Operational RWAs are therefore calculated based on an internal risk-based operational risk quantification model that meets the requirements for the “Advanced Measurement Approach.”
The Standardized Capital Rules do not include a capital requirement for operational risk.
Consolidated Regulatory Capital Ratios
December 2014 Capital Ratios and RWAs.The firm was required to calculate ratios under both the Basel III Advanced Rules and Hybrid Capital Rules as of December 2014, in both cases subject to transitional provisions. The ratios calculated under the Basel III Advanced Rules presented in the table below were lower than those calculated under the Hybrid Capital Rules and therefore were the binding ratios for the firm as of December 2014.
Effective on January 1, 2015, the firm was required to calculate ratios under both the Basel III Advanced Rules and Standardized Capital Rules. The firm’s ratios calculated under the Standardized Capital Rules as of December 2014 are also presented in the table below, although the ratios were not binding until January 2015.
| $ in millions | As of December 2014 | |||
Common shareholders’ equity | $ 73,597 | |||
Deductions for goodwill and identifiable intangible assets, net of deferred tax liabilities | (2,787 | ) | ||
Deductions for investments in nonconsolidated financial institutions | (953 | ) | ||
Other adjustments | (27 | ) | ||
Common Equity Tier 1 | 69,830 | |||
Perpetual non-cumulative preferred stock | 9,200 | |||
Junior subordinated debt issued to trusts | 660 | |||
Other adjustments | (1,257 | ) | ||
Tier 1 capital | 78,433 | |||
Qualifying subordinated debt | 11,894 | |||
Junior subordinated debt issued to trusts | 660 | |||
Other adjustments | (9 | ) | ||
Tier 2 capital 1 | 12,545 | |||
Total capital | $ 90,978 | |||
Basel III Advanced | ||||
RWAs | $570,313 | |||
CET1 ratio | 12.2% | |||
Tier 1 capital ratio | 13.8% | |||
Total capital ratio | 16.0% | |||
Tier 1 leverage ratio | 9.0% | |||
Standardized | ||||
RWAs | $619,216 | |||
CET1 ratio | 11.3% | |||
Tier 1 capital ratio | 12.7% | |||
Total capital ratio | 14.7% | |||
| 1. | Tier 2 capital under the Standardized Capital Rules is approximately $300 million higher due to the allowance for losses on loans and lending commitments. |
In the table above:
| Ÿ | The deduction for goodwill and identifiable intangible assets, net of deferred tax liabilities, represents goodwill of $3.65 billion and identifiable intangible assets of $103 million (20% of $515 million), net of associated deferred tax liabilities of $961 million. The remaining 80% of the deduction of identifiable intangible assets will be phased in ratably per year from 2015 to 2018. Identifiable intangible assets that are not deducted during the transitional period are risk weighted. |
| Ÿ | The deduction for investments in nonconsolidated financial institutions represents the amount by which the firm’s investments in the capital of nonconsolidated financial institutions exceed certain prescribed thresholds. As of December 2014, 20% of the deduction was reflected (calculated based on transitional thresholds). The remaining 80% will be phased in ratably per year from 2015 to 2018. The balance that is not deducted during the transitional period is risk weighted. |
| 196 | Goldman Sachs 2014 Form 10-K |
THE GOLDMAN SACHS GROUP, INC. AND SUBSIDIARIES
Notes to Consolidated Financial Statements
| Ÿ | Other adjustments within CET1 and Tier 1 capital primarily include accumulated other comprehensive loss, credit valuation adjustments on derivative liabilities, the overfunded portion of the firm’s defined benefit pension plan obligation, net of associated deferred tax liabilities, disallowed deferred tax assets and other required credit risk-based deductions. As of December 2014, 20% of the deductions related to credit valuation adjustments on derivative liabilities, the overfunded portion of the firm’s defined benefit pension plan obligation, net of associated deferred tax liabilities, disallowed deferred tax assets and other required credit risk-based deductions were included in other adjustments within CET1 and 80% of the deductions were included in other adjustments within Tier 1 capital. Most of the deductions that were included in other adjustments within Tier 1 capital will be phased into CET1 ratably per year from 2015 to 2018. Other adjustments within Tier 1 capital also include a deduction for investments in the preferred equity of nonconsolidated financial institutions. |
| Ÿ | Junior subordinated debt issued to trusts is reflected in both Tier 1 capital (50%) and Tier 2 capital (50%) and is reduced by the amount of trust preferred securities purchased by the firm. Junior subordinated debt issued to trusts will be fully phased out of Tier 1 capital by 2016, and then also from Tier 2 capital by 2022. See Note 16 for additional information about the firm’s junior subordinated debt issued to trusts and trust preferred securities purchased by the firm. |
| Ÿ | Qualifying subordinated debt represents subordinated debt issued by Group Inc. with an original term to maturity of five years or greater. The outstanding amount of subordinated debt qualifying for Tier 2 capital is reduced, or discounted, upon reaching a remaining maturity of five years. See Note 16 for additional information about the firm’s subordinated debt. |
The table below presents the changes in CET1, Tier 1 capital and Tier 2 capital for the period December 31, 2013 to December 31, 2014.
| $ in millions | Period Ended December 2014 | |||
Common Equity Tier 1 | ||||
Balance, December 31, 2013 | $63,248 | |||
Change in CET1 related to the transition to the Revised Capital Framework 1 | 3,177 | |||
Increase in common shareholders’ equity | 2,330 | |||
Change in deduction for goodwill and identifiable intangible assets, net of deferred tax liabilities | 144 | |||
Change in deduction for investments in nonconsolidated financial institutions | 839 | |||
Change in other adjustments | 92 | |||
Balance, December 31, 2014 | $69,830 | |||
Tier 1 capital | ||||
Balance, December 31, 2013 | $72,471 | |||
Change in CET1 related to the transition to the Revised Capital Framework 1 | 3,177 | |||
Change in Tier 1 capital related to the transition to the Revised Capital Framework 2 | (443 | ) | ||
Other net increase in CET1 | 3,405 | |||
Increase in perpetual non-cumulative preferred stock | 2,000 | |||
Redesignation of junior subordinated debt issued to trusts and decrease related to trust preferred securities purchased by the firm | (1,403 | ) | ||
Change in other adjustments | (774 | ) | ||
Balance, December 31, 2014 | 78,433 | |||
Tier 2 capital | ||||
Balance, December 31, 2013 | 13,632 | |||
Change in Tier 2 capital related to the transition to the Revised Capital Framework 3 | (197 | ) | ||
Decrease in qualifying subordinated debt | (879 | ) | ||
Trust preferred securities purchased by the firm, net of redesignation of junior subordinated debt issued to trusts | (27 | ) | ||
Change in other adjustments | 16 | |||
Balance, December 31, 2014 | 12,545 | |||
Total capital | $90,978 | |||
| 1. | Includes $3.66 billion related to the transition to the Revised Capital Framework on January 1, 2014 as well as $(479) million related to the firm’s application of the Basel III Advanced Rules on April 1, 2014. |
| 2. | Includes $(219) million related to the transition to the Revised Capital Framework on January 1, 2014 as well as $(224) million related to the firm’s application of the Basel III Advanced Rules on April 1, 2014. |
| 3. | Includes $(2) million related to the transition to the Revised Capital Framework on January 1, 2014 as well as $(195) million related to the firm’s application of the Basel III Advanced Rules on April 1, 2014. |
| Goldman Sachs 2014 Form 10-K | 197 |
THE GOLDMAN SACHS GROUP, INC. AND SUBSIDIARIES
Notes to Consolidated Financial Statements
A numberThe change in CET1 related to the transition to the Revised Capital Framework is principally related to the change in treatment of other governmental entities and regulators, includingequity investments in certain nonconsolidated entities. Under the European Union (EU)Prior Capital Rules, such investments were treated as deductions. However, during the transition to the Revised Capital Framework, only a portion of such investments that exceed certain prescribed thresholds are treated as deductions from CET1 and the U.K.’sremainder are risk weighted.
The table below presents the components of RWAs under the Basel III Advanced Rules and Standardized Capital Rules as of December 2014.
| As of December 2014 | ||||||||
| $ in millions | | Basel III Advanced | | Standardized | ||||
Credit RWAs | ||||||||
Derivatives | $122,501 | $180,771 | ||||||
Commitments, guarantees and loans | 95,209 | 89,783 | ||||||
Securities financing transactions 1 | 15,618 | 92,116 | ||||||
Equity investments | 40,146 | 38,526 | ||||||
Other 2 | 54,470 | 71,499 | ||||||
Total Credit RWAs | 327,944 | 472,695 | ||||||
Market RWAs | ||||||||
Regulatory VaR | 10,238 | 10,238 | ||||||
Stressed VaR | 29,625 | 29,625 | ||||||
Incremental risk | 16,950 | 16,950 | ||||||
Comprehensive risk | 8,150 | 9,855 | ||||||
Specific risk | 79,918 | 79,853 | ||||||
Total Market RWAs | 144,881 | 146,521 | ||||||
Total Operational RWAs | 97,488 | — | ||||||
Total RWAs | $570,313 | $619,216 | ||||||
| 1. | Represents resale and repurchase agreements and securities borrowed and loaned transactions. |
| 2. | Includes receivables, other assets, and cash and cash equivalents. |
The table below presents the changes in RWAs under the Basel III Advanced Rules for the period December 31, 2013 to December 31, 2014, and reflects the transition to the Revised Capital Framework from the Prior Capital Rules on January 1, 2014.
| $ in millions | Period Ended December 2014 | |||
Risk-weighted assets | ||||
Total RWAs, December 31, 2013 | $433,226 | |||
Credit RWAs | ||||
Change related to the transition to the Revised Capital Framework 1 | 69,101 | |||
Other changes: | ||||
Decrease in derivatives | (24,109 | ) | ||
Increase in commitments, guarantees and loans | 18,208 | |||
Decrease in securities financing transactions | (2,782 | ) | ||
Decrease in equity investments | (2,728 | ) | ||
Increase in other | 2,007 | |||
Change in Credit RWAs | 59,697 | |||
Market RWAs | ||||
Change related to the transition to the Revised Capital Framework | 1,626 | |||
Decrease in regulatory VaR | (5,175 | ) | ||
Decrease in stressed VaR | (11,512 | ) | ||
Increase in incremental risk | 7,487 | |||
Decrease in comprehensive risk | (6,617 | ) | ||
Decrease in specific risk | (5,907 | ) | ||
Change in Market RWAs | (20,098 | ) | ||
Operational RWAs | ||||
Change related to the transition to the Revised Capital Framework | 88,938 | |||
Increase in operational risk | 8,550 | |||
Change in Operational RWAs | 97,488 | |||
Total RWAs, December 31, 2014 | $570,313 | |||
| 1. | Includes $26.67 billion of RWA changes related to the transition to the Revised Capital Framework on January 1, 2014 and $42.43 billion of changes to the calculation of Credit RWAs under the Basel III Advanced Rules related to the firm’s application of the Basel III Advanced Rules on April 1, 2014. |
Credit RWAs as of December 2014 increased by $59.70 billion compared with December 2013, primarily due to increased risk weightings related to counterparty credit risk for derivative exposures and the inclusion of RWAs for equity investments in certain nonconsolidated entities, both resulting from the transition to the Revised Capital Framework. Market RWAs as of December 2014 decreased by $20.10 billion compared with December 2013, primarily due to a decrease in stressed VaR, reflecting reduced fixed income and equities exposures. Operational RWAs as of December 2014 increased by $97.49 billion compared with December 2013, substantially all of which was due to the transition to the Revised Capital Framework.
| 198 | Goldman Sachs 2014 Form 10-K |
THE GOLDMAN SACHS GROUP, INC. AND SUBSIDIARIES
Notes to Consolidated Financial Services Authority (FSA), have also proposed or announcedStatements
December 2013 Capital Ratios and RWAs. The table below presents information about the firm’s regulatory ratios as of December 2013 under the Prior Capital Rules.
| $ in millions | As of December 2013 | |||
Common shareholders’ equity | $ 71,267 | |||
Perpetual non-cumulative preferred stock | 7,200 | |||
Junior subordinated debt issued to trusts | 2,063 | |||
Deduction for goodwill and identifiable intangible assets | (4,376 | ) | ||
Deduction for equity investments in certain entities | (3,314 | ) | ||
Other adjustments | (369 | ) | ||
Tier 1 capital | 72,471 | |||
Qualifying subordinated debt | 12,773 | |||
Junior subordinated debt issued to trusts | 687 | |||
Other adjustments | 172 | |||
Tier 2 capital | 13,632 | |||
Total capital | $ 86,103 | |||
Credit RWAs | $268,247 | |||
Market RWAs | 164,979 | |||
Total RWAs | $433,226 | |||
Tier 1 capital ratio | 16.7% | |||
Total capital ratio | 19.9% | |||
Tier 1 leverage ratio | 8.1% | |||
In the table above:
| Ÿ | Junior subordinated debt issued to trusts is reflected in both Tier 1 capital (75%) and Tier 2 capital (25%). See Note 16 for additional information about the firm’s junior subordinated debt issued to trusts. |
| Ÿ | The deduction for goodwill and identifiable intangible assets includes goodwill of $3.71 billion and identifiable intangible assets of $671 million. |
| Ÿ | Other adjustments within Tier 1 capital primarily include disallowed deferred tax assets and the overfunded portion of the firm’s defined benefit pension plan obligation, net of associated deferred tax liabilities. |
| Ÿ | Qualifying subordinated debt represents subordinated debt issued by Group Inc. with an original term to maturity of five years or greater. The outstanding amount of subordinated debt qualifying for Tier 2 capital is reduced, or discounted, upon reaching a remaining maturity of five years. See Note 16 for additional information about the firm’s subordinated debt. |
The table below presents the changes that will result in Tier 1 capital and Tier 2 capital for the period ended December 2013 under the Prior Capital Rules.
| $ in millions | Period Ended December 2013 | |||
Tier 1 capital | ||||
Balance, December 31, 2012 | $66,977 | |||
Increase in common shareholders’ equity | 1,751 | |||
Increase in perpetual non-cumulative preferred stock | 1,000 | |||
Redesignation of junior subordinated debt issued to trusts | (687 | ) | ||
Change in goodwill and identifiable intangible assets | 723 | |||
Change in equity investments in certain entities | 1,491 | |||
Change in other adjustments | 1,216 | |||
Balance, December 31, 2013 | 72,471 | |||
Tier 2 capital | ||||
Balance, December 31, 2012 | 13,429 | |||
Decrease in qualifying subordinated debt | (569 | ) | ||
Redesignation of junior subordinated debt issued to trusts | 687 | |||
Change in other adjustments | 85 | |||
Balance, December 31, 2013 | 13,632 | |||
Total capital | $86,103 | |||
The table below presents the components of RWAs as of December 2013 under the Prior Capital Rules.
| $ in millions | As of December 2013 | |||
Credit RWAs | ||||
Derivatives | $ 94,753 | |||
Commitments, guarantees and loans | 78,997 | |||
Securities financing transactions 1 | 30,010 | |||
Equity investments | 3,673 | |||
Other 2 | 60,814 | |||
Total Credit RWAs | 268,247 | |||
Market RWAs | ||||
Regulatory VaR | 13,425 | |||
Stressed VaR | 38,250 | |||
Incremental risk | 9,463 | |||
Comprehensive risk | 18,150 | |||
Specific risk | 85,691 | |||
Total Market RWAs | 164,979 | |||
Total RWAs | $433,226 | |||
| 1. | Represents resale and repurchase agreements and securities borrowed and loaned transactions. |
| 2. | Includes receivables, other assets, and cash and cash equivalents. |
| Goldman Sachs 2014 Form 10-K | 199 |
THE GOLDMAN SACHS GROUP, INC. AND SUBSIDIARIES
Notes to Consolidated Financial Statements
The table below presents the changes in RWAs for the period ended December 31, 2013 under the Prior Capital Rules.
| $ in millions | Period Ended December 2013 | |||
Risk-weighted assets | ||||
Balance, December 31, 2012 | $399,928 | |||
Credit RWAs | ||||
Decrease in derivatives | (12,516 | ) | ||
Increase in commitments, guarantees and loans | 18,151 | |||
Decrease in securities financing transactions | (17,059 | ) | ||
Increase in equity investments | 1,077 | |||
Change in other | (8,932 | ) | ||
Change in Credit RWAs | (19,279 | ) | ||
Market RWAs | ||||
Increase related to the revised market risk rules | 127,608 | |||
Decrease in regulatory VaR | (2,038 | ) | ||
Decrease in stressed VaR | (13,700 | ) | ||
Decrease in incremental risk | (17,350 | ) | ||
Decrease in comprehensive risk | (9,568 | ) | ||
Decrease in specific risk | (32,375 | ) | ||
Change in Market RWAs | 52,577 | |||
Total RWAs, December 31, 2013 | $433,226 | |||
Credit RWAs as of December 2013 decreased $19.28 billion compared with December 2012, primarily due to a decrease in securities financing exposure. Market RWAs as of December 2013 increased by $52.58 billion compared with December 2012, reflecting the impact of the revised market risk regulatory capital requirements, for financial institutions.
Aswhich became effective on January 1, 2013, partially offset by, among other things, a consequence of these developments, the firm expects minimum capital ratios requireddecrease in specific risk due to be maintained under Federal Reserve Board regulations will be increased and changesa decrease in the prescribed calculation methodology are expected to result in higher RWAs and lower capital ratios than those currently computed.inventory.
The capital and liquidity requirements of several of the firm’s subsidiaries will also be impacted in the future by the various developments arising from the Basel Committee, the Dodd-Frank Act, and other governmental entities and regulators.
Bank Subsidiaries
Regulatory Capital Ratios.GS Bank USA, an FDIC-insured, New York State-chartered bank and a member of the Federal Reserve System, is supervised and regulated by the Federal Reserve Board, the FDIC, and the New York State Department of Financial Services (formerlyand the New York State Banking Department)Consumer Financial Protection Bureau, and is subject to minimum capital requirements (described below) that are calculated in a manner similar to those applicable to bank holding companies. For purposes of assessing the adequacy of its capital, GS Bank USA computes its capital ratios in accordance with the regulatory capital guidelines currentlyrequirements applicable to state member banks, whichbanks. Those requirements are based on Baselthe Revised Capital Framework described above, with changes to the definition of regulatory capital and capital ratios effective from January 1, as implemented by2014. GS Bank USA was notified in the first quarter of 2014 that it had completed a “parallel run” to the satisfaction of the Federal Reserve Board, as required under the Revised Capital Framework. As such, additional changes in GS Bank USA’s capital requirements, including changes to RWAs, became effective on April 1, 2014. GS Bank USA is an Advanced approach banking organization under the Revised Capital Framework. Under the Revised Capital Framework, as of January 1, 2014, GS Bank USA became subject to a new minimum CET1 ratio requirement of 4.0%. As of January 2015, the minimum CET1 ratio for purposes of assessing the adequacy of its capital. GS Bank USA increased from 4.0% to 4.5%.
Under the regulatory framework for prompt corrective action that is applicable to GS Bank USA as of December 2014, in order to be consideredmeet the quantitative requirements for being a “well-capitalized” depository institution, GS Bank USA must maintain a Tier 1 capital ratio of at least 6%, a total capital ratio of at least 10% and a Tier 1 leverage ratio of at least 5%. GS Bank USA has agreed with the Federal Reserve Board to minimum capital ratios in excess of these “well-capitalized” levels. Accordingly, for a period of time, GS Bank USA is expectedwas required to maintain a Tier 1 capital ratio of at least 8%6.0%, a totalTotal capital ratio of at least 11%10.0% and a Tier 1 leverage ratio of at least 6%5.0%. As of January 1, 2015, the Revised Capital Framework changed the standards for “well-capitalized” status under prompt corrective action regulations by, among other things, introducing a CET1 ratio requirement of 6.5% and increasing the Tier 1 capital ratio requirement from 6.0% to 8.0%. The Total capital ratio and Tier 1 leverage ratio requirements remain at 10.0% and 5.0%, respectively.
| 200 | Goldman Sachs 2014 Form 10-K |
THE GOLDMAN SACHS GROUP, INC. AND SUBSIDIARIES
Notes to Consolidated Financial Statements
As noted in the tabletables below, GS Bank USA was in compliance with these minimum capital requirements as of December 20112014 and December 2010.
The table below presents information regarding2013. GS Bank USA’s regulatory capital ratios under Basel 1 as implementedlevels and prompt corrective action classification are also subject to qualitative judgments by the Federal Reserve Board.
| As of December | ||||||||
| $ in millions | 2011 | 2010 | ||||||
Tier 1 capital | $ | 19,251 | $ | 18,604 | ||||
Tier 2 capital | 6 | 1 | 5,004 | |||||
Total capital | 19,257 | 23,608 | ||||||
Risk-weighted assets | 112,824 | 98,719 | ||||||
Tier 1 capital ratio | 17.1 | % | 18.8 | % | ||||
Total capital ratio | 17.1 | % 1 | 23.9 | % | ||||
Tier 1 leverage ratio | 18.5 | % | 19.5 | % | ||||
|
regulators about components of capital, risk weightings and other factors. Failure to comply with these capital requirements could result in restrictions being imposed by GS Bank USA is currently working to implement the Basel 2 framework, as implemented by the Federal Reserve Board. USA’s regulators.
Similar to the firm’s requirement as a bank holding company,firm, GS Bank USA is required to adoptcalculate ratios under both the Basel 2, once approvedIII Advanced Rules and Hybrid Capital Rules as of December 2014, in both cases subject to do so by regulators. In addition,transitional provisions. The ratios calculated under the capital requirementsHybrid Capital Rules presented in the table below were lower than those calculated under the Basel III Advanced Rules, and therefore were the binding ratios for GS Bank USA as of December 2014.
As a result of the changes in the applicable capital framework in 2014, GS Bank USA’s capital ratios as of December 2014 and December 2013 were calculated on a different basis and, accordingly, are expected to be impacted by changes to the Basel Committee’s capital guidelines, as outlined above. Furthermore, the firm expects thatnot comparable.
Effective on January 1, 2015, GS Bank USA will be impactedwas required to calculate ratios under both the Basel III Advanced Rules and Standardized Capital Rules. GS Bank USA’s ratios calculated under the Standardized Capital Rules as of December 2014 are also presented in the table below, although the ratios were not binding until January 2015.
| $ in millions | As of December 2014 | |||
Common Equity Tier 1 | $ 21,293 | |||
Tier 1 capital | $ 21,293 | |||
Tier 2 capital | $ 2,182 | |||
Total capital | $ 23,475 | |||
Hybrid RWAs | $149,963 | |||
CET1 ratio | 14.2% | |||
Tier 1 capital ratio | 14.2% | |||
Total capital ratio | 15.7% | |||
Tier 1 leverage ratio | 17.3% | |||
Standardized RWAs | $200,605 | |||
CET1 ratio | 10.6% | |||
Tier 1 capital ratio | 10.6% | |||
Total capital ratio | 11.7% | |||
The table below presents information as of December 2013 regarding GS Bank USA’s regulatory ratios under the Prior Capital Rules.
| $ in millions | As of December 2013 | |||
Tier 1 capital | $ 20,086 | |||
Tier 2 capital | $ 116 | |||
Total capital | $ 20,202 | |||
Risk-weighted assets | $134,935 | |||
Tier 1 capital ratio | 14.9% | |||
Total capital ratio | 15.0% | |||
Tier 1 leverage ratio | 16.9% | |||
The firm’s principal non-U.S. bank subsidiary, GSIB, is a wholly-owned credit institution, regulated by aspectsthe Prudential Regulation Authority (PRA) and the Financial Conduct Authority (FCA) and is subject to minimum capital requirements. As of the Dodd-Frank Act, including stress testDecember 2014 and resolution planDecember 2013, GSIB was in compliance with all regulatory capital requirements.
| Goldman Sachs 2014 Form 10-K | 201 |
THE GOLDMAN SACHS GROUP, INC. AND SUBSIDIARIES
Notes to Consolidated Financial Statements
Other.The deposits of GS Bank USA are insured by the FDIC to the extent provided by law. The Federal Reserve Board requires depository institutions tothat GS Bank USA maintain cash reserves with athe Federal Reserve Bank.Bank of New York. The amount deposited by the firm’s depository institutionGS Bank USA held at the Federal Reserve Bank of New York was approximately $40.06$38.68 billion and $28.12$50.39 billion as of December 20112014 and December 2010,2013, respectively, which exceeded required reserve amounts by $39.51$38.57 billion and $27.45$50.29 billion as of December 20112014 and December 2010,2013, respectively.
THE GOLDMAN SACHS GROUP, INC. AND SUBSIDIARIES
Notes to Consolidated Financial Statements
Transactions between GS Bank USA and its subsidiaries and Group Inc. and its subsidiaries and affiliates (other than, generally, subsidiaries of GS Bank USA) are regulated by the Federal Reserve Board. These regulations generally limit the types and amounts of transactions (including loans to and borrowings from GS Bank USA) that may take place and generally require those transactions to be on an arm’s-length basis.
Goldman Sachs International Bank, a wholly-owned credit institution, regulated by the FSA, and GS Bank Europe, a wholly-owned credit institution, regulated by the Central Bank of Ireland, are both subject to minimum capital requirements. As of December 2011 and December 2010, Goldman Sachs International Bank and GS Bank Europe were in compliance with all regulatory capital requirements.
Broker-Dealer Subsidiaries
U.S. Regulated Broker-Dealer Subsidiaries.The firm’s U.S. regulated broker-dealer subsidiaries include GS&Co. and GSEC. GS&Co. and GSEC are registered U.S. broker-dealers and futures commission merchants, and are subject to regulatory capital requirements, including those imposed by the SEC, the U.S. Commodity Futures Trading Commission (CFTC), the Chicago Mercantile Exchange, the Financial Industry Regulatory Authority, Inc. (FINRA) and the National Futures Association. Rule 15c3-1 of the SEC and Rule 1.17 of the CFTC specify uniform minimum net capital requirements, as defined, for their registrants, and also effectively require that a significant part of the registrants’ assets be kept in relatively liquid form. GS&Co. and GSEC have elected to compute their minimum capital requirements in accordance with the “Alternative Net Capital Requirement” as permitted by Rule 15c3-1.
As of December 2011,2014 and December 2013, GS&Co. had regulatory net capital, as defined by Rule 15c3-1, of $11.24$14.83 billion and $15.81 billion, respectively, which exceeded the amount required by $9.34 billion.$12.46 billion and $13.76 billion, respectively. As of December 2011,2014 and December 2013, GSEC had regulatory net capital, as defined by Rule 15c3-1, of $2.10$1.67 billion and $1.38 billion, respectively, which exceeded the amount required by $2.00 billion.$1.53 billion and $1.21 billion, respectively.
In addition to its alternative minimum net capital requirements, GS&Co. is also required to hold tentative net capital in excess of $1 billion and net capital in excess of $500 million in accordance with the market and credit risk standards of Appendix E of Rule 15c3-1. GS&Co. is also required to notify the SEC in the event that its tentative net capital is less than $5 billion. As of December 20112014 and December 2010,2013, GS&Co. had tentative net capital and net capital in excess of both the minimum and the notification requirements.
Insurance Subsidiaries
The firm has U.S. insurance subsidiaries that are subject to state insurance regulation and oversight in the states in which they are domiciled and in the other states in which they are licensed. In addition, certain of the firm’s insurance subsidiaries outside of the U.S. are regulated by the FSA and certain are regulated by the Bermuda Monetary Authority. The firm’s insurance subsidiaries were in compliance with all regulatory capital requirements as of December 2011 and December 2010.
Other Non-U.S. Regulated SubsidiariesBroker-Dealer Subsidiaries.
The firm’s principal non-U.S. regulated broker-dealer subsidiaries include GSIGoldman Sachs International (GSI) and Goldman Sachs Japan Co., Ltd. (GSJCL). GSI, the firm’s regulated U.K. broker-dealer, is subject to the capital requirements imposedregulated by the FSA.PRA and the FCA. GSJCL, the firm’s regulated Japanese broker-dealer, is subject to the capital requirements imposedregulated by Japan’s Financial Services Agency. As of December 2011These and December 2010, GSI and GSJCL were in compliance with their local capital adequacy requirements. Certaincertain other non-U.S. subsidiaries of the firm are also subject to capital adequacy requirements promulgated by authorities of the countries in which they operate. As of December 20112014 and December 2010,2013, these subsidiaries were in compliance with their local capital adequacy requirements.
Restrictions on Payments
The regulatory requirements referred to above restrict Group Inc.’s ability to withdraw capital from its regulated subsidiaries.subsidiaries is limited by minimum equity capital requirements applicable to those subsidiaries, as well as by provisions of applicable law and regulations that limit the ability of those subsidiaries to declare and pay dividends without prior regulatory approval even if the relevant subsidiary would satisfy the equity capital requirements applicable to it after giving effect to the dividend. As of December 20112014 and December 2010, approximately $25.532013, Group Inc. was required to maintain $33.62 billion and $24.70$31.20 billion, respectively, of net assets ofminimum equity capital in its regulated subsidiaries were restricted asin order to satisfy the paymentregulatory requirements of dividends to Group Inc.such subsidiaries. In addition to statutory limitations on the payment of dividends, imposed by federal and state laws, the Federal Reserve Board, the FDIC and the New York State Department of Financial Services have authority to prohibit or to limit the payment of dividends by the banking organizations they supervise (including GS Bank USA) if, in the relevant regulator’s opinion, payment of a dividend would constitute an unsafe or unsound practice in the light of the financial condition of the banking organization. Similar restrictions are imposed by regulators in jurisdictions outside of the U.S.
| 202 | Goldman Sachs |
THE GOLDMAN SACHS GROUP, INC. AND SUBSIDIARIES
Notes to Consolidated Financial Statements
Earnings Per Common Share
Basic earnings per common share (EPS) is calculated by dividing net earnings applicable to common shareholders by the weighted average number of common shares outstanding. Common shares outstanding includes common stock and RSUs for which no future service is required as a condition to the delivery of the underlying common stock. Diluted EPS includes the determinants of
basic EPS and, in addition, reflects the dilutive effect of the common stock deliverable for stock warrants and options and for RSUs for which future service is required as a condition to the delivery of the underlying common stock.
The table below presents the computations of basic and diluted EPS.
| Year Ended December | ||||||||||||
| in millions, except per share amounts | 2011 | 2010 | 2009 | |||||||||
Numerator for basic and diluted EPS — net earnings applicable to common shareholders | $ | 2,510 | $ | 7,713 | $ | 12,192 | ||||||
Denominator for basic EPS — weighted average number of common shares | 524.6 | 542.0 | 512.3 | |||||||||
Effect of dilutive securities: RSUs | 14.6 | 15.0 | 15.7 | |||||||||
Stock options and warrants | 17.7 | 28.3 | 22.9 | |||||||||
Dilutive potential common shares | 32.3 | 43.3 | 38.6 | |||||||||
Denominator for diluted EPS — weighted average number of common shares and dilutive potential common shares | 556.9 | 585.3 | 550.9 | |||||||||
Basic EPS | $ | 4.71 | $ | 14.15 | $ | 23.74 | ||||||
Diluted EPS | 4.51 | 13.18 | 22.13 | |||||||||
| Year Ended December | ||||||||||||
| in millions, except per share amounts | 2014 | 2013 | 2012 | |||||||||
Numerator for basic and diluted EPS — net earnings applicable to common shareholders | $8,077 | $7,726 | $7,292 | |||||||||
Denominator for basic EPS — weighted average number of common shares | 458.9 | 471.3 | 496.2 | |||||||||
Effect of dilutive securities: | ||||||||||||
RSUs | 6.1 | 7.2 | 11.3 | |||||||||
Stock options and warrants | 8.2 | 21.1 | 8.6 | |||||||||
Dilutive potential common shares | 14.3 | 28.3 | 19.9 | |||||||||
Denominator for diluted EPS — weighted average number of common shares and dilutive potential common shares | 473.2 | 499.6 | 516.1 | |||||||||
Basic EPS | $17.55 | $16.34 | $14.63 | |||||||||
Diluted EPS | 17.07 | 15.46 | 14.13 | |||||||||
In the table above, unvested share-based payment awards that have non-forfeitable rights to dividends or dividend equivalents are treated as a separate class of securities in calculating EPS. The impact of applying this methodology was a reduction in basic EPS of $0.05 for both 2014 and 2013, and $0.07 $0.08 and $0.06 for the years ended December 2011, December 2010 and December 2009, respectively.2012.
The diluted EPS computations in the table above do not include the following:antidilutive RSUs and common shares underlying antidilutive stock options and warrants of 6.0 million for both 2014 and 2013, and 52.4 million for 2012.
| Year Ended December | ||||||||||||
| in millions | 2011 | 2010 | 2009 | |||||||||
Number of antidilutive RSUs and common shares underlying antidilutive stock options and warrants | 9.2 | 6.2 | 24.7 | |||||||||
THE GOLDMAN SACHS GROUP, INC. AND SUBSIDIARIES
Notes to Consolidated Financial Statements
Transactions with Affiliated Funds
The firm has formed numerous nonconsolidated investment funds with third-party investors. TheAs the firm generally acts as the investment manager for these funds, and, as such,it is entitled to receive management fees and, in certain cases, advisory fees or incentive fees from these funds. Additionally, the firm invests alongside the third-party investors in certain funds.
The tables below present fees earned from affiliated funds, fees receivable from affiliated funds and the aggregate carrying value of the firm’s interests in affiliated funds.
| Year Ended December | ||||||||||||
| $ in millions | 2014 | 2013 | 2012 | |||||||||
Fees earned from affiliated funds | $3,232 | $2,897 | $2,935 | |||||||||
| Year Ended December | ||||||||||||
| in millions | 2011 | 2010 | 2009 | |||||||||
Fees earned from affiliated funds | $ | 2,789 | $ | 2,882 | $ | 2,484 | ||||||
| As of December | ||||||||||
| $ in millions | 2014 | 2013 | ||||||||
Fees receivable from funds | $ 724 | $ 817 | ||||||||
Aggregate carrying value of interests in funds 1 | 9,099 | 13,124 | ||||||||
| As of December | ||||||||
| in millions | 2011 | 2010 | ||||||
Fees receivable from funds | $ | 721 | $ | 886 | ||||
Aggregate carrying value of interests in funds | 14,960 | 14,773 | ||||||
| 1. | The decrease from December 2013 to December 2014 primarily reflects both cash and in-kind distributions received by the firm. |
As of December 2014 and December 2013, the firm has provided voluntary financial support to certainhad outstanding guarantees on behalf of its funds of $304 million and $147 million, respectively. The amounts as of December 2014 and December 2013 primarily relate to a guarantee that have experienced significant reductionsthe firm has voluntarily provided in capital and liquidity or had limited access toconnection with a financing agreement with a third-party lender executed by one of the debt markets duringfirm’s real estate funds that is not covered by the financial crisis.Volcker Rule. As of December 20112014 and December 2010,2013, the firm had exposure to these funds in the form ofno outstanding loans and guarantees of $289 million and $253 million, respectively, primarily related to certain real estate funds. In addition, as of December 2011 and 2010, the firm had outstandingor commitments to extend credit to these funds of $0 and $160 million, respectively.affiliated funds.
The Volcker Rule will restrict the firm mayfrom providing financial support to covered funds (as defined in the rule) after the expiration of the transition period. As a general matter, in the ordinary course of business, the firm does not expect to provide additional voluntary financial support to theseany covered funds if they werebut may choose to experience significant financial distress;do so with respect to funds that are not subject to the Volcker Rule; however, in the event that such amounts aresupport is provided, the amount is not expected to be material to the firm. material.
In addition, in the ordinary course of business, the firm may also engage in other activities with theseits affiliated funds including, among others, securities lending, trade execution, market making, custody, and acquisition and bridge financing. See Note 18 for the firm’s investment commitments related to these funds.
| Goldman Sachs |
THE GOLDMAN SACHS GROUP, INC. AND SUBSIDIARIES
Notes to Consolidated Financial Statements
Interest Income and Interest Expense
Interest income is recorded over the life of the instrument on an accrual basis based on contractual interest rates. The table below presents the
firm’s sources of interest income and interest expense.
| Year Ended December | Year Ended December | |||||||||||||||||||||||
| in millions | 2011 | 2010 | 2009 | |||||||||||||||||||||
| $ in millions | 2014 | 2013 | 2012 | |||||||||||||||||||||
Interest income | ||||||||||||||||||||||||
Deposits with banks | $ | 125 | $ | 86 | $ | 65 | $ 164 | $ 186 | $ 156 | |||||||||||||||
Securities borrowed, securities purchased under agreements to resell and federal funds sold | 666 | 540 | 951 | |||||||||||||||||||||
Securities borrowed, securities purchased under agreements to resell and federal funds sold 1 | (81 | ) | 43 | (77 | ) | |||||||||||||||||||
Financial instruments owned, at fair value | 10,718 | 10,346 | 11,106 | 7,452 | 8,159 | 9,817 | ||||||||||||||||||
Other interest 1 | 1,665 | 1,337 | 1,785 | |||||||||||||||||||||
Loans receivable | 708 | 296 | 150 | |||||||||||||||||||||
Other interest 2 | 1,361 | 1,376 | 1,335 | |||||||||||||||||||||
Total interest income | 13,174 | 12,309 | 13,907 | 9,604 | 10,060 | 11,381 | ||||||||||||||||||
Interest expense | ||||||||||||||||||||||||
Deposits | 280 | 304 | 415 | 333 | 387 | 399 | ||||||||||||||||||
Securities loaned and securities sold under agreements to repurchase | 905 | 708 | 1,317 | 431 | 576 | 822 | ||||||||||||||||||
Financial instruments sold, but not yet purchased, at fair value | 2,464 | 1,859 | 1,854 | 1,741 | 2,054 | 2,438 | ||||||||||||||||||
Short-term borrowings 2 | 526 | 453 | 623 | |||||||||||||||||||||
Long-term borrowings 2 | 3,439 | 3,155 | 2,585 | |||||||||||||||||||||
Other interest 3 | 368 | 327 | (294 | ) | ||||||||||||||||||||
Short-term borrowings 3 | 447 | 394 | 581 | |||||||||||||||||||||
Long-term borrowings 3 | 3,460 | 3,752 | 3,736 | |||||||||||||||||||||
Other interest 4 | (855 | ) | (495 | ) | (475 | ) | ||||||||||||||||||
Total interest expense | 7,982 | 6,806 | 6,500 | 5,557 | 6,668 | 7,501 | ||||||||||||||||||
Net interest income | $ | 5,192 | $ | 5,503 | $ | 7,407 | $4,047 | $ 3,392 | $ 3,880 | |||||||||||||||
| 1. |
|
| 2. | Includes interest income on customer debit balances and other interest-earning assets. |
Includes interest on unsecured borrowings and other secured financings. |
|
THE GOLDMAN SACHS GROUP, INC. AND SUBSIDIARIES
Notes to Consolidated Financial Statements
Income Taxes
Provision for Income Taxes
Income taxes are provided for using the asset and liability method under which deferred tax assets and liabilities are recognized for temporary differences between the financial reporting and tax bases of assets and liabilities. The firm reports interest expense related to income tax matters in “Provision for taxes” and income tax penalties in “Other expenses.”
The tables below present the components of the provision/(benefit) for taxes and a reconciliation of the U.S. federal statutory income tax rate to the firm’s effective income tax rate.
| Year Ended December | Year Ended December | |||||||||||||||||||||||
| in millions | 2011 | 2010 | 2009 | |||||||||||||||||||||
| $ in millions | 2014 | 2013 | 2012 | |||||||||||||||||||||
Current taxes | ||||||||||||||||||||||||
U.S. federal | $ | 405 | $ | 1,791 | $ | 4,039 | $1,908 | $2,589 | $3,013 | |||||||||||||||
State and local | 392 | 325 | 594 | 576 | 466 | 628 | ||||||||||||||||||
Non-U.S. | 204 | 1,083 | 2,242 | 901 | 613 | 447 | ||||||||||||||||||
Total current tax expense | 1,001 | 3,199 | 6,875 | 3,385 | 3,668 | 4,088 | ||||||||||||||||||
Deferred taxes | ||||||||||||||||||||||||
U.S. federal | 683 | 1,516 | (763 | ) | 190 | (188 | ) | (643 | ) | |||||||||||||||
State and local | 24 | 162 | (130 | ) | 38 | 67 | 38 | |||||||||||||||||
Non-U.S. | 19 | (339 | ) | 462 | 267 | 150 | 249 | |||||||||||||||||
Total deferred tax (benefit)/expense | 726 | 1,339 | (431 | ) | 495 | 29 | (356 | ) | ||||||||||||||||
Provision for taxes | $ | 1,727 | $ | 4,538 | $ | 6,444 | $3,880 | $3,697 | $3,732 | |||||||||||||||
| Year Ended December | Year Ended December | |||||||||||||||||||||||
| 2011 | 2010 | 2009 | 2014 | 2013 | 2012 | |||||||||||||||||||
U.S. federal statutory income tax rate | 35.0 | % | 35.0 | % | 35.0 | % | 35.0% | 35.0% | 35.0% | |||||||||||||||
State and local taxes, net of U.S. federal income tax effects | 4.4 | 2.5 | 1.5 | 3.2% | 4.1% | 3.8% | ||||||||||||||||||
Tax credits | (1.6 | ) | (0.7 | ) | (0.3 | ) | (1.1)% | (1.0)% | (1.0)% | |||||||||||||||
Non-U.S. operations | (6.7 | ) | (2.3 | ) | (3.5 | ) | ||||||||||||||||||
Non-U.S. operations 1 | (5.8)% | (5.6)% | (4.8)% | |||||||||||||||||||||
Tax-exempt income, including dividends | (2.4 | ) | (1.0 | ) | (0.4 | ) | (0.3)% | (0.5)% | (0.5)% | |||||||||||||||
Other | (0.7 | ) | 1.7 | 1 | 0.2 | 0.4% | (0.5)% | 0.8% | ||||||||||||||||
Effective income tax rate | 28.0 | % | 35.2 | % | 32.5 | % | 31.4% | 31.5% | 33.3% | |||||||||||||||
| 1. |
|
| 204 | Goldman Sachs |
THE GOLDMAN SACHS GROUP, INC. AND SUBSIDIARIES
Notes to Consolidated Financial Statements
Deferred Income Taxes
Deferred income taxes reflect the net tax effects of temporary differences between the financial reporting and tax bases of assets and liabilities. These temporary differences result in taxable or deductible amounts in future years and are measured using the tax rates and laws that will be in effect when such differences are expected to reverse. Valuation allowances are established to reduce
deferred tax assets to the amount that more likely than not will be realized.realized and primarily relate to the ability to utilize losses in various tax jurisdictions. Tax assets and liabilities are presented as a component of “Other assets” and “Other liabilities and accrued expenses,” respectively.
The table below presents the significant components of deferred tax assets and liabilities.
liabilities, excluding the impact of netting within tax jurisdictions.
| As of December | ||||||||
| in millions | 2011 | 2010 | ||||||
Deferred tax assets | ||||||||
Compensation and benefits | $ | 3,126 | $ | 3,397 | ||||
Unrealized losses | 849 | 731 | ||||||
ASC 740 asset related to unrecognized tax benefits | 569 | 972 | ||||||
Non-U.S. operations | 662 | 652 | ||||||
Foreign tax credits | 12 | 11 | ||||||
Net operating losses | 213 | 250 | ||||||
Occupancy-related | 110 | 129 | ||||||
Other comprehensive income-related | 168 | 68 | ||||||
Other, net | 581 | 473 | ||||||
| 6,290 | 6,683 | |||||||
Valuation allowance 1 | (65 | ) | (50 | ) | ||||
Total deferred tax assets 2 | $ | 6,225 | $ | 6,633 | ||||
Depreciation and amortization | 1,959 | 1,647 | ||||||
Other comprehensive income-related | 36 | 130 | ||||||
Total deferred tax liabilities 2 | $ | 1,995 | $ | 1,777 | ||||
|
|
THE GOLDMAN SACHS GROUP, INC. AND SUBSIDIARIES
Notes to Consolidated Financial Statements
| As of December | ||||||||
| $ in millions | 2014 | 2013 | ||||||
Deferred tax assets | ||||||||
Compensation and benefits | $3,032 | $2,740 | ||||||
Unrealized losses | — | 309 | ||||||
ASC 740 asset related to unrecognized tax benefits | 172 | 475 | ||||||
Non-U.S. operations | 1,418 | 1,318 | ||||||
Net operating losses | 336 | 232 | ||||||
Occupancy-related | 78 | 108 | ||||||
Other comprehensive income-related | 277 | 69 | ||||||
Other, net | 545 | 729 | ||||||
Subtotal | 5,858 | 5,980 | ||||||
Valuation allowance | (64 | ) | (183 | ) | ||||
Total deferred tax assets | $5,794 | $5,797 | ||||||
Depreciation and amortization | 1,176 | 1,269 | ||||||
Unrealized gains | 406 | — | ||||||
Other comprehensive income-related | — | 68 | ||||||
Total deferred tax liabilities | $1,582 | $1,337 | ||||||
The firm has recorded deferred tax assets of $213$336 million and $250$232 million as of December 20112014 and December 2010,2013, respectively, in connection with U.S. federal, state and local and foreign net operating loss carryforwards. The firm also recorded a valuation allowance of $59$26 million and $42$45 million as of December 20112014 and December 2010,2013, respectively, related to these net operating loss carryforwards.
As of December 2011,2014, the U.S. federal state and local, and foreign net operating loss carryforwards were $96$108 million $1.65and $1.2 billion, and $378 million, respectively. If not utilized, the U.S. federal net operating loss carryforward will begin to expire in 2017 and the state and local net operating loss carryforwards will begin to expire in 2012.2015. The foreign net operating loss carryforwards can be carried forward indefinitely. State and local net operating loss carryforwards of $790 million will begin to expire in 2015. If these carryforwards expire, they will not have a material impact on the firm’s results of operations. The firm had no foreign tax credit carryforwards of $12 million and $11 million as of December 2011 and December 2010, respectively. The firm recorded ano related net deferred income tax asset of $6 million and $5 millionassets as of December 20112014 and December 2010, respectively. These carryforwards will begin to expire in 2013.
The firm had no capital loss carryforwards of $6 million and $12 million as of December 2011 and December 2010, respectively. The firm recorded ano related net deferred income tax asset of $2 millionassets as of both December 20112014 and December 2010. These carryforwards expire in 2013.
The valuation allowance decreased by $119 million during 2014 and increased by $15 million and decreased by $24 million during 2011 and 2010, respectively. The increase was due to losses considered more likely than not to expire unused.2013. The decrease in 2014 was primarily due to a decrease in deferred tax assets from which the utilization of losses previously considered more likely thanfirm does not expect to expire unused.realize any benefit. The increase in 2013 was primarily due to an increase in deferred tax assets from which the firm does not expect to realize any benefit.
The firm permanently reinvests eligible earnings of certain foreign subsidiaries and, accordingly, does not accrue any U.S. income taxes that would arise if such earnings were repatriated. As of December 20112014 and December 2010,2013, this policy resulted in an unrecognized net deferred tax liability of $3.32$4.66 billion and $2.67$4.06 billion, respectively, attributable to reinvested earnings of $20.63$24.88 billion and $17.70$22.54 billion, respectively.
| Goldman Sachs 2014 Form 10-K | 205 |
THE GOLDMAN SACHS GROUP, INC. AND SUBSIDIARIES
Notes to Consolidated Financial Statements
Unrecognized Tax Benefits
The firm recognizes tax positions in the financial statements only when it is more likely than not that the position will be sustained on examination by the relevant taxing authority based on the technical merits of the position. A position that meets this standard is measured at the largest amount of benefit that will more likely than not be realized on settlement. A liability is established for differences between positions taken in a tax return and amounts recognized in the financial statements.
As of December 20112014 and December 2010,2013, the accrued liability for interest expense related to income tax matters and income tax penalties was $233$101 million and $213$410 million, respectively. The firm recognized $21 million, $28 million and $62 million of interest expense and income tax penalties of $45 million, $53 million and $95 million for the years ended December 2011, December 20102014, 2013 and December 2009,2012, respectively. It is reasonably possible that unrecognized tax benefits could change significantly during the twelve months subsequent to December 20112014 due to potential audit settlements. AtHowever, at this time it is not possible to estimate the change or its impact on the firm’s effective tax rate over the next twelve months.any potential change.
The table below presents the changes in the liability for unrecognized tax benefits, whichbenefits. This liability is recordedincluded in “Other liabilities and accrued expenses.” See Note 17 for further information.
| As of December | As of December | |||||||||||||||||||||||
| in millions | 2011 | 2010 | 2009 | |||||||||||||||||||||
| $ in millions | 2014 | 2013 | 2012 | |||||||||||||||||||||
Balance, beginning of year | $ | 2,081 | $ | 1,925 | $ | 1,548 | $ 1,765 | $2,237 | $1,887 | |||||||||||||||
Increases based on tax positions related to the current year | 171 | 171 | 143 | 204 | 144 | 190 | ||||||||||||||||||
Increases based on tax positions related to prior years | 278 | 162 | 379 | 263 | 149 | 336 | ||||||||||||||||||
Decreases related to tax positions of prior years | (41 | ) | (104 | ) | (19 | ) | ||||||||||||||||||
Decreases based on tax positions related to prior years | (241 | ) | (471 | ) | (109 | ) | ||||||||||||||||||
Decreases related to settlements | (638 | ) | (128 | ) | (91 | ) | (1,112 | ) | (299 | ) | (35 | ) | ||||||||||||
Acquisitions/(dispositions) | 47 | 56 | — | — | — | (47 | ) | |||||||||||||||||
Exchange rate fluctuations | (11 | ) | (1 | ) | (35 | ) | (8 | ) | 5 | 15 | ||||||||||||||
Balance, end of year | $ | 1,887 | $ | 2,081 | $ | 1,925 | $ 871 | $1,765 | $2,237 | |||||||||||||||
Related deferred income tax asset 1 | $ | 569 | $ | 972 | $ | 1,004 | 172 | 475 | 685 | |||||||||||||||
Net unrecognized tax benefit 2 | 1,318 | 1,109 | 921 | $ 699 | $1,290 | $1,552 | ||||||||||||||||||
| 1. | Included in “Other assets.” See Note |
| 2. | If recognized, the net tax benefit would reduce the firm’s effective income tax rate. |
THE GOLDMAN SACHS GROUP, INC. AND SUBSIDIARIES
Notes to Consolidated Financial Statements
Regulatory Tax Examinations
The firm is subject to examination by the U.S. Internal Revenue Service (IRS) and other taxing authorities in jurisdictions where the firm has significant business operations, such as the United Kingdom, Japan, Hong Kong, Korea and various states, such as New York. The tax years under examination vary by jurisdiction. The firm believes that during 2012, certain audits have a reasonable possibility of being completed. The firm does not expect completion of these audits to have a material impact on the firm’s financial condition but it may be material to operating results for a particular period, depending, in part, on the operating results for that period.
The table below presents the earliest tax years that remain subject to examination by major jurisdiction.
| Jurisdiction | As of
| |||
U.S. Federal | ||||
New York State and City | ||||
United Kingdom | ||||
Japan | ||||
Hong Kong | ||||
Korea | ||||
The U.S. Federal examinations of fiscal 2008 through calendar 2010 were finalized, but the settlement is subject to review by the Joint Committee of Taxation. The examinations of 2011 and 2012 began in 2013.
New York State and City examinations of fiscal 2004 through 2006 were finalized during 2014. The examinations of fiscal 2007 through 2010 began in 2013. The United Kingdom examinations of fiscal 2008 through 2011 were finalized during 2014. |
|
|
All years including and subsequent to the years in the table above remain open to examination by the taxing authorities. The firm believes that the liability for unrecognized tax benefits it has established is adequate in relation to the potential for additional assessments.
In January 2013, the firm was accepted into the Compliance Assurance Process program by the IRS. This program allows the firm to work with the IRS to identify and resolve potential U.S. federal tax issues before the filing of tax returns. The 2013 tax year is the first year that was examined under the program, and remains subject to post-filing review. The firm was also accepted into the program for the 2014 and 2015 tax years.
| 206 | Goldman Sachs 2014 Form 10-K |
THE GOLDMAN SACHS GROUP, INC. AND SUBSIDIARIES
Business SegmentsNotes to Consolidated Financial Statements
Business Segments
In
The firm reports its activities in the fourth quarter of 2010, the firm reorganized its three previous reportable business segments intofollowing four new reportable business segments: Investment Banking, Institutional Client Services, Investing & Lending and Investment Management. Prior periods are presented on a comparable basis.
Basis of Presentation
In reporting segments, certain of the firm’s business lines have been aggregated where they have similar economic characteristics and are similar in each of the following areas: (i) the nature of the services they provide, (ii) their methods of distribution, (iii) the types of clients they serve and (iv) the regulatory environments in which they operate.
The cost drivers of the firm taken as a whole — compensation, headcount and levels of business activity — are broadly similar in each of the firm’s business segments. Compensation and benefits expenses in the firm’s segments reflect, among other factors, the overall performance of the firm as well as the performance of individual businesses. Consequently, pre-tax margins in one segment of the firm’s business may be significantly affected by the performance of the firm’s other business segments.
The firm allocates assets (including allocations of global core liquid assets and cash, secured client financing and other assets), revenues and expenses among the four reportable business segments. Due to the integrated nature of these segments, estimates and judgments are made in allocating certain revenueassets, revenues and expense items.expenses. The allocation process is based on the manner in which management currently views the performance of the segments. Transactions between segments are based on specific criteria or approximate third-party rates. Total operating expenses include corporate itemscharitable contributions that have not been allocated to individual business segments. The allocation process is based on
Management believes that the mannerinformation in which management views the businesstable below provides a reasonable representation of the firm.each segment’s contribution to consolidatedpre-tax earnings and total assets.
| Year Ended or as of December | ||||||||||||
| $ in millions | 2014 | 2013 | 2012 | |||||||||
Investment Banking | ||||||||||||
Financial Advisory | $ 2,474 | $ 1,978 | $ 1,975 | |||||||||
Equity underwriting | 1,750 | 1,659 | 987 | |||||||||
Debt underwriting | 2,240 | 2,367 | 1,964 | |||||||||
Total Underwriting | 3,990 | 4,026 | 2,951 | |||||||||
Total net revenues | 6,464 | 6,004 | 4,926 | |||||||||
Operating expenses | 3,688 | 3,479 | 3,333 | |||||||||
Pre-tax earnings | $ 2,776 | $ 2,525 | $ 1,593 | |||||||||
Segment assets | $ 1,845 | $ 1,901 | $ 1,712 | |||||||||
Institutional Client Services | ||||||||||||
Fixed Income, Currency and Commodities Client Execution | $ 8,461 | $ 8,651 | $ 9,914 | |||||||||
Equities client execution | 2,079 | 2,594 | 3,171 | |||||||||
Commissions and fees | 3,153 | 3,103 | 3,053 | |||||||||
Securities services | 1,504 | 1,373 | 1,986 | |||||||||
Total Equities | 6,736 | 7,070 | 8,210 | |||||||||
Total net revenues 1 | 15,197 | 15,721 | 18,124 | |||||||||
Operating expenses | 10,880 | 11,792 | 12,490 | |||||||||
Pre-tax earnings | $ 4,317 | $ 3,929 | $ 5,634 | |||||||||
Segment assets | $696,013 | $788,238 | $825,496 | |||||||||
Investing & Lending | ||||||||||||
Equity securities | $ 3,813 | $ 3,930 | $ 2,800 | |||||||||
Debt securities and loans | 2,165 | 1,947 | 1,850 | |||||||||
Other | 847 | 1,141 | 1,241 | |||||||||
Total net revenues | 6,825 | 7,018 | 5,891 | |||||||||
Operating expenses | 2,819 | 2,686 | 2,668 | |||||||||
Pre-tax earnings | $ 4,006 | $ 4,332 | $ 3,223 | |||||||||
Segment assets | $143,842 | $109,285 | $ 98,600 | |||||||||
Investment Management | ||||||||||||
Management and other fees | $ 4,800 | $ 4,386 | $ 4,105 | |||||||||
Incentive fees | 776 | 662 | 701 | |||||||||
Transaction revenues | 466 | 415 | 416 | |||||||||
Total net revenues | 6,042 | 5,463 | 5,222 | |||||||||
Operating expenses | 4,647 | 4,357 | 4,296 | |||||||||
Pre-tax earnings | $ 1,395 | $ 1,106 | $ 926 | |||||||||
Segment assets | $ 14,540 | $ 12,083 | $ 12,747 | |||||||||
Total net revenues | $ 34,528 | $ 34,206 | $ 34,163 | |||||||||
Total operating expenses 2 | 22,171 | 22,469 | 22,956 | |||||||||
Total pre-tax earnings | $ 12,357 | $ 11,737 | $ 11,207 | |||||||||
Total assets | $856,240 | $911,507 | $938,555 | |||||||||
| 1. | Includes $37 million for 2013 and $121 million for 2012 of realized gains on available-for-sale securities. |
| 2. | Includes charitable contributions that have not been allocated to the firm’s segments of $137 million for 2014, $155 million for 2013 and $169 million for 2012. Operating expenses related to real estate-related exit costs, previously not allocated to the firm’s segments, have now been allocated. This allocation reflects the change in the manner in which management views the performance of the firm’s segments. Reclassifications have been made to previously reported segment amounts to conform to the current presentation. |
| Goldman Sachs | 207 |
THE GOLDMAN SACHS GROUP, INC. AND SUBSIDIARIES
Notes to Consolidated Financial Statements
The segment information presented in the table belowabove is prepared according to the following methodologies:
| Ÿ | Revenues and expenses directly associated with each segment are included in determining pre-tax earnings. |
| Ÿ | Net revenues in the firm’s segments include allocations of interest income and interest expense to specific securities, commodities and other positions in relation to the cash generated by, or funding requirements of, such underlying positions. Net interest is included in segment net revenues as it is consistent with the way in which management assesses segment performance. |
| Ÿ | Overhead expenses not directly allocable to specific segments are allocated ratably based on direct segment expenses. |
Management believes that the following information provides a reasonable representation of each segment’s contribution to consolidated pre-tax earnings and total assets.
| For the Years Ended or as of December | ||||||||||||||
| in millions | 2011 | 2010 | 2009 | |||||||||||
Investment Banking | Net revenues | $ | 4,355 | $ | 4,810 | $ | 4,984 | |||||||
Operating expenses | 2,962 | 3,511 | 3,482 | |||||||||||
Pre-tax earnings | $ | 1,393 | $ | 1,299 | $ | 1,502 | ||||||||
Segment assets | $ | 1,690 | $ | 1,870 | $ | 1,759 | ||||||||
Institutional Client Services | Net revenues 1 | $ | 17,280 | $ | 21,796 | $ | 32,719 | |||||||
Operating expenses | 12,697 | 14,291 | 13,691 | |||||||||||
Pre-tax earnings | $ | 4,583 | $ | 7,505 | $ | 19,028 | ||||||||
Segment assets | $ | 834,780 | $ | 819,765 | $ | 751,851 | ||||||||
Investing & Lending | Net revenues | $ | 2,142 | $ | 7,541 | $ | 2,863 | |||||||
Operating expenses | 2,673 | 3,361 | 3,523 | |||||||||||
Pre-tax earnings/(loss) | $ | (531 | ) | $ | 4,180 | $ | (660 | ) | ||||||
Segment assets | $ | 76,753 | $ | 78,771 | $ | 83,851 | ||||||||
Investment Management | Net revenues | $ | 5,034 | $ | 5,014 | $ | 4,607 | |||||||
Operating expenses | 4,018 | 4,051 | 3,673 | |||||||||||
Pre-tax earnings | $ | 1,016 | $ | 963 | $ | 934 | ||||||||
Segment assets | $ | 10,002 | $ | 10,926 | $ | 11,481 | ||||||||
Total | Net revenues | $ | 28,811 | $ | 39,161 | $ | 45,173 | |||||||
Operating expenses | 22,642 | 26,269 | 25,344 | |||||||||||
Pre-tax earnings | $ | 6,169 | $ | 12,892 | $ | 19,829 | ||||||||
Total assets | $ | 923,225 | $ | 911,332 | $ | 848,942 | ||||||||
|
THE GOLDMAN SACHS GROUP, INC. AND SUBSIDIARIES
Notes to Consolidated Financial Statements
Operating expenses in the table above include the following expenses that have not been allocated to the firm’s segments:
|
|
|
The tables below present the amounts of net interest income or interest expense included in net revenues, and the amounts of depreciation and amortization expense included in pre-tax earnings.
| Year Ended December | ||||||||||||
| in millions | 2011 | 2010 | 2009 | |||||||||
Investment Banking | $ | (6 | ) | $ | — | $ | — | |||||
Institutional Client Services | 4,360 | 4,692 | 6,951 | |||||||||
Investing & Lending | 635 | 609 | 242 | |||||||||
Investment Management | 203 | 202 | 214 | |||||||||
Total net interest | $ | 5,192 | $ | 5,503 | $ | 7,407 | ||||||
| Year Ended December | Year Ended December | |||||||||||||||||||||||
| in millions | 2011 | 2010 | 2009 | |||||||||||||||||||||
| $ in millions | 2014 | 2013 | 2012 | |||||||||||||||||||||
Investment Banking | $ | 174 | $ | 172 | $ | 156 | $ — | $ — | $ (15 | ) | ||||||||||||||
Institutional Client Services | 944 | 1,109 | 775 | 3,679 | 3,250 | 3,723 | ||||||||||||||||||
Investing & Lending | 563 | 422 | 793 | 237 | 25 | 26 | ||||||||||||||||||
Investment Management | 131 | 117 | 146 | |||||||||||||||||||||
Total net interest income | $4,047 | $3,392 | $3,880 | |||||||||||||||||||||
| Year Ended December | ||||||||||||||||||||||||
| $ in millions | 2014 | 2013 | 2012 | |||||||||||||||||||||
Investment Banking | $ 135 | $ 144 | $ 166 | |||||||||||||||||||||
Institutional Client Services | 525 | 571 | 802 | |||||||||||||||||||||
Investing & Lending | 530 | 441 | 565 | |||||||||||||||||||||
Investment Management | 188 | 200 | 214 | 147 | 166 | 205 | ||||||||||||||||||
Total depreciation and amortization 1 | $ | 1,869 | $ | 1,904 | $ | 1,943 | $1,337 | $1,322 | $1,738 | |||||||||||||||
| 1. |
|
Geographic Information
Due to the highly integrated nature of international financial markets, the firm manages its businesses based on the profitability of the enterprise as a whole. The methodology for allocating profitability to geographic regions is dependent on estimates and management judgment because a significant portion of the firm’s activities require cross-border coordination in order to facilitate the needs of the firm’s clients.
Geographic results are generally allocated as follows:
| Ÿ | Investment Banking: location of the client and investment banking team. |
| Ÿ | Institutional Client Services: Fixed Income, Currency and Commodities Client Execution, and Equities (excluding Securities Services): location of the market-making desk; Securities Services: location of the primary market for the underlying security. |
| Ÿ | Investing & Lending: Investing: location of the investment; Lending: location of the client. |
| Ÿ | Investment Management: location of the sales team. |
THE GOLDMAN SACHS GROUP, INC. AND SUBSIDIARIES
Notes to Consolidated Financial Statements
The table below presents the total net revenues, pre-tax earnings and net earnings of the firm by geographic region allocated based on the methodology referred to above, as
well as the percentage of total net revenues, pre-tax earnings and net earnings (excluding Corporate) for each geographic region.
In the table below, Asia includes Australia and New Zealand.
| Year Ended December | ||||||||||||||||||||||||
| $ in millions | 2011 | 2010 | 2009 | |||||||||||||||||||||
Net revenues Americas 1 | $ | 17,873 | 62 | % | $ | 21,564 | 55 | % | $ | 25,313 | 56 | % | ||||||||||||
EMEA 2 | 7,074 | 25 | 10,449 | 27 | 11,595 | 26 | ||||||||||||||||||
Asia 3, 4 | 3,864 | 13 | 7,148 | 18 | 8,265 | 18 | ||||||||||||||||||
Total net revenues | $ | 28,811 | 100 | % | $ | 39,161 | 100 | % | $ | 45,173 | 100 | % | ||||||||||||
Pre-tax earnings Americas 1 | $ | 5,466 | 85 | % | $ | 7,934 | 57 | % | $ | 11,461 | 56 | % | ||||||||||||
EMEA 2 | 1,226 | 19 | 3,080 | 22 | 5,508 | 26 | ||||||||||||||||||
Asia 3 | (231 | ) | (4 | ) | 2,933 | 21 | 3,835 | 18 | ||||||||||||||||
Subtotal | 6,461 | 100 | % | 13,947 | 100 | % | 20,804 | 100 | % | |||||||||||||||
Corporate 5 | (292 | ) | (1,055 | ) | (975 | ) | ||||||||||||||||||
Total pre-tax earnings | $ | 6,169 | $ | 12,892 | $ | 19,829 | ||||||||||||||||||
Net earnings Americas 1 | $ | 3,624 | 78 | % | $ | 4,917 | 53 | % | $ | 7,120 | 51 | % | ||||||||||||
EMEA 2 | 1,117 | 24 | 2,236 | 24 | 4,201 | 30 | ||||||||||||||||||
Asia 3 | (103 | ) | (2 | ) | 2,083 | 23 | 2,689 | 19 | ||||||||||||||||
Subtotal | 4,638 | 100 | % | 9,236 | 100 | % | 14,010 | 100 | % | |||||||||||||||
Corporate | (196 | ) | (882 | ) | (625 | ) | ||||||||||||||||||
Total net earnings | $ | 4,442 | $ | 8,354 | $ | 13,385 | ||||||||||||||||||
| Year Ended December | ||||||||||||||||||||||||
| $ in millions | 2014 | 2013 | 2012 | |||||||||||||||||||||
Net revenues | ||||||||||||||||||||||||
Americas | $20,062 | 58% | $19,858 | 58% | $20,159 | 59% | ||||||||||||||||||
Europe, Middle East and Africa | 9,057 | 26% | 8,828 | 26% | 8,612 | 25% | ||||||||||||||||||
Asia | 5,409 | 16% | 5,520 | 16% | 5,392 | 16% | ||||||||||||||||||
Total net revenues | $34,528 | 100% | $34,206 | 100% | $34,163 | 100% | ||||||||||||||||||
Pre-tax earnings | ||||||||||||||||||||||||
Americas | $ 7,144 | 57% | $ 6,794 | 57% | $ 6,956 | 61% | ||||||||||||||||||
Europe, Middle East and Africa | 3,338 | 27% | 3,230 | 27% | 2,931 | 26% | ||||||||||||||||||
Asia | 2,012 | 16% | 1,868 | 16% | 1,489 | 13% | ||||||||||||||||||
Subtotal | 12,494 | 100% | 11,892 | 100% | 11,376 | 100% | ||||||||||||||||||
Corporate 1 | (137 | ) | (155 | ) | (169 | ) | ||||||||||||||||||
Total pre-tax earnings | $12,357 | $11,737 | $11,207 | |||||||||||||||||||||
Net earnings | ||||||||||||||||||||||||
Americas | $ 4,558 | 53% | $ 4,425 | 54% | $ 4,255 | 56% | ||||||||||||||||||
Europe, Middle East and Africa | 2,576 | 30% | 2,377 | 29% | 2,361 | 31% | ||||||||||||||||||
Asia | 1,434 | 17% | 1,345 | 17% | 971 | 13% | ||||||||||||||||||
Subtotal | 8,568 | 100% | 8,147 | 100% | 7,587 | 100% | ||||||||||||||||||
Corporate | (91 | ) | (107 | ) | (112 | ) | ||||||||||||||||||
Total net earnings | $ 8,477 | $ 8,040 | $ 7,475 | |||||||||||||||||||||
| 1. |
|
|
|
|
|
| 208 | Goldman Sachs |
THE GOLDMAN SACHS GROUP, INC. AND SUBSIDIARIES
Notes to Consolidated Financial Statements
Credit Concentrations
Credit concentrations may arise from market making, client facilitation, investing, underwriting, lending and collateralized transactions and may be impacted by changes in economic, industry or political factors. The firm seeks to mitigate credit risk by actively monitoring exposures and obtaining collateral from counterparties as deemed appropriate.
While the firm’s activities expose it to many different industries and counterparties, the firm routinely executes a high volume of transactions with asset managers, investment funds, commercial banks, brokers and dealers, clearing houses and exchanges, which results in significant credit concentrations.
In the ordinary course of business, the firm may also be subject to a concentration of credit risk to a particular counterparty, borrower or issuer, including sovereign issuers, or to a particular clearing house or exchange.
The table below presents the credit concentrations in assetscash instruments held by the firm. As of December 2011 and December 2010, the firm did not have credit exposure to any other counterparty that exceeded 2% of total assets.
| As of December | As of December | |||||||||||||||
| $ in millions | 2011 | 2010 | 2014 | 2013 | ||||||||||||
U.S. government and federal agency obligations 1 | $ | 103,468 | $ | 96,350 | $69,170 | $90,118 | ||||||||||
% of total assets | 11.2 | % | 10.6 | % | 8.1% | 9.9% | ||||||||||
Other sovereign obligations 1,2 | $ | 49,025 | $ | 40,379 | ||||||||||||
Non-U.S. government and | $37,059 | $40,944 | ||||||||||||||
% of total assets | 5.3 | % | 4.4 | % | 4.3% | 4.5% | ||||||||||
| 1. | Included in “Financial instruments owned, at fair value” and “Cash and securities segregated for regulatory and other purposes.” |
As of December 2014 and December 2013, the firm did not have credit exposure to any other counterparty that exceeded 2% of total assets.
|
To reduce credit exposures, the firm may enter into agreements with counterparties that permit the firm to offset receivables and payables with such counterparties and/or enable the firm to obtain collateral on an upfront or contingent basis. Collateral obtained by the firm related to derivative assets is principally cash and is held by the firm or a third-party custodian. Collateral obtained by the firm related to resale agreements and securities borrowed transactions is primarily U.S. government and federal agency obligations and other sovereignnon-U.S. government and agency obligations. See Note 910 for further information about collateralized agreements and financings.
The table below presents U.S. government and federal agency obligations, and other sovereignnon-U.S. government and agency obligations, that collateralize resale agreements and securities borrowed transactions (including those in “Cash and securities segregated for regulatory and other purposes”). Because the firm’s primary credit exposure on such transactions is to the counterparty to the transaction, the firm would be exposed to the collateral issuer only in the event of counterparty default.
| As of December | ||||||||
| in millions | 2011 | 2010 | ||||||
U.S. government and federal agency obligations | $ | 94,603 | $ | 121,366 | ||||
Other sovereign obligations 1 | 110,178 | 73,357 | ||||||
| As of December | ||||||||
| $ in millions | 2014 | 2013 | ||||||
U.S. government and federal | $103,263 | $100,672 | ||||||
Non-U.S. government and | 71,302 | 79,021 | ||||||
| 1. | Principally |
| Goldman Sachs | 209 |
THE GOLDMAN SACHS GROUP, INC. AND SUBSIDIARIES
Notes to Consolidated Financial Statements
Legal Proceedings
The firm is involved in a number of judicial, regulatory and arbitration proceedings (including those described below) concerning matters arising in connection with the conduct of the firm’s businesses. Many of these proceedings are in early stages, and many of these cases seek an indeterminate amount of damages.
Under ASC 450, an event is “reasonably possible” if “the chance of the future event or events occurring is more than remote but less than likely” and an event is “remote” if “the chance of the future event or events occurring is slight.” Thus, references to the upper end of the range of reasonably possible loss for cases in which the firm is able to estimate a range of reasonably possible loss mean the upper end of the range of loss for cases for which the firm believes the risk of loss is more than slight. The amounts reserved against such matters are not significant as compared to the upper end of the range of reasonably possible loss.
With respect to proceedingsmatters described below for which management has been able to estimate a range of reasonably possible loss where (i) actual or potential plaintiffs have claimed an amount of money damages, (ii) the firm is being, or threatened to be, sued by purchasers in an underwriting and is not being indemnified by a party that the firm believes will pay any judgment, or (iii) the purchasers are demanding that the firm repurchase securities, management has estimated the upper end of the range of reasonably possible loss as being equal to (a) in the case of (i), the amount of money damages claimed, (b) in the case of (ii), the amountdifference between the initial sales price of the securities that the firm sold in such underwriting and the underwritingsestimated lowest subsequent price of such securities and (c) in the case of (iii), the price that purchasers paid for the securities less the estimated value, if any, as of December 20112014 of the relevant securities, in each of cases (i), (ii) and (iii), taking into account any factors believed to be relevant to the particular proceeding.matter or matters of that type. As of the date hereof, the firm has estimated the aggregate amountupper end of the range of reasonably possible lossesaggregate loss for such proceedingsmatters and for any other proceedingsmatters described below where management has been able to estimate a range of reasonably possible aggregate loss to be approximately $2.4 billion.$3.0 billion in excess of the aggregate reserves for such matters.
Management is generally unable to estimate a range of reasonably possible loss for proceedingsmatters other than those included in the estimate above, including where (i) actual or potential plaintiffs have not claimed an amount of money damages, unlessexcept in those instances where management can otherwise determine an appropriate amount, (ii) the proceedingsmatters are in early stages, (iii) matters relate to regulatory investigations or reviews, except in those instances where management can otherwise determine an appropriate amount, (iv) there is uncertainty as to the likelihood of a class being certified or the ultimate size of the class, (iv)(v) there is uncertainty as to the outcome of pending appeals or motions, (v)(vi) there are significant factual issues to be resolved, and/or (vi)(vii) there are novel legal issues presented. For example, the firm’s potential liabilities with respect to future mortgage-related “put-back” claims, any future claims arising from the ongoing investigations by members of the Residential Mortgage-Backed Securities Working Group of the U.S. Financial Fraud Enforcement Task Force (RMBS Working Group) and the action filed by the Libyan Investment Authority discussed below may ultimately result in a significant increase in the firm’s liabilities, but are not included in management’s estimate of reasonably possible loss. As another example, the firm’s potential liabilities with respect to the investigations and reviews discussed below under “Regulatory Investigations and Reviews and Related Litigation” also generally are not included in management’s estimate of reasonably possible loss. However, for these cases, management does not believe, based on currently available information, that the outcomes of such proceedingsother matters will have a material adverse effect on the firm’s financial condition, though the outcomes could be material to the firm’s operating results for any particular period, depending, in part, upon the operating results for such period.
IPO Process Matters.Group Inc. and GS&Co. are among the numerous financial services companies that have been named as defendants in a variety of lawsuits alleging improprieties in the process by which those companies participated in the underwriting of public offerings in recent years.
GS&Co. has, together with other underwriters in certain offerings as well as the issuers and certain of their officers and directors, been named as a defendant in a number of related lawsuits filed in the U.S. District Court See Note 18 for the Southern District of New York alleging, among other things, that the prospectuses for the offerings violated the federal securities laws by failing to disclose the existence of alleged arrangements tying allocations in certain offerings to higher customer brokerage commission rates as well as purchase orders in the aftermarket, and that the alleged arrangements resulted in market manipulation. On October 5, 2009, the district court approved a settlement agreement entered into by the parties. The firm has paid into a settlement fund the full amount that GS&Co. would contribute in the settlement. Certain objectors appealed certain aspects of the settlement’s approval, but all such appeals have been withdrawn or finally dismissed, thereby concluding the matter.further information about mortgage-related contingencies.
| 210 | Goldman Sachs |
THE GOLDMAN SACHS GROUP, INC. AND SUBSIDIARIES
Notes to Consolidated Financial Statements
GS&Co. is among numerous underwriting firms named as defendants in a number of complaints filed commencing October 3, 2007, in the U.S. District Court for the Western District of Washington alleging violations of Section 16 of the Exchange Act in connection with offerings of securities for 15 issuers during 1999 and 2000. The complaints generally assert that the underwriters, together with each issuer’s directors, officers and principal shareholders, entered into purported agreements to tie allocations in the offerings to increased brokerage commissions and aftermarket purchase orders. The complaints further allege that, based upon these and other purported agreements, the underwriters violated the reporting provisions of, and are subject to short-swing profit recovery under, Section 16 of the Exchange Act. The district court granted defendants’ motions to dismiss on the grounds that the plaintiff’s demands were inadequate with respect to certain actions and that the remaining actions were time-barred. On December 2, 2010, the appellate court affirmed in part and reversed in part, upholding the dismissal of seven of the actions in which GS&Co. is a defendant that were dismissed based on the deficient demands but remanding the remaining eight actions in which GS&Co. is a defendant that were dismissed as time-barred for consideration of other bases for dismissal. On June 27, 2011, the U.S. Supreme Court granted the defendants’ petition for review of whether the actions that were remanded are time-barred and denied the plaintiff’s petition.
GS&Co. has been named as a defendant in an action commenced on May 15, 2002 in New York Supreme Court, New York County, by an official committee of unsecured creditors on behalf of eToys, Inc., alleging that the firm intentionally underpriced eToys, Inc.’s initial public offering. The action seeks, among other things, unspecified compensatory damages resulting from the alleged lower amount of offering proceeds. On appeal from rulings on GS&Co.’s motion to dismiss, the New York Court of Appeals dismissed claims for breach of contract, professional malpractice and unjust enrichment, but permitted claims for breach of fiduciary duty and fraud to continue. On remand, the lower court granted GS&Co.’s motion for summary judgment and, on December 8, 2011, the appellate court affirmed the lower court’s decision. On January 9, 2012, the creditors moved for permission either to reargue the appellate decision or to appeal further to the New York Court of Appeals.
Group Inc. and certain of its affiliates have, together with various underwriters in certain offerings, received subpoenas and requests for documents and information from various governmental agencies and self-regulatory organizations in connection with investigations relating to the public offering process. Goldman Sachs has cooperated with these investigations.
World Online Litigation.In March 2001, a Dutch shareholders’ association initiated legal proceedings for an unspecified amount of damages against GSI and others in Amsterdam District Court in connection with the initial public offering of World Online in March 2000, alleging misstatements and omissions in the offering materials and that the market was artificially inflated by improper public statements and stabilization activities. Goldman Sachs and ABN AMRO Rothschild served as joint global coordinators of the approximately €2.9 billion offering. GSI underwrote 20,268,846 shares and GS&Co. underwrote 6,756,282 shares for a total offering price of approximately €1.16 billion.
The district court rejected the claims against GSI and ABN AMRO, but found World Online liable in an amount to be determined. On appeal, the Netherlands Court of Appeals affirmed in part and reversed in part the decision of the district court, holding that certain of the alleged disclosure deficiencies were actionable as to GSI and ABN AMRO. On further appeal, the Netherlands Supreme Court affirmed the rulings of the Court of Appeals, except that it found certain additional aspects of the offering materials actionable and held that individual investors could potentially hold GSI and ABN AMRO responsible for certain public statements and press releases by World Online and its former CEO. The parties entered into a definitive settlement agreement, dated July 15, 2011, pursuant to which GSI will contribute up to €48 million to a settlement fund. The firm has paid the full amount of GSI’s proposed contribution to the settlement into an escrow account. Other shareholders’ associations have made demands or filed claims for compensation of alleged damages.
THE GOLDMAN SACHS GROUP, INC. AND SUBSIDIARIES
Notes to Consolidated Financial Statements
Research Matters.Group Inc. and certain of its affiliates are subject to a number of investigations and reviews by various governmental and regulatory bodies and self-regulatory organizations relating to research practices, including, among other things, research analysts’ methods for obtaining receipt and distribution of information and communications among research analysts, sales and trading personnel and clients. On June 9, 2011, pursuant to a settlement, a consent order was entered by the Massachusetts Securities Division pursuant to which GS&Co. paid a $10 million civil penalty and agreed to various undertakings regarding certain of its research practices. Other regulators, including the SEC and FINRA, have been investigating matters similar to those involved in the Massachusetts settlement, and Goldman Sachshas been discussing potential resolution of their proposed charges.
Adelphia Communications Fraudulent Conveyance Litigation. GS&Co. is named a defendant in two adversary proceedings commenced in the U.S. Bankruptcy Court for the Southern District of New York, one on July 6, 2003 by a creditors committee, and the second on or about July 31, 2003 by an equity committee of Adelphia Communications, Inc. Those proceedings were consolidated in a single amended complaint filed by the Adelphia Recovery Trust on October 31, 2007. The complaint seeks, among other things, to recover, as fraudulent conveyances, approximately $62.9 million allegedly paid to GS&Co. by Adelphia Communications, Inc. and its affiliates in respect of margin calls made in the ordinary course of business on accounts owned by members of the family that formerly controlled Adelphia Communications, Inc. The district court assumed jurisdiction over the action and on April 8, 2011 granted GS&Co.’s motion for summary judgment. The plaintiff has appealed.
Specialist Matters. Spear, Leeds & Kellogg Specialists LLC (SLKS) and certain affiliates have received requests for information from various governmental agencies and self-regulatory organizations as part of an industry-wide investigation relating to activities of floor specialists in recent years. Goldman Sachs has cooperated with the requests.
On March 30, 2004, certain specialist firms on the NYSE, including SLKS, without admitting or denying the allegations, entered into a final global settlement with the SEC and the NYSE covering certain activities during the years 1999 through 2003. The SLKS settlement involves, among other things, (i) findings by the SEC and the NYSE that SLKS violated certain federal securities laws and NYSE rules, and in some cases failed to supervise certain individual specialists, in connection with trades that allegedly disadvantaged customer orders, (ii) a cease and desist order against SLKS, (iii) a censure of SLKS, (iv) SLKS’ agreement to pay an aggregate of $45.3 million in disgorgement and a penalty to be used to compensate customers, (v) certain undertakings with respect to SLKS’ systems and procedures, and (vi) SLKS’ retention of an independent consultant to review and evaluate certain of SLKS’ compliance systems, policies and procedures. Comparable findings were made and sanctions imposed in the settlements with other specialist firms. The settlement did not resolve the related private civil actions against SLKS and other firms or regulatory investigations involving individuals or conduct on other exchanges. On May 26, 2011, the SEC issued an order directing the undistributed settlement funds to be transferred to the U.S. Treasury; the funds will accordingly not be allocated to any settlement fund for the civil actions described below.
SLKS, Spear, Leeds & Kellogg, L.P. and Group Inc. are among numerous defendants named in purported class actions brought beginning in October 2003 on behalf of investors in the U.S. District Court for the Southern District of New York alleging violations of the federal securities laws and state common law in connection with NYSE floor specialist activities. The actions, which have been consolidated, seek unspecified compensatory damages, restitution and disgorgement on behalf of purchasers and sellers of unspecified securities between October 17, 1998 and October 15, 2003. By a decision dated March 14, 2009, the district court granted plaintiffs’ motion for class certification. The defendants’ petition with the U.S. Court of Appeals for the Second Circuit seeking review of the certification ruling was denied, and the specialist defendants’ petition for a rehearing and/or rehearing en banc was denied on February 24, 2010. On December 5, 2011, the parties reached a settlement in principle, subject to documentation and court approval. The firm has reserved the full amount of its proposed contribution to the settlement.
THE GOLDMAN SACHS GROUP, INC. AND SUBSIDIARIES
Notes to Consolidated Financial Statements
Treasury Matters.GS&Co. was named as a defendant in a purported class action filed on March 10, 2004 in the U.S. District Court for the Northern District of Illinois on behalf of holders of short positions in 30-year U.S. Treasury futures and options on the morning of October 31, 2001. The complaint alleged that the firm purchased 30-year bonds and futures prior to a forthcoming U.S. Treasury refunding announcement that morning based on non-public information about that announcement, and that such purchases increased the costs of covering such short positions. The complaint also named as defendants the Washington, D.C.-based political consultant who allegedly was the source of the information, a former GS&Co. economist who allegedly received the information, and another company and one of its employees who also allegedly received and traded on the information prior to its public announcement. The complaint alleged violations of the federal commodities and antitrust laws, as well as Illinois statutory and common law, and seeks, among other things, unspecified damages including treble damages under the antitrust laws. The district court dismissed the antitrust and Illinois state law claims but permitted the federal commodities law claims to proceed. Plaintiff’s motion for class certification was denied. GS&Co. moved for summary judgment, and the district court granted the motion but only insofar as the claim relates to the trading of treasury bonds. On October 13, 2009, the parties filed an offer of judgment and notice of acceptance with respect to plaintiff’s individual claim. The plaintiff attempted to pursue an appeal of the denial of class certification, as did another individual trader who had previously litigated and lost an individual claim and unsuccessfully sought to intervene in the purported class action. On August 5, 2011, the U.S. Court of Appeals for the Seventh Circuit affirmed the lower court’s rulings that neither the plaintiff nor the proposed intervenor could pursue the class issues on appeal, but remanded for further consideration as to the amount of pre-judgment interest on the plaintiff’s individual claim. The appellants’ petition for reconsideration en banc was denied on October 19, 2011. On remand, the district court entered a final stipulation and order on December 7, 2011 regarding calculation of pre-judgment interest, which concluded the matter.
Fannie Mae Litigation.GS&Co. was added as a defendant in an amended complaint filed on August 14, 2006 in a purported class action pending in the U.S. District Court for the District of Columbia. The complaint asserts violations of the federal securities laws generally arising from allegations concerning Fannie Mae’s accounting practices in connection with certain Fannie Mae-sponsored REMIC transactions that were allegedly arranged by GS&Co. The complaint does not specify a dollar amount of damages. The other defendants include Fannie Mae, certain of its past and present officers and directors, and accountants. By a decision dated May 8, 2007, the district court granted GS&Co.’s motion to dismiss the claim against it. The time for an appeal will not begin to run until disposition of the claims against other defendants. A motion to stay the action filed by the Federal Housing Finance Agency (FHFA), which took control of the foregoing action following Fannie Mae’s conservatorship, was denied on November 14, 2011.
Beginning in September 2006, Group Inc. and/or GS&Co. were named as defendants in four Fannie Mae shareholder derivative actions in the U.S. District Court for the District of Columbia. The complaints generally allege that the Goldman Sachs defendants aided and abetted a breach of fiduciary duty by Fannie Mae’s directors and officers in connection with certain Fannie Mae-sponsored REMIC transactions, and one of the complaints also asserts a breach of contract claim. The complaints also name as defendants certain former officers and directors of Fannie Mae as well as an outside accounting firm. The complaints seek, inter alia, unspecified damages. The Goldman Sachs defendants were dismissed without prejudice from the first filed of these actions, and the remaining claims in that action were dismissed for failure to make a demand on Fannie Mae’s board of directors. That dismissal has been affirmed on appeal. The district court dismissed the remaining three actions on July 28, 2010. The plaintiffs filed motions for reconsideration, which were denied on October 22, 2010, and have revised their notices of appeal in these actions. On January 20, 2011, the appellate court consolidated all actions on appeal.
THE GOLDMAN SACHS GROUP, INC. AND SUBSIDIARIES
Notes to Consolidated Financial Statements
Compensation-Related Litigation.On January 17, 2008, Group Inc., its Board, executive officers and members of its management committee were named as defendants in a purported shareholder derivative action in the U.S. District Court for the Eastern District of New York predicting that the firm’s 2008 Proxy Statement would violate the federal securities laws by undervaluing certain stock option awards and alleging that senior management received excessive compensation for 2007. The complaint seeks, among other things, an equitable accounting for the allegedly excessive compensation. Plaintiff’s motion for a preliminary injunction to prevent the 2008 Proxy Statement from using options valuations that the plaintiff alleges are incorrect and to require the amendment of SEC Form 4s filed by certain of the executive officers named in the complaint to reflect the stock option valuations alleged by the plaintiff was denied, and plaintiff’s appeal from this denial was dismissed. On February 13, 2009, the plaintiff filed an amended complaint, which added purported direct (i.e., non-derivative) claims based on substantially the same theory. The plaintiff filed a further amended complaint on March 24, 2010, and the defendants’ motion to dismiss this further amended complaint was granted on the ground that dismissal of the shareholder plaintiff’s prior action relating the firm’s 2007 Proxy Statement based on the failure to make a demand to the Board precluded relitigation of demand futility. On December 19, 2011, the appellate court vacated the order of dismissal, holding only that preclusion principles did not mandate dismissal and remanding for consideration of the alternative grounds for dismissal.
On March 24, 2009, the same plaintiff filed an action in New York Supreme Court, New York County against Group Inc., its directors and certain senior executives alleging violation of Delaware statutory and common law in connection with substantively similar allegations regarding stock option awards. On January 7, 2011, the plaintiff filed an amended complaint. Defendants moved to dismiss the amended complaint, and the parties subsequently agreed to stay the state court action pending the final resolution of the appeal from the dismissal of the federal court action in respect of the firm’s 2008 Proxy Statement described above, as well as any remanded proceedings further adjudicating defendants’ motion to dismiss.
Purported shareholder derivative actions were commenced in New York Supreme Court, New York County and the Delaware Court of Chancery beginning on December 14, 2009, alleging that the Board breached its fiduciary duties in connection with setting compensation levels for the year 2009 and that such levels were excessive. The complaints name as defendants Group Inc., the Board and certain senior executives. The complaints sought,inter alia, unspecified damages, restitution of certain compensation paid, and an order requiring the firm to adopt corporate reforms. In the actions in New York state court, on April 8, 2010, the plaintiffs filed a motion indicating that they no longer intend to pursue their claims but are seeking an award of attorneys’ fees in connection with bringing the suit, which the defendants opposed. By a decision dated September 21, 2011, the New York court dismissed plaintiffs’ claims as moot and denied plaintiffs’ application for attorneys’ fees. On October 25, 2011, plaintiffs appealed from the denial of a fee award. In the actions brought in the Delaware Court of Chancery, the defendants moved to dismiss, and the plaintiffs amended their complaint on April 28, 2010 to include, among other things, the allegations included in the SEC’s action described in the “Mortgage-Related Matters” section below. The plaintiffs amended the complaint a second time on January 20, 2011, the defendants moved to dismiss the second amended complaint and, by a decision dated October 12, 2011, the Delaware court dismissed plaintiffs’ second amended complaint. Plaintiffs appealed on November 9, 2011.
Group Inc. and certain of its affiliates are subject to a number of investigations and reviews from various governmental agencies and self-regulatory organizations regarding the firm’s compensation processes. The firm is cooperating with the investigations and reviews.
THE GOLDMAN SACHS GROUP, INC. AND SUBSIDIARIES
Notes to Consolidated Financial Statements
Mortgage-Related Matters. OnBeginning in April 16, 2010, the SEC brought an action (SEC Action) under the U.S. federal securities laws in the U.S. District Court for the Southern District of New York against GS&Co. and Fabrice Tourre, one of its employees, in connection with a CDO offering made in early 2007 (ABACUS 2007-AC1 transaction), alleging that the defendants made materially false and misleading statements to investors and seeking, among other things, unspecified monetary penalties. Investigations of GS&Co. by FINRA and of GSI by the FSA were subsequently initiated, and Group Inc. and certain of its affiliates have received subpoenas and requests for information from other regulators, regarding CDO offerings, including the ABACUS 2007-AC1 transaction, and related matters.
On July 14, 2010, GS&Co. entered into a consent agreement with the SEC, settling all claims made against GS&Co. in the SEC Action (SEC Settlement), pursuant to which GS&Co. paid $550 million of disgorgement and civil penalties, and which was approved by the U.S. District Court for the Southern District of New York on July 20, 2010.
On January 6, 2011, ACA Financial Guaranty Corp. filed an action against GS&Co. in respect of the ABACUS 2007-AC1 transaction in New York Supreme Court, New York County. The complaint includes allegations of fraudulent inducement, fraudulent concealment and unjust enrichment and seeks at least $30 million in compensatory damages, at least $90 million in punitive damages and unspecified disgorgement. On March 8, 2011, GS&Co. filed a motion to compel arbitration and/or to dismiss the complaint. On April 25, 2011, the plaintiff filed an amended complaint and, on June 3, 2011, GS&Co. moved to dismiss the amended complaint.
Since April 22, 2010, a number of putative shareholder derivative actions have been filed in New York Supreme Court, New York County, and the U.S. District Court for the Southern District of New York against Group Inc., the Board and certain officers and employees of Group Inc. and its affiliates in connection with mortgage-related matters between 2004 and 2007, including the ABACUS 2007-AC1 transaction and other CDO offerings. These derivative complaints generally include allegations of breach of fiduciary duty, corporate waste, abuse of control, mismanagement, unjust enrichment, misappropriation of information, securities fraud and insider trading, and
challenge the accuracy and adequacy of Group Inc.’s disclosure. These derivative complaints seek, among other things, declaratory relief, unspecified compensatory damages, restitution and certain corporate governance reforms. In addition, as described in the “Compensation-Related Litigation” section above, the plaintiffs in the compensation-related Delaware Court of Chancery actions twice amended their complaint, including to assert allegations similar to those in the derivative claims referred to above, the Delaware court granted the defendants’ motion to dismiss the second amended complaint and plaintiffs appealed on November 9, 2011.
The federal court cases have been consolidated, plaintiffs filed a consolidated amended complaint on August 1, 2011, and, on October 6, 2011, the defendants moved to dismiss the action. On December 8, 2011, the parties to the federal court action stipulated that (i) if the dismissal of the Delaware action is affirmed, the parties will submit a proposed order dismissing the federal court action with prejudice and (ii) if the Delaware action is remanded, the federal court action will be reinstated. The New York Supreme Court has consolidated the two actions pending in that court and the defendants moved to dismiss on December 2, 2011.
Since July 1, 2011, two putative shareholder derivative actions have been filed in the U.S. District Court for the Southern District of New York against Group Inc., the Board and certain officers and employees of Group Inc. and Litton in connection with the servicing of residential mortgage loans and other mortgage-related activities beginning in January 2009. The complaints generally include allegations of breach of fiduciary duty, waste, abuse of control, and mismanagement and seek, among other things, declaratory relief, unspecified damages and certain governance reforms. The district court consolidated the actions, and, on December 20, 2011, the plaintiffs filed a consolidated amended complaint. On January 31, 2012, the defendants moved to dismiss.
In addition, in October 2011, the Board received a books and records demand from a shareholder for materials relating to, among other subjects, the firm’s mortgage servicing and foreclosure activities, participation in federal programs providing assistance to financial institutions and homeowners and loan sales to Fannie Mae and Freddie Mac.
THE GOLDMAN SACHS GROUP, INC. AND SUBSIDIARIES
Notes to Consolidated Financial Statements
Since April 23, 2010, the Board has received letters from shareholders demanding that the Board take action to address alleged misconduct by GS&Co., the Board and certain officers and employees of Group Inc. and its affiliates. The demands generally allege misconduct in connection with the firm’s securitization practices, including the ABACUS 2007-AC1 transaction, the alleged failure by Group Inc. to adequately disclose the SEC investigation that led to the SEC Action, and Group Inc.’s 2009 compensation practices. The demands include a letter from a Group Inc. shareholder, which previously made a demand that the Board investigate and take action in connection with auction products matters, and expanded its demand to address the foregoing matters. The Board previously rejected the demand relating to auction products matters in September 2010, and, in August 2011, the shareholder made a books and records demand for materials related to the Board’s rejection of the shareholder’s demand letter.
In addition, beginning April 26, 2010, a number of purported securities law class actions have beenwere filed in the U.S. District Court for the Southern District of New York challenging the adequacy of Group Inc.’s public disclosure of, among other things, the firm’s activities in the CDO market, the firm’s conflict of interest management, and the SEC investigation that led to GS&Co. entering into a consent agreement with the SEC, Action.settling all claims made against GS&Co. by the SEC in connection with the ABACUS 2007-AC1 CDO offering (ABACUS 2007-AC1 transaction), pursuant to which GS&Co. paid $550 million of disgorgement and civil penalties. The purported class action complaints,consolidated amended complaint filed on July 25, 2011, which namenames as defendants Group Inc. and certain officers and employees of Group Inc. and its affiliates, have been consolidated, generally allegealleges violations of Sections 10(b) and 20(a) of the Exchange Act and seekseeks unspecified damages. PlaintiffsOn June 21, 2012, the district court dismissed the claims based on Group Inc.’s not disclosing that it had received a “Wells” notice from the staff of the SEC related to the ABACUS 2007-AC1 transaction, but permitted the plaintiffs’ other claims to proceed.
In June 2012, the Board of Directors of Group Inc. (Board) received a demand from a shareholder that the Board investigate and take action relating to the firm’s mortgage-related activities and to stock sales by certain directors and executives of the firm. On February 15, 2013, this shareholder filed a consolidated amendedputative shareholder derivative action in New York Supreme Court, New York County, against Group Inc. and certain current or former directors and employees, based on these activities and stock sales. The derivative complaint on July 25, 2011.includes allegations of breach of fiduciary duty, unjust enrichment, abuse of control, gross mismanagement and corporate waste, and seeks, among other things, unspecified monetary damages, disgorgement of profits and certain corporate governance and disclosure reforms. On October 6, 2011,May 28, 2013, Group Inc. informed the defendants movedshareholder that the Board completed its investigation and determined to dismiss.refuse the demand. On June 20, 2013, the shareholder made a books and records demand requesting materials relating to the Board’s determination. The parties have agreed to stay proceedings in the putative derivative action pending resolution of the books and records demand.
In addition, the Board has received books and records demands from several shareholders for materials relating to, among other subjects, the firm’s mortgage servicing and foreclosure activities, participation in federal programs providing assistance to financial institutions and homeowners, loan sales to Fannie Mae and Freddie Mac, mortgage-related activities and conflicts management.
GS&Co., Goldman Sachs Mortgage Company (GSMC) and GS Mortgage Securities Corp. (GSMSC) and three current or former Goldman Sachs employees are defendants in a putative class action commenced on December 11, 2008 in the U.S. District Court for the Southern District of New York brought on behalf of purchasers of various mortgage pass-through certificates and asset-backed certificates issued by various securitization trusts established by the firm and underwritten by GS&Co. in 2007. The complaint generally alleges that the registration statement and prospectus supplements for the certificates violated the federal securities laws, and seeks unspecified compensatory damages and rescission or rescissionary damages. TheBy a decision dated September 6, 2012, the U.S. Court of Appeals for the Second Circuit affirmed the district court’s dismissal of plaintiff’s claims with respect to 10 of the 17 offerings included in plaintiff’s original complaint but vacated the dismissal and remanded the case to the district court with instructions to reinstate the plaintiff’s claims with respect to the other seven offerings. On October 31, 2012, the plaintiff served an amended complaint relating to those seven offerings, plus seven additional offerings (additional offerings). On July 10, 2014, the court granted the defendants’ motion to dismiss the second amended complaint was granted with leave to replead certain claims. On March 31, 2010, the plaintiff filed a third amended complaint relating to two offerings, which the defendants moved to dismiss. This motion to dismiss was denied as to the plaintiff’s Section 12(a)(2) claims and granted as to the plaintiff’s Section 11 claims, and the plaintiff’s motion for reconsideration was denied. The plaintiff filed a motion for entry of final judgment or certification of an interlocutory appeal as to plaintiff’s Section 11 claims, which was denied. The plaintiff then filed a motion for leave to amend to reinstate the damages claims based on allegations that it had sold its securities, which was denied. On May 5, 2011, the court granted plaintiff’s motion for entry of a final judgment dismissing all its claims. The plaintiff has appealed the dismissal with respect to all of the offerings included in its original complaint.additional offerings. On June 3, 2010, another investor (who had unsuccessfully sought to intervene in the action) filed a separate putative class action asserting substantively similar allegations relating to anone of the additional offering pursuant to the 2007 registration statement. The defendantsofferings and thereafter moved to dismiss this separate action, andfurther amend its amended complaint to add claims with respect to two of the additional offerings. On March 27, 2014, the district court dismissedlargely denied defendants’ motion to dismiss as to the action, with leaveoriginal offering, but denied the separate plaintiff’s motion to replead. Plaintiff filedadd the two additional offerings through an amended complaint on October 20, 2011, and, on December 16, 2011, defendants moved to dismiss. Theseamendment. The securitization trusts issued, and GS&Co. underwrote, approximately $785 million principal amount of certificates to all purchasers in the offering at issue in this amended complaint.
THE GOLDMAN SACHS GROUP, INC. AND SUBSIDIARIES
Notes to Consolidated Financial Statements
Group Inc., GS&Co., GSMC and GSMSC are among the defendants in a separate putative class action commenced on February 6, 2009 in the U.S. District Court for the Southern District of New York brought on behalf of purchasers of various mortgage pass-through certificates and asset-backed certificates issued by various securitization trusts established by the firm and underwritten by GS&Co. in 2006. The other original defendants include three current or former Goldman Sachs employees and various rating agencies. The second amended complaint generally alleges that the registration statement and prospectus supplements for the certificates violated the federal securities laws, and seeks unspecified compensatory and rescissionary damages. Defendants moved to dismiss the second amended complaint. On January 12, 2011, the district court granted the motion to dismiss with respect to offerings in which plaintiff had not purchased securities as well as all claims against the rating agencies, but denied the motion to dismiss with respect to a single offering in which the plaintiff allegedly purchased securities. These trusts issued, and GS&Co. underwrote, approximately $698 million$11 billion principal amount of certificates to all purchasers in the offerings at issue in the complaint (excluding those offerings for which the claims have been dismissed). On February 2, 2012, the district court granted the plaintiff’s motion for class certification and on February 16, 2012, defendants filed a petitioncomplaints.
| Goldman Sachs 2014 Form 10-K | 211 |
THE GOLDMAN SACHS GROUP, INC. AND SUBSIDIARIES
Notes to review that ruling with the U.S. Court of Appeals for the Second Circuit.Consolidated Financial Statements
On September 30, 2010, a putative class action was filed in the U.S. District Court for the Southern District of New York against GS&Co., Group Inc. and two former GS&Co. employees on behalf of investors in $823 million of notes issued in 2006 and 2007 by two synthetic CDOs (Hudson Mezzanine 2006-1 and 2006-2). The complaint, which was amended on February 4, 2011,complaint asserts federal securities law and common law claims, and seeks unspecified compensatory, punitive and other damages. The defendants’ motion to dismiss was granted as to plaintiff’s claim of market manipulation and denied as to the remainder of plaintiff’s claims by a decision dated March 21, 2012. On May 21, 2012, the defendants counterclaimed for breach of contract and fraud. On June 27, 2014, the appellate court denied defendants’ petition for leave to appeal from the district court’s January 22, 2014 order granting class certification. On January 30, 2015, defendants moved to dismiss on April 5, 2011.
GS&Co., GSMC and GSMSC are among the defendants in a lawsuit filed in August 2011 by CIFG Assurance of North America, Inc. (CIFG) in the New York Supreme Court. The complaint alleges that CIFG was fraudulently induced to provide credit enhancement for a 2007 securitization sponsored by GSMC, and seeks, among other things, the repurchase of $24.7 million in aggregate principal amount of mortgages that CIFG had previously stated to be non-conforming, an accounting for any proceeds associated with mortgages discharged from the securitization and unspecified compensatory damages. On October 17, 2011, the Goldman Sachs defendants moved to dismiss.summary judgment.
Various alleged purchasers of, and counterparties and providers of credit enhancement involved in transactions relating to, mortgage pass-through certificates, CDOs and other mortgage-related products (including certain Allstate affiliates,Aozora Bank, Ltd., Basis Yield Alpha Fund (Master), Cambridge Place Investment Management Inc., the Charles Schwab Corporation, CIFG Assurance of North America, Inc., CMFG Life Insurance Company and related parties, Deutsche Zentral-Genossenschaftbank, the FDIC (as receiver for Guaranty Bank), the Federal Home Loan Banks of Boston, Chicago Indianapolis and Seattle, the FHFA (as conservator for Fannie MaeIKB Deutsche Industriebank AG, John Hancock and Freddie Mac), Heungkuk Life Insurance Co. Limited (Heungkuk), Landesbank Baden-Württemberg,related parties, Massachusetts Mutual Life Insurance Company, MoneyGram Payment Systems, Inc.,National Australia Bank, the National Credit Union Administration Stichting Pensioenfonds ABP,(as conservator or liquidating agent for several failed credit unions), Phoenix Light SF Limited and related parties, Royal Park Investments SA/NV, The Union Central Life Insurance Company, Ameritas Life Insurance Corp., Acacia Life Insurance Company, Watertown Savings Bank, Commerzbank, Texas County & District Retirement System and The Western and Southern Life Insurance Co.the Commonwealth of Virginia (on behalf of the Virginia Retirement System)) have filed complaints or summonses with notice in state and federal court or initiated arbitration proceedings against firm affiliates, generally alleging that the offering documents for the securities that they purchased contained untrue statements of material factsfact and material omissions and generally seeking rescission andand/or damages. Certain of these complaints allege fraud and seek punitive damages. Certain of these complaints also name other firms as defendants.
A number of other entities (including American International Group, Inc. (AIG), Bayerische Landesbank, Deutsche Bank National Trust Company, Deutsche Zentral-Genossenschaftbank, Erste Abwicklungsanstalt and related parties, HSH Nordbank, IKB Deutsche Industriebank AG, John Hancock and related parties, M&T Bank, Norges Bank Investment Management, PrudentialSelective Insurance Company and the State of America and related parties, and Sealink Funding Ltd.Illinois (on behalf of Illinois state retirement systems)) have threatened to assert claims of various types against the firm in connection with variousthe sale of mortgage-related transactions, and thesecurities. The firm has entered into agreements with a number of these entities to toll the relevant statute of limitations.
As of the date hereof, the aggregate notional amount of mortgage-related securities sold to plaintiffs in active and threatened cases brought againstdescribed in the firmpreceding two paragraphs where those plaintiffs are seeking rescission of such securities was approximately $16.5$6.6 billion (which does not reflect adjustment for any subsequent paydowns or distributions or any residual value of such securities)securities, statutory interest or any other adjustments that may be claimed). This amount does not include the threatened claims noted above or potential claims by these or other purchasers in the same or other mortgage-related offerings that have not actually brought claims against the firm,been described above, or claims that have been dismissed (includingdismissed.
The firm has entered into agreements with Deutsche Bank National Trust Company and U.S. Bank National Association to toll the relevant statute of limitations with respect to claims for repurchase of residential mortgage loans based on alleged breaches of representations related to $11.4 billion original notional face amount of securitizations issued by trusts for which they act as trustees.
Group Inc., Litton, Ocwen and Arrow Corporate Member Holdings LLC, a claimformer subsidiary of Group Inc., are defendants in a putative class action pending since January 23, 2013 in the U.S. District Court for the Southern District of New York generally challenging the procurement manner and scope of “force-placed” hazard insurance arranged by Landesbank Baden-Württemberg, which was dismissedLitton when homeowners failed to arrange for insurance as required by their mortgages. The complaint asserts claims for breach of contract, breach of fiduciary duty, misappropriation, conversion, unjust enrichment and violation of Florida unfair practices law, and seeks unspecified compensatory and punitive damages as well as declaratory and injunctive relief. An amended complaint, filed on November 19, 2013, added an additional plaintiff and RICO claims. On September 29, 2014, the court denied without prejudice and with leave to renew at a decision dated September 26, 2011, from whichlater date Group Inc.’s motion to sever the plaintiff appealed on October 24, 2011).claims against it and certain other defendants.
| Goldman Sachs |
THE GOLDMAN SACHS GROUP, INC. AND SUBSIDIARIES
Notes to Consolidated Financial Statements
In June 2011, Heungkuk filed a criminal complaint against certain past and present employees of the firm in South Korea relating to its purchase of a CDO securitization from Goldman Sachs. The filing does not represent any judgment by a governmental entity, but starts a process whereby the prosecutor investigates the complaint and determines whether to take action.
On September 1, 2011, Group Inc. and GS Bank USA entered into a Consent Order with the Federal Reserve Board relating to the servicing of residential mortgage loans. In addition, on September 1, 2011, GS Bank USA entered into an Agreement on Mortgage Servicing Practices with the New York State Banking Department, Litton and the acquirer of Litton, in connection with which Group Inc. agreed to forgive 25% of the unpaid principal balance on certain delinquent first lien residential mortgage loans owned by Group Inc. or a subsidiary, totaling approximately $13 million in principal forgiveness. See Note 18 for further information about these settlements.
Group Inc., GS&Co. and GSMC are among the numerous financial services firms named as defendants in a qui tam action originally filed by a realtor on April 7, 2010 purportedly on behalf of the City of Chicago and State of Illinois in Cook County, Illinois Circuit Court asserting claims under the Illinois Whistleblower Reward and Protection Act and Chicago False Claims Act, based on allegations that defendants had falsely certified compliance with various Illinois laws, which were purportedly violated in connection with mortgage origination and servicing activities. The complaint, which was originally filed under seal, seeks treble damages and civil penalties. Plaintiff filed an amended complaint on December 28, 2011, naming GS&Co. and GSMC, among others, as additional defendants and a second amended complaint on February 8, 2012.
The firm has also received, and continues to receive, requests for information and/or subpoenas fromas part of inquiries or investigations by the U.S. Department of Justice, other members of the RMBS Working Group and other federal, state and local regulators and law enforcement authorities relating to the mortgage-related securitization process, subprime mortgages, CDOs, synthetic mortgage-related products, sales communications and particular transactions involving these products, and servicing and foreclosure activities, which may subject the firm to actions, including litigation, penalties and fines. In December 2014, as part of the RMBS Working Group investigation, the firm received a letter from the U.S. Attorney for the Eastern District of California stating in connection with potentially bringing a civil action that it had preliminarily concluded that the firm had violated federal law in connection with its underwriting, securitization and sale of residential mortgage-backed securities and offering the firm an opportunity to respond. The firm is cooperating with these regulators and other authorities.authorities, including in some cases agreeing to the tolling of the relevant statute of limitations. See also “Financial Crisis-Related Matters”“Regulatory Investigations and Reviews and Related Litigation” below.
On February 24, 2012, the firm received a “Wells” notice from the staff of the SEC with respect to the disclosures contained in the offering documents used in connection with a late 2006 offering of approximately $1.3 billion of subprime residential mortgage-backed securities
underwritten by GS&Co. The firm will be making a submission to, and intends to engage in a dialogue with, the SEC staff seeking to address their concerns.
The firm expects to be the subject of additional putative shareholder derivative actions, purported class actions, rescission and “put back” claims and other litigation, additional investor and shareholder demands, and additional regulatory and other investigations and actions with respect to mortgage-related offerings, loan sales, CDOs, and servicing and foreclosure activities. See Note 18 for further information regarding mortgage-related contingencies.
Auction Products Matters. On August 21, 2008, GS&Co. entered into a settlementcontingencies not described in principle with the Office of the Attorney General of the State of New York and the Illinois Securities Department (on behalf of the North American Securities Administrators Association) regarding auction rate securities. Under the agreement, Goldman Sachs agreed, among other things, (i) to offer to repurchase at par the outstanding auction rate securities that its private wealth management clients purchased through the firm prior to February 11, 2008, with the exception of those auction rate securities where auctions were clearing, (ii) to continue to work with issuers and other interested parties, including regulatory and governmental entities, to expeditiously provide liquidity solutions for institutional investors, and (iii) to pay a $22.5 million fine. The settlement is subject to definitive documentation and approval by the various states. On June 2, 2009, GS&Co. entered into an Assurance of Discontinuance with the New York State Attorney General. On March 19, 2010, GS&Co. entered into an Administrative Consent Order with the Illinois Secretary of State, Securities Department, which had conducted an investigation on behalf of states other than New York. GS&Co. has entered into similar consent orders with most states and is in the process of doing so with the remaining states.this Note 27.
On September 4, 2008, Group Inc. was named as a defendant, together with numerous other financial services firms, in two complaints filed in the U.S. District Court for the Southern District of New York alleging that the defendants engaged in a conspiracy to manipulate the auction securities market in violation of federal antitrust laws. The actions were filed, respectively, on behalf of putative classes of issuers of and investors in auction rate securities and seek, among other things, treble damages in an unspecified amount. Defendants’ motion to dismiss was granted on January 26, 2010. On March 1, 2010, the plaintiffs appealed from the dismissal of their complaints.
THE GOLDMAN SACHS GROUP, INC. AND SUBSIDIARIES
Notes to Consolidated Financial Statements
Private Equity-Sponsored Acquisitions Litigation.Group Inc. and “GS Capital Partners” areis among numerous private equity firms and investment banks named as defendants in a federal antitrust action filed in the U.S. District Court for the District of Massachusetts in December 2007. As amended, the complaint generally alleges that the defendants have colluded to limit competition in bidding for private equity-sponsored acquisitions of public companies, thereby resulting in lower prevailing bids and, by extension, less consideration for shareholders of those companies in violation of Section 1 of the U.S. Sherman Antitrust Act and common law. The complaint seeks, among other things, treble damages in an unspecified amount. Defendants moved to dismiss on August 27, 2008. The district court dismissed claims relating to certain transactions that were the subject of releases as part of the settlement of shareholder actions challenging such transactions, and by an order dated December 15, 2008 otherwise denied the motion to dismiss. On April 26, 2010, the plaintiffs moved for leave to proceed with a second phase of discovery encompassing additional transactions. On August 18, 2010, the court permitted discovery on eight additional transactions,In June 2014, Group Inc. and the plaintiffs filed a fourth amended complaint on October 7, 2010. The defendants filed a motion to dismiss certain aspects of the fourth amended complaint on October 21, 2010, and the court granted that motion on January 13, 2011. On January 21, 2011, certain defendants, including Group Inc., filed a motion to dismiss another claim of the fourth amended complaint on the grounds that the transaction was the subject of a release as part of the settlement of a shareholder action challenging the transaction. The court granted that motion on March 1, 2011. On July 11, 2011, the plaintiffs moved for leave to file a fifth amended complaint encompassing additional transactions and to take discovery concerning those transactions. On September 7, 2011, the district court denied the plaintiffs’ motion, without prejudice, insofar as it sought leave to file a fifth amended complaint, but permitted an additional six-month phase of discovery with respect to the additional transactions.
Washington Mutual Securities Litigation. GS&Co. is among numerous underwriters named as defendants in a putative securities class action amended complaint filed on August 5, 2008 in the U.S. District Court for the Western District of Washington. As to the underwriters, plaintiffs allege that the offering documents in connection with various securities offerings by Washington Mutual, Inc.
failed to describe accurately the company’s exposure to mortgage-related activities in violation of the disclosure requirements of the federal securities laws. The defendants include past and present directors and officers of Washington Mutual, the company’s former outside auditors, and numerous underwriters. On June 30, 2011, the underwriter defendants and plaintiffs entered into a definitive settlement agreement, pursuant to which GS&Co. would contributeagreed to a settlement, fund. On November 4, 2011,which the court preliminarily approved the settlement, and the time to appeal has run, thereby concluding the matter. The firmon September 29, 2014. Group Inc., together with its affiliates, has paid the full amount of GS&Co.’sits proposed contribution to the settlement fund.settlement.
IndyMacRALI Pass-Through Certificates Litigation. GS&Co. is among numerous underwriters named as defendants in a putative securities class action initially filed on May 14, 2009 in September 2008 in New York Supreme Court, and subsequently removed to the U.S. District Court for the Southern District of New York. As to the underwriters, plaintiffs allege that the offering documents in connection with various securitizationsofferings of mortgage-related assetsmortgage-backed pass-through certificates violated the disclosure requirements of the federal securities laws. TheIn addition to the underwriters, the defendants include IndyMac-related entities formedResidential Capital, LLC (ResCap), Residential Accredit Loans, Inc. (RALI), Residential Funding Corporation (RFC), Residential Funding Securities Corporation (RFSC), and certain of their officers and directors. On January 3, 2013, the district court certified a class in connection with one offering underwritten by GS&Co. which includes only initial purchasers who bought the securitizations,securities directly from the underwriters ofor their agents no later than ten trading days after the offerings, certain ratings agencies which evaluatedoffering date. On April 30, 2013, the credit quality of the securities, and certain former officers and directors of IndyMac affiliates. On November 2, 2009, the underwriters moved to dismiss the complaint. The motion wasdistrict court granted in part on February 17, 2010plaintiffs’ request to the extent of dismissing claims based on offerings in which no plaintiff purchased, and the court reserved judgment as to the other aspectsreinstate a number of the motion. By a decision dated June 21, 2010, the district court formallypreviously dismissed all claims relating to offerings in which no named plaintiff purchased certificates (including allan additional nine offerings underwritten by GS&Co.), and both On May 10, 2013, the plaintiffs filed an amended complaint incorporating those nine additional offerings. On December 27, 2013, the court granted andthe plaintiffs’ motion for class certification as to the nine additional offerings but denied the defendants’ motionsplaintiffs’ motion to dismissexpand the time period and scope covered by the previous class definition. On October 17, 2014, the plaintiffs and defendants moved for summary judgment. On February 11, 2015, GS&Co. and the other underwriter defendants agreed to a settlement with the plaintiffs, subject to court approval. The firm has reserved the full amount of its proposed contribution to the settlement.
GS&Co. underwrote approximately $5.57 billion principal amount of securities to all purchasers in various other respects.the offerings included in the amended complaint. On May 17, 2010, four additional investors14, 2012, ResCap, RALI and RFC filed for Chapter 11 bankruptcy in the U.S. Bankruptcy Court for the Southern District of New York. On June 28, 2013, the district court entered a motion seeking to intervenefinal order and judgment approving a settlement between plaintiffs and ResCap, RALI, RFC, RFSC and their officers and directors named as defendants in order to assert claims based on additional offerings (including two underwritten by GS&Co.). On July 6, 2010 and August 19, 2010, two additional investors filed motions to intervene in order to assert claims based on additional offerings (none of which were underwritten by GS&Co.). The defendants opposed the motions on the ground that the putative intervenors’ claims were time-barred and, on June 21, 2011, the court denied the motions to intervene with respect to, among others, the claims based on the offerings underwritten by GS&Co. Certain of the putative intervenors (including those seeking to assert claims based on two offerings underwritten by GS&Co.) have appealed.action.
| Goldman Sachs | 213 |
THE GOLDMAN SACHS GROUP, INC. AND SUBSIDIARIES
Notes to Consolidated Financial Statements
GS&Co. underwrote approximately $751 million principal amount of securities to all purchasers in the offerings at issue in the May 2010 motion to intervene. On July 11, 2008, IndyMac Bank was placed under an FDIC receivership, and on July 31, 2008, IndyMac Bancorp, Inc. filed for Chapter 7 bankruptcy in the U.S. Bankruptcy Court in Los Angeles, California.
MF Global Securities Litigation.GS&Co. is among numerous underwriters named as defendants in class action complaints and an individual action filed in the U.S. District Court for the Southern District of New York commencing November 18, 2011. These complaints generally allege that the offering materials for two offerings of MF Global Holdings Ltd. (MF Global) convertible notes (aggregating approximately $575 million in principal amount) in February 2011 and July 2011, failed to, among other things, failed to describe adequately the extentnature, scope and risks of MF Global’s exposure to European sovereign debt, in violation of the disclosure requirements of the federal securities laws. On December 12, 2014, the court preliminarily approved a settlement resolving the class action, and on January 5, 2015, the court entered an order effectuating the settlement of all claims against GS&Co. underwrote an aggregate principalin the individual action. GS&Co. has paid the full amount of approximately $214 million ofits contribution to the notes.On October 31, 2011, MF Global Holdings Ltd. filed for Chapter 11 bankruptcy in the U.S. Bankruptcy Court in Manhattan, New York.settlements.
GS&Co. has also received inquiries from various governmental and regulatory bodies and self-regulatory organizations concerning certain transactions with MF Global prior to its bankruptcy filing. Goldman Sachs is cooperating with all such inquiries.
GT Advanced Technologies Securities Litigation. GS&Co. is among the underwriters named as defendants in several putative securities class actions filed in October 2014 in the U.S. District Court for the District of New Hampshire. In addition to the underwriters, the defendants include certain directors and officers of GT Advanced Technologies Inc. (GT Advanced Technologies). As to the underwriters, the complaints generally allege misstatements and omissions in connection with the December 2013 offerings by GT Advanced Technologies of approximately $86 million of common stock and $214 million principal amount of convertible senior notes, assert claims under the federal securities laws, and seek compensatory damages in an unspecified amount and rescission. GS&Co. underwrote 3,479,769 shares of common stock and $75 million principal amount of notes for an aggregate offering price of approximately $105 million. On October 6, 2014, GT Advanced Technologies filed for Chapter 11 bankruptcy.
FireEye Securities Litigation. GS&Co. is among the underwriters named as defendants in several putative securities class actions, filed beginning in June 2014 in the California Superior Court, County of Santa Clara. In addition to the underwriters, the defendants include FireEye, Inc. (FireEye) and certain of its directors and officers. The complaints generally allege misstatements and omissions in connection with the offering materials for the March 2014 offering of approximately $1.15 billion of FireEye common stock, assert claims under the federal securities laws, and seek compensatory damages in an unspecified amount and rescission. GS&Co. underwrote 2,100,000 shares for a total offering price of approximately $172 million.
Millennial Media Securities Litigation. GS&Co. is among the underwriters named as defendants in a putative securities class action filed on September 30, 2014 in the U.S. District Court for the Southern District of New York. In addition to the underwriters, the defendants include Millennial Media, Inc. (Millennial Media) and certain of its directors, officers and shareholders. As to the underwriters, the complaint generally alleges misstatements and omissions in connection with Millennial Media’s $152 million March 2012 initial public offering and the October 2012 offering of approximately $163 million of Millennial Media’s common stock, asserts claims under the federal securities laws, and seeks compensatory damages in an unspecified amount and rescission. GS&Co. underwrote 3,519,000 and 3,450,000 shares of common stock in the March and October 2012 offerings, respectively, for an aggregate offering price of approximately $95 million.
Zynga Securities Litigation. GS&Co. was among the underwriters named as defendants in a putative securities class action filed on August 1, 2012 in the California Superior Court, County of San Francisco. In addition to the underwriters, the defendants included Zynga Inc. (Zynga) and certain of its directors and officers. The consolidated amended complaint, filed on April 29, 2013, generally alleged that the offering materials for the March 2012 $516 million secondary offering of Zynga common stock by certain of Zynga’s shareholders violated the disclosure requirements of the federal securities laws, and sought compensatory damages in an unspecified amount and rescission. On February 11, 2015, the court dismissed the action.
| 214 | Goldman Sachs 2014 Form 10-K |
THE GOLDMAN SACHS GROUP, INC. AND SUBSIDIARIES
Notes to Consolidated Financial Statements
Cobalt International Energy Securities Litigation.Cobalt International Energy, Inc. (Cobalt), certain of its officers and directors (including employees of affiliates of Group Inc. who served as directors of Cobalt), shareholders of Cobalt (including certain funds affiliated with Group Inc.), affiliates of these shareholders (including Group Inc.) and underwriters (including GS&Co.) for certain offerings of Cobalt’s securities are defendants in a putative securities class action filed on November 30, 2014 in the U.S. District Court for the Southern District of Texas. The complaint asserts claims under the federal securities laws, seeks compensatory and rescissory damages in unspecified amounts and alleges material misstatements and omissions concerning Cobalt in connection with a $1.67 billion February 2012 offering of Cobalt common stock, a $1.38 billion December 2012 offering of Cobalt’s convertible notes, a $1.00 billion January 2013 offering of Cobalt’s common stock, a $1.33 billion May 2013 offering of Cobalt’s common stock, and a $1.30 billion May 2014 offering of Cobalt’s convertible notes. The complaint alleges that Group Inc., GS&Co. and the affiliated funds are liable as controlling persons with respect to all five offerings. The complaint also seeks damages (i) from GS&Co. in connection with its acting as an underwriter of 14,430,000 shares of common stock representing an aggregate offering price of approximately $465 million, $690 million principal amount of convertible notes, and approximately $508 million principal amount of convertible notes in the February 2012, December 2012 and May 2014 offerings, respectively, for an aggregate offering price of approximately $1.66 billion, and (ii) from Group Inc. and the affiliated funds in connection with their sales of 40,042,868 shares of common stock for aggregate gross proceeds of approximately $1.06 billion in the February 2012, January 2013 and May 2013 common stock offerings.
Employment-Related Matters.On May 27,September 15, 2010, a putative class action was filed in the U.S. District Court for the Southern District of New York by several contingent technology workers who were employees of third-party vendors. The plaintiffs are seeking overtime pay for alleged hours worked in excess of 40 per work week. The complaint alleges that the plaintiffs were de facto employees of GS&Co. and that GS&Co. is responsible for the overtime pay under federal and state overtime laws. The complaint seeks class action status and unspecified damages. On March 21, 2011, the parties agreed to the terms of a settlement in principle and on February 10, 2012, the court approved the terms of the settlement. The firm has reserved the full amount of the proposed settlement.
On September 15, 2010, a putative class action was filed in the U.S. District for the Southern District of New York by three female former female employees alleging that Group Inc. and GS&Co. have systematically discriminated against female employees in respect of compensation, promotion, assignments, mentoring and performance evaluations. The complaint alleges a class consisting of all female employees employed at specified levels in specified areas by Group Inc. and GS&Co. since July 2002, and asserts claims under federal and New York City discrimination laws. The complaint seeks class action status, injunctive relief and unspecified amounts of compensatory, punitive and other damages. Group Inc. and GS&Co. filed a motion to stay the claims of one of the named plaintiffs and to compel individual arbitration with that individual, based on an arbitration provision contained in an employment agreement between Group Inc. and the individual. On April 28, 2011, the magistrate judge to whomJuly 17, 2012, the district judge assigned the motion denied the motion. On July 7, 2011, the magistrate judge deniedcourt issued a decision granting in part Group Inc.’s and GS&Co.’s motion for reconsiderationto strike certain of plaintiffs’ class allegations on the magistrate judge’s decision,ground that plaintiffs lacked standing to pursue certain equitable remedies and on July 21, 2011denying Group Inc.’s and GS&Co. appealed the magistrate judge’s decision to the district court. On June 13, 2011, Group Inc. and GS&Co. moved to strike the class allegations of one of the three named plaintiffs based on her failure to exhaust administrative remedies. On September 29, 2011, the magistrate judge recommended denial of the’s motion to strike and Group Inc. and GS&Co. filed their objections to that recommendation with the district judge presiding over the case on October 11, 2011. By a decision dated January 10, 2012, the district court denied the motion to strike. On July 22, 2011, Group Inc. and GS&Co. moved to strike all of the plaintiffs’ class allegations and for partial summary judgment as to plaintiffs’ disparate impact claims. By a decision dated January 19, 2012, the magistrate judge recommended that defendants’ motion be deniedin their entirety as premature. The defendants have filed their objections toOn March 21, 2013, the U.S. Court of Appeals for the Second Circuit held that recommendation with the district judge. On November 15, 2011, the district court denied the defendants’ motion to compel arbitration should be compelled with one of the three named plaintiffs; defendants have appealed.
THE GOLDMAN SACHS GROUP, INC. AND SUBSIDIARIES
Notesplaintiffs, who as a managing director was a party to Consolidated Financial Statements
Transactionsan arbitration agreement with the Hellenic Republic (Greece).Group Inc. and certain of its affiliates have been subject to a number of investigations and reviews by various governmental and regulatory bodies and self-regulatory organizations in connection with the firm’s transactions with the Hellenic Republic (Greece), including financing and swap transactions. Goldman Sachs has cooperated with the investigations and reviews.firm. On May 19, 2014, plaintiffs moved for class certification.
Investment Management ServicesServices.. Group Inc. and certain of its affiliates are parties to various civil litigation and arbitration proceedings and other disputes with clients relating to losses allegedly sustained as a result of the firm’s investment management services. These claims generally seek, among other things, restitution or other compensatory damages and, in some cases, punitive damages. In addition, Group Inc. and its affiliates are subject from time to time to investigations and reviews by various governmental and regulatory bodies and self-regulatory organizations in connection with the firm’s investment management services. Goldman Sachs is cooperating with all such investigations and reviews.
Sales, Trading and Clearance Practices.Financial Advisory Services. Group Inc. and certain of its affiliates are subjectfrom time to a number of investigationstime parties to various civil litigation and reviews, certain of which are industry-wide, by various governmentalarbitration proceedings and regulatory bodiesother disputes with clients and self-regulatory organizationsthird parties relating to the sales, tradingfirm’s financial advisory activities. These claims generally seek, among other things, compensatory damages and, clearancein some cases, punitive damages, and in certain cases allege that the firm did not appropriately disclose or deal with conflicts of corporate and government securities and other financial products, including compliance with the SEC’s short sale rule, algorithmic and quantitative trading, futures trading, transaction reporting, securities lending practices, trading and clearance of credit derivative instruments, commodities trading, private placement practices and compliance with the U.S. Foreign Corrupt Practices Act.interest.
| Goldman Sachs 2014 Form 10-K | 215 |
THE GOLDMAN SACHS GROUP, INC. AND SUBSIDIARIES
Notes to Consolidated Financial Statements
Credit Derivatives Antitrust Matters.The European Commission announced in April 2011 that it iswas initiating proceedings to investigate further numerous financial services companies, including Group Inc., in
connection with the supply of data related to credit default swaps and in connection with profit sharing and fee arrangements for clearing of credit default swaps, including potential anti-competitive practices. TheseOn July 1, 2013, the European Commission issued to those financial services companies a Statement of Objections alleging that they colluded to limit competition in the trading of exchange-traded unfunded credit derivatives and exchange trading of credit default swaps more generally, and setting out its process for determining fines and other remedies. Group Inc.’s current understanding is that the proceedings are ongoing.related to profit sharing and fee arrangements for clearing of credit default swaps have been suspended indefinitely. The firm has received civil investigative demands from the U.S. Department of Justice (DOJ) for information on similar matters.
The CFTC has been investigating the role of GSEC as the clearing broker for an SEC-registered broker-dealer client. The CFTC staff has orally advised GSEC that it intends to recommend that the CFTC bring aiding and abetting, civil fraud and supervision-related charges against GSEC arising from its provision of clearing services to this broker-dealer client based on allegations that GSEC knew or should have known that the client’s subaccounts maintained at GSEC were actually accounts belonging to customers of the broker-dealer client and not the client’s proprietary accounts.GSEC has been discussing a potential resolution. Goldman Sachs is cooperating with the investigations and reviews.
Insider Trading Investigations. From time to time,GS&Co. and Group Inc. are among the firm and its employees are the subject of or otherwise involvednumerous defendants in regulatory investigationsputative antitrust class actions relating to insidercredit derivatives, filed beginning in May 2013 and consolidated in the U.S. District Court for the Southern District of New York. The complaints generally allege that defendants violated federal antitrust laws by conspiring to forestall the development of alternatives to OTC trading of credit derivatives and to maintain inflated bid-ask spreads for credit derivatives trading. The complaints seek declaratory and injunctive relief as well as treble damages in an unspecified amount. On September 4, 2014, the potential misusecourt granted in part and denied in part the defendants’ motion to dismiss, permitting the claim alleging an antitrust conspiracy to proceed but confining it to a period after the fall of material nonpublic information2008.
Libya-Related Litigation. GSI is the defendant in an action filed on January 21, 2014 with the High Court of Justice in London by the Libyan Investment Authority, relating to nine derivative transactions between the plaintiff and GSI and seeking, among other things, rescission of the transactions and unspecified equitable compensation and damages exceeding $1 billion. On August 4, 2014, GSI withdrew its April 10, 2014 motion for summary judgment, and on December 4, 2014, the Libyan Investment Authority filed an amended statement of claim.
Municipal Securities Matters.GS&Co. (along with, in some cases, other financial services firms) is named as respondent in a number of FINRA arbitrations filed by municipalities, municipal-owned entities, state-owned agencies or instrumentalities and non-profit entities, based on GS&Co.’s role as underwriter of the claimants’ issuances of an aggregate of approximately $2.0 billion of auction rate securities from 2003 through 2007 and as a broker-dealer with respect to auctions for these securities. The claimants generally allege that GS&Co. failed to disclose that it had a practice of placing cover bids in auctions, and/or failed to inform the claimant of the deterioration of the auction rate market beginning in the fall of 2007, and that, as a result, the claimant was forced to engage in a series of expensive refinancing and conversion transactions after the failure of the auction market in February 2008. Certain claimants also allege that GS&Co. advised them to enter into interest rate swaps in connection with their auction rate securities issuances, causing them to incur additional losses. The claims include breach of fiduciary duty, fraudulent concealment, negligent misrepresentation, breach of contract, violations of the Exchange Act and state securities laws, and breach of duties under the rules of the Municipal Securities Rulemaking Board and the effectivenessNASD. One claimant has also filed a complaint against GS&Co. in federal court asserting the same claims as in the FINRA arbitration.
GS&Co. filed complaints and motions in federal court seeking to enjoin certain of the firm’s insider trading controlsarbitrations to effectuate the exclusive forum selection clauses in the transaction documents. In one case, the district court denied the injunction but was reversed by the appellate court, and information barriers. It is the firm’s practiceU.S. Supreme Court denied the claimant’s petition for certiorari seeking review of the appellate court’s decision; in other cases, the district court granted the injunctions, which have been affirmed by the appellate court.
GS&Co. has also filed motions with the FINRA Panels to fully cooperate with any such investigations.
EU Price-Fixing Matter. On July 5, 2011,dismiss the European Commission issued a Statementarbitrations, one of Objections to Group Inc. raising allegations of an industry-wide conspiracy to fix prices for power cables including by an Italian cable company in which certain Goldman Sachs-affiliated investment funds held ownership interests from 2005 to 2009. The Statement of Objections proposes to hold Group Inc. jointly and severally liable for some or all of any fine levied against the cable company under the concept of parental liability under EU competition law.has been granted.
| Goldman Sachs |
THE GOLDMAN SACHS GROUP, INC. AND SUBSIDIARIES
Notes to Consolidated Financial Statements
Municipal Securities Matters.Commodities-Related Litigation. Group Inc. and its subsidiary, GS Power Holdings LLC (GS Power), as well as Metro, a previously consolidated subsidiary of Group Inc. that was sold in the fourth quarter of 2014, are among the defendants in a number of putative class actions filed beginning on August 1, 2013 and consolidated in the U.S. District Court for the Southern District of New York. The complaints generally allege violation of federal antitrust laws and other federal and state laws in connection with the management of aluminum storage facilities. The complaints seek declaratory, injunctive and other equitable relief as well as unspecified monetary damages, including treble damages. On August 29, 2014, the court granted the Goldman Sachs defendants’ motion to dismiss. Certain plaintiffs appealed on September 24, 2014, and the remaining plaintiffs filed proposed amended complaints on October 9 and 10, 2014.
Group Inc., GS Power, Metro and GSI are among the defendants named in putative class actions, filed beginning on May 23, 2014 in the U.S. District Court for the Southern District of New York, based on similar alleged violations of the federal antitrust laws in connection with the management of zinc storage facilities.
GSI is among the defendants named in putative class actions relating to trading in platinum and palladium, filed beginning on November 25, 2014, in the U.S. District Court for the Southern District of New York. The complaints generally allege that the defendants violated federal antitrust laws and the Commodity Exchange Act in connection with an alleged conspiracy to manipulate a benchmark for physical platinum and palladium prices and seek declaratory and injunctive relief as well as treble damages in an unspecified amount.
ISDAFIX-Related Litigation. GS&Co. is among the defendants named in several putative class actions relating to trading in interest rate derivatives, filed beginning in September 2014 in the U.S. District Court for the Southern District of New York. The complaints generally allege that the defendants violated federal antitrust laws and the Commodity Exchange Act in connection with an alleged conspiracy to manipulate the ISDAFIX benchmark and seek declaratory and injunctive relief as well as treble damages in an unspecified amount. On December 12, 2014, defendants moved to dismiss the consolidated amended complaint, and on February 12, 2015, the plaintiffs filed a second amended consolidated complaint.
Currencies-Related Litigation.GS&Co. and Group Inc. are among the defendants named in several putative antitrust class actions relating to trading in the foreign exchange markets, filed beginning in December 2013 in the U.S. District Court for the Southern District of New York. The complaints generally allege that defendants violated federal antitrust laws in connection with an alleged conspiracy to manipulate the foreign currency exchange markets and seek declaratory and injunctive relief as well as treble damages in an unspecified amount. On February 13, 2014, the cases were consolidated into one action. On February 28, 2014, Group Inc. was named in a separate putative class action on behalf of non-U.S. plaintiffs containing substantially similar allegations, which was not consolidated but was coordinated with the other proceedings for pretrial purposes; that complaint was amended on April 30, 2014. On January 28, 2015, the court denied defendants’ motion to dismiss the consolidated action and granted defendants’ motion to dismiss the amended complaint on behalf of the non-U.S. plaintiffs.
Regulatory Investigations and Reviews and Related Litigation. Group Inc. and certain of its affiliates are subject to a number of other investigations and reviews by, various governmental and regulatory bodiesin some cases have received subpoenas and self-regulatory organizations relating to transactions involving municipal securities, including wall-cross proceduresrequests for documents and conflict of interest disclosure with respect to state and municipal clients, the trading and structuring of municipal derivative instruments in connection with municipal offerings, political contribution rules, underwriting of Build America Bonds and the possible impact of credit default swap transactions on municipal issuers. Goldman Sachs is cooperating with the investigations and reviews.
Group Inc., Goldman Sachs Mitsui Marine Derivative Products, L.P. (GSMMDP) and GS Bank USA are among numerous financial services firms that have been named as defendants in numerous substantially identical individual antitrust actions filed beginning on November 12, 2009 that have been coordinated with related antitrust class action litigation and individual actions, in which no Goldman Sachs affiliate is named, for pre-trial proceedings in the U.S. District Court for the Southern District of New York. The plaintiffs include individual California municipal entities and three New York non-profit entities. All of these complaints against Group Inc., GSMMDP and GS Bank USA generally allege that the Goldman Sachs defendants participated in a conspiracy to arrange bids, fix prices and divide up the market for derivatives used by municipalities in refinancing and hedging transactionsinformation from, 1992 to 2008.
The complaints assert claims under the federal antitrust laws and either California’s Cartwright Act or New York’s Donnelly Act, and seek, among other things, treble damages under the antitrust laws in an unspecified amount and injunctive relief. On April 26, 2010, the Goldman Sachs defendants’ motion to dismiss complaints filed by several individual California municipal plaintiffs was denied. On August 19, 2011, Group Inc., GSMMDP and GS Bank USA were voluntarily dismissed without prejudice from all actions except one brought by a California municipal entity.
Financial Crisis-Related Matters. Group Inc. and certain of its affiliates are subject to a number of investigations and reviews by various governmental and regulatory bodies and self-regulatory organizations and litigation relating to the 2008 financial crisis, including the establishment and unwind of credit default swaps between Goldman Sachs and AIG and other transactions with, and in the securities of, AIG, The Bear Stearns Companies Inc., Lehman Brothers Holdings Inc. and other firms. Goldman Sachs is cooperating with the investigations and reviews.
In the second quarter of 2011, a Staff Report of the Senate Permanent Subcommittee on Investigations concerning the key causes of the financial crisis was issued. Goldman Sachs and another financial institution were used as case studies with respectvarious matters relating to the role of investment banks. The report was referred to the DOJfirm’s businesses and the SEC for review. The firm is cooperating with the investigations arising from this referral, which are ongoing.operations, including:
| Ÿ | The 2008 financial crisis; |
| Ÿ | The public offering process; |
| Ÿ | The firm’s investment management and financial advisory services; |
| Ÿ | Conflicts of interest; |
| Ÿ | Research practices, including research independence and interactions between research analysts and other firm personnel, including investment banking personnel, as well as third parties; |
| Goldman Sachs |
THE GOLDMAN SACHS GROUP, INC. AND SUBSIDIARIES
Notes to Consolidated Financial Statements
| Ÿ | Transactions involving municipal securities, including wall-cross procedures and conflict of interest disclosure with respect to state and municipal clients, the trading and structuring of municipal derivative instruments in connection with municipal offerings, political contribution rules, underwriting of Build America Bonds, municipal advisory services and the possible impact of credit default swap transactions on municipal issuers; |
| Ÿ | The sales, trading and clearance of corporate and government securities, currencies, commodities and other financial products and related sales and other communications and activities, including compliance with the SEC’s short sale rule, algorithmic, high-frequency and quantitative trading, the firm’s U.S. alternative trading system, futures trading, options trading, transaction reporting, technology systems and controls, securities lending practices, trading and clearance of credit derivative instruments, commodities activities and metals storage, private placement practices, allocations of and trading in securities, and trading activities and communications in connection with the establishment of benchmark rates, such as currency rates and the ISDAFIX benchmark rates; |
| Ÿ | Compliance with the U.S. Foreign Corrupt Practices Act, including with respect to the firm’s hiring practices; |
| Ÿ | The firm’s system of risk management and controls; and |
| Ÿ | Insider trading, the potential misuse and dissemination of material nonpublic information regarding corporate and governmental developments and the effectiveness of the firm’s insider trading controls and information barriers. |
Goldman Sachs is cooperating with all such regulatory investigations and reviews.
Employee Benefit Plans
The firm sponsors various pension plans and certain other postretirement benefit plans, primarily healthcare and life insurance. The firm also provides certain benefits to former or inactive employees prior to retirement.
Defined Benefit Pension Plans and Postretirement Plans
Employees of certain non-U.S. subsidiaries participate in various defined benefit pension plans. These plans generally provide benefits based on years of credited service and a percentage of the employee’s eligible compensation. The firm maintains a defined benefit pension plan for certain U.K. employees. As of April 2008, the U.K. defined benefit plan was closed to new participants, but willallows existing participants to continue to accrue benefits for existing participants. Thesebenefits. In 2014, the firm notified plan participants that it intends to close the U.K. defined benefit plan to future benefit accruals after March 31, 2016. The non-U.S. plans do not have a material impact on the firm’s consolidated results of operations.
The firm also maintains a defined benefit pension plan for substantially all U.S. employees hired prior to November 1, 2003. As of November 2004, this plan was closed to new participants and frozen such that existing participants would not accrue any additional benefits. In addition, the firm maintains unfunded postretirement benefit plans that provide medical and life insurance for eligible retirees and their dependents covered under these programs. These plans do not have a material impact on the firm’s consolidated results of operations.
The firm recognizes the funded status of its defined benefit pension and postretirement plans, measured as the difference between the fair value of the plan assets and the benefit obligation, in the consolidated statements of financial condition. As of December 2011,2014, “Other assets” and “Other liabilities and accrued expenses” included $135$273 million (related to an overfunded pension plan)plans) and $858$739 million, respectively, related to these plans. As of December 2010,2013, “Other assets” and “Other liabilities and accrued expenses” included $164$179 million (related to an overfunded pension plan)plans) and $641$482 million, respectively, related to these plans.
Defined Contribution Plans
The firm contributes to employer-sponsored U.S. and non-U.S. defined contribution plans. The firm’s contribution to these plans was $225 million, $193 million and $178$223 million for the years ended December 2011, December 20102014, $219 million for 2013 and December 2009, respectively.$221 million for 2012.
| Goldman Sachs |
THE GOLDMAN SACHS GROUP, INC. AND SUBSIDIARIES
Notes to Consolidated Financial Statements
Employee Incentive Plans
The cost of employee services received in exchange for a share-based award is generally measured based on the grant-date fair value of the award. Share-based awards that do not require future service (i.e., vested awards, including awards granted to retirement-eligible employees) are expensed immediately. Share-based awards that require future service are amortized over the relevant service period. Expected forfeitures are included in determining share-based employee compensation expense.
The firm pays cash dividend equivalents on outstanding RSUs. Dividend equivalents paid on RSUs are generally charged to retained earnings. Dividend equivalents paid on RSUs expected to be forfeited are included in compensation expense. The firm accounts for the tax benefit related to dividend equivalents paid on RSUs as an increase to additional paid-in capital.
The firm generally issues new shares of common stock upon delivery of share-based awards. In certain cases, primarily related to conflicted employment (as outlined in the applicable award agreements), the firm may cash settle share-based compensation awards. For awards accounted for as equity instruments,instruments. For these awards, whose terms allow for cash settlement, additional paid-in capital is adjusted to the extent of the difference between the current value of the award at the time of cash settlement and the grant-date value of the award.
Stock Incentive Plan
The firm sponsors a stock incentive plan, The Goldman Sachs Amended and Restated Stock Incentive Plan (SIP)(2013) (2013 SIP), which provides for grants of RSUs, restricted stock, dividend equivalent rights, incentive stock options, nonqualified stock options, stock appreciation rights, dividend equivalent rights, restricted stock, RSUs, awards with performance conditions and other share-based awards. Inawards, each of which may be subject to performance conditions. On May 23, 2013, shareholders approved the second quarter2013 SIP. The 2013 SIP replaces The Goldman Sachs Amended and Restated Stock Incentive Plan (SIP) previously in effect, and applies to awards granted on or after the date of 2003, the SIP was approved by the firm’s shareholders, effective for grants after April 1, 2003. The SIP was further amended and restated, effective December 31, 2008.approval.
The total number of shares of common stock that may be delivered pursuant to awards granted under the 2013 SIP throughcannot exceed 60 million shares, subject to adjustment for certain changes in corporate structure as permitted under the end2013 SIP. The 2013 SIP is scheduled to terminate on the date of the 2008 fiscal year could not exceed 250 million shares. The total numberannual meeting of shares of common stockshareholders that may be delivered for awards granted under the SIPoccurs in the 2009 fiscal year and each fiscal year thereafter cannot exceed 5% of the issued and outstanding shares of common stock, determined as of the last day of the immediately preceding fiscal year, increased by the number of shares available for awards in previous years but not covered by awards granted in such years.2016. As of December 2011 and December 2010, 161.02014, 45.7 million and 139.2 million shares respectively, were available for grant under the 2013 SIP.
Restricted Stock Units
The firm issuesgrants RSUs to employees under the 2013 SIP, primarily in connection with year-end compensation and acquisitions. RSUswhich are valued based on the closing price of the underlying shares on the date of grant after taking into account a liquidity discount for any applicable post-vesting transfer restrictions. Year-end RSUs generally vest and underlying shares of common stock deliver as outlined in the applicable RSU agreements. Employee RSU agreements generally provide that vesting is accelerated in certain circumstances, such as on retirement, death, disability and extended absence.conflicted employment. Delivery of the underlying shares of common stock is conditioned on the grantees satisfying certain vesting and other requirements outlined in the award agreements.
The table below presents the activity related to RSUs.
THE GOLDMAN SACHS GROUP, INC. AND SUBSIDIARIES
Notes to Consolidated Financial Statements
Restricted Stock Units Outstanding | Weighted Average Grant-Date Fair Value of Restricted Stock Units Outstanding | Restricted Stock Units Outstanding | Weighted Average Grant-Date Fair Value Units Outstanding | |||||||||||||||||||||||||||||||||
Future Service | No Future Service Required | Future Service | No Future Service Required | | Future Service Required | | | No Future Service Required | | | Future Service Required | | | No Future Service Required | | |||||||||||||||||||||
Outstanding, December 2010 | 21,455,793 | 39,537,417 | $ | 124.17 | $ | 145.13 | ||||||||||||||||||||||||||||||
Outstanding, December 2013 | 8,226,869 | 4 | 21,002,821 | $118.91 | $117.53 | |||||||||||||||||||||||||||||||
Granted 1, 2 | 10,250,856 | 7,156,834 | 139.47 | 143.70 | 4,832,540 | 9,567,783 | 155.13 | 149.52 | ||||||||||||||||||||||||||||
Forfeited | (1,258,410 | ) | (183,858 | ) | 128.29 | 133.15 | (800,429 | ) | (158,958 | ) | 130.57 | 139.02 | ||||||||||||||||||||||||
Delivered 3 | — | (31,815,863 | ) | — | 152.28 | — | (14,723,912 | ) | — | 121.60 | ||||||||||||||||||||||||||
Vested 2 | (16,146,050 | ) | 16,146,050 | 119.99 | 119.99 | (5,602,111 | ) | 5,602,111 | 119.78 | 119.78 | ||||||||||||||||||||||||||
Outstanding, December 2011 | 14,302,189 | 4 | 30,840,580 | 139.46 | 124.33 | |||||||||||||||||||||||||||||||
Outstanding, December 2014 | 6,656,869 | 4 | 21,289,845 | 143.07 | 129.52 | |||||||||||||||||||||||||||||||
| 1. | The weighted average grant-date fair value of RSUs granted during |
| 2. | The aggregate fair value of awards that vested during |
| 3. | Includes RSUs that were cash settled. |
| 4. | Includes |
In the first quarter of 2012,2015, the firm granted to its employees 10.414.0 million year-end RSUs, of which 6.23.6 million RSUs require future service as a condition of delivery. These awards are subject to additional conditions as outlined in the award agreements. Generally, shares underlying these awards, net of required withholding tax, deliver over a three-year period but are subject to post-vesting transfer restrictions through January 2017.2020. These grants are not included in the above table.table above.
| Goldman Sachs 2014 Form 10-K | 219 |
THE GOLDMAN SACHS GROUP, INC. AND SUBSIDIARIES
Notes to Consolidated Financial Statements
Stock Options
Stock options generally vest as outlined in the applicable stock option agreement. OptionsNo options have been granted in February 2010 will generally become exercisable in one-third installments in January 2011, January 2012 and January 2013 and will expire in February 2014.since 2010. In general, options granted prior to February 2010 expire on the tenth anniversary of the grant date, although they may be subject to earlier termination or cancellation under certain circumstances in accordance with the terms of the SIP and the applicable stock option agreement.agreement and the SIP in effect at the time of grant.
The table below presents the activity related to stock options.
| Options Outstanding | Weighted Average Exercise Price | Aggregate Intrinsic Value (in millions) | Weighted Average (years) | |||||||||||||
Outstanding, December 2010 | 55,247,865 | $ | 96.71 | $ | 4,152 | 6.25 | ||||||||||
Exercised | (4,289,438 | ) | 89.49 | |||||||||||||
Forfeited | (10,743 | ) | 79.73 | |||||||||||||
Expired | (3,690,746 | ) | 91.61 | |||||||||||||
Outstanding, December 2011 | 47,256,938 | 97.76 | 444 | 6.08 | ||||||||||||
Exercisable, December 2011 | 35,699,815 | 103.83 | 310 | 5.79 | ||||||||||||
THE GOLDMAN SACHS GROUP, INC. AND SUBSIDIARIES
Notes to Consolidated Financial Statements
| | Options Outstanding | | | Weighted Average Exercise Price | |
| Aggregate Intrinsic Value (in millions) |
|
| Weighted Average Remaining Life (years) |
| |||||
Outstanding, | 42,565,241 | $ 99.37 | $3,465 | 4.60 | ||||||||||||
Exercised | (22,609,903 | ) | 80.81 | |||||||||||||
Outstanding, | 19,955,338 | 120.40 | 1,516 | 3.28 | ||||||||||||
Exercisable, | 19,955,338 | 120.40 | 1,516 | 3.28 | ||||||||||||
The total intrinsic value of options exercised during the years ended December 2011, December 20102014, 2013 and December 20092012 was $143$2.03 billion, $26 million $510and $151 million, andrespectively.
$484 million, respectively. The table below presents options outstanding.
| Exercise Price | | Options Outstanding | | | Weighted Average Exercise Price | |
| Weighted Average Remaining Life (years) |
| |||
$ 75.00 - $ 89.99 | 12,236,264 | $ 78.78 | 4.00 | |||||||||
90.00 - 119.99 | — | — | — | |||||||||
120.00 - 134.99 | 1,737,950 | 131.64 | 0.92 | |||||||||
135.00 - 194.99 | — | — | — | |||||||||
195.00 - 209.99 | 5,981,124 | 202.27 | 2.48 | |||||||||
Outstanding, December 2014 | 19,955,338 | 120.40 | 3.28 | |||||||||
| Exercise Price | Options Outstanding | Weighted Average Exercise Price | Weighted Average (years) | |||||||||
| $ 75.00 - $89.99 | 38,119,258 | $ 78.79 | 6.37 | |||||||||
| 90.00 - 104.99 | 290,056 | 96.08 | 1.92 | |||||||||
| 105.00 - 119.99 | — | — | — | |||||||||
| 120.00 - 134.99 | 2,791,500 | 131.64 | 3.92 | |||||||||
| 135.00 - 149.99 | — | — | — | |||||||||
| 150.00 - 164.99 | 75,000 | 154.16 | 2.17 | |||||||||
| 165.00 - 194.99 | — | — | — | |||||||||
| 195.00 - 209.99 | 5,981,124 | 202.27 | 5.48 | |||||||||
| Outstanding, December 2011 | 47,256,938 | ||||||||||
TheAs of December 2014, there was $468 million of total unrecognized compensation cost related to non-vested share-based compensation arrangements. This cost is expected to be recognized over a weighted average fair valueperiod of options granted in the year ended December 2010 was $37.58 per option.1.53 years.
The tablestable below presentpresents the primary weighted average assumptions used to estimate fair value as of the grant date based on a Black-Scholes option-pricing model, and share-based compensation and the related excess tax benefit.
benefit/(provision).
| Year Ended December | ||||||||||
| 2011 | 2010 | 2009 | ||||||||
Risk-free interest rate | N/A | 1.6 | % | N/A | ||||||
Expected volatility | N/A | 32.5 | N/A | |||||||
Annual dividend per share | N/A | $1.40 | N/A | |||||||
Expected life | N/A | 3.75 years | N/A | |||||||
| Year Ended December | ||||||||||
| in millions | 2011 | 2010 | 2009 | |||||||
Share-based compensation | $ | 2,843 | $ | 4,070 | $2,030 | |||||
Excess tax benefit related to options exercised | 55 | 183 | 166 | |||||||
Excess tax benefit/(provision) related to share-based awards 1 | 138 | 239 | (793) | |||||||
| Year Ended December | ||||||||||||
| $ in millions | 2014 | 2013 | 2012 | |||||||||
Share-based compensation | $2,101 | $2,039 | $1,338 | |||||||||
Excess net tax benefit related to options exercised | 549 | 3 | 53 | |||||||||
Excess net tax benefit/(provision) related to share-based awards 1 | 788 | 94 | (11 | ) | ||||||||
| 1. | Represents the net tax benefit/(provision) recognized in additional paid-in capital on stock options exercised and the delivery of common stock underlying share-based awards. |
As of December 2011, there was $926 million of total unrecognized compensation cost related to non-vested share-based compensation arrangements. This cost is
expected to be recognized over a weighted average period of 1.62 years.
| 220 | Goldman Sachs |
THE GOLDMAN SACHS GROUP, INC. AND SUBSIDIARIES
Notes to Consolidated Financial Statements
Parent Company
| Group Inc. — Condensed Statements of Earnings | Group Inc. — Condensed Statements of Earnings | Group Inc. — Condensed Statements of Earnings |
| ||||||||||||||||||||||||
| Year Ended December | Year Ended December | ||||||||||||||||||||||||||
| in millions | 2011 | 2010 | 2009 | ||||||||||||||||||||||||
| $ in millions | 2014 | 2013 | 2012 | ||||||||||||||||||||||||
Revenues | |||||||||||||||||||||||||||
Dividends from bank subsidiary | $ | 1,000 | $ | — | $ | — | |||||||||||||||||||||
Dividends from nonbank subsidiaries | 4,967 | 6,032 | 8,793 | ||||||||||||||||||||||||
Dividends from subsidiaries | |||||||||||||||||||||||||||
Bank subsidiaries | $ 16 | $2,000 | $ — | ||||||||||||||||||||||||
Nonbank subsidiaries | 2,739 | 4,176 | 3,622 | ||||||||||||||||||||||||
Undistributed earnings of subsidiaries | 481 | 2,884 | 5,884 | 5,330 | 1,086 | 3,682 | |||||||||||||||||||||
Other revenues | (3,381 | ) | 964 | (1,018 | ) | 826 | 2,209 | 1,567 | |||||||||||||||||||
Total non-interest revenues | 3,067 | 9,880 | 13,659 | 8,911 | 9,471 | 8,871 | |||||||||||||||||||||
Interest income | 4,547 | 4,153 | 4,565 | 3,769 | 4,048 | 4,751 | |||||||||||||||||||||
Interest expense | 3,917 | 3,429 | 3,112 | 3,802 | 4,161 | 4,287 | |||||||||||||||||||||
Net interest income | 630 | 724 | 1,453 | ||||||||||||||||||||||||
Net interest income/(loss) | (33 | ) | (113 | ) | 464 | ||||||||||||||||||||||
Net revenues, including net interest income | 3,697 | 10,604 | 15,112 | 8,878 | 9,358 | 9,335 | |||||||||||||||||||||
Operating expenses | |||||||||||||||||||||||||||
Compensation and benefits | 300 | 423 | 637 | 411 | 403 | 452 | |||||||||||||||||||||
Other expenses | 252 | 238 | 1,034 | 282 | 424 | 448 | |||||||||||||||||||||
Total operating expenses | 552 | 661 | 1,671 | 693 | 827 | 900 | |||||||||||||||||||||
Pre-tax earnings | 3,145 | 9,943 | 13,441 | 8,185 | 8,531 | 8,435 | |||||||||||||||||||||
Provision/(benefit) for taxes | (1,297 | ) | 1,589 | 56 | (292 | ) | 491 | 960 | |||||||||||||||||||
Net earnings | 4,442 | 8,354 | 13,385 | 8,477 | 8,040 | 7,475 | |||||||||||||||||||||
Preferred stock dividends | 1,932 | 641 | 1,193 | 400 | 314 | 183 | |||||||||||||||||||||
Net earnings applicable to common shareholders | $ | 2,510 | $ | 7,713 | $ | 12,192 | $8,077 | $7,726 | $7,292 | ||||||||||||||||||
| Group Inc. — Condensed Statements of Financial Condition | Group Inc. — Condensed Statements of Financial Condition | Group Inc. — Condensed Statements of Financial Condition |
| |||||||||||||||
| As of December | As of December | |||||||||||||||||
| in millions | 2011 | 2010 | ||||||||||||||||
| $ in millions | 2014 | 2013 | ||||||||||||||||
Assets | ||||||||||||||||||
Cash and cash equivalents | $ | 14 | $ | 7 | $ 42 | $ 17 | ||||||||||||
Loans to and receivables from subsidiaries | ||||||||||||||||||
Bank subsidiary | 7,196 | 5,050 | ||||||||||||||||
Nonbank subsidiaries | 180,397 | 182,316 | ||||||||||||||||
Bank subsidiaries | 8,222 | 5,366 | ||||||||||||||||
Nonbank subsidiaries 1 | 171,121 | 169,653 | ||||||||||||||||
Investments in subsidiaries and other affiliates | ||||||||||||||||||
Bank subsidiary | 19,226 | 18,807 | ||||||||||||||||
Bank subsidiaries | 22,393 | 20,972 | ||||||||||||||||
Nonbank subsidiaries and other affiliates | 48,473 | 52,498 | 57,311 | 52,422 | ||||||||||||||
Financial instruments owned, at fair value | 20,698 | 24,153 | 11,812 | 16,065 | ||||||||||||||
Other assets | 7,912 | 8,612 | 7,629 | 7,575 | ||||||||||||||
Total assets | $ | 283,916 | $ | 291,443 | $278,530 | $272,070 | ||||||||||||
Liabilities and shareholders’ equity | ||||||||||||||||||
Payables to subsidiaries | $ | 693 | $ | 358 | $ 129 | $ 489 | ||||||||||||
Financial instruments sold, but not yet purchased, at fair value | 241 | 935 | 169 | 421 | ||||||||||||||
Unsecured short-term borrowings 1 | ||||||||||||||||||
With third parties | 35,368 | 32,299 | ||||||||||||||||
Unsecured short-term borrowings | ||||||||||||||||||
With third parties 2 | 31,022 | 30,611 | ||||||||||||||||
With subsidiaries | 4,701 | 5,483 | 1,955 | 4,289 | ||||||||||||||
Unsecured long-term borrowings 2 | ||||||||||||||||||
With third parties | 166,342 | 167,782 | ||||||||||||||||
With subsidiaries 3 | 1,536 | 1,000 | ||||||||||||||||
Unsecured long-term borrowings | ||||||||||||||||||
With third parties 3 | 158,613 | 153,576 | ||||||||||||||||
With subsidiaries 4 | 1,616 | 1,587 | ||||||||||||||||
Other liabilities and accrued expenses | 4,656 | 6,230 | 2,229 | 2,630 | ||||||||||||||
Total liabilities | 213,537 | 214,087 | 195,733 | 193,603 | ||||||||||||||
Commitments, contingencies and guarantees | ||||||||||||||||||
Shareholders’ equity | ||||||||||||||||||
Preferred stock | 3,100 | 6,957 | 9,200 | 7,200 | ||||||||||||||
Common stock | 8 | 8 | 9 | 8 | ||||||||||||||
Restricted stock units and employee stock options | 5,681 | 7,706 | ||||||||||||||||
Share-based awards | 3,766 | 3,839 | ||||||||||||||||
Additional paid-in capital | 45,553 | 42,103 | 50,049 | 48,998 | ||||||||||||||
Retained earnings | 58,834 | 57,163 | 78,984 | 71,961 | ||||||||||||||
Accumulated other comprehensive loss | (516 | ) | (286 | ) | (743 | ) | (524 | ) | ||||||||||
Stock held in treasury, at cost | (42,281 | ) | (36,295 | ) | (58,468 | ) | (53,015 | ) | ||||||||||
Total shareholders’ equity | 70,379 | 77,356 | 82,797 | 78,467 | ||||||||||||||
Total liabilities and shareholders’ equity | $ | 283,916 | $ | 291,443 | $278,530 | $272,070 | ||||||||||||
| Group Inc.—Condensed Statements of Cash Flows | |||||||||||||||||||||
Group Inc. — Condensed Statements of Cash Flows | Group Inc. — Condensed Statements of Cash Flows | ||||||||||||||||||||
| Year Ended December | Year Ended December | ||||||||||||||||||||
| in millions | 2011 | 2010 | 2009 | ||||||||||||||||||
| $ in millions | 2014 | 2013 | 2012 | ||||||||||||||||||
Cash flows from operating activities | |||||||||||||||||||||
Net earnings | $ | 4,442 | $ | 8,354 | $ | 13,385 | $ 8,477 | $ 8,040 | $ 7,475 | ||||||||||||
Non-cash items included in net earnings | |||||||||||||||||||||
Adjustments to reconcile net earnings to net cash provided by operating activities | |||||||||||||||||||||
Undistributed earnings of subsidiaries | (481 | ) | (2,884 | ) | (5,884 | ) | (5,330) | (1,086) | (3,682) | ||||||||||||
Depreciation and amortization | 14 | 18 | 39 | 42 | 15 | 15 | |||||||||||||||
Deferred income taxes | 809 | 214 | (3,347 | ) | (4) | 1,398 | (1,258) | ||||||||||||||
Share-based compensation | 244 | 393 | 100 | 188 | 194 | 81 | |||||||||||||||
Gain on extinguishment of junior subordinated debt | (289) | — | — | ||||||||||||||||||
Changes in operating assets and liabilities | |||||||||||||||||||||
Financial instruments owned, at fair value | 3,557 | (176 | ) | 24,382 | 6,766 | (3,235) | 2,197 | ||||||||||||||
Financial instruments sold, but not yet purchased, at fair value | (536 | ) | (1,091 | ) | (1,032 | ) | (252) | 183 | (3) | ||||||||||||
Other, net | 1,422 | 10,852 | �� | 10,081 | (5,793) | 586 | 1,888 | ||||||||||||||
Net cash provided by operating activities | 9,471 | 15,680 | 37,724 | 3,805 | 6,095 | 6,713 | |||||||||||||||
Cash flows from investing activities | |||||||||||||||||||||
Purchase of property, leasehold improvements and equipment | (42 | ) | (15 | ) | (5 | ) | (15) | (3) | (12) | ||||||||||||
Issuance of short-term loans to subsidiaries, net of repayments | 20,319 | (9,923 | ) | (6,335 | ) | ||||||||||||||||
Repayments/(issuances) of short-term loans by/(to) subsidiaries, net | (4,099) | (5,153) | 6,584 | ||||||||||||||||||
Issuance of term loans to subsidiaries | (42,902 | ) | (5,532 | ) | (13,823 | ) | (8,803) | (2,174) | (17,414) | ||||||||||||
Repayments of term loans by subsidiaries | 21,850 | 1,992 | 9,601 | 3,979 | 7,063 | 18,715 | |||||||||||||||
Capital distributions from/(contributions to) subsidiaries, net | 4,642 | (1,038 | ) | (2,781 | ) | 865 | 655 | (298) | |||||||||||||
Net cash provided by/(used for) investing activities | 3,867 | (14,516 | ) | (13,343 | ) | (8,073) | 388 | 7,575 | |||||||||||||
Cash flows from financing activities | |||||||||||||||||||||
Unsecured short-term borrowings, net | (727 | ) | 3,137 | (13,266 | ) | 963 | 1,296 | (2,647) | |||||||||||||
Proceeds from issuance of long-term borrowings | 27,251 | 21,098 | 22,814 | 37,101 | 28,458 | 26,160 | |||||||||||||||
Repayment of long-term borrowings, including the current portion | (27,865 | ) | (21,838 | ) | (27,374 | ) | (27,931) | (29,910) | (35,608) | ||||||||||||
Preferred stock repurchased | (3,857 | ) | — | (9,574 | ) | ||||||||||||||||
Purchase of trust preferred securities and senior guaranteed trust securities | (1,801) | — | — | ||||||||||||||||||
Common stock repurchased | (6,048 | ) | (4,183 | ) | (2 | ) | (5,469) | (6,175) | (4,640) | ||||||||||||
Repurchase of common stock warrants | — | — | (1,100 | ) | |||||||||||||||||
Dividends and dividend equivalents paid on common stock, preferred stock and restricted stock units | (2,771 | ) | (1,443 | ) | (2,205 | ) | |||||||||||||||
Proceeds from issuance of common stock, including stock option exercises | 368 | 581 | 6,260 | ||||||||||||||||||
Excess tax benefit related to share-based compensation | 358 | 352 | 135 | ||||||||||||||||||
Cash settlement of share-based compensation | (40 | ) | (1 | ) | (2 | ) | |||||||||||||||
Net cash used for financing activities | (13,331 | ) | (2,297 | ) | (24,314 | ) | |||||||||||||||
Net increase/(decrease) in cash and cash equivalents | 7 | (1,133 | ) | 67 | |||||||||||||||||
Dividends and dividend equivalents paid on common stock, preferred stock andshare-based awards | (1,454) | (1,302) | (1,086) | ||||||||||||||||||
Proceeds from issuance of preferred stock, net of issuance costs | 1,980 | 991 | 3,087 | ||||||||||||||||||
Proceeds from issuance of common stock, including exercise of share-based awards | 123 | 65 | 317 | ||||||||||||||||||
Excess tax benefit related to share-based awards | 782 | 98 | 130 | ||||||||||||||||||
Cash settlement of share-based awards | (1) | (1) | (1) | ||||||||||||||||||
Net cash provided by/(used for) financing activities | 4,293 | (6,480) | (14,288) | ||||||||||||||||||
Net increase in cash and cash equivalents | 25 | 3 | — | ||||||||||||||||||
Cash and cash equivalents, beginning of year | 7 | 1,140 | 1,073 | 17 | 14 | 14 | |||||||||||||||
Cash and cash equivalents, end of year | $ | 14 | $ | 7 | $ | 1,140 | $ 42 | $ 17 | $ 14 | ||||||||||||
SUPPLEMENTAL DISCLOSURES:
Cash payments for third-party interest, net of capitalized interest, were $3.83$4.31 billion, $3.07$2.78 billion and $2.77$5.11 billion for the years ended December 2011, December 20102014, 2013 and December 2009,2012, respectively.
Cash payments for income taxes, net of refunds, were $1.39$2.35 billion, $2.05$3.21 billion and $2.77$1.59 billion for 2014, 2013 and 2012, respectively.
Non-cash activity:
During 2014, the years ended December 2011, December 2010firm exchanged $1.58 billion of Trust Preferred Securities, common beneficial interests and December 2009, respectively.senior guaranteed trust securities held by the firm for $1.87 billion of the firm’s junior subordinated debt held by the issuing trusts. Following the exchange, this junior subordinated debt was extinguished.
| 1. | Primarily includes overnight loans, the proceeds of which can be used to satisfy the short-term obligations of Group Inc. |
| 2. | Includes |
Includes |
Unsecured long-term borrowings with subsidiaries by maturity date are |
Non-cash activity:
During the year ended December 2011, $103 million of common stock was issued in connection with the acquisition of Goldman Sachs Australia Pty Ltd (GS Australia), formerly Goldman Sachs & Partners Australia Group Holdings Pty Ltd.
| Goldman Sachs | 221 |
THE GOLDMAN SACHS GROUP, INC. AND SUBSIDIARIES
Supplemental Financial Information
The following represents the firm’s unaudited quarterly results for the years ended December 20112014 and December 2010.2013. These quarterly results were prepared in accordance with generally accepted accounting principlesU.S. GAAP and reflect all
adjustments that are, in the opinion of management, necessary for a fair statement of the results. These adjustments are of a normal, recurring nature.
| Three Months Ended | Three Months Ended | |||||||||||||||||||||||||||||||
| in millions, except per share data | December 2011 | September 2011 | June 2011 | March 2011 | | December 2014 | | | September 2014 | | | June 2014 | | | March 2014 | | ||||||||||||||||
Total non-interest revenues | $4,984 | $2,231 | $5,868 | $10,536 | ||||||||||||||||||||||||||||
Non-interest revenues | $6,727 | $7,338 | $8,125 | $8,291 | ||||||||||||||||||||||||||||
Interest income | 3,032 | 3,354 | 3,681 | 3,107 | 2,134 | 2,297 | 2,579 | 2,594 | ||||||||||||||||||||||||
Interest expense | 1,967 | 1,998 | 2,268 | 1,749 | 1,173 | 1,248 | 1,579 | 1,557 | ||||||||||||||||||||||||
Net interest income | 1,065 | 1,356 | 1,413 | 1,358 | 961 | 1,049 | 1,000 | 1,037 | ||||||||||||||||||||||||
Net revenues, including net interest income | 6,049 | 3,587 | 7,281 | 11,894 | 7,688 | 8,387 | 9,125 | 9,328 | ||||||||||||||||||||||||
Operating expenses 1 | 4,802 | 4,317 | 5,669 | 7,854 | 4,478 | 5,082 | 6,304 | 6,307 | ||||||||||||||||||||||||
Pre-tax earnings/(loss) | 1,247 | (730 | ) | 1,612 | 4,040 | |||||||||||||||||||||||||||
Provision/(benefit) for taxes | 234 | (337 | ) | 525 | 1,305 | |||||||||||||||||||||||||||
Net earnings/(loss) | 1,013 | (393 | ) | 1,087 | 2,735 | |||||||||||||||||||||||||||
Pre-tax earnings | 3,210 | 3,305 | 2,821 | 3,021 | ||||||||||||||||||||||||||||
Provision for taxes | 1,044 | 1,064 | 784 | 988 | ||||||||||||||||||||||||||||
Net earnings | 2,166 | 2,241 | 2,037 | 2,033 | ||||||||||||||||||||||||||||
Preferred stock dividends | 35 | 35 | 35 | 1,827 | 134 | 98 | 84 | 84 | ||||||||||||||||||||||||
Net earnings/(loss) applicable to common shareholders | $ 978 | $ (428 | ) | $1,052 | $ 908 | |||||||||||||||||||||||||||
Earnings/(loss) per common share | ||||||||||||||||||||||||||||||||
Net earnings applicable to common shareholders | $2,032 | $2,143 | $1,953 | $1,949 | ||||||||||||||||||||||||||||
Earnings per common share | ||||||||||||||||||||||||||||||||
Basic | $ 1.91 | $ (0.84 | ) | $ 1.96 | $ 1.66 | $ 4.50 | $ 4.69 | $ 4.21 | $ 4.15 | |||||||||||||||||||||||
Diluted | 1.84 | (0.84 | ) | 1.85 | 1.56 | 4.38 | 4.57 | 4.10 | 4.02 | |||||||||||||||||||||||
Dividends declared per common share | 0.35 | 0.35 | 0.35 | 0.35 | 0.60 | 0.55 | 0.55 | 0.55 | ||||||||||||||||||||||||
| Three Months Ended | Three Months Ended | |||||||||||||||||||||||||||||||
| in millions, except per share data | December 2010 | September 2010 | June 2010 | March 2010 | | December 2013 | | | September 2013 | | | June 2013 | | | March 2013 | | ||||||||||||||||
Total non-interest revenues | $7,304 | $7,775 | $7,222 | $11,357 | ||||||||||||||||||||||||||||
Non-interest revenues | $7,981 | $5,882 | $7,786 | $9,165 | ||||||||||||||||||||||||||||
Interest income | 3,069 | 2,937 | 3,302 | 3,001 | 2,391 | 2,398 | 2,663 | 2,608 | ||||||||||||||||||||||||
Interest expense | 1,731 | 1,809 | 1,683 | 1,583 | 1,590 | 1,558 | 1,837 | 1,683 | ||||||||||||||||||||||||
Net interest income | 1,338 | 1,128 | 1,619 | 1,418 | 801 | 840 | 826 | 925 | ||||||||||||||||||||||||
Net revenues, including net interest income | 8,642 | 8,903 | 8,841 | 12,775 | 8,782 | 6,722 | 8,612 | 10,090 | ||||||||||||||||||||||||
Operating expenses 1 | 5,168 | 6,092 | 7,393 | 7,616 | 5,230 | 4,555 | 5,967 | 6,717 | ||||||||||||||||||||||||
Pre-tax earnings | 3,474 | 2,811 | 1,448 | 5,159 | 3,552 | 2,167 | 2,645 | 3,373 | ||||||||||||||||||||||||
Provision for taxes | 1,087 | 913 | 835 | 1,703 | 1,220 | 650 | 714 | 1,113 | ||||||||||||||||||||||||
Net earnings | 2,387 | 1,898 | 613 | 3,456 | 2,332 | 1,517 | 1,931 | 2,260 | ||||||||||||||||||||||||
Preferred stock dividends | 160 | 161 | 160 | 160 | 84 | 88 | 70 | 72 | ||||||||||||||||||||||||
Net earnings applicable to common shareholders | $2,227 | $1,737 | $ 453 | $ 3,296 | $2,248 | $1,429 | $1,861 | $2,188 | ||||||||||||||||||||||||
Earnings per common share | ||||||||||||||||||||||||||||||||
Basic | $ 4.10 | $ 3.19 | $ 0.82 | $ 6.02 | $ 4.80 | $ 3.07 | $ 3.92 | $ 4.53 | ||||||||||||||||||||||||
Diluted | 3.79 | 2.98 | 0.78 | 5.59 | 4.60 | 2.88 | 3.70 | 4.29 | ||||||||||||||||||||||||
Dividends declared per common share | 0.35 | 0.35 | 0.35 | 0.35 | 0.55 | 0.50 | 0.50 | 0.50 | ||||||||||||||||||||||||
| 1. | The timing and magnitude of changes in the firm’s discretionary compensation accruals can have a significant effect on results in a given quarter. |
| 222 | Goldman Sachs |
THE GOLDMAN SACHS GROUP, INC. AND SUBSIDIARIES
Supplemental Financial Information
The table below presents the high and low sales prices per share of the firm’s common stock.
| Year Ended December | Year Ended December | |||||||||||||||||||||||||||||||||||||||||||||||||||||||
| 2011 | 2010 | 2009 | 2014 | 2013 | 2012 | |||||||||||||||||||||||||||||||||||||||||||||||||||
| High | Low | High | Low | High | Low | High | Low | High | Low | High | Low | |||||||||||||||||||||||||||||||||||||||||||||
First quarter | $ | 175.34 | $ | 153.26 | $ | 178.75 | $ | 147.81 | $ | 115.65 | $ | 59.13 | $181.13 | $159.77 | $159.00 | $129.62 | $128.72 | $ 92.42 | ||||||||||||||||||||||||||||||||||||||
Second quarter | 164.40 | 128.30 | 186.41 | 131.02 | 151.17 | 100.46 | 171.08 | 151.65 | 168.20 | 137.29 | 125.54 | 90.43 | ||||||||||||||||||||||||||||||||||||||||||||
Third quarter | 139.25 | 91.40 | 157.25 | 129.50 | 188.00 | 135.23 | 188.58 | 161.53 | 170.00 | 149.28 | 122.60 | 91.15 | ||||||||||||||||||||||||||||||||||||||||||||
Fourth quarter | 118.07 | 84.27 | 171.61 | 144.70 | 193.60 | 160.20 | 198.06 | 171.26 | 177.44 | 152.83 | 129.72 | 113.84 | ||||||||||||||||||||||||||||||||||||||||||||
As of February 17, 2012,6, 2015, there were 13,34010,230 holders of record of the firm’s common stock.
On February 17, 2012,6, 2015, the last reported sales price for the firm’s common stock on the New York Stock Exchange was $115.91$183.43 per share.
Common Stock Price Performance
The following graph comparesand table compare the performance of an investment in the firm’s common stock from November 24, 2006December 31, 2009 (the last trading day before the firm’s 2010 fiscal year) through December 31, 2011,2014, with the S&P 500 Index and the S&P 500 Financials Index. The graph assumesand table assume $100 was invested on November 24, 2006
December 31, 2009 in each of the firm’s common stock, the S&P 500
Index and the S&P 500 Financials Index, and the dividends were reinvested on the date of payment without payment of any commissions. The performance shown in the graph represents past performance and should not be considered an indication of future performance.
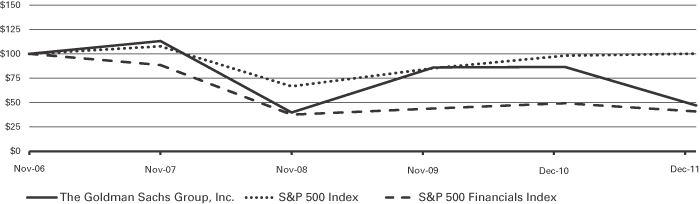
The table below shows the cumulative total returns in dollars of the firm’s common stock, the S&P 500 Index and the S&P 500 Financials Index for Goldman Sachs’ last five fiscal year ends 1, assuming $100 was invested on November 24, 2006 in each of the firm’s common stock,
the S&P 500 Index and the S&P 500 Financials Index, and the dividends were reinvested on the date of payment without payment of any commissions. The performance shown in the table represents past performance and should not be considered an indication of future performance.
| 11/24/06 | 11/30/07 | 11/28/08 | 12/31/09 | 12/31/10 | 12/31/11 | |||||||||||||||||||
The Goldman Sachs Group, Inc. | $ | 100.00 | $ | 113.17 | $ | 39.79 | $ | 86.10 | $ | 86.56 | $ | 47.09 | ||||||||||||
S&P 500 Index | 100.00 | 107.77 | 66.72 | 85.28 | 98.12 | 100.19 | ||||||||||||||||||
S&P 500 Financials Index | 100.00 | 88.54 | 37.56 | 43.92 | 49.27 | 40.88 | ||||||||||||||||||
|
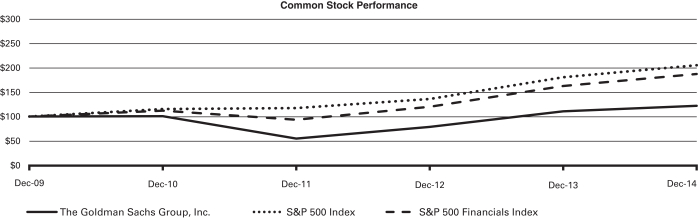
| As of December | ||||||||||||||||||||||||
| 2009 | 2010 | 2011 | 2012 | 2013 | 2014 | |||||||||||||||||||
The Goldman Sachs Group, Inc. | $100.00 | $100.54 | $ 54.69 | $ 78.41 | $110.39 | $122.29 | ||||||||||||||||||
S&P 500 Index | 100.00 | 115.06 | 117.49 | 136.27 | 180.40 | 205.08 | ||||||||||||||||||
S&P 500 Financials Index | 100.00 | 112.13 | 93.00 | 119.73 | 162.34 | 186.98 | ||||||||||||||||||
| Goldman Sachs | 223 |
THE GOLDMAN SACHS GROUP, INC. AND SUBSIDIARIES
Supplemental Financial Information
| As of or for the | Year Ended or as of December | |||||||||||||||||||||||||||||||||||||||||||||||||
| Year Ended | One Month Ended | 2014 | 2013 | 2012 | 2011 | 2010 | ||||||||||||||||||||||||||||||||||||||||||||
Income statement data($ in millions) | ||||||||||||||||||||||||||||||||||||||||||||||||||
Non-interest revenues | $ 30,481 | $ 30,814 | $ 30,283 | $ 23,619 | $ 33,658 | |||||||||||||||||||||||||||||||||||||||||||||
December 2011 | December 2010 | December 2009 | November 2008 | November 2007 | December 2008 1 | |||||||||||||||||||||||||||||||||||||||||||||
Income statement data(in millions) | ||||||||||||||||||||||||||||||||||||||||||||||||||
Total non-interest revenues | $ | 23,619 | $ | 33,658 | $ | 37,766 | $ | 17,946 | $ | 42,000 | $ | (502 | ) | |||||||||||||||||||||||||||||||||||||
Interest income | 13,174 | 12,309 | 13,907 | 35,633 | 45,968 | 1,687 | 9,604 | 10,060 | 11,381 | 13,174 | 12,309 | |||||||||||||||||||||||||||||||||||||||
Interest expense | 7,982 | 6,806 | 6,500 | 31,357 | 41,981 | 1,002 | 5,557 | 6,668 | 7,501 | 7,982 | 6,806 | |||||||||||||||||||||||||||||||||||||||
Net interest income | 5,192 | 5,503 | 7,407 | 4,276 | 3,987 | 685 | 4,047 | 3,392 | 3,880 | 5,192 | 5,503 | |||||||||||||||||||||||||||||||||||||||
Net revenues, including net interest income | 28,811 | 39,161 | 45,173 | 22,222 | 45,987 | 183 | 34,528 | 34,206 | 34,163 | 28,811 | 39,161 | |||||||||||||||||||||||||||||||||||||||
Compensation and benefits | 12,223 | 15,376 | 16,193 | 10,934 | 20,190 | 744 | 12,691 | 12,613 | 12,944 | 12,223 | 15,376 | |||||||||||||||||||||||||||||||||||||||
U.K. bank payroll tax | — | 465 | — | — | — | — | — | — | — | — | 465 | |||||||||||||||||||||||||||||||||||||||
Other operating expenses | 10,419 | 10,428 | 9,151 | 8,952 | 8,193 | 697 | ||||||||||||||||||||||||||||||||||||||||||||
Pre-tax earnings/(loss) | $ | 6,169 | $ | 12,892 | $ | 19,829 | $ | 2,336 | $ | 17,604 | $ | (1,258 | ) | |||||||||||||||||||||||||||||||||||||
Balance sheet data(in millions) | ||||||||||||||||||||||||||||||||||||||||||||||||||
Non-compensation expenses | 9,480 | 9,856 | 10,012 | 10,419 | 10,428 | |||||||||||||||||||||||||||||||||||||||||||||
Pre-tax earnings | $ 12,357 | $ 11,737 | $ 11,207 | $ 6,169 | $ 12,892 | |||||||||||||||||||||||||||||||||||||||||||||
Balance sheet data($ in millions) | ||||||||||||||||||||||||||||||||||||||||||||||||||
Total assets | $ | 923,225 | $ | 911,332 | $ | 848,942 | $ | 884,547 | $ | 1,119,796 | $ | 1,112,225 | $856,240 | $911,507 | $938,555 | $923,225 | $911,332 | |||||||||||||||||||||||||||||||||
Other secured financings (long-term) | 8,179 | 13,848 | 11,203 | 17,458 | 33,300 | 18,413 | 7,249 | 7,524 | 8,965 | 8,179 | 13,848 | |||||||||||||||||||||||||||||||||||||||
Unsecured long-term borrowings | 173,545 | 174,399 | 185,085 | 168,220 | 164,174 | 185,564 | 167,571 | 160,965 | 167,305 | 173,545 | 174,399 | |||||||||||||||||||||||||||||||||||||||
Total liabilities | 852,846 | 833,976 | 778,228 | 820,178 | 1,076,996 | 1,049,171 | 773,443 | 833,040 | 862,839 | 852,846 | 833,976 | |||||||||||||||||||||||||||||||||||||||
Total shareholders’ equity | 70,379 | 77,356 | 70,714 | 64,369 | 42,800 | 63,054 | 82,797 | 78,467 | 75,716 | 70,379 | 77,356 | |||||||||||||||||||||||||||||||||||||||
Common share data(in millions, except per share amounts) | ||||||||||||||||||||||||||||||||||||||||||||||||||
Earnings/(loss) per common share | ||||||||||||||||||||||||||||||||||||||||||||||||||
Earnings per common share | ||||||||||||||||||||||||||||||||||||||||||||||||||
Basic | $ | 4.71 | $ | 14.15 | $ | 23.74 | $ | 4.67 | $ | 26.34 | $ | (2.15 | ) | $ 17.55 | $ 16.34 | $ 14.63 | $ 4.71 | $ 14.15 | ||||||||||||||||||||||||||||||||
Diluted | 4.51 | 13.18 | 22.13 | 4.47 | 24.73 | (2.15 | ) | 17.07 | 15.46 | 14.13 | 4.51 | 13.18 | ||||||||||||||||||||||||||||||||||||||
Dividends declared per common share | 1.40 | 1.40 | 1.05 | 1.40 | 1.40 | 0.47 | 3 | 2.25 | 2.05 | 1.77 | 1.40 | 1.40 | ||||||||||||||||||||||||||||||||||||||
Book value per common share 2 | 130.31 | 128.72 | 117.48 | 98.68 | 90.43 | 95.84 | ||||||||||||||||||||||||||||||||||||||||||||
Book value per common share 1 | 163.01 | 152.48 | 144.67 | 130.31 | 128.72 | |||||||||||||||||||||||||||||||||||||||||||||
Average common shares outstanding | ||||||||||||||||||||||||||||||||||||||||||||||||||
Basic | 524.6 | 542.0 | 512.3 | 437.0 | 433.0 | 485.5 | 458.9 | 471.3 | 496.2 | 524.6 | 542.0 | |||||||||||||||||||||||||||||||||||||||
Diluted | 556.9 | 585.3 | 550.9 | 456.2 | 461.2 | 485.5 | 473.2 | 499.6 | 516.1 | 556.9 | 585.3 | |||||||||||||||||||||||||||||||||||||||
Selected data(unaudited) | ||||||||||||||||||||||||||||||||||||||||||||||||||
Total staff | ||||||||||||||||||||||||||||||||||||||||||||||||||
Americas | 17,200 | 19,900 | 18,900 | 19,700 | 20,100 | 19,200 | 17,400 | 16,600 | 16,400 | 17,200 | 19,900 | |||||||||||||||||||||||||||||||||||||||
Non-Americas | 16,100 | 15,800 | 13,600 | 14,800 | 15,400 | 14,100 | 16,600 | 16,300 | 16,000 | 16,100 | 15,800 | |||||||||||||||||||||||||||||||||||||||
Total staff | 33,300 | 35,700 | 32,500 | 34,500 | 35,500 | 33,300 | 34,000 | 32,900 | 32,400 | 33,300 | 35,700 | |||||||||||||||||||||||||||||||||||||||
Total staff, including consolidated entities held for investment purposes | 34,700 | 38,700 | 36,200 | 39,200 | 40,000 | 38,000 | ||||||||||||||||||||||||||||||||||||||||||||
Assets under management(in billions) | ||||||||||||||||||||||||||||||||||||||||||||||||||
Assets under supervision ($ in billions) | ||||||||||||||||||||||||||||||||||||||||||||||||||
Asset class | ||||||||||||||||||||||||||||||||||||||||||||||||||
Alternative investments | $ | 142 | $ | 148 | $ | 146 | $ | 146 | $ | 151 | $ | 145 | $ 143 | $ 142 | $ 151 | $ 148 | $ 150 | |||||||||||||||||||||||||||||||||
Equity | 126 | 144 | 146 | 112 | 255 | 114 | 236 | 208 | 153 | 147 | 162 | |||||||||||||||||||||||||||||||||||||||
Fixed income | 340 | 340 | 315 | 248 | 256 | 253 | 516 | 446 | 411 | 353 | 346 | |||||||||||||||||||||||||||||||||||||||
Total non-money market assets | 608 | 632 | 607 | 506 | 662 | 512 | ||||||||||||||||||||||||||||||||||||||||||||
Money markets | 220 | 208 | 264 | 273 | 206 | 286 | ||||||||||||||||||||||||||||||||||||||||||||
Total assets under management | $ | 828 | $ | 840 | $ | 871 | $ | 779 | $ | 868 | $ | 798 | ||||||||||||||||||||||||||||||||||||||
Long-term assets under supervision | 895 | 796 | 715 | 648 | 658 | |||||||||||||||||||||||||||||||||||||||||||||
Liquidity products | 283 | 246 | 250 | 247 | 259 | |||||||||||||||||||||||||||||||||||||||||||||
Total assets under supervision | $ 1,178 | $ 1,042 | $ 965 | $ 895 | $ 917 | |||||||||||||||||||||||||||||||||||||||||||||
| 1. |
|
Book value per common share is based on common shares outstanding, including RSUs granted to employees with no future service requirements, of 451.5 million, 467.4 million, 480.5 million, 516.3 million |
|
| 224 | Goldman Sachs |
THE GOLDMAN SACHS GROUP, INC. AND SUBSIDIARIES
Supplemental Financial Information
Distribution of Assets, Liabilities and Shareholders’ Equity |
The table below presents a summary of consolidated average balances and interest rates. Assets, liabilities and interest are
classified as U.S. and non-U.S.-based on the location of the legal entity in which the assets and liabilities are held.
| For the Year Ended December | ||||||||||||||||||||||||||||||||||||||||
| 2011 | 2010 | 2009 | ||||||||||||||||||||||||||||||||||||||
| in millions, except rates | Average balance | Interest | Average rate | Average balance | Interest | Average rate | Average balance | Interest | Average rate | |||||||||||||||||||||||||||||||
Assets | ||||||||||||||||||||||||||||||||||||||||
Deposits with banks | $ | 38,039 | $ | 125 | 0.33 | % | $ | 29,371 | $ | 86 | 0.29 | % | $ | 22,108 | $ | 65 | 0.29 | % | ||||||||||||||||||||||
U.S. | 32,770 | 95 | 0.29 | 24,988 | 67 | 0.27 | 18,134 | 45 | 0.25 | |||||||||||||||||||||||||||||||
Non-U.S. | 5,269 | 30 | 0.57 | 4,383 | 19 | 0.43 | 3,974 | 20 | 0.50 | |||||||||||||||||||||||||||||||
Securities borrowed, securities purchased under agreements to resell, at fair value, and federal funds sold | 351,896 | 666 | 0.19 | 353,719 | 540 | 0.15 | 355,636 | 951 | 0.27 | |||||||||||||||||||||||||||||||
U.S. | 219,240 | (249 | ) | (0.11 | ) | 243,907 | 75 | 0.03 | 255,785 | 14 | 0.01 | |||||||||||||||||||||||||||||
Non-U.S. | 132,656 | 915 | 0.69 | 109,812 | 465 | 0.42 | 99,851 | 937 | 0.94 | |||||||||||||||||||||||||||||||
Financial instruments owned, at fair value 1, 2 | 287,322 | 10,718 | 3.73 | 273,801 | 10,346 | 3.78 | 277,706 | 11,106 | 4.00 | |||||||||||||||||||||||||||||||
U.S. | 183,920 | 7,477 | 4.07 | 189,136 | 7,865 | 4.16 | 198,849 | 8,429 | 4.24 | |||||||||||||||||||||||||||||||
Non-U.S. | 103,402 | 3,241 | 3.13 | 84,665 | 2,481 | 2.93 | 78,857 | 2,677 | 3.39 | |||||||||||||||||||||||||||||||
Other interest-earning assets 3 | 143,270 | 1,665 | 1.16 | 118,364 | 1,337 | 1.13 | 127,067 | 1,785 | 1.40 | |||||||||||||||||||||||||||||||
U.S. | 99,042 | 915 | 0.92 | 82,965 | 689 | 0.83 | 83,000 | 1,052 | 1.27 | |||||||||||||||||||||||||||||||
Non-U.S. | 44,228 | 750 | 1.70 | 35,399 | 648 | 1.83 | 44,067 | 733 | 1.66 | |||||||||||||||||||||||||||||||
Total interest-earning assets | 820,527 | 13,174 | 1.61 | 775,255 | 12,309 | 1.59 | 782,517 | 13,907 | 1.78 | |||||||||||||||||||||||||||||||
Cash and due from banks | 4,987 | 3,709 | 5,066 | |||||||||||||||||||||||||||||||||||||
Other non-interest-earning assets 2 | 118,901 | 113,310 | 124,554 | |||||||||||||||||||||||||||||||||||||
Total Assets | $ | 944,415 | $ | 892,274 | $ | 912,137 | ||||||||||||||||||||||||||||||||||
Liabilities | ||||||||||||||||||||||||||||||||||||||||
Interest-bearing deposits | $ | 40,266 | $ | 280 | 0.70 | $ | 38,011 | $ | 304 | 0.80 | $ | 41,076 | $ | 415 | 1.01 | |||||||||||||||||||||||||
U.S. | 33,234 | 243 | 0.73 | 31,418 | 279 | 0.89 | 35,043 | 371 | 1.06 | |||||||||||||||||||||||||||||||
Non-U.S. | 7,032 | 37 | 0.53 | 6,593 | 25 | 0.38 | 6,033 | 44 | 0.73 | |||||||||||||||||||||||||||||||
Securities loaned and securities sold under agreements to repurchase, at fair value | 171,753 | 905 | 0.53 | 160,280 | 708 | 0.44 | 156,794 | 1,317 | 0.84 | |||||||||||||||||||||||||||||||
U.S. | 110,235 | 280 | 0.25 | 112,839 | 355 | 0.31 | 111,718 | 392 | 0.35 | |||||||||||||||||||||||||||||||
Non-U.S. | 61,518 | 625 | 1.02 | 47,441 | 353 | 0.74 | 45,076 | 925 | 2.05 | |||||||||||||||||||||||||||||||
Financial instruments sold, but not yet purchased 1, 2 | 102,282 | 2,464 | 2.41 | 89,040 | 1,859 | 2.09 | 72,866 | 1,854 | 2.54 | |||||||||||||||||||||||||||||||
U.S. | 52,065 | 984 | 1.89 | 44,713 | 818 | 1.83 | 39,647 | 586 | 1.48 | |||||||||||||||||||||||||||||||
Non-U.S. | 50,217 | 1,480 | 2.95 | 44,327 | 1,041 | 2.35 | 33,219 | 1,268 | 3.82 | |||||||||||||||||||||||||||||||
Commercial paper | 1,881 | 5 | 0.24 | 1,624 | 5 | 0.31 | 1,002 | 5 | 0.50 | �� | ||||||||||||||||||||||||||||||
U.S. | 630 | 2 | 0.31 | 289 | 1 | 0.35 | 284 | 3 | 1.06 | |||||||||||||||||||||||||||||||
Non-U.S. | 1,251 | 3 | 0.20 | 1,335 | 4 | 0.30 | 718 | 2 | 0.28 | |||||||||||||||||||||||||||||||
Other borrowings 4, 5 | 76,616 | 521 | 0.68 | 53,888 | 448 | 0.83 | 58,129 | 618 | 1.06 | |||||||||||||||||||||||||||||||
U.S. | 50,029 | 429 | 0.86 | 33,017 | 393 | 1.19 | 36,164 | 525 | 1.45 | |||||||||||||||||||||||||||||||
Non-U.S. | 26,587 | 92 | 0.35 | 20,871 | 55 | 0.26 | 21,965 | 93 | 0.42 | |||||||||||||||||||||||||||||||
Long-term borrowings 5,6 | 186,148 | 3,439 | 1.85 | 193,031 | 3,155 | 1.63 | 203,280 | 2,585 | 1.27 | |||||||||||||||||||||||||||||||
U.S. | 179,004 | 3,235 | 1.81 | 183,338 | 2,910 | 1.59 | 192,054 | 2,313 | 1.20 | |||||||||||||||||||||||||||||||
Non-U.S. | 7,144 | 204 | 2.86 | 9,693 | 245 | 2.53 | 11,226 | 272 | 2.42 | |||||||||||||||||||||||||||||||
Other interest-bearing liabilities 7 | 203,940 | 368 | 0.18 | 189,008 | 327 | 0.17 | 207,148 | (294 | ) | (0.14 | ) | |||||||||||||||||||||||||||||
U.S. | 149,958 | (535 | ) | (0.36 | ) | 142,752 | (221 | ) | (0.15 | ) | 147,206 | (723 | ) | (0.49 | ) | |||||||||||||||||||||||||
Non-U.S. | 53,982 | 903 | 1.67 | 46,256 | 548 | 1.18 | 59,942 | 429 | 0.72 | |||||||||||||||||||||||||||||||
Total interest-bearing liabilities | 782,886 | 7,982 | 1.02 | 724,882 | 6,806 | 0.94 | 740,295 | 6,500 | 0.88 | |||||||||||||||||||||||||||||||
Non-interest-bearing deposits | 140 | 169 | 115 | |||||||||||||||||||||||||||||||||||||
Other non-interest-bearing liabilities 2 | 88,681 | 92,966 | 106,200 | |||||||||||||||||||||||||||||||||||||
Total liabilities | 871,707 | 818,017 | 846,610 | |||||||||||||||||||||||||||||||||||||
Shareholders’ equity | ||||||||||||||||||||||||||||||||||||||||
Preferred stock | 3,990 | 6,957 | 11,363 | |||||||||||||||||||||||||||||||||||||
Common stock | 68,718 | 67,300 | 54,164 | |||||||||||||||||||||||||||||||||||||
Total shareholders’ equity | 72,708 | 74,257 | 65,527 | |||||||||||||||||||||||||||||||||||||
Total liabilities, preferred stock and shareholders’ equity | $ | 944,415 | $ | 892,274 | $ | 912,137 | ||||||||||||||||||||||||||||||||||
Interest rate spread | 0.59 | % | 0.65 | % | 0.90 | % | ||||||||||||||||||||||||||||||||||
Net interest income and net yield on interest-earning assets | $ | 5,192 | 0.63 | $ | 5,503 | 0.71 | $ | 7,407 | 0.95 | |||||||||||||||||||||||||||||||
U.S. | 3,600 | 0.67 | 4,161 | 0.77 | 6,073 | 1.09 | ||||||||||||||||||||||||||||||||||
Non-U.S. | 1,592 | 0.56 | 1,342 | 0.57 | 1,334 | 0.59 | ||||||||||||||||||||||||||||||||||
Percentage of interest-earning assets and interest-bearing liabilities attributable to non-U.S. operations 8 | ||||||||||||||||||||||||||||||||||||||||
Assets | 34.80 | % | 30.22 | % | 28.98 | % | ||||||||||||||||||||||||||||||||||
Liabilities | 26.53 | 24.35 | 24.07 | |||||||||||||||||||||||||||||||||||||
THE GOLDMAN SACHS GROUP, INC. AND SUBSIDIARIES
Supplemental Financial Information
| Year Ended December | ||||||||||||||||||||||||||||||||||||||||
| 2014 | 2013 | 2012 | ||||||||||||||||||||||||||||||||||||||
| $ in millions | | Average balance | | Interest | | Average rate | | | Average balance | | Interest | | Average rate | | | Average balance | | Interest | | Average rate | | |||||||||||||||||||
Assets | ||||||||||||||||||||||||||||||||||||||||
Deposits with banks | $ 59,135 | $ 164 | 0.28% | $ 61,921 | $ 186 | 0.30% | $ 52,500 | $ 156 | 0.30% | |||||||||||||||||||||||||||||||
U.S. | 53,606 | 144 | 0.27% | 56,848 | 167 | 0.29% | 49,123 | 132 | 0.27% | |||||||||||||||||||||||||||||||
Non-U.S. | 5,529 | 20 | 0.36% | 5,073 | 19 | 0.37% | 3,377 | 24 | 0.71% | |||||||||||||||||||||||||||||||
Securities borrowed, securities purchased under agreements to resell and federal funds sold | 302,321 | (81 | ) | (0.03)% | 327,748 | 43 | 0.01% | 331,828 | (77 | ) | (0.02)% | |||||||||||||||||||||||||||||
U.S. | 193,555 | (514 | ) | (0.27)% | 198,677 | (289 | ) | (0.15)% | 191,166 | (431 | ) | (0.23)% | ||||||||||||||||||||||||||||
Non-U.S. | 108,766 | 433 | 0.40% | 129,071 | 332 | 0.26% | 140,662 | 354 | 0.25% | |||||||||||||||||||||||||||||||
Financial instruments owned, at fair value 1 | 271,810 | 7,452 | 2.74% | 292,965 | 8,159 | 2.78% | 310,982 | 9,817 | 3.16% | |||||||||||||||||||||||||||||||
U.S. | 170,647 | 5,045 | 2.96% | 182,158 | 5,353 | 2.94% | 190,490 | 6,548 | 3.44% | |||||||||||||||||||||||||||||||
Non-U.S. | 101,163 | 2,407 | 2.38% | 110,807 | 2,806 | 2.53% | 120,492 | 3,269 | 2.71% | |||||||||||||||||||||||||||||||
Loans receivable | 22,425 | 708 | 3.16% | 10,296 | 296 | 2.87% | 5,617 | 150 | 2.67% | |||||||||||||||||||||||||||||||
U.S. | 21,459 | 650 | 3.03% | 9,736 | 268 | 2.75% | 5,526 | 148 | 2.68% | |||||||||||||||||||||||||||||||
Non-U.S. | 966 | 58 | 6.00% | 560 | 28 | 5.00% | 91 | 2 | 2.20% | |||||||||||||||||||||||||||||||
Other interest-earning assets 2 | 140,733 | 1,361 | 0.97% | 138,775 | 1,376 | 0.99% | 130,810 | 1,335 | 1.02% | |||||||||||||||||||||||||||||||
U.S. | 85,811 | 813 | 0.95% | 81,759 | 796 | 0.97% | 84,545 | 826 | 0.98% | |||||||||||||||||||||||||||||||
Non-U.S. | 54,922 | 548 | 1.00% | 57,016 | 580 | 1.02% | 46,265 | 509 | 1.10% | |||||||||||||||||||||||||||||||
Total interest-earning assets | 796,424 | 9,604 | 1.21% | 831,705 | 10,060 | 1.21% | 831,737 | 11,381 | 1.37% | |||||||||||||||||||||||||||||||
Cash and due from banks | 5,237 | 6,212 | 7,357 | |||||||||||||||||||||||||||||||||||||
Other non-interest-earning assets 1 | 93,002 | 106,095 | 107,702 | |||||||||||||||||||||||||||||||||||||
Total assets | $894,663 | $944,012 | $946,796 | |||||||||||||||||||||||||||||||||||||
Liabilities | ||||||||||||||||||||||||||||||||||||||||
Interest-bearing deposits | $ 73,286 | $ 333 | 0.45% | $ 69,707 | $ 387 | 0.56% | $ 56,399 | $ 399 | 0.71% | |||||||||||||||||||||||||||||||
U.S. | 62,717 | 286 | 0.46% | 60,824 | 352 | 0.58% | 48,668 | 362 | 0.74% | |||||||||||||||||||||||||||||||
Non-U.S. | 10,569 | 47 | 0.44% | 8,883 | 35 | 0.39% | 7,731 | 37 | 0.48% | |||||||||||||||||||||||||||||||
Securities loaned and securities sold under agreements to repurchase | 131,911 | 431 | 0.33% | 178,686 | 576 | 0.32% | 177,550 | 822 | 0.46% | |||||||||||||||||||||||||||||||
U.S. | 79,517 | 206 | 0.26% | 114,884 | 242 | 0.21% | 121,145 | 380 | 0.31% | |||||||||||||||||||||||||||||||
Non-U.S. | 52,394 | 225 | 0.43% | 63,802 | 334 | 0.52% | 56,405 | 442 | 0.78% | |||||||||||||||||||||||||||||||
Financial instruments sold, but not yet purchased, at fair value 1 | 82,219 | 1,741 | 2.12% | 92,913 | 2,054 | 2.21% | 94,740 | 2,438 | 2.57% | |||||||||||||||||||||||||||||||
U.S. | 39,708 | 828 | 2.09% | 37,923 | 671 | 1.77% | 41,436 | 852 | 2.06% | |||||||||||||||||||||||||||||||
Non-U.S. | 42,511 | 913 | 2.15% | 54,990 | 1,383 | 2.52% | 53,304 | 1,586 | 2.98% | |||||||||||||||||||||||||||||||
Short-term borrowings 3 | 64,594 | 447 | 0.69% | 60,926 | 394 | 0.65% | 70,359 | 581 | 0.83% | |||||||||||||||||||||||||||||||
U.S. | 45,843 | 413 | 0.90% | 40,511 | 365 | 0.90% | 47,614 | 479 | 1.01% | |||||||||||||||||||||||||||||||
Non-U.S. | 18,751 | 34 | 0.18% | 20,415 | 29 | 0.14% | 22,745 | 102 | 0.45% | |||||||||||||||||||||||||||||||
Long-term borrowings 3 | 172,047 | 3,460 | 2.01% | 174,195 | 3,752 | 2.15% | 176,698 | 3,736 | 2.11% | |||||||||||||||||||||||||||||||
U.S. | 164,844 | 3,327 | 2.02% | 168,106 | 3,635 | 2.16% | 170,163 | 3,582 | 2.11% | |||||||||||||||||||||||||||||||
Non-U.S. | 7,203 | 133 | 1.85% | 6,089 | 117 | 1.92% | 6,535 | 154 | 2.36% | |||||||||||||||||||||||||||||||
Other interest-bearing liabilities 4 | 215,911 | (855 | ) | (0.40)% | 203,482 | (495 | ) | (0.24)% | 206,790 | (475 | ) | (0.23)% | ||||||||||||||||||||||||||||
U.S. | 153,600 | (1,222 | ) | (0.80)% | 144,888 | (904 | ) | (0.62)% | 150,986 | (988 | ) | (0.65)% | ||||||||||||||||||||||||||||
Non-U.S. | 62,311 | 367 | 0.59% | 58,594 | 409 | 0.70% | 55,804 | 513 | 0.92% | |||||||||||||||||||||||||||||||
Total interest-bearing liabilities | 739,968 | 5,557 | 0.75% | 779,909 | 6,668 | 0.85% | 782,536 | 7,501 | 0.96% | |||||||||||||||||||||||||||||||
Non-interest-bearing deposits | 799 | 655 | 324 | |||||||||||||||||||||||||||||||||||||
Other non-interest-bearing liabilities 1 | 73,057 | 86,095 | 91,406 | |||||||||||||||||||||||||||||||||||||
Total liabilities | 813,824 | 866,659 | 874,266 | |||||||||||||||||||||||||||||||||||||
Shareholders’ equity | ||||||||||||||||||||||||||||||||||||||||
Preferred stock | 8,585 | 6,892 | 4,392 | |||||||||||||||||||||||||||||||||||||
Common stock | 72,254 | 70,461 | 68,138 | |||||||||||||||||||||||||||||||||||||
Total shareholders’ equity | 80,839 | 77,353 | 72,530 | |||||||||||||||||||||||||||||||||||||
Total liabilities and shareholders’ equity | $894,663 | $944,012 | $946,796 | |||||||||||||||||||||||||||||||||||||
Interest rate spread | 0.46% | 0.36% | 0.41% | |||||||||||||||||||||||||||||||||||||
Net interest income and net yield on interest-earning assets | $ 4,047 | 0.51% | $ 3,392 | 0.41% | $ 3,880 | 0.47% | ||||||||||||||||||||||||||||||||||
U.S. | 2,300 | 0.44% | 1,934 | 0.37% | 2,556 | 0.49% | ||||||||||||||||||||||||||||||||||
Non-U.S. | 1,747 | 0.64% | 1,458 | 0.48% | 1,324 | 0.43% | ||||||||||||||||||||||||||||||||||
Percentage of interest-earning assets and interest-bearing liabilities attributable tonon-U.S. operations |
| |||||||||||||||||||||||||||||||||||||||
Assets | 34.07% | 36.37% | 37.38% | |||||||||||||||||||||||||||||||||||||
Liabilities | 26.18% | 27.28% | 25.88% | |||||||||||||||||||||||||||||||||||||
| 1. |
|
Derivative instruments and commodities are included in other non-interest-earning assets and other non-interest-bearing liabilities. |
Primarily consists of certain receivables from customers and counterparties and cash and securities segregated for regulatory and other |
|
Interest rates include the effects of interest rate swaps accounted for as hedges. |
|
|
|
| Goldman Sachs |
THE GOLDMAN SACHS GROUP, INC. AND SUBSIDIARIES
Supplemental Financial Information
Changes in Net Interest Income, Volume and Rate Analysis
Changes in Net Interest Income, Volume and Rate Analysis |
The table below presents an analysis of the effect on net interest income of volume and rate changes. In this analysis,
changes due to volume/rate variance have been allocated to volume.
| For the Year Ended | Year Ended | |||||||||||||||||||||||||||||||||||||||||||||||||||
| December 2011 versus December 2010 | December 2010 versus December 2009 | December 2014 versus December 2013 | December 2013 versus December 2012 | |||||||||||||||||||||||||||||||||||||||||||||||||
| Increase (decrease) due to change in: | Increase (decrease) due to change in: | Increase (decrease) due to change in: | Increase (decrease) due to change in: | |||||||||||||||||||||||||||||||||||||||||||||||||
| in millions | Volume | Rate | Net change | Volume | Rate | Net change | ||||||||||||||||||||||||||||||||||||||||||||||
| $ in millions | Volume | Rate | | Net Change | | Volume | Rate | | Net Change | | ||||||||||||||||||||||||||||||||||||||||||
Interest-earning assets | ||||||||||||||||||||||||||||||||||||||||||||||||||||
Deposits with banks | $ 28 | $ 11 | $ 39 | $ 20 | $ 1 | $ 21 | $ (7 | ) | $ (15 | ) | $ (22 | ) | $ 29 | $ 1 | $ 30 | |||||||||||||||||||||||||||||||||||||
U.S. | 23 | 5 | 28 | 18 | 4 | 22 | (9 | ) | (14 | ) | (23 | ) | 23 | 12 | 35 | |||||||||||||||||||||||||||||||||||||
Non-U.S. | 5 | 6 | 11 | 2 | (3 | ) | (1 | ) | 2 | (1 | ) | 1 | 6 | (11 | ) | (5 | ) | |||||||||||||||||||||||||||||||||||
Securities borrowed, securities purchased under agreements to resell, at fair value and federal funds sold | 186 | (60 | ) | 126 | 38 | (449 | ) | (411 | ) | |||||||||||||||||||||||||||||||||||||||||||
Securities borrowed, securities purchased under agreements to resell and federal funds sold | (67 | ) | (57 | ) | (124 | ) | (41 | ) | 161 | 120 | ||||||||||||||||||||||||||||||||||||||||||
U.S. | 28 | (352 | ) | (324 | ) | (4 | ) | 65 | 61 | 14 | (239 | ) | (225 | ) | (11 | ) | 153 | 142 | ||||||||||||||||||||||||||||||||||
Non-U.S. | 158 | 292 | 450 | 42 | (514 | ) | (472 | ) | (81 | ) | 182 | 101 | (30 | ) | 8 | (22 | ) | |||||||||||||||||||||||||||||||||||
Financial instruments owned, at fair value | 375 | (3 | ) | 372 | (234 | ) | (526 | ) | (760 | ) | (569 | ) | (138 | ) | (707 | ) | (490 | ) | (1,168 | ) | (1,658 | ) | ||||||||||||||||||||||||||||||
U.S. | (212 | ) | (176 | ) | (388 | ) | (404 | ) | (160 | ) | (564 | ) | (340 | ) | 32 | (308 | ) | (245 | ) | (950 | ) | (1,195 | ) | |||||||||||||||||||||||||||||
Non-U.S. | 587 | 173 | 760 | 170 | (366 | ) | (196 | ) | (229 | ) | (170 | ) | (399 | ) | (245 | ) | (218 | ) | (463 | ) | ||||||||||||||||||||||||||||||||
Loans receivable | 379 | 33 | 412 | 139 | 7 | 146 | ||||||||||||||||||||||||||||||||||||||||||||||
U.S. | 355 | 27 | 382 | 116 | 4 | 120 | ||||||||||||||||||||||||||||||||||||||||||||||
Non-U.S. | 24 | 6 | 30 | 23 | 3 | 26 | ||||||||||||||||||||||||||||||||||||||||||||||
Other interest-earning assets | 299 | 29 | 328 | (159 | ) | (289 | ) | (448 | ) | 17 | (32 | ) | (15 | ) | 82 | (41 | ) | 41 | ||||||||||||||||||||||||||||||||||
U.S. | 149 | 77 | 226 | — | (363 | ) | (363 | ) | 38 | (21 | ) | 17 | (27 | ) | (3 | ) | (30 | ) | ||||||||||||||||||||||||||||||||||
Non-U.S. | 150 | (48 | ) | 102 | (159 | ) | 74 | (85 | ) | (21 | ) | (11 | ) | (32 | ) | 109 | (38 | ) | 71 | |||||||||||||||||||||||||||||||||
Change in interest income | 888 | (23 | ) | 865 | (335 | ) | (1,263 | ) | (1,598 | ) | (247 | ) | (209 | ) | (456 | ) | (281 | ) | (1,040 | ) | (1,321 | ) | ||||||||||||||||||||||||||||||
Interest-bearing liabilities | ||||||||||||||||||||||||||||||||||||||||||||||||||||
Interest-bearing deposits | 15 | (39 | ) | (24 | ) | (30 | ) | (81 | ) | (111 | ) | 16 | (70 | ) | (54 | ) | 75 | (87 | ) | (12 | ) | |||||||||||||||||||||||||||||||
U.S. | 13 | (49 | ) | (36 | ) | (32 | ) | (60 | ) | (92 | ) | 9 | (75 | ) | (66 | ) | 70 | (80 | ) | (10 | ) | |||||||||||||||||||||||||||||||
Non-U.S. | 2 | 10 | 12 | 2 | (21 | ) | (19 | ) | 7 | 5 | 12 | 5 | (7 | ) | (2 | ) | ||||||||||||||||||||||||||||||||||||
Securities loaned and securities sold under agreements to repurchase, at fair value | 136 | 61 | 197 | 22 | (631 | ) | (609 | ) | ||||||||||||||||||||||||||||||||||||||||||||
Securities loaned and securities sold under agreements to repurchase | (141 | ) | (4 | ) | (145 | ) | 26 | (272 | ) | (246 | ) | |||||||||||||||||||||||||||||||||||||||||
U.S. | (7 | ) | (68 | ) | (75 | ) | 4 | (41 | ) | (37 | ) | (92 | ) | 56 | (36 | ) | (13 | ) | (125 | ) | (138 | ) | ||||||||||||||||||||||||||||||
Non-U.S. | 143 | 129 | 272 | 18 | (590 | ) | (572 | ) | (49 | ) | (60 | ) | (109 | ) | 39 | (147 | ) | (108 | ) | |||||||||||||||||||||||||||||||||
Financial instruments sold, but not yet purchased, at fair value | 313 | 292 | 605 | 354 | (349 | ) | 5 | (231 | ) | (82 | ) | (313 | ) | (20 | ) | (364 | ) | (384 | ) | |||||||||||||||||||||||||||||||||
U.S. | 139 | 27 | 166 | 93 | 139 | 232 | 37 | 120 | 157 | (62 | ) | (119 | ) | (181 | ) | |||||||||||||||||||||||||||||||||||||
Non-U.S. | 174 | 265 | 439 | 261 | (488 | ) | (227 | ) | (268 | ) | (202 | ) | (470 | ) | 42 | (245 | ) | (203 | ) | |||||||||||||||||||||||||||||||||
Commercial paper | 1 | (1 | ) | — | 2 | (2 | ) | — | ||||||||||||||||||||||||||||||||||||||||||||
Short-term borrowings | 45 | 8 | 53 | (67 | ) | (120 | ) | (187 | ) | |||||||||||||||||||||||||||||||||||||||||||
U.S. | 1 | — | 1 | — | (2 | ) | (2 | ) | 48 | — | 48 | (64 | ) | (50 | ) | (114 | ) | |||||||||||||||||||||||||||||||||||
Non-U.S. | — | (1 | ) | (1 | ) | 2 | — | 2 | (3 | ) | 8 | 5 | (3 | ) | (70 | ) | (73 | ) | ||||||||||||||||||||||||||||||||||
Other borrowings | 166 | (93 | ) | 73 | (40 | ) | (130 | ) | (170 | ) | ||||||||||||||||||||||||||||||||||||||||||
Long-term borrowings | (45 | ) | (247 | ) | (292 | ) | (53 | ) | 69 | 16 | ||||||||||||||||||||||||||||||||||||||||||
U.S. | 146 | (110 | ) | 36 | (37 | ) | (95 | ) | (132 | ) | (66 | ) | (242 | ) | (308 | ) | (44 | ) | 97 | 53 | ||||||||||||||||||||||||||||||||
Non-U.S. | 20 | 17 | 37 | (3 | ) | (35 | ) | (38 | ) | 21 | (5 | ) | 16 | (9 | ) | (28 | ) | (37 | ) | |||||||||||||||||||||||||||||||||
Long-term debt | (151 | ) | 435 | 284 | (177 | ) | 747 | 570 | ||||||||||||||||||||||||||||||||||||||||||||
Other interest-bearing liabilities | (47 | ) | (313 | ) | (360 | ) | 57 | (77 | ) | (20 | ) | |||||||||||||||||||||||||||||||||||||||||
U.S. | (78 | ) | 403 | 325 | (138 | ) | 735 | 597 | (69 | ) | (249 | ) | (318 | ) | 38 | 46 | 84 | |||||||||||||||||||||||||||||||||||
Non-U.S. | (73 | ) | 32 | (41 | ) | (39 | ) | 12 | (27 | ) | ||||||||||||||||||||||||||||||||||||||||||
Other interest-bearing liabilities | 103 | (62 | ) | 41 | (155 | ) | 776 | 621 | ||||||||||||||||||||||||||||||||||||||||||||
U.S. | (26 | ) | (288 | ) | (314 | ) | 7 | 495 | 502 | |||||||||||||||||||||||||||||||||||||||||||
Non-U.S. | 129 | 226 | 355 | (162 | ) | 281 | 119 | 22 | (64 | ) | (42 | ) | 19 | (123 | ) | (104 | ) | |||||||||||||||||||||||||||||||||||
Change in interest expense | 583 | 593 | 1,176 | (24 | ) | 330 | 306 | (403 | ) | (708 | ) | (1,111 | ) | 18 | (851 | ) | (833 | ) | ||||||||||||||||||||||||||||||||||
Change in net interest income | $305 | $(616 | ) | $(311 | ) | $(311 | ) | $(1,593 | ) | $(1,904 | ) | $ 156 | $ 499 | $ 655 | $(299 | ) | $ (189 | ) | $ (488 | ) | ||||||||||||||||||||||||||||||||
| Goldman Sachs |
THE GOLDMAN SACHS GROUP, INC. AND SUBSIDIARIES
Supplemental Financial Information
Available-for-sale Securities Portfolio
The table below presents the fair value of available-for-sale securities.
| in millions | Amortized Cost | Gross Unrealized Gains | Gross Unrealized Losses | Fair Value | ||||||||||||
Available-for-sale securities, December 2011 | ||||||||||||||||
Commercial paper, certificates of deposit, time deposits and other money market instruments | $ | 406 | $ | — | $ | — | $ | 406 | ||||||||
U.S. government and federal agency obligations | 582 | 80 | — | 662 | ||||||||||||
Non-U.S. government obligations | 19 | — | — | 19 | ||||||||||||
Mortgage and other asset-backed loans and securities | 1,505 | 30 | (119 | ) | 1,416 | |||||||||||
Corporate debt securities | 1,696 | 128 | (11 | ) | 1,813 | |||||||||||
State and municipal obligations | 418 | 63 | — | 481 | ||||||||||||
Other debt obligations | 67 | — | (3 | ) | 64 | |||||||||||
Total available-for-sale securities | $ | 4,693 | $ | 301 | $ | (133 | ) | $ | 4,861 | |||||||
Available-for-sale securities, December 2010 | ||||||||||||||||
Commercial paper, certificates of deposit, time deposits and other money market instruments | $ | 176 | $ | — | $ | — | $ | 176 | ||||||||
U.S. government and federal agency obligations | 638 | 18 | (19 | ) | 637 | |||||||||||
Non-U.S. government obligations | 2 | — | — | 2 | ||||||||||||
Mortgage and other asset-backed loans and securities | 593 | 82 | (5 | ) | 670 | |||||||||||
Corporate debt securities | 1,533 | 162 | (7 | ) | 1,688 | |||||||||||
State and municipal obligations | 356 | 8 | (5 | ) | 359 | |||||||||||
Other debt obligations | 136 | 7 | (2 | ) | 141 | |||||||||||
Total available-for-sale securities | $ | 3,434 | $ | 277 | $ | (38 | ) | $ | 3,673 | |||||||
THE GOLDMAN SACHS GROUP, INC. AND SUBSIDIARIES
Supplemental Financial Information
The table below presents the fair value, amortized cost and weighted average yields of available-for-sale securities by
contractual maturity. Yields are calculated on a weighted average basis.
| As of December 2011 | ||||||||||||||||||||||||||||||||||||||||||||
Due in One Year or Less | Due After One Year Through Five Years | Due After Five Years Through Ten Years | Due After Ten Years | Total | ||||||||||||||||||||||||||||||||||||||||
| $ in millions | Amount | Yield | Amount | Yield | Amount | Yield | Amount | Yield | Amount | Yield | ||||||||||||||||||||||||||||||||||
Fair value of available-for-sale securities | ||||||||||||||||||||||||||||||||||||||||||||
Commercial paper, certificates of deposit, time deposits and other money market instruments | $406 | — | % | $ — | — | % | $ — | — | % | $ | — | — | % | $ | 406 | — | % | |||||||||||||||||||||||||||
U.S. government and federal agency obligations | 72 | — | 132 | 3 | 69 | 2 | 389 | 4 | 662 | 3 | ||||||||||||||||||||||||||||||||||
Non-U.S. government obligations | — | — | 9 | 3 | 9 | 6 | 1 | 4 | 19 | 4 | ||||||||||||||||||||||||||||||||||
Mortgage and other asset-backed loans and securities | — | — | 120 | 7 | 19 | 5 | 1,277 | 10 | 1,416 | 10 | ||||||||||||||||||||||||||||||||||
Corporate debt securities | 33 | 5 | 425 | 4 | 848 | 5 | 507 | 6 | 1,813 | 5 | ||||||||||||||||||||||||||||||||||
State and municipal obligations | 1 | 5 | 12 | 5 | — | — | 468 | 6 | 481 | 6 | ||||||||||||||||||||||||||||||||||
Other debt obligations | — | — | 10 | 4 | — | — | 54 | 3 | 64 | 3 | ||||||||||||||||||||||||||||||||||
Total available-for-sale securities | $512 | $708 | $945 | $ | 2,696 | $ | 4,861 | |||||||||||||||||||||||||||||||||||||
Amortized cost of available-for-sale securities | $512 | $696 | $899 | $ | 2,586 | $ | 4,693 | |||||||||||||||||||||||||||||||||||||
| As of December 2010 | ||||||||||||||||||||||||||||||||||||||||||||
Due in One Year or Less | Due After One Year Through Five Years | Due After Five Years Through Ten Years | Due After Ten Years | Total | ||||||||||||||||||||||||||||||||||||||||
| $ in millions | Amount | Yield | Amount | Yield | Amount | Yield | Amount | Yield | Amount | Yield | ||||||||||||||||||||||||||||||||||
Fair value of available-for-sale securities | ||||||||||||||||||||||||||||||||||||||||||||
Commercial paper, certificates of deposit, time deposits and other money market instruments | $176 | — | % | $ — | — | % | $ — | — | % | $ | — | — | % | $ | 176 | — | % | |||||||||||||||||||||||||||
U.S. government and federal agency obligations | 37 | 4 | 99 | 3 | 17 | 4 | 484 | 4 | 637 | 4 | ||||||||||||||||||||||||||||||||||
Non-U.S. government obligations | — | — | 2 | 2 | — | — | — | — | 2 | 2 | ||||||||||||||||||||||||||||||||||
Mortgage and other asset-backed loans and securities | — | — | — | — | — | — | 670 | 11 | 670 | 11 | ||||||||||||||||||||||||||||||||||
Corporate debt securities | 34 | 6 | 126 | 6 | 717 | 6 | 811 | 7 | 1,688 | 6 | ||||||||||||||||||||||||||||||||||
State and municipal obligations | — | — | 10 | 5 | 11 | 5 | 338 | 6 | 359 | 6 | ||||||||||||||||||||||||||||||||||
Other debt obligations | — | — | — | — | 24 | 1 | 117 | 5 | 141 | 4 | ||||||||||||||||||||||||||||||||||
Total available-for-sale securities | $247 | $237 | $769 | $ | 2,420 | $ | 3,673 | |||||||||||||||||||||||||||||||||||||
Amortized cost of available-for-sale | $246 | $220 | $708 | $ | 2,260 | $ | 3,434 | |||||||||||||||||||||||||||||||||||||
THE GOLDMAN SACHS GROUP, INC. AND SUBSIDIARIES
Supplemental Financial Information
Deposits
The tabletables below presentspresent a summary of the firm’s interest-bearing deposits.
| Average Balances | Average Interest Rates | |||||||||||||||||||||||||||||||||||||
| Year Ended December | Year Ended December | Average Balances for the Year Ended December | ||||||||||||||||||||||||||||||||||||
| $ in millions | 2011 | 2010 | 2009 | 2011 | 2010 | 2009 | 2014 | 2013 | 2012 | |||||||||||||||||||||||||||||
U.S.: | ||||||||||||||||||||||||||||||||||||||
Savings 1 | $ | 25,916 | $ | 23,260 | $ | 23,024 | 0.42 | % | 0.44 | % | 0.62 | % | $41,785 | $39,411 | $32,235 | |||||||||||||||||||||||
Time | 7,318 | 8,158 | 12,019 | 1.84 | 2.16 | 1.89 | 20,932 | 21,413 | 16,433 | |||||||||||||||||||||||||||||
Total U.S. deposits | 33,234 | 31,418 | 35,043 | 0.73 | 0.89 | 1.06 | 62,717 | 60,824 | 48,668 | |||||||||||||||||||||||||||||
Non-U.S.: | ||||||||||||||||||||||||||||||||||||||
Demand | 5,378 | 5,559 | 5,402 | 0.46 | 0.34 | 0.61 | 4,571 | 4,613 | 5,318 | |||||||||||||||||||||||||||||
Time | 1,654 | 1,034 | 631 | 0.73 | 0.58 | 1.65 | 5,998 | 4,270 | 2,413 | |||||||||||||||||||||||||||||
Total Non-U.S. deposits | 7,032 | 6,593 | 6,033 | 0.53 | 0.38 | 0.73 | 10,569 | 8,883 | 7,731 | |||||||||||||||||||||||||||||
Total deposits | $ | 40,266 | $ | 38,011 | $ | 41,076 | 0.70 | 0.80 | 1.01 | $73,286 | $69,707 | $56,399 | ||||||||||||||||||||||||||
| 1. | Amounts are available for withdrawal upon short notice, generally within seven days. |
Ratios
The table below presents selected financial ratios.
| Year Ended December | ||||||||||||
| 2011 | 2010 | 2009 | ||||||||||
Net earnings to average assets | 0.5 | % | 0.9 | % | 1.5 | % | ||||||
Return on average common shareholders’ equity 1 | 3.7 | 11.5 | 22.5 | |||||||||
Return on average total shareholders’ equity 2 | 6.1 | 11.3 | 20.4 | |||||||||
Total average equity to average assets | 7.7 | 8.3 | 7.2 | |||||||||
Dividend payout ratio 3 | 31.0 | 10.6 | 4.7 | |||||||||
|
|
|
Average Interest Rates for the Year Ended December | ||||||||||||
| 2014 | 2013 | 2012 | ||||||||||
U.S.: | ||||||||||||
Savings | 0.23% | 0.30% | 0.42% | |||||||||
Time | 0.91% | 1.09% | 1.38% | |||||||||
Total U.S. deposits | 0.46% | 0.58% | 0.74% | |||||||||
Non-U.S.: | ||||||||||||
Demand | 0.18% | 0.22% | 0.30% | |||||||||
Time | 0.65% | 0.59% | 0.87% | |||||||||
Total Non-U.S. deposits | 0.44% | 0.39% | 0.48% | |||||||||
Total deposits | 0.45% | 0.56% | 0.71% | |||||||||
Short-term and Other Borrowed Funds
The tabletables below presentspresent a summary of the firm’s securities loaned and securities sold under agreements to repurchase, and short-term borrowings. These borrowings generally
mature within one year of the financial statement date and include borrowings that are redeemable at the option of the holder within one year of the financial statement date.
| Securities Loaned and Securities Sold Under Agreements to Repurchase | Commercial Paper | Other Funds Borrowed 1, 2 | ||||||||||||||||||||||||||||||||||||||||||||||||||
| As of December | As of December | As of December | Securities Loaned and Securities Sold Under Agreements to Repurchase as of December | |||||||||||||||||||||||||||||||||||||||||||||||||
| $ in millions | 2011 | 2010 | 2009 | 2011 | 2010 | 2009 | 2011 | 2010 | 2009 | 2014 | 2013 | 2012 | ||||||||||||||||||||||||||||||||||||||||
Amounts outstanding at year-end | $ | 171,684 | $ | 173,557 | $ | 143,567 | $ | 1,491 | $ | 1,306 | $ | 1,660 | $ | 76,732 | $ | 71,065 | $ | 48,787 | $ 93,785 | $183,527 | $185,572 | |||||||||||||||||||||||||||||||
Average outstanding during the year | 171,753 | 160,280 | 156,794 | 1,881 | 1,624 | 1,002 | 76,616 | 53,888 | 58,129 | 131,911 | 178,686 | 177,550 | ||||||||||||||||||||||||||||||||||||||||
Maximum month-end outstanding | 190,453 | 173,557 | 169,083 | 2,853 | 1,712 | 3,060 | 84,546 | 71,065 | 77,712 | 178,049 | 196,393 | 198,456 | ||||||||||||||||||||||||||||||||||||||||
Weighted average interest rate | ||||||||||||||||||||||||||||||||||||||||||||||||||||
During the year | 0.53 | % | 0.44 | % | 0.84 | % | 0.24 | % | 0.31 | % | 0.50 | % | 0.68 | % | 0.83 | % | 1.06 | % | 0.33% | 0.32% | 0.46% | |||||||||||||||||||||||||||||||
At year-end | 0.39 | 0.44 | 0.26 | 0.34 | 0.20 | 0.37 | 0.93 | 0.63 | 0.76 | 0.31% | 0.28% | 0.44% | ||||||||||||||||||||||||||||||||||||||||
Short-Term Borrowings as of December | ||||||||||||||||||||||||||||||||||||||||||||||||||||
| $ in millions | 2014 | 2013 | 2012 | |||||||||||||||||||||||||||||||||||||||||||||||||
Amounts outstanding at year-end 1 | $ 60,100 | $ 61,982 | $ 67,349 | |||||||||||||||||||||||||||||||||||||||||||||||||
Average outstanding during the year | 64,594 | 60,926 | 70,359 | |||||||||||||||||||||||||||||||||||||||||||||||||
Maximum month-end outstanding | 68,572 | 66,978 | 75,280 | |||||||||||||||||||||||||||||||||||||||||||||||||
Weighted average interest rate 2 | ||||||||||||||||||||||||||||||||||||||||||||||||||||
During the year | 0.69% | 0.65% | 0.83% | |||||||||||||||||||||||||||||||||||||||||||||||||
At year-end | 0.68% | 0.89% | 0.79% | |||||||||||||||||||||||||||||||||||||||||||||||||
| 1. | Includes short-term secured financings of |
| 2. |
|
| Goldman Sachs |
THE GOLDMAN SACHS GROUP, INC. AND SUBSIDIARIES
Supplemental Financial Information
Cross-border Outstandings
Cross-border outstandings are based on the Federal Financial Institutions Examination Council’s (FFIEC) regulatory guidelines for reporting cross-border information and represent the amounts that the firm may not be able to obtain from a foreign country due to country-specific events, including unfavorable economic and political conditions, economic and social instability, and changes in government policies.
Credit exposure represents the potential for loss due to the default or deterioration in credit quality of a counterparty or an issuer of securities or other instruments the firm holds and is measured based on the potential loss in an event of non-payment by a counterparty. Credit exposure is reduced through the effect of risk mitigants, such as netting agreements with counterparties that permit the firm to offset receivables and payables with such counterparties or obtaining collateral from counterparties. The tables below do not include all the effects of such risk mitigants and do not represent the firm’s credit exposure.
ClaimsThe tables below present cross-border outstandings and commitments for each country in which cross-border outstandings exceed 0.75% of consolidated assets in accordance with the tables belowFFIEC guidelines and include cash, receivables, securities purchased under agreements to resell, securities borrowed and cash financial instruments, but exclude derivative instruments and commitments.instruments. Securities purchased under agreements to resell and securities borrowed are presented gross, without reduction for related securities collateral held, based on the domicile of the counterparty.held. Margin loans (included in receivables) are presented based on the amount of collateral advanced by the counterparty.
The tables Substantially all commitments in the table below present cross-border outstandings for each country in which cross-border outstandings exceed 0.75%consist of consolidated assets in accordance with the FFIEC guidelines.commitments to extend credit and forward starting resale and securities borrowing agreements.
$ in millions Country | As of December 2014 | |||||||||||||||||||||||||||||||||||
| Banks | Governments | Other | Total | Commitments | ||||||||||||||||||||||||||||||||
Cayman Islands | $ 2 | $ — | $35,829 | $35,831 | $ 2,658 | |||||||||||||||||||||||||||||||
| As of December 2011 | ||||||||||||||||||||||||||||||||||||
| in millions | Banks | Governments | Other | Total | ||||||||||||||||||||||||||||||||
Country | ||||||||||||||||||||||||||||||||||||
France | $ | 33,916 | 1 | $ | 2,859 | $ | 3,776 | $ | 40,551 | 4,730 | 4,932 | 18,261 | 1 | 27,923 | 12,214 | |||||||||||||||||||||
Japan | 13,862 | 373 | 10,763 | 24,998 | 11,413 | |||||||||||||||||||||||||||||||
Germany | 5,362 | 4,479 | 10,629 | 20,470 | 4,631 | |||||||||||||||||||||||||||||||
United Kingdom | 1,870 | 282 | 8,821 | 10,973 | 11,755 | |||||||||||||||||||||||||||||||
Italy | 3,331 | 4,173 | 2,215 | 9,719 | 783 | |||||||||||||||||||||||||||||||
China | 2,474 | 1,952 | 4,984 | 9,410 | 6 | |||||||||||||||||||||||||||||||
$ in millions Country | As of December 2013 | |||||||||||||||||||||||||||||||||||
| Banks | Governments | Other | Total | Commitments | ||||||||||||||||||||||||||||||||
Cayman Islands | — | — | 33,742 | 33,742 | 3 | $ 12 | $ 1 | $35,969 | $35,982 | $ 1,671 | ||||||||||||||||||||||||||
Japan | 18,745 | 31 | 6,457 | 25,233 | 3 | 23,026 | 123 | 11,981 | 35,130 | 5,086 | ||||||||||||||||||||||||||
France | 12,427 | 2,871 | 16,567 | 1 | 31,865 | 12,060 | ||||||||||||||||||||||||||||||
Germany | 5,458 | 16,089 | 3,162 | 24,709 | 5,148 | 4,336 | 7,793 | 17,277 | 4,716 | |||||||||||||||||||||||||||
Spain | 7,002 | 2,281 | 2,491 | 11,774 | 1,069 | |||||||||||||||||||||||||||||||
United Kingdom | 2,111 | 3,349 | 5,243 | 10,703 | 3 | 2,688 | 217 | 7,321 | 10,226 | 19,014 | ||||||||||||||||||||||||||
Italy | 6,143 | 3,054 | 841 | 10,038 | 4 | |||||||||||||||||||||||||||||||
Ireland | 1,148 | 63 | 8,801 | 2 | 10,012 | |||||||||||||||||||||||||||||||
China | 6,722 | 38 | 2,908 | 9,668 | ||||||||||||||||||||||||||||||||
Switzerland | 3,836 | 40 | 5,112 | 8,988 | ||||||||||||||||||||||||||||||||
Canada | 676 | 1,019 | 6,841 | 8,536 | ||||||||||||||||||||||||||||||||
Australia | 1,597 | 470 | 5,209 | 7,276 | ||||||||||||||||||||||||||||||||
Netherlands | 1,785 | 540 | 5,786 | 8,111 | 1,962 | |||||||||||||||||||||||||||||||
$ in millions Country | As of December 2012 | |||||||||||||||||||||||||||||||||||
| Banks | Governments | Other | Total | Commitments | ||||||||||||||||||||||||||||||||
Cayman Islands | $ — | $ — | $39,283 | $39,283 | $ 1,088 | |||||||||||||||||||||||||||||||
| As of December 2010 | ||||||||||||||||||||||||||||||||||||
| in millions | Banks | Governments | Other | Total | ||||||||||||||||||||||||||||||||
Country | ||||||||||||||||||||||||||||||||||||
France | $ | 29,250 | 1 | $ | 7,373 | $ | 4,860 | $ | 41,483 | 6,991 | 2,370 | 23,161 | 1 | 32,522 | 18,846 | |||||||||||||||||||||
Cayman Islands | 7 | — | 35,850 | 35,857 | 3 | |||||||||||||||||||||||||||||||
Japan | 21,881 | 49 | 8,002 | 29,932 | 3 | 16,679 | 19 | 8,908 | 25,606 | 9,635 | ||||||||||||||||||||||||||
Germany | 3,767 | 16,572 | 2,782 | 23,121 | 4,012 | 10,976 | 7,912 | 22,900 | 4,887 | |||||||||||||||||||||||||||
Spain | 3,790 | 4,237 | 1,816 | 9,843 | 473 | |||||||||||||||||||||||||||||||
Ireland | 438 | 68 | 7,057 | 7,563 | 2 | 176 | ||||||||||||||||||||||||||||||
United Kingdom | 1,422 | 237 | 5,874 | 7,533 | 20,327 | |||||||||||||||||||||||||||||||
China | 10,849 | 701 | 2,931 | 14,481 | 2,564 | 1,265 | 3,564 | 7,393 | — | |||||||||||||||||||||||||||
United Kingdom | 2,829 | 2,401 | 6,800 | 12,030 | 3 | |||||||||||||||||||||||||||||||
Brazil | 1,383 | 3,704 | 2,280 | 7,367 | 865 | |||||||||||||||||||||||||||||||
Switzerland | 2,473 | 151 | 7,616 | 10,240 | 3,706 | 230 | 3,133 | 7,069 | 1,305 | |||||||||||||||||||||||||||
Canada | 260 | 366 | 6,741 | 7,367 | ||||||||||||||||||||||||||||||||
| 1. | Primarily comprised of secured lending transactions with a clearing |
| 2. | Primarily comprised of interests in and receivables from funds domiciled in Ireland, but whose underlying investments are primarily located outside of Ireland, and secured lending |
|
|
| Goldman Sachs |
THE GOLDMAN SACHS GROUP, INC. AND SUBSIDIARIES
Item 9. Changes in and Disagreements with Accountants on Accounting and Financial Disclosure
There were no changes in or disagreements with accountants on accounting and financial disclosure during the last two years.
Item 9A. Controls and Procedures
As of the end of the period covered by this report, an evaluation was carried out by Goldman Sachs’ management, with the participation of our Chief Executive Officer and Chief Financial Officer, of the effectiveness of our disclosure controls and procedures (as defined in Rule 13a-15(e) under the Exchange Act). Based upon that evaluation, our Chief Executive Officer and Chief Financial Officer concluded that these disclosure controls and procedures were effective as of the end of the period covered by this report. In addition, no change in our internal control over financial reporting (as defined in Rule 13a-15(f) under the Exchange Act) occurred during the fourth quarter of our year ended December 31, 20112014 that has materially affected, or is reasonably likely to materially affect, our internal control over financial reporting.
Management’s Report on Internal Control over Financial Reporting and the Report of Independent Registered Public Accounting Firm are set forth in Part II, Item 8 of thisthe 2014 Form 10-K.
Not applicable.Effective February 20, 2015, the Board approved an amendment to our Amended and Restated By-Laws solely to change three references to the “Corporate Governance, Nominating and Public Responsibilities Committee” to the “Corporate Governance and Nominating Committee,” reflecting a change in the name of that Board committee.
Item 10. Directors, Executive Officers and Corporate Governance
Information relating to our executive officers is included on pages 35 to 36page 44 of thisthe 2014 Form 10-K. Information relating to our directors, including our audit committee and audit committee financial experts and the procedures by which shareholders can recommend director nominees, and our executive officers will be in our definitive Proxy Statement for our 20122015 Annual Meeting of Shareholders, which will be filed within 120 days of the end of 2011 (20122014 (2015 Proxy Statement) and is incorporated herein by reference. Information relating to our Code of Business Conduct and Ethics, which applies to our senior financial officers, is included under “Available Information” in Part I, Item 1 of thisthe 2014 Form 10-K.
Item 11. Executive Compensation
Information relating to our executive officer and director compensation and the compensation committee of our board of directorsthe Board will be in the 20122015 Proxy Statement and is incorporated herein by reference.
| Goldman Sachs |
THE GOLDMAN SACHS GROUP, INC. AND SUBSIDIARIES
Item 12. Security Ownership of Certain
Beneficial Owners and Management and
Related Stockholder Matters
Information relating to security ownership of certain beneficial owners of our common stock and information relating to the security ownership of our management will be in the 20122015 Proxy Statement and is incorporated herein by reference.
The following table provides information as of December 31, 2011,2014, the last day of 2011,2014, regarding securities to be issued on exercise of outstanding stock options or pursuant to outstanding restricted stock units and performance-based awards, and securities remaining available for issuance under our equity compensation plans that were in effect during 2011.2014.
Plan Category | Number of Securities to be Issued | Average Exercise Price of Outstanding Options, Warrants and Rights | Number of Securities Remaining Available For Issuance Under Equity Plans (Excluding Securities Reflected in the Second Column) | |||||||||||||||
Equity compensation plans approved by security holders | The Goldman Sachs Amended and Restated Stock Incentive Plan (2013) 1 | 47,970,886 | 2 | 3 | ||||||||||||||
Equity compensation plans not approved by security holders | None | — | — | — | ||||||||||||||
Total | 2 | |||||||||||||||||
| 1. | The Goldman Sachs Amended and Restated Stock Incentive Plan |
| 2. | Includes: (i) |
| 3. | This |
| 4. | Represents shares remaining to be issued under the 2013 SIP, excluding shares reflected in the second column. The total number of shares of common stock that may be delivered pursuant to awards granted under the 2013 SIP |
Item 13. Certain Relationships and Related Transactions, and Director Independence
Information regarding certain relationships and related transactions and director independence will be in the 20122015 Proxy Statement and is incorporated herein by reference.
Item 14. Principal AccountantAccounting Fees and Services
Information regarding principal accountantaccounting fees and services will be in the 20122015 Proxy Statement and is incorporated herein by reference.
| Goldman Sachs |
THE GOLDMAN SACHS GROUP, INC. AND SUBSIDIARIES
Item 15. Exhibits, and Financial Statement Schedules
(a) Documents filed as part of this Report:
1. Consolidated Financial Statements
The consolidated financial statements required to be filed in thisthe 2014 Form 10-K are included in Part II, Item 8 hereof.
2. Exhibits
| 2.1 | Plan of Incorporation (incorporated by reference to the corresponding exhibit to the Registrant’s | |
3.1 | Restated Certificate of Incorporation of The Goldman Sachs Group, Inc., amended as of May | |
3.2 | Amended and Restated By-Laws of The Goldman Sachs Group, Inc., amended as of | |
4.1 | Indenture, dated as of May 19, 1999, between The Goldman Sachs Group, Inc. and The Bank of New York, as trustee (incorporated by reference to Exhibit 6 to the Registrant’s | |
4.2 | Subordinated Debt Indenture, dated as of February 20, 2004, between The Goldman Sachs Group, Inc. and The Bank of New York, as trustee (incorporated by reference to Exhibit 4.2 to the Registrant’s Annual Report on Form 10-K for the fiscal year ended November 28, 2003). | |
4.3 | Warrant Indenture, dated as of February 14, 2006, between The Goldman Sachs Group, Inc. and The Bank of New York, as trustee (incorporated by reference to Exhibit 4.34 to the Registrant’s Post-Effective Amendment No. 3 to Form S-3, filed on March 1, 2006). | |
4.4 | Senior Debt Indenture, dated as of December 4, 2007, among GS Finance Corp., as issuer, The Goldman Sachs Group, Inc., as guarantor, and The Bank of New York, as trustee (incorporated by reference to Exhibit 4.69 to the Registrant’s Post-Effective Amendment No. 10 to Form S-3, filed on December 4, 2007). | |
Certain instruments defining the rights of holders of long-term debt securities of the Registrant and its subsidiaries are omitted pursuant to Item 601(b)(4)(iii) of RegulationS-K. The Registrant hereby undertakes to furnish to the SEC, upon request, copies of any such instruments. | ||
4.5 | Senior Debt Indenture, dated as of July 16, 2008, between The Goldman Sachs Group, Inc. and The Bank of New York Mellon, as trustee (incorporated by reference to Exhibit 4.82 to the Registrant’s Post-Effective Amendment No. 11 to Form S-3 (No. 333-130074), filed July 17, 2008). | |
4.6 | Senior Debt Indenture, dated as of October 10, 2008, among GS Finance Corp., as issuer, The Goldman Sachs Group, Inc., as guarantor, and The Bank of New York Mellon, as trustee (incorporated by reference to | |
| 4.7 | First Supplemental Indenture, dated as of February 20, 2015, among GS Finance Corp., as issuer, The Goldman Sachs Group, Inc., as guarantor, and The Bank of New York Mellon, as trustee, with respect to the Senior Debt Indenture, dated as of October 10, 2008. | |
| 10.1 | The Goldman Sachs Amended and Restated Stock Incentive Plan (2013) (incorporated by reference to | |
10.2 | The Goldman Sachs Amended and Restated Restricted Partner Compensation Plan (incorporated by reference to Exhibit 10.1 to the Registrant’s Quarterly Report on Form 10-Q for the period ended February 24, 2006). † | |
| Goldman Sachs 2014 Form 10-K | 231 |
THE GOLDMAN SACHS GROUP, INC. AND SUBSIDIARIES
10.3 | Form of Employment Agreement for Participating Managing Directors (applicable to executive officers) (incorporated by reference to Exhibit 10.19 to the Registrant’s | |
10.4 | Form of Agreement Relating to Noncompetition and Other Covenants (incorporated by reference to | |
10.5 | Tax Indemnification Agreement, dated as of May 7, 1999, by and among The Goldman Sachs Group, Inc. and various parties (incorporated by reference to Exhibit 10.25 to the Registrant’s | |
10.6 | Amended and Restated Shareholders’ Agreement, effective as of January | |
10.7 | Instrument of Indemnification (incorporated by reference to Exhibit 10.27 to the Registrant’s | |
10.8 | Form of Indemnification Agreement (incorporated by reference to Exhibit 10.28 to the Registrant’s Annual Report on Form 10-K for the fiscal year ended November 26, 1999). | |
10.9 | Form of Indemnification Agreement (incorporated by reference to Exhibit 10.44 to the Registrant’s Annual Report on Form 10-K for the fiscal year ended November 26, 1999). | |
10.10 | Form of Indemnification Agreement, dated as of July 5, 2000 (incorporated by reference to Exhibit 10.1 to the Registrant’s Quarterly Report on Form 10-Q for the period ended August 25, 2000). | |
10.11 | Amendment No. 1, dated as of September 5, 2000, to the Tax Indemnification Agreement, dated as of | |
10.12 |
| |
| Letter, dated February 6, 2001, from The Goldman Sachs Group, Inc. to Mr. James A. Johnson (incorporated by reference to Exhibit 10.65 to the Registrant’s Annual Report on Form 10-K for the fiscal year ended November 24, 2000). † | |
| Letter, dated December 18, 2002, from The Goldman Sachs Group, Inc. to Mr. William W. George (incorporated by reference to Exhibit 10.39 to the Registrant’s Annual Report on Form 10-K for the fiscal year ended November 29, 2002). † | |
| Letter, dated June 20, 2003, from The Goldman Sachs Group, Inc. to Mr. Claes Dahlbäck (incorporated by reference to Exhibit 10.1 to the Registrant’s Quarterly Report on Form 10-Q for the period ended | |
|
| |
|
| |
|
| |
| Form of Amendment, dated November 27, 2004, to Agreement Relating to Noncompetition and Other Covenants, dated May 7, 1999 (incorporated by reference to Exhibit 10.32 to the Registrant’s Annual Report on Form 10-K for the fiscal year ended November 26, 2004). † | |
|
| |
|
| |
| The Goldman Sachs Group, Inc. Non-Qualified Deferred Compensation Plan for U.S. Participating Managing Directors (terminated as of December 15, 2008) (incorporated by reference to Exhibit 10.36 to the Registrant’s Annual Report on Form 10-K for the fiscal year ended November 30, 2007). † | |
| Form of Year-End Option Award Agreement (incorporated by reference to Exhibit 10.36 to the Registrant’s Annual Report on Form 10-K for the fiscal year ended November 28, 2008). † | |
| Form of Year-End RSU Award Agreement (French alternative award) (incorporated by reference to | |
| Amendments to 2005 and 2006 Year-End RSU and Option Award Agreements (incorporated by reference to Exhibit 10.44 to the Registrant’s Annual Report on Form 10-K for the fiscal year ended November 30, 2007). † | |
| Form of Non-Employee Director Option Award Agreement (incorporated by reference to Exhibit 10.34 to the Registrant’s Annual Report on Form 10-K for the fiscal year ended December 31, 2009). † | |
| Form of Non-Employee Director RSU Award Agreement. † | |
|
|
THE GOLDMAN SACHS GROUP, INC. AND SUBSIDIARIES
| Ground Lease, dated August 23, 2005, between Battery Park City Authority d/b/a/ Hugh L. Carey Battery Park City Authority, as Landlord, and Goldman Sachs Headquarters LLC, as Tenant (incorporated by reference to Exhibit 10.1 to the Registrant’s Current Report on Form 8-K, filed August 26, 2005). | |
| General Guarantee Agreement, dated January 30, 2006, made by The Goldman Sachs Group, Inc. relating to certain obligations of Goldman, Sachs & Co. (incorporated by reference to Exhibit 10.45 to the Registrant’s Annual Report on Form 10-K for the fiscal year ended November 25, 2005). | |
| Goldman, Sachs & Co. Executive Life Insurance Policy and Certificate with Metropolitan Life Insurance Company for Participating Managing Directors (incorporated by reference to Exhibit 10.1 to the Registrant’s Quarterly Report on Form 10-Q for the period ended August 25, 2006). † | |
| Form of Goldman, Sachs & Co. Executive Life Insurance Policy with Pacific Life & Annuity Company for Participating Managing Directors, including policy specifications and form of restriction on Policy Owner’s Rights (incorporated by reference to Exhibit 10.2 to the Registrant’s Quarterly Report on Form 10-Q for the period ended August 25, 2006). † | |
| Form of Second Amendment, dated November 25, 2006, to Agreement Relating to Noncompetition and Other Covenants, dated May 7, 1999, as amended effective November 27, 2004 (incorporated by reference to Exhibit 10.51 to the Registrant’s Annual Report on Form 10-K for the fiscal year ended | |
| Description of PMD Retiree Medical Program (incorporated by reference to Exhibit 10.2 to the Registrant’s Quarterly Report on Form 10-Q for the period ended February 29, 2008). † | |
| Letter, dated June 28, 2008, from The Goldman Sachs Group, Inc. to Mr. Lakshmi N. Mittal (incorporated by reference to Exhibit 99.1 to the Registrant’s Current Report on Form 8-K, filed June 30, 2008). † | |
|
| |
| General Guarantee Agreement, dated December 1, 2008, made by The Goldman Sachs Group, Inc. relating to certain obligations of Goldman Sachs Bank USA (incorporated by reference to Exhibit 4.80 to the Registrant’s Post-Effective Amendment No. 2 toForm S-3, filed March 19, 2009). | |
|
| |
| Guarantee Agreement, dated November 28, 2008 and amended effective as of January 1, 2010, between The Goldman Sachs Group, Inc. and Goldman Sachs Bank USA (incorporated by reference to Exhibit 10.51 to the Registrant’s Annual Report on Form 10-K for the fiscal year ended December 31, 2009). | |
| Collateral Agreement, dated November 28, 2008, between The Goldman Sachs Group, Inc., Goldman Sachs Bank USA and each other party that becomes a pledgor pursuant thereto (incorporated by reference to Exhibit 10.61 to the Registrant’s Annual Report on Form 10-K for the fiscal year ended November 28, 2008). | |
| Form of One-Time RSU Award Agreement. † | |
| Amendments to Certain Equity Award Agreements (incorporated by reference to Exhibit 10.68 to the Registrant’s Annual Report on Form 10-K for the fiscal year ended November 28, 2008). † | |
| Amendments to Certain Non-Employee Director Equity Award Agreements (incorporated by reference to Exhibit 10.69 to the Registrant’s Annual Report on Form 10-K for the fiscal year ended November 28, 2008). † | |
| Form of Signature Card for Equity Awards. † | |
|
| |
|
| |
| Form of Year-End RSU Award Agreement (not fully vested). † | |
| Form of Year-End RSU Award Agreement (fully vested). † | |
| Form of Year-End RSU Award Agreement (Base and/or Supplemental). † | |
| Form of Year-End Short-Term RSU Award Agreement. † | |
| 10.40 |
| |
| 10.41 | Form of Year-End Restricted Stock Award Agreement (Base and/or Supplemental). † | |
|
| |
| Form of Year-End Short-Term Restricted Stock Award Agreement. † | |
| 10.43 |
| |
| Goldman Sachs 2014 Form 10-K | 233 |
THE GOLDMAN SACHS GROUP, INC. AND SUBSIDIARIES
| 10.44 | General Guarantee Agreement, dated March 2, 2010, made by The Goldman Sachs Group, Inc. relating to the obligations of Goldman Sachs Execution & Clearing, L.P. (incorporated by reference to Exhibit 10.1 to the Registrant’s Quarterly Report on Form 10-Q for the period ended March 31, 2010). | |
| Form of Deed of Gift (incorporated by reference to the Registrant’s Quarterly Report on Form 10-Q for the period ended June 30, 2010). † | |
| The Goldman Sachs Long-Term Performance Incentive Plan, dated December 17, 2010 (incorporated by reference to the Registrant’s Current Report on Form 8-K, filed December 23, 2010). † | |
| Form of Performance-Based Restricted Stock Unit Award Agreement (incorporated by reference to the Registrant’s Current Report on Form 8-K, filed December 23, 2010). † | |
| Form of Performance-Based Option Award Agreement (incorporated by reference to the Registrant’s Current Report on Form 8-K, filed December 23, 2010). † | |
| Form of Performance-Based Cash Compensation Award Agreement (incorporated by reference to the Registrant’s Current Report on Form 8-K, filed December 23, 2010). † | |
| Amended and Restated General Guarantee Agreement, dated November 21, 2011, made by | |
| Form of Aircraft Time Sharing | |
| 10.52 | Description of Compensation Arrangements with Executive Officer (incorporated by reference to the Registrant’s Quarterly Report on Form 10-Q for the period ended June 30, 2012). † | |
| 10.53 | The Goldman Sachs Group, Inc. Clawback Policy, effective as of January 1, 2015. | |
| 12.1 | Statement re: Computation of Ratios of Earnings to Fixed Charges and Ratios of Earnings to Combined Fixed Charges and Preferred Stock Dividends. | |
21.1 | List of significant subsidiaries of The Goldman Sachs Group, Inc. | |
23.1 | Consent of Independent Registered Public Accounting Firm. | |
31.1 | Rule 13a-14(a) Certifications. | |
32.1 | Section 1350 Certifications. * | |
99.1 | Report of Independent Registered Public Accounting Firm on Selected Financial Data. | |
Debt and trust securities registered under Section 12(b) of the Exchange Act. | ||
101 | Interactive data files pursuant to Rule 405 of RegulationS-T: (i) the Consolidated Statements of Earnings for the years ended December 31, | |
†This exhibit is a management contract or a compensatory plan or arrangement. | |||
* | This information is furnished and not filed for purposes of Sections 11 and 12 of the Securities Act of 1933 and Section 18 of the Securities Exchange Act of 1934. | ||
| 234 | Goldman Sachs |
Pursuant to the requirements of Section 13 or 15(d) of the Securities Exchange Act of 1934, the Registrant has duly caused this report to be signed on its behalf by the undersigned, thereunto duly authorized.
THE GOLDMAN SACHS GROUP, INC. | ||||
| By: | /s/ | Harvey M. Schwartz | ||
|
| |||
|
| |||
| Chief Financial Officer | |||
Date: February 28, 201220, 2015
Pursuant to the requirements of the Securities Exchange Act of 1934, this report has been signed below by the following persons on behalf of the Registrant and in the capacities and on the dates indicated.
Signature | Capacity | Date | ||
/s/ Lloyd C. Blankfein Lloyd C. Blankfein | Director, Chairman and Chief Executive Officer (Principal Executive Officer) | February | ||
| ||||
/s/ M. Michele Burns M. Michele Burns | Director | February | ||
/s/ Gary D. Cohn Gary D. Cohn | Director | February | ||
/s/ Claes Dahlbäck Claes Dahlbäck | Director | February | ||
/s/
| Director | February | ||
/s/ William W. George William W. George | Director | February | ||
/s/ James A. Johnson James A. Johnson | Director | February | ||
| ||||
/s/ Lakshmi N. Mittal Lakshmi N. Mittal | Director | February | ||
| ||||
| II-1 | Goldman Sachs |
/s/ Adebayo O. Ogunlesi Adebayo O. Ogunlesi | Director | February 20, 2015 | ||
/s/ Peter Oppenheimer Peter Oppenheimer | Director | February 20, 2015 | ||
/s/ Debora L. Spar Debora L. Spar | Director | February | ||
/s/ Mark E. Tucker Mark E. Tucker | Director | February 20, 2015 | ||
/s/ David A. Viniar David A. Viniar |
| February | ||
/s/ Mark O. Winkelman Mark O. Winkelman | Director | February 20, 2015 | ||
/s/ Harvey M. Schwartz Harvey M. Schwartz | Chief Financial Officer (Principal Financial Officer) | February 20, 2015 | ||
/s/ Sarah E. Smith Sarah E. Smith | Principal Accounting Officer | February | ||
| Goldman Sachs | II-2 |