UNITED STATESUse these links to rapidly review the document
Table of Contents
PART IV
UNITED STATES
SECURITIES AND EXCHANGE COMMISSION
WASHINGTON, D.C. 20549
FORM 10-K
(Mark One)
| (Mark One) | ||
ý | ANNUAL REPORT PURSUANT TO SECTION 13 OR 15(d) OF THE SECURITIES EXCHANGE ACT OF 1934 |
For the Fiscal Year Ended December 31, 2011
OR
For the Fiscal Year Ended December 29, 2012 | ||
OR | ||
o | TRANSITION REPORT PURSUANT TO SECTION 13 OR 15(d) OF THE SECURITIES EXCHANGE ACT OF 1934 | |
For the transition period from to | ||
For the transition period from to
Commission File Number 0-19848
FOSSIL, INC.
(Exact name of registrant as specified in its charter)
| Delaware | |||
| 75-2018505
| ||
| |||
| Richardson, Texas (Address of principal executive offices) | 75080 (Zip Code) | ||
Registrant’sRegistrant's telephone number, including area code:(972) 234-2525
Securities registered pursuant to Section 12(b) of the Act:
| Title of each class | Name of each exchange on which registered | ||||
|---|---|---|---|---|---|
| Common Stock, $0.01 par value | NASDAQ Global Select Market |
Securities registered pursuant to Section 12(g) of the Act:None
Indicate by check mark if the registrant is a well-known seasoned issuer, as defined in Rule 405 of the Securities Act. Yes xý No ¨o
Indicate by check mark if the registrant is not required to file reports pursuant to Section 13 or Section 15(d) of the Act. Yes ¨o No xý
Indicate by check mark whether the registrant (1) has filed all reports required to be filed by Section 13 or 15(d) of the Securities Exchange Act of 1934 during the preceding 12 months (or for such shorter period that the registrant was required to file such reports), and (2) has been subject to such filing requirements for the past 90 days. Yes xý No ¨o
Indicate by check mark whether the registrant has submitted electronically and posted on its corporate Web site, if any, every Interactive Data File required to be submitted and posted pursuant to Rule 405 of Regulation S-T (§232.405 of this chapter) during the preceding 12 months (or for such shorter period that the registrant was required to submit and post such files). Yes xý No ¨o
Indicate by check mark if disclosure of delinquent filers pursuant to Item 405 of Regulation S-K (§229.405 of this chapter) is not contained herein, and will not be contained, to the best of registrant’sregistrant's knowledge, in definitive proxy or information statements incorporated by reference in Part III of this Form 10-K or any amendment to this Form 10-K. ¨o
Indicate by check mark whether the registrant is a large accelerated filer, an accelerated filer, a non-accelerated filer, or a smaller reporting company. See the definitions of “large"large accelerated filer,” “accelerated filer”" "accelerated filer" and “smaller"smaller reporting company”company" in Rule 12b-2 of the Exchange Act.
| Large accelerated filer | ||||||||
| Accelerated filer | Non-accelerated filer o (Do not check if a smaller reporting company) | Smaller reporting company | ||||||
Indicate by check mark whether the registrant is a shell company (as defined in Rule 12b-2 of the Exchange Act). Yes ¨o No xý
The aggregate market value of Common Stock, $0.01 par value per share (the “Common Stock”"Common Stock"), held by non-affiliates of the registrant, based on the last sale price of the Common Stock as reported by the NASDAQ Global Select Market on July 1, 2011,June 30, 2012, was $5,592,991,813.$2,955,599,524. For purposes of this computation, all officers, directors and 10% beneficial owners of the registrant are deemed to be affiliates. Such determination should not be deemed an admission that such officers, directors or 10% beneficial owners are, in fact, affiliates of the registrant.
As of February 23, 2012, 61,788,74421, 2013, 59,343,769 shares of Common Stock were outstanding.
DOCUMENTS INCORPORATED BY REFERENCE
Portions of the registrant’sregistrant's proxy statement to be furnished to shareholders in connection with its 20122013 Annual Meeting of Stockholders are incorporated by reference in Part III, Items 10-14 of this Annual Report on Form 10-K.
FOSSIL, INC.
FORM 10-K
FOR THE FISCAL YEAR ENDED DECEMBER 31, 201129, 2012
INDEX
In this Form 10-K, references to “we,” “our,”"we," "our," and the “Company”"Company" refer to Fossil, Inc. and its subsidiaries on a consolidated basis.
General
We are a global design, marketing and distribution company that specializes in consumer fashion accessories. Our principal offerings include an extensive line of men’smen's and women’swomen's fashion watches and jewelry, handbags, small leather goods, belts, sunglasses, shoes, soft accessories and clothing. In the watch and jewelry product categories, we have a diverse portfolio of globally recognized owned and licensed brand names under which our products are marketed. Our products are distributed globally through various distribution channels, including wholesale in countries where we have a physical presence, direct to the consumer through our retail stores and commercial websites and through third-party distributors in countries where we do not maintain a physical presence. Our products are offered at varying price points to meet the needs of our customers, whether they are value-conscious or luxury oriented. Based on our extensive range of accessory products, brands, distribution channels and price points, we are able to target style-conscious consumers across a wide age spectrum on a global basis.
Domestically, we sell our products through a diversified distribution network that includes department stores, specialty retail locations, specialty watch and jewelry stores, Company-owned retail and factory outlet stores, mass market stores owned and affiliate internet sites and through our FOSSIL® catalogs.FOSSIL® catalogs and website. Our broad-based wholesale customer base includes, retailers such asamong others, Dillard's, JCPenney, Kohl's, Macy's, Neiman Marcus, Nordstrom, Saks Fifth Avenue, Macy’s, Dillard’s, JCPenney, Kohl’s, Sears, Wal-MartTarget and Target.Wal-Mart. In the United States (“("U.S.”"), our network of Company-owned stores included 123131 retail stores located in premier retail sites and 7495 outlet stores located in major outlet malls as of December 31, 2011.29, 2012. In addition, we offer an extensive collection of our FOSSIL brand products through our catalogs and atwww.fossil.com, as well as proprietary and licensed watch and jewelry brands through other managed and affiliate websites.
Internationally, our products are sold to department stores, specialty retail locations,stores, and specialty watch and jewelry stores in over 120approximately 130 countries worldwide through 2223 Company-owned foreign sales subsidiaries and through a network of over 60 independent distributors. Our products are distributed in Africa, Asia, Australia, Europe, Central and South America, Canada, the Caribbean, Mexico, and the Middle East. Our products are offered on airlines and cruise ships and in international Company-owned retail stores. Internationally, our network of Company-owned stores which included 156 accessory185 retail stores 11 multi-brand stores, 4 clothing stores and 3062 outlet stores in select international markets as of December 31, 2011.29, 2012. Our products are also sold through licensed and franchised FOSSIL retail stores, retail concessions operated by us and kiosks in certain international markets, as well as our websites in certain countries.
We are a Delaware corporation formed in 1991 and are the successor to a Texas corporation formed in 1984. In 1993, we completed an initial public offering of 13,972,500 shares of our common stock. Domestically, we conduct a majority of our operations through Fossil Partners, L.P., a Texas limited partnership formed in 1994 of which we are the sole general partner. We also conduct operations domestically and in certain international markets through various owned subsidiaries. Our principal executive offices are located at 901 S. Central Expressway, Richardson, Texas 75080, and our telephone number at that address is (972) 234-2525. Our European headquarters is located in Basel, Switzerland, and our Far EastAsia headquarters is located in Hong Kong. Our common stock is traded on the NASDAQ Global Select Market under the trading symbol FOSL. We make available free of charge through our website atwww.fossil.com our annual reports on Form 10-K, quarterly reports on Form 10-Q, current reports on Form 8-K and amendments to these reports.reports filed or furnished pursuant to Section 13(a) or 15(a) of the Securities Exchange Act of 1934 as soon as reasonably practicable after such materials are electronically filed with, or furnished to, the U.S. Securities and Exchange
Commission ("SEC"). You may also obtain any materials we file with, or furnish to, the U.S. Securities and Exchange Commission (the “SEC”)SEC on its website atwww.sec.gov.
3
Business segments
Our operations and financial reporting are primarily divided into four distinct segments: (i) the North America wholesale segment; (ii) the Europe wholesale segment; (iii) the Asia Pacific wholesale segment; and (iv) the Direct to consumer segment, which includes our Company-owned retail stores, our catalogs and e-commerce activities. Within the wholesale segments of our business, we generally sell to retailers in those countries in which we have a physical presence as well as to third-party distributors in countries where we do not have a physical presence. Except to the extent that differences between operating segments are material to an understanding of our business taken as a whole, the description of our business in this report is presented on a consolidated basis. Corporate expenses include certain administrative, legal, accounting, technology support costs, equity compensation costs, payroll costs attributable to executive management and amounts related to intercompany eliminations that are not allocated to the various segments. For financial information about our operating segments and geographic areas, refer to Management’sManagement's Discussion and Analysis of Financial Condition and Results of Operations set forth in Part II, Item 7 and Note 17-Major18-Major Customer, Segment and Geographic Information to our Consolidated Financial Statements set forth in Part II, Item 8 of this Annual Report on Form 10-K.
Business strengths
We believe that we have several business strengths which allow us to differentiate ourselves and achieve our key operating and financial goals. These business strengths include:
Brand strength.We believe a brand’sbrand's image, individuality, consistency and connection with its customers is paramount in building and sustaining the brand. We believe that our FOSSIL brand name is recognized on a global basis as a vintage-inspired aspirational lifestyle brand with a focus on fashion accessories. The FOSSIL brand has developed from its origin as a watch brand to encompass other accessory categories, including handbags, belts, small leather goods, jewelry, soft accessories, sunglasses clothing and shoes.clothing. We believe the FOSSIL brand is one of our most valuable assets, serves as a foundational piece of our business and remains very marketable across product lines, geographic areas and distribution channels. Since our inception in 1984, we have continued to develop, acquire or license other nationally or internationally recognized brand names, such as ADIDAS®ADIDAS®, ARMANI EXCHANGE®EXCHANGE®, BURBERRY®BURBERRY®, DIESEL®DIESEL®, DKNY®DKNY®, EMPORIO ARMANI®ARMANI®, KARL LAGERFELD®, MARC® BY MARC JACOBS™, MICHELE®MICHAEL KORS®, MICHAEL KORS®MICHELE®, RELIC®RELIC®, SKAGEN®, and ZODIAC®ZODIAC®, in order to appeal to a wide range of consumers. Our industry is highly competitive and subject to changing preferences in style, taste and price points. The success of our business model depends upon offering a wide range of branded products that appeal to the various tastes and fashion preferences of our customers. We must also maintain the relevance of these products by continually anticipating customer needs and desires as they relate to both the brands and categories of productproducts we offer. We have teams of designers and productbrand specialists assigned to each of our brands. The objectives of these designers and brand specialists are to immerse themselves in their assigned brand and product area, identify their customers’customers' preferences, interpret global fashion trends and develop style-right offerings to generate volume purchasing. By owning the vast majority of our global distribution, we are also able to create and execute consistent pricing strategies and brand image presentations that protect and enhance our proprietary brands and those of our licensors.
Licensing strength.Since 1997, we have attracted highly recognized and respected brand names to license within our watch and jewelry portfolios. We believe we attract such quality brands due to our ability to provide them with access to our global design, production, distribution and marketing infrastructure. As a result of our vertical integration, we, unlike many of our competitors, can offer an
integrated solution to launch or increase an accessory category presence on a worldwide basis in a consistent, timely and focused manner. All of our major licensing relationships are exclusive to us and the licensors, which substantially minimizes risks to the licensor associated with dealing with multiple licensees in different geographic regions. Additionally, in order to develop a broader relationship and maintain brand consistency across the accessory categories, we have broadened our infrastructure, allowing us to expand our licensing activities to products beyond the watch category, including our DIESEL, DKNY, EMPORIO ARMANI and MICHAEL KORS jewelry product lines.
4
Breadth of brands and retail price points.Through the multiple brands we distribute, we have developed a broad spectrum of retail price points. Within our watch collections, core retail price points vary from approximately $7 in the mass market channel up to retail price points of $2,395$3,995 in the luxury distribution channel, although the majority of our collections focus on price points ranging from $85 to $600. The breadth of our brands allows us to anchor a brand to a given price point range and distribution channel, thereby maintaining a consistent brand image while focusing on the quality/value relationship important to the customer and not diluting the brand through overlapping distribution channels. The breadth of price points allows us to cater to various age and income groups while continuing to participate in sales consistently, regardless of a shift in income or the price/value preferences of our customers.
International penetration.Since our initial public offering in 1993, we have continued to extend our reach beyond the U.S. by forming and acquiring internationally-based subsidiaries, licensing and developing internationally recognized brands and investing in the growth of our business within many major countries of the world. For fiscal years 2012, 2011, and 2010, 56.4%, 54.5% and 2009, 54.5%, 52.9% and 59.8% of our wholesale net sales and 51.1%52.6%, 49.3%51.1% and 53.9%49.3% of our consolidated net sales were generated outside of the U.S., respectively.
Breadth of distribution channels.Our products are sold through multiple distribution channels including department stores, specialty retail stores, specialty watch and jewelry stores, mass market stores, cruise ships, airlines, Company-owned retail stores, licensed and franchised FOSSIL stores, retail concessions operated by us, business to business, e-commerce sites and our catalogs. As we expand our presence in existing distribution channels and add new distribution channels, as well as develop new product lines and expand our geographic reach, our revenues have become less dependent on any one product, brand, distribution channel or geographic region. Our Company-owned retail stores, websites and catalog venues allow us to enhance the related brand image by offering a targeted message to the customer, showcasing the array of product availability, influencing the merchandising and presentation of the products and testing new product introductions.
In-house creative team.Since our inception, we have developed a talented pool of creative individuals who design our retail stores, websites, products, packaging, graphics, presentation displays and marketing materials, allowing us to deliver a unique and cohesive style and image for each of our brands. We believe our emphasis on constant innovation and distinctive design has made us a leader in the branded accessory category. The breadth of talent and vertical integration of our design teams allows us to minimize the need for, and associated expense of, outside creative talent and advertising agencies.
International sourcing.The vast majority of our products are sourced internationally. Most watch product sourcing from Asia is coordinated through our Hong Kong subsidiary, Fossil (East) Limited (“("Fossil East”East"), which we acquired in 1993.. During 2011,fiscal 2012, more than 60%61% of our non-Swiss made watch production was assembled through wholly or majority owned factories. This vertical integration of our business allows for better flow of communication, consistent quality, product design protection and improved supply chain speed, while still allowing us to utilize non-owned production facilities for their unique capabilities and to cover production needs over internal capacities. Establishing our watch assembly facilities near the component manufacturers also allows us to operate a more efficient supply chain. We
have also been successful in leveraging our jewelry production needs through our watch assembly factory infrastructure. Our other accessory clothing and shoesclothing products are purchased from third-party manufacturers with whom we have long-standing relationships and, in the case of our leathers business, we typically represent a meaningful portion of their businesses.
Operating cash flow.Our business model has historically generated strong operating cash flows, including $251.3$451.6 million in fiscal year 2011,2012, and $726.4$912.0 million and $967.4 million$1.3 billion over the past three fiscal years and five fiscal years, respectively. This strong cash flow has allowed us to operate at low debt levels while funding capital expenditures, Company-owned retail store growth, product line expansions and common stock repurchase programs.
Information systems.Operating and managing a global company requires sophisticated and reliable management information systems to assist in the planning, order processing, production and distribution
5
functions and accounting of each relevant business. In 2003, we implementedWe operate an SAP Enterprise Resource Planning system (“ERP”("ERP") in the U.S. and have rolled this system out to our larger international subsidiaries. For many of our subsidiaries, which do not currently demand the complexity of the SAP solution, we have implemented Microsoft’sMicrosoft's Dynamics Navision Enterprise Resource Planning System (“Navision”("Navision"). Additionally, in 2009 we upgraded ourOur e-commerce platform tois an IBM mainframe systemWebsphere Commerce platform and we have continued to invest in our e-commerce infrastructure, which will allow us to leverage the success of our U.S.-based web business across many of the countries where we currently distribute products. We have also implemented SAP’sSAP's IS Retail Merchandise Planning and anplatform combined with the SAP point-of-sale system to improve our ability to manage our growing Company-owned retail stores globally. In addition, we implemented a Customer Relationship Management (“CRM”) system that allows us to significantly increase our ability to communicate with our customers and increase the efficiency of our marketing activities. We believe these systems allow us to gain better insight into our businesses in real-time on a global basis, assist us in meeting the needs of our customers in a professional and timely manner and provide a scalable infrastructure to accommodate further growth. Our company’s products are principally distributed from three primary warehouses, one located in Texas near our headquarters, one located in southern Germany and the other located in Hong Kong. Our facilities in Texas and Germany utilize sophisticated automated material handling equipment and software designed to improve accuracy, speed and quality in our warehousing operations.
Growth strategy
In order to expand our global market share in a profitable manner, we continually establish and implement business initiatives that we believe will build brand equity, increase revenues and improve profitability. Our key operating and financial goals are as follows:
Extend product categories of existing brands.We frequently introduce new accessory product categories within our existing proprietary and licensed brands to further leverage our branded portfolio. For example, we introduced jewelry collections under the DIESEL, DKNY, EMPORIO ARMANI, FOSSIL and MICHAEL KORS brands after first establishing a market for the brands in watches. Additionally, we have leveraged the FOSSIL brand name with the introduction of soft accessories such as hats, gloves and scarves in 2007, men’s shoes in late 2008 and women’s shoes in 2009.scarves.
Introduce new brands.We have introduced new brands through the development or acquisition of proprietary brands and licensing agreements related to recognizable global fashion brands to attract a wide range of consumers with differing tastes and lifestyles. For example, our current portfolio of proprietary and licensed watch brands allows us to compete for market share from the luxury branded market to the mass market level. In 2011, we announcedentered into an exclusive global licensing agreement with Karl Lagerfeld for watches, which are expected to launchlaunched worldwide in the first quarter of 2013. In JanuaryApril 2012, we also announced that we had entered into a purchase agreement to acquirecompleted the acquisition of Skagen Designs, Ltd. (“("Skagen Designs”Designs") and certain of its international subsidiaries. Skagen Designs is an international company offering contemporary Danish design accessories including watches, jewelry, sunglasses and clocksclocks. In February 2013, we announced an exclusive global licensing agreement with Tory Burch for watches, which are expected to launch worldwide in 75 global markets and in company-owned and operated retail stores in the U.S., Denmark, Germany, U.K. and Hong Kong. The acquisition has cleared regulatory requirements in the U.S. and Germany, and U.K. regulatory approval is still pending. We anticipate receiving U.K. regulatory approval by the endlate 2014.
Expand international business.Since 1993, international International expansion has beenis a key driver in our long-term growth strategy. We have continued to increase our penetration of the international market by building brand name recognition, broadening the selection of merchandise through existing distribution channels by introducing new products or brands, extending product categories under our existing portfolio of brands, purchasing former distributors to gain increased control over international businesses, establishing owned, franchised or licensed retail stores, expanding into retail concessions operated by us and entering new geographic markets through owned subsidiary or third-party distributor relationships. For example, in 2007,on December 31, 2012, we formed distribution subsidiaries in India and South Korea, replacing former distribution partners that serviced those markets for us previously.acquired substantially all the assets of our third largest distributor, Bentrani Watches, LLC.
6
Leverage existing infrastructure.We have built our design, marketing, assembly and distribution infrastructure to allow us to manage and grow our businesses. As we continue to develop additional products, acquire or license additional brands and seek additional businesses and products to complement our existing product lines, we believe we will be able to leverage our infrastructure and continue to increase the efficiency of our operations over the long-term.
Expand retail locations.Historically, we have expanded our Company-owned retail and outlet locations each year. Distribution through our Company-owned retail stores has allowed us to raise awareness of the FOSSIL brand and showcase a broad assortment of FOSSIL branded products in a warm and inviting atmosphere. Our FOSSIL retail stores, combined with our FOSSIL branded catalogs and website, have continued to build brand equity, present a consistent brand image, influence the merchandising and presentation of our products at other retailers and have allowed us to test new product categories and designs. With the level of awareness we have achieved for the FOSSIL brand worldwide and the expansion of product categories offered under the brand, we have been able to accelerate our FOSSIL retail store growth. Of the 398473 Company-owned retail stores open as of December 31, 2011, 37329, 2012, 406 of these stores are FOSSIL branded stores. We also sell certain of our proprietary and licensed watch products, as well as upscale watch brands of other companies, such as Citizen and Swiss Army, at our Company-owned Watch Station International full pricefull-price retail and outlet stores. As of December 31, 2011,29, 2012, we operated 1846 Watch Station International stores. We plan to open approximately 70 to 75 additional stores in 2012,fiscal 2013, depending upon available retail locations and lease terms that meet our requirements, the majority of which will be our FOSSIL full-price accessory and outlet concept.concepts. During fiscal 2012,2013, we also expect to close approximately 1812 stores.
Operating strategy
Fashion orientation and design innovation.We are able to market our products to consumers with differing tastes and lifestyles by offering a wide range of brands and product categories at varying price points. We attempt to stay abreast of emerging fashion and lifestyle trends affecting accessories and clothing, and we respond to these trends by making adjustments in our product lines several times each year. We differentiate our products from those of our competitors principally through innovations in fashion details, including variations in both the materials and treatments used for dials, crystals, cases, straps and bracelets for our watches, and innovative treatments and details in our other accessories.
Coordinated product promotion.We coordinate in-house product design, packaging, advertising, our website and catalogs and in-store presentations to more effectively and cohesively communicate to our target markets the themes and images associated with our brands. For example, many of our watch products and certain of our accessory products are packaged in metal tins decorated with designs consistent with our marketing strategy and product image. In certain parts of the world, we market our non-watch fashion accessory lines through the same distribution channels as our watch lines, using similar in-store presentations, graphics and packaging.
Captive suppliers.The two entities that assemble or source the majority of our Asia watch production volume are majority-ownedmajority owned by us. In addition, although we do not have long-term contracts with our
unrelated accessory manufacturers, we maintain long-term relationships with several manufacturers. These relationships have developed due to the number of years that we have been conducting business with and visiting the same manufacturers and because of the small amount of turnover in the employees of our manufacturers. We believe that we are able to exert significant operational control with regard to our principal watch assemblers because of our level of ownership and long standing relationships. In addition, we believe that the relative size of our business with non-owned watch manufacturers gives us priority within their production schedules. Furthermore, the manufacturers understand our quality standards, which allows us to produce quality products and reduce the delivery time to market, improving overall operating margins.
Actively manage retail sales.We manage the retail sales process with some of our wholesale customers by monitoring consumer purchases and retail inventory levels by product category and style, primarily through
7
electronic data interchange, and by assisting some of our wholesale customers in the conception, development and implementation of their marketing programs. Through our merchandising unit, we work with some retailers to ensure that our products are properly stocked and displayed in accordance with our visual standards. As a result, we believe we enjoy close relationships with some of our principal wholesale customers, often allowing us to influence the mix, quantity and timing of their purchasing decisions.
Centralized distribution.We distribute substantially all of our products sold in North America from our warehouse and distribution centers located in Texas. In Europe, we distribute our products primarily through our warehouse and distribution center located in Germany. In Asia, we primarily distribute our products through our distribution warehouse located in Hong Kong and through smaller distribution warehouses in those countries where we maintain a physical presence. We believe our centralized distribution capabilities in the U.S. and Europe enable us to reduce inventory risk, increase flexibility in meeting the delivery requirements of our customers and maintain cost advantages as compared to our competitors.
Industry overview
Watch products
We believe that the current market for watches generally can be divided into four segments. One segment of the market consists of fine watches characterized by internationally known brand names such as Audemars Piguet, Cartier, Omega, Patek Philippe, Piaget and Rolex. Watches offered in this segment are usually made of precious metals or stainless steel and may be set with precious gems. These watches are almost exclusively manufactured in Switzerland and are sold by trade jewelers and in the fine jewelry departments of better department stores and other purveyors of luxury goods at retail prices ranging from $4,000 to in excess of $20,000. A portionSelected limited editions of our BURBERRY and MICHELE line competeslines compete in this market. A second segment of the market consists of fine premium branded and designer watches produced in Switzerland and the Far East such as Gucci, Movado, Raymond Weil, Seiko, TagTAG Heuer and Tissot. These watches are sold at retail prices generally ranging from $495 to $4,000. Our BURBERRY, EMPORIO ARMANI, MICHELE, SKAGEN and ZODIAC lines generally compete in this market segment. A third segment of the market consists of watches sold by mass marketers, which typically consist of digital and analog watches manufactured in the Far East. Well-known brands in this segment include Armitron, Casio and Timex. Retail prices in this segment range from $7 to $60. We compete in this segment through the design and production of private label watch products for Wal-Mart and Target.
The fourth segment of the market consists of moderately priced watches characterized by contemporary fashion and well known fashion brand names. Moderately priced watches are typically produced in Japan, China or Hong Kong and are sold by department stores and specialty stores at retail prices ranging from $65$60 to $595.$795. This market segment is targeted by us with our FOSSIL,
SKAGEN and RELIC lines and by our principal competitors, including the companies that market watches under the Anne Klein II, Guess?, Kenneth Cole and Swatch brand names, whose products attempt to reflect emerging fashion trends in accessories and clothing. Our ARMANI EXCHANGE, DKNY, DIESEL, MARC BY MARC JACOBS and MICHAEL KORS lines generally compete in this segment as well. We compete in the sports specialty area of this segment with our ADIDAS line of women’swomen's and men’smen's sport timepieces. We believe that a number of consumers regard branded fashion watches not only as time pieces, but also as fashion accessories, and that has historically resulted in consumers owning multiple watches that may differ significantly in terms of style, features and cost.
Watches typically utilize either a mechanical or quartz-analog movement to maintain their time keeping function. Mechanical watches utilize intricate arrangements of wheels, jewels and winding and regulating mechanisms to keep time, while quartz-analog watches are precisely calibrated to the regular frequency of the vibration of a quartz crystal powered by a battery. Although quartz-analog movements typically maintain their time keeping functions more precisely than mechanical movements, mechanical movements are prized for their craftsmanship and are generally associated with high-end luxury timepieces.
8
Fashion accessories
In addition to watches, the fashion accessories market also includes an array of products such as small leather goods, handbags, belts, eyewear,sunglasses, neckwear, underwear, lounge wear, jewelry, gloves, hats, hosiery and socks. We believe that a number of consumers view accessories as fashion statements, and as a result, purchase brand name, quality items that complement other fashion items. These fashion accessory products are generally marketed through mass merchandisers, department stores, specialty retailers and specialty shops,mass merchandisers, depending upon price and quality. Higher price point items include products offered by such fashion names such as Louis Vuitton and Prada.
Moderately priced fashion accessories are typically marketed in department stores and are characterized by contemporary fashion and well-known brand names at reasonable price points, such as our FOSSIL and RELIC brands. We currently offer small leather goods, handbags, belts, eyewearsunglasses and soft accessories for both men and women through department stores and specialty retailers in the moderate to upper-moderate price ranges. Our competitors in this market include companies such as Coach, Guess?, Nine West, Kenneth Cole and Liz Claiborne. In addition, we currently offer fashion jewelry sold under the DIESEL, DKNY, EMPORIO ARMANI, FOSSIL, SKAGEN and MICHAEL KORS brands.
Clothing
In 2000, we introduced a line of FOSSIL clothing that is distributed exclusively through Company-owned retail stores,www.fossil.comand through our FOSSIL catalogs. Selling through Company-owned distribution channels allows us to more effectively manage visual presentation, information feedback, inventory levels and operating returns. The clothing line is focused on the casual lifestyle of the savvy consumer who is youthful in their approach to life and is not tied to any one demographic or age. The clothing line consists primarily of jeans, tee shirts and vintage-inspired fashion clothing. The suggested retail selling price of the clothing line is comparable to that of major competitors like American Eagle Outfitters and J. Crew. We have leveraged our existing graphic and store design infrastructure to create a unique, inviting and welcoming environment rich in details of design, product and merchandising to appeal to the consumers’consumers' sense of discovery.
Shoes
In late 2008, we launched We discontinued our shoe product line of FOSSIL men’s shoes through our FOSSIL website. In the spring of 2009, we launched the men’s line into a select number of department store doors in the U.S. and Germany. In the falllatter half of 2009, we launched our women’s shoe line in select department stores, specialty stores, Company-owned retail stores andwww.fossil.com. We currently offer a select assortmentfiscal year 2012.
9
Our products
We design, develop, market and distribute fashion accessories, including clothing, belts, handbags, jewelry, small leather goods, sunglasses, soft accessories and watches under proprietary and licensed brand names. Additionally, we manufacture or distribute private label brands as well as branded products we purchase for resale in certain of our non-FOSSIL retail stores. The following table sets forth certain information with respect to the breakdown of our net sales and percentage of growth between proprietary, licensed and other brands within our wholesale and direct to consumer distribution channels for the fiscal years indicated (in millions, except for percentage data).
| Fiscal Year | ||||||||||||||||||||
| 2011 | 2010 | 2009 | ||||||||||||||||||
| Dollars | % Growth | Dollars | % Growth | Dollars | ||||||||||||||||
Net sales | ||||||||||||||||||||
Wholesale | ||||||||||||||||||||
Proprietary | $ | 844.5 | 13.7 | % | $ | 742.7 | 18.9 | % | $ | 624.5 | ||||||||||
Licensed | 1,043.3 | 43.0 | 729.8 | 54.7 | 471.9 | |||||||||||||||
Other | 72.1 | (3.7 | ) | 74.9 | (0.9 | ) | 75.6 | |||||||||||||
|
|
|
|
|
|
|
|
|
| |||||||||||
| 1,959.9 | 26.7 | 1,547.4 | 32.0 | 1,172.0 | ||||||||||||||||
Direct to consumer | ||||||||||||||||||||
Proprietary | 494.7 | 23.1 | 402.0 | 27.9 | 314.3 | |||||||||||||||
Licensed | 103.4 | 48.4 | 69.7 | 38.0 | 50.5 | |||||||||||||||
Other | 9.3 | (19.8 | ) | 11.6 | 2.7 | 11.3 | ||||||||||||||
|
|
|
|
|
|
|
|
|
| |||||||||||
| 607.4 | 25.7 | 483.3 | 28.5 | 376.1 | ||||||||||||||||
Total | ||||||||||||||||||||
Proprietary | 1,339.2 | 17.0 | 1,144.7 | 21.9 | 938.8 | |||||||||||||||
Licensed | 1,146.7 | 43.4 | 799.5 | 53.0 | 522.4 | |||||||||||||||
Other | 81.4 | (5.9 | ) | 86.5 | (0.5 | ) | 86.9 | |||||||||||||
|
|
|
|
|
|
|
|
|
| |||||||||||
| $ | 2,567.3 | 26.4 | % | $ | 2,030.7 | 31.2 | % | $ | 1,548.1 | |||||||||||
|
|
|
|
|
|
|
|
|
| |||||||||||
| | Fiscal Year | |||||||||||||||
|---|---|---|---|---|---|---|---|---|---|---|---|---|---|---|---|---|
| | 2012 | 2011 | 2010 | |||||||||||||
| | Dollars | % Growth | Dollars | % Growth | Dollars | |||||||||||
Net sales | ||||||||||||||||
Wholesale | ||||||||||||||||
Proprietary | $ | 836.7 | (0.9 | )% | $ | 844.5 | 13.7 | % | $ | 742.7 | ||||||
Licensed | 1,220.2 | 17.0 | 1,043.3 | 43.0 | 729.8 | |||||||||||
Other | 85.1 | 18.0 | 72.1 | (3.7 | ) | 74.9 | ||||||||||
| 2,142.0 | 9.3 | 1,959.9 | 26.7 | 1,547.4 | ||||||||||||
Direct to consumer | ||||||||||||||||
Proprietary | 570.3 | 15.3 | 494.7 | 23.1 | 402.0 | |||||||||||
Licensed | 135.3 | 30.9 | 103.4 | 48.4 | 69.7 | |||||||||||
Other | 9.9 | 6.5 | 9.3 | (19.8 | ) | 11.6 | ||||||||||
| 715.5 | 17.8 | 607.4 | 25.7 | 483.3 | ||||||||||||
Total | ||||||||||||||||
Proprietary | 1,407.0 | 5.1 | 1,339.2 | 17.0 | 1,144.7 | |||||||||||
Licensed | 1,355.5 | 18.2 | 1,146.7 | 43.4 | 799.5 | |||||||||||
Other | 95.0 | 16.7 | 81.4 | (5.9 | ) | 86.5 | ||||||||||
| $ | 2,857.5 | 11.3 | % | $ | 2,567.3 | 26.4 | % | $ | 2,030.7 | |||||||
Watch products
We offer an extensive line of branded lifestyle watches under our proprietary brands and, pursuant to license agreements, under some of the most prestigious brands in the world. Sales of watches for fiscal years 2012, 2011 2010 and 20092010 accounted for approximately 71.8%74.9%, 69.9%71.8% and 66.0%69.9%, respectively, of our consolidated net sales.
10
Proprietary brands. The following table sets forth information about some of our primary proprietary brand watches:
Brand | Suggested
| Primary Distribution Channels | |||||||
|---|---|---|---|---|---|---|---|---|---|
FOSSIL | $75 - 235 | U.S. department stores | |||||||
MICHELE | |||||||||
| $295 - 2,395 | U.S. department stores (Neiman Marcus, Saks Fifth Avenue, Bloomingdales and Nordstrom), watch specialty stores, jewelry stores,www.michele.comandwww.watchstation.com | |||||||
RELIC | |||||||||
$60 - 195 | U.S. department stores (JCPenney, | ||||||||
SKAGEN | $95 - 325 | U.S. department stores (Dillard's, Macy's, Lord and Taylor, Von Maur, Belk and Nordstrom), U.S. specialty and independent retailers, U.S. military, better European department stores (Karstadt, Galeries Lafayette, Kaufhof, House of Fraser), European specialty stores (Christ) and independent retailers, Asian speciality stores (City Chain, Tic Tac, On Time) and independent retailers, Company-owned stores (Skagen, Watch Station International retail stores and outlets) andwww.skagen.com | |||||||
| $495 - | Watch specialty jewelry stores worldwide,www.watchstation.comandwww.zodiacwatches.com |
Licensed brands. We have entered into multi-year, worldwide exclusive license agreements for the manufacture, distribution and sale of watches bearing the brand names of certain globally recognized fashion companies. The following table sets forth information with respect to certain of our primary licensed watch products:
Brand | Suggested Retail Price Point Range | Expiration Date | Primary Distribution Channels | |||||||||||
|---|---|---|---|---|---|---|---|---|---|---|---|---|---|---|
ADIDAS | $ | 12/31/2017 | Department stores, major sports stores, specialty retailers, jewelry stores, Adidas stores worldwide andwww.watchstation.com | |||||||||||
| $100 - 240 | 12/31/2013 | Department stores, specialty retailers, duty free stores worldwide, Armani Exchange boutiques worldwide,www.armaniexchange.comandwww.watchstation.com | |||||||||||
BURBERRY | $395 - 3,995 | |||||||||||||
| 12/31/2013 | Department stores, specialty retailers, duty free stores worldwide, | ||||||||||||
DIESEL | ||||||||||||||
| $100 - | 12/31/2015 | Department stores, specialty retailers, Diesel boutiques worldwide,www.dieseltimeframes.comandwww.watchstation.com | |||||||||||
DKNY | ||||||||||||||
| $75 - 275 | 12/31/2014 | Department stores, jewelry stores, specialty retailers, DKNY boutiques worldwide andwww.watchstation.com | |||||||||||
| $195 - 695 | 12/31/2013 | Department stores, specialty retailers, major jewelry and watch stores, Emporio Armani boutiques worldwide, duty free stores worldwide, | |||||||||||
MARC BY MARC JACOBS | $125 - | 12/31/2015 | Department stores, specialty retailers, Marc by Marc Jacobs boutiques worldwide andwww.watchstation.com | |||||||||||
| $120 - | 12/31/2015 | Department stores, specialty retailers, jewelry stores, duty free stores worldwide, Michael Kors boutiques nationwide andwww.watchstation.com | |||||||||||
11
The continuation of our significant license agreements is important to the growth of our watch business. The Emporio Armani, Armani Exchange and Burberry licenses expire December 31, 2013, and we are negotiating new long-term contracts to continue our distribution of these licensed brand products. Sales of our licensed watch products amounted to 44.7%accounted for 45.2% of our consolidated net sales for fiscal year 2011, with certain individual licensed brands accounting for a significant portion of our revenues.2012. In fiscal year 2011, we announcedentered into an exclusive global licensing agreement with Karl Lagerfeld for watches, which are expected to launchlaunched worldwide in the first quarter of 2013. In February 2013, we
announced an exclusive global licensing agreement with Tory Burch for watches, which are expected to launch worldwide in late 2014.
Private label and other.We design, market and arrange for the manufacture of watches and accessories on behalfmanufacturing of certain mass market retailers, various companies and other organizations asretailers' private label productsand owned brand watches or as premium and incentive items for use in various corporate events. Under these arrangements, we perform design and product development functions, as well as act as a sourcing agent for our customers by contracting for and managing the manufacturing process, purchasing and inspecting the finished product and arranging for shipment. Participation in the private label and premium businesses provides us with certain advantages, including increased assembly volume, which may reduce the costs of assembling our other products, and the strengthening of business relationships with our manufacturing sources.
Fashion accessories
In order to leverage our design and marketing expertise and our close relationships with our principal retail customers, primarily in the U.S. and Europe, we have developed a line of fashion accessories for both men and women, including handbags, belts, small leather goods, jewelry and sunglasses. We also offer a line of soft accessories including hats, gloves and scarves under the FOSSIL brand. Our handbags are made of a variety of fine leathers and other materials that emphasize classic styles and incorporate a variety of creative designs. Our small leather goods are typically made of fine leathers or other man-made materials and include items such as mini-bags, coin purses, cosmetic bags and wallets. Our jewelry lines include earrings, cufflinks, necklaces, rings and bracelets marketed under the EMPORIO ARMANI, DIESEL, DKNY, FOSSIL, SKAGEN and MICHAEL KORS brands and typically include materials such as base metals, stainless steel, semi-precious stones or silver jewelry with 18K gold or sterling silver with natural and synthetic materials. Our sunglass line features optical quality lensesplating on top. We offer 100% UV protected fashion sunglasses in both plasticthe FOSSIL and metal frames, with classic and fashion styling.RELIC brands. Our soft accessories are made of a variety of blends consisting of natural yarns such as cotton, wool, cashmere, angora and alpaca, as well as man-made blends including acrylic, viscose and nylon. We currently sell our fashion accessories through a number of our existing major department store and specialty retail store customers, as well as our Company-owned retail stores,www.fossil.com, other internationally-owned e-commerce sites and through our catalog operations. In the U.S. and certain international markets, we generally market our fashion accessory lines through the same distribution channels as our watches using similar in-store presentations, graphics and packaging. These fashion accessories are typically sold in locations adjacent to watch departments, which may lead to purchases by persons who are familiar with our watch brands. Sales of our accessory lines for fiscal years 2012, 2011 2010 and 20092010 accounted for approximately 26.0%22.9%, 27.4%26.0% and 31.1%27.4%, respectively, of our consolidated net sales.
12
The following table sets forth information about our fashion accessories:
Brand | Accessory Category | Suggested Retail Price | Primary Distribution Channel | |||||||||||
|---|---|---|---|---|---|---|---|---|---|---|---|---|---|---|
| FOSSIL | Handbags
| $ 268 115
85
| U.S. department stores | |||||||||||
| Jewelry | $75 - | Department stores, specialty retailers, major jewelry stores, Emporio Armani boutiques worldwide, duty free stores worldwide andwww.emporioarmani.com | |||||||||||
DIESEL | ||||||||||||||
Jewelry | $ | Department stores, domestic and international specialty retailers and Diesel retail stores worldwide | ||||||||||||
DKNY | ||||||||||||||
Jewelry | $30 - 200 | International department stores, specialty retailers, jewelry stores and DKNY boutiques | ||||||||||||
RELIC | ||||||||||||||
|
|
| U.S. department stores (JCPenney, | |||||||||||
| Jewelry | $45 - 595 | Department stores, specialty retailers, jewelry stores, duty free stores worldwide and Michael Kors boutiques nationwide | |||||||||||
SKAGEN | Jewelry | $15 - 80 | U.S. department stores (Dillard's, Macy's, Lord and Taylor, Von Maur, Belk and Nordstrom), U.S. specialty stores and independent retailers, U.S military, European department stores (Karstadt, Galeries Lafayette, Kaufhof, House of Fraser), European specialty stores (Christ) and independent retailers, Asian speciality stores (City Chain, Tic Tac, On Time) and independent retailers, Company-owned stores (Skagen, Watch Station International retail stores and outlets) andwww.skagen.com | |||||||||||
Clothing
The FOSSIL clothing collection is designed for both men and women and includes jeans, outerwear, fashion tops and bottoms and tee shirts. The products’products' unique vintage-inspired style, packaging and graphics capture the energy and spirit of the FOSSIL brand. As of December 31, 2011, 29, 2012,
the FOSSIL clothing collection was offered through 3633 Company-owned stores located in leading malls and retail locations in the U.S and internationally. The line is also available atwww.fossil.comand through our catalogs. Sales for our clothing collection for fiscal years 2012, 2011 2010 and 20092010 accounted for approximately 0.6%0.7%, 0.8%0.6% and 1.0%0.8%, respectively, of our consolidated net sales.
Shoes
In late 2008, we launched a men’s shoe line, followed by a launch of a women’s line in 2009. The shoe line includes sport court sneakers, authentic casuals, dress classics and boots with a modern touch for men and fashionable flats, heels, wedges, and boots for women. Sales for our shoe line for fiscal years 2011, 2010, and 2009 accounted for approximately 0.4%, 0.5%, and 0.3%, respectively, of our consolidated net sales.
Licensed eyewear
We are partyhave licensed our FOSSIL and RELIC brands to a license agreement with the Safilo Group, for the manufacture, marketingwho manufactures, markets, and sale ofsells optical frames under the FOSSIL and RELIC brands in the U.S. and Canada. The license agreement provides for royalties to be paid to us based on a percentage of net sales and includes certain guaranteed minimum royalties.
13
Design and development
We believe one of our key strengths is our internal creative team. Our watch, accessory and clothing products are created and developed by our in-house design staff primarily located in the U.S., Germany, Hong Kong and Switzerland. When developing products under our various licensed brands, we often coordinate our efforts with our licensors’licensors' design teams to provide for a more fluid design approval process and to fully incorporate the image of the respective brand into the product. Product design ideas are drawn from various sources and are reviewed and modified by our design staff to ensure consistency with our existing product offerings and the themes and images associated with our brands. Senior management is actively involved in the design process.
In order to respond effectively to changing consumer preferences, we attempt to stay abreast of emerging lifestyle and fashion trends affecting accessories and clothing. In addition, we attempt to take advantage of the constant flow of information from our customers and our retail stores and e-commerce sites regarding the retail performance of our products. We review weekly sales reports provided by a substantial number of our customers, as well as daily sales reports generated from our Company-owned retail stores and e-commerce sites, containing information with respect to sales and inventories by product category and style. Once a trend in the retail performance of a product category or style has been identified, our design and marketing staffs review their product design decisions to ensure that key features of successful products are incorporated into future designs. Other factors having an influence on the design process include the availability of components, the capabilities of the factories that will manufacture the products for us and the anticipated retail prices and profit margins for the products. Our creative teams have access to our Company’sCompany's product design archives and are regularly updated on all the various new components, hardware and materials that become available. Over the last few years, our focus has been on transforming our approach in design and development from an assortment-rich offering to an iconic platform presentation. This has enhanced our ability to develop and share compelling stories within the platforms through a narrower range of product offerings, thereby reducing inventory risk and improving lead times. We initially developed this approach in our watch business, and we are now in the early stages of applying a similar approach to our leather and jewelry businesses.
We differentiate our products from those of our competitors principally by incorporating into our product designs innovations in fashion details, including variations in the materials and treatments used for dials, crystals, cases, straps and bracelets for our watches, and innovative details and treatments in our other accessories. We also incorporate certain proprietary technology or integrate our suppliers’suppliers' technologies in certain of our watch products. In some instances, we believe that such innovations have allowed us to achieve significant improvements in consumer acceptance of our product offerings. We believe that the substantial experience of our design staff will assist us in maintaining our current leadership position in the watch and handbag categories and in expanding the scope of our product offerings.
Marketing and promotion
Our marketing strategy for each of our proprietary brands is to deliver a coordinated and consistent brand image to the consumer regardless of where the consumer comes into contact with the brand. This permeates from point of sale merchandise displays, print and media advertising, our websites, our catalogs, retail stores, and the product packaging to the product itself. We identify our advertising themes and coordinate our packaging, advertising and point of sale material around these themes. These themes are carefully coordinated in order to convey modernAmerican vintage styling and the aspirational viewpoint that we associate with our products. Our vintage-inspired tin packaging concept for many of our watch products and certain of our accessories is an example of these marketing themes. While our marketing themes typically change each year, the core image of the brand is designed to endure, only changing slightly to keep it fresh and relevant to our targeted consumer. For our licensed brands, we incorporate many of the same concepts but derive the themes generally from the licensors.
We participate in cooperative advertising programs with our major retail customers, whereby we share the cost of certain of their advertising and promotional expenses. An important aspect of the marketing process
14
involves the use of in-store visual support and other merchandising materials, including packages, signs, posters and fixtures. Through the use of these materials, we attempt to differentiate the space used to sell our products from other areas of our customers’customers' stores. We also promote the use of our shop-in-shop concept for watches, jewelry, handbags, small leather goods and watch and jewelry concessions, primarily in Asia and Europe. Our shop-in-shop concept involves the use of dedicated space within a customer’scustomer's store to create a brand “shop”"shop" featuring our products and visual displays. The concessions we run allow us to essentially operate all or a portion of the watch and jewelry department within our customers’customers' stores, thereby permitting us to control merchandising, inventory levels, build-out and branding decisions and, more importantly, the interaction with the end consumer. We also provide our customers with a large number of preprinted customized advertising inserts and from time to time stage promotional events designed to focus public attention on our products.
Our in-house art department designs, develops and implements all of the packaging, advertising, marketing and other promotional aspects of our products. The art staff uses computer-aided design techniques to generate the images presented on product packaging and other advertising materials. Senior management is involved in monitoring our advertising and promotional activities to ensure that themes and ideas are communicated in a cohesive manner to our target audience.
We advertise, market and promote our products to consumers through a variety of media, including direct mail catalogs, catalog inserts, billboards, print media television, cinema and the Internet. We also distribute FOSSIL catalogs in the U.S. and certain international markets, which are produced by our in-house staff and feature selected FOSSIL branded products. Additionally, we are now utilizing a similar strategy for the promotion of the MICHELE brand and multi-brand products in our Watch Station International stores. The timing of these catalogs is generally coordinated with seasonal shopping periods and generally peak during the year end holiday season. The scope of the distribution of these catalogs is determined by our management based on consumer response. During 2011, we implemented a new CRM database toWe regularly monitor and analyze the productivity of our marketing activities, including catalog mailings and Internet basedInternet-based search advertising, in an effort to optimize our spending in this area. As a result of this analysis, we reduced the number of our global catalog circulation in 2011 and again in 2012, while still generating higher incremental sales and profitability in our Direct to consumer segment. We believe our catalogs are a cost-effective way of enhancing the FOSSIL brandour proprietary brands and driving sales to our retail stores, e-commerce sites and wholesale customers.
Sales and customers
General.Domestically, we sell our products in retail locations in the U.S. through a diversified distribution network that includes department stores, specialty retail locations, specialty watch and jewelry stores and mass market stores. For our FOSSIL, MICHELE and licensed branded products, our primary department store customers include Neiman Marcus, Belk, Saks Fifth Avenue, Bloomingdales, Nordstrom, Macy’s, Dillard’sMacy's and BonTon.Dillard's. For our RELIC brand, our primary customers include JCPenney Kohl’s and Sears.Kohl's. For our SKAGEN brand, our primary customers include Macy's, Nordstrom and Dillard's. Many of our licensed branded products are also sold through each respective licensor’slicensor's boutique stores and websites. We maintain sales offices in several major cities across the U.S. staffed with sales associates to assist in managing our department and specialty store accounts and employ a nationwide staff of merchandise coordinators who work with the stores to ensure that our products are displayed appropriately. We also sell certain of our FOSSIL branded products at Company-owned FOSSIL retail stores and outlet stores located throughout the U.S., retail locations in major airports, on cruise ships and through our catalogs and website atwww.fossil.com. In addition, we sell certain of our proprietary and licensed watch products, as well as upscale watch brands of other companies, such as Citizen and Swiss Army, at our Company-owned Watch Station International retail stores in the U.S. and through our website atwww.watchstation.com.
Our foreign operations include a presence in Africa, Asia, Australia, Europe, Central and South America, Canada, the Caribbean, Mexico and the Middle East. We maintain subsidiary offices in Australia, Austria, Belgium, Canada, China, Denmark, France, Germany, Hong Kong, India, Italy, Japan, Macau, Malaysia, Mexico, the Netherlands, New Zealand, Norway, Singapore, South Korea, Spain, Sweden, Switzerland, Taiwan and the United Kingdom. Our European headquarters is located in Basel, Switzerland, and our Far EastAsia headquarters is located in Hong Kong. Internationally, our products are sold to department stores and specialty retail stores in over 120approximately 130 countries worldwide through 2223 Company-owned foreign subsidiaries, a network of over 60 independent distributors,
15
Company-owned retail stores and websites and licensed or franchised FOSSIL retail stores, retail concessions operated by us and kiosks. Foreign distributors generally purchase products from us at uniform prices established by us for all international sales and resell them to department stores and specialty retail stores. We generally receive payment from our foreign distributors in U.S. currency.dollars. We generally do not have long-term contracts with any of our retail customers. All transactions between us and our retail customers are conducted on the basis of purchase orders, which generally require payment of amounts due to us on a net 30 day basis for most of our U.S.-based customers and up to 120 days for certain international customers. No customer accounted for 10% or more of our consolidated net sales in fiscal years 2012, 2011 2010 or 2009.2010. Net sales for geographic segments are generally based on the location of the customers. For more information on our geographic segments, see Note 18—Major Customer, Segment and Geographic Information to our Consolidated Financial Statements set forth in Part II, Item 8 of this Annual Report on Form 10-K.
U.S. wholesale sales.For fiscal years 2012, 2011 2010 and 2009,2010, U.S. wholesale sales accounted for approximately 34.7%32.7%, 35.9%34.7% and 30.4%35.9% of our consolidated net sales, respectively. In addition, in the same fiscal year periods,respectively, and the aggregate sales to our 10 largest customers in the U.S. wholesale channel represented approximately 21.1%20.8%, 23.5%21.1% and 22.0%23.5% of consolidated net sales, respectively.
International wholesale sales.During the fiscal years 2012, 2011 2010 and 2009,2010, international wholesale sales, including sales to third-party distributors, accounted for approximately 41.6%42.3%, 40.3%41.6% and 45.3%40.3% of consolidated net sales, respectively. Wholesale sales within Germany, excluding sales to third-party distributors located outside of Germany, accounted for approximately 12.4%, 15.0% and 14.7% of consolidated net sales in fiscal years 2012, 2011 and 2010, respectively.
Company-owned stores.Our various retail store formats focus on creating emotional connections with our customer through an intense branding experience and personalized customer service. We strive to provide an inviting and welcoming environment for our customers that enhance our brand image and seek brand loyalty by continually delivering innovative vintage-inspired products that meet our customers’customers' tastes.
The following table sets forth the number of stores by brand and concept as of December 29, 2012 and December 31, 2011:
| | December 29, 2012 | December 31, 2011 | |||||||||||||||||
|---|---|---|---|---|---|---|---|---|---|---|---|---|---|---|---|---|---|---|---|
| | North America | Outside of North America | Total | North America | Outside of North America | Total | |||||||||||||
FOSSIL accessory stores | 106 | 145 | 251 | 103 | 142 | 245 | |||||||||||||
FOSSIL outlet stores | 77 | 45 | 122 | 65 | 25 | 90 | |||||||||||||
Watch Station International outlet stores | 22 | 13 | 35 | 10 | 4 | 14 | |||||||||||||
Outlet stores | 99 | 58 | 157 | 75 | 29 | 104 | |||||||||||||
FOSSIL clothing stores | 31 | 2 | 33 | 32 | 4 | 36 | |||||||||||||
Full-price Watch Station International | 5 | 6 | 11 | 2 | 2 | 4 | |||||||||||||
Other full-price multi-brand | 0 | 7 | 7 | 0 | 9 | 9 | |||||||||||||
Full-price multi-brand | 5 | 13 | 18 | 2 | 11 | 13 | |||||||||||||
SKAGEN stores | 6 | 8 | 14 | 0 | 0 | 0 | |||||||||||||
Total stores | 247 | 226 | 473 | 212 | 186 | 398 | |||||||||||||
FOSSIL accessory stores
In 1996, we commenced operations of full price We operate full-price FOSSIL accessory retail stores (“("Accessory Stores”Stores") in the U.S. in order to broaden the recognition of the FOSSIL brand name. Accessory Stores carry a full assortment of FOSSIL watches and other accessories that are generally sold at the suggested retail price. We believe our Accessory Stores present a key growth strategy for us on a worldwide basis. As of December 31, 2011, 156 of our 245 Accessory Stores were located outside of the U.S., mainly in Europe and Asia. At the end of fiscal 2011,2012, the average size of our Accessory Stores was 1,3781,410 square feet, but each store can vary in size based on its geographic location. For example, our international-based stores are generally smaller in square footage than our U.S.-based stores due to smaller retail store configurations generally available in the international market.markets. The table below sets forth information about our Accessory Stores for the last five fiscal years:
Fiscal Year | Open At Beginning of Period | Opened During Period | Closed During Period | Open at End of Period | Total Gross Square Footage (in thousands) | Percentage Increase in Square Footage | Average Gross Square Footage Per Retail Store | |||||||||||||||||||||
2007 | 73 | 42 | 2 | 113 | 153.6 | 42.8 | % | 1,359 | ||||||||||||||||||||
2008 | 113 | 79 | 1 | 191 | 258.6 | 68.4 | % | 1,354 | ||||||||||||||||||||
2009 | 191 | 29 | 2 | 218 | 296.2 | 14.5 | % | 1,359 | ||||||||||||||||||||
2010 | 218 | 20 | 8 | 230 | 311.4 | 5.1 | % | 1,354 | ||||||||||||||||||||
2011 | 230 | 22 | 7 | 245 | 337.7 | 8.4 | % | 1,378 | ||||||||||||||||||||
16
Fiscal Year | Open At Beginning of Period | Opened During Period | Closed During Period | Open at End of Period | Total Gross Square Footage (in thousands) | Percentage Increase in Square Footage | Average Gross Square Footage Per Retail Store | |||||||||||||||
|---|---|---|---|---|---|---|---|---|---|---|---|---|---|---|---|---|---|---|---|---|---|---|
2008 | 113 | 79 | 1 | 191 | 258.6 | 68.4 | % | 1,354 | ||||||||||||||
2009 | 191 | 29 | 2 | 218 | 296.2 | 14.5 | % | 1,359 | ||||||||||||||
2010 | 218 | 20 | 8 | 230 | 311.4 | 5.1 | % | 1,354 | ||||||||||||||
2011 | 230 | 22 | 7 | 245 | 337.7 | 8.4 | % | 1,378 | ||||||||||||||
2012 | 245 | 16 | 10 | 251 | 354.0 | 4.8 | % | 1,410 | ||||||||||||||
FOSSIL outletOutlet stores
In 1995, we commenced operations of We operate FOSSIL outlet stores at selected major outlet malls throughout the U.S. and certain international locations. We opened our firstoperate outlets under both the FOSSIL outlet store outside the U.S. in 2005 and as of December 31, 2011, 29 of our 104 outlet stores are located outside of the U.S. These outlet stores, which operateWatch Station International names. Our outlets operating under the FOSSIL name not only increase our brand awareness, but also enable us to liquidate excess inventory generally at significantly better prices than we would obtain through third-party liquidators. We generally discount products in our outlet stores from 25% to 75%
off our suggested retail price. The table below sets forth information about our FOSSIL outlet stores during the last five fiscal years:
Fiscal Year | Open At Beginning of Period | Opened During Period | Closed During Period | Open at End of Period | Total Gross Square Footage (in thousands) | Percentage Increase in Square Footage | Average Gross Square Footage Per Retail Store | |||||||||||||||||||||
2007 | 78 | 4 | 2 | 80 | 206.2 | 1.0 | % | 2,577 | ||||||||||||||||||||
2008 | 80 | 5 | 3 | 82 | 207.6 | 0.7 | % | 2,532 | ||||||||||||||||||||
2009 | 82 | 12 | 4 | 90 | 212.5 | 2.4 | % | 2,361 | ||||||||||||||||||||
2010 | 90 | 9 | 6 | 93 | 221.1 | 4.0 | % | 2,377 | ||||||||||||||||||||
2011 | 93 | 15 | 4 | 104 | 238.3 | 7.8 | % | 2,291 | ||||||||||||||||||||
Fiscal Year | Open At Beginning of Period | Opened During Period | Closed During Period | Open at End of Period | Total Gross Square Footage (in thousands) | Percentage Increase in Square Footage | Average Gross Square Footage Per Retail Store | |||||||||||||||
|---|---|---|---|---|---|---|---|---|---|---|---|---|---|---|---|---|---|---|---|---|---|---|
2008 | 80 | 5 | 3 | 82 | 207.6 | 0.7 | % | 2,532 | ||||||||||||||
2009 | 82 | 12 | 4 | 90 | 212.5 | 2.4 | % | 2,361 | ||||||||||||||
2010 | 90 | 9 | 6 | 93 | 221.1 | 4.0 | % | 2,377 | ||||||||||||||
2011 | 93 | 15 | 4 | 104 | 238.3 | 7.8 | % | 2,291 | ||||||||||||||
2012 | 104 | 54 | 1 | 157 | 350.5 | 47.1 | % | 2,233 | ||||||||||||||
Other direct to consumer
In 2000, we began offering We offer FOSSIL brand clothing through specially designed Company-owned clothing stores. As of December 31, 2011, we operated 32 FOSSIL clothing stores in leading malls and retail locations throughout the U.S and 4 outside the U.S. Our clothing stores carry our full clothing line along with an assortment of certain FOSSIL watch and accessory products and shoes. In 2004, we commenced operations of our first Modern Watch Co. retail store, in both full-price and outlet locations, through which we soldproducts. We sell certain of our proprietary and licensed brand watches, as well as watches manufactured by other companies. In 2007, we acquired the Watch Station trade name from Sunglass Hut and subsequently rebranded all Modern Watch Co. stores with thecompanies in our Watch Station International name. As of December 31, 2011, we operated 18 Watch Station International stores of which (i) 12 are located in the U.S., including two full-price stores and 10 outlets, (ii) four are located in Asia, including one full-price store and three outlets, and (iii) two are located in Europe, including one full-price store and one outlet. As of December 31, 2011, we also operated seven retail stores outside the U.S. featuring watch products under various names.stores.
During 2006, we entered into We have an agreement with the House of Fraser ("HOF"), a U.K.-based department store, (“HOF”), which allows us to operate the watch department in certain HOF stores. Under this agreement, we own the inventory within the HOF store, provide the labor to operate the department and pay HOF a commission on the retail watch sales generated in the stores. As of December 31, 2011,29, 2012, we operated the watch department in 4645 HOF stores. Although we include the net sales derived from the HOF stores in our Direct to consumer segment, we do not include the number of locations associated with this arrangement in our retail store count.
Internet sales.In November 1996, we established our first Our U.S. e-commerce website with the launch offor FOSSIL branded products iswww.fossil.com.In October 2007, we launched our first non-U.S.We also operate e-commerce site in Germany. We now operate siteswebsites in Australia, Austria, China, France, Germany, Italy, Japan, the Netherlands, South Africa and the United Kingdom. In October 2012, we began shipping to Canada and Mexico through our U.S. e-commerce website. Each sitewebsite features a full selection of geographically appropriatespecific FOSSIL brand products. Certain of our siteswebsites also provide customer service, company news and shareholder information. Our siteswebsites are continually updated to provide a fresh look and an easy-to-navigate interface that enhances our brand image, while allowing consumers a pleasing shopping experience or a preview of what they may find at their local store carrying the brand. Since its launch, thewww.fossil.comwebsite has been promoted consistently in support of online brand and direct sales goals. OnlineOur online marketing efforts include:include the following: search/keyword marketing programs through major search partners including Google Affiliate Network, Microsoft Network and Yahoo!; regular e-mail communications sent using Email Service Providers (“ESP”) to over one million registered consumers; product and promotional banners presented on affiliate networks and display banner networks; and online brand initiatives through social networks such as
17
Facebook, Twitter and YouTube in support of viral and traditional brand initiatives. We have leveraged our e-commerce infrastructure by opening websites to support our licensed and owned brands, includingwww.dieseltimeframes.com, www.emporioarmaniwatches.com, www.michele.com, www.relicbrand.com, www.skagen.com, www.watchstation.comandwww.zodiacwatches.com,as well as our international FOSSIL brand sitewebsite located athttp://global.fossil.com. www.fossilglobal.com.
During fiscal years 2011, 2010 and 2009, our Direct to consumer segment, which includes sales from Company-owned stores, catalogs and e-commerce businesses, accounted for approximately 23.7%, 23.8% and 24.3% of consolidated net sales, respectively.
Catalogs.In fiscal year 2011,2012, we distributed approximately 16.211.0 million FOSSIL catalogs in the U.S., a decrease from 19.916.2 million in fiscal year 2010. We2011, and we distributed 2.41.4 million FOSSIL catalogs internationally, an increasea decrease from 1.12.4 million in fiscal year 2010.2011. We typically distribute several versions of our catalog each year with approximately half the catalogs being distributed during our fourth quarter. In fiscal year 2011,2012, we utilized our new CRMcustomer relationship management database to optimize
and reduce our global circulation strategy, resulting in higher incremental sales and profitability. We view our catalogs as a key communication and advertising tool for the FOSSIL brand, further enhancing and focusing the brand image, as well as promoting sales across all of our distribution channels.
During fiscal years 2012, 2011 and 2010, our Direct to consumer segment, which includes sales from Company-owned stores, catalogs and e-commerce businesses, accounted for approximately 25.0%, 23.7% and 23.8% of consolidated net sales, respectively.
Facilitating our wholesale distribution
We utilize an in-house sales staff and, to a lesser extent, independent sales representatives to promote the sale of our products to retail accounts. Our in-house sales personnel receive a salary and, in some cases, a commission based on a percentage of sales attributable to specified accounts. Independent sales representatives generally do not sell competing product lines and are under contracts with us that are generally terminable by either party upon 30notice ranging from 15 days notice.to six months. These independent contractors are primarily compensated on a commission basis.
We have developed an approach to managing the retail sales process that involves monitoring our customers’customers' sales and inventories by product category and style, primarily through electronic data interchange. We review weekly selling and inventory information to ensure our products are properly stocked and replenished on a timely basis. We also assist many of our customers in the conception, development and implementation of their marketing programs. We also participate in cooperative advertising programs with our major retail customers. We believe that management of the retail sales process has resulted in close relationships with our principal wholesale customers, often allowing us to influence the mix, quantity and timing of their purchasing decisions.
We believe that our sales approach has historically accounted for high retail turnover in our products, which can result in attractive profit margins for our wholesale customers. We believe that the resulting profit margins for our wholesale customers encourage them to devote greater selling space to our products within their stores. We are also able to work closely with buyers for our wholesale customers in determining the mix of products a store should carry. In addition, we believe that the buyers’buyers' familiarity with our sales approach has facilitated, and should continue to facilitate, the introduction of new products through our existing distribution network.
We permit the return of damaged or defective products. In addition, although we have no obligation to do so, we accept limited amounts of product returns from our wholesale customers in other instances. Accordingly, we provide allowances for the estimated amount of product returns. The allowances for product returns as of the end of fiscal years 2012, 2011 and 2010 and 2009 were $65.3 million, $61.6 million $62.7 million and $40.0$62.7 million, respectively. We have not historically experienced returns in excess of our aggregate allowances.
18
Backlog
It is the practice of a substantial number of our customers not to confirm orders by delivering a formal purchase order until a relatively short time prior to the shipment of goods. As a result, the amount of unfilled customer orders includes confirmed orders and orders that we believe will be confirmed by delivery of a formal purchase order. A majority of such amounts represent orders that have been confirmed. The remainder of such amounts represents orders that we believe, based on industry practice and prior experience, will be confirmed in the ordinary course of business. Our backlog at a particular time is affected by a number of factors, including seasonality and the scheduling of the manufacture and shipment of our products. Accordingly, a comparison of backlog from period to period is not necessarily meaningful and may not be indicative of eventual actual shipments. At the end of fiscal year 2011,2012, we had unfilled customer orders of approximately $112.6$203.0 million compared to $137.8$112.6 million and $82.4$137.8 million at the end of fiscal years 2011 and 2010, and 2009, respectively.
Manufacturing
During fiscal 2011,2012, more than 60% of the watches we procured from the Far EastAsia were assembled through our two majority-owned entities. The remaining watches we procured from the Far EastAsia were assembled by approximately 4850 unrelated factories located primarily in Hong Kong and China, which includes almost all the production and assembly of our digital and mass market watches. During fiscal year 2011, production2012, our Swiss-made watches were assembled primarily in three third-party factories in Switzerland. During fiscal year 2012, approximately 60% of approximately 52% of theour jewelry products we sell were sourced frommanufactured by one of our majority-owned entities. The remaining 48%40% of theour jewelry products we sell were manufactured by approximately 2325 factories located primarily in China. Although we have no ownership interest in these unrelated watch and jewelry factories, Fossil East maintains oversight and control of the supply chain from design through final delivery of the finished product as it does with our related factories. We believe substantial ownership of the assembly factories that produce a majority of our fashion watches and jewelry is critical to our operating model, as we believe this allows us to keep our designs proprietary, control the size of our production runs and vertically manage our supply chain. During fiscal year 2011, all of the manufacturing of our handbags, small leather goods, belts, sunglasses, shoes and clothing was outsourced. We believe that our policy of outsourcing the production of these product categories allows us flexibility in selecting our suppliers while avoiding significant capital expenditures, build-ups of work-in-process inventory and the costs of managing a substantial production work force. During fiscal year 2011, our Swiss-made watches were assembled primarily in three third-party factories in Switzerland.
The principal components used in the assembly of our watches are cases, crystals, dials, movements, hands, bracelets and straps. These components are obtained from a large number of suppliers located principally in China, Hong Kong, India, Italy, Japan, South Korea, Switzerland Taiwan and Thailand. The majority of the movements, cases, dials, bracelets and hands used in the assembly of our watches are supplied by seven principal vendors. During fiscal years 2012, 2011 2010 and 2009,2010, one vendor was responsible for supplying approximately 31%28%, 28%31% and 30%28% of our case and bracelet components, respectively. Additionally, two vendors were responsible for supplying approximately 85%88%, 81%85% and 75%81% of our movements in fiscal years 2012, 2011 2010 and 2009,2010, respectively. The principal materials used in the manufacture of our jewelry products are base metals, stainless steel, sterlingsemi-precious stones or silver semiprecious stones, and natural and synthetic materials.jewelry with 18K gold plating on top. These components are primarily obtained from the same factories that we use for our watches. Except for the one case and bracelet vendor and the two movement vendors noted above, we do not believe that our business is materially dependent on any single component supplier.
We believe that we have established and maintain close relationships with a number of component manufacturers and assembly factories primarily located in Hong Kong, China and Switzerland. The loss of any one of these manufacturers could temporarily disrupt shipments of certain of our watch and jewelry products. In addition, we believe that losing one or more of the watch assembly factories or jewelry manufacturers could have a material impact on our ability to source these products and meet our sales plans. Our future success will generally depend upon our ability to maintain close relationships with, or ownership of, our current watch assembly and jewelry manufacturing factories and to develop long-term relationships with other manufacturers that satisfy our requirements for price, quality and production flexibility.
During fiscal year 2012, all of the manufacturing of our handbags, small leather goods, belts, sunglasses and clothing was outsourced. We believe that our policy of outsourcing the production of these product categories allows us flexibility in selecting our suppliers while avoiding significant capital expenditures, build-ups of work-in-process inventory and the costs of managing a substantial production work force. We have a Code of Conduct for Manufacturers ("Manufacturer Code") that sets forth the corporate responsibility requirements for our suppliers, including compliance with international labor and human rights standards and environmental laws and regulations. Before supplying products to us, our manufacturers sign an agreement that includes a commitment to abide by our Manufacturer Code. For more information on our Manufacturer Code, see "Code of Conduct for Manufacturers."
Our products are assembled or manufactured according to plans that reflect management’smanagement's estimates of product performance based on recent sales results, current economic conditions and prior experience with
19
manufacturing sources. The average lead time from the commitment to purchase
products through the production and shipment thereof ranges from two to four months for our watches, leather goods, jewelry, eyewearsunglasses and clothing. We believe that the close relationships, including ownership interests in some cases, we have established and maintain with our principal assembly or manufacturing sources constitute a significant competitive advantage and allow us to quickly and efficiently introduce innovative product designs and alter production in response to the retail performance of our products.
Code of Conduct for Manufacturers
We are committed to ethical and responsible conduct in all of our operations and respect for the rights of all individuals. We strive to ensure that human rights are upheld for all workers involved in our supply chain, and that individuals experience safe, fair and non-discriminatory working conditions. In addition, we are committed to compliance with applicable environmental requirements and are committed to seeing that all of our products are manufactured and distributed in compliance with applicable environmental laws and regulations. We expect that our business partners will share these commitments, which we enforce through our Manufacturer Code.
Our Manufacturer Code specifically requires our manufacturers to not use child, forced or involuntary labor and to comply with applicable environmental laws and regulations. We provide training to our factories related to the Manufacturer Code and the applicable laws in the country in which the factory is located. The training provides the factories with a more in-depth explanation of the Manufacturer Code.
In addition to the contractual obligation, we evaluate our suppliers' compliance with the Manufacturer Code through audits conducted both by our employees and third party compliance auditing firms. In most cases, the audits are announced. If we believe that a supplier is failing to live up to the standards of the Manufacturer Code, we may terminate the supplier or provide the supplier with an opportunity to remedy the non-compliance through the implementation of a corrective action plan. For those suppliers on a corrective action plan, we will work with the supplier as necessary to help them understand the non-compliance and provide advice on how to remedy the non-compliance. We usually conduct a follow-up audit to confirm compliance after the implementation of the corrective action plan. Should the supplier continue to fail to meet our standards, we may seek to eliminate such supplier from our supply chain.
Quality control
Our quality control program attempts to ensure that our products meet the standards established by our product development staff. Samples of products are inspected by us prior to placing orders with factories to ensure compliance with our technical design specifications. We also typically inspect "top of production" prototypes of each product before commencing production. The operations of our Hong Kong and Chinese factories are monitored on a periodic basis by Fossil East, and the operations of our Swiss factories are monitored on a periodic basis by Montres Antima SA, one of our foreign operating subsidiaries. Substantially all of our watches, jewelry and certain of our other accessories are inspected by personnel of Fossil East or by the assembly/manufacturing facility prior to shipment to us.our distribution centers. Final inspections, on a sampling basis, occur when the products are received in our distribution centers. We believe that our policy of inspecting our products at the assembly/manufacturing facility, upon receipt at our distribution facilities and prior to shipment to our customers is important to maintain the quality, consistency and reputation of our products.
Distribution
Upon completion of assembly/manufacturing, the majority of our products are shipped to one of our warehousing and distribution centers in Texas, Germany or Hong Kong, from which they are
shipped to subsidiary warehouses in the case of our Mexico, Scandinavia and Far East operations, or directly to customers in selected markets. Our centralized warehouse and distribution facilities in Texas and Germany allow us to maximize our inventory management and distribution capabilities and more readily meet the varying distribution requirements placed on us by our customers at a lower cost. Our facilities in Texas and Germany are equipped with automated material handling equipment operated by world-class software from SAP and Manhattan Associates. The automated equipment and operating systems, in conjunction with the continual manual sampling of our outgoing orders prior to shipment, are important in maintaining the quality, accuracy, speed and reputation of our products and distribution service.
Our warehouse and distribution facilities in Texas operate in a special purpose sub-zone established by the U.S. Department of Commerce Foreign Trade Zone Board. This sub-zone provides the following economic and operational advantages to us: (i) we do not have to pay duty on imported merchandise until it leaves the sub-zone and enters the U.S. market, (ii) we do not have to pay any U.S. duty on merchandise if the imported merchandise is subsequently shipped to locations outside the U.S. and (iii) we do not have to pay local property tax on inventory located within the sub-zone.
Information technology systems
General.We believe that automation, reliable and scalable systems, accurate reporting and rapid flow of communication is essential to maintain our competitive position and support our key operating and financial goals. Therefore, we continue to invest in computer hardware, system applications and telecommunication networks. Our information technology systems consist of a wide spectrum of financial, distribution, human resources, merchandising, planning, point of sale, supply chain and other solutions. Where possible and cost effective, we leverage our various systems on a global basis, which enhances the accuracy, timeliness and accessibility of the relevant data.
Inventory control.We maintain inventory control systems at our facilities that enable us to track each product from the time it is shipped from our factory through shipment to our customers, or consumer in the case
20
of our retail stores, concessions and websites. To facilitate this tracking, a significant number of products sold by us are pre-ticketed and bar coded. Our inventory control systems report shipping, sales and individual stock keeping unit level inventory information. We manage the retail sales process by monitoring customer sales and inventory levels of our products by product category and style, primarily through electronic data interchange. We believe that our distribution capabilities enable us to reduce inventory risk and increase flexibility in responding to the delivery requirements of our customers. Our management believes that our electronic data interchange efforts will continue to grow in the future as customers focus further on increasing operating efficiencies. In addition, we maintain systems that are designed to track inventory movement through our Company-owned stores. Detailed sales transaction records are accumulated on each store’sstore's point-of-sale system and polled by us.
Enterprise resource planning.We have implemented SAP ERP in our U.S. operations and throughout most of Europe except for our smaller business in Scandinavia.Europe. This software is installed on a single site platform located in our U.S. headquarters facility. The software currently supports the human resources, sales and distribution, inventory planning, retail merchandising and operational and financial reporting systems of our U.S. businesses and allmost subsidiary operations in Europe except for our subsidiaries in Scandinavia. The financial, sales and distribution, inventory planning and reporting system implementations were principally completed in the U.S., Germany, France, Italy, the United Kingdom and Switzerland during fiscal years 2003, 2004, 2005, 2008, 2010 and 2011, respectively. The human resources and retail systems were implemented for our operations in the U.S. during fiscal years 2005 and 2007, respectively.Europe. We do not believe our subsidiary sales operations in the Far EastAsia are of a size at this time to effectively benefit from our SAP software application. However, in fiscal 2009, we implemented our SAP financial, planning and warehouse management modules in Hong Kong to provide efficiencies to further support our regional warehouse in Hong Kong and the related supply chain associated with our local country operations, including our Company-owned retail stores throughout Asia. We have implemented Navision as our standard system throughout most of our Far EastAsia distribution and manufacturing subsidiary operations. The Navision system supports many of the same functions as our SAP system on a local country level.
Data securitysecurity.. Our business involves the receipt and storage of personal information about customers and employees, the protection of which is critical to us. If we experience a significant breach of customer or employee data it could attract a substantial amount of media attention, damage the Company’sour customer relationships and reputation and result in lost sales, fines, or lawsuits. Our Audit Committee annually reviews our data security risks, and we have obtained insurance liability coverage for certain data security or privacy breaches.
Warranty and repair
Our FOSSIL watch products sold in the U.S. are covered by a limited warranty against defects in materials or workmanship for a period of 11 years from the date of purchase. Our RELIC watch products sold in the U.S. are covered by a comparable 12 year warranty while other watches sold by us in the U.S. are covered by a comparable two year limited warranty. SKAGEN branded watches are covered by a lifetime warranty against defects due to faulty material or workmanship, subject to normal conditions of use. Generally, all of our watch products sold in Canada, Europe and Asia are covered by a comparable two year limited warranty. The majority of our defective watch products returned by consumers in North America are processed at our repair facilities in Texas while defective watch products returned by consumers in Europe are processed at our repair facilities in France. We also maintain repair facilities at a majority of our subsidiaries, as well as through our network of third-party distributors to handle repairs which are minor in nature or are not convenient to one of our centralized repair facilities. In most cases, defective products under warranty are repaired by our personnel or third-party distributors. We attempt to retain adequate levels of component parts to facilitate after-sales service of our watches, even after specific styles are discontinued. We have a component parts system that tracks the inventory of our various component replacement parts that can be utilized by our repair facilities for identifying stock levels and availability for procurement. Watch and non-watch products under warranty that cannot be repaired in a cost-effective manner are replaced by us at no cost to the customer. Our warranty liability at the end of fiscal years 2012, 2011 and 2010 and 2009 was $13.4 million, $11.0 million $8.5 million and $6.4$8.5 million, respectively. In fiscal years 2012, 2011 2010 and 2009,2010, repair services accounted for approximately 0.8%0.9%, 0.8% and 0.9%0.8%, respectively, of our consolidated net sales.
21
Governmental regulations
Imports and import restrictions.Most of our products are assembled or manufactured overseas. As a result, the U.S. and countries in which our products are sourced or sold may from time to time modify existing or impose new quotas, duties (including antidumping or countervailing duties), tariffs or other restrictions in a manner that adversely affects us. For example, our products imported to the U.S. are subject to U.S. customs duties and, in the ordinary course of our business, we may from time to time be subject to claims by the U.S. Customs Service for duties and other charges. Factors that may influence the modification or imposition of these restrictions include the determination by the U.S. Trade Representative that a country has denied adequate intellectual property rights or fair and equitable market access to U.S. firms that rely on intellectual property, trade disputes between the U.S. and a country that leads to withdrawal of “most"most favored nation”nation" status for that country and economic and political changes within a country that are viewed unfavorably by the U.S. government. We cannot predict the effect, if any, these events would have on our operations, especially in light of the concentration of our assembly and manufacturing operations in Hong Kong and China.
General.Our sunglass products We are subject to regulation bylaws regarding customs, tax, employment, privacy, truth-in-advertising, consumer product safety, zoning and occupancy and other laws and regulations that regulate and/or govern the U.S. Foodimportation, promotion and Drug Administration as medical devices,sale of consumer products and certain of our dialscorporate, retail and watch straps are subject to regulation by the U.S. Fish and Wildlife Service. In addition, we are subject to various state and federal regulations generally applicable to similar businesses.distribution operations.
Intellectual property
Trademarks.We use our FOSSIL, MICHELE, RELIC, MICHELESKAGEN and ZODIAC trademarks, as well as other trademarks on certain of our watches, leather goods, clothing and other fashion accessories in the U.S. and in a significant number of foreign countries. We have taken steps to establish or provide additional protection for our trademarks by registering or applying to register our trademarks for relevant classes of products in each country where our products are sold in addition to certain foreign countries where it is our intent to market our products in the future. Each registered trademark may be renewable indefinitely, so long as we continue to use the mark in the applicable jurisdiction and make the appropriate filings when required. We aggressively protect our trademarks and trade dress and pursue infringement both domestically and internationally. We also pursue counterfeiters both domestically and internationally through leads generated internally, as well as through our business partners worldwide. In certain cases, we track serial numbers of our products or we etch microscopic identification markings on certain of our watches in order to identify potential customers who might be diverting product into a parallel market.
Patents.We continue to explore innovations in the design and assembly of our watch products. As a result, we have been granted, and have pending, various U.S. and international design and utility patents related to certain of our watch designs and features. We also have been granted, and have pending, various U.S. patents related to certain of our other products and technologies. The expiration dateAs of December 29, 2012, none of our twopatents were material U.S. patents is April 12, 2019.to our business.
License agreements.A significant portion of our growth in sales and net income is, and is expected to continue to be, derived from the sales of products produced under licensing agreements with third-parties. Under these license agreements, we generally have the right to produce, market and distribute certain products utilizing the brand names of other companies. Our significant license agreements have various expiration dates between 2013 and 2017. In 2011, we announcedentered into an exclusive global licensing agreement with Karl Lagerfeld for watches, which are expected to launchlaunched worldwide in the first quarter of 2013. In February 2013, we announced an exclusive global licensing agreement with Tory Burch for watches, which are expected to launch worldwide in late 2014.
Seasonality
Although the majority of our products are not seasonal, our business is seasonal by nature. A significant portion of our net sales and operating income is generated during the third and fourth quarters of our fiscal year, which includes the “back"back to school”school" and Christmas seasons. Additionally, as our directDirect to consumer segment sales
22
continue to increase as a percentage of our sales mix, they will benefit our sales and profitability in our fiscal fourth quarter, generally at the expense of our fiscal first and second quarters when it is more difficult to leverage our Direct to consumer segment expenses against our Direct to consumer segment sales. The amount of net sales and operating income generated during our fiscal fourth quarter also depends upon the anticipated level of retail sales during the Christmas season, as well as general economic conditions and other factors beyond our control. In addition, the amount of net sales and operating income generated during our fiscal first quarter depends in part upon the actual level of retail sales during the Christmas season. Lower levels of inventory held by our wholesale customers at the end of the Christmas season may result in higher levels of restocking orders placed by them during our fiscal first quarter.
Competition
The businesses in which we compete are highly competitive and fragmented. We believe that the current market for watches can be divided into four segments, ranging from lower price point watches that are typically distributed through mass market channels to luxury watches at higher price points that are typically distributed through fine watch departments of upscale department stores or upscale specialty watch and fine jewelry stores. Our watch business generally competes in these segments with a number of established manufacturers, importers and distributors, including Armitron, Citizen, Gucci, Guess?, Kenneth Cole, LVMH Group, Movado, Raymond Weil, Seiko, Swatch, Swiss Army, TAG Heuer and Timex. In addition, our leather goods, sunglasses, jewelry and clothing businesses compete with a large number of established companies that have significantly greater experience than us in designing, developing, marketing and distributing such products. In all of our businesses, we compete with numerous manufacturers, importers and distributors who may have significantly greater financial, distribution, advertising and marketing resources than us. Our competitors include distributors that import watches, accessories and clothing from abroad, U.S. companies that have established foreign manufacturing relationships and companies that produce accessories and clothing domestically.
Although the level and nature of competition varies among our product categories and geographic regions, we believe that we compete on the basis of style, price, value, quality, brand name, advertising, marketing, distribution and customer service. We believe that our ability to identify and respond to changing fashion trends and consumer preferences, to maintain existing relationships and develop new relationships with manufacturing sources, to deliver quality merchandise in a timely manner and to manage the retail sales process are important factors in our ability to compete. We also believe that our distinctive business model of owning the distribution in many key markets and offering a globally recognized portfolio of proprietary and licensed-branded products allows for many competitive advantages over smaller, regional or local competitors. This “ownership"ownership of the market”market" allows us in certain countries to bypass the local distributor’sdistributor's cost structure resulting in more competitively priced products while also generating higher product and operating margins.
We believe the risk of significant new competitors is mitigated to some extent by barriers to entry such as high startup costs and the development of long-term relationships with customers and manufacturing sources. During the past few years, it has been our experience that better department stores and other major retailers have been increasingly unwilling to purchase products from suppliers who are not well capitalized or do not have a demonstrated ability to deliver quality merchandise in a timely manner. There can be no assurance, however, that significant new competitors will not emerge in the future.
Employees
As of the end of fiscal year 2011,December 29, 2012, we employed approximately 13,10014,000 persons, including approximately 7,4007,200 persons employed by our foreign operating subsidiaries.
None of our domestic or foreign-based employees are represented by a trade union. However, certain European-based employees are represented by work councils, which include certain of our current employees who negotiate with management on behalf of all the employees. We have never experienced a work stoppage and consider our working relationship with our employees and work councils to be good.
23
The statements contained and incorporated by reference in this Annual Report on Form 10-K that are not historical facts, including, but not limited to, statements regarding our expected financial position, results of operations, business and financing plans found in Item 1. Business and Item 7. Management’sManagement's Discussion and Analysis of Financial Condition and Results of Operations, constitute forward-looking statements within
the meaning of the Private Securities Litigation Reform Act of 1995 and involve a number of risks and uncertainties. The words “may”"may", “believes”"believes", “expects”"expects", “plans”"plans", “intends”"intends", “anticipates”"anticipates" and similar expressions identify forward-looking statements. The actual results of the future events described in such forward-looking statements could differ materially from those stated in such forward-looking statements.
Our actual results may differ materially due to the risks and uncertainties discussed in this Annual Report on Form 10-K, including those discussed below. Accordingly, readers of this Annual Report on Form 10-K should consider these factors in evaluating, and are cautioned not to place undue reliance on, the forward-looking statements contained herein. We undertake no obligation to update or revise publicly any forward-looking statements, whether as a result of new information, future events or otherwise, except as required by law.
Risk Factors Relating to Our Business
The deterioration in the global economic environment, and resulting declines in consumer confidence and spending, could have an adverse effect on our operating results.
The global economic environment has been challenging during the past several years. DecliningDepressed real estate values, reduced lending by banks, solvency concerns of major financial institutions and certain foreign countries increases inand high levels of unemployment levels and significant volatility in the global financial markets have negatively impacted the level of consumer spending for discretionary items. This has affected our business as it is dependent on consumer demand for our products. In certain countries in which we distribute our products, we experienced a significant slowdown in customer traffic and a highly promotional environment during late 2008 and most of 2009. Although we have experiencedseen a slight improvement in the overall economy recently, ifglobal economic conditions, particularly in Europe, remain fragile, and the economy deterioratespossibility remains that the domestic or slides back intoglobal economies, or certain industry sectors of those economies that are key to our sales, may continue to be slow or could further deteriorate, which could result in a recession, there could likely be a negative effect oncorresponding decrease in demand for our revenuesproducts and earnings across mostnegatively impact our results of operations and financial condition. In particular, during fiscal 2012, we derived 24.4% of our segments for fiscal year 2012.net sales from our Europe wholesale segment. Any adverse change in the European economy could materially impact our net sales.
The effects of economic cycles, terrorism, acts of war and retail industry conditions may adversely affect our business.
Our business is subject to economic cycles and retail industry conditions. Purchases of discretionary fashion accessories, such as our watches, handbags, sunglasses and other products, tend to decline during recessionary periods when disposable income is low and consumers are hesitant to use available credit. In addition, acts of terrorism, acts of war and military action both in the U.S. and abroad can have a significant effect on economic conditions and may negatively affect our ability to procure our products from manufacturers for sale to our customers. Any significant declines in general economic conditions, public safety concerns or uncertainties regarding future economic prospects that affect consumer spending habits could have a material adverse effect on consumer purchases of our products.
Our success depends upon our ability to anticipate and respond to changing fashion trends.
Our success depends upon our ability to anticipate and respond to changing fashion trends and consumer preferences in a timely manner. The purchasing decisions of consumers are highly subjective and can be influenced by many factors, such as brand image, marketing programs and product design. Our success depends, in part, on our ability to anticipate, gauge and respond to these changing consumer preferences in a timely manner while preserving the authenticity and the quality of our brands. Although we attempt to stay abreast of emerging lifestyle and fashion trends affecting accessories and clothing, any failure by us to identify and respond to such trends could adversely affect consumer acceptance of our existing brand names and product lines, which
24
in turn could adversely
affect sales of our products. If we misjudge the market for our products, we may be faced with a significant amount of unsold finished goods inventory, which could adversely affect our results of operations.
The loss of any of our license agreements, pursuant to which a number of our products are produced, may result in the loss of significant revenues and may adversely affect our business.
A significant portion of our growth in sales and net income is, and is expected to continue to be, derived from the sales of products produced under license agreements with third-parties.third parties. Under these license agreements, we generally have the right to produce, market and distribute certain products utilizing the brand names of other companies. We sell products under certain licensed brands, including, but not limited to, ADIDAS, ARMANI EXCHANGE, BURBERRY, DIESEL, DKNY, EMPORIO ARMANI, MARC BY MARC JACOBS and MICHAEL KORS. Sales of our licensed products amounted to 44.7%47.4% of our consolidated net sales for fiscal year 2011, with certain individual licensed brands accounting for a2012. Our significant portion of our revenues. Our material license agreements have various expiration dates between 2013 and 2017. In addition, certain license agreements may require us to make minimum royalty payments, subject us to restrictive covenants or require us to comply with certain other obligations and may be terminated by the licensor if these or other conditions are not met or upon certain events. We may not be able to continue to meet our obligations or fulfill the conditions under these agreements in the future. In addition, we may be unable to renew our existing license agreements beyond the current term or obtain new license agreements to replace any lost license agreements on similar economic terms or at all. The failure by us to maintain or renew one or more of our existing material license agreements could result in a significantmeaningful decrease in our sales and have a material adverse affecteffect on our results of operations.
Certain key components in our products come from limited sources of supply, which exposes us to potential supply shortages that could disrupt the manufacture and sale of our products.
We and our contract manufacturers currently purchase a number of key components used to manufacture our products from limited sources of supply for which alternative sources may not be readily available. Any interruption or delay in the supply of any of these components could significantly harm our ability to meet scheduled product deliveries to our customers and cause us to lose sales. Interruptions or delays in supply may be caused by a number of factors that are outside of our and our contractor manufacturers’manufacturers' control, such as natural disasters like the recentMarch 2011 earthquake and tsunami in Japan. In addition, the purchase of these components on a limited source basis subjects us to risks of price increases and potential quality assurance problems. An increase in the cost of components could make our products less competitive and result in lower gross margins. In the event that we can no longer obtain materials from these limited sources of supply, we might not be able to qualify or identify alternative suppliers in a timely fashion. Any extended interruption in the supply of any of the key components currently obtained from a limited source or delay in transitioning to a replacement supplier could disrupt our operations and significantly harm our business in any given period. If our supply of certain components is disrupted, our lead times are extended or the cost of our components increases, our business, operating results and financial condition could be materially affected.
Our success depends upon our ability to continue to develop innovative products.
Our success also depends upon our ability to continue to develop innovative products in the respective markets in which we compete. If we are unable to successfully introduce new products, or if our competitors introduce superior products, customers may purchase increasing amounts of products from our competitors, which could adversely affect our sales and results of operations.
25
We are subject to laws and regulations in the U.S. and the many countries in which we operate. Violations of laws and regulations, or changes to existing laws or regulations, could have a material adverse effect on our financial condition or results of operations.
Our operations are subject to domestic and international laws and regulations in a number of areas, including, but not limited to, labor, advertising, consumer protection, real estate, product safety, e-commerce, promotions, intellectual property, tax, import and export, anti-corruption, foreign exchange controls and cash repatriation, data privacy, anti-competition, environmental, health and safety. Compliance with these numerous laws and regulations is complicated, time consuming and expensive, and the laws and regulations may be inconsistent from jurisdiction to jurisdiction, further increasing the difficulty of, and cost to comply with them. New laws and regulations, or changes to existing laws and regulations, could individually or in the aggregate make our products more costly to produce, delay the introduction of new products in one or more regions, cause us to change or limit our business practices, or affect our financial condition and results of operations. We have implemented policies and procedures designed to ensure compliance with the numerous laws and regulations affecting our business, but there can be no assurance that our employees, contractors, or agents will not violate such laws, regulations or our policies related thereto. Any such violations could have a material adverse effect on our financial condition or operating results.
Reduced lending by banks could have a negative impact on our customers, suppliers and business partners, which in turn could materially and adversely affect our results of operations and liquidity.
The reduction in lending by banks is havinghas had, and may continue to have, a significant negative impact on businesses around the world. Although we believe that our cash provided by operations and available borrowing capacity under our U.S. credit facility will provide us with sufficient liquidity for the foreseeable future, the impact of reduced lending on our customers, business partners and suppliers cannot be predicted and may be quite severe. The inability of our manufacturers to ship our products could impair our ability to meet delivery date requirements. A disruption in the ability of our significant customers, distributors or licensees to access liquidity could cause serious disruptions or an overall deterioration of their businesses, which could lead to a significant reduction in their future orders of our products and the inability or failure on their part to meet their payment obligations to us, any of which could have a material adverse effect on our financial condition and results of operations and liquidity.
Seasonality of our business may adversely affect our net sales and operating income.
Our quarterly results of operations have fluctuated in the past and may continue to fluctuate as a result of a number of factors, including seasonal cycles, the timing of new product introductions, the timing of orders by our customers and the mix of product sales demand. Our business is seasonal by nature. A significant portion of our net sales and operating income are generated during the third and fourth quarters of our fiscal year, which includes the “back"back to school”school" and Christmas seasons. The amount of net sales and operating income generated during our fiscal fourth quarter depends upon the anticipated level of retail sales during the Christmas season, as well as general economic conditions and other factors beyond our control. In addition, the amount of net sales and operating income generated during our fiscal first quarter depends in part upon the actual level of retail sales during the Christmas season. The seasonality of our business may adversely affect our net sales and operating income during the first and fourth quarters of our fiscal year.
A privacy breach could result in negative publicity and adversely affect our business.
Our business involves the receipt and storage of personal information about customers and employees, the protection of which is critical to us. Our customers also have a high expectation that we will adequately protect their personal information. Personal information is highly regulated at the
international, federal and state level. If we experience a significant breach of customer or employee data it could attract a substantial amount of media attention, damage the Company’sour customer relationships and reputation and result in lost sales, fines, or lawsuits.
26
Our plan to significantly increase our store base may not be successful, and implementation of this plan may divert our operational, managerial and administrative resources, which could impact our competitive position.
Each year, we have historically expanded our store base. During fiscal year 2012,2013, we intend to further expand our store base by opening approximately 70 to 75 new stores globally and close approximately 1812 stores. Thereafter, in the near term, we plan to continue to expand our store base annually. The success of our business depends, in part, on our ability to open new stores and renew our existing store leases on terms that meet our financial targets. Our ability to open new stores on schedule or at all, to renew existing store leases on favorable terms or to operate them on a profitable basis will depend on various factors, including our ability to:
Our plans to expand our store base may not be successful and the implementation of these plans may not result in an increase in our net sales even though they increase our costs. Additionally, implementing our plans to expand our store base will place increased demands on our operational, managerial and administrative resources. The increased demands of operating additional stores could cause us to operate less effectively, which could cause the performance of our existing stores and our wholesale operations to suffer materially. Any of these outcomes of our attempted expansion of our store base could have a material adverse effect on the amount of net sales we generate and on our financial condition and results of operations.
We have key facilities in the U.S. and overseas, the loss or shut down of any of which could harm our business.
Our administrative, information technology and distribution operations in the U.S. are conducted primarily from two separate facilities located in the Dallas, Texas area. Our operations internationally are conducted from various administrative, distribution and assembly facilities outside of the U.S., particularly in China, Germany, Hong Kong and Switzerland. The complete or temporary loss of use of all or part of these facilities could have a material adverse effect on our business.
Our warehouse and distribution facilities in the Dallas, Texas area are operated in a special purpose sub-zone established by the U.S. Department of Commerce Foreign Trade Zone Board. Although the sub-zone allows us certain tax advantages, the sub-zone is highly regulated by the U.S. Customs Service. This level of regulation may cause disruptions or delays in the distribution of our products out of these facilities. Under some circumstances, the U.S. Customs Service has the right to shut down the entire sub-zone and, therefore, our entire warehouse and distribution facilities. During
the time that the sub-zone is shut down, we may be unable to adequately meet the supply requests of our customers and our Company-owned retail stores, which could have an adverse effect on our sales, relationships with our customers, and results of operations, especially if the shutdown were to occur during our third or fourth quarter.
27
Our ability to grow our sales is dependent upon the implementation of our growth strategy, which we may not be able to achieve.
Since our public offering in 1993, we have experienced substantial growth in net sales. Our ability to continue this growth is dependent on the successful implementation of our business strategy. This includes diversification of our product offerings, expansion of our Company-owned accessorystore locations and strategic acquisitions. If we are not successful in the expansion of our product offerings or our new products are not profitable or do not generate sales comparable to those of our existing businesses, our results of operations could be negatively impacted. Another element of our business strategy is to place increased emphasis on growth in selected international markets. If our brand names and products do not achieve a high degree of consumer acceptance in these markets, our net sales could be adversely affected.
We also operate FOSSIL brand stores and other non-FOSSIL branded stores and have historically expanded our Company-owned accessory and outlet locations to further strengthen our brand image. As of December 31, 2011,29, 2012, we operated 398473 stores worldwide. The costs associated with leasehold improvements to current stores and the costs associated with opening new stores could materially increase our costs of operation.
We have recently expanded and intend to further expand the scope of our product offerings, and new products introduced by us may not achieve consumer acceptance comparable to that of our existing product lines.
We have recently expanded and intend to further expand the scope of our product offerings. As is typical with new products, market acceptance of new designs and products is subject to uncertainty. In addition, we generally make decisions regarding product designs several months in advance of the time when consumer acceptance can be measured. If trends shift away from our products, or if we misjudge the market for our product lines, we may be faced with significant amounts of unsold inventory or other conditions which could have a material adverse effect on our financial condition and results of operations.
The failure of new product designs or new product lines to gain market acceptance could also adversely affect our business and the image of our brands. Achieving market acceptance for new products may also require substantial marketing efforts and expenditures to generate consumer demand. These requirements could strain our management, financial and operational resources. If we do not continue to develop innovative products that provide better design and performance attributes than the products of our competitors and that are accepted by consumers, or if our future product lines misjudge consumer demands, we may lose consumer loyalty, which could result in a decline in our sales and market share.
Our business could be harmed if we fail to maintain proper inventory levels.
We maintain an inventory of selected products that we anticipate will be in high demand. We may be unable to sell the products we have ordered in advance from manufacturers or that we have in our inventory. Inventory levels in excess of customer demand may result in inventory write-downs or the sale of excess inventory at prices below our standard levels. These events could significantly harm our operating results and impair the image of our brands. Conversely, if we underestimate consumer demand for our products or if our manufacturers fail to supply quality products in a timely manner, we may experience inventory shortages, which might result in unfilled orders, negatively impact customer relationships, diminish brand loyalty and result in lost revenues, any of which could harm our business.
Our license agreements may require minimum royalty commitments regardless of the level of product sales under these agreements.
Under our license agreements, we have in the past experienced, and could again in the future experience, instances where our minimum royalty commitments exceeded the royalties payable based upon our sales of the licensed products. We incurred royalty expensePayments of approximately $160.2 million, $109.4 millionminimum royalties in excess of the royalties based on our sales of the licensed products reduces our margins and $73.9
28
million in fiscal years 2011, 2010 and 2009, respectively. We also have agreements in effect at the endcould adversely affect our results of fiscal year 2011 which expire on various dates between fiscal years 2013 and 2017 that require us to pay royalties ranging from 4% to 20% of defined net sales.operations.
Fluctuations in the price, availability and quality of raw materials could cause delays and increase costs.
Fluctuations in the price, availability and quality of the raw materials used in our products could have a material adverse effect on our cost of sales or ability to meet our customers’customers' demands. The price and availability of such raw materials may fluctuate significantly, depending on many factors, including natural resources, increased freight costs, increased labor costs, especially in China, and weather conditions. In the future, we may not be able to pass on all, or a portion of, such higher raw materials prices to our customers.
We rely on third-party assembly factories and manufacturers and problems with, or loss of, our assembly factories or manufacturing sources could harm our business and results of operations.
The majority of our watch products are currently assembled, and a majority of our jewelry products are manufactured, to our specifications by our majority-owned entities in China with the remainder assembled or manufactured by independent entities. All of our clothing, shoes, sunglasses, handbags, small leather goods, belts and soft accessories are produced by independent manufacturers. We have no long-term contracts with these independent assembly factories or manufacturers and compete with other companies for production facilities. All transactions between us and our independent assembly factories or manufacturers are conducted on the basis of purchase orders. We face the risk that these independent assembly factories or manufacturers may not produce and deliver our products on a timely basis, or at all. As a result, we cannot be certain that these assembly factories or manufacturers will continue to assemble or manufacture products for us or that we will not experience operational difficulties with our manufacturers, such as reductions in the availability of production capacity, errors in complying with product specifications, insufficient quality control, shortages of raw materials, failures to meet production deadlines or increases in manufacturing costs. Our future success will depend upon our ability to maintain close relationships with, or ownership of, our current independent assembly factories and manufacturers and to develop long-term relationships with other manufacturers that satisfy our requirements for price, quality and production flexibility. Our ability to establish new manufacturing relationships involves numerous uncertainties, including those relating to payment terms, costs of manufacturing, adequacy of manufacturing capacity, quality control and timeliness of delivery. Any failure by us to maintain long-term relationships with, or ownership of, our current assembly factories and manufacturers or to develop relationships with other manufacturers could have a material adverse effect on our ability to manufacture and distribute our products.
If an independent manufacturer or license partner of ours fails to use acceptable labor practices or otherwise comply with laws, our business could suffer.
We have no control over the ultimate actions or labor practices of our independent manufacturers. The violation of labor or other laws by one of our independent manufacturers, or by one of our license partners, or the divergence of an independent manufacturer’smanufacturer's or license partner’spartner's labor practices from those generally accepted as ethical in the U.S. or other countries in which the violation or divergence occurred, could interrupt or otherwise disrupt the shipment of finished products to us or damage our reputation. Any of these, in turn, could have a material adverse effect on our financial condition and
results of operations. As a result, should one of our independent manufacturers or licensors be found in violation of state or international labor laws, we could suffer financial or other unforeseen consequences.
29
We extend unsecured credit to our customers and are therefore vulnerable to any financial difficulties they may face.
We sell our merchandise primarily to department stores and specialty retail stores worldwide. We extend credit based on an evaluation of each customer’scustomer's financial condition, usually without requiring collateral. Should any of our larger customers experience financial difficulties, we could curtail business with such customers or assume more credit risk relating to such customers’customers' receivables. Our inability to collect on our trade accounts receivable relating to such customers could have a material adverse effect on the amount of sales revenue that we receive and our financial condition and results of operations.
We do not maintain long-term contracts with our customers and are unable to control their purchasing decisions.
We do not maintain long-term purchasing contracts with our customers and therefore have no contractual leverage over their purchasing decisions. A decision by a major department store or other significant customer to decrease the amount of merchandise purchased from us or to cease carrying our products could have a material adverse effect on our net sales and operating strategy.
Our Direct to consumer business segment operates in the highly competitive specialty retail, e-commerce and catalog industry and the size and resources of some of our competitors are substantially greater than ours, which may allow them to compete more effectively.
We face intense competition in the specialty retail, e-commerce and catalog industry. We compete primarily with specialty retailers, department stores, catalog retailers and internet businesses that engage in the retail sale of watches, accessories and clothing. We believe that the principal basis upon which we compete is the quality and design of merchandise and the quality of customer service. We also believe that price is an important factor in our customers’customers' decision-making processes. Many of our competitors are, and many of our potential competitors may be, larger and have greater financial, marketing and other resources than we have and therefore may be able to adapt to changes in customer requirements more quickly, devote greater resources to the marketing and sale of their products and generate greater national brand recognition than we can. This intense competition and greater size and resources of some of our competitors could have a material adverse effect on the amount of net sales we generate and on our results of operations.
We could be negatively impacted if we fail to successfully integrate the businesses we acquire.
As part of our growth strategy, we have made certain acquisitions, domestically and internationally, including acquisitions of FOSSIL stores previously operated under license agreements, acquisitions of certain watch brands and acquisitions of independent distributors of our products. On January 10,In April 2012, we announced that we have entered into an agreement to acquireacquired Skagen Designs and certain of its international affiliates. Skagen Designs based in Reno, Nevada, manufactures, markets and distributes watches, jewelry, sunglasses and clocks. The potential integration of Skagen Designs when and if the transaction closes, andany future acquisitions may not be successful or generate sales increases. When we have acquired businesses, we have acquired businesses that we believe could enhance our business opportunities and our growth prospects. All acquisitions involve risks that could materially affect our business, financial condition and operating results. These risks include:
30
In addition, acquired businesses may not provide us with increased business opportunities or result in the growth that we anticipate. Furthermore, integrating acquired operations is a complex, time-consuming and expensive process. Combining acquired operations with our current operations may result in lower overall operating margins, greater stock price volatility and quarterly earnings fluctuations. Cultural incompatibilities, career uncertainties and other factors associated with such acquisitions may also result in the loss of employees. Failure to acquire and successfully integrate complementary practices, or failure to achieve the business synergies or other anticipated benefits, could materially adversely affect our business, our financial condition and results of operations.
Our competitors are established companies that may have greater experience than us in a number of crucial areas, including design and distribution.
There is intense competition in each of the businesses in which we compete. In all of our businesses, we compete with numerous manufacturers, importers and distributors who may have significantly greater financial, distribution, advertising and marketing resources than us. Our competitors include distributors that import watches, accessories and clothing from abroad, U.S. companies that have established foreign manufacturing relationships and companies that produce accessories and clothing domestically. Our results of operations and market position may be adversely affected by our competitors and their competitive pressures in the watch, fashion accessory and clothing industries.
Our implementation Any material disruption of a new enterprise resource planning systemour information systems could disrupt our computer systembusiness and divert management time.reduce our sales.
In 2003, we began implementing an enterprise resource planning system from SAP AG, We are increasingly dependent on information systems to operate our websites, process transactions, manage inventory, monitor sales and purchase, sell and ship goods on a German software company.timely basis. We implemented thealso utilize SAP ERP system in our U.S., Germany, France, Italy, United Kingdom operations and Switzerland locations in fiscal years 2003, 2004, 2005, 2008, 2010 and 2011, respectively. Over time, we intend to replace our existing enterprise resource planning systems and other principal financial systems in certain other subsidiaries with software systems provided by SAP AG. We have implemented Navision as our standard system throughout most of our Far EastEuropean operations to support our human resources, sales and distribution, inventory planning, retail merchandising and manufacturing subsidiaryoperational and financial reporting systems of our business, and Navision in our Asian operations to support many of the same functions on a local country level. We may experience operational problems with our information systems as a result of system failures, viruses, computer "hackers" or other causes. Any material disruption or slowdown of our systems could cause information, including data related to customer orders, to be lost or delayed which could result in delays in the delivery of merchandise to our principal Hong Kong officestores and China assembly facilities. Our current expansion plans may place significant strain oncustomers or lost sales, which could reduce demand for our management, working capital,merchandise and cause our sales to decline. Moreover, the failure to maintain, or a disruption in, financial and management control systems and staff. The failure to maintain or upgrade financial and management control systems, to recruit additional staff or to respond effectively to difficulties encountered during expansion could have a material adverse effect on our ability to respond to trends in our target markets, market our products and meet our customers’customer's requirements. The sustained disruption or failure of our systems due to force majeure or as part of an upgrade, conversion or
In addition, we have e-commerce and other systems maintenance could resultwebsites in the same adverse effects.U.S. and internationally. In addition to changing consumer preferences and buying trends relating to Internet usage, we are vulnerable to certain additional risks and uncertainties associated with the Internet, including changes in required technology interfaces, website downtime and other technical failures, security breaches, and consumer privacy concerns. Our failure to successfully respond to these risks and uncertainties could reduce Internet sales, increase costs and damage our brand's reputation.
Changes in the mix of product sales demand could negatively impact our gross profit margins.
Our gross profit margins are impacted by our sales mix. Sales from our Direct to consumer segment and international and licensed watch businesses generally provide gross margins in excess of our historical consolidated gross profit margin, while accessory products generally provide gross profit margins below our historical consolidated gross profit margin. If future sales from our Direct to consumer segment and international and licensed watch businesses do not increase at a faster rate than
our accessory business, our gross profit margins may grow at a slower pace, cease to grow, or decrease relative to our historical consolidated gross profit margin. We also distribute private label productproducts to the mass market channel at gross profit margins significantly lower than our historical consolidated gross profit margin. Future growth in this channel at rates in excess of our consolidated net sales growth rate could negatively impact our consolidated gross profit margins.
Our industry is subject to pricing pressures that may adversely impact our financial performance.
We assemble or source many of our products offshore because they generally cost less to make overseas, due primarily to lower labor costs. Many of our competitors also source their product requirements offshore to
31
achieve lower costs, possibly in locations with lower costs than our offshore operations, and those competitors may use these cost savings to reduce prices. To remain competitive, we must adjust our prices from time to time in response to these industry-wide pricing pressures. Our financial performance may be negatively affected by these pricing pressures if we are forced to reduce our prices and we cannot reduce our production costs or our production costs increase and we cannot increase our prices.
The loss of our intellectual property rights may harm our business.
Our trademarks, patents and other intellectual property rights are important to our success and competitive position. We are devoted to the establishment and protection of our trademarks, patents and other intellectual property rights in those countries where we believe it is important to our ability to sell our products. However, we cannot be certain that the actions we have taken will result in enforceable rights, will be adequate to protect our products in every country where we may want to sell our products, will be adequate to prevent imitation of our products by others or will be adequate to prevent others from seeking to prevent sales of our products as a violation of the trademarks, patents or other intellectual property rights of others. Additionally, we rely on the patent, trademark and other intellectual property laws of the U.S. and other countries to protect our proprietary rights. Even if we are successful in obtaining appropriate trademark, patent and other intellectual property rights, we may be unable to prevent third-partiesthird parties from using our intellectual property without our authorization, particularly in those countries where the laws do not protect our proprietary rights as fully as in the U.S. Because we sell our products internationally and are dependent on foreign manufacturing in China, we are significantly dependent on foreign countries to protect our intellectual property rights. The use of our intellectual property or similar intellectual property by others could reduce or eliminate any competitive advantage we have developed, causing us to lose sales or otherwise harm our business. Further, if it became necessary for us to resort to litigation to protect our intellectual property rights, any proceedings could be burdensome and costly and we may not prevail. The failure to obtain or maintain trademark, patent or other intellectual property rights could materially harm our business.
Our products may infringe the intellectual property rights of others, which may cause us to incur unexpected costs or prevent us from selling certain our products.
We cannot be certain that our products do not and will not infringe upon the intellectual property rights of others. We may be subject to legal proceedings and claims in the ordinary course of our business, including claims of alleged infringement of the intellectual property rights of third-partiesthird parties by us or our customers in connection with their use of our products. Any such claims, whether or not meritorious, could result in costly litigation and divert the efforts of our personnel. Moreover, should we be found liable for infringement, we may be required to enter into licensing agreements (if available on acceptable terms or at all) or to pay damages and cease making or selling certain products. Moreover, we may need to redesign or rename some of our products to avoid future infringement liability. Any of the foregoing could cause us to incur significant costs and prevent us from manufacturing or selling certain of our products.
An increase in product returns could negatively impact our operating results.
We accept limited returns and will request that a customer return a product if we feel the customer has an excess of any style that we have identified as being a poor performer for that customer or geographic location. We continually monitor returns and maintain a provision for estimated returns based upon historical experience and any specific issues identified. While returns have historically been within our expectations and the provisions established, future return rates may differ from those experienced in the past. In the event that our products are performing poorly in the retail market and/or we experience product damages or defects at a rate significantly higher than our historical rate, the resulting credit returns could have an adverse impact on the operating results for the period or periods in which such returns occur.
32
There are inherent limitations in all control systems, and misstatements due to error or fraud may occur and not be detected.
We are subject to the ongoing internal control provisions of Section 404 of the Sarbanes-Oxley Act of 2002. These provisions provide for the identification of material weaknesses in internal control over financial reporting, which is a process to provide reasonable assurance regarding the reliability of financial reporting for external purposes in accordance with accounting principles generally accepted in the United States of America. Our management, including our Chief Executive Officer and Chief Financial Officer, does not expect that our internal controls and disclosure controls will prevent all errors and all fraud. A control system, no matter how well conceived and operated, can provide only reasonable, not absolute, assurance that the objectives of the control system are met. In addition, the design of a control system must reflect the fact that there are resource constraints and the benefit of controls must be relative to their costs. Because of the inherent limitations in all control systems, no evaluation of controls can provide absolute assurance that all control issues and instances of fraud, if any, in our company have been detected. These inherent limitations include the realities that judgments in decision-making can be faulty and that breakdowns can occur because of simple errors or mistakes. Further, controls can be circumvented by individual acts of some persons, by collusion of two or more persons, or by management override of the controls. The design of any system of controls is also based in part upon certain assumptions about the likelihood of future events, and there can be no assurance that any design will succeed in achieving its stated goals under all potential future conditions. Over time, a control may be inadequate because of changes in conditions, such as growth of the company or increased transaction volume, or the degree of compliance with the policies or procedures may deteriorate. Because of inherent limitations in a cost-effective control system, misstatements due to error or fraud may occur and not be detected.
In addition, discovery and disclosure of a material weakness, by definition, could have a material adverse impact on our financial statements. Such an occurrence could discourage certain customers or suppliers from doing business with us, cause downgrades in our debt ratings leading to higher borrowing costs and affect how our stock trades. This could in turn negatively affect our ability to access public debt or equity markets for capital.
Risk Factors Relating to Our International Operations
Factors affecting international commerce and our international operations may seriously harm our financial condition.
We generate a significant portion During fiscal 2012, we generated 52.6% of our revenuesnet sales from outside of the U.S., and we anticipate that revenue from our international operations could account for an increasingly larger portion of our net sales in the future. Our international operations are directly related to, and dependent on, the volume of international trade and foreign market conditions. International
commerce and our international operations are subject to many risks, some of which are discussed in more detail below, including:
33
The occurrence or consequences of any of these risks may restrict our ability to operate in the affected regions and decrease the profitability of our international operations, which may seriously harm our financial condition.
Foreign currency fluctuations could adversely impact our financial condition.
We generally purchase our products in U.S. dollars. However, we source a significant amount of our products overseas and, as such, the cost of these products may be affected by changes in the value of the currencies, including the Australian Dollar, British Pound, Canadian Dollar, Chinese Yuan, Danish Krone, Euro, Hong Kong Dollar, Indian Rupee, Japanese Yen, Korean Won, Malaysian Ringgit, Mexican Peso, Norwegian Kroner, Singapore Dollar, Swedish Krona, Swiss Franc and Taiwanese Dollar. Due to our dependence on manufacturing operations in China, changes in the value of the Chinese Yuan may have a material impact on our supply channels and manufacturing costs, including component and assembly costs. Changes in the currency exchange rates may also affect the relative prices at which we and our foreign competitors sell products in the same market. Although we utilize forward contracts to mitigate foreign currency risks (mostly relating to the Euro, British Pound, Japanese Yen, Mexican Peso, Canadian Dollar and Australian Dollar), if we are unsuccessful in mitigating these risks, foreign currency fluctuations may have a material adverse impact on our financial condition and results of operations.
We depend on independent distributors to sell our products in certain international markets.
Our products are sold in certain international markets through independent distributors. If a distributor fails to meet annual sales goals, it may be difficult and costly to locate an acceptable substitute distributor. If a change in our distributors becomes necessary, we may experience increased costs, as well as a substantial disruption in, and a resulting loss of, sales and profits.
Because we are dependent on foreign manufacturing, we are vulnerable to changes in economic and social conditions in Asia, particularly China, and disruptions in international travel and shipping.
Because a substantial portion of our watches and jewelry and certain of our handbags, sunglasses and other products are assembled or manufactured in China, our success will depend to a significant
extent upon future economic and social conditions existing in China. If the factories in China were disrupted for any reason, we would need to arrange for the manufacture and shipment of products by alternative sources. Because the establishment of new manufacturing relationships involves numerous uncertainties, including those relating to payment terms, costs of manufacturing, adequacy of manufacturing capacity, quality control and timeliness of delivery, we are unable to predict whether such new relationships would be on terms that we regard as satisfactory. Any significant disruption in our relationships with our manufacturing sources located in China would have a material adverse effect on our ability to manufacture and distribute our products. Restrictions on travel to and from this and other regions, similar to those imposed during the outbreak of Severe Acute Respiratory Syndrome in 2003, commonly known as SARS, and any delays or cancellations of customer orders or the manufacture or shipment of our products on account of SARS or other syndromes could have a material adverse effect on our ability to meet customer deadlines and timely distribute our products in order to match consumer tastes.
Risks associated with foreign government regulations and U.S. trade policy may affect our foreign operations and sourcing.
Our businesses are subject to risks generally associated with doing business abroad, such as foreign governmental regulation in the countries in which our manufacturing sources are located, primarily China. While
34
we have not experienced any material issues with foreign governmental regulations that would impact our arrangements with our foreign manufacturing sources, we believe that this issue is of particular concern with regard to China due to the less mature nature of the Chinese market economy and the historical involvement of the Chinese government in industry. If regulationregulations were to render the conduct of business in a particular country undesirable or impracticable, or if our current foreign manufacturing sources were for any other reason to cease doing business with us, such a development could have a material adverse effect on our product sales and on our supply, manufacturing and distribution channels.
Our business is also subject to the risks associated with U.S. and foreign legislation and regulations relating to imports, including quotas, duties, tariffs or taxes, and other charges or restrictions on imports, which could adversely affect our operations and our ability to import products at current or increased levels. We cannot predict whether additional U.S. and foreign customs quotas, duties (including antidumping or countervailing duties), tariffs, taxes or other charges or restrictions, requirements as to where raw materials must be purchased, additional workplace regulations or other restrictions on our imports will be imposed upon the importation of our products in the future or adversely modified, or what effect such actions would have on our costs of operations. For example, our products imported to the U.S. are subject to U.S. customs duties and, in the ordinary course of our business we may from time to time be subject to claims by the U.S. Customs Service for duties and other charges. Factors that may influence the modification or imposition of these restrictions include the determination by the U.S. Trade Representative that a country has denied adequate intellectual property rights or fair and equitable market access to U.S. firms that rely on intellectual property, trade disputes between the U.S. and a country that leads to withdrawal of “most"most favored nation”nation" status for that country and economic and political changes within a country that are viewed unfavorably by the U.S. government. Future quotas, duties or tariffs may have a material adverse effect on our business, financial condition and results of operations. Future trade agreements could also provide our competitors with an advantage over us, or increase our costs, either of which could have a material adverse effect on our business, financial condition and results of operations and financial condition. Substantially all of our import operations are subject to:
Our clothing business is also subject to the effects of international trade agreements and regulations such as the North American Free Trade Agreement, and the activities and regulations of the World Trade Organization, referred to as the WTO. Generally, such trade agreements benefit our clothing business by reducing or eliminating the duties and/or quotas assessed on products manufactured in a particular country. However, trade agreements can also impose requirements that negatively impact our clothing business, such as limiting the countries from which we can purchase raw materials and setting quotas on products that may be imported into the U.S. from a particular country. In addition, the WTO may commence a new round of trade negotiations that liberalize textile trade. This increased competition could have a material adverse effect on our business, results of operations and financial condition.
Risk Factors Relating to Our Common Stock
Many factors may cause our net sales, operating results and cash flows to fluctuate and possibly decline, which may result in declines in our stock price.
Our net sales, operating results and cash flows may fluctuate significantly because of a number of factors, many of which are outside of our control. These factors may include, but may not be limited to, the following:
35
One or more of the foregoing factors, as well as any other risk factors discussed in this Annual Report on Form 10-K, may cause our operating expenses to be unexpectedly high or result in a decrease in our net sales during any given period. If these or any other variables or unknowns were to cause a shortfall in revenues or earnings, an increase in our operating costs or otherwise cause a failure to meet public market expectations, our stock price may decline and our business could be adversely affected.
Our CEO owns a significant amountapproximately 10% of our outstanding common stock.
Mr. Kosta Kartsotis, our CEO, owns approximately 10% of our common stock as of December 31, 2011.29, 2012. As a result, he is in a position to significantly influence the outcome of elections of our directors, the adoption, amendment or repeal of our bylaws and any other actions requiring the vote or consent of our stockholders, and to otherwise influence our affairs.
Because the interests of Mr. Kartsotis may not coincide with the interests of other stockholders, Mr. Kartsotis may influence the Company to enter into transactions or agreements that other stockholders would not approve or make decisions with which other stockholders may disagree.
Our organizational documents contain anti-takeover provisions that could discourage a proposal for a takeover.
Our certificate of incorporation and bylaws, as well as the General Corporation Law of the State of Delaware, contain provisions that may have the effect of discouraging a proposal for a takeover. These include a provision in our certificate of incorporation authorizing the issuance of “blank check”"blank check" preferred stock and provisions in our bylaws establishing advance notice procedures with respect to certain stockholder proposals. Our bylaws may be amended by a vote of 80% of the Board of Directors, subject to repeal by a vote of 80% of the stockholders. In addition, Delaware law limits the ability of a Delaware corporation to engage in certain business combinations with interested stockholders. Finally, Mr. Kartsotis has the ability, by virtue of his stock ownership, to significantly influence a vote regarding a change in control.
Future sales of our common stock in the public market could adversely affect our stock price.
Mr. Kosta Kartsotis owns approximately 10% The shares of our common stock as of December 31, 2011. The shares beneficially owned by Mr. Kosta Kartsotis may be sold in the open market in the future, subject to any volume restrictions and other limitations under the Securities Act of 1933 and Rule 144 thereunder. We may also decide to file a registration statement enabling Mr. Kartsotis to sell additional shares. Any sales by Mr. Kartsotis of substantial amounts of our common stock in the open market, or the availability of his shares for sale, could adversely affect the price of our common stock. The market price of our common stock could decline as a result of sales of substantial amounts of our common stock in the public market, or the perception that those sales could
36
occur. These sales or the possibility that they may occur also could make it more difficult for us to raise funds in any equity offering in the future at a time and price that we deem appropriate.
Item 1B. Unresolved Staff Comments
None.
Company facilities.As of the end of fiscal year 2011,2012, we owned or leased the following material facilities in connection with our U.S. and international operations:
Location | Use | Square Footage | Owned / Leased | |||||||||||||
|---|---|---|---|---|---|---|---|---|---|---|---|---|---|---|---|---|
Dallas, Texas | Office, warehouse and distribution | 517,500 | Owned | |||||||||||||
Eggstätt, Germany | Office, warehouse and distribution | 260,000 | Owned | |||||||||||||
| Office | 92,160 | Owned | |||||||||||||
Basel, Switzerland | European headquarters | 31,000 | Owned | |||||||||||||
Richardson, Texas | Corporate headquarters | 535,731 | Lease expiring in 2021 | |||||||||||||
Hong Kong | Far East headquarters, warehouse and distribution | 210,786 | Lease expiring in 2014 | |||||||||||||
Garland, Texas | Warehouse | 268,706 | Lease expiring in 2017 | |||||||||||||
Shenzhen, China | Manufacturing | 110,231 | Lease expiring in 2013 | |||||||||||||
New York, New York | General office and showroom | 26,552 | Lease expiring in 2016 | |||||||||||||
In 2011, we entered into a lease for a new corporate headquarters building in Richardson, Texas. In a related transaction, we sold two office buildings that were previously used as our corporate headquarters comprising approximately 190,000 and 132,000 square feet, respectively, and one of our warehouses comprising approximately 138,000 square feet, all located in Richardson, Texas.
We also lease certain other manufacturing and/or office, warehouse and/or distribution facilities in Atlanta, Georgia; Chicago, Illinois; Los Angeles, California; Miami, Florida; Australia; Austria; Canada; China; Denmark; France; Germany; Hong Kong; India; Italy; Japan; Malaysia; Mexico; the Netherlands; New Zealand; Portugal; Singapore; South Korea; Spain; Sweden; Switzerland; Taiwan and the United Kingdom.
Retail store facilities.As of the end of fiscal year 2011,2012, we had 420496 lease agreements for retail space for the sale of our products. The leases, including renewal options, expire at various times from 20122013 to 2024.2026. The leases provide for minimum annual rentals and, in certain cases, for the payment of additional rent when sales exceed specified net sales amounts. We are also generally required to pay our pro rata share of common area maintenance costs, real estate taxes, insurance, maintenance expenses and utilities.
We believe that our material existing facilities are well maintained, in good operating condition, and are adequate for our needs.
There are no legal proceedings to which we are a party or to which our properties are subject, other than routine litigation incidental to our business, which is not material to our consolidated financial condition, results of operations or cash flows. We do not believe that the outcome of any currently pending legal matters, individually or collectively, will have a material effect on the consolidated results of operations or financial condition of the Company.
Item 4. Mine Safety Disclosures
Not applicable.
37
Item 5. Market for Registrant’sRegistrant's Common Equity, Related Stockholder Matters and Issuer Purchases of Equity Securities
General.Our common stock is listed on the NASDAQ Global Select Market under the symbol “FOSL.”"FOSL." The following table sets forth the range of quarterly high and low sales prices per share of our common stock on the NASDAQ Global Select Market for the fiscal years ended December 31, 201129, 2012 and January 1,December 31, 2011.
| | High | Low | |||||
|---|---|---|---|---|---|---|---|
Fiscal year ended December 29, 2012: | |||||||
First quarter | $ | 135.98 | $ | 76.72 | |||
Second quarter | 139.20 | 67.69 | |||||
Third quarter | 93.69 | 62.77 | |||||
Fourth quarter | 96.40 | 78.75 | |||||
Fiscal year ended December 31, 2011: | |||||||
First quarter | $ | 94.77 | $ | 66.05 | |||
Second quarter | 122.00 | 89.55 | |||||
Third quarter | 134.98 | 69.57 | |||||
Fourth quarter | 110.74 | 73.01 | |||||
| High | Low | |||||||
Fiscal year ended December 31, 2011: | ||||||||
First quarter | $ | 94.77 | $ | 66.05 | ||||
Second quarter | 122.00 | 89.55 | ||||||
Third quarter | 134.98 | 69.57 | ||||||
Fourth quarter | 110.74 | 73.01 | ||||||
Fiscal year ended January 1, 2011: | ||||||||
First quarter | $ | 39.60 | $ | 31.31 | ||||
Second quarter | 43.42 | 33.00 | ||||||
Third quarter | 54.76 | 35.49 | ||||||
Fourth quarter | 74.34 | 51.03 | ||||||
As of February 23, 2012,21, 2013, there were 116106 holders of record of our shares of common stock (including nominee holders such as banks and brokerage firms who hold shares for beneficial owners), although we believe that the number of beneficial owners is much higher.
Cash Dividend Policy.We did not pay any cash dividends in fiscal years 2012, 2011 2010 or 2009.2010. We expect that for the foreseeable future, we will retain all available earnings generated by our operations for the development and growth of our business.business and for the repurchase of shares of our common stock. Any future determination as to a cash dividend policy will be made at the discretion of our Board of Directors and will depend on a number of factors, including our future earnings, capital requirements, stock repurchase plans, financial condition, future prospects and such other factors as our Board of Directors may deem relevant.
Common Stock Performance Graph
The following performance graph compares the cumulative return of our shares of common stock over the preceding five year periods with that of the broad market (CRSP Total Return Index of the NASDAQ Global Select Market (US) and the Standard & Poor's 500 Stock Index ("S&P 500 Index")) and the NASDAQ Retail Trades Group. Each Index assumes $100 invested at December 31, 20062007 and is calculated assuming quarterly reinvestment of dividends and quarterly weighting by market capitalization. Effective April 3, 2012, our common stock was added to the S&P 500 Index. As a result, we now use the S&P 500 Index as our broad market index. We will discontinue presenting the CRSP Total Return Index of the NASDAQ Global Select Market (US) in future stock performance graphs.
38
2011
2012 COMPARATIVE TOTAL RETURNS
Fossil, Inc., NASDAQ Global Select Market, and
NASDAQ Market Retail Trades Group
and S&P 500 Index
(Performance Results through 12/31/11)12)
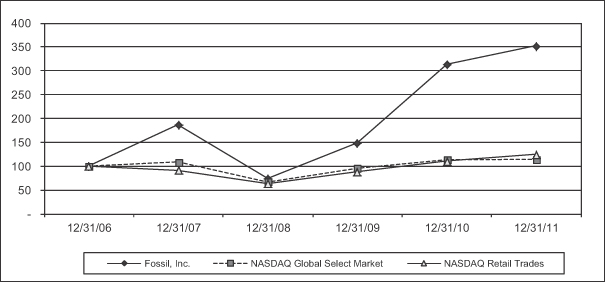
| 12/31/06 | 12/31/07 | 12/31/08 | 12/31/09 | 12/31/10 | 12/31/11 | |||||||||||||||||||
Fossil, Inc. | 100.00 | 185.92 | 73.96 | 148.63 | 312.13 | 351.46 | ||||||||||||||||||
NASDAQ Global Select Market | 100.00 | 108.47 | 66.35 | 95.38 | 113.19 | 113.81 | ||||||||||||||||||
NASDAQ Retail Trades | 100.00 | 90.99 | 63.49 | 88.19 | 110.46 | 124.39 | ||||||||||||||||||
| | 12/31/07 | 12/31/08 | 12/31/09 | 12/31/10 | 12/31/11 | 12/31/12 | |||||||||||||
|---|---|---|---|---|---|---|---|---|---|---|---|---|---|---|---|---|---|---|---|
Fossil, Inc. | 100.00 | 39.78 | 79.94 | 167.89 | 189.04 | 212.74 | |||||||||||||
Nasdaq Global Select Market | 100.00 | 61.17 | 87.93 | 104.13 | 104.69 | 123.85 | |||||||||||||
Nasdaq Retail Trades | 100.00 | 69.77 | 96.92 | 121.39 | 136.70 | 161.63 | |||||||||||||
S&P 500 Index | 100.00 | 61.51 | 75.94 | 85.65 | 85.65 | 97.13 | |||||||||||||
Purchases of Equity Securities by the Issuer and Affiliated Purchasers
In August 2010, our Board of Directors approved a common stock repurchase program pursuant to which up to $750 million could be used to repurchase outstanding shares of our common stock. This repurchase program is to be conducted pursuant to Rule 10b-18 of the Securities Exchange Act of 1934 and has a termination date of December 2013. We repurchased 3.13.0 million shares under the $750 million repurchase program during fiscal year 20102012 at a cost of $179.2$261.3 million. During fiscal yearyears 2011 and 2010, we repurchased 3.1 million shares under this repurchase programeach at a cost of $270.9 million.million and $179.2 million, respectively. In December 2012, our Board of Directors approved a new common stock repurchase program pursuant to which up to $1.0 billion could be used to repurchase outstanding shares of our common stock. This repurchase program is to be conducted pursuant to Rule 10b-18 of the Securities Exchange Act of 1934 and has a termination date of December 31, 2016. As of December 29, 2012, no shares had been repurchased under the $1.0 billion stock repurchase plan. Common stock repurchases acquired from grantees in connection with income tax withholding obligations arising from vesting of restricted stock grants were 23,702 shares, 24,769 shares and 25,299 shares for fiscal years 2012, 2011 and 2010, respectively.
The following table shows our common stock repurchases based on the settlement date for the quarter ended December 31, 2011:29, 2012:
| Period | Total Number of Shares Purchased | Average Price Paid per Share | Total Number of Shares Purchased as Part of Publicly Announced Plan | Approximate Dollar Value of Shares that May Yet Be Purchased Under the Plans | ||||||||||||
| October 2, 2011 - October 29, 2011 | 257,424 | $ | 87.24 | 257,424 | $ | 373,889,088 | ||||||||||
| October 30, 2011 - November 26, 2011 | 120,500 | $ | 96.05 | 120,500 | $ | 362,315,348 | ||||||||||
| November 27, 2011 - December 31, 2011 | 384,191 | $ | 84.38 | 384,191 | $ | 329,895,552 | ||||||||||
|
|
|
| |||||||||||||
Total | 762,115 | 762,115 | ||||||||||||||
|
|
|
| |||||||||||||
39
Period | Total Number of Shares Purchased | Average Price Paid per Share | Total Number of Shares Purchased as Part of Publicly Announced Plan | Approximate Dollar Value of Shares that May Yet Be Purchased Under the Plans | |||||||||
|---|---|---|---|---|---|---|---|---|---|---|---|---|---|
September 30, 2012 - October 27, 2012 | 268,129 | $ | 86.73 | 267,664 | $ | 110,343,423 | |||||||
October 28, 2012 - November 24, 2012 | 159,200 | $ | 86.84 | 159,200 | $ | 96,519,143 | |||||||
November 25, 2011 - December 29, 2012 | 317,495 | $ | 88.08 | 317,476 | $ | 1,068,554,797 | |||||||
Total | 744,824 | 744,340 | |||||||||||
Item 6. Selected Financial Data
The following information should be read in conjunction with our consolidated financial statements and notes thereto contained in Item 8. Consolidated Financial Statements and Supplementary Data of this Annual Report on Form 10-K (in thousands, except for per share data).
Fiscal Year | 2011 | 2010 | 2009 | 2008 | 2007 | 2012 | 2011 | 2010 | 2009 | 2008 | ||||||||||||||||||||||||||
|---|---|---|---|---|---|---|---|---|---|---|---|---|---|---|---|---|---|---|---|---|---|---|---|---|---|---|---|---|---|---|---|---|---|---|---|---|
Net sales | $ | 2,567,302 | $ | 2,030,690 | $ | 1,548,093 | $ | 1,583,242 | $ | 1,432,984 | $ | 2,857,508 | $ | 2,567,302 | $ | 2,030,690 | $ | 1,548,093 | $ | 1,583,242 | ||||||||||||||||
Gross profit | 1,439,186 | 1,155,164 | 844,850 | 851,151 | 742,031 | 1,606,543 | 1,439,186 | 1,155,164 | 844,850 | 851,151 | ||||||||||||||||||||||||||
Operating income | 471,991 | 376,414 | 211,627 | 205,770 | 186,485 | 488,840 | 471,991 | 376,414 | 211,627 | 205,770 | ||||||||||||||||||||||||||
| Income before taxes attributable to Fossil, Inc. | 438,860 | 372,448 | 213,776 | 189,429 | 187,526 | 478,726 | 438,860 | 372,448 | 213,776 | 189,429 | ||||||||||||||||||||||||||
Net income attributable to Fossil, Inc. | 294,702 | 255,205 | 139,188 | 138,097 | (1) | 123,261 | (2) | 343,401 | (1) | 294,702 | 255,205 | 139,188 | 138,097 | (2) | ||||||||||||||||||||||
Earnings per share: | ||||||||||||||||||||||||||||||||||||
Basic | 4.66 | 3.83 | 2.09 | 2.05 | (1) | 1.81 | (2) | 5.63 | (1) | 4.66 | 3.83 | 2.09 | 2.05 | (2) | ||||||||||||||||||||||
Diluted | 4.61 | 3.77 | 2.07 | 2.02 | (1) | 1.75 | (2) | 5.59 | (1) | 4.61 | 3.77 | 2.07 | 2.02 | (2) | ||||||||||||||||||||||
Weighted average common shares and common equivalent shares outstanding: | ||||||||||||||||||||||||||||||||||||
Basic | 63,298 | 66,701 | 66,684 | 67,525 | 68,213 | 60,959 | 63,298 | 66,701 | 66,684 | 67,525 | ||||||||||||||||||||||||||
Diluted | 63,965 | 67,687 | 67,153 | 68,323 | 70,333 | 61,400 | 63,965 | 67,687 | 67,153 | 68,323 | ||||||||||||||||||||||||||
Working capital | $ | 844,124 | $ | 801,329 | $ | 701,193 | $ | 556,497 | $ | 546,410 | $ | 737,334 | $ | 844,124 | $ | 801,329 | $ | 701,193 | $ | 556,497 | ||||||||||||||||
Total assets | 1,642,922 | 1,467,573 | 1,276,483 | 1,087,296 | 1,122,628 | 1,841,989 | 1,642,922 | 1,467,573 | 1,276,483 | 1,087,296 | ||||||||||||||||||||||||||
Total long-term liabilities | 134,798 | 76,377 | 62,791 | 74,964 | 66,432 | 194,747 | 134,798 | 76,377 | 62,791 | 74,964 | ||||||||||||||||||||||||||
| Stockholders’ equity attributable to Fossil, Inc. | 1,105,929 | 1,044,118 | 962,781 | 802,144 | 771,662 | |||||||||||||||||||||||||||||||
Return on average stockholders’ equity attributable to Fossil, Inc. | 28.0 | % | 25.0 | % | 16.2 | % | 17.8 | % | 18.3 | % | ||||||||||||||||||||||||||
Stockholders' equity attributable to Fossil, Inc. | 1,233,535 | 1,105,929 | 1,044,118 | 962,781 | 802,144 | |||||||||||||||||||||||||||||||
Return on average stockholders' equity attributable to Fossil, Inc. | 29.9 | %(3) | 28.0 | %(3) | 25.0 | %(3) | 16.2 | %(3) | 17.8 | %(3) | ||||||||||||||||||||||||||
40
Item 7. Management’sManagement's Discussion and Analysis of Financial Condition and Results of Operations
Summary
We are a global design, marketing and distribution company that specializes in consumer fashion accessories. Our principal offerings include an extensive line of men’smen's and women’swomen's fashion watches and jewelry, handbags, small leather goods, belts, sunglasses, soft accessories shoes and clothing. In the watch and jewelry product categories, we have a diverse portfolio of globally recognized owned and licensed brand names under which our products are marketed. Our products are distributed globally through various distribution channels including wholesale in countries where we have a physical presence, direct to the consumer through our retail stores and commercial websites and through third-party distributors in countries where we do not maintain a physical presence. Our products are offered at varying price points to meet the needs of our customers, whether they are value-conscious or luxury oriented. Based on our extensive range of accessory products, brands, distribution channels and price points, we are able to target style-conscious consumers across a wide age spectrum on a global basis.
Domestically, we sell our products through a diversified distribution network that includes department stores, specialty retail locations, specialty watch and jewelry stores, Company-owned retail and factory outlet stores, mass market stores and through our FOSSIL catalogs and website. Our wholesale customer base includes, among others, Dillard's, JCPenney, Kohl's, Macy's, Neiman Marcus, Nordstrom, Saks Fifth Avenue, Macy’s, Dillard’s, JCPenney, Kohl’s, Sears, Wal-MartTarget and Target.Wal-Mart. In the United States, our network of Company-owned stores included 123131 retail stores located in premier retail sites and 7495 outlet stores located in major outlet malls as of December 31, 2011.29, 2012. In addition, we offer an extensive collection of our FOSSIL brand products through our catalogs and on our website,www.fossil.com, as well as proprietary and licensed watch and jewelry brands through other managed and affiliated websites.
Internationally, our products are sold to department stores, specialty retail stores and specialty watch and jewelry stores in over 120approximately 130 countries worldwide through 2223 Company-owned foreign sales subsidiaries and through a network of over 60 independent distributors. Our products are distributed in Africa, Asia, Australia, Europe, Central and South America, Canada, the Caribbean, Mexico, and the Middle East. Our products are offered on airlines and cruise ships and in internationalInternationally, our network of Company-owned retail stores which included 171185 retail stores and 3062 outlet stores in select international markets as of December 31, 2011.29, 2012. Our products are also sold through licensed and franchised FOSSIL retail stores, retail concessions operated by us and kiosks in certain international markets. In addition, we offer an extensive collection of our FOSSIL brand products on our websites in certain countries.
Our business is subject to the risks inherent in global sourcing supply. Certain key components in our products come from limited sources of supply, which exposes us to potential supply shortages that could disrupt the manufacture and sale of our products. Any interruption or delay in the supply of key components could significantly harm our ability to meet scheduled product deliveries to our customers and cause us to lose sales. Interruptions or delays in supply may be caused by a number of factors that are outside of our and our contractor manufacturers’manufacturers' control, such as natural disasters like the earthquake and tsunami in Japan that occurred during fiscal year 2011. As a result of these natural disasters, we experienced an increase in the cost of movements that negatively impacted gross profit margin in fiscal year 2011 as compared to fiscal year 2010. We do not expect material changes in movement costs during fiscal year 2012.
Effective January 3, 2010, we made changes to the presentation of reportable segments to reflect changes in the way our chief operating decision maker evaluates the performance of our operations, develops strategy and allocates capital resources. Prior to January 3, 2010, our reportable segments consisted of the following: United States wholesale, Europe wholesale, Other International wholesale and Direct to consumer. Effective January 3, 2010, our reportable segments consist of the following: North America wholesale, Europe wholesale, Asia Pacific wholesale and Direct to consumer. These changes included the reclassification of our wholesale operations in Canada and Mexico and our U.S. export business, all of which were previously recorded within our
41
Other International wholesale segment, to the North America wholesale segment. Our U.S. domestic wholesale operations previously recorded within the United States wholesale segment, were also reclassified to the North America wholesale segment. Our Asia Pacific wholesale operations, previously recorded within the Other International wholesale segment, were reclassified to the Asia Pacific wholesale segment. Our operations related to our joint venture with Fossil Spain, S.A., previously recorded within the Other International wholesale segment, were reclassified to the Europe wholesale segment. For comparison purposes, our historical segment disclosures were recast to be consistent with the current presentation.
This discussion should be read in conjunction with theour consolidated financial statements and the related notes included therewith.
Critical Accounting Policies and Estimates
The preparation of the consolidated financial statements in conformity with accounting principles generally accepted in the United States of America requires us to make estimates and assumptions that affect the reported amounts of assets and liabilities and the disclosure of contingent assets and liabilities at the date of the consolidated financial statements and the reported amounts of revenues
and expenses during the reporting period. On an on-goingongoing basis, we evaluate our estimates and judgments, including those related to product returns, bad debt, inventories, long-lived asset impairment, impairment of goodwill and trade names, income taxes, warranty costs, hedge accounting, litigation reserves and stock-based compensation. We base our estimates and judgments on historical experience and on various other factors that we believe to be reasonable under the circumstances. Our estimates form the basis for making judgments about the carrying values of assets and liabilities that are not readily apparent from other sources. Actual results may differ from these estimates under different assumptions or conditions. We believe the following critical accounting policies require the most significant estimates and judgments.
Product Returns.We accept limited returns and may request that a customer return a product if we feel the customer has an excess of any style that we have identified as being a poor performer for that customer or geographic location. We monitor returns and maintain a provision for estimated returns based upon historical experience and any specific issues identified. While returns have historically been within our expectations and the provisions established, future return rates may differ from those experienced in the past. In the event that our products are performing poorly in the retail market and/or we experience product damages or defects at a rate significantly higher than our historical rate, the resulting returns could have an adverse impact on the operating results for the period or periods in which such returns occur.
Bad Debt.We perform ongoing credit evaluations of our customers and adjust credit limits based upon payment history and the customer’scustomer's current credit worthiness, as determined by a review of their current credit information. We monitor collections and payments from our customers and maintain a provision for estimated credit losses based upon historical experience and any specific customer collection issues identified. Additionally, we secure credit insurance policies in certain countries. While such credit losses have historically been within our expectations and the provisions established, future credit losses may differ from those experienced in the past. Our bad debt allowance has increased over the last three fiscal years due to the challenging global economic environment. As a result of the difficult economic environment, some of our domestic and international customers have experienced financial difficulties, including bankruptcy. We increasedDue to an improvement in the aging of our receivables and the resolution of certain customer bankruptcies, we were able to reduce our bad debt allowance to reserve for these bankruptcies, as well as increased risks of non-payment and increased risk of customer charge-backs.in fiscal year 2012. Our policy is to maintain the reserve balances for bankruptcies until such time as the bankruptcies are actually settled.
Inventories.Inventories are stated at the lower of average cost, including any applicable duty and freight charges, or market. We account for estimated obsolescence or unmarketable inventory equal to the difference between the average cost of inventory and the estimated market value based upon assumptions about future demand, market conditions and market conditions.available liquidation channels. If actual future demand or market conditions are less favorable than those projected by management, or if liquidation channels are not readily available, additional inventory valuation reductions may be required. We assess our off-price sales on an ongoing basis and update our estimates accordingly. Revenue from sales of our products that are subject to inventory consignment agreements is recognized when title and risk of loss transfers, delivery has occurred, the price to the buyer is determinable and collectability is reasonably assured. Inventory held at consignment locations is included in our finished goods inventory.
42
Long-lived Asset Impairment.We test for asset impairment of property, plant and equipment and other long-lived assets whenever events or conditions indicate that the carrying value of an asset might not be recoverable based on expected discountedundiscounted cash flows related to the asset. We apply Accounting Standards Codification (“ASC”("ASC") 360,Property, Plant and Equipment(“ ("ASC 360”360"), in order to determine whether or not an asset is impaired. In evaluating long-lived assets for recoverability, we use our best estimate of future cash flows expected to result from the use of the asset and its eventual disposition. When undiscounted cash flows estimated to be generated through the operations of our Company-owned retail stores are less than the carrying value of the underlying assets, impairment losses are recorded in selling and distribution expenses. In addition, impairment losses resulting from
property, plant and equipment in our corporate costs area are recorded in general and administrative expenses. Should actual results or market conditions differ from those anticipated, additional losses may be recorded. We recorded impairment losses of $1.2 million, $1.0 million $5.6 million and $2.5$5.6 million in fiscal years 2012, 2011 and 2010, and 2009, respectively.
Impairment of Goodwill and Trade Names.We evaluate goodwill for impairment annually as of the end of the fiscal year by comparing the fair value of the reporting unit to its recorded value. Additionally, if events or conditions were to indicate the carrying value of a reporting unit may not be recoverable, we would evaluate goodwill for impairment at that time. We have three reporting units for which we evaluate goodwill for impairment, North America wholesale, Europe wholesale and Asia Pacific wholesale. The fair value of each reporting unit is estimated using market comparable information. If the estimated fair value of a reporting unit exceeds its recordedcarrying value, no impairment charge is recorded. As of December 31, 2011,29, 2012, the fair value of each of these reporting units substantially exceeded its carrying value.
Judgments and assumptions are inherent in our estimate of future cash flows used to determine the estimate of the reporting unit’sunit's fair value. The most significant assumptions associated with the fair value calculations include net sales growth rates and discount rates. If the actual future sales results do not meet the assumed growth rates, future impairments of goodwill may be incurred.
We evaluate trade names by comparing the fair value of the asset to its recorded value annually as of the end of the fiscal year and whenever events or conditions indicate that the carrying value of the trade name may not be recoverable. The fair value of the asset is estimated using discounted cash flow methodologies. The MICHELE trade name represented approximately 22% and 98% of our total trade name balances at the end of both fiscal years 2012 and 2011, and 2010.respectively. The SKAGEN trade name represented approximately 77% of our total trade name balance at the end of fiscal year 2012. We performed the required annual impairment test and recorded no impairment charges in fiscal yearyears 2012 and 2011. We recorded impairment charges of $1.8 million in fiscal year 2010 related to the ZODIAC and OYZTERBAY trade names and $2.7 million in fiscal year 2009 related to the ZODIAC and OYZTERBAY trade names. As of December 31, 2011,29, 2012, the fair valuevalues of the MICHELE and SKAGEN trade namenames exceeded itstheir carrying valuevalues by approximately 62%.40% and 24%, respectively. Due to the inherent uncertainties involved in making the estimates and assumptions used in the fair value analysis, actual results may differ which could alter the fair value of the trade names and possibly cause impairment charges to occur in future periods.
Income Taxes.We record valuation allowances against our deferred tax assets, when necessary, in accordance with ASC 740,Income TaxesTaxes("ASC 740"). Realization of deferred tax assets (such as net operating loss carry-forwards) is dependent on future taxable earnings and is therefore uncertain. At least quarterly, we assess the likelihood that our deferred tax asset balance will be recovered from future taxable income. To the extent we believe that recovery is not likely, we establish a valuation allowance against our deferred tax asset, increasing our income tax expense in the period such determination is made. In addition, we have not recorded U.S. income tax expense for foreign earnings that we have determined to be indefinitely reinvested.reinvested outside the U.S.. On an interim basis, we estimate what our effective tax rate will be for the full fiscal year. The estimated annual effective tax rate is then applied to the year-to-date pre-tax income excluding unusual or infrequently occurring items, to determine the year-to-date tax expense. The income tax effects of infrequent or unusual items are recognized in the interim period in which they occur. As the fiscal year progresses, we continually refine our estimate based upon actual events and earnings by jurisdiction during the year. This continual estimation process periodically results in a change to our expected effective tax rate for the fiscal year. When this occurs, we adjust the income tax provision
43
during the quarter in which the change in estimate occurs so that the year-to-date provision equals the expected annual rate excluding the impact of infrequent or unusual items.
Our continuing practice is to recognize interest and penalties related to income tax matters in income tax expense. As required under applicable accounting rules, we accrue an amount for our estimate of additional income tax liability which we believe we are more likely than not to incur as a result of the ultimate resolution of tax audits ("uncertain tax positions"). We review and update the estimates used in the accrual for uncertain tax positions as more definitive information becomes available from taxing authorities, upon completion of tax audits, upon expiration of statutes of limitation, or upon occurrence of other events. The results of operations and financial position for future periods could be impacted by changes in assumptions or resolutions of tax audits.
Warranty Costs.Our FOSSIL watch products sold in the U.S. are covered by a limited warranty against defects in materials or workmanship for a period of 11 years from the date of purchase. RELIC watch products sold in the U.S. are covered by a comparable 12 year limited warranty, while all other watch brands sold in the U.S. are covered by a comparable two year limited warranty. SKAGEN branded watches are covered by a lifetime warranty against defects due to faulty material or workmanship, subject to normal conditions of use. Generally, all of our watch products sold in Canada, Europe and Asia are covered by a comparable two year limited warranty. We determine our warranty liability using historical warranty repair experience. As changes occur in sales volumes and warranty experience, the warranty accrual is adjusted as necessary. The year-end warranty liability for fiscal years 2012, 2011 and 2010 and 2009 was $13.4 million, $11.0 million $8.5 million and $6.4$8.5 million, respectively.
Hedge Accounting.We operate in foreign countries, which exposes us to market risk associated with foreign currency exchange rate fluctuations. We have entered into certain foreign currency forward contracts ("forward contracts") to hedge the risk of foreign currency rate fluctuations. We have elected to apply the hedge accounting rules as required by ASC 815,Derivatives and Hedging,for these hedges. Our objective is to hedge the variability in forecasted cash flows due to the foreign currency risks primarily associated with certain anticipated inventory purchases. Changes in the fair value of forward contracts designated as cash flow hedges are recorded as a component of accumulated other comprehensive income within stockholders’stockholders' equity, and are recognized in other income (expense) income-net-net in the period which approximates the time the hedged inventory is sold.
Litigation Reserves.Estimated amounts for claims that are probable and can be reasonably estimated are recorded as liabilities in our consolidated balance sheet. The likelihood of a material change in these estimated reserves would be dependent on new claims that may arise, changes in the circumstances used to estimate amounts for prior period claims and favorable or unfavorable final settlements of prior period claims. As additional information becomes available, we assess the potential liability related to new claims and existing claims and revise estimates as appropriate. As new claims arise or circumstances change relative to prior claim assessments, revisions in estimates of the potential liability could materially impact theour consolidated results of operations and financial position.
Stock-Based Compensation.We account for stock-based compensation in accordance with the provisions of ASC 718,Compensation-StockCompensation—Stock Compensation(“ ("ASC 718”718"). We utilize the Black-Scholes model to determine the fair value of stock options and stock appreciation rights on the date of grant. The model requires us to make assumptions concerning (i) the length of time employees will retain their vested stock options before exercising them (“("expected term”term"), (ii) the volatility of our common stock price over the expected term, and (iii) the number of stock options that will be forfeited. Changes in these assumptions can materially affect the estimate of fair value of stock-based compensation and, consequently, the related expense amounts recognized on theour consolidated statements of income and comprehensive income.
Recently Issued Accounting Standards
In May 2011,July 2012, the Financial Accounting Standards Board (“FASB”("FASB") issued Accounting Standards Update (“ASU”("ASU") 2012-02. The amendments in this update permit an entity to make a qualitative
assessment to determine if it is more likely than not that an indefinite-lived intangible asset other than goodwill is impaired. If an entity concludes that it is more likely than not that the fair value of an indefinite-lived intangible asset other than goodwill is less than its carrying amount, it is required to perform the quantitative impairment test for that asset. This ASU aligns the guidance of impairment testing for indefinite-lived intangible assets other than goodwill with that in ASU 2011-08,Intangibles—Goodwill and Other (Topic 350): Testing Goodwill for Impairment ("ASU 2011-08"). The guidance in ASU 2012-02 will be effective for us for annual and interim periods for fiscal years beginning after September 15, 2012, and is not expected to have a material impact on our consolidated results of operations or financial position.
Recently Adopted Accounting Standards
In May 2011, the FASB issued ASU 2011-04,Fair Measurement (Topic 820): Amendments to Achieve Common Fair Value Measurement and Disclosure Requirements in U.S. GAAP and IFRSs (“ ("ASU 2011-04”2011-04"). FASB intends the new guidance to achieve common fair value measurement and disclosure requirements in U.S. GAAPgenerally accepted accounting principles and International Financial Reporting Standards. The amended guidance changes certain fair value measurement principles and enhances the disclosure requirements, particularly for Level 3 assets and liabilities for which we will be required to disclose quantitative information about the unobservable inputs used in fair value measurements. These changes became effective for us beginning January 1, 2012. The adoption of ASU 2011-04 isdid not expected to have a material impact on our consolidated results of operations andor financial position.
In June 2011, FASB issued ASU 2011-05,Comprehensive Income (Topic 220): Presentation of Comprehensive Income (“ ("ASU 2011-05”2011-05"). ASU 2011-05 eliminates the option to report other comprehensive
44
income and its components in the consolidated statement of shareholder’sshareholder's equity and comprehensive income and requires an entity to present the total of comprehensive income, the components of net income and the components of other comprehensive income either in a single continuous statement or in two separate but consecutive statements. The amendmentsWe adopted the single continuous statement beginning in the update do not change the items that must be reported in other comprehensive income or when an itemfirst quarter of other comprehensive income must be reclassified to net income. This amendment also required an entity to present on the face of the financial statements adjustments for items that are reclassified from accumulated other comprehensive income to net income. However, in December 2011, the FASB issued ASU 2011-12,Comprehensive Income (Topic 220): Deferral of the Effective Date for Amendments to the Presentation of Reclassifications of Items Out of Accumulated Other Comprehensive Income in ASU 2011-05(“ASU 2011-12”). ASU 2011-12 defers the specific requirement to present items that are reclassified from accumulated other comprehensive income to net income separately with their respective components of net income and other comprehensive income while FASB further deliberates this aspect of the proposal.fiscal 2012. ASU 2011-05, as amended by ASU 2011-12, became effective for us beginning January 1, 2012. The adoption of ASU 2011-05 isdid not expected to have a material impact on our consolidated results of operations or financial position.
In September 2011, FASB issued ASU 2011-08,Intangibles-Goodwill and Other (Topic 350): Testing Goodwill for Impairment (“ASU 2011-08”).2011-08. ASU 2011-08 simplifies the assessment of goodwill for impairment by allowing companies the option to assess qualitative factors to determine whether the existence of events or circumstances leads to a determination that it is more likely than not that the fair value of a reporting unit is less than its carrying amount. If a company concludes from the qualitative assessment that impairment is more likely than not, the entity is required to perform the two-step quantitative impairment test. These changes became effective for us beginning January 1, 2012. The adoption of ASU 2011-08 isdid not expected to have a material impact on our consolidated results of operations andor financial position.
Results of Operations
The following table sets forth, for the periods indicated, (i) the percentages of our net sales represented by certain line items from our consolidated statements of income and comprehensive income and (ii) the percentage changes in these line items between the fiscal years indicated.
Fiscal Year | 2011 | Percentage Change from 2010 | 2010 | Percentage Change from 2009 | 2009 | |||||||||||||||
Net sales | 100.0 | % | 26.4 | % | 100.0 | % | 31.2 | % | 100.0 | % | ||||||||||
Cost of sales | 43.9 | 28.9 | 43.1 | 24.5 | 45.4 | |||||||||||||||
|
|
|
|
|
| |||||||||||||||
Gross profit | 56.1 | 24.6 | 56.9 | 36.7 | 54.6 | |||||||||||||||
Operating expenses: | ||||||||||||||||||||
Selling and distribution | 27.9 | 22.5 | 28.7 | 22.0 | 30.9 | |||||||||||||||
General and administrative | 9.8 | 29.2 | 9.6 | 26.1 | 10.0 | |||||||||||||||
|
|
|
|
|
| |||||||||||||||
Operating income | 18.4 | 25.4 | 18.6 | 77.9 | 13.7 | |||||||||||||||
Interest expense | 0.1 | 113.7 | 0.1 | 376.2 | 0.0 | |||||||||||||||
Other (expense) income-net | (0.7 | ) | (302.4 | ) | 0.4 | 4.8 | 0.5 | |||||||||||||
|
|
|
|
|
| |||||||||||||||
Income before income taxes | 17.6 | 17.5 | 18.9 | 74.7 | 14.2 | |||||||||||||||
Provision for income taxes | 5.6 | 20.8 | 5.9 | 57.8 | 4.9 | |||||||||||||||
|
|
|
|
|
| |||||||||||||||
Net income | 12.0 | 16.0 | 13.0 | 83.6 | 9.3 | |||||||||||||||
Net income attributable to noncontrolling interest, net of taxes | 0.5 | 31.1 | 0.4 | 89.7 | 0.3 | |||||||||||||||
|
|
|
|
|
| |||||||||||||||
Net income attributable to Fossil, Inc. | 11.5 | % | 15.5 | % | 12.6 | % | 83.4 | % | 9.0 | % | ||||||||||
|
|
|
|
|
| |||||||||||||||
45
Fiscal Year | 2012 | Percentage Change from 2011 | 2011 | Percentage Change from 2010 | 2010 | |||||||||||
|---|---|---|---|---|---|---|---|---|---|---|---|---|---|---|---|---|
Net sales | 100.0 | % | 11.3 | % | 100.0 | % | 26.4 | % | 100.0 | % | ||||||
Cost of sales | 43.8 | 10.9 | 43.9 | 28.9 | 43.1 | |||||||||||
Gross profit | 56.2 | 11.6 | 56.1 | 24.6 | 56.9 | |||||||||||
Operating expenses: | ||||||||||||||||
Selling and distribution | 28.9 | 15.6 | 27.9 | 22.5 | 28.7 | |||||||||||
General and administrative | 10.2 | 15.5 | 9.8 | 29.2 | 9.6 | |||||||||||
Operating income | 17.1 | 3.6 | 18.4 | 25.4 | 18.6 | |||||||||||
Interest expense | 0.2 | 115.8 | 0.1 | 113.7 | 0.1 | |||||||||||
Other income (expense)—net | 0.3 | (147.3 | ) | (0.7 | ) | (302.4 | ) | 0.4 | ||||||||
Income before income taxes | 17.2 | 9.0 | 17.6 | 17.5 | 18.9 | |||||||||||
Provision for income taxes | 4.8 | (4.3 | ) | 5.6 | 20.8 | 5.9 | ||||||||||
Net income | 12.4 | 15.2 | 12.0 | 16.0 | 13.0 | |||||||||||
Net income attributable to noncontrolling interest, net of tax | 0.4 | (14.5 | ) | 0.5 | 31.1 | 0.4 | ||||||||||
Net income attributable to Fossil, Inc. | 12.0 | % | 16.5 | % | 11.5 | % | 15.5 | % | 12.6 | % | ||||||
Net Sales.The following table sets forth consolidated net sales by segment and the percentage relationship of each segment to consolidated net sales for the fiscal years indicated (in millions, except percentage data):
| Amounts | Percentage of Total | |||||||||||||||||||||||
Fiscal Year | 2011 | 2010 | 2009 | 2011 | 2010 | 2009 | ||||||||||||||||||
Wholesale | ||||||||||||||||||||||||
North America | $ | 967.5 | $ | 779.2 | $ | 551.1 | 37.7 | % | 38.3 | % | 35.6 | % | ||||||||||||
Europe | 695.4 | 547.4 | 467.1 | 27.1 | 27.0 | 30.2 | ||||||||||||||||||
Asia Pacific | 297.0 | 220.8 | 153.8 | 11.5 | 10.9 | 9.9 | ||||||||||||||||||
|
|
|
|
|
|
|
|
|
|
|
| |||||||||||||
Total wholesale | 1,959.9 | 1,547.4 | 1,172.0 | 76.3 | 76.2 | 75.7 | ||||||||||||||||||
Direct to consumer | 607.4 | 483.3 | 376.1 | 23.7 | 23.8 | 24.3 | ||||||||||||||||||
|
|
|
|
|
|
|
|
|
|
|
| |||||||||||||
Consolidated | $ | 2,567.3 | $ | 2,030.7 | $ | 1,548.1 | 100.0 | % | 100.0 | % | 100.0 | % | ||||||||||||
|
|
|
|
|
|
|
|
|
|
|
| |||||||||||||
| | Amounts | Percentage of Total | |||||||||||||||||
|---|---|---|---|---|---|---|---|---|---|---|---|---|---|---|---|---|---|---|---|
Fiscal Year | 2012 | 2011 | 2010 | 2012 | 2011 | 2010 | |||||||||||||
Wholesale | |||||||||||||||||||
North America | $ | 1,083.5 | $ | 967.5 | $ | 779.2 | 37.9 | % | 37.7 | % | 38.3 | % | |||||||
Europe | 697.0 | 695.4 | 547.4 | 24.4 | 27.1 | 27.0 | |||||||||||||
Asia Pacific | 361.5 | 297.0 | 220.8 | 12.7 | 11.5 | 10.9 | |||||||||||||
Total wholesale | 2,142.0 | 1,959.9 | 1,547.4 | 75.0 | 76.3 | 76.2 | |||||||||||||
Direct to consumer | 715.5 | 607.4 | 483.3 | 25.0 | 23.7 | 23.8 | |||||||||||||
Consolidated | $ | 2,857.5 | $ | 2,567.3 | $ | 2,030.7 | 100.0 | % | 100.0 | % | 100.0 | % | |||||||
Fiscal Year 20112012 Compared to Fiscal Year 20102011
Net Sales.The following table illustrates by factor the total year-over-year percentage change in net sales by segment and on a consolidated basis:
| | Exchange Rates | Acquisitions | Organic Change | Total Change | |||||||||
|---|---|---|---|---|---|---|---|---|---|---|---|---|---|
North America wholesale | (0.2 | )% | 3.9 | % | 8.3 | % | 12.0 | % | |||||
Europe wholesale | (6.2 | ) | 5.5 | 0.9 | 0.2 | ||||||||
Asia Pacific wholesale | (1.1 | ) | 3.1 | 19.7 | 21.7 | ||||||||
Direct to consumer | (1.3 | ) | 1.5 | 17.6 | 17.8 | ||||||||
Consolidated | (2.2 | )% | 3.7 | % | 9.8 | % | 11.3 | % | |||||
| Exchange Rates | Organic Change | Total Change | ||||||||||
North America wholesale | 0.1 | % | 24.1 | % | 24.2 | % | ||||||
Europe wholesale | 5.1 | 21.9 | 27.0 | |||||||||
Asia Pacific wholesale | 6.7 | 27.8 | 34.5 | |||||||||
Direct to consumer | 2.1 | 23.6 | 25.7 | |||||||||
Consolidated | 2.6 | % | 23.8 | % | 26.4 | % | ||||||
The following net sales discussion excludes the impact on sales growth attributable to foreign currency rate changes as noted in the above table.
Consolidated Net Sales. Net sales rose 13.5%, representing sales growth across each of our global wholesale and direct to consumer businesses. Our acquisition of Skagen Designs on April 2, 2012 contributed $93.8 million to fiscal year 2012. On an organic basis, excluding sales related to the SKAGEN brand, worldwide net sales increased 9.8%. Global watch sales made the most significant contribution, increasing 13.4%, or $247.3 million. We believe our global watch sales across all of our operating segments are benefiting from a resurgencegeneral upward trend in the watch category in general, resulting in consumers allocating more of their discretionary spending to this fashion category. We also believe our results are outpacing those of our competitors as consumers respond positively to our innovative product offeringsbranded products and focused presentations at retail.retail are appealing to the various tastes and fashion preferences of our customers. We attribute this favorable consumer response to our designs, which incorporate newer materials into the construction of the watch while also maintaining a very strong price to value relationship. Our leather category sales increased 4.2%, or $18.2 million, primarily due to square footage growth in our Direct to consumer segment. Sales gains from our watch and leather businesses were partially offset by a 32.2%, or $15.2 million, decrease in sunglass sales, and a 1.2%, or $2.2 million, decrease in our jewelry business. Sunglass and jewelry sales were negatively impacted throughout the year as a result of repositioning and market changes impacting FOSSIL branded products in these categories. Global jewelry sales benefitted from the continued roll-out of the MICHAEL KORS jewelry line which launched in fiscal year 2011.
We believe our diverse global distribution network, including owned distribution in 21 countries, combined with our design and marketing capabilities, will allow us to continue to take shelf space from lesser known local and regional brands as we continue to increase brand awareness through the growth of our retail stores and introduction of new websites in many of the countries in which we operate. We also believe that investments we have made in certain emerging markets will allow us to experience higher levels of growth in our international wholesale segments in comparison to our North America wholesale segment.
North America Wholesale Net Sales. Net sales in the North America wholesale segment increased 12.2%, or $118.2 million, during fiscal year 2012. This sales growth was primarily attributable to a 17.7%, or $127.2 million, increase in watch sales, and $37.5 million of sales related to SKAGEN branded products. Sales from our jewelry business also favorably impacted fiscal year 2012, increasing 36.1%, or $10.1 million, primarily a result of the continued roll-out of the MICHAEL KORS jewelry line launched in the last half of fiscal year 2011. These increases were partially offset by sales volume declines in our leathers products of 4.8%, or $9.2 million, and our sunglass category of 39.1%, or $7.2 million. The decrease in our leathers business was principally attributable to decreased sell-through rates in our FOSSIL women's categories, partially offset by sales volume increases in our RELIC leather products in the department store channel. Sunglass sales were negatively impacted by our repositioning of the FOSSIL branded sunglass business resulting in a year-over-year decrease in the number of department store doors through which the product is distributed in the U.S. During fiscal year 2012, excluding sales related to SKAGEN branded products, U.S. wholesale net sales increased 5.9%, or $49.9 million. Additionally, excluding Skagen branded product sales, shipments from our subsidiaries in Canada and Mexico increased 18.2% and 40.8%, respectively, while shipments to third party distributors increased 12.8%.
Europe Wholesale Net Sales. Europe wholesale net sales rose 6.4%, or $44.8 million, inclusive of a $37.7 million contribution from sales related to SKAGEN branded products. Excluding SKAGEN branded products, sales growth of 0.9% was principally attributable to a 5.5%, or $27.9 million, increase in watch sales, partially offset by an 11.5%, or $21.6 million, decrease in our accessories businesses. Our jewelry and leather categories experienced sales volume declines of 13.2%, or $15.3 million, and 8.5%, or $4.0 million, respectively, while our sunglass business decreased 26.8%, or
$3.0 million. We believe a challenging macro environment in Europe was a contributing factor to the reduction in sales growth in addition to our repositioning of the FOSSIL jewelry brand. On a geographical basis, we experienced a reduction in shipments to our Spain joint venture and sales volume declines in Italy and Germany, while sales volumes increased in France and the United Kingdom. Additionally, sales to our third party distributors, located primarily in Eastern Europe and the Middle East, favorably impacted European wholesale net sales in fiscal year 2012, increasing 10.3%, or $12.5 million, as a result of increased sell through.
Asia Pacific Wholesale Net Sales. In fiscal year 2012, Asia Pacific wholesale net sales increased 22.8%, or $67.7 million, including $9.2 million of sales of SKAGEN branded products. Excluding sales of SKAGEN branded products, net sales grew 19.7%, primarily attributable to increased watch sales of $56.8 million. At the end of fiscal year 2012, we operated 270 concession locations in the Asia Pacific region with a net 56 new concessions opened during the last twelve months. For the 2012 fiscal year, Asia Pacfic concession sales increased by 22.8% with comparable store sales growing 1.5% in comparison to the prior fiscal year. We believe these concessions represent a large opportunity for us in that they allow us to control the brand presentation and customer experience at the point of sale and capture the full retail price. While the increase in concession locations as well as the addition of duty free business favorably impacted sales growth in Asia during fiscal year 2012, the rate of growth slowed during the back half of the year.
Direct to Consumer Net Sales. Direct to consumer net sales increased 19.1%, or $116.2 million, during fiscal year 2012, principally the result of comparable store sales increases of 3.1% and square footage growth of 20.3% during the fiscal year. During fiscal year 2012, comparable store sales related to our global full price accessory concept decreased by 2.0%, primarily driven by declines in our European-based stores. Our global outlet stores experienced comparable store sales growth of 8.4% with positive results in each of our major geographies. Additionally, our Direct to consumer segment was favorably impacted in fiscal year 2012 by an increase of $3.2 million in e-commerce sales, primarily driven by the launch of our France-based e-commerce business as well as modest growth in our other international-based e-commerce sites.
The following table sets forth the number of stores by brand and concept as of December 29, 2012 and December 31, 2011:
| | December 29, 2012 | December 31, 2011 | |||||||||||||||||
|---|---|---|---|---|---|---|---|---|---|---|---|---|---|---|---|---|---|---|---|
| | North America | Outside of North America | Total | North America | Outside of North America | Total | |||||||||||||
FOSSIL accessory stores | 106 | 145 | 251 | 103 | 142 | 245 | |||||||||||||
FOSSIL outlet stores | 77 | 45 | 122 | 65 | 25 | 90 | |||||||||||||
Watch Station International outlet stores | 22 | 13 | 35 | 10 | 4 | 14 | |||||||||||||
Outlet stores | 99 | 58 | 157 | 75 | 29 | 104 | |||||||||||||
FOSSIL clothing stores | 31 | 2 | 33 | 32 | 4 | 36 | |||||||||||||
Full-price Watch Station International | 5 | 6 | 11 | 2 | 2 | 4 | |||||||||||||
Other full-price multi-brand | 0 | 7 | 7 | 0 | 9 | 9 | |||||||||||||
Full-price multi-brand | 5 | 13 | 18 | 2 | 11 | 13 | |||||||||||||
SKAGEN stores | 6 | 8 | 14 | 0 | 0 | 0 | |||||||||||||
Total stores | 247 | 226 | 473 | 212 | 186 | 398 | |||||||||||||
During fiscal year 2012, we opened 92 new stores and closed 17 stores. During fiscal year 2013, we anticipate opening approximately 70 to 75 additional retail stores and closing approximately 12 stores
globally. A store is included in comparable store sales in the thirteenth month of operation. Stores that experience a gross square footage increase of 10% or more due to an expansion and/or relocation are removed from the comparable store sales base, but are included in total sales. These stores are returned to the comparable store sales base in the thirteenth month following the expansion and/or relocation.
Gross Profit. Gross profit of $1.6 billion in fiscal year 2012 represented an increase of 11.6% in comparison to $1.4 billion in fiscal year 2011. Gross profit margin increased 10 basis points to 56.2% in fiscal year 2012 compared to 56.1% in the prior fiscal year. Foreign currency exchange rates negatively impacted gross profit margin by approximately 110 basis points during fiscal year 2012. Excluding the impact of currency, gross profit margin was favorably impacted by increases in the sales mix of higher margin watch products versus leather products, select price increases across certain businesses, production efficiencies, an increase in the Direct to consumer and Asia Pacific wholesale distribution channels and outlet expansion. The success of our efforts to reduce the number of our SKUs has reduced our liquidation needs and our margins on liquidated products have improved as a greater mix of sales are flowing through our outlets rather than third party liquidators.
Our consolidated gross profit margin is also impacted by our diversified business model that includes but is not limited to: (i) a significant number of product categories we distribute, (ii) the multiple brands we offer within several product categories, (iii) the geographical presence of our businesses, and (iv) the different distribution channels we sell to or through. The components of this diversified business model produce varying ranges of gross profit margin. Generally, on a historical basis, our fashion branded watch, jewelry and sunglass offerings produce higher gross profit margins than our leather goods offerings. In addition, in most product categories that we offer, brands with higher retail price points generally produce higher gross profit margins compared to those of lower retail priced brands. From a segment standpoint, our Direct to consumer business generally produces the highest gross profit margin as a result of these sales being direct to the ultimate consumer. Gross profit margins related to sales in our international wholesale segments are historically lower than our Direct to consumer segment, but historically higher than our North America wholesale segment primarily due to the following factors: (i) premiums charged in comparison to retail prices on products sold in the U.S.; (ii) the product sales mix in our international wholesale segments, in comparison to our North America wholesale segment, are comprised more predominantly of watches and jewelry that generally produce higher gross profit margins than leather goods; (iii) the watch sales mix in our international wholesale segments, in comparison to our North America wholesale segment, are comprised more predominantly of higher priced licensed brands; and (iv) concessions sales in our Asia Pacific wholesale segment where we capture the full retail price.
Operating Expenses. Operating expenses increased by $150.5 million, and as a percentage of net sales, increased to 39.1% in fiscal year 2012 compared to 37.7% in fiscal year 2011. The translation of foreign-based expenses in fiscal year 2012 decreased operating expenses by approximately $18.7 million as a result of the stronger U.S dollar. Non-recurring acquisition and transition costs associated with the Skagen Designs acquisition totaled $8.7 million. These non-recurring costs were offset by a $9.9 million favorable adjustment resulting from the revaluation of a contingent consideration liability related to the purchase. On a constant dollar basis and excluding non-recurring expenses related to the Skagen Designs acquisition, operating expense increases were primarily attributable to expenses associated with an increase in the number of Company-owned retail stores and expense increases across our wholesale and corporate segments. Expense growth in our wholesale segments was largely a result of infrastructure investments primarily related to headcount additions and Asia Pacific concession-related costs. Expense increases in the Direct to consumer segment were primarily attributable to the 14.3% growth in retail stores. Expense growth in the corporate cost area was primarily attributable to increased payroll costs due to headcount additions and equity-based compensation and other infrastructure expenses.
The following table sets forth operating expenses on a segment basis and the relative percentage of operating expenses to net sales for each segment for the fiscal years indicated (in millions, except for percentage data):
| | 2012 | 2011 | |||||||||||
|---|---|---|---|---|---|---|---|---|---|---|---|---|---|
Fiscal Year | Operating Expense | % of Net Sales | Operating Expense | % of Net Sales | |||||||||
North America wholesale | $ | 200.4 | 18.5 | % | $ | 165.4 | 17.1 | % | |||||
Europe wholesale | 210.5 | 30.2 | 199.2 | 28.6 | |||||||||
Asia Pacific wholesale | 170.0 | 47.0 | 134.1 | 45.2 | |||||||||
Direct to consumer | 379.4 | 53.0 | 322.7 | 53.1 | |||||||||
Corporate | 157.4 | 145.8 | |||||||||||
Total | $ | 1,117.7 | 39.1 | % | $ | 967.2 | 37.7 | % | |||||
Operating Income. Operating income increased $16.8 million, or 3.6%, in fiscal year 2012. As a percentage of net sales, operating income decreased to 17.1% of net sales in fiscal year 2012 compared to 18.4% of net sales in the prior fiscal year, primarily as a result of a 140 basis point decrease in operating expense leverage. During fiscal year 2012, operating income was negatively impacted by approximately $43.8 million as a result of the translation of foreign-based sales and expenses into U.S. dollars. Excluding the impact of foreign currency rate changes, fiscal year 2012 operating income, as a percentage of net sales, would have approximated 18.3%.
Interest Expense. Interest expense increased by $2.8 million in fiscal year 2012, primarily driven by interest expense on borrowings against our revolving credit facility, partially related to the acquisition of Skagen Designs and purchases of common stock under our stock repurchase programs. To a lesser extent, interest expense increased as a result of participation by our Asia Pacific and Mexican subsidiaries in our intercompany cash pool at interest rates in excess of those earned on cash deposits by our European subsidiaries participating in the pool.
Other Income (Expense)—Net. Other income (expense)—net primarily reflects foreign currency transaction gains or losses resulting from mark-to-market, hedging and other transactional activities, equity in the earnings or losses of our non-consolidated joint venture in Spain and interest income from investments. During fiscal year 2012, other income (expense)—net changed favorably by approximately $26.6 million, primarily driven by net foreign currency transaction gains of $5.6 million in fiscal year 2012, as compared to net foreign currency transaction losses of $20.7 million in fiscal year 2011.
Provision for Income Taxes. Income tax expense for fiscal year 2012 was $138.0 million, resulting in an effective tax rate of 28.0%, compared to 31.9% in fiscal year 2011. Fiscal year 2012 income tax expense was favorably impacted by management's determination in fiscal 2012 to reinvest undistributed earnings and profits of certain foreign subsidiaries and the recognition of previously unrecognized income tax benefits in connection with the completion of prior year income tax audits during the fiscal year.
Net Income Attributable to Noncontrolling Interest. Net income attributable to noncontrolling interest, which represents the minority interest portion of subsidiaries in which we own less than 100%, decreased $1.8 million for fiscal year 2012. This decrease was primarily a result of our acquiring the remaining noncontrolling interests of our Mexico subsidiaries and decreased net income related to our less than 100% owned watch assembly facilities.
Net Income Attributable to Fossil, Inc. Fiscal year 2012 net income attributable to Fossil, Inc. increased 16.5% to $343.4 million, or $5.59 per diluted share, in comparison to $294.7 million, or $4.61 per diluted share, in the prior fiscal year. Net income attributable to Fossil, Inc. for fiscal year 2012 included net foreign currency losses of $0.21 per diluted share and a $0.22 per diluted share benefit as
a result of a 4.0% lower outstanding share count due to common stock repurchases under our ongoing stock repurchase program.
Fiscal Year 2011 Compared to Fiscal Year 2010
Net Sales. The following table illustrates by factor the total year-over-year percentage change in net sales by segment and on a consolidated basis:
| | Exchange Rates | Organic Change | Total Change | |||||||
|---|---|---|---|---|---|---|---|---|---|---|
North America wholesale | 0.1 | % | 24.1 | % | 24.2 | % | ||||
Europe wholesale | 5.1 | 21.9 | 27.0 | |||||||
Asia Pacific wholesale | 6.7 | 27.8 | 34.5 | |||||||
Direct to consumer | 2.1 | 23.6 | 25.7 | |||||||
Consolidated | 2.6 | % | 23.8 | % | 26.4 | % | ||||
The following net sales discussion excludes the impact on sales growth attributable to foreign currency rate changes as noted in the above table.
Consolidated Net Sales. We believe watch sales across all of our operating segments benefited from a resurgence in the watch category in general, resulting in consumers allocating more of their discretionary spending to this fashion category. We also believe our results outpaced those of our competitors as consumers responded positively to our innovative product offerings and focused presentations at retail. We attributed this favorable consumer response to our designs, which incorporated newer materials into the construction of the watch while also maintaining a very strong price to value relationship. With respect to the FOSSIL brand, we have followed a strategy of focusing our marketing efforts on point-of-sale presentations, as well as our catalog and web-based marketing initiatives and the growth of our FOSSIL store and e-commerceecommerce footprint. We believe these strategies are clearly communicatingcommunicated the aspirational lifestyle image of the brand and are resonatingresonated strongly with consumers around the world. Net sales of FOSSIL branded products increased by 17.3% during fiscal year 2011.
North America Wholesale Net Sales.Net sales in the North America wholesale segment rose 24.1%, or $187.4 million, during fiscal year 2011, including double-digit sales growth across all major product categories. Watch sales increased 29.5%, or $162.7 million, representing broad-based growth across brands. Licensed brand watch sales were led by sales volume increases in MICHAEL KORS of $83.1 million, DIESEL of $14.3 million, ARMANI EXCHANGE of $11.8 million, MARC BY MARC JACOBS of $10.8 million, BURBERRY of $8.5 million and EMPORIO ARMANI of $8.2 million. Additionally, FOSSIL and RELIC watch sales volumes increased $16.4 million and $4.8 million, respectively. These increases were partially offset by sales volume
46
declines of $4.5 million in our mass market business. Shipments to third party distributors, located primarily in South America, increased by 47.9%, or $36.9 million, during fiscal year 2011. MICHAEL KORS sales volume increases were primarily attributable to increased case space allocated by retailers in the department store channel as a result of strong sell-through rates and door expansion in MICHAEL KORS boutiques. DIESEL, ARMANI EXCHANGE and EMPORIO ARMANI sales volume increases were principally driven by increased doors with existing customers in the department store channel. DIESEL sales volumes also benefitted from a shift in the sales mix to higher price points. Increases in MARC BY MARC JACOBS and BURBERRY were primarily a result of increased sell-through rates with existing customers in the department store channel. We believe the RELIC sales volumes were favorably impacted by an upward trend in the overall fashion watch category in the mid-tier department store channel. Decreased sales volumes in our mass market distribution channel were principally driven by retailers destocking inventory levels.
The leather and jewelry categories also contributed to the sales volume growth in North America during fiscal year 2011, increasing 11.5%, or $19.7 million, and 24.0%, or $5.4 million, respectively. Growth in the leathers business was primarily attributable to FOSSIL women’swomen's and men’smen's leather sales volume increases of $14.4 million and $4.9 million, respectively. The FOSSIL leathers business was favorably impacted by increased sell-through rates at retail and increased average unit retail prices as a result of introducing a growing selection of higher quality details and fabrications in our leather products. Increases in the jewelry category were primarily the result of the launch of MICHAEL KORS jewelry during fiscal year 2011, which contributed $6.4 million, partially offset by a sales volume decline of $2.4 million in FOSSIL accessory jewelry as a result of lower sell-through rates in fiscal year 2011 as compared to the prior fiscal year.
Europe Wholesale Net SalesSales.. Europe wholesale net sales rose 21.9%, or $119.9 million, during fiscal year 2011, primarily as a result of a 22.7%, or $90.0 million, increase in watch shipments. All key markets and major watch brands experienced growth, with the greatest gains delivered by MICHAEL KORS of $23.5 million, FOSSIL of $21.5 million, DKNY of $11.2 million, DIESEL of $10.0 million and EMPORIO ARMANI and BURBERRY of $8.9 million each. Sales growth in MICHAEL KORS primarily resulted from increased door growth in the region as well as the continuing brand building initiatives by the licensor. We believe the growth in all of our other watch brands was a result of consumers’consumers' positive response to our focused and innovative designs, lifestyle brand imaging and the strong price to value relationship of our product offerings in comparison to our competitors in the region. The leather and jewelry businesses also favorably impacted fiscal year 2011 by increasing 71.8%, or $19.0 million, and 11.0%, or $11.2 million, respectively. The leather business continues to expand in Europe as a result of the increased FOSSIL brand awareness generated from the growing number of retail stores and websites launched in key markets. Additionally, during fiscal year 2011, sales to third party distributors, located primarily in Eastern Europe and the Middle East, rose 40.3%, or $35.1 million, as a result of increased brand awareness and higher sell-through rates.
Asia Pacific Wholesale Net Sales.In fiscal year 2011, Asia Pacific wholesale net sales increased 27.8%, or $61.4 million. This increase was principally attributable to increases in our watch and leather categories of 32.1%, or $61.0 million, and 36.2%, or $4.6 million, respectively. These sales volume gains were partially offset by a 42.9%, or $5.2 million, decrease in jewelry sales volumes primarily as a result of discontinuing a non-strategic, local jewelry brand in India. Our business model in Asia is focused on expanding our concessions model across key markets while exploring opportunities to further advance the FOSSIL brand across the region. Combined sales volumes in our strategic markets of China, Korea and Japan increased 39.7% during fiscal year 2011 as compared to the prior fiscal year. At the end of fiscal year 2011, we operated 213 concession locations in Asia with a net 52 new concessions opened during the last twelve months. For the 2011 fiscal year, concession sales increased by 74.1% with comparable store sales growing 24.1% in comparison to the prior fiscal year. These concessions represent a large opportunity for us in that they allow us to control the brand presentation and customer experience at the point of sale and capture the full retail price.
We believe our diverse global distribution network, including owned distribution in 22 countries, combined with our design and marketing capabilities, will allow us to continue to take shelf space from lesser known local
47
and regional brands as we continue to increase brand awareness through the growth of our retail stores and introduction of new websites in many of the countries in which we operate. We also believe that investments we have made in certain emerging markets will allow us to experience higher levels of growth in our international wholesale segments in comparison to our North America wholesale segment.
Direct to Consumer Net Sales.Direct to consumer net sales increased 23.6%, or $113.8 million, during fiscal year 2011, principally the result of comparable store sales increases of 17.4% and a 6.1% increase in the average number of stores open during the fiscal year. The emphasis we have placed upon engaging our customers within our redesigned store environment and the focus on our proven selling metrics has improved store productivity. During fiscal year 2011, comparable store sales related to our global full pricefull-price accessory concept increased by 11.5%, while our global outlet stores experienced comparable store sales growth of 26.2%. Additionally, our Direct to consumer segment was favorably impacted in fiscal year 2011 by $5.0 million of additional e-commerce sales, primarily driven by our U.S., Germany and U.K.-based e-commerce businesses. In December, our most productive month for e-commerce, our e-commerce business increased by 11.7% in 2011 as compared to December 2010.
We ended fiscal year 2011 with 398 stores, including 245 full price accessory stores, 142 of which were outside of North America, 104 outlet locations, including 29 outside of North America, 36 clothing stores, including 4 outside of North America, and 13 full price multi-brand stores, including 11 outside of North America. This compares to 364 stores at the end of fiscal year 2010, including 230 full price accessory stores, 127 of which were outside of North America, 93 outlet locations, including 22 outside of North America, 31 clothing stores, including 3 outside of North America, and 10 full price multi-brand stores, including 9 outside of North America. During fiscal year 2011, we opened 51 new stores and closed 17 stores. During fiscal year 2012, we anticipate opening approximately 70 to 75 additional retail stores and closing approximately 18 stores globally.
A store is included in comparable store sales in the thirteenth month of operation. Stores that experience a gross square footage increase of 10% or more due to an expansion and/or relocation are removed from the comparable store sales base, but are included in total sales. These stores are returned to the comparable store sales base in the thirteenth month following the expansion and/or relocation. During 2006, we entered into an agreement with the House of Fraser, a U.K.-based department store (“HOF”), which allows us to operate the watch department in certain HOF stores. Under this agreement, we own the inventory within the HOF store, provide the labor to operate the department and pay HOF a commission on the retail watch sales generated in the stores. Although we include the net sales derived from the HOF stores in our Direct to consumer segment, we do not include the number of locations associated with this agreement in our retail store count or in our comparable store sales.
Gross Profit.Gross profit of $1.4 billion in fiscal year 2011 represented an increase of 24.6% in comparison to $1.2 billion in the prior fiscal year. This increase was primarily a result of an increase in
net sales partially offset by a reduction in gross profit margin. Gross profit margin decreased 80 basis points to 56.1% in fiscal year 2011 compared to 56.9% in the prior fiscal year. The decrease in gross profit margin was primarily driven by increased production costs, lower margin sales to off-price retailers and, to a lesser extent, an increase in the sales mix of lower margin sales to third party distributors. Partially offsetting these declines in gross profit margin was an increase in the mix of sales of higher margin watch products in comparison to leather products, including a greater mix of higher margin licensed watch brands in fiscal year 2011 as compared to the prior fiscal year. Additionally, the impact of a weaker U.S. dollar during fiscal year 2011 in comparison to the prior fiscal year benefitted gross profit margin by approximately 180 basis points.
Our consolidated gross profit margin is also impacted by our diversified business model that includes but is not limited to: (i) a significant number of product categories we distribute, (ii) the multiple brands we offer within several product categories, (iii) the geographical presence of our businesses, and (iv) the different distribution channels we sell to or through. The components of this diversified business model produce varying ranges of gross profit margin. Generally, on a historical basis, our fashion branded watch, jewelry and sunglass
48
offerings produce higher gross profit margins than our leather goods categories. In addition, in most product categories that we offer, brands with higher retail price points generally produce higher gross profit margins compared to those of lower retail priced brands. From a segment standpoint, our Direct to consumer business generally produces the highest gross profit margin as a result of these sales being direct to the ultimate consumer. Gross profit margins related to sales in our international wholesale segments are historically lower than our Direct to consumer segment, but historically higher than our North America wholesale segment primarily due to the following factors: (i) premiums charged in comparison to retail prices on products sold in the U.S., (ii) the product sales mix in our international wholesale segments, in comparison to our North America wholesale segment, are comprised more predominantly of watches and jewelry that generally produce higher gross profit margins than leather goods; and (iii) the watch sales mix in our international wholesale segments, in comparison to our North America wholesale segment, are comprised more predominantly of higher priced licensed brands.
Operating Expenses.Operating expenses, expressed as a percentage of net sales, decreased to 37.7% in fiscal year 2011 compared to 38.3% in the prior fiscal year. Total operating expenses in fiscal year 2011 increased by $188.4 million, primarily as a result of increased sales. The translation of foreign-based expenses in fiscal year 2011 increased operating expenses by $23.3 million as a result of the weaker U.S. dollar, in comparison to the prior fiscal year. Excluding currency effects, fiscal year 2011 operating expenses in our wholesale segments, Direct to consumer segment and corporate cost areas increased by $76.9 million, $57.6 million and $30.6 million, respectively, as compared to the prior fiscal year. A majority of the expense growth in the wholesale segments was related to ongoing investments in the Asia region. Expense growth in other regions was primarily related to increased compensation costs and marketing expenses. Expense increases in the Direct to consumer segment were primarily attributable to store growth, increased web-based marketing expenditures, expansion of our catalog costs and costs associated with the launch and ongoing expenses of our customer relationship management initiative. Expense growth in the corporate cost area was primarily attributable to increased payroll costs due to headcount additions and incentive and equity-based compensation, and operating costs and incurring expenses to move into our new corporate headquarters. In addition, fiscal year 2010 included a non-cash charge of approximately $3.7 million related to an other than temporary fixed asset impairment.
The following table sets forth operating expenses on a segment basis and the relative percentage of operating expenses to net sales for each segment for the fiscal years indicated (in millions, except for percentage data):
Fiscal Year | 2011 | 2010 | ||||||||||||||
| Operating Expense | % of Net Sales | Operating Expense | % of Net Sales | |||||||||||||
North America wholesale | $ | 165.4 | 17.1 | % | $ | 146.3 | 18.8 | % | ||||||||
Europe wholesale | 199.2 | 28.6 | 164.1 | 30.0 | ||||||||||||
Asia Pacific wholesale | 134.1 | 45.2 | 96.1 | 43.5 | ||||||||||||
Direct to consumer | 322.7 | 53.1 | 258.2 | 53.4 | ||||||||||||
Corporate | 145.8 | 114.1 | ||||||||||||||
|
|
|
|
|
|
|
| |||||||||
Total | $ | 967.2 | 37.7 | % | $ | 778.8 | 38.3 | % | ||||||||
|
|
|
|
|
|
|
| |||||||||
| | 2011 | 2010 | |||||||||||
|---|---|---|---|---|---|---|---|---|---|---|---|---|---|
Fiscal Year | Operating Expense | % of Net Sales | Operating Expense | % of Net Sales | |||||||||
North America wholesale | $ | 165.4 | 17.1 | % | $ | 146.3 | 18.8 | % | |||||
Europe wholesale | 199.2 | 28.6 | 164.1 | 30.0 | |||||||||
Asia Pacific wholesale | 134.1 | 45.2 | 96.1 | 43.5 | |||||||||
Direct to consumer | 322.7 | 53.1 | 258.2 | 53.4 | |||||||||
Corporate | 145.8 | 114.1 | |||||||||||
Total | $ | 967.2 | 37.7 | % | $ | 778.8 | 38.3 | % | |||||
Operating Income. Operating income increased $95.6 million, or 25.4%, in fiscal year 2011. As a percentage of net sales, operating income decreased slightly to 18.4% of net sales in fiscal year 2011 compared to 18.5% of net sales in the prior fiscal year, primarily as a result of a decrease in gross profit margin, partially offset by 60 basis points of operating expense leverage. During fiscal year 2011, operating income was positively impacted by approximately $39.2 million as a result of the translation of foreign-based sales and expenses into U.S. dollars.
Interest Expense. Interest expense increased by $1.3 million in fiscal year 2011, primarily driven by increased participation by our Asia Pacific subsidiaries in our intercompany cash pool at interest rates in excess of those earned on cash deposits by our European subsidiaries participating in the pool.
49
Other Income (Expense) Income-Net.—Net. Other income (expense) income-net—net primarily reflects interest income from investments, foreign currency transaction gains or losses resulting from mark-to-market, hedging and other transactional activities, and equity in the earnings or losses of our non-consolidated joint venture in Spain. During fiscal year 2011, other income (expense) income-net—net changed unfavorably by approximately $27.0 million, primarily driven by net foreign currency transaction losses of $20.7 million in fiscal year 2011, as compared to net foreign currency transaction gains of $5.2 million in fiscal year 2010.
Provision for Income Taxes. Income tax expense for fiscal year 2011 was $144.2 million, resulting in an effective tax rate of 31.9%, compared to 31.1% in fiscal year 2010. Fiscal year 2011 income tax expense was positively impacted due to certain tax provision offsets carrying a higher effective tax rate. Fiscal year 2010 income tax expense was favorably impacted by the recognition of previously unrecognized income tax benefits in connection with the completion of prior year income tax audits during the fiscal year.
Net Income Attributable to Noncontrolling Interest.Net income attributable to noncontrolling interest, which represents the minority interest portion of subsidiaries in which we own less than 100%, increased $3.0 million for fiscal year 2011. This increase was primarily a result of increased net income related to our less than 100% owned watch assembly facilities.
Net Income Attributable to Fossil, Inc. Fiscal year 2011 net income attributable to Fossil, Inc. increased 15.5% to $294.7 million, or $4.61 per diluted share, in comparison to $255.2 million, or $3.77 per diluted share, in the prior fiscal year. Net income attributable to Fossil, Inc. for fiscal year 2011 included net foreign currency gains of $0.14 per diluted share and a $0.26 per diluted share benefit as a result of a 5.5% lower outstanding share count related to our ongoing stock repurchase program.
Fiscal Year 2010 Compared to Fiscal Year 2009
Net Sales.The following table illustrates by factor the total year-over-year percentage change in net sales by segment and on a consolidated basis:
| Exchange Rates | Organic Change | Total Change | ||||||||||
North America wholesale | 0.7 | % | 40.7 | % | 41.4 | % | ||||||
Europe wholesale | (5.6 | ) | 22.8 | 17.2 | ||||||||
Asia Pacific wholesale | 8.6 | 35.0 | 43.6 | |||||||||
Direct to consumer | (0.5 | ) | 29.0 | 28.5 | ||||||||
Consolidated | (0.7 | )% | 31.9 | % | 31.2 | % | ||||||
The following net sales discussion excludes the impact on sales growth attributable to foreign currency rate changes as noted in the above table.
North America Wholesale Net Sales.Net sales in the North America wholesale segment, which consists of our operations in the U.S., Canada, Mexico and sales to third-party distributors in South America, increased 40.7%, or $224.4 million, during fiscal year 2010. We attribute this increase to consumers’ positive reactions to our innovative product offerings and an upward trend in the fashion watch category. These favorable watch sales trends have prompted retailers to place greater emphasis on the category by increasing staff to service the watch customer, increasing open-to-buy dollars and expanding marketing initiatives, thereby further accelerating net sales. The increased sell-through rates of our watch products at our retailers have also resulted in these customers restocking inventories during fiscal year 2010, after heavily destocking inventory levels in fiscal year 2009 due to the economic downturn. Additionally, our customers have been increasing the level of inventories in certain situations, including allocating additional retail space within their stores, to meet the increased demand for our watch products. As a result of the acceleration in sales in fiscal year 2010 in comparison to the destocking activity in fiscal year 2009, North American wholesale watch shipments increased by 60.9%, or $207.9 million, in fiscal year 2010. Licensed brands, FOSSIL and MICHELE represented the strongest net sales contributions,
50
increasing by 113.9%, 35.4% and 49.7%, respectively. Licensed brand watch sales were primarily led by sales volume increases in MICHAEL KORS of 218.4%, or $95.5 million, and, to a lesser extent, increases in EMPORIO ARMANI of 48.8%, DIESEL of 61.0%, DKNY of 46.8% and MARC BY MARC JACOBS of 61.0%. In addition, our RELIC watch business increased 20.8% during fiscal year 2010. MICHAEL KORS sales volumes were principally driven by innovative designs, increased sell-through rates at retail and additional case space allocated by retailers in the department store channel.
Our accessories business, which includes our men’s and women’s leather, jewelry, and other non-watch categories, also contributed to the growth in North America as net sales volumes increased 7.9%, or $16.5 million, in fiscal year 2010. This increase was primarily a result of sales volume growth in FOSSIL accessory jewelry, shoes, women’s small leathers, and sunglasses which had sales increases of 67.6%, 122.2%, 27.2% and 3.6%, respectively. Both our accessory jewelry and shoes categories were launched into the department store channel in the last two years and are still experiencing both door growth and, in some cases, assortment expansion. These increases were partially offset by sales volume declines of 2.6% and 3.8% in women’s bags and men’s leather products, respectively.
Europe Wholesale Net Sales.Net sales in our Europe wholesale segment increased 22.8%, or $106.4 million, during fiscal year 2010. During fiscal year 2010, our Europe wholesale segment benefited from a similar level of increased consumer response to new designs as we experienced in the North America wholesale segment. Additionally, Europe wholesale net sales increases in fiscal year 2010 benefited from similar de-stocking activities to that experienced in our North America wholesale segment, primarily during the last nine months of fiscal year 2009. Watch sales experienced the most significant growth, increasing 23.3%, or $78.5 million. All major watch brands contributed to this growth with increases of 19.7% in FOSSIL, 24.3% in EMPORIO ARMANI, 101.3% in MICHAEL KORS, 26.6% in DIESEL and 18.2% in DKNY representing the strongest performances. During fiscal year 2010, our jewelry and leather categories also delivered strong double-digit increases of 21.0% and 46.7%, respectively. We believe net sales increases in our jewelry category were positively impacted by trends similar to those that we experienced in our watch business. We believe the growth experienced in our leather products business in fiscal year 2010 was a result of our initiative to expand our leather offerings in our wholesale channel by leveraging the increased brand awareness generated by the expansion of our FOSSIL accessory store concept in the region over the last two years. In addition, shipments to third-party distributors increased 45.4% in fiscal year 2010, which we believe was principally related to increased sell-through rates of our fashion watch offerings and to our distributors replenishing inventory during fiscal year 2010 in comparison to destocking inventory in the prior fiscal year.
Asia Pacific Wholesale Net Sales.In fiscal year 2010, Asia Pacific wholesale shipments increased 35.0%, or $53.8 million, primarily a result of a 39.6% increase in licensed brand watch sales and, to a lesser extent, increases of 19.4% in FOSSIL watches and 55.2% in leather products. Licensed brand watch sales were led by increases of 43.0% in EMPORIO ARMANI, 127.8% in MARC BY MARC JACOBS and 54.0% in BURBERRY. In addition to consumers responding favorably to new designs, we believe the growth in our watch business was due to the growth in our retail concession base across many of our markets within this segment, including the transition of our South Korean operations from a third-party distributor to a Company-owned subsidiary during the 2010 fiscal year. The net sales growth in the South Korea market represented 46.6% of the $53.8 million in net sales that we added within this segment in fiscal year 2010 in comparison to fiscal year 2009. The growth in the leather category in fiscal year 2010 was a result of our initiative to broaden distribution of the category by leveraging the FOSSIL brand awareness created from an expanded FOSSIL accessory store base in this region.
Direct to Consumer Net Sales.Direct to consumer net sales increased 29.0%, or $108.9 million, during fiscal year 2010, principally the result of comparable store sales increases of 19.0% and a 5.9% increase in the average number of stores open during the fiscal year. Additionally, our Direct to consumer segment was favorably impacted in fiscal year 2010 by growth of 50.2% in e-commerce sales primarily driven by our U.S. and Germany-based e-commerce businesses. During fiscal year 2010, comparable store sales related to our global full
51
price accessory concept increased by 15.9%, while our global outlet stores experienced comparable store sales growth of 21.1%. We believe the growth in our Direct to consumer business was attributable to consumers’ positive response to the focused point of view and imagery of the FOSSIL brand, the continuous introduction of new and innovative designs and materials, increased catalog mailings and expanded e-commerce marketing activities.
We ended fiscal year 2010 with 364 stores, including 230 full price accessory stores, 127 of which were outside of North America, 93 outlet locations, including 22 outside of North America, 31 clothing stores, including 3 outside of North America, and 10 full price multi-brand stores, including 9 outside of North America. This compares to 354 stores at the end of fiscal year 2009, including 218 full price accessory stores, 116 of which were outside of North America, 90 outlet locations, including 15 outside of North America, 33 clothing stores, all in North America, and 13 full price multi-brand stores, including 11 outside of North America. During fiscal year 2010, we opened 33 new stores and closed 23 stores.
Gross Profit.Gross profit of $1.2 billion in fiscal year 2010 represented an increase of 36.7% in comparison to $844.9 million in the prior fiscal year. This increase was primarily a result of an increase in net sales and gross profit margin expansion. Gross profit margin increased 230 basis points to 56.9% in fiscal year 2010 compared to 54.6% in the prior fiscal year. The increase in gross profit margin was principally driven by an increase in the mix of sales of higher margin watch products in comparison to leather products, including a greater mix of higher margin licensed watch brands, and higher gross margins experienced in outlet stores. Gross profit margin was also favorably impacted by a combination of decreased component costs associated with some of the new materials we incorporated into our watch designs and higher retail prices. These increases in gross profit margin were partially offset by a stronger U.S. dollar, which unfavorably impacted gross profit margin by approximately 20 basis points during fiscal year 2010, and increased input costs related to payroll as a result of wage increases across our China assembly operations and third-party component manufacturers.
Operating Expenses.Total operating expenses increased $145.5 million to $778.8 million in fiscal year 2010. Expressed as a percentage of net sales, operating expenses decreased to 38.3% in fiscal year 2010 compared to 40.9% in the prior fiscal year and included a favorable impact of approximately $3.5 million related to the translation of foreign-based expenses due to a stronger U.S. dollar. On a constant dollar basis, operating expenses in our wholesale segments, Direct to consumer segment and corporate cost areas increased by $78.9 million, $35.7 million and $34.4 million, respectively, in fiscal year 2010. Expense growth in the wholesale segments was principally a result of increased marketing expenses and compensation costs. Expense increases in the Direct to consumer segment were primarily attributable to store growth, expansion of our catalog mailings and increased web-based marketing expenditures. Expense growth in the corporate cost area was primarily associated with increased compensation costs, including a $3.8 million increase in equity compensation expense, and a non-cash charge of approximately $3.7 million related to an other than temporary fixed asset impairment.
The following table sets forth operating expenses on a segment basis and the relative percentage of operating expenses to net sales for each segment for the fiscal years indicated (in millions, except for percentage data):
Fiscal Year | 2010 | 2009 | ||||||||||||||
| Operating Expense | % of Net Sales | Operating Expense | % of Net Sales | |||||||||||||
North America wholesale | $ | 146.3 | 18.8 | % | $ | 118.9 | 21.6 | % | ||||||||
Europe wholesale | 164.1 | 30.0 | 146.0 | 31.3 | ||||||||||||
Asia Pacific wholesale | 96.1 | 43.5 | 66.9 | 43.5 | ||||||||||||
Direct to consumer | 258.2 | 53.4 | 222.6 | 59.2 | ||||||||||||
Corporate | 114.1 | 78.8 | ||||||||||||||
|
|
|
|
|
|
|
| |||||||||
Total | $ | 778.8 | 38.3 | % | $ | 633.2 | 40.9 | % | ||||||||
|
|
|
|
|
|
|
| |||||||||
52
Operating Income.Operating income increased by 77.9% to $376.4 million in fiscal year 2010 compared to $211.6 million in fiscal year 2009. Operating income margin increased by 480 basis points to 18.5% of net sales in fiscal 2010 compared to 13.7% in the prior fiscal year, principally as a result of increased net sales, gross profit margin expansion and a decrease in operating expenses as a percentage of sales. Operating income included approximately $6.8 million of net currency losses in fiscal year 2010 related to the translation of foreign-based sales and expenses into U.S. dollars.
Interest Expense. Interest expense increased by $884,000 in fiscal year 2010, primarily driven by increased participation by our Asia Pacific subsidiaries in our intercompany cash pool at interest rates in excess of those earned on cash deposits by our European subsidiaries in the pool.
Other (Expense) Income - Net. Other (expense) income - net primarily reflects interest income from investments, foreign currency transaction gains or losses resulting from mark-to-market, hedging and other transactional activities, and equity in the earnings or losses of our non-consolidated joint venture in Spain. During fiscal year 2010, other (expense) income - net changed favorably by approximately $409,000 as compared to fiscal year 2009, primarily driven by increased equity earnings of our non-consolidated joint venture in Spain and increased interest income, partially offset by decreased net foreign currency transaction gains.
Provision for Income Taxes. Income tax expense for fiscal 2010 was $119.3 million, resulting in an effective tax rate of 31.1%, compared to 34.4% in fiscal year 2009. Fiscal year 2010 income tax expense was favorably impacted by the recognition of previously unrecognized income tax benefits in connection with the completion of prior year income tax audits during the fiscal year.
Net Income Attributable to Noncontrolling Interest.Net income attributable to noncontrolling interest, which represents the minority interest portion of subsidiaries in which we own less than 100%, increased $4.6 million for fiscal year 2010. This increase is a result of increased net income related to our less than 100% wholly-owned subsidiaries with a substantial portion of this increase attributable to the net income related to one of our watch assembly facilities.
Net Income Attributable to Fossil, Inc. Fiscal year 2010 net income attributable to Fossil, Inc. increased 83.4% to $255.2 million, or $3.77 per diluted share, in comparison to $139.2 million, or $2.07 per diluted share, in the prior fiscal year. Fiscal year 2010 earnings per diluted share of $3.77 included an approximate $0.07 diluted earnings per share reduction related to foreign currency rate changes.
Effects of Inflation
Although inflation in raw materials and production costs have had a negative impact on our gross profit margins, we do not believe that inflation overall has had a material impact on our results of operations for the periods presented. Substantial increases in costs in the future, however, could have a material impact on us and the industry. We believe that, to the extent inflation increases our costs in the future, we could generally offset that inflation over time by increasing prices, if competitive conditions permit.
Liquidity and Capital Resources
Historically, our business operations have not required substantial cash during the first several months of our fiscal year. Generally, starting in the secondthird quarter, our cash needs begin to increase, typically reaching a peak in the September-November time frame as we increase inventory levels in advance of the holiday season. Our quarterly cash requirements are also impacted by the number of new stores we open, other capital expenditures and the amount of any discretionary stock repurchases we make.
53
Net cash provided by operating activities of $251.3$451.6 million in fiscal year 20112012 was more than offset by the aggregate amount of cash used in investing and financing activities of $110.1$345.2 million and $249.9$219.6 million, respectively, resulting in a $105.3$110.3 million decrease in cash and cash equivalents since the
end of fiscal year 2010.2011. During fiscal year 2011,2012, net cash provided by operating activities consisted primarily of net income of $307.4$354.3 million, and favorable non-cash activities of $91.4$77.4 million, partially offset by an unfavorable increaseand a favorable decrease in net operating assets and liabilities of $147.5$18.1 million. During fiscal year 2011,2012, net cash used in investing activities was primarily driven by $109.9$229.2 million in business acquisitions and $112.4 million related to capital expenditures. During fiscal year 2011,2012, net cash used in financing activities was principally comprised of $270.9$271.3 million of common stock repurchases. Foreign exchange rate translationsacquisitions, partially offset by $56.2 million of net borrowings on notes payable. Net borrowings on notes payable primarily consisted of draws and repayments made under our $350 million revolving line of credit.
Accounts receivable increased cash and cash equivalents by $3.420.2% to $363.5 million during fiscal year 2011.
As illustrated in the contractual obligations table below, we have approximately $ 2.7 million of unrecognized tax benefits that have been recorded as liabilities and could be settled in the next 12 months. Settlement of such amounts could require utilization of working capital.
As of December 31, 2011, we have not provided for U.S. federal and state income taxes on approximately $371.8 million of undistributed earnings of our foreign subsidiaries, since such earnings are considered indefinitely reinvested outside the United States. If in the future we decide to repatriate such earnings, we would incur incremental U.S. federal and state income tax, reduced by allowable foreign tax credits. However, our intent is to keep these funds indefinitely reinvested outside of the United States and our current plans do not indicate a need to repatriate them to fund our U.S. operations.
Accounts receivable increased by 14.9% to $302.5 million during fiscal year 20112012 compared to $263.2$302.5 million at the end of the prior fiscal year, primarily due to an increase in wholesale shipments.shipments and the acquisition of Skagen Designs. Average days sales outstanding for our wholesale segments for fiscal year 2011 was2012 remained at 46 days in comparison to 48 days infrom the prior fiscal year.
Inventory at the end of fiscal year 20112012 was $489.0$506.3 million, representing an increase of 31.5%3.5% from the prior fiscal year inventory balance of $371.9$489.0 million. An approximate five day reductionOur inventory growth was driven by investments in lead times in watch shipments in December 2011 resulted in approximately $30 millioncomponents to preserve production flow, the adddition of inventory receipts shiftingSkagen Designs and new store growth. These additional investments were partially offset by lower finished goods inventories resulting from our efforts to reduce the first quarter of fiscal year 2012 to the fourth quarter of fiscal year 2011. Additionally, given the natural disasters that occurred in Japan in early fiscal year 2011 and the concentrationnumber of our movement supply in that country, we have increased the level of inventory related to key watch component parts including those with longer lead times.SKUs.
In fiscal year 2010, our Board of Directors approved two common stock repurchase programs pursuant to which up to $30 million and $750 million, respectively, could be used to repurchase outstanding shares of our common stock. BothIn December 2012, our Board of Directors approved an additional common stock repurchase program pursuant to which up to $1.0 billion could be used to repurchase outstanding shares of our common stock. All of these repurchase programs are to be conducted pursuant to Rule 10b-18 of the Securities Exchange Act of 1934. The $750 million repurchase program has a termination date of December 2013, and the $30 million repurchase program has no termination date. We repurchased 3.1 million shares under the $750 millionThe $1.0 billion common stock repurchase program during fiscal year 2010 athas a costtermination date of $179.2 million.December 2016.
During fiscal year 2011, we repurchased approximately 3.1 million shares of common stock under the $750 million repurchase program at a cost of $270.9 million. During fiscal year 2012, we repurchased approximately 3.0 million shares of common stock under the $750 million repurchase program at a cost of $261.3 million. We did not make any repurchases under the $30 million plan during fiscal year 2012 and 2011. On February 16,We did not make any repurchases under the $1 billion repurchase program during fiscal year 2012. We effectively retired 9.3 million shares of our common stock during fiscal year 2012 that were repurchased under our repurchase programs during our 2012, 2011 and 2010 fiscal years. During fiscal year 2012, we entered into a new $100accounted for the retirements by allocating the repurchase price, which is based upon the equity contribution associated with historical issuances, to common stock, additional paid-in capital and retained earnings. The effective retirement of common stock repurchased decreased common stock by $93,000, additional paid in capital by $50.1 million, 10b5-1 plan under the $750retained earnings by $661.8 million repurchase program. This new plan has a termination date of May 3, 2012.and treasury stock by $712.0 million.
At the end of the fiscal year 2011,2012, we had working capital of $844.1$737.3 million compared to working capital of $801.3$844.1 million at the end of the prior fiscal year. Additionally, we had approximately $9.0$2.8 million of outstanding short-term borrowings and $6.2$75.1 million in long-term debt.
On December 17, 2010, we and certain of our subsidiaries entered into a three year Credit Agreement (the “Credit Agreement”"Credit Agreement") with (i) Wells Fargo Bank, National Association (“("Wells Fargo”Fargo"), as administrative agent, swingline lender and issuing lender, (ii) Wells Fargo Securities, LLC, as sole lead arranger and sole book manager and (iii) Bank of America, N.A., as lender. The Credit Agreement provides for revolving credit loans in the amount of
54
$300 $300 million (the “Revolver”"Revolver"), a swingline loan of $20 million, and letters of credit. We had no outstanding borrowingsOn April 2, 2012, in connection with the Skagen Designs acquisition, the Credit Agreement was amended to, among other things, (i) increase the
aggregate commitment of the lenders under the Revolver atfrom $300 million to $350 million, (ii) provide for an uncommitted $50 million incremental revolving credit commitment and (iii) extend the endmaturity date from December 17, 2013 to December 17, 2014. The Credit Agreement is guaranteed by all of fiscal year 2011.our direct and indirect material domestic subsidiaries and secured by 65% of the outstanding voting capital stock and 100% of the non-voting capital of our foreign subsidiaries, Fossil Europe B.V., Swiss Technology Holding GmbH and Fossil (East) Limited. Amounts outstanding under the Revolver bear interest at our option of (i) the base rate (defined as the higher of (a) the prime rate publicly announced by Wells Fargo (3.25% at fiscal year end 2011)2012), (b) the federal funds rate plus 1.50% and (c) the London Interbank Offer Rate (“LIBOR”("LIBOR") (0.3%(0.21% at fiscal year end 2011)2012) plus 1.50%) plus the base rate applicable margin (which varies based upon our consolidated leverage ratio (the “Ratio”"Ratio") from 0.25% if the Ratio is less than 1.00 to 1.00, to 1.00% if the Ratio is greater than or equal to 2.00 to 1.00) or (ii) the LIBOR rate (defined as the quotient obtained by dividing (a) LIBOR by (b) 1.00 minus the Eurodollar reserve percentage) plus the LIBOR rate applicable margin (which varies based upon the Ratio from 1.25% if the Ratio is less than 1.00 to 1.00, to 2.00% if the Ratio is greater than or equal to 2.00 to 1.00). Amounts outstanding under the swingline loan under the Credit Agreement or upon any drawing under a letter of credit bear interest at the base rate plus the base rate applicable margin. Financial covenants in the Credit Agreement require us to maintain (i) a consolidated leverage ratio no greater than 2.50 to 1.00, (ii) consolidated tangible net worth of no less than the sum of (a) $600 million plus (b) 25% of positive consolidated net income, (iii) consolidated net income that is not negative for any two consecutive fiscal quarters, and (iv) maximum capital expenditures not in excess of $200 million during fiscal year 2012, and $150 million during each fiscal year thereafter, subject to certain adjustments. The Credit Agreement contains representations, warranties, covenants, events of default and indemnities that are customary for agreements of this type. We had $0.9 million of outstanding standby letters of credit at December 31, 201129, 2012 that reducereduced amounts available under the Revolver. During the fiscal year 2012, we borrowed $544.8 million under the Revolver at an average rate of 1.5% and repaid $479.8 million, leaving a balance of $65.0 million outstanding under the Revolver as of December 29, 2012.
In November 2009, our Japanese subsidiary, Fossil Japan, Inc. (“("Fossil Japan”Japan"), entered into a 400 million Yen revolving credit facility agreement (the “Facility”"Facility"). The Facility bears interest at the short-term prime rate (1.475% at fiscal year end 2011). At the end of fiscal year 2011, we had approximately $2.6 million of outstanding borrowings under the Facility. On February 22, 2012, Fossil Japan renewed 300 million Yen, or approximately $3.8 million, of borrowings under the Facility were renewed at the short-term prime rate of 1.475%, with a maturity of date of May 22, 2012.
On April 6, 2012, Fossil Japan repaid the outstanding balance of 300 million Yen, or approximately $3.6 million. At the end of fiscal year 2011,2012, we had no outstanding borrowings under the Facility.
At the end of fiscal year 2012, excluding long-term capital lease obligations of $2.5$6.4 million, we had outstanding short-term and long-term borrowings of $0.1 million and $3.7 million, respectively, related to our wholly-owned subsidiary, Fossil Group Europe, Gmbh, (“FGE”), in the form of a term note. This note requires Fossil Group Europe, Gmbh to submit an annual balance sheet and income statement and is secured by our building in Basel, Switzerland. This note has a variable interest term with an interest rate (2.0% at the end of fiscal year 2011 of 2.0%,end 2012) and interest payments are due quarterly. This note requires minimum principal payments of 100,000 Swiss Francs (approximately $109,000 at the end of fiscal year 2012) each year, has no stated maturity and has no penalties for early termination.
On During the second quarter of fiscal 2012, we assumed a 500,000 Swiss Franc short-term note payable (the "STP Note") with Eastime Limited. The STP Note has a fixed interest rate of 2% with interest due annually and a maturity date of March 31, 2013. Swiss Franc-based borrowings, in U.S. dollars, under the STP Note were approximately $0.5 million at December 29, 2012.
In April 6, 2011, our Korean subsidiary, Fossil (Korea) Limited (“("Fossil Korea”Korea"), entered into a new $20 million credit facility agreement (the “Agreement”"Agreement") with Bank of America, N.A., Seoul Branch. BorrowingsOn April 13, 2012, the Agreement was renewed under the Agreement are renewed onsame terms for a monthly basis.one year time period. The Agreement bears interest, based on a three month CD rate which is published by the Korea Securities
Dealers Association (3.55%(2.85% at fiscal year end 2011)2012), plus 120 basis points for a one month period or plus 130 basis points for a three month period. As of December 31, 2011,On November 19, 2012, Fossil Korea had anrepaid the outstanding balance of 7 billion Won, or $6.0approximately $1.8 million. At the end of fiscal year 2012, we had no outstanding borrowings under the Facility.
On October 31, 2012, Swiss Technology Components AG ("STC"), our wholly-owned subsidiary, entered into a 1.1 million at anSwiss Franc short-term note payable (the "STC Note") with New Civilization Limited, a corporation registered in Macau, China. The STC Note has a fixed interest rate of 4.75%. Approximately $6.2 million of3% with interest and principal due on October 31, 2013. The Swiss Franc-based borrowings, in U.S. dollars, under the AgreementSTC Note were renewedapproximately $1.2 million at an interest rate of approximately 4.75% in each of January 2012 and February 2012. The February 2012 borrowings have a maturity date of March 21,December 29, 2012.
At December 31, 2011,29, 2012, we were in compliance with all material debt covenants related to all of our credit facilities.
As of December 29, 2012, $395 million of undistributed earnings of our foreign subsidiaries are not considered to be indefinitely reinvested. As such, taxes have been accrued on these amounts net of applicable foreign tax credits. We have not provided for U.S. federal and state income taxes on the remaining $557 million of undistributed earnings of our foreign subsidiaries, as such earnings are considered indefinitely reinvested outside the United States. The determination of the amount of incremental tax that would be due in the event these earnings are repatriated in the future is not practicable. However, our intent is to keep these funds indefinitely reinvested outside of the United States and our current plans do not indicate a need to repatriate them to fund our U.S. operations.
As illustrated in the contractual obligations table below, we have approximately $7.9 million of uncertain tax positions that have been recorded as liabilities and could be settled in cash in the next 12 months. For the fiscal year ending December 28, 2013, we expect total capital expenditures to be in a range of $115 million to $125 million. These capital expenditures will be primarily related to global retail store expansion and renovation and investment in technological infrastructure. We believe that cash flows from operations combined with existing cash on hand and amounts available under the Revolver will be sufficient to fund our working capital needs, common stock repurchases planned acquisition and planned capital expenditures for the next twelve months.
55
Contractual Obligations
The following table identifies our contractual obligations as of December 31, 201129, 2012 (in thousands).
| Total | Less than 1 Year | 1-3 Years | 3-5 Years | More than 5 Years | ||||||||||||||||
Debt obligations (1) | $ | 12,464 | $ | 8,731 | $ | 213 | $ | 213 | $ | 3,307 | ||||||||||
Minimum royalty payments (2) | 279,626 | 121,233 | 126,549 | 27,854 | 3,990 | |||||||||||||||
Capital lease obligations | 10,947 | 701 | 2,472 | 2,158 | 5,616 | |||||||||||||||
Operating lease obligations | 638,857 | 103,177 | 185,680 | 151,419 | 198,581 | |||||||||||||||
Purchase obligations (3) | 281,500 | 278,432 | 3,018 | 50 | 0 | |||||||||||||||
Uncertain tax positions (4) | 2,677 | 2,677 | 0 | 0 | 0 | |||||||||||||||
|
|
|
|
|
|
|
|
|
| |||||||||||
Total contractual obligations | $ | 1,226,071 | $ | 514,951 | $ | 317,932 | $ | 181,694 | $ | 211,494 | ||||||||||
|
|
|
|
|
|
|
|
|
| |||||||||||
| | Total | Less than 1 Year | 1 - 3 Years | 3 - 5 Years | More than 5 Years | |||||||||||
|---|---|---|---|---|---|---|---|---|---|---|---|---|---|---|---|---|
Debt obligations(1) | $ | 70,587 | $ | 1,865 | $ | 65,219 | $ | 219 | $ | 3,284 | ||||||
Minimum royalty payments(2) | 285,920 | 144,910 | 133,306 | 7,704 | 0 | |||||||||||
Capital lease obligations | 10,268 | 1,095 | 2,304 | 2,166 | 4,703 | |||||||||||
Operating lease obligations | 739,725 | 130,423 | 221,801 | 163,680 | 223,821 | |||||||||||
Purchase obligations(3) | 271,186 | 268,928 | 2,258 | 0 | 0 | |||||||||||
Uncertain tax positions(4) | 7,921 | 7,921 | 0 | 0 | 0 | |||||||||||
Total contractual obligations | $ | 1,385,607 | $ | 555,142 | $ | 424,888 | $ | 173,769 | $ | 231,808 | ||||||
Off Balance Sheet Arrangements
None.
56
Selected Quarterly Consolidated Financial Data
The table below sets forth selected quarterly consolidated financial information. The information is derived from our unaudited consolidated financial statements and includes, in the opinion of management, all normal and recurring adjustments that management considers necessary for a fair statement of results for such periods. The operating results for any quarter are not necessarily indicative of results for any future period. Certain line items presented in the tables below, when aggregated, may not agree with the corresponding line items on our Consolidated Statementsconsolidated statements of Income and Comprehensive Incomecomprehensive income for fiscal years 20112012 and 20102011 due to rounding (in thousands, except percentage and per share data).
Fiscal Year 2012 | 1st Qtr | 2nd Qtr | 3rd Qtr | 4th Qtr | |||||||||
|---|---|---|---|---|---|---|---|---|---|---|---|---|---|
Net sales | $ | 589,533 | $ | 636,104 | $ | 684,170 | $ | 947,700 | |||||
Gross profit | 328,980 | 356,361 | 381,524 | 539,678 | |||||||||
Operating expenses | 246,119 | 268,264 | 268,437 | 334,883 | |||||||||
Operating income | 82,861 | 88,097 | 113,087 | 204,795 | |||||||||
Income before income taxes | 84,596 | 88,093 | 113,861 | 205,671 | |||||||||
Provision for income taxes | 23,524 | 27,705 | 33,984 | 52,749 | |||||||||
Net income | 61,072 | 60,388 | 79,877 | 152,922 | |||||||||
Net income attributable to noncontrolling interest | 2,932 | 3,050 | 3,086 | 1,790 | |||||||||
Net income attributable to Fossil, Inc. | 58,140 | 57,338 | 76,791 | 151,132 | |||||||||
Earnings per share: | |||||||||||||
Basic | 0.94 | 0.93 | 1.27 | 2.53 | |||||||||
Diluted | 0.93 | 0.92 | 1.26 | 2.51 | |||||||||
Gross profit as a percentage of net sales | 55.8 | % | 56.0 | % | 55.8 | % | 56.9 | % | |||||
Operating expenses as a percentage of net sales | 41.7 | % | 42.2 | % | 39.3 | % | 35.3 | % | |||||
Operating income as a percentage of net sales | 14.1 | % | 13.8 | % | 16.5 | % | 21.6 | % | |||||
Fiscal Year 2011 | 1st Qtr | 2nd Qtr | 3rd Qtr | 4th Qtr | |||||||||
|---|---|---|---|---|---|---|---|---|---|---|---|---|---|
Net sales | $ | 536,975 | $ | 556,661 | $ | 642,910 | $ | 830,756 | |||||
Gross profit | 301,812 | 311,976 | 359,529 | 465,869 | |||||||||
Operating expenses | 209,256 | 225,714 | 240,720 | 291,505 | |||||||||
Operating income | 92,556 | 86,262 | 118,809 | 174,364 | |||||||||
Income before income taxes | 89,258 | 81,688 | 111,811 | 168,803 | |||||||||
Provision for income taxes | 31,192 | 27,657 | 39,307 | 46,001 | |||||||||
Net income | 58,066 | 54,031 | 72,504 | 122,802 | |||||||||
Net income attributable to noncontrolling interest | 2,244 | 2,670 | 2,895 | 4,891 | |||||||||
Net income attributable to Fossil, Inc. | 55,822 | 51,361 | 69,609 | 117,911 | |||||||||
Earnings per share: | |||||||||||||
Basic | 0.87 | 0.81 | 1.10 | 1.88 | |||||||||
Diluted | 0.86 | 0.80 | 1.09 | 1.87 | |||||||||
Gross profit as a percentage of net sales | 56.2 | % | 56.0 | % | 55.9 | % | 56.1 | % | |||||
Operating expenses as a percentage of net sales | 39.0 | % | 40.5 | % | 37.4 | % | 35.1 | % | |||||
Operating income as a percentage of net sales | 17.2 | % | 15.5 | % | 18.5 | % | 21.0 | % | |||||
Fiscal Year 2011 | 1st Qtr | 2nd Qtr | 3rd Qtr | 4th Qtr | ||||||||||||
Net sales | $ | 536,975 | $ | 556,661 | $ | 642,910 | $ | 830,756 | ||||||||
Gross profit | 301,812 | 311,976 | 359,529 | 465,869 | ||||||||||||
Operating expenses | 209,256 | 225,714 | 240,720 | 291,505 | ||||||||||||
Operating income | 92,556 | 86,262 | 118,809 | 174,364 | ||||||||||||
Income before income taxes | 89,258 | 81,688 | 111,811 | 168,803 | ||||||||||||
Provision for income taxes | 31,192 | 27,657 | 39,307 | 46,001 | ||||||||||||
Net income | 58,066 | 54,031 | 72,504 | 122,802 | ||||||||||||
Net income attributable to noncontrolling interest | 2,244 | 2,670 | 2,895 | 4,891 | ||||||||||||
Net income attributable to Fossil, Inc. | 55,822 | 51,361 | 69,609 | 117,911 | ||||||||||||
Comprehensive income | 72,109 | 62,777 | 58,068 | 117,210 | ||||||||||||
Comprehensive income attributable to noncontrolling interest | 2,244 | 2,670 | 2,895 | 4,891 | ||||||||||||
Comprehensive income attributable to Fossil, Inc. | 69,865 | 60,107 | 55,173 | 112,319 | ||||||||||||
Earnings per share: | ||||||||||||||||
Basic | 0.87 | 0.81 | 1.10 | 1.88 | ||||||||||||
Diluted | 0.86 | 0.80 | 1.09 | 1.87 | ||||||||||||
Gross profit as a percentage of net sales | 56.2 | % | 56.0 | % | 55.9 | % | 56.1 | % | ||||||||
Operating expenses as a percentage of net sales | 39.0 | % | 40.5 | % | 37.4 | % | 35.1 | % | ||||||||
Operating income as a percentage of net sales | 17.2 | % | 15.5 | % | 18.5 | % | 21.0 | % | ||||||||
Fiscal Year 2010 | 1st Qtr | 2nd Qtr | 3rd Qtr | 4th Qtr | ||||||||||||
Net sales | $ | 393,229 | $ | 412,560 | $ | 523,825 | $ | 701,076 | ||||||||
Gross profit | 219,419 | 236,885 | 298,743 | 400,118 | ||||||||||||
Operating expenses | 168,156 | 172,539 | 187,473 | 250,582 | ||||||||||||
Operating income | 51,263 | 64,346 | 111,270 | 149,536 | ||||||||||||
Income before income taxes | 53,739 | 64,524 | 111,257 | 154,690 | ||||||||||||
Provision for income taxes | 16,043 | 7,965 | 40,353 | 54,959 | ||||||||||||
Net income | 37,696 | 56,559 | 70,904 | 99,731 | ||||||||||||
Net income attributable to noncontrolling interest | 1,789 | 2,074 | 2,748 | 3,074 | ||||||||||||
Net income attributable to Fossil, Inc. | 35,907 | 54,485 | 68,156 | 96,657 | ||||||||||||
Comprehensive income | 25,496 | 43,323 | 88,705 | 92,324 | ||||||||||||
Comprehensive income attributable to noncontrolling interest | 1,780 | 2,062 | 2,764 | 3,084 | ||||||||||||
Comprehensive income attributable to Fossil, Inc. | 23,716 | 41,261 | 85,941 | 89,240 | ||||||||||||
Earnings per share: | ||||||||||||||||
Basic | 0.54 | 0.81 | 1.02 | 1.48 | ||||||||||||
Diluted | 0.53 | 0.80 | 1.00 | 1.46 | ||||||||||||
Gross profit as a percentage of net sales | 55.8 | % | 57.4 | % | 57.0 | % | 57.1 | % | ||||||||
Operating expenses as a percentage of net sales | 42.8 | % | 41.8 | % | 35.8 | % | 35.7 | % | ||||||||
Operating income as a percentage of net sales | 13.0 | % | 15.6 | % | 21.2 | % | 21.3 | % | ||||||||
While the majority of our products are not seasonal in nature, a significant portion of our net sales and operating income is generally derived in the second half of the fiscal year. Our third and fourth quarters, which include the “back"back to school”school" and Christmas seasons, have historically generated a significant portion of our
57
annual operating income. The amount of net sales and operating income generated during the first quarter is affected by the levels of inventory held by retailers at the end of the Christmas season, as well as general economic conditions and other factors beyond our control. In general, lower levels of inventory held by retailers at the end of the Christmas season may have a positive impact on our net sales and operating income in the first quarter of the following fiscal year as a result of higher levels of restocking orders placed by retailers. We currently believe that our inventory levels at our largest customers in the U.S. about which we have sufficient information to form an opinion were near their targeted inventory levels at the end of fiscal year 2011.2012.
As we expand our retail store base and e-commerce businesses, sales from our Direct to consumer segment may increase as a percentage of the total sales mix. Based upon the historical seasonality of sales in our Direct to consumer segment, we believe this expansion could result in higher levels of profitability in the fourth quarter and lower levels of profitability in the first and second quarters when, due to seasonality, it is more difficult to leverage four wall operating costs and back office expenses against a lower level of sales productivity. In addition, new product launches would generally augment the sales and operating expense levels in the quarter the product launch takes place. The results of operations for a particular quarter may also vary due to a number of factors, including retail, economic and monetary conditions, timing of orders or holidays and the mix of products sold by us.
Item 7A. Quantitative and Qualitative Disclosures about Market Risk
As a multinational enterprise, we are exposed to changes in foreign currency exchange rates. Our most significant foreign currency risk relates to the Euro and, to a lesser extent, the British Pound, Australian Dollar, Canadian Dollar, Japanese Yen and Mexican Peso as compared to the U.S. dollar. Due to our vertical nature whereby a significant portion of goods are sourced from our owned facilities, the foreign currency risks relate primarily to the necessary current settlement of intercompany inventory transactions. We employ a variety of operating practices to manage these market risks relative to foreign currency exchange rate changes and, where deemed appropriate, utilize foreign currency forward contracts. These operating practices include, among others, our ability to convert foreign currency into U.S. dollars at spot rates and to maintain U.S. dollar pricing relative to sales of our products to certain distributors located outside the U.S. The use of foreign currency forward contracts allows us to offset exposure to rate fluctuations because the gains or losses incurred on the derivative instruments will offset, in whole or in part, losses or gains on the underlying foreign currency exposure. We use derivative instruments only for risk management purposes and do not use them for speculation or for trading. There were no significant changes in how we managed foreign currency transactional exposure in fiscal year 20112012 and management does not anticipate any significant changes in such exposures or in the strategies we employ to manage such exposure in the near future.
At December 31, 2011, we had29, 2012, the following table reflects the outstanding foreign exchange contracts to sell 113.3 million Euro for approximately $156.6 million, expiring through June 2013, 2.8 billion Japanese Yen for approximately $33.3 million, expiring through December 2013, 14.9 million British Pounds for approximately $23.7 million, expiring through June 2013, 8.3 million Australian Dollars for approximately $7.7 million, expiring through September 2012, 97.7 million Mexican Pesos for approximately $7.3 million, expiring through July 2012 and 16.6 million Canadian Dollars for approximately $16.6 million, expiring through June 2013.their expiration dates (in millions).
| Functional Currency | Contract Currency | | ||||||||
|---|---|---|---|---|---|---|---|---|---|---|
Type | Amount | Type | Amount | Expiration Date | ||||||
Euro | 144.9 | U.S. Dollar | 188.4 | June 2014 | ||||||
British Pound | 15.8 | U.S. Dollar | 25.1 | June 2014 | ||||||
Japanese Yen | 1,996.7 | U.S. Dollar | 24.6 | June 2014 | ||||||
Canadian Dollar | 21.1 | U.S. Dollar | 21.0 | June 2014 | ||||||
Mexican Peso | 153.0 | U.S. Dollar | 11.5 | September 2013 | ||||||
Australian Dollar | 10.4 | U.S. Dollar | 10.6 | September 2013 | ||||||
If we were to settle our European Euro, British Pound, Japanese Yen, British Pound, Australian Dollar, Mexican Peso and Canadian Dollar based forward contracts at fiscal year end 2011,December 29, 2012, the net result would behave been a net gainloss of approximately $4.8$1.8 million, net of taxes. At fiscal year end 2011,December 29, 2012, a 10% unfavorable change in the exchange rate of the U.S. dollar strengthening against foreign currencies to which we have balance sheet transactional exposures, would have reduceddecreased net pre-tax income by $12.8$6.1 million. The translation of the balance sheets of our foreign-based operations from their local currencies into U.S. dollars is also sensitive to changes in foreign currency exchange rates. At fiscal year end 2011,December 29, 2012, a 10% unfavorable change in the exchange rate of the U.S. dollar strengthening against the foreign currencies to which we have exposure would have reduced consolidated stockholders’stockholders' equity by approximately $35.9$59.1 million. In theour view, of management, these hypothetical losses resulting from these assumed changes in foreign currency exchange rates are not material to our consolidated financial position, results of operations or cash flows.
58
Item 8. Consolidated Financial Statements and Supplementary Data
REPORT OF INDEPENDENT REGISTERED PUBLIC ACCOUNTING FIRM
To the Board of Directors and Stockholders of
Fossil, Inc.
Richardson, Texas
We have audited the accompanying consolidated balance sheets of Fossil, Inc. and subsidiaries (“the Company”(the "Company") as of December 31, 201129, 2012 and January 1,December 31, 2011, and the related consolidated statements of income and comprehensive income, stockholders’stockholders' equity, and cash flows for each of the three years in the period ended December 31, 2011.29, 2012. Our audits also included the consolidated financial statement schedule listed in the Index at Item 15. These consolidated financial statements and consolidated financial statement schedule are the responsibility of the Company’sCompany's management. Our responsibility is to express an opinion on the consolidated financial statements and consolidated financial statement schedule based on our audits.
We conducted our audits in accordance with the standards of the Public Company Accounting Oversight Board (United States). Those standards require that we plan and perform the audit to obtain reasonable assurance about whether the consolidated financial statements are free of material misstatement. An audit includes examining, on a test basis, evidence supporting the amounts and disclosures in the consolidated financial statements. An audit also includes assessing the accounting principles used and significant estimates made by management, as well as evaluating the overall consolidated financial statement presentation. We believe that our audits provide a reasonable basis for our opinion.
In our opinion, such consolidated financial statements present fairly, in all material respects, the financial position of Fossil, Inc. and subsidiaries as of December 31, 201129, 2012 and January 1,December 31, 2011, and the results of their operations and their cash flows for each of the three years in the period ended December 31, 2011,29, 2012, in conformity with accounting principles generally accepted in the United States of America. Also, in our opinion, such consolidated financial statement schedule, when considered in relation to the basic consolidated financial statements taken as a whole, presentspresent fairly, in all material respects, the information set forth therein.
We have also audited, in accordance with the standards of the Public Company Accounting Oversight Board (United States), the Company’sCompany's internal control over financial reporting as of December 31, 2011,29, 2012, based on the criteria establishedinInternal Control-IntegratedControl—Integrated Framework issued by the Committee of Sponsoring Organizations of the Treadway Commission and our report dated February 29, 201227, 2013 expressed an unqualified opinion on the Company’sCompany's internal control over financial reporting.
/S/ DELOITTEs/DELOITTE & TOUCHETOUCHE LLP
Dallas, Texas
February 29, 201227, 2013
59
FOSSIL, INC.
CONSOLIDATED BALANCE SHEETS
IN THOUSANDS
IN THOUSANDS
| | December 29, 2012 | December 31, 2011 | |||||
|---|---|---|---|---|---|---|---|
Assets | |||||||
Current assets: | |||||||
Cash and cash equivalents | $ | 177,236 | $ | 287,498 | |||
Securities available for sale | 127 | 155 | |||||
Accounts receivable—net | 363,456 | 302,467 | |||||
Inventories | 506,314 | 488,983 | |||||
Deferred income tax assets—net | 34,238 | 45,803 | |||||
Prepaid expenses and other current assets | 62,741 | 110,496 | |||||
Total current assets | 1,144,112 | 1,235,402 | |||||
Investments | 6,965 | 7,520 | |||||
Property, plant and equipment—net | 335,446 | 282,050 | |||||
Goodwill | 184,793 | 44,054 | |||||
Intangible and other assets—net | 170,673 | 73,896 | |||||
Total long-term assets | 697,877 | 407,520 | |||||
Total assets | $ | 1,841,989 | $ | 1,642,922 | |||
Liabilities and Stockholders' Equity | |||||||
Current liabilities: | |||||||
Accounts payable | $ | 149,561 | $ | 157,883 | |||
Short-term debt | 2,794 | 9,009 | |||||
Accrued expenses: | |||||||
Compensation | 55,563 | 58,745 | |||||
Royalties | 53,547 | 48,807 | |||||
Co-op advertising | 24,500 | 21,287 | |||||
Transaction taxes | 27,973 | 23,086 | |||||
Other | 61,575 | 56,122 | |||||
Income taxes payable | 31,265 | 16,339 | |||||
Total current liabilities | 406,778 | 391,278 | |||||
Long-term income taxes payable | 8,662 | 17,194 | |||||
Deferred income tax liabilities | 79,756 | 86,328 | |||||
Long-term debt | 75,140 | 6,236 | |||||
Other long-term liabilities | 31,189 | 25,040 | |||||
Total long-term liabilities | 194,747 | 134,798 | |||||
Commitments and contingencies (Note 14) | |||||||
Stockholders' equity: | |||||||
Common stock, 59,631 and 68,370 shares issued at December 29, 2012 and December 31, 2011, respectively | 596 | 684 | |||||
Treasury stock, at cost, 6,215 shares at December 31, 2011 | 0 | (450,700 | ) | ||||
Additional paid-in capital | 138,097 | 149,243 | |||||
Retained earnings | 1,066,082 | 1,384,522 | |||||
Accumulated other comprehensive income | 28,760 | 22,180 | |||||
Total Fossil, Inc. stockholders' equity | 1,233,535 | 1,105,929 | |||||
Noncontrolling interest | 6,929 | 10,917 | |||||
Total stockholders' equity | 1,240,464 | 1,116,846 | |||||
Total liabilities and stockholders' equity | $ | 1,841,989 | $ | 1,642,922 | |||
| December 31, 2011 | January 1, 2011 | |||||||
Assets | ||||||||
Current assets: | ||||||||
Cash and cash equivalents | $ | 287,498 | $ | 392,794 | ||||
Securities available for sale | 155 | 8,864 | ||||||
Accounts receivable-net | 302,467 | 263,218 | ||||||
Inventories | 488,983 | 371,935 | ||||||
Deferred income tax assets-net | 45,803 | 41,836 | ||||||
Prepaid expenses and other current assets | 110,496 | 62,170 | ||||||
|
|
|
| |||||
Total current assets | 1,235,402 | 1,140,817 | ||||||
Investments | 7,520 | 9,023 | ||||||
Property, plant and equipment-net | 282,050 | 217,424 | ||||||
Goodwill | 44,054 | 44,572 | ||||||
Intangible and other assets-net | 73,896 | 55,737 | ||||||
|
|
|
| |||||
Total long-term assets | 407,520 | 326,756 | ||||||
|
|
|
| |||||
Total assets | $ | 1,642,922 | $ | 1,467,573 | ||||
|
|
|
| |||||
Liabilities and Stockholders’ Equity | ||||||||
Current liabilities: | ||||||||
Accounts payable | $ | 157,883 | $ | 122,266 | ||||
Short-term debt | 9,009 | 5,314 | ||||||
Accrued expenses: | ||||||||
Compensation | 58,745 | 51,374 | ||||||
Royalties | 48,807 | 39,731 | ||||||
Co-op advertising | 21,287 | 23,101 | ||||||
Transaction taxes | 23,086 | 18,894 | ||||||
Other | 56,122 | 50,779 | ||||||
Income taxes payable | 16,339 | 28,029 | ||||||
|
|
|
| |||||
Total current liabilities | 391,278 | 339,488 | ||||||
Long-term income taxes payable | 17,194 | 9,088 | ||||||
Deferred income tax liabilities | 86,328 | 47,893 | ||||||
Long-term debt | 6,236 | 4,513 | ||||||
Other long-term liabilities | 25,040 | 14,883 | ||||||
|
|
|
| |||||
Total long-term liabilities | 134,798 | 76,377 | ||||||
Commitments and contingencies (Note 13) | ||||||||
Stockholders’ equity: | ||||||||
Common stock, 68,370 and 67,882 shares issued at December 31, 2011 and January 1, 2011, respectively | 684 | 679 | ||||||
Treasury stock, at cost, 6,215 and 3,206 shares at December 31, 2011 and January 1, 2011, respectively | (450,700 | ) | (183,014 | ) | ||||
Additional paid-in capital | 149,243 | 117,215 | ||||||
Retained earnings | 1,384,522 | 1,089,820 | ||||||
Accumulated other comprehensive income | 22,180 | 19,418 | ||||||
Noncontrolling interest | 10,917 | 7,590 | ||||||
|
|
|
| |||||
Total stockholders’ equity | 1,116,846 | 1,051,708 | ||||||
|
|
|
| |||||
Total liabilities and stockholders’ equity | $ | 1,642,922 | $ | 1,467,573 | ||||
|
|
|
| |||||
See notes to the consolidated financial statements.
60
FOSSIL, INC.
CONSOLIDATED STATEMENTS OF INCOME AND COMPREHENSIVE INCOME
IN THOUSANDS, EXCEPT PER SHARE DATA
Fiscal Year | 2012 | 2011 | 2010 | |||||||
|---|---|---|---|---|---|---|---|---|---|---|
Net sales | $ | 2,857,508 | $ | 2,567,302 | $ | 2,030,690 | ||||
Cost of sales | 1,250,965 | 1,128,116 | 875,526 | |||||||
Gross profit | 1,606,543 | 1,439,186 | 1,155,164 | |||||||
Operating expenses: | ||||||||||
Selling and distribution | 826,919 | 715,350 | 583,860 | |||||||
General and administrative | 290,784 | 251,845 | 194,890 | |||||||
Total operating expenses | 1,117,703 | 967,195 | 778,750 | |||||||
Operating income | 488,840 | 471,991 | 376,414 | |||||||
Interest expense | 5,160 | 2,391 | 1,119 | |||||||
Other income (expense)—net | 8,542 | (18,041 | ) | 8,915 | ||||||
Income before income taxes | 492,222 | 451,559 | 384,210 | |||||||
Provision for income taxes | 137,963 | 144,157 | 119,320 | |||||||
Net income | 354,259 | 307,402 | 264,890 | |||||||
Less: Net income attributable to noncontrolling interest | 10,858 | 12,700 | 9,685 | |||||||
Net income attributable to Fossil, Inc. | $ | 343,401 | $ | 294,702 | $ | 255,205 | ||||
Other comprehensive income (loss), net of taxes: | ||||||||||
Currency translation adjustment | $ | 11,228 | $ | (6,491 | ) | $ | (9,909 | ) | ||
Unrealized (loss) gain on securities available for sale | (29 | ) | (656 | ) | 554 | |||||
Forward contracts hedging intercompany foreign currency payments—change in fair values | (4,619 | ) | 9,909 | (5,687 | ) | |||||
Total other comprehensive income (loss) | 6,580 | 2,762 | (15,042 | ) | ||||||
Total comprehensive income | 360,839 | 310,164 | 249,848 | |||||||
Less: Comprehensive income attributable to noncontrolling interest | 10,858 | 12,700 | 9,690 | |||||||
Comprehensive income attributable to Fossil, Inc. | $ | 349,981 | $ | 297,464 | $ | 240,158 | ||||
Earnings per share: | ||||||||||
Basic | $ | 5.63 | $ | 4.66 | $ | 3.83 | ||||
Diluted | $ | 5.59 | $ | 4.61 | $ | 3.77 | ||||
Weighted average common shares outstanding: | ||||||||||
Basic | 60,959 | 63,298 | 66,701 | |||||||
Diluted | 61,400 | 63,965 | 67,687 | |||||||
Fiscal Year | 2011 | 2010 | 2009 | |||||||||
Net sales | $ | 2,567,302 | $ | 2,030,690 | $ | 1,548,093 | ||||||
Cost of sales | 1,128,116 | 875,526 | 703,243 | �� | ||||||||
|
|
|
|
|
| |||||||
Gross profit | 1,439,186 | 1,155,164 | 844,850 | |||||||||
Operating expenses: | ||||||||||||
Selling and distribution | 715,350 | 583,860 | 478,637 | |||||||||
General and administrative | 251,845 | 194,890 | 154,586 | |||||||||
|
|
|
|
|
| |||||||
Total operating expenses | 967,195 | 778,750 | 633,223 | |||||||||
|
|
|
|
|
| |||||||
Operating income | 471,991 | 376,414 | 211,627 | |||||||||
Interest expense | 2,391 | 1,119 | 235 | |||||||||
Other (expense) income-net | (18,041 | ) | 8,915 | 8,506 | ||||||||
|
|
|
|
|
| |||||||
Income before income taxes | 451,559 | 384,210 | 219,898 | |||||||||
Provision for income taxes | 144,157 | 119,320 | 75,604 | |||||||||
|
|
|
|
|
| |||||||
Net income | 307,402 | 264,890 | 144,294 | |||||||||
Less: Net income attributable to noncontrolling interest | 12,700 | 9,685 | 5,106 | |||||||||
|
|
|
|
|
| |||||||
Net income attributable to Fossil, Inc. | $ | 294,702 | $ | 255,205 | $ | 139,188 | ||||||
|
|
|
|
|
| |||||||
Other comprehensive (loss) income, net of taxes: | ||||||||||||
Currency translation adjustment | $ | (6,491 | ) | $ | (9,909 | ) | $ | 13,584 | ||||
Unrealized (loss) gain on securities available for sale | (656 | ) | 554 | 1,093 | ||||||||
Forward contracts hedging intercompany foreign currency payments-change in fair values | 9,909 | (5,687 | ) | (4,364 | ) | |||||||
|
|
|
|
|
| |||||||
Total comprehensive income | 310,164 | 249,848 | 154,607 | |||||||||
Less: Comprehensive income attributable to noncontrolling interest | 12,700 | 9,690 | 5,105 | |||||||||
|
|
|
|
|
| |||||||
Comprehensive income attributable to Fossil, Inc. | $ | 297,464 | $ | 240,158 | $ | 149,502 | ||||||
|
|
|
|
|
| |||||||
Earnings per share: | ||||||||||||
Basic | $ | 4.66 | $ | 3.83 | $ | 2.09 | ||||||
|
|
|
|
|
| |||||||
Diluted | $ | 4.61 | $ | 3.77 | $ | 2.07 | ||||||
|
|
|
|
|
| |||||||
Weighted average common shares outstanding: | ||||||||||||
Basic | 63,298 | 66,701 | 66,684 | |||||||||
|
|
|
|
|
| |||||||
Diluted | 63,965 | 67,687 | 67,153 | |||||||||
|
|
|
|
|
| |||||||
See notes to the consolidated financial statements.
61
FOSSIL, INC.
CONSOLIDATED STATEMENTS OF STOCKHOLDERS’STOCKHOLDERS' EQUITY
AMOUNTS IN THOUSANDS
| Accumulated other | ||||||||||||||||||||||||||||||||||||||||||||
| comprehensive income (loss) | ||||||||||||||||||||||||||||||||||||||||||||
| Unrealized | Unrealized | |||||||||||||||||||||||||||||||||||||||||||
| Common stock | Additional | Cumulative | gain (loss) on | gain (loss) | Stockholders’ | Total | ||||||||||||||||||||||||||||||||||||||
| Shares | Par value | paid-in capital | Treasury stock | Retained earnings | translation adjustment | securities available for sale | on forward contracts | equity attributable to Fossil, Inc. | Noncontrolling interest | stockholders’ equity | ||||||||||||||||||||||||||||||||||
Balance, January 3, 2009 | 66,502 | $ | 665 | $ | 81,905 | $ | 0 | $ | 695,427 | $ | 21,769 | $ | (1,437 | ) | $ | 3,815 | $ | 802,144 | $ | 3,219 | $ | 805,363 | ||||||||||||||||||||||
Common stock issued upon exercise of stock options and stock appreciation rights | 314 | 3 | 3,753 | 0 | 0 | 0 | 0 | 0 | 3,756 | 0 | 3,756 | |||||||||||||||||||||||||||||||||
Tax benefit derived from stock-based compensation | 0 | 0 | 1,166 | 0 | 0 | 0 | 0 | 0 | 1,166 | 1,166 | ||||||||||||||||||||||||||||||||||
Repurchase and retirement of common stock | (45 | ) | 0 | (785 | ) | 785 | 0 | 0 | 0 | 0 | 0 | 0 | 0 | |||||||||||||||||||||||||||||||
Restricted stock issued in connection with deferred compensation plan | 129 | 1 | (1 | ) | 0 | 0 | 0 | 0 | 0 | 0 | 0 | 0 | ||||||||||||||||||||||||||||||||
Restricted stock forfeiture put to treasury | 0 | 0 | 212 | (785 | ) | 0 | 0 | 0 | 0 | (573 | ) | 0 | (573 | ) | ||||||||||||||||||||||||||||||
Stock-based compensation expense | 0 | 0 | 6,787 | 0 | 0 | 0 | 0 | 0 | 6,787 | 0 | 6,787 | |||||||||||||||||||||||||||||||||
Net income | 0 | 0 | 0 | 0 | 139,188 | 0 | 0 | 0 | 139,188 | 5,106 | 144,294 | |||||||||||||||||||||||||||||||||
Unrealized gain on securities available for sale | 0 | 0 | 0 | 0 | 0 | 0 | 1,093 | 0 | 1,093 | 0 | 1,093 | |||||||||||||||||||||||||||||||||
Currency translation adjustment | 0 | 0 | 0 | 0 | 0 | 13,584 | 0 | 0 | 13,584 | (1 | ) | 13,583 | ||||||||||||||||||||||||||||||||
Distribution of noncontrolling interest earnings | 0 | 0 | 0 | 0 | 0 | 0 | 0 | 0 | 0 | (2,693 | ) | (2,693 | ) | |||||||||||||||||||||||||||||||
Forward contracts hedging intercompany foreign currency payments-change in fair values | 0 | 0 | 0 | 0 | 0 | 0 | 0 | (4,364 | ) | (4,364 | ) | 0 | (4,364 | ) | ||||||||||||||||||||||||||||||
|
|
|
|
|
|
|
|
|
|
|
|
|
|
|
|
|
|
|
|
|
| |||||||||||||||||||||||
Balance, January 2, 2010 | 66,900 | $ | 669 | $ | 93,037 | $ | 0 | $ | 834,615 | $ | 35,353 | $ | (344 | ) | $ | (549 | ) | $ | 962,781 | $ | 5,631 | $ | 968,412 | |||||||||||||||||||||
|
|
|
|
|
|
|
|
|
|
|
|
|
|
|
|
|
|
|
|
|
| |||||||||||||||||||||||
Common stock issued upon exercise of stock options and stock appreciation rights | 1,382 | 14 | 23,396 | 0 | 0 | 0 | 0 | 0 | 23,410 | 0 | 23,410 | |||||||||||||||||||||||||||||||||
Tax benefit derived from stock-based compensation | 0 | 0 | 11,961 | 0 | 0 | 0 | 0 | 0 | 11,961 | 0 | 11,961 | |||||||||||||||||||||||||||||||||
Repurchase of common stock | 0 | 0 | 0 | (199,222 | ) | 0 | 0 | 0 | 0 | (199,222 | ) | 0 | (199,222 | ) | ||||||||||||||||||||||||||||||
Retirement of common stock | (563 | ) | (6 | ) | (21,746 | ) | 21,752 | 0 | 0 | 0 | 0 | 0 | 0 | 0 | ||||||||||||||||||||||||||||||
Restricted stock issued in connection with stock-based compensation plan | 163 | 2 | (2 | ) | 0 | 0 | 0 | 0 | 0 | 0 | 0 | 0 | ||||||||||||||||||||||||||||||||
Common stock forfeitures put to treasury | 0 | 0 | 727 | (5,544 | ) | 0 | 0 | 0 | 0 | (4,817 | ) | 0 | (4,817 | ) | ||||||||||||||||||||||||||||||
Stock-based compensation expense | 0 | 0 | 10,553 | 0 | 0 | 0 | 0 | 0 | 10,553 | 0 | 10,553 | |||||||||||||||||||||||||||||||||
Net income | 0 | 0 | 0 | 0 | 255,205 | 0 | 0 | 0 | 255,205 | 9,685 | 264,890 | |||||||||||||||||||||||||||||||||
Unrealized gain on securities available for sale | 0 | 0 | 0 | 0 | 0 | 0 | 554 | 0 | 554 | 0 | 554 | |||||||||||||||||||||||||||||||||
Currency translation adjustment | 0 | 0 | 0 | 0 | 0 | (9,909 | ) | 0 | 0 | (9,909 | ) | 5 | (9,904 | ) | ||||||||||||||||||||||||||||||
Purchase of noncontrolling interest shares | 0 | 0 | (711 | ) | 0 | 0 | 0 | 0 | (711 | ) | (144 | ) | (855 | ) | ||||||||||||||||||||||||||||||
Distribution of noncontrolling interest earnings | 0 | 0 | 0 | 0 | 0 | 0 | 0 | 0 | 0 | (7,587 | ) | (7,587 | ) | |||||||||||||||||||||||||||||||
Forward contracts hedging intercompany foreign currency payments-change in fair values | 0 | 0 | 0 | 0 | 0 | 0 | 0 | (5,687 | ) | (5,687 | ) | 0 | (5,687 | ) | ||||||||||||||||||||||||||||||
|
|
|
|
|
|
|
|
|
|
|
|
|
|
|
|
|
|
|
|
|
| |||||||||||||||||||||||
Balance, January 1, 2011 | 67,882 | $ | 679 | $ | 117,215 | $ | (183,014 | ) | $ | 1,089,820 | $ | 25,444 | $ | 210 | $ | (6,236 | ) | $ | 1,044,118 | $ | 7,590 | $ | 1,051,708 | |||||||||||||||||||||
|
|
|
|
|
|
|
|
|
|
|
|
|
|
|
|
|
|
|
|
|
| |||||||||||||||||||||||
Common stock issued upon exercise of stock options and stock appreciation rights | 436 | 4 | 8,536 | 0 | 0 | 0 | 0 | 0 | 8,540 | 0 | 8,540 | |||||||||||||||||||||||||||||||||
Tax benefit derived from stock-based compensation | 0 | 0 | 9,980 | 0 | 0 | 0 | 0 | 0 | 9,980 | 0 | 9,980 | |||||||||||||||||||||||||||||||||
Repurchase of common stock | 0 | 0 | 0 | (270,882 | ) | 0 | 0 | 0 | 0 | (270,882 | ) | 0 | (270,882 | ) | ||||||||||||||||||||||||||||||
Retirement of common stock | (75 | ) | 0 | (6,220 | ) | 6,220 | 0 | 0 | 0 | 0 | 0 | 0 | 0 | |||||||||||||||||||||||||||||||
Restricted stock issued in connection with stock-based compensation plan | 127 | 1 | (1 | ) | 0 | 0 | 0 | 0 | 0 | 0 | 0 | 0 | ||||||||||||||||||||||||||||||||
Common stock forfeitures put to treasury | 0 | 0 | 481 | (6,220 | ) | 0 | 0 | 0 | �� | 0 | (5,739 | ) | 0 | (5,739 | ) | |||||||||||||||||||||||||||||
Stock-based compensation expense | 0 | 0 | 14,615 | 0 | 0 | 0 | 0 | 0 | 14,615 | 0 | 14,615 | |||||||||||||||||||||||||||||||||
Common stock issued upon legal settlement | 0 | 0 | 4,637 | 3,196 | 0 | 0 | 0 | 0 | 7,833 | 0 | 7,833 | |||||||||||||||||||||||||||||||||
Net income | 0 | 0 | 0 | 0 | 294,702 | 0 | 0 | 0 | 294,702 | 12,700 | 307,402 | |||||||||||||||||||||||||||||||||
Unrealized loss on securities available for sale | 0 | 0 | 0 | 0 | 0 | 0 | (656 | ) | 0 | (656 | ) | 0 | (656 | ) | ||||||||||||||||||||||||||||||
Currency translation adjustment | 0 | 0 | 0 | 0 | 0 | (6,491 | ) | 0 | 0 | (6,491 | ) | 0 | (6,491 | ) | ||||||||||||||||||||||||||||||
Distribution of noncontrolling interest earnings | 0 | 0 | 0 | 0 | 0 | 0 | 0 | 0 | 0 | (9,373 | ) | (9,373 | ) | |||||||||||||||||||||||||||||||
Forward contracts hedging intercompany foreign currency payments-change in fair values | 0 | 0 | 0 | 0 | 0 | 0 | 0 | 9,909 | 9,909 | 0 | 9,909 | |||||||||||||||||||||||||||||||||
|
|
|
|
|
|
|
|
|
|
|
|
|
|
|
|
|
|
|
|
|
| |||||||||||||||||||||||
Balance, December 31, 2011 | 68,370 | $ | 684 | $ | 149,243 | $ | (450,700 | ) | $ | 1,384,522 | $ | 18,953 | $ | (446 | ) | $ | 3,673 | $ | 1,105,929 | $ | 10,917 | $ | 1,116,846 | |||||||||||||||||||||
|
|
|
|
|
|
|
|
|
|
|
|
|
|
|
|
|
|
|
|
|
| |||||||||||||||||||||||
| | Common stock | | | | | | | | ||||||||||||||||||||
|---|---|---|---|---|---|---|---|---|---|---|---|---|---|---|---|---|---|---|---|---|---|---|---|---|---|---|---|---|
| | | | | | Stockholders' equity attributable to Fossil, Inc. | | | |||||||||||||||||||||
| | | | | Accumulated other comprehensive income (loss) | | | ||||||||||||||||||||||
| | Shares | Par value | Additional paid-in capital | Treasury stock | Retained earnings | Noncontrolling interest | Total stockholders' equity | |||||||||||||||||||||
Balance, January 2, 2010 | 66,900 | $ | 669 | $ | 93,037 | $ | 0 | $ | 834,615 | $ | 34,460 | $ | 962,781 | $ | 5,631 | $ | 968,412 | |||||||||||
Common stock issued upon exercise of stock options and stock appreciation rights | 1,382 | 14 | 23,396 | 0 | 0 | 0 | 23,410 | 0 | 23,410 | |||||||||||||||||||
Tax benefit derived from stock-based compensation | 0 | 0 | 11,961 | 0 | 0 | 0 | 11,961 | 0 | 11,961 | |||||||||||||||||||
Repurchase of common stock | 0 | 0 | 0 | (199,222 | ) | 0 | 0 | (199,222 | ) | 0 | (199,222 | ) | ||||||||||||||||
Retirement of common stock | (563 | ) | (6 | ) | (21,746 | ) | 21,752 | 0 | 0 | 0 | 0 | 0 | ||||||||||||||||
Restricted stock issued in connection with stock-based compensation plan | 163 | 2 | (2 | ) | 0 | 0 | 0 | 0 | 0 | 0 | ||||||||||||||||||
Common stock forfeitures put to treasury | 0 | 0 | 727 | (5,544 | ) | 0 | 0 | (4,817 | ) | 0 | (4,817 | ) | ||||||||||||||||
Stock-based compensation expense | 0 | 0 | 10,553 | 0 | 0 | 0 | 10,553 | 0 | 10,553 | |||||||||||||||||||
Net income | 0 | 0 | 0 | 0 | 255,205 | 0 | 255,205 | 9,685 | 264,890 | |||||||||||||||||||
Other comprehensive income | 0 | 0 | 0 | 0 | 0 | (15,042 | ) | (15,042 | ) | 5 | (15,037 | ) | ||||||||||||||||
Purchase of noncontrolling interest shares | 0 | 0 | (711 | ) | 0 | 0 | (711 | ) | (144 | ) | (855 | ) | ||||||||||||||||
Distribution of noncontrolling interest earnings | 0 | 0 | 0 | 0 | 0 | 0 | 0 | (7,587 | ) | (7,587 | ) | |||||||||||||||||
Balance, January 1, 2011 | 67,882 | $ | 679 | $ | 117,215 | $ | (183,014 | ) | $ | 1,089,820 | $ | 19,418 | $ | 1,044,118 | $ | 7,590 | $ | 1,051,708 | ||||||||||
Common stock issued upon exercise of stock options and stock appreciation rights | 436 | 4 | 8,536 | 0 | 0 | 0 | 8,540 | 0 | 8,540 | |||||||||||||||||||
Tax benefit derived from stock-based compensation | 0 | 0 | 9,980 | 0 | 0 | 0 | 9,980 | 0 | 9,980 | |||||||||||||||||||
Repurchase of common stock | 0 | 0 | 0 | (270,882 | ) | 0 | 0 | (270,882 | ) | 0 | (270,882 | ) | ||||||||||||||||
Retirement of common stock | (75 | ) | 0 | (6,220 | ) | 6,220 | 0 | 0 | 0 | 0 | 0 | |||||||||||||||||
Restricted stock issued in connection with stock-based compensation plan | 127 | 1 | (1 | ) | 0 | 0 | 0 | 0 | 0 | 0 | ||||||||||||||||||
Common stock forfeitures put to treasury | 0 | 0 | 481 | (6,220 | ) | 0 | 0 | (5,739 | ) | 0 | (5,739 | ) | ||||||||||||||||
Stock-based compensation expense | 0 | 0 | 14,615 | 0 | 0 | 0 | 14,615 | 0 | 14,615 | |||||||||||||||||||
Common stock issued upon legal settlement | 0 | 0 | 4,637 | 3,196 | 0 | 0 | 7,833 | 0 | 7,833 | |||||||||||||||||||
Net income | 0 | 0 | 0 | 0 | 294,702 | 0 | 294,702 | 12,700 | 307,402 | |||||||||||||||||||
Other comprehensive income | 0 | 0 | 0 | 0 | 0 | 2,762 | 2,762 | 0 | 2,762 | |||||||||||||||||||
Distribution of noncontrolling interest earnings | 0 | 0 | 0 | 0 | 0 | 0 | 0 | (9,373 | ) | (9,373 | ) | |||||||||||||||||
Balance, December 31, 2011 | 68,370 | $ | 684 | $ | 149,243 | $ | (450,700 | ) | $ | 1,384,522 | $ | 22,180 | $ | 1,105,929 | $ | 10,917 | $ | 1,116,846 | ||||||||||
Common stock issued upon exercise of stock options and stock appreciation rights | 336 | 3 | 6,087 | 0 | 0 | 0 | 6,090 | 0 | 6,090 | |||||||||||||||||||
Tax benefit derived from stock-based compensation | 0 | 0 | 11,693 | 0 | 0 | 0 | 11,693 | 0 | 11,693 | |||||||||||||||||||
Acquisition of common stock | 0 | 0 | 0 | (271,293 | ) | 0 | 0 | (271,293 | ) | 0 | (271,293 | ) | ||||||||||||||||
Retirement of common stock | (9,341 | ) | (93 | ) | (60,476 | ) | 722,410 | (661,841 | ) | 0 | 0 | 0 | 0 | |||||||||||||||
Restricted stock issued in connection with stock-based compensation plan | 116 | 1 | (1 | ) | 0 | 0 | 0 | 0 | 0 | 0 | ||||||||||||||||||
Common stock forfeitures put to treasury | 0 | 0 | 417 | (417 | ) | 0 | 0 | 0 | 0 | 0 | ||||||||||||||||||
Stock-based compensation expense | 0 | 0 | 18,568 | 0 | 0 | 0 | 18,568 | 0 | 18,568 | |||||||||||||||||||
Net income | 0 | 0 | 0 | 0 | 343,401 | 0 | 343,401 | 10,858 | 354,259 | |||||||||||||||||||
Other comprehensive income | 0 | 0 | 0 | 0 | 0 | 6,580 | 6,580 | 0 | 6,580 | |||||||||||||||||||
Purchase of noncontrolling interest shares | 0 | 0 | (7,332 | ) | 0 | 0 | 0 | (7,332 | ) | (6,729 | ) | (14,061 | ) | |||||||||||||||
Distribution of noncontrolling interest earnings | 0 | 0 | 0 | 0 | 0 | 0 | 0 | (8,198 | ) | (8,198 | ) | |||||||||||||||||
Acquisitions | 150 | 1 | 19,898 | 0 | 0 | 0 | 19,899 | 81 | 19,980 | |||||||||||||||||||
Balance, December 29, 2012 | 59,631 | $ | 596 | $ | 138,097 | $ | 0 | $ | 1,066,082 | $ | 28,760 | $ | 1,233,535 | $ | 6,929 | $ | 1,240,464 | |||||||||||
See notes to consolidated financial statements.
62
FOSSIL, INC.
CONSOLIDATED STATEMENTS OF CASH FLOWS
AMOUNTS IN THOUSANDS
Fiscal Year | 2012 | 2011 | 2010 | |||||||
|---|---|---|---|---|---|---|---|---|---|---|
Operating Activities: | ||||||||||
Net income | $ | 354,259 | $ | 307,402 | $ | 264,890 | ||||
Adjustments to reconcile net income to net cash provided by operating activities: | ||||||||||
Depreciation, amortization and accretion | 65,536 | 51,925 | 40,560 | |||||||
Stock-based compensation | 18,568 | 14,615 | 10,553 | |||||||
Increase (decrease) in allowance for returns—net of inventory in transit | 3,395 | (700 | ) | 15,558 | ||||||
Loss on disposal of assets | 2,290 | 2,582 | 748 | |||||||
Impairment losses | 1,231 | 957 | 7,429 | |||||||
Equity in income of joint venture | (1,382 | ) | (508 | ) | (1,072 | ) | ||||
Distribution from joint venture | 1,870 | 2,226 | 4,726 | |||||||
(Decrease) increase in allowance for doubtful accounts | (1,221 | ) | 556 | 3,921 | ||||||
Excess tax benefits from stock-based compensation | (11,693 | ) | (9,980 | ) | (11,961 | ) | ||||
Deferred income taxes and other | 10,591 | 29,697 | 11,213 | |||||||
Contingent consideration revaluation | (9,949 | ) | 0 | 0 | ||||||
Changes in operating assets and liabilities: | ||||||||||
Accounts receivable | (42,849 | ) | (44,061 | ) | (85,893 | ) | ||||
Inventories | 10,677 | (122,648 | ) | (115,921 | ) | |||||
Prepaid expenses and other current assets | 38,236 | (34,029 | ) | (14,298 | ) | |||||
Accounts payable | (7,017 | ) | 12,657 | 18,193 | ||||||
Accrued expenses | 2,847 | 34,094 | 63,331 | |||||||
Income taxes payable | 16,211 | 6,482 | (2,800 | ) | ||||||
Net cash provided by operating activities | 451,600 | 251,267 | 209,177 | |||||||
Investing Activities: | ||||||||||
Additions to property, plant and equipment | (112,385 | ) | (109,852 | ) | (46,538 | ) | ||||
Increase in intangible and other assets | (10,419 | ) | (21,644 | ) | (274 | ) | ||||
Purchases of securities available for sale | 0 | (222 | ) | (628 | ) | |||||
Sales/maturities of securities available for sale | 0 | 8,255 | 314 | |||||||
Proceeds from sale of property, plant and equipment | 68 | 21,388 | 448 | |||||||
Net change in restricted cash | 6,734 | (7,998 | ) | 0 | ||||||
Other investing | 0 | 0 | (855 | ) | ||||||
Business acquisitions—net of cash acquired | (229,151 | ) | 0 | 0 | ||||||
Net cash used in investing activities | (345,153 | ) | (110,073 | ) | (47,533 | ) | ||||
Financing Activities: | ||||||||||
Acquisition of common stock | (271,293 | ) | (270,882 | ) | (199,222 | ) | ||||
Distribution of noncontrolling interest earnings | (8,198 | ) | (9,373 | ) | (7,587 | ) | ||||
Purchase of noncontrolling interest shares | (14,061 | ) | 0 | 0 | ||||||
Excess tax benefits from stock-based compensation | 11,693 | 9,980 | 11,961 | |||||||
Borrowings on notes payable | 554,568 | 12,883 | 1,243 | |||||||
Payments on notes payable | (498,391 | ) | (8,838 | ) | (389 | ) | ||||
Common stock issued upon legal settlement | 0 | 7,833 | 0 | |||||||
Proceeds from exercise of stock options | 6,090 | 8,540 | 23,410 | |||||||
Net cash used in financing activities | (219,592 | ) | (249,857 | ) | (170,584 | ) | ||||
Effect of exchange rate changes on cash and cash equivalents | 2,883 | 3,367 | (3,441 | ) | ||||||
Net decrease in cash and cash equivalents | (110,262 | ) | (105,296 | ) | (12,381 | ) | ||||
Cash and cash equivalents: | ||||||||||
Beginning of year | 287,498 | 392,794 | 405,175 | |||||||
End of year | $ | 177,236 | $ | 287,498 | $ | 392,794 | ||||
Fiscal Year | 2011 | 2010 | 2009 | |||||||||
Operating Activities: | ||||||||||||
Net income | $ | 307,402 | $ | 264,890 | $ | 144,294 | ||||||
Adjustments to reconcile net income to net cash provided by operating activities: | ||||||||||||
Depreciation, amortization and accretion | 51,925 | 40,560 | 41,334 | |||||||||
Stock-based compensation | 14,615 | 10,553 | 6,787 | |||||||||
(Decrease) increase in allowance for returns-net of inventory in transit | (700 | ) | 15,558 | (557 | ) | |||||||
Loss on disposal of assets | 2,582 | 748 | 618 | |||||||||
Impairment losses | 957 | 7,429 | 5,232 | |||||||||
Equity in income of joint venture | (508 | ) | (1,072 | ) | (449 | ) | ||||||
Distribution from joint venture | 2,226 | 4,726 | 0 | |||||||||
Increase in allowance for doubtful accounts | 556 | 3,921 | 2,599 | |||||||||
Excess tax benefits from stock-based compensation | (9,980 | ) | (11,961 | ) | (1,166 | ) | ||||||
Deferred income taxes and other | 29,697 | 11,213 | 3,235 | |||||||||
Changes in operating assets and liabilities: | ||||||||||||
Accounts receivable | (44,061 | ) | (85,893 | ) | (4,180 | ) | ||||||
Inventories | (122,648 | ) | (115,921 | ) | 44,569 | |||||||
Prepaid expenses and other current assets | (34,029 | ) | (14,298 | ) | 8,491 | |||||||
Accounts payable | 12,657 | 18,193 | 6,101 | |||||||||
Accrued expenses | 34,094 | 63,331 | 1,777 | |||||||||
Income taxes payable | 6,482 | (2,800 | ) | 7,303 | ||||||||
|
|
|
|
|
| |||||||
Net cash provided by operating activities | 251,267 | 209,177 | 265,988 | |||||||||
Investing Activities: | ||||||||||||
Additions to property, plant and equipment | (109,852 | ) | (46,538 | ) | (37,687 | ) | ||||||
Increase in intangible and other assets | (21,644 | ) | (274 | ) | (385 | ) | ||||||
Purchase of securities available for sale | (222 | ) | (628 | ) | (1,237 | ) | ||||||
Sales/maturities of securities available for sale | 8,255 | 314 | 938 | |||||||||
Proceeds from sale of property, plant and equipment | 21,388 | 448 | 76 | |||||||||
Purchase of noncontrolling interest shares | 0 | (855 | ) | 0 | ||||||||
Net change in restricted cash | (7,998 | ) | 0 | 0 | ||||||||
|
|
|
|
|
| |||||||
Net cash used in investing activities | (110,073 | ) | (47,533 | ) | (38,295 | ) | ||||||
Financing Activities: | ||||||||||||
Acquisition of common stock | (270,882 | ) | (199,222 | ) | 0 | |||||||
Distribution of noncontrolling interest earnings | (9,373 | ) | (7,587 | ) | (2,693 | ) | ||||||
Excess tax benefits from stock based compensation | 9,980 | 11,961 | 1,166 | |||||||||
Borrowings on notes payable | 12,883 | 1,243 | 5,111 | |||||||||
Payments on notes payable | (8,838 | ) | (389 | ) | (7,055 | ) | ||||||
Common stock issued upon legal settlement | 7,833 | 0 | 0 | |||||||||
Proceeds from exercise of stock options | 8,540 | 23,410 | 3,756 | |||||||||
|
|
|
|
|
| |||||||
Net cash (used in) provided by financing activities | (249,857 | ) | (170,584 | ) | 285 | |||||||
Effect of exchange rate changes on cash and cash equivalents | 3,367 | (3,441 | ) | 5,185 | ||||||||
|
|
|
|
|
| |||||||
Net (decrease) increase in cash and cash equivalents | (105,296 | ) | (12,381 | ) | 233,163 | |||||||
Cash and cash equivalents: | ||||||||||||
Beginning of year | 392,794 | 405,175 | 172,012 | |||||||||
|
|
|
|
|
| |||||||
End of year | $ | 287,498 | $ | 392,794 | $ | 405,175 | ||||||
|
|
|
|
|
| |||||||
See notes to the consolidated financial statements.
FOSSIL, INC.
NOTES TO CONSOLIDATED FINANCIAL STATEMENTS
1. Significant Accounting Policies
Consolidated Financial Statementsinclude the accounts of Fossil, Inc., a Delaware corporation, and its subsidiaries (the “Company”"Company"). The Company reports on a fiscal year reflecting the retail-based calendar (containing 4-4-5 week calendar quarters). References to 2012, 2011 2010 and 20092010 are for the fiscal years ended December 29, 2012, December 31, 2011, and January 1, 2011, and January 2, 2010, respectively. All intercompany balances and transactions are eliminated in consolidation. The Company is a leader in the design, development, marketing and distribution of contemporary, high quality fashion accessories on a global basis. The Company’sCompany's products are sold primarily through department stores, specialty retailers and Company-owned retail stores worldwide.
Effective January 3, 2010, the Company made changes to the presentation of reportable segments to reflect changes in the way its chief operating decision maker evaluates the performance of its operations, develops strategy and allocates capital resources. The Company’s reportable segments consist of the following: North America wholesale, Europe wholesale, Asia Pacific wholesale and Direct to consumer. Prior to January 3, 2010, the Company’s reportable segments consisted of the following: United States wholesale, Europe wholesale, Other International wholesale and Direct to consumer.
These changes included the reclassification of the Company’s wholesale operations in Canada and Mexico and its U.S. export business, all of which were previously recorded within the Company’s Other International wholesale segment, to the North America wholesale segment. The Company’s U.S. domestic wholesale operations previously recorded within the United States wholesale segment, were also reclassified to the North America wholesale segment. The Company’s Asia Pacific wholesale operations, previously recorded within the Other International wholesale segment, were reclassified to the Asia Pacific wholesale segment. The Company’s operations related to its joint venture with Fossil, Spain S.A., previously recorded within the Other International wholesale segment, were reclassified to the Europe wholesale segment. The Company’s historical segment disclosures were recast to be consistent with the current presentation.
Use of Estimatesare required in the preparation of the consolidated financial statements in conformity with accounting principles generally accepted in the United States of America. Management makes estimates and assumptions that affect the reported amounts of assets and liabilities, and the disclosure of contingent assets and liabilities at the date of the consolidated financial statements and the reported amounts of revenues and expenses during the reporting period. On an on-goingongoing basis, management evaluates its estimates and judgments, including those related to product returns, allowance for bad debt, inventories, long-lived assets, goodwill and trade names, income taxes, warranty costs, hedge accounting, litigation, reserves and stock-based compensation. Management bases its estimates and judgments on historical experience and on various other factors that it believes are reasonable under the circumstances. Management estimates form the basis for making judgments about the carrying value of the assets and liabilities that are not readily apparent from other sources. Actual results could differ from those estimates under different assumptions or conditions.
Concentration of Riskinvolves financial instruments that potentially expose the Company to concentration of credit risk and consist primarily of cash investments and accounts receivable. The Company places its cash investments with high-credit quality financial institutions and currently invests primarily in corporate debt securities and money market funds with major banks and financial institutions. Accounts receivable are generally diversified due to the number of entities comprising the Company’sCompany's customer base and their dispersion across many geographic regions. The Company believes no significant concentration of credit risk exists with respect to these cash investments and accounts receivable.
A significant portion of sales of the Company’sCompany's products are supplied by manufacturers located outside of the U.S., primarily in Asia. While the Company is not dependent on any single manufacturer outside the U.S., the Company could be adversely affected by political or economic disruptions affecting the business or operations of
64
third-party manufacturers located outside of the U.S. In fiscal years 2012 and 2011, and 2010, threetwo of the Company’sCompany's majority-owned assembly factories accounted for more than 60% of the Company’sCompany's total watch assembly and jewelry production.
Cash Equivalentsare considered all highly liquid investments with original maturities of three months or less from the date of purchase.
Restricted Cash at as of December 29, 2012 was comprised of $0.3 million in short-term balances, primarily pledged as collateral to secure bank guarantees for the purpose of obtaining retail space. As of December 31, 2011, was primarily comprisedthe Company had short-term restricted cash of $5.9 million, in cashprimarily pledged as collateral to secure bank guarantees on behalf of the Company for payments related to prospective value addedvalue-added tax liabilities. ThisShort-term restricted cash is reported in prepaid expenses and other current assets in the Company’sCompany's consolidated balance sheets as a component of current assets. The Company also hashad long-term restricted cash balances of $1.0 million and $2.1 million in cashas of December 29, 2012
FOSSIL, INC.
NOTES TO CONSOLIDATED FINANCIAL STATEMENTS (Continued)
1. Significant Accounting Policies (Continued)
and December 31, 2011, respectively, pledged as collateral to secure bank guarantees for the purpose of obtaining retail space. This restricted cash is reported in intangible and other assets-netassets—net in the Company’sCompany's consolidated balance sheets as a component of long-term assets.
Securities Available for Saleconsists of debt securities with original maturities exceeding three months and investments in publicly traded equity securities. By policy, the Company invests primarily in high-grade, marketable securities. Unrealized holding gains (losses)and losses are included in accumulated other comprehensive income in the Company’sCompany's consolidated balance sheets as a component of stockholders’stockholders' equity. In fiscal year 2011, the Company sold all of the bondsdebt securities it held at their approximate carrying value forof $8.1 million.
Accounts Receivableare stated net of allowances of approximately $61.6$65.3 million and $62.7$61.6 million for estimated customer returns and approximately $18.2$17.1 million and $18.0$18.2 million for doubtful accounts at the end of fiscal years 20112012 and 2010,2011, respectively. The Company’sCompany's bad debt allowance has increased over the last threeduring fiscal years 2011 and 2010 due to the challenging global economic environment. As a resultDue to an improvement in the aging of the difficult economic environment, manyCompany's receivables and the resolution of certain customer bankruptcies, the Company’s customers both domestically and internationally have experienced financial difficulties including bankruptcy. The Company increasedwas able to reduce its bad debt allowance to reserve for these bankruptcies, increased risks of non-payment and increased risk of customer charge-backs.in fiscal year 2012. The Company’sCompany's policy is to maintain the reserve balances for bankruptcies until such time as the bankruptcies are actually settled. The total amount charged to cost and expenses relating to the Company's doubtful accounts receivables is not material to the Company's consolidated statements of comprehensive income. See Schedule II—Valuations and Qualifying Accounts for more information regarding the Company's bad debt allowance.
Inventoriesare stated at the lower of market or average cost, including any applicable duty and freight charges. Inventory held at consignment locations is included in the Company's finished goods inventory, and at the end of fiscal years 2012 and 2011 was $35.9 million and $18.5 million, respectively.
Investmentsin which the Company has significant influence over the investee are accounted for utilizing the equity method. If the Company does not have significant influence over the investee, the cost method is utilized.
Property, Plant and Equipmentis stated at cost less accumulated depreciation and amortization. Depreciation is calculated using the straight-line method over the estimated useful lives of the assets of thirty years for buildings, five years for furniture and fixtures and three to seven years for computer equipment and software. Leasehold improvements are amortized over the shorter of the lease term or the asset’sasset's useful life.
Property, plant and equipment and other long-lived assets are evaluated for impairment whenever events or conditions indicate that the carrying value of an asset may not be recoverable based on expected undiscounted cash flows related to the asset. Impairment losses related to underperforming Company-owned retail stores of approximately $1.2 million, $1.0 million $1.8 million and $2.5$1.8 million were recorded in fiscal years 2012, 2011 2010 and 2009,2010, respectively, and are included in selling and distribution expenses in the Company’sCompany's consolidated statementstatements of income and comprehensive income. The Company also recorded a $3.7 million impairment loss related to a Company-owned office building in fiscal 2010, which was included in general and administrative expenses in the Company’sCompany's consolidated statementstatements of income and comprehensive income. No impairment losses were recorded on Company-owned office buildings in fiscal years 20112012 or 2009.2011.
Goodwill and Other Intangible Assetsinclude the cost in excess of net tangible assets acquired (goodwill), trademarks, trade names, customer lists and patents. Trademarks, customer lists and patents are
FOSSIL, INC.
65NOTES TO CONSOLIDATED FINANCIAL STATEMENTS (Continued)
are amortized using the straight-line method over their estimated useful lives, which are generally seventhree to twenty years. Goodwill and other indefinite-lived intangible assets, such as trade names acquired in business combinations, are evaluated for impairment annually as of the end of the fiscal year rather than amortized. Additionally, if events or conditions were to indicate the carrying value of a reporting unit or an indefinite-lived intangible asset may not be recoverable, the Company would evaluate the asset for impairment at that time. Impairment testing compares the carrying amount of the asset with its fair value. When the carrying amount of the asset exceeds its fair value, an impairment charge is recorded.
The Company has three reporting units for which it evaluates goodwill for impairment. These reporting units are North America wholesale, Europe wholesale and Asia Pacific wholesale. The fair value of each reporting unit is estimated using market comparable information. If the estimated fair value of a reporting unit exceeds its carrying value, no impairment charge is recorded. As of December 31, 2011,29, 2012, the fair value of each of these reporting units substantially exceeded its carrying value.
Judgments and assumptions are inherent in the Company’sCompany's estimate of future cash flows used to determine the estimate of the reporting unit’sunit's fair value. The most significant assumptions associated with the fair value calculations include net sales growth rates and discount rates. If the actual future sales results do not meet the assumed growth rates, future impairments of goodwill may be incurred.
The Company estimates the fair value of its trade names using discounted cash flow methodologies. Due to the inherent uncertainties involved in making the estimates and assumptions used in the fair value analysis, actual results may differ, which could alter the fair value of the trade names and possibly result in impairment charges in future periods. The Company has completed the required annual impairment testing for trade names for fiscal years 2012, 2011 2010 and 2009.2010. No impairment charge wascharges were recorded in fiscal yearyears 2012 and 2011, and impairment charges of $1.8 million and $2.7 million were recorded in fiscal years 2010 and 2009, respectively.year 2010. See Note 7-Intangible8—Intangible and Other Assets, for more information regarding impairment to the Company’sCompany's trade names.
Accrued Expenses Otherincludes liabilities relating to warranties, duty, deferred compensation, gift cards, forward contracts, taxes, deferred rent, and other liabilities which are current in nature.
Warranty Liabilityis recorded using historical warranty repair experience. As changesOther Long-Term Liabilities includes obligations relating to asset retirements, deferred rent, forward contracts and defined benefits relating to certain international employees that are not current in warranty costs are experienced, the warranty accrual is adjusted as necessary. The warranty liability at the end of fiscal years 2011, 2010 and 2009 was $11.0 million, $8.5 million and $6.4 million, respectively.nature.
Cumulative Translation Adjustmentis included as a component of accumulated other comprehensive income and reflects the adjustments resulting from translating the financial statements of foreign subsidiaries.subsidiaries into U.S. dollars. The functional currency of the Company’sCompany's foreign subsidiaries is the currency of the primary economic environment in which the entity operates, which is generally the local currency of the country. Accordingly, assets and liabilities of the foreign subsidiaries are translated to U.S. dollars at fiscal year end exchange rates. Income and expense items are translated at daily or average monthly exchange rates. Changes in exchange rates that affect cash flows and the related receivables or payables are recognized as transaction gains and losses in determining net income. The Company incurred net foreign currency transaction losses,gains, including gains and losses associated with the settlement of forward contracts, of approximately $5.6 million and $5.2 million in fiscal years 2012 and 2010, respectively, and a net loss of approximately $20.7 million in fiscal year 2011
FOSSIL, INC.
NOTES TO CONSOLIDATED FINANCIAL STATEMENTS (Continued)
1. Significant Accounting Policies (Continued)
2011. These net gains and gains of $5.2 million and $5.8 million in fiscal years 2010 and 2009, respectively, whichlosses have been included in other income (expense) income-net.—net in the Company's consolidated statements of comprehensive income.
Forward Contractsare entered into by the Company principally to hedge the future payment of intercompany inventory transactions by its non-U.S. subsidiaries. These cash flow hedges are stated at estimated fair value and changes in fair value are reported as a component of other comprehensive income (loss) income,, net of taxes.taxes on the Company's consolidated statements of comprehensive income. If the Company werewas to settle its Euro, Canadian Dollar, Japanese Yen, British Pound, Australian Dollar, and Mexican Peso based forward contracts at fiscal year end 2011,2012, the result would have been a net gainloss of approximately $4.8$1.8 million, net of taxes. This unrealized gainloss is recognized in other comprehensive income (loss) income,, net of taxes.
66
taxes on the Company's consolidated statements of comprehensive income. Additionally, to the extent that any of these contracts are not considered to be perfectly effective in offsetting the change in the value of the cash flows being hedged, any changes in fair value relating to the ineffective portion of these contracts would be recognized in other income (expense) income-net.—net on the Company's consolidated statements of comprehensive income. See Note 8-Derivatives9—Derivatives and Risk Management for more information regarding the Company’sCompany's use of forward contracts.
Litigation Reservesare estimated amounts for claims that are probable and can be reasonably estimated and are recorded as liabilities in the Company's consolidated balance sheet.sheets. The likelihood of a material change in these estimated reserves would be dependent on new claims that may arise, changes in the circumstances used to estimate amounts for prior period claims and favorable or unfavorable final settlements of prior period claims. As additional information becomes available, the Company assesses the potential liability related to new claims and existing claims and revises estimates as appropriate. As new claims arise or circumstances change relative to prior claim assessments, revisions in estimates of the potential liability could materially impact the Company’sCompany's consolidated results of consolidated operations and financial position.
Stock-Based Compensationis accounted for in accordance with the provisions of Accounting Standards Codification (“ASC”("ASC") 718,Compensation-StockCompensation—Stock Compensation(“ ("ASC 718”718"). The Company utilizes the Black-Scholes model to determine the fair value of stock options and stock appreciation rights on the date of grant. The model requires the Company to make assumptions concerning (i) the length of time employees will retain their vested stock options before exercising them (“("expected term”term"), (ii) the volatility of the Company’sCompany's common stock price over the expected term, and (iii) the number of stock options that will be forfeited. Changes in these assumptions can materially affect the estimate of fair value of stock-based compensation and, consequently, the related expense amounts recognized on the Company's consolidated statements of income and comprehensive income.
Revenuesare recognized at the point title and the risks and rewards of ownership have passed to the customer, based on the terms of sale. Revenue from sales of the Company's products including those that are subject to inventory consignment agreements is recognized when title and risk of loss transfers, delivery has occurred, the price to the buyer is determinable and collectability is reasonably assured. The Company accepts limited returns and may request that a customer return a product if the customer has an excess of any style that the Company has identified as being a poor performer for that customer or geographic location. The Company continually monitors returns and maintains a provision for estimated returns based upon historical experience and any specific issues identified. Product returns are accounted for as reductions to revenue, cost of sales, accounts receivable and an increase in inventory to the extent the returned product is resalable. While returns have historically been within management’s
FOSSIL, INC.
NOTES TO CONSOLIDATED FINANCIAL STATEMENTS (Continued)
1. Significant Accounting Policies (Continued)
management's expectations and the provisions established, future return rates may differ from those experienced in the past. In the event that the Company’sCompany's products are performing poorly in the retail market and/or it experiences product damages or defects at a rate significantly higher than the historical rate, the resulting returns could have an adverse impact on the operating results for the period or periods in which such returns materialize.occur. Taxes imposed by governmental authorities on the Company’sCompany's revenue-producing activities with customers, such as sales taxes and value added taxes, are excluded from net sales.
Cost of Salesincludes raw material costs, assembly labor, assembly overhead including depreciation expense, assembly warehousing costs and shipping and handling costs related to the movement of finished goods from assembly locations to sales distribution centers and from sales distribution centers to customer locations. Additionally, cost of sales includes customs duties, product packaging cost, royalty cost associated with sales of licensed products, the cost of molding and tooling and inventory shrinkage and damages.
Selling and Distribution Expensesinclude sales and distribution labor costs, sales distribution center and warehouse facility costs, depreciation expense related to sales distribution and warehouse facilities, the four-wall operating costs of the Company’sCompany's retail stores, point-of-sale expenses, advertising expenses and art, design and product development labor costs.
General and Administrative Expensesinclude administrative support labor and “back office”"back office" or support costs such as treasury, legal, information services, accounting, internal audit, human resources and executive management costs. General and administrative expenses also include costs associated with stock-based compensation.
67
Advertising Costsfor in-store and media advertising as well as co-op advertising, catalog costs, product displays, show/exhibit costs, advertising royaltyroyalties related to the sales of licensed brands, internet costs associated with affiliation fees, printing costs and promotional allowances are expensed as incurred. Advertising costs were approximately $175.3 million, $156.5 million $123.8 million and $85.6$123.8 million for fiscal years 2012, 2011 2010 and 2009,2010, respectively.
Noncontrolling Interestis recognized as equity in the Company's consolidated balance sheets, is reflected in net income attributable to noncontrolling interest in consolidated net income and is captured within the summary of changes in equity attributable to controlling and noncontrolling interests. Noncontrolling interests represent ownership interests in subsidiaries not held by the Company.
Earnings Per Share (“EPS”("EPS").Basic EPS is based on the weighted average number of common shares outstanding during each period. Diluted EPS adjusts basic EPS for the effects of dilutive common stock equivalents outstanding during each period using the treasury stock method.
FOSSIL, INC.
NOTES TO CONSOLIDATED FINANCIAL STATEMENTS (Continued)
1. Significant Accounting Policies (Continued)
The following table reconciles the numerators and denominators used in the computations of both basic and diluted EPS (in thousands except per share data):
Fiscal Year | 2012 | 2011 | 2010 | |||||||
|---|---|---|---|---|---|---|---|---|---|---|
Numerator: | ||||||||||
Net income attributable to Fossil, Inc. | $ | 343,401 | $ | 294,702 | $ | 255,205 | ||||
Denominator: | ||||||||||
Basic EPS computations: | ||||||||||
Basic weighted average common shares outstanding | 60,959 | 63,298 | 66,701 | |||||||
Basic EPS | $ | 5.63 | $ | 4.66 | $ | 3.83 | ||||
Diluted EPS computation: | ||||||||||
Basic weighted average common shares outstanding | 60,959 | 63,298 | 66,701 | |||||||
Stock options, stock appreciation rights and restricted stock units | 441 | 667 | 986 | |||||||
Diluted weighted average common shares outstanding | 61,400 | 63,965 | 67,687 | |||||||
Diluted EPS | $ | 5.59 | $ | 4.61 | $ | 3.77 | ||||
Fiscal Year | 2011 | 2010 | 2009 | |||||||||
Numerator: | ||||||||||||
Net income attributable to Fossil, Inc. | $ | 294,702 | $ | 255,205 | $ | 139,188 | ||||||
|
|
|
|
|
| |||||||
Denominator: | ||||||||||||
Basic EPS computations: | ||||||||||||
Basic weighted average common shares outstanding | 63,298 | 66,701 | 66,684 | |||||||||
|
|
|
|
|
| |||||||
Basic EPS | $ | 4.66 | $ | 3.83 | $ | 2.09 | ||||||
|
|
|
|
|
| |||||||
Diluted EPS computation: | ||||||||||||
Basic weighted average common shares outstanding | 63,298 | 66,701 | 66,684 | |||||||||
Stock options, stock appreciation rights and restricted stock units | 667 | 986 | 469 | |||||||||
|
|
|
|
|
| |||||||
Diluted weighted average common shares outstanding | 63,965 | 67,687 | 67,153 | |||||||||
|
|
|
|
|
| |||||||
Diluted EPS | $ | 4.61 | $ | 3.77 | $ | 2.07 | ||||||
|
|
|
|
|
| |||||||
Approximately 40,000203,000 and 812,000 weighted average40,000 shares issuable under stock-based awards were not included in the diluted EPS calculation in fiscal years 20112012 and 2009,2011, respectively, because they were antidilutive. There were no antidilutive shares in fiscal year 2010.
Income Taxesare provided for under the asset and liability method for temporary differences in the recognition of certain revenues and expenses for tax and financial reporting purposes. The Company applies the provisions of ASC 740,Income Taxes ("ASC 740"), which addresses how the benefit of tax positions taken or expected to be taken on a tax return should be recorded in the financial statements. Tax benefits associated with uncertain tax positions are recognized in the period in which one of the following conditions is satisfied: (i) the more likely than not recognition threshold is satisfied; (ii) the position is ultimately settled through negotiation or litigation; or (iii) the statute of limitations for the taxing authority to examine and challenge the position has expired. Tax benefits associated with an uncertain tax position are derecognized in the period in which the more likely than not recognition threshold is no longer satisfied.
68
Recently Issued Accounting Standards
In May 2011,July 2012, the Financial Accounting Standards Board (“FASB”("FASB") issued Accounting Standards Update (“ASU”("ASU") 2012-02. The amendments in this update permit an entity to make a qualitative assessment to determine if it is more likely than not that an indefinite-lived intangible asset other than goodwill is impaired. If an entity concludes that it is more likely than not that the fair value of an indefinite-lived intangible asset other than goodwill is less than its carrying amount, it is required to perform the quantitative impairment test for that asset. This ASU aligns the guidance of impairment testing for indefinite-lived intangible assets other than goodwill with that in ASU 2011-08,Intangibles—Goodwill and Other (Topic 350): Testing Goodwill for Impairment ("ASU 2011-08"). The guidance in ASU 2012-02 will be effective for the Company for annual and interim periods for fiscal years beginning after September 15, 2012, and is not expected to have a material impact on the Company's consolidated results of operations or financial position.
FOSSIL, INC.
NOTES TO CONSOLIDATED FINANCIAL STATEMENTS (Continued)
1. Significant Accounting Policies (Continued)
Recently Adopted Accounting Standards
In May 2011, FASB issued ASU 2011-04,Fair Measurement (Topic 820): Amendments to Achieve Common Fair Value Measurement and Disclosure Requirements in U.S. GAAP and IFRSs (“ ("ASU 2011-04”2011-04"). FASB intends the new guidance to achieve common fair value measurement and disclosure requirements in U.S. GAAPGenerally Accepted Accounting Principles and International Financial Reporting Standards. The amended guidance changes certain fair value measurement principles and enhances the disclosure requirements, particularly for Level 3 assets and liabilities for which the Company will be required to disclose quantitative information about the unobservable inputs used in fair value measurements. These changes became effective for the Company beginning January 1, 2012. The adoption of ASU 2011-04 isdid not expected to have a material impact on the Company’sCompany's consolidated results of operations andor financial position.
In June 2011, FASB issued ASU 2011-05, Comprehensive Income (Topic 220): Presentation of Comprehensive Income (“ ("ASU 2011-05”2011-05"). ASU 2011-05 eliminates the option to report other comprehensive income and its components in the consolidated statement of shareholder’sshareholder's equity and comprehensive income and requires an entity to present the total of comprehensive income, the components of net income and the components of other comprehensive income either in a single continuous statement or in two separate but consecutive statements. The amendmentsCompany adopted the single continuous statement beginning in the update do not change the items that must be reported in other comprehensive income or when an itemfirst quarter of other comprehensive income must be reclassified to net income. This amendment also required an entity to present on the face of the financial statements adjustments for items that are reclassified from accumulated other comprehensive income to net income. However, in December 2011, the FASB issued ASU 2011-12,Comprehensive Income (Topic 220): Deferral of the Effective Date for Amendments to the Presentation of Reclassifications of Items Out of Accumulated Other Comprehensive Income in ASU 2011-05 (“ASU 2011-12”). ASU 2011-12 defers the specific requirement to present items that are reclassified from accumulated other comprehensive income to net income separately with their respective components of net income and other comprehensive income while FASB further deliberates this aspect of the proposal.fiscal 2012. ASU 2011-05, as amended by ASU 2011-12, became effective for the Company beginning January 1, 2012. The adoption of ASU 2011-05 isdid not expected to have a material impact on the Company’sCompany's consolidated results of operations or financial position.
In September 2011, FASB issued ASU 2011-08,Intangibles-Goodwill and Other (Topic 350): Testing Goodwill for Impairment(“ASU 2011-08”).2011-08. ASU 2011-08 simplifies the assessment of goodwill for impairment by allowing companies the option to assess qualitative factors to determine whether the existence of events or circumstances leads to a determination that it is more likely than not that the fair value of a reporting unit is less than its carrying amount. If a company concludes from the qualitative assessment that impairment is more likely than not, the entity is required to perform the two-step quantitative impairment test. These changes became effective for the Company beginning January 1, 2012. The adoption of ASU 2011-08 isdid not expected to have a material impact on the Company’sCompany's consolidated results of operations andor financial position.
2. Acquisitions and Goodwill
In August 2010, Fossil (East) Limited, Skagen Designs, Ltd. Acquisition. On April 2, 2012, the Company acquired Skagen Designs, Ltd. and certain of its international affiliates ("Skagen Designs"). Skagen Designs was a wholly owned subsidiaryprivately held Nevada-based company that marketed and distributed contemporary Danish design accessories including watches, clocks, jewelry and sunglasses globally. The primary purpose of the acquisition was to add an attractive brand to the Company's portfolio that the Company exercisedcan grow using established distribution channels. The purchase price was $231.7 million in cash and 150,000 shares of the Company's common stock valued at $19.9 million based on the mean between the highest and lowest sales price of the Company's common stock on NASDAQ on April 2, 2012. To fund the cash purchase price, the Company utilized approximately $200 million of availability under its call option$350 million revolving line of credit and excess cash available in its international subsidiaries to fund the international portion of the purchase 370,500price. In addition, the sellers may receive up to 100,000 additional shares of the Company's common stock if the Company's net sales of SKAGEN® branded products exceed certain thresholds over a defined period of time (the "Earnout").
FOSSIL, INC.
NOTES TO CONSOLIDATED FINANCIAL STATEMENTS (Continued)
2. Acquisitions and Goodwill (Continued)
The Company recorded a contingent consideration liability in Fossil (Asia) Holdings Limited (“Fossil Taiwan”), representingaccrued expenses—other in the entire noncontrolling interest in Fossil Taiwan, for approximately $854,000. The Company’s ownership interest in Fossil Taiwan increased from 81%Company's consolidated balance sheets of $9.9 million as of the acquisition date related to 100%. The transactionthe Earnout. As of December 29, 2012, the contingent consideration liability was accounted for as an equity transaction, resultingremeasured at zero, which resulted in a decrease in operating expenses of $9.9 million during fiscal year 2012. The results of Skagen Designs' operations have been included in the Company’sCompany's consolidated financial statements since April 2, 2012.
Prior to closing the Skagen Designs acquisition, the Company incurred approximately $600,000 of acquisition-related expenses for legal, accounting and valuation services during fiscal year 2011 and the 13 weeks ended March 31, 2012. The Company incurred additional paid-in capitalacquisition and integration related costs of approximately $711,000.
The Company's consolidated statements of comprehensive income for fiscal year 2012 includes $93.8 million of net sales and $11.2 million of operating income, related to the results of operations of Skagen Designs since April 2, 2012. Operating income was favorably impacted by $10.0 million related to Skagen Designs' ongoing operations.
69 Assets acquired and liabilities assumed in the transaction were recorded at their acquisition date fair values, while transaction costs associated with the acquisition were expensed as incurred. Because the total purchase price exceeded the fair values of the tangible and intangible assets acquired, goodwill was recorded equal to the difference. The element of goodwill that is not separable into identifiable intangible assets represents expected synergies. The following table summarizes the allocation of the purchase price to the preliminary estimated fair value of the assets acquired and the liabilities assumed as of April 2, 2012, the effective date of the acquisition (in thousands):
Cash paid, net of cash acquired | $ | 229,012 | ||
Value of common stock issued | 19,899 | |||
Contingent consideration | 9,950 | |||
Total transaction consideration: | $ | 258,861 | ||
Accounts receivable | $ | 16,595 | ||
Inventories | 22,638 | |||
Prepaid expenses and other current assets | 3,306 | |||
Property, plant & equipment | 4,232 | |||
Goodwill | 140,387 | |||
Trade name | 64,700 | |||
Customer lists | 24,400 | |||
Patents | 1,500 | |||
Noncompete agreement | 1,900 | |||
Other long-term assets | 2,972 | |||
Current liabilities | (20,840 | ) | ||
Long-term liabilities | (2,929 | ) | ||
Total net assets acquired | $ | 258,861 | ||
NOTES TO CONSOLIDATED FINANCIAL STATEMENTS (Continued)
2. Acquisitions and Goodwill (Continued)
The amounts shown above may change in the near term as management continues to assess the fair value of acquired assets and liabilities. A change in this valuation may also impact the income tax related accounts and goodwill. The goodwill and trade name assets recognized from the acquisition have indefinite useful lives and will be tested annually for impairment. The amortization periods for the acquired customer lists, patents and noncompete agreements have amortization periods of five to nine years, three years and six years, respectively. Approximately $133.8 million of the goodwill recognized in the acquisition is expected to be deductible for tax purposes.
The following unaudited pro forma financial information presents the combined results of operations of Fossil, Inc. and Skagen Designs as if the acquisition had occurred at the beginning of each period presented below. The pro forma information is not necessarily indicative of what the financial position or results of operations actually would have been had the acquisition been completed at the beginning of each period presented below. In addition, the unaudited pro forma financial information is not indicative of, nor does it purport to project, the future financial position or operating results of Fossil, Inc. The unaudited pro forma financial information for fiscal 2012 was adjusted to exclude acquisition and integration costs and does not give effect to any potential cost savings or other operating efficiencies that could result from the acquisition. These acquisition and integration costs were included in the pro forma information for fiscal year 2011. The following table presents the unaudited pro forma financial information (in thousands except per share data):
Fiscal Year | 2012 | 2011 | |||||
|---|---|---|---|---|---|---|---|
| | Unaudited | ||||||
Net sales | $ | 2,887,951 | $ | 2,687,162 | |||
Net income attributable to Fossil, Inc. | 350,010 | 300,739 | |||||
Earnings per share: | |||||||
Basic | $ | 5.74 | $ | 4.75 | |||
Diluted | $ | 5.70 | $ | 4.70 | |||
Swiss Technology Productions AG Acquisition. Effective April 30, 2012, the Company acquired fifty-one percent of Swiss Technology Productions AG ("STP") to support its Swiss-made watch production. The acquisition was completed for 255,000 Swiss francs, approximately $266,000. The Company recorded approximately $160,000 of goodwill related to the acquisition. The results of STP's operations and related noncontrolling interest have been included in the Company's consolidated financial statements since the acquisition date.
Fossil Spain Acquisition. On August 10, 2012, the Company's Spanish joint venture company, Fossil, S.L. ("Fossil Spain"), entered into a Framework Agreement (the "Framework Agreement") with several related and unrelated parties, including General De Relojeria, S.A., the Company's joint venture partner, pursuant to which, among other things, Fossil Spain was granted the right to acquire the outstanding 50% of its shares owned by General De Relojeria, S.A. upon the expiration of the joint venture agreement on December 31, 2015.
The purchase price has a fixed and variable component. The fixed price will be determined based on 50% of the net book value of Fossil Spain as of December 31, 2012 (the net book value was approximately $15.9 million as of December 29, 2012). The variable price will be determined based on Fossil Spain's aggregated results of operations less dividends distributed by Fossil Spain to General De Relojeria, S.A. for the calendar years 2013, 2014 and 2015, with a minimum variable price of 2.0 million Euros (approximately $2.6 million at December 29, 2012) and a maximum variable price of 3.5 million Euros (approximately $4.6 million at December 29, 2012) each respective year.
FOSSIL, INC.
NOTES TO CONSOLIDATED FINANCIAL STATEMENTS (Continued)
2. Acquisitions and Goodwill (Continued)
Goodwill. Goodwill is the excess of the cost of an acquired entity over the net of the amounts assigned to assets acquired and liabilities assumed. The changes in the carrying amount of goodwill, which is not subject to amortization, were as follows (in thousands):.
Fiscal Year | North America wholesale | Europe wholesale | Asia Pacific wholesale | Direct to consumer | Total | |||||||||||||||
Balance at January 2, 2010 | $ | 23,721 | $ | 18,054 | $ | 2,491 | $ | 0 | $ | 44,266 | ||||||||||
Currency | 117 | 66 | 123 | 0 | 306 | |||||||||||||||
|
|
|
|
|
|
|
|
|
| |||||||||||
Balance at January 1, 2011 | 23,838 | 18,120 | 2,614 | 0 | 44,572 | |||||||||||||||
Currency | (233 | ) | (229 | ) | (56 | ) | 0 | (518 | ) | |||||||||||
|
|
|
|
|
|
|
|
|
| |||||||||||
Balance at December 31, 2011 | $ | 23,605 | $ | 17,891 | $ | 2,558 | $ | 0 | $ | 44,054 | ||||||||||
|
|
|
|
|
|
|
|
|
| |||||||||||
At Fiscal Year End | North America wholesale | Europe wholesale | Asia Pacific wholesale | Direct to consumer | Total | |||||||||||
|---|---|---|---|---|---|---|---|---|---|---|---|---|---|---|---|---|
Balance at January 1, 2011 | $ | 23,838 | $ | 18,120 | $ | 2,614 | $ | 0 | $ | 44,572 | ||||||
Foreign currency changes | (233 | ) | (229 | ) | (56 | ) | 0 | (518 | ) | |||||||
Balance at December 31, 2011 | 23,605 | 17,891 | 2,558 | 0 | 44,054 | |||||||||||
Acquisitions | 85,530 | 46,020 | 8,997 | 0 | 140,547 | |||||||||||
Foreign currency changes | 135 | (27 | ) | 84 | 0 | 192 | ||||||||||
Balance at December 29, 2012 | $ | 109,270 | $ | 63,884 | $ | 11,639 | $ | 0 | $ | 184,793 | ||||||
3. Inventories
Inventories consisted of the following (in thousands):
At Fiscal Year End | 2011 | 2010 | ||||||
Components and parts | $ | 37,482 | $ | 23,292 | ||||
Work-in-process | 4,764 | 4,176 | ||||||
Inventory purchases in transit | 57,474 | 47,455 | ||||||
Finished goods | 389,263 | 297,012 | ||||||
|
|
|
| |||||
Inventories | $ | 488,983 | $ | 371,935 | ||||
|
|
|
| |||||
At Fiscal Year End | 2012 | 2011 | |||||
|---|---|---|---|---|---|---|---|
Components and parts | $ | 62,731 | $ | 37,482 | |||
Work-in-process | 8,071 | 4,764 | |||||
Finished goods | 435,512 | 446,737 | |||||
Inventories | $ | 506,314 | $ | 488,983 | |||
4. Warranty Reserve
The Company's warranty liabilities are primarily related to watch products. The Company's FOSSIL® watch products sold in the U.S. are covered by a limited warranty against defects in materials or workmanship for a period of 11 years from the date of purchase. RELIC® watch products sold in the U.S. are covered by a comparable 12 year warranty, while certain other watches sold by the Company are covered by a comparable two year limited warranty. SKAGEN branded watches are covered by a lifetime warranty against defects due to faulty material or workmanship subject to normal conditions of use. The Company's warranty liability is recorded using historical warranty repair expense.
FOSSIL, INC.
NOTES TO CONSOLIDATED FINANCIAL STATEMENTS (Continued)
4. Warranty Reserve (Continued)
As changes in warranty costs are experienced, the warranty accrual is adjusted as necessary. Warranty liability activity consisted of the following (in thousands):
Fiscal Year | 2012 | 2011 | |||||
|---|---|---|---|---|---|---|---|
Beginning balance | $ | 10,996 | $ | 8,534 | |||
Settlements in cash or kind | (6,945 | ) | (7,025 | ) | |||
Warranties issued and adjustments to preexisting warranties(1) | 8,737 | 9,487 | |||||
Liabilities assumed in acquisition | 595 | 0 | |||||
Ending balance | $ | 13,383 | $ | 10,996 | |||
5. Prepaid Expenses and Other Current Assets
Prepaid expenses and other current assets consisted of the following (in thousands):
At Fiscal Year End | 2011 | 2010 | ||||||
Prepaid royalties | $ | 29,329 | $ | 20,639 | ||||
Prepaid taxes | 21,493 | 12,699 | ||||||
Other receivables | 21,861 | 9,606 | ||||||
Forward contracts | 9,719 | 1,388 | ||||||
Prepaid rent | 7,726 | 7,097 | ||||||
Restricted cash | 5,908 | 0 | ||||||
Other | 14,460 | 10,741 | ||||||
|
|
|
| |||||
Prepaid expenses and other current assets | $ | 110,496 | $ | 62,170 | ||||
|
|
|
| |||||
At Fiscal Year End | 2012 | 2011 | |||||
|---|---|---|---|---|---|---|---|
Prepaid royalties | $ | 9,814 | $ | 29,329 | |||
Prepaid taxes | 20,876 | 21,493 | |||||
Other receivables | 6,768 | 21,861 | |||||
Forward contracts | 2,336 | 9,719 | |||||
Prepaid rent | 9,148 | 7,726 | |||||
Restricted cash | 303 | 5,908 | |||||
Other | 13,496 | 14,460 | |||||
Prepaid expenses and other current assets | $ | 62,741 | $ | 110,496 | |||
5.6. Property, Plant and Equipment
Property, plant and equipment-netequipment—net consisted of the following (in thousands):
At Fiscal Year End | 2011 | 2010 | ||||||
Land | $ | 14,357 | $ | 19,402 | ||||
Buildings | 64,225 | 86,366 | ||||||
Furniture and fixtures | 92,713 | 87,663 | ||||||
Computer equipment and software | 137,167 | 111,699 | ||||||
Leasehold improvements | 179,386 | 110,179 | ||||||
Construction in progress | 11,447 | 7,427 | ||||||
|
|
|
| |||||
| 499,295 | 422,736 | |||||||
Less accumulated depreciation and amortization | 217,245 | 205,312 | ||||||
|
|
|
| |||||
Property, plant and equipment-net | $ | 282,050 | $ | 217,424 | ||||
|
|
|
| |||||
At Fiscal Year End | 2012 | 2011 | |||||
|---|---|---|---|---|---|---|---|
Land | $ | 16,008 | $ | 14,357 | |||
Buildings | 74,592 | 64,225 | |||||
Furniture and fixtures | 107,409 | 92,713 | |||||
Computer equipment and software | 155,408 | 137,167 | |||||
Leasehold improvements | 210,414 | 179,386 | |||||
Construction in progress | 33,656 | 11,447 | |||||
| 597,487 | 499,295 | ||||||
Less accumulated depreciation and amortization | 262,041 | 217,245 | |||||
Property, plant and equipment—net | $ | 335,446 | $ | 282,050 | |||
FOSSIL, INC.
70NOTES TO CONSOLIDATED FINANCIAL STATEMENTS (Continued)
6.7. Investments
The Company has a 50% equity interest in Fossil Spain S.A. (“Fossil Spain”) pursuant to a joint venture agreement with Sucesores de A. CardarsoGeneral De Relojeria, S.A. for the marketing, distribution and sale of the Company’sCompany's products in Spain and Portugal. The Company has accounted for the investment based upon the equity method from the effective date of the investment and, as of December 31, 2011,29, 2012, the investment balance was approximately $7.5$7.0 million. The Company’sCompany's equity in Fossil Spain’sSpain's net income is recorded in the Europe wholesale segment in other income (expense) income-net—net in the Company's consolidated statements of comprehensive income and was $1.0 million, $1.4$1.0 million and $1.1$1.4 million for fiscal years 2012, 2011 2010 and 2009,2010, respectively. Net sales to Fossil Spain by the Company for fiscal years 2012, 2011, and 2010 and 2009 were $15.1 million, $19.2 million $16.3 million and $8.0$16.3 million, respectively. The Company had receivable balances from Fossil Spain of $3.7$2.0 million and $3.0$3.7 million as of December 31, 201129, 2012 and January 1,December 31, 2011, respectively, which are included in accounts receivable-net.receivable—net in the Company's consolidated balance sheets. See Note 2—Acquisitions and Goodwill and Note 20—Subsequent Events for more information regarding Fossil Spain.
The Company periodically evaluates whether declines in the fair value of its investments are other-than-temporary. This evaluation consists of several qualitative and quantitative factors regarding the severity and duration of the unrealized loss as well as the Company’sCompany's ability and intent to hold the investment. Factors considered include, if applicable, quoted market prices, recent financial results and operating trends, other publicly available information, implied values from any recent transactions or offers of investee securities, or other conditions that may affect the value of its investments.
FOSSIL, INC.
NOTES TO CONSOLIDATED FINANCIAL STATEMENTS (Continued)
8. Intangible and Other Assets
The following table summarizes intangible Intangible and other assets-net asassets consisted of fiscal year end 2011 and 2010, respectivelythe following (in thousands):
| | | 2012 | 2011 | |||||||||||||
|---|---|---|---|---|---|---|---|---|---|---|---|---|---|---|---|---|
At Fiscal Year End | Useful Lives | Carrying Amount | Accumulated Amortization | Carrying Amount | Accumulated Amortization | |||||||||||
Intangibles—subject to amortization: | ||||||||||||||||
Trademarks | 10 yrs. | $ | 4,135 | $ | 2,400 | $ | 4,121 | $ | 2,109 | |||||||
Customer lists | 5-9 yrs. | 32,144 | 9,980 | 7,636 | 7,274 | |||||||||||
Patents | 3-20 yrs. | 2,273 | 815 | 773 | 394 | |||||||||||
Noncompete agreement | 6 yrs. | 1,895 | 237 | |||||||||||||
Other | 7-20 yrs. | 258 | 194 | 193 | 190 | |||||||||||
Total intangibles—subject to amortization | 40,705 | 13,626 | 12,723 | 9,967 | ||||||||||||
Intangibles—not subject to amortization: | ||||||||||||||||
Trade names | 83,647 | 18,936 | ||||||||||||||
Other assets: | ||||||||||||||||
Key money deposits | 35,655 | 14,060 | 31,804 | 10,291 | ||||||||||||
Other deposits | 17,591 | 13,685 | ||||||||||||||
Deferred compensation plan assets | 3,188 | 2,897 | ||||||||||||||
Deferred tax asset—net | 6,536 | 4,875 | ||||||||||||||
Restricted cash | 991 | 2,114 | ||||||||||||||
Shop-in-shop | 11,396 | 5,297 | 6,965 | 3,433 | ||||||||||||
Other | 3,948 | 1 | 3,903 | 315 | ||||||||||||
Total other assets | 79,305 | 19,358 | 66,243 | 14,039 | ||||||||||||
Total intangible and other assets | $ | 203,657 | $ | 32,984 | $ | 97,902 | $ | 24,006 | ||||||||
Total intangible and other assets—net | $ | 170,673 | $ | 73,896 | ||||||||||||
| 2011 | 2010 | ||||||||||||||||
Useful | Carrying Amount | Accumulated Amortization | Carrying Amount | Accumulated Amortization | ||||||||||||||
Intangibles-subject to amortization: | ||||||||||||||||||
Trademarks | 10 yrs. | $ | 4,121 | $ | 2,109 | $ | 2,666 | $ | 1,795 | |||||||||
Customer lists | 9 yrs. | 7,636 | 7,274 | 7,937 | 6,963 | |||||||||||||
Patents | 14-20 yrs. | 773 | 394 | 775 | 349 | |||||||||||||
Other | 7-20 yrs. | 193 | 190 | 194 | 187 | |||||||||||||
|
|
|
|
|
|
|
| |||||||||||
Total intangibles-subject to amortization | 12,723 | 9,967 | 11,572 | 9,294 | ||||||||||||||
Intangibles-not subject to amortization: | ||||||||||||||||||
Trade names | 18,936 | 18,938 | ||||||||||||||||
Other assets: | ||||||||||||||||||
Key money deposits | 31,804 | 10,291 | 22,973 | 7,720 | ||||||||||||||
Other deposits | 13,685 | 11,991 | ||||||||||||||||
Deferred compensation plan assets | 2,897 | 3,295 | ||||||||||||||||
Deferred tax asset | 4,875 | 926 | ||||||||||||||||
Restricted cash | 2,114 | 0 | ||||||||||||||||
Other | 10,868 | 3,748 | 5,689 | 2,633 | ||||||||||||||
|
|
|
|
|
|
|
| |||||||||||
Total other assets | 66,243 | 14,039 | 44,874 | 10,353 | ||||||||||||||
|
|
|
|
|
|
|
| |||||||||||
Total intangible and other assets | $ | 97,902 | $ | 24,006 | $ | 75,384 | $ | 19,647 | ||||||||||
|
|
|
|
|
|
|
| |||||||||||
Total intangible and other assets-net | $ | 73,896 | $ | 55,737 | ||||||||||||||
|
|
|
| |||||||||||||||
71
Amortization expense for intangible assets key money deposits and other assets was approximately $5.1$3.5 million, $5.9$0.9 million and $4.4$1.4 million for fiscal years 2012, 2011 2010 and 2009,2010, respectively. Estimated aggregate future amortization expense by fiscal year for intangible assets key money deposits and other assets is estimated as follows (in thousands):
Fiscal Year | Amortization Expense | |||
|---|---|---|---|---|
2013 | $ | 4,125 | ||
2014 | 4,053 | |||
2015 | 3,661 | |||
2016 | 3,522 | |||
2017 | 3,263 | |||
FOSSIL, INC.
NOTES TO CONSOLIDATED FINANCIAL STATEMENTS (Continued)
8. Intangible and Other Assets (Continued)
Fiscal Year | Amortization Expense | |||
2012 | $5,254 | |||
2013 | 4,478 | |||
2014 | 3,990 | |||
2015 | 3,496 | |||
2016 | 2,936 | |||
As noted in Note 1,1—Significant Accounting Policies, the Company performed its annual impairment test of certain trade names. At December 31, 2011,29, 2012, the estimated fair value of the Company’sCompany's MICHELE, ZODIAC, and ZODIAC tradenamesSKAGEN trade names exceeded the carrying cost of these indefinite-lived intangible assets, thereforeassets. Therefore, no impairment charges were recorded. The OYZTERBAYMICHELE and ZODIAC trade name carrying value was written down to zeronames were tested in fiscal year 2010, therefore2011 for annual impairment, and no impairment testing of that trade name was performed in fiscal year 2011.recorded. During fiscal year 2010, the Company’sCompany's annual impairment analysis resulted in net of tax impairment charges of $837,000 and $789,000 to the OYZTERBAY and ZODIAC trade names, respectively. During fiscal year 2009, the Company’s annual impairment analysis resulted in net of taxThe impairment charges of $0.4 million and $1.8 million tofor the OYZTERBAY andtrade name reduced the carrying value to zero. The ZODIAC trade names, respectively. The ZODIAC and OYZTERBAY trade names arename is reported within the Europe wholesale segment.
8.9. Derivatives and Risk Management
The Company is exposed to certain risks relating to its ongoing business operations, which it attempts to manage by using derivative instruments. The primary risks managed by using derivative instruments are the fluctuations in global currencies that will ultimately be used by non-U.S. dollar functional currency subsidiaries to settle future payments of intercompany inventory transactions denominated in U.S. dollars. Specifically, the Company projects future intercompany purchases by its non-U.S. dollar functional currency subsidiaries generally over a period of up to 18 months. The Company enters into foreign currency forward contracts (“("forward contracts”contracts") generally for up to 65% of the forecasted purchases to manage fluctuations in global currencies that will ultimately be used to settle such U.S. dollar denominated inventory purchases. Forward contracts represent agreements to exchange the currency of one country for the currency of another country at an agreed-upon settlement date. The majority of the Company’sCompany's forward contracts are designated as single cash flow hedges. Fluctuations in exchange rates will either increase or decrease the Company’sCompany's U.S. dollar equivalent cash flows from these intercompany inventory transactions, which will affect the Company’sCompany's U.S. dollar earnings. Gains or losses on the forward contracts are expected to offset these fluctuations to the extent the cash flows are hedged by the forward contracts. The Company also periodically enters into forward contracts to manage exchange rate risks associated with certain non-inventory intercompany transactions and to which the Company does not elect hedge treatment. All of the Company’sCompany's outstanding forward contracts were designated as hedging instruments as of December 31, 201129, 2012 and January 1,December 31, 2011.
The forward contracts that the Company purchased to hedge exchange rate risk associated with intercompany inventory transactions meet the criteria for hedge eligibility, which requires that they represent foreign-currency-denominated forecasted intra-entity transactions in which (i) the operating unit that has the foreign currency exposure is a party to the hedging instrument and (ii) the hedged transaction is denominated in a currency other than the hedging unit’sunit's functional currency. At the inception of the hedge, the hedging relationship is expected to be highly effective in achieving offsetting cash flows attributable to the hedged risk. The Company assesses hedge effectiveness under the critical terms matched method at inception and at least quarterly throughout the life of the hedging relationship. If the critical terms (i.e., amounts, currencies and settlement dates) of the forward currency exchange contract match the terms of the forecasted transaction, the Company concludes that the hedge is effective.
72
The accounting for gains and losses that result from changes in the fair values of derivative instruments depends on whether the derivatives have been designated and qualify as hedging instruments. Changes in the fair value of derivatives not designated as hedging instruments are
FOSSIL, INC.
NOTES TO CONSOLIDATED FINANCIAL STATEMENTS (Continued)
9. Derivatives and Risk Management (Continued)
recognized in earnings when they occur. For a derivative instrument that is designated and qualifies as a cash flow hedge, the effective portion of the gain or loss on the derivative is reported as a component of other comprehensive income (loss) income,, net of taxes and reclassified into earnings in the same period or periods during which the hedged transaction affects earnings. Gains and losses on the derivative representing either hedge ineffectiveness or hedge components excluded from the assessment of effectiveness are recognized in current earnings. Due to the high degree of effectiveness between the hedging instruments and the underlying exposures being hedged, the Company’sCompany's hedges resulted in no ineffectiveness in the Company's consolidated statements of income and comprehensive income, and there were no components excluded from the assessment of hedge effectiveness for fiscal years 2012, 2011 2010 and 2009.2010.
All derivative instruments are recognized as either assets or liabilities at fair value in the Company's consolidated balance sheets. Forward contracts designated as cash flow hedges are recorded at fair value at each balance sheet date and the change in fair value is recorded to accumulated other comprehensive income (loss) within the equity section of the Company's consolidated balance sheet until such forward contract’scontract's gains (losses) become realized or the cash flow hedge relationship is terminated. If the cash flow hedge relationship is terminated, the derivative’sderivative's gains or losses that are deferred in accumulated other comprehensive income (loss) will be recognized in earnings when the hedged cash flows occur. However, for cash flow hedges that are terminated because the forecasted transaction is not expected to occur in the original specified time period, the derivative’sderivative's gains or losses are immediately recognized in earnings. There were no gains or losses reclassified into earnings as a result of the discontinuance of cash flow hedges as of December 31, 2011during fiscal year 2012 or January 1, 2011. Hedge accounting is discontinued if it is determined that the derivative is not highly effective. The Company records all cash flow hedge assets and liabilities on a gross basis as they do not meet the balance sheet netting criteria because the Company does not have master netting agreements established with the derivative counterparties that would allow for net settlement. As of December 31, 2011,29, 2012, the Company had the following outstanding forward contracts that were entered into to hedge the future payments of intercompany inventory transactions (in thousands):
| Functional Currency | Contract Currency | ||||||||
|---|---|---|---|---|---|---|---|---|---|
| Type | Amount | Type | Amount | ||||||
Euro | 144,875 | U.S. Dollar | 188,388 | ||||||
British Pound | 15,805 | U.S. Dollar | 25,059 | ||||||
Japanese Yen | 1,966,700 | U.S. Dollar | 24,648 | ||||||
Canadian Dollar | 21,075 | U.S. Dollar | 20,955 | ||||||
Mexican Peso | 153,033 | U.S. Dollar | 11,500 | ||||||
Australian Dollar | 10,400 | U.S. Dollar | 10,643 | ||||||
Functional Currency | Contract Currency | |||||||||
Type | Amount | Type | Amount | |||||||
Euro | 113,305 | U.S. Dollar | 156,579 | |||||||
British Pound | 14,918 | U.S. Dollar | 23,726 | |||||||
Japanese Yen | 2,762,700 | U.S. Dollar | 33,265 | |||||||
Mexican Peso | 97,743 | U.S. Dollar | 7,250 | |||||||
Australian Dollar | 8,320 | U.S. Dollar | 7,689 | |||||||
Canadian Dollar | 16,622 | U.S. Dollar | 16,640 | |||||||
The effective portion of gains and losses on derivative instruments that was recognized in other comprehensive income (loss) income,, net of taxes during fiscal years 20112012 and 20102011 is set forth below (in thousands):
Derivatives Designated as Cash Flow Hedges Under ASC 815 | For the Fiscal Year Ended December 31, 2011 | For the Fiscal Year Ended January 1, 2011 | ||||||
Foreign exchange contracts | $ | 280 | $ | 1,016 | ||||
|
|
|
| |||||
Total gain recognized in other comprehensive (loss) income, net of taxes | $ | 280 | $ | 1,016 | ||||
|
|
|
| |||||
Derivatives Designated as Cash Flow Hedges Under ASC 815 | For the Fiscal Year Ended December 29, 2012 | For the Fiscal Year Ended December 31, 2011 | |||||
|---|---|---|---|---|---|---|---|
Foreign exchange contracts | $ | 426 | $ | 280 | |||
Total gain recognized in other comprehensive | $ | 426 | $ | 280 | |||
FOSSIL, INC.
NOTES TO CONSOLIDATED FINANCIAL STATEMENTS (Continued)
9. Derivatives and Risk Management (Continued)
73
The following table illustrates the effective portion of gains and losses on derivative instruments designated and qualifying as cash flow hedges recorded in other comprehensive income (loss) income,, net of taxes during the term of the hedging relationship and reclassified into earnings, and gains and losses on derivatives not designated as hedging instruments recorded directly to earnings during fiscal years 20112012 and 20102011 (in thousands):
Foreign Exchange Contracts Under ASC 815 | Consolidated Statements of Comprehensive Income Location | | For the Fiscal Year Ended December 29, 2012 | For the Fiscal Year Ended December 31, 2011 | |||||||
|---|---|---|---|---|---|---|---|---|---|---|---|
Cash flow hedging instruments | Other income | Total gain (loss) reclassified from other comprehensive income (loss), net of taxes into income, net of taxes | $ | 5,045 | $ | (9,629 | ) | ||||
Not designated as hedging instruments | Other income | Total gain recognized in income | $ | 527 | $ | 0 | |||||
Foreign Exchange Contracts Under ASC 815 | Consolidated Statements of Income and | For the Fiscal Year Ended December 31, 2011 | For the Fiscal Year Ended January 1, 2011 | |||||||||
Cash flow hedging instruments | Other (expense) income-net | Total (loss)/gain reclassified from other comprehensive (loss) income, net of taxes into income, net of taxes | $ | (9,629 | ) | $ | 6,703 | |||||
|
|
|
| |||||||||
Not designated as hedging instruments | Other (expense) income-net | Total loss recognized in income | $ | 0 | $ | (1,879 | ) | |||||
|
|
|
| |||||||||
The following table discloses the fair value amounts for the Company’sCompany's derivative instruments as separate asset and liability values, presents the fair value of derivative instruments on a gross basis, and identifies the line items in the Company's consolidated balance sheets in which the fair value amounts for these categories of derivative instruments are included (in thousands):
| | Asset Derivatives | Liability Derivatives | |||||||||||||||||||
|---|---|---|---|---|---|---|---|---|---|---|---|---|---|---|---|---|---|---|---|---|---|
| | December 29, 2012 | December 31, 2011 | December 29, 2012 | December 31, 2011 | |||||||||||||||||
Foreign Exchange Contracts Under ASC 815 | Consolidated Balance Sheets Location | Fair Value | Consolidated Balance Sheets Location | Fair Value | Consolidated Balance Sheets Location | Fair Value | Consolidated Balance Sheets Location | Fair Value | |||||||||||||
Cash flow hedging instruments | Prepaid expenses and other current assets | $ | 2,336 | Prepaid expenses and other current assets | $ | 9,719 | Accrued expenses—other | $ | 4,560 | Accrued expenses—other | $ | 3,204 | |||||||||
Cash flow hedging instruments | Intangible and other assets—net | 240 | Intangible and | 895 | Other long-term liabilities | 582 | Other long-term liabilities | 382 | |||||||||||||
Total | $ | 2,576 | $ | 10,614 | $ | 5,142 | $ | 3,586 | |||||||||||||
Asset Derivatives | Liability Derivatives | |||||||||||||||||||||||
December 31, 2011 | January 1, 2011 | December 31, 2011 | January 1, 2011 | |||||||||||||||||||||
Foreign exchange contracts under | Consolidated Balance | Fair Value | Consolidated | Fair Value | Consolidated Sheet Location | Fair Value | Consolidated Sheet Location | Fair Value | ||||||||||||||||
Cash flow hedging | Prepaid | $ | 9,719 | Prepaid | $ | 1,388 | Accrued | $ | 3,204 | Accrued | $ | 8,583 | ||||||||||||
Cash flow hedging | Intangible | 895 | Intangible | 240 | Other long-term | 382 | Other long-term | 1,639 | ||||||||||||||||
|
|
|
|
|
|
|
| |||||||||||||||||
Total | $ | 10,614 | $ | 1,628 | $ | 3,586 | $ | 10,222 | ||||||||||||||||
|
|
|
|
|
|
|
| |||||||||||||||||
At the end of fiscal year 2011,2012, the Company had foreign exchangeforward contracts with maturities extending through December 2013.June 2014. The estimated net amount of the existing gains and losses at December 31, 201129, 2012 that is expected to be reclassified into earnings within the next 12twelve months is a gainloss of $4.4$1.5 million.
74
9.10. Fair Value Measurements
The Company defines fair value as the price that would be received to sell an asset or paid to transfer a liability in the principal or most advantageous market for the asset or liability in an orderly transaction between market participants at the measurement date.
FOSSIL, INC.
NOTES TO CONSOLIDATED FINANCIAL STATEMENTS (Continued)
10. Fair Value Measurements (Continued)
ASC 820,Fair Value Measurement and Disclosures(“ ("ASC 820”820"), establishes a fair value hierarchy, which prioritizes the inputs used in measuring fair value into three broad levels as follows:
ASC 820 requires the use of observable market data if such data is available without undue cost and effort.
The following table presents the fair value hierarchy for those assets and liabilities measured at fair value on a recurring basis as of December 29, 2012 (in thousands):
| | Fair Value at December 29, 2012 | ||||||||||||
|---|---|---|---|---|---|---|---|---|---|---|---|---|---|
| | Level 1 | Level 2 | Level 3 | Total | |||||||||
Assets: | |||||||||||||
Securities available for sale: | |||||||||||||
Investments in publicly traded equity securities | $ | 127 | $ | 0 | $ | 0 | $ | 127 | |||||
Forward contracts | 0 | 2,576 | 0 | 2,576 | |||||||||
Deferred compensation plan assets: | |||||||||||||
Investment in publicly traded mutual funds | 3,188 | 0 | 0 | 3,188 | |||||||||
Total | $ | 3,315 | $ | 2,576 | $ | 0 | $ | 5,891 | |||||
Liabilities: | |||||||||||||
Forward contracts | $ | 0 | $ | 5,142 | $ | 0 | $ | 5,142 | |||||
Total | $ | 0 | $ | 5,142 | $ | 0 | $ | 5,142 | |||||
The following table presents the fair value hierarchy for those assets and liabilities measured at fair value on a recurring basis as of December 31, 2011 (in thousands):
| Fair Value at December 31, 2011 | ||||||||||||||||
| Level 1 | Level 2 | Level 3 | Total | |||||||||||||
Assets: | ||||||||||||||||
Securities available for sale: | ||||||||||||||||
Investments in publicly traded equity securities | $ | 155 | $ | 0 | $ | 0 | $ | 155 | ||||||||
Foreign exchange forward contracts | 0 | 10,614 | 0 | 10,614 | ||||||||||||
Deferred compensation plan assets: | ||||||||||||||||
Investment in publicly traded mutual funds | 2,897 | 0 | 0 | 2,897 | ||||||||||||
|
|
|
|
|
|
|
| |||||||||
Total | $ | 3,052 | $ | 10,614 | $ | 0 | $ | 13,666 | ||||||||
|
|
|
|
|
|
|
| |||||||||
Liabilities: | ||||||||||||||||
Foreign exchange forward contracts | $ | 0 | $ | 3,586 | $ | 0 | $ | 3,586 | ||||||||
|
|
|
|
|
|
|
| |||||||||
Total | $ | 0 | $ | 3,586 | $ | 0 | $ | 3,586 | ||||||||
|
|
|
|
|
|
|
| |||||||||
| | Fair Value at December 31, 2011 | ||||||||||||
|---|---|---|---|---|---|---|---|---|---|---|---|---|---|
| | Level 1 | Level 2 | Level 3 | Total | |||||||||
Assets: | |||||||||||||
Securities available for sale: | |||||||||||||
Investment in publicly traded equity securities | $ | 155 | $ | 0 | $ | 0 | $ | 155 | |||||
Forward contracts | 0 | 10,614 | 0 | 10,614 | |||||||||
Deferred compensation plan assets: | |||||||||||||
Investment in publicly traded mutual funds | 2,897 | 0 | 0 | 2,897 | |||||||||
Total | $ | 3,052 | $ | 10,614 | $ | 0 | $ | 13,666 | |||||
Liabilities: | |||||||||||||
Forward contracts | $ | 0 | $ | 3,586 | $ | 0 | $ | 3,586 | |||||
Total | $ | 0 | $ | 3,586 | $ | 0 | $ | 3,586 | |||||
The following table presents the fair value hierarchy for those assets and liabilities measured at fair value on a recurring basis asTable of January 1, 2011 (in thousands):Contents
FOSSIL, INC.
NOTES TO CONSOLIDATED FINANCIAL STATEMENTS (Continued)
10. Fair Value Measurements (Continued)
| Fair Value at January 1, 2011 | ||||||||||||||||
| Level 1 | Level 2 | Level 3 | Total | |||||||||||||
Assets: | ||||||||||||||||
Securities available for sale: | ||||||||||||||||
Investments in bonds | $ | 7,705 | $ | 0 | $ | 0 | $ | 7,705 | ||||||||
Investment in publicly traded equity securities | 1,159 | 0 | 0 | 1,159 | ||||||||||||
Foreign exchange forward contracts | 0 | 1,628 | 0 | 1,628 | ||||||||||||
Deferred compensation plan assets: | ||||||||||||||||
Investment in publicly traded mutual funds | 3,295 | 0 | 0 | 3,295 | ||||||||||||
|
|
|
|
|
|
|
| |||||||||
Total | $ | 12,159 | $ | 1,628 | $ | 0 | $ | 13,787 | ||||||||
|
|
|
|
|
|
|
| |||||||||
Liabilities: | ||||||||||||||||
Foreign exchange forward contracts | $ | 0 | $ | 10,222 | $ | 0 | $ | 10,222 | ||||||||
|
|
|
|
|
|
|
| |||||||||
Total | $ | 0 | $ | 10,222 | $ | 0 | $ | 10,222 | ||||||||
|
|
|
|
|
|
|
| |||||||||
75
The fair values of the Company’sCompany's securities available for sale and deferred compensation plan assets are based on quoted prices. The deferred compensation plan assets are recorded asin intangible and other assets-net. The foreign exchange forward contracts are entered into byassets—net in the Company’s foreign subsidiaries principally to hedge the future payment of intercompany inventory transactions denominated in U.S dollars.Company's consolidated balance sheets. The fair values of the Company’s foreign exchangeCompany's forward contracts are based on published quotations of spot currency rates and forwardsforward points, which are converted into implied forward currency rates.
The Company has evaluated its short-term and long-term debt and believes, based on the interest rates, related terms and maturities, that the fair values of such instruments approximate their carrying amounts. As of December 31, 201129, 2012 and January 1,December 31, 2011, the carrying values of cash and cash equivalents, accounts receivable, accounts payable and accrued liabilities approximated their values due to the short-term maturities of these accounts.
The following table presents the fair value hierarchy for those assets and liabilities measured at fair value on a nonrecurring basis as of December 29, 2012 (in thousands):
| | | Fair Value Measurements Using | | |||||||||||||
|---|---|---|---|---|---|---|---|---|---|---|---|---|---|---|---|---|
| | For the Fiscal Year Ended December 29, 2012 | Total Losses | ||||||||||||||
| | Level 1 | Level 2 | Level 3 | |||||||||||||
Assets: | ||||||||||||||||
Specific Company-owned stores | $ | 67 | $ | 0 | $ | 0 | $ | 67 | $ | (1,231 | ) | |||||
The following table presents the fair value hierarchy for those assets and liabilities measured at fair value on a nonrecurring basis as of December 31, 2011 (in thousands):
| Fair Value Measurements Using | ||||||||||||||||||||
| For the Year Ended | Total | |||||||||||||||||||
| December 31, 2011 | Level 1 | Level 2 | Level 3 | Gains/(Losses) | ||||||||||||||||
Assets: | ||||||||||||||||||||
Specific Company-owned stores | $ | 51 | $ | 0 | $ | 0 | $ | 51 | $ | (957 | ) | |||||||||
| | | Fair Value Measurements Using | | |||||||||||||
|---|---|---|---|---|---|---|---|---|---|---|---|---|---|---|---|---|
| | For the Fiscal Year Ended December 31, 2011 | Total Losses | ||||||||||||||
| | Level 1 | Level 2 | Level 3 | |||||||||||||
Assets: | ||||||||||||||||
Specific Company-owned stores | $ | 51 | $ | 0 | $ | 0 | $ | 51 | $ | (957 | ) | |||||
In accordance with the provisions of ASC 360,Property, Plant and Equipment, property, plant and equipment-netequipment—net with a carrying amount of $1.2 million related to Company-owned retail store leasehold improvements, fixturing, computer software and computer hardware was written down to a fair value of $0.1 million, resulting in an impairment charge of $1.2 million for fiscal year 2012.
In fiscal year 2011, property, plant and equipment—net with a carrying amount of $1.0 million related to Company-owned retail store leasehold improvements, fixturing, computer software and computer hardware was written down to a fair value of $0.1 million, resulting in an impairment charge of $1.0 million for fiscal year 2011.
The fair values of assets related to the Company-owned retail stores were determined using Level 3 inputs. If undiscounted cash flows estimated to be generated through the operation of Company-owned retail stores are less than the carrying value of the underlying assets, impairment losses are recorded. Impairment expenseexpenses related to Company-owned retail stores isare recorded in selling and distribution expensesexpense within the Direct to consumer segment.
FOSSIL, INC.
NOTES TO CONSOLIDATED FINANCIAL STATEMENTS (Continued)
11. Debt
Short Term Foreign-Based.The following table presentsCompany's Japanese subsidiary, Fossil Japan, Inc. ("Fossil Japan"), entered into a 400 million Yen revolving credit facility agreement (the "Facility") on November 25, 2009. The Facility bears interest at the fair value hierarchy for those assets and liabilities measuredshort-term prime rate (1.475% at fair value on a nonrecurring basis as of January 1, 2011 (in thousands):
| Fair Value Measurements Using | ||||||||||||||||||||
| For the Year Ended | Total | |||||||||||||||||||
| January 1, 2011 | Level 1 | Level 2 | Level 3 | Gains/(Losses) | ||||||||||||||||
Assets: | ||||||||||||||||||||
Specific Company-owned stores-net | $ | 0 | $ | 0 | $ | 0 | $ | 0 | $ | (1,848 | ) | |||||||||
Specific Company-owned office-net | 8,863 | 0 | 0 | 8,863 | (3,738 | ) | ||||||||||||||
Specific trade names | 438 | 0 | 0 | 438 | (1,843 | ) | ||||||||||||||
|
|
|
|
|
|
|
| |||||||||||||
Total | $ | 0 | $ | 0 | $ | 9,301 | $ | (7,429 | ) | |||||||||||
|
|
|
|
|
|
|
| |||||||||||||
In fiscal year end 2012). On April 6, 2012, Fossil Japan repaid the entire outstanding balance of 300 million Yen, approximately $3.6 million. Yen-based borrowings, in U.S. dollars, under the Facility were approximately $2.6 million and $4.9 million at fiscal year end 2011 and 2010, property, plantrespectively. The Company incurred approximately $13,000, $46,000, and equipment-net with a carrying amount$61,000 of $2.1 millioninterest expense related to Company-owned retail store leasehold improvements, fixtures, computer softwareborrowings under the Facility for fiscal years 2012, 2011 and computer hardware was deemed not recoverable, resulting in an impairment charge2010, respectively. The borrowings entered into by Fossil Japan were primarily used for working capital purposes.
In April 2011, the Company's Korean subsidiary, Fossil (Korea) Limited ("Fossil Korea"), entered into a $20 million credit facility agreement (the "Agreement") with Bank of $1.8 million after estimated insurance proceeds of $0.3 million. Property, plant and equipment-net with a carrying amount of $12.6 million associated with a Company-owned office building was written down to a fair value of $8.9 million,America, N.A. Seoul Branch. The Agreement bears interest based on a third-party appraisal, resulting in an impairment charge of $3.7 million included in earnings forthree month CD rate which is published by the Korea Securities Dealers Association (2.85% at fiscal year 2010. Bothend 2012), plus 120 basis points for a one month period or plus 130 basis points for a three month period. On April 13, 2012, the fair valuesAgreement was renewed under the same terms for a one year time period. On November 19, 2012, Fossil Korea repaid the entire outstanding balance of $1.8 million. Borrowings under the Company-owned retail storesFacility were approximately $6.0 million at fiscal year end 2011. The Company incurred approximately $242,000, and the Company-owned office building were determined using Level 3 inputs. Impairment expense and associated insurance recoveries related to Company-owned retail stores
76
were recorded in selling and distribution expenses within the Direct to consumer segment. The impairment$265,000 of interest expense related to borrowings under the Company-owned officeAgreement for fiscal years 2012 and 2011, respectively. The borrowings entered into by Fossil Korea were primarily used for working capital purposes.
On September 21, 2007, Fossil Group Europe, GmbH ("FGE"), a wholly owned subsidiary of the Company, entered into a long-term note payable with its primary bank (the "FGE Note") related to the purchase of a building was recorded in generalBasel, Switzerland. The FGE Note requires FGE to submit an annual balance sheet and administrative expenses withinincome statement and is secured by the corporate cost area.Company's building in Basel, Switzerland. The FGE Note has a variable interest rate (2% at fiscal year end 2012) with interest payments due quarterly. This note requires minimum principal payments of 100,000 Swiss Francs (approximately $109,000 U.S. dollars at fiscal year end 2012) per year with no stated maturity and no penalties for early payment. The principal payment for the subsequent fiscal year is included in short-term borrowings.
Upon acquiring STP in April 2012, the Company assumed a 500,000 Swiss Franc short-term note payable (the "STP Note") with Eastime Limited that is used for working capital purposes. The STP Note has a fixed interest rate of 2% with interest payments due yearly and a maturity date of March 31, 2013. Swiss Franc-based borrowings, in U.S. dollars, under the STP Note were approximately $547,000 at the end of fiscal year 2012.
On October 31, 2012, Swiss Technology Components AG ("STC"), a wholly owned subsidiary of the Company, entered into a 1.1 million Swiss Franc short-term note payable (the "STC Note") with New Civilization Limited, a corporation registered in Macau, China. The STC Note has a fixed interest rate of 3% with interest and principal due on October 31, 2013. The Swiss Franc-based borrowings, in U.S. dollars, under the STC Note were approximately $1.2 million at December 29, 2012. The borrowings entered into by STC were used to purchase real estate.
10. Debt Long Term U.S.-Based.
Short-Term U.S.-Based:On December 17, 2010, the Company entered into a three year Credit Agreement (the “Credit Agreement”"Credit Agreement") with (i) Wells Fargo Bank, National Association (“("Wells Fargo”Fargo"),
FOSSIL, INC.
NOTES TO CONSOLIDATED FINANCIAL STATEMENTS (Continued)
11. Debt (Continued)
as administrative agent, swingline lender and issuing lender, (ii) Wells Fargo Securities, LLC, as sole lead arranger and sole book manager, and (iii) Bank of America, N.A., as lender. The Credit Agreement provides for revolving credit loans in the amount of $300 million (the “Revolver”"Revolver"), a swingline loan of $20 million, and letters of credit. TheOn April 2, 2012, in connection with the Skagen Designs acquisition, the Credit Agreement expireswas amended to, among other things, (i) increase the aggregate commitment of the lenders under the revolving credit facility from $300 million to $350 million, (ii) provide for an uncommitted $50 million incremental revolving credit commitment and is due and payable on(iii) extend the maturity date from December 17, 2013.2013 to December 17, 2014. The Credit Agreement is guaranteed by all direct and indirect material domestic subsidiaries of the Company and secured by 65% of the outstanding voting capital stock and 100% of the non-voting capital stock of the following foreign subsidiaries of the Company: Fossil Europe B.V., Swiss Technology Holding GmbH and Fossil (East) Limited. In connection with entering into the Credit Agreement, the Company paid upfront fees of approximately $1.2 million, which are being amortized over the life of the Credit Agreement. In connection with the amendment on April 2, 2012, the Company paid upfront fees of $50,000 to increase the revolving credit commitment and an amendment fee of $175,000, which are also being amortized over the life of the Credit Agreement.
Amounts outstanding under the Revolver bear interest at the Company’sCompany's option of (i) the base rate (defined as the higher of (a) the prime rate publicly announced by Wells Fargo (3.25% at fiscal year end 2011)2012), (b) the federal funds rate plus 1.50% and (c) the London Interbank Offer Rate (“LIBOR”("LIBOR") (0.3%(0.21% at fiscal year end 2011)2012) plus 1.50%) plus the base rate applicable margin (which varies based upon the Company’sCompany's consolidated leverage ratio (the “Ratio”"Ratio") from 0.25% if the Ratio is less than 1.00 to 1.00, to 1.00% if the Ratio is greater than or equal to 2.00 to 1.00) or (ii) the LIBOR rate (defined as the quotient obtained by dividing (a) LIBOR by (b) 1.00 minus the Eurodollar reserve percentage) plus the LIBOR rate applicable margin (which varies based upon the Ratio from 1.25% if the Ratio is less than 1.00 to 1.00, to 2.00% if the Ratio is greater than or equal to 2.00 to 1.00). Amounts outstanding under the swingline loan under the Credit Agreement or upon any drawing under a letter of credit bear interest at the base rate plus the base rate applicable margin. Interest based upon the base rate is payable quarterly in arrears. Interest based upon the LIBOR rate is payable either monthly or quarterly in arrears, depending on the interest period selected by the Company. The Revolver also includes a commitment fee ranging from 0.20% to 0.35% for any amounts not drawn under the Revolver.
The Credit Agreement replaced that certain Loan Agreement dated as of September 23, 2004, as amended, by and between Fossil Partners, L.P. (“LP”), a subsidiary of the Company, as borrower, the Company, and certain subsidiaries of the Company, as guarantors, and Wells Fargo, which was scheduled to mature on December 31, 2010 (the “Old Agreement”). No amounts were outstanding under the Old Agreement except for three letters of credit in the aggregate amount of $598,000. Upon termination of the Old Agreement, these letters of credit continued to be issued and outstanding under the Credit Agreement. No penalties or other early termination fees were incurred in connection with the termination of the Old Agreement.
Loans under the Credit Agreement may be prepaid, in whole or in part, at the option of the Company, in minimum principal amounts of $2.0 million or increments of $1.0 million in excess thereof with respect to a base rate loan, $5.0 million or increments of $1.0 million in excess thereof with respect to a LIBOR rate loan and $100,000 or increments of $100,000 in excess thereof with respect to a swingline loan. Loans under the Credit Agreement must be repaid, or letter of credit obligations cash collateralized with the net proceeds of certain asset sales, insurance and condemnation events. The Company may permanently reduce the revolving credit commitment at any time, in whole or in part, without premium or penalty, in a minimum aggregate principal amount of not less than $3.0 million or increments of $1.0 million in excess thereof.
Wells Fargo can accelerate the repayment obligation upon the occurrence of an event of default, including the failure to pay principal or interest, a material inaccuracy of a representation or warranty, violation of covenants, cross-default, change in control, bankruptcy events, failure of a loan document provision, certain
77
ERISA events and material judgments. There were no outstanding borrowings of
FOSSIL, INC.
NOTES TO CONSOLIDATED FINANCIAL STATEMENTS (Continued)
11. Debt (Continued)
$65 million under the Revolver as of December 31, 2011.29, 2012. Amounts available under the Revolver are reduced by any amounts outstanding under stand-bystandby letters of credit. At December 31, 2011,29, 2012, the Company had available borrowings of approximately $299.1$284.1 million under the Revolver. As a result of having no outstanding borrowing during fiscal years 2011, 2010 and 2009, theThe Company incurred noapproximately $2.6 million of interest expense related to the Revolver or the Old Agreement during fiscal years 2011, 2010 and 2009.year 2012.
Financial covenants in the Credit Agreement require the Company to maintain (i) a consolidated leverage ratio no greater than 2.50 to 1.00, (ii) consolidated tangible net worth of no less than the sum of (a) $600 million plus (b) 25% of positive consolidated net income, (iii) consolidated net income that is not negative for any two consecutive fiscal quarters, and (iv) maximum capital expenditures not in excess of $125$200 million in anyduring fiscal year 2012, and $150 million during each fiscal year thereafter, subject to certain adjustments. The Credit Agreement contains representations, warranties, covenants, events of default and indemnities that are customary for agreements of this type. The Company was in compliance with all material covenants in the Credit Agreement as of and during the year ended December 31, 2011.29, 2012.
Short-Term Foreign-Based:The Company’s Japanese subsidiary, Fossil Japan Inc. (“Fossil Japan”), entered into a 400 million Yen revolving credit facility agreement (the “Facility”) on November 25, 2009. The Facility bears interest at the short-term prime rate (1.475% at fiscal year end 2011). Japan-based borrowings, in U.S. dollars, under the Facility were approximately $2.6 million and $4.9 million at fiscal year end 2011 and 2010, respectively. On February 22, 2012, approximately $3.8 million of borrowings under the facility were renewed at the short-term prime rate of 1.475%, with a maturity date of May 22, 2012. The Company incurred approximately $46,000, $61,000, and $61,000 of interest expense related to borrowings under the Facility for fiscal years 2011, 2010 and 2009, respectively. The borrowings entered into by Fossil Japan were primarily used for working capital purposes.
On April 6, 2011, the Company’s Korean subsidiary, Fossil (Korea) Limited (“Fossil Korea”), entered into a new $20 million credit facility agreement (the “Agreement”) with Bank of America, N.A. Seoul Branch. Borrowings under the Agreement are renewed on a monthly basis. The Agreement bears interest based on a three month CD rate which is published by the Korea Securities Dealers Association (3.55% at fiscal year end 2011), plus 120 basis points for a one month period or plus 130 basis points for a three month period. Korea-based borrowings, in U.S. dollars, under the Agreement were approximately $6.0 million at fiscal year end 2011, at an interest rate of 4.75%. Approximately $6.2 million of borrowings under the Agreement were renewed at an interest rate of approximately 4.75% in each of January 2012 and February 2012. The February borrowings have a maturity date of March 21, 2012. The Company incurred approximately $265,000 of interest expense related to borrowings under the Agreement for fiscal year 2011. The borrowings entered into by Fossil Korea were primarily used for working capital purposes.
On September 21, 2007, Fossil Group Europe, Gmbh (“FGE”), a wholly owned subsidiary of the Company, entered into a long-term note payable with its primary bank (the “FGE Note”) related to the purchase of a building in Basel, Switzerland. The FGE Note requires FGE to submit an annual balance sheet and income statement and is secured by the Company’s building in Basel, Switzerland. The FGE Note has a variable interest rate (2% at fiscal year end 2011) with interest payments due quarterly. This note requires minimum principal payments of 100,000 Swiss Francs (approximately $107,000 U.S. dollars at fiscal year end 2011) per year with no stated maturity and no penalties for early payment. The principal payment for the subsequent fiscal year is included in short-term borrowings.
Long-Term Foreign-Based:Foreign Based.In addition to the annual principal payment of 100,000 Swiss Francs, which is classified as a short-term borrowing,borrowings, a portion of the FGE Note was classified as a long-term borrowing at the end of fiscal year 2011.2012. The Company incurred approximately $98,000, $82,000, $76,000, and $76,000 of interest expense related to the FGE Note forduring fiscal years 2012, 2011 2010, and 2009,2010, respectively. At the end of fiscal yearsyear 2012 and 2011, and 2010, total current and long-term amounts outstanding under the FGE Note were $3.8 million and $3.9 million, respectively.million.
78
Letters of Credit:Credit.On February 7, 2011,May 11, 2012, the Company, LP, FGE and Fossil Asia Pacific Ltd. renewed itstheir Letter of Credit Facility (the “LC Facility”"LC Facility") with the Hongkong and Shanghai Banking Corporation Limited to allow for $60$80 million of commercial letters of credit. Prior to this renewal, the LC Facility allowed for $40$60 million of commercial letters of credit. At the end of fiscal years 20112012 and 2010,2011, the Company had outstanding letters of credit under the LC Facility of approximately $36.9$39.9 million and $37.2$36.9 million, respectively. Letters of credit issued under the LC Facility are primarily used for the purchase of inventory.
Capital Lease Obligations:Obligations. At the end of fiscal years 20112012 and 2010,2011, the Company had current capital lease obligations of $0.9 million and $0.3 million, each yearrespectively, and long-term capital lease obligations of $2.5$6.4 million and $0.7$2.5 million, respectively.
11.12. Other Income (Expense) Income-Net—Net
Other income (expense) income-net—net consisted of the following (in thousands):
Fiscal Year | 2011 | 2010 | 2009 | |||||||||
Interest income | $ | 350 | $ | 1,503 | $ | 1,310 | ||||||
Equity in the earnings of joint venture, net of tax | 1,027 | 1,382 | 1,146 | |||||||||
Currency (losses) gains | (20,744 | ) | 5,227 | 5,779 | ||||||||
Royalty income | 475 | 462 | 478 | |||||||||
Other gains (losses) | 851 | 341 | (207 | ) | ||||||||
|
|
|
|
|
| |||||||
Other (expense) income-net | $ | (18,041 | ) | $ | 8,915 | $ | 8,506 | |||||
|
|
|
|
|
| |||||||
Fiscal Year | 2012 | 2011 | 2010 | |||||||
|---|---|---|---|---|---|---|---|---|---|---|
Interest income | $ | 889 | $ | 350 | $ | 1,503 | ||||
Equity in the earnings of joint venture, net of tax | 972 | 1,027 | 1,382 | |||||||
Currency gains (losses) | 5,565 | (20,744 | ) | 5,227 | ||||||
Royalty income | 676 | 475 | 462 | |||||||
Other gains | 440 | 851 | 341 | |||||||
Other income (expense)—net | $ | 8,542 | $ | (18,041 | ) | $ | 8,915 | |||
FOSSIL, INC.
79NOTES TO CONSOLIDATED FINANCIAL STATEMENTS (Continued)
12.13. Taxes
Income TaxesTaxes.
Deferred income taxes reflect the net tax effects of temporary differences between the carrying amounts of assets and liabilities for financial reporting purposes and the amounts used for income tax purposes. Significant components of the consolidated deferred tax assets and liabilities were (in thousands):
Fiscal Year | 2012 | 2011 | |||||
|---|---|---|---|---|---|---|---|
Current deferred income tax assets (liabilities): | |||||||
Bad debt allowance | $ | 6,542 | $ | 6,605 | |||
Returns allowance | 14,835 | 15,364 | |||||
Inventory | 10,019 | 11,656 | |||||
Warranty reserve | 2,403 | 2,078 | |||||
Compensation | (2,872 | ) | 7,707 | ||||
Accrued liabilities | 2,600 | 5,951 | |||||
Returns cost of sales | (6,005 | ) | (6,613 | ) | |||
Deferred rent | 804 | 1,560 | |||||
Loss carry-forwards | 1,735 | 881 | |||||
Other | 6,016 | 1,312 | |||||
Total current deferred tax assets | 36,077 | 46,501 | |||||
Valuation allowance | (1,843 | ) | (698 | ) | |||
Net current deferred income tax assets | $ | 34,234 | $ | 45,803 | |||
Total current deferred income tax assets | $ | 34,238 | $ | 45,803 | |||
Total current deferred income tax liabilities | (4 | ) | 0 | ||||
Net current deferred income tax assets | $ | 34,234 | $ | 45,803 | |||
Long-term deferred income tax (liabilities) assets: | |||||||
Unrealized exchange losses | $ | 1,098 | $ | 2,858 | |||
State income tax and interest on tax contingencies | 24 | 0 | |||||
Fixed assets | (45,237 | ) | (35,413 | ) | |||
Trade names and customer lists | (7,139 | ) | (7,144 | ) | |||
Compensation | 12,010 | 3,522 | |||||
Deferred rent | 7,732 | 6,693 | |||||
Loss carry-forwards | 3,357 | 2,275 | |||||
Undistributed earnings of certain foreign subsidiaries | (51,578 | ) | (57,324 | ) | |||
Tax deductible foreign reserves | 335 | 1,460 | |||||
Other | 10,098 | 4,115 | |||||
Total deferred income tax liabilities | (69,300 | ) | (78,958 | ) | |||
Valuation allowance | (3,920 | ) | (2,495 | ) | |||
Net long-term deferred income tax liabilities | $ | (73,220 | ) | $ | (81,453 | ) | |
Total long-term deferred income tax assets | $ | 6,536 | $ | 4,875 | |||
Total long-term deferred income tax liabilities | (79,756 | ) | (86,328 | ) | |||
Net long-term deferred income tax liabilities | $ | (73,220 | ) | $ | (81,453 | ) | |
Net deferred income tax liability | $ | (38,986 | ) | $ | (35,650 | ) | |
Fiscal Year | 2011 | 2010 | ||||||
Current deferred income tax assets (liabilities): | ||||||||
Bad debt allowance | $ | 6,605 | $ | 7,028 | ||||
Returns allowance | 15,364 | 15,468 | ||||||
Inventory | 11,656 | 10,144 | ||||||
Warranty reserve | 2,078 | 1,054 | ||||||
Compensation | 7,707 | 2,894 | ||||||
Accrued liabilities | 5,951 | 3,536 | ||||||
Returns cost of sales | (6,613 | ) | (6,024 | ) | ||||
Deferred rent | 1,560 | 789 | ||||||
Loss carry-forwards | 881 | 1,596 | ||||||
Other | 1,312 | 6,837 | ||||||
|
|
|
| |||||
Total current deferred tax assets | 46,501 | 43,322 | ||||||
Valuation allowance | (698 | ) | (1,486 | ) | ||||
|
|
|
| |||||
Net current deferred income tax assets | $ | 45,803 | $ | 41,836 | ||||
|
|
|
| |||||
Long-term deferred income tax (liabilities) assets: | ||||||||
Unrealized exchange losses | 2,858 | 2,520 | ||||||
State income tax and interest on tax contingencies | 0 | 925 | ||||||
Fixed assets | (35,413 | ) | (8,847 | ) | ||||
Trade names and customer lists | (7,144 | ) | (7,168 | ) | ||||
Compensation | 3,522 | 5,972 | ||||||
Deferred rent | 6,693 | 3,264 | ||||||
Loss carry-forwards | 2,275 | 2,375 | ||||||
Undistributed earnings of certain foreign subsidiaries | (57,324 | ) | (44,122 | ) | ||||
Tax deductible foreign reserves | 1,460 | (1,229 | ) | |||||
Other | 4,115 | 2,038 | ||||||
|
|
|
| |||||
Total deferred income tax liabilities | (78,958 | ) | (44,272 | ) | ||||
Valuation allowance | (2,495 | ) | (2,695 | ) | ||||
|
|
|
| |||||
Net long-term deferred income tax liabilities | $ | (81,453 | ) | $ | (46,967 | ) | ||
|
|
|
| |||||
Total long-term deferred income tax assets | 4,875 | 926 | ||||||
Total deferred income tax liabilities | (86,328 | ) | (47,893 | ) | ||||
|
|
|
| |||||
Net long-term deferred income tax liabilities | $ | (81,453 | ) | $ | (46,967 | ) | ||
|
|
|
| |||||
NOTES TO CONSOLIDATED FINANCIAL STATEMENTS (Continued)
8013. Taxes (Continued)
Operating Loss Carry-Forwards.The deferred income tax asset for loss carry-forwards includes $11.6$19.4 million of net operating losses of foreign subsidiaries. Valuation allowances have been recorded to reflect the estimated amount of deferred tax assets that may not be realized on these losses. The amounts and the fiscal year of expiration of ourthe loss carry-forwards are (in thousands):
Operating loss carry-forwards
Expires 2013 through 2017 | $ | 2,365 | ||
Expires 2018 through 2022 | 4,297 | |||
Expires 2023 through 2027 | 2,354 | |||
Indefinite | 10,402 | |||
Total loss carry-forwards | $ | 19,418 | ||
Expires 2012 through 2016 | $ | 947 | ||
Expires 2017 through 2021 | 1,004 | |||
Expires 2022 through 2026 | 1,496 | |||
Indefinite | 8,186 | |||
|
| |||
Total loss carry-forwards | $ | 11,633 | ||
|
|
The following table identifies earnings before income taxes for the Company’sCompany's U.S. and non-U.S. based operations for the fiscal years indicated (in thousands):
Fiscal Year | 2012 | 2011 | 2010 | |||||||
|---|---|---|---|---|---|---|---|---|---|---|
U.S. | $ | 193,985 | $ | 173,861 | $ | 154,318 | ||||
Non-U.S. | 298,237 | 277,698 | 229,892 | |||||||
Total | $ | 492,222 | $ | 451,559 | $ | 384,210 | ||||
Fiscal Year | 2011 | 2010 | 2009 | |||||||||
U.S. | $ | 173,861 | $ | 154,318 | $ | 94,543 | ||||||
Non-U.S. | 277,698 | 229,892 | 125,355 | |||||||||
|
|
|
|
|
| |||||||
Total | $ | 451,559 | $ | 384,210 | $ | 219,898 | ||||||
|
|
|
|
|
| |||||||
The Company’sCompany's provision for income taxes consisted of the following for the fiscal years indicated (in thousands):
Fiscal Year | 2012 | 2011 | 2010 | |||||||
|---|---|---|---|---|---|---|---|---|---|---|
Current provision: | ||||||||||
U.S. federal | $ | 64,552 | $ | 59,854 | $ | 54,820 | ||||
Non-U.S. | 60,239 | 55,407 | 44,613 | |||||||
State and local | 6,314 | 7,416 | 4,535 | |||||||
Total current | 131,105 | 122,677 | 103,968 | |||||||
Deferred provision | ||||||||||
U.S. federal | 9,485 | 25,116 | 19,112 | |||||||
Non-U.S. | (2,426 | ) | (4,680 | ) | (3,188 | ) | ||||
State and local | (201 | ) | 1,044 | (572 | ) | |||||
Total deferred | 6,858 | 21,480 | 15,352 | |||||||
Provision for income taxes | $ | 137,963 | $ | 144,157 | $ | 119,320 | ||||
Fiscal Year | 2011 | 2010 | 2009 | |||||||||
Current provision: | ||||||||||||
U.S. federal | $ | 59,854 | $ | 54,820 | $ | 46,350 | ||||||
Non-U.S. | 55,407 | 44,613 | 22,629 | |||||||||
State and local | 7,416 | 4,535 | 3,284 | |||||||||
|
|
|
|
|
| |||||||
Total current | 122,677 | 103,968 | 72,263 | |||||||||
Deferred provision: | ||||||||||||
U.S. federal | 25,116 | 19,112 | 3,320 | |||||||||
Non-U.S. | (4,680 | ) | (3,188 | ) | (39 | ) | ||||||
State and local | 1,044 | (572 | ) | 60 | ||||||||
|
|
|
|
|
| |||||||
Total deferred | 21,480 | 15,352 | 3,341 | |||||||||
Provision for income taxes | $ | 144,157 | $ | 119,320 | $ | 75,604 | ||||||
|
|
|
|
|
| |||||||
The expected cash payments for current U.S. income tax expense for fiscal years 2012, 2011 2010 and 20092010 were reduced by approximately $15.1 million, $11.2 million $12.5 million and $2.1$12.5 million, respectively, as a result of tax deductions related to the exercise of non-qualified stock options and stock appreciation rights and the vesting of restricted stock and restricted stock units. The expected cash payments for current foreign tax expense for fiscal years 2012, 2011 and 2010 were reduced by $0.5 million, $1.7 million, in fiscal 2011 and $1.7 million, in fiscal 2010respectively, as a result of tax deductions related to the exercise of stock options and the vesting of restricted stock granted to foreign employees. The income tax benefits resulting from these stock-based compensation plans have been recorded to additional paid-in capital.capital in the Company's consolidated balance sheets. Total deferred income tax expense of $6.9 million, $21.5 million $15.4 million and $3.3$15.4 million for fiscal years 2012, 2011 2010 and 2009,2010, respectively, are included in deferred income taxes on the Company's consolidated statements of cash flows.
FOSSIL, INC.
NOTES TO CONSOLIDATED FINANCIAL STATEMENTS (Continued)
13. Taxes (Continued)
The Company was granted a 100% tax holiday for its watch assembly activities in Switzerland for tax years 2003 through 2007 and a 60% tax holiday for tax years 2008 through 2012. After 2012, the Company will pay
81
the full Swiss tax rate on its watch assembly activities. This tax holiday reduced current foreign income taxes by approximately $1.2 million, $0.9 million $0.2 million and $0.1$0.2 million in fiscal years 2012, 2011 2010 and 2009,2010, respectively.
A reconciliation of income tax computed at the U.S. federal statutory income tax rate of 35% to the provision for income taxes is as follows:
Fiscal Year | 2012 | 2011 | 2010 | |||||||
|---|---|---|---|---|---|---|---|---|---|---|
Tax at statutory rate | 35.0 | % | 35.0 | % | 35.0 | % | ||||
State, net of federal tax benefit | 1.0 | 1.2 | 0.9 | |||||||
Foreign rate differential | (10.0 | ) | (12.0 | ) | (11.1 | ) | ||||
U.S. tax on foreign income | 3.1 | 6.7 | 9.8 | |||||||
Income tax contingencies | (1.7 | ) | 0.7 | (3.7 | ) | |||||
Other | 0.6 | 0.3 | 0.2 | |||||||
Provision for income taxes | 28.0 | % | 31.9 | % | 31.1 | % | ||||
Fiscal Year | 2011 | 2010 | 2009 | |||||||||
Tax at statutory rate | 35.0 | % | 35.0 | % | 35.0 | % | ||||||
State, net of federal tax benefit | 1.2 | 0.9 | 0.8 | |||||||||
Foreign rate differential | (12.0 | ) | (11.1 | ) | (9.2 | ) | ||||||
U.S. tax on foreign income | 6.7 | 9.8 | 8.7 | |||||||||
Income tax contingencies | 0.7 | (3.7 | ) | (0.4 | ) | |||||||
Other | 0.3 | 0.2 | (0.5 | ) | ||||||||
|
|
|
|
|
| |||||||
Provision for income taxes | 31.9 | % | 31.1 | % | 34.4 | % | ||||||
|
|
|
|
|
| |||||||
Deferred U.S. federal income taxes and foreign withholding taxes are not recorded on undistributed earnings of certain foreign subsidiaries where management plans to continue reinvesting these earnings outside the U.S. The amount of undistributed earnings that would be subject to tax if distributed was approximately $371.8$557 million at December 31, 2011.29, 2012. Determining tax amounts that would be payable if these earnings were distributed to the U.S. parent company is not practicable.
The total amount of unrecognized tax benefits under ASC 740, excluding interest and penalties that would favorably impact the effective tax rate in future periods if recognized, was $10.7 million for fiscal year 2012, $12.7 million for fiscal year 2011, and $8.1 million for fiscal year 2010, and $7.8 million for fiscal year 2009. During2010. In the secondfourth quarter of fiscal 2010, the examination phase of the Internal Revenue Service (“IRS”) audit for tax years 2005 and 2006 was completed. The IRS proposed certain adjustments to the Company’s tax returns and the Company filed a protest. The protest is under review by2012, the IRS Office of Appeals and will be resolved within the next twelve months.Company executed a Closing Agreement to settle issues under protest after the close of the income tax audit for the 2005-2006 tax years. As a result, the Company reduced the amount of unrecognized tax benefits by $6.0 million. The examination of the 2007-2009 federal income tax returns by the IRS began in January 2012. The Company is also subject to examinations in various state and foreign jurisdictions for the 2005-20102005-2011 tax years, none of which the Company believes are individually significant. Audit outcomes and timing of audit settlements are subject to significant uncertainty.
The Company has classified uncertain tax positions as long-term income taxes payable unless such amounts are expected to be paid within twelve months from December 31, 2011.29, 2012. As of December 31, 2011,29, 2012, the Company had recorded $2.7$7.9 million of unrecognized tax benefits, excluding interest and penalties, for positions that could be settled within the next twelve months. Consistent with its past practice, the Company recognizes interest and/or penalties related to income tax overpayments and income tax underpayments in income tax expense and income taxes receivable/payable, respectively. The total amount of accrued income tax-related interest in the Company's consolidated balance sheets was $2.5$2.2 million and $1.3$2.5 million at December 29, 2012 and December 31, 2011, and January 1, 2011, respectively. The total amount of accrued income tax-related penalties in the Company's consolidated balance sheets was $0.3 million at December 29, 2012. There were no accrued income tax-related penalties in the consolidated balance sheets at
FOSSIL, INC.
NOTES TO CONSOLIDATED FINANCIAL STATEMENTS (Continued)
13. Taxes (Continued)
December 31, 2011 or January 1, 2011. The Company accrued income tax-related interest expense of ($1.0) million, $1.2 million and $0.8 million and $1.8 million in each of fiscal years 2012, 2011 and 2010, and 2009.
82
The following is a tabular reconciliation of the total amounts of unrecognized tax benefits for the fiscal years indicated (in thousands):
Fiscal Year | 2011 | 2010 | 2009 | |||||||||
Balance at beginning of year | $ | 10,945 | $ | 35,426 | $ | 33,855 | ||||||
Gross increases tax positions in prior years | 5,963 | 2,680 | 4,676 | |||||||||
Gross decreases tax positions in prior years | 0 | (27,799 | ) | (641 | ) | |||||||
Gross increases-current year tax positions | 1,192 | 842 | 2,428 | |||||||||
Settlements | (119 | ) | (204 | ) | 0 | |||||||
Lapse in statute of limitations | 0 | 0 | (4,902 | ) | ||||||||
Increase due to currency revaluation | (7 | ) | 0 | 10 | ||||||||
|
|
|
|
|
| |||||||
Balance at end of year | $ | 17,974 | $ | 10,945 | $ | 35,426 | ||||||
|
|
|
|
|
| |||||||
Fiscal Year | 2012 | 2011 | 2010 | |||||||
|---|---|---|---|---|---|---|---|---|---|---|
Balance at beginning of year | $ | 17,974 | $ | 10,945 | $ | 35,426 | ||||
Gross increases tax positions in prior years | 1,245 | 5,963 | 2,680 | |||||||
Gross decreases tax positions in prior years | (2,580 | ) | 0 | (27,799 | ) | |||||
Gross increases—current year tax positions | 2,486 | 1,192 | 842 | |||||||
Settlements | (3,582 | ) | (119 | ) | (204 | ) | ||||
Lapse in statute of limitations | 0 | 0 | 0 | |||||||
Increase due to currency revaluation | 6 | (7 | ) | 0 | ||||||
Balance at end of year | $ | 15,549 | $ | 17,974 | $ | 10,945 | ||||
13.14. Commitments and Contingencies
License Agreements.The Company has various license agreements to market watches and jewelry bearing certain trademarks or patents owned by various third-parties.third parties. In accordance with these agreements, the Company incurred royalty expense of approximately $181.8 million, $160.2 million $109.4 million and $73.9$109.4 million in fiscal years 2012, 2011 2010 and 2009,2010, respectively. These amounts are included in the Company’sCompany's cost of sales or if advertising related, selling and distribution expenses. At fiscal year end 2011,2012, certain of the Company’sCompany's significant license agreements had expiration dates between fiscal years 2013 and 2017. These license agreements require the Company to pay royalties ranging from 4%5% to 20% of defined net sales. Future minimum royalty commitments under these license agreements, by fiscal year, are as follows (in thousands):
2012 | $ | 121,233 | ||
2013 | 90,666 | |||
2014 | 35,883 | |||
2015 | 24,140 | |||
2016 | 3,714 | |||
Thereafter | 3,990 | |||
|
| |||
| $ | 279,626 | |||
|
|
83
2013 | $ | 144,910 | ||
2014 | 75,311 | |||
2015 | 57,995 | |||
2016 | 3,714 | |||
2017 | 3,990 | |||
| $ | 285,920 | |||
Leases.The Company leases its retail and outlet store facilities as well as certain of its office and warehouse facilities and equipment under non-cancelable operating leases and capital leases. Most of the retail and outlet store leases provide for contingent rental payments based on operating results and require the payment of taxes, insurance and other costs applicable to the property. Generally, these leases include renewal options for various periods at stipulated rates. Rent expense under these agreements was approximately $131.5 million, $107.3 million $88.6 million and $77.6$88.6 million for fiscal years 2012, 2011 2010 and 2009,2010, respectively. Contingent rent expense was approximately $11.1 million, $9.0 million $3.8 millionand
FOSSIL, INC.
NOTES TO CONSOLIDATED FINANCIAL STATEMENTS (Continued)
14. Commitments and $1.8Contingencies (Continued)
$3.8 million for fiscal years 2012, 2011 2010 and 2009,2010, respectively. Future minimum rental commitments under non-cancelable leases, by fiscal year, are as follows (in thousands):
| Operating Leases | Capital Leases | |||||||
2012 | $ | 103,177 | $ | 701 | ||||
2013 | 98,167 | 1,309 | ||||||
2014 | 87,513 | 1,163 | ||||||
2015 | 79,096 | 1,080 | ||||||
2016 | 72,323 | 1,078 | ||||||
Thereafter | 198,581 | 5,616 | ||||||
|
|
|
| |||||
| $ | 638,857 | $ | 10,947 | |||||
|
|
|
| |||||
Less amounts representing interest | (1,110 | ) | ||||||
|
| |||||||
Capital lease obligations, included in short-term debt and in other long-term debt | $ | 9,837 | ||||||
|
| |||||||
| | Operating Leases | Capital Leases | |||||
|---|---|---|---|---|---|---|---|
2013 | $ | 130,423 | $ | 1,095 | |||
2014 | 117,516 | 1,204 | |||||
2015 | 104,285 | 1,100 | |||||
2016 | 87,406 | 1,096 | |||||
2017 | 76,274 | 1,070 | |||||
Thereafter | 223,821 | 4,703 | |||||
| $ | 739,725 | $ | 10,268 | ||||
Less amounts representing interest | (814 | ) | |||||
Capital lease obligations, included in short-term debt and in other long-term debt | $ | 9,454 | |||||
Purchase Obligations.As of December 31, 2011,29, 2012, the Company had purchase obligations totaling $281.5$271.2 million.
Asset Retirement Obligations.ASC 410,Asset Retirement and Environmental Obligations(“ ("ASC 410”410") requires that the fair value of a liability for an asset retirement obligation be recognized in the period in which it is incurred if a reasonable estimate of fair value can be made and that the associated asset retirement costs be capitalized as part of the carrying amount of the long-lived asset. The Company’sCompany's asset retirement obligations relate to costs associated with the retirement of leasehold improvements under office leases within the Europe wholesale segment and the Asia Pacific wholesale segment and under retail store leases within the Direct to consumer segment. The Company had asset retirement obligations of $4.1$6.6 million as of December 31, 2011.29, 2012.
Litigation.The Company is occasionally subject to litigation or other legal proceedings in the normal course of its business. On August 5, 2011, the Company settled the three shareholder derivative lawsuits that were filed in the United States District Court for the Northern District of Texas, Dallas Division, naming the Company as a nominal defendant and naming all of the Company’s then current directors and certain of its current and former officers and directors as defendants. The lawsuits alleged purported violations of federal securities laws and state law claims for breach of fiduciary duty, abuse of control, constructive fraud, corporate waste, unjust enrichment and gross mismanagement in connection with certain stock option grants made by the Company. The settlement provided in part for the following: (i) payment to the Company of approximately $8.7 million by the insurance carriers for the individual defendants; (ii) the adoption or maintenance by the Company of certain corporate governance measures; and (iii) in payment of plaintiff’s counsel’s fees and expenses (a) the issuance by the Company to plaintiff’s counsel of approximately $7.8 million in shares of the Company’s common stock and (b) the granting to plaintiff’s counsel of a stock option to acquire up to 32,000 shares of the Company’s common stock.
The Company does not believe that the outcome of any currently pending legal matters, individually or collectively, will have a material effect on the results of operationsbusiness or financial condition of the Company.
84
14. Stockholders’15. Stockholders' Equity and Benefit Plans
Common and Preferred Stock.The Company has 100,000,000 shares of common stock, par value $0.01 per share, authorized, with 68,370,02059,631,459 and 67,881,52268,370,020 shares issued at fiscal year end 20112012 and 2010,2011, respectively. The Company has 1,000,000 shares of preferred stock, par value $0.01 per share, authorized, with none issued or outstanding. Rights, preferences and other terms of preferred stock will be determined by the Board of Directors at the time of issuance.
Common Stock Repurchase Programs.Purchases of the Company’sCompany's common stock are made from time to time pursuant to its repurchase programs, subject to market conditions and at prevailing market prices, through the open market. Repurchased shares of common stock are recorded at cost and become authorized but unissued shares which may be issued in the future for general corporate or other purposes. The Company may terminate or limit its stock repurchase program at any time. In the
FOSSIL, INC.
NOTES TO CONSOLIDATED FINANCIAL STATEMENTS (Continued)
15. Stockholders' Equity and Benefit Plans (Continued)
event the repurchased shares are cancelled, the Company accounts for retirements by allocating the repurchase price to common stock, additional paid-in capital and retained earnings. The repurchase price allocation is based upon the equity contribution associated with historical issuances. TheseThe repurchase programs wereare conducted pursuant to Rule 10b-18 of the Securities Exchange Act of 1934. AtDuring the period from the announcement of the Company's $750 million buyback authorization in August 2010 until the end of the fiscal year 2011,2012 the Company had open authorizations to repurchasehas repurchased approximately $330$711.4 million of its common stock.stock, representing approximately 9.2 million shares. The Company has not repurchased any shares under the $30 million repurchase plan that was authorized in 2010.
During fiscal year 2012, the Company effectively retired 9.3 million shares of common stock repurchased under its repurchase programs during fiscal years 2012, 2011, and 2010. During fiscal year 2012, the effective retirement of these shares of common stock decreased common stock by $93,000, additional paid-in capital by $50.1 million, retained earnings by $661.8 million and treasury stock by $712.0 million.
The following table reflects the Company’sCompany's common stock repurchase activity for the periods indicated (in millions):
| For the 2011 Fiscal Year | For the 2010 Fiscal Year | |||||||||||||||||||||
Fiscal year authorized | Dollar value authorized | Termination date | Number of shares repurchased | Dollar value repurchased | Number of shares repurchased | Dollar value repurchased | ||||||||||||||||
2010 | $ | 30.0 | None | 0.0 | $ | 0.0 | 0.0 | $ | 0.0 | |||||||||||||
2010 | $ | 750.0 | December 2013 | 3.1 | $ | 270.9 | 3.1 | $ | 179.2 | |||||||||||||
2009 | $ | 20.0 | Completed | 0.5 | $ | 20.0 | ||||||||||||||||
| | | | For the 2012 Fiscal Year | For the 2011 Fiscal Year | ||||||||||||||
|---|---|---|---|---|---|---|---|---|---|---|---|---|---|---|---|---|---|---|
Fiscal Year Authorized | Dollar Value Authorized | Termination Date | Number of Shares Repurchased | Dollar Value Repurchased | Number of Shares Repurchased | Dollar Value Repurchased | ||||||||||||
2012 | $ | 1,000.0 | December 2016 | 0.0 | $ | 0.0 | 0.0 | $ | 0.0 | |||||||||
2010 | $ | 30.0 | None | 0.0 | $ | 0.0 | 0.0 | $ | 0.0 | |||||||||
2010 | $ | 750.0 | December 2013 | 3.0 | $ | 261.3 | 3.1 | $ | 270.9 | |||||||||
Noncontrolling Interest. In October 2012, the Company acquired the outstanding minority interest shares in Fossil Mexico, S.A. de C.V. ("Fossil Mexico") and Servicios Fossil Mexico, S.A. de C.V. ("Fossil Servicios"), representing the entire noncontrolling interest in these subsidiaries, for approximately $14.1 million in cash. The transaction was accounted for as an equity transaction, and the Company's ownership interest in both Fossil Mexico and Fossil Servicios increased to 100%. The following table summarizes the effects of changes in the Company’sCompany's ownership interest in its subsidiaries on stockholders’stockholders' equity (in thousands):
Fiscal Year | 2011 | 2010 | ||||||
Net income attributable to Fossil, Inc. | $ | 294,702 | $ | 255,205 | ||||
|
|
|
| |||||
Transfers to noncontrolling interest: | ||||||||
Decrease in Fossil, Inc.'s additional paid-in capital for purchases of 371 common shares of Fossil Taiwan | 0 | (711 | ) | |||||
|
|
|
| |||||
Net transfers to noncontrolling interest | 0 | (711 | ) | |||||
|
|
|
| |||||
Change from net income attributable to Fossil, Inc. and transfers to noncontrolling interest | $ | 294,702 | $ | 254,494 | ||||
|
|
|
| |||||
Fiscal Year | 2012 | 2011 | 2010 | |||||||
|---|---|---|---|---|---|---|---|---|---|---|
Net income attributable to Fossil, Inc. | $ | 343,401 | $ | 294,702 | $ | 255,205 | ||||
Transfers to noncontrolling interest: | ||||||||||
Decrease in Fossil, Inc.'s additional paid-in capital for purchases of 49 common shares of Fossil Mexico and 49 common shares of Fossil Servicios | (7,332 | ) | 0 | 0 | ||||||
Decrease in Fossil, Inc.'s additional paid-in capital for purchases of 371 common shares of Fossil Taiwan | 0 | 0 | (711 | ) | ||||||
Net transfers to noncontrolling interest | (7,332 | ) | 0 | (711 | ) | |||||
Change from net income attributable to Fossil, Inc. and transfers to noncontrolling interest | $ | 336,069 | $ | 294,702 | $ | 254,494 | ||||
FOSSIL, INC.
NOTES TO CONSOLIDATED FINANCIAL STATEMENTS (Continued)
15. Stockholders' Equity and Benefit Plans (Continued)
Deferred Compensation and Savings Plans.The Company has a defined contribution savings plan (the “401(k) Plan”"401(k) Plan") for substantially all U.S. basedU.S.-based full-time employees of the Company. The Company’sCompany's common stock is one of several investment alternatives available under the 401(k) Plan. Effective January 1, 2012, the Company added a Roth 401(k) option to the 401(k) Plan. The Company has a discretionary match for the 401(k) Plan. After one year of service (minimum of 1,000 hours worked), the Company matches 50% of employee contributions up to 3% of their compensation and 25% of employee contributions between 4% and 6% of their compensation. Effective January 1, 2012, after ninety 90 days of service (minimum of 250 hours worked), the Company increased its match to 50% of employee contributions up to 6% of their compensation. Matching contributions made by the Company to the 401(k) Plan totaled approximately $2.7 million, $1.6 million and $1.3 million and $186,000 for fiscal years 2012, 2011 and 2010, and 2009, respectively. In March 2009, the Company suspended the employer match portion of the 401(k) Plan and, effective January 2010, the Company reinstated the employer match program. The Company also has the right to
85
make additional matching contributions not to exceed 15% of employee compensation. The Company did not make any additional matching contributions during fiscal years 2012, 2011 2010 and 2009.2010.
In December 1998, the Company adopted the Fossil, Inc. and Affiliates Deferred Compensation Plan (the “Deferred Plan”"Deferred Plan"). Eligible participants may elect to defer up to 50% of their salary or up to 100% of any bonuses paid pursuant to the terms and conditions of the Deferred Plan. In addition, the Company may make employer contributions to participants under the Deferred Plan from time to time. The Company made no contributions to the Deferred Plan during fiscal years 2012, 2011 2010 and 2009.2010. The Company has made payments pursuant to the Deferred Plan into a Rabbi Trust. The funds held in the Rabbi Trust are directed to certain investments available through life insurance products and accounted for in accordance with ASC 710,Compensation-GeneralCompensation—General(“ ("ASC 710”710"). As of December 31, 2011,29, 2012, the Company had an asset of $2.9$3.2 million related to the Company’sCompany's invested balances recorded in intangible and other assets-netassets—net and a liability of $2.0$2.8 million related to the participants’participants' invested balances recorded in accrued expenses other.expenses—other, each on the Company's consolidated balance sheets.
Stock-Based Compensation Plans.The Company accounts for stock-based compensation in accordance with the provisions of ASC 718, using the Black-Scholes option pricing model to determine the fair value of stock options and stock appreciation rights at the date of grant. The Company’sCompany's grants under its current stock-based compensation plans generally include: (i) stock options and restricted stock for its international employees, (ii) stock options and restricted stock units for its non-employee directors and (iii) stock appreciation rights, restricted stock and restricted stock units for its U.S.-based employees. As of December 31, 2011,29, 2012, there was approximately $22.0$26.5 million of total unrecognized compensation cost related to nonvested share-based compensation arrangements granted under the Company’sCompany's incentive plans. This cost is expected to be recognized over a weighted-average period of approximately twoone and a halfone-half years.
Long-Term Incentive Plans.An aggregate of 4,685,030 shares of the Company’sCompany's common stock were reserved for issuance pursuant to the Company’sCompany's 2008 Long-Term Incentive Plan (“("2008 LTIP”LTIP"), adopted in March 2008. Designated employees of the Company, including officers, and directors, certain contractors, and outside directors of the Company are eligible to receive (i) stock options, (ii) stock appreciation rights, (iii) restricted or non-restricted stock awards, (iv) restricted stock units, (v) cash awards, or (vi) any combination of the foregoing. The 2008 LTIP is administered by the Compensation Committee of the Company’sCompany's Board of Directors (the “Compensation Committee”"Compensation Committee"). Each award issued under the 2008 LTIP terminates at the time designated by the Compensation Committee, not to exceed ten years. The currentlycurrent outstanding stock options, stock appreciation rights, restricted stock and restricted stock
FOSSIL, INC.
NOTES TO CONSOLIDATED FINANCIAL STATEMENTS (Continued)
15. Stockholders' Equity and Benefit Plans (Continued)
units issued under the 2008 LTIP have original vesting periods that predominately range from three to five years. All stock appreciation rights and restricted stock units are settled in shares of the Company’sCompany's common stock. Effective January 1, 2010,2012, the Company’sCompany's Board of Directors approved a newchanges to the equity compensation package for nonemployee directors. Each nonemployee director receives restricted stock units valued at $100,000$120,000 on the date of the Company’sCompany's annual stockholders’stockholders' meeting. These grants vest on the earlier of one year from the date of grant or the Company’sCompany's next annual stockholders’stockholders' meeting date.
Prior to the Company establishing the 2008 LTIP, stock-based compensation awards were made to employees and nonemployee directors pursuant to the Company’sCompany's initial Long-Term Incentive Plan (“LTIP”("LTIP") and Nonemployee Director Stock Option Plan (“("Nonemployee Plan”Plan"), respectively. Each award issued under the LTIP terminates at the time designated by the Compensation Committee, not to exceed ten years. The currently outstanding options, stock appreciation rights, restricted stock and restricted stock units issued under the LTIP and Nonemployee Plan have original vesting periods that predominately range from three to five years. All stock appreciation rights and restricted stock units are settled in shares of the Company’sCompany's common stock. The exercise prices of stock options granted under the Nonemployee Plan were not less than the fair market value of the Company’sCompany's common stock at the date of grant. Pursuant to the Nonemployee Plan, 50% of the options granted became exercisable on the first anniversary of the date of grant and in two additional installments of 25% each on the second and third anniversaries. On March 26, 2008, the Company’sCompany's Board of Directors elected to terminate these prior plans, and grants to employees and nonemployee directors since the termination date have been made
86
under the 2008 LTIP. However, theplans. The termination of the LTIP and the Nonemployee plansPlan did not impair outstanding awards representing 524,501268,281 shares and 63,50037,000 shares, respectively, of the Company’sCompany's common stock at December 29, 2012 which continued in accordance with their original terms.
Restricted Stock Plan.The 2002 Restricted Stock Plan of the Company was intended to advance the interests of the Company, its subsidiaries and its stockholders in order to attract, retain and motivate key employees by providing them with additional incentives through the award of shares of restricted stock. Shares awarded under the Restricted Stock Plan were funded with shares contributed to the Company from a significant stockholder. During 2006, 44,200 shares of stock were contributed to the Restricted Stock Plan by the stockholder and reissued by the Company to employees. On August 29, 2007, the Company’s Board of Directors elected to terminate this plan. However, the termination did not impair outstanding awards which continued in accordance with their original terms. At fiscal year end 2011, all awards issued under the 2002 Restricted Stock Plan were fully vested.
Stock Options and Stock Appreciation Rights.The fair value of stock options and stock appreciation rights granted under the Company’sCompany's stock-based compensation plans was estimated on the date of grant using the Black-Scholes option-pricingoption pricing model. The table below outlines the weighted average assumptions for these award grants:
Fiscal Year | 2012 | 2011 | 2010 | |||||||
|---|---|---|---|---|---|---|---|---|---|---|
Risk-free interest rate | 1.1 | % | 1.1 | % | 1.4 | % | ||||
Expected term (in years) | 5.1 | 4.7 | 5.8 | |||||||
Expected volatility | 51.1 | % | 45.2 | % | 50.4 | % | ||||
Expected dividend yield | 0.0 | % | 0.0 | % | 0.0 | % | ||||
Estimated fair value per option/stock appreciation right granted | $ | 56.08 | $ | 33.10 | $ | 18.60 | ||||
Fiscal Year | 2011 | 2010 | 2009 | |||||||||
Risk-free interest rate | 1.1 | % | 1.4 | % | 1.8 | % | ||||||
Expected term (in years) | 4.7 | 5.8 | 5.9 | |||||||||
Expected volatility | 45.2 | % | 50.4 | % | 53.2 | % | ||||||
Expected dividend yield | 0.0 | % | 0.0 | % | 0.0 | % | ||||||
Estimated fair value per options/stock appreciation right granted | $ | 33.10 | $ | 18.60 | $ | 13.65 | ||||||
The expected term of the options represent the estimated period of time until exercise and is based on historical experience of similar awards. Expected stock price volatility is based on the historical volatility of the Company’sCompany's common stock. The risk-free interest rate is based on the implied yield available on U.S. Treasury issues with an equivalent remaining term.
The Company receives a tax deduction for certain stock option exercises/restricted stock vestings when the options/restricted shares are exercised/vested. Generally for stock options, the tax deduction is related to the excess of the stock price at the time the stock options are soldexercised over the exercise price of the stock options. For restricted shares, the tax deduction is the fair market value of the Company’sCompany's common stock on the date the restricted shares vest. Excess tax benefits from stock-based
FOSSIL, INC.
NOTES TO CONSOLIDATED FINANCIAL STATEMENTS (Continued)
15. Stockholders' Equity and Benefit Plans (Continued)
compensation on the Company's consolidated statements of cash flows for fiscal years 2012, 2011 2010 and 20092010 amounted to approximately $11.7 million, $10.0 million and $12.0 million, and $1.2 million, respectively.
87
The following table summarizes stock option and stock appreciation rights activity:
Stock Options and Stock Appreciation Rights | Shares | Weighted- Average Exercise Price | Weighted- Average Remaining Contractual Term (years) | Aggregate Intrinsic Value | |||||||||
|---|---|---|---|---|---|---|---|---|---|---|---|---|---|
| | in thousands | | | in thousands | |||||||||
Outstanding at January 2, 2010 | 2,811 | $ | 21.21 | 5.3 | $ | 35,217 | |||||||
Granted | 325 | 38.37 | |||||||||||
Exercised | (1,496 | ) | 19.98 | 47,073 | |||||||||
Forfeited or expired | (240 | ) | 26.82 | ||||||||||
Outstanding at January 1, 2011 | 1,400 | 25.55 | 5.8 | 62,889 | |||||||||
Granted | 303 | 87.73 | |||||||||||
Exercised | (461 | ) | 23.95 | 33,267 | |||||||||
Forfeited or expired | (22 | ) | 47.44 | ||||||||||
Outstanding at December 31, 2011 | 1,220 | 41.20 | 5.8 | 49,125 | |||||||||
Granted | 279 | 124.61 | |||||||||||
Exercised | (386 | ) | 30.28 | 32,201 | |||||||||
Forfeited or expired | (74 | ) | 98.53 | ||||||||||
Outstanding at December 29, 2012 | 1,039 | 63.56 | 6.4 | 36,708 | |||||||||
Exercisable at December 29, 2012 | 400 | 34.85 | 4.6 | 21,988 | |||||||||
Nonvested at December 29, 2012 | 639 | 81.55 | 7.4 | 14,720 | |||||||||
Expected to vest | 576 | $ | 81.55 | 7.4 | $ | 13,400 | |||||||
Stock Options and Stock Appreciation Rights | Shares | Weighted- Average Exercise Price | Weighted- Average Remaining Contractual Term (years) | Aggregate Intrinsic Value | ||||||||||||||||
| IN THOUSANDS | IN THOUSANDS | |||||||||||||||||||
Outstanding at January 3, 2009 | 2,858 | $ | 21.09 | 5.7 | $ | 5,862 | ||||||||||||||
Granted | 317 | 13.65 | ||||||||||||||||||
Exercised | (315 | ) | 12.03 | 4,935 | ||||||||||||||||
Forfeited or expired | (49 | ) | 24.13 | |||||||||||||||||
|
| |||||||||||||||||||
Outstanding at January 2, 2010 | 2,811 | 21.21 | 5.3 | 35,217 | ||||||||||||||||
Granted | 325 | 38.37 | ||||||||||||||||||
Exercised | (1,496 | ) | 19.98 | 47,073 | ||||||||||||||||
Forfeited or expired | (240 | ) | 26.82 | |||||||||||||||||
|
| |||||||||||||||||||
Outstanding at January 1, 2011 | 1,400 | 25.55 | 5.8 | 62,889 | ||||||||||||||||
Granted | 303 | 87.73 | ||||||||||||||||||
Exercised | (461 | ) | 23.95 | 33,267 | ||||||||||||||||
Forfeited or expired | (22 | ) | 47.44 | |||||||||||||||||
|
| |||||||||||||||||||
Outstanding at December 31, 2011 | 1,220 | 41.20 | 5.8 | 49,125 | ||||||||||||||||
|
| |||||||||||||||||||
Exercisable at December 31, 2011 | 496 | 30.95 | 3.9 | 25,346 | ||||||||||||||||
|
| |||||||||||||||||||
Nonvested at December 31, 2011 | 724 | 48.21 | 7.2 | 23,779 | ||||||||||||||||
|
| |||||||||||||||||||
Expected to vest | 671 | $ | 48.21 | 7.2 | $ | 22,091 | ||||||||||||||
|
| |||||||||||||||||||
The aggregate intrinsic value in the table above is before income taxes and is based on the exercise price for outstanding and exercisable options/rights at December 31, 201129, 2012 and based on the fair market value of the Company’sCompany's common stock on the exercise date for options/rights that have been exercised during the fiscal year.
FOSSIL, INC.
NOTES TO CONSOLIDATED FINANCIAL STATEMENTS (Continued)
15. Stockholders' Equity and Benefit Plans (Continued)
Stock Options and Stock Appreciation Rights Outstanding and Exercisable.The following table summarizes information with respect to options and stock appreciation rights outstanding and exercisable at December 31, 2011:29, 2012:
Stock Options and Stock Appreciation Rights Outstanding | Stock Options and Stock Appreciation Rights Exercisable | |||||||||||||||||||||
Range of Exercise Prices | Number of Shares | Weighted- Average Exercise Price | Weighted- Average Remaining Contractual Term (Years) | Number of Shares | Weighted- Average Exercise Price | |||||||||||||||||
| IN THOUSANDS | IN THOUSANDS | |||||||||||||||||||||
$9.22 - $12.83 | 43 | $ | 11.60 | 1.0 | 43 | $ | 11.60 | |||||||||||||||
$12.83 - 25.66 | 346 | 16.87 | 5.0 | 191 | 18.93 | |||||||||||||||||
$25.66 - 38.49 | 505 | 33.03 | 5.7 | 198 | 30.06 | |||||||||||||||||
$38.49 - 51.32 | 32 | 43.12 | 6.0 | 32 | 43.12 | |||||||||||||||||
$64.15 - 76.97 | 6 | 69.53 | 9.0 | 0 | 0.00 | |||||||||||||||||
$76.97 - 89.80 | 237 | 81.23 | 8.7 | 0 | 0.00 | |||||||||||||||||
$89.80 - 102.63 | 5 | 93.29 | 9.3 | 0 | 0.00 | |||||||||||||||||
$115.46 - 128.29 | 46 | 123.75 | 3.1 | 32 | 121.73 | |||||||||||||||||
|
|
|
|
|
|
|
|
|
| |||||||||||||
Total | 1,220 | $ | 41.20 | 5.8 | 496 | $ | 30.95 | |||||||||||||||
|
|
|
|
|
|
|
|
|
| |||||||||||||
88
| Stock Options and Stock Appreciation Rights Outstanding | Stock Options and Stock Appreciation Rights Exercisable | |||||||||||||||
|---|---|---|---|---|---|---|---|---|---|---|---|---|---|---|---|---|
Range of Exercise Prices | Number of Shares | Weighted- Average Exercise Price | Weighted- Average Remaining Contractual Term (Years) | Number of Shares | Weighted- Average Exercise Price | |||||||||||
| | in thousands | | | in thousands | | |||||||||||
$ 11.66 - $ 13.15 | 4 | $ | 11.69 | 0.2 | 4 | $ | 11.69 | |||||||||
$ 13.15 - 26.29 | 271 | 18.32 | 4.0 | 184 | 20.44 | |||||||||||
$ 26.29 - 39.44 | 256 | 34.78 | 5.5 | 129 | 33.94 | |||||||||||
$ 39.44 - 52.58 | 32 | 43.12 | 5.0 | 32 | 43.12 | |||||||||||
$ 65.73 - 78.88 | 7 | 68.59 | 8.6 | 1 | 69.53 | |||||||||||
$ 78.88 - 92.02 | 209 | 81.45 | 7.8 | 43 | 81.23 | |||||||||||
$ 92.02 - 105.17 | 3 | 93.29 | 5.7 | 2 | 93.29 | |||||||||||
$118.31 - 131.46 | 257 | 128.02 | 8.8 | 5 | 128.29 | |||||||||||
Total | 1,039 | $ | 63.56 | 6.4 | 400 | $ | 34.85 | |||||||||
Restricted Stock and Restricted Stock Units.The following table summarizes restricted stock and restricted stock unit activity:
Restricted Stock and Restricted Stock Units | Number of Shares | Weighted- Average Grant-Date Fair Value | |||||
|---|---|---|---|---|---|---|---|
| | in thousands | | |||||
Nonvested at January 2, 2010 | 493 | $ | 21.54 | ||||
Granted | 215 | 38.83 | |||||
Vested | (150 | ) | 21.66 | ||||
Forfeited | (128 | ) | 25.35 | ||||
Nonvested at January 1, 2011 | 430 | 29.03 | |||||
Granted | 105 | 86.80 | |||||
Vested | (172 | ) | 29.29 | ||||
Forfeited | (11 | ) | 42.98 | ||||
Nonvested at December 31, 2011 | 352 | 45.70 | |||||
Granted | 102 | 110.72 | |||||
Vested | (161 | ) | 45.14 | ||||
Forfeited | (16 | ) | 67.62 | ||||
Nonvested at December 29, 2012 | 277 | 68.69 | |||||
Expected to vest | 250 | $ | 68.69 | ||||
FOSSIL, INC.
NOTES TO CONSOLIDATED FINANCIAL STATEMENTS (Continued)
15. Stockholders' Equity and Benefit Plans (Continued)
Restricted Stock and Restricted Stock Units | Number of Shares | Weighted- Average Grant-Date Fair Value | ||||||
| IN THOUSANDS | ||||||||
Nonvested at January 3, 2009 | 495 | $ | 24.56 | |||||
Granted | 150 | 13.65 | ||||||
Vested | (142 | ) | 23.48 | |||||
Forfeited | (10 | ) | 25.02 | |||||
|
| |||||||
Nonvested at January 2, 2010 | 493 | 21.54 | ||||||
Granted | 215 | 38.83 | ||||||
Vested | (150 | ) | 21.66 | |||||
Forfeited | (128 | ) | 25.35 | |||||
|
| |||||||
Nonvested at January 1, 2011 | 430 | 29.03 | ||||||
Granted | 105 | 86.80 | ||||||
Vested | (172 | ) | 29.29 | |||||
Forfeited | (11 | ) | 42.98 | |||||
|
| |||||||
Nonvested at December 31, 2011 | 352 | 45.70 | ||||||
|
| |||||||
Expected to vest | 317 | $ | 45.70 | |||||
|
| |||||||
The total fair value of shares/units vested during fiscal years 2012, 2011 and 2010 and 2009 was $19.1 million, $14.7 million $5.8 million and $2.4$5.8 million, respectively.
15.16. Supplemental Cash Flow Information
The following table summarizes supplemental cash flow information (in thousands):
Fiscal Year | 2011 | 2010 | 2009 | |||||||||
Cash paid during the year for: | ||||||||||||
Interest | $ | 3,323 | $ | 1,026 | $ | 443 | ||||||
Income taxes | $ | 135,133 | $ | 107,787 | $ | 62,957 | ||||||
Supplemental disclosures of non-cash investing and financing activities: | ||||||||||||
Additions to property, plant and equipment included in accounts payable | $ | 23,766 | $ | 8,034 | $ | 4,349 | ||||||
Retirement of treasury stock | $ | 482 | $ | 725 | $ | 212 | ||||||
89
Fiscal Year | 2012 | 2011 | 2010 | |||||||
|---|---|---|---|---|---|---|---|---|---|---|
Cash paid during the year for: | ||||||||||
Interest | $ | 5,155 | $ | 3,323 | $ | 1,026 | ||||
Income taxes | $ | 105,433 | $ | 135,133 | $ | 107,787 | ||||
Supplemental disclosures of non-cash investing and financing activities: | ||||||||||
Additions to property, plant and equipment included in accounts payable | $ | 11,713 | $ | 23,766 | $ | 8,034 | ||||
Additions to property, plant and equipment acquired under capital leases | $ | 4,884 | $ | 2,067 | $ | 58 | ||||
Issuance of common stock for acquisition | $ | 19,899 | $ | 0 | $ | 0 | ||||
16.17. Supplemental Disclosure for Accumulated Other Comprehensive Income
The following table summarizes changes in accumulated other comprehensive income (in thousands):
Fiscal Year | 2011 | 2010 | 2009 | |||||||||
Unrealized (loss) gain on securities available for sale: | ||||||||||||
Balance at beginning of fiscal year | $ | 210 | $ | (344 | ) | $ | (1,437 | ) | ||||
Unrealized (loss) gain on marketable investments | (656 | ) | 554 | 1,093 | ||||||||
|
|
|
|
|
| |||||||
Balance at end of fiscal year | (446 | ) | 210 | (344 | ) | |||||||
|
|
|
|
|
| |||||||
Unrealized (loss) gain on cash flow hedges: | ||||||||||||
Balance at beginning of fiscal year | (6,236 | ) | (549 | ) | 3,815 | |||||||
Plus change in fair value associated with current period hedging activities, net of taxes of ($2,343), $2,482, ($23), respectively | 280 | 1,016 | (2,911 | ) | ||||||||
Less reclassification into earnings, net of taxes of ($4,167), $25, and $749, respectively | (9,629 | ) | 6,703 | 1,453 | ||||||||
|
|
|
|
|
| |||||||
Balance at end of fiscal year | $ | 3,673 | $ | (6,236 | ) | $ | (549 | ) | ||||
|
|
|
|
|
| |||||||
Cumulative translation adjustment | $ | 18,953 | $ | 25,444 | $ | 35,353 | ||||||
|
|
|
|
|
| |||||||
Accumulated other comprehensive income | $ | 22,180 | $ | 19,418 | $ | 34,460 | ||||||
|
|
|
|
|
| |||||||
Fiscal Year | 2012 | 2011 | 2010 | |||||||
|---|---|---|---|---|---|---|---|---|---|---|
Unrealized (loss) gain on securities available for sale: | ||||||||||
Balance at beginning of fiscal year | $ | (446 | ) | $ | 210 | $ | (344 | ) | ||
Unrealized (loss) gain on marketable investments | (29 | ) | (656 | ) | 554 | |||||
Balance at end of fiscal year | $ | (475 | ) | (446 | ) | 210 | ||||
Unrealized gain (loss) on cash flow hedges: | ||||||||||
Balance at beginning of fiscal year | 3,673 | (6,236 | ) | (549 | ) | |||||
Plus change in fair value associated with current period hedging activities, net of taxes of $806, ($2,343), $2,482, respectively | 426 | 280 | 1,016 | |||||||
Less reclassification into earnings, net of taxes of $2,716, ($4,167), and $25, respectively | 5,045 | (9,629 | ) | 6,703 | ||||||
Balance at end of fiscal year | $ | (946 | ) | $ | 3,673 | $ | (6,236 | ) | ||
Cumulative translation adjustment | $ | 30,181 | $ | 18,953 | $ | 25,444 | ||||
Accumulated other comprehensive income | $ | 28,760 | $ | 22,180 | $ | 19,418 | ||||
FOSSIL, INC.
NOTES TO CONSOLIDATED FINANCIAL STATEMENTS (Continued)
18. Major Customer, Segment and Geographic Information
In accordance with ASC 280, Segment Reporting(“ ("ASC 280”280"), the Company reports segment information based on the “management”"management" approach. The management approach designates the internal reporting used by management for making decisions and assessing performance as the source of the Company’sCompany's reportable segments.
Major Customer
Wholesale customers of the Company consist principally of major department stores and specialty retail stores located throughout the world. No individual customer accounts for 10% or more of the Company’sCompany's net sales.
Segment Information
The Company manages its business primarily on a geographic basis. The Company’sCompany's reportable operating segments are comprised of North America wholesale, Europe wholesale, Asia Pacific wholesale and Direct to consumer. The North America wholesale, Europe wholesale and Asia Pacific wholesale reportable segments do not include activities related to the Direct to consumer segment. The North America wholesale segment primarily includes sales to wholesale or distributor customers based in Canada, Mexico, the United States and countries in South America. The Europe wholesale segment primarily includes sales to wholesale or distributor customers based in European countries, the Middle East and Africa. The Asia Pacific wholesale segment primarily includes sales to wholesale or distributor customers based in Australia, China (including the Company’sCompany's assembly and procurement operations), India, Indonesia, Japan, Malaysia, New Zealand, Singapore, South Korea, Taiwan and Thailand. The Direct to consumer segment includes Company-owned retail stores, e-commerce sales and catalog activities. Each reportable operating segment provides similar products and services.
The Company evaluates the performance of its reportable segments based on net sales and operating income. Net sales for geographic segments are generally based on the location of the customers. Operating income for each segment includes net sales to third-parties,third parties, related cost of sales and operating expenses directly
90
attributable to the segment. General corporate expenses, including certain administrative, legal, accounting, technology support costs, equity compensation costs, payroll costs attributable to executive management and amounts related to intercompany eliminations are not allocated to the various segments. Intercompany sales of products between segments are referred to as intersegment items.
Certain reclassifications were made to prior fiscal year amounts to conform with current fiscal year presentation. Due to changes in the Company’s reportable segments as discussed in Note 1 to the consolidated financial statements, segment results for fiscal years 2009 were recast to present results on a comparable basis. These changes had no impact on consolidated net sales or operating income.Table of Contents
FOSSIL, INC.
NOTES TO CONSOLIDATED FINANCIAL STATEMENTS (Continued)
18. Major Customer, Segment and Geographic Information (Continued)
Summary information by operating segment is as follows (in thousands):
| | Fiscal Year 2012 | |||||||||||||||
|---|---|---|---|---|---|---|---|---|---|---|---|---|---|---|---|---|
| | Net Sales | Operating Income | Depreciation and Amortization | Long-term Assets | Total Assets | |||||||||||
North America wholesale: | $ | 4,880 | $ | 236,639 | $ | 610,979 | ||||||||||
External customers | $ | 1,083,489 | $ | 246,616 | ||||||||||||
Intersegment | 203,266 | |||||||||||||||
Europe wholesale: | 6,529 | 150,977 | 354,823 | |||||||||||||
External customers | 696,988 | 174,469 | ||||||||||||||
Intersegment | 166,952 | |||||||||||||||
Asia Pacific wholesale: | 3,958 | 37,639 | 416,825 | |||||||||||||
External customers | 361,514 | 127,263 | ||||||||||||||
Intersegment | 757,480 | |||||||||||||||
Direct to consumer | 715,517 | 98,754 | 26,259 | 170,461 | 313,498 | |||||||||||
Intersegment items | (1,127,698 | ) | ||||||||||||||
Corporate | (158,262 | ) | 18,880 | 102,161 | 145,864 | |||||||||||
Consolidated | $ | 2,857,508 | $ | 488,840 | $ | 60,506 | $ | 697,877 | $ | 1,841,989 | ||||||
| Fiscal Year 2011 | ||||||||||||||||||||
| Net Sales | Operating Income | Depreciation and Amortization | Long-lived Assets | Total Assets | ||||||||||||||||
North America wholesale: | $ | 2,912 | $ | 65,332 | $ | 524,615 | ||||||||||||||
External customers | $ | 967,493 | $ | 235,003 | ||||||||||||||||
Intersegment | 161,640 | |||||||||||||||||||
Europe wholesale: | 5,377 | 83,107 | 436,775 | |||||||||||||||||
External customers | 695,391 | 187,762 | ||||||||||||||||||
Intersegment | 154,654 | |||||||||||||||||||
Asia Pacific wholesale: | 2,448 | 16,067 | 258,343 | |||||||||||||||||
External customers | 297,045 | 108,756 | ||||||||||||||||||
Intersegment | 709,336 | |||||||||||||||||||
Direct to consumer | 607,373 | 87,187 | 21,409 | 141,039 | 246,911 | |||||||||||||||
Intersegment items | (1,025,630 | ) | ||||||||||||||||||
Corporate | (146,717 | ) | 13,074 | 101,975 | 176,278 | |||||||||||||||
|
|
|
|
|
|
|
|
|
| |||||||||||
Consolidated | $ | 2,567,302 | $ | 471,991 | $ | 45,220 | $ | 407,520 | $ | 1,642,922 | ||||||||||
|
|
|
|
|
|
|
|
|
| |||||||||||
| Fiscal Year 2010 | ||||||||||||||||||||
| Net Sales | Operating Income | Depreciation and Amortization | Long-lived Assets | Total Assets | ||||||||||||||||
North America wholesale: | $ | 3,547 | $ | 98,970 | $ | 585,616 | ||||||||||||||
External customers | $ | 779,159 | $ | 188,155 | ||||||||||||||||
Intersegment | 151,304 | |||||||||||||||||||
Europe wholesale: | 3,954 | 85,048 | 383,301 | |||||||||||||||||
External customers | 547,428 | 154,729 | ||||||||||||||||||
Intersegment | 100,661 | |||||||||||||||||||
Asia Pacific wholesale: | 2,291 | 17,193 | 188,459 | |||||||||||||||||
External customers | 220,777 | 82,037 | ||||||||||||||||||
Intersegment | 592,403 | |||||||||||||||||||
Direct to consumer | 483,326 | 66,339 | 21,452 | 96,017 | 217,620 | |||||||||||||||
Intersegment items | (844,368 | ) | ||||||||||||||||||
Corporate | (114,846 | ) | 9,058 | 29,528 | 92,577 | |||||||||||||||
|
|
|
|
|
|
|
|
|
| |||||||||||
Consolidated | $ | 2,030,690 | $ | 376,414 | $ | 40,302 | $ | 326,756 | $ | 1,467,573 | ||||||||||
|
|
|
|
|
|
|
|
|
| |||||||||||
| | Fiscal Year 2011 | |||||||||||||||
|---|---|---|---|---|---|---|---|---|---|---|---|---|---|---|---|---|
| | Net Sales | Operating Income | Depreciation and Amortization | Long-term Assets | Total Assets | |||||||||||
North America wholesale: | $ | 2,912 | $ | 65,332 | $ | 524,615 | ||||||||||
External customers | $ | 967,493 | $ | 235,003 | ||||||||||||
Intersegment | 161,640 | |||||||||||||||
Europe wholesale: | 5,377 | 83,107 | 436,775 | |||||||||||||
External customers | 695,391 | 187,762 | ||||||||||||||
Intersegment | 154,654 | |||||||||||||||
Asia Pacific wholesale: | 2,448 | 16,067 | 258,343 | |||||||||||||
External customers | 297,045 | 108,756 | ||||||||||||||
Intersegment | 709,336 | |||||||||||||||
Direct to consumer | 607,373 | 87,187 | 21,409 | 141,039 | 246,911 | |||||||||||
Intersegment items | (1,025,630 | ) | ||||||||||||||
Corporate | (146,717 | ) | 13,074 | 101,975 | 176,278 | |||||||||||
Consolidated | $ | 2,567,302 | $ | 471,991 | $ | 45,220 | $ | 407,520 | $ | 1,642,922 | ||||||
FOSSIL, INC.
NOTES TO CONSOLIDATED FINANCIAL STATEMENTS (Continued)
18. Major Customer, Segment and Geographic Information (Continued)
91
| | Fiscal Year 2010 | |||||||||||||||
|---|---|---|---|---|---|---|---|---|---|---|---|---|---|---|---|---|
| | Net Sales | Operating Income | Depreciation and Amortization | Long-term Assets | Total Assets | |||||||||||
North America wholesale: | $ | 3,547 | $ | 98,970 | $ | 585,616 | ||||||||||
External customers | $ | 779,159 | $ | 188,155 | ||||||||||||
Intersegment | 151,304 | |||||||||||||||
Europe wholesale: | 3,954 | 85,048 | 383,301 | |||||||||||||
External customers | 547,428 | 154,729 | ||||||||||||||
Intersegment | 100,661 | |||||||||||||||
Asia Pacific wholesale: | 2,291 | 17,193 | 188,459 | |||||||||||||
External customers | 220,777 | 82,037 | ||||||||||||||
Intersegment | 592,403 | |||||||||||||||
Direct to consumer | 483,326 | 66,339 | 21,452 | 96,017 | 217,620 | |||||||||||
Intersegment items | (844,368 | ) | ||||||||||||||
Corporate | (114,846 | ) | 9,058 | 29,528 | 92,577 | |||||||||||
Consolidated | $ | 2,030,690 | $ | 376,414 | $ | 40,302 | $ | 326,756 | $ | 1,467,573 | ||||||
| Fiscal Year 2009 | ||||||||||||||||||||
| Net Sales | Operating Income | Depreciation and Amortization | Long-lived Assets | Total Assets | ||||||||||||||||
North America wholesale: | $ | 3,355 | $ | 93,065 | $ | 459,076 | ||||||||||||||
External customers | $ | 551,117 | $ | 103,272 | ||||||||||||||||
Intersegment | 181,207 | |||||||||||||||||||
Europe wholesale: | 4,176 | 104,813 | 430,921 | |||||||||||||||||
External customers | 467,099 | 91,295 | ||||||||||||||||||
Intersegment | 43,037 | |||||||||||||||||||
Asia Pacific wholesale: | 2,303 | 18,793 | 189,172 | |||||||||||||||||
External customers | 153,739 | 57,507 | ||||||||||||||||||
Intersegment | 349,896 | |||||||||||||||||||
Direct to consumer | 376,138 | 39,047 | 21,385 | 82,766 | �� | 142,986 | ||||||||||||||
Intersegment items | (574,140 | ) | ||||||||||||||||||
Corporate | (79,494 | ) | 9,661 | 30,573 | 54,328 | |||||||||||||||
|
|
|
|
|
|
|
|
|
| |||||||||||
Consolidated | $ | 1,548,093 | $ | 211,627 | $ | 40,880 | $ | 330,010 | $ | 1,276,483 | ||||||||||
|
|
|
|
|
|
|
|
|
| |||||||||||
The following table indicates revenue for each class of similar products for fiscal years 2012, 2011 2010, and 20092010 (in thousands):
| Fiscal Year 2011 | Fiscal Year 2010 | Fiscal Year 2009 | ||||||||||||||||||||||
| Net Sales | Percentage of Total | Net Sales | Percentage of Total | Net Sales | Percentage of Total | |||||||||||||||||||
Watches | $ | 1,843,909 | 71.8 | % | $ | 1,419,205 | 69.9 | % | $ | 1,021,181 | 66.0 | % | ||||||||||||
Leathers | 427,771 | 16.7 | 340,405 | 16.8 | 297,591 | 19.2 | ||||||||||||||||||
Jewelry | 190,126 | 7.4 | 166,183 | 8.2 | 133,949 | 8.7 | ||||||||||||||||||
Other | 105,496 | 4.1 | 104,897 | 5.1 | 95,372 | 6.1 | ||||||||||||||||||
|
|
|
|
|
|
|
|
|
|
|
| |||||||||||||
Total | $ | 2,567,302 | 100.0 | % | $ | 2,030,690 | 100.0 | % | $ | 1,548,093 | 100.0 | % | ||||||||||||
|
|
|
|
|
|
|
|
|
|
|
| |||||||||||||
| | Fiscal Year 2012 | Fiscal Year 2011 | Fiscal Year 2010 | ||||||||||||||||
|---|---|---|---|---|---|---|---|---|---|---|---|---|---|---|---|---|---|---|---|
| | Net Sales | Percentage of Total | Net Sales | Percentage of Total | Net Sales | Percentage of Total | |||||||||||||
Watches | $ | 2,141,481 | 74.9 | % | $ | 1,843,909 | 71.8 | % | $ | 1,419,205 | 69.9 | % | |||||||
Leathers | 440,113 | 15.4 | 427,771 | 16.7 | 340,405 | 16.8 | |||||||||||||
Jewelry | 181,636 | 6.4 | 190,126 | 7.4 | 166,183 | 8.2 | |||||||||||||
Other | 94,278 | 3.3 | 105,496 | 4.1 | 104,897 | 5.1 | |||||||||||||
Total | $ | 2,857,508 | 100.0 | % | $ | 2,567,302 | 100.0 | % | $ | 2,030,690 | 100.0 | % | |||||||
Geographic Information
Net sales operating income and long-lived assets related to the Company’sCompany's operations in the U.S., Europe, Asia Pacific and all other international markets were as follows (in thousands):
| Fiscal Year 2011 | ||||||||
| Net Sales | Long-lived Assets | |||||||
United States | $ | 1,255,148 | $ | 209,576 | ||||
Europe | 858,452 | 158,324 | ||||||
Asia Pacific | 358,904 | 31,609 | ||||||
All other international | 94,798 | 8,011 | ||||||
|
|
|
| |||||
Consolidated | $ | 2,567,302 | $ | 407,520 | ||||
|
|
|
| |||||
| | Fiscal Year 2012 | ||||||
|---|---|---|---|---|---|---|---|
| | Net Sales | Long-term Assets | |||||
United States | $ | 1,354,337 | $ | 391,232 | |||
Europe | 880,012 | (1) | 241,766 | ||||
Asia Pacific | 448,217 | 54,150 | |||||
All other international | 174,942 | 10,729 | |||||
Consolidated | $ | 2,857,508 | $ | 697,877 | |||
| Fiscal Year 2010 | ||||||||
| Net Sales | Long-lived Assets | |||||||
United States | $ | 1,028,840 | $ | 161,472 | ||||
Europe | 670,959 | 135,087 | ||||||
Asia Pacific | 267,158 | 23,617 | ||||||
All other international | 63,733 | 6,580 | ||||||
|
|
|
| |||||
Consolidated | $ | 2,030,690 | $ | 326,756 | ||||
|
|
|
| |||||
FOSSIL, INC.
NOTES TO CONSOLIDATED FINANCIAL STATEMENTS (Continued)
18. Major Customer, Segment and Geographic Information (Continued)
92
| | Fiscal Year 2011 | ||||||
|---|---|---|---|---|---|---|---|
| | Net Sales | Long-term Assets | |||||
United States | $ | 1,255,148 | $ | 209,576 | |||
Europe | 858,452 | (1) | 158,324 | ||||
Asia Pacific | 358,904 | 31,609 | |||||
All other international | 94,798 | 8,011 | |||||
Consolidated | $ | 2,567,302 | $ | 407,520 | |||
| | Fiscal Year 2010 | ||||||
|---|---|---|---|---|---|---|---|
| | Net Sales | Long-term Assets | |||||
United States | $ | 1,028,840 | $ | 161,472 | |||
Europe | 670,959 | (1) | 135,087 | ||||
Asia Pacific | 267,158 | 23,617 | |||||
All other international | 63,733 | 6,580 | |||||
Consolidated | $ | 2,030,690 | $ | 326,756 | |||
| Fiscal Year 2009 | ||||||||
| Net Sales | Long-lived Assets | |||||||
United States | $ | 757,837 | $ | 161,636 | ||||
Europe | 563,061 | 142,234 | ||||||
Asia Pacific | 183,599 | 19,418 | ||||||
All other international | 43,596 | 6,722 | ||||||
|
|
|
| |||||
Consolidated | $ | 1,548,093 | $ | 330,010 | ||||
|
|
|
| |||||
18.19. Selected Quarterly Financial Data (Unaudited)
The following is a summary of the Company’sCompany's unaudited quarterly financial information for fiscal years 20112012 and 20102011 (in thousands, except per share data):
Fiscal Year 2011 | 1st Qtr | 2nd Qtr | 3rd Qtr | 4th Qtr | ||||||||||||
Net sales | $ | 536,975 | $ | 556,661 | $ | 642,910 | $ | 830,756 | ||||||||
Gross profit | 301,812 | 311,976 | 359,529 | 465,869 | ||||||||||||
Operating expenses | 209,256 | 225,714 | 240,720 | 291,505 | ||||||||||||
Operating income | 92,556 | 86,262 | 118,809 | 174,364 | ||||||||||||
Income before income taxes | 89,258 | 81,688 | 111,811 | 168,803 | ||||||||||||
Provision for income taxes | 31,192 | 27,657 | 39,307 | 46,001 | ||||||||||||
Net income | 58,066 | 54,031 | 72,504 | 122,802 | ||||||||||||
Net income attributable to noncontrolling interest | 2,244 | 2,670 | 2,895 | 4,891 | ||||||||||||
Net income attributable to Fossil, Inc. | 55,822 | 51,361 | 69,609 | 117,911 | ||||||||||||
Comprehensive income | 72,109 | 62,777 | 58,068 | 117,210 | ||||||||||||
Comprehensive income attributable to noncontrolling interest | 2,244 | 2,670 | 2,895 | 4,891 | ||||||||||||
Comprehensive income attributable to Fossil, Inc. | 69,865 | 60,107 | 55,173 | 112,319 | ||||||||||||
Earnings per share: | ||||||||||||||||
Basic | 0.87 | 0.81 | 1.10 | 1.88 | ||||||||||||
Diluted | 0.86 | 0.80 | 1.09 | 1.87 | ||||||||||||
Gross profit as a percentage of net sales | 56.2 | % | 56.0 | % | 55.9 | % | 56.1 | % | ||||||||
Operating expenses as a percentage of net sales | 39.0 | % | 40.5 | % | 37.4 | % | 35.1 | % | ||||||||
Operating income as a percentage of net sales | 17.2 | % | 15.5 | % | 18.5 | % | 21.0 | % | ||||||||
Fiscal Year 2012 | 1st Qtr | 2nd Qtr | 3rd Qtr | 4th Qtr | |||||||||
|---|---|---|---|---|---|---|---|---|---|---|---|---|---|
Net sales | $ | 589,533 | $ | 636,104 | $ | 684,170 | $ | 947,700 | |||||
Gross profit | 328,980 | 356,361 | 381,524 | 539,678 | |||||||||
Operating expenses | 246,119 | 268,264 | 268,437 | 334,883 | |||||||||
Operating income | 82,861 | 88,097 | 113,087 | 204,795 | |||||||||
Income before income taxes | 84,596 | 88,093 | 113,861 | 205,671 | |||||||||
Provision for income taxes | 23,524 | 27,705 | 33,984 | 52,749 | |||||||||
Net income | 61,072 | 60,388 | 79,877 | 152,922 | |||||||||
Net income attributable to noncontrolling interest | 2,932 | 3,050 | 3,086 | 1,790 | |||||||||
Net income attributable to Fossil, Inc. | 58,140 | 57,338 | 76,791 | 151,132 | |||||||||
Earnings per share: | |||||||||||||
Basic | 0.94 | 0.93 | 1.27 | 2.53 | |||||||||
Diluted | 0.93 | 0.92 | 1.26 | 2.51 | |||||||||
Gross profit as a percentage of net sales | 55.8 | % | 56.0 | % | 55.8 | % | 56.9 | % | |||||
Operating expenses as a percentage of net sales | 41.7 | % | 42.2 | % | 39.3 | % | 35.3 | % | |||||
Operating income as a percentage of net sales | 14.1 | % | 13.8 | % | 16.5 | % | 21.6 | % | |||||
FOSSIL, INC.
NOTES TO CONSOLIDATED FINANCIAL STATEMENTS (Continued)
19. Selected Quarterly Financial Data (Unaudited) (Continued)
93
Fiscal Year 2010 | 1st Qtr | 2nd Qtr | 3rd Qtr | 4th Qtr | ||||||||||||
Net sales | $ | 393,229 | $ | 412,560 | $ | 523,825 | $ | 701,076 | ||||||||
Gross profit | 219,419 | 236,885 | 298,743 | 400,118 | ||||||||||||
Operating expenses | 168,156 | 172,539 | 187,473 | 250,582 | ||||||||||||
Operating income | 51,263 | 64,346 | 111,270 | 149,536 | ||||||||||||
Income before income taxes | 53,739 | 64,524 | 111,257 | 154,690 | ||||||||||||
Provision for income taxes | 16,043 | 7,965 | 40,353 | 54,959 | ||||||||||||
Net income | 37,696 | 56,559 | 70,904 | 99,731 | ||||||||||||
Net income attributable to noncontrolling interest | 1,789 | 2,074 | 2,748 | 3,074 | ||||||||||||
Net income attributable to Fossil, Inc. | 35,907 | 54,485 | 68,156 | 96,657 | ||||||||||||
Comprehensive income | 25,496 | 43,323 | 88,705 | 92,324 | ||||||||||||
Comprehensive income attributable to noncontrolling interest | 1,780 | 2,062 | 2,764 | 3,084 | ||||||||||||
Comprehensive income attributable to Fossil, Inc. | 23,716 | 41,261 | 85,941 | 89,240 | ||||||||||||
Earnings per share: | ||||||||||||||||
Basic | 0.54 | 0.81 | 1.02 | 1.48 | ||||||||||||
Diluted | 0.53 | 0.80 | 1.00 | 1.46 | ||||||||||||
Gross profit as a percentage of net sales | 55.8 | % | 57.4 | % | 57.0 | % | 57.1 | % | ||||||||
Operating expenses as a percentage of net sales | 42.8 | % | 41.8 | % | 35.8 | % | 35.7 | % | ||||||||
Operating income as a percentage of net sales | 13.0 | % | 15.6 | % | 21.2 | % | 21.3 | % | ||||||||
Fiscal Year 2011 | 1st Qtr | 2nd Qtr | 3rd Qtr | 4th Qtr | |||||||||
|---|---|---|---|---|---|---|---|---|---|---|---|---|---|
Net sales | $ | 536,975 | $ | 556,661 | $ | 642,910 | $ | 830,756 | |||||
Gross profit | 301,812 | 311,976 | 359,529 | 465,869 | |||||||||
Operating expenses | 209,256 | 225,714 | 240,720 | 291,505 | |||||||||
Operating income | 92,556 | 86,262 | 118,809 | 174,364 | |||||||||
Income before income taxes | 89,258 | 81,688 | 111,811 | 168,803 | |||||||||
Provision for income taxes | 31,192 | 27,657 | 39,307 | 46,001 | |||||||||
Net income | 58,066 | 54,031 | 72,504 | 122,802 | |||||||||
Net income attributable to noncontrolling interest | 2,244 | 2,670 | 2,895 | 4,891 | |||||||||
Net income attributable to Fossil, Inc. | 55,822 | 51,361 | 69,609 | 117,911 | |||||||||
Earnings per share: | |||||||||||||
Basic | 0.87 | 0.81 | 1.10 | 1.88 | |||||||||
Diluted | 0.86 | 0.80 | 1.09 | 1.87 | |||||||||
Gross profit as a percentage of net sales | 56.2 | % | 56.0 | % | 55.9 | % | 56.1 | % | |||||
Operating expenses as a percentage of net sales | 39.0 | % | 40.5 | % | 37.4 | % | 35.1 | % | |||||
Operating income as a percentage of net sales | 17.2 | % | 15.5 | % | 18.5 | % | 21.0 | % | |||||
19.20. Subsequent Events
On January 10,December 31, 2012, the Company announced itpurchased substantially all of the assets of Bentrani Watches, LLC ("Bentrani"). Bentrani was a distributor of watch products in 16 Latin American countries and was based in Miami, Florida. Bentrani was the Company's largest third-party distributor and had entered into an agreement to acquire Skagen Designs, Ltd. and certainpartnered with the Company for ten years. The purchase price was $27.0 million, comprised of its international affiliates for approximately $225$19.7 million in cash subjectand $7.3 million in forgiveness of a payable to the Company.
Effective January 1, 2013, pursuant to the Framework Agreement, the Company assumed the day-to-day management of Fossil Spain. As a working capital adjustment,result of this change, the Company believes it now exercises significant control over the joint venture, and 150,000 sharesin future reporting periods, Fossil Spain will be accounted for under the consolidation method of the Company’s common stock. In addition, the sellers may receive up to 100,000 additional sharesaccounting in accordance with ASC 810,Consolidation, instead of the Company’s common stock if the Company’s net sales of Skagen-branded products exceed certain thresholds. The acquisition has cleared regulatory requirements in the U.S. and Germany, and U.K. regulatory approval is still pending. The Company anticipates receiving U.K. regulatory approval by the end of March.
Due to the limited time since these transaction dates, the initial accounting for these transactions is incomplete at this time.
Item 9. Changes in and Disagreements with Accountants on Accounting and Financial Disclosure
None.
Item 9A. Controls and Procedures
Evaluation of Disclosure Controls and Procedures
We conducted an evaluation of the effectiveness of our “disclosure"disclosure controls and procedures” (“procedures" ("Disclosure Controls”Controls"), as defined by Rules 13a-15(e) and 15d-15(e) of the Securities Exchange Act of 1934, as amended (the “Exchange Act”"Exchange Act"), as of December 31, 2011,29, 2012, the end of the period covered by this Annual Report on Form 10-K. The Disclosure Controls evaluation was done under the supervision and with the participation of management, including our Chief Executive Officer (“CEO”("CEO") and Chief Financial Officer (“CFO”("CFO"). There are inherent limitations to the effectiveness of any system of disclosure controls and procedures. Accordingly, even effective disclosure controls and procedures can only provide reasonable assurance of achieving their control objectives.
Based upon this evaluation, our CEO and CFO have concluded that our Disclosure Controls were effective at the reasonable assurance level as of December 31, 2011.29, 2012.
Management’sManagement's Report on Internal Control Over Financial Reporting
Management is responsible for establishing and maintaining adequate internal control over financial reporting, as defined in Rules 13a-15(f) and 15d-15(f) under the Exchange Act. The Company’sCompany's internal control over financial reporting is designed to provide reasonable assurance regarding the reliability of financial reporting and the preparation of the consolidated financial statements for external reporting purposes in accordance with generally accepted accounting principles.
Because of its inherent limitations, internal control over financial reporting may not prevent or detect misstatements. Also, projections of any evaluation of effectiveness of internal control over financial reporting to future periods are subject to the risk that controls may become inadequate because of changes in conditions or that the degree of compliance with the policies or procedures may deteriorate over time.
Management, including our CEO and our CFO, assessed the effectiveness of the Company’sCompany's internal control over financial reporting as of December 31, 2011.29, 2012. In making this assessment, management used the criteria set forth by the Committee of Sponsoring Organizations of the Treadway Commission inInternal Control-IntegratedControl—Integrated Framework. Based on its assessment and those criteria, management has concluded that the Company maintained effective internal control over financial reporting as of December 31, 2011.29, 2012.
Deloitte & Touche LLP, the independent registered public accounting firm that audited the Company’sCompany's consolidated financial statements included in this Annual Report on Form 10-K, has issued an attestation report on the Company’sCompany's internal control over financial reporting, which is included herein.
Changes in Internal Control over Financial Reporting
There were no changes in our internal control over financial reporting during the fourth quarter ended December 31, 201129, 2012 that materially affected, or are reasonably likely to materially affect, our internal control over financial reporting.
95
REPORT OF INDEPENDENT REGISTERED PUBLIC ACCOUNTING FIRM
To the Board of Directors and Stockholders of
Fossil, Inc.
Richardson, Texas
We have audited the internal control over financial reporting of Fossil, Inc. and subsidiaries (the “Company”"Company") as of December 31, 2011,29, 2012, based onInternal Control-IntegratedControl—Integrated Framework issued by the Committee of Sponsoring Organizations of the Treadway Commission. The Company’sCompany's management is responsible for maintaining effective internal control over financial reporting and for its assessment of the effectiveness of internal control over financial reporting, included in the accompanying Management’sManagement's Report on Internal Control over Financial Reporting. Our responsibility is to express an opinion on the Company’sCompany's internal control over financial reporting based on our audit.
We conducted our audit in accordance with the standards of the Public Company Accounting Oversight Board (United States). Those standards require that we plan and perform the audit to obtain reasonable assurance about whether effective internal control over financial reporting was maintained in all material respects. Our audit included obtaining an understanding of internal control over financial reporting, assessing the risk that a material weakness exists, testing and evaluating the design and operating effectiveness of internal control based on the assessed risk, and performing such other procedures as we considered necessary in the circumstances. We believe that our audit provides a reasonable basis for our opinion.
A company’scompany's internal control over financial reporting is a process designed by, or under the supervision of, the company’s principlecompany's principal executive and principal financial officers, or personpersons performing similar functions, and effected by the company’scompany's board of directors, management, and other personnel to provide reasonable assurance regarding the reliability of financial reporting and the preparation of financial statements for external purposes in accordance with generally accepted accounting principles. A company’scompany's internal control over financial reporting includes those policies and procedures that (1) pertain to the maintenance of records that, in reasonable detail, accurately and fairly reflect the transactions and dispositions of the assets of the company; (2) provide reasonable assurance that transactions are recorded as necessary to permit preparation of financial statements in accordance with generally accepted accounting principles, and that receipts and expenditures of the company are being made only in accordance with authorizations of management and directors of the company; and (3) provide reasonable assurance regarding prevention or timely detection of unauthorized acquisition, use, or disposition of the company’scompany's assets that could have a material effect on the financial statements.
Because of the inherent limitations of internal control over financial reporting, including the possibility of collusion or improper management override of controls, material misstatements due to error or fraud may not be prevented or detected on a timely basis. Also, projections of any evaluation of the effectiveness of the internal control over financial reporting to future periods are subject to the risk that the controls may become inadequate because of changes in conditions, or that the degree of compliance with the policies or procedures may deteriorate.
In our opinion, the Company maintained, in all material respects, effective internal control over financial reporting as of December 31, 2011,29, 2012, based on the criteria established inInternal Control-IntegratedControl—Integrated Framework issued by the Committee of Sponsoring Organizations of the Treadway Commission.
We have also audited, in accordance with the standards of the Public Company Accounting Oversight Board (United States), the consolidated financial statements and consolidated financial statement schedule as of and for the year ended December 31, 201129, 2012 of the Company and our report dated February 29, 201227, 2013 expressed an unqualified opinion on those consolidated financial statements and consolidated financial statement schedule.
/S/ DELOITTEs/DELOITTE & TOUCHETOUCHE LLP
Dallas, Texas
February 27, 2013
February 29, 2012Table of Contents
96
None.
Item 10. Directors, Executive Officers and Corporate Governance
The information under the headings “Directors"Directors and Nominees,” “Executive" "Executive Officers,” “Section" "Section 16(a) Beneficial Ownership Reporting Compliance”Compliance" and “Board"Board Committees and Meetings”Meetings" in our proxy statement to be filed with the SEC pursuant to Regulation 14A, not later than 120 days after the end of the fiscal year covered by this report, is incorporated herein by reference.
We have adopted a code of ethics that applies to all our directors and employees, including the principal executive officer, principal financial officer, principal accounting officer and controller. The full text of our Code of Conduct and Ethics is published on the Investor Relations section of our website atwww.fossil.com. We intend to disclose any future amendments to certain provisions of the Code of Conduct and Ethics, or waivers of such provisions granted to executive officers and directors, on this website within five business days following the date of any such amendment or waiver.
Item 11. Executive Compensation
The information required in response to this Item is incorporated herein by reference to our proxy statement to be filed with the SEC pursuant to Regulation 14A, not later than 120 days after the end of the fiscal year covered by this report.
Item 12. Security Ownership of Certain Beneficial Owners and Management and Related Stockholder Matters
The information required in response to this Item is incorporated herein by reference to our proxy statement to be filed with the SEC pursuant to Regulation 14A, not later than 120 days after the end of the fiscal year covered by this report.
Item 13. Certain Relationships and Related Transactions, and Director Independence
The information required in response to this Item is incorporated herein by reference to our proxy statement to be filed with the SEC pursuant to Regulation 14A, not later than 120 days after the end of the fiscal year covered by this report.
Item 14. Principal Accountant Fees and Services
The information required in response to this Item is incorporated herein by reference to our proxy statement to be filed with the SEC pursuant to Regulation 14A, not later than 120 days after the end of the fiscal year covered by this report.
97
Item 15. Exhibits and Consolidated Financial Statement Schedules
| | | Page | ||||
|---|---|---|---|---|---|---|
1. | Report of Independent Registered Public Accounting Firm | 65 | ||||
Consolidated Balance Sheets | 66 | |||||
Consolidated Statements of Comprehensive Income | 67 | |||||
Consolidated Statements of Stockholders' Equity | 68 | |||||
Consolidated Statements of Cash Flows | 69 | |||||
Notes to Consolidated Financial Statements | 70 | |||||
2. | Consolidated Financial Statement Schedule: See "Schedule II". | 113 | ||||
3. | Exhibits required to be filed by Item 601 of Regulation S-K. | 114 | ||||
The exhibits required to be filed by this Item 15 are set forth in the Exhibit Index accompanying this report.
98
SIGNATURES
Pursuant to the requirements of Section 13 or 15(d) of the Securities Exchange Act of 1934, the registrant has duly caused this report to be signed on its behalf by the undersigned, thereunto duly authorized.
February | 27, 2013 | FOSSIL, INC. | ||||
| ||||||
Kosta N. Kartsotis, | ||||||
Chairman of the Board of Directors and Chief Executive Officer | ||||||
Pursuant to the requirements of the Securities Exchange Act of 1934, this report has been signed below by the following persons on behalf of the registrant and in the capacities and on the dates indicated.
Signature | Capacity | Date | |||
|---|---|---|---|---|---|
| /s/ KOSTA N. KARTSOTIS Kosta N. Kartsotis |
|
| |||
| Chairman of the Board of Directors and Chief Executive Officer (Principal Executive Officer) | February | |||
/s/ DENNIS R. SECOR Dennis R. Secor | |||||
| Executive Vice President, Chief Financial Officer and Treasurer (Principal Financial and Accounting Officer) | February | |||
/s/ ELAINE AGATHER Elaine Agather | Director | February 27, 2013 | |||
/s/ JEFFREY N. BOYER Jeffrey N. Boyer | Director | February 27, 2013 | |||
/s/ DIANE NEAL Diane Neal | Director | February 27, 2013 | |||
/s/ THOMAS M. NEALON Thomas M. Nealon | Director | February 27, 2013 | |||
/s/ MARK D. QUICK Mark D. Quick | Director | February 27, 2013 | |||
/s/ ELYSIA HOLT RAGUSA Elysia Holt Ragusa | Director | February 27, 2013 | |||
Signature | Capacity | Date | ||
|---|---|---|---|---|
| /
Jal S. Shroff | Director | February | ||
|
| |||
|
| |||
|
| |||
|
| |||
|
| |||
James E. Skinner |
| February | ||
/s/ MICHAEL STEINBERG Michael Steinberg | Director | February 27, 2013 | ||
|
| |||
Donald J. Stone |
| February | ||
James M. Zimmerman |
| February | ||
99
FOSSIL, INC. AND SUBSIDIARIES
VALUATIONS AND QUALIFYING ACCOUNTS
Fiscal Years 2009, 2010, 2011 and 2011
2012
(in Thousands)
| Additions | Deductions | |||||||||||||||
| Balance at Beginning of Period | Charged (Credited) to Operations | Actual Returns or Writeoffs | Balance at End of Period | |||||||||||||
Classification | ||||||||||||||||
Fiscal Year 2009: | ||||||||||||||||
Account receivable allowances: | ||||||||||||||||
Sales returns | 42,232 | 59,435 | 61,664 | 40,003 | ||||||||||||
Bad debts | 13,364 | 5,906 | 3,307 | 15,963 | ||||||||||||
Deferred tax asset valuation allowance | 4,891 | 2,250 | 2,176 | 4,965 | ||||||||||||
Fiscal Year 2010: | ||||||||||||||||
Account receivable allowances: | ||||||||||||||||
Sales returns | 40,003 | 99,581 | 76,886 | 62,698 | ||||||||||||
Bad debts | 15,963 | 6,078 | 4,080 | 17,961 | ||||||||||||
Deferred tax asset valuation allowance | 4,965 | 1,501 | 2,285 | 4,181 | ||||||||||||
Fiscal Year 2011: | ||||||||||||||||
Account receivable allowances: | ||||||||||||||||
Sales returns | 62,698 | 106,828 | 107,946 | 61,580 | ||||||||||||
Bad debts | 17,961 | 4,458 | 4,178 | 18,241 | ||||||||||||
Deferred tax asset valuation allowance | 4,181 | 649 | 1,637 | 3,193 | ||||||||||||
| | | Additions | Deductions | | |||||||||
|---|---|---|---|---|---|---|---|---|---|---|---|---|---|
| | Balance at Begining of Period | Charged (Credited) to Operations | Actual Returns or Writeoffs | Balance at End of Period | |||||||||
Classification | |||||||||||||
Fiscal Year 2010: | |||||||||||||
Account receivable allowances: | |||||||||||||
Sales returns | $ | 40,003 | $ | 99,581 | $ | 76,886 | $ | 62,698 | |||||
Bad debts | 15,963 | 6,078 | 4,080 | 17,961 | |||||||||
Deferred tax asset valuation allowance | 4,965 | 1,501 | 2,285 | 4,181 | |||||||||
Fiscal Year 2011: | |||||||||||||
Account receivable allowances: | |||||||||||||
Sales returns | 62,698 | 106,828 | 107,946 | 61,580 | |||||||||
Bad debts | 17,961 | 4,458 | 4,178 | 18,241 | |||||||||
Deferred tax asset valuation allowance | 4,181 | 649 | 1,637 | 3,193 | |||||||||
Fiscal Year 2012: | |||||||||||||
Account receivable allowances: | |||||||||||||
Sales returns | 61,580 | 119,106 | 115,430 | 65,256 | |||||||||
Bad debts | 18,241 | 848 | 1,983 | 17,106 | |||||||||
Deferred tax asset valuation allowance | 3,193 | 3,114 | 544 | 5,763 | |||||||||
100
101
|
| |
102
|
| |
103
|
| |
104