
UNITED STATES SECURITIES AND EXCHANGE COMMISSION
WASHINGTON, D.C. 20549
FORM 10-K
(Mark One)
| þ | ANNUAL REPORT PURSUANT TO SECTION 13 OR 15(d) OF THE SECURITIES EXCHANGE ACT OF 1934 |
| FOR THE FISCAL YEAR ENDED DECEMBER 31, |
| ¨ | TRANSITION REPORT PURSUANT TO SECTION 13 OR 15(d) OF THE SECURITIES EXCHANGE ACT OF 1934 |
| FOR THE TRANSITION PERIOD FROM TO |
COMMISSION FILE NUMBER: 001-33776
ABITIBIBOWATERRESOLUTE FOREST PRODUCTS INC.
(Exact name of registrant as specified in its charter)
Delaware | 98-0526415 | |||
| (I.R.S. employer identification number) |
111 Duke Street, Suite 5000; Montreal, Quebec; Canada H3C 2MI
2M1
(Address of principal executive offices) (Zip Code)
(514) 875-2515
(Registrant’s telephone number, including area code)
Securities registered pursuant to Section 12(b) of the Act:
Common Stock, par value $.001 per share | New York Stock Exchange Toronto Stock Exchange | |||
| (Name of exchange on which registered) |
Securities registered pursuant to Section 12(g) of the Act: None
Indicate by check mark if the registrant is a well-known seasoned issuer, as defined in Rule 405 of the Securities
Act. Yes þ No ¨
Indicate by check mark if the registrant is not required to file reports pursuant to Section 13 or Section 15(d) of the Act. Yes ¨ No þ
Indicate by check mark whether the registrant (1) has filed all reports required to be filed by Section 13 or 15(d) of the Securities Exchange Act of 1934 during the preceding 12 months (or for such shorter period that the registrant was required to file such reports), and (2) has been subject to such filing requirements for the past 90 days. Yes þ No ¨
Indicate by check mark whether the registrant has submitted electronically and posted on its corporate Website, if any, every Interactive Data File required to be submitted and posted pursuant to Rule 405 of Regulation S-T (§232.405 of this chapter) during the preceding 12 months (or for such shorter period that the registrant was required to submit and post such files). Yes þ No ¨
Indicate by check mark if disclosure of delinquent filers pursuant to Item 405 of Regulation S-K (§229.405 of this chapter) is not contained herein, and will not be contained, to the best of the registrant’s knowledge, in definitive proxy or information statements incorporated by reference in Part III of this Form 10-K or any amendment to this
Form 10-K.¨þ
Indicate by check mark whether the registrant is a large accelerated filer, an accelerated filer, a non-accelerated filer, or a smaller reporting company. See the definitions of “large accelerated filer,” “accelerated filer” and “smaller reporting company” in Rule 12b-2 of the Exchange Act.
Large accelerated filer þ | Accelerated filer ¨ | Non-accelerated filer ¨ | Smaller reporting company ¨ | |||
| (Do not check if a smaller reporting company) |
Indicate by check mark whether the registrant is a shell company (as defined in Rule 12b-2 of the Act). Yes¨ Noþ
The aggregate market value of the registrant’s common stock held by non-affiliates of the registrant as of the last business day of the registrant’s most recently completed second fiscal quarter (June 30, 2011)29, 2012) was approximately $1.2 billion.$639 million. For purposes of the foregoing calculation only, all directors, executive officers and 5% beneficial owners have been deemed affiliates.
Indicate by check mark whether the registrant has filed all documents and reports required to be filed pursuant toby Section 12, 13 or 15(d) of the Securities Exchange Act of 1934 subsequent to the distribution of securities under a plan confirmed by a court. Yes þ No ¨
As of January 31, 2012,2013, there were 97,092,38294,754,031 shares of AbitibiBowaterResolute Forest Products Inc. common stock outstanding.
DOCUMENTS INCORPORATED BY REFERENCE
Portions of the registrant’s definitive proxy statement to be filed within 120 days of December 31, 20112012 are incorporated by reference in this Annual Report on Form 10-K in response to Part III, Items 10, 11, 12, 13 and 14.
Item 1. | 1 | |||||||
Item 1A. | ||||||||
Item 1B. | ||||||||
Item 2. | ||||||||
Item 3. | ||||||||
Item 4. | ||||||||
Item 5. | ||||||||
Item 6. | ||||||||
Item 7. | Management’s Discussion and Analysis of Financial Condition and Results of Operations | |||||||
Item 7A. | ||||||||
Item 8. | ||||||||
Item 9. | Changes in and Disagreements With Accountants on Accounting and Financial Disclosure | |||||||
Item 9A. | ||||||||
Item 9B. | ||||||||
Item 10. | ||||||||
Item 11. | ||||||||
Item 12. | Security Ownership of Certain Beneficial Owners and Management and Related Stockholder Matters | |||||||
Item 13. | Certain Relationships and Related Transactions, and Director Independence | |||||||
Item 14. | ||||||||
Item 15. | ||||||||
CAUTIONARY STATEMENTS REGARDING FORWARD-LOOKING INFORMATION AND USE OF
THIRD-PARTY DATA
Statements in this Annual Report on Form 10-K (“Form 10-K”) that are not reported financial results or other historical information of AbitibiBowaterResolute Forest Products Inc. (with its subsidiaries and affiliates, either individually or collectively, unless otherwise indicated, referred to as “AbitibiBowater,“Resolute Forest Products,” “we,” “our,” “us” or the “Company”) are “forward-looking statements” within the meaning of the Private Securities Litigation Reform Act of 1995. They include, for example, statements relating to our:to: our efforts to continue to reduce costs and increase revenues and profitability, including our cost reduction initiatives regarding selling, general and administrative (“SG&A”) expenses;initiatives; our business outlook; our assessment of market conditions; our liquidity outlook,outlook; our prospects, growth strategies and the industry in which we operate; and strategies for achieving our goals generally, including the strategies described in Part II, Item 7, “Management’s Discussion and Analysis of Financial Condition and Results of Operations – Our Business, Strategy and Outlook,” of this Form 10-K.10-K; and the industry in which we operate. Forward-looking statements may be identified by the use of forward-looking terminology such as the words “should,” “would,” “could,” “will,” “may,” “expect,” “believe,” “anticipate,” “attempt,” “project” and other terms with similar meaning indicating possible future events or potential impact on our business or AbitibiBowater’s shareholders.
The reader is cautioned not to place undue reliance on these forward-looking statements, which are not guarantees of future performance. These statements are based on management’s current assumptions, beliefs and expectations, all of which involve a number of business risks and uncertainties that could cause actual results to differ materially. The potential risks and uncertainties that could cause our actual future financial condition, results of operations and performance to differ materially from those expressed or implied in this Form 10-K include those set forththe risks described in Part I, Item 1A, “Risk Factors.”
All forward-looking statements in this Form 10-K are expressly qualified by the cautionary statements contained or referred to in this section and in our other filings with the United States Securities and Exchange Commission (the “SEC”) and the Canadian securities regulatory authorities. We disclaim any obligation to publicly update or revise any forward-looking information, whether as a result of new information, future events or otherwise, except as required by law.
Market and Industry Data
InformationCertain information about industry or general economic conditions contained in this Form 10-K is derived from third-party sources and certain trade publications (“Third-Party Data”) that we believe are widely accepted and accurate; however, we have not independently verified this information and cannot provide assurances of its accuracy.
We are a global leader in the forest products industry, with a diverse range of products, including newsprint, commercial printing papers, market pulp and wood products, which are marketed in close to 9080 countries. We own or operate 18over 40 pulp and paper mills and 23 wood products facilities in the United States, Canada and South Korea.Korea, and power generation assets in Quebec, Canada.
AbitibiBowater Inc. is a Delaware corporation incorporated on January 25, 2007. On October 29, 2007, Abitibi-Consolidated Inc. (“Abitibi”) and Bowater Incorporated (“Bowater”) combined in a merger of equals (the “Combination”) with each becoming a subsidiary of AbitibiBowater Inc., a Delaware corporation incorporated on January 25, 2007. On November 7, 2011, AbitibiBowater Inc. began doing business as Resolute Forest Products. We expect atAt the 2012 annual meeting of shareholders on May 23, 2012, the shareholders approved an amendment to seek shareholder approval to amend our certificate of incorporation to change our legalcorporate name from AbitibiBowater Inc. to Resolute Forest Products Inc. Our, effective May 24, 2012. The ticker symbol for our common stock began trading under the symbolwas changed from “ABH” to “RFP” on both the New York Stock Exchange (the “NYSE”) on May 24, 2012 and on the Toronto Stock Exchange (the “TSX”) on December 10, 2010.May 28, 2012.
Executive Officers
The following is information about our executive officers as of February 29, 2012:March 1, 2013:
| Name | Age | Position | Officer Since | Age | Position | Officer Since | ||||||||
Richard Garneau | 64 | President and Chief Executive Officer | 2011 | 65 | President and Chief Executive Officer | 2011 | ||||||||
Alain Boivin | 61 | Senior Vice President, Pulp and Paper Operations | 2011 | 62 | Senior Vice President, Pulp and Paper Operations | 2011 | ||||||||
Pierre Laberge | 55 | Senior Vice President, Human Resources and Public Affairs | 2011 | 56 | Senior Vice President, Human Resources | 2011 | ||||||||
John Lafave | 47 | Senior Vice President, Pulp and Paper Sales and Marketing | 2011 | 48 | Senior Vice President, Pulp and Paper Sales and Marketing | 2011 | ||||||||
Yves Laflamme | 55 | Senior Vice President, Wood Products, Global Supply Chain, Procurement and Information Technology | 2007 | 56 | Senior Vice President, Wood Products, Procurement and Information Technology | 2007 | ||||||||
Jo-Ann Longworth | 51 | Senior Vice President and Chief Financial Officer | 2011 | 52 | Senior Vice President and Chief Financial Officer | 2011 | ||||||||
Jacques P. Vachon | 52 | Senior Vice President and Chief Legal Officer | 2007 | 53 | Senior Vice President, Corporate Affairs and Chief Legal Officer | 2007 | ||||||||
Mr. Garneau joined the Board of Directors in June 2010. Previously, Mr. Garneau served as President and Chief Executive Officer of Catalyst Paper Corporation from March 2007 to May 2010. Prior to his tenure at Catalyst, Mr. Garneau served as Executive Vice President, Operations at Domtar Corporation. He also held a variety of roles at Norampac Inc. (a divisionjoint-venture of Domtar Inc. and Cascades Inc.), Copernic Inc., Future Electronics Inc., St. Laurent Paperboard Inc., Finlay Forest Industries Inc. and Donohue Inc. Mr. Garneau is a member of the Canadian Institute of Chartered Accountants.
Mr. Boivin previously served as Vice President of Mill Operations at Smurfit-Stone Container Corporation and as a Vice President at Smurfit-Stone since 2000. He was Senior Vice President, Containerboard Operations for St. Laurent Paperboard Inc. from 1999 to 2000 and was Mill Manager at a number of operations for Donohue Inc. and Avenor Inc.
Mr. Laberge previously served as Senior Vice President, Human Resources and Public Affairs from June 2011 to February 2012 and as Vice President, Human Resources for our Canadian operations.operations from January 2011 to May 2011. He joined a predecessor of the CompanyDonohue Inc. in 1988. As of March 1, 2012, Mr. Laberge will serve as Senior Vice President, Human Resources.
Mr. Lafave previously served as Vice President Sales, National Accounts – Paper Sales, and as Vice President Sales, National Accounts – Newsprint, and Vice President Sales, Commercial Printers of Abitibi from 2004 to 2009. He held progressive positions in sales with UPM-Kymmene and Repap Enterprises.
Mr. Laflamme previously served as Senior Vice President, Wood Products from October 2007 to January 2011, as Senior Vice President, Woodlands and Sawmills of Abitibi from 2006 to October 2007, and as Vice President, Sales, Marketing and Value-Added Wood Products Operations of Abitibi from 2004 to 2005.
Ms. Longworth previously served as Special Advisor to the President and Chief Executive Officer, focusing on special mandates, from July 4, 2011 to August 31, 2011. She served as Senior Vice President and Chief Accounting Officer with World Color Inc. (formerly Quebecor World Inc.) from 2008 to 2010, as Chief Financial Officer with Skyservice Inc. from 2007 to 2008, as Vice President and Controller with Novelis, Inc. from 2005 to 2006, and held a number of financial and operational roles over a 16-year career with Alcan Inc.
Mr. Vachon previously served as Senior Vice President and Chief Legal Officer from January 2011 to February 2012, as Senior Vice President, Corporate Affairs and Chief Legal Officer from October 2007 to January 2011, and as Senior Vice President, Corporate Affairs and Secretary of Abitibi from 1997 to October 2007. As of March 1, 2012, Mr. Vachon will serve as Senior Vice President, Corporate Affairs and Chief Legal Officer.
Our Products
We manage our business based on the products we manufacture. Accordingly, our reportable segments correspond to our primary product lines: newsprint, coated papers, specialty papers, market pulp and wood products. Certain segment and geographical financial information, including sales by segment and by geographic area, operating income (loss) by segment total assets by segment and long-lived assets by geographic area, can be found in Note 25,24, “Segment Information,” to our consolidated financial statements and related notes (“Consolidated Financial Statements”) appearing in Part II, Item 8, “Financial Statements and Supplementary Data,” of this Form 10-K.10-K (“Item 8”).
In accordance with our values, our environmental vision statement and forestry policies and in the interests of our customers and other stakeholders, we are committed to implementing and maintaining environmental management systems at our pulp, paper, woodlands and wood procurement operations to promote the conservation and sustainable use of forests and other natural resources. We and other member companies of the Forest Products Association of Canada, as well as a number of environmental organizations, are partners in the Canadian Boreal Forest Agreement. The group works to identify solutions to conservation issues that meet the goal of balancing equally the three pillars of sustainability linked to human activities: economic, social and environmental. We are also a member of the World Wildlife Fund’s Climate Savers program, in which businesses establish ambitious targets to voluntarily reduce greenhouse gas emissions and work aggressively toward achieving them.
Newsprint
We produce newsprint at 1110 facilities in North America and one facility in South Korea. We are the largest producer of newsprint in the world by capacity, with total capacity of approximately 3.1 million metric tons, or approximately 9% of total worldwide capacity. We are also the largest North American producer of newsprint, with total North American capacity of approximately 2.9 million metric tons, or approximately 36%39% of total North American capacity.
We distribute newsprint by rail, truck and ship; it is sold to North American customers directly by our regional sales offices. Export markets are serviced primarily through our international offices located in or near the markets we supply or through international agents. In 2011,2012, approximately 45%41% of our total newsprint shipments were to markets outside of North America.
We sell newsprint to various joint venture partners (partners with us in the ownership of certain mills we operate). During 2011,2012, these joint venture partners purchased approximately 400,000382,000 metric tons from our consolidated entities, which represented approximately 15% of the total newsprint metric tons we sold in 2011.2012.
Coated papers
We produce coated mechanical papers at our Catawba, South Carolina facility. We are one of the largest producers of coated mechanical papers in North America, with total capacity of approximately 616,000645,000 metric tons, or approximately 16%19% of total North American capacity. Our coated papers are used in magazines, catalogs, books, retail advertising, direct mail and coupons.
We sell coated papers to major commercial printers, publishers, catalogers and retailers. We distribute coated papers by truck, rail and ship. Most of our coated paper production is sold within North America and serviced directly by our regional sales offices. Export markets are serviced primarily through international agents.
Specialty papers
We produce specialty papers at eight facilities in North America. We are the largest producer of specialty papers in North America by capacity, including supercalendered, superbright, high bright, bulky book and directory papers, with total capacity of approximately 1.41.3 million metric tons, or approximately 31%29% of total North American capacity. Our specialty papers are used in books, retail advertising, direct mail, coupons and other commercial printing applications.
We sell specialty papers to major commercial printers, direct mailers, publishers, catalogers and retailers. We distribute specialty papers by truck, rail and ship. Most of our specialty paper production is sold within North America and serviced directly by our regional sales offices. Export markets are serviced primarily through international agents.
We sell specialty papers to various joint venture partners (partners with us in the ownership of certain mills we operate). During 2011,2012, these joint venture partners purchased approximately 25,00037,000 short tons from our consolidated entities, which represented approximately 1%3% of the total specialty papers short tons we sold in 2011.2012.
Market pulp
Wood pulp is the most commonly used material to make paper. Pulp shipped and sold as pulp, as opposed to being processednot converted into paper in one of our facilities, is referred tosold as market pulp. We produce market pulp at fiveeight facilities in North America, with total capacity of approximately 1.11.7 million metric tons, or approximately 6%10% of total North American capacity. Market pulp is used to make a range of consumer products including tissue, packaging, specialty paper products, diapers and other absorbent products.
North American market pulp sales are made through our regional sales offices, while export sales are made through international sales agents local to their markets. We distribute market pulp by truck, rail and ship.
On December 15, 2011,In 2012, we announced an offer to purchasepurchased all of the issued and outstanding shares of Fibrek Inc. (“Fibrek”), a producer and marketer of virgin and recycled kraft pulp, with a combined annual production capacity of approximately 760,000 metric tons.operating three mills. For additional information, see Part II, Item 7, “Management’s Discussion and Analysis of Financial Condition and Results of Operations,” of this Form 10-K (“Item 7”) under “Business Strategy and Outlook – Strategic opportunities.”.
Wood products
We operate 1816 sawmills in Canada that produce construction-grade lumber sold in North America. In addition, our sawmills are a major source of wood chips for our pulp and paper mills. We also operate two engineered wood products facilities in Canada that produce I-joists and three remanufacturing wood products facilities in Canada that produce bed frame components, finger joints and furring strips.
For additional information on our corporate strategy, see “Our Business” under Item 7.
Pulp and paper manufacturing facilities
The following table provides a listing of the pulp and paper manufacturing facilities and the number of paper machines we owned or operated as of December 31, 20112012 (excluding facilities and paper machines which have been permanently closed as of December 31, 2011)2012) and production information by product line (which represents all of our reportable segments except wood products). The table below represents these facilities’ actual 20112012 production, which reflects the impact of any downtime taken in 2011,2012, and 2012expected 2013 capacity.
| Number | 2012 | 2011 | 2011 Production by Product Line | Number | 2013 | 2012 | 2012 Production by Product Line | |||||||||||||||||||||||||||||||||||||||||||||||||
| (In 000s of metric tons) | of Paper Machines | Total Capacity | Total Production | Newsprint | Coated Papers | Specialty Papers | Market Pulp | of Paper Machines | Total Capacity | Total Production | Newsprint | Coated Papers | Specialty Papers | Market Pulp | ||||||||||||||||||||||||||||||||||||||||||
Canada | ||||||||||||||||||||||||||||||||||||||||||||||||||||||||
Alma, Quebec | 3 | 370 | 351 | – | – | 351 | – | 3 | 368 | 348 | – | – | 348 | – | ||||||||||||||||||||||||||||||||||||||||||
Amos, Quebec | 1 | 193 | 194 | 194 | – | – | – | 1 | 200 | 165 | 165 | – | – | – | ||||||||||||||||||||||||||||||||||||||||||
Baie-Comeau, Quebec | 3 | 443 | 432 | 432 | – | – | – | 3 | 461 | 435 | 435 | – | – | – | ||||||||||||||||||||||||||||||||||||||||||
Clermont, Quebec(1) | 2 | 345 | 298 | 298 | – | – | – | 2 | 345 | 305 | 305 | – | – | – | ||||||||||||||||||||||||||||||||||||||||||
Fort Frances, Ontario | 2 | 254 | 229 | – | – | 171 | 58 | |||||||||||||||||||||||||||||||||||||||||||||||||
Dolbeau, Quebec(2) | 1 | 138 | 26 | – | – | 26 | – | |||||||||||||||||||||||||||||||||||||||||||||||||
Fort Frances, Ontario(3) | 2 | 112 | 177 | – | – | 146 | 31 | |||||||||||||||||||||||||||||||||||||||||||||||||
Gatineau, Quebec(4) | 1 | 110 | – | – | – | – | – | |||||||||||||||||||||||||||||||||||||||||||||||||
Iroquois Falls, Ontario | 2 | 251 | 244 | 214 | – | 30 | – | 2 | 263 | 221 | 194 | – | 27 | – | ||||||||||||||||||||||||||||||||||||||||||
Kenogami, Quebec | 1 | 143 | 137 | – | – | 137 | – | 1 | 139 | 134 | – | – | 134 | – | ||||||||||||||||||||||||||||||||||||||||||
Laurentide, Quebec | 2 | 329 | 323 | – | – | 323 | – | 1 | 226 | 195 | – | – | 195 | – | ||||||||||||||||||||||||||||||||||||||||||
Liverpool, Nova Scotia(2) | 2 | 230 | 224 | 216 | – | 8 | – | |||||||||||||||||||||||||||||||||||||||||||||||||
Saint-Félicien, Quebec(5) | – | 356 | 170 | – | – | – | 170 | |||||||||||||||||||||||||||||||||||||||||||||||||
Thorold, Ontario | 1 | 199 | 196 | 196 | – | – | – | 1 | 202 | 145 | 145 | – | – | – | ||||||||||||||||||||||||||||||||||||||||||
Thunder Bay, Ontario | 1 | 574 | 514 | 216 | – | – | 298 | 1 | 566 | 523 | 213 | – | – | 310 | ||||||||||||||||||||||||||||||||||||||||||
United States | ||||||||||||||||||||||||||||||||||||||||||||||||||||||||
Augusta, Georgia(3) | 2 | 401 | 390 | 390 | – | – | – | |||||||||||||||||||||||||||||||||||||||||||||||||
Calhoun, Tennessee(4) | 3 | 655 | 640 | 118 | – | 394 | 128 | |||||||||||||||||||||||||||||||||||||||||||||||||
Catawba, South Carolina | 3 | 865 | 845 | – | 610 | 22 | 213 | |||||||||||||||||||||||||||||||||||||||||||||||||
Augusta, Georgia | 2 | 401 | 369 | 369 | – | – | – | |||||||||||||||||||||||||||||||||||||||||||||||||
Calhoun, Tennessee (6) | 3 | 660 | 636 | 180 | – | 324 | 132 | |||||||||||||||||||||||||||||||||||||||||||||||||
Catawba, South Carolina(7) | 3 | 871 | 771 | – | 533 | 18 | 220 | |||||||||||||||||||||||||||||||||||||||||||||||||
Coosa Pines, Alabama | – | 272 | 250 | – | – | – | 250 | – | 273 | 203 | – | – | – | 203 | ||||||||||||||||||||||||||||||||||||||||||
Fairmont, West Virginia(5) | – | 218 | 109 | – | – | – | 109 | |||||||||||||||||||||||||||||||||||||||||||||||||
Grenada, Mississippi | 1 | 247 | 240 | 240 | – | – | – | 1 | 246 | 241 | 241 | – | – | – | ||||||||||||||||||||||||||||||||||||||||||
Usk, Washington(5) | 1 | 244 | 240 | 240 | – | – | – | |||||||||||||||||||||||||||||||||||||||||||||||||
Menominee, Michigan(5) | – | 178 | 101 | – | – | – | 101 | |||||||||||||||||||||||||||||||||||||||||||||||||
Usk, Washington(8) | 1 | 243 | 239 | 239 | – | – | – | |||||||||||||||||||||||||||||||||||||||||||||||||
South Korea | ||||||||||||||||||||||||||||||||||||||||||||||||||||||||
Mokpo, South Korea | 1 | 200 | 219 | 219 | – | – | – | 1 | 200 | 198 | 198 | – | – | – | ||||||||||||||||||||||||||||||||||||||||||
| 31 | 6,215 | 5,966 | 2,973 | 610 | 1,436 | 947 | 30 | 6,776 | 5,711 | 2,684 | 533 | 1,218 | 1,276 | |||||||||||||||||||||||||||||||||||||||||||
| (1) | Donohue Malbaie Inc. (“DMI”), which owns one of Clermont’s paper machines, is owned 51% by us and 49% by NYT Capital Inc. We manage the facility and wholly own all of the other assets at the site. Manufacturing costs are transferred between us and DMI at agreed-upon transfer costs. DMI’s paper machine produced |
| (2) |
|
| (3) | On November 20, 2012, we announced the indefinite idling of the kraft mill and a paper machine at our Fort Frances facility, effective December 4, 2012 and December 10, 2012, respectively (representing approximately 200,000 metric tons of pulp capacity and approximately 105,000 metric tons of specialty papers capacity). The pulp production listed represents pulp sold to third parties. |
| (4) | Our Gatineau facility, which was closed in 2010, is |
| (5) | On May 2, 2012, we acquired Fibrek, which owns the Saint-Félicien, Fairmont and |
|
Calhoun Newsprint Company (“CNC”), which owns one of Calhoun’s paper machines, Calhoun’s recycled fiber plant and a portion of the thermomechanical pulp (“TMP”) mill, is owned 51% by us and 49% by Herald Company, Inc. We manage the facility and wholly own all of the other assets at the site, including the remaining portion of the TMP mill, a kraft pulp mill, a market pulp dryer, |
On June 23, 2012, we announced the indeterminate idling of a paper machine at our Catawba facility, effective June 30, 2012 (representing approximately 132,000 metric tons of capacity). |
| (8) | Ponderay Newsprint Company is located in Usk, Washington and is an unconsolidated partnership in which we have a 40% interest and, through a wholly-owned subsidiary, we are the managing partner. The balance of the partnership is held by |
Wood products facilities
The following table provides a listing of the sawmills we owned or operated as of December 31, 20112012 and their respective 2012expected 2013 capacity and 20112012 production. Our harvesting rights in Quebec are not sufficient to operate our sawmills at their total capacity. This table excludes facilities which have been permanently closed as of December 31, 2011.2012.
| (In million board feet) | 2012 Total Capacity | 2011 Total Production | 2013 Total Capacity | 2012 Total Production | ||||||||||||||
Comtois, Quebec | 145 | 50 | 145 | 28 | ||||||||||||||
Girardville-Normandin, Quebec | 208 | 189 | 218 | 178 | ||||||||||||||
La Dore, Quebec | 183 | 183 | ||||||||||||||||
La Doré, Quebec | 185 | 185 | ||||||||||||||||
La Tuque, Quebec (1) | 200 | 108 | 200 | 115 | ||||||||||||||
Maniwaki, Quebec | 160 | 125 | 160 | 59 | ||||||||||||||
Mistassini, Quebec | 175 | 167 | 175 | 166 | ||||||||||||||
Oakhill, Nova Scotia(2) | 152 | 97 | ||||||||||||||||
Obedjiwan, Quebec (3) | 30 | 20 | ||||||||||||||||
Petit Saguenay, Quebec(4) | 27 | – | ||||||||||||||||
Obedjiwan, Quebec (2) | 30 | 16 | ||||||||||||||||
Pointe-aux-Outardes, Quebec | 175 | 26 | 175 | 36 | ||||||||||||||
Roberval, Quebec | 143 | 21 | 143 | 9 | ||||||||||||||
Saint-Felicien, Quebec | 160 | 135 | ||||||||||||||||
Saint-Fulgence, Quebec(4) | 167 | 26 | ||||||||||||||||
Saint-Félicien, Quebec | 160 | 126 | ||||||||||||||||
Saint-Fulgence, Quebec | 167 | 26 | ||||||||||||||||
Saint-Hilarion, Quebec | 85 | 22 | 85 | 19 | ||||||||||||||
Saint-Ludger-de-Milot, Quebec (5) | 135 | 95 | ||||||||||||||||
Saint-Ludger-de-Milot, Quebec (3) | 135 | 97 | ||||||||||||||||
Saint-Thomas, Quebec | 110 | 78 | 110 | 74 | ||||||||||||||
Senneterre, Quebec | 155 | 104 | 155 | 118 | ||||||||||||||
Thunder Bay, Ontario | 300 | 237 | 300 | 256 | ||||||||||||||
| 2,710 | 1,683 | 2,543 | 1,508 | |||||||||||||||
| (1) | Forest Products Mauricie L.P. is located in La Tuque, Quebec and is a consolidated subsidiary in which we have a 93.2% interest. The amounts in the above table represent the mill’s total capacity and production. |
| (2) |
|
Societe en Commandite Scierie Opitciwan is located in Obedjiwan, Quebec and is an unconsolidated entity in which we have a 45% interest. The amounts in the above table represent the mill’s total capacity and production. |
|
Produits Forestiers Petit-Paris Inc. is located in Saint-Ludger-de-Milot, Quebec and is an unconsolidated entity in which we have a 50% interest. The amounts in the above table represent the mill’s total capacity and production. |
The following table provides a listing of the remanufacturing and engineered wood products facilities we owned or operated as of December 31, 20112012 and their respective 2012expected 2013 capacity and 20112012 production.
| (In million board feet, except where otherwise stated) | 2012 Total Capacity | 2011 Total Production | 2013 Total Capacity | 2012 Total Production | ||||||||||||||
Remanufacturing Wood Products Facilities | ||||||||||||||||||
Chateau-Richer, Quebec | 63 | 47 | 63 | 48 | ||||||||||||||
La Dore, Quebec | 15 | 20 | ||||||||||||||||
La Doré, Quebec | 15 | 22 | ||||||||||||||||
Manseau, Quebec | 20 | 7 | 20 | 12 | ||||||||||||||
Total Remanufacturing Wood Facilities | 98 | 74 | 98 | 82 | ||||||||||||||
Engineered Wood Products Facilities | ||||||||||||||||||
Larouche and Saint-Prime, Quebec (million linear feet) | 145 | 67 | 145 | 85 | ||||||||||||||
| (1) | Our Manseau facility will be permanently closed in the first quarter of 2013. |
| (2) | Abitibi-LP Engineered Wood Inc. and Abitibi-LP Engineered Wood II Inc. are located in Larouche, Quebec and Saint-Prime, Quebec, respectively, and are unconsolidated entities in which we have a 50% interest in each entity. We operate the facilities and our joint venture partners sell the products. The amounts in the above table represent the mills’ total capacity and production. |
On October 12, 2006, an agreement regarding Canada’s softwood lumber exports to the U.S. became effective (the “2006 Softwood Lumber Agreement”). The 2006 Softwood Lumber Agreement provides for, among other things, softwood lumber to be subject to one of two ongoing border restrictions, depending upon the province of first manufacture with several provinces including Nova Scotia, being exempt from these border restrictions. Volume quotas have been established for each company within the provinces of Ontario and Quebec based on historical production, and the volume quotas are not transferable between provinces. Quota volume restrictions are lifted if U.S. composite prices would have to rise above $355 composite per thousand board feet before the quota volume restrictions would be lifted, which had not occurred since the implementation of the 2006 Softwood Lumber Agreement.feet. On January 23, 2012, Canada and the U.S. announced a two-year extension to the 2006 Softwood Lumber Agreement, through October 2015. For information regarding lumber duties, see Note 20, “Commitments and Contingencies – Lumber duties,” to our Consolidated Financial Statements.
Other products
We also sell pulpwood, saw timber and wood chips to customers located in Canada and the United States. Sales of these other products are considered a recovery of the cost of manufacturing our primary products.
Raw Materials
Our operations consume substantial amounts of raw materials such as wood, recovered paper, chemicals and energy in the manufacturing of our paper, pulp and wood products. We purchase raw materials and energy sources (except internal generation) primarily on the open market.
Wood
Our sources of wood include property we own or lease, property on which we possess harvesting rights and purchases from local producers, including sawmills that supply residual wood chips. As of December 31, 2011,2012, we owned or leased approximately 0.70.1 million acres of timberlands, primarily in Canada, and have long-term harvesting rights for approximately 35.236.2 million acres of Crown-owned land in Canada. These sources provide approximately halfone third of ourthe wood fiber supplies to our paper, pulp and wood products operations. The harvesting rights contracts are approximately 20 – 25 years in length and automatically renew every five years, contingent upon our continual compliance with environmental performance and reforestation requirements. New legislation in the province of Quebec provides that a portion of the harvesting rights allocated to harvesters, including us, will be subject to an auction system that will be fully implemented in April 2013.
All of our managed forest lands are third-party certified to one or more globally recognized sustainable forest management standards, including those of the Sustainable Forestry Initiative (the “SFI”), Canadian Standards Association (the “CSA”) and Forest Stewardship Council (the “FSC”). We have implemented fiber tracking systems at our mills to ensure that our wood fiber supply comes from acceptable sources such as certified forests and legal harvesting operations. At several of our mills, theseThese systems are third-party certified at all of our mills to recognize chain of custody standards, with the exception of one mill, which is expected to be certified by the second quarter of 2013.
In Quebec and others areOntario, our volume allocated on Crown land is limited by the Annual Allowable Cut. This overall level of harvest is revised on a regular basis, typically every five years. In December 2006, the Chief Forester of the province of Quebec confirmed a reduction of 23.8% below 2004 levels for the period 2008 to 2013. In August 2011, the Quebec Chief Forester announced an interim estimate reduction of 10.3% in the process of being certified.Annual Allowable Cut for 2013 – 2014. A final assessment is expected in 2013.
We strive to improve our forest management and wood fiber procurement practices and we encourage our wood and fiber suppliers to demonstrate continual improvement in forest resource management, wood and fiber procurement and third-party certification.
Recovered paper
We are one of the largest recyclers of newspapers and magazines in North America and have a number of recycling plants that use advanced mechanical and chemical processes to manufacture high quality pulp from a mixture of old newspapers, old magazines and magazines,sorted office paper, or “recovered paper.” Using recovered paper, we produce, among other things, recycled fiber newsprint and uncoated specialty papers comparable in quality to paper produced with 100% virgin fiber pulp. The Thorold and Mokpo newsprint operations, and the Menominee and Fairmont pulp operations, produce products containing 100% recycled fiber. In 2011,2012, we used 0.9 million metric tons of recovered paper in our production processes and the recycled fiber content in the newsprint we produced averaged 20%17%.
In 2011,2012, we collected or purchased 1.2 million metric tons of recovered paper. Our Paper Retriever® and ecorewards® programs collect recovered fiber through a combination of community drop-off containers and recycling programs with businesses and commercial offices. The recovered paper that we physically purchase is from suppliers generally within the region of our recycling plants, primarily under long-term agreements.
Energy
Steam and electrical power constitute the primary forms of energy used in pulp and paper production. Process steam is produced in boilers using a variety of fuel sources, as well as heat recovery units in mechanical pulp facilities. All but two of our mills produced 100% of their own steam requirements. In 2011,2012, our Alma, Calhoun, Catawba, Coosa Pines, Dolbeau, Fort Frances, Kenogami, Saint-Félicien and Thunder Bay operations collectively consumed approximately 33%37% of their electrical requirements from internal sources, notably on-site cogeneration and hydroelectric stations.dams. The balance of our energy needs was purchased from third parties. We have sixseven sites that operate cogeneration facilities and all of these sites generate “green energy” from carbon-neutral biomass. In addition, we utilize alternative fuels such as methane from landfills, used oil, tire-derived fuel and black liquor to reduce consumption of virgin fossil fuels.
As of December 31, 2011,2012, we had one hydroelectric facility (Hydro Saguenay, Quebec), which consisted of seven installationsdams with capacity of 162170 MW and generation of 1,1221,120 GWh. The water rights agreements required to operate these installationsdams typically range from 10 to 50 years and are generally renewable, under certain conditions, for additional terms. In certain circumstances, water rights are granted without expiration dates. In some cases, the agreements are contingent on the continued operation of the related paper mill and a minimum level of capital spending in the region. The province of Quebec informed us on December 30, 2011 that it intended not to terminate one of these agreementsrenew our water rights associated with our Jim-Gray hydroelectric dam and to require us to transfer property of the associated installationproperty to the province for no consideration. The termination andOn February 6, 2013, the province of Quebec granted us an extension to transfer the property. As extended, an agreement on the terms of the transfer would need to be effective as of March 2, 2012.entered into at the latest on June 14, 2013. The province’s actions are not consistent withcontrary to our understanding of the agreementwater power lease in question. We continue to evaluate our legal options. For additional information, see the discussion under “Critical Accounting Estimates – Long-lived assets” in Item 7.
Competition
In general, our products are globally-traded commodities and are marketed in close to 9080 countries. The markets in which we compete are highly competitive and, aside from quality specifications to meet customer needs, the production of our products does not depend upon a proprietary process or formula. Pricing and the level of shipments of our products are influenced by the balance between supply and demand as affected by global economic conditions, changes in consumption and capacity, the level of customer and producer inventories and fluctuations in currency exchange rates. Any material decline in prices for our products or other adverse developments in the markets for our products could have a material adverse effect on our results of operations or financial condition. Prices for our products have been and are likely to continue to be highly volatile.
Newsprint, one of our principal products, is produced by numerous manufacturers worldwide. In 2011,2012, the five largest North American producers represented approximately 85%78% of North American newsprint capacity and the five largest global producers represented approximately 36%35% of global newsprint capacity. Our total newsprint capacity is approximately 9% of worldwide newsprint capacity. We face competition from both large global producers and numerous smaller regional producers. In recent years, a number of global producers of newsprint based in Asia, particularly China, have grown their production capacity. Price, quality and customer relationships are important competitive determinants.
We compete with seven other coated mechanical paper producers with operations in North America. In 2011,2012, the five largest North American producers represented approximately 84%85% of North American capacity for coated mechanical paper. In addition, several major offshore suppliers of coated mechanical paper compete for North American business. In 2011,2012, offshore imports represented approximately 11%12% of North American demand. As a major supplier to printers, end users (such as magazine publishers, catalogers and retailers) and brokers/merchants in North America, we compete with numerous worldwide suppliers of other grades of paper such as coated freesheet and supercalendered paper. We compete on the basis of price, quality and service.
In 2011,2012, we produced approximately 30%31% of North American uncoated mechanical paper demand, comprised mainly of supercalendered, superbright, high bright, bulky book and directory papers. We compete with numerous uncoated mechanical paper producers with operations in North America. In addition, imports from overseas represented approximately 10% of North American demand in 20112012 and were primarily concentrated in the supercalendered paper market where they represented approximately 19%20% of North American demand. We compete on the basis of price, quality, service and breadth of product line.
We compete with eightseven other major market pulp suppliersproducers with operations in North America along with other smaller competitors. Market pulp is a globally-traded commodity for which competition exists in all major markets. We produce five major grades of market pulp (northern and southern hardwood, northern and southern softwood and fluff) and compete with other producers from South America (eucalyptus hardwood and radiata pine softwood), Europe (northern hardwood and softwood) and Asia (mixed tropical hardwood). With the acquisition of Fibrek, we also produce recycled bleached kraft pulp. Price, quality, service and fiber sources are considered the main competitive determinants.
By the end of 2008, we had completed the certification of all of our managed forest lands to globally-recognized sustainable forest management standards, namely the SFI and the Z809 Standard of the CSA. In 2009, to better respond to market demands, we introduced the FSC standard in our certification portfolio by re-certifying two forest units in Quebec from CSA to FSC and by dual-certifying one forest in Ontario to FSC (already certified to SFI). In 2010, we further balanced our forest certification portfolio by re-certifying two additional forest units in Quebec from CSA to FSC and by dual-certifying one forest in Nova Scotia to FSC (already certified to SFI). We have committed to increasing FSC certification of our forest tenures from 18% in 2010 to 80% by 2015. We have certified approximately 65% of our forests to FSC standards, and in 2012, achieved the distinction of being the largest manager of FSC-certified forests in the world.
As with other global commodities, the competitive position of our products is significantly affected by the volatility of foreign currency exchange rates. See Item 7A, “Quantitative and Qualitative Disclosures About Market Risk – Foreign Currency Exchange Risk,” of this Form 10-K. We have operations in Canada, the United States and South Korea. In addition to the U.S., several of our primary competitors are located in Canada, Sweden, Finland and certain Asian countries. Accordingly, the relative rates of exchange between those countries’ currencies and the United States dollar can have a substantial effect on our ability to compete. In addition, the degree to which we compete with foreign producers depends in part on the level of demand abroad. Shipping costs and relative pricing generally cause producers to prefer to sell in local markets when the demand is sufficient in those markets.
Trends in advertising, electronic data transmission and storage and the Internet couldare expected to have further adverse effects on the demand for traditional print media, including our products and those of our customers, but neither the timing nor the extent of those trends can be predicted with certainty. Our newspaper, magazine, book and catalog publishing customers may increasingly use, and compete with businesses that use, other forms of media and advertising and electronic data transmission and storage, including television, electronic readers and the Internet, instead of newsprint, coated papers, uncoated specialty papers or other products made by us. The demand for newsprint declined significantly over the last several years as a result of continued declines in newspaper circulation and advertising volume and publishers’ conservation measures, which include increased usage of lighter basis-weight newsprint and web-width and page count reductions. Our newsprint, magazine and catalog publishing customers are also subject to the effects of competing media, including the Internet.
Emergence From Creditor Protection Proceedings
AbitibiBowater Inc.We and all but one of itsour debtor affiliates (as discussed below) successfully emerged from creditor protection proceedings under Chapter 11 of the United States Bankruptcy Code, as amended (“Chapter 11”) and theCompanies’ Creditors Arrangement Act (Canada) (the “CCAA”), as applicable (collectively, the “Creditor Protection Proceedings”) on December 9, 2010 (the “Emergence Date”). In the third quarter of 2010, the creditors under the Creditor Protection Proceedings, with one exception, voted in the requisite numbers to approve the respective Plan of Reorganization (as defined below). Creditors of Bowater Canada Finance Corporation (“BCFC”), an indirect, wholly-owned subsidiary of ours, did not vote in the requisite numbers to approve the Plans of Reorganization (as defined below). Accordingly, we did not seek sanction of theCCAA Plan of Reorganization and Compromise (the “CCAA Reorganization Plan”) or confirmation of theDebtors’ Second Amended Joint Plan of Reorganization under Chapter 11 of the Bankruptcy Code (the “Chapter 11 Reorganization Plan” and, together with the CCAA Reorganization Plan, the “Plans of Reorganization” and each, a “Plan of Reorganization”) with respect to BCFC. See Item 3, “Legal Proceedings, – BCFC Bankruptcy and Insolvency Act Filing,” for information regarding BCFC’s Bankruptcy and Insolvency Act filing on December 31, 2010. The Plans of Reorganization became effective on the Emergence Date.
From the 97,134,954 shares of Successor Company common stock issued for claims in the Creditor Protection Proceedings, we established a reserve of 23,382,073 shares for claims that remained in dispute as of the Emergence Date, from which we have made and will make supplemental interim distributions to unsecured creditors as disputed claims are resolved. As of December 31, 2011, there were 19,719,565 shares remaining in this reserve. The remaining claims are claims that we believe should be disallowed because they are duplicative, without merit, overstated or should be disallowed for other reasons. We have made significant progress in addressing the claims that remained in dispute at the time of our emergence from the substantial number and amount of claims filed during the Creditor Protection Proceedings. The majority of the remaining disputed claims will be disposed through ongoing litigation before the United States Bankruptcy Court for the District of Delaware (the “U.S. Court”) or a claims officer appointed by the Superior Court of Quebec in Canada (the “Canadian Court” and, together with the U.S. Court, the “Courts”). The ultimate completion of the claims resolution process could therefore take some time to complete. We may be required to settle certain disputed claims in cash under certain specific circumstances. As such, included in “Accounts payable and accrued liabilities” in our Consolidated Balance Sheets (as defined below) as of December 31, 2011 and 2010 is a liability of $11 million and $35 million, respectively, for the estimated cash settlement of such claims. To the extent there are shares remaining after all disputed claims have been resolved, these shares will be reallocated ratably among unsecured creditors with allowed claims in the Creditor Protection Proceedings pursuant to the Plans of Reorganization.
For additional information regarding the Creditor Protection Proceedings, see Note 3,4, “Creditor Protection Proceedings,” to our Consolidated Financial Statements.
Basis of Presentation
Effective upon the commencement of the Creditor Protection Proceedings on April 16 and 17,in 2009 and through the Convenience Date (as defined below), we applied the guidance in Financial Accounting Standards Board (“FASB”) Accounting Standards Codification (“ASC”) 852, “Reorganizations” (“FASB ASC 852”), in preparing our consolidated financial statements. The guidance in FASB ASC 852 does not change the manner in which financial statements are prepared. However, it requires that the financial statements distinguish transactions and events that are directly associated with the reorganization from the ongoing operations of the business. Accordingly, during the Creditor Protection Proceedings, we: (i) recorded certain expenses, charges and credits incurred or realized that were directly associated with or resulting from the reorganization and restructuring of the business in “Reorganization items, net” in our Consolidated Statements of Operations included in our Consolidated Financial Statements (“Consolidated Statements of Operations”) and (ii) ceased recording interest expense on certain of our pre-petition debt obligations. For additional information, see Note 3,4, “Creditor Protection Proceedings,” and Note 16, “Liquidity and17, “Long-Term Debt,” to our Consolidated Financial Statements.
In accordance with FASB ASC 852, fresh start accounting (“fresh start accounting”) was required upon our emergence from the Creditor Protection Proceedings, which we applied effective December 31, 2010 (the “Convenience Date”). As such, adjustments related to the application of fresh start accounting was reflected in our Consolidated Balance Sheets included in our Consolidated Financial Statements (“Consolidated Balance Sheets”) as of December 31, 2010 and fresh start accounting adjustments related thereto were included in our Consolidated Statements of Operations for the year ended December 31, 2010.
The implementation of the Plans of Reorganization and the application of fresh start accounting materially changed the carrying amounts and classifications reported in our consolidated financial statements and resulted in the Company becoming a new entity for financial reporting purposes. Accordingly, our consolidated financial statements as of December 31, 2010 and for periods subsequent to December 31, 2010 are not comparable to our consolidated financial statements for periods prior to December 31, 2010. References to “Successor” or “Successor Company” refer to the Company on or after December 31, 2010, after giving effect to the implementation of the Plans of Reorganization and the application of fresh start accounting. References to “Predecessor” or “Predecessor Company” refer to the Company prior to December 31, 2010. Additionally, references to periods on or after December 31, 2010 refer to the Successor and references to periods prior to December 31, 2010 refer to the Predecessor.
Employees
As of December 31, 2011,2012, we employed approximately 10,4009,300 people, of whom approximately 7,9006,700 were represented by bargaining units. Our unionized employees are represented predominantly by the Communications, Energy and Paperworkers Union (the “CEP”) and the Confederation des syndicats nationauxof National Trade Unions (the “CSN”“CNTU”) in Canada and predominantly by the United Steelworkers International in the U.S.
We haveWhile we intend to negotiate to renew collective bargaining agreements, in place covering the majority of our unionized employees, many of which have been recently renewed and revised. However, there can be no assurance that we will be able to renew agreements on satisfactory terms, or that we will maintain continuously satisfactory agreements with all of our unionized employees or that we will finalize satisfactory agreements with the remaining unionized employees (which include approximately 200 wood workers in Quebec).employees. Should we be unable to do so, it could result in strikes or other work stoppages by affected employees, which could cause us to experience a disruption of operations and affect our business, financial condition or results of operations.
Trademarks
We registeredhave applied for registration of the marks “AbitibiBowater,” “Resolute,” “Resolutetrademarks “RESOLUTE” and “resolute Forest Products” “Resolu” and “Produits Forestiers Resolu” and the AbitibiBowater and Resolute logos & Design” in the countries of our principal markets.markets, as well as “RESOLUTE FOREST PRODUCTS” and “R Design” in Canada and the United States, and “RÉSOLU” and “Produits forestiers résolu & Design” in Canada. We consider our interest in the logosmarks and markslogos to be important and necessary to the conduct of our business.
Environmental Matters
We are subject to a variety of federal, state, provincial and local environmental laws and regulations in the jurisdictions in which we operate. We believe our operations are in material compliance with current applicable environmental laws and regulations. While it is impossible to predict future environmental regulations that may be established, we believe that we will not be at a competitive disadvantage with regard to meeting future Canadian, United States or South Korean standards. For additional information, see
Note 20, “Commitments and Contingencies – Environmental matters,” to our Consolidated Financial Statements.
Internet Availability of Information
We make our Form 10-K, our Quarterly Reports on Form 10-Q and our Current Reports on Form 8-K, and any amendments to these reports, available free of charge on our website(www.resolutefp.com) as soon as reasonably practicable after we file or furnish such materials to the SEC. The SEC also maintains a website(www.sec.gov)that contains our reports and other information filed with the SEC. In addition, any materials we file with the SEC may be read and copied at the SEC’s Public Reference Room at 100 F Street, NE, Washington, D.C., 20549. Information on the operations of the Public Reference Room may be obtained by calling the SEC at
1-800-SEC-0330. Our reports are also available on the System for Electronic Document Analysis and Retrieval (“SEDAR”) website(www.sedar.com).
In addition to the other information set forth in this Form 10-K, you should carefully consider the following factors, which could materially affect our business, financial condition or future results. In particular, the risks described below could cause actual events to differ materially from those contemplated in the forward-looking statements in this Form 10-K. The risks described below are not the only risks we face. Additional risks and uncertainties not currently known to us or that we currently deem to be immaterial may also materially affect our business, financial condition or future results.
Developments in alternative media couldare expected to continue to adversely affect the demand for our products, especially in North America, and our responses to these developments may not be successful.
Trends in advertising, electronic data transmission and storage and the Internet couldare expected to have further adverse effects on the demand for traditional print media, including our products and those of our customers. Neither the timing nor the extent of those trends can be predicted with certainty. Our newspaper, magazine, book and catalog publishing customers may increasingly use, and compete with businesses that use, other forms of media and advertising and electronic data transmission and storage, including television, electronic readers and the Internet, instead of newsprint, coated papers, uncoated specialty papers or other products made by us. The demand for certain of our products weakened significantly over the last several years. For example, industry statistics indicate that North American newsprint demand has been in decline for several years and has experienced annual declines of 10.3% in 2007, 11.2% in 2008, 25.3% in 2009, 6.0% in 2010, and 7.4% in 2011.2011 and 1.2% in 2012. Third-party forecasters indicate that these declines may continue in the future due to reduced North American newspaper circulation, less advertising, substitution to other uncoated mechanical grades and conservation measures taken by publishers.
One of our responses to the declining demand for our products has been to curtail our production capacity. If demand for our products continues to decline, for our products, it may become necessary to curtail production even further or permanently shut down even more machines or facilities. Curtailments or shutdowns could result in asset impairments and additional cash costs at the affected facilities, including restructuring charges and exit or disposal costs, and could negatively impact our cash flows and materially affect our results of operations or financial condition.
Currency fluctuations may adversely affect our results of operations or financial condition, and changes in foreign currency exchange rates can affect our competitive position, selling prices and manufacturing costs.
We compete with North American, European and Asian producers in most of our product lines. Our products are sold and denominated in U.S. dollars, Canadian dollars and selected foreign currencies. A substantial portion of our manufacturing costs are denominated in Canadian dollars. In addition to the impact of product supply and demand, changes in the relative strength or weakness of such currencies, particularly the U.S. dollar, may also affect international trade flows of these products. A stronger U.S. dollar may attract imports into North America from foreign producers, increase supply and have a downward effect on prices, while a weaker U.S. dollar may encourage U.S. exports and increase manufacturing costs that are in Canadian dollars or other foreign currencies. Variations in the exchange rates between the U.S. dollar and other currencies, particularly the Euro and the currencies of Canada, Sweden and certain Asian countries, will significantly affect our competitive position compared to many of our competitors.
We are particularly sensitive to changes in the value of the Canadian dollar versus the U.S. dollar. The impact of these changes depends primarily on our production and sales volume, the proportion of our production and sales that occur in Canada, the proportion of our financial assets and liabilities denominated in Canadian dollars, our hedging levels and the magnitude, direction and duration of changes in the exchange rate. We expect exchange rate fluctuations to continue to impact costs and revenues; however, we cannot predict the magnitude or direction of this effect for any quarter, and there can be no assurance of any future effects. During the last two years, the relative value of the Canadian dollar ranged from a high of US$1.06 in July 2011 to a low of US$0.930.95 in May 2010October 2011 and was US$0.981.01 as of December 31, 2011.2012. Based on operating projections for 2012,2013, a one-cent increase in the Canadian-U.S. dollar exchange rate would decrease our annual operating income by approximately $16$14 million.
Certain of our assets and liabilities, including a substantial portion of our net pension and pension and other postretirement benefit (“OPEB”) obligations and our deferred income tax assets, are denominated in Canadian dollars, and are exposed to foreign currency movements. Our earnings are therefore affected by increases or decreases in the value of the Canadian dollar. Increases in the value of the Canadian dollar versus the U.S. dollar will tend to increase reported earnings, and decreases in the value of the Canadian dollar will tend to reduce reported earnings.
If the Canadian dollar continues to remain strong or appreciates as against the U.S. dollar, it could influence the foreign exchange rate assumptions that are used in our evaluation of long-lived assets for impairment and consequently, result in asset impairment charges.
We face intense competition in the forest products industry and the failure to compete effectively would have a material adverse effect on our business, financial condition or results of operations.
We compete with numerous forest products companies, many of which have greater financial resources than we do. There has been a continued trend toward consolidation in the forest products industry, leading to new global producers. These global producers are typically large, well-capitalized companies that may have greater flexibility in pricing and financial resources for marketing, investment and expansion than we do. The markets for our products are all highly competitive. Actions by competitors can affect our ability to sell our products and can affect the volatility of the prices at which our products are sold. While the principal basis for competition is price, we also compete on the basis of customer service, quality and product type. There has also been an increasing trend toward consolidation among our customers. With fewer customers in the market for our products, our negotiating position with these customers could be weakened.
In addition, our industry is capital intensive, which leads to high fixed costs. Some of our competitors may be lower-cost producers in some of the businesses in which we operate. Global newsprint capacity, particularly Chinese and European newsprint capacity, has been increasing, which may result in lower prices, volumes or both for our exported products. We believe that hardwood pulp capacity at South American pulp mills has unit costs that are significantly below those of our hardwood kraft pulp mills. Other actions by competitors, such as reducing costs or adding low-cost capacity, may adversely affect our competitive position in the products we manufacture and consequently, our sales, operating income and cash flows. We may not be able to compete effectively and achieve adequate levels of sales and product margins. Failure to compete effectively would have a material adverse effect on our business, financial condition or results of operations.
The forest products industry is highly cyclical. Fluctuations in the prices of, and the demand for, our products could result in small or negative profit margins, lower sales volumes and curtailment or closure of operations.
The forest products industry is highly cyclical. Historically, economic and market shifts, fluctuations in capacity and changes in foreign currency exchange rates have created cyclical changes in prices, sales volume and margins for our products. Most of our paper and wood products are commodities that are widely available from other producers and even our coated and specialty papers are susceptible to these fluctuations. Because our commodity products have few distinguishing qualities from producer to producer, competition for these products is based primarily on price, which is determined by supply relative to demand. The overall levels of demand for the products we manufacture and distribute and consequently, our sales and profitability, reflect fluctuations in levels of end-user demand, which depend in part on general economic conditions in North America and worldwide.
The effect of not meeting certain conditions under theWe could be required to make contributions to our Canadian pension funding relief regulationsplans at levels that could be significantly higher than expected, which could have a materialan adverse impact on our financial condition.
As ofa pre-condition to our emergence from the third quarter of 2011, bothcreditor protection proceedings, we entered into agreements with the provinces of Quebec and Ontario had adopted specific regulations to implementestablish parameters concerning the funding relief measures with respect toof the aggregate solvency deficits in our material Canadian registered pension plans, which we refer to as contemplated by an agreement between each province andthe “affected plans,” until 2020. These plans represented approximately 70% of our principal Canadian operating subsidiary, effectiveunfunded pension obligations as of December 31, 2012. In exchange for certain undertakings, the provinces confirmed their intention to adopt regulations specific to us, which we refer to as the “funding relief regulations,” to implement those parameters in respect of the affected plans. Because the aggregate solvency ratio in the affected plans was below the minimum solvency level prescribed in the funding relief regulations as of December 31, 2011, those regulations require that we propose, by March 2013, corrective measures designed to attain the target solvency ratio prescribed therein within five years. The portion of the solvency deficit that is subject to corrective measures amounted to approximately Cdn$500 million as of December 31, 2011 ($504 million, based on the exchange rate in effect on December 31, 2012). We continue to work with other plan stakeholders, including employees, retirees, unions, the provincial governments of Quebec and Ontario and the related pension regulators to address these corrective measures, but at this time we cannot estimate the additional contributions, if any, that may be made or required in future years in respect of the corrective measures, but they could be material, which would negatively impact our emergencecash flows and materially affect our results of operations or financial condition.
In light of a further decrease in yields on government securities in Canada, and certain changes to Canadian actuarial rules, when we file the actuarial report in respect of the affected plans in the second quarter of 2013, we expect that the aggregate solvency ratio as of December 31, 2012, will likely have further decreased from the Creditor Protection Proceedingslevel at December 31, 2011. This might therefore trigger the need for additional corrective measures, but at this time we cannot estimate the supplemental contributions, if any, that may be made or required in future years as a periodresult, but they could be material, which would negatively impact our cash flows and materially affect our results of 10 years. Thoseoperations or financial condition.
The agreements includewe reached with the provinces of Quebec and Ontario to implement the funding relief measures provide a number of undertakings by our principal Canadian operating subsidiary, which willincluding an obligation to make solvency deficit reduction contributions in the event of capacity reductions, subject to certain conditions. These undertakings apply for a minimum period of five years following the Emergence Date. Those undertakings and the basic funding parameters are described in Note 18, “Pension and Other Postretirement Benefit Plans – Canadian pension funding relief,” to our Consolidated Financial Statements. We could lose the benefit of the funding relief regulations if we fail to comply with them or fail to meet our undertakings in the related agreements, which, in either case, could have a material impact on our financial condition.
The regulations also provide that corrective measures would be required if the aggregate solvency ratio in the registered pension plans falls below For a prescribed level under the target provided by the regulations as of December 31 in any year through 2014. Such measures may include additional funding over five years to attain the target solvency ratio prescribed in the regulations. Thereafter, supplemental contributions, as described in Note 18, “Pension and Other Postretirement Benefit Plans – Canadian pension funding relief,” to our Consolidated Financial Statements, would be required if the aggregate solvency ratio in the registered pension plans falls below a prescribed level under the target provided by the regulations as of December 31 in any year on or after 2015 for the remainderfurther discussion of the period covered by the regulations. The aggregate solvency ratio in the Canadian registered pension plans covered by the Quebec and Ontario funding relief is determined annually as of December 31. The calculation is based on a number of factorsregulations, see “Liquidity and assumptions, including the accrued benefits to be provided by the plans, interest rate levels, membership data and demographic experience. In light of low yields on government securities in Canada, which are used to determine the applicable discount rate, when we file the actuarial report in respect of these plans later this year, we expect that the aggregate solvency ratio in these Canadian registered plans will have fallen below the minimum level prescribed by the regulations and that we will therefore be required to adopt corrective measures by March 2013. At this time, we cannot estimate the additional contributions, if any, that may be required in future years, but they could be material.Capital Resources – Employee Benefit Plans” under Item 7.
It is also possible that provinces other than Quebec and Ontarioprovincial pension regulators could attempt to assert jurisdiction and to compel additional funding of certain of our Canadian registered pension plans in respect of plan members associated with sites we formerly operated in their respective provinces. At this time,As more fully described under Item 3, “Legal Proceedings,” we cannot estimatefiled a motion for directives with the additional contributions,Quebec Superior Court in Canada, the court with jurisdiction in the Creditor Protection Proceedings (the “Canadian Court”), seeking an order to prevent pension regulators in each of Quebec, New Brunswick and Newfoundland and Labrador from declaring partial wind-ups of pension plans relating to employees of former operations in New Brunswick and Newfoundland and Labrador, or a declaration that any claim for accelerated reimbursements of deficits arising from a partial wind-up is a barred claim under the Creditor Protection Proceedings. A partial wind-up would likely shorten the period in which any deficit within those plans, which could exceed $150 million, would have to be funded if any, that may be required, but they could be material.we do not obtain the relief sought.
We may be required to record additional valuation allowances against our recorded deferred income tax assets.
We recorded significant tax attributes (deferred income tax assets) in our Consolidated Balance Sheet included in our Consolidated Financial Statements (“Consolidated Balance Sheet”) as of December 31, 2011,2012, which attributes would be available to offset any future taxable income. If, in the future, we determine that we are unable to use the full extent of these tax attributes as a result of sustained cumulative taxable losses, we could be required to record additional valuation allowances for the portion of the deferred income tax assets that are not recoverable. Such valuation allowances, if taken, would be recorded as a charge to income tax expense and would negatively impact our reported net income (loss).
We may not be able to generate sufficient cash to service allresults of our indebtedness and may be forced to take other actions to satisfy our obligations under our indebtedness, which may not be successful.
Our ability to service our debt obligations depends on our financial condition and operating performance, which are subject to prevailing economic and competitive conditions and certain financial, business, legislative, regulatory and other factors beyond our control. We may be unable to maintain a level of cash flows from operating activities sufficient to permit us to fund our day-to-day operations or to pay the principal, premium, if any, and interest on our indebtedness.
If our cash flows and capital resources are insufficient to fund our debt service obligations, we could face substantial liquidity problems and could be forced to reduce or delay capital expenditures or to sell assets or operations, seek additional capital or restructure or refinance our indebtedness. We may not be able to effect any such alternative measures, if necessary, on commercially reasonable terms or at all and, even if successful, such alternative actions may not allow us to meet our scheduled debt service obligations. The credit agreement that governs our ABL Credit Facility (as defined and further discussed in Item 7 under “Liquidity and Capital Resources”) restricts our ability to dispose of assets and use the proceeds from any such dispositions and may also restrict our ability to raise debt or equity capital to be used to repay other indebtedness when it becomes due. We may not be able to consummate those dispositions or obtain proceeds in an amount sufficient to meet any debt service obligations when due.
If we are unable to generate sufficient cash flows to service our obligations under the 2018 Notes (as defined in Item 7 under “Liquidity and Capital Resources”) and the ABL Credit Facility, we would be in default. If the default is not cured, holders of the 2018 Notes could declare all outstanding principal and interest to be due and payable, the lenders under the ABL Credit Facility could terminate their commitments to loan money, our secured lenders could foreclose against the assets securing such borrowings and we could be forced into bankruptcy or liquidation.operations.
The credit agreement that governs the ABL Credit Facility and the 2018 Notes indenture may restrict our ability to respond to changes or to take certain actions.
The indenture with respect to our senior secured notes due in 2018 Notes indenture(the “2018 Notes”), and the credit agreement that governs our ABLsenior secured asset-based revolving credit facility (the “ABL Credit FacilityFacility”), contain a number of restrictive covenants that impose significant operating and financial restrictions on us and may limit our ability to engage in acts that may be in our long-term best interests, including, among other things, restrictions on our ability (subject to a number of exceptions and qualifications) to: incur, assume or guarantee additional indebtedness; issue redeemable stock and preferred stock; pay dividends or make distributions or redeem or repurchase capital stock; prepay, redeem or repurchase certain indebtedness; make loans and investments; incur liens; restrict dividends, loans or asset transfers from our subsidiaries; sell or otherwise dispose of assets, including capital stock of subsidiaries; consolidate or merge with or into, or sell substantially all of our assets to another person; enter into transactions with affiliates; and enter into new lines of business.
In addition, the restrictive covenants in the credit agreement that governs our ABL Credit Facility could require us to maintain a specified financial ratio if the availability under the facility falls below a certain threshold, as well as satisfy other financial condition tests. Our ability to meet those financial ratios and tests can be affected by events beyond our control, and there can be no assurance that we will meet them.
A breach of the covenants under the 2018 Notes indenture or under the credit agreement that governs the ABL Credit Facility could result in an event of default under the indenture or credit agreement governing the applicable indebtedness. Such default may allow the holders to accelerate the related debt and may result in the acceleration of any other debt to which a cross-acceleration or cross-default provision applies. In addition, the occurrence of an event of default under the credit agreement that governs our ABL Credit Facility would permit the lenders thereunder to terminate all commitments to extend further credit under that facility. Furthermore, if we were unable to repay the amounts due and payable under our ABL Credit Facility or the 2018 Notes following an acceleration, those lenders could proceed against the collateral securing that indebtedness. In the event our lenders under the ABL Credit Facility or holders of the 2018 Notes accelerate the repayment of our borrowings, there can be no assurance that we and our subsidiaries would have sufficient assets to repay such indebtedness. As a result of these restrictions, we may be limited in how we conduct our business, unable to raise additional debt or equity financing to operate during general economic or business downturns or unable to compete effectively or to take advantage of new business opportunities. These restrictions may affect our ability to respond to changes or to pursue other business opportunities.
Our operations require substantial capital and we may be unable to maintain adequate capital resources to provide for all of our capital requirements.
Our businesses are capital intensive and require regular capital expenditures in order to maintain our equipment, increase our operating efficiency and comply with environmental laws. In addition, significant amounts of capital may be required to modify our equipment to produce alternative grades with better demand characteristics or to make significant improvements in the characteristics of our current products. If our available cash resources and cash generated from operations are not sufficient to fund our operating needs and capital expenditures, we would have to obtain additional funds from borrowings or other available sources or reduce or delay our capital expenditures. Recent global credit conditions and the downturn in the global economy have resulted in a significant decline in the credit markets and the overall availability of credit. Our indebtedness could adversely affect our financial health, limit our operations and impair our ability to raise additional capital. If this occurs, we may not be able to obtain additional funds on favorable terms or at all. If we cannot maintain or upgrade our equipment as we require, we may become unable to manufacture products that compete effectively. An inability to make required capital expenditures in a timely fashion could have a material adverse effect on our growth, business, financial condition or results of operations.
We may not be successful in implementing our strategies to increase our return on capital.
We are targeting a higher return on capital, which may require significant capital investments with uncertain return outcomes. Our strategies include improving our business mix, reducing our costs and increasing operational flexibility, targeting export markets with better newsprint demand and exploring strategic alternatives. There are risks associated with the implementation of these strategies, which are complicated and involve a substantial number of mills, machines, capital and personnel. To the extent we are unsuccessful in achieving these strategies, our results of operations may be adversely affected.
Our manufacturing businesses may have difficulty obtaining wood fiber at favorable prices, or at all.
Wood fiber is the principal raw material we use in our business. We use both virgin fiber (wood chips and logs) and recycled fiber (old newspapers, old magazines and magazines)sorted office paper) as fiber sources for our pulp and paper mills. The primary source for wood fiber is timber. Environmental litigation and regulatory developments have caused, and may cause in the future, significant reductions in the amount of timber available for commercial harvest in Canada and the United States. For example, new legislation in the province of Quebec provides that a portionapproximately 25% of the historical harvesting rights allocated to harvesters including us, will be subjectreallocated to an open auction system, that willscheduled to be fully implemented in April 2013. The new system couldwill have the effect of increasing the cost of harvesting timber and reducing supply.
In addition, future domestic or foreign legislation or regulation, litigation advanced by Aboriginal groups or other interested parties and litigationactions taken by environmental organizations concerning the use of timberlands, forest management practices, the protection of endangered species, the promotion of forest biodiversity and the response to and prevention of catastrophic wildfires could also affect timber supplies. Availability of harvested timber may further be limited by factors such as fire and fire prevention, insect infestation, disease, ice storms, wind storms, drought, flooding and other natural and man-made causes, thereby reducing supply and increasing prices. As is typical in the industry, we do not maintain insurance for any loss to our standing timber from natural disasters or other causes.
In all Canadian provinces, theQuebec and Ontario, our volume allocated on Crown land is constrainedlimited by the Annual Allowable Cut. This overall level of harvest is revised on a regular basis, typically every five years. In December 2006, the Chief Forester of the province of Quebec confirmed a reduction of 23.8% below 2004 levels for the period 2008 to 2013. In August 2011, the Quebec Chief Forester announced a dropan interim estimate reduction of 10.3% in the annual allowable cutAnnual Allowable Cut for 2013 – 2014, which2014. A final assessment is an interim estimate. A revised assessment will be available sometimeexpected in 2013, which2013. When implemented, this will reduce the volume that could be allocated toproduced at our sawmills through Timber Supply Guarantees starting on April 1, 2013.
Wood fiber is a commodity and prices historically have been cyclical, are subject to market influences and may increase in particular regions due to market shifts. Pricing of recycled fiber is also subject to market influences and has experienced significant fluctuations. During the last two years, the market prices of old newspapers have ranged from a low of $136 average per ton during the third quarter of 2010 to a high of $192 average per ton during the third quarter of 2011. There can be no assurance that prices of recycled fiber will remain at levels that are economical for us to use. Any sustained increase in fiber prices would increase our operating costs and we may be unable to increase prices for our products in response, which could have a material adverse effect on our results of operations or financial condition.
There can be no assurance that access to fiber will continue at the same levels as in the past. The cost of softwood fiber and the availability of wood chips may be affected. If our harvesting rights pursuant to applicable laws, forest licenses or forest management agreements are reduced or if any third-party supplier of wood fiber stops selling or is unable to sell wood fiber to us, our financial condition or operating results could suffer.
A sustained increase in the cost of purchased energy and other raw materials would lead to higher manufacturing costs, thereby reducing our margins.
Our operations consume substantial amounts of energy, such as electricity, natural gas, fuel oil, coal and wood waste. We buy a significant proportion of our energy and raw materials includingon the open market. The main raw materials we require in our manufacturing process are chemicals, wood, recovered paper and other raw materials, primarily on the open market.
materials. The prices for raw materials and energy are volatile and may change rapidly, directly affecting our results of operations. The availability of raw materials and energy may also be disrupted by many factors outside our control, adversely affecting our operations. Energy prices, particularly for electricity, natural gas and fuel oil, have been volatile in recent years and prices every year since 2005 have exceeded long-term historical averages.years. As a result, fluctuations in energy prices will impact our manufacturing costs and contribute to earnings volatility.
We are a major user of renewable natural resources such as water and wood. Accordingly, significant changes in climate and forest diseases or infestation could affect our financial condition or results of operations. The volume and value of timber that we can harvest or purchase may be limited by factors such as fire and fire prevention, insect infestation, disease, ice storms, wind storms, drought, flooding and other natural and man-made causes, thereby reducing supply and increasing prices. As is typical in the industry, we do not maintain insurance for any loss to our standing timber from natural disasters or other causes. Also, there can be no assurance that we will be able to maintain our water rights or to renew them at conditions comparable to those currently in effect.
Wood fiber is a commodity and prices historically have been cyclical, are subject to market influences and may increase in particular regions due to market shifts. Pricing of recycled fiber is also subject to market influences and has experienced significant fluctuations. During the last two years, the market prices of old newspapers have ranged from a low of $110 average per short ton during the fourth quarter of 2012 to a high of $192 average per short ton during the third quarter of 2011. There can be no assurance that prices of recycled fiber will remain at levels that are economical for us to use. Any sustained increase in fiber prices would increase our operating costs and we may be unable to increase prices for our products in response, which could have a material adverse effect on our results of operations or financial condition.
There can be no assurance that access to fiber will continue at the same levels as in the past. The cost of softwood fiber and the availability of wood chips may be affected. If our harvesting rights pursuant to applicable laws, forest licenses or forest management agreements are reduced or if any third-party supplier of wood fiber stops selling or is unable to sell wood fiber to us, our financial condition or operating results could suffer.
For our commodity products, the relationship between industry supply and demand for these products, rather than changes in the cost of raw materials, will determine our ability to increase prices. Consequently, we may be unable to pass along increases in our operating costs to our customers. Any sustained increase in energy, chemical or raw material prices without any corresponding increase in product pricing would reduce our operating margins and potentially require us to limit or cease operations of one or more of our machines.
TheSoft global financial crisis and economic downturn couldconditions will continue to negatively impactaffect our results of operations or financial condition, and it may cause a number of the risks that we currently face to increase in likelihood, magnitude and duration.
The global financial crisis and economic downturn has adversely affected economic activity globally. Our operations and performance depend significantly on worldwide economic conditions. CustomersDuring the global financial crisis and the soft conditions that have followed, customers across all of our businesses have been delayingdelayed and reducing theirreduced expenditures in response to deteriorating macroeconomic and industry conditions and uncertainty, which has had a significant negative impact on the demand for our products and therefore, the cash flows of our businesses, and could continue to have a negative impact on our capital resources.
OurDemand for newsprint, coated papers and specialty papers demand has been and is expected to be negatively impacted by higher unemployment and lower gross domestic product growth rates. We believe that some end consumers have reduced newspaper and magazine subscriptions as a direct result of their financial circumstances induring the current economic downturn, contributing to lower demand for our products by our customers. Additionally, advertising demand in magazines and newspapers, including classified advertisements, and demand from automotive dealerships and real estate agencies have been impacted by higher unemployment, lower automobile sales and the distressedtepid real estate environment. Lower demand for print advertisements leads to fewer pages in newspapers, magazines and other advertisement circulars and periodicals, decreasing the demand for our products. Furthermore, consumer and advertising-driven demand for our paper products may not recover, even with an economic recovery, as purchasing habits may be permanently changed with a prolonged economic downturn.
The economic downturn has had a profoundly negative impact on the U.S. housing industry, which sets the prices for many of our lumber and other wood-based products. According to the U.S. Census Bureau, U.S. housing starts declined from approximately 1.4 million in 2007 to a low of approximately 0.70.6 million in 2011,2009, reflecting a 52%57% decline. With thisDuring conditions such as those, with a low level of primary demand for our lumber and other wood-based products, we would expect our wood products business may continue to operate at a low level until there is a meaningful recovery in new residential construction demand. With less demand for saw logs at sawmills throughout North America and lower saw log prices, our timberland values may decline, impacting some of our financial options. Additionally,Furthermore, with less lumber demand, sawmills have generatedgenerate less sawdust and wood chips and shavings that we use for fiber forin our mills. The price of sawdustpulp and wood chips for ourpaper mills, that needwhich leads the mills to purchaseincrease their furnish onsupply from the open market, where prices may be elevated and subject to market forces. We would also continuehave less waste to be at elevated levels, until there isuse internally, which would increase our fossil fuel consumption and, as a meaningful recovery in new residential demand in the U.S.result, our costs.
Changes in laws and regulations could adversely affect our results of operations.
We are subject to a variety of foreign, federal, state, provincial and local laws and regulations dealing with trade, employees, transportation, taxes, timber and water rights, pension funding and the environment. Changes in these laws or regulations or their interpretations or enforcement have required in the past, and could require in the future, substantial expenditures by us and adversely affect our results of operations. For example, changes in environmental laws and regulations have in the past, and could in the future, require us to spend substantial amounts to comply with restrictions on air emissions, wastewater discharge, waste management, landfill sites, including remediation costs, the Environmental Protection Agency’s new greenhouse gas regulations and Boiler MACT. Environmental laws are becoming increasingly stringent. Consequently, our compliance and remediation costs could increase materially.
Changes in the political or economic conditions in Canada, the United States or other countries in which our products are manufactured or sold could adversely affect our results of operations.
We manufacture products in Canada, the United States and South Korea and sell products throughout the world. Paper prices are tied to the health of the economies of North and South America, Asia, Europe and Europe,South Pacific, as well as to paper inventory levels in these regions. The economic and political climate of each region has a significant impact on our costs and the prices of, and demand for, our products. Changes in regional economies or political instability, including acts of war or terrorist activities, can affect the cost of manufacturing and distributing our products, pricing and sales volume, directly affecting our results of operations. Such changes could also affect the availability or cost of insurance.
We may be required to record additional environmental liabilities.
We are subject to a wide range of general and industry-specific laws and regulations relating to the protection of the environment, including those governing air emissions, wastewater discharges, timber harvesting, the storage, management and disposal of hazardous substances and waste, the clean-up of contaminated sites, landfill and lagoon operation and closure, forestry operations, endangered species habitat and health and safety. As an owner and operator of real estate and manufacturing and processing facilities, we may be liable under environmental laws for cleanup and other costs and damages, including tort liability and damages to natural resources, resulting from past or present spills or releases of hazardous or toxic substances on or from our current or former properties. We may incur liability under these laws without regard to whether we knew of, were responsible for, or owned the property at the time of, any spill or release of hazardous or toxic substances on or from our property, or at properties where we arranged for the disposal of regulated materials. Claims may also arise out of currently unknown environmental conditions or aggressive enforcement efforts by governmental or private parties. As a result of the above, we may be required to record additional environmental liabilities. For information regarding environmental matters to which we are subject, see Note 20, “Commitments and Contingencies – Environmental matters,” to our Consolidated Financial Statements.
We are subject to physical and financial risks associated with climate change.
Our operations are subject to climate variations, which impact the productivity of forests, the distribution and abundance of species and the spread of disease or insect epidemics, which may adversely or positively affect timber production. Over the past several years, changing weather patterns and climatic conditions have added to the unpredictability and frequency of natural disasters such as hurricanes, earthquakes, hailstorms, wildfires, snow and ice storms, which could also affect our woodlands or cause variations in the cost for raw materials, such as fiber. Changes in precipitation resulting in droughts could adversely affect our hydroelectric facilities’ production, increasing our energy costs, while increased precipitation may generally have positive effects.
To the extent climate change impacts raw material availability or our electricityhydroelectric production, it may also impact our costs and revenues. Furthermore, should financial markets view climate change as a financial risk, our ability to access capital markets or to receive acceptable terms and conditions could be affected.
We may be required to record additional long-lived asset impairment or accelerated depreciation charges.
Losses related to the impairment of long-lived assets to be held and used are recognized when circumstances indicate the carrying value of an asset group may not be recoverable, such as continuing losses in certain businesses. When indicators that the carrying value of an asset group may not be recoverable are triggered, we evaluate the carrying value of the asset group in relation to its expected undiscounted future cash flows. If the carrying value of an asset group is greater than the expected undiscounted future cash flows to be generated by the asset group, an impairment charge is recognized based on the excess of the asset group’s carrying value over its fair value. If it is determined that the carrying value of an asset group is recoverable, we review and adjust, as necessary, the estimated useful lives of the assets in the group.
If there were to be a triggering event, it is possible that we could record non-cash long-lived asset impairment or accelerated depreciation charges in future periods, which would be recorded as operating expenses and would directly and negatively impact our reported operating income (loss) and net income (loss).results of operations. One group of assets, for which the remaining useful life is being monitored closely, are the tangible and intangible assets associated with our Jim-Gray hydroelectric installation,dam, which is part of the Hydro Saguenay facility that provides hydroelectric power to certain mills in the province of Quebec. The province of Quebec informed us on December 30, 2011 that it intended not to terminaterenew our water rights associated with this facilityour Jim-Gray hydroelectric dam and to require us to transfer property of the associated installationproperty to the province for no consideration. The termination andOn February 6, 2013, the province of Quebec granted us an extension to transfer the property. As extended, an agreement on the terms of the transfer would need to be effective as of March 2, 2012.entered into at the latest
on June 14, 2013. The province’s actions are not consistent withcontrary to our understanding of the agreementwater power lease in question. We continue to evaluate our legal options. The net book value of this hydroelectric facilitydam was tested for impairment with the other assets in its asset group and no impairment was indicated. At this time, we believe that the remaining useful life of the assets remains unchanged, as we continue pursuing the renewal of our water rights at the facility.unchanged. The carrying value of the long-lived assets associated with the Jim-Gray installationdam as of December 31, 20112012 was approximately $95$93 million. If we are unable to renew the water rights at this facility,dam, we will reevaluate the remaining useful life of these assets, which may result in accelerated depreciation and amortization charges in the first quarter of 2012.
We could be compelled to make additional environmental remediation payments in respect of certain sites we formerly owned and/or operated in the province of Newfoundland and Labrador.
On March 31, 2010, the Canadian Court dismissed a motion for declaratory judgment brought by the province of Newfoundland and Labrador, awarding costs in our favor, and thus confirmed our positionat that the five orders the province issued under section 99 of its Environmental Protection Act on November 12, 2009 were subject to the stay of proceedings pursuant to the Creditor Protection Proceedings. The province of Newfoundland and Labrador’s orders could have required us to proceed immediately with the environmental remediation of various sites we formerly owned or operated, some of which the province expropriated in December 2008. The Quebec Court of Appeal denied the province’s request for leave to appeal on May 18, 2010. An appeal of that decision is now pending before the Supreme Court of Canada, which heard the matter on November 16, 2011. If leave to appeal is ultimately granted and the appeal is allowed, we could be required to make additional environmental remediation payments without regard to the Creditor Protection Proceedings. Any additional environmental remediation payments required to be made by us could have a material adverse effect on our results of operations or financial condition. For information regarding our environmental matters, see Note 20, “Commitments and Contingencies – Environmental matters,” to our Consolidated Financial Statements.time.
We could experience disruptions in operations or increased labor costs due to labor disputes.
As of December 31, 2011,2012, we employed approximately 10,4009,300 people, of whom approximately 7,9006,700 were represented by bargaining units. Our unionized employees are represented predominantly by the CEP and the CSNCNTU in Canada and predominantly by the United Steelworkers International in the U.S. The collective agreements covering 350 employees working in five of our woodlands and sawmills operations in Canada have expired and are subject to renegotiation. The collective agreements covering approximately 3,000 employees (2,000 in Canada and 1,000 in the U.S.) in 12 of our pulp and paper operations, and 300 employees in three of our woodlands and sawmills operations in Canada, are scheduled to expire in April 2014.
We haveWhile we intend to negotiate to renew collective bargaining agreements, in place covering the majority of our unionized employees, many of which have been recently renewed and revised. However, there can be no assurance that we will be able to renew agreements on satisfactory terms, or that we will maintain continuously satisfactory agreements with all of our unionized employees or that we will finalize satisfactory agreements with the remaining unionized employees (which include approximately 200 wood workers in Quebec).employees. Should we be unable to do so, it could result in strikes or other work stoppages by affected employees, which could cause us to experience a disruption of operations and affect our business, financial condition or results of operations.
The occurrence of natural or man-made disasters could disrupt our supply chain and the delivery of our products and adversely affect our financial condition or results of operations.
The success of our businesses is largely contingent on the availability of direct access to raw materials and our ability to ship products on a timely basis. As a result, any event that disrupts or limits transportation or delivery services wouldcould materially and adversely affect our business. In addition, our operating results are dependent on the continued operation of our various production facilities and the ability to complete construction and maintenance projects on schedule. Material operating interruptions at our facilities, including interruptions caused by the events described below, may materially reduce the productivity and profitability of a particular manufacturing facility, or our business as a whole, during and after the period of such operational difficulties.
Although we take precautions to enhance the safety of our operations and minimize the risk of disruptions, our operations are subject to hazards inherent in our business and the transportation of raw materials, products and wastes. These potential hazards include: explosions; fires; severe weather and natural disasters; mechanical failures; unscheduled downtimes; supplier disruptions; labor shortages or other labor difficulties; transportation interruptions; remediation complications; discharges or releases of toxic or hazardous substances or gases; other environmental risks; and terrorist acts.
Some of these hazards may cause personal injury and loss of life, severe damage to or destruction of property and equipment and environmental damage and may result in suspension of operations, the shutdown of affected facilities and the imposition of civil or criminal penalties. Furthermore, except for claims that were addressed by the Plans of Reorganization, we will also continue to be subject to present and future claims with respect to workplace exposure, exposure of contractors on our premises, as well as other persons located nearby, workers’ compensation and other matters.
We maintain property, business interruption, product, general liability, casualty and other types of insurance, including pollution and legal liability, that we believe are in accordance with customary industry practices, but we are not fully insured against all potential hazards incident to our business, including losses resulting from natural disasters, war risks or terrorist acts. Changes in insurance market conditions have caused, and may in the future cause, premiums and deductibles for certain insurance policies to increase substantially and in some instances, for certain insurance to become unavailable or available only for reduced amounts of coverage. If we were to incur a significant liability for which we were not fully insured, we might not be able to finance the amount of the uninsured liability on terms acceptable to us or at all, and might be obligated to divert a significant portion of our cash flow from normal business operations.
Shared control or lack of control of joint ventures may delay decisions or actions regarding the joint ventures.
A portion of our operations currently are, and may in the future be, conducted through joint ventures, where control may be exercised by or shared with unaffiliated third parties. We cannot control the actions of our joint venture partners, including any nonperformance, default or bankruptcy of joint venture partners. The joint ventures that we do not control may also lack adequate internal controls systems.
In the event that any of our joint venture partners do not observe their joint venture obligations, it is possible that the affected joint venture would not be able to operate in accordance with our business plans or that we would be required to increase our level of commitment in order to give effect to such plans. As with any such joint venture arrangements, differences in views among the joint venture participants may result in delayed decisions or in failures to agree on major matters, potentially adversely affecting the business and operations of the joint ventures and in turn our business and operations.
Bankruptcy of a significant customer could have a material adverse effect on our liquidity, financial condition or results of operations.
Trends in alternative media continue to impact the operations of our newsprint customers. See “—Developments in alternative media could continue to adversely affect the demand for our products, especially in North America, and our responses to these developments may not be successful” above. If a customer is forced into bankruptcy as a result of these trends, any receivables related to that customer prior to the date of the bankruptcy filing of such customer may not be realized. In addition, such a customer may choose to reject its contracts with us, which could result in a larger claim arising prior to the date of the bankruptcy filing of such customer that also may not be realized.
Because our consolidated financial statements as of and for the year ended December 31, 2010 reflect adjustments related to the implementation of the Plans of Reorganization and the application of fresh start accounting as a result of our emergence from the Creditor Protection Proceedings, the consolidated financial statements of the Successor Company are not comparable to the consolidated financial statements of the Predecessor Company.
As of December 31, 2010, we applied fresh start accounting, pursuant to which the reorganization value, as derived from the enterprise value established in the Plans of Reorganization, was allocated to our assets and liabilities based on their fair values (except for deferred income taxes and pension and other postretirement (“OPEB”) benefit obligations) in accordance with FASB ASC 805, “Business Combinations,” with the excess of net asset values over the reorganization value recorded as an adjustment to equity. The amount of deferred income taxes recorded was determined in accordance with FASB ASC 740, “Income Taxes.” The amount of pension and OPEB benefit obligations recorded was determined in accordance with FASB ASC 715, “Compensation – Retirement Benefits.” Additionally, the implementation of the Plans of Reorganization, among other things, resulted in a new capital structure that replaced our historical pre-petition capital structure. The implementation of the Plans of Reorganization and the application of fresh start accounting materially changed the carrying amounts and classifications reported in our consolidated financial statements and resulted in the Company becoming a new entity for financial reporting purposes. Accordingly, our consolidated financial statements as of December 31, 2010 and for periods subsequent to December 31, 2010 are not comparable to our consolidated financial statements for periods prior to December 31, 2010. For additional information, see Note 3, “Creditor Protection Proceedings,” to our Consolidated Financial Statements and “Plans of Reorganization” in Item 7.
Certain liabilities were not fully extinguished as a result of our emergence from the Creditor Protection Proceedings.
While a significant amount of our existing liabilities were discharged upon emergence from the Creditor Protection Proceedings, a number of obligations remain in effect following the effective date of the Plans of Reorganization. Various agreements and liabilities remain in place, such as certain employee benefit and pension obligations, potential environmental liabilities related to sites in operation or formerly owned or operated by us and other contracts that, even if they were modified during the Creditor Protection Proceedings, may still subject us to substantial obligations and liabilities. Other claims, such as those alleging toxic tort or product liability, or environmental liability related to formerly owned or operated sites, were not extinguished.
Other circumstances in which claims and other obligations that arose prior to Creditor Protection Proceedings were not discharged include instances where a claimant had inadequate notice of the Creditor Protection Proceedings or a valid argument as to when its claim arose or as a matter of law or otherwise.
There are significant holders of our common stock.
As publicly reported on SEDAR and with the SEC, thereThere are several significant holders of our common stock who own a substantial percentage of the outstanding shares of our common stock. These holders may increase their percentage ownership of our common stock, including as a result of additional distributions pursuant to the Creditor Protection Proceedings. These holders may be in a position to influence the outcome of actions requiring shareholder approval, including, among other things, the election of board members. This concentration of ownership could also facilitate or hinder a negotiated change of control and consequently, impact the value of our common stock. Furthermore, the possibility that one or more of these holders may sell all or a large portion of our common stock in a short period of time may adversely affect the trading price of our common stock.
We are subject to cyber-security risks related to breaches of security pertaining to sensitive company, customer, employee and vendor information as well as breaches in the technology that manages operations and other business processes.
We use information technologies to securely manage operations and various business functions. We rely upon various technologies to process, store and report on our business and interact with customers, vendors and employees. The secure processing, maintenance and transmission of this information is critical to our operations and business strategy. Despite our security design and controls, and those of our third party providers, our information technology and infrastructure may be vulnerable to cyber attacks by hackers or breaches due to employee error, malfeasance or other disruptions. Any such breach could result in operational disruptions or the misappropriation of sensitive data which could subject us to legal claims or proceedings and have a negative impact on our reputation. There can be no assurance that such disruptions or misappropriations and the resulting repercussions will not negatively impact our cash flows and materially affect our results of operations or financial condition.
ITEM 1B. UNRESOLVED STAFF COMMENTS
None.
Information regarding our owned properties is included in Item 1, “Business.”
In addition to the properties that we own, we also lease under long-term leases certain timberlands, office premises and office and transportation equipment and have harvesting rights with respect to certain timberlands. Information regarding our timberland and operating leases and harvesting rights is included in Note 23, “Timberland and Operating Leases and Purchase Obligations,” to our Consolidated Financial Statements.
BCFC Bankruptcy and Insolvency Act Filing
As part of a negotiated resolution to certain objections to the Plans of Reorganization, as reflected in the U.S. Court’s order confirming the Chapter 11 Reorganization Plan, BCFC was dismissed from the CCAA proceedings and is expected to be dismissed from the Chapter 11 cases. In addition, BCFC has made an assignment for the benefit of its creditors under theBankruptcy and Insolvency Act(Canada) (the “BIA”). BCFC appointed a trustee as its representative in the BIA filing, whose responsibilities are to prosecute its claims (including a disputed claim in the Creditor Protection Proceedings), distribute its property, if any, and others as provided by the BIA.
Legal Items
We are involved in various legal proceedings relating to contracts, commercial disputes, taxes, environmental issues, employment and workers’ compensation claims, Aboriginal claims and other matters. We periodically review the status of these proceedings with both inside and outside counsel. Although the final outcome of any of these matters is subject to many variables and cannot be predicted with any degree of certainty, we establish reserves for a matter (including legal costs expected to be incurred) when we believe an adverse outcome is probable and the amount can be reasonably estimated. We believe that the ultimate disposition of these matters will not have a material adverse effect on our financial condition, but it could have a material adverse effect on our results of operations in any given quarter or year.
Subject to certain exceptions, all litigation against the entities subject to the Creditor Protection Proceedings (the “Debtors”) that arose out of pre-petition conduct or acts was subject to the automatic stay provisions of Chapter 11 and the CCAA and the orders of the Courtscourts rendered thereunder and subject to certain exceptions, any recovery by the plaintiffs in those matters was treated consistently with all other general unsecured claims in the Creditor Protection Proceedings, i.e., to the extent a disputed general unsecured claim becomes an accepted claim, the claimholder would be entitled to receive a ratable amount of Successor Company common stock from the reserve established on the Emergence Date for this purpose, as discussed in Item 1, “Business – Emergence From CreditorNote 4, “Creditor Protection Proceedings.Proceedings,” to our Consolidated Financial Statements. As a result, we believe that these matters will not have a material adverse effect on our results of operations or financial position.
Effective July 31, 2012, we completed the second step transaction pursuant to which we acquired the remaining 25.4% of the outstanding Fibrek shares, following the approval of Fibrek’s shareholders on July 23, 2012, and the issuance of a final order of the Canadian Court approving the arrangement on July 27, 2012. Certain former shareholders of Fibrek exercised (or purported to exercise) rights of dissent in respect of the transaction, asking for a judicial determination of the fair value of their claim under the Canada Business Corporations Act. No consideration has to date been paid to the former Fibrek shareholders who exercised (or purported to exercise) rights of dissent. Any such consideration will only be paid out upon settlement or judicial determination of the fair value of their claims and will be paid entirely in cash. Accordingly, we cannot presently determine the amount that ultimately will be paid to former holders of Fibrek shares in connection with the proceedings, but we have reserved approximately Cdn$14 million ($14 million, based on the exchange rate in effect on December 31, 2012) for the eventual payment of those claims.
On June 12, 2012, we filed a motion for directives the Canadian Court seeking an order to prevent pension regulators in each of Quebec, New Brunswick and Newfoundland and Labrador from declaring partial wind-ups of pension plans relating to employees of former operations in New Brunswick and Newfoundland and Labrador, or a declaration that any claim for accelerated reimbursements of deficits arising from a partial wind-up is a barred claim under the Creditor Protection Proceedings. These plans are subject to the funding relief regulations described in Note 18, “Pension and Other Postretirement Benefit Plans – Canadian pension funding,” to our Consolidated Financial Statements and we contend, among other things, that any such declaration, if issued, would be inconsistent with the Canadian Court’s sanction order confirming the Plan of Reorganization and the terms of our emergence from the Creditor Protection Proceedings. A partial wind-up would likely shorten the period in which any deficit within those plans, which could exceed $150 million, would have to be funded if we do not obtain the relief sought. The pension regulators filed contestations to our motion in August 2012.
On March 31, 2010, the Canadian Court dismissed a motion for declaratory judgment brought by the province of Newfoundland and Labrador, awarding costs in our favor, and thus confirmed our position that the five orders the province issued under section 99 of its Environmental Protection Act on November 12, 2009 were subject to the stay of proceedings and the application of the claims
procedure order pursuant to the Creditor Protection Proceedings. The province of Newfoundland and Labrador’s orders could have required us to proceed immediately with the environmental remediation of various sites we formerly owned or operated, some of which the province expropriated in December 2008. The Quebec Court of Appeal denied the province’s request for leave to appeal on May 18, 2010. An appeal of that decision is now pending before2010 and the Supreme Court of Canada which heard the matter on November 16, 2011. If leave to(the last level of appeal is ultimately granted andin Canada) denied the appeal is allowed, we could be required to make additional environmental remediation payments without regard toof that decision on December 7, 2012.
BCFC was dismissed from the Creditor Protection Proceedings which payments could haveas part of a material impact on our resultsnegotiated resolution to certain objections to the Plans of operations or financial condition.
Since late 2001, Bowater, several other paper companies,Reorganization, and numerous other companies have been namedit subsequently made an assignment for the benefit of its creditors under the Bankruptcy and Insolvency Act (Canada) (the “BIA”). BCFC appointed Green Hunt Wedlake Inc. (the “BCFC Trustee”) as defendantsits representative in asbestos personal injury actions. These actions generally allege occupational exposurethe BIA filing, whose responsibilities were, among others, to numerous products. We have denied the allegations and no specific product of ours has been identified by the plaintiffs in any of the actions as having caused or contributed to any individual plaintiff’s alleged asbestos-related injury. These suits have been filed by approximately 1,800 claimants who sought monetary damages in civil actions pending in state courts in Delaware, Georgia, Illinois, Mississippi, Missouri, New York and Texas. Approximately 1,000 of theseprosecute BCFC’s claims have been dismissed, either voluntarily or by summary judgment, and approximately 645 claims remain. A motion to dismiss will be filed in each state for all matters related to products and premises where the plaintiffs did not file(including a disputed claim in the Creditor Protection Proceedings in connection with the 7.95% notes due November 15, 2011 issued by BCFC (the “7.95% Notes”)) and distribute its property, if any. On September 21, 2012, in connection with the Creditor Protection Proceedings, Resolute FP US Inc. (formerly “AbiBow US Inc.” and Bowater), entered into a settlement agreement with the BCFC Trustee, Wilmington Trust Company, as the successor indenture trustee with respect to the 7.95% Notes (the “Indenture Trustee”), and Avidity Partners, LLC, the Post-Effective Date Claims Agent under the confirmed Chapter 11 Plan of Reorganization. The settlement agreement resolved the claims process. All Mississippi productsagainst Bowater filed by the BCFC Trustee and premises cases were dismissed, with other dismissals to follow. We expect that any resulting liability would be a general unsecured claimthe Indenture Trustee in the Creditor Protection Proceedings. We subsequently distributed approximately 15 million shares of common stock from the disputed claim share reserve to the BCFC Trustee and to the holders of allowed and accepted unsecured creditor claims resolution process, which would be settled outentitled to additional distributions under the Plans of Reorganization. These distributions were not dilutive, as the shares in the reserve have been deemed outstanding since emergence. As a result of the share reserveBIA filing, the BCFC Trustee controls the entity and would not impact our results of operationsis responsible for prosecuting any remaining claim and cash flows.
For a discussion of environmental matters to which we are subject, see Note 20, “Commitments and Contingencies – Environmental matters,” to our Consolidated Financial Statements.distributing its property under the BIA.
ITEMITEM 4.MINE SAFETY DISCLOSURES
Not applicable.
| ITEM 5. | MARKET FOR REGISTRANT’S COMMON EQUITY, RELATED STOCKHOLDER MATTERS AND ISSUER PURCHASES OF EQUITY SECURITIES |
The Predecessor Company’sOur common stock began trading under the symbol “ABH”trades on both the NYSE and the TSXTSX. The ticker symbol for our common stock was changed from “ABH” to “RFP” on October 29, 2007, following the consummation of the Combination. As a result of the Creditor Protection Proceedings, each of the NYSE and the TSX delisted this common stock at the opening of business on May 21, 2009 and the close of market on May 15, 2009, respectively. During the Creditor Protection Proceedings, this common stock traded in the over-the-counter market and was quoted on the Pink Sheets Quotation Service24, 2012 and on the OTC Bulletin Board under the symbol “ABWTQ.”
As of the Emergence Date and pursuant to the Plans of Reorganization, each share of the Predecessor Company’s common stock and each option, warrant, conversion privilege or other legal or contractual right to purchase shares of the Predecessor Company’s common stock, in each case to the extent outstanding immediately before the Emergence Date, was canceled and the holders thereof are not entitled to receive or retain any property on account thereof. On the Emergence Date, we issued 97,134,954 shares of new common stock. The Successor Company’s common stock began trading under the symbol “ABH” on both the NYSE and the TSX on December 10, 2010.
On December 31, 2010, AbitibiBowater Inc. issued 17,010,728 shares of unregistered common stock to Donohue Corp. (“Donohue,” a wholly-owned subsidiary of AbitibiBowater Inc.) as part of an internal tax restructuring contemplated by the Plans of Reorganization. The shares were issued to Donohue in exchange for all of the outstanding shares of common stock of two of Donohue’s wholly-owned subsidiaries, each of which also was an indirect wholly-owned subsidiary of ours. We accounted for these shares as treasury stock in our Consolidated Balance Sheets. The shares are voting stock but, in accordance with applicable Delaware corporate law, they will not be entitled to vote on matters brought before our shareholders nor be counted for quorum purposes. If ever entitled to vote,e.g., on account of a change in applicable law, Donohue has agreed with us that the shares will be voted in proportion to the votes of non-affiliated shareholders on all matters. The issuance of the shares to Donohue was made without registration under the Securities Act of 1933 (as amended, the “Securities Act”) in reliance on the exemption from registration provided under section 4(2) thereof.May 28, 2012.
The high and low prices of our common stock for 20102011 and 2011,2012, by quarter, are set forth below. The data through December 9, 2010 reflects inter-dealer prices, without retail mark-up, mark-down or commission and may not necessarily represent actual transactions.
| High | Low | High | Low | |||||||||||||
Predecessor common stock: | ||||||||||||||||
2010 | ||||||||||||||||
First quarter | $ | 0.24 | $ | 0.09 | ||||||||||||
Second quarter | $ | 0.60 | $ | 0.09 | ||||||||||||
Third quarter | $ | 0.14 | $ | 0.01 | ||||||||||||
Fourth quarter – October 1 – December 9 | $ | 0.08 | $ | 0.00 | ||||||||||||
Successor common stock: | ||||||||||||||||
2010 | ||||||||||||||||
Fourth quarter – December 10 – December 31 | $ | 25.15 | $ | 21.50 | ||||||||||||
2011 | ||||||||||||||||
2011: | ||||||||||||||||
First quarter | $ | 30.54 | $ | 22.94 | $ | 30.54 | $ | 22.94 | ||||||||
Second quarter | $ | 28.34 | $ | 19.41 | $ | 28.34 | $ | 19.41 | ||||||||
Third quarter | $ | 21.18 | $ | 14.42 | $ | 21.18 | $ | 14.42 | ||||||||
Fourth quarter | $ | 18.20 | $ | 13.70 | $ | 18.20 | $ | 13.70 | ||||||||
2012: | ||||||||||||||||
First quarter | $ | 16.22 | $ | 14.20 | ||||||||||||
Second quarter | $ | 14.40 | $ | 10.15 | ||||||||||||
Third quarter | $ | 14.95 | $ | 9.02 | ||||||||||||
Fourth quarter | $ | 13.93 | $ | 10.40 | ||||||||||||
As of January 31, 2012,2013, there were approximately 2,7005,177 holders of record of the Successor Company’sour common stock.
During the Creditor Protection Proceedings, we could not pay dividends on the Predecessor Company’s common stock under the terms of our debtor in possession financing arrangements. It is unlikely that we will pay any dividends with respect to the Successor Company’sour common stock in the foreseeable future. Any future determination to pay dividends will be at the discretion of the boardBoard of directorsDirectors and will be dependent on then-existing conditions, including our financial condition,
results of operations, capital requirements, contractual restrictions, business prospects and other factors that the boardBoard of directorsDirectors considers relevant. The 2018 Notes indenture and the credit agreement that governs the ABL Credit Facility contain restrictions on our ability to pay dividends.
We did not repurchase any shares of commonThe following table sets forth information about our stock during 2010 and 2011 nor have we made any public announcement of plans or programs to date.repurchases for the three months ended December 31, 2012:
| Period | Total Number of Shares Purchased | Average Price Paid per Share | Total Number of Shares Purchased as Part of Publicly Announced Plans or Programs | Approximate Dollar Value of Shares That May Yet Be Purchased Under the Plans or Programs(1) | ||||||||||||
October 1 to October 31 | 462,505 | $ | 12.42 | 462,505 | $ | 49,586,084 | ||||||||||
November 1 to November 30 | 1,176,800 | 11.14 | 1,176,800 | 36,482,382 | ||||||||||||
December 1 to December 31 | 306,900 | 11.75 | 306,900 | 32,876,629 | ||||||||||||
Total | 1,946,205 | $ | 11.54 | 1,946,205 | $ | 32,876,629 | ||||||||||
| (1) | On May 22, 2012, our Board of Directors approved a share repurchase program of up to 10% of our common stock, for an aggregate purchase price of up to $100 million. |
See Part III, Item 12 of this Form 10-K, “Security Ownership of Certain Beneficial Owners and Management and Related Stockholder Matters,” for information regarding our equity compensation plan.
The following graph compares the cumulative total return attained by shareholders on our common stock versus the cumulative total returns of the S&P 500 index and a peer group of five companies since December 10, 2010, the date the Successor Company’sour common stock began trading following our emergence from the Creditor Protection Proceedings. The individual companies comprising the peer group are: Domtar Corporation, International Paper Company, UPM – Kymmene Corporation, Verso Paper Corp. and Weyerhaeuser Company. The graph tracks the performance of a $100 investment in our common stock on December 10, 2010, in the S&P 500 index on November 30, 2010 and in the peer group on November 30, 2010 (with the reinvestment of all dividends) to December 31, 2011.2012. Data for periods prior to December 10, 2010 is not shown because of the Creditor Protection Proceedings and the fact that the financial results of the Successor Company are not comparable to the results of the Predecessor Company. The stock price performance included in the graph is not necessarily indicative of future stock price performance.
COMPARISON OF CUMULATIVE TOTAL RETURN
Among AbitibiBowater, the S&P 500 Index, and a Peer Group
ITEM 6. SELECTED FINANCIAL DATA
The following table presents summary historical consolidated financial information for each of the last five years and should be read in conjunction with Items 7 and 8. The selected financial information for the years ended December 31, 2012, 2011 2010 and 20092010 and as of December 31, 20112012 and 20102011 under the captions “Statement of Operations Data,” “Segment Sales Information,” “Statement of Cash Flows Data” and “Financial Position” shown below has been derived from our audited Consolidated Financial Statements.
As discussed in Part I, Item 1, “Business” – Basis of this Form 10-K, on October 29, 2007, Abitibi and Bowater became subsidiaries of AbitibiBowater Inc. Bowater was deemed to be the “acquirer” of Abitibi for accounting purposes and AbitibiBowater Inc. was deemed to be the successor to Bowater for purposes of U.S. securities laws and financial reporting. Therefore, the data set forth below reflects the results of operations and financial position of Bowater for the period before October 29, 2007 and those of both Abitibi and Bowater for periods beginning on or after October 29, 2007.
As previously discussed,Presentation,” the implementation of the Plans of Reorganization and the application of fresh start accounting materially changed the carrying amounts and classifications reported in our Consolidated Financial Statements and resulted in the Company becoming a new entity for financial reporting purposes. Accordingly, the consolidated financial statements of the Successor Company are not comparable to the consolidated financial statements of the Predecessor Company. For additional information, see Note 3,4, “Creditor Protection Proceedings,” to our Consolidated Financial Statements and “Plans of Reorganization” in Item 7.
| Successor | Predecessor | Successor | Predecessor | |||||||||||||||||||||||||||||||||||||||||
| (In millions, except per share amounts or otherwise indicated) | 2011 | 2010 | 2009 | 2008 | 2007 | 2012 | 2011 | 2010 | 2009 | 2008 | ||||||||||||||||||||||||||||||||||
Statement of Operations Data | ||||||||||||||||||||||||||||||||||||||||||||
Sales | $ | 4,756 | $ | 4,746 | $ | 4,366 | $ | 6,771 | $ | 3,876 | $ | 4,503 | $ | 4,756 | $ | 4,746 | $ | 4,366 | $ | 6,771 | ||||||||||||||||||||||||
Operating income (loss)(1) | 198 | (160) | (375) | (1,430) | (400) | |||||||||||||||||||||||||||||||||||||||
Operating (loss) income(1) | (30 | ) | 198 | (160 | ) | (375 | ) | (1,430 | ) | |||||||||||||||||||||||||||||||||||
Reorganization items, net(2) | – | 1,901 | (639) | – | – | – | – | 1,901 | (639 | ) | – | |||||||||||||||||||||||||||||||||
Income (loss) before extraordinary item | 39 | 2,775 | (1,560) | (1,951) | (491) | |||||||||||||||||||||||||||||||||||||||
Net income (loss) attributable to AbitibiBowater Inc.(3) | 41 | 2,614 | (1,553) | (2,234) | (490) | |||||||||||||||||||||||||||||||||||||||
Basic net income (loss) per share attributable to AbitibiBowater Inc. common shareholders | 0.42 | 45.30 | (26.91) | (38.79) | (14.11) | |||||||||||||||||||||||||||||||||||||||
Diluted net income (loss) per share attributable to AbitibiBowater Inc. common shareholders | 0.42 | 27.63 | (26.91) | (38.79) | (14.11) | |||||||||||||||||||||||||||||||||||||||
(Loss) income before extraordinary item | (2 | ) | 39 | 2,775 | (1,560 | ) | (1,951 | ) | ||||||||||||||||||||||||||||||||||||
Net (loss) income attributable to Resolute Forest Products Inc.(3) | (2 | ) | 41 | 2,614 | (1,553 | ) | (2,234 | ) | ||||||||||||||||||||||||||||||||||||
Basic net (loss) income per share attributable to Resolute Forest Products Inc. common shareholders | (0.02 | ) | 0.42 | 45.30 | (26.91 | ) | (38.79 | ) | ||||||||||||||||||||||||||||||||||||
Diluted net (loss) income per share attributable to Resolute Forest Products Inc. common shareholders | (0.02 | ) | 0.42 | 27.63 | (26.91 | ) | (38.79 | ) | ||||||||||||||||||||||||||||||||||||
Dividends declared per common share | – | – | – | – | 1.15 | – | – | – | – | – | ||||||||||||||||||||||||||||||||||
Segment Sales Information | ||||||||||||||||||||||||||||||||||||||||||||
Newsprint | $ | 1,816 | $ | 1,804 | $ | 1,802 | $ | 3,238 | $ | 1,574 | $ | 1,627 | $ | 1,816 | $ | 1,804 | $ | 1,802 | $ | 3,238 | ||||||||||||||||||||||||
Coated papers | 538 | 482 | 416 | 659 | 570 | 455 | 538 | 482 | 416 | 659 | ||||||||||||||||||||||||||||||||||
Specialty papers | 1,275 | 1,321 | 1,331 | 1,829 | 800 | 1,107 | 1,275 | 1,321 | 1,331 | 1,829 | ||||||||||||||||||||||||||||||||||
Market pulp | 659 | 715 | 518 | 626 | 600 | 814 | 659 | 715 | 518 | 626 | ||||||||||||||||||||||||||||||||||
Wood products | 468 | 424 | 290 | 418 | 318 | 500 | 468 | 424 | 290 | 418 | ||||||||||||||||||||||||||||||||||
Other | – | – | 9 | 1 | 14 | – | – | – | 9 | 1 | ||||||||||||||||||||||||||||||||||
| $ | 4,756 | $ | 4,746 | $ | 4,366 | $ | 6,771 | $ | 3,876 | $ | 4,503 | $ | 4,756 | $ | 4,746 | $ | 4,366 | $ | 6,771 | |||||||||||||||||||||||||
Statement of Cash Flows Data | ||||||||||||||||||||||||||||||||||||||||||||
Net cash provided by (used in) operating activities | $ | 198 | $ | 39 | $ | 46 | $ | (420) | $ | (247) | $ | 266 | $ | 198 | $ | 39 | $ | 46 | $ | (420 | ) | |||||||||||||||||||||||
Cash invested in fixed assets | 97 | 81 | 101 | 186 | 128 | 169 | 97 | 81 | 101 | 186 | ||||||||||||||||||||||||||||||||||
| Successor | Predecessor | Successor | Predecessor | |||||||||||||||||||||||||||||||||||||||||
| 2011 | 2010 | 2009 | 2008 | 2007 | 2012 | 2011 | 2010 | 2009 | 2008 | |||||||||||||||||||||||||||||||||||
Financial Position | ||||||||||||||||||||||||||||||||||||||||||||
Fixed assets | $ | 2,502 | $ | 2,641 | $ | 3,897 | $ | 4,507 | $ | 5,733 | $ | 2,440 | $ | 2,502 | $ | 2,641 | $ | 3,897 | $ | 4,507 | ||||||||||||||||||||||||
Total assets | 6,298 | 7,135 | 7,112 | 8,072 | 10,287 | 6,324 | 6,298 | 7,135 | 7,112 | 8,072 | ||||||||||||||||||||||||||||||||||
Long-term debt, including current portion(6) (7) | 621 | 905 | 613 | 5,293 | 5,059 | |||||||||||||||||||||||||||||||||||||||
Total debt(6) (7) | 621 | 905 | 1,499 | 5,970 | 5,648 | |||||||||||||||||||||||||||||||||||||||
Long-term debt, including current portion(5) (6) | 534 | 621 | 905 | 613 | 5,293 | |||||||||||||||||||||||||||||||||||||||
Total debt(5) (6) | 534 | 621 | 905 | 1,499 | 5,970 | |||||||||||||||||||||||||||||||||||||||
Additional Information | ||||||||||||||||||||||||||||||||||||||||||||
Employees (number) | 10,400 | 10,500 | 12,100 | 15,900 | 18,000 | 9,300 | 10,400 | 10,500 | 12,100 | 15,900 | ||||||||||||||||||||||||||||||||||
| (1) | Operating (loss) income |
| (2) | Certain expenses, provisions for losses and other charges and credits directly associated with or resulting from the reorganization and restructuring of the business that were realized or incurred in the Creditor Protection Proceedings, including the impact of the implementation of the Plans of Reorganization and the application of fresh start accounting, were recorded in “Reorganization items, net” in our Consolidated Statements of Operations. For additional information, see Note |
| (3) | Net loss attributable to |
| (4) |
|
As part of the application of fresh start accounting, fixed assets were adjusted to their fair values as of December 31, 2010. |
As of the Emergence Date and pursuant to the Plans of Reorganization, all amounts outstanding under our debtor in possession financing arrangements and the Debtors’ pre-petition secured debt obligations were paid in full in cash and certain holders of allowed claims arising from the Debtors’ pre-petition unsecured debt obligations received their pro rata share of the Successor Company’s common stock. Additionally, upon the consummation of the Plans of Reorganization, we assumed the obligations in respect of the $850 million principal amount of 2018 Notes issued by an escrow subsidiary of ours. In 2012 and 2011, we redeemed $85 million and $264 million, respectively, of principal amount of the 2018 Notes. For additional information, see Note |
Due to the commencement of the Creditor Protection Proceedings, our consolidated balance sheet as of December 31, 2009 included unsecured pre-petition debt obligations of $4,852 million included in liabilities subject to compromise, secured pre-petition debt obligations of $980 million included in current liabilities and secured pre-petition |
ITEM 7. MANAGEMENT’S DISCUSSION AND ANALYSIS OF FINANCIAL CONDITION AND RESULTS OF OPERATIONS
The following management’s discussion and analysis of financial condition and results of operations (“MD&A”) provides information that we believe is useful in understandingintended to help the reader understand Resolute Forest Products, our results of operations, cash flows and financial condition for the years ended December 31, 2011, 2010condition. The discussion is provided as a supplement to, and 2009. This discussion should be read in conjunction with, our consolidated financial statements and the accompanying notes contained inItem 8 – Financial Statements and Supplementary Data.
OVERVIEW
Resolute Forest Products is qualifieda global leader in its entiretythe forest products industry. We own or operate over 40 pulp and paper mills and wood products facilities in the U.S., Canada and South Korea, and power generation assets in Quebec, Canada. By capacity, we are the largest producer of newsprint in the world, the largest producer of uncoated mechanical papers in North America and the biggest Canadian volume producer of wood products east of the Rockies. We are also a significant North American producer in coated papers and market pulp.
We are guided by referenceour vision and values, focusing on safety, profitability, accountability, sustainability and teamwork, and we believe that the following elements best define us:
| — | Competitive cost structure – as a result of aggressive cost reductions and mill rationalizations, today we compete as a leading, lower-cost North American producer. When compared to the company that filed for creditor protection in 2009, today we have dramatically lower fixed costs and a significantly lower breakeven point. |
| — | Synergistic and diversified asset base – in implementing our mill rationalization efforts, we operate our best assets, closing or selling the higher cost ones. Our harvesting rights and extensive network of Canadian sawmills not only makes us a significant lumber producer in eastern North America, but also give us the benefit of integration from the harvested log all the way through the paper roll or pulp bale. In the U.S., we source primarily from the low-cost southeastern fiber basket. |
| — | Financial strength – we make disciplined capital management a priority, and we strive to maintain a conservative capital structure. |
Our business
Products
Our 3.1 million metric tons of capacity in newsprint represents approximately 9% of worldwide capacity and 39% of North American capacity. We sell newsprint to newspaper publishers all over the world and also to commercial printers in North America for uses such as inserts and flyers. In 2012, international sales represented 41% of total newsprint sales.
Approximately one third of our production of uncoated mechanical papers is high-gloss (or supercalender) paper, mainly used for coupons, retail inserts and newspaper supplements. We produce another third of high-bright papers for general commercial printing, educational textbooks, digital printing and tradebooks. The last third includes papers for directories, paperback books and other commercial applications. In total, our 1.3 million metric tons of uncoated mechanical papers capacity makes us the largest producer in North America, and the third largest in the world. We sell uncoated mechanical papers almost exclusively in North America.
With 645,000 metric tons of capacity, we are North America’s third largest producer of coated mechanical papers, grades used for magazines, catalogs and advertising inserts. Demand for these products is largely tied to consumer spending and advertising. We sell to major commercial printers, publishers, catalogers and retailers in North America.
We operate eight pulp mills, five in the U.S. and three in Canada, with total capacity of 1.7 million metric tons, making us the fourth largest pulp producer in North America. Approximately 80% of our virgin pulp capacity is softwood-based: northern bleached softwood kraft pulp (or “NBSK”), southern bleached softwood kraft pulp (or “SBSK”) and fluff pulp. We are also a competitive producer of northern bleached hardwood kraft pulp (or “NBHK”) and southern bleached hardwood kraft pulp (or “SBHK”), and, with the acquisition of Fibrek in 2012, a leading producer of recycled bleached kraft pulp (or “RBK”). Our market pulp – the pulp we produce but do not consume internally – is used to make a range of consumer products, like tissue, packaging, specialty paper products, diapers and other absorbent products. Approximately 39% of our 2012 market pulp shipments were exported outside of North America, including significant exports to Europe (21%) and Asia (11%).
Our sawmills provide wood chips to our Consolidated Financial Statements.
Business Strategypulp and Outlook
We emerged from the Creditor Protection Proceedings with a more flexible, lower-cost operating platformpaper mills in Canada and a more conservative capital structure. Through aggressive capacity reductions,they produce construction-grade lumber that we streamlined our asset base and the substantial majority of our remaining assets have a competitive cost structure. We have reduced our debt levels from approximately $6.2 billion at the time of filing for creditor protection to $621 million as of December 31, 2011. We have substantially lowered our annual fixed costs, our debt service charges, as well as our SG&A expenses. We have also lowered overall manufacturing costs including significant reductionssell in salary and labor wages and costs.
During 2011, we experienced cost pressures as a result of inflation on our input costs, including higher energy and recycled fiber costs. We expect these cost pressures to continue in 2012; however, we also expect to mitigate some of the cost increases with actions to further lower manufacturing costs. Additionally, the Canadian dollar has a significant impactNorth America, mostly on the financial performance of our Canadian manufacturing sites. Based on our operating projectionseast coast. We also produce I-joists for 2012, a one-cent increase in the Canadian-U.S. dollar exchange rate is expected to decrease our annual operating income by approximately $16 million.construction industry and bed frame components, finger joints and furring strips.
| Years Ended December 31, | ||||||||||||
| 2012 | 2011 | 2010 | ||||||||||
| Successor | Successor | Predecessor | ||||||||||
Sales | ||||||||||||
Newsprint | 36% | 38% | 38% | |||||||||
Coated papers | 10% | 11% | 10% | |||||||||
Specialty papers | 25% | 27% | 28% | |||||||||
Market pulp | 18% | 14% | 15% | |||||||||
Wood products | 11% | 10% | 9% | |||||||||
Total (%) | 100% | 100% | 100% | |||||||||
Total sales ($ millions) | $ | 4,503 | $ | 4,756 | $ | 4,746 | ||||||
Strategy
Our businesscorporate strategy which buildsincludes, on the successful restructuring that began atone hand, a gradual retreat from certain paper grades, and on the time of the Combinationother, using our strong financial position to act on opportunities to diversify and continued through the Creditor Protection Proceedings, is basedgrow. That strategy focuses on three core areas of focus:themes: operational excellence, corporate initiativesdisciplined use of capital and strategic opportunities.
Operational excellence
We planaim to improve our performance and margins by: (i)(1) leveraging our lower-cost position, (ii) continuingposition; (2) maintaining a stringent focus on reducing costs and optimizing our diversified asset base; (3) maximizing the benefits of our access to prioritize further manufacturing cost reductions, (iii)virgin fiber and managing our exposure to volatile recycled fiber; (4) pursuing our strategy of managing production and inventory levels and focusing production on our most profitable facilities and machines; and (5) capitalizing on our economical access to international ports through our networkmarkets to compensate for the secular decline in North American newsprint demand.
Disciplined use of mills located near deep sea ports to strengthen the export portion of our newsprint segment in growing markets such as Asia, Latin America and the Middle East and (iv) pursuing our strategy of not building inventory. capital
We also regularly reevaluate our network of manufacturing assets and consider ways to further optimize our overall production and costs.
Corporate initiatives
make capital management a priority. Building on our focus to reduce manufacturing costs, we will continue our efforts to decrease overhead and spend our capital in a disciplined, strategic and focused manner, concentrated on the sites we believe are viable for the longer term.our most successful sites.
Reducing debt and the associated interest charges is one of our primary financial goals. We believe this improves our financial flexibility and supports the implementation of our strategic objectives. In 2011,Since December 31, 2010, we redeemed $354$349 million of debt using the proceeds from the saleprincipal amount of our 2018 senior secured notes and a $90 million promissory note issued in connection with an acquisition in 2011. In 2012, we also repaid and canceled Fibrek’s term loan and credit facility, for a total of $112 million.
Not only have we focused on reducing our debt and the associated interest burden, we also have in Ontario power generation assets (ACH Limited Partnership, “ACH”) and cash on hand, as further discussed belowplace a $100 million share repurchase program, under “Liquidity and Capital Resources.”which we have repurchased 5.6 million shares at a cost of $67 million through December 31.
Strategic opportunitiesinitiatives
We believe therein taking an opportunistic approach to strategic initiatives, pursuing only those that reduce our cost position, improve our product diversification, provide synergies or allow us to expand into future growth markets.
By acquiring Fibrek, we grew our market pulp segment, increasing our presence in a market that we believe will begrow over the long term. We believe that we can generate more value from Fibrek’s assets, including the NBSK mill and the two RBK mills, than they could on a standalone basis because of integration and the application of our business principles.
We anticipate continued consolidation in the paper and forest products industry, as we and our competitors continue to explore ways to increase efficiencies and diversify customer offerings. grow into more favorable markets.
Sustainable performance and development
Our sustainability strategy is to improve our competitive position by balancing equally the three pillars of sustainability linked to human activities: environmental, social and economic. By achieving our established commitments, we will grow and compete on all three levels, in particular:
| — | Improving resource efficiency helps drive down fiber and power costs, two significant input costs in our industry. |
| — | Adapting to our customers’ procurement policies, and more importantly striving to anticipate trends in demand for environmentally-conscious forest-based products enhances our environmental credentials and the competitiveness of our product offering. |
| — | Hiring, engaging and retaining the best and brightest minds promotes employee engagement, innovation and longevity. |
| — | Building solid community relations supports long-term regional prosperity and our own financial and operational success. |
Our key sustainability commitments include:
| — | Increasing FSC forest certification of managed forests from 18% in 2010 to 80% by 2015. In November, we achieved a level of approximately 65%, raising the total area of our FSC-certified tenures in North America to 39 million acres. In 2012, we achieved the distinction of being the largest manager of FSC-certified forests in the world. |
| — | Achieving a 65% absolute reduction of scope 1 and 2 greenhouse gas (or “GHG”) emissions by 2015 compared to the 2000 base year. In 2011, our scope 1 GHG emissions (from sources we own or control) and scope 2 GHG emissions (as a result of third-party power generation for our activities) were down 62% below 2000 levels, and we continue to make progress toward our 65% goal. |
| — | Through 2015, implementing new human resource practices to support workforce renewal and retention, engage employees in the Company’s sustainability-focused vision and values, and ensure current and future staffing requirements. |
| — | Achieving an Occupational Safety and Health Administration (or “OSHA”) incident rate of 1.2 or below in 2012, with a long-term goal of zero incidents, zero injuries. Our incident rate was 1.13 for the twelve months ended December 31, 2012 and we recorded 38 fewer injuries compared to 2011. |
| — | Reducing environmental incidents by 10% in 2013 compared to 2012, with a long-term goal of zero incidents. |
Power generation
We will take an opportunistic approachproduce electricity at seven cogeneration facilities and seven hydroelectric dams. The output is consumed internally, sold at contracted fixed prices and/or sold on the spot market. This allows us to strategic opportunities that reduce our costs by generating energy internally at a lower cost position even further, improve our product diversification or expand into future growth markets.
For example, on December 15, 2011, we announced an offercompared to purchase allopen market purchases, and by producing revenue from external sales of some of the issuedpower. This table provides a breakdown of the output capacity (based on installed capacity and outstanding sharesoperating expectations in 2013) available for internal consumption at our existing production facilities:
| Energy | ||||||||||||
| INTERNAL CONSUMPTION | Type | Capacity (MW) | Consumption (MWh/year) | |||||||||
Calhoun, TN | Cogeneration | 64 | 373,000 | |||||||||
Catawba, SC | Cogeneration | 55 | 310,000 | |||||||||
Coosa Pines, AL | Cogeneration | 30 | 119,000 | |||||||||
Fort Frances, ON | Cogeneration | 45 | 250,000 | |||||||||
Hydro Saguenay, QC (7 dams) | Hydroelectric | 170 | 1,120,000 | |||||||||
Thunder Bay, ON | Cogeneration | 51 | 216,000 | |||||||||
The table below shows the facilities where we currently produce, or will produce in 2013, energy and sell it externally as power produced from renewable sources. We buy back a portion of the energy produced for use in our operations.
|
| |||||||||||
| Energy | ||||||||||||
| EXTERNAL SALES | Type | Capacity (MW) | Annualized sales (MWh/year) | |||||||||
Current | ||||||||||||
Dolbeau-Mistassini, QC | Cogeneration | 28 | 163,000 | |||||||||
Fort Frances, ON | Cogeneration | 45 | 3,700 | |||||||||
Saint-Félicien, QC | Cogeneration | 43 | 305,400 | |||||||||
New in 2013 | ||||||||||||
Gatineau, QC | Cogeneration | 15 | 96,000 | |||||||||
Thunder Bay, ON | Cogeneration | 65 | 370,000 | |||||||||
Only two of Fibrek. Fibrek is a producer and marketer of virgin and recycled kraft pulp, operating three mills with a combined annual production capacity of approximately 760,000 metric tons. The considerationthese facilities produced power for external sale for the proposed transaction (the “Fibrek Transaction”) consistsduration of cash2012 – Fort Frances and sharesSaint-Félicien. In December, our Dolbeau facility began operations following the restart of our common stock, upthe paper mill, and we completed the installation of a new turbine at Saint-Félicien, adding an additional 9.5 MW of capacity. Our Thunder Bay facility is expected to approximately Cdn$71.5 millionbegin production by the end of the first quarter and 3.7 million shares, if consummated. The offer, whichthe Gatineau facility is more fully describedexpected to begin sales in the bid circularsecond quarter.
Business Conditions
2012 Highlights
2012 marked our second full year as a restructured company, a year in which we responded to the challenges facing us and other ancillary documentationthe forest products industry. In doing so, we filed withbelieve that we improved our competitiveness by optimizing the SEC, will expire at 5:00 p.m. (Eastern Standard Time) on March 9, 2012, unless it is further extended or withdrawn. At this time, there can be no assuranceasset base and strengthening our financial position. In particular, we:
| — | grew the pulp segment by adding the three Fibrek mills, one NBSK and two RBK, representing 752,000 tons of additional capacity, positioning us well as an important long-term North American pulp producer; |
| — | announced a number of projects to grow our wood products business: capacity enhancements at a number of existing sawmills, the restart of the Ignace, Ontario, facility and the construction of a new facility in Atikokan, Ontario. When all these projects are completed by mid-2014, they will add approximately 400 million board feet of annual production capacity; |
| — | invested in a number of power cogeneration assets. Starting in December, we added additional capacity at Saint-Félicien and Dolbeau and began external sales of the power produced. We are in the closing stages of installing our Thunder Bay facility, and we expect it to become operational by the end of the first quarter of 2013; |
| — | at the corporate level, completed the transfer of the remaining corporate functions from Greenville, South Carolina, to our Montreal head office; |
| — | continued to advance on our key sustainability efforts, including in responsible fiber sourcing, carbon footprint reduction, environmental compliance, product stewardship and sustainability disclosure, and achieved FSC certification of approximately 65% of Company-managed forests; |
| — | returned $67 million to our shareholders through share buybacks, reduced working capital on the balance sheet – which we calculate as current assets minus current liabilities, excluding cash and cash equivalents and debt – by $81 million from the end of 2011, and redeemed an additional $85 million of senior secured notes; and |
| — | made significant progress toward optimizing our paper asset base. While preserving our ability to generate cash flow, these steps provide for a leaner and more efficient mill network, including: |
| — | we idled and subsequently sold our Mersey newsprint mill, as part of our efforts to manage exposure to export markets where the relative strength of the U.S. dollar has created difficult conditions for North American producers; |
| — | we restarted a high-gloss paper machine in Dolbeau. The machine was newly built in 1999, and we believe that together with the power cogeneration unit, it will be an integrated and highly competitive operation; |
| — | we rationalized higher cost capacity by closing a high-gloss paper machine in Laurentide and indefinitely idling the pulp mill and high-bright and book paper machine in Fort Frances; |
| — | indeterminately idled a coated paper machine in Catawba to improve overall efficiency and reduce labor costs; and |
| — | in order to drive better efficiency and lower overall labor costs, we implemented or announced more efficient manning structures at a number of sites. |
2013 segment outlook
Newsprint – after two years of stability, the offer will be consummated on the terms currently proposed or at all.
Plansprice of Reorganization
Asnewsprint in North America has started to come under pressure, mainly as a result of capacity restarts in Eastern Canada and lower North American exports to markets where the relative strength of the U.S. dollar has created difficult conditions for North American producers.
Coated papers – the late-year price improvement in North America is fragile, and is under pressure because of demand softness and grade switching to high-gloss grades. We continue the process of restructuring our Catawba mill, applying the principles we successfully applied in newsprint and uncoated mechanical papers to remain competitive.
Uncoated mechanical papers – the industry shipment to capacity ratio fell by nearly 10% in December as a result of a significant capacity addition in eastern Canada, and this in turn has increased pressure on pricing, particularly for high-gloss and coated paper grades.
Pulp– recent demand and pricing trends are giving us reason for cautious optimism that the pulp market is gradually improving after difficult conditions in 2012.
Wood products – wood products should continue to show progress as housing starts build on recent improvements. Our ongoing growth projects – the capacity enhancement in Thunder Bay, in addition to the announced restart of the Ignace, Ontario, sawmill and construction of the new Atikokan, Ontario, sawmill to be completed in 2014 – further enhance our position in the segment for the future.
RESULTSOF OPERATIONS
Consolidated Earnings
Selected Annual Financial Information
| Years Ended December 31, | ||||||||||||
| 2012 | 2011 | 2010 | ||||||||||
| (in millions, except per share amounts) | Successor | Successor | Predecessor | |||||||||
Sales | $ | 4,503 | $ | 4,756 | $ | 4,746 | ||||||
Operating income (loss) per segment | ||||||||||||
Newsprint | 97 | 89 | (171 | ) | ||||||||
Coated papers | 9 | 57 | 31 | |||||||||
Specialty papers | 76 | 62 | (44 | ) | ||||||||
Market pulp | (50 | ) | 85 | 137 | ||||||||
Wood products | 26 | (25 | ) | 9 | ||||||||
Corporate / other | (188 | ) | (70 | ) | (122 | ) | ||||||
Total | (30 | ) | 198 | (160 | ) | |||||||
Net (loss) income | (2 | ) | 41 | 2,614 | ||||||||
Net (loss) income per common share | ||||||||||||
Basic | $ | (0.02 | ) | $ | 0.42 | $ | 45.30 | |||||
Diluted | (0.02 | ) | 0.42 | 27.63 | ||||||||
Cash and cash equivalents | $ | 263 | $ | 369 | $ | 319 | ||||||
Total assets | 6,324 | 6,298 | 7,135 | |||||||||
Adjusted EBITDA1 | $ | 386 | $ | 481 | $ | 306 | ||||||
Adjusted EBITDA margin1 | 8.6 | % | 10.1 | % | 6.4 | % | ||||||
ROE, adjusted for special items2 | 2.4 | % | 4.7 | % | n/m | |||||||
| 1. | Earnings before interest expense, income taxes and depreciation, or “EBITDA”, adjusted EBITDA and adjusted EBITDA margin are not financial measures recognized under generally accepted accounting principles, or “GAAP”. EBITDA is calculated as net (loss) income including noncontrolling interests from the consolidated statements of operations, adjusted for interest expense, income taxes and depreciation, amortization and cost of timber harvested. Adjusted EBITDA means EBITDA, excluding special items such as foreign exchange translation gains and losses, employee termination costs, closure costs, impairment and other related charges, inventory write-downs related to closures, start up costs of idled mills, gains and losses on dispositions of assets, post-emergence costs, transaction costs and other charges or credits that are excluded from our segments’ performance from GAAP operating income (loss). Adjusted EBITDA margin is adjusted EBITDA expressed as a percentage of sales. We believe that using measures such as EBITDA, adjusted EBITDA and adjusted EBITDA margin is useful because they are consistent with the indicators management uses internally to measure the Company’s performance and it allows the reader to more easily compare our ongoing operations and financial performance from period to period. |
Net (loss) income including noncontrolling interests Interest expense Income tax (benefit) provision Depreciation, amortization and cost of timber harvested EBITDA Foreign exchange translation (gain) loss Employee termination costs (credits) Closure costs, impairment and other related charges Inventory write-downs related to closures Start up costs of idled mills Net gain on disposition of assets Post-emergence costs Transaction costs Other income, net Reorganization items, net Adjusted EBITDA Years ended December 31, 2012 2011 2010 (in millions) Successor Successor Predecessor $ (36) $ 39 $ 2,775 66 95 483 (38) 16 (1,606) 233 220 493 $ 225 $ 370 $ 2,145 (17) 21 94 5 12 (8) 180 46 11 12 3 – 13 – – (35) (3) (30) 11 47 – 8 5 – (16) (20) (5) – – (1,901) $ 386 $ 481 $ 306
| 2. | Return on equity, or “ROE”, is a non-GAAP financial measure, calculated by dividing net (loss) income, excluding the special items identified below, by adjusted shareholders’ equity. ROE is a measure of profitability that shows how much profit the Company generated as a percentage of shareholder money invested. The calculation of ROE as of December 31, 2010, has been omitted because, in management’s view, it does not provide a true representation of ROE given that net income, excluding special items, and shareholders’ equity are adjusted for fresh start accounting and the application of the plans of reorganization on and as of December 31, 2010, and as a result net income does not reflect the performance during the entire year. During the creditor protection and until the application of fresh start accounting, the predecessor company’s shareholders’ equity was negative. |
| December 31, 2012 | ||||||||||||
| (in millions, except ROE) | Net (loss) income | Shareholders’ equity | ROE (%) | |||||||||
GAAP as reported | $ | (2 | ) | $ | 3,093 | (0.1 | )% | |||||
Adjustments for special items: | ||||||||||||
Foreign exchange translation gain | $ | (23 | ) | $ | (23 | ) | ||||||
Employee termination costs | 4 | 4 | ||||||||||
Closure costs, impairment and other related charges | 112 | 112 | ||||||||||
Inventory write-downs related to closures | 7 | 7 | ||||||||||
Start up costs of idled mills | 10 | 10 | ||||||||||
Net gain on disposition of assets | (22 | ) | (22 | ) | ||||||||
Post-emergence costs | 9 | 9 | ||||||||||
Transaction costs | 8 | 8 | ||||||||||
Other income, net | (11 | ) | (11 | ) | ||||||||
Reorganization-related and other tax adjustments | (13 | ) | (13 | ) | ||||||||
Cumulative past-year adjustments | – | 125 | ||||||||||
GAAP as adjusted for special items | $ | 79 | $ | 3,299 | 2.4 | % | ||||||
GAAP as reported Adjustments for special items: Foreign exchange translation loss Employee termination costs Closure costs, impairment and other related charges Inventory write-downs related to closures Net gain on disposition of assets Post-emergence costs Transaction costs Other income, net Reorganization-related and other tax adjustments GAAP as adjusted for special items December 31, 2011 (in millions, except ROE) Net income Shareholders’
equity ROE (%) $ 41 $ 3,417 1.2 % $ 23 $ 23 8 8 32 32 2 2 (2 ) (2 ) 34 34 4 4 (14 ) (14 ) 38 38 $ 166 $ 3,542 4.7 %
Fresh start accounting
The implementation of the Plansplans of Reorganizationreorganization and the application of fresh start accounting as well as other actions taken duringupon our emergence from the Creditor Protection Proceedings,creditor protection proceedings materially changed the carrying amounts and classifications reported in our consolidated financial statements, and resulted in the treatment of the Successor Company as a new entity for financial reporting purposes. Accordingly, our consolidated balance sheets as of December 31, 2010, and the other financial statements for periods thereafter are not comparable to theour consolidated financial statements for earlier periods. To help the reader with this important distinction, we sometimes refer to the Company on and after December 31, 2010, as the “successor” or the “successor Company” to indicate the implementation of the Predecessor Company. Beginning in 2011,plans of reorganization and the application of fresh start accounting to the results. We sometimes refer to the Company before December 31, 2010, as the “predecessor” or the “predecessor Company” to indicate that the results are before those changes.
Some of the significant differences include:
| — | Higher cost of sales, excluding depreciation, amortization and cost of timber harvested, as a result of the increase in the carrying value of finished goods inventory as of December 31, 2010, to reflect fair value mostly in the first quarter of 2011 as the inventory was sold. |
| — | Lower depreciation, amortization and cost of timber harvested as a result of the rationalization of facilities, sale of assets, reductions in the carrying values of fixed assets and amortizable intangible assets to reflect fair values and updated useful lives of fixed assets and amortizable intangible assets. |
| — | Lower labor and salary costs as a result of the implementation of our new labor agreements (costs of sales, excluding depreciation, amortization and cost of timber harvested) and salary reductions at the corporate level (selling, general and administrative expenses, or “SG&A”). |
| — | Significantly lower interest expense as a result of the settlement or extinguishment of the predecessor Company’s secured and unsecured debt obligations, partially offset by interest expense on the exit financing. |
| — | The predecessor Company’s consolidated statements of operations included significant costs for reorganization items that were directly associated with or resulted from the reorganization and restructuring of the business. Starting in 2011, we incurred and will continue to incur costs associated with the finalization of outstanding restructuring and reorganization matters, primarily for the resolution and settlement of disputed creditor claims. We record these post-emergence costs in “other income (expense), net” in the successor Company’s consolidated statements of operations. |
| — | Income taxes are no longer affected by the valuation allowances established on substantially all of the predecessor Company’s deferred income tax assets because those valuation allowances were reversed in connection with the implementation of the plans of reorganization and the application of fresh start accounting. As of December 31, 2012, we had approximately $1,983 million of deferred income tax assets, net, on the consolidated balance sheets. |
Fibrek acquisition
Fibrek’s results of operations have been included in our consolidated financial statements as of May 2, 2012, the Successor Companydate we acquired a controlling interest. The results are included in the market pulp segment. The amount of Fibrek’s sales, operating loss and will continue to be significantly different from the Predecessor Company due to, among other things, the following:net loss included in our results for 2012 were $268 million, $13 million and $13 million, respectively.
2012 vs. 2011
Operating (loss) income variance analysis
higher cost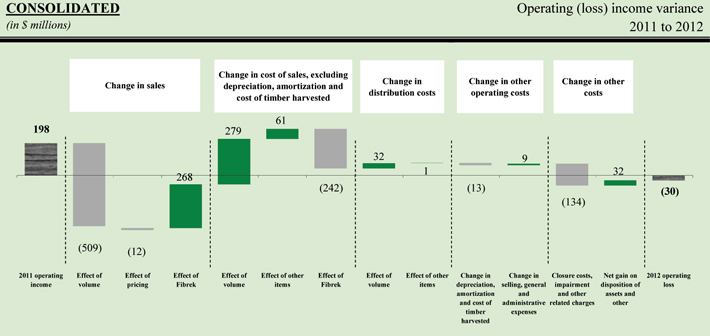
Sales
Sales decreased by $253 million in 2012, or 5.3%, to $4,503 million, led by a $509 million decline in volume across all grades and a net $12 million reduction in pricing, as more fully described in the segment variance analysis below. The decline was partly offset with the inclusion of Fibrek sales ($268 million). In light of challenging market conditions, the non-Fibrek volume decline reflects additional market downtime and our ongoing efforts to focus production in our most cost-effective mills, and drive better efficiency by restructuring and reducing labor costs. This fits into our strategy of managing production and inventory levels, selling only profitable tons, and maintaining world-class operational standards.
Cost of sales, excluding depreciation, amortization and cost of timber harvested as a result of the increase in the carrying value of finished goods inventory as of December 31, 2010 to reflect fair value, which increased cost of sales, excluding depreciation, amortization and cost of timber harvested, in the first quarter of 2011 as the inventory was sold;
lower depreciation, amortization and cost of timber harvested as a result of the rationalization of facilities, sale of assets, reductions in the carrying values of fixed assets and amortizable intangible assets to reflect fair values and updated useful lives of fixed assets and amortizable intangible assets;
lower labor and salary costs as a result of the implementation of our new labor agreements (costs of sales, excluding depreciation, amortization and cost of timber harvested) and salary reductions at the corporate level (SG&A expenses);
significantly lower interest expense as a result of the settlement or extinguishment of the Predecessor Company’s secured and unsecured debt obligations, partially offset by interest expense on our exit financing;
the Predecessor Company’s consolidated statements of operations included significant costs for reorganization items, which were directly associated with or resulted from the reorganization and restructuring of the business. In 2011, we incurred and will continue to incur costs associated with the finalization of outstanding restructuring and reorganization matters, primarily for the resolution and settlement of disputed creditor claims. These post-emergence costs are recorded in “Other expense, net” in the Successor Company’s consolidated statements of operations; and
income taxes are no longer impacted by the valuation allowances established on substantially all of the Predecessor Company’s deferred income tax assets. Such valuation allowances were reversed in connection with the implementation of the Plans of Reorganization. As of December 31, 2011, we recorded approximately $1,858 million of deferred income tax assets, which were reduced by $564 million of valuation allowances. As a result, we do not expect to pay significant cash taxes until these deferred income tax assets are fully utilized.
Business and Financial Review
Overview
Through our subsidiaries, we manufacture newsprint, coated and specialty papers, market pulp and wood products. We operate pulp and paper manufacturing facilities in Canada, the United States and South Korea, as well as wood products manufacturing facilities and hydroelectric facilities in Canada.
As discussed further below, newsprint, coated papers and specialty papers (particularly lightweight and directory grades) experienced a decrease in North American demand in 2011 compared to 2010. Global shipments of market pulp increased during 2011 compared to 2010, primarily due to increased Chinese demand. Our wood products segment continues to be impacted by low demand due to a weak U.S. housing market.
As discussed above, due to the implementation of the Plans of Reorganization and the application of fresh start accounting, as well as other actions taken during the Creditor Protection Proceedings, the operating results and financial condition of the Successor Company are not comparable to the operating results and financial condition of the Predecessor Company.
Consolidated Results of Operations
Year Ended December 31, 2011 versus December 31, 2010
| Years Ended December 31, | ||||||||||||||||||
| Successor | Predecessor | |||||||||||||||||
| (In millions, except per share amounts) | 2011 | 2010 | Change | |||||||||||||||
Sales | $ | 4,756 | $ | 4,746 | $ | 10 | ||||||||||||
Operating income (loss) | 198 | (160 | ) | 358 | ||||||||||||||
Net income attributable to AbitibiBowater Inc. | 41 | 2,614 | (2,573 | ) | ||||||||||||||
Net income per share attributable to AbitibiBowater Inc. – basic | 0.42 | 45.30 | (44.88 | ) | ||||||||||||||
Net income per share attributable to AbitibiBowater Inc. – diluted | 0.42 | 27.63 | (27.21 | ) | ||||||||||||||
Significant items that favorably (unfavorably) impacted operating income (loss): | ||||||||||||||||||
Product pricing | $ | 295 | ||||||||||||||||
Shipments | (285 | ) | ||||||||||||||||
Change in sales | 10 | |||||||||||||||||
Change in cost of sales, excluding depreciation, amortization and cost of timber harvested | 134 | |||||||||||||||||
Change in depreciation, amortization and cost of timber harvested | 273 | |||||||||||||||||
Change in distribution costs | 6 | |||||||||||||||||
Change in selling, general and administrative expenses | (3 | ) | ||||||||||||||||
Change in closure costs, impairment and other related charges | (35 | ) | ||||||||||||||||
Change in net gain on disposition of assets and other | (27 | ) | ||||||||||||||||
| $ | 358 | |||||||||||||||||
Sales
Sales increased $10 million, or 0.2%, from $4,746 million in 2010 to $4,756 million in 2011. The increase was due to higher transaction prices for newsprint, coated papers, specialty papers and higher shipments for wood products, partially offset by lower transaction prices for market pulp and wood products and lower shipments for newsprint, coated papers, specialty papers and market pulp. The impact of each of these items is discussed further below under “Segment Results of Operations.”
Operating income (loss)
Operating income (loss) improved $358 million to operating income of $198 million in 2011 compared to an operating loss of $160 million in 2010. The above table presents the items that impacted operating income (loss). A brief explanation of the major items follows.
Cost of sales, excluding depreciation, amortization and cost of timber harvested, decreased $134which we refer to as “COS”, improved by $98 million in 20112012 compared to 2010, primarily due2011, or $61 million net of Fibrek and the volume effect. COS was favorably influenced by the slightly weaker Canadian dollar compared to lower volumesthe U.S. dollar ($20124 million) and lowera net reduction in manufacturing costs for energy ($937 million), fuel ($12 million) and labor and benefits ($82 million). including:
| — | lower costs for energy ($44 million) as a result of favorable pricing and our energy saving initiatives; |
| — | lower labor and pension costs ($34 million); |
| — | favorable recovered paper pricing ($21 million); |
| — | the idling of the Mersey facility in June ($18 million); |
| — | other operational cost improvements ($17 million); and |
| — | favorable inventory adjustment as a result of increasing market prices for lumber products ($6 million). |
These lower costsfavorable effects to COS were partially offset by a significantly unfavorable currency exchangecosts associated with the start-up of closed mills and our capacity reduction initiatives ($89 million, primarily due to the Canadian dollar) and25 million); higher log costs for wood and fiber ($3823 million), including stumpage fees; and coating and chemicals ($2817 million), maintenance ($3 million) and other unfavorable cost variances. As discussed above, cost. The addition of sales, excluding depreciation, amortization and costFibrek added $242 million of timber harvested, inCOS. Compared to 2011, segment COS was also unfavorably impactedaffected by the increase in the carrying valueloss of finished goods inventory as of December 31, 2010 to reflect fair value pursuant to fresh start accounting. In addition, as discussed above, such costs in 2011 were favorably impacted by lower costs for labor and benefitspower sales income as a result of actions taken duringour sale of ACH Limited Partnership, or “ACH”, in 2011 ($19 million), by non-cash inventory obsolescence charges for slow-moving spare parts ($15 million) over the Creditor Protection Proceedings. Additionally,course of the year and by the benefit of a 2010 NIER program rebate recorded in the second quarter of 2011 we were approved for entry in($8 million).
We joined the Northern Industrial Electricity Rate Program, (“or “NIER Program”) in whichprogram”, during the second quarter of 2011, retroactive to the program’s April 1, 2010, start date. Under the program, we will earnearned rebates on electricity purchased and consumed by our northern Ontario pulp and paper mills, insubject to certain conditions. These rebates, which effectively reduce our energy costs, are available until the province of Ontario from April 1, 2010 throughprogram expires on March 31, 2013, providedthough we comply withexpect it to be extended on terms that have yet to be determined. Of the conditions of the program. During the second quarter of 2011,rebates we recorded a rebatein 2011, $8 million related to 2010.
Depreciation, amortization and cost of approximately $19 million, of which approximately $14 million represented a retroactive rebate from April 1, 2010 through the first quarter of 2011.timber harvested
Depreciation, amortization and cost of timber harvested decreased $273increased by $13 million in 2011 compared to 2010, primarily2012, mainly as a result of actions taken during the Creditor Protection Proceedingsacquisition of Fibrek’s assets.
Selling, general and the application of fresh start accounting, as discussed above.administrative expenses
Distribution costs decreased $6SG&A was $9 million lower in 20112012 compared to 2010 due2011, as we collected a refund of certain group benefit premiums paid in prior years ($11 million) and recorded lower severance and transition costs ($8 million). These favorable changes to lower shipment volumes,SG&A were partially offset by higher distributionspecial project costs per ton.($6 million), including Fibrek, and the SG&A associated with the addition of Fibrek.
Selling, generalClosure costs, impairment and administrative expenses increased $3 million in 2011 compared to 2010, primarily due to the reversal of a $17 million bonus accrual in 2010, as well as approximately $12 million of corporate employee termination costs and approximately $5 million of transaction costs in connection with our proposed acquisition of Fibrek recorded in 2011, partially offset by our continued cost reduction initiatives, including salary reductions at the corporate level, as discussed above, the reversal of a capital tax reserve of approximately $4 million in 2011 and a lease termination fee of approximately $2 million in 2010other related to our head office in Montreal, Quebec.charges
We recorded closure costs, impairment and other related charges of $46$180 million in 2012, $134 million higher than in 2011, compared to $11 millionas a result of our asset optimization initiatives during the year, including the idling and sale of operations in 2010. Mersey, Nova Scotia, the idling of a kraft pulp mill and paper machine in Fort Frances and the closure of a paper machine in Laurentide. Our major initiatives in 2011 included machine closures in Coosa Pines, Baie-Comeau and Kenogami as well as restructurings in our Mokpo and Mersey facilities.
Net gain on disposition of assets and other
We recordedrecognized a net gain on disposition of assets and other of $35 million in 2012, compared to $3 million in 2011, mainly as a result of the sale of timberlands in Nova Scotia in the first quarter.
Net (loss) income variance analysis
Net loss in 2012 was $2 million, or $0.02 per share, a decrease of $43 million, or $0.44 per share, compared to $30 million in 2010. For additional information, see “Segment Results of Operations – Corporate and Other” below.
Netnet income attributable to AbitibiBowater Inc.
Net income attributable to AbitibiBowater Inc. in 2011 wasof $41 million, or $0.42 per diluted common share, a decrease of $2,573share.
Interest expense
Interest expense decreased by $29 million, or $27.21 per diluted common share, compared to $2,614$66 million, or $27.63 per diluted common share, in 2010.2012 from $95 million in 2011. The decrease was primarily due to reorganization items, net recorded in 2010 (which included a net gain of $3,553 million resulting from the implementation of the Plans of Reorganization and a net expense of $362 million resulting from the application of fresh start accounting), which is discussed further below under “Non-operating Items,” partially offset by the improvement in operating income (loss), as discussed above, and a decrease in other expense, net (primarily foreign exchange) and a decrease in interest expense, both of which are discussed further below under “Non-operating Items.” Additionally, in 2011, we recorded an income tax provision of $16 million compared to an income tax benefit of $1,606 million in 2010, which was primarily duerelated to the reversalelimination of our valuation allowancesACH’s debt in connection with the implementation of the Plans of Reorganization (see Note 19, “Income Taxes,” to our Consolidated Financial Statements for additional information). The 2011 income tax provision included an unfavorable $38 million of reorganization-related tax adjustments, which resulted from our identification of certain adjustments associated with our previously-reported 2010 deferred income tax balance sheet accounts. We did not adjust any prior period amounts, as we do not believe that these adjustments are material to 2011 or anysale of our previously-issued financial statements.
Fourth Quarter of 2011 versus Fourth Quarter of 2010
Sales decreased $125 million, or 9.8%, from $1,272 million in the fourth quarter of 2010 to $1,147 million in the fourth quarter of 2011. The decrease was due to lower transaction prices for market pulp and wood products and lower shipments for newsprint, coated papers, specialty papers and market pulp, partially offset by higher transaction prices for newsprint, coated papers and specialty papers and higher shipments for wood products.
Operating income increased $36 million from $11 million in the fourth quarter of 2010 to $47 million in the fourth quarter of 2011. The increase was due to the following:
a decrease in cost of sales, excluding depreciation, amortization and cost of timber harvested, of $102 million, primarily due to a favorable currency exchange ($6 million, primarily due to the Canadian dollar), lower volumes ($75 million) and lower costs for energy ($5 million), fuel ($4 million), labor and benefits ($34 million) and other favorable cost variances, partially offset by higher costs for wood and fiber ($11 million), chemicalsinterest ($7 million) and maintenance ($10 million). As discussed above, costthe lower principal amount of sales, excluding depreciation, amortization and cost of timber harvested, in 2011 was favorably impacted by lower costs for labor and benefitssenior secured notes as a result of actions taken during the Creditor Protection Proceedings;
a decrease in depreciation, amortization and cost of timber harvested of $61 million, primarily as a result of actions taken during the Creditor Protection Proceedings and the application of fresh start accounting, as discussed above;
a decrease in distribution costs of $10 million due to lower shipment volumes, partially offset by higher distribution costs per ton; and
a decrease in selling, general and administrative expenses of $10 million, primarily due to our continued cost reduction initiatives,redemptions, including salary reductions at the corporate level, as discussed above, the reversal of a capital tax reserve of approximately $4$179 million in the fourth quarter ofJune 2011, and a lease termination fee of approximately $2an additional $85 million in the fourth quarterNovember of 2010 related to our head office in Montreal, Quebec, partially offset by approximately $5 million of transaction costs in connection with our proposed acquisition of Fibrek recorded in the fourth quarter of 2011.
The decreases in expenses discussed above were offset by the following:
the decrease in sales, as discussed above;
an increase in closure costs, impairmentthat year and other related charges of $6 million; and
a decrease in net gain on disposition of assets and other of $16 million, primarily due to a net gain related to a customer bankruptcy settlement in the fourth quarter of 2010.
Interest expense decreased $48 million from $66$85 million in the fourth quarterOctober of 2010 to $18 million in the fourth quarter of 2011, primarily due to significantly lower debt levels in connection with our emergence from the Creditor Protection Proceedings, as well as debt redemptions of the 2018 Notes in 2011, as further discussed below under “Liquidity and Capital Resources.”2012.
Other income (expense), net
Other income, net, was $3$22 million in the fourth quarter of 20112012, compared to otheran expense net of $121$48 million in 2011. The change of $70 million includes a foreign exchange gain (compared to a 2011 loss) on the fourth quartertranslation of 2010, primarily dueCanadian dollar net monetary assets to foreign currency exchange gains of $9 million in the fourth quarter of 2011 compared to foreign currency exchange losses of $124 million in the fourth quarter of 2010, as well as a net gain on extinguishment of debt of $2 million in the fourth quarter of 2011, partially offset byU.S. dollars ($38 million) and lower post-emergence costs ($36 million), which are legal and other professional fees for the resolution and settlement of disputed creditor claims and other post-emergence activities associated with the Creditor Protection Proceedings of $12activities.
Income taxes
We recorded a $38 million in the fourth quarter of 2011.
Net loss attributable to AbitibiBowater Inc. in the fourth quarter of 2011 was $6 million, or $0.06 per diluted common share, compared to $4,240 million of net income, or $44.82 per diluted common share, in the fourth quarter of 2010. The decrease was primarily due to reorganization items, net recorded in the fourth quarter of 2010 (which included a net gain of $3,553 million resulting from the implementation of the Plans of Reorganization and a net expense of $362 million resulting from the application of fresh start accounting), which is discussed further below under “Non-operating Items,” partially offset by the increase in operating income, the decrease in interest expense and the decrease in other expense, all of which are discussed above. Additionally, in the fourth quarter of 2011, we recorded an income tax provision of $42 million compared to an income tax benefit in 2012, on a loss before income taxes of $1,601$74 million, $12 million more than the expected $26 million benefit calculated using the federal statutory income tax rate of 35%. Our effective tax rate for the year was therefore 51%. This stems from the favorable effects of reorganization-related and other tax adjustments of $13 million, foreign exchange of $10 million, research and development tax incentives of $8 million and adjustments for unrecognized tax benefits of $5 million, offset by a net increase in the fourth quartervaluation allowances of 2010, which$25 million. This net increase in valuation allowances was primarily due to the reversalcosts associated with the idling of our valuation allowances in connection withMersey operations before the implementationassets were sold and an internal reorganization of the Plans of Reorganization (see Note 19, “Income Taxes,” to our Consolidated Financial Statements for additional information). TheU.S. Fibrek subsidiaries. In 2011, our income tax provision in the fourth quarter of 2011 included an unfavorable $48 million of reorganization-related tax adjustments, which resulted from our identification of certain adjustments associated with our previously-reported 2010 deferred income tax balance sheet accounts. We did not adjust any prior period amounts, as we do not believe that these adjustments are material to 2011 or any of our previously-issued financial statements.
Year Ended December 31, 2010 versus December 31, 2009
| 0000000 | 0000000 | 0000000 | ||||||||||
| Predecessor | ||||||||||||
| Years Ended December 31, | ||||||||||||
| (In millions, except per share amounts) | 2010 | 2009 | Change | |||||||||
Sales | $ | 4,746 | $ | 4,366 | $ | 380 | ||||||
Operating loss | (160 | ) | (375 | ) | 215 | |||||||
Net income (loss) attributable to AbitibiBowater Inc. | 2,614 | (1,553 | ) | 4,167 | ||||||||
Net income (loss) per share attributable to AbitibiBowater Inc. – basic | 45.30 | (26.91 | ) | 72.21 | ||||||||
Net income (loss) per share attributable to AbitibiBowater Inc. – diluted | 27.63 | (26.91 | ) | 54.54 | ||||||||
Significant items that favorably (unfavorably) impacted operating loss: | ||||||||||||
Product pricing | $ | 233 | ||||||||||
Shipments | 147 | |||||||||||
Change in sales | 380 | |||||||||||
Change in cost of sales and depreciation, amortization and cost of timber harvested | (272 | ) | ||||||||||
Change in distribution costs | (66 | ) | ||||||||||
Change in selling, general and administrative expenses | 43 | |||||||||||
Change in closure costs, impairment and other related charges | 191 | |||||||||||
Change in net gain on disposition of assets and other | (61 | ) | ||||||||||
| $ | 215 | |||||||||||
Sales
Sales increased $380 million, or 8.7%, from $4,366 million in 2009 to $4,746 million in 2010. The increase was primarily due to significantly higher transaction prices for market pulp and wood products, higher transaction prices for newsprint and higher shipments for coated papers, specialty papers and wood products, partially offset by lower transaction prices for specialty papers and lower shipments for newsprint. The impact of each of these items is discussed further below under “Segment Results of Operations.”
Operating loss
Operating loss decreased $215 million from $375 million in 2009 to $160 million in 2010. The above table presents the items that impacted operating loss. A brief explanation of the major items follows.
Cost of sales and depreciation, amortization and cost of timber harvested increased $272 million in 2010 compared to 2009, primarily due to a significantly unfavorable currency exchange ($248 million, primarily due to the Canadian dollar), benefits from the alternative fuel mixture tax credits of $276 million that were recorded in 2009 (the fuel tax credit program expired at the end of 2009) and higher costs for maintenance ($26 million) and energy ($12 million). These higher costs were partially offset by lower volumes ($40 million) and lower costs for wood and fiber ($15 million), fuel ($8 million), chemicals ($21 million), labor and benefits ($55 million), depreciation ($109 million) and other favorable cost variances. For additional information regarding the alternative fuel mixture tax credits, see Note 24, “Alternative Fuel Mixture Tax Credits,” to our Consolidated Financial Statements.
Distribution costs increased $66 million in 2010 compared to 2009 due to higher distribution costs per ton and higher shipment volumes.
Selling, general and administrative expenses decreased $43 million in 2010 compared to 2009 due to our continued cost reduction initiatives and the reversal of a $17 million bonus accrual in 2010, as well as $10 million of costs incurred in 2009 related to our unsuccessful refinancing efforts. These decreases were partially offset by a $16 million, reversal that was recorded in 2009 for previously recorded Canadian capital tax liabilities as a result of legislation which eliminated this tax, an accrual of approximately $7 million in 2010 for the 2010 short-term incentive plan and a lease termination fee of approximately $2 million in 2010 related to our head office in Montreal, Quebec.
We recorded closure costs, impairment and other related charges of $11 million in 2010 compared to $202 million in 2009. We recorded a net gain on disposition of assets and other of $30 million in 2010 compared to $91 million in 2009. For additional information, see “Segment Results of Operations – Corporate and Other” below.
Net income (loss) attributable to AbitibiBowater Inc.
Net income (loss) attributable to AbitibiBowater Inc. in 2010 was $2,614 million of net income, or $27.63 per diluted common share, an improvement of $4,167 million, or $54.54 per diluted common share, compared to $1,533 million of net loss, or $26.91 per diluted common share, in 2009. The improvement was primarily due to the decrease in operating loss, as discussed above, decreases in interest expense and reorganization items, net and an increase in income tax benefit, partially offset by the increase in other expense, net, all of which are discussed further below under “Non-operating Items.” As further discussed in Note 3, “Creditor Protection Proceedings – Reorganization items, net,” to our Consolidated Financial Statements, reorganization items, net in 2010 included a net gain of $3,553 million resulting from the implementation of the Plans of Reorganization and a net expense of $362 million resulting from the application of fresh start accounting. Additionally, in 2010, we recorded an income tax benefit of $1,606 million, primarily due to the reversal of our valuation allowances in connection with the implementation of the Plans of Reorganization (see Note 19, “Income Taxes,” to our Consolidated Financial Statements for additional information).
Non-operating Items - Years Ended December 31, 2011, 2010 and 2009
Interest expense
Interest expense decreased to $95 million in 2011 from $483 million in 2010 and $597 million in 2009. The decrease in interest expense in 2011 compared to 2010 was primarily due to significantly lower debt levels in connection with our emergence from the Creditor Protection Proceedings. Additionally, interest expense in 2010 included a cumulative adjustment of $43 million to increase the accrued interest on the unsecured U.S. dollar denominated debt obligations of the CCAA filers to a fixed exchange rate, as further discussed in Note 3, “Creditor Protection Proceedings – Reorganization items, net,” to our Consolidated Financial Statements. The decrease in interest expense in 2010 compared to 2009 was a result of ceasing to accrue interest on certain of our pre-petition debt obligations. In accordance with FASB ASC 852, during the Creditor Protection Proceedings, we recorded interest expense on our pre-petition debt obligations only to the extent that: (i) interest would be paid during the Creditor Protection Proceedings or (ii) it was probable that interest would be an allowed priority, secured or unsecured claim. As such, during the Creditor Protection Proceedings, we continued to accrue interest on the Debtors’ pre-petition secured debt obligations and, until the third quarter of 2010, the CCAA filers’ pre-petition unsecured debt obligations. See Note 3, “Creditor Protection Proceedings – Reorganization items, net,” to our Consolidated Financial Statements for a discussion of the reversal of post-petition accrued interest on the CCAA filers’ pre-petition unsecured debt obligations. Interest expense in 2010 also included accrued interest on the 2018 Notes, which were issued on October 4, 2010, as further discussed below under “Liquidity and Capital Resources.”
Other expense, net
Other expense, net in 2011 was $48 million, primarily comprised of foreign currency exchange losses of $21 million and costs for the resolution and settlement of disputed creditor claims and other post-emergence activities associated with the Creditor Protection Proceedings of $47 million, partially offset by net gains on extinguishment of debt of $6 million. Other expense, net in 2010 was $89 million, primarily comprised of foreign currency exchange losses. Other expense, net in 2009 was $71 million, primarily comprised of foreign currency exchange losses of $59 million, fees for waivers and amendments to our former accounts receivable securitization program of $23 million, as well as a loss on the sale of ownership interests in accounts receivable of $17 million, partially offset by $24 million of income, net from a subsidiary’s proceeds sharing arrangement related to a third party’s sale of timberlands.
Reorganization items, net
Pursuant to FASB ASC 852, we recorded reorganization items, net in 2010 of a credit of $1,901 million and expense of $639 million in 2009 for certain expenses, provisions for losses and other charges and credits directly associated with or resulting from the reorganization and restructuring of the business that were realized or incurred in the Creditor Protection Proceedings, including the impact of the implementation of the Plans of Reorganization (net gain of $3,553 million in 2010) and the application of fresh start accounting (net expense of $362 million in 2010). For additional information, see Note 3, “Creditor Protection Proceedings – Reorganization items, net,” to our Consolidated Financial Statements.
Income taxes
In 2011, an income tax provision of $16 million was recorded on income before income taxes of $55 million, resulting in an effective tax rate of 29%. The income tax provision included a favorable $63 million adjustment related to our reserves for unrecognized tax benefits primarily due to of $63 million on
the completion of certain tax authority examinations, during the year, partiallymostly offset by anthe unfavorable $38 millioneffects of prior year reorganization-related tax adjustments which resulted from our identification of certain adjustments associated with our previously-reported 2010 deferred income tax balance sheet accounts. We did not adjust any prior period amounts, as we do not believe that these adjustments are material to 2011 or any of our previously-issued financial statements. Also impacting our effective tax rate in 2011 are unfavorable effects related to$38 million, foreign exchange of $9 million, and the recording ofan increase in valuation allowances of $15 million on certain deferred income tax benefits notwe no longer expected to be realized. For additional information, see Note 19, “Income Taxes,”realize.
Some of our Canadian subsidiaries, including our principal Canadian operating subsidiary, use the U.S. dollar as functional currency but determine taxable income in Canadian dollars. This can cause frequent and substantial variation to our Consolidated Financial Statements.
In 2010, an income tax benefit of $1,606 million was recorded on income before income taxes of $1,169 million, resulting in an effective tax rate of (137)%. The income tax benefit was primarily duecompared to the reversal of our valuation allowances as part of the implementation of the Plans of Reorganization and the non-taxability of the gains on the Plans of Reorganization. See Note 19, “Income Taxes,” to our Consolidated Financial Statements.
In 2009, income tax benefits of $122 million were recorded on a loss before income taxes of $1,682 million, resulting in an effective tax rate of 7%. In 2009, income tax benefits of approximately $615 million generated on the majority of our losses were entirely offset by tax charges to increase our valuation allowance related to these tax benefits. Our effective tax rate in 2009 was primarily impacted by the valuation allowance, as described above, and the tax treatment on foreign currency gains and losses. Additionally, subsequent to the commencement of Abitibi’s CCAA proceedings, in 2009, we concluded that our investment in the common stock of Abitibi no longer had any value and therefore, we recorded a $308 million tax benefit for a worthless stock deduction, which represents the estimated tax basis in our investment in Abitibi of approximately $800 million. In addition, in 2009, we recorded a tax recovery of approximately $141 million related to the asset impairment charges associated with our investment in Manicouagan Power Company (“MPCo”) while it was an asset held for sale. For additional information, see Note 5, “Closure Costs, Impairment and Other Related Charges,” to our Consolidated Financial Statements.
Our effective tax rate varies frequently and substantially from the weighted-average effect of both domestic and foreign statutory tax rates primarily as a result ofbecause the tax treatment on foreign currency gains and losses. We have foreign subsidiaries whose unconsolidated local currency foreign exchange gains and losses used to calculate the income tax provision of our Canadian subsidiaries are taxed indetermined on a different basis from the local country. Upon consolidation, such gains and losses are eliminated, but we are still liable for the local country taxes. We also have foreign exchange gains and losses on the conversion of foreign currency denominated items, for which no tax expense or benefit is recorded.included in our consolidated financial statements. Due to the variability and volatility of foreign exchange rates, we are unable to estimate the impact of future changes in exchange rates on our effective tax rate.
Financial ConditionQ4 of 2012 vs. Q4 of 2011
TotalOperating (loss) income variance analysis
We recorded an operating loss of $46 million in the fourth quarter of 2012, compared to operating income of $47 million in the same period of 2011. Approximately half of the $93 million decrease results from lower volume in each segment, with the exception of pulp, including: newsprint ($19 million) mainly as a result of lower exports; coated papers ($14 million) because of the closure of a machine and production difficulties; and capacity reduction initiatives in specialty papers ($17 million) in response to lower demand. The other unfavorable variances include: higher closure costs from the idlings and closures at Fort Frances, Laurentide and Mersey ($70 million), compared to the closure in Kenogami in 2011; the effects of the stronger Canadian dollar ($12 million); and a non-cash inventory obsolescence charge for slow-moving spare parts ($10 million). These items were only partially offset by improved manufacturing costs, mainly the result of: restructuring initiatives ($21 million); power ($7 million); and maintenance ($5 million), partially offset by additional costs for the ramp-up at Dolbeau ($4 million), higher stumpage fees ($5 million) and chemicals ($5 million).
Net loss variance analysis
Net loss in the fourth quarter of 2012 was $36 million, compared to a net loss of $6 million in the year ago period, a $30 million increase. Interest expense was $3 million lower, to $15 million, as a result of the redemption of senior secured notes. The change in the Canadian dollar compared to the end of the third quarter led to a $4 million foreign exchange loss on the translation of Canadian dollar net monetary assets to U.S. dollars, compared to a gain of $9 million in the fourth quarter of 2011.
We recorded a $26 million income tax benefit on loss before taxes of $61 million in the fourth quarter of 2012, compared to a $42 million provision on $32 million of income before taxes in the same period of 2011. The fourth quarter 2012 benefit reflected a favorable net adjustment for valuation allowances of $10 million, mainly as a result of an internal reorganization of our U.S. Fibrek subsidiaries. In the fourth quarter of 2011, we adjusted the provision unfavorably for reorganization-related and other tax adjustments of $48 million and recorded an increase of $11 million in valuation allowances, offset in part by previously unrecognized tax benefits of $18 million.
2011 vs. 2010
Operating income (loss) variance analysis

Sales
Sales increased by $10 million in 2011, or 0.2%, to $4,756 million. There was a $295 million increase in product pricing as a result of higher transaction prices for newsprint, coated papers and specialty papers. Transaction prices were $6.3 billionlower, however, for market pulp and wood products. Shipments were down in all segments, with the exception of wood products. The impact of each item is more fully described below in the segment variance analysis.
Cost of sales, excluding depreciation, amortization and cost of timber harvested
COS decreased $134 million in 2011 compared to 2010. The lower shipment volume ($201 million) and lower costs for labor and benefits ($82 million), fuel ($12 million) and energy ($9 million) favorably affected COS, but it was unfavorably influenced by a stronger Canadian dollar compared to the U.S. dollar ($89 million), and higher costs for wood and fiber ($38 million), chemicals ($28 million) and maintenance ($3 million).
Certain initiatives implemented during the creditor protection proceedings, such as a Company-wide reduction to salaries and benefits, had a favorable impact in 2011 when compared to 2010. There was, however, an unfavorable impact to COS in 2011 for the increase in the carrying value of finished goods inventory as of December 31, 2010, to reflect fair value under fresh start accounting.
Depreciation, amortization and cost of timber harvested
Depreciation, amortization and cost of timber harvested decreased $273 million in 2011, primarily as a result of the creditor protection proceedings and the application of fresh start accounting.
Distribution costs
Distribution costs decreased $6 million in 2011 due to lower shipment volumes, partially offset by higher distribution costs per ton.
Selling, general and administrative expenses
SG&A increased $3 million in 2011 compared to 2010. Unfavorable effects included: the reversal, in 2010, of a bonus accrual ($17 million); corporate employee termination costs ($12 million) and transaction costs in connection with our acquisition of Fibrek ($5 million).
Favorable items included our continued cost reduction initiatives, including salary reductions at the corporate level, the reversal of a capital tax reserve ($4 million) and a lease termination fee, in 2010, for our former head office in Montreal ($2 million).
Closure costs, impairment and other related charges & net gain on disposition of assets and other
We recorded closure costs, impairment and other related charges of $46 million in 2011 compared to $11 million in 2010, a $35 million increase. We also recorded a net gain on disposition of assets and other of $3 million in 2011 compared to $30 million in 2010.
Net income variance analysis
Net income in 2011 was $41 million, or $0.42 per diluted common share, a decrease of $0.8 billion$2,573 million, or $27.21 per diluted common share, compared to December 31,net income in 2010 whichof $2,614 million, or $27.63 per diluted common share. Net income in 2010 includes material adjustments as a result of the creditor protection proceedings and the application of fresh start accounting, as further described in the notes to the consolidated financial statements.
Interest expense
Interest expense decreased to $95 million in 2011 from $483 million in 2010. The decrease was primarily due to significantly lower debt levels following our emergence from the creditor protection proceedings. Interest expense in 2010 also included a cumulative adjustment of $43 million to increase accrued interest on certain pre-petition debt obligations, as more fully described in note 4, “creditor protection proceedings – reorganization items, net,” to the consolidated financial statements.
Other expense, net & reorganization items, net
Other expense, net, was $48 million in 2011, compared to $89 million in 2010, a $41 million reduction. We recorded foreign exchange losses in other expense, net, in 2011 ($21 million) and in 2010 ($94 million), reflecting the effects of the strengthening Canadian dollar on the translation of Canadian dollar net monetary assets to U.S. dollars.
In 2011, we incurred $47 million in post-emergence costs, primarily legal and other professional fees for the resolution and settlement of disputed creditor claims, as well as costs for other post-emergence activities. These costs were partially offset by net gains on extinguishment of debt ($6 million).
Under applicable accounting guidance, after our emergence, we ceased recording creditor protection-related costs and expenses to reorganization items, net. In 2010, we recorded a credit of $1,901 million to reorganization items, net, as a result of the implementation of the plans of reorganization and the application of fresh start accounting.
Income taxes
In 2011, our income tax provision was $16 million, on income before income taxes of $55 million, resulting in an effective tax rate of 29%. The provision included a favorable adjustment to reserves for unrecognized tax benefits of $63 million on the completion of certain tax authority examinations, mostly offset by the unfavorable effects of prior year reorganization-related tax adjustments of $38 million, foreign exchange of $9 million and an increase in valuation allowances of $15 million on certain deferred income tax benefits we no longer expected to realize.
In 2010, we recorded an income tax benefit of $1,606 million on income before income taxes of $1,169 million. The benefit was primarily due to the salereversal of our investment in ACH in 2011. Cashvaluation allowances as part of the implementation of the plans of reorganization and cash equivalents were $369 million asthe non-taxability of December 31, 2011, an increasethe gains on the plans of $50 million compared to December 31, 2010. For additional information regarding our liquidity, see “Liquidity and Capital Resources” below.reorganization.
Segment Results of OperationsEarnings
We manage our business based on the products we manufacture. Accordingly, ourOur reportable segments correspond to our primaryprincipal product lines: newsprint, coated papers, specialty papers, market pulp and wood products. None
We do not allocate any of the income or loss items following “Operating income“operating (loss)” income” in our Consolidated Statementsconsolidated statements of Operations are allocatedoperations to our segments sincebecause those items are reviewed separately by management. ForSimilarly, we do not allocate to the same reason,segments closure costs, impairment and other related charges, employee termination costs, net gain on disposition of assets and other, as well as other discretionary charges or credits are not allocated to our segments. Also excludedcredits. We also exclude certain corporate items from our segment results arethe segments, and present those separately as corporate and other, items, which include costs associatedconsistent with our unsuccessful refinancing efforts in 2009. These items are also analyzed separately from our segmenthow management analyzes the results. Additionally, beginning in
In 2011, allwe began to allocate SG&A expenses, excludingto the segments, with the exception of employee termination costs and certain other discretionary charges and credits, which are allocated to our segments.presented under corporate and other. Share-based compensation expense and depreciation expense are also allocated to our segments. For additional information regarding
NEWSPRINT
Highlights
| Years Ended December 31, | ||||||||||||
| 2012 | 2011 | 2010 | ||||||||||
| (in millions, except where otherwise stated) | Successor | Successor | Predecessor | |||||||||
Sales | $ | 1,627 | $ | 1,816 | $ | 1,804 | ||||||
Operating income (loss) 1 | 97 | 89 | (171 | ) | ||||||||
EBITDA 2 | 169 | 162 | 54 | |||||||||
| (in thousands of metric tons) | ||||||||||||
Shipments | 2,491 | 2,753 | 3,005 | |||||||||
Downtime | 260 | 102 | 738 | |||||||||
Inventory at end of period | 90 | 78 | 75 | |||||||||
| 1. | Net income (loss) including noncontrolling interests is equal to operating income (loss) in this segment. |
| 2. | EBITDA, a non-GAAP financial measure, is reconciled below. For more information on the calculation and reason we include this measure, see note 1 under “Results of Operations – Consolidated Earnings – Selected Annual Financial Information” above. |
| Years Ended December 31, | ||||||||||||
| 2012 | 2011 | 2010 | ||||||||||
| (in millions) | Successor | Successor | Predecessor | |||||||||
Net income (loss) including noncontrolling interests | $ | 97 | $ | 89 | $ | (171 | ) | |||||
Depreciation, amortization and cost of timber harvested | 72 | 73 | 225 | |||||||||
EBITDA | 169 | 162 | 54 | |||||||||
Industry trends
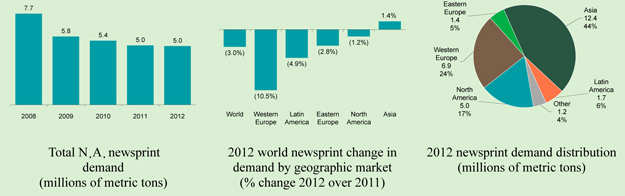
Source: Pulp & Paper Products Council (or “PPPC”)
Total North American newsprint demand declined 1.2% in 2012, reflecting a 20% increase in demand from other uses, mainly commercial printers, and a 6% decline in demand from newspapers. Accordingly, the average operating rate, on shipment to capacity basis, remained elevated in 2012, at 92%. Global demand for newsprint was down 3% in 2012, including an 11% decline in Western Europe, 9% in India and 5% in Latin America. North American exports were down to Western Europe (30%), Asia (32%) and Latin America (6%), mainly because the strong U.S. dollar has created difficult conditions for North American producers on export markets.
Operational Performance

2012 vs. 2011
Operating income variance analysis

Sales
In 2012, newsprint sales decreased $189 million, or 10%, to $1,627 million, primarily as a result of a 262,000 metric ton decrease in shipments ($173 million) and a $6 per metric ton reduction in average transaction price ($15 million).
Shipments were down as a result of our segments, see Note 25, “Segment Information,”efforts to control finished goods inventory and to manage our Consolidated Financial Statements.
As discussed above, dueexposure to newsprint export markets pressured by the implementation of the Plans of Reorganization and the application of fresh start accounting, the operating results of the Successor Company are not comparable to the operating results of the Predecessor Company. To the extent that the items discussed above under “Plans of Reorganization” are allocated to our segments, the results of operationsstrong U.S. dollar. We took 158,000 metric tons more downtime in 2012 than in 2011, for all ofand we indefinitely idled, and subsequently sold, our segments were impactedexport-focused Mersey newsprint mill, reducing our annual capacity by the actions taken during the Creditor Protection Proceedings, the implementation of the Plans of Reorganization and the application of fresh start accounting. Additionally, the results of operations in 2011 for all of our segments were impacted by the allocation of SG&A expenses, excluding employee termination costs and certain discretionary charges, to our segments, as discussed above.
Year Ended December 31, 2011 versus December 31, 2010approximately 250,000 metric tons.
Newsprint
| Years Ended December 31, | ||||||||||||||||
| Successor | Predecessor | |||||||||||||||
| 2011 | 2010 | Change | ||||||||||||||
Average price (per metric ton) | $ | 659 | $ | 600 | $ | 59 | ||||||||||
Average cost (per metric ton) | $ | 627 | $ | 657 | $ | (30 | ) | |||||||||
Shipments (thousands of metric tons) | 2,753 | 3,005 | (252 | ) | ||||||||||||
Downtime (thousands of metric tons) | 102 | 738 | (636 | ) | ||||||||||||
Inventory at end of year (thousands of metric tons) | 78 | 75 | 3 | |||||||||||||
(In millions) | ||||||||||||||||
Segment sales | $ | 1,816 | $ | 1,804 | $ | 12 | ||||||||||
Segment operating income (loss) | 89 | (171) | 260 | |||||||||||||
Significant items that favorably (unfavorably) impacted segment operating income (loss): | ||||
Product pricing | $ | 178 | ||
Shipments | (166 | ) | ||
Change in sales | 12 | |||
Change in cost of sales, excluding depreciation, amortization and cost of timber harvested | 104 | |||
Change in depreciation, amortization and cost of timber harvested | 152 | |||
Change in distribution costs | 14 | |||
Change in selling, general and administrative expenses | (22 | ) | ||
| $ | 260 | |||
Segment sales increased $12 million, or 0.7%, from $1,804 million in 2010 to $1,816 million in 2011 due to higher transaction prices, partially offset by lower shipment volumes. Shipments in 2011 decreased 252,000 metric tons, or 8.4%, compared to 2010.
Downtime at our facilities was significantly lower in 2011 compared to 2010 due to permanent capacity reductions.
Segment operating income (loss) improved $260 million to operating income of $89 million in 2011 compared to an operating loss of $171 million in 2010. The above table presents the items that impacted operating income (loss). A brief explanation of the major items follows.
Segment costCost of sales, excluding depreciation, amortization and cost of timber harvested decreased $104
Segment COS improved by $173 million in 2012, or $90 million net of the impact of lower volume. In addition to an $11 million positive effect on operating income because of the weaker Canadian dollar, there was a $79 million improvement in manufacturing costs, including:
| — | lower costs of power and fuel on lower natural gas pricing and energy saving initiatives ($22 million); |
| — | favorable recovered paper pricing ($20 million); |
| — | the idling of the Mersey facility in June ($18 million); |
| — | lower labor costs as a result of various restructuring initiatives ($16 million); |
| — | other operational cost improvements ($13 million); and |
| — | favorable fiber costs, including kraft usage and lower pricing for wood chips ($7 million). |
Compared to 2011, segment COS was also favorably affected with the receipt of insurance proceeds ($7 million) for the 2011 roof collapse at our Clermont mill, but it was unfavorably affected by the loss of power sales income as a result of our sale of ACH in 2011 ($19 million), a non-cash obsolescence provision for slow-moving spare parts ($6 million) and the benefit of a 2010 NIER rebate recorded in 2011 ($5 million).
2011 vs. 2010
Operating income (loss) variance analysis

Sales
Sales increased $12 million, or 0.7%, to $1,816 million in 2011 compared to 2010. The principal favorable variance was an increase in average transaction price of $59 per metric ton ($178 million), and the principal unfavorable variance was a drop in shipments of 252,000 metric tons ($166 million). We took 636,000 metric tons less of downtime in 2011 compared to 2010 primarily duebecause of permanent capacity reductions.
Cost of sales, excluding depreciation, amortization and cost of timber harvested
Segment COS decreased $104 million in 2011. Compared to 2010, the favorable variances included: the impact of lower volumesvolume ($113 million) and lower; reduced energy costs for energy ($19 million),; lower labor and benefits costs ($22 million) and other favorable cost variances, partiallythe application of a retroactive rebate under the NIER program ($9 million). These were offset by anthe unfavorable currency exchangeeffects of the stronger Canadian dollar ($36 million, primarily due to the Canadian dollar)million) and higher costs for wood and fiber costs ($18 million). In addition, as discussed above, such costs in 2011 were favorably impacted by approximately $9 million for the NIER Program retroactive rebate recorded in the second quarter
Depreciation, amortization and cost of 2011.timber harvested
Segment depreciation, amortization and cost of timber harvested decreased $152 million in 2011 compared to 2010, primarily as a result of actions taken during the Creditor Protection Proceedingscreditor protection proceedings and the application of fresh start accounting, as discussed above.accounting.
Distribution costs
Segment distribution costs decreased $14 million in 2011 compared to 2010, due principally to lowerthe decrease in shipment volumes,volume, partially offset by higher distribution costs per ton.
Newsprint Third-Party Data: North American newsprint demand declined 7.4%Selling, general and global newsprint demand declined 5.2% in 2011 compared to 2010. In 2011, North American net exports of newsprint were 4.2% lower than 2010. Inventories for North American mills as of December 31, 2011 were 192,000 metric tons, which is 1.1% higher than as of December 31, 2010. The North American operating rate for newsprint was 92% in both 2011 and 2010.administrative expenses
Coated Papers
| 00000 | 00000 | 00000 | 00000 | |||||||||||
| Years Ended December 31, | ||||||||||||||
| Successor | Predecessor | |||||||||||||
| 2011 | 2010 | Change | ||||||||||||
Average price (per short ton) | $ | 819 | $ | 718 | $ | 101 | ||||||||
Average cost (per short ton) | $ | 732 | $ | 672 | $ | 60 | ||||||||
Shipments (thousands of short tons) | 657 | 671 | (14 | ) | ||||||||||
Downtime (thousands of short tons) | 6 | 10 | (4 | ) | ||||||||||
Inventory at end of year (thousands of short tons) | 26 | 20 | 6 | |||||||||||
(In millions) | ||||||||||||||
Segment sales | $ | 538 | $ | 482 | $ | 56 | ||||||||
Segment operating income | 57 | 31 | 26 | |||||||||||
| 000000 | ||||
Significant items that favorably (unfavorably) impacted segment operating income: | ||||
Product pricing | $ | 66 | ||
Shipments | (10 | ) | ||
Change in sales | 56 | |||
Change in cost of sales, excluding depreciation, amortization and cost of timber harvested | (15 | ) | ||
Change in depreciation, amortization and cost of timber harvested | (5 | ) | ||
Change in selling, general and administrative expenses | (10 | ) | ||
| $ | 26 | |||
Segment sales increased $56 million, or 11.6%, from $482 million in 2010 to $538 million in 2011 due to higher transaction prices, partially offset by lower shipment volumes.
Segment operating incomeSG&A increased $26 million to $57$22 million in 2011 compared to $312010 as a result of the allocation of SG&A, except employee termination costs and certain other discretionary charges, to the segments in 2011.
COATED PAPERS
Highlights
| Years Ended December 31, | ||||||||||||
| 2012 | 2011 | 2010 | ||||||||||
| (in millions, except where otherwise stated) | Successor | Successor | Predecessor | |||||||||
Sales | $ | 455 | $ | 538 | $ | 482 | ||||||
Operating income 1 | 9 | 57 | 31 | |||||||||
EBITDA 2 | 46 | 92 | 61 | |||||||||
(in thousands of short tons) | ||||||||||||
Shipments | 573 | 657 | 671 | |||||||||
Downtime | 88 | 6 | 10 | |||||||||
Inventory at end of period | 16 | 26 | 20 | |||||||||
| 1. | Net income including noncontrolling interests is equal to operating income in this segment. |
| 2. | EBITDA, a non-GAAP financial measure, is reconciled below. For more information on the calculation and reason we include this measure, see note 1 under “Results of Operations – Consolidated Earnings – Selected Annual Financial Information” above. |
| Years Ended December 31, | ||||||||||||
| 2012 | 2011 | 2010 | ||||||||||
| (in millions) | Successor | Successor | Predecessor | |||||||||
Net income including noncontrolling interests | $ | 9 | $ | 57 | $ | 31 | ||||||
Depreciation, amortization and cost of timber harvested | 37 | 35 | 30 | |||||||||
EBITDA | 46 | 92 | 61 | |||||||||
Industry trends

Source: PPPC
North American demand for coated mechanical paper was down 2.3% in 2012. There was a 4% reduction in shipments within North America and a 12% increase in imports. The shipment-to-capacity ratio average was elevated, at 94% in all of 2012, in part as a result of machine closures in the industry.
Operational Performance

2012 vs. 2011
Operating income variance analysis
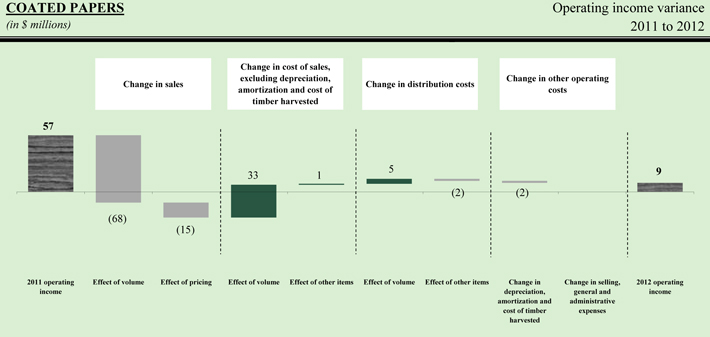
Sales
Coated paper sales decreased $83 million, or 15%, to $455 million in 2010.2012, primarily as a result of a 76,000 metric ton (84,000 short tons) decrease in shipments ($68 million), following the indeterminate idling, as of June 30, of a paper machine at the Catawba mill, and a $26 per short ton reduction in average transaction price ($15 million). The above table presents the items that impacted operating income. A brief explanationidled machine represents a reduction of the major items follows.approximately 132,000 metric tons (146,000 short tons) of capacity on an annualized basis.
Segment costCost of sales, excluding depreciation, amortization and cost of timber harvested
Segment COS decreased $34 million in 2012. Favorable variances other than volume included: lower costs of labor ($3 million) as a result of the restructuring initiatives; lower power and steam costs ($3 million); and lower kraft usage ($2 million). Increases in costs of coating and other chemicals ($6 million) and maintenance ($2 million), owing to the cold mill outage in the first quarter, offset the reductions.
2011 vs. 2010
Operating income variance analysis

Sales
Coated paper sales increased $15$56 million, or 11.6%, to $538 million in 2011, compared to 2010, primarily due to higher costs for wood and fiberreflecting a pricing increase of $101 per short ton ($866 million), energy ($6 million), chemicals ($26 million) and other unfavorable cost variances, partially offset by lower volumesa 13,000 metric ton (14,000 short tons) reduction in shipments ($3010 million).
Coated Papers Third-Party Data:North American demand for coated mechanical papers decreased 8.6% in 2011 compared to 2010. The North American operating rate for coated mechanical papers was 90% in 2011 compared to 88% in 2010. North American coated mechanical mill inventories were at 17 days of supply as of December 31, 2011 compared to 14 days of supply as of December 31, 2010.
Specialty Papers
| Years Ended December 31, | ||||||||||||||||||
| Successor | Predecessor | |||||||||||||||||
| 2011 | 2010 | Change | ||||||||||||||||
Average price (per short ton) | $ | 727 | $ | 687 | $ | 40 | ||||||||||||
Average cost (per short ton) | $ | 692 | $ | 709 | $ | (17 | ) | |||||||||||
Shipments (thousands of short tons) | 1,753 | 1,924 | (171 | ) | ||||||||||||||
Downtime (thousands of short tons) | 90 | 115 | (25 | ) | ||||||||||||||
Inventory at end of year (thousands of short tons) | 68 | 88 | (20 | ) | ||||||||||||||
(In millions) | ||||||||||||||||||
Segment sales | $ | 1,275 | $ | 1,321 | $ | (46 | ) | |||||||||||
Segment operating income (loss) | 62 | (44) | 106 | |||||||||||||||
Significant items that favorably (unfavorably) impacted segment operating income (loss): | ||||
Product pricing | $ | 71 | ||
Shipments | (117 | ) | ||
Change in sales | (46 | ) | ||
Change in cost of sales, excluding depreciation, amortization and cost of timber harvested | 89 | |||
Change in depreciation, amortization and cost of timber harvested | 79 | |||
Change in distribution costs | 4 | |||
Change in selling, general and administrative expenses | (20 | ) | ||
| $ | 106 | |||
Segment sales decreased $46 million, or 3.5%, from $1,321 million in 2010 to $1,275 million in 2011 due to lower shipment volumes, partially offset by higher transaction prices.
Segment operating income (loss) improved $106 million to operating income of $62 million in 2011 compared to an operating loss of $44 million in 2010. The above table presents the items that impacted operating income (loss). A brief explanation of the major items follows.
Segment costCost of sales, excluding depreciation, amortization and cost of timber harvested
Segment COS increased $15 million in 2011 compared to 2010. The principal favorable variance was the lower shipment volume ($30 million), while the unfavorable variances included higher costs for chemicals ($26 million), wood and fiber ($8 million) and energy ($6 million).
Selling, general and administrative expenses
Segment SG&A increased $10 million in 2011 compared to 2010 as a result of the allocation of SG&A, except employee termination costs and certain other discretionary charges, to the segments in 2011.
SPECIALTY PAPERS
Highlights
| Years Ended December 31, | ||||||||||||
| 2012 | 2011 | 2010 | ||||||||||
| (in millions, except where otherwise stated) | Successor | Successor | Predecessor | |||||||||
Sales | $ | 1,107 | $ | 1,275 | $ | 1,321 | ||||||
Operating income (loss) 1 | 76 | 62 | (44 | ) | ||||||||
EBITDA 2 | 122 | 111 | 84 | |||||||||
(in thousands of short tons) | ||||||||||||
Shipments | 1,481 | 1,753 | 1,924 | |||||||||
Downtime | 104 | 90 | 115 | |||||||||
Inventory at end of period | 66 | 68 | 88 | |||||||||
| 1. | Net income (loss) including noncontrolling interests is equal to operating income (loss) in this segment. |
| 2. | EBITDA, a non-GAAP financial measure, is reconciled below. For more information on the calculation and reason we include this measure, see note 1 under “Results of Operations – Consolidated Earnings – Selected Annual Financial Information” above. |
| Years Ended December 31, | ||||||||||||
| 2012 | 2011 | 2010 | ||||||||||
| (in millions) | Successor | Successor | Predecessor | |||||||||
Net income (loss) including noncontrolling interests | $ | 76 | $ | 62 | $ | (44 | ) | |||||
Depreciation, amortization and cost of timber harvested | 46 | 49 | 128 | |||||||||
EBITDA | 122 | 111 | 84 | |||||||||
Industry trends
| ||||
Source: PPPC | ||||
Total North American demand for uncoated mechanical paper declined 16% in 2012, including a 20% drop in high-gloss grades (SC-A+, SC-A, SC-B), 18% in lightweight and 10% in standard grades, including high-brights. The shipment to capacity ratio averaged 92% in the year, but it fell to 83% in December as a result of significant capacity additions late in the year.
Operational Performance
| ||
2012 vs. 2011
Operating income variance analysis
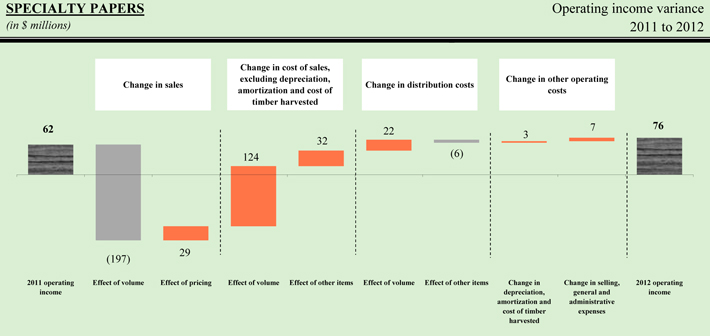
Sales
Specialty paper sales decreased $168 million, or 13%, to $1,107 million in 2012, reflecting the unfavorable effect of a 247,000 metric ton (272,000 short ton) decrease in shipments ($197 million) and the favorable impact of a $20 per short ton increase in average transaction price ($29 million).
We optimized our asset base in the segment as part of our ongoing efforts to manage production and inventory levels and to focus production in our most cost-effective mills. While we took only 13,000 additional metric tons (14,000 short tons) of downtime in 2012 compared to 2011, we adjusted our network with the following capacity initiatives:
| — | closure of one paper machine at Kenogami (December 2011); |
| — | restart of Dolbeau (October 2012); |
| — | closure of one paper machine at Laurentide (November 2012); and |
| — | idling of one paper machine at Fort Frances (November 2012). |
These adjustments resulted in a net decrease of approximately 90,000 metric tons (100,000 short tons) of operating capacity on an annualized basis.
Cost of sales, excluding depreciation, amortization and cost of timber harvested
Segment COS decreased $156 million in 2012. Other than the impact of volume ($124 million), COS was favorably influenced by the positive effects of:
| — | lower costs for power and steam ($14 million); |
| — | the weaker Canadian dollar ($8 million); |
| — | lower labor and benefits costs ($7 million) as a result of various restructuring initiatives; |
| — | lower fiber costs ($3 million); and |
| — | a decline in kraft usage ($2 million). |
Manufacturing costs were, however, unfavorably affected by additional costs associated with the ramp-up of operations at the Dolbeau facility ($4 million) and a non-cash obsolescence provision for slow-moving spare parts ($5 million).
Distribution costs
Segment distribution costs decreased $16 million in 2012 as a result of lower volumes ($22 million), offset by increased unit costs ($6 million) as a result of delays in Dolbeau’s start-up, which led to more costly modes of transportation to meet delivery deadlines.
Selling, general and administrative expenses
We allocated less SG&A to the segment in 2012 due to the reductions in operating capacity.
2011 vs. 2010
Operating income (loss) variance analysis
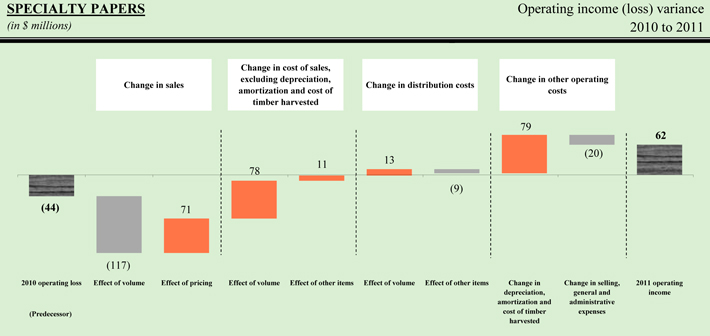
Sales
Specialty papers sales decreased by $46 million, or 3.5%, to $1,275 million in 2011. There was a $40 per short ton increase in average transaction price ($71 million), but a 155,000 metric ton (171,000 short tons) decrease in shipments ($117 million). We reduced our operating capacity in the year with the elimination of paperboard production at Coosa Pines in the first quarter and the closure of a machine at our Kenogami mill in the fourth quarter.
Cost of sales, excluding depreciation, amortization and cost of timber harvested
Segment COS decreased $89 million in 2011 compared to 2010,2010. The favorable variances included: lower shipment volume ($78 million); reduced fuel costs ($14 million); lower labor and benefits costs ($23 million); and a retroactive NIER program rebate for power consumed at our Ontario mills ($3 million). The unfavorable variance was primarily due to lower volumes ($78 million) and lower costs for fuel ($14 million), labor and benefits ($23 million) and other favorable cost variances, partially offset by an unfavorablethe effects of a stronger Canadian dollar currency exchange ($29 million). In addition, as discussed above, such costs in 2011 were favorably impacted by approximately $3 million for the NIER Program retroactive rebate recorded in the second quarter
Depreciation, amortization and cost of 2011.timber harvested
Segment depreciation, amortization and cost of timber harvested decreased $79 million in 2011 compared to 2010, primarily as a result of actions taken during the Creditor Protection Proceedingscreditor protection proceedings and the application of fresh start accounting, as discussed above.accounting.
Distribution costs
Segment distribution costs decreased $4 million in 2011 compared to 2010, due principally to lowerthe decrease in shipment volumes,volume, partially offset by higher distribution costs per ton.
Specialty Papers Third-Party Data:In 2011 compared to 2010, North American demand for supercalendered high gloss papers was down 4.2%, for lightweightSelling, general and directory grades was down 20.8%, for standard uncoated mechanical papers was down 7.5% and in total for all specialty papers was down 7.8%. The North American operating rate for all specialty papers was 94% in 2011 compared to 91% in 2010. North American uncoated mechanical mill inventories were at 16 days of supply as of both December 31, 2011 and 2010.administrative expenses
Market Pulp
| 00000 | 00000 | 00000 | 00000 | |||||||||||
| Years Ended December 31, | ||||||||||||||
| Successor | Predecessor | |||||||||||||
| 2011 | 2010 | Change | ||||||||||||
Average price (per metric ton) | $ | 731 | $ | 737 | $ | (6 | ) | |||||||
Average cost (per metric ton) | $ | 637 | $ | 596 | $ | 41 | ||||||||
Shipments (thousands of metric tons) | 902 | 970 | (68 | ) | ||||||||||
Downtime (thousands of metric tons) | 97 | 47 | 50 | |||||||||||
Inventory at end of year (thousands of metric tons) | 79 | 58 | 21 | |||||||||||
(In millions) | ||||||||||||||
Segment sales | $ | 659 | $ | 715 | $ | (56 | ) | |||||||
Segment operating income | 85 | 137 | (52 | ) | ||||||||||
| 000000 | 000000 | |||||
Significant items that (unfavorably) favorably impacted segment operating income: | ||||||
Product pricing | $ | (6 | ) | |||
Shipments | (50 | ) | ||||
Change in sales | (56 | ) | ||||
Change in cost of sales, excluding depreciation, amortization and cost of timber harvested | – | |||||
Change in depreciation, amortization and cost of timber harvested | 19 | |||||
Change in selling, general and administrative expenses | (15 | ) | ||||
| $ | (52 | ) | ||||
Segment sales decreased $56 million, or 7.8%, from $715 million in 2010 to $659 million in 2011 due to lower shipment volumes and transaction prices.
Segment operating income decreased $52 million to $85SG&A increased $20 million in 2011 compared to $1372010 as a result of the allocation of SG&A, except employee termination costs and certain other discretionary charges, to the segments in 2011.
MARKET PULP
Highlights
| Years Ended December 31, | ||||||||||||
| 2012 | 2011 | 2010 | ||||||||||
| (in millions, except where otherwise stated) | Successor | Successor | Predecessor | |||||||||
Sales | $ | 814 | $ | 659 | $ | 715 | ||||||
Operating (loss) income1 | (50 | ) | 85 | 137 | ||||||||
EBITDA1 | (6 | ) | 115 | 186 | ||||||||
(in thousands of metric tons) | ||||||||||||
Shipments | 1,254 | 902 | 970 | |||||||||
Downtime | 302 | 97 | 47 | |||||||||
Inventory at end of period | 121 | 79 | 58 | |||||||||
| 1. | Net (loss) income including noncontrolling interests is equal to operating (loss) income in this segment. |
| 2. | EBITDA, a non-GAAP financial measure, is reconciled below. For more information on the calculation and reason we include this measure, see note 1 under “Results of Operations – Consolidated Earnings – Selected Annual Financial Information” above. |
| Years Ended December 31, | ||||||||||||
| 2012 | 2011 | 2010 | ||||||||||
| (in millions) | Successor | Successor | Predecessor | |||||||||
Net (loss) income including noncontrolling interests | $ | (50 | ) | $ | 85 | $ | 137 | |||||
Depreciation, amortization and cost of timber harvested | 44 | 30 | 49 | |||||||||
EBITDA | (6 | ) | 115 | 186 | ||||||||
Industry trends

Source: PPPC
Overall chemical market pulp demand rose 2.4% in 2012, driven by a 7% increase in Chinese demand. Demand in North America and Western Europe improved in the fourth quarter, resulting in declines for the year of only 0.8% and 1%, respectively. Global demand for softwood pulp was up 2.4% in 2012, also as a result of stronger demand in the fourth quarter. Non-eucalyptus hardwood pulp was also higher in 2012, by 2%.
Operational Performance
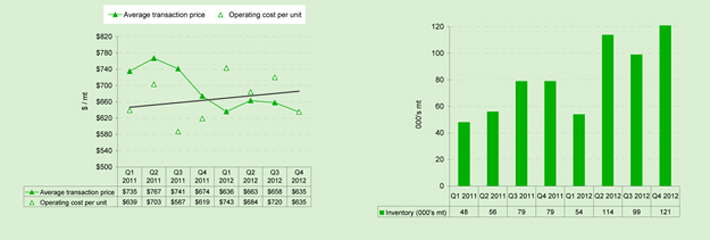
2012 vs. 2011
Operating (loss) income variance analysis

Sales
Sales in the market pulp segment increased $155 million, or 24%, to $814 million in 2010.2012. Shipments rose 352,000 metric tons, including the additional volume ($268 million) with our acquisition of Fibrek, which we began to consolidate in our results as of May. Excluding Fibrek, we experienced a $100 per metric ton decrease in average transaction price ($86 million) and a reduction in shipments compared to 2011 ($27 million). Overall, we took over 205,000 metric tons more downtime in the year, as we increased market downtime in response to softer market conditions compared to 2011, and as a result of downtime associated with the extensive maintenance outage and environmental work at Fibrek’s Saint-Félicien mill.
We also idled our Fort Frances kraft pulp mill in November, reducing the production available for external sales by 63,000 metric tons on an annualized basis. The above table presents the itemsmill’s operational configuration was such that impacted segment operating income. A brief explanation of the major items follows.we did not believe it could be operated profitably under current conditions when its key customer stopped purchasing pulp.
Segment cost
Cost of sales, excluding depreciation, amortization and cost of timber harvested
Segment COS increased $250 million in 2012, mainly as a result of our acquisition of Fibrek ($242 million), partly offset by the favorable impact of lower volume. Unfavorable items included higher costs for chemicals ($11 million), maintenance and labor ($10 million), and, for Fibrek, $16 million of maintenance costs relating to the five-week outage at Saint-Felicien.
Depreciation, amortization and cost of timber harvested
Primarily as a result of adding the three Fibrek mills to our asset base, segment depreciation, amortization and cost of timber harvested increased by $14 million compared to 2011.
Selling, general and administrative expenses
SG&A increased $4 million on account of the acquisition of Fibrek.
2011 vs. 2010
Operating income variance analysis
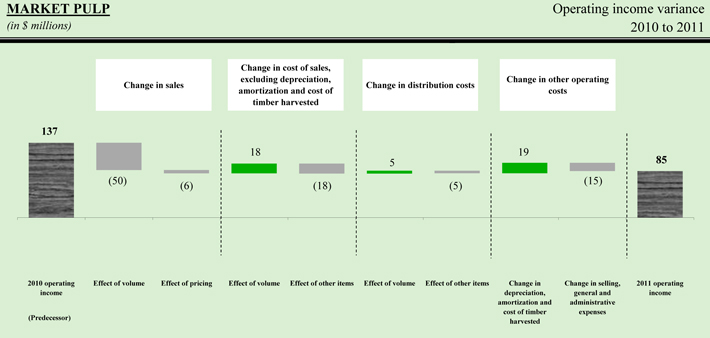
Sales
Sales in the market pulp segment decreased $56 million, or 7.8%, to $659 million in 2011 as a result of a $6 per metric ton decrease in average transaction price ($6 million) and a 68,000 metric ton decrease in shipments ($50 million), primarily because of increased downtime.
Cost of sales, excluding depreciation, amortization and cost of timber harvested
Segment COS was unchanged in 2011 compared to 2010. An unfavorable Canadian dollar currency exchange ($10 million), higher costs for energy ($5 million) and other unfavorable cost2010, reflecting the net of favorable variances were offset byfor: lower volumesshipment volume ($18 million) and; lower costs for wood and fiber costs ($3 million) and; lower labor and benefits ($3 million). In addition, as discussed above, such; and a retroactive NIER program rebate for power consumed at our Ontario pulp mills ($2 million); offset by unfavorable variances associated with: the effects of a stronger Canadian dollar on currency exchange ($10 million); and higher energy costs in 2011 were favorably impacted by approximately $2 million for the NIER Program retroactive rebate recorded in the second quarter($5 million).
Depreciation, amortization and cost of 2011.timber harvested
Segment depreciation, amortization and cost of timber harvested decreased $19 million in 2011 compared to 2010, primarily as a result of actions taken during the Creditor Protection Proceedingscreditor protection proceedings and the application of fresh start accounting, as discussed above.accounting.
Market Pulp Third-Party Data:World shipments for market pulp increased 3.5% in 2011 compared to 2010. Shipments were down 2.4% in Western Europe (the world’s largest pulp market), down 3.5% in North America, up 30.0% in China, down 2.7% in Latin AmericaSelling, general and up 0.1% in Africa and Asia (excluding China and Japan). World market pulp producers shipped at 91% of capacity in 2011 compared to 92% in 2010. World market pulp producer inventories of softwood and hardwood grades were at 36 days and 33 days, respectively, of supply as of December 31, 2011 compared to 25 days and 36 days, respectively, of supply as of December 31, 2010. World market pulp producer inventories of all grades were at 34 days of supply as of December 31, 2011 compared to 30 days of supply as of December 31, 2010.administrative expenses
Wood Products
| 00000 | 00000 | 00000 | 00000 | |||||||||||
| Years Ended December 31, | ||||||||||||||
| Successor | Predecessor | |||||||||||||
| 2011 | 2010 | Change | ||||||||||||
Average price (per thousand board feet) | $ | 294 | $ | 304 | $ | (10 | ) | |||||||
Average cost (per thousand board feet) | $ | 310 | $ | 297 | $ | 13 | ||||||||
Shipments (millions of board feet) | 1,586 | 1,395 | 191 | |||||||||||
Downtime (millions of board feet) | 560 | 954 | (394 | ) | ||||||||||
Inventory at end of year (millions of board feet) | 124 | 122 | 2 | |||||||||||
(In millions) | ||||||||||||||
Segment sales | $ | 468 | $ | 424 | $ | 44 | ||||||||
Segment operating (loss) income | (25) | 9 | (34 | ) | ||||||||||
| 000000 | 000000 | |||||
Significant items that (unfavorably) favorably impacted segment operating (loss) income: | ||||||
Product pricing | $ | (14 | ) | |||
Shipments | 58 | |||||
Change in sales | 44 | |||||
Change in cost of sales, excluding depreciation, amortization and cost of timber harvested | (55 | ) | ||||
Change in depreciation, amortization and cost of timber harvested | 9 | |||||
Change in distribution costs | (15 | ) | ||||
Change in selling, general and administrative expenses | (17 | ) | ||||
| $ | (34 | ) | ||||
Segment sales increased $44 million, or 10.4%, from $424 million in 2010 to $468 million in 2011 due to higher shipment volumes, partially offset by lower transaction prices.
In 2011, downtime at our facilities was market related.
Segment operating (loss) income decreased $34 million to an operating loss of $25SG&A increased $15 million in 2011 compared to 2010 as a result of the allocation of SG&A, except employee termination costs and certain other discretionary charges, to the segments in 2011.
WOOD PRODUCTS
Highlights
| Years Ended December 31, | ||||||||||||
| 2012 | 2011 | 2010 | ||||||||||
| (in millions, except where otherwise stated) | Successor | Successor | Predecessor | |||||||||
Sales | $ | 500 | $ | 468 | $ | 424 | ||||||
Operating income (loss)1 | 26 | (25) | 9 | |||||||||
EBITDA2 | 60 | 8 | 51 | |||||||||
(in millions of board feet) | ||||||||||||
Shipments | 1,442 | 1,586 | 1,395 | |||||||||
Downtime | 559 | 517 | 904 | |||||||||
Inventory at end of period | 101 | 124 | 122 | |||||||||
| 1. | Net income (loss) including noncontrolling interests is equal to operating income (loss) in this segment. |
| 2. | EBITDA, a non-GAAP financial measure, is reconciled below. For more information on the calculation and reason we include this measure, see note 1 under “Results of Operations – Consolidated Earnings – Selected Annual Financial Information” above. |
| Years Ended December 31, | ||||||||||||
| 2012 | 2011 | 2010 | ||||||||||
| (in millions) | Successor | Successor | Predecessor | |||||||||
Net income (loss) including noncontrolling interests | $ | 26 | $ | (25) | $ | 9 | ||||||
Depreciation, amortization and cost of timber harvested | 34 | 33 | 42 | |||||||||
EBITDA | 60 | 8 | 51 | |||||||||
Industry trends
|
| Source: U.S. Census Bureau |
Actual U.S. housing starts in 2012 were 780,000, 28% higher than in 2011.
Operational Performance
| ||
2012 vs. 2011
Operating income of $9(loss) variance analysis

Sales
Wood products sales increased $32 million, or 7%, to $500 million in 2010.2012. The above table presentsprincipal favorable variance was an increase in average transaction price of $53 per thousand board feet ($75 million), partially offset by a 144 million board feet reduction in shipments ($43 million). The drop in shipments stems from lower production, including the items that impacted segment operating (loss) income. A brief explanationclosure of the major items follows.Oakhill sawmill in Nova Scotia and downtime at certain Quebec sawmills.
Segment costCost of sales, excluding depreciation, amortization and cost of timber harvested
Segment COS decreased $8 million in 2012, including the favorable impact of lower volume ($24 million). Manufacturing costs were favorably influenced by lower maintenance costs ($8 million) due in part to the closure of the Oakhill sawmill, and a favorable inventory adjustment as a result of increasing market prices for lumber products ($6 million). They were unfavorably affected by: lower prices on chip sales ($8 million); higher stumpage costs ($17 million), which are directly related to lumber prices; and unfavorable fiber usage ($4 million) due to size and species mix.
Distribution costs
Segment distribution costs decreased $13 million in 2012 as a result of lower volumes ($7 million) and lower freight costs ($6 million).
2011 vs. 2010
Operating (loss) income variance analysis

Sales
Wood products sales increased $44 million, or 10.4%, to $468 million in 2011. Shipments increased 191 million board feet ($58 million) as a result of an improvement to market conditions, but average transaction price decreased by $10 per thousand board feet ($14 million). Downtime in 2011 was 387 million board feet lower than in 2010.
Cost of sales, excluding depreciation, amortization and cost of timber harvested
Segment COS increased $55 million in 2011 compared to 2010, primarily due to an unfavorable2010. Despite lower costs for labor and benefits ($22 million), COS was unfavorably influenced by: the effects of the stronger Canadian dollar on currency exchange ($14 million),; higher shipment volumes ($38 million); and higher costs for wood and fiber ($13 million).
Depreciation, amortization and other unfavorable cost variances, partially offset by lower costs for labor and benefits ($22 million).of timber harvested
Segment depreciation, amortization and cost of timber harvested decreased $9 million in 2011 compared to 2010, primarily as a result of actions taken during the Creditor Protection Proceedingscreditor protection proceedings and the application of fresh start accounting, as discussed above.accounting.
Distribution costs
Segment distribution costs increased $15 million in 2011 compared to 2010, due to higherthe increase in shipment volumesvolume and higher distribution costs per ton.
Wood Products Third-Party DataSelling, general and administrative expenses: Privately-owned housing starts in the U.S.
Segment SG&A increased 24.9% to a seasonally-adjusted annual rate of 657,000 units$17 million in December 2011 compared to 526,000 units2010 as a result of the allocation of SG&A, except employee termination costs and certain other discretionary charges, to the segments in December 2010.2011.
Corporate and OtherCORPORATE AND OTHER
Highlights
| Years Ended December 31, | ||||||||||||||||
| 2012 | 2011 | 2010 | ||||||||||||||
| (in millions) | Successor | Successor | Predecessor | |||||||||||||
Cost of sales, excluding depreciation, amortization and cost of timber harvested | $ (37 | ) | $ (14 | ) | $ (25 | ) | ||||||||||
Depreciation, amortization and cost of timber harvested | – | – | (19 | ) | ||||||||||||
Distribution costs | – | – | (3 | ) | ||||||||||||
Selling, general and administrative expenses | (6 | ) | (13 | ) | (94 | ) | ||||||||||
Closure costs, impairment and other related charges | (180 | ) | (46 | ) | (11 | ) | ||||||||||
Net gain on disposition of assets and other | 35 | 3 | 30 | |||||||||||||
Operating loss | $ (188 | ) | $ (70 | ) | $ (122 | ) | ||||||||||
The following table is included in order to facilitatebelow shows the reconciliation of our segment salesnet (loss) income including noncontrolling interests to EBITDA and segment operating income (loss) to our total salesadjusted EBITDA, which are non-GAAP financial measures. For more information on the calculation and operating income (loss) in ourreason we include these measures, see note 1 under “Results of Operations – Consolidated Statements of Operations.Earnings – Selected Annual Financial Information” above.
| Years Ended December 31, | ||||||||||||||||||
| Successor | Predecessor | |||||||||||||||||
| (In millions) | 2011 | 2010 | Change | |||||||||||||||
Cost of sales, excluding depreciation, amortization and cost of timber harvested | $ | (14) | $ | (25) | $ | 11 | ||||||||||||
Depreciation, amortization and cost of timber harvested | – | (19) | 19 | |||||||||||||||
Distribution costs | – | (3) | 3 | |||||||||||||||
Selling, general and administrative expenses | (13) | (94) | 81 | |||||||||||||||
Closure costs, impairment and other related charges | (46) | (11) | (35 | ) | ||||||||||||||
Net gain on disposition of assets and other | 3 | 30 | (27 | ) | ||||||||||||||
Operating loss | $ | (70) | $ | (122) | $ | 52 | ||||||||||||
| Years Ended December 31, | ||||||||||||||||
| 2012 | 2011 | 2010 | ||||||||||||||
| (in millions) | Successor | Successor | Predecessor | |||||||||||||
Net (loss) income including noncontrolling interests | $ (194 | ) | $ (229 | ) | $ 2,813 | |||||||||||
Interest expense | 66 | 95 | 483 | |||||||||||||
Income tax (benefit) provision | (38 | ) | 16 | (1,606 | ) | |||||||||||
Depreciation, amortization and cost of timber harvested | – | – | 19 | |||||||||||||
EBITDA | $ (166 | ) | $ (118 | ) | $ 1,709 | |||||||||||
Foreign exchange translation (gain) loss | (17 | ) | 21 | 94 | ||||||||||||
Employee termination costs (credits) | 5 | 12 | (8 | ) | ||||||||||||
Closure costs, impairment and other related charges | 180 | 46 | 11 | |||||||||||||
Inventory write-downs related to closures | 12 | 3 | – | |||||||||||||
Start up costs of idled mills | 13 | – | – | |||||||||||||
Net gain on disposition of assets | (35) | (3) | (30) | |||||||||||||
Post-emergence costs | 11 | 47 | – | |||||||||||||
Transaction costs | 8 | 5 | – | |||||||||||||
Other income, net | (16) | (20) | (5) | |||||||||||||
Reorganization items, net | – | – | (1,901) | |||||||||||||
Adjusted EBITDA | (5) | (7) | (130) | |||||||||||||
Cost of sales,2012 vs. 2011
Costs, excluding depreciation, amortization and cost of timber harvested
Cost of sales, excluding depreciation, amortizationCOS rose by $23 million, to $37 million, in 2012. In 2012, we incurred start-up costs for our Dolbeau and cost of timber harvested, in corporate and other included ongoing costs related to closedGatineau mills and other miscellaneous adjustments. Additionally, in 2011, we recorded charges of $3 million for($13 million), write-downs of inventory as a result of the decisioncapacity reduction initiatives at Mersey, Fort Frances and Laurentide ($12 million) and other costs related to ceaseclosed mills ($12 million). By comparison, in 2011, we incurred costs related to closed mills ($9 million), write-downs of inventory ($3 million) with the elimination of paperboard production at our Coosa Pines paper mill as well as the permanent closure of a paper machine at our Kenogami paper mill. Cost of sales, excluding depreciation, amortization and cost of timber harvested, in corporate and other in 2010 included approximately $31 million for ongoing costs related to closed mills.
Selling, general and administrative expenses
Beginning in 2011, all selling, general and administrative expenses, excluding employee termination costs and certain discretionary charges, are allocated to our segments. Prior to 2011, only direct selling expenses were allocated to our segments, with the balance of selling, general and administrative expenses included in corporate and other. In 2011, we recorded approximately $12 million of corporate employee termination costs and approximately $5 million of transaction costs in connection with our proposed acquisition of Fibrek, as well as the reversal of a capital tax reserve of approximately $4 million. In 2010, selling, general and administrative expenses included in corporate and other included the reversal of a $17 million bonus accrual, as well as a lease termination fee of approximately $2 million related to our head office in Montreal, Quebec.
Closure costs, impairment and other related charges
In 2011, we recorded closure costs, impairment and other related charges of $46 million for: (i) accelerated depreciation related to the permanent closures of a de-inking line at our Alma paper mill, a paper machine and a thermomechanical pulp line at our Baie-Comeau paper mill, as well as our Saint-Prime remanufacturing wood products facility; (ii) accelerated depreciation, long-lived asset impairment charges, severance costs and an OPEB benefit plan curtailment loss as a result of the decision to cease paperboard production at our Coosa Pines paper mill; (iii) long-lived asset impairment charges related to our Mokpo paper mill and certain scrapped equipment at our Calhoun paper mill; (iv) severance costs for an early retirement program for employees at our Mokpo paper mill; (v) accelerated depreciation, severance costs and a pension plan curtailment loss related to the permanent closure of a paper machine at our Kenogami paper millmill.
Selling, general and (vi) severanceadministrative expenses
Corporate SG&A was $7 million lower in 2012 than in 2011, mainly as a result of a refund of certain group benefit premiums paid in prior years ($11 million), partly offset by additional transaction costs.
Closure costs, impairment and a pension plan curtailment lossother related to a workforce reduction at our Mersey operations.charges
In 2010, weWe recorded closure costs, impairment and other related charges of $180 million in 2012, $134 million higher than in 2011, as a result of our asset optimization initiatives during the year, including the idling and sale of operations in Mersey the idling of a kraft pulp mill and paper machine in Fort Frances, and the closure of a paper machine in Laurentide. Our major initiatives in 2011 included machine closures in Coosa Pines, Baie-Comeau and Kenogami, as well as restructurings in our Mokpo and Mersey facilities.
Net gain on disposition of assets and other
We recognized a net gain on disposition of assets of $35 million in 2012, compared to $3 million in 2011, mainly as a result of the sale of timberlands in Nova Scotia in the first quarter.
2011 vs. 2010
Costs, excluding depreciation, amortization and cost of timber harvested
Cost of sales was $11 million lower in 2011 than in 2010. In 2011, we recorded charges related to the closure of production at Coosa Pines and Kenogami and ongoing costs related to closed mills, as described above, but we recorded $31 million of ongoing costs related to closed mills in 2010.
Selling, general and administrative expenses
SG&A decreased by $81 million in 2011, primarily because we started to allocate SG&A to our operating segments, with the exception of employee termination costs and certain other discretionary charges. Before then, only direct selling expenses were allocated to the segments, with the balance of SG&A included in corporate and other. Other favorable variances included our continued cost reduction initiatives, including salary reductions at the corporate level, and the reversal of a capital tax reserve of
($4 million) in 2011 and a lease termination fee, in 2010, for our former head office in Montreal ($2 million). The unfavorable variances included: the recordingreversal, in 2010, of a bonus accrual ($17 million); and, in 2011, corporate employee termination costs ($12 million) and transaction costs in connection with our acquisition of Fibrek ($5 million).
Closure costs, impairment and other related charges
We recorded closure costs, impairment and other related charges of $46 million in 2011 compared to $11 million in 2010, a $35 million increase. Our 2011 initiatives included: scrapping equipment at our Calhoun mill; the closure of a de-inking line at Alma, a paper machine in Baie-Comeau, paperboard production at Coosa Pines, a paper machine in Kenogami, and a remanufacturing wood products facility in Saint-Prime; and mill restructuring initiatives in Mokpo and Mersey. In 2010, we recorded a tax indemnification liability related to the 2009 sale of our investment in Manicouagan Power Company, or “MPCo and long-lived asset impairment”, charges related to our previously permanently closed Covington, Tennessee facility, as well as costs for a lawsuit related to a closed millmills, and other miscellaneous adjustments to severance liabilities and asset retirement obligations.
For additional information, see Note 5, “Closure Costs, Impairment and Other Related Charges,” to our Consolidated Financial Statements.
Net gain on disposition of assets and other
In 2011, weWe also recorded a net gain on disposition of assets of $3 million relatedin 2011, compared to the sale of our investment in ACH, our Alabama River paper mill and various other assets. In 2010, we recorded a net gain on disposition of assets and other of $30 million in 2010, which was primarily related to the sale of various assets, as well asresult of: a net gain related to a customercustomer’s bankruptcy settlement.
For additional information, see Note 6, “Assets Held for Sale, Liabilities Associated with Assets Held for Sale and Net Gain on Disposition of Assets and Other – Net gain on disposition of assets and other,” to our Consolidated Financial Statements.
Year Ended December 31, 2010 versus December 31, 2009
Newsprint
| 000000000 | 000000000 | 000000000 | ||||||||||
| Predecessor | ||||||||||||
| Years Ended December 31, | ||||||||||||
| 2010 | 2009 | Change | ||||||||||
Average price (per metric ton) | $ | 600 | $ | 571 | $ | 29 | �� | |||||
Average cost (per metric ton) | $ | 657 | $ | 682 | $ | (25 | ) | |||||
Shipments (thousands of metric tons) | 3,005 | 3,157 | (152 | ) | ||||||||
Downtime (thousands of metric tons) | 738 | 1,404 | (666 | ) | ||||||||
Inventory at end of year (thousands of metric tons) | 75 | 117 | (42 | ) | ||||||||
(In millions) | ||||||||||||
Segment sales | $ | 1,804 | $ | 1,802 | $ | 2 | ||||||
Segment operating loss | (171 | ) | (353 | ) | 182 | |||||||
| 000000000 | ||||
Significant items that favorably (unfavorably) impacted segment operating loss: | ||||
Product pricing | $ | 93 | ||
Shipments | (91 | ) | ||
Change in sales | 2 | |||
Change in cost of sales and depreciation, amortization and cost of timber harvested | 211 | |||
Change in distribution costs | (22 | ) | ||
Change in selling, general and administrative expenses | (9 | ) | ||
| $ | 182 | |||
Segment sales increased $2 million, or 0.1%, from $1,802 million in 2009 to $1,804 million in 2010 due to higher transaction prices, offset by lower shipment volumes. Shipments in 2010 decreased 152,000 metric tons, or 4.8%, compared to 2009.
In 2010, downtime was primarily at indefinitely idled facilities.
Segment operating loss decreased $182 million to $171 million in 2010 compared to $353 million in 2009. The above table presents the items that impacted operating loss. A brief explanation of the major items follows.
Segment cost of sales and depreciation, amortization and cost of timber harvested decreased $211 million in 2010 compared to 2009, primarily due to lower volumessettlement ($16616 million), lower costs for wood and fiber ($7 million), energy ($4 million), fuel ($5 million), labor and benefits ($55 million), depreciation ($68 million) and other favorable cost variances. These lower costs were partially offset by an unfavorable currency exchange ($96 million, primarily due to the Canadian dollar), as well as benefits from the alternative fuel mixture tax credits of $15 million that were recorded in 2009. The average cost per ton decreased $30 in 2010 compared to 2009, excluding the benefit of $5 per ton credited in 2009 due to the benefits from the alternative fuel mixture tax credits in 2009.
Segment distribution costs increased $22 million in 2010 compared to 2009 due to higher distribution costs per ton, partially offset by lower shipment volumes.
Newsprint Third-Party Data: In 2010, North American newsprint demand declined 6.0% compared to 2009. In 2010, North American net exports of newsprint were 47.9% higher than 2009. Inventories for North American mills as of December 31, 2010 were 187,000 metric tons, which is 34.2% lower than as of December 31, 2009. The days of supply at the U.S. daily newspapers was 44 days as of December 31, 2010 compared to 47 days as of December 31, 2009. The North American operating rate for newsprint was 92% in 2010 compared to 75% in 2009.
Coated Papers
| 000000000 | 000000000 | 000000000 | ||||||||||
| Predecessor | ||||||||||||
| Years Ended December 31, | ||||||||||||
| 2010 | 2009 | Change | ||||||||||
Average price (per short ton) | $ | 718 | $ | 730 | $ | (12 | ) | |||||
Average cost (per short ton) | $ | 672 | $ | 574 | $ | 98 | ||||||
Shipments (thousands of short tons) | 671 | 571 | 100 | |||||||||
Downtime (thousands of short tons) | 10 | 114 | (104 | ) | ||||||||
Inventory at end of year (thousands of short tons) | 20 | 22 | (2 | ) | ||||||||
(In millions) | ||||||||||||
Segment sales | $ | 482 | $ | 416 | $ | 66 | ||||||
Segment operating income | 31 | 89 | (58 | ) | ||||||||
| 000000000 | ||||
Significant items that (unfavorably) favorably impacted segment operating income: | ||||
Product pricing | $ | (6 | ) | |
Shipments | 72 | |||
Change in sales | 66 | |||
Change in cost of sales and depreciation, amortization and cost of timber harvested | (117 | ) | ||
Change in distribution costs | (6 | ) | ||
Change in selling, general and administrative expenses | (1 | ) | ||
| $ | (58 | ) | ||
Segment sales increased $66 million, or 15.9%, from $416 million in 2009 to $482 million in 2010 due to significantly higher shipment volumes, partially offset by lower transaction prices.
Segment operating income decreased $58 million to $31 million in 2010 compared to $89 million in 2009. The above table presents the items that impacted operating income. A brief explanation of the major items follows.
Segment cost of sales and depreciation, amortization and cost of timber harvested increased $117 million in 2010 compared to 2009, primarily due to benefits from the alternative fuel mixture tax credits of $62 million that were recorded in 2009, higher volumes ($31 million) and higher costs for wood and fiber ($10 million), fuel ($2 million), chemicals ($8 million), labor and benefits ($2 million), maintenance ($7 million) and depreciation ($2 million), partially offset by favorable cost variances. The average cost per ton decreased $11 in 2010 compared to 2009, excluding the benefit of $109 per ton credited in 2009 due to the benefits from the alternative fuel mixture tax credits in 2009.
Segment distribution costs increased $6 million in 2010 compared to 2009 due to higher shipment volumes.
Coated Papers Third-Party Data:North American demand for coated mechanical papers increased 1.8% in 2010 compared to 2009. The North American operating rate for coated mechanical papers was 88% in 2010 compared to 78% in 2009. North American coated mechanical mill inventories were at 14 days of supply as of December 31, 2010 compared to 19 days of supply as of December 31, 2009.
Specialty Papers
| Predecessor | ||||||||||||||||||
| Years Ended December 31, | ||||||||||||||||||
| 2010 | 2009 | Change | ||||||||||||||||
Average price (per short ton) | $ | 687 | $ | 731 | $ | (44 | ) | |||||||||||
Average cost (per short ton) | $ | 709 | $ | 685 | $ | 24 | ||||||||||||
Shipments (thousands of short tons) | 1,924 | 1,819 | 105 | |||||||||||||||
Downtime (thousands of short tons) | 115 | 521 | (406 | ) | ||||||||||||||
Inventory at end of year (thousands of short tons) | 88 | 86 | 2 | |||||||||||||||
| (In millions) | ||||||||||||||||||
Segment sales | $ | 1,321 | $ | 1,331 | $ | (10 | ) | |||||||||||
Segment operating (loss) income | (44 | ) | 85 | (129 | ) | |||||||||||||
Significant items that (unfavorably) favorably impacted segment operating (loss) income: |
| |||||||||||||||||
Product pricing | $ | (82 | ) | |||||||||||||||
Shipments | 72 | |||||||||||||||||
Change in sales | (10 | ) | ||||||||||||||||
Change in cost of sales and depreciation, amortization and cost of timber harvested | (114 | ) | ||||||||||||||||
Change in distribution costs | (3 | ) | ||||||||||||||||
Change in selling, general and administrative expenses | (2 | ) | ||||||||||||||||
| $ | (129 | ) | ||||||||||||||||
Segment sales decreased $10 million, or 0.8%, from $1,331 million in 2009 to $1,321 million in 2010 due to lower average transaction prices, partially offset by higher shipment volumes.
In 2010, downtime at our facilities was market related.
Segment operating (loss) income decreased $129 million to an operating loss of $44 million in 2010 compared to $85 million of operating income in 2009. The above table presents the items that impacted operating (loss) income. A brief explanation of the major items follows.
Segment cost of sales and depreciation, amortization and cost of timber harvested increased $114 million in 2010 compared to 2009, primarily due to an unfavorable Canadian dollar currency exchange ($78 million), benefits from the alternative fuel mixture tax credits of $34 million that were recorded in 2009, higher volumes ($8 million) and higher costs for energy ($23 million), maintenance ($10 million) and other unfavorable cost variances. These higher costs were partially offset by lower costs for wood and fiber ($3 million), depreciation ($23 million), chemicals ($14 million) and fuel ($3 million). The average cost per ton increased $5 in 2010 compared to 2009, excluding the benefit of $19 per ton credited in 2009 due to the benefits from the alternative fuel mixture tax credits in 2009.
Segment distribution costs increased $3 million in 2010 compared to 2009 due to higher shipment volumes, partially offset by lower distribution costs per ton.
Specialty Papers Third-Party Data: In 2010 compared to 2009, North American demand for supercalendered high gloss papers was up 1.8%, for lightweight or directory grades was down 8.1%, for standard uncoated mechanical papers was up 3.5% and in total for all specialty papers was up 1.1%. The North American operating rate for all specialty papers was 91% in 2010 compared to 76% in 2009. North American uncoated mechanical mill inventories were at 16 days of supply as of December 31, 2010 compared to 18 days supply as of December 31, 2009.
Market Pulp
| Predecessor | ||||||||||||||||||
| Years Ended December 31, | ||||||||||||||||||
| 2010 | 2009 | Change | ||||||||||||||||
Average price (per metric ton) | $ | 737 | $ | 548 | $ | 189 | ||||||||||||
Average cost (per metric ton) | $ | 596 | $ | 430 | $ | 166 | ||||||||||||
Shipments (thousands of metric tons) | 970 | 946 | 24 | |||||||||||||||
Downtime (thousands of metric tons) | 47 | 138 | (91 | ) | ||||||||||||||
Inventory at end of year (thousands of metric tons) | 58 | 53 | 5 | |||||||||||||||
| (In millions) | ||||||||||||||||||
Segment sales | $ | 715 | $ | 518 | $ | 197 | ||||||||||||
Segment operating income | 137 | 112 | 25 | |||||||||||||||
Significant items that favorably (unfavorably) impacted segment operating income: | ||||||||||||||||||
Product pricing | $ | 180 | ||||||||||||||||
Shipments | 17 | |||||||||||||||||
Change in sales | 197 | |||||||||||||||||
Change in cost of sales and depreciation, amortization and cost of timber harvested | (159 | ) | ||||||||||||||||
Change in distribution costs | (10 | ) | ||||||||||||||||
Change in selling, general and administrative expenses | (3 | ) | ||||||||||||||||
| $ | 25 | |||||||||||||||||
Segment sales increased $197 million, or 38.0%, from $518 million in 2009 to $715 million in 2010 due to significantly higher transaction prices and slightly higher shipment volumes.
Segment operating income increased $25 million to $137 million in 2010 compared to $112 million in 2009. The above table presents the items that impacted operating income. A brief explanation of the major items follows.
Segment cost of sales and depreciation, amortization and cost of timber harvested increased $159 million in 2010 compared to 2009, primarily due to benefits from the alternative fuel mixture tax credits of $165 million that were recorded in 2009, an unfavorable Canadian dollar currency exchange ($26 million), higher costs for maintenance ($6 million) and other unfavorable cost variances. These higher costs were partially offset by lower volumes ($10 million) and lower costs for energy ($2 million), fuel ($2 million), chemicals ($13 million), labor and benefits ($15 million) and depreciation ($3 million). The average cost per ton decreased $9 in 2010 compared to 2009, excluding the benefit of $175 per ton credited in 2009 due to the benefits from the alternative fuel mixture tax credits in 2009.
Segment distribution costs increased $10 million in 2010 compared to 2009 due to higher distribution costs per ton and higher shipment volumes.
Market Pulp Third-Party Data:World shipments for market pulp increased 0.3% in 2010 compared to 2009. Shipments were up 7.6% in Western Europe (the world’s largest pulp market), up 5.7% in North America, down 17.4% in China, up 11.3% in Latin America and down 7.0% in Africa and Asia (excluding China and Japan). World market pulp producers shipped at 92% of capacity in 2010 compared to 91% in 2009. World market pulp producer inventories were at 30 days of supply as of December 31, 2010 compared to 27 days of supply as of December 31, 2009.
Wood Products
| Predecessor | ||||||||||||||||||
| Years Ended December 31, | ||||||||||||||||||
| 2010 | 2009 | Change | ||||||||||||||||
Average price (per thousand board feet) | $ | 304 | $ | 254 | $ | 50 | ||||||||||||
Average cost (per thousand board feet) | $ | 297 | $ | 303 | $ | (6 | ) | |||||||||||
Shipments (millions of board feet) | 1,395 | 1,143 | 252 | |||||||||||||||
Downtime (millions of board feet) | 954 | 1,761 | (807 | ) | ||||||||||||||
Inventory at end of year (millions of board feet) | 122 | 106 | 16 | |||||||||||||||
(In millions) | ||||||||||||||||||
Segment sales | $ | 424 | $ | 290 | $ | 134 | ||||||||||||
Segment operating income (loss) | 9 | (56 | ) | 65 | ||||||||||||||
Significant items that favorably (unfavorably) impacted segment operating income (loss): | ||||||||||||||||||
Product pricing | $ | 57 | ||||||||||||||||
Shipments | 77 | |||||||||||||||||
Change in sales | 134 | |||||||||||||||||
Change in cost of sales and depreciation, amortization and cost of timber harvested | (54 | ) | ||||||||||||||||
Change in distribution costs | (17 | ) | ||||||||||||||||
Change in selling, general and administrative expenses | 2 | |||||||||||||||||
| $ | 65 | |||||||||||||||||
Segment sales increased $134 million, or 46.2%, from $290 million in 2009 to $424 million in 2010 due to significantly higher shipment volumes and transaction prices. Despite a decrease in U.S. housing starts, shipments were higher in 2010, primarily due to an increase in Canadian housing starts.
In 2010, downtime at our facilities was market related.
Segment operating income (loss) improved $65 million to operating income of $9 million in 2010 compared to a $56 million operating loss in 2009. The above table presents the items that impacted operating income (loss). A brief explanation of the major items follows.
Segment cost of sales and depreciation, amortization and cost of timber harvested increased $54 million in 2010 compared to 2009, primarily due to an unfavorable Canadian dollar currency exchange ($48 million) and higher volumes ($105 million), partially offset by lower costs for wood ($14 million), energy ($5 million), depreciation ($6 million), labor and benefits ($12 million), administrative overhead ($38 million) and other favorable cost variances.
Segment distribution costs increased $17 million in 2010 compared to 2009 due to higher shipment volumes and higher distribution costs per ton.
Wood Products Third-Party Data: Privately-owned housing starts in the U.S. decreased 8.2% in December 2010 compared to December 2009.
Corporate and Other
The following table is included in order to facilitate the reconciliation of our segment sales and segment operating income (loss) to our total sales and operating income (loss) in our Consolidated Statements of Operations.
| Predecessor | ||||||||||||||||||
| Years Ended December 31, | ||||||||||||||||||
| (In millions) | 2010 | 2009 | Change | |||||||||||||||
Sales | $ | – | $ | 9 | $ | (9 | ) | |||||||||||
Cost of sales and depreciation, amortization and cost of timber harvested | (44 | ) | (8 | ) | (36 | ) | ||||||||||||
Distribution (costs) credit | (3 | ) | 6 | (9 | ) | |||||||||||||
Selling, general and administrative expenses | (94 | ) | (148 | ) | 54 | |||||||||||||
Closure costs, impairment and other related charges | (11 | ) | (202 | ) | 191 | |||||||||||||
Net gain on disposition of assets and other | 30 | 91 | (61 | ) | ||||||||||||||
Operating loss | $ | (122 | ) | $ | (252 | ) | $ | 130 | ||||||||||
Cost of sales and depreciation, amortization and cost of timber harvested
Cost of sales and depreciation, amortization and cost of timber harvested in 2010 included an accrual of approximately $6 million for the 2010 short-term incentive plan and approximately $31 million for ongoing costs related to closed mills. Cost of sales and depreciation, amortization and cost of timber harvested in 2009 included $17 million for the write-down of inventory, primarily associated with our Alabama River, Alabama and Dalhousie, New Brunswick mills, as well as two paper machines at our Calhoun mill.
Selling, general and administrative expenses
The decrease in selling, general and administrative expenses in 2010 compared to 2009 was due to our continued cost reduction initiatives, the reversal of a $17 million bonus accrual in 2010, as well as $10 million of costs incurred in 2009 related to our unsuccessful refinancing efforts. These decreases were partially offset by a $16 million reversal that was recorded in 2009 for previously recorded Canadian capital tax liabilities as a result of legislation which eliminated this tax, an accrual of approximately $7 million in 2010 for the 2010 short-term incentive plan and a lease termination fee of approximately $2 million in 2010 related to our head office in Montreal, Quebec.
Closure costs, impairment and other related charges
In 2010, we recorded closure costs, impairment and other related charges of $11 million, primarily for the recording of a tax indemnification liability related to the 2009 sale of our investment in MPCo and long-lived asset impairment charges related to our previously permanently closed Covington, Tennessee facility, as well as costs for a lawsuit related to a closed mill and other miscellaneous adjustments to severance liabilities and asset retirement obligations.
In 2009, we recorded closure costs, impairment and other related charges of $202 million, primarily for asset impairment charges related to assets held for sale for our interest in MPCo, as well as certain of our newsprint mill assets, accelerated depreciation charges for two paper machines at our Calhoun mill, which were previously indefinitely idled, and additional asset impairment charges primarily related to two previously permanently closed mills. In addition, in 2009, we recorded severance and other costs related to the permanent closures of our Westover, Alabama sawmill and Goodwater, Alabama planer mill operations and the continued idling of our Alabama River newsprint mill.
For additional information, see Note 5, “Closure Costs, Impairment and Other Related Charges,” to our Consolidated Financial Statements.
Net gain on disposition of assets and other
In 2010, we recorded a net gain on disposition of assets and other of $30 million, primarily related to the sale of various assets, as well as a net gain related to a customer bankruptcy settlement. In 2009, we recorded a net gain on disposition of assetstimberlands and other of $91 million, primarily related to the sale of 491,356 acres of timberlands, primarily located in Quebec, Canada and other assets.
For additional information, see Note 6, “Assets Held for Sale, Liabilities Associated with Assets Held for Sale and Net Gain on Disposition of Assets and Other – Net gain on disposition of assets and other,” to our Consolidated Financial Statements.($14 million).
Liquidity and LIQUIDITYAND CAPITAL RESOURCES
Capital Resources
Overview
In addition toWe rely on cash and cash equivalents, and net cash provided by operations our principal external source of liquidity isand the ABL Credit Facility, which is definedcredit facility to fund our operations, make pension contributions and discussed below.to finance our working capital and capital expenditures. As of December 31, 2011,2012, we had cash and cash equivalents of $369$263 million and had $515availability of $519 million of availability under the ABL Credit Facility. We believe that these sources provide uscredit facility. In our view, the Company has sufficient financial resources available to finance its business plan, meet its working capital requirements and maintain an appropriate level of capital spending.
In connection with adequate liquidity. In 2012,our emergence from the creditor protection proceedings in 2010, we anticipate thatissued $850 million of senior secured notes and we may use cash on hand to redeem additional 2018 Notes pursuant to existing redemption features inentered into the notes indenture. In addition, if we consummate the Fibrek Transaction, we would expect to use cash on hand to pay the cash portion$600 million ABL credit facility with a syndicate of the consideration of up to Cdn$71.5 million ($70 million, based on the exchange rate in effect on December 31, 2011) and to repay Fibrek’s existing outstanding indebtedness, which, aslenders.
As of December 31, 2011, was approximately Cdn$112 million ($109 million, based on the exchange rate in effect on December 31, 2011).
On May 27, 2011,2012, we announced the sale of our 75% equity interest in ACH. Cash proceeds from the sale, including cash available at closing, were approximately Cdn$290 million ($296 million, based on the exchange rate in effect on May 27, 2011). The proceeds were applied in accordance with the terms of the 2018 Notes indenture, which requires, among other things, that the first $100 million of net proceeds from the sale of certain assets, including our interest in ACH, be used to redeem 2018 Notes (including accrued and unpaid interest) if the closing occurs within six months of the Emergence Date (as further discussed below). We also used the ACH proceeds to redeem an additional $85had redeemed $349 million of principal amount of the 2018 Notes and repaid $90 million of other long-term debt (as further discussed below). The purchaser assumed the outstanding debt of ACH. Accordingly, ACH’s total long-term debt ($280 million as of December 31, 2010) is no longer reflected in our Consolidated Balance Sheet.
As further discussed below, on November 4, 2011, we redeemed an additional $85 million of principal amount of the 2018 Notes.
10.25 % senior secured notes, due 2018
On December 9, 2010, AbitibiBowater Inc.which currently stands at $501 million, using cash generated from operations and each of its material, wholly-owned U.S. subsidiaries entered into a supplemental indenture with Wells Fargo Bank, National Association, as trustee and collateral agent, pursuant to which AbitibiBowater Inc. assumed the obligations of ABI Escrow Corporation with respect to $850 million in aggregate principal amount of 10.25% senior secured notes due 2018 (the “2018 Notes” or “notes”), originally issued on October 4, 2010 pursuant to an indenture as of that date (as supplemented, the “indenture”). ABI Escrow Corporation was a wholly-owned subsidiary of AbitibiBowater Inc. created solely for the purpose of issuing the 2018 Notes. The notes were issued in a private placement exempt from registration under the Securities Act. Interest is payable on the notes on April 15 and October 15 of each year beginning on April 15, 2011, until their maturity date of October 15, 2018. In accordance with certain conditions in the indenture, the net proceeds of the notes offering were placed into an escrow account on October 4, 2010. On December 9, 2010, upon satisfaction of the escrow conditions, the funds deposited into escrow were released to AbitibiBowater Inc. and we used the net proceeds to repay certain indebtedness pursuant to the Plans of Reorganization. On May 12, 2011, the indenture was amended and restated in its entirety to make certain technical corrections and conforming changes.
The notes are and will be guaranteed by our current and future wholly-owned material U.S. subsidiaries (the “guarantors”) and are secured on a first priority basis, subject to permitted liens, by the capital stock of our subsidiaries (limited to 65% of the capital stock in first tier foreign subsidiaries) now owned or acquired in the future by AbitibiBowater Inc. and the guarantors and substantially all of AbitibiBowater Inc.’s and the guarantors’ assets (other than certain excluded assets and assets that are first priority collateral in respect of the ABL Credit Facility) now owned or acquired in the future. The notes and the guarantees are also secured on a second priority basis by the collateral securing the ABL Credit Facility, including accounts receivable, inventory and cash deposit and investment accounts.
The notes rank equally in right of payment with all of AbitibiBowater Inc.’s post-emergence senior indebtedness and senior in right of payment to all of its subordinated indebtedness. The note guarantees rank equally in right of payment with all of the guarantors’ post-emergence senior indebtedness and are senior in right of payment to all of the guarantors’ post-emergence subordinated indebtedness. In addition, the notes are structurally subordinated to all existing and future liabilities (including trade payables) of our subsidiaries that do not guarantee the notes. The notes and the guarantees are also effectively junior to indebtedness under the ABL Credit Facility to the extent of the value of the collateral that secures the ABL Credit Facility on a first priority basis and to indebtedness secured by assets that are not collateral securing the 2018 Notes to the extent of the value of such assets.
At any time prior to October 15, 2014, we may redeem some or all of the notes at a price equal to 100% of the principal amount plus accrued and unpaid interest plus a “make-whole” premium. We may also redeem some or all of the notes on and after October 15, 2014, at a redemption price of 105.125% of the principal amount thereof if redeemed during the twelve-month period beginning on October 15, 2014, 102.563% of the principal amount thereof if redeemed during the twelve-month period beginning on October 15, 2015, and 100% of the principal amount thereof if redeemed on or after October 15, 2016, plus, in each case, accrued and unpaid interest. We may also redeem up to 35% of the notes using the proceeds of certain equity offerings completed before October 15, 2013 at a redemption priceasset sales. Our ABL credit facility was also undrawn, but for ordinary course letters of 110.250% of the principal amount thereof, plus accrued and unpaid interest. Prior to October 15, 2013, we may also redeem up to 10% of the notes per twelve-month period at a redemption price of 103% of the principal amount, plus accrued and unpaid interest. If we experience specific kinds of changes in control, we must offer to purchase the notes at a redemption price of 101% of the principal amount thereof plus accrued and unpaid interest. For certain of our assets, including our interest in ACH, sold within six months of the Emergence Date, we must use the first $100 million of the net proceeds received from any such sales to redeem a portion of the notes at a redemption price of 105% of the principal amount plus accrued and unpaid interest. If we sell certain of our assets thereafter, and we do not use the proceeds to pay down certain indebtedness, purchase additional assets or make capital expenditures, each as specified in the indenture, we must offer to purchase the notes at a redemption price of 100% of the principal amount thereof plus accrued and unpaid interest, if any, to the redemption date with the net cash proceeds from the asset sale.
On June 13, 2011, we applied the first $100 million of net proceeds from the sale of ACH (as discussed above) to redeem $94 million of principal amount of the 2018 Notes at a redemption price of 105% of the principal amount, plus accrued and unpaid interest. Additionally, on both June 29, 2011 and November 4, 2011, we redeemed $85 million of principal amount of the 2018 Notes at a redemption price of 103% of the principal amount, plus accrued and unpaid interest. As a result of these redemptions, during the year ended December 31, 2011, we recorded net gains on extinguishment of debt of $6 million, which were included in “Other expense, net” in our Consolidated Statements of Operations.
The terms of the indenture impose certain restrictions, subject to a number of exceptions and qualifications, on us, including limits on our ability to: incur, assume or guarantee additional indebtedness; issue redeemable stock and preferred stock; pay dividends or make distributions or redeem or repurchase capital stock; prepay, redeem or repurchase certain debt; make loans and investments; incur liens; restrict dividends, loans or asset transfers from our subsidiaries; sell or otherwise dispose of assets, including capital stock of subsidiaries; consolidate or merge with or into, or sell substantially all of our assets to, another person; enter into transactions with affiliates and enter into new lines of business. The indenture also contains customary events of default.
As a result of our application of fresh start accounting, as of December 31, 2010, the 2018 Notes were recorded at their fair value of $905 million, which resulted in a premium of $55 million, which is being amortized to interest expense using the effective interest method over the term of the notes. As of December 31, 2011, the carrying value of the 2018 Notes was $621 million, which included the unamortized premium of $35 million.
In connection with the issuance of the notes, during 2010, we incurred fees of $27 million, which were written off to “Reorganization items, net” in our Consolidated Statements of Operations as a result of the application of fresh start accounting.credit.
ABL Credit Facility
On December 9, 2010, AbitibiBowater Inc. and three of its post-emergence wholly-owned subsidiaries, AbiBow US Inc. and AbiBow Recycling LLC, (collectively, the “U.S. Borrowers”) and AbiBow Canada Inc. (the “Canadian Borrower” and, together with the U.S. Borrowers, the “Borrowers”) entered into a senior secured asset-based revolvingThe ABL credit facility, (the “ABL Credit Facility”) with certain lenders and Citibank, N.A., as administrative agent and collateral agent (the “agent”).
Onwhich expires on October 28, 2011, the Borrowers and the subsidiaries of AbitibiBowater Inc. that are guarantors of the ABL Credit Facility entered into an amendment (the “amendment”) to the credit agreement that governs the ABL Credit Facility. The ABL Credit Facility, as amended, provides for2016, is an asset-based, revolving credit facility with an aggregate lender commitment of up to $600 million at any time outstanding, subject to borrowing base availability, includingmillion. It includes a $60 million (increased from $20 million) swingline sub-facility and a $200 million (increased from $150 million) letter of credit sub-facility. The ABL Credit Facility includes a $400 million tranche available to the Borrowers and a $200 million tranche available solely to the U.S. Borrowers, in each case subject to the borrowing base availability of those Borrowers. The ABL Credit FacilityIt also provides for an uncommitted incremental loan facility of up to $100 million, subject to certain terms and conditions set forth in the ABL Credit Facility. The amendment extends the maturityconditions. Revolving loans and letters of the ABL Credit Facility from December 9, 2014 to October 28, 2016.
Revolving loan (and letter of credit) availabilitycredit under the ABL Credit Facility isfacility are subject to a borrowing base, which at any time is equal to: (a) for U.S. Borrowers,calculated monthly on the sum of (i) 85%basis of eligible accounts receivable of the U.S. Borrowers plus (ii) the lesser of 65% of eligibleand inventory, of the U.S. Borrowers or 85% of the net orderly liquidation value of eligible inventory of the U.S. Borrowers, minus reserves established by the agent and (b) for the Canadian Borrower, the sum of (i) 85% of eligible accounts receivable of the Canadian Borrower plus (ii) the lesser of 65% of eligible inventory of the Canadian Borrower or 85% of the net orderly liquidation value of eligible inventory of the Canadian Borrower, minus reserves established by the agent.
certain reserves. The borrowing base availability of each borrower is subject to certain reserves, which are established by the agent in its discretion. The reserves may include dilution reserves, inventory reserves, rent reserves and any other reserves that the agent determines are necessary and have not already been taken into account in the calculation of the borrowing base. Asfacility was undrawn as of December 31, 2010, an additional reserve2012, except for $54 million of $286 millionordinary course letters of credit; availability was in place against the borrowing base of the Canadian Borrower until the adoption, by the governments of Quebec and Ontario, of regulations to implement previously-announced funding relief with respect to aggregate solvency deficits in$519 million.
Generally, our material Canadian registered pension plans, as discussed in Note 18, “Pension and Other Postretirement Benefit Plans – Canadian pension funding relief,” to our Consolidated Financial Statements. As of the third quarter of 2011, both the provinces of Quebec and Ontario had adopted these funding relief regulations. As a result, this reserve against the borrowing base of the Canadian Borrower was removed in the third quarter of 2011.
The obligations of the U.S. Borrowers under the ABL Credit Facilityfacility are guaranteed by each of the other U.S. Borrowers and certain material U.S. subsidiaries of AbitibiBowater Inc. (the “U.S. Guarantors”), and secured by first priority liens on and security interests in accounts receivable, inventory and related assets of the U.S. Borrowers and the U.S. Guarantors and second priority liens on and security interests in all of the collateral of the U.S. Borrowers and the U.S. Guarantors pledged to secure the 2018 Notes, as described above. The obligations of the Canadian Borrower under the ABL Credit Facility are guaranteed by each of the other Borrowers, the U.S. Guarantors and certain material Canadian subsidiaries of AbitibiBowater Inc. (the “Canadian Guarantors” and, together with the U.S. Guarantors, the “Guarantors”), andthey are secured by first priority liens on and security interests in accounts receivable, inventory and related assets, of the Borrowers and the Guarantors and second priority liens on and security interests in all of the collateral of the U.S. Borrowerscovered borrowers and the U.S. Guarantorsguarantors pledged to secure the 2018 Notes.senior secured notes.
BorrowingsOur borrowings under the ABL Credit Facilitycredit facility bear interest at a rate equal to at the Borrower’s option, thea specified base rate, the Canadian prime rate or the Eurodollar rate, in each case plus an applicable margin. The base rate under the ABL Credit Facility equals the greater of: (i) the agent’s base rate, (ii) the Federal Funds rate plus 0.5%, (iii) the agent’s rate for certificates of deposit having a term of three months plus 0.5% or (iv) the Eurodollar rate for a one month interest period plus 1.0%. The amendment reduced the interest rate margin applicable to borrowings under the ABL Credit Facility to 1.75% – 2.25% per annum with respect to Eurodollar rate and bankers’ acceptance rate borrowings (reduced from 2.75% – 3.25%) and 0.75% – 1.25% per annum with respect to base rate and Canadian prime rate borrowings (reduced from 1.75% – 2.25%), in each case depending on excess availability under the ABL Credit Facility. The applicable margin is subject, in each case, to monthly pricing adjustments based on the average monthly excess availability under the ABL Credit Facility, with such adjustments commencing after the end of the second full fiscal quarter following the Emergence Date.
In addition to paying interest on the outstanding borrowings under the ABL Credit Facility, the Borrowers are required toWe pay a commitment fee in respect of unutilized commitments, which was equalfrom 0.375% to 0.75%0.50% per annum initially. Commencing after the end of the second full fiscal quarter following the Emergence Date, the fee isyear, subject to monthly pricing adjustments, based on the unutilized commitment of the ABL Credit Facility over the prior month. Initially, the Borrowers were required to pay a fee equal to 0.75% per annum when the unutilized commitment of the ABL Credit Facility was greater than or equal to 50% of the total commitments and 0.50% per annum when the unutilized commitment of the ABL Credit Facility was less than 50% of the total commitments. The amendment reduced the unutilized commitment fee payable by the Borrowers under the ABL Credit Facility to 0.375% – 0.50% per annum, subject to monthly pricing adjustments based on the unutilized commitment of the ABL Credit Facility. The Borrowers must also pay a fee on outstanding letters of credit under the ABL Credit Facility at a rate equal to the applicable margin in respect of Eurodollar borrowings, plus a facing fee, as agreed to in writing from time to time, and certain administrative fees.
The Borrowers are able to voluntarily repay outstanding loansLoans and reduce unused commitments in each case,under the facility are voluntarily repayable, in whole or in part, at any time without premium or penalty. The Borrowers are required to repay outstanding loans anytime the outstanding loans exceed the maximum availability then in effect. The Borrowers are also required to use net proceeds from certain significant asset sales to repay outstanding loans, but may re-borrow following such prepayments if the conditions to borrowings are met.
The ABL Credit Facility contains customaryfacility does not include financial covenants, except for asset-based credit agreements of this type, including, among other things: (i) requirements to deliver financial statements, other reports and notices; (ii) restrictions on the existence or incurrence and repayment of indebtedness; (iii) restrictions on the existence or incurrence of liens; (iv) restrictions on making certain restricted payments; (v) restrictions on making certain investments; (vi) restrictions on certain mergers, consolidations and asset dispositions; (vii) restrictions on transactions with affiliates; (viii) restrictions on amendments or modifications to the Canadian pension and benefit plans and (ix) restrictions on modifications to material indebtedness. Additionally, the amendment reduced to 1.0:1.0 (reduced from 1.1:1.0) thea minimum consolidated fixed charge coverage ratio required if at any time excess availability falls below the greater of: (i) $60 million and (ii) 12.5% of the lesser of (A) the total commitments and (B) the borrowing base then in effect. Prior to the effectiveness of the amendment, this springing fixed charge coverage ratio covenantThe requirement was not triggered ifat any time in 2012 as excess availability fell below 15%was above these levels.
The ABL credit facility contains customary covenants for asset-based credit agreements of the total commitments then in effect. The amendment also easesthis type, and imposes certain other covenants,restrictions, subject to a number of exceptions and qualifications, including covenants restrictinglimits on our ability to: (i) prepay certain indebtedness, (ii) consummate permitted acquisitions
| — | incur and repay indebtedness; |
| — | incur liens; |
| — | make certain restricted payments; |
| — | make certain investments; |
| — | merge, consolidate and dispose assets; |
| — | enter into transactions with affiliates; |
| — | amend or modify the Canadian pension and benefit plans; and |
| — | modify material indebtedness. |
The ABL credit facility also contains customary requirements to deliver financial statements, other reports and (iii) make certain restricted payments. Subjectnotices, as well as events of default, subject to customary grace periods and notice requirements,requirements.
10.25% senior secured notes due 2018
The senior secured notes bear interest at 10.25% and they mature on October 15, 2018. The notes are guaranteed by our material U.S. subsidiaries, and are secured on a first priority basis by substantially all of our guaranteeing subsidiaries’ assets, and on a second priority basis by the collateral securing the ABL Credit Facilitycredit facility, including accounts receivable, inventory, and cash deposit and investment accounts.
The terms of the indenture impose certain restrictions, subject to a number of exceptions and qualifications, including limits on our ability to:
| — | incur, assume or guarantee additional indebtedness; |
| — | issue redeemable stock and preferred stock; |
| — | pay dividends or make distributions or redeem or repurchase capital stock; |
| — | prepay, redeem or repurchase certain debt; |
| — | make loans and investments; |
| — | incur liens; |
| — | issue dividends, make loans or transfer assets from our subsidiaries; |
| — | sell or otherwise dispose of assets, including capital stock of subsidiaries; |
| — | consolidate or merge with or into, or sell substantially all of our assets to, another person; |
| — | enter into transactions with affiliates; and |
| — | enter into new lines of business. |
The indenture also contains customary events of default.
AsThe notes include certain redemption features. We have exercised, on three occasions, our ability to redeem up to 10% of December 31, 2011, the Borrowers had no borrowingsnotes per twelve-month period before October 15, 2013, at a redemption price of 103% of the principal amount, plus accrued and $62 millionunpaid interest. In addition to an optional “make-whole” redemption feature and a feature permitting us to redeem up to 35% of letters of credit outstanding under the ABL Credit Facility. As of December 31, 2011, we had $515 million of availability under the ABL Credit Facility, which was comprised of $280 million for the U.S. Borrowers and $235 million for the Canadian Borrower.
In accordance with its stated purpose,notes using the proceeds of the ABL Credit Facility were used to fund amounts payable under the Planscertain equity offerings completed before October 15, 2013, we can redeem all or part of Reorganization and can be used by us for, among other things, working capital, capital expenditures, permitted acquisitions and other general corporate purposes. Upon receiptnotes starting on October 15, 2014, at specified redemption prices.
As a result of the North American Free Trade Agreement (“NAFTA”) settlement amount (see Note 3, “Creditor Protection Proceedings – Reorganization items, net,” to our Consolidated Financial Statements), we repaid the $100 million we had borrowed on the Emergence Date under the ABL Credit Facility.
As consideration for amending the ABL Credit Facility in 2011 and entering into the ABL Credit Facility in 2010, during 2011 and 2010, we incurred feesapplication of $3 million and $19 million, respectively, which were recorded as deferred financing costs in “Other assets” in our Consolidated Balance Sheetsfresh start accounting, as of December 31, 2011 and 2010, respectively, and arethe senior secured notes were recorded at their fair value, resulting in a premium. That premium is being amortized to interest expense over the term of the facility.notes.
Promissory note
As of December 31, 2010, ANC, which operates our newsprint mill in Augusta, Georgia, was owned 52.5% by us. Our consolidated financial statements included this entity on a fully consolidated basis. On January 14, 2011, we acquired the noncontrolling interest in ANC and ANC became a wholly-owned subsidiary of ours. As part of the consideration for the transaction, ANC paid cash of $15 million and issued a secured promissory note (the “note”) in the principal amount of $90 million. On June 30, 2011, the note, including accrued interest, was repaid with cash in full.
Flow of fundsFunds
Summary of cash flows
A summary of cash flows for the years ended December 31, 2012, 2011 2010 and 20092010 was as follows:
| Successor | Predecessor | |||||||||||||||
| (In millions) | 2011 | 2010 | 2009 | |||||||||||||
Net cash provided by operating activities | $ | 198 | $ | 39 | $ | 46 | ||||||||||
Net cash provided by investing activities | 245 | 96 | 484 | |||||||||||||
Net cash (used in) provided by financing activities | (393) | (572 | ) | 34 | ||||||||||||
Net increase (decrease) in cash and cash equivalents | $ | 50 | $ | (437 | ) | $ | 564 | |||||||||
| Years Ended December 31, | ||||||||||||
| 2012 | 2011 | 2010 | ||||||||||
| (in millions) | Successor | Successor | Predecessor | |||||||||
Net cash provided by operating activities | $ | 266 | $ | 198 | $ | 39 | ||||||
Net cash (used in) provided by investing activities | (75 | ) | 245 | 96 | ||||||||
Net cash used in financing activities | (297 | ) | (393 | ) | (572 | ) | ||||||
Net (decrease) increase in cash and cash equivalents | $ | (106 | ) | $ | 50 | $ | (437 | ) | ||||
2012 vs. 2011
Cash provided by operating activities
We generated $68 million more cash from operating activities in 2012 compared to 2011, despite a $228 million reduction in operating income, as described in more detail above. The improvement was primarily due to: lower pension contributions net of expense ($80 million) as a result of a $17 million reduction in contributions to U.S. plans; and, in 2011, of the $20 million voluntary additional and $25 million accelerated contributions for the first half of 2012; partly offset by a $14 million increase in the cash component of closure costs, impairment and other charges.
Cash (used in) provided by investing activities
We used $75 million for investing activities in 2012, compared to $245 million provided by investing activities in 2011. The $320 million difference reflects lower proceeds from: the disposition of assets ($265 million), as a result of the sale of Mersey assets in 2012, compared to the 2011 disposition of our investment in ACH; an increase in investments in fixed assets ($72 million) and cash used, in 2012, in the acquisition of Fibrek ($24 million). These changes were partially offset by a decrease of restricted cash in 2012, compared to a small increase in 2011, due to the partial release of a tax indemnity in connection with the sale of our interest in MPCo, the effects of which led to a $78 million change.
Cash used in financing activities
Cash used in financing activities was $96 million lower than in 2011, to $297 million, mainly as a result lower debt payments ($156 million). In 2011, we redeemed $264 million of senior secured notes and a $90 million promissory note, partly with the proceeds of ACH. In 2012, we redeemed $85 million of senior secured notes and we repaid Fibrek’s debt ($112 million). The item was also unfavorably affected by purchases of our shares of common stock ($67 million) and higher payments for the acquisition of noncontrolling interests ($12 million), as a result of the acquisitions of Fibrek in 2012 and Augusta Newsprint Company in 2011, offset by the favorable effects of lower dividends and distribution to noncontrolling interests ($16 million).
2011 vs. 2010
Cash provided by operating activities
The $159 million increase in cash provided by operating activities in 2011 compared to 2010 was due primarily due to improved operating income in 2011 compared to an operating loss in 2010,($358 million), lower interest payments in 2011 compared to 2010 (primarily due to significantlyas a result of the lower post-emergence debt levels, in connection with our emergence from the Creditor Protection Proceedings) and lower cash reorganization and restructuring costs, as well ascosts. We also experienced a larger increase in cash generated by the changes in working capital in 2011 compared to 2010. These increases in cash provided by operating activities were partially offset by higher net pension contributions in 2011 (primarily due to($139 million) because of the voluntary additional and prepaid contributions to our Canadian pension plans in the third quarter of 2011, and suspendedthe lower contribution levels during the creditor protection proceedings (suspended contributions of prior service costs to our Canadian pension plans in 2010 as a result2010), and the positive effects of the Creditor Protection Proceedings), as well as the receipt of the NAFTA settlement in 2010 (see “Newfoundland and Labrador Expropriation” below for additional information)($130 million).
The $7 million decrease in cash provided by operating activities in 2010 compared to 2009 was primarily due to the alternative fuel mixture tax credits received in 2009 and payments in 2010 related to our emergence from the Creditor Protection Proceedings for professional fees, administrative, priority and convenience claims and a backstop commitment agreement termination fee related to a rights offering that we elected not to pursue. These decreases in cash provided by operating activities were partially offset by reductions in our pension contributions and SG&A expenses in 2010, as well as the receipt of the NAFTA settlement in 2010.
Cash (used in) provided by investing activities
The $149 million increase in cash provided by investing activitiesWe received in 2011 compared to 2010 was primarily due to highercash proceeds from the dispositionsale of assets (primarilyour 75% equity interest in ACH, including cash available at closing, of approximately Cdn$290 million ($296 million, based on the dispositionexchange rate in effect on May 27, 2011). We also collected proceeds ($29 million) from the release in 2011 of a holdback in connection with the 2009 sale of our investment in ACH) in 2011 andMPCo. On the proceeds in 2011 from the holdback related to the disposition of the investment in MPCo in 2009, partially offset by an increase inother hand, we increased cash invested in fixed assets in 2011as we gradually returned to normal operations following our emergence from the creditor protection proceedings, and thewe experienced a decrease in restricted cash in 2010 as a result of theour emergence from Creditor Protection Proceedings.the creditor protection proceedings.
The $388 million decreaseCash used in cash provided by investing activities in 2010 compared to 2009 was primarily due to the proceeds from the sale of our interest in MPCo in 2009, lower proceeds from the disposition of assets in 2010 and an increase in deposit requirements for letters of credit in 2010, partially offset by a reduction in cash invested in fixed assets in 2010 and a decrease in restricted cash in 2010.
Capital expenditures for all periods include compliance, maintenance and projects to increase returns on production assets.
Cash (used in) provided by financing activities
TheThere was a $179 million decrease in cash used in financing activities in 2011 compared to 2010. In 2010, was primarily due to lower debt repayments in 2011 (primarily due toconnection with the repayment ofemergence from creditor protection proceedings, we repaid all debtor-in-possession financing and all secured pre-petition debt, obligations uponbut we also issued the senior secured notes.
In 2011, in accordance with the senior secured notes indenture, we applied the first $100 million of net proceeds from the 2011 sale of our 75% equity interest in ACH to redeem senior secured notes. We also voluntarily used the proceeds to redeem an additional $85 million of principal amount of the notes and to repay the $90 million promissory note, and we paid dividends and distributions to noncontrolling interests ($21 million).
2013 expectations
In 2013, we anticipate that we may use cash on hand to:
| — | Subject to market conditions, repurchase up to the remaining $33 million authorized for share repurchases under our existing $100 million repurchase program. |
| — | Make capital expenditures for compliance and maintenance of business activities of between $125 million and $150 million, and between $50 million and $100 million for value-creating projects. |
| — | We may consider other strategic opportunities, with a particular focus on those that reduce our cost position, improve our product diversification, provide synergies or allow us to expand into future growth markets. |
| — | Potentially redeem up to an additional $85 million of senior secured notes under the existing redemption features in the notes indenture. In light of the attractive conditions currently available for debt financing and the relatively high interest rate on the senior secured notes, management continues to evaluate options to refinance the notes. |
Credit Rating Risk
Although the ABL credit facility does not include any provision that would require material changes in payment schedules or terminations as a result of a credit rating downgrade, we believe our access to capital markets at a reasonable cost is determined in large part by credit quality. A credit rating downgrade could impact our ability to access capital markets.
In the fourth quarter of 2012, Standard & Poor’s Ratings Services affirmed its long-term corporate credit rating (BB-, stable) and upgraded the issue-level rating on the senior secured notes to BB from BB-. Also in the fourth quarter, Moody’s Investors Service upgraded the corporate family rating and the senior secured notes rating to Ba3 from B1.
Standard & Poor’s Senior secured notes rating Long-term corporate credit rating Outlook Recovery rating Moody’s Investors Service Senior secured debt Corporate family rating Probability of default Outlook December 31, 2012 2011 2010 Successor Successor Predecessor BB BB- n/m BB- BB- n/m Stable Stable n/m 2 3 n/m Ba3 B1 n/m Ba3 B1 n/m Ba3 B1 n/m Stable Stable n/m
Subject to other factors affecting the credit markets as a whole, we believe our current ratings should provide a significant degree of flexibility in obtaining funds on competitive terms. These security ratings reflect the views of the rating agencies only. An explanation of the significance of these ratings can be obtained from each rating agency. The ratings are not a recommendation to buy, sell or hold securities. Any rating can be revised upward or downward or withdrawn at any time by a rating agency.
Employee Benefit Plans
Canadian pension funding
Funding relief measures
As a pre-condition to our emergence from the Creditor Protection Proceedings in 2010) and lower payments of financing fees in 2011 compared to 2010, partially offset by the proceeds received from the issuance of the 2018 Notes in 2010 and the acquisition of the noncontrolling interest in ANC and dividends and distribution to noncontrolling interests in 2011.
The $606 million decrease in cash provided by financing activities in 2010 compared to 2009 was primarily due to the repayment of borrowings under our debtor in possession financing arrangement in 2010 versus the amount of borrowings and repayments under the debtor in possession financing arrangements in 2009, the repayment of secured pre-petition debt obligations upon our emergence from the Creditor Protection Proceedings versus the repayments of long-term debt in 2009 and the payment of financing fees on our exit financing, partially offset by the proceeds received from the issuance of the 2018 Notes in 2010 and lower debtor in possession financing costs in 2010.
Contractual Obligations
In addition to our debt obligations as of December 31, 2011,creditor protection proceedings, we had other commitments and contractual obligations that require us to make specified payments in the future. As of December 31, 2011, the scheduled maturities of our contractual obligations were as follows:
| (In millions) | Total | 2012 | 2013 – 2014 | 2015 – 2016 | Thereafter | ||||||||||||||||||||
Long-term debt(1) | $ | 1,006 | $ | 60 | $ | 120 | $ | 120 | $ | 706 | |||||||||||||||
Non-cancelable operating lease obligations(2) | 35 | 7 | 10 | 10 | 8 | ||||||||||||||||||||
Purchase obligations(3) | 262 | 34 | 39 | 27 | 162 | ||||||||||||||||||||
Pension and OPEB funding(4) | 522 | 130 | 98 | 98 | 196 | ||||||||||||||||||||
Tax reserves | 2 | – | 2 | – | – | ||||||||||||||||||||
| $ | 1,827 | $ | 231 | $ | 269 | $ | 255 | $ | 1,072 | ||||||||||||||||
|
|
|
|
In addition to the items shown in the table above, we have contractual obligations related to certain undertakingsentered into agreements with the provinces of Quebec and Ontario as discussed further in Note 18, “Pension and Other Postretirement Benefit Plans – Canadian pensionto establish parameters concerning the funding relief,” to our Consolidated Financial Statements. We are also party to employment and change-in-control agreements with our executive officers. See Part III, Item 11, “Executive Compensation,” of this Form 10-K.
Employee Benefit Plans
Canadian pension funding relief
As of the third quarter of 2011, both the provinces of Quebec and Ontario had adopted specific regulations to implement funding relief measures with respect to aggregate solvency deficits in our material Canadian registered pension plans. The basic funding parameters are described in Note 18, “Pension and Other Postretirement Benefit Plans – Canadianplans, which we refer to as the “affected plans,” until 2020. These plans represented approximately 70% of our unfunded pension fundingobligations as of December 31, 2012. In exchange for certain undertakings, the provinces confirmed their intention to adopt regulations specific to us, which we refer to as the “funding relief regulations,” to our Consolidated Financial Statements. Theimplement those parameters in respect of the affected plans.
As adopted in mid-2011, the funding relief regulations also provide that corrective measures would be required if the aggregate solvency ratio in the registered pensionaffected plans fallsfell below a prescribed level under the target providedtargets specified by the regulations as of December 31 in any year through 2014. Such measures may include additional funding over five years to attain the target solvency ratio prescribed in the regulations. Thereafter, supplemental contributions as described in Note 18, “Pension and Other Postretirement Benefit Plans – Canadian pension funding relief,” to our Consolidated Financial Statements, would be required if the aggregate solvency ratio in the registered pensionaffected plans falls below a prescribed level under the target providedtargets specified by the regulations as of December 31 in any year on or after 2015 for the remainder of the period covered by the regulations.
We believe that the objective of the negotiations that led to the funding relief measures was to establish a framework under which the Company would gradually restore, over fifteen years, the solvency of the affected plans and honor its commitment to pay 100% of retirement benefits to plan members over the long-term without reducing benefits, a commitment that could have been subject to compromise under the creditor protection proceedings. In exchange for certain undertakings, the Company was to benefit from stable, predictable and balanced pension funding obligations, particularly in the first five years following emergence from the creditor protection proceedings as we completed our restructuring.
Solvency deficit
The aggregate solvency ratio in the Canadian registered pension plans covered by the Quebec and Ontario funding relief is determined annually as of December 31. The calculation is based on a number of factors and assumptions, including the accrued benefits to be provided by the plans, interest rate levels, membership data and demographic experience. The assumptions used in the calculation are materially different from the assumptions used to arrive at the net pension and OPEB benefit obligations for purposes of our consolidated financial statements.
Under Canadian actuarial rules for solvency determinations, the liabilities are calculated on the assumption that the plans are terminated at the measurement date (each December 31 for the affected plans), and the liabilities are discounted primarily using a prescribed annuity purchase rate, which is that day’s spot interest rate on government securities in Canada plus a prescribed margin. By contrast, for purposes of our consolidated financial statements, the discount rate is determined with a model that develops a hypothetical high-quality bond portfolio, where the bonds are theoretically purchased to settle the expected benefit payments of the plans.
As of December 31, 2011, the applicable annuity purchase rate for solvency purposes was 3.3%, compared to a discount rate of 4.9% for accounting purposes. That annuity purchase rate was 1.2% lower than the annuity purchase rate as of December 31, 2010, twice the 0.6% reduction to the discount rate applicable for accounting purposes in that same period. As of December 31, 2012, the annuity purchase rate is expected to be approximately 3.0%, compared to a discount rate of 4.3% for accounting purposes.
As of December 31, 2012, a 1% increase in the applicable annuity purchase rate described above would decrease the solvency deficit by approximately Cdn$500 million ($504 million), andvice versa. As a result of a change to the asset allocation in 2013, we expect that a 1% increase in the annuity purchase rate would decrease the solvency deficit by approximately Cdn$600 million ($605 million).
Corrective measures
As of December 31, 2011, the aggregate solvency ratio in the affected plans was below the minimum solvency level prescribed in the regulations. Accordingly, the regulations require that we propose, by March 2013, corrective measures designed to attain the target solvency ratio prescribed in the regulations within five years. The difference between the solvency status as of December 31, 2011, and the target specified under the funding relief regulations represents the portion of the solvency deficit that is subject to corrective measures; it amounted to approximately Cdn$500 million ($504 million) as of December 31, 2012.
Generally speaking, a contribution of assets, an increase in applicable discount rates and a reduction in benefit entitlements, or a combination thereof, would have for effect to reduce a deficit.
We continue to work with other plan stakeholders, including employees, retirees, unions, the provincial governments of Quebec and Ontario and the related pension regulators to address these corrective measures. With interest rates currently near historic lows, we will work to develop corrective measures that balance the need to meet our undertakings to retirees, but also provide us the funding predictability we need to manage our business. At this time, we do not expect that we will contribute funds to the affected plans in respect of the corrective measures unless we reach an outcome that is consistent with what we believe was the objective of the funding relief measures, or we are compelled to do so.
In light of continued low yields on government securities in Canada, which are usedand a 0.2% reduction in the prescribed margin to determine the applicable discountannuity purchase rate under Canadian actuarial rules, when we file the actuarial report in respect of thesethe affected plans laterin the second quarter of this year, we expect that the aggregate solvency ratio as of December 31, 2012 will likely have further decreased from the level at December 31, 2011. This might therefore trigger the need for additional corrective measures. At this time we cannot estimate the additional contributions, if any, that may be made or required in these Canadian registeredfuture years as a result, but they could be material.
Partial wind-ups
On June 12, 2012, we filed a motion for directives with the Quebec Superior Court in Canada, the court with jurisdiction in the creditor protection proceedings, seeking an order to prevent pension regulators in each of Quebec, New Brunswick and Newfoundland and Labrador from declaring partial wind-ups of pension plans willrelating to employees of former operations in New Brunswick and Newfoundland and Labrador, or a declaration that any claim for accelerated reimbursements of deficits arising from a partial wind-up is a barred claim under the creditor protection proceedings. A partial wind-up would likely shorten the period in which any deficit within those plans, which could exceed $150 million, would have fallen belowto be funded if we do not obtain the minimum level prescribed by the regulations and that we will therefore be required to adopt corrective measures by March 2013.relief sought. At this time, we cannot estimate the additional contributions, if any, that may be required in future years, but they could be material.
Pension and OPEB plans
The determination of benefit obligations and the recognition of expenses relatedIn 2012, gross contributions to our pension and OPEB obligations are dependent on assumptions used in calculating these amounts. These assumptions include: discount rates, expected rates of return on plan assets, rate of future compensation increases, mortality rates, termination rates, health care inflation trend rates and other factors. All assumptions are reviewed periodically with third-party actuarial consultants and adjusted as necessary.
Any deterioration in the global securities markets could impact the value of the assets included in our defined benefit pension plans, which could materially impact future minimum cash contributions. Should values deteriorateand defined contribution pension (including SERP) were $103 million and $21 million, respectively. The funding was net of a prepayment, in 2012, the decline in fair value2011, of our plans could result in increased total pension costs for 2013 as compared to total pension costs$25 million of contributions that would have otherwise been payable in 2012. Any decreases in discount rates could result in increases inOf the aggregate 2012 funding of $124 million, we expensed $29 million. We also made $20 million of contributions to OPEB plans, all of which was expensed.
For 2013, we estimate that our contributions to defined benefit pension and defined contribution pension plans (including SERP) will be approximately $105 million and $21 million, respectively, and we would expect to expense approximately $40 million in the aggregate. We also expect to make approximately $25 million of contributions to OPEB benefit obligations.plans, all of which would be expensed.
Under the funding relief regulations, if the aggregate solvency ratio in the affected plans remains below the minimum threshold under the funding relief regulations as of December 31 on or after 2012, we will be required to contribute up to an additional 15% of free cash flow, up to Cdn$15 million ($15 million), to the affected plans in the immediately following year. According to the regulations, no such amount is payable in respect of 2012. In the undertakings our principal Canadian operating subsidiary provided in connection with the negotiations that led to the funding relief regulations, it undertook to make an additional solvency deficit reduction contribution to its pension plans of Cdn$75 ($75), payable over four years, for each metric ton of capacity reduced in Quebec or Ontario, in the event of downtime of more than six consecutive months or nine cumulative months over a period of 18 months, subject to certain conditions.
As described above, we cannot at this time estimate the additional contributions, if any, that may be required in future years in respect of the corrective measures.
We fund our pension and OPEB plans as required by applicable laws and regulations, taking into account the agreements entered into with the provinces of Quebec and Ontario discussed above andabove. We may, from time to time, make additional payments. In 2011, gross contributions
Share Repurchase Program
On May 22, 2012, the board approved a share repurchase program of up to our defined benefit pension and OPEB plans were $220 million, which include a $20 million voluntary contribution to our Canadian registered pension plans covered by the funding relief regulations and a $25 million prepayment10% of our common stock, for an aggregate purchase price of up to $100 million. Through December 31, 2012, funding obligations thereunder. We estimate our 2012 contributions to be approximately $105we repurchased 5.6 million to our pension plans (excluding contributions to our defined contribution plans) and approximately $25 million to our OPEB plans.shares at a cost of $67 million.
For a further discussion of our pension and OPEB plans, see Note 18, “Pension and Other Postretirement Benefit Plans,” to our Consolidated Financial Statements.
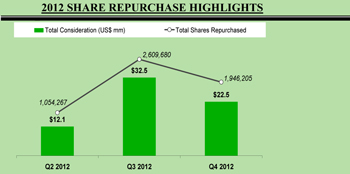
Exchange Rate Fluctuation Effect on EarningsContractual Obligations
We compete with North American, European and Asian producers in most of our product lines. Our products are sold and denominated in U.S. dollars, Canadian dollars and selected foreign currencies. A substantial portion of our manufacturing costs are denominated in Canadian dollars. In addition to the impact of product supply and demand, changes in the relative strength or weakness of such currencies, particularly the U.S. dollar, may also affect international trade flows of these products. A stronger U.S. dollar may attract imports into North America from foreign producers, increase supply and have a downward effect on prices, while a weaker U.S. dollar may encourage U.S. exports and increase manufacturing costs that are in Canadian dollars or other foreign currencies. Variations in the exchange rates between the U.S. dollar and other currencies, particularly the Euro and the currencies of Canada, Sweden and certain Asian countries, will significantly affect our competitive position compared to many of our competitors.
We are particularly sensitive to changes in the value of the Canadian dollar versus the U.S. dollar. The impact of these changes depends primarily on our production and sales volume, the proportion of our production and sales that occur in Canada, the proportion of our financial assets and liabilities denominated in Canadian dollars, our hedging levels and the magnitude, direction and duration of changes in the exchange rate. We expect exchange rate fluctuations to continue to impact costs and revenues; however, we cannot predict the magnitude or direction of this effect for any quarter, and there can be no assurance of any future effects. During the last two years, the relative value of the Canadian dollar ranged from a high of US$1.06 in July 2011 to a low of US$0.93 in May 2010 and was US$0.98 asAs of December 31, 2011. Based on operating projections for 2012, a one-cent increase in the Canadian-U.S. dollar exchange rate would decrease our annual operating incomeCompany’s contractual obligations, including payments due by approximately $16 million.period, were as follows:
If the Canadian dollar continues to remain strong or appreciates as against the U.S. dollar, it could influence the foreign exchange rate assumptions that are used in our evaluation of long-lived assets for impairment and consequently, result in asset impairment charges.
| (in millions) | Total | 2013 | 2014-2015 | 2016-2017 | Thereafter | |||||||||||||||
Long-term debt1 | $ | 818 | $ | 54 | $ | 106 | $ | 105 | $ | 553 | ||||||||||
Non-cancelable operating lease obligations2 | 28 | 6 | 7 | 5 | 10 | |||||||||||||||
Purchase obligations3 | 298 | 63 | 54 | 34 | 147 | |||||||||||||||
| $ | 1,144 | $ | 123 | $ | 167 | $ | 144 | $ | 710 | |||||||||||
| 1. | Long-term debt commitments represent primarily interest payments on the senior secured notes over the periods indicated and payment of the remaining principal balance at maturity, assuming no further redemptions. Commitments do not include the fair value premium associated with the senior secured notes, which is being amortized to interest expense but is a non-cash item. |
| 2. | We lease timberlands, certain office premises, office equipment and transportation equipment under operating leases. |
| 3. | As of December 31, 2012, purchase obligations include, among other things, a bridge and railroad contract for our Fort Frances operations with commitments totaling $127 million through 2044. |
Newfoundland and Labrador ExpropriationRECENTACCOUNTING GUIDANCE
On August 24, 2010, we reached a settlement agreement with the government of Canada, which was subsequently approved by the Courts, concerning the December 2008 expropriation of certain of our assets and rights in the province of Newfoundland and Labrador by the provincial government. Under the agreement, the government of Canada agreed to pay AbiBow Canada Inc. Cdn$130 million ($130 million) following our emergence from the Creditor Protection Proceedings. On February 25, 2010, we had filed a Notice of Arbitration against the government of Canada under NAFTA, asserting that the expropriation was arbitrary, discriminatory and illegal. As partNone of the settlement agreement, we agreed to waive our legal actions and claims against the government of Canada under NAFTA.
In December 2010, following our emergence from the Creditor Protection Proceedings, we received the settlement amount. Since the receipt of the settlement was contingent upon our emergence from the Creditor Protection Proceedings, we recorded the settlement in “Reorganization items, net” in our Consolidated Statements of Operations for the year ended December 31, 2010.
Environmental Matters
For information regarding our environmental matters, see Note 20, “Commitments and Contingencies – Environmental matters,” to our Consolidated Financial Statements.
Monetization of Timber Notes
In connection with certain timberland sales transactions in 2002 and prior years, Bowater received a portion of the sale proceeds in notes receivable from institutional investors. In order to increase our liquidity, we monetized these notes receivable using qualified special purpose entities (“QSPEs”) set up in accordance with FASB ASC 860, “Transfers and Servicing.” The more significant aspects of the QSPEs are discussed in Note 17, “Monetization of Timber Notes,” to our Consolidated Financial Statements.
The following summarizes our retained interest in our QSPEs and the QSPEs’ total assets and obligations as of December 31, 2011:
| (In millions) | Retained Interest | Total Assets | Total Obligations | Excess of Assets over Obligations | ||||||||||||
Calhoun Note Holdings AT LLC | $ | 8 | $ | 74 | $ | 64 | $ | 10 | ||||||||
Calhoun Note Holdings TI LLC | 12 | 74 | 62 | 12 | ||||||||||||
| $ | 20 | $ | 148 | $ | 126 | $ | 22 | |||||||||
Recent Accounting Guidance
There is no new accounting guidance issued which we have not yet adopted that is expected to materially impactaffect our results of operations or financial condition.
Critical Accounting EstimatesCRITICAL ACCOUNTING ESTIMATES
The preparation of financial statements in conformity with United StatesU.S. generally accepted accounting principles requires us to make accounting estimates based on assumptions, judgments and projections of future results of operations and cash flows. These estimates and assumptions affect the reported amounts of revenues and expenses during the periods presented and the reported amounts of assets and liabilities and the disclosure of contingent assets and liabilities as of the date of the financial statements.
We base our estimates, assumptions and judgments on a number of factors, including historical experience, recent events, existing conditions, internal budgets and forecasts, projections obtained from industry research firms and other data that we believe are reasonable under the circumstances. We believe that our accounting estimates are appropriate and that the resulting financial statement amounts are reasonable. Due to the inherent uncertainties in making estimates, actual results could differ materially from these estimates, requiring adjustments to financial statement amounts in future periods.
A summary of our significant accounting policies is disclosed in Notenote 2, “Summary“summary of Significant Accounting Policies,significant accounting policies,” to our Consolidated Financial Statements.consolidated financial statements. Based upon a review of our significant accounting policies, we believe the following accounting policies require us to make accounting estimates that can significantly affect the results reported in our Consolidated Financial Statements.consolidated financial statements. We have reported the development, selection and disclosures of our critical accounting estimates to the Audit Committeeaudit committee of our Boardboard of Directors,directors, and the Audit Committeeaudit committee has reviewed the disclosures relating to these estimates.
Pension and OPEB benefit obligations
Description of accounts impacted by the accounting estimate
We record assets and liabilities associated with our pension and OPEB benefit obligations, net of pension plan assets that may be considered material to our financial position. We also record net periodic benefit costs associated with these net obligations as our employees render service. As of December 31, 2011,2012, we have pension and OPEB benefit obligations aggregating $6,815$7,148 million and accumulated pension plan assets at fair value of $5,259$5,175 million. Our 20112012 net periodic pension and OPEB benefit costs were $54$52 million.
Judgments and uncertainties involved in the accounting estimate
The following inputs are used to determine our net obligations and our net periodic benefit costs each year and the determination of these inputs requires judgment:
discount rate – used to arrive at the net present value of our pension and OPEB benefit obligations and the interest cost component of our net periodic pension and OPEB benefit costs;
| — | discount rate – used to arrive at the net present value of our pension and OPEB benefit obligations and the interest cost component of our net periodic pension and OPEB benefit costs; |
| — | return on assets – used to estimate the growth in the value of invested assets that are available to satisfy pension benefit obligations and to arrive at the expected return on plan assets component of our net periodic pension benefit costs; |
| — | mortality rate – used to estimate the impact of mortality on pension and OPEB benefit obligations; |
| — | rate of compensation increase – used to calculate the impact future pay increases will have on pension benefit obligations; and |
| — | health care cost trend rate – used to calculate the impact of future health care costs on OPEB benefit obligations. |
The discount rate for our domestic and foreign plans was determined with a model that develops a hypothetical high-quality bond portfolio, where the bonds are theoretically purchased to settle the expected benefit payments of the plans. The discount rate reflects the single rate that produces the same discounted values as the value of invested assets that are available to satisfy pension benefit obligations and to arrive at the theoretical high-quality bond portfolio. In determining the
expected return on plan assets component of our net periodic pension benefit costs;
mortality rate – used to estimate the impact of mortality on pension and OPEB benefit obligations;
rate of compensation increase – used to calculate the impact future pay increases will have on pension benefit obligations; and
health care cost trend rate – used to calculate the impact of future health care costs on OPEB benefit obligations.
We determined the discount rate by considering the timing and amount of projected future benefit payments, which, for our U.S. plans, is based on a portfolio of long-term high quality corporate bonds of a similar duration and, for our Canadian and other plans, is based on a model that matches the plan’s duration to published yield curves. To develop our expected long-term rate of return on assets, we considered the historical returns and the future expectations for returns for each asset class, of assets held in our pension portfolios, as well as the target asset allocation of those portfolios.the pension portfolio. For the mortality rate, we used actuarially-determined mortality tables that were consistent with our historical mortality experience and future expectations for mortality of the employees who participate in our pension and OPEB plans. In determining the rate of compensation increase, we reviewed historical salary increases and promotions, while considering current industry conditions, the terms of collective bargaining agreements with our employees and the outlook for our industry. For the health care cost trend rate, we considered historical trends for these costs, as well as recently enacted healthcare legislation.
Effect if actual results differ from assumptions
Variations in assumptions could have a significant effect on the net periodic benefit costs and net unfunded pension and OPEB benefit obligations reported in our Consolidated Financial Statements.consolidated financial statements. For example, a 25 basis point change in any one of these assumptions would have increased (decreased) our net periodic benefit costs for our pension and OPEB plans and our net pension and OPEB benefit obligations as follows (in millions):
| 2011 Net Periodic Benefit Cost | Net Pension and OPEB Benefit Obligations as of December 31, 2011 | 2012 Net Periodic Benefit Cost | Net Pension and OPEB Benefit Obligations as of December 31, 2012 | |||||||||||||||||||||||||||||||||||
| Assumption | 25 Basis Point Increase | 25 Basis Point Decrease | 25 Basis Point Increase | 25 Basis Point Decrease | 25 Basis Point Increase | 25 Basis Point Decrease | 25 Basis Point Increase | 25 Basis Point Decrease | ||||||||||||||||||||||||||||||
Discount rate | $ | 5 | $ | (6) | $ | (177) | $ | 183 | $ | 6 | $ | (4 | ) | $ | (188 | ) | $ | 194 | ||||||||||||||||||||
Return on assets | (13) | 13 | – | – | (13 | ) | 13 | — | — | |||||||||||||||||||||||||||||
Rate of compensation increase | – | – | 6 | (6) | 1 | (1 | ) | 12 | (12 | ) | ||||||||||||||||||||||||||||
Health care cost trend rate | 1 | (1) | 11 | (9) | 1 | (1 | ) | 12 | (11 | ) | ||||||||||||||||||||||||||||
As of December 31, 2011,2012, the most significant change in our assumptions was a decrease to 4.9%4.3% from 5.5%4.9% as of December 31, 20102011, in the weighted-average discount rate for our pension benefit obligations.
The net periodic benefit costs of our pension plans is based on the expected return on plan assets and not the actual return on plan assets, and the net periodic benefit cost of our pension and OPEB plans is based on the expected change in pension and OPEB benefit obligations arising from the time value of money and not the actual change in pension and OPEB benefit obligations. Differences between these expected and actual results were recorded in “Accumulated“accumulated other comprehensive loss” in our Consolidated Balance Sheetsconsolidated balance sheets as an actuarial gain or loss. These accumulated differences were eliminated as of December 31, 2010 as a result of our application of fresh start accounting. Net losses arising in 2011,2012, before tax, and deferred in “Accumulated“accumulated other comprehensive loss” were $446$456 million. These losses will be amortized into income in future years and will increase our 20122013 net periodic benefit costs by approximately $1$22 million.
Recoverability of deferredDeferred income tax assets
Description of accounts impacted by the accounting estimateestimates
We have significant net deferred income tax assets of $1,783$1,983 million recorded in our Consolidated Balance Sheetconsolidated balance sheet as of December 31, 2011. These2012, representing net deferred income tax assets consist of $1,281$560 million net in Canada and $502$1,423 million net in the U.S. and Canada, respectively, and are comprised primarily of:
United States:
Deferred income tax assets for Federal and state net operating loss carryforwards of approximately $572 million. Our federal operating loss carryforwards are subject to certain annual limitations; however, these ordinary losses expire between 2020 and 2031 and we expect to fully utilize them during this period. In some instances, we have applied a valuation allowance to certain state operating loss carryforwards.
| — | Net deferred income tax assets for federal and state operating loss carryforwards of approximately $594 million. Our federal operating loss carryforwards are subject to certain annual limitations and expire between 2021 and 2032; however, we expect to fully utilize them during this period. In some instances, we have applied a valuation allowance to certain state operating loss carryforwards. |
Our remaining U.S. deferred income tax balances net to a deferred income tax liability position of approximately $70 million, which includes a deferred income tax liability on our fixed assets of $259 million, offset by a deferred income tax asset of $189
| — | Our remaining U.S. deferred income tax balances net to a deferred income tax liability position of approximately $34 million, which includes a deferred income tax liability on our fixed assets of $258 million, offset by a deferred income tax asset of $222 million related to liabilities for our pension and OPEB plans. |
| — | We have approximately $440 million of gross deferred income tax assets related to capital loss carryforwards against which we have applied a full valuation allowance because we are not assured of realizing capital gains in the carryforward period. |
Canada:
| — | Net deferred income tax assets for operating loss carryforwards of approximately $92 million and tax credit carryforwards of approximately $126 million that expire between 2013 and 2032 and that we expect to utilize during this period. In some instances we applied a valuation allowance to certain operating loss carryforwards not expected to be realized and tax credit carryforwards expected to expire unused. |
| — | Deferred income tax assets related to a pool of indefinite lived scientific research and experimental development costs of approximately $254 million, which we expect to fully utilize in the future. |
| — | Indefinite lived net deferred income tax assets related to undepreciated capital costs of approximately $579 million and net deferred income tax assets related to liabilities for our pension and OPEB plans of approximately $356 million. |
Judgments and OPEB plans.uncertainties involved in the accounting estimates
We have approximately $446 million ofassess whether it is more likely than not that the deferred income tax assets related to capital loss carryforwards against which we have applied a full valuation allowance because we are not assuredwill be realized based on the review of realizing capital gains in the carryforward period.
Canada:
Deferredall available positive and negative evidence, including future reversals of existing taxable temporary differences, estimates of future taxable income, past operating results, and prudent and feasible tax assets for operating loss carryforwardsplanning strategies. The carrying value of approximately $74 million and tax credit carryforwards of approximately $143 million that expire between 2013 and 2030 and which we expect to fully utilize during this period.
Deferred income tax assets related to a pool of indefinite lived scientific research and experimental development costs of approximately $264 million, which we expect to fully utilize in the future.
Indefinite livedour deferred income tax assets related(tax benefits expected to undepreciated capital costs of approximately $484 million andbe realized in the future) reflects our expected ability to generate sufficient future taxable income in certain tax jurisdictions to utilize these deferred income tax assets related to liabilities for our pensionbenefits.
In each of 2010, 2011 and OPEB plans of approximately $278 million.
Upon emergence from the Creditor Protection Proceedings, in 2010 and 2011,2012, we have evaluated the need for a valuation allowance against our net deferred income tax assets and determinedconcluded that we expect to generate sufficient taxable income in the future to realize most of the deferred income tax assets and accordingly, determined that a valuation allowance was only needed against certain deferred income tax assets. In making this determination, we focused primarily focused on a post-reorganization outlook, which reflected a new capital structure, new contractual arrangements and a new asset structure with new values under the application of fresh start accounting as of December 31, 2010. The weight of positive evidence, which included our expected future performance, resulted in the conclusion by management that upon emergence from the Creditor Protection Proceedings,creditor protection proceedings in 2010, valuation allowances were not required for most of theour deferred income tax assets. Therefore, the majority of the valuation allowances were reversed in 2010 as part of the implementation of the Plansplans of Reorganizationreorganization and the application of fresh start accounting. In 2011, ourOur results and expected future performance continue to support the recoverability of most of the deferred income tax assets. Prior to emergence from the Creditor Protection Proceedings, in 2009 and 2010 until the Emergence Date, due to the existence ofAs a result, we have significant negative evidence such as a cumulative three-year loss and our financial condition, we had concluded that a valuation allowance was necessary on substantially all of our net deferred income tax assets.assets recorded on our consolidated balance sheets as of December 31, 2012 and 2011.
Judgments and uncertainties involved inIn certain of our smaller foreign subsidiaries, deferred income tax assets are reduced by a full valuation allowance because, based on the accounting estimate
We are required to assess whetherweight of available evidence, it is more likely than not that the deferred income tax assets will not be realized,realized. We will continue to monitor all available evidence related to these subsidiaries, including past and expected future performance in order to assess the need for a valuation allowance.
We calculate our income tax provision for the period based on estimates and assumptions that could differ from the actual results reflected in income tax returns filed in the subsequent years. Adjustments based on actual filed income tax returns are recorded when identified.
Tax benefits related to uncertain tax positions are recorded when it is more likely than not, based on the nature, frequency and severitytechnical merits, that the position will be sustained upon examination by the relevant tax authority. The amount of recent losses, forecasted income,tax benefit recognized may differ from the amount taken or where necessary, the implementation of prudent and feasible tax planning strategies. The carrying value of our deferred income tax assets (tax benefits expected to be realized in the future) assumes that we will be able to generate,taken on a tax return. These differences represent unrecognized tax benefits and are reviewed at each reporting period based on certain estimatesfacts, circumstances and assumptions, sufficient future taxable income in certainavailable evidence. We have unrecognized tax jurisdictions to utilize these deferredbenefits of $84 million as of December 31, 2012. As income tax benefits, or in the absence of sufficient future taxable income, that we would implementlegislation and regulations are complex and subject to interpretation, our tax planning strategies to generate sufficient taxable income.positions could be challenged by taxing authorities.
Effect if actual results differ from assumptions
Our expected future performance represents important positive evidence in determining the recoverability of deferred income tax assets. If actual financial results are not consistent with the assumptions and judgments used, in determining and estimating the realization of our deferred income tax assets, we may be required to reduce the value of our net deferred income tax assets by recording additional valuation allowances, resulting in an additional income tax expense that could be material.
Long-lived assetsWe do not expect a significant change to the amount of unrecognized tax benefits over the next twelve months. However, any adjustments arising from examinations by tax authorities may alter the timing or amount of taxable income or deductions, or the allocation of income among tax jurisdictions and could differ from the amount accrued.
Long-lived assets
Description of accounts impacted by the accounting estimate
We have long-lived assets recorded in our Consolidated Balance Sheetsconsolidated balance sheet of $2,527$2,509 million as of December 31, 2011.2012. These long-lived assets include fixed assets, net (including timber and timberlands); amortizable intangible assets, net; and long-lived assets included in assets held for sale. In 2011,2012, we recorded depreciation and amortization of $220$233 million and impairment and accelerated depreciation charges aggregating $24$127 million associated with these long-lived assets. The depreciation and amortization and impairment charges are based on accounting estimates.
The unit of accounting for impairment testing for long-lived assets is its asset group (see Notenote 2, “Summary“summary of Significant Accounting Policiessignificant accounting policies – Impairmentimpairment of long-lived assets,” to our Consolidated Financial Statements)consolidated financial statements). The unit of accounting for the depreciation and amortization of long-lived assets is at a lower level, either an individual asset or a group of closely-related assets. The cost of a long-lived asset is amortized over its estimated remaining useful life, which is subject to change based on events and circumstances or management’s intention for the use of the asset.
Losses related to the impairment of long-lived assets to be held and used are recognized when circumstances indicate the carrying value of an asset group may not be recoverable, such as continuing losses in certain businesses. When indicators that the carrying value of an asset group may not be recoverable are triggered, we evaluate the carrying value of the asset group in relation to its expected undiscounted future cash flows. If the carrying value of an asset group is greater than the expected undiscounted future cash flows to be generated by the asset group, an impairment charge is recognized based on the excess of the asset group’s carrying value over its fair value. If it is determined that the carrying value of an asset group is recoverable, we review and adjust, as necessary, the estimated useful lives of the assets in the group.
When an asset group meets the criteria for classification as an asset held for sale, an impairment charge is recognized, if necessary, based on the excess of the asset group’s carrying value over the expected net proceeds from the sale (the estimated fair value minus the estimated costs to sell the asset group).
Our long-lived asset impairment and accelerated depreciation charges are disclosed in Note 3, “Creditor Protection Proceedingsnote 4, “creditor protection proceedings – Reorganizationreorganization items, net,” and Note 5, “Closure Costs, Impairmentnote 6, “closure costs, impairment of Assetsassets and Other Related Charges,other related charges,” to our Consolidated Financial Statements.consolidated financial statements.
Judgments and uncertainties involved in the accounting estimate
The calculation of depreciation and amortization of long-lived assets requires us to apply judgment in selecting the remaining useful lives of the assets. The remaining useful life of an asset must address both physical and economic considerations. The remaining economic life of a long-lived asset is frequently shorter than its physical life. The pulp and paper industry in recent years has been characterized by considerable uncertainty in business conditions. Estimates of future economic conditions for our long-lived assets and therefore, their remaining useful economic life, require considerable judgment.
Asset impairment for long-lived assets to be held and used is tested at the lowest asset group level having largely independent cash flows. Determining the asset groups for long-lived assets to be held and used requires management’s judgment.
Asset impairment loss calculations require us to apply judgment in estimating asset group fair values and future cash flows, including periods of operation, projections of product pricing, first quality production levels, product costs, market supply and demand, foreign exchange rates, inflation, projected capital spending and, specifically for fixed assets acquired, assigned useful lives, functional obsolescence, asset condition and discount rates. When performing impairment tests, we estimate the fair values of the assets using management’s best assumptions, which we believe would be consistent with the assumptions that a hypothetical marketplace
participant would use. Estimates and assumptions used in these tests are evaluated and updated as appropriate. One key assumption, especially for our long-lived assets in Canada, is the foreign exchange rate. Foreign exchange rates were determined based on our budgeted exchange rates for 2012.2013. The assessment of whether an asset group should be classified as held for sale requires us to apply judgment in estimating the probable timing of the sale, and in testing for impairment loss, judgment is required in estimating the net proceeds from the sale.
Effect if actual results differ from assumptions
If our estimate of the remaining useful life changes, such a change is accounted for prospectively in our determination of depreciation and amortization. Actual depreciation and amortization charges for an individual asset may therefore be significantly accelerated if the outlook for its remaining useful life is shortened considerably. One group of assets, for which the remaining useful life is being monitored closely, are the tangible and intangible assets associated with our Jim-Gray hydroelectric installation,dam, which is part of the Hydro Saguenay facility that provides hydroelectric power to certain mills in the province of Quebec. The province of Quebec informed us on
December 30, 2011 that it intended not to terminaterenew our water rights associated with this facilityour Jim-Gray hydroelectric dam and to require us to transfer property of the associated installationproperty to the province for no consideration. The termination andOn February 6, 2013, the province of Quebec granted us an extension to transfer the property. As extended, an agreement on the terms of the transfer would need to be effective as of March 2, 2012.entered into at the latest on June 14, 2013. The province’s actions are not consistent withcontrary to our understanding of the agreementwater power lease in question. We continue to evaluate our legal options. The net book value of this hydroelectric facilitydam was tested for impairment with the other assets in its asset group and no impairment was indicated. At this time, we believe that the remaining useful life of the assets remains unchanged, as we continue pursuing the renewal of our water rights at the facility.unchanged. The carrying value of the long-lived assets associated with the Jim-Gray installationdam as of December 31, 20112012 was approximately $95$93 million. If we are unable to renew theJim-Gray’s water rights, at this facility, we will reevaluate the remaining useful life of these assets, which may result in accelerated depreciation and amortization charges in the first quarter of 2012.at that time.
A number of judgments were made in the determination of our asset groups. If a different conclusion had been reached for any one of those assumptions, it could have resulted in the identification of asset groups different from those we actually identified. This may have resulted in a different conclusion when comparing the expected undiscounted future cash flows or the fair value to the carrying value of the asset group.
Actual asset impairment losses could vary considerably from estimated impairment losses if actual results are not consistent with the assumptions and judgments used in estimating future cash flows and asset fair values, and for assets held for sale, the probable timing of the sale and the net proceeds from the sale.
Assets with proportionately greater risk of acceleration in depreciation and amortization or additional impairment are the Jim-Gray hydroelectric facilitystation (as discussed above) and those facilities whichthat are presently idled, closed or held for sale. Information on certain of our idled assets can be found in Note 3, “Creditor Protection Proceedingsnote 4, “creditor protection proceedings – Reorganizationreorganization items, net,” and in Note 5, “Closure Costs, Impairmentnote 6, “closure costs, impairment of Assetsassets and Other Related Chargesother related charges – Impairmentimpairment of long-lived assets,” to our Consolidated Financial Statements.consolidated financial statements. Information on the carrying amounts of our assets held for sale can be found in Note 6, “Assets Heldnote 7, “assets held for Sale, Liabilities Associated with Assets Held for Salesale and Net Gainnet gain on Dispositiondisposition of Assetsassets and Other,other,” to our Consolidated Financial Statements. The carrying amount of facilities which are closed and not classified as held for sale as of December 31, 2011 was approximately $28 million.consolidated financial statements.
ITEM 7A. QUANTITATIVE AND QUALITATIVE DISCLOSURES ABOUT MARKET RISK
We are exposed to risks associated with fluctuations in foreign currency exchange rates, interest rates, commodity prices, prices for the products we manufacture and credit risk on the accounts receivable from our customers.
Foreign Currency Exchange Risk
We compete with producers from around the world, particularly North America, Europe and South America, in all of our product lines with the exception of wood products, where we compete with other North American producers. We sell our products in transactions denominated principally in U.S. dollars, but we also sell in certain local currencies, including the euro, the pound sterling and the Canadian dollar. A substantial portion of our manufacturing costs are denominated in Canadian dollars.
In addition to the impact of product supply and demand, changes in the relative strength or weakness of these currencies, particularly the U.S. dollar, may also affect international trade flows of these products. A stronger U.S. dollar may attract imports into North America from foreign producers, thereby increasing supply and possibly creating downward pressure on prices. On the other hand, a weaker U.S. dollar may encourage U.S. exports and increase manufacturing costs that are in Canadian dollars or other foreign currencies.
Variations in the exchange rates between the U.S. dollar, the Canadian dollar, the euro, the pound sterling, Swedish krona and the Norwegian krone and other currencies, could also significantly affect our competitive position. In 2012, the strength of the U.S. dollar against certain European currencies negatively affected the competitive position of North American newsprint producers selling in certain international U.S. dollar-denominated newsprint markets like most of Asia and India. Some of our European competitors have manufacturing operationsbeen able to price business more aggressively in those markets as a result of the relative weakness of their local currency, which has negatively affected our ability to compete. We, as a result, significantly reduced sales to Asia and Europe, and we took steps to limit our exposure by reducing export-focused capacity, like our Mersey mill, which we closed in June.
We are particularly sensitive to changes in the value of the Canadian dollar versus the U.S. dollar. The actual impact of these changes depends primarily on the proportion of our production and sales that occur in Canada, the United States and South Korea and sales offices located throughout the world. As a result, we are exposed to movements in foreign currency exchange rates in countries outside the United States. Our most significant foreign currency exposure relates to Canada. Over halfproportion of our pulpfinancial assets and paper production capacity and all of our wood products production capacity are in Canada, with manufacturing costs primarilyliabilities denominated in Canadian dollars. dollars, and the magnitude, direction and duration of changes in the exchange rate.
We expect exchange rate fluctuations to continue to impact costs and revenues, but we cannot predict the magnitude or direction of this effect for any quarter, and there can be no assurance of any future effects. In the last two years, the Canadian dollar fluctuated between a low of US$0.95 in October 2011 to a high of US$1.06 in July 2011. Based on operating projections for 2013, if the Canadian dollar strengthens by one cent against the U.S. dollar, we expect that it will decrease our annual operating income by approximately $14 million.
Also, certain other assets and liabilities, including a substantial portion of our net pension and OPEB benefit obligations and our deferred income tax assets, are denominated in Canadian dollars and are exposed to foreign currency movements. As a result, ourOur earnings are therefore affected by increases or decreases in the value of the Canadian dollar.dollar, but our exposure has been gradually reduced as a result of the offsetting nature of the net pension and OPEB benefit obligations and our deferred income tax assets. Long-term increases in the value of the Canadian dollar versus the United StatesU.S. dollar will tend to reduceincrease reported earnings, and long-term decreases in the value of the Canadian dollar will tend to increasereduce reported earnings. See “Exchange Rate Fluctuation Effect on Earnings” in Item 7 for additional information on foreign exchange risks related to our earnings.
Interest RateProduct Price Risk
WeHistorically, economic and market shifts, fluctuations in capacity, and changes in foreign currency exchange rates have created cyclical changes in prices, sales volume and margins for our products. Most of our paper, market pulp and wood products are exposedcommodities that are widely available from other producers; because these products have few distinguishing qualities from producer to interest rate riskproducer, competition is based primarily on price, which is determined by supply relative to demand. The overall levels of demand for the products we manufacture, consequently our sales and profitability, reflect fluctuations in end-user demand, which depend in part on general economic conditions in North America and worldwide.
In the table below, we show the impact of a $25 change to the average transaction price per unit of our products, based on our fixed-rate long-term debt (the 2018 Notes) and our variable-rate short-term bank debt (borrowings under the ABL Credit Facility). Asoperating configuration as of December 31, 2011, we had $621 million ($586 million principal amount)2012. This presentation measures only the impact of fixed-rate long-term debtpricing and no variable-rate short-term bank debt. Our fixed-rate long-term debtitems directly related to price, and assumes that every other factor is exposed to fluctuations in fair value resulting from changes in market interest rates, but such changes do not affect earnings or cash flows.held constant.
| PRODUCT | Unit | Projected change in ($ millions) | ||||
| $25 increase in price per unit | $25 decrease in price per unit | |||||
Newsprint | $ / metric ton | 63 | 63 | |||
Specialty and coated papers | $ / short ton | 51 | 51 | |||
Market pulp | $ / metric ton | 41 | 41 | |||
Wood products | $ /thousand board feet | 31 | 31 | |||
Commodity Price Risk
We purchase significant amounts of energy, chemicals, wood fiber and recovered paper to supply our manufacturing facilities. These raw materials are market-priced commodities and as such, are subject to fluctuations in market prices. Increases in the prices of these commodities will tend to reduce our reported earnings and decreases will tend to increase our reported earnings. From time to time, we may enter into contracts aimed at securing a stable source of supply for commodities such as timber, wood fiber, energy, chemicals and recovered paper. These contracts typically require us to pay the market price at the time of purchase. Thus, under these contracts, we generally remain subject to market fluctuations in commodity prices.
Credit Risk
We are exposed to credit risk on the accounts receivable from our customers. In order to manage our credit risk, we have adopted policies, which include the analysis of the financial position of our customers and the regular review of their credit limits. We also subscribe to credit insurance and, in some cases, require bank letters of credit. Our customers are mainly in the newspaper publishing, specialty, advertising, and paper converting, consumer products as well as lumber wholesaling and retailing businesses. See Part I, Item 1A, “Risk Factors – Bankruptcy of a significant customer could have a material adverse effect on our liquidity, financial condition or results of operations,” of this Form 10-K.
| ITEM 8. | FINANCIAL STATEMENTS AND SUPPLEMENTARY DATA |
ITEM 8. FINANCIAL STATEMENTS AND SUPPLEMENTARY DATA
Index to Financial Statements
Page | |||||
| 74 | |||||
| 75 | |||||
Consolidated Balance Sheets as of December 31, | |||||
ABITIBIBOWATERRESOLUTE FOREST PRODUCTS INC.
CONSOLIDATED STATEMENTS OF OPERATIONS
(In millions, except per share amounts)
| Years Ended December 31, | Years Ended December 31, | |||||||||||||||||||||||||
| Successor | Predecessor | Successor | Predecessor | |||||||||||||||||||||||
| 2011 | 2010 | 2009 | 2012 | 2011 | 2010 | |||||||||||||||||||||
Sales | $ | 4,756 | $ | 4,746 | $ | 4,366 | $ | 4,503 | $ | 4,756 | $ | 4,746 | ||||||||||||||
Costs and expenses: | ||||||||||||||||||||||||||
Cost of sales, excluding depreciation, amortization and cost of timber harvested | 3,590 | 3,724 | 3,343 | 3,492 | 3,590 | 3,724 | ||||||||||||||||||||
Depreciation, amortization and cost of timber harvested | 220 | 493 | 602 | 233 | 220 | 493 | ||||||||||||||||||||
Distribution costs | 547 | 553 | 487 | 514 | 547 | 553 | ||||||||||||||||||||
Selling, general and administrative expenses | 158 | 155 | 198 | 149 | 158 | 155 | ||||||||||||||||||||
Closure costs, impairment and other related charges | 46 | 11 | 202 | 180 | 46 | 11 | ||||||||||||||||||||
Net gain on disposition of assets and other | (3 | ) | (30 | ) | (91 | ) | (35 | ) | (3 | ) | (30) | |||||||||||||||
Operating income (loss) | 198 | (160 | ) | (375 | ) | |||||||||||||||||||||
Interest expense (contractual interest of $714 and $788 for the years ended December 31, 2010 and 2009, respectively) (Note 16) | (95 | ) | (483 | ) | (597 | ) | ||||||||||||||||||||
Other expense, net | (48 | ) | (89 | ) | (71 | ) | ||||||||||||||||||||
Income (loss) before reorganization items and income taxes | 55 | (732 | ) | (1,043 | ) | |||||||||||||||||||||
Reorganization items, net (Note 3) | – | 1,901 | (639 | ) | ||||||||||||||||||||||
Income (loss) before income taxes | 55 | 1,169 | (1,682 | ) | ||||||||||||||||||||||
Income tax (provision) benefit | (16 | ) | 1,606 | 122 | ||||||||||||||||||||||
Net income (loss) including noncontrolling interests | 39 | 2,775 | (1,560 | ) | ||||||||||||||||||||||
Operating (loss) income | (30 | ) | 198 | (160) | ||||||||||||||||||||||
Interest expense (contractual interest of $714 for the year ended | (66 | ) | (95 | ) | (483) | |||||||||||||||||||||
Other income (expense), net | 22 | (48 | ) | (89) | ||||||||||||||||||||||
(Loss) income before reorganization items and income taxes | (74 | ) | 55 | (732) | ||||||||||||||||||||||
Reorganization items, net (Note 4) | – | – | 1,901 | |||||||||||||||||||||||
(Loss) income before income taxes | (74 | ) | 55 | 1,169 | ||||||||||||||||||||||
Income tax benefit (provision) | 38 | (16 | ) | 1,606 | ||||||||||||||||||||||
Net (loss) income including noncontrolling interests | (36 | ) | 39 | 2,775 | ||||||||||||||||||||||
Net loss (income) attributable to noncontrolling interests | 2 | (161 | ) | 7 | 34 | 2 | (161) | |||||||||||||||||||
Net income (loss) attributable to AbitibiBowater Inc. | $ | 41 | $ | 2,614 | $ | (1,553 | ) | |||||||||||||||||||
Net (loss) income attributable to Resolute Forest Products Inc. | $ | (2 | ) | $ | 41 | $ | 2,614 | |||||||||||||||||||
Net income (loss) per share attributable to AbitibiBowater Inc. common shareholders: | ||||||||||||||||||||||||||
Net (loss) income per share attributable to Resolute Forest Products | ||||||||||||||||||||||||||
Basic | $ | 0.42 | $ | 45.30 | $ | (26.91 | ) | $ | (0.02 | ) | $ | 0.42 | $ | 45.30 | ||||||||||||
Diluted | $ | 0.42 | $ | 27.63 | $ | (26.91 | ) | $ | (0.02 | ) | $ | 0.42 | $ | 27.63 | ||||||||||||
Weighted-average number of AbitibiBowater Inc. common shares outstanding: | ||||||||||||||||||||||||||
Weighted-average number of Resolute Forest Products Inc. | ||||||||||||||||||||||||||
Basic | 97.1 | 57.7 | 57.7 | 97.4 | 97.1 | 57.7 | ||||||||||||||||||||
Diluted | 97.1 | 94.6 | 57.7 | 97.4 | 97.1 | 94.6 | ||||||||||||||||||||
See accompanying notes to consolidated financial statements.
ABITIBIBOWATERRESOLUTE FOREST PRODUCTS INC.
CONSOLIDATED STATEMENTS OF COMPREHENSIVE (LOSS) INCOME
(In millions)
| Years Ended December 31, | ||||||||||||
| Successor | Predecessor | |||||||||||
| 2012 | 2011 | 2010 | ||||||||||
Net (loss) income including noncontrolling interests | $ | (36 | ) | $ | 39 | $ | 2,775 | |||||
Other comprehensive income (loss): | ||||||||||||
Change in unamortized prior service costs and credits, net of tax of $7 in 2012 and $0 in both 2011 and 2010 | 23 | (2 | ) | 8 | ||||||||
Change in unamortized actuarial gains and losses, net of tax of $135, $127 and $0 in 2012, 2011 and 2010, respectively | (351 | ) | (317 | ) | (598) | |||||||
Foreign currency translation | 1 | 10 | 15 | |||||||||
Other comprehensive loss, net of tax | (327 | ) | (309 | ) | (575) | |||||||
Comprehensive (loss) income including noncontrolling interests | (363 | ) | (270 | ) | 2,200 | |||||||
Less: Comprehensive loss (income) attributable to noncontrolling interests: | ||||||||||||
Net loss (income) | 34 | 2 | (161) | |||||||||
Change in unamortized actuarial gains and losses, net of tax of $0 in both 2012 and 2011 | 6 | 8 | – | |||||||||
Foreign currency translation | 2 | (2 | ) | 5 | ||||||||
Comprehensive loss (income) attributable to noncontrolling interests | 42 | 8 | (156) | |||||||||
Comprehensive (loss) income attributable to Resolute Forest Products Inc. | $ | (321 | ) | $(262 | ) | $ | 2,044 | |||||
See accompanying notes to consolidated financial statements.
RESOLUTE FOREST PRODUCTS INC.
(In millions, except per share amount)
| Successor | ||||||||||||||||||||
| December 31, | December 31, | Successor | ||||||||||||||||||
| 2011 | 2010 | December 31, 2012 | December 31, 2011 | |||||||||||||||||
Assets | ||||||||||||||||||||
Current assets: | ||||||||||||||||||||
Cash and cash equivalents | $ | 369 | $ | 319 | $ | 263 | $ | 369 | ||||||||||||
Accounts receivable, net | 750 | 833 | ||||||||||||||||||
Accounts receivable, net: | ||||||||||||||||||||
Trade | 576 | 582 | ||||||||||||||||||
Other | 121 | 168 | ||||||||||||||||||
Inventories, net | 475 | 438 | 545 | 475 | ||||||||||||||||
Assets held for sale | 7 | 698 | – | 7 | ||||||||||||||||
Deferred income tax assets | 109 | 47 | 56 | 109 | ||||||||||||||||
Other current assets | 59 | 88 | 58 | 59 | ||||||||||||||||
Total current assets | 1,769 | 2,423 | 1,619 | 1,769 | ||||||||||||||||
Fixed assets, net | 2,502 | 2,641 | 2,440 | 2,502 | ||||||||||||||||
Amortizable intangible assets, net | 18 | 19 | 69 | 18 | ||||||||||||||||
Deferred income tax assets | 1,749 | 1,736 | 2,002 | 1,749 | ||||||||||||||||
Other assets | 260 | 316 | 194 | 260 | ||||||||||||||||
Total assets | $ | 6,298 | $ | 7,135 | $ | 6,324 | $ | 6,298 | ||||||||||||
Liabilities and equity | ||||||||||||||||||||
Current liabilities: | ||||||||||||||||||||
Accounts payable and accrued liabilities | $ | 544 | $ | 547 | $ | 581 | $ | 544 | ||||||||||||
Liabilities associated with assets held for sale | – | 289 | ||||||||||||||||||
Current portion of long-term debt | 2 | – | ||||||||||||||||||
Total current liabilities | 544 | 836 | 583 | 544 | ||||||||||||||||
Long-term debt | 621 | 905 | ||||||||||||||||||
Long-term debt, net of current portion | 532 | 621 | ||||||||||||||||||
Pension and other postretirement benefit obligations | 1,524 | 1,272 | 1,946 | 1,524 | ||||||||||||||||
Deferred income tax liabilities | 75 | 72 | 75 | 75 | ||||||||||||||||
Other long-term liabilities | 57 | 63 | 72 | 57 | ||||||||||||||||
Total liabilities | 2,821 | 3,148 | 3,208 | 2,821 | ||||||||||||||||
Commitments and contingencies | ||||||||||||||||||||
Equity: | ||||||||||||||||||||
AbitibiBowater Inc. shareholders’ equity: | ||||||||||||||||||||
Common stock, $0.001 par value. 114.1 shares issued and 97.1 shares outstanding as of December 31, 2011 and 2010 | – | – | ||||||||||||||||||
Resolute Forest Products Inc. shareholders’ equity: | ||||||||||||||||||||
Common stock, $0.001 par value. 117.0 shares issued and 94.8 shares outstanding as of December 31, 2012; 114.1 shares issued and 97.1 shares outstanding as of December 31, 2011 | – | – | ||||||||||||||||||
Additional paid-in capital | 3,687 | 3,709 | 3,730 | 3,687 | ||||||||||||||||
Retained earnings | 41 | – | 38 | 41 | ||||||||||||||||
Accumulated other comprehensive loss | (311 | ) | – | (614) | (311) | |||||||||||||||
Treasury stock at cost, 17.0 shares as of December 31, 2011 and 2010 (Note 21) | – | – | ||||||||||||||||||
Total AbitibiBowater Inc. shareholders’ equity | 3,417 | 3,709 | ||||||||||||||||||
Treasury stock at cost, 22.2 shares and 17.0 shares as of December 31, 2012 and 2011 (Note 21) | (61) | – | ||||||||||||||||||
Total Resolute Forest Products Inc. shareholders’ equity | 3,093 | 3,417 | ||||||||||||||||||
Noncontrolling interests | 60 | 278 | 23 | 60 | ||||||||||||||||
Total equity | 3,477 | 3,987 | 3,116 | 3,477 | ||||||||||||||||
Total liabilities and equity | $ | 6,298 | $ | 7,135 | $ | 6,324 | $ | 6,298 | ||||||||||||
See accompanying notes to consolidated financial statements.
ABITIBIBOWATERRESOLUTE FOREST PRODUCTS INC.
CONSOLIDATED STATEMENTS OF CHANGES IN (DEFICIT) EQUITY
(In millions)
| AbitibiBowater Inc. Shareholders’ (Deficit) Equity | ||||||||||||||||||||||||||||||||
| Common Stock | Exchangeable Shares | Additional Paid-in Capital | (Deficit) Retained Earnings | Accumulated Other Comprehensive Loss | Treasury Stock | Non-controlling Interests | Total (Deficit) Equity | |||||||||||||||||||||||||
Balance as of December 31, 2008 (Predecessor) | $ | 53 | $ | 242 | $ | 2,451 | $ | (2,838 | ) | $ | (384 | ) | $ | – | $ | 136 | $ | (340 | ) | |||||||||||||
Exchangeable shares retracted and common shares issued (1.4 shares) | 2 | (69 | ) | 67 | – | – | – | – | – | |||||||||||||||||||||||
Share-based compensation costs for equity-classified awards | – | – | 4 | – | – | – | – | 4 | ||||||||||||||||||||||||
Restricted stock units vested, net of shares forfeited for employee withholding taxes (0.1 shares) | – | – | – | – | – | – | – | – | ||||||||||||||||||||||||
Dividends paid to noncontrolling interests | – | – | – | – | – | – | (7 | ) | (7 | ) | ||||||||||||||||||||||
Net loss | – | – | – | (1,553 | ) | – | – | (7 | ) | (1,560 | ) | |||||||||||||||||||||
Other comprehensive loss, net of tax | – | – | – | – | (66 | ) | – | – | (66 | ) | ||||||||||||||||||||||
Balance as of December 31, 2009 (Predecessor) | 55 | 173 | 2,522 | (4,391 | ) | (450 | ) | – | 122 | (1,969 | ) | |||||||||||||||||||||
Share-based compensation costs for equity-classified awards | – | – | 3 | – | – | – | – | 3 | ||||||||||||||||||||||||
Net income | – | – | – | 2,614 | – | – | 161 | 2,775 | ||||||||||||||||||||||||
Other comprehensive loss, net of tax | – | – | – | – | (570 | ) | – | (5 | ) | (575 | ) | |||||||||||||||||||||
Implementation of Plans of Reorganization and application of fresh start accounting (Note 3): | ||||||||||||||||||||||||||||||||
Cancellation of Predecessor Company common stock (54.7 shares) and exchangeable shares (3.0 shares) | (55 | ) | (173 | ) | 228 | – | – | – | – | – | ||||||||||||||||||||||
Issuance of Successor Company common stock (97.1 shares) | – | – | 3,709 | – | – | – | – | 3,709 | ||||||||||||||||||||||||
Plans of Reorganization adjustments to accumulated other comprehensive loss | – | – | – | – | 44 | – | – | 44 | ||||||||||||||||||||||||
Elimination of Predecessor Company additional paid-in capital, deficit and accumulated other comprehensive loss | – | – | (2,753 | ) | 1,777 | 976 | – | – | – | |||||||||||||||||||||||
Issuance of Successor Company common stock to Donohue Corp., a wholly-owned subsidiary of the Company (17.0 shares in treasury) (Note 21) | – | – | – | – | – | – | – | – | ||||||||||||||||||||||||
Balance as of December 31, 2010 (Successor) | – | – | 3,709 | – | – | – | 278 | 3,987 | ||||||||||||||||||||||||
Share-based compensation costs for equity-classified awards | – | – | 3 | – | – | – | – | 3 | ||||||||||||||||||||||||
Net income (loss) | – | – | – | 41 | – | – | (2 | ) | 39 | |||||||||||||||||||||||
Dividends and distribution paid to noncontrolling interests | – | – | – | – | – | – | (21 | ) | (21 | ) | ||||||||||||||||||||||
Acquisition of noncontrolling interest (Note 16 and Note 19) | – | – | (15 | ) | – | – | – | (105 | ) | (120 | ) | |||||||||||||||||||||
Disposition of investment in ACH Limited Partnership (Note 8 and Note 16) | – | – | – | – | (8 | ) | – | (99 | ) | (107 | ) | |||||||||||||||||||||
Contribution of capital to noncontrolling interest | – | – | (10 | ) | – | – | – | 15 | 5 | |||||||||||||||||||||||
Other comprehensive loss, net of tax | – | – | – | – | (303 | ) | – | (6 | ) | (309 | ) | |||||||||||||||||||||
Balance as of December 31, 2011 (Successor) | $ | – | $ | – | $ | 3,687 | $ | 41 | $ | (311 | ) | $ | – | $ | 60 | $ | 3,477 | |||||||||||||||
| Resolute Forest Products Inc. Shareholders’ (Deficit) Equity | ||||||||||||||||||||||||||||||||
Common Stock | Exchangeable Shares | Additional Paid-in Capital | (Deficit) Retained Earnings | Accumulated Other Comprehensive Loss | Treasury Stock | Non- controlling | Total (Deficit) Equity | |||||||||||||||||||||||||
Balance as of December 31, 2009 (Predecessor) | $ | 55 | $ | 173 | $ | 2,522 | $ | (4,391 | ) | $ | (450) | $ | – | $ | 122 | $ | (1,969 | ) | ||||||||||||||
Share-based compensation costs for equity- | – | – | 3 | – | – | – | – | 3 | ||||||||||||||||||||||||
Net income | – | – | – | 2,614 | – | – | 161 | 2,775 | ||||||||||||||||||||||||
Other comprehensive loss, net of tax | – | – | – | – | (570) | – | (5) | (575 | ) | |||||||||||||||||||||||
Implementation of Plans of Reorganization | ||||||||||||||||||||||||||||||||
Cancellation of Predecessor Company | (55) | (173) | 228 | – | – | – | – | – | ||||||||||||||||||||||||
Issuance of Successor Company common | – | – | 3,709 | – | – | – | – | 3,709 | ||||||||||||||||||||||||
Plans of Reorganization adjustments to | – | – | – | – | 44 | – | – | 44 | ||||||||||||||||||||||||
Elimination of Predecessor Company | – | – | (2,753 | ) | 1,777 | 976 | – | – | – | |||||||||||||||||||||||
Issuance of Successor Company common | – | – | – | – | – | – | – | – | ||||||||||||||||||||||||
Balance as of December 31, 2010 | – | – | 3,709 | – | – | – | 278 | 3,987 | ||||||||||||||||||||||||
Share-based compensation costs for equity- | – | – | 3 | – | – | – | – | 3 | ||||||||||||||||||||||||
Net income (loss) | – | – | – | 41 | – | – | (2) | 39 | ||||||||||||||||||||||||
Dividends and distribution paid to | – | – | – | – | – | – | (21) | (21 | ) | |||||||||||||||||||||||
Acquisition of noncontrolling interest | – | – | (15 | ) | – | – | – | (105) | (120 | ) | ||||||||||||||||||||||
Disposition of investment in ACH Limited | – | – | – | – | (8) | – | (99) | (107 | ) | |||||||||||||||||||||||
Contribution of capital to noncontrolling | – | – | (10 | ) | – | – | – | 15 | 5 | |||||||||||||||||||||||
Other comprehensive loss, net of tax | – | – | – | – | (303) | – | (6) | (309 | ) | |||||||||||||||||||||||
Balance as of December 31, 2011 | – | – | 3,687 | 41 | (311) | – | 60 | 3,477 | ||||||||||||||||||||||||
Share-based compensation costs for equity- | – | – | 5 | – | – | – | – | 5 | ||||||||||||||||||||||||
Net loss | – | – | – | (2 | ) | – | – | (34) | (36 | ) | ||||||||||||||||||||||
Acquisition of Fibrek Inc. (2.8 newly-issued | – | – | 38 | (1 | ) | – | 6 | – | 43 | |||||||||||||||||||||||
Disposition of investment in Bowater | – | – | – | – | 16 | – | 9 | 25 | ||||||||||||||||||||||||
Purchases of treasury stock (5.6 shares) | – | – | – | – | – | (67 | ) | – | (67 | ) | ||||||||||||||||||||||
Distribution of common stock from the | – | – | – | – | – | – | – | – | ||||||||||||||||||||||||
Restricted stock units and deferred stock | – | – | – | – | – | – | – | – | ||||||||||||||||||||||||
Dividends paid to noncontrolling interest | – | – | – | – | – | – | (5) | (5 | ) | |||||||||||||||||||||||
Contribution of capital to non-controlling | – | – | – | – | – | – | 1 | 1 | ||||||||||||||||||||||||
Other comprehensive loss, net of tax | – | – | – | – | (319) | – | (8) | (327 | ) | |||||||||||||||||||||||
Balance as of December 31, 2012 | $ | – | $ | – | $ | 3,730 | $ | 38 | $ | (614) | $ | (61 | ) | $ | 23 | $ | 3,116 | |||||||||||||||
See accompanying notes to consolidated financial statements.
ABITIBIBOWATER INC.
CONSOLIDATED STATEMENTS OF COMPREHENSIVE (LOSS) INCOME
(In millions)
| Years Ended December 31, | ||||||||||||
| Successor | Predecessor | |||||||||||
| 2011 | 2010 | 2009 | ||||||||||
Net income (loss) including noncontrolling interests | $ | 39 | $ | 2,775 | $ | (1,560) | ||||||
Other comprehensive (loss) income: | ||||||||||||
Change in unamortized prior service costs and credits, net of tax of $0 in all years | (2) | 8 | (15) | |||||||||
Change in unamortized actuarial gains and losses, net of tax of $127, $0 and $0 in 2011, 2010 and 2009 | (317) | (598) | (176) | |||||||||
Foreign currency translation | 10 | 15 | 125 | |||||||||
Other comprehensive loss, net of tax | (309) | (575) | (66) | |||||||||
Comprehensive (loss) income including noncontrolling interests | (270) | 2,200 | (1,626) | |||||||||
Less: Comprehensive loss (income) attributable to noncontrolling interests: | ||||||||||||
Net loss (income) | 2 | (161) | 7 | |||||||||
Change in unamortized actuarial gains and losses, net of tax of $0 in 2011 | 8 | – | – | |||||||||
Foreign currency translation | (2) | 5 | – | |||||||||
Comprehensive loss (income) attributable to noncontrolling interests | 8 | (156) | 7 | |||||||||
Comprehensive (loss) income attributable to AbitibiBowater Inc. | $ | (262) | $ | 2,044 | $ | (1,619) | ||||||
See accompanying notes to consolidated financial statements.
ABITIBIBOWATERRESOLUTE FOREST PRODUCTS INC.
CONSOLIDATED STATEMENTS OF CASH FLOWS
(In millions)
| Years Ended December 31, | Years Ended December 31, | |||||||||||||||||||||||||
| Successor | Predecessor | Successor | Predecessor | |||||||||||||||||||||||
| 2011 | 2010 | 2009 | 2012 | 2011 | 2010 | |||||||||||||||||||||
Cash flows from operating activities: | ||||||||||||||||||||||||||
Net income (loss) including noncontrolling interests | $ | 39 | $ | 2,775 | $ | (1,560 | ) | |||||||||||||||||||
Adjustments to reconcile net income (loss) including noncontrolling interests to net cash provided by operating activities: | ||||||||||||||||||||||||||
Net (loss) income including noncontrolling interests | $ | (36 | ) | $ | 39 | $ | 2,775 | |||||||||||||||||||
Adjustments to reconcile net (loss) income including noncontrolling interests to net cash provided by operating activities: | ||||||||||||||||||||||||||
Share-based compensation | 3 | 3 | 4 | 5 | 3 | 3 | ||||||||||||||||||||
Depreciation, amortization and cost of timber harvested | 220 | 493 | 602 | 233 | 220 | 493 | ||||||||||||||||||||
Closure costs, impairment and other related charges | 41 | 11 | 170 | 161 | 41 | 11 | ||||||||||||||||||||
Write-downs of inventory | 3 | – | 17 | 12 | 3 | – | ||||||||||||||||||||
Deferred income taxes | 19 | (1,600 | ) | (118 | ) | (35 | ) | 19 | (1,600) | |||||||||||||||||
Net pension contributions | (175 | ) | (36 | ) | (150 | ) | (95 | ) | (175 | ) | (36) | |||||||||||||||
Net gain on disposition of assets and other | (3 | ) | (30 | ) | (91 | ) | (35 | ) | (3 | ) | (30) | |||||||||||||||
Loss on translation of foreign currency denominated deferred income taxes | 25 | – | – | |||||||||||||||||||||||
(Gain) loss on translation of foreign currency denominated pension and other postretirement benefit obligations | (15 | ) | 18 | 29 | ||||||||||||||||||||||
(Gain) loss on translation of foreign currency denominated deferred income taxes | (37 | ) | 25 | – | ||||||||||||||||||||||
Loss (gain) on translation of foreign currency denominated pension and other postretirement benefit obligations | 30 | (15 | ) | 18 | ||||||||||||||||||||||
Premium related to debt redemptions | (16 | ) | – | – | (5 | ) | (16 | ) | – | |||||||||||||||||
Dividends received from equity method investees in excess of income | 9 | – | – | 2 | 9 | – | ||||||||||||||||||||
Leasehold improvement incentive received from lessor | 5 | – | – | |||||||||||||||||||||||
Amortization of debt discount (premium) and debt issuance costs, net | – | 14 | 57 | – | – | 14 | ||||||||||||||||||||
Loss on translation of foreign currency denominated debt | – | 116 | 62 | – | – | 116 | ||||||||||||||||||||
Non-cash interest expense | – | 217 | 230 | – | – | 217 | ||||||||||||||||||||
Non-cash reorganization items, net | – | (1,981 | ) | 535 | – | – | (1,981) | |||||||||||||||||||
Debtor in possession financing costs | – | 10 | 31 | – | – | 10 | ||||||||||||||||||||
Exit financing costs | – | 27 | – | – | – | 27 | ||||||||||||||||||||
Changes in working capital: | ||||||||||||||||||||||||||
Accounts receivable | 87 | (54 | ) | 159 | 91 | 87 | (54) | |||||||||||||||||||
Inventories | (39 | ) | (13 | ) | 101 | (21 | ) | (39 | ) | (13) | ||||||||||||||||
Other current assets | 31 | 4 | (29 | ) | 5 | 31 | 4 | |||||||||||||||||||
Accounts payable and accrued liabilities | (28 | ) | 98 | (1 | ) | (11 | ) | (28 | ) | 98 | ||||||||||||||||
Other, net | (3 | ) | (33 | ) | (2 | ) | (3 | ) | (3 | ) | (33) | |||||||||||||||
Net cash provided by operating activities | 198 | 39 | 46 | 266 | 198 | 39 | ||||||||||||||||||||
Cash flows from investing activities: | ||||||||||||||||||||||||||
Cash invested in fixed assets | (97 | ) | (81 | ) | (101 | ) | (169 | ) | (97 | ) | (81) | |||||||||||||||
Disposition of investment in ACH Limited Partnership (Note 16) | 296 | – | – | |||||||||||||||||||||||
Disposition of investment in Manicouagan Power Company (“MPCo”) (Note 16) | – | – | 554 | |||||||||||||||||||||||
Disposition of investment in ACH Limited Partnership (Note 7) | – | 296 | – | |||||||||||||||||||||||
Disposition of our interest in our Mersey operations, net of cash (Note 7) | 14 | – | – | |||||||||||||||||||||||
Disposition of other assets | 19 | 96 | 119 | 36 | 19 | 96 | ||||||||||||||||||||
Proceeds from holdback related to disposition of investment in MPCo (Note 16) | 29 | – | – | |||||||||||||||||||||||
Acquisition of Fibrek Inc., net of cash acquired (Note 3) | (24 | ) | – | – | ||||||||||||||||||||||
Proceeds from holdback related to disposition of investment in Manicouagan Power Company | – | 29 | – | |||||||||||||||||||||||
Proceeds from insurance settlements | 8 | – | – | – | 8 | – | ||||||||||||||||||||
(Increase) decrease in restricted cash | (2 | ) | 76 | (142 | ) | |||||||||||||||||||||
(Increase) decrease in deposit requirements for letters of credit, net | (8 | ) | (3 | ) | 49 | |||||||||||||||||||||
Decrease (increase) in restricted cash | 76 | (2 | ) | 76 | ||||||||||||||||||||||
Increase in deposit requirements for letters of credit, net | (12 | ) | (8 | ) | (3) | |||||||||||||||||||||
Release of pension trust assets | – | 8 | – | – | – | 8 | ||||||||||||||||||||
Cash received in monetization of derivative financial instruments | – | – | 5 | |||||||||||||||||||||||
Net cash provided by investing activities | 245 | 96 | 484 | |||||||||||||||||||||||
Other investing activities, net | 4 | – | – | |||||||||||||||||||||||
Net cash (used in) provided by investing activities | (75 | ) | 245 | 96 | ||||||||||||||||||||||
Cash flows from financing activities: | ||||||||||||||||||||||||||
Purchases of treasury stock | (67 | ) | – | – | ||||||||||||||||||||||
Dividends and distribution to noncontrolling interests | (21 | ) | – | (7 | ) | (5 | ) | (21 | ) | – | ||||||||||||||||
Acquisition of noncontrolling interest (Note 16) | (15 | ) | – | – | ||||||||||||||||||||||
Acquisition of noncontrolling interest (Note 3 and Note 17) | (27 | ) | (15 | ) | – | |||||||||||||||||||||
Issuance of long-term debt | – | 850 | – | – | – | 850 | ||||||||||||||||||||
Payments of long-term debt | (354 | ) | (334 | ) | (118 | ) | ||||||||||||||||||||
Payments of debt | (198 | ) | (354 | ) | (334) | |||||||||||||||||||||
Payments of financing and credit facility fees | (3 | ) | (46 | ) | (9 | ) | – | (3 | ) | (46) | ||||||||||||||||
Decrease in secured borrowings, net | – | (141 | ) | – | – | – | (141) | |||||||||||||||||||
Debtor in possession financing | – | – | 261 | |||||||||||||||||||||||
Debtor in possession financing costs | – | (10 | ) | (31 | ) | – | – | (10) | ||||||||||||||||||
Payments of debtor in possession financing | – | (206 | ) | (55 | ) | – | – | (206) | ||||||||||||||||||
Term loan repayments | – | (347 | ) | – | – | – | (347) | |||||||||||||||||||
Short-term financing, net | – | (338 | ) | (7 | ) | – | – | (338) | ||||||||||||||||||
Net cash (used in) provided by financing activities | (393 | ) | (572 | ) | 34 | |||||||||||||||||||||
Net increase (decrease) in cash and cash equivalents | 50 | (437 | ) | 564 | ||||||||||||||||||||||
Net cash used in financing activities | (297 | ) | (393 | ) | (572) | |||||||||||||||||||||
Net (decrease) increase in cash and cash equivalents | (106 | ) | 50 | (437) | ||||||||||||||||||||||
Cash and cash equivalents: | ||||||||||||||||||||||||||
Beginning of year | 319 | 756 | 192 | 369 | 319 | 756 | ||||||||||||||||||||
End of year (2011 and 2010: Successor; 2009: Predecessor) | $ | 369 | $ | 319 | $ | 756 | ||||||||||||||||||||
End of year (Successor) | $ | 263 | $ | 369 | $ | 319 | ||||||||||||||||||||
Supplemental disclosures of cash flow information: | ||||||||||||||||||||||||||
Cash paid (received) during the year for: | ||||||||||||||||||||||||||
Interest, including capitalized interest of $1, $0 and $1 in 2011, 2010 and 2009, respectively (Note 16) | $ | 105 | $ | 198 | $ | 276 | ||||||||||||||||||||
Interest, including capitalized interest of $2, $1 and $0 in 2012, 2011 and 2010, respectively | $ | 68 | $ | 105 | $ | 198 | ||||||||||||||||||||
Income taxes, net | $ | (6 | ) | $ | (3 | ) | $ | (3 | ) | $ | – | $ | (6 | ) | $ | (3) | ||||||||||
See accompanying notes to consolidated financial statements.
ABITIBIBOWATERRESOLUTE FOREST PRODUCTS INC.
Notes to Consolidated Financial Statements
Note 1. Organization and Basis of Presentation
Nature of operations
AbitibiBowaterResolute Forest Products Inc. (with its subsidiaries and affiliates, either individually or collectively, unless otherwise indicated, referred to as “AbitibiBowater,“Resolute Forest Products,” “we,” “our,” “us” or the “Company”) is incorporated in Delaware. We are a global leader in the forest products industry, with a diverse range of products, including newsprint, commercial printing papers, market pulp and wood products. We own or operateindustry; operating pulp and paper mills and wood products facilities in the United States, Canada and South Korea. Korea, and power generation assets in Quebec, Canada. We offer a diverse range of products, including newsprint, coated and specialty papers, market pulp and wood products.
On November 7, 2011, AbitibiBowater Inc.we began doing business as Resolute Forest Products. We expect atAt the 2012 annual meeting of shareholders on May 23, 2012, the shareholders approved an amendment to seek shareholder approval to amend our certificate of incorporation to change our legalcorporate name from AbitibiBowater Inc. to Resolute Forest Products Inc., effective May 24, 2012. The ticker symbol for our common stock was changed from “ABH” to “RFP” on the New York Stock Exchange on May 24, 2012 and on the Toronto Stock Exchange on May 28, 2012.
Financial statements
We have prepared our consolidated financial statements in accordance with United States generally accepted accounting principles (“U.S. GAAP”). All amounts are expressed in U.S. dollars, unless otherwise indicated. Certain prior year amounts in our consolidated financial statementsConsolidated Balance Sheets and the related notesNotes to Consolidated Financial Statements have been reclassified to conform to the 20112012 presentation. The reclassifications had no effect on net income.total assets.
Basis of presentation
Effective upon the commencement of the Creditor Protection Proceedings (as defined in Note 3,4, “Creditor Protection Proceedings”) on April 16 and 17,in 2009 and through the Convenience Date (as defined below), we applied the guidance in Financial Accounting Standards Board (“FASB”) Accounting Standards Codification (“ASC”) 852, “Reorganizations” (“FASB ASC 852”), in preparing our consolidated financial statements. The guidance in FASB ASC 852 does not change the manner in which financial statements are prepared. However, it requires that the financial statements distinguish transactions and events that are directly associated with the reorganization from the ongoing operations of the business. Accordingly, during the Creditor Protection Proceedings, we: (i) recorded certain expenses, charges and credits incurred or realized that were directly associated with or resulting from the reorganization and restructuring of the business in “Reorganization items, net” in our Consolidated Statements of Operations and (ii) ceased recording interest expense on certain of our pre-petition debt obligations. For additional information, see Note 3,4, “Creditor Protection Proceedings,” and Note 16, “Liquidity and17, “Long-Term Debt.”
As further discussed in Note 3,4, “Creditor Protection Proceedings,” on December 9, 2010, we emerged from the Creditor Protection Proceedings. In accordance with FASB ASC 852, fresh start accounting (“fresh start accounting”) was required upon our emergence from the Creditor Protection Proceedings, which we applied effective December 31, 2010 (the “Convenience Date”). As such, adjustments related to the application of fresh start accounting was reflected in our Consolidated Balance Sheet as of December 31, 2010 and fresh start accounting adjustments related thereto were included in our Consolidated Statements of Operations for the year ended December 31, 2010.
The implementation of the Plans of Reorganization (as defined in Note 3,4, “Creditor Protection Proceedings”) and the application of fresh start accounting materially changed the carrying amounts and classifications reported in our consolidated financial statements and resulted in the Company becoming a new entity for financial reporting purposes. Accordingly, our consolidated financial statements as of December 31, 2010 and for periods subsequent to December 31, 2010 are not comparable to our consolidated financial statements for periods prior to December 31, 2010. References to “Successor” or “Successor Company” refer to the Company on or after December 31, 2010, after giving effect to the implementation of the Plans of Reorganization and the application of fresh start accounting. References to “Predecessor” or “Predecessor Company” refer to the Company prior to December 31, 2010. Additionally, references to periods on or after December 31, 2010 refer to the Successor and references to periods prior to December 31, 2010 refer to the Predecessor.
Bridgewater Administration
On February 2, 2010, Bridgewater Paper Company Limited (“BPCL”), a subsidiary of AbitibiBowater Inc., filed for administration in the United Kingdom pursuant to the United Kingdom Insolvency Act 1986, as amended (the “BPCL Administration”). BPCL’s board of directors appointed Ernst & Young LLP as joint administrators for the BPCL Administration, whose responsibilities are to manage the affairs, business and assets of BPCL. In May 2010, the joint administrators announced the sale of the Bridgewater paper mill and all related machinery and equipment. As a result of the filing for administration, we lost control over and the ability to influence BPCL’s operations. As a result, effective as of the date
ABITIBIBOWATERRESOLUTE FOREST PRODUCTS INC.
Notes to Consolidated Financial Statements
of the BPCL Administration filing, the financial position, results of operations and cash flows of BPCL are no longer consolidated in our consolidated financial statements. We are now accounting for BPCL using the cost method of accounting. For additional information, see Note 3, “Creditor Protection Proceedings – Reorganization items, net.”
Consolidation
Our consolidated financial statements include the accounts of AbitibiBowaterResolute Forest Products Inc. and its controlled subsidiaries. All significant transactions and balances between these companies have been eliminated. All consolidated subsidiaries are wholly-owned as of December 31, 20112012 with the exception of the following:
| Consolidated Subsidiary | AbitibiBowater Ownership | Partner | Partner Ownership | Resolute Forest Products Ownership | Partner | Partner Ownership | ||||||||||||
Forest Products Mauricie L.P. | 93.2 | % | Cooperative Forestiere du Haut Saint-Maurice | 6.8 | % | 93.2% | Cooperative Forestiere du Haut Saint-Maurice | 6.8% | ||||||||||
Calhoun Newsprint Company (“CNC”) | 51 | % | Herald Company, Inc. | 49 | % | 51% | Herald Company, Inc. | 49% | ||||||||||
Bowater Mersey Paper Company Limited | 51 | % | The Daily Herald Company | 49 | % | |||||||||||||
Donohue Malbaie Inc. | 51 | % | NYT Capital Inc. | 49 | % | 51% | NYT Capital Inc. | 49% | ||||||||||
Equity method investments
We account for our investments in affiliated companies where we have significant influence, but not control over their operations, using the equity method of accounting.
Note 2. Summary of Significant Accounting Policies
Use of estimates
In preparing our consolidated financial statements in accordance with U.S. GAAP, management is required to make accounting estimates based on assumptions, judgments and projections of future results of operations and cash flows. These estimates and assumptions affect the reported amounts of revenues and expenses during the periods presented and the reported amounts of assets and liabilities and the disclosure of contingent assets and liabilities as of the date of the financial statements. The most critical estimates relate to the assumptions underlying the benefit obligations of our pension and other postretirement benefit (“OPEB”) benefit plans, the recoverability of deferred income tax assets and the carrying values of our long-lived assets. Estimates, assumptions and judgments are based on a number of factors, including historical experience, recent events, existing conditions, internal budgets and forecasts, projections obtained from industry research firms and other data that management believes are reasonable under the circumstances. Actual results could differ materially from those estimates under different assumptions or conditions.
Fresh start accounting
As discussed in Note 1, “Organization and Basis of Presentation – Basis of presentation,” we applied fresh start accounting as of the December 31, 2010 Convenience Date. Under fresh start accounting, the reorganization value, as derived from the enterprise value established in the Plans of Reorganization, was allocated to our assets and liabilities based on their fair values (except for deferred income taxes and pension and OPEB benefit obligations) in accordance with FASB ASC 805, “Business Combinations,” with the excess of net asset values over the reorganization value recorded as an adjustment to equity. The amount of deferred income taxes recorded was determined in accordance with FASB ASC 740, “Income Taxes” (“FASB ASC 740”). The amount of pension and OPEB benefit obligations recorded was determined in accordance with FASB ASC 715, “Compensation – Retirement Benefits.” Therefore, all assets and liabilities reflected in our Consolidated Balance Sheet as of December 31, 2010 were recorded at fair value or, for deferred income taxes and pension and OPEB benefit obligations, in accordance with the respective accounting policy described below. Except for the impact of the application of fresh start accounting on the carrying values of our assets and liabilities as of December 31, 2010, our assets and liabilities as of December 31, 2011 are accounted for based on the significant accounting policies described below.
Cash and cash equivalents
Cash and cash equivalents generally consist of direct obligations of the U.S. and Canadian governments and their agencies, demand deposits and other short-term, highly liquid securities with a maturity of three months or less from the date of purchase.
ABITIBIBOWATER INC.
Notes to Consolidated Financial Statements
Accounts receivable
Accounts receivable are recorded at cost, net of an allowance for doubtful accounts that is based on expected collectibility, and such carrying value approximates fair value.
Monetization of notes receivable
We monetized notes receivable using qualified special purpose entities (“QSPEs”) set up in accordance with FASB ASC 860, “Transfers and Servicing” (“FASB ASC 860”). The QSPEs that were established for note monetization purposes have not been consolidated within our financial statements. Our retained interest consists principally of the net excess cash flows (the difference between the interest received on the notes receivable and the interest paid on the debt issued by the QSPE to third parties) and a cash reserve account established at inception. Fair value of our retained interest was estimated based on the present value of future excess cash flows to be received over the life of the notes using management’s best estimate of key assumptions, including credit risk and discount rates. Our retained interest is included in “Other assets” in our Consolidated Balance Sheets. Excess cash flows revert to us on a quarterly or semi-annual basis. The balance of the cash reserve accounts, if any, reverts to us at the maturity date of the QSPE third-party debt.
Inventories
Inventories are stated at the lower of cost or market value using the average cost method. Cost includes labor, materials and production overhead, which is based on the normal capacity of our production facilities. Unallocated overhead, including production overhead associated with abnormal production levels, is recognized in “Cost of sales, excluding depreciation, amortization and cost of timber harvested” in our Consolidated Statements of Operations when incurred.
Assets held for sale and liabilities associated with assets held for sale
Assets held for sale, net of liabilities associated with assets held for sale are carried in our Consolidated Balance Sheets at the lower of carrying value or fair value less costs to sell. We cease recording depreciation and amortization when assets are classified as held for sale.
RESOLUTE FOREST PRODUCTS INC.
Notes to Consolidated Financial Statements
Fixed assets, including timber and timberlands
Fixed assets acquired by the Predecessor Company are stated at their December 31, 2010 carrying values less accumulated depreciation for the current year. Fixed assets acquired by the Successor Company are stated at acquisition cost less accumulated depreciation.depreciation and impairment. The cost of the fixed assets is reduced by any investment tax credits or government capital grants received. Depreciation is provided on a straight-line basis over the estimated useful lives of the assets. Repair and maintenance costs, including those associated with planned major maintenance, are expensed as incurred. We capitalize interest on borrowings during the construction period of major capital projects as part of the related asset and amortize the capitalized interest into earnings over the related asset’s remaining useful life. We also capitalize costs related to the acquisition of timber and timberlands and subsequent costs incurred for the planting and growing of timber. The cost generally includes the acquisition cost of land and timber, site preparation and other costs. These costs, excluding land, are expensed at the time the timber is harvested, based on annually determined depletion rates, and are included in “Depreciation, amortization and cost of timber harvested” in our Consolidated Statements of Operations. Growth and yield models are used to estimate timber volume on our land from year to year. These volumes affect the depletion rates, which are calculated annually based on the capitalized costs and the total timber volume based on the current stage of the growth cycle.
Asset retirement obligations
We record an asset and a liability equal to the fair value of the estimated costs associated with the retirement of long-lived assets where a legal or contractual obligation exists; life of the long-lived asset is determinable; and a reasonable estimate of fair value can be made, even if the timing and/or settlement of the obligation is conditional on a future event that may or may not be within our control. Fair value is established using the discounted cash flow method. The liability is accreted to recognize the passage of time using a credit adjusted risk-free interest rate, and the asset is depreciated over the life of the related equipment or facility. The asset and liability are subsequently adjusted for changes in the amount or timing of the estimated costs.
ABITIBIBOWATER INC.
Notes to Consolidated Financial Statements
Environmental costs
We expense environmental costs related to existing conditions resulting from past or current operations and from which no current or future benefit is discernible. These costs are included in “Cost of sales, excluding depreciation, amortization and cost of timber harvested” in our Consolidated Statements of Operations. Expenditures that extend the life of the related property are capitalized. We determine our liability on a site-by-site basis and record a liability at the time it is probable and can be reasonably estimated. Such accruals are adjusted as further information develops or circumstances change. Costs of future expenditures for environmental remediation obligations are discounted to their present value when the amount and timing of expected cash payments are reliably determinable.
Amortizable intangible assets
Amortizable intangible assets are stated at their December 31, 2010 carrying valuecost less accumulated amortization. Amortization of the water rights is provided on a straight-line basis over the estimated useful lifelives of the assets. Intangible assets are grouped with the related long-lived assets when tested for impairment, as described below.
Impairment of long-lived assets
The unit of accounting for impairment testing for long-lived assets is its group, which includes fixed assets, amortizable intangible assets and liabilities directly related to those assets, such as asset retirement obligations (herein defined as “asset group”). For asset groups that are held and used, that group represents the lowest level for which identifiable cash flows are largely independent of the cash flows of other asset groups. For asset groups that are to be disposed of by sale or otherwise, that group represents assets to be disposed of together as a group in a single transaction and liabilities directly associated with those assets that will be transferred in the transaction.
Long-lived assets are reviewed for impairment when events or changes in circumstances indicate that the carrying value of an asset group may no longer be recoverable. The recoverability of an asset group that is held and used is tested by comparing the carrying value of the asset group to the sum of the estimated undiscounted future cash flows expected to be generated by that asset group. In estimating the undiscounted future cash flows, we use projections of cash flows directly associated with, and which are expected to arise as a direct result of, the use and eventual disposition of the asset group. If there are multiple plausible scenarios for the use and eventual disposition of an asset group, we assess the likelihood of each scenario occurring in order to determine a probability-weighted estimate of the undiscounted future cash flows. The principal assumptions include periods of operation, projections of product pricing, production levels and sales volumes, product costs, market supply and demand, foreign exchange rates, inflation and
RESOLUTE FOREST PRODUCTS INC.
Notes to Consolidated Financial Statements
projected capital spending. Changes in any of these assumptions could have a material effect on the estimated undiscounted future cash flows expected to be generated by the asset group. If it is determined that an asset group is not recoverable, an impairment loss is recognized in the amount that the asset group’s carrying value exceeds its fair value. The fair value of a long-lived asset group is determined in accordance with our accounting policy for fair value measurements, as discussed below. If it is determined that the carrying value of an asset group is recoverable, we review and adjust, as necessary, the estimated useful lives of the assets in the group.
When an asset group meets the criteria for classification as an asset held for sale, an impairment charge is recognized, if necessary, based on the excess of the asset group’s carrying value over the expected net proceeds from the sale (the estimated fair value minus the estimated costs to sell).
Asset groups to be disposed of other than by sale are classified as held and used until the asset group is disposed or use of the asset group has ceased.
Income taxes
DeferredWe use the asset and liability approach in accounting for income taxes. Under this approach, deferred income tax assets and liabilities are recognized for the expected future tax consequences attributable to differences between the financial statement carrying amounts of existing assets and liabilities and their respective tax bases, andbases. This approach also requires the recording of deferred tax assets related to operating loss and tax credit carryforwards. Deferred income tax assets and liabilities are measured using enacted tax rates applicable when temporary differences and carryforwards are expected to be recovered or settled. We have not provided for U.S. income taxes on the undistributed earnings, if any, of our foreign subsidiaries, as we have specific plans for the reinvestment of such earnings.
Valuation allowances are recognized to reduce deferred income tax assets to the amount that is more likely than not to be realized. In assessing the likelihood of realization, we consider all available positive and negative evidence, including future reversals of existing taxable temporary differences, estimates of future taxable income, past operating results, and prudent and feasible tax planning strategies. We have
Tax benefits related to uncertain tax positions are recorded when it is more likely than not, provided for U.S. income taxesbased on technical merits, that the undistributed earningsposition will be sustained upon examination by the relevant taxing authorities. The amount of certain of our foreign subsidiaries, as we have specific plans fortax benefit recognized may differ from the reinvestment of such earnings.amount taken or expected to be taken on a tax return. These differences represent unrecognized tax benefits and are reviewed at each reporting period based on facts, circumstances and available evidence. We recognize interest and penalties accrued related to unrecognized tax benefits as componentsa component of the income tax expense.
ABITIBIBOWATER INC.
Notes to Consolidated Financial Statements
Pension and OPEB benefit obligations
For our defined benefit plans, we recognize an asset or a liability for pension and OPEB benefit obligations net of the fair value of plan assets. An asset is recognized for a plan’s over-funded status and a liability is recognized for a plan’s under-funded status. Changes in the funding status that have not been recognized in our net periodic benefit costs are reflected as an adjustment to our “Accumulated other comprehensive loss” in our Consolidated Balance Sheets. Net periodic benefit costs are recognized as employees render the services necessary to earn the pension and OPEB benefits. Amounts we contribute to our defined contribution plans are expensed as incurred.
Fair value measurements
Fair value is defined as the price that would be received to sell an asset or paid to transfer a liability (an exit price) in an orderly transaction between market participants at the measurement date, and is based on ourany principal or most advantageous market for the specific asset or liability. We consider the risk of non-performance of the obligor, which in some cases reflects our own credit risk, in determining fair value. In accordance with FASB ASC 820, “Fair Value Measurements and Disclosures,” we categorize assets and liabilities measured at fair value into one of three different levels depending on the observability of the inputs employed in the measurement. This fair value hierarchy is as follows:
Level 1 – Valuations based on quoted prices in active markets for identical assets and liabilities.
Level 2 – Valuations based on observable inputs, other than Level 1 prices, such as quoted interest or currency exchange rates.
Level 3 –
| Level 1 - | Valuations based on quoted prices in active markets for identical assets and liabilities. | |
| Level 2 - | Valuations based on observable inputs, other than Level 1 prices, such as quoted interest or currency exchange rates. | |
| Level 3 - | Valuations based on significant unobservable inputs that are supported by little or no market activity, such as discounted cash flow methodologies based on internal cash flow forecasts. | |
RESOLUTE FOREST PRODUCTS INC.
Notes to Consolidated Financial Statements
The asset’s or liability’s fair value measurement level within the fair value hierarchy is based on the lowest level of any input that is significant to the fair value measurement. Valuation techniques used in the determination of fair value of our assets and liabilities, when required, maximize the use of observable inputs and minimize the use of unobservable inputs.
Share-based compensation
We amortize the fair value of our stock incentive awards over the requisite service period using the straight-line attribution approach. The requisite service period is reduced for those employees who are retirement eligible at the date of the grant or who will become retirement eligible during the vesting period and who will be entitled to continue vesting in their entire award upon retirement. The fair value of stock options is determined using a Black-Scholes option pricing formula, and the fair value of restricted stock units (“RSUs”) and deferred stock units (“DSUs”) is determined based on the market price of a share of AbitibiBowater Inc.our common stock on the grant date. We estimate forfeitures of stock incentive awards based on historical experience and recognize compensation cost only for those awards expected to vest. Estimated forfeitures are updated to reflect new information or actual experience, as it becomes available.
The additional paid-in capital (“APIC”) pool represents the excess tax benefits related to share-based compensation that are available to absorb future tax deficiencies. If the amount of future tax deficiencies is greater than the available APIC pool, we would record the excess as income tax expense in our Consolidated Statements of Operations. For both the years ended December 31, 2012 and 2011, the balance of the APIC pool was zero. For the year ended December 31, 2011, the APIC pool was not sufficient to cover the nominal amount of tax deficiencies recorded. For the years ended December 31, 2010, and 2009, we had a sufficient APIC pool to cover any tax deficiencies recorded; as a result, these deficiencies did not affect our results of operations. The APIC pool was reset to zero as of December 31, 2010 as a result of the application of fresh start accounting.
We classify the cash flows resulting from the tax benefit that arise from the exercise of stock options and the vesting of RSUs and DSUs that exceed the compensation cost recognized (excess tax benefits) as financing cash flows.
Revenue recognition
Pulp, paper and wood products are delivered to our customers in the United States and Canada directly from our mills by either truck or rail are sold with the terms free on board (“FOB”) shipping point. For these sales, revenue is recorded when the product leaves the mill.rail. Pulp and paper products delivered to our international customers by ship are sold with international shipping terms. For these sales, revenueRevenue is recorded when risk of loss and title of the product passes to the customer. For sales with the terms free on board (“FOB”) shipping point, revenue is recorded when the product leaves the mill, whereas for sales transactions FOB destination, revenue is recorded when the product is delivered to the customer’s delivery site, when the title and risk of loss are transferred. Sales are reported net of allowances and rebates, and the following criteria must be met before they are recognized: persuasive evidence of an arrangement exists, delivery has occurred and we have no remaining obligations, prices are fixed or determinable and collectibility is reasonably assured.
ABITIBIBOWATER INC.
Notes to Consolidated Financial Statements
IncomeNet (loss) income per share
We calculate basic net (loss) income (loss) per share attributable to AbitibiBowaterResolute Forest Products Inc. common shareholders by dividing our net (loss) income (loss) by the weighted-average number of outstanding common shares, including outstanding exchangeable shares of the Predecessor Company in 2009 and 2010. We calculate diluted net income (loss) per share attributable to AbitibiBowaterResolute Forest Products Inc. common shareholders by dividing our net income, (loss), as adjusted in 2009 and 2010 for the assumed conversion of the pre-petition convertible notes, by the weighted-average number of outstanding common shares, including outstanding exchangeable shares of the Predecessor Company in 2009 and 2010, as adjusted for the incremental shares attributable to the dilutive effects of potentially dilutive securities (such as the pre-petition convertible notes, stock options, RSUs and DSUs). The incremental shares are calculated using the “if converted” method (pre-petition convertible notes) or the treasury stock method (stock options, RSUs and DSUs). To calculate diluted net loss per share attributable to Resolute Forest Products Inc. common shareholders, no adjustments to our basic weighted-average number of outstanding common shares are made, since the impact of potentially dilutive securities (such as stock options, RSUs and DSUs) would be antidilutive.
Translation
The functional currency of the majority of our operations is the U.S. dollar. However, some of these operations maintain their books and records in their local currency in accordance with certain statutory requirements. Non-monetary assets and liabilities of these operations and the related income and expense items such as depreciation and amortization are remeasured into U.S. dollars using historical exchange rates. Remaining assets and liabilities are remeasured into U.S. dollars using the exchange rates as of the balance sheet date. Remaining income and expense items are remeasured into U.S. dollars using an average exchange rate for the period. Gains and losses from foreign currency transactions and from remeasurement of the balance sheet are reported as “Other expense,income (expense), net” in our Consolidated Statements of Operations.
RESOLUTE FOREST PRODUCTS INC.
Notes to Consolidated Financial Statements
The functional currency of all other operations is their local currency. Assets and liabilities of these operations are translated into U.S. dollars at the exchange rates in effect as of the balance sheet dates. Income and expense items are translated at average daily or monthly exchange rates for the period. The resulting translation gains or losses are recognized as a component of equity in “Accumulated other comprehensive loss.”
Distribution costs
Shipping and handling costs represent costs associated with shipping products to customers and handling finished goods. Such costs are included in “Distribution costs” in our Consolidated Statements of Operations.
Creditor Protection Proceedings
As discussed in Note 1, “Organization and Basis of Presentation – Basis of presentation,” duringeffective upon the commencement of the Creditor Protection Proceedings and through the Convenience Date, we applied the guidance in FASB ASC 852, which requires that financial statements distinguish transactions and events that are directly associated with the reorganization process from the ongoing operations of the business.852.
Reorganization items, net
FASB ASC 852 requires separate disclosure of reorganization items such as certain expenses, provisions for losses and other charges and credits directly associated with or resulting from the reorganization and restructuring of the business that were realized or incurred during the Creditor Protection Proceedings, including the impact of the implementation of the Plans of Reorganization and the application of fresh start accounting. As a result, during the Creditor Protection Proceedings, all charges related to the commencement of an indefinite idling or permanent closure of a mill or a paper machine subsequent to the commencement of the Creditor Protection Proceedings were recorded in “Reorganization items, net,” whereas all charges related to the commencement of an indefinite idling or permanent closure of a mill or a paper machine prior to the commencement of the Creditor Protection Proceedings were recorded in “Closure costs, impairment and other related charges,” both in our Consolidated Statements of Operations. The recognition of Reorganization items, net, unless specifically prescribed otherwise by FASB ASC 852, was in accordance with other applicable U.S. GAAP, including accounting for impairments of long-lived assets, accelerated depreciation, severance and termination benefits and costs associated with exit and disposal activities (including costs incurred in a restructuring).
ABITIBIBOWATER INC.
Notes to Consolidated Financial Statements
Interest expense
During the Creditor Protection Proceedings, we recorded interest expense on our pre-petition debt obligations only to the extent that: (i) interest would be paid during the Creditor Protection Proceedings or (ii) it was probable that interest would be an allowed priority, secured, or unsecured claim.
Fresh start accounting
As discussed in Note 1, “Organization and Basis of Presentation – Basis of presentation,” we applied fresh start accounting as of the December 31, 2010 Convenience Date. Under fresh start accounting, the reorganization value, as derived from the enterprise value established in the Plans of Reorganization, was allocated to our assets and liabilities based on their fair values (except for deferred income taxes and pension and OPEB benefit obligations, which were determined in accordance with other applicable U.S. GAAP) in accordance with FASB ASC 805, “Business Combinations” (“FASB ASC 805”), with the excess of net asset values over the reorganization value recorded as an adjustment to equity.
RESOLUTE FOREST PRODUCTS INC.
Notes to Consolidated Financial Statements
Note 3. Acquisition of Fibrek Inc.
Overview
On December 15, 2011, we announced an offer to purchase all of the issued and outstanding shares of Fibrek Inc. (“Fibrek”), a producer and marketer of virgin and recycled kraft pulp, operating three mills. On May 2, 2012, we acquired a controlling interest in Fibrek and began consolidating the results of operations, financial position and cash flows of Fibrek in our consolidated financial statements.
The acquisition of Fibrek grew our overall market pulp segment and our virgin kraft pulp capacity in particular, providing a better overall balance to our product offering. We believe that the integration of Fibrek’s Saint-Félicien, Quebec mill will result in certain operational synergies as it now operates as an integrated facility, with chips supplied from our regional sawmills.
Our acquisition of Fibrek was achieved in stages. In connection with the offer, between April 11, 2012 and April 25, 2012, we acquired approximately 48.8% of the then outstanding Fibrek shares. On May 2, 2012, we acquired additional shares of Fibrek, after which we owned a controlling interest in Fibrek (approximately 50.1% of the then outstanding Fibrek shares) and Fibrek became a consolidated subsidiary. After May 2, 2012, we acquired additional shares of Fibrek and, as of May 17, 2012, the offer expiry date, we owned approximately 74.6% of the then outstanding Fibrek shares. On July 31, 2012, we completed the second step transaction for the remaining 25.4% of the outstanding Fibrek shares.
As aggregate consideration for all of the Fibrek shares we purchased, we distributed approximately 3.3 million shares of our common stock and Cdn$63 million ($63 million, based on the exchange rates in effect on each of the dates we acquired the shares of Fibrek) in cash. In connection with the Fibrek shareholder vote on the arrangement, certain former shareholders of Fibrek exercised (or purported to exercise) rights of dissent in respect of the transaction, asking for a judicial determination of the fair value of their claim under the Canada Business Corporations Act. No consideration has to date been paid to the former Fibrek shareholders who exercised (or purported to exercise) rights of dissent. Any such consideration will only be paid out upon settlement or judicial determination of the fair value of their claims and will be paid entirely in cash. Accordingly, we cannot presently determine the amount that ultimately will be paid to former holders of Fibrek shares in connection with the proceedings, but we have reserved approximately Cdn$14 million ($14 million, based on the exchange rate in effect on December 31, 2012) for the eventual payment of those claims, which was recorded in “Other long-term liabilities” in our Consolidated Balance Sheet as of December 31, 2012.
Initial investment
As noted above, we held an equity interest in Fibrek before we obtained control of Fibrek on May 2, 2012 (the “acquisition date”). We accounted for our initial equity investment in Fibrek as an available for sale investment since we had no ability to exert significant influence over Fibrek at any time prior to acquiring a controlling interest on May 2, 2012.
Acquisition of controlling interest
The acquisition of a controlling interest in Fibrek on May 2, 2012 was accounted for as a business combination in accordance with the acquisition method of accounting pursuant to FASB ASC 805, which requires recording identifiable assets acquired and liabilities assumed at fair value (except for deferred income taxes and pension and OPEB plan obligations). Additionally, on the acquisition date, we remeasured our initial equity investment in Fibrek at the acquisition-date fair value. The acquisition-date fair value of our previously-held equity interest in Fibrek was $58 million, resulting in a loss of $1 million, which was recorded in “Other income (expense), net” in our Consolidated Statements of Operations for the year ended December 31, 2012.
In connection with the acquisition, we also assumed $121 million of Fibrek’s outstanding indebtedness. For additional information, see Note 17, “Long-Term Debt.”
RESOLUTE FOREST PRODUCTS INC.
Notes to Consolidated Financial Statements
The following summarizes the fair value as of the acquisition date of all of the consideration transferred through May 2, 2012 to acquire our controlling interest in Fibrek:
| (In millions) | ||||
Cash | $ | 36 | ||
Common stock issued (1.9 million shares) | 24 | |||
| $ | 60 | |||
The acquisition-date fair value of our common stock issued as part of the consideration transferred for Fibrek was determined based on the closing market price of our common stock on the acquisition date.
The total purchase price was allocated to the identifiable assets acquired and liabilities assumed based on our estimates of their fair values on the acquisition date.
The following summarizes our allocation of the purchase price to the fair value of assets acquired and liabilities assumed:
| (In millions) | ||||
Cash and cash equivalents | $ | 12 | ||
Accounts receivable | 60 | |||
Inventories | 63 | |||
Other current assets | 2 | |||
Current assets acquired | 137 | |||
Fixed assets | 161 | |||
Amortizable intangible assets | 52 | |||
Other assets | 1 | |||
Total assets acquired | $ | 351 | ||
Accounts payable and accrued liabilities | $ | 70 | ||
Short-term bank debt | 36 | |||
Current portion of long-term debt | 2 | |||
Current liabilities assumed | 108 | |||
Long-term debt, net of current portion | 83 | |||
Pension and other postretirement benefit obligations | 39 | |||
Other long-term liabilities | 1 | |||
Total liabilities assumed | $ | 231 | ||
Net assets acquired | 120 | |||
Fair value of consideration transferred, including our previously-held interest of $58 million | 60 | |||
Fair value of noncontrolling interest | 60 | |||
| $ | 120 | |||
The fair value of the consideration transferred plus the fair value of the noncontrolling interest approximated the fair value of the net assets acquired. Therefore, no goodwill or gain was recognized at the acquisition date. The acquisition-date fair value of the noncontrolling interest in Fibrek was determined based on the market price we paid for Fibrek’s common stock on the acquisition date.
We identified amortizable intangible assets related to energy contracts, which have a weighted-average amortization period of approximately 23 years. The fair value of the amortizable intangible assets was determined based on the discounted cash flow method.
Fibrek’s results of operations have been included in our consolidated financial statements beginning on the acquisition date and are included in the market pulp segment. The amount of Fibrek’s sales and net loss included in our Consolidated Statements of Operations were $268 million and $13 million, respectively, for the year ended December 31, 2012. Additionally, “Selling, general and administrative expenses” in our Consolidated Statements of Operations for the year ended December 31, 2012 included $8 million of transaction costs associated with the acquisition of our controlling interest in Fibrek.
RESOLUTE FOREST PRODUCTS INC.
Notes to Consolidated Financial Statements
The following unaudited pro forma information for the years ended December 31, 2012 and 2011 represents our results of operations as if the acquisition of Fibrek had occurred on January 1, 2011. This pro forma information does not purport to be indicative of the results that would have occurred for the periods presented or that may be expected in the future.
| (Unaudited, in millions except per share data) | 2012 | 2011 | ||||||
Sales | $ | 4,669 | $ | 5,300 | ||||
Net (loss) income attributable to Resolute Forest Products Inc. | (5) | 47 | ||||||
Basic net (loss) income per share attributable to Resolute Forest Products Inc. | (0.05) | 0.47 | ||||||
Diluted net (loss) income per share attributable to Resolute Forest Products Inc. | (0.05) | 0.47 | ||||||
The unaudited pro forma net (loss) income attributable to Resolute Forest Products Inc. for the years ended December 31, 2012 and 2011 excludes $19 million and $7 million, respectively, of both our and Fibrek’s transaction costs associated with the acquisition.
Acquisition of noncontrolling interest
Subsequent to the May 2, 2012 acquisition date, we acquired the remaining noncontrolling interest in Fibrek, which we accounted for as equity transactions whereby we adjusted the carrying amount of the noncontrolling interest in Fibrek to reflect the change in our ownership interest in Fibrek. As consideration for this additional equity interest in Fibrek, we distributed approximately 1.4 million shares of our common stock and Cdn$27 million ($27 million, based on the exchange rates in effect on each of the dates we acquired the shares of Fibrek) in cash. Transaction costs of approximately $1 million associated with the acquisition of the noncontrolling interest in Fibrek were recorded in “Additional paid-in capital” in our Consolidated Balance Sheet as of December 31, 2012.
Note 3.4. Creditor Protection Proceedings
Emergence from Creditor Protection Proceedings
AbitibiBowater Inc.We and all but one of itsour debtor affiliates (as discussed below) successfully emerged from creditor protection proceedings under Chapter 11 of the United States Bankruptcy Code, as amended (“Chapter 11”) and theCompanies’ Creditors Arrangement Act (Canada) (the “CCAA”), as applicable (collectively, the “Creditor Protection Proceedings”) on December 9, 2010 (the “Emergence Date”). The following is a brief history of the Creditor Protection Proceedings.
On April 16, 2009 and December 21, 2009, AbitibiBowater Inc.We and certain of itsour U.S. and Canadian subsidiaries filed voluntary petitions (collectively, the “Chapter 11 Cases”(the “Debtors”) in the United States Bankruptcy Court for the District of Delaware (the “U.S. Court”) for relief under the provisions of Chapter 11. In addition, on April 17, 2009, certain of AbitibiBowater Inc.’s Canadian subsidiaries sought creditor protection (the “CCAA Proceedings”) under the CCAA with the Superior Court of Quebec in Canada (the “Canadian Court”). On April 17, 2009, certain of AbitibiBowater Inc.’s Canadian subsidiaries filed voluntary petitions for provisional and final relief (the “Chapter 15 Cases”) in the U.S. Court under the provisions of Chapter 15 of the United States Bankruptcy Code, as amended, to obtain recognition and enforcement in the United States of certain relief granted in the CCAA Proceedings and also on that date, AbitibiBowater Inc. and certain of its subsidiaries in the Chapter 11 Cases obtained orders under Section 18.6 of the CCAA in respect thereof (the “18.6 Proceedings”). The Chapter 11 Cases, the Chapter 15 Cases, the CCAA Proceedings and the 18.6 Proceedings are collectively referred to as the “Creditor Protection Proceedings.” The entities that were subject toentered into the Creditor Protection Proceedings are referred to herein as the “Debtors.” The U.S. Court and the Canadian Court are collectively referred to as the “Courts.”in April 2009. Our wholly-owned subsidiary that operates our Mokpo, South Korea operations and almost all of our less than wholly-owned subsidiaries operated outside of the Creditor Protection Proceedings.
In the third quarter of 2010, the creditors under the Creditor Protection Proceedings, with one exception, voted in the requisite numbers to approve the respective Plan of Reorganization (as defined below). Creditors of Bowater Canada Finance Corporation (“BCFC”), an indirect, wholly-owned subsidiary of ours, did not vote in the requisite numbers to approve the Plans of Reorganization (as defined below). Accordingly, we did not seek sanction of theCCAA Plan of Reorganization and Compromise (the “CCAA Reorganization Plan”) or confirmation of theDebtors’ Second Amended Joint Plan of Reorganization under Chapter 11 of the Bankruptcy Code (the “Chapter 11 Reorganization Plan” and, together with the CCAA Reorganization Plan, the “Plans of Reorganization” and each, a “Plan of Reorganization”) with respect to BCFC. See Note 20, “Commitments and Contingencies, – BCFC Bankruptcy and Insolvency Act filing,” for information regarding BCFC’s Bankruptcy and Insolvency Act filing on December 31, 2010 and our deconsolidation of BCFC as of December 31, 2010. The Plans of Reorganization became effective on the Emergence Date.
Upon implementation of the Plans of Reorganization, the Debtors were reorganized through the consummation of several transactions pursuant to which, among other things:
each of the Debtors’ operations were continued in substantially the same form;
| — | each of the Debtors’ operations were continued in substantially the same form; |
all allowed pre-petition and post-petition secured claims, administrative expense claims and priority claims were paid in full in cash, including accrued interest, if applicable, and all pre-petition and post-petition secured credit facilities were terminated;
| — | all allowed pre-petition and post-petition secured claims, administrative expense claims and priority claims were paid in full in cash, including accrued interest, if applicable, and all pre-petition and post-petition secured credit facilities were terminated; |
all outstanding receivable interests sold under our accounts receivable securitization program were repurchased in cash for a price equal to the par amount thereof and the program was terminated;
| — | all outstanding receivable interests sold under our accounts receivable securitization program were repurchased in cash for a price equal to the par amount thereof and the program was terminated; |
holders of allowed claims arising from the Debtors’ pre-petition unsecured indebtedness received their pro rata share of common stock issued by us on account of their claims;
holders of pre-petition unsecured claims with individual claim amounts of $5,000 or less (or reduced to that amount) were paid in cash in an amount equal to 50% of their claim amount, but under certain circumstances, these claim holders were treated instead like all other holders of claims arising from pre-petition unsecured liabilities and received shares of common stock issued by us on account of their claims;
| — | holders of allowed claims arising from the Debtors’ pre-petition unsecured indebtedness received their pro rata share of common stock issued by us on account of their claims; |
ABITIBIBOWATERRESOLUTE FOREST PRODUCTS INC.
Notes to Consolidated Financial Statements
all equity interests in the Predecessor Company existing immediately prior to the Emergence Date, including, among other things, all of our common stock issued and outstanding, were discharged, canceled, released and extinguished;
| — | holders of pre-petition unsecured claims with individual claim amounts of $5,000 or less (or reduced to that amount) were paid in cash in an amount equal to 50% of their claim amount, but under certain circumstances, these claim holders were treated instead like all other holders of claims arising from pre-petition unsecured liabilities and received shares of common stock issued by us on account of their claims; |
AbitibiBowater Inc. issued an aggregate of 97,134,954 shares of Successor Company common stock, par value $0.001 per share, for the benefit of unsecured creditors of the Debtors in the Creditor Protection Proceedings, and distributed 73,752,881 of those shares in December 2010 to the holders of unsecured claims as of the applicable distribution record date on account of allowed unsecured creditor claims;
| — | all equity interests in the Predecessor Company existing immediately prior to the Emergence Date, including, among other things, all of our common stock issued and outstanding, were discharged, canceled, released and extinguished; |
various equity incentive and other employee benefit plans came into effect, including the AbitibiBowater Inc. 2010 Equity Incentive Plan, pursuant to which 8.5% of common stock on a fully diluted basis (or 9,020,960 shares) was reserved for issuance to eligible persons, of which awards representing not more than 4% (or 4,245,158 shares) were to be made approximately 30 days after the Emergence Date;
| — | we issued an aggregate of 97,134,954 shares of Successor Company common stock, par value $0.001 per share, for the benefit of unsecured creditors of the Debtors in the Creditor Protection Proceedings, and distributed 73,752,881 of those shares in December 2010 to the holders of unsecured claims as of the applicable distribution record date on account of allowed unsecured creditor claims; |
the Debtors’ obligations to fund the prior service costs related to their pension and OPEB benefit plans were reinstated prospectively;
| — | various equity incentive and other employee benefit plans came into effect, including the AbitibiBowater Inc. 2010 Equity Incentive Plan, which has been renamed the Resolute Forest Products Equity Incentive Plan (the “2010 LTIP”), pursuant to which 8.5% of common stock on a fully diluted basis (or 9,020,960 shares) was reserved for issuance to eligible persons, of which awards representing not more than 4% (or 4,245,158 shares) were to be made approximately 30 days after the Emergence Date; |
the Debtors’ assets were retained by, and were reinvested in, the Successor Company;
| — | the Debtors’ obligations to fund the prior service costs related to their pension and OPEB benefit plans were reinstated prospectively; |
AbitibiBowater Inc. assumed by merger the obligations of ABI Escrow Corporation with respect to $850 million in aggregate principal amount of 10.25% senior secured notes due 2018, as further discussed in Note 16, “Liquidity and Debt”; and
| — | the Debtors’ assets were retained by, and were reinvested in, the Successor Company; |
| — | we assumed by merger the obligations of ABI Escrow Corporation with respect to $850 million in aggregate principal amount of 10.25% senior secured notes due 2018, as further discussed in Note 17, “Long-Term Debt”; and |
we entered into the ABL Credit Facility, as defined and further discussed in Note 16, “Liquidity and Debt.”
| — | we entered into the ABL Credit Facility, as defined and further discussed in Note 17, “Long-Term Debt.” |
From the 97,134,954 shares of Successor Company common stock issued for claims in the Creditor Protection Proceedings, we established a reserve of 23,382,073 shares for claims that remained in dispute as of the Emergence Date, from which we have made and will make supplemental interim distributions to unsecured creditors as disputed claims are resolved. As of December 31, 2011,2012, there were 19,719,5654,017,147 shares remaining in this reserve. The remaining claims are claims that we believe should be disallowed because they are duplicative, without merit, overstated or should be disallowed for other reasons. We have made significant progress in addressing the claims that remained in dispute at the time of our emergence from the substantial number and amount of claims filed during the Creditor Protection Proceedings. The majority of the remaining disputed claims will be disposed through ongoing litigation before the U.S.United States Bankruptcy Court for the District of Delaware (the “U.S. Court”) or a claims officer appointed by the Canadian Court.Superior Court of Quebec (the “Canadian Court” and, together with the U.S. Court, the “Courts”). The ultimate completion of the claims resolution process could therefore take some time to complete. We may be required to settle certain disputed claims in cash under certain specific circumstances. As such, included in “Accounts payable and accrued liabilities” in our Consolidated Balance Sheets as of December 31, 20112012 and 20102011 is a liability of $11$4 million and $35$11 million, respectively, for the estimated cash settlement of such claims. To the extent there are shares remaining after all disputed claims have been resolved, these shares will be reallocated ratably among unsecured creditors with allowed claims in the Creditor Protection Proceedings pursuant to the Plans of Reorganization.
The common stock of the Successor Company began trading under the symbol “ABH” on both the New York Stock Exchange (the “NYSE”) and the Toronto Stock Exchange (the “TSX”) on December 10, 2010. See Note 21, “Share Capital,” for additional information.
Events prior to emergence from Creditor Protection Proceedings
During the Creditor Protection Proceedings, we remained in possession of our assets and properties and operated our business and managed our properties as “debtors in possession” under the jurisdiction of the Courts and in accordance with the applicable provisions of Chapter 11 and the CCAA. In general, the Debtors were authorized to operate as ongoing businesses, but could not engage in transactions outside the ordinary course of business without the approval of the applicable Court(s) or Ernst & Young Inc. (which, under the terms of a Canadian Court order, served as the court-appointed monitor under the CCAA Proceedingsproceedings (the “Monitor”)), as applicable.
Subject to certain exceptions under Chapter 11 and the CCAA, our filings and orders of the Canadian Court automatically enjoined, or stayed, the continuation of any judicial or administrative proceedings or other actions against us and our property to recover, collect or secure a claim arising prior to the filing of the Creditor Protection Proceedings. Chapter 11 and orders of the Canadian Court gave us the ability to reject certain contracts, subject to Court oversight. We engaged in a review of our various agreements and rejected and repudiated a number of unfavorable agreements and leases, including leases of real estate and equipment. The creditors affected by these actions were given the opportunity to file proofs of claims in the Creditor Protection Proceedings.
ABITIBIBOWATERRESOLUTE FOREST PRODUCTS INC.
Notes to Consolidated Financial Statements
The NYSE and the TSX delisted the Predecessor Company’s common stock at the opening of business on May 21, 2009 and the close of market on May 15, 2009, respectively. During the Creditor Protection Proceedings, the Predecessor Company’s common stock traded in the over-the-counter market and was quoted on the Pink Sheets Quotation Service and on the OTC Bulletin Board under the symbol “ABWTQ.” In addition, the TSX delisted the exchangeable shares of our former indirect wholly-owned subsidiary, AbitibiBowater Canada Inc., at the close of market on May 15, 2009.
Reorganization items, net
Reorganization items, net for the yearsyear ended December 31, 2010 and 2009 were comprised of the following:
| Predecessor | ||||||||
| (In millions) | 2010 | 2009 | ||||||
Professional fees(1) | $ | 154 |
| $ | 106 | |||
Gain due to Plans of Reorganization adjustments(2) | (3,553 | ) | – | |||||
Loss due to fresh start accounting adjustments(3) | 362 | – | ||||||
Provision for repudiated or rejected executory contracts(4) | 121 | 225 | ||||||
Charges related to indefinite idlings and permanent closures(5) | 307 | 242 | ||||||
Gains on disposition of assets(6) (11) | (70 | ) | – | |||||
Write-off of debt discounts, premiums and issuance costs(7) | 666 | – | ||||||
Revaluation of debt due to currency exchange(8) | 546 | – | ||||||
Reversal of post-petition accrued interest on certain debt obligations(9) | (447 | ) | – | |||||
Gain on deconsolidation of BPCL(10) | (26 | ) | – | |||||
Gain on deconsolidation of a variable interest entity (“VIE”)(11) | (16 | ) | – | |||||
Debtor in possession financing costs(12) | 10 | 31 | ||||||
Other(13) | 45 | 35 | ||||||
| $ | (1,901 | ) | $ | 639 | ||||
| Predecessor | ||||
| (In millions) | 2010 | |||
Professional fees(1) | $ | 154 | ||
Gain due to Plans of Reorganization adjustments(2) | (3,553) | |||
Loss due to fresh start accounting adjustments(3) | 362 | |||
Provision for repudiated or rejected executory contracts(4) | 121 | |||
Charges related to indefinite idlings and permanent closures(5) | 307 | |||
Gains on disposition of assets(6) (11) | (70) | |||
Write-off of debt discounts, premiums and issuance costs(7) | 666 | |||
Revaluation of debt due to currency exchange(8) | 546 | |||
Reversal of post-petition accrued interest on certain debt obligations(9) | (447) | |||
Gain on deconsolidation of BPCL(10) | (26) | |||
Gain on deconsolidation of a variable interest entity (“VIE”)(11) | (16) | |||
Debtor in possession financing costs(12) | 10 | |||
Other(13) | 45 | |||
| $ | (1,901) | |||
| (1) | Professional fees directly related to the Creditor Protection Proceedings and the establishment of the Plans of Reorganization, including legal, accounting and other professional fees, as well as professional fees incurred by our creditors. Additionally, |
| (2) | Represented the effects of the implementation of the Plans of Reorganization, including, among other things: (i) the gain on extinguishment of the Predecessor Company’s liabilities subject to compromise, (ii) the gain on the settlement of the North American Free Trade Agreement (“NAFTA”) claim (the receipt of which was contingent upon our emergence from the Creditor Protection Proceedings) related to the December 2008 expropriation of certain of our assets and rights in the province of Newfoundland and Labrador by the provincial government and (iii) professional fees that were contractually due to certain professionals as “success” fees upon our emergence from the Creditor Protection Proceedings. |
| (3) | Represented, among other things, adjustments to the carrying values of our assets and liabilities to reflect their fair values and the elimination of the Predecessor Company’s additional paid-in capital, deficit and accumulated other comprehensive loss as a result of the application of fresh start accounting. |
| (4) | Represented provision for estimated claims arising from repudiated or rejected executory contracts, as well as supply contracts and equipment leases. |
| (5) |
|
ABITIBIBOWATER INC.
Notes to Consolidated Financial Statements
| Predecessor | ||||||||
| (In millions) | 2010 | 2009 | ||||||
Accelerated depreciation | $ | 251 | $ | 51 | ||||
Long-lived asset impairment | 10 | 130 | ||||||
Severance and pension curtailment | 29 | 32 | ||||||
Write-downs of inventory | 17 | 17 | ||||||
Other | – | 12 | ||||||
| $ | 307 | $ | 242 | |||||
| Predecessor | |||||
| (In millions) | 2010 | ||||
Accelerated depreciation | $ | 251 | |||
Long-lived asset impairment | 10 �� | ||||
Severance and pension curtailment | 29 | ||||
Write-downs of inventory | 17 | ||||
| $ | 307 | ||||
RESOLUTE FOREST PRODUCTS INC.
Notes to Consolidated Financial Statements
| (6) | Represented gains on the disposition of various mills and other assets as part of our work toward a comprehensive restructuring plan, including the write-off of related asset retirement obligations. Such gains |
| (7) | FASB ASC 852 requires that debt discounts and premiums, as well as debt issuance costs, be viewed as part of the valuation of the related pre-petition debt in arriving at the net carrying amount of the debt. When the debt becomes an allowed claim and the allowed claim differs from the net carrying amount of the debt, the recorded debt obligations should be adjusted to the amount of the allowed claim. |
| (8) | For purposes of determining the amounts of allowed unsecured claims, claims filed against a CCAA filer or Chapter 11 filer denominated in a currency other than the local currency |
| (9) |
|
| (10) | On February 2, 2010, Bridgewater Paper Company Limited (“BPCL”), a subsidiary of ours, filed for administration in the United Kingdom pursuant to the United Kingdom Insolvency Act 1986, as amended. As |
| (11) | During the second quarter of 2010, a subsidiary that was a VIE that we had been consolidating was placed into receivership. As a result, we lost control over and the ability to influence this VIE’s operations and were no longer the primary beneficiary of this VIE. Therefore, we are no longer consolidating this VIE in our consolidated financial statements. Upon the deconsolidation of this VIE, we derecognized our negative investment in this VIE, which resulted in a gain. Additionally, in the fourth quarter of 2010, we transferred assets and liabilities associated with certain Canadian properties to this VIE. Upon the transfer of these properties to this VIE and the assumption of the associated liabilities by this VIE, we lost control of the assets transferred and were no longer primarily responsible for the liabilities transferred and therefore deconsolidated these properties, which resulted in a gain on disposition of assets. |
ABITIBIBOWATER INC.
Notes to Consolidated Financial Statements
| (12) | Debtor in possession financing costs were recorded |
| (13) |
|
RESOLUTE FOREST PRODUCTS INC.
Notes to Consolidated Financial Statements
In 2010, and 2009, we paid $210 million and $104 million, respectively, relating to reorganization items, which were comprised of: (i) professional fees of $139 million and $73 million, respectively,million; (ii) debtor in possession financing costs of $10 and $31 million, respectively,million; (iii) the backstop commitment agreement termination fee of $15 million in 2010 discussed above and (iv) exit financing costs of $46 million in 2010.million. Payments relating to professional fees and the backstop commitment agreement termination fee were included in cash flows from operating activities and payments relating to debtor in possession financing costs and exit financing costs were included in cash flows from financing activities in our Consolidated Statements of Cash Flows. Additionally, the receipt of the NAFTA settlement discussed above of $130 million in 2010 was included in cash flows from operating activities in our Consolidated Statements of Cash Flows.
Note 4.5. Amortizable Intangible Assets, Net
Amortizable intangible assets, net as of December 31, 20112012 and 20102011 were comprised of water rights:the following:
| Successor | ||||||||
| (In millions) | 2011 | 2010 | ||||||
Gross carrying value | $ | 19 | $ | 19 | ||||
Accumulated amortization | (1 | ) | – | |||||
Net | $ | 18 | $ | 19 | ||||
| Successor | ||||||||||||||||||||||||||||
| 2012 | 2011 | |||||||||||||||||||||||||||
| (Dollars in millions) | Estimated (Years) | Gross Carrying Value | Accumulated Amortization | Net | Estimated Life(Years) | Gross Carrying Value | Accumulated Amortization | Net | ||||||||||||||||||||
Water rights | 40 | $ | 19 | $ | 1 | $ | 18 | 40 | $ | 19 | $ | 1 | $ | 18 | ||||||||||||||
Energy contracts | 15 – 25 | 52 | 1 | 51 | – | – | – | – | ||||||||||||||||||||
| $ | 71 | $ | 2 | $ | 69 | $ | 19 | $ | 1 | $ | 18 | |||||||||||||||||
In order to operate our hydroelectric generating facilities,facility, we draw water from various rivers in Canada.Quebec. The use of such government-owned waters is governed by water power leases/agreements with the Canadian provinces,province of Quebec, which set out the terms, conditions and fees (as applicable). Terms of these agreements typically range from 10 to 50 years and are generally renewable, under certain conditions, for additional terms. In certain circumstances, water rights are granted without expiration dates. In some cases, the agreements are contingent on the continued operation of the related paper mill and a minimum level of capital spending in the region. We have assigned the Successor Company’sThe water rights anrights’ expected useful life of 40 years which corresponds to the related hydroelectric power plants’ expected useful lives.
The province of Quebec informed us on December 30, 2011 that it intended not to terminate one ofrenew our water rights agreementsassociated with our Jim-Gray hydroelectric dam and to require us to transfer property of the associated installationproperty to the province for no consideration. The termination andOn February 6, 2013, the province of Quebec granted us an extension to transfer the property. As extended, an agreement on the terms of the transfer would need to be effective asentered into at the latest on June 14, 2013. The province’s actions are contrary to our understanding of March 2, 2012. See Note 12, “Fixed Assets, Net,”the water power lease in question. We continue to evaluate our legal options. The net book value of this hydroelectric dam was tested for additional information.impairment with the other assets in its asset group and no impairment was indicated. At this time, we believe that the remaining useful life of the assets remains unchanged, as we continue pursuing the renewal of our water rights at the facility.unchanged. The carrying value of the intangible assets associated with the Jim-Gray installationdam as of December 31, 20112012 was approximately $6$5 million. If we are unable to renew the water rights at this facility,dam, we will reevaluate the remaining useful life of these assets, which may result in accelerated amortization charges in the first quarterat that time.
In connection with our acquisition of 2012.Fibrek, we identified amortizable intangible assets related to energy contracts. See Note 3, “Acquisition of Fibrek Inc.,” for additional information.
Amortization expense related to amortizable intangible assets for the years ended December 31, 2012, 2011 2010 and 20092010 was approximately $1 million, $19$1 million and $25$19 million, respectively. Amortization expense related to amortizable intangible assets is estimated to be approximately less than $1$3 million per year for each of the next five years (excluding any accelerated amortization charges that may be required, in the first quarter of 2012, as discussed above).
ABITIBIBOWATERRESOLUTE FOREST PRODUCTS INC.
Notes to Consolidated Financial Statements
Note 5.6. Closure Costs, Impairment and Other Related Charges
Closure costs, impairment and other related charges for the yearsyear ended December 31, 2011, 2010 and 20092012, were comprised of the following:
| Successor | Predecessor | |||||||||||||||||
| (In millions) | 2011 | 2010 | 2009 | |||||||||||||||
Impairment of long-lived assets | $ | 16 | $ | 2 | $ | 87 | ||||||||||||
Accelerated depreciation | 8 | – | 21 | |||||||||||||||
Impairment of assets held for sale | – | – | 84 | |||||||||||||||
Contractual obligations and other commitments | – | 8 | – | |||||||||||||||
Severance and other costs | 22 | 1 | 10 | |||||||||||||||
| $ | 46 | $ | 11 | $ | 202 | |||||||||||||
| Successor | ||||||||||||||||||||
| (In millions) | Impairment of assets | Accelerated depreciation | Pension and OPEB plan curtailment and settlement losses | Severance and other costs | Total | |||||||||||||||
Indefinite idlings: | ||||||||||||||||||||
Mersey operations, Nova Scotia(1) | $ | 72 | $ | – | $ | 8 | $ | 15 | $ | 95 | ||||||||||
Kraft mill and paper machine in Fort Frances, Ontario(2) | 31 | 2 | 1 | 6 | 40 | |||||||||||||||
Paper machine in Catawba(2) | 1 | – | – | – | 1 | |||||||||||||||
Permanent closure: | ||||||||||||||||||||
Paper machine in Laurentide, Quebec | – | 18 | – | 4 | 22 | |||||||||||||||
Restructuring initiatives: | ||||||||||||||||||||
Catawba paper mill | – | – | – | 4 | 4 | |||||||||||||||
Baie-Comeau, Quebec paper mill | – | – | 3 | 1 | 4 | |||||||||||||||
Lump-sum payments to vested terminated employees (Note 18) | – | – | 7 | – | 7 | |||||||||||||||
Other(2) | 2 | 1 | 2 | 2 | 7 | |||||||||||||||
| $ | 106 | $ | 21 | $ | 21 | $ | 32 | $ | 180 | |||||||||||
Impairment of long-lived assets
| (1) | We recorded long-lived asset impairment charges (including a $7 million write-down of an asset retirement obligation for environmental liabilities) related to the indefinite idling and subsequent sale of our interest in our Mersey operations, to reduce the carrying value of our net assets to fair value less costs to sell. |
In
| (2) | We recorded long-lived assets impairment charges to reduce the carrying value of the assets to their estimated fair value, which was determined based on the assets’ estimated salvage values. |
Closure costs, impairment and other related charges for the year ended December 31, 2011, we recorded long-lived asset impairment charges of $6 million related to our Mokpo paper mill, $3 million related to certain scrapped equipment at our Calhoun, Tennessee paper mill and $7 million as a resultwere comprised of the decision to cease paperboard production at our Coosa Pines paper mill to reduce the carrying value of the assets to their estimated fair value, which was determined based on the assets’ estimated sale or salvage values.following:
In 2010, we recorded long-lived asset impairment charges of $2 million related to our previously permanently closed Covington facility to further reduce the carrying value of the assets to their estimated fair value, which was determined based on the mill’s estimated sales value.
| Successor | ||||||||||||||||||||
| (In millions) | Impairment of assets(1) | Accelerated depreciation | Pension and OPEB plan curtailment losses | Severance and other costs | Total | |||||||||||||||
Permanent closures: | ||||||||||||||||||||
Paperboard production in Coosa Pines | $ | 7 | $ | 1 | $ | 3 | $ | 3 | $ | 14 | ||||||||||
Paper machine in Kenogami, Quebec | – | 3 | 2 | 5 | 10 | |||||||||||||||
Paper machine in Baie-Comeau | – | 2 | – | – | 2 | |||||||||||||||
Restructuring initiatives: | ||||||||||||||||||||
Mokpo paper mill | 6 | – | – | 3 | 9 | |||||||||||||||
Mersey operations | – | – | 3 | 3 | 6 | |||||||||||||||
Calhoun, Tennessee | 3 | – | – | – | 3 | |||||||||||||||
Other | – | 2 | – | – | 2 | |||||||||||||||
| $ | 16 | $ | 8 | $ | 8 | $ | 14 | $ | 46 | |||||||||||
In 2009, upon review of the recoverability of certain of our indefinitely idled newsprint mill assets following a steep decline in market demand in early 2009, we recorded a long-lived asset impairment charge of $85 million. The fair value of these assets was determined based on their estimated sale or salvage values. In 2009, we also recorded long-lived asset impairment charges, primarily related to two previously permanently closed mills, which we bundled and sold together in 2010 with two other previously permanently closed mills, to further reduce the carrying value of their assets to their current estimated fair value, which was determined based on their estimated sales values.
Accelerated depreciation
In 2011, we recorded accelerated depreciation charges of $3 million related to the permanent closure of a paper machine at our Kenogami, Quebec paper mill, $1 million related to the permanent closure of our Saint-Prime, Quebec remanufacturing wood products facility, $1 million related to the permanent closure of a de-inking line at our Alma, Quebec paper mill, $2 million related to the permanent closure of a paper machine and a thermomechanical pulp line at our Baie-Comeau, Quebec paper mill and $1 million as a result of the decision to cease paperboard production at our Coosa Pines paper mill.
In 2009, we reviewed the remaining useful lives of two paper machines at our Calhoun newsprint mill and concluded that the estimated remaining useful lives should be reduced to zero. Accordingly, we recorded accelerated depreciation charges of $21 million to reduce their carrying values to their estimated salvage values of zero.
Impairment of assets held for sale
In 2009, we recorded long-lived asset impairment charges of $84 million related to the assets held for sale for our interest in MPCo to reduce the carrying value of our investment in MPCo to its current fair value less costs to sell to reflect the terms of the final sale and actual costs to sell. The sale of MPCo was completed in the fourth quarter of 2009.
We recorded long-lived assets impairment charges to reduce the carrying value of the assets to their estimated fair value, which was determined based on the assets’ estimated sale or salvage values. In 2010, we recorded an $8 million tax indemnification liability related to the 2009 sale of our investment in Notes to Consolidated Financial StatementsContractual obligations and other commitments(1) MPCoManicouagan Power Company (“MPCo”) (see Note 20, “Commitments and Contingencies – Other representations, warranties and indemnifications”)., long-lived asset impairment charges of $2 million and $1 million of severance and other costs.ABITIBIBOWATERRESOLUTE FOREST PRODUCTS INC.
Severance and other costs
In 2011, we recorded $5 million of severance costs and a $2 million pension plan curtailment loss related to the permanent closure of a paper machine at our Kenogami paper mill, $3 million of severance costs and a $3 million pension plan curtailment loss related to a workforce reduction at our Mersey operations in Nova Scotia, $3 million of severance costs for an early retirement severance program for employees at our Mokpo paper mill and $3 million of severance costs and a $3 million OPEB plan curtailment loss as a result of the decision to cease paperboard production at our Coosa Pines paper mill.
In 2010, we recorded $1 million in severance and other costs, primarily for miscellaneous adjustments to severance liabilities and asset retirement obligations, as well as other costs, primarily for a lawsuit related to a closed mill.
In 2009, we recorded severance and other costs related to the permanent closures of our Westover sawmill and Goodwater, Alabama planer mill operations and the continued idling of our Alabama River, Alabama newsprint mill.
Note 6. Assets Held for Sale, Liabilities Associated with7. Assets Held for Sale and Net Gain on Disposition of Assets and Other
AssetsAs of December 31, 2012, we held for sale and liabilities associated withmiscellaneous assets held for sale
Assets held for sale as of December 31, 2011 and 2010 were comprised of the following:
| Successor | ||||||||
| (In millions) | 2011 | 2010 | ||||||
Cash and cash equivalents | $ | – | $ | 10 | ||||
Accounts receivable | – | 4 | ||||||
Other current assets | – | 1 | ||||||
Fixed assets, net | 7 | 149 | ||||||
Amortizable intangible assets | – | 528 | ||||||
Other assets | – | 6 | ||||||
| $ | 7 | $ | 698 | |||||
Liabilities associated with assets held for sale as of December 31, 2011 and 2010 were comprised of the following:
| Successor | ||||||||
| (In millions) | 2011 | 2010 | ||||||
Accounts payable and accrued liabilities | $ | – | $ | 9 | ||||
Long-term debt | – | 280 | ||||||
| $ | – | $ | 289 | |||||
less than $1 million. As of December 31, 2011, we held for sale the following assets: our Petit Saguenay sawmill and certain parcels of land. Theland and these assets held for sale are carriedwere comprised of fixed assets, net of $7 million.
During 2012, we sold two parcels of land in Gatineau, our Petit Saguenay sawmill, our recycling division’s assets located in Phoenix, Arizona, a portion of our Mersey timberlands and subsequently our interest in our Consolidated Balance Sheet asMersey operations and various other assets for total consideration of December 31,$55 million, comprised of a note receivable of $5 million and net cash proceeds of $50 million, resulting in a net gain on disposition of assets of $35 million.
During 2011, at the lower of carrying value or fair value less costs to sell. We expect to complete a sale of all of these assets within the next twelve months for amounts that equal or exceed their individual carrying values.
As of December 31, 2010, we held for sale the following assets:sold our investment in ACH Limited Partnership (“ACH”), our Kenora, Ontario and Alabama River, paper mills, our Saint-Fulgence and Petit Saguenay sawmills and various other assets. These assets and liabilities held for sale were carried in our Consolidated Balance Sheet as of December 31, 2010 at fair value (as a result of the application of fresh start accounting) less costs to sell. Since we had control over ACH, our consolidated financial statements included this entity on a fully consolidated basis.
Net gain on disposition of assets and other
During 2011, we sold our investment in ACH (for additional information, see Note 16, “Liquidity and Debt”), our Alabama River paper mill, our Kenora, Ontario paper mill and various other assets for cash proceeds of $315 million, resulting in a net gain on disposition of assets of $3 million.
ABITIBIBOWATER INC.
Notes to Consolidated Financial Statements
During 2010, we sold timberlands and other assets for proceeds of $16 million, resulting in a net gain on disposition of assets of $14 million. Additionally, during 2010, as part of our work toward a comprehensive restructuring plan, we sold various mills and other assets. For additional information, see Note 3,4, “Creditor Protection Proceedings – Reorganization items, net.” Additionally, in 2010, we recorded a net gain of $16 million related to a customer bankruptcy settlement.
During 2009, we sold 491,356 acres of timberlands, primarily located in Quebec, Canada and other assets, including the water system associated with our Lufkin paper mill, for proceeds of $119 million, resulting in a net gain on disposition of assets of $91 million. In addition, in 2009, we sold our interest in MPCo for gross cash proceeds of Cdn$615 million ($583 million). We did not recognize a gain or loss on this sale since we had previously recorded long-lived asset impairment charges to reduce the carrying value of our investment in MPCo to its fair value less costs to sell. See Note 5, “Closure Costs, Impairment and Other Related Charges – Impairment of assets held for sale,” for additional information.
Note 7.8. Other Expense,Income (Expense), Net
Other expense,income (expense), net for the years ended December 31, 2012, 2011 2010 and 20092010 was comprised of the following:
| Successor | Predecessor | |||||||||||||||||||||
| (In millions) | 2011 | 2010 | 2009 | |||||||||||||||||||
Foreign exchange loss | $ | (21 | ) | $ | (94 | ) | $ | (59 | ) | |||||||||||||
Post-emergence costs(1) | (47 | ) | – | – | ||||||||||||||||||
Income (loss) from equity method investments | 2 | (3 | ) | (9 | ) | |||||||||||||||||
Net gains on extinguishment of debt (Note 16) | 6 | – | – | |||||||||||||||||||
Interest income(2) | 3 | 1 | – | |||||||||||||||||||
Fees for waivers and amendments to accounts receivable securitization program(3) | – | – | (23 | ) | ||||||||||||||||||
Loss on sale of ownership interests in accounts receivable (Note 16) | – | – | (17 | ) | ||||||||||||||||||
Miscellaneous income(4) | 9 | 7 | 37 | |||||||||||||||||||
| $ | (48 | ) | $ | (89 | ) | $ | (71 | ) | ||||||||||||||
| Successor | Predecessor | |||||||||||
| (In millions) | 2012 | 2011 | 2010 | |||||||||
Foreign exchange gain (loss) | $ | 17 | $ | (21 | ) | $ | (94) | |||||
Post-emergence costs(1) | (11 | ) | (47 | ) | – | |||||||
Income (loss) from equity method investments | 5 | 2 | (3) | |||||||||
Net gains on extinguishment of debt (Note 17) | 2 | 6 | – | |||||||||
Interest income(2) | 5 | 3 | 1 | |||||||||
Acquisition-related loss (Note 3) | (1 | ) | – | – | ||||||||
Miscellaneous income | 5 | 9 | 7 | |||||||||
| $ | 22 | $ | (48 | ) | $ | (89) | ||||||
| (1) | Primarily represents ongoing legal and other professional fees for the resolution and settlement of disputed creditor claims, as well as costs for other post-emergence activities associated with the Creditor Protection Proceedings. |
| (2) | During the Creditor Protection Proceedings, we recorded our Debtors’ interest income in “Reorganization items, net” in our Consolidated Statements of Operations. |
RESOLUTE FOREST PRODUCTS INC. Notes to Consolidated Financial Statements |
|
Note 8.9. Accumulated Other Comprehensive Loss
Accumulated other comprehensive loss as of December 31, 20112012 and 20102011 was comprised of the following:
| Successor | Successor | |||||||||||||||
| (In millions) | 2011 | 2010 (1) | 2012 | 2011 | ||||||||||||
Unamortized prior service costs | $ | (2 | ) | $ | – | $ | 21 | $ | (2) | |||||||
Unamortized actuarial losses(3) | (309 | ) | – | |||||||||||||
Foreign currency translation(4) (5) | – | – | ||||||||||||||
Unamortized actuarial losses(2) (3) | (640) | (309) | ||||||||||||||
Foreign currency translation(3) (4) (5) | 5 | – | ||||||||||||||
| $ | (311 | ) | $ | – | $ | (614) | $ | (311) | ||||||||
| (1) |
|
Net of deferred income taxes of $7 million and zero as of December 31, |
Net of deferred income tax benefit of $262 million and $127 million as of December 31, |
| (3) | Accumulated other comprehensive loss as of December 31, 2012 was decreased by $14 million of unamortized actuarial losses and $2 million of foreign currency translation losses that were reclassified to “Closure costs, impairment and other related charges” in our Consolidated Statements of Operations for the year ended December 31, 2012 as a result of the disposition of our interest in our Mersey operations. |
| (4) | No tax effect was recorded for foreign currency translation since the investment in foreign net assets |
ABITIBIBOWATER INC.
Notes to Consolidated Financial Statements
| (5) | Accumulated other comprehensive loss as of December 31, 2011 |
RESOLUTE FOREST PRODUCTS INC.
Notes to Consolidated Financial Statements
The pension and OPEB benefit related components of other comprehensive loss for the years ended December 31, 2012, 2011 2010 and 20092010 were comprised of the following:
| Successor | Predecessor | |||||||||||||||||||||||||||||||||||
| 2011 | 2010 | 2009 | ||||||||||||||||||||||||||||||||||
| (In millions) | Before- tax Amount | Taxes | After- tax Amount | Before- tax Amount | Taxes | After- tax Amount | Before- tax Amount | Taxes | After- tax Amount | |||||||||||||||||||||||||||
Prior service (cost) credit from plan amendment during period | $ | (1 | ) | $ | – | $ | (1 | ) | $ | 8 | $ | – | $ | 8 | $ | – | $ | – | $ | – | ||||||||||||||||
Amortization or curtailment recognition of prior service credit included in net periodic benefit cost | (1 | ) | – | (1 | ) | – | – | – | (15 | ) | – | (15 | ) | |||||||||||||||||||||||
Change in unamortized prior service costs and credits during period | (2 | ) | – | (2 | ) | 8 | – | 8 | (15 | ) | – | (15 | ) | |||||||||||||||||||||||
Net actuarial loss arising during period | (447 | ) | 127 | (320 | ) | (606 | ) | – | (606 | ) | (176 | ) | – | (176 | ) | |||||||||||||||||||||
Amortization or settlement recognition of net actuarial loss | 3 | – | 3 | 8 | – | 8 | – | – | – | |||||||||||||||||||||||||||
Change in unamortized actuarial gains and losses during period | (444 | ) | 127 | (317 | ) | (598 | ) | – | (598 | ) | (176 | ) | – | (176 | ) | |||||||||||||||||||||
Comprehensive loss associated with pension and OPEB plans including noncontrolling interests | (446 | ) | 127 | (319 | ) | (590 | ) | – | (590 | ) | (191 | ) | – | (191 | ) | |||||||||||||||||||||
Less: Comprehensive loss associated with pension and OPEB plans attributable to noncontrolling interests: | ||||||||||||||||||||||||||||||||||||
Net actuarial loss arising during period | 8 | – | 8 | – | – | – | – | – | – | |||||||||||||||||||||||||||
Comprehensive loss associated with pension and OPEB plans attributable to noncontrolling interests | 8 | – | 8 | – | – | – | – | – | – | |||||||||||||||||||||||||||
Comprehensive loss associated with pension and OPEB plans attributable to AbitibiBowater Inc. | $ | (438 | ) | $ | 127 | $ | (311 | ) | $ | (590 | ) | $ | – | $ | (590 | ) | $ | (191 | ) | $ | – | $ | (191 | ) | ||||||||||||
| Successor | Predecessor | |||||||||||||||||||||||||||||||||||
| 2012 | 2011 | 2010 | ||||||||||||||||||||||||||||||||||
| (In millions) | Before-tax Amount | Taxes | After- tax Amount | Before-tax Amount | Taxes | After- tax | Before-tax Amount | Taxes | After- tax Amount | |||||||||||||||||||||||||||
Prior service credit (cost) | $ | 30 | $ | (7) | $ | 23 | $ | (1) | $ | – | $ | (1) | $ | 8 | $ | – | $ | 8 | ||||||||||||||||||
Amortization or curtailment | – | – | – | (1) | – | (1) | – | – | – | |||||||||||||||||||||||||||
Change in unamortized | 30 | (7) | 23 | (2) | – | (2) | 8 | – | 8 | |||||||||||||||||||||||||||
Net actuarial loss arising | (496) | 138 | (358) | (447) | 127 | (320) | (606) | – | (606) | |||||||||||||||||||||||||||
Amortization or settlement | 10 | (3) | 7 | 3 | – | 3 | 8 | – | 8 | |||||||||||||||||||||||||||
Change in unamortized | (486) | 135 | (351) | (444) | 127 | (317) | (598) | – | (598) | |||||||||||||||||||||||||||
Comprehensive loss | (456) | 128 | (328) | (446) | 127 | (319) | (590) | – | (590) | |||||||||||||||||||||||||||
Less: Comprehensive loss | ||||||||||||||||||||||||||||||||||||
Net actuarial loss arising | 6 | – | 6 | 8 | – | 8 | – | – | – | |||||||||||||||||||||||||||
Comprehensive loss | 6 | – | 6 | 8 | – | 8 | – | – | – | |||||||||||||||||||||||||||
Comprehensive loss | $ | (450) | $ | 128 | $ | (322) | $ | (438) | $ | 127 | $ | (311) | $ | (590) | $ | – | $ | (590) | ||||||||||||||||||
ABITIBIBOWATERRESOLUTE FOREST PRODUCTS INC.
Notes to Consolidated Financial Statements
Note 9.10. Net (Loss) Income (Loss) Per Share
The weighted-average number of common shares outstanding used to calculate basic and diluted net (loss) income (loss) per share attributable to AbitibiBowaterResolute Forest Products Inc. common shareholders for the years ended December 31, 2012, 2011 2010 and 20092010 was as follows:
| Successor | Predecessor | Successor | Predecessor | |||||||||||||||||||||||||||
| (In millions) | 2011 | 2010 | 2009 | 2012 | 2011 | 2010 | ||||||||||||||||||||||||
Basic weighted-average number of common shares outstanding | 97.1 | 57.7 | 57.7 | 97.4 | 97.1 | 57.7 | ||||||||||||||||||||||||
Effect of potentially dilutive securities and pre-petition convertible notes | – | 36.9 | – | – | – | 36.9 | ||||||||||||||||||||||||
Diluted weighted-average number of common shares outstanding | 97.1 | 94.6 | 57.7 | 97.4 | 97.1 | 94.6 | ||||||||||||||||||||||||
For the years ended December 31, 2012 and 2011, no adjustments to net (loss) income attributable to Resolute Forest Products Inc. common shareholders were necessary to calculate basic and diluted net (loss) income per share. For the year ended December 31, 2012, option shares of 1.5 million and equity-classified RSUs and DSUs of 0.8 million were excluded from the calculation of diluted net loss per share as the impact would have been antidilutive. For the year ended December 31, 2011, the dilutive impact of option shares of 0.9 million and equity-classified RSUs and DSUs of 0.4 million on the weighted-average number of common shares outstanding used to calculate diluted net income per share was nominal. For the year ended December 31, 2010, an adjustment to our basic weighted-average number of common shares outstanding of 36.9 million shares was necessary for the dilutive effect of the assumed conversion of the pre-petition convertible notes, which were outstanding at that time. However, no adjustment to net income attributable to Resolute Forest Products Inc. common shareholders was necessary for the year ended December 31, 2010 because we did not record interest expense related to such convertible notes as a result of the Creditor Protection Proceedings. For the year ended December 31, 2010, option shares of 2.4 million were excluded from the calculation of diluted net income per share as the impact would have been antidilutive.
As discussed in Note 4, “Creditor Protection Proceedings,” and Note 21, “Share Capital,” (i) all equity interests in the Predecessor Company existing immediately prior to the Emergence Date, including, among other things, all of our common stock issued and outstanding, were discharged, canceled, released and extinguished and (ii) on the Emergence Date and pursuant to the Plans of Reorganization, we issued an aggregate of 97,134,954 shares of Successor Company common stock. The weighted-average number of common shares outstanding as of December 31, 2010 assumes that the Predecessor Company common stock remained outstanding through the December 31, 2010 Convenience Date.
For the year ended December 31, 2011, no adjustment to net income attributable to AbitibiBowater Inc. common shareholders was necessary to calculate basic and diluted net income per share. For the year ended December 31, 2011, the dilutive impact of 0.9 million option shares and 0.4 million equity-classified RSUs and DSUs on the weighted-average number of common shares outstanding used to calculate diluted net income per share was nominal. For the year ended December 31, 2010, an adjustment to our basic weighted-average number of common shares outstanding of 36.9 million shares was necessary for the dilutive effect of the assumed conversion of the pre-petition convertible notes, which were outstanding at that time. However, no adjustment to net income attributable to AbitibiBowater Inc. common shareholders was necessary for the year ended December 31, 2010 because we did not record interest expense related to such convertible notes as a result of the Creditor Protection Proceedings. For the year ended December 31, 2009, no adjustment to net loss attributable to AbitibiBowater Inc. common shareholders and the diluted weighted-average number of common shares outstanding for the assumed conversion of such convertible notes was necessary as the impact would have been anti-dilutive.
Options to purchase 2.4 million shares and 2.9 million shares for the years ended December 31, 2010 and 2009, respectively, were excluded from the calculation of diluted net income (loss) per share as the impact would have been anti-dilutive.
Note 10.11. Inventories, Net
Inventories, net as of December 31, 20112012 and 20102011 were comprised of the following:
| Successor | Successor | |||||||||||||||
| (In millions) | 2011 | 2010 | 2012 | 2011 | ||||||||||||
At lower of cost or market (2011); at fair value (2010): | ||||||||||||||||
Raw materials and work in process | $ | 152 | $ | 146 | $ | 181 | $ | 152 | ||||||||
Finished goods | 168 | 184 | 188 | 168 | ||||||||||||
Mill stores and other supplies | 155 | 108 | 176 | 155 | ||||||||||||
| $ | 475 | $ | 438 | $ | 545 | $ | 475 | |||||||||
In 2012, we recorded charges of $12 million for write-downs of inventory as a result of the indefinite idling of our Mersey newsprint mill, the permanent closure of a paper machine at our Laurentide paper mill and the indefinite idling of the kraft mill and a paper machine at our Fort Frances pulp and paper mill. In 2011, we recorded charges of $3 million for write-downs of inventory as a result of the decision to cease paperboard production at our Coosa Pines paper mill, as well as the permanent closure of a paper machine at our Kenogami paper mill. These charges were included in “Cost of sales, excluding depreciation, amortization and cost of timber harvested” in our Consolidated Statements of Operations. In 2010, we recorded charges of $17 million for write-downs of inventory, primarily associated with our indefinitely idled Gatineau paper mill, an indefinitely idled paper machine and de-inking line at our Thorold paper mill and a permanently closed paper machine at our Coosa Pines paper mill. These charges were incurred as part of our restructuring and were included in “Reorganization items, net” in our Consolidated Statements of Operations.
ABITIBIBOWATERRESOLUTE FOREST PRODUCTS INC.
Notes to Consolidated Financial Statements
Note 11.12. Restricted Cash
In connection with the sale of our investment in MPCo in December 2009, we provided certain undertakings and indemnities to Alcoa Canada Ltd. (collectively with certain affiliates, “Alcoa”), our former partner in MPCo, including an indemnity for potential tax liabilities arising from the transaction. As of December 31, 20112012 and 2010,2011, we maintained a reserve of approximately Cdn$5 million ($5 million, based on the exchange rate in effect on December 31, 2012) and Cdn$83 million ($81 million, based on the exchange rate in effect on December 31, 2011) and Cdn$80 million ($80 million, based on the exchange rate in effect on December 31, 2010), respectively, to secure those obligations. The decrease in the reserve was due to the partial release of a tax indemnity in the second quarter of 2012. This reserve was included as restricted cash in “Other assets” in our Consolidated Balance Sheets as of December 31, 2011 and 2010.Sheets.
Note 12.13. Fixed Assets, Net
Fixed assets, net as of December 31, 20112012 and 20102011 were comprised of the following:
| Successor | Successor | |||||||||||||||||||
| (Dollars in millions) | Range of Estimated Useful Lives in Years | 2011 | 2010 | Range of Estimated Useful Lives in Years | 2012 | 2011 | ||||||||||||||
Land and land improvements | 2 – 10 | $ | 85 | $ | 72 | 5 – 20 | $ | 88 | $ | 85 | ||||||||||
Buildings | 10 – 40 | 264 | 280 | 7 – 40 | 289 | 264 | ||||||||||||||
Machinery and equipment | 3 – 20 | 1,910 | 1,853 | 3 – 40 | 2,090 | 1,910 | ||||||||||||||
Hydroelectric power plants (1) | 40 | 283 | 283 | 40 | 283 | 283 | ||||||||||||||
Timber and timberlands | 10 – 20 | 105 | 100 | 3 – 20 | 70 | 105 | ||||||||||||||
Construction in progress | 81 | 53 | 91 | 81 | ||||||||||||||||
| 2,728 | 2,641 | 2,911 | 2,728 | |||||||||||||||||
Less accumulated depreciation | (226 | ) | – | (471 | ) | (226 | ) | |||||||||||||
| $ | 2,502 | $ | 2,641 | $ | 2,440 | $ | 2,502 | |||||||||||||
| (1) | The province of Quebec informed us on December 30, 2011 that it intended not to |
Note 13.14. Accounts Payable and Accrued Liabilities
Accounts payable and accrued liabilities as of December 31, 20112012 and 20102011 were comprised of the following:
| Successor | Successor | |||||||||||||||
| (In millions) | 2011 | 2010 | 2012 | 2011 | ||||||||||||
Trade accounts payable | $ | 291 | $ | 252 | $ | 368 | $ | 291 | ||||||||
Payroll, bonuses and severance payable | 89 | 99 | 109 | 89 | ||||||||||||
Accrued interest | 13 | 21 | 12 | 13 | ||||||||||||
Pension and OPEB benefit obligations | 34 | 35 | 30 | 34 | ||||||||||||
Income and other taxes payable | 19 | 15 | 8 | 19 | ||||||||||||
Claims payable | 11 | 35 | 4 | 11 | ||||||||||||
Other | 87 | 90 | 50 | 87 | ||||||||||||
| $ | 544 | $ | 547 | $ | 581 | $ | 544 | |||||||||
ABITIBIBOWATERRESOLUTE FOREST PRODUCTS INC.
Notes to Consolidated Financial Statements
Note 14.15. Severance Related Liabilities
The activity in our severance related liabilities for the years ended December 31, 20102011 and 20112012 was as follows:
| (In millions) | 2011 Initiatives | 2010 Initiatives | 2009 Initiatives | 2008 Initiatives | 2007 Initiatives | Total | ||||||||||||||||||
Balance as of December 31, 2009 (Predecessor) | $ | – | $ | – | $ | 43 | $ | 27 | $ | 17 | $ | 87 | ||||||||||||
Charges (credits) | – | 24 | 5 | – | (4 | ) | 25 | |||||||||||||||||
Compromise and settlement due to distribution of Successor Company common stock on account of unsecured creditor claims | – | (22 | ) | (48 | ) | (29 | ) | (12 | ) | (111 | ) | |||||||||||||
Other | – | – | – | 2 | (1 | ) | 1 | |||||||||||||||||
Balance as of December 31, 2010 (Successor) | – | 2 | – | – | – | 2 | ||||||||||||||||||
Charges | 28 | – | – | – | – | 28 | ||||||||||||||||||
Payments | (17 | ) | (2 | ) | – | – | – | (19 | ) | |||||||||||||||
Balance as of December 31, 2011 (Successor) | $ | 11 | $ | – | $ | – | $ | – | $ | – | $ | 11 | ||||||||||||
| (Unaudited, in millions) | 2012 Initiatives | 2011 Initiatives | 2010 Initiatives | Total | ||||||||||||
Balance as of December 31, 2010 (Successor) | $ | – | $ | – | $ | 2 | $ | 2 | ||||||||
Charges | – | 28 | – | 28 | ||||||||||||
Payments | – | (17) | (2) | (19) | ||||||||||||
Balance as of December 31, 2011 (Successor) | – | 11 | – | 11 | ||||||||||||
Charges | 35 | 1 | – | 36 | ||||||||||||
Payments | (18) | (9) | – | (27) | ||||||||||||
Reduction due to the sale of our interest in our Mersey operations | (4) | (1) | – | (5) | ||||||||||||
Balance as of December 31, 2012 (Successor) | $ | 13 | $ | 2 | $ | – | $ | 15 | ||||||||
In 2012, we recorded employee termination costs primarily related to the indefinite idling of our Mersey operations, the indefinite idling of the kraft mill and a paper machine at our Fort Frances pulp and paper mill, the permanent closure of a paper machine at our Laurentide paper mill and a restructuring initiative at our Catawba paper mill. The majority of the remaining severance liability is expected to be paid in 2013.
In 2011, we recorded employee termination costs primarily as a result of corporate employee terminations, the decision to close our Greenville, South Carolina office, the decision to cease paperboard production at our Coosa Pines paper mill, an early retirement severance program for employees at our Mokpo paper mill, the permanent closure of a paper machine at our Kenogami paper mill and a workforce reduction at our Mersey operations. The majority of the remaining severance liability is expected to be paid in 2012.
In 2010, we recorded employee termination costs resulting from our work toward a comprehensive restructuring plan, primarily related to: (i) the indefinite idling of our Gatineau paper mill, (ii) the indefinite idling of a paper machine and a de-inking line at our Thorold paper mill, (iii) a workforce reduction at our Catawba paper mill, (iv) the continued indefinite idling of our Dolbeau, Quebec paper mill (for which we announced its permanent closure in the third quarter of 2010), (v) the continued indefinite idling of a paper machine at our Thunder Bay, Ontario paper mill and (vi) the departure of our former Chief Executive Officer.
In 2009, we recorded employee termination costs primarily related to: (i) the indefinite idling of various paper mills and paper machines located in Canada resulting from our work toward a comprehensive restructuring plan, (ii) the continued idling of our Alabama River newsprint mill and (iii) the permanent closure of a sawmill in the United States resulting from our work toward a comprehensive restructuring plan.
Employee termination costs incurred as part of our restructuring were included in “Reorganization items, net” in our Consolidated Statements of Operations. Employee termination costs that were not associated with our restructuring were classified as “Cost of sales, excluding depreciation, amortization and cost of timber harvested,” “Selling, general and administrative expenses” or “Closure costs, impairment and other related charges” in our Consolidated Statements of Operations. The severance related liabilitiesaccruals were included in “Accounts payable and accrued liabilities” and “Other long-term liabilities” in our Consolidated Balance Sheets.
ABITIBIBOWATER INC.
Notes to Consolidated Financial Statements
Note 15.16. Asset Retirement Obligations
The activity in our liability for asset retirement obligations for the years ended December 31, 20112012 and 20102011 was as follows:
| Successor | Predecessor | Successor | ||||||||||||||||||||||
| (In millions) | 2011 | 2010 | 2012 | 2011 | ||||||||||||||||||||
Beginning of year (2011: Successor; 2010: Predecessor) | $ | 17 | $ | 55 | ||||||||||||||||||||
Beginning of year | $ | 20 | $ | 17 | ||||||||||||||||||||
Additions | 3 | 5 | 1 | 3 | ||||||||||||||||||||
Accretion expense | 1 | 2 | 1 | 1 | ||||||||||||||||||||
Reductions due to sale of mills | – | (20 | ) | |||||||||||||||||||||
Write-off of liabilities for which no claim was filed against us in the Creditor Protection Proceedings | – | (20 | ) | |||||||||||||||||||||
Payments | (1 | ) | (1 | ) | – | (1 | ) | |||||||||||||||||
Compromise and settlement due to distribution of Successor Company common stock on account of unsecured creditor claims | – | (3 | ) | |||||||||||||||||||||
Other | – | (1 | ) | (1 | ) | – | ||||||||||||||||||
End of year (Successor) | $ | 20 | $ | 17 | ||||||||||||||||||||
End of year | $ | 21 | $ | 20 | ||||||||||||||||||||
These asset retirement obligations consist primarily of liabilities for landfills, sludge basins and decontamination of closed sites. The related costs are capitalized as part of land and land improvements. We have not had to legally restrict assets for purposes of settling our asset retirement obligations.
The costsaddition in 2012 represented increases in obligations associated with these obligations are expected to be paid over a weighted average periodthe acquisition of approximately nine years.
Fibrek. The additions in 2011 represented increases in obligations associated with our Thunder Bay, Ontario, Calhoun, Baie-Comeau and Laurentide Quebec paper mills and included closure and cleanup of landfills, sludge ponds/lagoons and ash ponds. The additions in 2011 also included soil and groundwater testing and remediation and closure of two on-site landfills at our permanently closed Gatineau paper mill. The additions in 2010 represented obligations associated with our permanently closed Gatineau paper mill and included soil and groundwater testing and remediation, capping of landfills and removal of chemicals and other related materials.
Additionally, we have certain other asset retirement obligations for which the timing of settlement is conditional upon the closure of the related operating facility. At this time, we have no specific plans for the closure of these other facilities and currently intend to make improvements to the assets as necessary that would extend their lives indefinitely. Furthermore, the settlement dates have not
RESOLUTE FOREST PRODUCTS INC.
Notes to Consolidated Financial Statements
been specified by law, regulation or contract. As a result, we are unable at this time to estimate the fair value of the liability because there are indeterminate settlement dates for thethese conditional asset retirement obligations. If a closure plan for any of these facilities is initiated in the future, the settlement date will become determinable, an estimate of fair value will be made and an asset retirement obligation will be recorded.
The fair value of the asset retirement obligations was determined by discounting the cash flows (Level 3) using a weighted average interest rate of 7.7% (range between 3.6% and 8.3%). The costs associated with these obligations are expected to be paid over a weighted average period of approximately 10 years (range between two and 38 years).
The asset retirement obligations were included in “Accounts payable and accrued liabilities” or “Other long-term liabilities” in our Consolidated Balance Sheets.
Note 16. Liquidity and17. Long-Term Debt
LiquidityOverview
As of December 31, 2011, in addition to cash and cash equivalents and net cash provided by operations, our principal external source of liquidity was the ABL Credit Facility, which is defined and discussed below. As of December 31, 2011, we had cash and cash equivalents of $369 million and had $515 million of availability under the ABL Credit Facility.
On May 27, 2011, we announced the sale of our 75% equity interest in ACH. Cash proceeds from the sale,Long-term debt, including cash available at closing, were approximately Cdn$290 million ($296 million, based on the exchange rate in effect on May 27, 2011). The proceeds were applied in accordance with the terms of the 2018 Notes (as defined below) indenture, which requires, among other things, that the first $100 million of net proceeds from the sale of certain assets, including our interest in ACH, be used to redeem 2018 Notes (including accrued and unpaid interest) if the closing occurs within six months of the Emergence Date (as further discussed below). We also used the ACH proceeds to redeem an additional $85 million of principal amount of the 2018 Notes and repaid $90 million of other long-term debt (as further discussed below). The purchaser assumed the outstanding debt of ACH. Accordingly, ACH’s total long-term debt ($280 millioncurrent portion, as of December 31, 2010) is no longer reflected in our Consolidated Balance Sheet.
ABITIBIBOWATER INC.
Notes to Consolidated Financial Statements
| Successor | ||||||||
| (In millions) | 2012 | 2011 | ||||||
10.25% senior secured notes due 2018: | ||||||||
Principal amount | $ | 501 | $ | 586 | ||||
Unamortized premium | 27 | 35 | ||||||
Total senior secured notes due 2018 | 528 | 621 | ||||||
Other debt: | ||||||||
PSIF – Investissement Quebec loan | 3 | – | ||||||
Capital lease obligation | 3 | – | ||||||
Total other debt | 6 | – | ||||||
Total debt | 534 | 621 | ||||||
Less: Current portion of long-term debt | (2 | ) | – | |||||
Long-term debt, net of current portion | $ | 532 | $ | 621 | ||||
As further discussed below, on November 4, 2011, we redeemed an additional $85 million of principal amount of the10.25% senior secured notes due 2018 Notes.
In 2010, prior toconnection with our emergence from the Creditor Protection Proceedings in addition to cash and cash equivalents and net cash provided by operations, our external sources of liquidity were comprised of the following (which are defined and discussed below): (i) the Bowater DIP Agreement, (ii) the ULC DIP Facility and (iii) an accounts receivable securitization program. During the Creditor Protection Proceedings, cash payments for interest were only made on the Bowater DIP Agreement, the accounts receivable securitization program, the pre-petition secured bank credit facilities, the pre-petition senior secured term loan, the pre-petition floating rate industrial revenue bonds due 2029, as well as the Abitibi DIP Agreement (defined and discussed below) through December 9, 2009, the date such agreement was terminated. In addition, as discussed below under “Sale of our investment in MPCo,” in 2009,2010, we also paid accrued interest to the holders of our pre-petition 13.75% senior secured notes due 2011.
Debt
Emergence from Creditor Protection Proceedings
In connection with the implementation of the Plans of Reorganization:
all amounts outstanding under the Bowater DIP Agreement were paid in full in cash and the facility was terminated;
all amounts outstanding under the ULC DIP Facility were paid in full and the facility was terminated;
all outstanding receivable interests sold under the accounts receivable securitization program were repurchased in cash for a price equal to the par amount thereof and the program was terminated;
all amounts outstanding under our pre-petition secured financing agreements were paid in full in cash, including accrued interest, and the agreements governing the obligations and all other related agreements, supplements and amendments were canceled and terminated;
holders of allowed debt claims relating to the Debtors’ pre-petition unsecured indebtedness were allocated shares of the Successor Company’s common stock on account of their claims and all obligations of the Debtors thereunder were discharged and the agreements governing the obligations, including all other related agreements, supplements, amendments and arrangements, were canceled and terminated;
we assumed by merger the obligations of ABI Escrow Corporation with respect toissued $850 million in aggregate principal amount of 10.25% senior secured notes due 2018 (the “2018 Notes” or “notes”), as discussed below; and
we entered into a senior secured asset-based revolving credit facility in an amount of $600 million (the “ABL Credit Facility”), as discussed below.
Proceeds from the issuance of the 2018 Notes of $850 million, borrowings under the ABL Credit Facility of $100 million, together with cash and cash equivalents at emergence, were used to pay: (i) all amounts outstanding, including accrued interest, under our secured pre-petition debt obligations and the Bowater DIP Agreement; (ii) all outstanding secured borrowings under the accounts receivable securitization program; (iii) administrative expense claims and priority claims; (iv) other secured and convenience claims; (v) financing costs related to the 2018 Notes and the ABL Credit Facility and (vi) other payments required upon emergence.
10.25% senior secured notes due 2018
On December 9, 2010, AbitibiBowater Inc. and each of its material, wholly-owned U.S. subsidiaries entered into a supplemental indenture with Wells Fargo Bank, National Association, as trustee and collateral agent, pursuant to which AbitibiBowater Inc. assumed the obligations of ABI Escrow Corporation with respect to $850 million in aggregate principal amount of the 2018 Notes, originally issued on October 4, 2010 pursuant to an indenture as of that date (as supplemented, the “indenture”). ABI Escrow Corporation was a wholly-owned subsidiary of AbitibiBowater Inc. created solely for the purpose of issuing the 2018 Notes. The notes were issued in a private placement exempt from registration under the Securities Act of 1933 (as amended, the “Securities Act”). Interest is payable on the notes on April 15 and October 15 of each year beginning on April 15, 2011, until their maturity date of October 15, 2018. In accordance with certain conditions in the indenture, the net proceeds of the notes offering were placed into an escrow account on October 4, 2010. On December 9, 2010, upon satisfaction of the escrow conditions, the funds deposited into escrow were released to AbitibiBowater Inc. and we used the net proceeds to repay certain indebtedness pursuant to the Plans of Reorganization. On May 12, 2011, the indenture was amended and restated in its entirety to make certain technical corrections and conforming changes.
ABITIBIBOWATER INC.
Notes to Consolidated Financial Statements
The notes are and will be guaranteed by our current and future wholly-owned material U.S. subsidiaries (the “guarantors”) and are secured on a first priority basis, subject to permitted liens, by the capital stock of our subsidiaries (limited to 65% of the capital stock in first tier foreign subsidiaries) now owned or acquired in the future by AbitibiBowaterResolute Forest Products Inc. and the guarantors and substantially all of AbitibiBowaterResolute Forest Products Inc.’s and the guarantors’ assets (other than certain excluded assets and assets that are first priority collateral in respect of the ABL Credit Facility)Facility, as defined and discussed below) now owned or acquired in the future. The notes and the guarantees are also secured on a second priority basis by the collateral securing the ABL Credit Facility, including accounts receivable, inventory and cash deposit and investment accounts.
The notes rank equally in right of payment with all of AbitibiBowaterResolute Forest Products Inc.’s post-emergence senior indebtedness and senior in right of payment to all of its subordinated indebtedness. The note guarantees rank equally in right of payment with all of the guarantors’ post-emergence senior indebtedness and are senior in right of payment to all of the guarantors’ post-emergence subordinated indebtedness. In addition, the notes are structurally subordinated to all existing and future liabilities (including trade payables) of our subsidiaries that do not guarantee the notes. The notes and the guarantees are also effectively junior to indebtedness under the ABL Credit Facility to the extent of the value of the collateral that secures the ABL Credit Facility on a first priority basis and to indebtedness secured by assets that are not collateral securing the 2018 Notes to the extent of the value of such assets.
RESOLUTE FOREST PRODUCTS INC.
Notes to Consolidated Financial Statements
At any time prior to October 15, 2014, we may redeem some or all of the notes at a price equal to 100% of the principal amount plus accrued and unpaid interest plus a “make-whole” premium. We may also redeem some or all of the notes on and after October 15, 2014, at a redemption price of 105.125% of the principal amount thereof if redeemed during the twelve-month period beginning on October 15, 2014, 102.563% of the principal amount thereof if redeemed during the twelve-month period beginning on October 15, 2015, and 100% of the principal amount thereof if redeemed on or after October 15, 2016, plus, in each case, accrued and unpaid interest. We may also redeem up to 35% of the notes using the proceeds of certain equity offerings completed before October 15, 2013 at a redemption price of 110.250% of the principal amount thereof, plus accrued and unpaid interest. Prior to October 15, 2013, we may also redeem up to 10% of the notes per twelve-month period at a redemption price of 103% of the principal amount, plus accrued and unpaid interest. If we experience specific kinds of changes in control, we must offer to purchase the notes at a redemption price of 101% of the principal amount thereof plus accrued and unpaid interest. For certain of our assets, including our interest in ACH, sold within six months of the Emergence Date, we must use the first $100 million of the net proceeds received from any such sales to redeem a portion of the notes at a redemption price of 105% of the principal amount plus accrued and unpaid interest. If we sell certain of our assets thereafter, and we do not use the proceeds to pay down certain indebtedness, purchase additional assets or make capital expenditures, each as specified in the indenture, we must offer to purchase the notes at a redemption price of 100% of the principal amount thereof plus accrued and unpaid interest, if any, to the redemption date with the net cash proceeds from the asset sale.
On June 13, 2011, in accordance with the terms of the indenture, we applied the first $100 million of net proceeds from theour May 27, 2011 sale of our investment in ACH (as discussed above) to redeem $94 million of principal amount of the 2018 Notes at a redemption price of 105% of the principal amount, plus accrued and unpaid interest. Additionally, on botheach of June 29, 2011, and November 4, 2011 and October 10, 2012, we redeemed $85 million of principal amount of the 2018 Notes at a redemption price of 103% of the principal amount, plus accrued and unpaid interest. As a result of these redemptions, during the yearyears ended December 31, 2012 and 2011, we recorded net gains on extinguishment of debt of $2 million and $6 million, respectively, which were included in “Other expense,income (expense), net” in our Consolidated Statements of Operations.
The terms of the indenture impose certain restrictions, subject to a number of exceptions and qualifications, on us, including limits on our ability to: incur, assume or guarantee additional indebtedness; issue redeemable stock and preferred stock; pay dividends or make distributions or redeem or repurchase capital stock; prepay, redeem or repurchase certain debt; make loans and investments; incur liens; restrict dividends, loans or asset transfers from our subsidiaries; sell or otherwise dispose of assets, including capital stock of subsidiaries; consolidate or merge with or into, or sell substantially all of our assets to, another person; enter into transactions with affiliates and enter into new lines of business. The indenture also contains customary events of default.
As a result of our application of fresh start accounting, as of December 31, 2010, the 2018 Notes were recorded at their fair value, of $905 million, which resulted in a premium, of $55 million, which is being amortized to interest expense using the effective interest method over the term of the notes. As of December 31, 2011, the carrying value of the 2018 Notes was $621 million, which included the unamortized premium of $35 million,notes, resulting in an effective interest rate of 9.1%.
ABITIBIBOWATER INC.
Notes to Consolidated Financial Statements
as of December 31, 2012.
In connection with the issuance of the notes, during 2010, we incurred fees of $27 million, which were written off to “Reorganization items, net” in our Consolidated Statements of Operations as a result of the application of fresh start accounting.
The fair value of the 2018 Notes was $576 million and $649 million as of December 31, 2012 and 2011, respectively. The fair value was determined by reference to quoted market prices (Level 1).
ABL Credit Facility
On December 9,In connection with our emergence from the Creditor Protection Proceedings in 2010, AbitibiBowater Inc.we and three of itsour post-emergence wholly-owned subsidiaries, AbiBow US Inc., which has been renamed Resolute FP US Inc., and AbiBow Recycling LLC (collectively, the “U.S. Borrowers”) and AbiBow Canada Inc., which has been renamed Resolute FP Canada Inc. (the “Canadian Borrower” and, together with the U.S. Borrowers, the “Borrowers”), entered into the ABLa senior secured asset-based revolving credit facility (the “ABL Credit FacilityFacility”) with certain lenders and Citibank, N.A., as administrative agent and collateral agent (the “agent”).a syndicate of lenders.
On October 28, 2011, the Borrowers and the subsidiaries of AbitibiBowater Inc. that are guarantors of the ABL Credit Facility entered into an amendment (the “amendment”) to the credit agreement that governs the ABL Credit Facility. The ABL Credit Facility, as amended, matures on October 28, 2016 and provides for an asset-based, revolving credit facility with an aggregate lender commitment of up to $600 million at any time outstanding, subject to borrowing base availability, including a $60 million (increased from $20 million) swingline sub-facility and a $200 million (increased from $150 million) letter of credit sub-facility. The ABL Credit Facility includes a $400 million tranche available to the Borrowers and a $200 million tranche available solely to the U.S. Borrowers, in each case subject to the borrowing
RESOLUTE FOREST PRODUCTS INC.
Notes to Consolidated Financial Statements
base availability of those Borrowers. The ABL Credit Facility also provides for an uncommitted incremental loan facility of up to $100 million, subject to certain terms and conditions set forth in the ABL Credit Facility. The amendment extends the maturity of the ABL Credit Facility from December 9, 2014 to October 28, 2016.
Revolving loan (and letter of credit) availability under the ABL Credit Facility is subject to a borrowing base, which at any time is equal to: (a) for U.S. Borrowers, the sum of (i) 85% of eligible accounts receivable of the U.S. Borrowers plus (ii) the lesser of 65% of eligible inventory of the U.S. Borrowers or 85% of the net orderly liquidation value of eligible inventory of the U.S. Borrowers, minus certain reserves established by the agent and (b) for the Canadian Borrower, the sum of (i) 85% of eligible accounts receivable of the Canadian Borrower plus (ii) the lesser of 65% of eligible inventory of the Canadian Borrower or 85% of the net orderly liquidation value of eligible inventory of the Canadian Borrower, minus reserves established by the agent.
The borrowing base availability of each borrower is subject to certain reserves, which are established by the agent in its discretion. The reserves may include dilution reserves, inventory reserves, rent reserves and any other reserves that the agent determines are necessary and have not already been taken into account in the calculation of the borrowing base. As of December 31, 2010, an additional reserve of $286 million was in place against the borrowing base of the Canadian Borrower until the adoption, by the governments of Quebec and Ontario, of regulations to implement previously-announced funding relief with respect to aggregate solvency deficits in our material Canadian registered pension plans, as discussed in Note 18, “Pension and Other Postretirement Benefit Plans – Canadian pension funding relief.” As of the third quarter of 2011, both the provinces of Quebec and Ontario had adopted these funding relief regulations. As a result, this reserve against the borrowing base of the Canadian Borrower was removed in the third quarter of 2011.reserves.
The obligations of the U.S. Borrowers under the ABL Credit Facility are guaranteed by each of the other U.S. Borrowers and certain of our material U.S. subsidiaries of AbitibiBowater Inc. (the “U.S. Guarantors”), and secured by first priority liens on and security interests in accounts receivable, inventory and related assets of the U.S. Borrowers and the U.S. Guarantors and second priority liens on and security interests in all of the collateral of the U.S. Borrowers and the U.S. Guarantors pledged to secure the 2018 Notes, as described above. The obligations of the Canadian Borrower under the ABL Credit Facility are guaranteed by each of the other Borrowers, the U.S. Guarantors and certain of our material Canadian subsidiaries of AbitibiBowater Inc. (the “Canadian Guarantors” and, together with the U.S. Guarantors, the “Guarantors”), and are secured by first priority liens on and security interests in accounts receivable, inventory and related assets of the Borrowers and the Guarantors and second priority liens on and security interests in all of the collateral of the U.S. Borrowers and the U.S. Guarantors pledged to secure the 2018 Notes.
Borrowings under the ABL Credit Facility bear interest at a rate equal to, at the Borrower’s option, the base rate, the Canadian prime rate or the Eurodollar rate, in each case plus an applicable margin. The base rate under the ABL Credit Facility equals the greater of: (i) the agent’sa specified base rate, (ii) the Federal Funds rate plus 0.5%, (iii) the agent’sa specified rate for certificates of deposit having a term of three months plus 0.5% or (iv) the Eurodollar rate for a one month interest period plus 1.0%. The amendment reduced the interest rate margin applicable to borrowings under the ABL Credit Facility, toas amended, is 1.75% – 2.25% per annum with respect to Eurodollar rate and bankers’ acceptance rate borrowings (reduced from 2.75% – 3.25%) and 0.75% – 1.25% per annum with respect to base rate and Canadian prime rate borrowings, (reduced from 1.75% – 2.25%), in each case depending on excess availability under the ABL Credit Facility. The applicable margin is subject, in each case, to monthly pricing adjustments based on the average monthly excess availability under the ABL Credit Facility, with such adjustments commencing after the end of the second full fiscal quarter following the Emergence Date.
ABITIBIBOWATER INC.
Notes to Consolidated Financial Statements
Facility.
In addition to paying interest on the outstanding borrowings under the ABL Credit Facility, the Borrowers are required to pay a fee in respect of unutilized commitments, which was equal to 0.75% per annum initially. Commencing after the end of the second full fiscal quarter following the Emergence Date, the fee is subject to monthly pricing adjustments based on the unutilized commitment of the ABL Credit Facility over the prior month. Initially, the Borrowers were required to pay a fee equal to 0.75% per annum when the unutilized commitment of the ABL Credit Facility was greater than or equal to 50% of the total commitments and 0.50% per annum when the unutilized commitment of the ABL Credit Facility was less than 50% of the total commitments. The amendment reduced the unutilized commitment fee payable by the Borrowers under the ABL Credit Facility, toas amended, is 0.375% – 0.50% per annum, subject to monthly pricing adjustments based on the unutilized commitment of the ABL Credit Facility. The Borrowers must also pay a fee on outstanding letters of credit under the ABL Credit Facility at a rate equal to the applicable margin in respect of Eurodollar borrowings, plus a facing fee as agreed to in writing from time to time, and certain administrative fees.
The Borrowers are able to voluntarily repay outstanding loans and reduce unused commitments, in each case, in whole or in part, at any time without premium or penalty. The Borrowers are required to repay outstanding loans anytime the outstanding loans exceed the maximum availability then in effect. The Borrowers are also required to use net proceeds from certain significant asset sales to repay outstanding loans, but may re-borrow following such prepayments if the conditions to borrowings are met.
The ABL Credit Facility contains customary covenants for asset-based credit agreements of this type, including, among other things: (i) requirements to deliver financial statements, other reports and notices; (ii) restrictions on the existence or incurrence and repayment of indebtedness; (iii) restrictions on the existence or incurrence of liens; (iv) restrictions on making certain restricted payments; (v) restrictions on making certain investments; (vi) restrictions on certain mergers, consolidations and asset dispositions; (vii) restrictions on transactions with affiliates; (viii) restrictions on amendments or modifications to the Canadian pension and benefit plans and (ix) restrictions on modifications to material indebtedness. Additionally, the amendment reduced to 1.0:1.0 (reduced from 1.1:1.0) thea minimum consolidated fixed charge coverage ratio of 1.0:1.0 is required if at any time excess availability falls below the greater of: (i) $60 million and (ii) 12.5% of the lesser of (A) the total commitments and (B) the borrowing base then in effect. PriorAn amendment to the effectiveness of the amendment, this springing fixed charge coverage ratio covenant was triggered if excess availability fell below 15% of the total commitments thenABL Credit Facility in effect. The amendment also eases2011 eased certain other covenants, including covenants restricting our ability to: (i) prepay certain indebtedness, (ii) consummate permitted acquisitions and (iii) make certain restricted payments. Subject to customary grace periods and notice requirements, the ABL Credit Facility also contains customary events of default.
As of December 31, 2011,2012, the Borrowers had no borrowings and $62$54 million of letters of credit outstanding under the ABL Credit Facility. As of December 31, 2011,2012, we had $515$519 million of availability under the ABL Credit Facility, which was comprised of $280$259 million for the U.S. Borrowers and $235$260 million for the Canadian Borrower.
RESOLUTE FOREST PRODUCTS INC.
Notes to Consolidated Financial Statements
In accordance with its stated purpose, the proceeds of the ABL Credit Facility were used to fund amounts payable under the Plans of Reorganization and can be used by us for, among other things, working capital, capital expenditures, permitted acquisitions and other general corporate purposes. Upon receipt of the NAFTA settlement amount (see Note 3,4, “Creditor Protection Proceedings – Reorganization items, net”), we repaid the $100 million we had borrowed on the Emergence Date under the ABL Credit Facility.
As consideration for amending the ABL Credit Facility in 2011 and entering into the ABL Credit Facility in 2010, during 2011 and 2010, we incurred fees of $3 million and $19 million, respectively, which were recorded as deferred financing costs in “Other assets” in our Consolidated Balance Sheets as of December 31, 2011 and 2010, respectively, and are being amortized to interest expense over the term of the facility.
Other debt
As discussed in Note 3, “Acquisition of Fibrek Inc.,” we assumed Fibrek’s outstanding indebtedness on the acquisition date. As of December 31, 2012, Fibrek’s term loan and credit facility, totaling $112 million of principal, were repaid in full, plus accrued and unpaid interest, and the related agreements were cancelled and terminated.
PSIF – Investissement Quebec
On February 23, 2007, Fibrek obtained a Cdn$6 million interest-free loan granted by Investissement Quebec through the Soutien à l’industrie forestière program (“PSIF”) to support investments made in the forest products industry. The loan is payable in monthly installments over a maximum of four years starting December 31, 2010. Under the loan agreement, Fibrek must comply with certain restrictive covenants, including the requirement to meet certain financial ratios. As of December 31, 2012, the fair value of the loan approximated its carrying value of $3 million. The fair value was determined by discounting the cash flows using a current interest rate (4.6%) for financial instruments with similar characteristics and maturities (Level 3).
Capital lease obligation
We have a capital lease obligation for a warehouse, which can be renewed for 20 years at our option. Minimal payments are determined by an escalatory price clause.
Promissory note
As of December 31, 2010,On January 14, 2011, we acquired the noncontrolling interest in Augusta Newsprint Company (“ANC”), which operates our newsprint mill in Augusta, Georgia, was owned 52.5% by us. Our consolidated financial statements included this entity on a fully consolidated basis. On January 14, 2011, we acquired the noncontrolling interest in ANC and ANC became a wholly-owned subsidiary of ours.subsidiary. As part of the consideration for the transaction, ANC paid cash of $15 million and issued a secured promissory note (the “note”) in the principal amount of $90 million. The acquisition of the noncontrolling interest in ANC was accounted for as an equity transaction. On June 30, 2011, the note, including accrued interest, was repaid with cash in full.
Assets pledged as collateral
The carrying value of assets pledged as collateral for our total debt obligations was approximately $3.8 billion as of December 31, 2012.
ABITIBIBOWATERCreditor Protection Proceedings
In connection with the implementation of the Plans of Reorganization, proceeds from the issuance of the 2018 Notes of $850 million, borrowings under the ABL Credit Facility of $100 million, together with cash and cash equivalents at emergence, were used to pay: (i) all amounts outstanding, including accrued interest, under our secured pre-petition debt obligations and debtor in possession financing agreements; (ii) all outstanding secured borrowings under our former accounts receivable securitization program; (iii) administrative expense claims and priority claims; (iv) other secured and convenience claims; (v) financing costs related to the 2018 Notes and the ABL Credit Facility and (vi) other payments required upon emergence.
Holders of allowed debt claims relating to the Debtors’ pre-petition unsecured indebtedness were allocated shares of the Successor Company’s common stock on account of their claims and all obligations of the Debtors thereunder were discharged. The agreements governing all of our pre-petition debt obligations, debtor in possession financing arrangements and former accounts receivable securitization program, including all other related agreements, supplements, amendments and arrangements, as applicable, were canceled and terminated.
RESOLUTE FOREST PRODUCTS INC.
Notes to Consolidated Financial Statements
Interest expense
Interest expense recorded in our Consolidated Statements of Operations totaled $95 million in 2011, $483 million in 2010 and $597 million in 2009. The decrease in interest expense in 2011 compared to 2010 was primarily due to significantly lower debt levels in connection with our emergence from the Creditor Protection Proceedings. Additionally, interest expense in 2010 included a cumulative adjustment of $43 million to increase the accrued interest on the unsecured U.S. dollar denominated debt obligations of the CCAA filers to a fixed exchange rate, as further discussed in Note 3, “Creditor Protection Proceedings – Reorganization items, net.” The decrease in interest expense in 2010 compared to 2009 was a result of ceasing to accrue interest on certain of our pre-petition debt obligations. In accordance with FASB ASC 852, during the Creditor Protection Proceedings, we recorded interest expense on our pre-petition debt obligations only to the extent that: (i) interest would be paid during the Creditor Protection Proceedings or (ii) it was probable that interest would be an allowed priority, secured or unsecured claim. As such, during the Creditor Protection Proceedings, we continued to accrue interest on the Debtors’ pre-petition secured debt obligations and, until the third quarter of 2010, the CCAA filers’ pre-petition unsecured debt obligations. See Note 3,4, “Creditor Protection Proceedings – Reorganization items, net,” for a discussion of the reversal of post-petition accrued interest on the CCAA filers’ pre-petition unsecured debt obligations. Interest expense in 2010 also included accrued interest on the 2018 Notes, which were issued on October 4, 2010, as discussed above. Contractual interest expense was $714 million in 2010 and $788 million in 2009.
Fair value of total debt
The fair value of our total debt was determined by reference to quoted market prices or by discounting the cash flows using current interest rates for financial instruments with similar characteristics and maturities. The fair value of our debt as of December 31, 2011 and 2010 was approximately $649 million and $1.2 billion (including ACH’s long-term debt of $280 million, which was included in “Liabilities associated with assets held for sale” in our Consolidated Balance Sheet as of December 31, 2010), respectively.
Assets pledged as collateral
The carrying value of assets pledged as collateral for our total debt obligations was approximately $3.8 billion as of December 31, 2011.
Financings during Creditor Protection Proceedings
Bowater DIP Agreement
On April 21, 2009, we entered into a Senior Secured Superpriority Debtor In Possession Credit Agreement (the “Bowater DIP Agreement”) among AbitibiBowater Inc., Bowater Incorporated (“Bowater,” a former subsidiary of ours) and Bowater Canadian Forest Products Inc. (“BCFPI,” a former subsidiary of Bowater), as borrowers, Fairfax, as administrative agent, collateral agent and an initial lender, and Avenue Investments, L.P., as an initial lender. Law Debenture Trust Company of New York replaced Fairfax as the administrative agent and collateral agent under the Bowater DIP Agreement.
The Bowater DIP Agreement provided for term loans in an aggregate principal amount of $206 million (the “Initial Advance”). In connection with an amendment we entered into on July 15, 2010, we prepaid $166 million of the outstanding principal amount of the Initial Advance on July 21, 2010. On the Emergence Date and pursuant to the Plans of Reorganization, the remaining outstanding balance of $40 million, plus accrued interest, was paid in full in cash and the Bowater DIP Agreement was terminated.
In 2010, as consideration for two extensions to the Bowater DIP Agreement, the amendment discussed above, as well as the exit fee that was required to be paid to the lenders upon repayment of the outstanding balance, we incurred fees totaling $6 million. In 2009, as consideration for entering into the Bowater DIP Agreement, we incurred fees of $14 million. All of these fees were recorded in “Reorganization items, net” in our Consolidated Statements of Operations (see Note 3, “Creditor Protection Proceedings – Reorganization items, net”).
Accounts receivable securitization program
Abitibi-Consolidated Inc. (“Abitibi”) and Abitibi Consolidated Sales Corporation (two former subsidiaries of ours, the “Participants”) participated in an accounts receivable securitization program (the “Program”) whereby the Participants shared among themselves the proceeds received under the Program. On June 16, 2009, the former accounts receivable securitization program was amended and restated in its entirety and, as further amended on June 11, 2010, provided for a maximum outstanding limit of $180 million (the “Purchase Limit”) for the purchase of ownership interests in the Participants’ eligible trade accounts receivable by the third-party financial institutions party to the agreement (the “Banks”). On the Emergence Date and pursuant to the Plans of Reorganization, all outstanding receivable interests sold under the Program were repurchased in cash for a price equal to the par amount thereof and the Program was terminated.
ABITIBIBOWATER INC.
Notes to Consolidated Financial Statements
In 2009, the transfers of receivable interests to the agent for the Banks were accounted for as sales in accordance with FASB ASC 860. The proceeds received from the Banks were net of an amount based on the Banks’ funding cost plus a margin, which resulted in a loss on the sale of ownership interests in accounts receivable of $17 million in 2009, which was included in “Other expense, net” in our Consolidated Statements of Operations. Effective January 1, 2010, we prospectively applied new accounting guidance relating to the transfers of financial assets. As a result, transfers of the receivable interests to the agent for the Banks no longer qualified as sales. Beginning January 1, 2010, such transfers and the proceeds received from the Banks were accounted for as secured borrowings in accordance with FASB ASC 860. On the Emergence Date, in connection with the termination of the Program, we paid the outstanding balance of secured borrowings of $120 million in full in cash to the Banks. In 2010, the interest on the secured borrowings and the commitment fee for the unused portion of the Purchase Limit charged by the Banks totaled $11 million, which was included in “Interest expense” in our Consolidated Statements of Operations.
In 2010, as consideration for entering into the amendment to the Program, we incurred fees of $4 million. In 2009, as consideration for entering into the amended and restated accounts receivable securitization program, we incurred fees of $11 million. All of these fees were recorded in “Reorganization items, net” in our Consolidated Statements of Operations (see Note 3, “Creditor Protection Proceedings – Reorganization items, net”).
ULC DIP Facility
On December 9, 2009, Abitibi entered into a Cdn$230 million ($218 million, based on the exchange rate in effect on December 9, 2009) Super Priority Debtor-In-Possession Credit Facility (the “ULC DIP Facility”) with 3239432 Nova Scotia Company, a former wholly-owned subsidiary of ours (the “ULC”), which was an intercompany facility that was created upon the sale of MPCo and was funded by a portion of the sale proceeds, as discussed below. On the same date, Cdn$130 million ($123 million, based on the exchange rate in effect on December 9, 2009) of the ULC DIP Facility was drawn. Loans made under the ULC DIP Facility bore no interest. On the Emergence Date and pursuant to the Plans of Reorganization, all amounts outstanding under the ULC DIP Facility were paid in full and the facility was terminated.
The ULC maintained a reserve of approximately Cdn$83 million ($81 million, based on the exchange rate in effect on December 31, 2011) and Cdn$80 million ($80 million, based on the exchange rate in effect on December 31, 2010) as of December 31, 2011 and 2010, respectively, in connection with a guarantee agreement with Alcoa. This reserve was included as restricted cash in “Other assets” in our Consolidated Balance Sheets as of December 31, 2011 and 2010.
Abitibi DIP Agreement
On May 6, 2009, we entered into a letter loan agreement (the “Abitibi DIP Agreement”), among Abitibi and another former subsidiary of ours, as borrowers, certain subsidiaries of Abitibi, as guarantors, and the Bank of Montreal, as lender, which was acknowledged by Investissement Quebec, as sponsor. On December 9, 2009, in connection with the consummation of the MPCo Transactions (as defined and discussed below), we repaid all amounts outstanding under the Abitibi DIP Agreement, totaling $55 million, and terminated the Abitibi DIP Agreement.
In 2009, in connection with entering into and extending the Abitibi DIP Agreement through December 15, 2009, we incurred fees of $6 million, which were recorded in “Reorganization items, net” in our Consolidated Statements of Operations (see Note 3, “Creditor Protection Proceedings – Reorganization items, net”).
Sale of our investment in MPCo
On December 9, 2009, we announced the closing of a series of transactions resulting in the sale of our 60% interest in MPCo to HQ Manicouagan Inc., a wholly-owned direct subsidiary of Hydro-Quebec, for gross cash proceeds of Cdn$615 million ($583 million, based on the exchange rate in effect on December 9, 2009) (the “MPCo Transactions”). We applied the proceeds from the sale as follows, which reflect the exchange rate to U.S. dollars in effect on December 9, 2009:
$267 million was set aside temporarily in the ULC to secure certain indemnities and undertakings provided to Alcoa under the MPCo Transactions, and the ULC entered into a guarantee agreement with Alcoa for this purpose. Of the $267 million set aside in the ULC, $218 million was used by the ULC to fund the ULC DIP Facility;
ABITIBIBOWATER INC.
Notes to Consolidated Financial Statements
$55 million was used to repay all amounts outstanding under the Abitibi DIP Agreement, $26 million of which was paid from the proceeds of the ULC DIP Facility;
$113 million was used as a partial repayment of our pre-petition 13.75% senior secured notes due 2011, $72 million was used to pay accrued interest on such notes and $5 million was used to cover fees related to the partial repayment of such notes;
approximately $67 million was used to pay Alcoa in respect of taxes that it incurred as a result of the MPCo Transactions, as well as our estimated transaction costs, pre-petition amounts owed to the distribution division of Hydro-Quebec by us and pre-petition amounts owed to MPCo and Alcoa for electricity purchased by us from MPCo and to make certain other adjustments contemplated by the MPCo Transactions; and
approximately $29 million was subject to a two-year holdback by HQ Manicouagan Inc. (and guaranteed by Hydro-Quebec) and was included in “Other assets” in our Consolidated Balance Sheet as of December 31, 2010. In December 2011, and based on the exchange rate in effect on December 31, 2011, we received the holdback amount of $29 million, as well as interest income of approximately $2 million.
For additional information, see Note 5, “Closure Costs, Impairment and Other Related Charges – Impairment of assets held for sale,” and Note 6, “Assets Held for Sale, Liabilities Associated with Assets Held for Sale and Net Gain on Disposition of Assets and Other – Net gain on disposition of assets and other.”
Note 17. Monetization of Timber Notes
In connection with certain timberland sales transactions in 2002 and prior years, we received a portion of the sale proceeds in notes receivable from institutional investors. In order to increase our liquidity, we monetized these notes receivable using QSPEs set up in accordance with FASB ASC 860. The more significant aspects of the QSPEs are as follows:
The QSPEs are not consolidated within our financial statements. The business purpose of the QSPEs is to hold the notes receivable and issue fixed and floating rate senior notes, which are secured by the notes receivable, to third parties. The value of these debt securities is equal to approximately 90% of the value of the notes receivable. The full principal amounts of the notes receivable are backed by letters of credit issued by third-party financial institutions.
Our retained interest consists principally of the net excess cash flows (the difference between the interest received on the notes receivable and the interest paid on the debt issued by the QSPE to third parties) and a cash reserve account. Fair value of our retained interests was estimated based on the present value of future excess cash flows to be received over the life of the notes, using management’s best estimate of key assumptions, including credit risk and discount rates. Our retained interest is recorded at a proportional amount of the previous carrying amount of the notes receivable and treated as interest-bearing investments.
The cash reserve accounts were established at inception and are required to meet specified minimum levels throughout the life of the debt issued by the QSPEs to third-party investors. Any excess cash flows revert to us on a quarterly or semi-annual basis. The balance of the cash reserve accounts, if any, reverts to us at the maturity date of the third-party debt.
With respect to Calhoun Note Holdings AT LLC and Calhoun Note Holdings TI LLC, we may be required to make capital contributions to these QSPEs from time to time in sufficient amounts so that these QSPEs will be able to comply with their covenants regarding the payment of taxes, maintenance as entities in good standing, transaction fees, contractual indemnification of the collateral agent and certain other parties, and the maintenance of specified minimum amounts in the cash reserve account. Notwithstanding these covenants, because of the expected net available cash flow to these QSPEs (interest and principal on notes receivable backed by letters of credit will be in excess of interest and principal on debt securities), we do not expect to be required to make additional capital contributions, nor have any capital contributions been required to date.
No QSPEs are permitted to hold our common stock and there are no commitments or guarantees that provide for the potential issuance of our common stock. These entities do not engage in speculative activities of any description and are not used to hedge AbitibiBowater positions, and no AbitibiBowater employee is permitted to invest in any QSPE.
ABITIBIBOWATER INC.
Notes to Consolidated Financial Statements
As discussed in Note 3, “Creditor Protection Proceedings – Reorganization items, net,” the commencement of the Creditor Protection Proceedings constituted an event of default under the note purchase agreements for three of our QSPEs, which resulted in a 200 basis point increase in the interest rate payable to the note holders. As a result, our retained interest was impaired. Accordingly, we recorded impairment charges totaling $21 million for the year ended December 31, 2009, which were included in “Reorganization items, net” in our Consolidated Statements of Operations, to reduce our retained interest in these three QSPEs to zero. We were not obligated to fund the shortfall in interest payments due to the note holders. In the fourth quarter of 2010, we transferred our interests in these three QSPEs to a third-party for the benefit of the note holders of the debt issued by these QSPEs.
The following summarizes our retained interest in the QSPEs included in “Other assets” in our Consolidated Balance Sheets as of December 31, 2011 and 2010:
| Successor | ||||||||||
| (In millions) | 2011 | 2010 | ||||||||
Calhoun Note Holdings AT LLC | $ | 8 | $ | 8 | ||||||
Calhoun Note Holdings TI LLC | 12 | 11 | ||||||||
| $ | 20 | $ | 19 | |||||||
Note 18. Pension and Other Postretirement Benefit Plans
We have multiple contributory and non-contributory defined benefit pension plans covering a significant portion of our U.S. and Canadian employees. We also sponsor a number of OPEB benefit plans (e.g., defined benefit health care and life insurance plans) for retirees at certain locations. Benefits are based on years of service and, depending on the plan, average compensation earned by employees either during their last years of employment or over their careers. Our plan assets and cash contributions to the plans have been sufficient to provide pension benefits to participants and meet the funding requirements of ERISA in the United States and, prior to the CCAA Proceedings,proceedings, applicable pension benefits legislation in Canada. In connection with the CCAA Proceedings,proceedings, on May 8, 2009, the Canadian Court approved a reduction in the cash contributions required for our Canadian pension plans. As a result, subsequent to that date and through the Emergence Date, the cash contributions we made to our Canadian pension plans were sufficient to meet the funding requirements for current service costs, but not for prior service costs. Suspended contributions for past service costs associated with our Canadian pension plans were estimated to be approximately $159 million on an annual basis. Prior to our emergence from the Creditor Protection Proceedings, we entered into agreements with the provinces of Quebec and Ontario relating in part to funding relief in respect of the material aggregate solvency deficits in our registered pension plans in these provinces, as further discussed below under “Canadian pension funding relief.funding.”
In addition to the previously described plans, we have a number of defined contribution plans covering substantially all of our U.S. employees and a significant portion of our Canadian employees. Under the U.S. defined contribution plans, employees are allowed to contribute to these plans and we make matching contributions. Effective April 1, 2009, the matching contribution was suspended for non-union employees but was reinstated effective January 1, 2011. In addition, under the U.S. defined contribution plans, most non-union employees also receive an automatic company contribution, regardless of the employee’s contribution. The amount of the automatic company contribution is a percentage of the employee’s pay, determined based on age and years of service. The Canadian registered defined contribution plans provide for mandatory contributions by employees and by us, as well as opportunities for employees to make additional optional contributions and receive, in some cases, matching contributions on those optional amounts. Our expense for the defined contribution plans totaled $21 million in 2012, $22 million in 2011 and $12 million in 2010 and $14 million in 2009.2010.
Certain of the above plans are covered under collective bargaining agreements.
RESOLUTE FOREST PRODUCTS INC.
Notes to Consolidated Financial Statements
The following tables include both our foreign (Canada and South Korea) and domestic (U.S.) plans. The pension and OPEB benefitassumptions used to measure the obligations of theeach of our foreign and domestic plans are significant relative to the total benefit obligations; however,not significantly different from each other, with the exception of the health care trend rates, the assumptions used to measure the obligations of those planswhich are not significantly different from those used for our domestic plans.
ABITIBIBOWATER INC.
Notes to Consolidated Financial Statements
presented below.
The changes in our pension and OPEB benefit obligations and plan assets for the years ended December 31, 20112012 and 20102011 and the funded status and reconciliation of amounts recognized in our Consolidated Balance Sheets as of December 31, 20112012 and 20102011 were as follows:
| Pension Plans | OPEB Plans | Successor | ||||||||||||||||||||||||||||||||||||||||
| Successor | Predecessor | Successor | Predecessor | Pension Plans | OPEB Plans | |||||||||||||||||||||||||||||||||||||
| (In millions) | 2011 | 2010 | 2011 | 2010 | 2012 | 2011 | 2012 | 2011 | ||||||||||||||||||||||||||||||||||
Change in benefit obligations: | ||||||||||||||||||||||||||||||||||||||||||
Benefit obligations as of beginning of year | $ | 6,302 | $ | 5,665 | $ | 408 | $ | 382 | ||||||||||||||||||||||||||||||||||
Benefit obligations as of beginning of year | $ | 6,411 | $ | 6,302 | $ | 404 | $ | 408 | ||||||||||||||||||||||||||||||||||
Service cost | 35 | 41 | 3 | 4 | 36 | 35 | 3 | 3 | ||||||||||||||||||||||||||||||||||
Interest cost | 335 | 350 | 22 | 23 | 312 | 335 | 20 | 22 | ||||||||||||||||||||||||||||||||||
Actuarial loss (gain) | 397 | 649 | (6) | 29 | 488 | 397 | 13 | (6 | ) | |||||||||||||||||||||||||||||||||
Participant contributions | 17 | 21 | 5 | 5 | 15 | 17 | 5 | 5 | ||||||||||||||||||||||||||||||||||
Plan amendments | 1 | – | – | (8) | (30 | ) | 1 | – | – | |||||||||||||||||||||||||||||||||
Plan amendments upon emergence from the Creditor Protection Proceedings | – | (22) | – | (4) | ||||||||||||||||||||||||||||||||||||||
Curtailments and settlements | (66) | (16) | 4 | – | (51 | ) | (66 | ) | – | 4 | ||||||||||||||||||||||||||||||||
Curtailments and settlements upon emergence from the Creditor Protection Proceedings | – | (98) | – | – | ||||||||||||||||||||||||||||||||||||||
Deconsolidation of BPCL (Note 1 and Note 3) | – | (92) | – | – | ||||||||||||||||||||||||||||||||||||||
Acquisition | 133 | – | 3 | – | ||||||||||||||||||||||||||||||||||||||
Divestiture | (239 | ) | – | (4 | ) | – | ||||||||||||||||||||||||||||||||||||
Benefits paid | (502) | (461) | (29) | (31) | (506 | ) | (502 | ) | (25 | ) | (29 | ) | ||||||||||||||||||||||||||||||
Effect of foreign currency exchange rate changes | (108) | 265 | (3) | 8 | 155 | (108 | ) | 5 | (3 | ) | ||||||||||||||||||||||||||||||||
Benefit obligations as of end of year (Successor) | 6,411 | 6,302 | 404 | 408 | ||||||||||||||||||||||||||||||||||||||
Benefit obligations as of end of year | 6,724 | 6,411 | 424 | 404 | ||||||||||||||||||||||||||||||||||||||
Change in plan assets: | ||||||||||||||||||||||||||||||||||||||||||
Fair value of plan assets as of beginning of year | 5,422 | 5,241 | – | – | ||||||||||||||||||||||||||||||||||||||
Fair value of plan assets as of beginning of year | 5,259 | 5,422 | – | – | ||||||||||||||||||||||||||||||||||||||
Actual return on plan assets | 294 | 458 | – | – | 348 | 294 | – | – | ||||||||||||||||||||||||||||||||||
Employer contributions | 196 | 50 | 24 | 26 | 103 | 196 | 20 | 24 | ||||||||||||||||||||||||||||||||||
Participant contributions | 17 | 21 | 5 | 5 | 15 | 17 | 5 | 5 | ||||||||||||||||||||||||||||||||||
Settlements | (71) | (14) | – | – | (62 | ) | (71 | ) | – | – | ||||||||||||||||||||||||||||||||
Settlements upon emergence from the Creditor Protection Proceedings | – | (43) | – | – | ||||||||||||||||||||||||||||||||||||||
Deconsolidation of BPCL (Note 1 and Note 3) | – | (67) | – | – | ||||||||||||||||||||||||||||||||||||||
Acquisition | 97 | – | – | – | ||||||||||||||||||||||||||||||||||||||
Divestiture | (209 | ) | – | – | – | |||||||||||||||||||||||||||||||||||||
Benefits paid | (502) | (461) | (29) | (31) | (506 | ) | (502 | ) | (25 | ) | (29 | ) | ||||||||||||||||||||||||||||||
Effect of foreign currency exchange rate changes | (97) | 237 | – | – | 130 | (97 | ) | – | – | |||||||||||||||||||||||||||||||||
Fair value of plan assets as of end of year (Successor) | 5,259 | 5,422 | – | – | ||||||||||||||||||||||||||||||||||||||
Funded status as of end of year (Successor) | $ | (1,152) | $ | (880) | $ | (404) | $ | (408) | ||||||||||||||||||||||||||||||||||
Fair value of plan assets as of end of year | 5,175 | 5,259 | – | – | ||||||||||||||||||||||||||||||||||||||
Funded status as of end of year | $ | (1,549 | ) | $ | (1,152 | ) | $ | (424 | ) | $ | (404 | ) | ||||||||||||||||||||||||||||||
Amounts recognized in our Consolidated Balance Sheets consisted of (Successor): | ||||||||||||||||||||||||||||||||||||||||||
Amounts recognized in our Consolidated Balance Sheets | ||||||||||||||||||||||||||||||||||||||||||
Other assets | $ | 2 | $ | 19 | $ | – | $ | – | $ | 3 | $ | 2 | $ | – | $ | – | ||||||||||||||||||||||||||
Accounts payable and accrued liabilities | (9) | (7) | (25) | (28) | (4 | ) | (9 | ) | (26 | ) | (25 | ) | ||||||||||||||||||||||||||||||
Pension and OPEB benefit obligations | (1,145) | (892) | (379) | (380) | (1,548 | ) | (1,145 | ) | (398 | ) | (379 | ) | ||||||||||||||||||||||||||||||
Net obligations recognized | $ | (1,152) | $ | (880) | $ | (404) | $ | (408) | $ | (1,549 | ) | $ | (1,152 | ) | $ | (424 | ) | $ | (404 | ) | ||||||||||||||||||||||
The sum of the benefit obligations and the sum of the fair value of plan assets for pension plans with benefit obligations in excess of plan assets were $6,633 million and $5,078 million, respectively, as of December 31, 2012, and were $6,351 million and $5,197 million, respectively, as of December 31, 2011, and were $5,368 million and $4,469 million, respectively, as of December 31, 2010.2011. The sum of the accumulated benefit obligations and the sum of the fair value of plan assets for pension plans with accumulated benefit obligations in excess of plan assets were $6,546 million and $5,078 million, respectively, as of December 31, 2012, and were $6,288 million and $5,197 million, respectively, as of December 31, 2011, and were $4,906 million and $4,063 million, respectively, as of December 31, 2010.2011. The total accumulated benefit obligations for all pension plans were $6,348$6,639 million and $6,242$6,348 million as of December 31, 2012 and 2011, respectively.
In 2012, following the renewal of the 2009 collective agreements in our Canadian pulp and paper mills, we cancelled 2011 and 2010, respectively.2013 ad hoc indexations as part of the emergence from the Creditor Protection Proceedings. This plan amendment resulted in a prior service credit of $30 million. The reduction in benefit obligation was reflected in the year-end obligation and the prior service credit will be amortized over the expected average remaining service lifetime of the respective plans beginning in 2013.
ABITIBIBOWATERRESOLUTE FOREST PRODUCTS INC.
Notes to Consolidated Financial Statements
The components of net periodic benefit cost relating to our pension and OPEB plans for the years ended December 31, 2012, 2011 2010 and 20092010 were as follows:
| Pension Plans | OPEB Plans | |||||||||||||||||||||||||||||
| Successor | Predecessor | Successor | Predecessor | |||||||||||||||||||||||||||
| 2011 | 2010 | 2009 | 2011 | 2010 | 2009 | |||||||||||||||||||||||||
Service cost | $ | 35 | $ | 41 | $ | 40 | $ | 3 | $ | 4 | $ | 3 | ||||||||||||||||||
Interest cost | 335 | 350 | 346 | 22 | 23 | 24 | ||||||||||||||||||||||||
Expected return on plan assets | (351) | (365) | (370) | – | – | – | ||||||||||||||||||||||||
Amortization of prior service cost (credit) | 2 | 3 | 3 | – | (7) | (10) | ||||||||||||||||||||||||
Amortization of net actuarial loss (gain) | – | 4 | (7) | – | 3 | 4 | ||||||||||||||||||||||||
Curtailments, settlements and special termination benefits | 5 | (19) | (4) | 3 | – | (5) | ||||||||||||||||||||||||
| $ | 26 | $ | 14 | $ | 8 | $ | 28 | $ | 23 | $ | 16 | |||||||||||||||||||
In December 2011, in consideration for the mutual release of all claims or potential claims arising from the Creditor Protection Proceedings between us and certain former employees, we agreed to amend a certain defined benefit plan to add the former employees as participants, and the employees agreed to pay us $2 million in cash. The plan amendment resulted in an increase in the pension benefit obligation of $2 million, which was recognized in other comprehensive loss as prior service costs and then immediately amortized into our Consolidated Statements of Operations for the year ended December 31, 2011, offsetting the $2 million we recorded upon receipt of the cash from the employees. We do not expect to realize any future benefits as a result of the plan amendment. The table above reflects the amortization of the prior service costs, but does not reflect the offsetting gain.
| Pension Plans | OPEB Plans | |||||||||||||||||||||||||
| Successor | Predecessor | Successor | Predecessor | |||||||||||||||||||||||
| (In millions) | 2012 | 2011 | 2010 | 2012 | 2011 | 2010 | ||||||||||||||||||||
Service cost | $ | 36 | $ | 35 | $ | 41 | $ | 3 | $ | 3 | $ | 4 | ||||||||||||||
Interest cost | 312 | 335 | 350 | 20 | 22 | 23 | ||||||||||||||||||||
Expected return on plan assets | (340) | (351) | (365) | – | – | – | ||||||||||||||||||||
Amortization of prior service cost (credit) | – | 2 | 3 | – | – | (7) | ||||||||||||||||||||
Amortization of net actuarial loss | – | – | 4 | – | – | 3 | ||||||||||||||||||||
Curtailments and settlements | 21 | 5 | (19) | – | 3 | – | ||||||||||||||||||||
| $ | 29 | $ | 26 | $ | 14 | $ | 23 | $ | 28 | $ | 23 | |||||||||||||||
A detail of amounts included in “Accumulated other comprehensive loss” in our Consolidated Balance Sheets can be found in Note 8,9, “Accumulated Other Comprehensive Loss.” We estimate that $1$22 million of net actuarial losses will be amortized from accumulated other comprehensive loss into our Consolidated Statements of Operations in 2012.2013.
The following is a summary of the special events that impacted our net periodic benefit costs as a curtailment settlement or special termination benefitsettlement for the years ended December 31, 2012, 2011 2010 and 2009:2010:
| Pension Plans | OPEB Plans | Pension Plans | OPEB Plans | |||||||||||||||||||||||||||||||||||||||||||||||||||
| Successor | Predecessor | Successor | Predecessor | Successor | Predecessor | Successor | Predecessor | |||||||||||||||||||||||||||||||||||||||||||||||
| (In millions) | 2011 | 2010 | 2009 | 2011 | 2010 | 2009 | 2012 | 2011 | 2010 | 2012 | 2011 | 2010 | ||||||||||||||||||||||||||||||||||||||||||
Settlements resulting from lump-sum payouts or plan liquidations and wind-ups | $ | 3 | $ | 1 | $ | 2 | $ | – | $ | – | $ | – | $ | 10 | $ | 3 | $ | 1 | $ | – | $ | – | $ | – | ||||||||||||||||||||||||||||||
Curtailments, net, and special retirement benefits resulting from the closure of mills or paper machines and other mill restructurings | 2 | 4 | (6) | 3 | – | (5) | ||||||||||||||||||||||||||||||||||||||||||||||||
Curtailments and settlements resulting from the closure of mills or paper machines and other mill restructurings | 11 | 2 | 4 | – | 3 | – | ||||||||||||||||||||||||||||||||||||||||||||||||
Curtailments and settlements that arose upon our emergence from the Creditor Protection Proceedings | – | (24) | – | – | – | – | – | – | (24) | – | – | – | ||||||||||||||||||||||||||||||||||||||||||
| $ | 5 | $ | (19) | $ | (4) | $ | 3 | $ | – | $ | (5) | $ | 21 | $ | 5 | $ | (19) | $ | – | $ | 3 | $ | – | |||||||||||||||||||||||||||||||
In 2012, we recorded charges for curtailments and settlements primarily related to the indefinite idling of part of our Mersey operations (eliminating 176 positions), a workforce reduction at our Baie-Comeau paper mill (eliminating 90 positions) and the lump-sum payments for the vested terminated employees in certain of our U.S. pension plans. The cost of these curtailments and settlements was included in “Closure costs, impairment and other related charges” in our Consolidated Statements of Operations for the year ended December 31, 2012.
In 2011, we ceased paperboard production at our Coosa Pines paper mill (eliminating 137 positions), reduced the workforce at our Mersey operations (eliminating 97 positions), permanently closed a paper machine at our Kenogami paper mill (eliminating 130 positions) and liquidated, either partially or fully, two of our pension plans. The cost of these settlementscurtailments and curtailmentssettlements was included in “Closure costs, impairment and other related charges” in our Consolidated Statements of Operations for the year ended December 31, 2011.
In 2010, we indefinitely idled (and subsequently permanently closed) our Gatineau paper mill, which impacted approximately 330 employees. In addition, effective upon our emergence from the Creditor Protection Proceedings, the following changes were made to our pension plans:
Curtailments – Benefits for participants in the majority of our non-qualified pension plans and certain of our qualified plans were frozen so that participants will no longer earn benefits for future service. These changes resulted in an $8 million reduction in our benefit obligations and a corresponding decrease in our accumulated other comprehensive loss, but had a negligible impact on our 2010 net periodic benefit cost.
ABITIBIBOWATERRESOLUTE FOREST PRODUCTS INC.
Notes to Consolidated Financial Statements
Settlements – Participants who elected to retain their claims against us under certain non-qualified pension plans forfeited their benefits under those plans, which resulted in a $47 million reduction in our benefit obligations and a $23 million decrease in our accumulated other comprehensive loss. We also recorded a settlement gain of $24 million in our 2010 net periodic benefit cost.
Plan amendments – We reduced benefits for inactive participants in the majority of our non-qualified pension plans. We also placed a cap on the participant’s annual benefits. These plan amendments resulted in a $26 million reduction in our benefit obligations and a corresponding decrease in our accumulated other comprehensive loss, but had a negligible impact on our 2010 net periodic benefit cost. These changes will reduce future net periodic benefit cost.
Plan combinations – We replaced and combined several of our existing non-qualified plans, which had no effect on our benefit obligations, accumulated other comprehensive loss or net periodic benefit cost.
In 2009, we indefinitely idled (and subsequently permanently closed) our Dolbeau paper mill, our Beaupre, Quebec paper mill and a paper machine at our Thunder Bay paper mill. We also permanently closed our Grand Falls, Newfoundland and Labrador newsprint mill, our Westover sawmill, our Albertville sawmill and our Goodwater planer mill operations. Approximately 1,319 employees were impacted by these events. In addition, approximately 33 employees retired at our Laurentide paper mill following a special program introduced in 2008.
Assumptions used to determine benefit obligations and net periodic benefit cost
The weighted-average assumptions used to determine the benefit obligations at the measurement dates and the net periodic benefit cost for the years ended December 31, 2012, 2011 2010 and 20092010 were as follows:
| Pension Plans | OPEB Plans | Pension Plans | OPEB Plans | |||||||||||||||||||||||||||||||||||||||||||||||
| 2011 | 2010 | 2009 | 2011 | 2010 | 2009 | 2012 | 2011 | 2010 | 2012 | 2011 | 2010 | |||||||||||||||||||||||||||||||||||||||
Benefit obligations: | ||||||||||||||||||||||||||||||||||||||||||||||||||
Discount rate | 4.9% | 5.5% | 6.4% | 4.9% | 5.6% | 6.3% | 4.3% | 4.9% | 5.5% | 4.2% | 4.9% | 5.6% | ||||||||||||||||||||||||||||||||||||||
Rate of compensation increase | 1.2% | 0.9% | 2.3% | – | – | – | 2.5% | 1.2% | 0.9% | – | – | – | ||||||||||||||||||||||||||||||||||||||
Net periodic benefit cost: | ||||||||||||||||||||||||||||||||||||||||||||||||||
Discount rate | 5.5% | 6.4% | 7.3% | 5.6% | 6.3% | 7.0% | 4.9% | 5.5% | 6.4% | 4.9% | 5.6% | 6.3% | ||||||||||||||||||||||||||||||||||||||
Expected return on assets | 6.6% | 6.8% | 7.3% | – | – | – | 6.5% | 6.6% | 6.8% | – | – | – | ||||||||||||||||||||||||||||||||||||||
Rate of compensation increase | 0.9% | 2.3% | 3.0% | – | – | – | 1.2% | 0.9% | 2.3% | – | – | – | ||||||||||||||||||||||||||||||||||||||
The discount rate for our domestic and foreign plans was determined by considering the timing and amount of projected future benefit payments and was based on a portfolio of long-term high quality corporate bonds of a similar duration or, for our foreign plans,with a model that matchesdevelops a hypothetical high-quality bond portfolio, where the plan’s durationbonds are theoretically purchased to published yield curves.settle the expected benefit payments of the plans. The discount rate reflects the single rate that produces the same discounted values as the value of the theoretical bond portfolio. In determining the expected return on assets, we considered the historical returns and the future expectations for returns for each asset class, as well as the target asset allocation of the pension portfolio. In determining the rate of compensation increase, we reviewed historical salary increases and promotions, while considering current industry conditions, the terms of collective bargaining agreements with our employees and the outlook for our industry.
The assumed health care cost trend rates used to determine the benefit obligations for our domestic and foreign OPEB plans as of December 31, 20112012 and 20102011 were as follows:
| 2011 | 2010 | 2012 | 2011 | |||||||||||||||||||||||||||||||||
| Domestic Plans | Foreign Plans | Domestic Plans | Foreign Plans | Domestic Plans | Foreign Plans | Domestic Plans | Foreign Plans | |||||||||||||||||||||||||||||
Health care cost trend rate assumed for next year | 7.1% | 4.4% | 7.2% | 4.5% | 7.0% | 4.4% | 7.1% | 4.4% | ||||||||||||||||||||||||||||
Rate to which the cost trend rate is assumed to decline | 4.5% | 2.9% | 4.5% | 2.9% | 4.5% | 2.9% | 4.5% | 2.9% | ||||||||||||||||||||||||||||
Year that the rate reaches the ultimate trend rate | 2028 | 2031 | 2028 | 2031 | 2028 | 2031 | 2028 | 2031 | ||||||||||||||||||||||||||||
For the health care cost trend rates, we considered historical trends for these costs, as well as recently enacted health care legislation. Based on recent studies in Canada, it was determined that a longer period to reach the ultimate trend rate is more realistic and that the ultimate rate should follow more closely to the long-term Canadian Consumer Price Index, which results in a slightly lower ultimate rate.
ABITIBIBOWATERRESOLUTE FOREST PRODUCTS INC.
Notes to Consolidated Financial Statements
Variations in this health care cost trend rate can have a significant effect on the amounts reported. A 1% change in this assumption would have had the following impact on our 20112012 OPEB obligation and costs for our domestic and foreign plans:
| 1% Increase | 1% Decrease | 1% Increase | 1% Decrease | |||||||||||||||||||||||||||||||||||||||||||||||||||||||||||||||||
| (Dollars in millions) | Domestic Plans | Foreign Plans | Domestic Plans | Foreign Plans | Domestic Plans | Foreign Plans | Domestic Plans | Foreign Plans | ||||||||||||||||||||||||||||||||||||||||||||||||||||||||||||
Benefit obligation | $ | 36 | 15% | $ | 8 | 5% | $ | (30) | (13)% | $ | (7) | (4)% | $ | 43 | 17 | % | $ | 9 | 5 | % | $ | (34 | ) | (14 | )% | $ | (8 | ) | (5 | )% | ||||||||||||||||||||||||||||||||||||||
Service and interest costs | $ | 2 | 15% | $ | – | 5% | $ | (2) | (14)% | $ | – | (4)% | $ | 3 | 20 | % | $ | – | 5 | % | $ | (2 | ) | (16 | )% | $ | – | (4 | )% | |||||||||||||||||||||||||||||||||||||||
Fair value of plan assets
The fair value of plan assets held by our pension plans as of December 31, 2012 was as follows:
| Successor | ||||||||||||||||
| (In millions) | Total | Level 1 | Level 2 | Level 3 | ||||||||||||
Equity securities: | ||||||||||||||||
U.S. companies | $ | 642 | $ | 632 | $ | 10 | $ | – | ||||||||
Non-U.S. companies | 847 | 571 | 276 | – | ||||||||||||
Debt securities: | ||||||||||||||||
Corporate and government securities | 3,019 | 242 | 2,777 | – | ||||||||||||
Asset-backed securities | 139 | – | 139 | – | ||||||||||||
Bank loans/foreign annuities | 41 | – | – | 41 | ||||||||||||
Real estate | 51 | – | 5 | 46 | ||||||||||||
Cash and cash equivalents | 398 | 398 | – | – | ||||||||||||
Accrued interest and dividends | 38 | – | 38 | – | ||||||||||||
| $ | 5,175 | $ | 1,843 | $ | 3,245 | $ | 87 | |||||||||
The fair value of plan assets held by our pension plans as of December 31, 2011 was as follows:
| Successor | Successor | |||||||||||||||||||||||||||||||||
| (In millions) | Total | Level 1 | Level 2 | Level 3 | Total | Level 1 | Level 2 | Level 3 | ||||||||||||||||||||||||||
Equity securities: | ||||||||||||||||||||||||||||||||||
U.S. companies | $ | 760 | $ | 760 | $ | – | $ | – | $ | 760 | $ | 760 | $ | – | $ | – | ||||||||||||||||||
Non-U.S. companies | 911 | 651 | 260 | – | 911 | 651 | 260 | – | ||||||||||||||||||||||||||
Debt securities: | ||||||||||||||||||||||||||||||||||
Corporate and government securities | 3,031 | 99 | 2,932 | – | 3,031 | 99 | 2,932 | – | ||||||||||||||||||||||||||
Asset-backed securities | 165 | – | 165 | – | 165 | – | 165 | – | ||||||||||||||||||||||||||
Bank loans/foreign annuities | 44 | – | – | 44 | 44 | – | – | 44 | ||||||||||||||||||||||||||
Real estate | 39 | – | – | 39 | 39 | – | – | 39 | ||||||||||||||||||||||||||
Cash and cash equivalents | 271 | 271 | – | – | 271 | 271 | – | – | ||||||||||||||||||||||||||
Accrued interest and dividends | 38 | – | 38 | – | 38 | – | 38 | – | ||||||||||||||||||||||||||
| $ | 5,259 | $ | 1,781 | $ | 3,395 | $ | 83 | $ | 5,259 | $ | 1,781 | $ | 3,395 | $ | 83 | |||||||||||||||||||
| The fair value of plan assets held by our pension plans as of December 31, 2010 was as follows: | ||||||||||||||||||||||||||||||||||
| Successor | ||||||||||||||||||||||||||||||||||
| (In millions) | Total | Level 1 | Level 2 | Level 3 | ||||||||||||||||||||||||||||||
Equity securities: | ||||||||||||||||||||||||||||||||||
U.S. companies | $ | 978 | $ | 946 | $ | 32 | $ | – | ||||||||||||||||||||||||||
Non-U.S. companies | 1,093 | 775 | 318 | – | ||||||||||||||||||||||||||||||
Debt securities: | ||||||||||||||||||||||||||||||||||
Corporate and government securities | 2,861 | 87 | 2,774 | – | ||||||||||||||||||||||||||||||
Asset-backed securities | 114 | – | 114 | – | ||||||||||||||||||||||||||||||
Bank loans/foreign annuities | 44 | – | – | 44 | ||||||||||||||||||||||||||||||
Real estate | 42 | – | – | 42 | ||||||||||||||||||||||||||||||
Cash and cash equivalents | 242 | 242 | – | – | ||||||||||||||||||||||||||||||
Accrued interest and dividends | 48 | – | 48 | – | ||||||||||||||||||||||||||||||
| $ | 5,422 | $ | 2,050 | $ | 3,286 | $ | 86 | |||||||||||||||||||||||||||
Equity securities primarily include large-cap and mid-cap publicly-traded companies primarily located in the United States, Canada and other developed countries, as well as commingled equity funds invested in the same types of securities. The fair value of the equity securities is determined based on quoted market prices (Level 1) or the net asset values per share that are derived from the accumulated fair values of the equity securities within the commingled funds (Level 2).
Debt securities primarily include corporate bonds of U.S. and Canadian companies from diversified industries, bonds and treasuries issued by the U.S. government and the Canadian federal and provincial governments, mortgage-backedasset-backed securities and commingled fixed income funds invested in these same types of securities. The fair value of the debt securities is determined based on quoted market prices (Level 1), market-corroborated inputs such as matrix prices, yield curves and indices (Level 2), the net asset values per share that are derived from the accumulated fair values of the debt securities within the commingled funds (Level 2) or specialized pricing sources that utilize consensus-based contributed prices and spreads (Level 3). Bank loan investments are primarily located in the U.S. The fair value of bank loans is determined based on the mid-point of the bid and ask price points (Level 3).
ABITIBIBOWATERRESOLUTE FOREST PRODUCTS INC.
Notes to Consolidated Financial Statements
Real estate investments are primarily located in Canada. The fair value of the real estate is determined based on an appraisal completed by a national real estate firm. Those appraisers use several valuation concepts, including the cost approach, market approach and income approach (Level 3).
The fair value of accrued interest and dividends is determined based on market-corroborated inputs such as declared dividends and stated interest rates (Level 2).
The changes in Level 3 pension plan assets for the years ended December 31, 20112012 and 20102011 were as follows:
| (In millions) | Bank Loans/ Annuities | Real Estate | Total | Bank Loans/ Foreign | Real Estate | Total | ||||||||||||||||||
Balance as of December 31, 2009 (Predecessor) | $ | 5 | $ | 37 | $ | 42 | ||||||||||||||||||
Unrealized gains relating to assets held as of December 31, 2010 | – | 5 | 5 | |||||||||||||||||||||
Purchases | 57 | – | 57 | |||||||||||||||||||||
Sales | (18) | – | (18) | |||||||||||||||||||||
Balance as of December 31, 2010 (Successor) | 44 | 42 | 86 | $ | 44 | $ | 42 | $ | 86 | |||||||||||||||
Unrealized gains relating to assets held as of December 31, 2011 | – | 5 | 5 | – | 5 | 5 | ||||||||||||||||||
Realized losses | – | (1) | (1) | – | (1) | (1) | ||||||||||||||||||
Purchases | 41 | – | 41 | 41 | – | 41 | ||||||||||||||||||
Sales | (40) | (6) | (46) | (40) | (6) | (46) | ||||||||||||||||||
Effect of foreign currency exchange rate changes | (1) | (1) | (2) | (1) | (1) | (2) | ||||||||||||||||||
Balance as of December 31, 2011 (Successor) | $ | 44 | $ | 39 | $ | 83 | 44 | 39 | 83 | |||||||||||||||
Unrealized gains relating to assets held as of | – | 7 | 7 | |||||||||||||||||||||
Realized gains | 1 | – | 1 | |||||||||||||||||||||
Purchases | 54 | – | 54 | |||||||||||||||||||||
Sales | (57) | – | (57) | |||||||||||||||||||||
Effect of foreign currency exchange rate changes | (1) | – | (1) | |||||||||||||||||||||
Balance as of December 31, 2012 (Successor) | $ | 41 | $ | 46 | $ | 87 | ||||||||||||||||||
Long-term strategy and objective
Our investment strategy and objective is to maximize the long-term rate of return on our plan assets within an acceptable level of risk in order to meet our current and future obligations to pay benefits to qualifying employees and their beneficiaries while minimizing and stabilizing pension benefit costs and contributions. One way we accomplish this objective is to diversify our plan investments. Diversification of assets is achieved through strategic allocations to various asset classes, as well as various investment styles within these asset classes, and by retaining multiple, experienced third-party investment management firms with complementary investment styles and philosophies to implement these allocations. Risk is further managed by reviewing our investment policies at least annually and monitoring our fund managers at least quarterly for compliance with mandates and performance measures. A series of permitted and prohibited investments are listed in our respective investment policies, which are provided to our fund managers. The use of derivative financial instruments for speculative purposes and investments in the equity or debt securities of AbitibiBowaterResolute Forest Products are both prohibited.
We have established a target asset allocation and an allowable range from such target asset allocation for our plans based upon analysis of risk/return tradeoffs and correlations of asset mixes given long-term historical returns, prospective capital market returns, forecasted benefit payments and the forecasted timing of those payments. The targeted asset allocation of the plan assets is designed to hedge the change in the pension liabilities resulting from fluctuations in the discount rate by investing in debt and other securities, while also generating excess returns required to reduce the unfunded pension deficit by investing in equity securities with higher potential returns. The targeted asset allocation of the plan assets is 50% equity securities, with an allowable range of 35%30% to 60%, and 50% debt and other securities, with an allowable range of 40% to 65%70%, including up to 3% in short-term instruments required for near-term liquidity needs. Two-thirdsApproximately 60% of the equity securities are targeted to be invested in the U.S. and Canada, with the balance in other developed and emerging countries. Substantially all of the debt securities are targeted to be invested in the U.S. and Canada. The asset allocation for each plan is reviewed periodically and rebalanced toward the targeted asset mix when the fair value of the investments within an asset class falls outside the predetermined range.
ABITIBIBOWATERRESOLUTE FOREST PRODUCTS INC.
Notes to Consolidated Financial Statements
Expected benefit payments and future contributions
The following benefit payments are expected to be paid from the plans’ net assets. The OPEB plans’ benefit payments have been reduced by expected Medicare subsidy receipts associated with the Medicare Prescription Drug, Improvement and Modernization Act of 2003.
| (In millions) | Pension Plans | OPEB Plans | Expected Subsidy Receipts | Pension Plans | OPEB Plans | Expected Subsidy Receipts | ||||||||||||||||||
2012 | $ | 512 | $ | 27 | $ | 2 | ||||||||||||||||||
2013 | 417 | 26 | 2 | $ | 425 | $ | 25 | $ | 2 | |||||||||||||||
2014 | 436 | 26 | 2 | 427 | 25 | 2 | ||||||||||||||||||
2015 | 436 | 26 | 2 | 430 | 25 | 2 | ||||||||||||||||||
2016 | 439 | 26 | 3 | 432 | 25 | 3 | ||||||||||||||||||
2017 – 2021 | 2,182 | 137 | 15 | |||||||||||||||||||||
2017 | 432 | 25 | 3 | |||||||||||||||||||||
2018 – 2022 | 2,128 | 133 | 17 | |||||||||||||||||||||
We estimate our 20122013 contributions (excluding contributions to our defined contribution plans) to be approximately $105 million to our pension plans (excluding contributions to our defined contribution plans) and approximately $25 million to our OPEB plans.
Patient Protection and Affordable Care Act
In March 2010, the Patient Protection and Affordable Care Act (the “PPACA”) was enacted, potentially impacting our cost to provide healthcare benefits to eligible active and retired employees. The PPACA has both short-term and long-term implications on benefit plan standards. Implementation of this legislation began in 2010 and is expected to continue in phases from 2011 through 2018.
We have analyzed this legislation to determine the impact of the required plan standard changes on our employee healthcare plans and the effect of the excise tax on high cost healthcare plans and the resulting costs and such impact, for those changes that are currently estimable, was not material to our results of operations. We have reflected the impact of the PPACA in our benefit obligations as of December 31, 20112012 and 2010.2011.
Moving Ahead for Progress in the 21st Century Act
In July 2012, the Moving Ahead for Progress in the 21st Century Act (“MAP-21”) was signed into law, offering optional short-term funding relief for domestic pension plan sponsors. The discount-rate stabilization provision in MAP-21 limits the discount rates applicable in determining funding requirements to rates within a 10% corridor of a 25-year average. The 10% corridor will widen to 15% in 2013, 20% in 2014, 25% in 2015 and 30% for the years after 2015. This enactment provides relief in the form of reduced minimum required contributions. In 2012, we benefited from this funding relief and as a result, our required contributions were reduced by $9 million for our domestic plans.
Canadian pension funding relief
AbiBow Canada Inc. (“AbiBow Canada”), through its principal predecessor entities, Abitibi-Consolidated Company of Canada and BCFPI,Funding relief regulations
As a pre-condition to our emergence from the creditor protection proceedings, we entered into agreements with the provinces of Quebec and Ontario in September and Novemberto establish parameters concerning the funding of 2010, respectively (which became effective on the Emergence Date), relating in part to funding relief with respect to aggregate solvency deficits in our material Canadian registered pension plans. The agreements include a numberplans, which we refer to as the “affected plans,” until 2020. These plans represented approximately 70% of our unfunded pension obligations as of December 31, 2012. In exchange for certain undertakings, by AbiBow Canada,the provinces confirmed their intention to adopt regulations specific to us, which will apply for five years fromwe refer to as the Emergence Date. As“funding relief regulations,” to implement those parameters in respect of the third quarter of 2011, both the provinces of Quebec and Ontario had adopted specific regulations to implement this funding relief.affected plans.
The funding relief regulations provide, among other things, that AbiBow Canada’sour aggregate annual contribution in respect of the solvency deficits in its material Canadian registered pensionthe affected plans for each year from 2011 through 2020 are limited to the following: (i) a Cdn$50 million basic contribution; (ii) beginning in 2013, if the plans’ aggregate solvency ratio falls below a specified target for a year, an additional contribution equal to 15% of free cash flow (calculated as per the funding relief regulations) up to Cdn$15 million per year and (iii) beginning in 2016, if the amount payable for benefits in a year exceeds a specified threshold and the plans’ aggregate solvency ratio is more than 2% below the target for that year, a supplementary contribution equal to such excess (such supplementary contribution being capped at Cdn$25 million on the first occurrence only of such an excess). Should a plan move into a surplus during the 2011 – 2020 period, it will cease to be subject to this funding relief. After 2020, the funding rules in place at the time will apply to any remaining deficit.
The
RESOLUTE FOREST PRODUCTS INC.
Notes to Consolidated Financial Statements
As adopted in mid-2011, the regulations also provide that corrective measures would be required if the aggregate solvency ratio in the registered pensionaffected plans fallsfell below a prescribed level under the target providedtargets specified by the regulations as of December 31 in any year through 2014. Such measures may include additional funding over five years to attain the target solvency ratio prescribed in the regulations. Thereafter, supplemental contributions, as described above, would be required if the aggregate solvency ratio
In addition, our principal Canadian operating subsidiary has undertaken in the registered pension plans falls below a prescribed level under the target provided by the regulations as of December 31 in any year on or after 2015 for the remainder of the period covered by the regulations. those agreements, among other things, to:
| — | not pay a dividend at any time when the weighted average solvency ratio of its pension plans in Quebec or Ontario is less than 80%; |
| — | abide by the compensation plan detailed in the Plans of Reorganization with respect to salaries, bonuses and severance; |
| — | direct at least 60% of the maintenance and value-creation investments earmarked for our Canadian pulp and paper operations to projects in Quebec and at least 30% to projects in Ontario; |
| — | invest a minimum of Cdn$50 million over a two to three year construction period for a new condensing turbine at our Thunder Bay facility, subject to certain conditions; |
| — | invest at least Cdn$75 million in strategic projects in Quebec over a five-year period; |
| — | maintain our head office and the current related functions in Quebec; |
| — | make an additional solvency deficit reduction contribution to its pension plans of Cdn$75, payable over four years, for each metric ton of capacity reduced in Quebec or Ontario, in the event of downtime of more than six consecutive months or nine cumulative months over a period of 18 months; |
| — | create a diversification fund by contributing Cdn$2 million per year for five years for the benefit of the municipalities and workers in our Quebec operating regions; |
| — | pay an aggregate of Cdn$5 million over five years to be used for such environmental remediation purposes instructed by the province of Ontario; and |
| — | maintain and renew certain financial assurances with the province of Ontario in respect of certain properties in the province. |
Solvency deficit
The aggregate solvency ratio in the Canadian registered pension plans covered by the Quebec and Ontario funding relief is determined annually as of December 31. The calculation is based on a number of factors and assumptions, including the accrued benefits to be provided by the plans, interest rate levels, membership data and demographic experience. The assumptions used in the solvency calculation are materially different from the assumptions used to arrive at the pension and OPEB benefit obligations for purposes of our consolidated financial statements.
Under Canadian actuarial rules for solvency determinations, the liabilities are calculated on the assumption that the plans are terminated at the measurement date (each December 31 for the affected plans), and the liabilities are discounted primarily using a prescribed annuity purchase rate, which is that day’s spot interest rate on government securities in Canada plus a prescribed margin. By contrast, for purposes of our consolidated financial statements, the discount rate is determined with a model that develops a hypothetical high-quality bond portfolio, where the bonds are theoretically purchased to settle the expected benefit payments of the plans.
As of December 31, 2011, the applicable annuity purchase rate for solvency purposes was 3.3%, compared to a discount rate of 4.9% for accounting purposes. That annuity purchase rate was 1.2% lower than the annuity purchase rate as of December 31, 2010, twice the 0.6% reduction to the discount rate applicable for accounting purposes in that same period.
As of December 31, 2012, a 1% change in discount rates would result in an approximate Cdn$500 million ($504 million, based on the exchange rate in effect on December 31, 2012) change in the solvency deficit.
ABITIBIBOWATERRESOLUTE FOREST PRODUCTS INC.
Notes to Consolidated Financial Statements
demographic experience. Corrective measures
As of December 31, 2011, the aggregate solvency ratio in the affected plans was below the minimum solvency level prescribed in the regulations. Accordingly, the regulations require that we propose, by March 2013, corrective measures designed to attain the target solvency ratio prescribed in the regulations within five years. The difference between the solvency status as of December 31, 2011, and the target specified under the funding relief regulations represents the portion of the solvency deficit that is subject to corrective measures; it amounted to approximately Cdn$500 million as of December 31, 2011 ($504 million, based on the exchange rate in effect on December 31, 2012).
We continue to work with other plan stakeholders, including employees, retirees, unions, the provincial governments of Quebec and Ontario and the related pension regulators to address these corrective measures. With interest rates currently near historic lows, we will work to develop corrective measures that balance the need to meet our undertakings to retirees, but also provide us the funding predictability we need to manage our business. At this time, we do not expect that we will contribute funds to the affected plans in respect of the corrective measures unless we reach an outcome that is consistent with what we believe was the objective of the funding relief measures, or we are compelled to do so.
In light of continued low yields on government securities in Canada, which are usedand a 0.2% reduction in the prescribed margin to determine the applicable discountannuity purchase rate under Canadian actuarial rules, when we file the actuarial report in respect of thesethe affected plans later this year,in the second quarter of 2013, we expect that the aggregate solvency ratio in these Canadian registered plansas of December 31, 2012, will likely have fallen belowfurther decreased from the minimum level prescribed by the regulations and that we will therefore be required to adopt corrective measures by March 2013.at December 31, 2011. At this time, we cannot estimate the additionalsupplemental contributions, if any, that may be made or required in future years in respect of the corrective measures, but they could be material.
In addition, AbiBow Canada has undertakenPartial wind-ups
On June 12, 2012, we filed a motion for directives with the Canadian Court seeking an order to prevent pension regulators in those agreements,each of Quebec, New Brunswick and Newfoundland and Labrador from declaring partial wind-ups of pension plans relating to employees of former operations in New Brunswick and Newfoundland and Labrador, or a declaration that any claim for accelerated reimbursements of deficits arising from a partial wind-up is a barred claim under the Creditor Protection Proceedings. These plans are subject to the funding relief regulations and we contend, among other things, to:that any such declaration, if issued, would be inconsistent with the Canadian Court’s sanction order confirming the Plan of Reorganization and the terms of our emergence from the Creditor Protection Proceedings. A partial wind-up would likely shorten the period in which any deficit within those plans, which could exceed $150 million, would have to be funded if we do not obtain the relief sought. The pension regulators filed contestations to our motion in August 2012.
RESOLUTE FOREST PRODUCTS INC.
Notes to Consolidated Financial Statements
not pay a dividend at any time when the weighted average solvency ratio of its pension plans in Quebec or Ontario is less than 80%;
abide by the compensation plan detailed in the Plans of Reorganization with respect to salaries, bonuses and severance;
direct at least 60% of the maintenance and value-creation investments earmarked for our Canadian pulp and paper operations to projects in Quebec and at least 30% to projects in Ontario;
invest a minimum of Cdn$50 million over a two to three year construction period for a new condensing turbine at our Thunder Bay facility, subject to certain conditions;
invest at least Cdn$75 million in strategic projects in Quebec over a five-year period;
maintain our head office and the current related functions in Quebec;
make an additional solvency deficit reduction contribution to its pension plans of Cdn$75, payable over four years, for each metric ton of capacity reduced in Quebec or Ontario, in the event of downtime of more than six consecutive months or nine cumulative months over a period of 18 months;
create a diversification fund by contributing Cdn$2 million per year for five years for the benefit of the municipalities and workers in our Quebec operating regions;
pay an aggregate of Cdn$5 million over five years to be used for such environmental remediation purposes instructed by the province of Ontario; and
maintain and renew certain financial assurances with the province of Ontario in respect of certain properties in the province.
Note 19. Income Taxes
Income (loss)(Loss) income before income taxes by taxing jurisdiction for the years ended December 31, 2012, 2011 2010 and 20092010 was as follows:
| Successor | Predecessor | |||||||||||||||||
| (In millions) | 2011 | 2010 | 2009 | |||||||||||||||
United States | $ | 25 | $ | (1,039 | ) | $ | (421 | ) | ||||||||||
Foreign | 30 | 2,208 | (1,261 | ) | ||||||||||||||
| $ | 55 | $ | 1,169 | $ | (1,682 | ) | ||||||||||||
| Income tax (provision) benefit for the years ended December 31, 2011, 2010 and 2009 was comprised of the following: | ||||||||||||||||||
| Successor | Predecessor | |||||||||||||||||
| (In millions) | 2011 | 2010 | 2009 | |||||||||||||||
U.S. Federal and State: | ||||||||||||||||||
Current | $ | – | $ | – | $ | – | ||||||||||||
Deferred | (21 | ) | 470 | (1 | ) | |||||||||||||
| (21 | ) | 470 | (1 | ) | ||||||||||||||
Foreign: | ||||||||||||||||||
Current | (4 | ) | – | – | ||||||||||||||
Deferred | 9 | 1,136 | 123 | |||||||||||||||
| 5 | 1,136 | 123 | ||||||||||||||||
Total: | ||||||||||||||||||
Current | (4 | ) | – | – | ||||||||||||||
Deferred | (12 | ) | 1,606 | 122 | ||||||||||||||
| $ | (16 | ) | $ | 1,606 | $ | 122 | ||||||||||||
ABITIBIBOWATER INC.
Notes to Consolidated Financial Statements
| Successor | Predecessor | |||||||||||
| (In millions) | 2012 | 2011 | 2010 | |||||||||
United States | $ | (34 | ) | $ | 25 | $ | (1,039) | |||||
Foreign | (40 | ) | 30 | 2,208 | ||||||||
| $ | (74 | ) | $ | 55 | $ | 1,169 | ||||||
The income tax benefit (provision) for the years ended December 31, 2012, 2011 and 2010 was comprised of the following:
| Successor | Predecessor | |||||||||||
| (In millions) | 2012 | 2011 | 2010 | |||||||||
U.S. Federal and State: | ||||||||||||
Current | $ | (2 | ) | $ | – | $ | – | |||||
Deferred | 17 | (21 | ) | 470 | ||||||||
| 15 | (21 | ) | 470 | |||||||||
Foreign: | ||||||||||||
Current | 5 | (4 | ) | – | ||||||||
Deferred | 18 | 9 | 1,136 | |||||||||
| 23 | 5 | 1,136 | ||||||||||
Total: | ||||||||||||
Current | 3 | (4 | ) | – | ||||||||
Deferred | 35 | (12 | ) | 1,606 | ||||||||
| $ | 38 | $ | (16 | ) | $ | 1,606 | ||||||
The income tax benefit (provision) attributable to (loss) income (loss) before income taxes differs from the amounts computed by applying the United States federal statutory income tax rate of 35% for the years ended December 31, 2012, 2011 2010 and 20092010 as a result of the following:
| Successor | Predecessor | Successor | Predecessor | |||||||||||||||||||||||
| (In millions) | 2011 | 2010 | 2009 | 2012 | 2011 | 2010 | ||||||||||||||||||||
Income (loss) before income taxes | $ | 55 | $ | 1,169 | $ | (1,682 | ) | |||||||||||||||||||
(Loss) income before income taxes | $ | (74 | ) | $ | 55 | $ | 1,169 | |||||||||||||||||||
Income tax (provision) benefit: | ||||||||||||||||||||||||||
Expected income tax (provision) benefit | (19 | ) | (409 | ) | 588 | |||||||||||||||||||||
Income tax benefit (provision): | ||||||||||||||||||||||||||
Expected income tax benefit (provision) | 26 | (19 | ) | (409) | ||||||||||||||||||||||
Changes resulting from: | ||||||||||||||||||||||||||
Valuation allowance(1) | (15 | ) | 1,166 | (615 | ) | (25 | ) | (15 | ) | 1,166 | ||||||||||||||||
Plans of Reorganization | – | 1,043 | – | – | – | 1,043 | ||||||||||||||||||||
Subpart F income | – | (107 | ) | – | ||||||||||||||||||||||
Worthless stock(2) | – | – | 308 | |||||||||||||||||||||||
Tax reserve adjustments(3) | 63 | – | 45 | |||||||||||||||||||||||
Reorganization-related and other tax adjustments(2) | 13 | (38 | ) | – | ||||||||||||||||||||||
Adjustment for unrecognized tax benefits(3) | 5 | 63 | – | |||||||||||||||||||||||
Foreign exchange | (9 | ) | 9 | (230 | ) | 10 | (9 | ) | 9 | |||||||||||||||||
Reorganization-related adjustments (4) | (38 | ) | – | – | ||||||||||||||||||||||
Research and development tax incentives | 8 | – | – | |||||||||||||||||||||||
State income taxes, net of federal income tax benefit | (1 | ) | 2 | 12 | 1 | (1 | ) | 2 | ||||||||||||||||||
Foreign tax rate differences | 2 | (72 | ) | 30 | – | 2 | (72) | |||||||||||||||||||
Subpart F income(4) | – | – | (107) | |||||||||||||||||||||||
Other, net | 1 | (26 | ) | (16 | ) | – | 1 | (26) | ||||||||||||||||||
| $ | (16 | ) | $ | 1,606 | $ | 122 | $ | 38 | $ | (16 | ) | $ | 1,606 | |||||||||||||
| (1) | In 2012, the increase in the valuation allowance primarily related to costs associated with the indefinite idling of our Mersey operations prior to the sale, where we did not recognize tax benefits, as well as an increase in the valuation allowance for certain benefits in Canada and the U.S. expected to expire unused. Partially offsetting these increases was a release of valuation allowance related to the U.S. Fibrek operations, following an internal reorganization where the U.S. Fibrek group joined our U.S. consolidated group. In 2011, the increase in the valuation allowance related to certain U.S. State ordinary loss carryforwards, as |
RESOLUTE FOREST PRODUCTS INC.
Notes to Consolidated Financial Statements
| well as tax benefits for our Mersey operations and our Mokpo paper mill where we do not recognize deferred income tax assets. In 2010, the benefit primarily related to the reversal of our valuation allowance following emergence from the Creditor Protection Proceedings. See “Deferred income taxes” section below for a further discussion of the valuation allowance. |
| (2) |
|
|
|
| (3) | During 2012 and 2011, we recorded benefits for previously unrecognized tax benefits related to uncertain tax positions pursuant to FASB ASC 740, “Income Taxes,” as effectively settled upon completion of certain tax authority examinations. |
| (4) | During 2010, we recognized U.S. Sub-Part F taxable income from the 2009 sale of our investment in MPCo. |
Deferred income taxes
We are required to assess whether it is more likely than not that the deferred income tax assets will be realized, based on the nature, frequencyreview of all available positive and severitynegative evidence, including future reversals of recent losses, forecastedexisting taxable temporary differences, estimates of future taxable income, or where necessary, the implementation ofpast operating results and prudent and feasible tax planning strategies. The carrying value of our deferred income tax assets (tax benefits expected to be realized in the future) assumes that we will be ablereflects our expected ability to generate based on certain estimates and assumptions, sufficient future taxable income in certain tax jurisdictions to utilize these deferred income tax benefits, or in the absence of sufficient future taxable income, that we would implement tax planning strategies to generate sufficient taxable income in cases where tax benefit carryforwards may expire unused. benefits.
In making such judgments, significant weight is given to evidence that can be objectively verified.
Upon emergence from the Creditor Protection Proceedings, in 2010, 2011 and 2011,2012, we evaluated the need for a valuation allowance against our net deferred income tax assets and determinedconcluded that we expect to generate sufficient taxable income in the future to realize most of the deferred income tax assets and accordingly, determined that a valuation allowance was only needed against certain deferred income tax assets. In making this determination, we focused primarily focused on a post-reorganization outlook, which reflected a new capital structure, new contractual arrangements and a new asset structure with new values under the application of fresh start accounting as of December 31, 2010. The weight of positive evidence, which included our expected future performance, resulted in the conclusion by management that upon emergence from the Creditor Protection Proceedings in 2010, valuation allowances were not required for most of theour deferred income tax assets. Therefore, the majority of the valuation allowances were reversed in 2010 as part of the implementation of the Plans of Reorganization and the application of fresh start accounting. Prior to emergence from the Creditor Protection Proceedings, in 2009 and 2010 until the Emergence Date, due to the existence of significant negative evidence such as a cumulative three-year loss and our financial condition, we had concluded that a valuation allowance was necessary on substantially all of our net deferred income tax assets. In 2011, ourOur results and expected future performance continue to support the recoverability of most of the deferred income tax assets. As a result, we have significant net deferred income tax assets recorded on the Successor Company’s Consolidated Balance Sheet as of December 31, 2011 and 2010.
ABITIBIBOWATERRESOLUTE FOREST PRODUCTS INC.
Notes to Consolidated Financial Statements
Deferred income taxes as of December 31, 20112012 and 20102011 were comprised of the following:
| 00000000 | 00000000 | 00000000 | 00000000 | |||||||||||||||||
| Successor | Successor | |||||||||||||||||||
| (In millions) | 2011 | 2010 | 2012 | 2011 | ||||||||||||||||
Fixed assets | $ | (259 | ) | $ | (167 | ) | $ | (262 | ) | $ | (259 | ) | ||||||||
Deferred gains | (40 | ) | (37 | ) | (40 | ) | (40 | ) | ||||||||||||
Other liabilities | (91 | ) | (35 | ) | (118 | ) | (91 | ) | ||||||||||||
Deferred income tax liabilities | (390 | ) | (239 | ) | (420 | ) | (390 | ) | ||||||||||||
Fixed assets | 500 | 484 | 593 | 500 | ||||||||||||||||
Pension and OPEB benefit plans | 473 | 416 | 587 | 473 | ||||||||||||||||
Ordinary loss carryforwards | 716 | 598 | 816 | 716 | ||||||||||||||||
Capital loss carryforwards | 447 | 371 | 444 | 447 | ||||||||||||||||
Research and development expense pool | 265 | 264 | 254 | 265 | ||||||||||||||||
Tax credit carryforwards | 167 | 220 | 159 | 167 | ||||||||||||||||
Other assets | 169 | 71 | 173 | 169 | ||||||||||||||||
Deferred income tax assets | 2,737 | 2,424 | 3,026 | 2,737 | ||||||||||||||||
Valuation allowance | (564 | ) | (474 | ) | (623 | ) | (564 | ) | ||||||||||||
Net deferred income tax assets | $ | 1,783 | $ | 1,711 | $ | 1,983 | $ | 1,783 | ||||||||||||
Amounts recognized in our Consolidated Balance Sheets consisted of: | ||||||||||||||||||||
Deferred income tax assets – current | $ | 109 | $ | 47 | $ | 56 | $ | 109 | ||||||||||||
Deferred income tax assets – noncurrent | 1,749 | 1,736 | 2,002 | 1,749 | ||||||||||||||||
Deferred income tax liabilities – noncurrent | (75 | ) | (72 | ) | (75 | ) | (75 | ) | ||||||||||||
Net deferred income tax assets | $ | 1,783 | $ | 1,711 | $ | 1,983 | $ | 1,783 | ||||||||||||
RESOLUTE FOREST PRODUCTS INC.
Notes to Consolidated Financial Statements
The balance of tax attributes and their dates of expiration as of December 31, 20112012 were as follows:
| Successor | ||||||||||
| (In millions) | Related Deferred Income Tax Asset | Year of Expiration | ||||||||
Ordinary loss carryforwards: | ||||||||||
U.S. Federal ordinary loss carryforwards of $1,564 | $ 542 | 2020 – 2031 | ||||||||
U.S. State ordinary loss carryforwards of $1,672 | 70 | (1) | 2014 – 2031 | |||||||
Canadian Federal and provincial (excluding Quebec) ordinary loss carryforwards of $274 | 53 | 2014 – 2030 | ||||||||
Quebec ordinary loss carryforwards of $391 | 33 | 2014 – 2030 | ||||||||
Other ordinary loss carryforwards | 18 | (2) | Various | |||||||
|
| |||||||||
| $ 716 | ||||||||||
Capital loss carryforwards: | ||||||||||
U.S. capital loss carryforwards of $1,275 | $ 446 | (3) | 2014 | |||||||
Other capital loss carryforwards | 1 | Various | ||||||||
|
| |||||||||
| $ 447 | ||||||||||
Research and development expense pool: | ||||||||||
Canadian Federal and provincial (excluding Quebec) research and development expense pool of $903 | $ 163 | Indefinite | ||||||||
Quebec research and development expense pool of $1,213 | 102 | Indefinite | ||||||||
|
| |||||||||
| $ 265 | ||||||||||
Tax credit carryforwards: | ||||||||||
Canadian research and development tax credit carryforwards | $ 134 | 2018 – 2030 | ||||||||
Other tax credit carryforwards | 33 | (4) | Various | |||||||
|
| |||||||||
| $ 167 | ||||||||||
|
|
ABITIBIBOWATER INC.
Notes to Consolidated Financial Statements
|
|
| Successor | ||||||||||
| (In millions) | Related Asset | Related Valuation Allowance | Year of Expiration | |||||||
Ordinary loss carryforwards: | ||||||||||
U.S. Federal ordinary loss carryforwards of $1,647 | $ | 576 | $ | – | 2021 – 2032 | |||||
U.S. State ordinary loss carryforwards of $1,890 | 71 | (53) | 2013 – 2032 | |||||||
Canadian Federal and provincial (excluding Quebec) ordinary loss carryforwards of $547 | 92 | (31) | 2014 – 2032 | |||||||
Quebec ordinary loss carryforwards of $571 | 55 | (24) | 2014 – 2032 | |||||||
Other ordinary loss carryforwards | 22 | (22) | 2013 – 2022 | |||||||
|
| |||||||||
| $ | 816 | $ | (130) | |||||||
Capital loss carryforwards: | ||||||||||
U.S. capital loss carryforwards of $1,258 | $ | 440 | $ | (440) | 2014 | |||||
Canadian capital loss carryforwards of $13 | 4 | (4) | Indefinite | |||||||
|
| |||||||||
| $ | 444 | $ | (444) | |||||||
Research and development expense pool: | ||||||||||
Canadian Federal and provincial (excluding Quebec) research and development expense pool of $824 | $ | 148 | $ | – | Indefinite | |||||
Quebec research and development expense pool of $1,265 | 106 | – | Indefinite | |||||||
|
| |||||||||
| $ | 254 | $ | – | |||||||
Tax credit carryforwards: | ||||||||||
Canadian research and development tax credit carryforwards | $ | 123 | $ | – | 2016 – 2032 | |||||
Other Canadian tax credit carryforwards | 27 | (24) | 2013 | |||||||
U.S State tax credit carryforwards | 9 | (3) | 2013 – 2026 | |||||||
|
| |||||||||
| $ | 159 | $ | (27) | |||||||
Valuation allowance related to other deferred income tax assets | $ | (22) | ||||||||
|
| |||||||||
| $ | (623) | |||||||||
Our U.S federal net operating loss carryforwards are subject to the U.S. Internal Revenue Code of 1986, as amended (the “Code”) § 382 (“IRC § 382”) limitation, due toresulting primarily from an ownership change that occurred on the Emergence Date. We do not expect that this IRC § 382 limit will affectlimit the utilization of our available U.S federal net operating loss carryforwards prior to their expiration.
As of December 31, 2011 and 2010, we had unremittedWe consider our foreign earnings of our subsidiaries outside the U.S. totaling $75 million and $50 million, respectively, which have been deemed to be permanently invested. No deferredAccordingly, we do not currently provide for the additional United States and foreign income tax liability has been recognized with regard totaxes that would become payable upon remission of undistributed earnings of foreign subsidiaries. The cumulative undistributed earnings of such earnings.subsidiaries as of December 31, 2012 are not material. It is not practicable to estimate the income tax liability that might be incurred if such earnings were remitted to the U.S. During 2010, we recognized $305 million of U.S. Sub-Part F taxable income from the 2009 sale of our investment in MPCo.
As a result of the acquisition of the noncontrolling interest in ANC in 2011, we had established a deferred income tax liability of approximately $15 million. Since this acquisition was accounted for as an equity transaction, as discussed in Note 16, “Liquidity and17, “Long-Term Debt, – Debt – Promissory note,” the recording of this deferred income tax liability resulted in a reduction of “Additional paid-in capital” in our Consolidated Balance Sheet as of December 31, 2011.
RESOLUTE FOREST PRODUCTS INC.
Notes to Consolidated Financial Statements
IncomeUnrecognized tax reservesbenefits
A reconciliation ofThe following table summarizes the beginning and ending amount ofactivity related to our gross unrecognized tax benefits for the years ended December 31, 20112012 and 2010 was as follows:2011:
| Successor | Predecessor | Successor | ||||||||||||||||||||
| (In millions) | 2011 | 2010 | 2012 | 2011 | ||||||||||||||||||
Beginning of year (2011: Successor; 2010: Predecessor) | $ | 191 | $ | 206 | ||||||||||||||||||
Beginning of year | $ | 109 | $ | 191 | ||||||||||||||||||
(Decrease) increase in unrecognized tax benefits resulting from: | ||||||||||||||||||||||
Positions taken in a prior period | (100 | ) | 2 | (16 | ) | (100 | ) | |||||||||||||||
Positions taken in the current period | 20 | 42 | 44 | 20 | ||||||||||||||||||
Settlements with taxing authorities | (55 | ) | – | |||||||||||||||||||
Change in Canadian foreign exchange rate | (2 | ) | (1 | ) | 2 | (2 | ) | |||||||||||||||
Expiration of statute of limitations | – | (58 | ) | |||||||||||||||||||
End of year (Successor) | $ | 109 | $ | 191 | ||||||||||||||||||
End of year | $ | 84 | $ | 109 | ||||||||||||||||||
We recognize interest and penalties accrued related to unrecognized tax benefits as components of the income tax provision. The total amount of unrecognized tax benefits that, if recognized, would affect the effective tax rate is $101$84 million. During 2012 and 2011, we adjusted certain reserves for unrecognized tax benefits primarily due tofollowing the completion of certainexaminations and settlements reached with various taxing authorities, as well as additional uncertain tax authority examinations during the year. During 2010, we reversed approximately $58 million of liabilities for unrecognized tax benefits, mainly due to certain U.S. and Canadian statute of limitations either expiring or effectively expiring due to our emergence from the Creditor Protection Proceedings.positions taken.
In the normal course of business, we are subject to audits from the federal, state, provincial and other tax authorities regarding various tax liabilities. The U.S. federal statute of limitations for 2009 and prior tax years prior to 2009 effectively expired on December 9, 2010, the date we emerged from the Creditor Protection Proceedings.Emergence Date. In Canada, tax returns for years 2008 onwardand future years remain subject to examination by tax authorities.
We do not expect a significant change to the amount of unrecognized tax benefits over the next twelve months. However, any auditsadjustments arising from examinations by taxing authorities may alter the timing or amount of taxable income or deductions, or the allocation of income among tax jurisdictions. The amount ultimately determined upon resolution of issues raised would be uncertainjurisdictions, and maycould differ from the amount accrued. We believe that taxes accrued in our Consolidated Balance Sheets fairly represent the amount of income taxes to be settled or realized in the future.
Note 20. Commitments and Contingencies
BCFC Bankruptcy and Insolvency Act filing
As part of a negotiated resolution to certain objections to the Plans of Reorganization, as reflected in the U.S. Court’s order confirming the Chapter 11 Reorganization Plan, BCFC was dismissed from the CCAA Proceedings and is expected to be dismissed from the Chapter 11 Cases. In addition, BCFC made an assignment for the benefit of its creditors under theBankruptcy and Insolvency Act(Canada) (the “BIA”). BCFC appointed a trustee as its representative in the BIA filing, whose responsibilities are to prosecute its claims (including a disputed claim in the Creditor Protection Proceedings), distribute its property, if any, and others as provided by the BIA. As a result of the BIA filing, we lost control over and the ability to influence this entity. As a result, effective as of the date of the BIA filing, the financial position, results of operations and cash flows of BCFC are no longer consolidated in our consolidated financial statements. We are now accounting for BCFC using the cost method of accounting.
ABITIBIBOWATER INC.
Notes to Consolidated Financial Statements
Legal items
We are involved in various legal proceedings relating to contracts, commercial disputes, taxes, environmental issues, employment and workers’ compensation claims, Aboriginal claims and other matters. We periodically review the status of these proceedings with both inside and outside counsel. Although the final outcome of any of these matters is subject to many variables and cannot be predicted with any degree of certainty, we establish reserves for a matter (including legal costs expected to be incurred) when we believe an adverse outcome is probable and the amount can be reasonably estimated. We believe that the ultimate disposition of these matters will not have a material adverse effect on our financial condition, but it could have a material adverse effect on our results of operations in any given quarter or year.
Subject to certain exceptions, all litigation against the Debtors that arose out of pre-petition conduct or acts was subject to the automatic stay provisions of Chapter 11 and the CCAA and the orders of the Courts rendered thereunder and subject to certain exceptions, any recovery by the plaintiffs in those matters was treated consistently with all other general unsecured claims in the Creditor Protection Proceedings, i.e., to the extent a disputed general unsecured claim becomes an accepted claim, the claimholder would be entitled to receive a ratable amount of Successor Company common stock from the reserve established on the Emergence Date for this purpose, as discussed in Note 3,4, “Creditor Protection Proceedings.” As a result, we believe that these matters will not have a material adverse effect on our results of operations or financial position.
Effective July 31, 2012, we completed the second step transaction pursuant to which we acquired the remaining 25.4% of the outstanding Fibrek shares, following the approval of Fibrek’s shareholders on July 23, 2012, and the issuance of a final order of the Canadian Court approving the arrangement on July 27, 2012. Certain former shareholders of Fibrek exercised (or purported to exercise) rights of dissent in respect of the transaction, asking for a judicial determination of the fair value of their claim under the Canada Business Corporations Act. No consideration has to date been paid to the former Fibrek shareholders who exercised (or purported to exercise) rights of dissent. Any such consideration will only be paid out upon settlement or judicial determination of
RESOLUTE FOREST PRODUCTS INC.
Notes to Consolidated Financial Statements
the fair value of their claims and will be paid entirely in cash. Accordingly, we cannot presently determine the amount that ultimately will be paid to former holders of Fibrek shares in connection with the proceedings, but we have reserved approximately Cdn$14 million ($14 million, based on the exchange rate in effect on December 31, 2012) for the eventual payment of those claims.
On June 12, 2012, we filed a motion for directives with the Canadian Court seeking an order to prevent pension regulators in each of Quebec, New Brunswick and Newfoundland and Labrador from declaring partial wind-ups of pension plans relating to employees of former operations in New Brunswick and Newfoundland and Labrador, or a declaration that any claim for accelerated reimbursements of deficits arising from a partial wind-up is a barred claim under the Creditor Protection Proceedings. These plans are subject to the funding relief regulations described in Note 18, “Pension and Other Postretirement Benefit Plans - Canadian pension funding,” and we contend, among other things, that any such declaration, if issued, would be inconsistent with the Canadian Court’s sanction order confirming the Plan of Reorganization and the terms of our emergence from the Creditor Protection Proceedings. A partial wind-up would likely shorten the period in which any deficit within those plans, which could exceed $150 million, would have to be funded if we do not obtain the relief sought. The pension regulators filed contestations to our motion in August 2012.
On March 31, 2010, the Canadian Court dismissed a motion for declaratory judgment brought by the province of Newfoundland and Labrador, awarding costs in our favor, and thus confirmed our position that the five orders the province issued under section 99 of its Environmental Protection Act on November 12, 2009 were subject to the stay of proceedings and the application of the claims procedure order pursuant to the Creditor Protection Proceedings. The province of Newfoundland and Labrador’s orders could have required us to proceed immediately with the environmental remediation of various sites we formerly owned or operated, some of which the province expropriated in December 2008. The Quebec Court of Appeal denied the province’s request for leave to appeal on May 18, 2010. An appeal of that decision is now pending before2010 and the Supreme Court of Canada which heard the matter on November 16, 2011. If leave to(the last level of appeal is ultimately granted andin Canada) denied the appeal is allowed, we could be required to make additional environmental remediation payments without regard toof that decision on December 7, 2012.
BCFC was dismissed from the Creditor Protection Proceedings which payments could haveas part of a material impact on our resultsnegotiated resolution to certain objections to the Plans of operations or financial condition.
Since late 2001, Bowater, several other paper companies,Reorganization, and numerous other companies have been namedit subsequently made an assignment for the benefit of its creditors under the Bankruptcy and Insolvency Act (Canada) (the “BIA”). BCFC appointed Green Hunt Wedlake Inc. (the “BCFC Trustee”) as defendantsits representative in asbestos personal injury actions. These actions generally allege occupational exposurethe BIA filing, whose responsibilities were, among others, to numerous products. We have denied the allegations and no specific product of ours has been identified by the plaintiffs in any of the actions as having caused or contributed to any individual plaintiff’s alleged asbestos-related injury. These suits have been filed by approximately 1,800 claimants who sought monetary damages in civil actions pending in state courts in Delaware, Georgia, Illinois, Mississippi, Missouri, New York and Texas. Approximately 1,000 of theseprosecute BCFC’s claims have been dismissed, either voluntarily or by summary judgment, and approximately 645 claims remain. A motion to dismiss will be filed in each state for all matters related to products and premises where the plaintiffs did not file(including a disputed claim in the Creditor Protection Proceedings in connection with the 7.95% notes due November 15, 2011 issued by BCFC (the “7.95% Notes”)) and distribute its property, if any. On September 21, 2012, in connection with the Creditor Protection Proceedings, Resolute FP US Inc. (formerly “AbiBow US Inc.” and Bowater Incorporated (“Bowater”)), entered into a settlement agreement with the BCFC Trustee, Wilmington Trust Company, as the successor indenture trustee with respect to the 7.95% Notes (the “Indenture Trustee”), and Avidity Partners, LLC, the Post-Effective Date Claims Agent under the confirmed Chapter 11 Plan of Reorganization. The settlement agreement resolved the claims process. All Mississippi productsagainst Bowater filed by the BCFC Trustee and premises cases were dismissed, with other dismissals to follow. We expect that any resulting liability would be a general unsecured claimthe Indenture Trustee in the Creditor Protection Proceedings. We subsequently distributed approximately 15 million shares of common stock from the disputed claim share reserve to the BCFC Trustee and to the holders of allowed and accepted unsecured creditor claims resolution process, which would be settled outentitled to additional distributions under the Plans of Reorganization. These distributions were not dilutive, as the shares in the reserve have been deemed outstanding since emergence. As a result of the share reserveBIA filing, the BCFC Trustee controls the entity and would not impact our results of operationsis responsible for prosecuting any remaining claim and cash flows.
Lumber duties
On October 12, 2006, an agreement regarding Canada’s softwood lumber exports todistributing its property under the U.S. became effective (the “2006 Softwood Lumber Agreement”). The 2006 Softwood Lumber Agreement provides for, among other things, softwood lumber to be subject to one of two ongoing border restrictions, depending upon the province of first manufacture with several provinces, including Nova Scotia, being exempt from these border restrictions. Volume quotas have been established for each
ABITIBIBOWATER INC.
Notes to Consolidated Financial Statements
company within the provinces of Ontario and Quebec based on historical production, and the volume quotas are not transferable between provinces. U.S. composite prices would have to rise above $355 composite per thousand board feet before the quota volume restrictions would be lifted, which had not occurred since the implementation of the 2006 Softwood Lumber Agreement. On January 23, 2012, Canada and the U.S. announced a two-year extension to the 2006 Softwood Lumber Agreement, through October 2015.
In February 2009, the LCIA tribunal (formerly the London Court of International Arbitration) issued its decision on a remedy in the softwood lumber arbitration in which Canada was found to have breached the 2006 Softwood Lumber Agreement between the United States and Canada by failing to properly calculate quotas during six months of 2007. The tribunal determined that, as an appropriate adjustment to compensate for the breach, Canada must collect an additional 10 percent ad valorem export charge on softwood lumber shipments from Eastern Canadian provinces, including Quebec and Ontario, until Cdn$68.26 million has been collected or the breach is cured some other way. If Canada fails to cure the breach, the United States is authorized to impose duties up to the amount specified by the tribunal. In April 2009, the United States announced that it would impose 10 percent ad valorem customs duties on imports of softwood lumber products in response to Canada’s failure to cure the breach. Such duties have not had a significant impact on our results of operations or financial position to date. The imposition of such duties ended in May 2011.BIA.
Environmental matters
We are subject to a variety of federal, state, provincial and local environmental laws and regulations in the jurisdictions in which we operate. We believe our operations are in material compliance with current applicable environmental laws and regulations. Environmental regulations promulgated in the future could require substantial additional expenditures for compliance and could have a material impact on us, in particular, and the industry in general.
We may be a “potentially responsible party” with respect to four hazardous waste sites that are being addressed pursuant to the Comprehensive Environmental Response, Compensation and Liability Act of 1980 (“Superfund”) or the Resource Conservation and Recovery Act (“RCRA”) corrective action authority. The first two sites are on CNC timberland tracts in South Carolina. One was already contaminated when acquired, and subsequently, the prior owner remediated the site and continues to monitor the groundwater. On the second site, several hundred steel drums containing textile chemical residue were discarded by unknown persons. The third site, at our mill in Coosa Pines, contained buried drums and has been remediated pursuant to RCRA and the RCRA permit has been closed. We continue to monitor the groundwater. The fourth site is called Alternate Energy Resources and involves ANC. ANC shipped to this site less than 100,000 gallons of waste to be disposed of and ANC’s share of the remediation costs is less than 0.5%. We believe we will not be liable for any significant amounts at any of these sites.
RESOLUTE FOREST PRODUCTS INC.
Notes to Consolidated Financial Statements
As of December 31, 2011,2012, we have recorded $6$4 million for environmental liabilities, which represents management’s estimate based on an assessment of relevant factors and assumptions of the ultimate settlement amounts for environmental liabilities. The amount of these liabilities could be affected by changes in facts or assumptions not currently known to management. These liabilities are included in “Accounts payable and accrued liabilities” or “Other long-term liabilities” in our Consolidated Balance Sheets.
ABITIBIBOWATER INC.
Notes to Consolidated Financial Statements
The activity in our environmental liabilities for the years ended December 31, 20112012 and 20102011 was as follows:
| Successor | Predecessor | |||||||||||
| (In millions) | 2011 | 2010 | ||||||||||
Beginning of year (2011: Successor; 2010: Predecessor) | $ | 8 | $ | 27 | ||||||||
Additions | – | 37 | ||||||||||
Payments | (1 | ) | (2 | ) | ||||||||
Reduction due to sale of mill | (1 | ) | – | |||||||||
Compromise and settlement due to distribution of Successor Company common stock on account of unsecured creditor claims | – | (38 | ) | |||||||||
Write-off of liabilities for which no claim was filed against us in the Creditor Protection Proceedings | – | (15 | ) | |||||||||
Transfer from liabilities associated with assets held for sale | – | 2 | ||||||||||
Other | – | (3 | ) | |||||||||
End of year (Successor) | $ | 6 | $ | 8 | ||||||||
| Successor | ||||||||
| (In millions) | 2012 | 2011 | ||||||
Beginning of year | $ | 6 | $ | 8 | ||||
Additions | – | – | ||||||
Payments | (2 | ) | (1 | ) | ||||
Reduction due to sale of mill | – | (1 | ) | |||||
End of year | $ | 4 | $ | 6 | ||||
Other representations, warranties and indemnifications
We make representations and warranties and offer indemnities to counterparties in connection with commercial transactions like asset sales and other commercial agreements. Indemnification obligations generally are standard contractual terms, are entered into in the normal course of business and are related to contingencies that are not expected to occur at the time of the agreement. We are not able to develop an estimate of the maximum payout under these indemnification obligations, but we believe that it is unlikely that we will be required to make material payments under those arrangements and, except as otherwise noted, no material liabilities related thereto have been recognized in our consolidated financial statements.
In connection with the sale of our investment in MPCo in December 2009, we provided certain undertakings and indemnities to Alcoa, including an indemnity for potential tax liabilities arising from the transaction. As discussed in Note 16, “Liquidity and Debt – Debt – Financings during Creditor Protection Proceedings – ULC DIP Facility,” the ULC maintained a reserve of approximately Cdn$83 million ($81 million, based on the exchange rate in effect on December 31, 2011) and Cdn$80 million ($80 million, based on the exchange rate in effect on December 31, 2010) as of December 31, 2011 and 2010, respectively, to secure those obligations. This reserve was included as restricted cash in “Other assets” in our Consolidated Balance Sheets as of December 31, 2011 and 2010. As discussed in Note 5,6, “Closure Costs, Impairment and Other Related Charges,” in 2010, we recorded an $8 milliona tax indemnification liability, which will bewas paid from this reserve. We believe it is unlikely that we will be required to make additional material payments pursuant to our undertakings and indemnities and therefore have recorded no additional liability as of December 31, 2011.2012. See Note 12, “Restricted Cash,” for additional information.
Note 21. Share Capital
Successor Company
Overview
AbitibiBowater Inc. isWe are authorized under itsour certificate of incorporation, which was amended and restated on the Emergence Date, to issue up to 200 million shares of capital stock, consisting of: (i) 190 million shares of common stock, par value $0.001 per share and (ii) 10 million shares of preferred stock, par value $0.001 per share.
Preferred stock
As of December 31, 20112012 and 2010,2011, no preferred shares were issued and outstanding.
Common stock
On the Emergence Date and pursuant to the Plans of Reorganization, we issued an aggregate of 97,134,954 shares of common stock and reserved 9,020,960 shares of common stock for future issuance under the AbitibiBowater Inc. 2010 Equity Incentive Plan (the “2010 LTIP”).LTIP. On December 17, 2010, 73,752,881 shares of common stock were distributed to the holders of unsecured claims as of the applicable distribution record date under the Plans of Reorganization on account of allowed unsecured creditor claims. During the yearyears ended December 31, 2012 and 2011, an additional 15,702,418 and 3,662,508 shares, respectively, of common stock were distributed to the holders of unsecured claims from this reserve. As of December 31, 20112012 and 2010,2011, we held the
ABITIBIBOWATER INC.
Notes to Consolidated Financial Statements
remaining 19,719,5654,017,147 and 23,382,07319,719,565 shares of common stock, respectively, in reserve for the benefit of holders of disputed claims. We will continue to make supplemental interim distributions of shares from this reserve to unsecured creditors as disputed claims are resolved. See Note 3,4, “Creditor Protection Proceedings – Emergence from Creditor Protection Proceedings,” for additional information.
RESOLUTE FOREST PRODUCTS INC.
Notes to Consolidated Financial Statements
Consistent with the confirmation order in respect of our U.S. Debtors’ Chapter 11 Reorganization Plan and applicable law, we relied on section 1145(a)(1) of Chapter 11 to exempt the issuance of these shares of common stock and their distribution to unsecured creditors from the registration requirements of the Securities Act.Act of 1933 (as amended, the “Securities Act”).
Treasury stock
On December 31, 2010, AbitibiBowater Inc.we issued 17,010,728 shares of unregistered common stock to Donohue Corp. (“Donohue,” a wholly-owned subsidiary of AbitibiBowater Inc.)ours) as part of an internal tax restructuring contemplated by the Plans of Reorganization. The shares were issued to Donohue in exchange for all of the outstanding shares of common stock of two of Donohue’s wholly-owned subsidiaries, each of which also was an indirect wholly-owned subsidiary of ours. We accounted for these shares as treasury stock in our Consolidated Balance Sheets and since these shares were acquired by Donohue from AbitibiBowater Inc. through an intercompany transaction which was eliminated in our consolidated financial statements, there was no cost to the consolidated entity for such treasury stock. The issuance of the shares to Donohue was made without registration under the Securities Act in reliance on the exemption from registration provided under section 4(2) thereof.
In 2012 and 2011, AbitibiBowater Inc.we distributed 29,923 shares and 49,172 shares, respectively, of common stock to ANC and we distributed 14,020 shares and 2,453 shares, respectively, of common stock to Fibrek. All such shares were distributed from the share reserve discussed above as settlement of an unsecured intercompany claimclaims ANC and Fibrek had filed against us in the Creditor Protection Proceedings. WeAs of December 31, 2012 and 2011, we accounted for thesethe shares distributed to ANC as treasury stock in our Consolidated Balance Sheets and since these shares were distributed to a wholly-ownedconsolidated subsidiary of ours through an intercompany transaction which wasand were eliminated in our consolidated financial statements, there was no cost to the consolidated entity for such treasury stock. Since Fibrek is also now a consolidated subsidiary, all shares distributed to Fibrek were accounted for as treasury stock at no cost to the consolidated entity in our Consolidated Balance Sheet as of December 31, 2012.
On May 22, 2012, our Board of Directors approved a share repurchase program of up to 10% of our common stock, for an aggregate purchase price of up to $100 million. During the year ended December 31, 2012, we repurchased 5,610,152 shares at a cost of $67 million.
On July 31, 2012, we distributed 503,054 shares from treasury as part of the consideration in the second step transaction to acquire the remaining non-controlling interest in Fibrek. For additional information, see Note 3, “Acquisition of Fibrek Inc.”
Predecessor Company
As of the Emergence Date and pursuant to the Plans of Reorganization, each share of the Predecessor Company’s common stock and preferred stock and each exchangeable share, option, warrant, conversion privilege or other legal or contractual right to purchase shares of the Predecessor Company’s common stock, including RSUs and DSUs, in each case to the extent outstanding immediately before the Emergence Date, was canceled and the holders thereof are not entitled to receive or retain any property on account thereof.
Dividends
We did not declare or pay any dividends on our common stock during the years ended December 31, 2012, 2011 2010 and 2009.2010.
Note 22. Share-Based Compensation
Overview
During the pendency of the Creditor Protection Proceedings and through December 31, 2010, no new share-based compensation awards were granted, and during the pendency of the Creditor Protection Proceedings, no issuance or payments of vested share-based awards were permitted without Court approval.
On the Emergence Date and pursuant to the Plans of Reorganization, all previously-issued and outstanding equity-based awards under our various share-based compensation plans were terminated and the 2010 LTIP became effective. The 2010 LTIP, administered by the Human Resources and Compensation/Nominating and Governance Committee of the Board of Directors (the “HR Board Committee”), provides for the grant of equity-based awards, including stock options, stock appreciation rights, restricted stock, RSUs, DSUs (collectively, “stock incentive awards”) and cash incentive awards to certain of our officers, directors, employees, consultants and advisors. WeAs discussed in Note 21, “Share Capital,” we have been authorized to issue stock incentive awards for up to 9.0 million shares under the 2010 LTIP.
RESOLUTE FOREST PRODUCTS INC.
Notes to Consolidated Financial Statements
In 2011, the Board of Directors adopted the AbitibiBowater Outside Director Deferred Compensation Plan, which has been renamed the Resolute Forest Products Outside Director Deferred Compensation Plan (the “Deferred Compensation Plan”), which allows non-employee directors to surrender 50% or 100% of their cash fees in exchange for DSUs or RSUs, as applicable based on the director’s country of residency. The number of awards issued pursuant to the Deferred Compensation Plan is based on 110% of the fees earned, resulting in a 10% premium incentive (the “incentive”).
As of December 31, 2012 and 2011, all of our outstanding stock incentive awards pursuant to the 2010 LTIP were accounted for as equity-classified, service-based awards and all of our outstanding stock incentive awards pursuant to the Deferred Compensation Plan were accounted for as liability awards. Approximately 7.7As of December 31, 2012, approximately 6.6 million shares were available for issuance under the 2010 LTIP.
ABITIBIBOWATER INC.
Notes to Consolidated Financial Statements
For the years ended December 31, 2012, 2011 2010 and 2009,2010, share-based compensation expense was $3$5 million ($1 million of tax benefit), $3 million (no($1 million of tax benefit) and $4$3 million (no tax benefit), respectively.
Modification of the 2010 LTIP
On July 20, 2011, the HR Board Committee approved a modification of the stock incentive award agreements under the 2010 LTIP for any stock incentive awards granted to employees retroactive to the beginning of the year. Employees who retire (upon meeting certain age and service criteria) at least six months after the grant date and prior to the end of the four-year vesting period will be allowed to continue vesting in their awards after retirement in accordance with the normal vesting schedule. The requisite service periods for the stock incentive awards are reduced on an individual basis, as necessary, to reflect the grantee’s individual retirement eligibility date (“the retirement eligibility period”). As of the date of the modification, nine employees’ awards were impacted.
Stock options
In 2012 and 2011, we made grants of 758,885 and 1,106,533 stock options, respectively, to our non-employee directors and to certain employees using the following weighted-average assumptions:
| 2012 | 2011 | |||||||||||
Exercise price | $ | 20.18 | $ | 11.41 | $ | 20.18 | ||||||
Fair value | $ | 9.71 | $ | 5.59 | $ | 9.71 | ||||||
Expected dividend yield | – | – | – | |||||||||
Expected volatility | 45.5 | % | 50.6 | % | 45.5 | % | ||||||
Risk-free interest rate | 2.0 | % | 1.6 | % | 2.0 | % | ||||||
Expected life in years | 6.25 | 6.25 | 6.25 | |||||||||
The stock options become exercisable ratably over a period of four years, or the retirement eligibility period, whichever is shorter, and, unless terminated earlier in accordance with their terms, expire 10 years from the date of grant. New shares of AbitibiBowaterour common stock are issued upon the exercise of a stock option.
We calculated the grant-date fair value of the stock options using the Black-Scholes option pricing model. The payment of dividends is subject to certain restrictions under the 2018 Notes indenture and the credit agreement that governs the ABL Credit Facility; therefore, we assumed an expected dividend yield of zero. Due to the short trading history of the Successor Company’s common stock, we estimated the expected volatility based on the historical volatility of a peer group within our industry measured over a term approximating the expected life of the options. We estimated the risk-free interest rate based on a zero-coupon U.S. Treasury instrument with a remaining term approximating the expected life of the options. Historical exercise data attributable to stock incentive awards granted after the Successor Company’s common stock began publicly trading is limited; therefore, we used the simplified method permitted by Staff Accounting Bulletin Topic 14 to estimate the expected life of the options. Under this approach, the expected life is presumed to be the midpoint between the vesting date and the end of the contractual term.
RESOLUTE FOREST PRODUCTS INC.
Notes to Consolidated Financial Statements
The activity of stock options for the year ended December 31, 20112012 was as follows:
| Number of Shares | Weighted- Average Exercise Price | Weighted- Life (years) | Aggregate Intrinsic Value | Number of Shares | Weighted- Price | Weighted- Life (years) | Aggregate Intrinsic Value | |||||||||||||||||||||||||
Outstanding as of December 31, 2010 (Successor) | – | $ | – | $ | – | |||||||||||||||||||||||||||
Outstanding as of December 31, 2011 (Successor) | 909,426 | $ | 19.56 | 9.5 | $ | – | ||||||||||||||||||||||||||
Granted | 1,106,533 | 20.18 | 758,885 | 11.41 | ||||||||||||||||||||||||||||
Exercised | – | – | – | – | ||||||||||||||||||||||||||||
Forfeited | (197,107 | ) | 23.05 | (137,693) | 20.22 | |||||||||||||||||||||||||||
Outstanding as of December 31, 2011 (Successor) | 909,426 | $ | 19.56 | 9.5 | $ | – | ||||||||||||||||||||||||||
Exercisable as of December 31, 2011 (Successor) | 134,331 | $ | 23.05 | 9.0 | $ | – | ||||||||||||||||||||||||||
Outstanding as of December 31, 2012 (Successor) | 1,530,618 | $ | 15.46 | 9.2 | $ | – | ||||||||||||||||||||||||||
Exercisable as of December 31, 2012 (Successor) | 292,738 | $ | 20.54 | 8.3 | $ | – | ||||||||||||||||||||||||||
As of December 31, 2011,2012, there was approximately $6$7 million of unrecognized compensation cost related to these stock options, which is expected to be recognized over a remaining requisite service period of 3.43.2 years.
ABITIBIBOWATER INC.
Notes to Consolidated Financial Statements
Restricted stock units and deferred stock units
In 2012 and 2011, we made grants of RSUs and DSUs to our non-employee directors and to certain employees pursuant to the 2010 LTIP. Each RSU and DSU provides the holder the right to receive one share of our common stock upon vesting. The awards vest ratably over a period of one year for directors and four years for employees, or over the retirement-eligibilityretirement eligibility period, whichever is shorter. Awards to employees are settled with shares of stock upon vesting, while awards to directors are settled with shares of stock ratably over a period of three years or upon separation from the Board of Directors, as applicable based on the director’s country of residency.
The activity of RSUs and DSUs for the year ended December 31, 20112012 was as follows:
| Number of Units | Weighted- Average Fair Value at Grant Date | Number of Units | Weighted- Average Fair Value at Grant Date | |||||||||||
Outstanding as of December 31, 2010 (Successor) | – | $ | – | |||||||||||
Outstanding as of December 31, 2011 (Successor) | 398,956 | $ 17.56 | ||||||||||||
Granted | 434,689 | 18.07 | 530,990 | 11.66 | ||||||||||
Vested and settled | (7,262 | ) | 26.49 | (110,551 | ) | 18.14 | ||||||||
Forfeited | (28,471 | ) | 23.05 | (41,847 | ) | 16.74 | ||||||||
Outstanding as of December 31, 2011 (Successor) | 398,956 | $ | 17.56 | |||||||||||
Outstanding as of December 31, 2012 (Successor)(3) | 777,548 | 13.50 | ||||||||||||
| (1) |
|
| (2) | Includes 20,859 awards that were vested in 2011 but were not settled |
| (3) | Includes 43 awards and 13,554 awards that were vested in 2012 and 2011, respectively, but have not been settled and therefore remain outstanding as of December 31, |
As of December 31, 2011,2012, there was approximately $5$8 million of unrecognized compensation cost related to these RSUs and DSUs, which is expected to be recognized over a remaining requisite service period of 3.73.4 years. New shares of AbitibiBowaterour common stock are issued upon the settlement of an RSU or DSU issued pursuant to the 2010 LTIP.
InThe weighted-average grant-date fair value of all RSUs and DSUs granted in 2011 we granted 4,625 DSUswas $18.07 per unit.
RESOLUTE FOREST PRODUCTS INC.
Notes to a non-employee director pursuant to the Deferred Compensation Plan. Each award provides the holder with the right to receive an amount of cash based on the market price of a share of AbitibiBowater common stock at the date of settlement. The portion of the award representing the incentive vests ratably over three years or, if earlier, upon the director’s separation from the Board of Directors. The remaining portion of the award is fully vested on the date of grant. The director vested in 4,205 DSUs in 2011. The awards are settled in cash upon separation from the Board of Directors. None of the DSUs were settled in 2011.Consolidated Financial Statements
Note 23. Timberland and Operating Leases and Purchase Obligations
We lease approximately 40,000 acres of timberlands under long-term leases for which aggregate lease payments were less than $1 million each year in 2012, 2011 2010 and 2009. These lease costs are capitalized as part of timberlands included in fixed assets and are charged against income at the time the timber is harvested.2010. In addition, we lease certain office premises, office equipment and transportation equipment under operating leases for which total expense was $13 million in 2012, $13 million in 2011 and $17 million in 2010 and $24 million in 2009.2010. In the normal course of business, we have also entered into various supply agreements, guarantees, purchase commitments and harvesting rights agreements (for land that we manage for which we make payments to various Canadian provinces based on the amount of timber harvested). Total expense for these agreements, guarantees and purchase commitments was $237 million in 2011, $174 million in 2010 and $174 million in 2009.
As of December 31, 2011,2012, the future minimum rental payments under timberland and operating leases and commitments for purchase obligations were as follows:
| (In millions) | Timberland Leases | Purchase Obligations (1) | Operating Leases, Net | Purchase Obligations (1) | Operating Leases, Net | |||||||||||||||
2012 | $ | – | $ | 34 | $ | 7 | ||||||||||||||
2013 | – | 21 | 6 | $ | 63 | $ | 6 | |||||||||||||
2014 | – | 18 | 4 | 34 | 4 | |||||||||||||||
2015 | – | 14 | 4 | 20 | 3 | |||||||||||||||
2016 | – | 13 | 6 | 17 | 3 | |||||||||||||||
2017 | 17 | 2 | ||||||||||||||||||
Thereafter | 2 | 162 | 6 | 147 | 10 | |||||||||||||||
| $ | 2 | $ | 262 | $ | 33 | $ | 298 | $ | 28 | |||||||||||
| (1) | Purchase obligations include, among other things, a bridge and railroad contract for our Fort Frances |
ABITIBIBOWATER INC.
Notes to Consolidated Financial Statements
Note 24. Alternative Fuel Mixture Tax Credits
During 2009, the Code provided a tax credit for companies that use alternative fuel mixtures to produce energy to operate their businesses. The credit, equal to $0.50 per gallon of alternative fuel contained in the mixture, was refundable to the taxpayer. During the year ended December 31, 2009, we recorded $276 million of these credits, which were included in “Cost of sales, excluding depreciation, amortization and cost of timber harvested” in our Consolidated Statements of Operations. According to the Code, the tax credit expired at the end of 2009.
Note 25.24. Segment Information
We manage our business based on the products we manufacture. Accordingly, our reportable segments correspond to our primary product lines: newsprint, coated papers, specialty papers, market pulp and wood products.
None of the income or loss items following “Operating income (loss)” income” in our Consolidated Statements of Operations are allocated to our segments, since those items are reviewed separately by management. For the same reason, closure costs, impairment and other related charges, employee termination costs, net gain on disposition of assets and other, costs associated with our unsuccessful refinancing efforts in 2009 andas well as other discretionary charges or credits are not allocated to our segments. Share-based compensation expense is, however, allocated to our segments. We also allocate depreciation expense to our segments, although the related fixed assets are not allocated to segment assets. Additionally, beginning in 2011, all selling, general and administrative expenses, excluding employee termination costs and certain discretionary charges and credits, are allocated to our segments.
Only assets which are identifiable by segment and reviewed by our management are allocated to segment assets. In 2012 and 2011, no assets were identifiable by segment and reviewed by management. In 2010, and 2009, the only assets identifiable by segment were goodwill of the Predecessor Company and finished goods inventory. All other assets were included in Corporate and other.
RESOLUTE FOREST PRODUCTS INC.
Notes to Consolidated Financial Statements
Information about certain segment data as of and for the years ended December 31, 2012, 2011 2010 and 20092010 was as follows:
| (In millions) | Newsprint | Coated Papers | Specialty Papers | Market Pulp(1) | Wood Products | Corporate and Other | Consolidated Total | Newsprint | Coated Papers | Specialty Papers | Market Pulp(1) | Wood Products | Corporate and Other | Consolidated Total | ||||||||||||||||||||||||||||||||||||||||||
Sales | Sales |
| Sales |
| ||||||||||||||||||||||||||||||||||||||||||||||||||||
2012 (Successor) | $ | 1,627 | $ | 455 | $ | 1,107 | $ | 814 | $ | 500 | $ | – | $ | 4,503 | ||||||||||||||||||||||||||||||||||||||||||
2011 (Successor) | $ | 1,816 | $ | 538 | $ | 1,275 | $ | 659 | $ | 468 | $ | – | $ | 4,756 | 1,816 | 538 | 1,275 | 659 | 468 | – | 4,756 | |||||||||||||||||||||||||||||||||||
2010 (Predecessor) | 1,804 | 482 | 1,321 | 715 | 424 | – | 4,746 | 1,804 | 482 | 1,321 | 715 | 424 | – | 4,746 | ||||||||||||||||||||||||||||||||||||||||||
2009 (Predecessor) | 1,802 | 416 | 1,331 | 518 | 290 | 9 | 4,366 | |||||||||||||||||||||||||||||||||||||||||||||||||
Depreciation, amortization and cost of timber harvested | Depreciation, amortization and cost of timber harvested |
| Depreciation, amortization and cost of timber harvested |
| ||||||||||||||||||||||||||||||||||||||||||||||||||||
2012 (Successor) | $ | 72 | $ | 37 | $ | 46 | $ | 44 | $ | 34 | $ | – | $ | 233 | ||||||||||||||||||||||||||||||||||||||||||
2011 (Successor) | $ | 73 | $ | 35 | $ | 49 | $ | 30 | $ | 33 | $ | – | $ | 220 | 73 | 35 | 49 | 30 | 33 | – | 220 | |||||||||||||||||||||||||||||||||||
2010 (Predecessor) | 225 | 30 | 128 | 49 | 42 | 19 | 493 | 225 | 30 | 128 | 49 | 42 | 19 | 493 | ||||||||||||||||||||||||||||||||||||||||||
2009 (Predecessor) | 291 | 28 | 151 | 52 | 49 | 31 | 602 | |||||||||||||||||||||||||||||||||||||||||||||||||
Operating income (loss)(2) | Operating income (loss)(2) |
| Operating income (loss)(2) |
| ||||||||||||||||||||||||||||||||||||||||||||||||||||
2012 (Successor) | $ | 97 | $ | 9 | $ | 76 | $ | (50) | $ | 26 | $ | (188) | $ | (30) | ||||||||||||||||||||||||||||||||||||||||||
2011 (Successor) | $ | 89 | $ | 57 | $ | 62 | $ | 85 | $ | (25 | ) | $ | (70 | ) | $ | 198 | 89 | 57 | 62 | 85 | (25) | (70) | 198 | |||||||||||||||||||||||||||||||||
2010 (Predecessor) | (171 | ) | 31 | (44 | ) | 137 | 9 | (122 | ) | (160 | ) | (171) | 31 | (44) | 137 | 9 | (122) | (160) | ||||||||||||||||||||||||||||||||||||||
2009 (Predecessor)(3) | (353 | ) | 89 | 85 | 112 | (56 | ) | (252 | ) | (375 | ) | |||||||||||||||||||||||||||||||||||||||||||||
Capital expenditures | Capital expenditures |
| ||||||||||||||||||||||||||||||||||||||||||||||||||||||
2012 (Successor) | $ | 58 | $ | 8 | $ | 14 | $ | 40 | $ | 22 | $ | 27 | $ | 169 | ||||||||||||||||||||||||||||||||||||||||||
2011 (Successor) | $ | 34 | $ | 4 | $ | 15 | $ | 12 | $ | 20 | $ | 12 | $ | 97 | 34 | 4 | 15 | 12 | 20 | 12 | 97 | |||||||||||||||||||||||||||||||||||
2010 (Predecessor) | 26 | 4 | 34 | 7 | 9 | 1 | 81 | 26 | 4 | 34 | 7 | 9 | 1 | 81 | ||||||||||||||||||||||||||||||||||||||||||
2009 (Predecessor) | 36 | 3 | 43 | 9 | 9 | 1 | 101 | |||||||||||||||||||||||||||||||||||||||||||||||||
Assets | Assets |
| ||||||||||||||||||||||||||||||||||||||||||||||||||||||
2012 (Successor) | $ | – | $ | – | $ | – | $ | – | $ | – | $ | 6,324 | $ | 6,324 | ||||||||||||||||||||||||||||||||||||||||||
2011 (Successor) | $ | – | $ | – | $ | – | $ | – | $ | – | $ | 6,298 | $ | 6,298 | – | – | – | – | – | 6,298 | 6,298 | |||||||||||||||||||||||||||||||||||
2010 (Successor) | 43 | 15 | 52 | 37 | 37 | 6,951 | 7,135 | 43 | 15 | 52 | 37 | 37 | 6,951 | 7,135 | ||||||||||||||||||||||||||||||||||||||||||
2009 (Predecessor) | 74 | 65 | 46 | 28 | 42 | 6,857 | 7,112 | |||||||||||||||||||||||||||||||||||||||||||||||||
| (1) | For the years ended December 31, 2012, 2011 |
ABITIBIBOWATER INC.
Notes to Consolidated Financial Statements
| (2) | Corporate and other operating loss for the years ended December 31, 2012, 2011 |
| Successor | Predecessor | Successor | Predecessor | |||||||||||||||||||||||||||
| (In millions) | (In millions) | 2011 | 2010 | 2009 | 2012 | 2011 | 2010 | |||||||||||||||||||||||
Net gain on disposition of assets and other | $ | 3 | $ | 30 | $ | 91 | $ | 35 | $ | 3 | $ | 30 | ||||||||||||||||||
Closure costs, impairment and other related charges | (46 | ) | (11 | ) | (202 | ) | (180 | ) | (46 | ) | (11) | |||||||||||||||||||
Write-downs of inventory | (3 | ) | – | (17 | ) | (12 | ) | (3 | ) | – | ||||||||||||||||||||
Employee termination (costs) credit | (12 | ) | 8 | (2 | ) | (5 | ) | (12 | ) | 8 | ||||||||||||||||||||
Transaction costs in connection with our proposed acquisition of | (5 | ) | – | – | ||||||||||||||||||||||||||
Reversal of previously recorded Canadian capital tax liabilities due to new legislation | – | – | 16 | |||||||||||||||||||||||||||
Fees for unsuccessful refinancing efforts | – | – | (10 | ) | ||||||||||||||||||||||||||
Transaction costs in connection with our acquisition of Fibrek | (8 | ) | (5 | ) | – | |||||||||||||||||||||||||
Start up costs of idled mills | (13 | ) | – | – | ||||||||||||||||||||||||||
| $ | (63 | ) | $ | 27 | $ | (124 | ) | $ | (183 | ) | $ | (63 | ) | $ | 27 | |||||||||||||||
RESOLUTE FOREST PRODUCTS INC.
Notes to Consolidated Financial Statements
|
We sell newsprint and specialty papers to various joint venture partners (partners with us in the ownership of certain mills we operate). Sales to our joint venture partners, which are transacted at arm’s length negotiated prices, were $278 million, $294 million and $301 million in 2011, 2010 and 2009, respectively. Amounts due from joint venture partners were $31 million and $35 million as of December 31, 2011 and 2010, respectively, and are included in “Accounts receivable, net” in our Consolidated Balance Sheets.
Sales are attributed to countries based on the location of the customer. No single customer, related or otherwise, accounted for 10% or more of our 2012, 2011 2010 or 20092010 consolidated sales. No country in the “Other countries” group in the table below exceeded 2% of consolidated sales. Sales by country for the years ended December 31, 2012, 2011 2010 and 20092010 were as follows:
| Successor | Predecessor | Successor | Predecessor | |||||||||||||||||||||||||||
| (In millions) | 2011 | 2010 | 2009 | 2012 | 2011 | 2010 | ||||||||||||||||||||||||
United States | $ | 2,859 | $ | 2,775 | $ | 2,852 | $ | 2,766 | $ | 2,859 | $ | 2,775 | ||||||||||||||||||
Foreign countries: | ||||||||||||||||||||||||||||||
Canada | 636 | 703 | 508 | 636 | 636 | 703 | ||||||||||||||||||||||||
Brazil | 166 | 156 | 118 | 154 | 166 | 156 | ||||||||||||||||||||||||
Mexico | 151 | 166 | 93 | 140 | 151 | 166 | ||||||||||||||||||||||||
Italy | 106 | 128 | 83 | 105 | 106 | 128 | ||||||||||||||||||||||||
Korea | 88 | 36 | 88 | 84 | 88 | 36 | ||||||||||||||||||||||||
United Kingdom | 68 | 73 | 188 | |||||||||||||||||||||||||||
India | 60 | 96 | 34 | 36 | 60 | 96 | ||||||||||||||||||||||||
Other countries | 622 | 613 | 402 | 582 | 690 | 686 | ||||||||||||||||||||||||
| 1,897 | 1,971 | 1,514 | 1,737 | 1,897 | 1,971 | |||||||||||||||||||||||||
| $ | 4,756 | $ | 4,746 | $ | 4,366 | $ | 4,503 | $ | 4,756 | $ | 4,746 | |||||||||||||||||||
Long-lived assets, which exclude goodwill of the Predecessor Company, intangible assets and deferred income tax assets, by country, as of December 31, 2011, 20102012 and 20092011, were as follows:
Successor | Predecessor | Successor | ||||||||||||||||||||||||
| (In millions) | 2011 | 2010 | 2009 | 2012 | 2011 | |||||||||||||||||||||
United States | $ | 1,110 | $ | 1,189 | $ | 1,449 | $ | 1,071 | $ | 1,110 | ||||||||||||||||
Foreign countries: | ||||||||||||||||||||||||||
Canada | 1,629 | 1,736 | 2,785 | 1,538 | 1,629 | |||||||||||||||||||||
Korea | 23 | 32 | 102 | 25 | 23 | |||||||||||||||||||||
United Kingdom | – | – | 78 | |||||||||||||||||||||||
| 1,652 | 1,768 | 2,965 | 1,563 | 1,652 | ||||||||||||||||||||||
| $ | 2,762 | $ | 2,957 | $ | 4,414 | $ | 2,634 | $ | 2,762 | |||||||||||||||||
ABITIBIBOWATERRESOLUTE FOREST PRODUCTS INC.
Notes to Consolidated Financial Statements
Note 26.25. Condensed Consolidating Financial Information
The following information is presented in accordance with Rule 3-10 of Regulation S-X and the public information requirements of Rule 144 promulgated pursuant to the Securities Act in connection with AbitibiBowaterResolute Forest Products Inc.’s issuance of the 2018 Notes that are fully and unconditionally guaranteed, on a joint and several basis, by all of our 100% owned material U.S. subsidiaries (the “Guarantor Subsidiaries”). The 2018 Notes are not guaranteed by our foreign subsidiaries and our less than 100% owned U.S. subsidiaries (the “Non-guarantor Subsidiaries”).
The following condensed consolidating financial information sets forth the Statements of Operations and Comprehensive (Loss) Income for the years ended December 31, 2012, 2011 2010 and 2009,2010, the Balance Sheets as of December 31, 20112012 and 20102011 and the Statements of Cash Flows for the years ended December 31, 2012, 2011 and 2010 and 2009 for AbitibiBowaterResolute Forest Products Inc. (the “Parent”), the Guarantor Subsidiaries on a combined basis and the Non-guarantor Subsidiaries on a combined basis. The condensed consolidating financial information reflects the investments of the Parent in the Guarantor Subsidiaries and Non-guarantor Subsidiaries, as well as the investments of the Guarantor Subsidiaries in the Non-guarantor Subsidiaries, using the equity method of accounting. The principal consolidating adjustments are elimination entries to eliminate the investments in subsidiaries and intercompany balances and transactions.
CONDENSED CONSOLIDATING STATEMENT OF OPERATIONS
For the Year Ended December 31, 2011 (Successor)
CONDENSED CONSOLIDATING STATEMENT OF OPERATIONS AND COMPREHENSIVE (LOSS) INCOME For the Year Ended December 31, 2012 (Successor)
| CONDENSED CONSOLIDATING STATEMENT OF OPERATIONS AND COMPREHENSIVE (LOSS) INCOME For the Year Ended December 31, 2012 (Successor)
| ||||||||||||||||||||||||||||||||||||||||||||
| (In millions) | Parent | Guarantor Subsidiaries | Non-guarantor Subsidiaries | Consolidating Adjustments | Consolidated | Parent | Guarantor Subsidiaries | Non-guarantor Subsidiaries | Consolidating Adjustments | Consolidated | |||||||||||||||||||||||||||||||||||
Sales | $ | – | $ | 3,141 | $ | 3,154 | $ | (1,539 | ) | $ | 4,756 | $ | – | $ | 3,139 | $ | 2,894 | $ | (1,530 | ) | $4,503 | ||||||||||||||||||||||||
Costs and expenses: | |||||||||||||||||||||||||||||||||||||||||||||
Cost of sales, excluding depreciation, amortization and cost of timber harvested | – | 2,684 | 2,445 | (1,539 | ) | 3,590 | – | 2,774 | 2,235 | (1,517 | ) | 3,492 | |||||||||||||||||||||||||||||||||
Depreciation, amortization and cost of timber harvested | – | 90 | 130 | – | 220 | – | 93 | 140 | – | 233 | |||||||||||||||||||||||||||||||||||
Distribution costs | – | 157 | 390 | – | 547 | – | 162 | 361 | (9 | ) | 514 | ||||||||||||||||||||||||||||||||||
Selling, general and administrative expenses | 27 | 58 | 73 | – | 158 | 18 | 56 | 75 | – | 149 | |||||||||||||||||||||||||||||||||||
Closure costs, impairment and other related charges | – | 18 | 28 | – | 46 | – | 12 | 168 | – | 180 | |||||||||||||||||||||||||||||||||||
Net gain on disposition of assets and other | – | (2 | ) | (1 | ) | – | (3 | ) | – | – | (35 | ) | – | (35 | ) | ||||||||||||||||||||||||||||||
Operating (loss) income | (27 | ) | 136 | 89 | – | 198 | (18 | ) | 42 | (50 | ) | (4 | ) | (30 | ) | ||||||||||||||||||||||||||||||
Interest expense | (153 | ) | (7 | ) | (18 | ) | 83 | (95 | ) | (214 | ) | (13 | ) | (8 | ) | 169 | (66 | ) | |||||||||||||||||||||||||||
Other income (expense), net | 6 | 71 | (42 | ) | (83 | ) | (48 | ) | |||||||||||||||||||||||||||||||||||||
Other income, net | 2 | 171 | 18 | (169 | ) | 22 | |||||||||||||||||||||||||||||||||||||||
Parent’s equity in income of subsidiaries | 152 | – | – | (152 | ) | – | 144 | – | – | (144 | ) | – | |||||||||||||||||||||||||||||||||
(Loss) income before income taxes | (22 | ) | 200 | 29 | (152 | ) | 55 | (86 | ) | 200 | (40 | ) | (148 | ) | (74 | ) | |||||||||||||||||||||||||||||
Income tax benefit (provision) | 63 | (86 | ) | 7 | – | (16 | ) | 84 | (69 | ) | 22 | 1 | 38 | ||||||||||||||||||||||||||||||||
Net income including noncontrolling interests | 41 | 114 | 36 | (152 | ) | 39 | |||||||||||||||||||||||||||||||||||||||
Net (loss) income including noncontrolling interests | (2 | ) | 131 | (18 | ) | (147 | ) | (36 | ) | ||||||||||||||||||||||||||||||||||||
Net loss attributable to noncontrolling interests | – | – | 2 | – | 2 | – | – | 34 | – | 34 | |||||||||||||||||||||||||||||||||||
Net income attributable to AbitibiBowater Inc. | $ | 41 | $ | 114 | $ | 38 | $ | (152 | ) | $ | 41 | ||||||||||||||||||||||||||||||||||
Net (loss) income attributable to Resolute Forest | $ | (2 | ) | $ | 131 | $ | 16 | $ | (147 | ) | $ (2 | ) | |||||||||||||||||||||||||||||||||
Comprehensive (loss) income attributable to Resolute Forest Products Inc. | $ | (321 | ) | $ | 69 | $ | (241 | ) | $ | 172 | $ (321 | ) | |||||||||||||||||||||||||||||||||
ABITIBIBOWATERRESOLUTE FOREST PRODUCTS INC.
Notes to Consolidated Financial Statements
CONDENSED CONSOLIDATING STATEMENT OF OPERATIONS
For the Year Ended December 31, 2010 (Predecessor)
| (In millions) | Parent | Guarantor Subsidiaries | Non-guarantor Subsidiaries | Consolidating Adjustments | Consolidated | |||||||||||||||
Sales | $ | – | $ | 2,761 | $ | 3,393 | $ | (1,408 | ) | $ | 4,746 | |||||||||
Costs and expenses: | ||||||||||||||||||||
Cost of sales, excluding depreciation, amortization and cost of timber harvested | – | 2,389 | 2,743 | (1,408 | ) | 3,724 | ||||||||||||||
Depreciation, amortization and cost of timber harvested | – | 133 | 360 | – | 493 | |||||||||||||||
Distribution costs | – | 134 | 419 | – | 553 | |||||||||||||||
Selling, general and administrative expenses | 34 | 36 | 85 | – | 155 | |||||||||||||||
Reserve for receivables from subsidiaries | (32 | ) | – | – | 32 | – | ||||||||||||||
Closure costs, impairment and other related charges | – | 2 | 9 | – | 11 | |||||||||||||||
Net gain on disposition of assets and other | – | (13 | ) | (17 | ) | – | (30 | ) | ||||||||||||
Operating (loss) income | (2 | ) | 80 | (206 | ) | (32 | ) | (160 | ) | |||||||||||
Interest expense | (26 | ) | (96 | ) | (371 | ) | 10 | (483 | ) | |||||||||||
Other (expense) income, net | (1 | ) | 66 | 29 | (183 | ) | (89 | ) | ||||||||||||
Parent’s equity in income of subsidiaries | 1,652 | – | – | (1,652 | ) | – | ||||||||||||||
Income (loss) before reorganization items and income taxes | 1,623 | 50 | (548 | ) | (1,857 | ) | (732 | ) | ||||||||||||
Reorganization items, net | (185 | ) | 1,274 | 4,848 | (4,036 | ) | 1,901 | |||||||||||||
Income (loss) before income taxes | 1,438 | 1,324 | 4,300 | (5,893 | ) | 1,169 | ||||||||||||||
Income tax benefit (provision) | 8 | 461 | 1,145 | (8 | ) | 1,606 | ||||||||||||||
Net income (loss) including noncontrolling interests | 1,446 | 1,785 | 5,445 | (5,901 | ) | 2,775 | ||||||||||||||
Net income attributable to noncontrolling interests | – | – | (161 | ) | – | (161 | ) | |||||||||||||
Net income (loss) attributable to AbitibiBowater Inc. | $ | 1,446 | $ | 1,785 | $ | 5,284 | $ | (5,901 | ) | $ | 2,614 | |||||||||
CONDENSED CONSOLIDATING STATEMENT OF OPERATIONS AND COMPREHENSIVE (LOSS) INCOME For the Year Ended December 31, 2011 (Successor)
| |||||||||||||||||||||||||
| (In millions) | Parent | Guarantor Subsidiaries | Non-guarantor Subsidiaries | Consolidating Adjustments | Consolidated | ||||||||||||||||||||
Sales | $ | – | $ | 3,141 | $ | 3,154 | $ | (1,539 | ) | $ | 4,756 | ||||||||||||||
Costs and expenses: | |||||||||||||||||||||||||
Cost of sales, excluding depreciation, | – | 2,684 | 2,445 | (1,539 | ) | 3,590 | |||||||||||||||||||
Depreciation, amortization and cost of timber | – | 90 | 130 | – | 220 | ||||||||||||||||||||
Distribution costs | – | 157 | 390 | – | 547 | ||||||||||||||||||||
Selling, general and administrative expenses | 27 | 58 | 73 | – | 158 | ||||||||||||||||||||
Closure costs, impairment and other related | – | 18 | 28 | – | 46 | ||||||||||||||||||||
Net gain on disposition of assets and other | – | (2 | ) | (1 | ) | – | (3 | ) | |||||||||||||||||
Operating (loss) income | (27 | ) | 136 | 89 | – | 198 | |||||||||||||||||||
Interest expense | (216 | ) | (7 | ) | (18 | ) | 146 | (95 | ) | ||||||||||||||||
Other income (expense), net | 6 | 134 | (42 | ) | (146 | ) | (48 | ) | |||||||||||||||||
Parent’s equity in income of subsidiaries | 193 | – | – | (193 | ) | – | |||||||||||||||||||
(Loss) income before income taxes | (44 | ) | 263 | 29 | (193 | ) | 55 | ||||||||||||||||||
Income tax benefit (provision) | 85 | (107 | ) | 6 | – | (16 | ) | ||||||||||||||||||
Net income including noncontrolling interests | 41 | 156 | 35 | (193 | ) | 39 | |||||||||||||||||||
Net loss attributable to noncontrolling interests | – | – | 2 | – | 2 | ||||||||||||||||||||
Net income attributable to Resolute Forest | $ | 41 | $ | 156 | $ | 37 | $ | (193 | ) | $ | 41 | ||||||||||||||
Comprehensive (loss) income attributable to | $ | (262 | ) | $ | 83 | $ | (192 | ) | $ | 109 | $ | (262 | ) | ||||||||||||
ABITIBIBOWATERRESOLUTE FOREST PRODUCTS INC.
Notes to Consolidated Financial Statements
CONDENSED CONSOLIDATING STATEMENT OF OPERATIONS
For the Year Ended December 31, 2009 (Predecessor)
| (In millions) | Parent | Guarantor Subsidiaries | Non-guarantor Subsidiaries | Consolidating Adjustments | Consolidated | |||||||||||||||
Sales | $ | – | $ | 2,519 | $ | 3,222 | $ | (1,375 | ) | $ | 4,366 | |||||||||
Costs and expenses: | ||||||||||||||||||||
Cost of sales, excluding depreciation, amortization and cost of timber harvested | – | 2,052 | 2,666 | (1,375 | ) | 3,343 | ||||||||||||||
Depreciation, amortization and cost of timber harvested | – | 147 | 455 | – | 602 | |||||||||||||||
Distribution costs | – | 120 | 367 | – | 487 | |||||||||||||||
Selling, general and administrative expenses | 29 | 74 | 95 | – | 198 | |||||||||||||||
Reserve for receivables from subsidiaries | 410 | 299 | – | (709 | ) | – | ||||||||||||||
Closure costs, impairment and other related charges | – | 111 | 91 | – | 202 | |||||||||||||||
Net gain on disposition of assets and other | – | (13 | ) | (78 | ) | – | (91 | ) | ||||||||||||
Operating (loss) income | (439 | ) | (271 | ) | (374 | ) | 709 | (375 | ) | |||||||||||
Interest expense | (40 | ) | (136 | ) | (464 | ) | 43 | (597 | ) | |||||||||||
Other income (expense), net | 12 | 38 | (78 | ) | (43 | ) | (71 | ) | ||||||||||||
Parent’s equity in loss of subsidiaries | – | – | – | – | – | |||||||||||||||
(Loss) income before reorganization items and income taxes | (467 | ) | (369 | ) | (916 | ) | 709 | (1,043 | ) | |||||||||||
Reorganization items, net | (2 | ) | (193 | ) | (444 | ) | – | (639 | ) | |||||||||||
(Loss) income before income taxes | �� | (469 | ) | (562 | ) | (1,360 | ) | 709 | (1,682 | ) | ||||||||||
Income tax (provision) benefit | – | (24 | ) | 146 | – | 122 | ||||||||||||||
Net (loss) income including noncontrolling interests | (469 | ) | (586 | ) | (1,214 | ) | 709 | (1,560 | ) | |||||||||||
Net loss attributable to noncontrolling interests | – | – | 7 | – | 7 | |||||||||||||||
Net (loss) income attributable to AbitibiBowater Inc. | $ | (469 | ) | $ | (586 | ) | $ | (1,207 | ) | $ | 709 | $ | (1,553 | ) | ||||||
CONDENSED CONSOLIDATING STATEMENT OF OPERATIONS AND COMPREHENSIVE INCOME For the Year Ended December 31, 2010 (Predecessor)
| |||||||||||||||||||||||||
| (In millions) | Parent | Guarantor Subsidiaries | Non-guarantor Subsidiaries | Consolidating Adjustments | Consolidated | ||||||||||||||||||||
Sales | $ | – | $ | 2,761 | $ | 3,393 | $ | (1,408 | ) | $4,746 | |||||||||||||||
Costs and expenses: | |||||||||||||||||||||||||
Cost of sales, excluding depreciation, | – | 2,389 | 2,743 | (1,408 | ) | 3,724 | |||||||||||||||||||
Depreciation, amortization and cost of timber | – | 133 | 360 | – | 493 | ||||||||||||||||||||
Distribution costs | – | 134 | 419 | – | 553 | ||||||||||||||||||||
Selling, general and administrative expenses | 34 | 36 | 85 | – | 155 | ||||||||||||||||||||
Reserve for receivables from subsidiaries | (32 | ) | – | – | 32 | – | |||||||||||||||||||
Closure costs, impairment and other related | – | 2 | 9 | – | 11 | ||||||||||||||||||||
Net gain on disposition of assets and other | – | (13 | ) | (17 | ) | – | (30 | ) | |||||||||||||||||
Operating (loss) income | (2 | ) | 80 | (206 | ) | (32 | ) | (160 | ) | ||||||||||||||||
Interest expense | (29 | ) | (96 | ) | (371 | ) | 13 | (483 | ) | ||||||||||||||||
Other (expense) income, net | (1 | ) | 96 | 29 | (213 | ) | (89 | ) | |||||||||||||||||
Parent’s equity in income of subsidiaries | 1,682 | – | – | (1,682 | ) | – | |||||||||||||||||||
Income (loss) before reorganization items and | 1,650 | 80 | (548 | ) | (1,914 | ) | (732 | ) | |||||||||||||||||
Reorganization items, net | (212 | ) | 1,274 | 4,848 | (4,009 | ) | 1,901 | ||||||||||||||||||
Income before income taxes | 1,438 | 1,354 | 4,300 | (5,923 | ) | 1,169 | |||||||||||||||||||
Income tax benefit (provision) | 8 | 461 | 1,145 | (8 | ) | 1,606 | |||||||||||||||||||
Net income including noncontrolling | 1,446 | 1,815 | 5,445 | (5,931 | ) | 2,775 | |||||||||||||||||||
Net income attributable to noncontrolling interests | – | – | (161 | ) | – | (161 | ) | ||||||||||||||||||
Net income attributable to Resolute | $ | 1,446 | $ | 1,815 | $ | 5,284 | $ | (5,931 | ) | $2,614 | |||||||||||||||
Comprehensive income attributable to | $ | 876 | $ | 1,760 | $ | 4,769 | $ | (5,361 | ) | $2,044 | |||||||||||||||
ABITIBIBOWATERRESOLUTE FOREST PRODUCTS INC.
Notes to Consolidated Financial Statements
CONDENSED CONSOLIDATING BALANCE SHEET
As of December 31, 2011 (Successor)
CONDENSED CONSOLIDATING BALANCE SHEET As of December 31, 2012 (Successor)
| CONDENSED CONSOLIDATING BALANCE SHEET As of December 31, 2012 (Successor)
| ||||||||||||||||||||||||||||||||||||||||||||
| (In millions) | Parent | Guarantor Subsidiaries | Non-guarantor Subsidiaries | Consolidating Adjustments | Consolidated | Parent | Guarantor Subsidiaries | Non-guarantor Subsidiaries | Consolidating Adjustments | Consolidated | |||||||||||||||||||||||||||||||||||
Assets | |||||||||||||||||||||||||||||||||||||||||||||
Current assets: | |||||||||||||||||||||||||||||||||||||||||||||
Cash and cash equivalents | $ | – | $ | 128 | $ | 241 | $ | – | $ | 369 | $ | 5 | $ | 171 | $ | 87 | $ | – | $ 263 | ||||||||||||||||||||||||||
Accounts receivable, net | – | 349 | 401 | – | 750 | – | 383 | 366 | (52 | ) | 697 | ||||||||||||||||||||||||||||||||||
Accounts receivable from affiliates | – | 70 | 302 | (372 | ) | – | – | 262 | 211 | (473 | ) | – | |||||||||||||||||||||||||||||||||
Inventories, net | – | 172 | 303 | – | 475 | – | 221 | 328 | (4 | ) | 545 | ||||||||||||||||||||||||||||||||||
Assets held for sale | – | – | 7 | – | 7 | ||||||||||||||||||||||||||||||||||||||||
Deferred income tax assets | – | 27 | 82 | – | 109 | – | 11 | 45 | – | 56 | |||||||||||||||||||||||||||||||||||
Note and interest receivable from parent | – | 945 | – | (945 | ) | – | |||||||||||||||||||||||||||||||||||||||
Note receivable from affiliate | – | 11 | – | (11 | ) | – | |||||||||||||||||||||||||||||||||||||||
Notes and interest receivable from parent | – | 593 | – | (593 | ) | – | |||||||||||||||||||||||||||||||||||||||
Notes receivable from affiliates | – | 9 | 138 | (147 | ) | – | |||||||||||||||||||||||||||||||||||||||
Note receivable from a subsidiary | 41 | – | – | (41 | ) | – | |||||||||||||||||||||||||||||||||||||||
Other current assets | – | 16 | 43 | – | 59 | – | 18 | 40 | – | 58 | |||||||||||||||||||||||||||||||||||
Total current assets | – | 1,718 | 1,379 | (1,328 | ) | 1,769 | 46 | 1,668 | 1,215 | (1,310 | ) | 1,619 | |||||||||||||||||||||||||||||||||
Fixed assets, net | – | 938 | 1,564 | – | 2,502 | – | 908 | 1,532 | – | 2,440 | |||||||||||||||||||||||||||||||||||
Amortizable intangible assets, net | – | – | 18 | – | 18 | – | – | 69 | – | 69 | |||||||||||||||||||||||||||||||||||
Deferred income tax assets | – | 524 | 1,225 | – | 1,749 | – | 595 | 1,406 | 1 | 2,002 | |||||||||||||||||||||||||||||||||||
Note receivable from affiliate | – | 3 | – | (3 | ) | – | |||||||||||||||||||||||||||||||||||||||
Notes receivable from affiliates | – | 531 | – | (531 | ) | – | |||||||||||||||||||||||||||||||||||||||
Investments in and advances to consolidated subsidiaries | 5,565 | 2,360 | – | (7,925 | ) | – | 4,850 | 2,089 | – | (6,939 | ) | – | |||||||||||||||||||||||||||||||||
Other assets | – | 27 | 128 | 105 | 260 | – | 98 | 96 | – | 194 | |||||||||||||||||||||||||||||||||||
Total assets | $ | 5,565 | $ | 5,570 | $ | 4,314 | $ | (9,151 | ) | $ | 6,298 | $ | 4,896 | $ | 5,889 | $ | 4,318 | $ | (8,779 | ) | $6,324 | ||||||||||||||||||||||||
Liabilities and equity | |||||||||||||||||||||||||||||||||||||||||||||
Current liabilities: | |||||||||||||||||||||||||||||||||||||||||||||
Accounts payable and accrued liabilities | $ | 15 | $ | 166 | $ | 363 | $ | – | $ | 544 | $ | 11 | $ | 198 | $ | 424 | $ | (52 | ) | $ 581 | |||||||||||||||||||||||||
Current portion of long-term debt | – | – | 2 | – | 2 | ||||||||||||||||||||||||||||||||||||||||
Accounts payable to affiliates | 232 | 27 | – | (259 | ) | – | 336 | 135 | 2 | (473 | ) | – | |||||||||||||||||||||||||||||||||
Note and interest payable to a subsidiary | 945 | – | – | (945 | ) | – | |||||||||||||||||||||||||||||||||||||||
Note payable to affiliate | – | – | 11 | (11 | ) | – | |||||||||||||||||||||||||||||||||||||||
Notes and interest payable to subsidiaries | 593 | – | – | (593 | ) | – | |||||||||||||||||||||||||||||||||||||||
Notes payable to affiliates | – | 138 | 9 | (147 | ) | – | |||||||||||||||||||||||||||||||||||||||
Note payable to parent | – | – | 41 | (41 | ) | – | |||||||||||||||||||||||||||||||||||||||
Total current liabilities | 1,192 | 193 | 374 | (1,215 | ) | 544 | 940 | 471 | 478 | (1,306 | ) | 583 | |||||||||||||||||||||||||||||||||
Long-term debt | 621 | – | – | – | 621 | ||||||||||||||||||||||||||||||||||||||||
Long-term debt, net of current portion | 528 | 3 | 1 | – | 532 | ||||||||||||||||||||||||||||||||||||||||
Long-term debt due to affiliate | – | – | 3 | (3 | ) | – | – | – | 531 | (531 | ) | – | |||||||||||||||||||||||||||||||||
Pension and other postretirement benefit obligations | – | 475 | 1,049 | – | 1,524 | – | 559 | 1,387 | – | 1,946 | |||||||||||||||||||||||||||||||||||
Deferred income tax liabilities | – | – | 75 | – | 75 | – | – | 75 | – | 75 | |||||||||||||||||||||||||||||||||||
Other long-term liabilities | – | 34 | 23 | – | 57 | – | 36 | 36 | – | 72 | |||||||||||||||||||||||||||||||||||
Total liabilities | 1,813 | 702 | 1,524 | (1,218 | ) | 2,821 | 1,468 | 1,069 | 2,508 | (1,837 | ) | 3,208 | |||||||||||||||||||||||||||||||||
Total equity | 3,752 | 4,868 | 2,790 | (7,933 | ) | 3,477 | 3,428 | 4,820 | 1,810 | (6,942 | ) | 3,116 | |||||||||||||||||||||||||||||||||
Total liabilities and equity | 5,565 | $ | 5,570 | $ | 4,314 | $ | (9,151 | ) | $ | 6,298 | $ | 4,896 | $ | 5,889 | $ | 4,318 | $ | (8,779 | ) | $6,324 | |||||||||||||||||||||||||
ABITIBIBOWATERRESOLUTE FOREST PRODUCTS INC.
Notes to Consolidated Financial Statements
CONDENSED CONSOLIDATING BALANCE SHEET
As of December 31, 2010 (Successor)
CONDENSED CONSOLIDATING BALANCE SHEET As of December 31, 2011 (Successor)
| CONDENSED CONSOLIDATING BALANCE SHEET As of December 31, 2011 (Successor)
| ||||||||||||||||||||||||||||||||||||||||||||
| (In millions) | Parent | Guarantor Subsidiaries | Non-guarantor Subsidiaries | Consolidating Adjustments | Consolidated | Parent | Guarantor Subsidiaries | Non-guarantor Subsidiaries | Consolidating Adjustments | Consolidated | |||||||||||||||||||||||||||||||||||
Assets | |||||||||||||||||||||||||||||||||||||||||||||
Current assets: | |||||||||||||||||||||||||||||||||||||||||||||
Cash and cash equivalents | $ | – | $ | 164 | $ | 155 | $ | – | $ | 319 | $ | – | $ | 128 | $ | 241 | $ | – | $ 369 | ||||||||||||||||||||||||||
Accounts receivable | – | 348 | 485 | – | 833 | ||||||||||||||||||||||||||||||||||||||||
Accounts receivable, net | – | 349 | 401 | – | 750 | ||||||||||||||||||||||||||||||||||||||||
Accounts receivable from affiliates | 40 | – | 287 | (327 | ) | – | – | – | 302 | (302 | ) | – | |||||||||||||||||||||||||||||||||
Inventories | – | 158 | 280 | – | 438 | ||||||||||||||||||||||||||||||||||||||||
Inventories, net | – | 172 | 303 | – | 475 | ||||||||||||||||||||||||||||||||||||||||
Assets held for sale | – | 15 | 683 | – | 698 | – | – | 7 | – | 7 | |||||||||||||||||||||||||||||||||||
Deferred income tax assets | – | 31 | 16 | – | 47 | – | 27 | 82 | – | 109 | |||||||||||||||||||||||||||||||||||
Note and interest receivable from parent | – | 864 | – | (864 | ) | – | |||||||||||||||||||||||||||||||||||||||
Notes and interest receivable from parent | – | 1,238 | – | (1,238 | ) | – | |||||||||||||||||||||||||||||||||||||||
Note receivable from affiliate | – | 10 | – | (10 | ) | – | – | 11 | – | (11 | ) | – | |||||||||||||||||||||||||||||||||
Note receivable from a subsidiary | 41 | – | – | (41 | ) | – | |||||||||||||||||||||||||||||||||||||||
Other current assets | – | 25 | 63 | – | 88 | – | 16 | 43 | – | 59 | |||||||||||||||||||||||||||||||||||
Total current assets | 40 | 1,615 | 1,969 | (1,201 | ) | 2,423 | 41 | 1,941 | 1,379 | (1,592 | ) | 1,769 | |||||||||||||||||||||||||||||||||
Fixed assets | – | 858 | 1,783 | – | 2,641 | ||||||||||||||||||||||||||||||||||||||||
Amortizable intangible assets | – | – | 19 | – | 19 | ||||||||||||||||||||||||||||||||||||||||
Fixed assets, net | – | 938 | 1,564 | – | 2,502 | ||||||||||||||||||||||||||||||||||||||||
Amortizable intangible assets, net | – | – | 18 | – | 18 | ||||||||||||||||||||||||||||||||||||||||
Deferred income tax assets | – | 439 | 1,297 | – | 1,736 | – | 524 | 1,225 | – | 1,749 | |||||||||||||||||||||||||||||||||||
Note receivable from affiliate | – | 30 | – | (30 | ) | – | – | 33 | – | (33 | ) | – | |||||||||||||||||||||||||||||||||
Investments in and advances to consolidated subsidiaries | 5,977 | 2,933 | – | (8,910 | ) | – | 5,805 | 2,076 | – | (7,881 | ) | – | |||||||||||||||||||||||||||||||||
Other assets | – | 34 | 168 | 114 | 316 | – | 101 | 159 | – | 260 | |||||||||||||||||||||||||||||||||||
Total assets | $ | 6,017 | $ | 5,909 | $ | 5,236 | $ | (10,027 | ) | $ | 7,135 | $ | 5,846 | $ | 5,613 | $ | 4,345 | $ | (9,506 | ) | $6,298 | ||||||||||||||||||||||||
Liabilities and equity | |||||||||||||||||||||||||||||||||||||||||||||
Current liabilities: | |||||||||||||||||||||||||||||||||||||||||||||
Accounts payable and accrued liabilities | $ | 26 | $ | 175 | $ | 346 | $ | – | $ | 547 | $ | 15 | $ | 166 | $ | 363 | $ | – | $ 544 | ||||||||||||||||||||||||||
Accounts payable to affiliates | 178 | 99 | – | (277 | ) | – | 220 | 82 | – | (302 | ) | – | |||||||||||||||||||||||||||||||||
Note and interest payable to a subsidiary | 864 | – | – | (864 | ) | – | |||||||||||||||||||||||||||||||||||||||
Notes and interest payable to subsidiaries | 1,238 | – | – | (1,238 | ) | – | |||||||||||||||||||||||||||||||||||||||
Note payable to affiliate | – | – | 10 | (10 | ) | – | – | – | 11 | (11 | ) | – | |||||||||||||||||||||||||||||||||
Liabilities associated with assets held for sale | – | – | 289 | – | 289 | ||||||||||||||||||||||||||||||||||||||||
Note payable to parent | – | – | 41 | (41 | ) | – | |||||||||||||||||||||||||||||||||||||||
Total current liabilities | 1,068 | 274 | 645 | (1,151 | ) | 836 | 1,473 | 248 | 415 | (1,592 | ) | 544 | |||||||||||||||||||||||||||||||||
Long-term debt | 905 | – | – | – | 905 | 621 | – | – | – | 621 | |||||||||||||||||||||||||||||||||||
Long-term debt due to affiliate | – | – | 30 | (30 | ) | – | – | – | 33 | (33 | ) | – | |||||||||||||||||||||||||||||||||
Pension and other postretirement benefit obligations | – | 362 | 910 | – | 1,272 | – | 475 | 1,049 | – | 1,524 | |||||||||||||||||||||||||||||||||||
Deferred income tax liabilities | – | – | 72 | – | 72 | – | – | 75 | – | 75 | |||||||||||||||||||||||||||||||||||
Other long-term liabilities | – | 32 | 31 | – | 63 | – | 34 | 23 | – | 57 | |||||||||||||||||||||||||||||||||||
Total liabilities | 1,973 | 668 | 1,688 | (1,181 | ) | 3,148 | 2,094 | 757 | 1,595 | (1,625 | ) | 2,821 | |||||||||||||||||||||||||||||||||
Total equity | 4,044 | 5,241 | 3,548 | (8,846 | ) | 3,987 | 3,752 | 4,856 | 2,750 | (7,881 | ) | 3,477 | |||||||||||||||||||||||||||||||||
Total liabilities and equity | $ | 6,017 | $ | 5,909 | $ | 5,236 | $ | (10,027 | ) | $ | 7,135 | $ | 5,846 | $ | 5,613 | $ | 4,345 | $ | (9,506 | ) | $6,298 | ||||||||||||||||||||||||
ABITIBIBOWATERRESOLUTE FOREST PRODUCTS INC.
Notes to Consolidated Financial Statements
CONDENSED CONSOLIDATING STATEMENT OF CASH FLOWS
For the Year Ended December 31, 2011 (Successor)
CONDENSED CONSOLIDATING STATEMENT OF CASH FLOWS For the Year Ended December 31, 2012 (Successor)
| CONDENSED CONSOLIDATING STATEMENT OF CASH FLOWS For the Year Ended December 31, 2012 (Successor)
| ||||||||||||||||||||||||||||||||||||||||||||
| (In millions) | Parent | Guarantor Subsidiaries | Non-guarantor Subsidiaries | Consolidating Adjustments | Consolidated | Parent | Guarantor Subsidiaries | Non-guarantor Subsidiaries | Consolidating Adjustments | Consolidated | |||||||||||||||||||||||||||||||||||
Net cash provided by operating activities | $ | – | $ | 188 | $ | 10 | $ | – | $ | 198 | $ | – | $ | 249 | $ | 17 | $ | – | $ | 266 | |||||||||||||||||||||||||
Cash flows from investing activities: | |||||||||||||||||||||||||||||||||||||||||||||
Cash invested in fixed assets | – | (30 | ) | (67 | ) | – | (97 | ) | – | (42 | ) | (127 | ) | – | (169 | ) | |||||||||||||||||||||||||||||
Disposition of investment in ACH | – | – | 296 | – | 296 | ||||||||||||||||||||||||||||||||||||||||
Disposition of our interest in our Mersey operations, net of cash | – | – | 14 | – | 14 | ||||||||||||||||||||||||||||||||||||||||
Disposition of other assets | – | 11 | 8 | – | 19 | – | 1 | 35 | – | 36 | |||||||||||||||||||||||||||||||||||
Proceeds from holdback related to disposition of investment in MPCo | – | – | 29 | – | 29 | ||||||||||||||||||||||||||||||||||||||||
Proceeds from insurance settlements | – | – | 8 | – | 8 | ||||||||||||||||||||||||||||||||||||||||
Increase in restricted cash | – | – | (2 | ) | – | (2 | ) | ||||||||||||||||||||||||||||||||||||||
Acquisition of Fibrek, net of cash acquired | – | – | (24 | ) | – | (24 | ) | ||||||||||||||||||||||||||||||||||||||
Decrease in restricted cash | – | – | 76 | – | 76 | ||||||||||||||||||||||||||||||||||||||||
Increase in deposit requirements for letters of credit, net | – | – | (8 | ) | – | (8 | ) | – | – | (12 | ) | – | (12 | ) | |||||||||||||||||||||||||||||||
Advances from (to) affiliate | – | 150 | (150 | ) | – | – | 72 | (56 | ) | (16 | ) | – | – | ||||||||||||||||||||||||||||||||
Net cash provided by investing activities | – | 131 | 114 | – | 245 | ||||||||||||||||||||||||||||||||||||||||
Other investing activities, net | – | – | 4 | – | 4 | ||||||||||||||||||||||||||||||||||||||||
Net cash provided by (used in) investing activities | 72 | (97 | ) | (50 | ) | – | (75 | ) | |||||||||||||||||||||||||||||||||||||
Cash flows from financing activities: | |||||||||||||||||||||||||||||||||||||||||||||
Purchases of treasury stock | (67 | ) | – | – | – | (67 | ) | ||||||||||||||||||||||||||||||||||||||
Dividends and distribution to noncontrolling interests | – | – | (21 | ) | – | (21 | ) | – | – | (5 | ) | – | (5 | ) | |||||||||||||||||||||||||||||||
Acquisition of noncontrolling interest | – | – | (15 | ) | – | (15 | ) | – | – | (27 | ) | – | (27 | ) | |||||||||||||||||||||||||||||||
Payments of long-term debt | – | (354 | ) | – | – | (354 | ) | ||||||||||||||||||||||||||||||||||||||
Payment of credit facility fees | – | (1 | ) | (2 | ) | – | (3 | ) | |||||||||||||||||||||||||||||||||||||
Payments of debt | – | (109 | ) | (89 | ) | – | (198 | ) | |||||||||||||||||||||||||||||||||||||
Net cash used in financing activities | – | (355 | ) | (38 | ) | – | (393 | ) | (67 | ) | (109 | ) | (121 | ) | – | (297 | ) | ||||||||||||||||||||||||||||
Net (decrease) increase in cash and cash equivalents | – | (36 | ) | 86 | – | 50 | |||||||||||||||||||||||||||||||||||||||
Net increase (decrease) in cash and cash equivalents | 5 | 43 | (154 | ) | – | (106 | ) | ||||||||||||||||||||||||||||||||||||||
Cash and cash equivalents: | |||||||||||||||||||||||||||||||||||||||||||||
Beginning of year | – | 164 | 155 | – | 319 | – | 128 | 241 | – | 369 | |||||||||||||||||||||||||||||||||||
End of year | $ | – | $ | 128 | $ | 241 | $ | – | $ | 369 | $ | 5 | $ | 171 | $ | 87 | $ | – | $ | 263 | |||||||||||||||||||||||||
ABITIBIBOWATERRESOLUTE FOREST PRODUCTS INC.
Notes to Consolidated Financial Statements
CONDENSED CONSOLIDATING STATEMENT OF CASH FLOWS
For the Year Ended December 31, 2010 (Predecessor)
| (In millions) | Parent | Guarantor Subsidiaries | Non-guarantor Subsidiaries | Consolidating Adjustments | Consolidated | |||||||||||||||
Net cash provided by (used in) operating activities | $ | – | $ | 168 | $ | (129 | ) | $ | – | $ | 39 | |||||||||
Cash flows from investing activities: | ||||||||||||||||||||
Cash invested in fixed assets | – | (19 | ) | (62 | ) | – | (81 | ) | ||||||||||||
Disposition of assets | – | 43 | 53 | – | 96 | |||||||||||||||
Decrease in restricted cash | – | 12 | 64 | – | 76 | |||||||||||||||
Collections on note receivable from affiliate | – | 21 | – | (21 | ) | – | ||||||||||||||
Increase in deposit requirements for letters of credit, net | – | – | (3 | ) | – | (3 | ) | |||||||||||||
Release of pension trust assets | – | 8 | – | – | 8 | |||||||||||||||
Investment in and advances (to) from affiliates | (850 | ) | 100 | 750 | – | – | ||||||||||||||
Net cash (used in) provided by investing activities | (850 | ) | 165 | 802 | (21 | ) | 96 | |||||||||||||
Cash flows from financing activities: | ||||||||||||||||||||
Decrease in secured borrowings, net | – | (141 | ) | – | – | (141 | ) | |||||||||||||
Debtor in possession financing costs | – | (9 | ) | (1 | ) | – | (10 | ) | ||||||||||||
Payments of debtor in possession financing | – | (166 | ) | (40 | ) | – | (206 | ) | ||||||||||||
Term loan repayments | – | – | (347 | ) | – | (347 | ) | |||||||||||||
Short-term financing, net | – | (204 | ) | (134 | ) | – | (338 | ) | ||||||||||||
Payments of note payable to affiliate | – | – | (21 | ) | 21 | – | ||||||||||||||
Issuance of long-term debt | 850 | – | – | – | 850 | |||||||||||||||
Payments of long-term debt | – | (34 | ) | (300 | ) | – | (334 | ) | ||||||||||||
Payments of financing and credit facility fees | – | (33 | ) | (13 | ) | – | (46 | ) | ||||||||||||
Net cash provided by (used in) financing activities | 850 | (587 | ) | (856 | ) | 21 | (572 | ) | ||||||||||||
Net decrease in cash and cash equivalents | – | (254 | ) | (183 | ) | – | (437 | ) | ||||||||||||
Cash and cash equivalents: | ||||||||||||||||||||
Beginning of year | – | 418 | 338 | – | 756 | |||||||||||||||
End of year (Successor) | $ | – | $ | 164 | $ | 155 | $ | – | $ | 319 | ||||||||||
CONDENSED CONSOLIDATING STATEMENT OF CASH FLOWS For the Year Ended December 31, 2011 (Successor)
| |||||||||||||||||||||||||
| (In millions) | Parent | Guarantor Subsidiaries | Non-guarantor Subsidiaries | Consolidating Adjustments | Consolidated | ||||||||||||||||||||
Net cash provided by operating activities | $ | – | $ | 188 | $ | 10 | $ | – | $ | 198 | |||||||||||||||
Cash flows from investing activities: | |||||||||||||||||||||||||
Cash invested in fixed assets | – | (30 | ) | (67 | ) | – | (97 | ) | |||||||||||||||||
Disposition of investment in ACH | – | – | 296 | – | 296 | ||||||||||||||||||||
Disposition of other assets | – | 11 | 8 | – | 19 | ||||||||||||||||||||
Proceeds from holdback related to disposition of | – | – | 29 | – | 29 | ||||||||||||||||||||
Proceeds from insurance settlements | – | – | 8 | – | 8 | ||||||||||||||||||||
Increase in restricted cash | – | – | (2 | ) | – | (2 | ) | ||||||||||||||||||
Increase in deposit requirements for letters of credit, | – | – | (8 | ) | – | (8 | ) | ||||||||||||||||||
Advances from (to) affiliate | – | 150 | (150 | ) | – | – | |||||||||||||||||||
Net cash provided by investing activities | – | 131 | 114 | – | 245 | ||||||||||||||||||||
Cash flows from financing activities: | |||||||||||||||||||||||||
Dividends and distribution to noncontrolling interests | – | – | (21 | ) | – | (21 | ) | ||||||||||||||||||
Acquisition of noncontrolling interest | – | – | (15 | ) | – | (15 | ) | ||||||||||||||||||
Payments of debt | – | (354 | ) | – | – | (354 | ) | ||||||||||||||||||
Payment of credit facility fees | – | (1 | ) | (2 | ) | – | (3 | ) | |||||||||||||||||
Net cash used in financing activities | – | (355 | ) | (38 | ) | – | (393 | ) | |||||||||||||||||
Net (decrease) increase in cash and cash equivalents | – | (36 | ) | 86 | – | 50 | |||||||||||||||||||
Cash and cash equivalents: | |||||||||||||||||||||||||
Beginning of year | – | 164 | 155 | – | 319 | ||||||||||||||||||||
End of year | $ | – | $ | 128 | $ | 241 | $ | – | $ | 369 | |||||||||||||||
ABITIBIBOWATERRESOLUTE FOREST PRODUCTS INC.
Notes to Consolidated Financial Statements
CONDENSED CONSOLIDATING STATEMENT OF CASH FLOWS
For the Year Ended December 31, 2009 (Predecessor)
CONDENSED CONSOLIDATING STATEMENT OF CASH FLOWS For the Year Ended December 31, 2010 (Predecessor)
| CONDENSED CONSOLIDATING STATEMENT OF CASH FLOWS For the Year Ended December 31, 2010 (Predecessor)
| ||||||||||||||||||||||||||||||||||||||||||||
| (In millions) | Parent | Guarantor Subsidiaries | Non-guarantor Subsidiaries | Consolidating Adjustments | Consolidated | Parent | Guarantor Subsidiaries | Non-guarantor Subsidiaries | Consolidating Adjustments | Consolidated | |||||||||||||||||||||||||||||||||||
Net cash provided by (used in) operating activities | $ | – | $ | 323 | $ | (277 | ) | $ | – | $ | 46 | $ | – | $ | 168 | $ | (129 | ) | $ | – | $ | 39 | |||||||||||||||||||||||
Cash flows from investing activities: | |||||||||||||||||||||||||||||||||||||||||||||
Cash invested in fixed assets | – | (28 | ) | (73 | ) | – | (101 | ) | – | (19 | ) | (62 | ) | – | (81 | ) | |||||||||||||||||||||||||||||
Disposition of investment in MPCo | – | – | 554 | – | 554 | ||||||||||||||||||||||||||||||||||||||||
Disposition of other assets | – | 16 | 103 | – | 119 | ||||||||||||||||||||||||||||||||||||||||
Increase in restricted cash | – | (12 | ) | (130 | ) | – | (142 | ) | |||||||||||||||||||||||||||||||||||||
Disposition of assets | – | 43 | 53 | – | 96 | ||||||||||||||||||||||||||||||||||||||||
Decrease in restricted cash | – | 12 | 64 | – | 76 | ||||||||||||||||||||||||||||||||||||||||
Collections on note receivable from affiliate | – | 15 | – | (15 | ) | – | – | 21 | – | (21 | ) | – | |||||||||||||||||||||||||||||||||
Decrease in deposit requirements for letters of credit, net | – | – | 49 | – | 49 | ||||||||||||||||||||||||||||||||||||||||
Cash received in monetization of derivative financial instruments | – | – | 5 | – | 5 | ||||||||||||||||||||||||||||||||||||||||
Increase in deposit requirements for letters of credit, | – | – | (3 | ) | – | (3 | ) | ||||||||||||||||||||||||||||||||||||||
Release of pension trust assets | – | 8 | – | – | 8 | ||||||||||||||||||||||||||||||||||||||||
Investment in and advances (to) from affiliates | (850 | ) | 100 | 750 | – | – | |||||||||||||||||||||||||||||||||||||||
Net cash (used in) provided by investing activities | – | (9 | ) | 508 | (15 | ) | 484 | (850 | ) | 165 | 802 | (21 | ) | 96 | |||||||||||||||||||||||||||||||
Cash flows from financing activities: | |||||||||||||||||||||||||||||||||||||||||||||
Cash dividends to noncontrolling interests | – | – | (7 | ) | – | (7 | ) | ||||||||||||||||||||||||||||||||||||||
Debtor in possession financing | – | 166 | 95 | – | 261 | ||||||||||||||||||||||||||||||||||||||||
Decrease in secured borrowings, net | – | (141 | ) | – | – | (141 | ) | ||||||||||||||||||||||||||||||||||||||
Debtor in possession financing costs | – | (23 | ) | (8 | ) | – | (31 | ) | – | (9 | ) | (1 | ) | – | (10 | ) | |||||||||||||||||||||||||||||
Payment of debtor in possession financing | – | – | (55 | ) | – | (55 | ) | ||||||||||||||||||||||||||||||||||||||
Payments of debtor in possession financing | – | (166 | ) | (40 | ) | – | (206 | ) | |||||||||||||||||||||||||||||||||||||
Term loan repayments | – | – | (347 | ) | – | (347 | ) | ||||||||||||||||||||||||||||||||||||||
Short-term financing, net | – | (74 | ) | 67 | – | (7 | ) | – | (204 | ) | (134 | ) | – | (338 | ) | ||||||||||||||||||||||||||||||
Payments of note payable to affiliate | – | – | (15 | ) | 15 | – | – | – | (21 | ) | 21 | – | |||||||||||||||||||||||||||||||||
Payments of long-term debt | – | (1 | ) | (117 | ) | – | (118 | ) | |||||||||||||||||||||||||||||||||||||
Issuance of long-term debt | 850 | – | – | – | 850 | ||||||||||||||||||||||||||||||||||||||||
Payments of debt | – | (34 | ) | (300 | ) | – | (334 | ) | |||||||||||||||||||||||||||||||||||||
Payments of financing and credit facility fees | – | (8 | ) | (1 | ) | – | (9 | ) | – | (33 | ) | (13 | ) | – | (46 | ) | |||||||||||||||||||||||||||||
Net cash provided by (used in) financing activities | – | 60 | (41 | ) | 15 | 34 | 850 | (587 | ) | (856 | ) | 21 | (572 | ) | |||||||||||||||||||||||||||||||
Net increase in cash and cash equivalents | – | 374 | 190 | – | 564 | ||||||||||||||||||||||||||||||||||||||||
Net decrease in cash and cash equivalents | – | (254 | ) | (183 | ) | – | (437 | ) | |||||||||||||||||||||||||||||||||||||
Cash and cash equivalents: | |||||||||||||||||||||||||||||||||||||||||||||
Beginning of year | – | 44 | 148 | – | 192 | – | 418 | 338 | – | 756 | |||||||||||||||||||||||||||||||||||
End of year | $ | – | $ | 418 | $ | 338 | $ | – | $ | 756 | |||||||||||||||||||||||||||||||||||
End of year (Successor) | $ | – | $ | 164 | $ | 155 | $ | – | $ | 319 | |||||||||||||||||||||||||||||||||||
ABITIBIBOWATERRESOLUTE FOREST PRODUCTS INC.
Notes to Consolidated Financial Statements
Note 27.26. Quarterly Information (Unaudited)
| Year ended December 31, 2011 (Successor) | First | Second | Third | Fourth | ||||||||||||||||
| (In millions, except per share amounts) | Quarter | Quarter | Quarter | Quarter | Year | |||||||||||||||
Sales | $ | 1,185 | $ | 1,200 | $ | 1,224 | $ | 1,147 | $ | 4,756 | ||||||||||
Operating income(1) | 27 | 52 | 72 | 47 | 198 | |||||||||||||||
Net income (loss) attributable to AbitibiBowater Inc. | 30 | 61 | (44 | ) | (6 | ) | 41 | |||||||||||||
Basic net income (loss) per share attributable to | 0.31 | 0.63 | (0.46 | ) | (0.06 | ) | 0.42 | |||||||||||||
Diluted net income (loss) per share attributable to | 0.31 | 0.63 | (0.46 | ) | (0.06 | ) | 0.42 | |||||||||||||
| Year ended December 31, 2010 (Predecessor) | First | Second | Third | Fourth | ||||||||||||||||
| (In millions, except per share amounts) | Quarter | Quarter | Quarter | Quarter | Year | |||||||||||||||
Sales | $ | 1,100 | $ | 1,182 | $ | 1,192 | $ | 1,272 | $ | 4,746 | ||||||||||
Operating (loss) income(2) | (110 | ) | (73 | ) | 12 | 11 | (160 | ) | ||||||||||||
Net (loss) income attributable to AbitibiBowater Inc. | (500 | ) | (297 | ) | (829 | ) | 4,240 | 2,614 | ||||||||||||
Basic net (loss) income per share attributable to | (8.68 | ) | (5.15 | ) | (14.35 | ) | 73.48 | 45.30 | ||||||||||||
Diluted net (loss) income per share attributable to | (8.68 | ) | (5.15 | ) | (14.35 | ) | 44.82 | 27.63 | ||||||||||||
Year ended December 31, 2012 (Successor) (In millions, except per share amounts) | First Quarter | Second Quarter | Third Quarter | Fourth Quarter | Year | |||||||||||||||
Sales | $ | 1,054 | $ | 1,168 | $ | 1,153 | $ | 1,128 | $ | 4,503 | ||||||||||
Operating income (loss)(1) | 26 | (36) | 26 | (46) | (30) | |||||||||||||||
Net income (loss) attributable to Resolute Forest Products Inc. | 23 | (20) | 31 | (36) | (2) | |||||||||||||||
Basic net income (loss) per share attributable to Resolute Forest Products Inc. common shareholders | 0.23 | (0.20) | 0.32 | (0.38) | (0.02) | |||||||||||||||
Diluted net income (loss) per share attributable to Resolute Forest Products Inc. common shareholders | 0.23 | (0.20) | 0.32 | (0.38) | (0.02) | |||||||||||||||
Year ended December 31, 2011 (Successor) (In millions, except per share amounts) | First Quarter | Second Quarter | Third Quarter | Fourth Quarter | Year | |||||||||||||||
Sales | $ | 1,185 | $ | 1,200 | $ | 1,224 | $ | 1,147 | $ | 4,756 | ||||||||||
Operating income(2) | 27 | 52 | 72 | 47 | 198 | |||||||||||||||
Net income (loss) attributable to Resolute Forest Products Inc. | 30 | 61 | (44) | (6) | 41 | |||||||||||||||
Basic net income (loss) per share attributable to Resolute Forest Products Inc. common shareholders | 0.31 | 0.63 | (0.46) | (0.06) | 0.42 | |||||||||||||||
Diluted net income (loss) per share attributable to Resolute Forest Products Inc. common shareholders | 0.31 | 0.63 | (0.46) | (0.06) | 0.42 | |||||||||||||||
| (1) | Operating loss for the year ended December 31, 2012 included the following significant items: |
| Successor | ||||||||||||||||||||
| (In millions) | First Quarter | Second Quarter | Third Quarter | Fourth Quarter | Year | |||||||||||||||
Net gain on disposition of assets | $ | 23 | $ | 1 | $ | 4 | $ | 7 | $ | 35 | ||||||||||
Closure costs, impairment and other related charges | (5) | (88) | (5) | (82) | (180) | |||||||||||||||
Write-downs of inventory | – | (7) | – | (5) | (12) | |||||||||||||||
Employee termination costs | (2) | (1) | – | (2) | (5) | |||||||||||||||
Transaction costs in connection with our acquisition of Fibrek | (4) | (3) | – | (1) | (8) | |||||||||||||||
Start up costs of idled mills | – | – | (5) | (8) | (13) | |||||||||||||||
| $ | 12 | $ | (98) | $ | (6) | $ | (91) | $ | (183) | |||||||||||
| (2) | Operating income for the year ended December 31, 2011 included the following |
| 000000 | 000000 | 000000 | 000000 | 000000 | 000000 | |||||||||||||||||||||||||||||||||||||
| Successor | Successor | |||||||||||||||||||||||||||||||||||||||||
| (In millions) | First Quarter | Second Quarter | Third Quarter | Fourth Quarter | Year | First Quarter | Second Quarter | Third Quarter | Fourth Quarter | Year | ||||||||||||||||||||||||||||||||
Net gain (loss) on disposition of assets and other | $ | 1 | $ | 3 | $ | (1 | ) | $ | – | $ | 3 | |||||||||||||||||||||||||||||||
Net gain (loss) on disposition of assets | $ | 1 | $ | 3 | $ | (1) | $ | – | $ | 3 | ||||||||||||||||||||||||||||||||
Closure costs, impairment and other related charges | (13 | ) | (4 | ) | (17 | ) | (12 | ) | (46) | (13) | (4) | (17) | (12) | (46) | ||||||||||||||||||||||||||||
Write-downs of inventory | (1 | ) | – | – | (2 | ) | (3) | |||||||||||||||||||||||||||||||||||
Write-downs inventory | (1) | – | – | (2) | (3) | |||||||||||||||||||||||||||||||||||||
Employee termination costs | (4 | ) | (3 | ) | (5 | ) | – | (12) | (4) | (3) | (5) | – | (12) | |||||||||||||||||||||||||||||
Transaction costs in connection with our proposed acquisition of Fibrek Inc. | – | – | – | (5 | ) | (5) | ||||||||||||||||||||||||||||||||||||
Transaction costs in connection with our acquisition of Fibrek | – | – | – | (5) | (5) | |||||||||||||||||||||||||||||||||||||
| $ | (17 | ) | $ | (4 | ) | $ | (23 | ) | $ | (19 | ) | $ | (63) | $ | (17) | $ | (4) | $ | (23) | $ | (19) | $ | (63) | |||||||||||||||||||
RESOLUTE FOREST PRODUCTS INC.
Notes to Consolidated Financial Statements
Note 27. Subsequent Event
The following significant event occurred subsequent to December 31, 2012:
|
| 000000 | 000000 | 000000 | 000000 | 000000 | 000000 | |||||||||||||||||
| Predecessor | ||||||||||||||||||||||
| (In millions) | First Quarter | Second Quarter | Third Quarter | Fourth Quarter | Year | |||||||||||||||||
Net gain on disposition of assets and other | $ | 9 | $ | 4 | $ | 1 | $ | 16 | $ | 30 | ||||||||||||
Closure costs, impairment and other related charges | (5 | ) | (3 | ) | 3 | (6 | ) | (11 | ) | |||||||||||||
Employee termination credit | 8 | – | – | – | 8 | |||||||||||||||||
| $ | 12 | $ | 1 | $ | 4 | $ | 10 | $ | 27 | |||||||||||||
REPORT OF INDEPENDENT REGISTERED PUBLIC ACCOUNTING FIRM
To the Board of Directors and the Shareholders of AbitibiBowaterResolute Forest Products Inc.
In our opinion, the accompanying consolidated balance sheets and the related consolidated statements of operations, comprehensive (loss) income, changes in (deficit) equity comprehensive (loss) income and cash flows present fairly, in all material respects, the financial position of AbitibiBowaterResolute Forest Products Inc. and its subsidiaries (Successor Company) as of December 31, 20112012 and December 31, 20102011, and the results of their operations and their cash flows for each of the yearyears in the two-year period ended December 31, 20112012 in conformity with accounting principles generally accepted in the United States of America. In addition, in our opinion, the accompanying financial statement schedule listed in the index appearing under Item 15(a)(2) which includes the Successor Company’s parent company only condensed balance sheets as at December 31, 20112012 and December 31, 20102011 and the condensed statements of operations and retained earnings (deficit) and cash flows for each of the yearyears in the two-year period ended December 31, 20112012 presents fairly, in all material respects, the information set forth therein when read in conjunction with the related consolidated financial statements. Also in our opinion, the Successor Company maintained, in all material respects, effective internal control over financial reporting as of December 31, 2011,2012, based on criteria established inInternal Control—Control – Integrated Framework issued by the Committee of Sponsoring Organizations of the Treadway Commission (COSO). The Successor Company’s management is responsible for these financial statements and financial statement schedule, for maintaining effective internal control over financial reporting and for its assessment of the effectiveness of internal control over financial reporting, included in the accompanying Management’s Report on Financial Statements and Assessment of Internal Control over Financial Reporting. Our responsibility is to express opinions on these financial statements, the financial statement schedule and on the Successor Company’s internal control over financial reporting based on our integrated audits. We conducted our audits in accordance with the standards of the Public Company Accounting Oversight Board (United States). Those standards require that we plan and perform the audits to obtain reasonable assurance about whether the financial statements are free of material misstatement and whether effective internal control over financial reporting was maintained in all material respects. Our audits of the financial statements included examining, on a test basis, evidence supporting the amounts and disclosures in the financial statements and financial statement schedule, assessing the accounting principles used and significant estimates made by management, and evaluating the overall financial statement presentation. Our audit of internal control over financial reporting included obtaining an understanding of internal control over financial reporting, assessing the risk that a material weakness exists, and testing and evaluating the design and operating effectiveness of internal control based on the assessed risk. Our audits also included performing such other procedures as we considered necessary in the circumstances. We believe that our audits provide a reasonable basis for our opinions.
As more fully described in Notes 1 and 34 to the consolidated financial statements, on September 23, 2010, the Superior Court of Canada, province of Quebec for the district of Montreal sanctioned the Successor Company’s plan of reorganization under the Companies’ Creditors Arrangement Act (CCAA Reorganization Plan) and on November 23, 2010, the United States Bankruptcy Court for the district of Delaware confirmed the Successor Company’s plan of reorganization under Chapter 11 of the Bankruptcy Code (Chapter 11 Reorganization Plan). Confirmation of the CCAA Reorganization Plan and the Chapter 11 Reorganization Plan resulted in the discharge of all claims against the predecessor company that arose before April 17, 2009 and April 16, 2009 respectively and terminates all rights and interests of equity security holders as provided for in the plans of reorganization. These plans of reorganization were substantially consummated on December 9, 2010 and the Successor Company emerged from bankruptcy. In connection with its emergence from bankruptcy, the Successor Company adopted fresh start accounting on December 31, 2010.
A company’s internal control over financial reporting is a process designed to provide reasonable assurance regarding the reliability of financial reporting and the preparation of financial statements for external purposes in accordance with generally accepted accounting principles. A company’s internal control over financial reporting includes those policies and procedures that (i) pertain to the maintenance of records that, in reasonable detail, accurately and fairly reflect the transactions and dispositions of the assets of the company; (ii) provide reasonable assurance that transactions are recorded as necessary to permit preparation of financial statements in accordance with generally accepted accounting principles, and that receipts and expenditures of the company are being made only in accordance with authorizations of management and directors of the company; and (iii) provide reasonable assurance regarding prevention or timely detection of unauthorized acquisition, use, or disposition of the company’s assets that could have a material effect on the financial statements.
Because of its inherent limitations, internal control over financial reporting may not prevent or detect misstatements. Also, projections of any evaluation of effectiveness to future periods are subject to the risk that controls may become inadequate because of changes in conditions, or that the degree of compliance with the policies or procedures may deteriorate.
/s/ PricewaterhouseCoopers LLP(1) |
Montreal, Canada |
March 1, 2013 |
(1) CPA auditor, CA, public accountancy permit No.A113048
Montreal, Canada
February 29, 2012
|
REPORT OF INDEPENDENT REGISTERED PUBLIC ACCOUNTING FIRM
To the Board of Directors and the Shareholders of AbitibiBowaterResolute Forest Products Inc.
In our opinion, the accompanying consolidated statements of operations, comprehensive (loss) income, changes in (deficit) equity comprehensive (loss) income and cash flows present fairly, in all material respects, the results of the operations and the cash flows of AbitibiBowaterResolute Forest Products Inc. and its subsidiaries (Predecessor Company) for each of the years in the two-year periodyear ended December 31, 2010 in conformity with accounting principles generally accepted in the United States of America. In addition, in our opinion, the accompanying financial statement schedule listed in the index appearing under Item 15(a)(2) which includes the Predecessor Company’s parent company only condensed statements of operations and retained earnings (deficit) and cash flows for each of the years in the two-year periodyear ended December 31, 2010 presents fairly, in all material respects, the information set forth therein when read in conjunction with the related consolidated financial statements. These financial statements and the financial statement schedule are the responsibility of the Predecessor Company’s management; our responsibility is to express an opinion on these financial statements and on the financial statement schedule based on our audits.audit. We conducted our auditsaudit in accordance with the standards of the Public Company Accounting Oversight Board (United States). Those standards require that we plan and perform the auditsaudit to obtain reasonable assurance about whether the financial statements are free of material misstatement. Our auditsaudit of the financial statements included examining, on a test basis, evidence supporting the amounts and disclosures in the financial statements, assessing the accounting principles used and significant estimates made by management, and evaluating the overall financial statement presentation. Our auditsaudit also included performing such other procedures as we considered necessary in the circumstances. We believe that our audits provideaudit provides a reasonable basis for our opinion.
As more fully described in Notes 1 and 34 to the consolidated financial statements, in 2009, the Predecessor Company and certain of its U.S. and Canadian subsidiaries filed voluntary petitions for reorganization under Chapters 11 and 15 of the United States Bankruptcy Code and the Companies’ Creditors Arrangement Act in Canada. The Predecessor Company’s plans of reorganizations under Chapters 11 and 15 and the Companies’ Creditors Arrangement Act in Canada were substantially consummated on December 9, 2010 and the Predecessor Company emerged from bankruptcy. In connection with its emergence from bankruptcy, the successor company adopted fresh start accounting.
/s/ PricewaterhouseCoopers LLP(1) |
Montreal, Canada |
April 5, 2011 |
(1) Chartered accountant auditor permit No. R24549
Montreal, Canada
April 5, 2011
|
MANAGEMENT’S REPORT ON FINANCIAL STATEMENTS AND ASSESSMENT OF INTERNAL CONTROL OVER FINANCIAL REPORTING
Financial Statements
Management of AbitibiBowaterResolute Forest Products Inc. is responsible for the preparation of the financial information included in this Form 10-K. The accompanying consolidated financial statements have been prepared in accordance with U.S. generally accepted accounting principles and include amounts that are based on the best estimates and judgments of management.
Assessment of Internal Control over Financial Reporting
Management is responsible for establishing and maintaining adequate internal control over financial reporting as defined in
Rules 13a-15(f) and 15d-15(f) under the Securities Exchange Act of 1934. AbitibiBowaterResolute Forest Products Inc.’s internal control over financial reporting is a process designed to provide reasonable assurance regarding the reliability of financial reporting and the preparation of financial statements for external purposes in accordance with U.S. generally accepted accounting principles. Internal control over financial reporting includes those policies and procedures that:
pertain to the maintenance of records that, in reasonable detail, accurately and fairly reflect the transactions and dispositions of the assets of AbitibiBowater Inc.;
| — | pertain to the maintenance of records that, in reasonable detail, accurately and fairly reflect the transactions and dispositions of the assets of Resolute Forest Products Inc.; |
provide reasonable assurance that transactions are recorded as necessary to permit preparation of financial statements in accordance with U.S. generally accepted accounting principles;
| — | provide reasonable assurance that transactions are recorded as necessary to permit preparation of financial statements in accordance with U.S. generally accepted accounting principles; |
provide reasonable assurance that receipts and expenditures of AbitibiBowater Inc. are being made only in accordance with the authorizations of management and directors of AbitibiBowater Inc.; and
| — | provide reasonable assurance that receipts and expenditures of Resolute Forest Products Inc. are being made only in accordance with the authorizations of management and directors of Resolute Forest Products Inc.; and |
provide reasonable assurance regarding prevention or timely detection of unauthorized acquisition, use or disposition of assets that could have a material effect on the consolidated financial statements.
| — | provide reasonable assurance regarding prevention or timely detection of unauthorized acquisition, use or disposition of assets that could have a material effect on the consolidated financial statements. |
Because of its inherent limitations, internal control over financial reporting may not prevent or detect misstatements. Projections of any evaluation of effectiveness to future periods are subject to the risk that controls may become inadequate because of changes in conditions, or that the degree of compliance with the policies or procedures may deteriorate.
Management assessed the effectiveness of AbitibiBowaterResolute Forest Products Inc.’s internal control over financial reporting as of December 31, 2011.2012. Management based this assessment on the criteria for effective internal control over financial reporting described inInternal
Control – Integrated Framework issued by the Committee of Sponsoring Organizations of the Treadway Commission. Management’s assessment included an evaluation of the design of AbitibiBowaterResolute Forest Products Inc.’s internal control over financial reporting and testing of the operational effectiveness of its internal control over financial reporting. Management reviewed the results of its assessment with the Audit Committee of our Board of Directors.
Based on this assessment, management determined that, as of December 31, 2011, AbitibiBowater2012, Resolute Forest Products Inc.’s internal control over financial reporting was effective.
The effectiveness of AbitibiBowaterResolute Forest Products Inc.’s internal control over financial reporting as of December 31, 20112012 has been audited by PricewaterhouseCoopers LLP, an independent registered public accounting firm, as stated in their report above.
ITEM 9. CHANGES IN AND DISAGREEMENTS WITH ACCOUNTANTS ON ACCOUNTING AND FINANCIAL DISCLOSURE
| ITEM 9. | CHANGES IN AND DISAGREEMENTS WITH ACCOUNTANTS ON ACCOUNTING AND FINANCIAL DISCLOSURE |
None.
ITEM 9A. CONTROLS AND PROCEDURES
| ITEM 9A. | CONTROLS AND PROCEDURES |
Evaluation of Disclosure Controls and Procedures
Disclosure controls and procedures as defined in Exchange Act Rules 13a-15(e) and 15d-15(e) are our controls and other procedures that are designed to ensure that information required to be disclosed by us in the reports that we file or submit under the Exchange Act is recorded, processed, summarized and reported within the time periods specified in the Securities and Exchange Commission’s rules and forms. Disclosure controls and procedures include, without limitation, controls and procedures designed to ensure that information required to be disclosed by us in the reports that we file or submit under the Exchange Act is accumulated and communicated to our management, including our President and Chief Executive Officer and Senior Vice President and Chief Financial Officer, as appropriate to allow timely decisions regarding required disclosure.
We have evaluated the effectiveness of the design and operation of our disclosure controls and procedures, as defined in
Rules 13a-15(e) and 15d-15(e) of the Securities Exchange Act of 1934, as of December 31, 2011.2012. Based on that evaluation, the President and Chief Executive Officer and the Senior Vice President and Chief Financial Officer concluded that our disclosure controls and procedures were effective as of such date in recording, processing, summarizing and timely reporting information required to be disclosed in our reports to the Securities and Exchange Commission.
Management’s Report on Internal Control over Financial Reporting
Management has issued its report on internal control over financial reporting, which included management’s assessment that the Company’s internal control over financial reporting was effective as of December 31, 2011.2012. Management’s report on internal control over financial reporting can be found on page 119137 of this Form 10-K. Our independent registered public accounting firm, PricewaterhouseCoopers LLP, has issued an attestation report on the effectiveness of internal control over financial reporting as of December 31, 2011.2012. This report can be found on page 117135 of this Form 10-K.
Changes in Internal Control over Financial Reporting
In connection with the evaluation of internal control over financial reporting, there were no changes during the quarter ended December 31, 20112012 that have materially affected, or are reasonably likely to materially affect, our internal control over financial reporting.
| ITEM 9B. | OTHER INFORMATION |
None.
ITEM 10. DIRECTORS, EXECUTIVE OFFICERS AND CORPORATE GOVERNANCE
| ITEM 10. | DIRECTORS, EXECUTIVE OFFICERS AND CORPORATE GOVERNANCE |
The information required by this Item is incorporated by reference to our definitive proxy statement for our 20122013 annual meeting of shareholders to be held on May 23, 201216, 2013 (the “2012“2013 proxy statement”), which will be filed within 120 days of the end of our fiscal year ended December 31, 2011.2012.
We have adopted a code of ethics that applies to our principal executive officer, principal financial officer and principal accounting officer. This code of ethics (which is entitled “Code of Business Conduct”) and our corporate governance policies are posted on our website atwww.resolutefp.com. We intend to satisfy disclosure requirements regarding amendments to or waivers from our code of ethics by posting such information on this website. The charters of the Audit Committee and the Human Resources and Compensation/CorporateNominating and Governance and Nominating Committee of our Board of Directors are available on our website as well. This information is also available in print free of charge to any person who requests it.
ITEM 11. EXECUTIVE COMPENSATION
| ITEM 11. | EXECUTIVE COMPENSATION |
The information required by this Item is incorporated by reference to our 20122013 proxy statement.
ITEM 12. SECURITY OWNERSHIP OF CERTAIN BENEFICIAL OWNERS AND MANAGEMENT AND RELATED STOCKHOLDER MATTERS
| ITEM 12. | SECURITY OWNERSHIP OF CERTAIN BENEFICIAL OWNERS AND MANAGEMENT AND RELATED STOCKHOLDER MATTERS |
The information required by this Item that is not included below under “Equity Compensation Plan Information” is incorporated by reference to our 20122013 proxy statement.
Equity Compensation Plan Information
The following table provides information as of December 31, 20112012 regarding securities to be issued upon exercise of outstanding stock options or pursuant to outstanding restricted stock units, deferred stock units and performance-based awards, and securities remaining available for issuance under our equity compensation plan. The 2010 AbitibiBowater Inc.Resolute Forest Products Equity Incentive Plan is the only compensation plan with shares authorized.
| Plan category | (a) Number of securities to be issued upon exercise of outstanding options, warrants and rights | (b) Weighted-average exercise price of outstanding options, warrants and rights | (c) Number of securities remaining available for future issuance under equity compensation plans (excluding securities reflected in column (a)) | (a) Number of securities to be issued upon exercise of outstanding options, warrants and rights | (b) Weighted-average exercise price of outstanding options, warrants and rights | (c) Number of securities remaining available for future issuance under equity compensation plans (excluding securities reflected in column (a)) | ||||||||||||||||||||||||
Equity compensation plans approved by security holders | – | $ | – | – | – | $ | – | – | ||||||||||||||||||||||
Equity compensation plans not approved by security holders:(1) | 1,308,382 | 19.56 | 7,705,316 | |||||||||||||||||||||||||||
Equity compensation plans not approved | 2,308,166 | 15.46 | 6,594,981 | |||||||||||||||||||||||||||
Total | 1,308,382 | $ | 19.56 | | 7,705,316 | | 2,308,166 | $ | 15.46 | 6,594,981 | ||||||||||||||||||||
| (1) | The Resolute Forest Products Equity Incentive Plan was previously named the 2010 AbitibiBowater Inc. Equity Incentive Plan, which was approved by the Courts pursuant to the Plans of Reorganization. The weighted-average exercise price in column (b) represents the weighted-average exercise price of |
ITEM 13.CERTAIN RELATIONSHIPS AND RELATED TRANSACTIONS, AND DIRECTOR INDEPENDENCE
| ITEM 13. | CERTAIN RELATIONSHIPS AND RELATED TRANSACTIONS, AND DIRECTOR INDEPENDENCE |
The information required by this Item is incorporated by reference to our 20122013 proxy statement.
ITEM 14.PRINCIPAL ACCOUNTING FEES AND SERVICES
| ITEM 14. | PRINCIPAL ACCOUNTING FEES AND SERVICES |
The information required by this Item is incorporated by reference to our 20122013 proxy statement.
| ITEM 15. | EXHIBITS, FINANCIAL STATEMENT SCHEDULES |
| (a) | ||||
| (1) | ||||
|
| Page | |||||
and 2010 (Predecessor) | |||||
| 75 | |||||
Consolidated Balance Sheets as of December 31, | |||||
| |||||
and 2010 (Predecessor) | |||||
| (2) | |
|
Schedule I – | F-1 | |||
All other financial statement schedules are omitted because they are not applicable, not material or because the required information is included in the financial statements or notes.
| (3) | ||||
|
Exhibit No. | Description | |
| 2.1* | Sanction Order, dated September 23, 2010 (incorporated by reference from Exhibit 2.1 of AbitibiBowater Inc.’s Current Report on Form 8-K filed November 30, 2010, SEC File No. 001-33776). | |
2.2* | Confirmation Order, dated November 23, 2010, which includes theDebtors’ Second Amended Joint Plan of Reorganization under Chapter 11 of the Bankruptcy Code, dated November 16, 2010 (as amended) (incorporated by reference from Exhibit 2.2 of AbitibiBowater Inc.’s Current Report on Form 8-K filed November 30, 2010, SEC File No. 001-33776). | |
2.3* | CCAA Plan of Reorganization and Compromise, dated August 2, 2010 (incorporated by reference from Exhibit 99.2 to AbitibiBowater Inc.’s Current Report on Form 8-K filed August 5, 2010, SEC File No. 001-33776). | |
| ||
| 3.1** | Amended and Restated Certificate of Incorporation of AbitibiBowater Inc. | |
3.2* | Third Amended and Restated By-laws of AbitibiBowater Inc. (incorporated by reference from Exhibit 3(ii) to AbitibiBowater Inc.’s Form 8-A filed on December 9, 2010). | |
4.1* | ||
| ||
| ||
|
| |
| Secured Promissory Note, dated January 14, 2011, made by Augusta Newsprint Company LLC in favor of Woodbridge International Holdings Limited (incorporated by reference from Exhibit 4.4 to AbitibiBowater Inc.’s Annual Report on Form 10-K for the year ended December 31, 2010 filed April 5, 2011, SEC File No. 001-33776). |
Exhibit No. | Description | |
| Amended and Restated Indenture, dated as of May 12, 2011, among AbitibiBowater Inc., each of the guarantors from time to time party hereto, as guarantors, and Wells Fargo Bank, National Association, as trustee and as collateral agent (incorporated by reference from Exhibit 4.1 to AbitibiBowater Inc.’s Quarterly Report on Form 10-Q for the quarter ended March 31, 2011 filed May 16, 2011, SEC File No. 001-33776). | |
4.3* | Form of 10.25% Senior Note due 2018 (included in Exhibit 4.1 to AbitibiBowater Inc.’s Quarterly Report on Form 10-Q for the quarter ended March 31, 2011 filed May 16, 2011, SEC File No. 001-33776). | |
| 4.4* | Second Supplemental Indenture, dated as of March 9, 2012, among AbitibiBowater Inc., the guarantors party thereto and Wells Fargo Bank, National Association, as trustee (incorporated by reference from Exhibit 4.1 to AbitibiBowater Inc.’s Quarterly Report on Form 10-Q for the quarter ended March 31, 2012 filed May 10, 2012, SEC File No. 001-33776). | |
| 10.1* | ABL Credit Agreement, dated as of December 9, 2010, among AbitibiBowater Inc., Bowater Incorporated, Abitibi-Consolidated Corp., Abitibi-Consolidated Inc., Barclays Bank PLC, JPMorgan Chase Bank, N.A., and Citibank, N.A., as administrative agent and collateral agent (incorporated by reference from Exhibit 10.1 to AbitibiBowater Inc.’s Current Report on Form 8-K filed December 15, 2010, SEC File No. 001-33776). | |
10.2* | Stock Purchase Agreement, dated as of December 23, 2010, among Woodbridge International Holdings Limited, The Woodbridge Company Limited, Abitibi Consolidated Sales Corporation, AbitibiBowater Inc., Augusta Newsprint Company and Augusta Newsprint Inc. (incorporated by reference from Exhibit 10.2 to AbitibiBowater Inc.’s Annual Report on Form 10-K for the year ended December 31, 2010 filed April 5, 2011, SEC File No. 001-33776). | |
10.3* | Securities Purchase Agreement, dated February 11, 2011, among AbiBow Canada Inc., Caisse de depot et placement du Quebec and CDP Investissements Inc., as vendors, and Infra H2O GP Partners Inc., Infra H2O LP Partners Inc. and BluEarth Renewables Inc., as the purchaser (incorporated by reference from Exhibit 2.1 to AbitibiBowater Inc.’s Current Report on Form 8-K filed February 17, 2011, SEC File No. 001-33776). | |
†10.4* | AbitibiBowater 2010 Canadian DB Supplemental Executive Retirement Plan, effective as of December 9, 2010 (incorporated by reference from Exhibit 10.4 to AbitibiBowater Inc.’s Annual Report on Form 10-K for the year ended December 31, 2010 filed April 5, 2011, SEC File No. 001-33776). | |
†10.5* | AbitibiBowater 2010 DC Supplemental Executive Retirement Plan, effective as of December 9, 2010 (incorporated by reference from Exhibit 10.5 to AbitibiBowater Inc.’s Annual Report on Form 10-K for the year ended December 31, 2010 filed April 5, 2011, SEC File No. 001-33776). | |
†10.6* | ||
| ||
| AbitibiBowater Inc. 2010 Equity Incentive Plan Form of Restricted Stock Unit Agreement (incorporated by reference from Exhibit 10.2 to AbitibiBowater Inc.’s Registration Statement on Form S-8 filed January 7, 2011, SEC Registration No. 333-171602). | |
† | AbitibiBowater Inc. 2010 Equity Incentive Plan Form of Director Nonqualified Stock Option Agreement (incorporated by reference from Exhibit 10.3 to AbitibiBowater Inc.’s Registration Statement on Form S-8 filed January 7, 2011, SEC Registration No. 333-171602). | |
† | AbitibiBowater Inc. 2010 Equity Incentive Plan Form of Employee Nonqualified Stock Option Agreement (incorporated by reference from Exhibit 10.4 to AbitibiBowater Inc.’s Registration Statement on Form S-8 filed January 7, 2011, SEC Registration No. 333-171602). | |
| †10.9* | AbitibiBowater Inc. 2010 Equity Incentive Plan Form of Employee Restricted Stock Unit Agreement (incorporated by reference from Exhibit 10.13 to AbitibiBowater Inc.’s Annual Report on Form 10-K for the year ended December 31, 2011 filed February 29, 2012, SEC File No. 001-33776). | |
Exhibit No. | Description | |
| † | AbitibiBowater Inc. 2010 Equity Incentive Plan Form of | |
† | ||
|
| |
|
| |
| AbitibiBowater Executive Restricted Stock Unit Plan, effective as of April 1, 2011 (incorporated by reference from Exhibit 10.13 to AbitibiBowater Inc.’s Annual Report on Form 10-K for the year ended December 31, 2010 filed April 5, 2011, SEC File No. 001-33776). | |
† | 2011 AbitibiBowater Inc. Short-Term Incentive | |
† | Summary of 2012 AbitibiBowater Inc. Short-Term Incentive | |
|
| |
|
| |
† |
| |
|
| |
|
| |
|
| |
|
| |
|
| |
| Offer Letter between Yves Laflamme and AbitibiBowater Inc., dated October 26, 2010 (incorporated by reference from Exhibit 10.23 to AbitibiBowater Inc.’s Annual Report on Form 10-K for the year ended December 31, 2010 filed April 5, 2011, SEC File No. 001-33776). | |
† | Employment Agreement between Yves Laflamme and AbitibiBowater Inc., dated February 14, 2011 (incorporated by reference from Exhibit 10.2 to AbitibiBowater Inc.’s Current Report on Form 8-K filed February 18, 2011, SEC File No. 001-33776). | |
|
| |
† |
| |
| Executive Employment Agreement between AbitibiBowater Inc. and Richard Garneau, dated January 1, 2011 (incorporated by reference from Exhibit 10.26 to AbitibiBowater Inc.’s Annual Report on Form 10-K for the year ended December 31, 2010 filed April 5, 2011, SEC File No. 001-33776). | |
† | Change in Control Agreement between AbitibiBowater Inc. and Richard Garneau, dated January 1, 2011 (incorporated by reference from Exhibit 10.27 to AbitibiBowater Inc.’s Annual Report on Form 10-K for the year ended December 31, 2010 filed April 5, 2011, SEC File No. 001-33776). | |
† | Employment Agreement between Alain Boivin and AbitibiBowater Inc., dated February 22, 2011 (incorporated by reference from Exhibit 10.28 to AbitibiBowater Inc.’s Annual Report on Form 10-K for the year ended December 31, 2010 filed April 5, 2011, SEC File No. 001-33776). | |
† | Offer Letter between John Lafave and AbitibiBowater Inc., dated February 14, 2011 (incorporated by reference from Exhibit 10.29 to AbitibiBowater Inc.’s Annual Report on Form 10-K for the year ended December 31, 2010 filed April 5, 2011, SEC File No. 001-33776). | |
† | Offer Letter between Jo-Ann Longworth and AbitibiBowater Inc., dated July 25, 2011 (incorporated by reference from Exhibit 10.2 to AbitibiBowater Inc.’s Quarterly Report on Form 10-Q for the quarter ended September 30, 2011 filed November 14, 2011, SEC File No. 001-33776). | |
† |
| |
| Offer Letter between Pierre Laberge and AbitibiBowater Inc., dated June 9, | |
† | Director compensation program | |
† |
| |
|
| |
| Retirement Compensation Trust Agreement (with Letter of Credit) between AbiBow Canada Inc. and AbitibiBowater Inc. and CIBC Mellon Trust Company, dated and effective as of November 1, | |
Exhibit No. | Description | |
† | Agreement Concerning the Pulp and Paper Operations of AbiBow Canada in Ontario, dated November 10, 2010, between Bowater Canadian Forest Products Inc. and Abitibi-Consolidated Company of Canada and The Province of Ontario (incorporated by reference from Exhibit 10.32 to AbitibiBowater Inc.’s Annual Report on Form 10-K for the year ended December 31, 2010 filed April 5, 2011, SEC File No. 001-33776). | |
† | Agreement Concerning the Pulp and Paper Operations of AbiBow Canada in Quebec, dated September 13, 2010, between Bowater Canadian Forest Products Inc. and Abitibi-Consolidated Company of Canada and The Government of Quebec (incorporated by reference from Exhibit 10.33 to AbitibiBowater Inc.’s Annual Report on Form 10-K for the year ended December 31, 2010 filed April 5, 2011, SEC File No. 001-33776). | |
|
| |
| Settlement Agreement, dated as of August 24, 2010, between AbitibiBowater Inc., Abitibi-Consolidated Company of Canada, Abitibi-Consolidated Inc. and AbitibiBowater Canada Inc. and The Government of Canada (incorporated by reference from Exhibit 10.1 to AbitibiBowater Inc.’s Quarterly Report on Form 10-Q filed for the quarter ended September 30, 2010, SEC File No. 001-33776). | |
| Amendment No. 1, dated as of April 28, 2011, to the ABL Credit Agreement, dated as of December 9, 2010, among AbitibiBowater Inc., the subsidiaries of AbitibiBowater party thereto, the lenders party thereto from time to time and Citibank, N.A., as administrative agent and collateral agent (incorporated by reference from Exhibit 10.1 to AbitibiBowater Inc.’s Quarterly Report on Form 10-Q for the quarter ended March 31, 2011 filed May 16, 2011, SEC File No. 001-33776). | |
| Amendment No. 2, dated October 28, 2011, to ABL Credit Agreement, dated as of December 9, 2010, among AbitibiBowater Inc., AbiBow US Inc. (f/k/a Bowater Incorporated) and AbiBow Recycling LLC (f/k/a Abitibi-Consolidated Corp.) and AbiBow Canada Inc. (f/k/a Abitibi-Consolidated Inc.), and Citibank, N.A., as administrative agent and collateral agent (incorporated by reference from Exhibit 10.1 to AbitibiBowater Inc.’s Current Report on Form 8-K filed October 31, 2011, SEC File No. 001-33776). | |
| Lock-up Agreement between AbitibiBowater Inc. and Fairfax Financial Holdings Limited, dated as of November 28, 2011 (incorporated by reference from Exhibit 10.1 to AbitibiBowater Inc.’s Current Report on Form 8-K filed November 29, 2011, SEC File No. 001-33776). | |
| Lock-up Agreement between AbitibiBowater Inc. and Oakmont Capital Inc., dated as of November 28, 2011 (incorporated by reference from Exhibit 10.2 to AbitibiBowater Inc.’s Current Report on Form 8-K filed November 29, 2011, SEC File No. 001-33776). | |
| Lock-up Agreement between AbitibiBowater Inc. and Dalal Street, LLC, dated as of November 28, 2011 (incorporated by reference from Exhibit 10.3 to AbitibiBowater Inc.’s Current Report on Form 8-K filed November 29, 2011, SEC File No. 001-33776). | |
| †10.32* | 2012 AbitibiBowater Inc. Short-Term Incentive Plan (incorporated by reference from Exhibit 10.1 to AbitibiBowater Inc.’s Quarterly Report on Form 10-Q for the quarter ended March 31, 2012 filed May 10, 2012, SEC File No. 001-33776). | |
| †10.33* | Offer Letter between Jacques Vachon and AbitibiBowater Inc., dated March 19, 2012 (incorporated by reference from Exhibit 10.2 to AbitibiBowater Inc.’s Quarterly Report on Form 10-Q for the quarter ended March 31, 2012 filed May 10, 2012, SEC File No. 001-33776). | |
| †10.34* | Resolute Forest Products DC Make-up Program, effective January 1, 2012 (incorporated by reference from Exhibit 10.3 to AbitibiBowater Inc.’s Quarterly Report on Form 10-Q for the quarter ended March 31, 2012 filed May 10, 2012, SEC File No. 001-33776). | |
| 10.35* | Waiver and Amendment No. 3, dated as of March 21, 2012, under and to the ABL Credit Agreement, dated as of December 9, 2010, among AbitibiBowater Inc., the subsidiaries of AbitibiBowater party thereto, the lenders party thereto from time to time and Citibank, N.A., as administrative agent and collateral agent (incorporated by reference from Exhibit 10.4 to AbitibiBowater Inc.’s Quarterly Report on Form 10-Q for the quarter ended March 31, 2012 filed May 10, 2012, SEC File No. 001-33776). | |
Exhibit No. | Description | |
†10.36* | Resolute Forest Products Inc. Severance Policy – Chief Executive Officer and Direct Reports, effective as of August 1, 2012 (incorporated by reference from Exhibit 10.1 to Resolute Forest Products Inc.’s Quarterly Report on Form 10-Q for the quarter ended June 30, 2012 filed August 9, 2012, SEC File No. 001-33776). | |
| †10.37* | First Amendment to the AbitibiBowater 2010 DC Supplemental Executive Retirement Plan, effective as of December 31, 2011 (incorporated by reference from Exhibit 10.1 to Resolute Forest Products Inc.’s Quarterly Report on Form 10-Q for the quarter ended September 30, 2012 filed November 9, 2012, SEC File No. 001-33776). | |
| †10.38* | Resolute Forest Products Equity Incentive Plan (previously named the AbitibiBowater Inc. 2010 Equity Incentive Plan), effective as of December 9, 2010 (incorporated by reference from Exhibit 10.2 to Resolute Forest Products Inc.’s Quarterly Report on Form 10-Q for the quarter ended September 30, 2012 filed November 9, 2012, SEC File No. 001-33776). | |
| †10.39* | Resolute Forest Products Outside Director Deferred Compensation Plan (previously named the AbitibiBowater Inc. Outside Director Deferred Compensation Plan), effective as of April 1, 2011 (incorporated by reference from Exhibit 10.3 to Resolute Forest Products Inc.’s Quarterly Report on Form 10-Q for the quarter ended September 30, 2012 filed November 9, 2012, SEC File No. 001-33776). | |
| †10.40* | Summary of 2013 Resolute Forest Products Inc. Short-Term Incentive Plan (incorporated by reference from Exhibit 10.1 to Resolute Forest Products Inc.’s Current Report on Form 8-K filed February 28, 2013, SEC File No. 001-33776). | |
| †10.41** | Form of Indemnification Agreement for Directors and Officers of Resolute Forest Products Inc. | |
| †10.42** | AbiBow Canada Inc. and AbitibiBowater Inc. Security Protocol with respect to the AbitibiBowater 2010 Canadian DB Supplemental Executive Retirement Plan and the AbiBow Canada SERP, amended and restated effective April 1, 2012. | |
| 12.1** | Computation of Ratio of Earnings to Fixed Charges. | |
21.1** | Subsidiaries of the registrant. | |
23.1** | Consent of PricewaterhouseCoopers LLP. | |
24.1** | Power of attorney for certain Directors of the registrant. | |
31.1** | Certification of President and Chief Executive Officer Pursuant to Section 302 of the Sarbanes-Oxley Act of 2002. | |
31.2** | Certification of Senior Vice President and Chief Financial Officer Pursuant to Section 302 of the Sarbanes-Oxley Act of 2002. | |
|
| ||
32.1** | Certification of President and Chief Executive Officer Pursuant to Section 906 of the Sarbanes-Oxley Act of 2002. | ||
32.2** | Certification of Senior Vice President and Chief Financial Officer Pursuant to Section 906 of the Sarbanes-Oxley Act of 2002. | ||
| XBRL Instance Document. | ||
| XBRL Taxonomy Extension Schema Document. | ||
| XBRL Taxonomy Extension Calculation Linkbase Document. | ||
| XBRL Taxonomy Extension Label Linkbase Document. | ||
| XBRL Taxonomy Extension Presentation Linkbase Document. | ||
| XBRL Taxonomy Extension Definition Linkbase Document. | ||
| * | Previously filed and incorporated herein by reference. |
| † | This is a management contract or compensatory plan or arrangement. |
| ** | Filed with this Form 10-K. |
| *** | Interactive data files |
| (b) | The above-referenced exhibits are being filed with this Form 10-K. |
| (c) | None. |
Pursuant to the requirements of Section 13 or 15(d) of the Securities Exchange Act of 1934, the Registrant has duly caused this report to be signed on its behalf by the undersigned, thereunto duly authorized.
| Date: | By: | /s/ Richard Garneau | ||||
| Richard Garneau | ||||||
| President and Chief Executive Officer | ||||||
Pursuant to the requirements of the Securities Exchange Act of 1934, this report has been signed below by the following persons on behalf of the Registrant and in the capacities and on the dates indicated.
Signature | Title | Date | ||||||
/s/ Richard Garneau
| President and Chief Executive | March 1, 2013 | ||||||
| Richard Garneau | Officer | |||||||
| (Principal Executive Officer) | ||||||||
/s/ Richard B. Evans* | Chairman, Director | March 1, 2013 | ||||||
| Richard B. Evans |
| |||||||
/s/ Jo-Ann Longworth
| Senior Vice President and | March 1, 2013 | ||||||
| Jo-Ann Longworth | Chief Financial Officer | |||||||
| (Principal Financial Officer) | ||||||||
/s/ Silvana Travaglini
| Vice President and | March 1, 2013 | ||||||
| Silvana Travaglini | Chief Accounting Officer | |||||||
| (Principal Accounting Officer) | ||||||||
/s/ Richard D. Falconer* | Director | March 1, 2013 | ||||||
| Richard D. Falconer |
| |||||||
/
| Director | |||||||
| Jeffrey A. Hearn | ||||||||
/s/ Alain Rheaume*
| Director | |||||||
| Alain Rheaume | ||||||||
/s/
| Director | |||||||
| Bradley P. Martin | ||||||||
/s/ Michael S. Rousseau* | Director | March 1, 2013 | ||||||
| Michael S. Rousseau |
| |||||||
/s/ David H. Wilkins*
| Director | |||||||
| March 1, 2013 | ||||||
| David H. Wilkins | ||||||
* Jo-Ann Longworth, by signing her name hereto, does sign this document on behalf of the persons indicated above pursuant to powers of attorney duly executed by such persons that are filed herewith as Exhibit 24.1.
| By: | /s/ Jo-Ann Longworth | |
| Jo-Ann Longworth, Attorney-in-Fact |
Schedule I – ABITIBIBOWATERRESOLUTE FOREST PRODUCTS INC. CONDENSED FINANCIAL STATEMENTS AND NOTES
AbitibiBowaterResolute Forest Products Inc.
(Parent Company Only)
Condensed Statements of Operations, and Retained Earnings (Deficit) and Comprehensive (Loss) Income
(In millions)
| Years Ended December 31, | ||||||||||||||||||||||||||||||||||
| Successor | Predecessor | Years Ended December 31, | ||||||||||||||||||||||||||||||||
| 2011 | 2010 | 2009 | Successor | Predecessor | ||||||||||||||||||||||||||||||
| 2012 | 2011 | 2010 | ||||||||||||||||||||||||||||||||
Expenses: | ||||||||||||||||||||||||||||||||||
Selling, general and administrative expenses | $ | 27 | $ | 34 | $ | 29 | $ | 18 | $ | 27 | $ | 34 | ||||||||||||||||||||||
Reserve for receivables from subsidiaries (Note E) | – | (32 | ) | 410 | – | – | (32) | |||||||||||||||||||||||||||
Operating loss | (27) | (2 | ) | (439 | ) | (18 | ) | (27 | ) | (2) | ||||||||||||||||||||||||
Interest expense (Note B) | (153) | (26 | ) | (40 | ) | (214 | ) | (216 | ) | (29) | ||||||||||||||||||||||||
Other income (expense), net | 6 | (1 | ) | 12 | 2 | 6 | (1) | |||||||||||||||||||||||||||
Equity in income of subsidiaries | 152 | 1,652 | – | 144 | 193 | 1,682 | ||||||||||||||||||||||||||||
(Loss) income before reorganization items and income taxes | (22) | 1,623 | (467 | ) | (86 | ) | (44 | ) | 1,650 | |||||||||||||||||||||||||
Reorganization items, net (Note B) | – | (185 | ) | (2 | ) | – | – | (212) | ||||||||||||||||||||||||||
(Loss) income before income taxes | (22) | 1,438 | (469 | ) | (86 | ) | (44 | ) | 1,438 | |||||||||||||||||||||||||
Income tax benefit | 63 | 8 | – | 84 | 85 | 8 | ||||||||||||||||||||||||||||
Net income (loss) | 41 | 1,446 | (469 | ) | ||||||||||||||||||||||||||||||
Deficit as of beginning of year | – | (3,223 | ) | (2,754 | ) | |||||||||||||||||||||||||||||
Net (loss) income | (2 | ) | 41 | 1,446 | ||||||||||||||||||||||||||||||
Retained earnings (deficit) as of beginning of year | 41 | – | (3,223) | |||||||||||||||||||||||||||||||
Acquisition of Fibrek | (1 | ) | – | – | ||||||||||||||||||||||||||||||
Elimination of Predecessor Company deficit as a result of the application of fresh start accounting | – | 1,777 | – | – | – | 1,777 | ||||||||||||||||||||||||||||
Retained earnings (deficit) as of end of year (2011 and 2010: Successor; 2009: Predecessor) | $ | 41 | $ | – | $ | (3,223 | ) | |||||||||||||||||||||||||||
Retained earnings as of end of year (Successor) | $ | 38 | $ | 41 | $ | – | ||||||||||||||||||||||||||||
Comprehensive (loss) income | $ | (321 | ) | $ | (262 | ) | $ | 876 | ||||||||||||||||||||||||||
See accompanying notes to condensed financial statements.
Schedule I – ABITIBIBOWATERRESOLUTE FOREST PRODUCTS INC. CONDENSED FINANCIAL STATEMENTS AND NOTES
AbitibiBowaterResolute Forest Products Inc.
(Parent Company Only)
Condensed Balance Sheets
(In millions)
| Successor | ||||||||||||||||||||||
| December 31, 2011 | December 31, 2010 | Successor | ||||||||||||||||||||
| December 31, 2012 | December 31, 2011 | |||||||||||||||||||||
Assets | ||||||||||||||||||||||
Accounts receivable from subsidiaries | $ | – | $ | 40 | ||||||||||||||||||
Current assets: | ||||||||||||||||||||||
Cash and cash equivalents | 5 | – | ||||||||||||||||||||
Note receivable from a subsidiary (Note E) | $ | 41 | $ | 41 | ||||||||||||||||||
Total current assets | 46 | 41 | ||||||||||||||||||||
Investment in and advances to subsidiaries (Note C) | 5,565 | 5,977 | 4,850 | 5,805 | ||||||||||||||||||
Total assets | $ | 5,565 | $ | 6,017 | $ | 4,896 | $ | 5,846 | ||||||||||||||
Liabilities and equity | ||||||||||||||||||||||
Current liabilities: | ||||||||||||||||||||||
Accounts payable and accrued liabilities | $ | 15 | $ | 26 | $ | 11 | $ | 15 | ||||||||||||||
Accounts payable to subsidiaries | 232 | 178 | 336 | 220 | ||||||||||||||||||
Note and interest payable to a subsidiary (Note E) | 945 | 864 | ||||||||||||||||||||
Notes and interest payable to subsidiaries (Note E) | 593 | 1,238 | ||||||||||||||||||||
Total current liabilities | 1,192 | 1,068 | 940 | 1,473 | ||||||||||||||||||
Long-term debt | 621 | 905 | 528 | 621 | ||||||||||||||||||
Total liabilities | 1,813 | 1,973 | 1,468 | 2,094 | ||||||||||||||||||
Equity: | ||||||||||||||||||||||
Common stock | – | – | – | – | ||||||||||||||||||
Additional paid-in capital | 4,022 | 4,044 | 4,065 | 4,022 | ||||||||||||||||||
Retained earnings | 41 | – | 38 | 41 | ||||||||||||||||||
Accumulated other comprehensive loss | (311 | ) | – | (614 | ) | (311 | ) | |||||||||||||||
Total AbitibiBowater Inc. equity | 3,752 | 4,044 | ||||||||||||||||||||
Treasury stock | (61 | ) | – | |||||||||||||||||||
Total Resolute Forest Products Inc. equity | 3,428 | 3,752 | ||||||||||||||||||||
Total liabilities and equity | $ | 5,565 | $ | 6,017 | $ | 4,896 | $ | 5,846 | ||||||||||||||
See accompanying notes to condensed financial statements.
F- 2
Schedule I – ABITIBIBOWATERRESOLUTE FOREST PRODUCTS INC. CONDENSED FINANCIAL STATEMENTS AND NOTES
AbitibiBowaterResolute Forest Products Inc.
(Parent Company Only)
Condensed Statements of Cash Flows
(In millions)
| Years Ended December 31, | ||||||||||||||||||||||||||||||||||||||||||||
| Successor | Predecessor | Years Ended December 31, | ||||||||||||||||||||||||||||||||||||||||||
| 2011 | 2010 | 2009 | Successor | Predecessor | ||||||||||||||||||||||||||||||||||||||||
| 2012 | 2011 | 2010 | ||||||||||||||||||||||||||||||||||||||||||
Net cash provided by operating activities | $ | – | $ | – | $ | – | $ | – | $ | – | $ | – | ||||||||||||||||||||||||||||||||
Cash flows from investing activities: | ||||||||||||||||||||||||||||||||||||||||||||
Investment in and advances to affiliates | – | (850 | ) | – | ||||||||||||||||||||||||||||||||||||||||
Net cash used in investing activities | – | (850 | ) | – | ||||||||||||||||||||||||||||||||||||||||
Investment in and advances from (to) affiliates | 72 | – | (850) | |||||||||||||||||||||||||||||||||||||||||
Net cash provided by (used in) investing activities | 72 | – | (850) | |||||||||||||||||||||||||||||||||||||||||
Cash flows from financing activities: | ||||||||||||||||||||||||||||||||||||||||||||
Purchases of treasury stock | (67 | ) | – | – | ||||||||||||||||||||||||||||||||||||||||
Issuance of long-term debt | – | 850 | – | – | – | 850 | ||||||||||||||||||||||||||||||||||||||
Net cash provided by financing activities | – | 850 | – | |||||||||||||||||||||||||||||||||||||||||
Net cash (used in) provided by financing activities | (67 | ) | – | 850 | ||||||||||||||||||||||||||||||||||||||||
Net increase in cash and cash equivalents | – | – | – | 5 | – | – | ||||||||||||||||||||||||||||||||||||||
Cash and cash equivalents: | ||||||||||||||||||||||||||||||||||||||||||||
Beginning of year | – | – | – | – | – | – | ||||||||||||||||||||||||||||||||||||||
End of year (2011 and 2010: Successor; 2009: Predecessor) | $ | – | $ | – | $ | – | ||||||||||||||||||||||||||||||||||||||
End of year (Successor) | $ | 5 | $ | – | $ | – | ||||||||||||||||||||||||||||||||||||||
See accompanying notes to condensed financial statements.
F- 3
Schedule I – ABITIBIBOWATERRESOLUTE FOREST PRODUCTS INC. CONDENSED FINANCIAL STATEMENTS AND NOTES
AbitibiBowaterResolute Forest Products Inc.
(Parent Company Only)
Notes to Condensed Financial Statements
Note A. Organization and Basis of Presentation
The accompanying condensed financial statements, including the notes thereto, should be read in conjunction with the consolidated financial statements of AbitibiBowaterResolute Forest Products Inc. included in Item 8 of this Form 10-K (“Consolidated Financial Statements”). When the term “AbitibiBowater“Resolute Forest Products Inc.” (also referred to as “AbitibiBowater,“Resolute Forest Products,” “we,” “us” or “our”) is used, we mean AbitibiBowaterResolute Forest Products Inc., the parent company only. Resolute Forest Products Inc. is incorporated in Delaware and is a holding company whose only significant asset is an investment in the common stock of our subsidiaries.
All amounts are expressed in U.S. dollars, unless otherwise indicated. Defined terms in this Schedule I have the meanings ascribed to them in the Consolidated Financial Statements.
AbitibiBowater Inc. is incorporated Certain prior year amounts in Delaware. On October 29, 2007, Abitibiour condensed financial statements and Bowater combined in a merger of equals with each becoming a subsidiary of AbitibiBowater and resulted in AbitibiBowater becoming a holding company whose only significant asset was an investment innotes have been reclassified to conform to the common stock of our subsidiaries.2012 presentation.
For a discussion of our involvement in and our emergence from the Creditor Protection Proceedings, see Note 3,4, “Creditor Protection Proceedings,” to the Consolidated Financial Statements. Effective upon the commencement of the Creditor Protection Proceedings and through the Convenience Date, we applied the guidance in FASB ASC 852, including the application of fresh start accounting as of December 31, 2010, in preparing our condensed financial statements, which is the same basis of presentation used in the preparation of the Consolidated Financial Statements, as discussed in Note 1, “Organization and Basis of Presentation,” to the Consolidated Financial Statements. As such, adjustments related to the application of fresh start accounting was reflected in our Condensed Balance Sheet as of December 31, 2010 and fresh start accounting adjustments related thereto were included in our Condensed Statements of Operations, and Retained Earnings (Deficit)and Comprehensive (Loss) Income (“Statements of Operations”) for the year ended December 31, 2010.
The implementation of the Plans of Reorganization and the application of fresh start accounting materially changed the carrying amounts and classifications reported in our condensed financial statements and resulted in us becoming a new entity for financial reporting purposes. Accordingly, our condensed financial statements as of December 31, 2010 and for periods subsequent to December 31, 2010 are not comparable to our condensed financial statements for periods prior to December 31, 2010. References to “Successor” or “Successor Company” refer to AbitibiBowaterus on or after December 31, 2010, after giving effect to the implementation of the Plans of Reorganization and the application of fresh start accounting. References to “Predecessor” or “Predecessor Company” refer to AbitibiBowaterus prior to December 31, 2010. Additionally, references to periods on or after December 31, 2010 refer to the Successor and references to periods prior to December 31, 2010 refer to the Predecessor.
Note B. Creditor Protection Proceedings Related Disclosures
Reorganization items, net
FASB ASC 852 requires separate disclosure of reorganization items such as certain expenses, provisions for losses and other charges and credits directly associated with or resulting from the reorganization and restructuring of the business that were realized or incurred during the Creditor Protection Proceedings, including the impact of the implementation of the Plans of Reorganization and the application of fresh start accounting. The recognition of Reorganization items, net, unless specifically prescribed otherwise by FASB ASC 852, was in accordance with other applicable U.S. GAAP.
Reorganization items, net for the year ended December 31, 2010 were comprised of the following:
| Predecessor | ||
| (In millions) | 2010 | |
Professional fees(1) | $ 18 | |
Gain due to Plans of Reorganization adjustments(2) | (160) | |
Loss due to fresh start accounting adjustments(3) | 82 | |
Provision for repudiated or rejected executory contracts | 5 | |
Write-off of debt discounts and issuance costs(4) | 103 | |
Post-petition interest on note payable to a subsidiary (Note E) | 161 | |
Other | 3 | |
| $ 212 |
F- 4
AbitibiBowaterResolute Forest Products Inc.
(Parent Company Only)
Notes to Condensed Financial Statements
Reorganization items, net for the years ended December 31, 2010 and 2009 were comprised of the following:
| Predecessor | ||||||||
| (In millions) | 2010 | 2009 | ||||||
Professional fees(1) | $ | 18 | $ | – | ||||
Gain due to Plans of Reorganization adjustments(2) | (160 | ) | – | |||||
Loss due to fresh start accounting adjustments(3) | 82 | – | ||||||
Provision for repudiated or rejected executory contracts | 5 | 2 | ||||||
Write-off of debt discounts and issuance costs(4) | 103 | – | ||||||
Post-petition interest on note payable to a subsidiary (Note E) | 134 | – | ||||||
Other | 3 | – | ||||||
| $ | 185 | $ | 2 | |||||
| (1) | Professional fees directly related to the Creditor Protection Proceedings. Additionally, |
| (2) | Represented the effects of the implementation of the Plans of Reorganization, which consisted of the gain on extinguishment of the Predecessor Company’s liabilities subject to compromise, net of professional fees that were contractually due to certain professionals as “success” fees upon our emergence from the Creditor Protection Proceedings. |
| (3) | Represented adjustments to the carrying values of our assets and liabilities to reflect their fair values as a result of the application of fresh start accounting and consisted of: (i) the write-off of deferred financing costs associated with the 2018 Notes and (ii) the premium recorded on the 2018 Notes (see Note D, “Financing Arrangements”). |
| (4) | FASB ASC 852 requires that debt discounts and premiums, as well as debt issuance costs, be viewed as part of the valuation of the related pre-petition debt in arriving at the net carrying amount of the debt. When the debt becomes an allowed claim and the allowed claim differs from the net carrying amount of the debt, the recorded debt obligations should be adjusted to the amount of the allowed claim. |
In 2010, and 2009, we paid no amounts relating to reorganization items (see Note E, “Transactions with Related Parties,” for additional information).
Interest expense
Interest expense recorded in our Condensed Statements of Operations and Retained Earnings (Deficit) totaled $153 million in 2011, $26 million in 2010 (which included interest accrued on the 2018 Notes in the fourth quarter of 2010, as well as catch up interest expense on a note payable to a subsidiary of $5 million, as further discussed in Note E, “Transactions with Related Parties”) and $40 million in 2009. The increase in interest expense in 2011 compared to 2010 was primarily due to a full year of interest expense in 2011 on the 2018 Notes, as well as a full year of interest in 2011 recorded in interest expense on an intercompany note payable (see Note E, “Transactions with Related Parties,” for additional information). The decrease in interest expense in 2010 compared to 2009 was a result of ceasing to accrue interest on our pre-petition debt obligations. In accordance with FASB ASC 852, during the Creditor Protection Proceedings, we recorded interest expense on our pre-petition debt obligations only to the extent that: (i) interest would be paid during the Creditor Protection Proceedings or (ii) it was probable that interest would be an allowed priority, secured or unsecured claim. Since neither of these conditions applied to our pre-petition debt obligations, we ceased accruing interest on our pre-petition debt obligations. Contractual interest expense was $142$172 million in both 2010 and 2009.
AbitibiBowater Inc.
(Parent Company Only)
Notes to Condensed Financial Statements
2010.
Note C. Equity Method Investments
The recognition of our share of the equity in loss of our subsidiaries resulted in a reported investment in our subsidiaries of zero as of December 31, 2008.in prior years. Since we have no obligation to fund additional losses of our subsidiaries, we cannot report a negative investment in our subsidiaries under the equity method. Accordingly, in 2009, we did not record any of our share of our subsidiaries’ losses. In 2010, we recorded our share of income of our subsidiaries, net of the cumulative losses that would otherwise have resulted in the reporting of a negative investment by us in prior years. In 2012 and 2011, we recorded our share of the income of our subsidiaries.
Note D. Financing Arrangements
10.25% senior secured notes due 2018
On December 9,In connection with our emergence from the Creditor Protection Proceedings in 2010, we and each of our material, wholly-owned U.S. subsidiaries entered into a supplemental indenture with Wells Fargo Bank, National Association, as trustee and collateral agent, pursuant to which we assumed the obligations of ABI Escrow Corporation with respect toissued $850 million in aggregate principal amount of the 2018 Notes originally issued on October 4, 2010 pursuant to an indenture as of that date. ABI Escrow Corporation was a wholly-owned subsidiary of ours created solely for the purpose of issuing the 2018 Notes. For a discussion of the 2018 Notes, see Note 16, “Liquidity and Debt –17, “Long-Term Debt – 10.25% senior secured notes due 2018,” to the Consolidated Financial Statements.
On June 13, 2011, the first $100 million of net proceeds from the sale of our investment in ACH was used to redeem $94 million of principal amount of the 2018 Notes at a redemption price of 105% of the principal amount, plus accrued and unpaid interest. Additionally, on botheach of June 29, 2011, and November 4, 2011 and October 10, 2012, $85 million of principal amount of the 2018 Notes was redeemed at a redemption price of 103% of the principal amount, plus accrued and unpaid interest. As a result of these redemptions, during the year ended December 31,in 2012 and 2011, we recorded net gains on extinguishment of debt of $2 million and $6 million, respectively, which were included in “Other income (expense), net” in our Condensed Statements of Operations and Retained Earnings (Deficit).Operations. These redemptions and all interest on the notes were paid by AbiBowResolute FP US Inc. on our behalf (see Note E, “Transactions with Related Parties”).
F- 5
Resolute Forest Products Inc.
(Parent Company Only)
Notes to Condensed Financial Statements
As a result of our application of fresh start accounting, as of December 31, 2010, the 2018 Notes were recorded at their fair value, of $905 million, which resulted in a premium, of $55 million, which is being amortized to interest expense using the effective interest method over the term of the notes. As of December 31, 2012 and 2011, the carrying value of the 2018 Notes was $528 million and $621 million, respectively, which included the unamortized premium of $27 million and $35 million.million, respectively.
In connection with the issuance of the notes, during 2010, we incurred fees of $27 million, which were written off to “Reorganization items, net” in our Condensed Statements of Operations and Retained Earnings (Deficit) as a result of the application of fresh start accounting. These fees were paid by BowaterResolute FP US Inc. on our behalf (see Note E, “Transactions with Related Parties”).
Promissory note
As of December 31, 2010, ANC was owned 52.5% by a subsidiary of ours. On January 14, 2011, we acquired the noncontrolling interest in ANC and ANC became a wholly-owned subsidiary of ours.subsidiary. As part of the consideration for the transaction, ANC paid cash of $15 million and issued a secured promissory note (the “note”) in the principal amount of $90 million. The acquisition of the noncontrolling interest in ANC was accounted for as an equity transaction (see Note 19, “Income Taxes,” to the Consolidated Financial Statements for additional information).transaction. On June 30, 2011, the note, including accrued interest, was repaid with cash in full by AbiBowResolute FP US Inc. on our behalf (see Note E, “Transactions with Related Parties”).
Financial covenants
The 2018 Notes and the ABL Credit Facility impose restrictions on the ability of certain subsidiaries to transfer funds or other assets to AbitibiBowaterus in the form of dividends or advances. These restrictions could affect AbitibiBowater’sour operations or itsour ability to pay dividends in the future.
Note E. Transactions with Related Parties
On May 12,Notes and interest payable to subsidiaries
In 2008, we contributed to Bowater, as additional paid-in capital,Resolute FP US Inc. a 12.5% promissory note in the amount of $650 million due June 30, 2013, executed by us in favor of Bowater and on May 15, 2008, Bowater transferredResolute FP US Inc. in exchange for the ownership interest it held in Bowater Newsprint South LLC to us. In 2009, pre-petition interest on the note was $24 million and was included in “Interest expense” in our Condensed Statementsone of Operations and Retained Earnings (Deficit). During the Creditor Protection Proceedings, we ceased accruing interest on the note.its subsidiaries. Upon emergence from the Creditor Protection Proceedings, the liability for the note and accrued interest was retained by us as it was management’s intention that Bowater willResolute FP US Inc. would dividend this note to us. Asus and, as permitted under the Plans of Reorganization, we intended to allow Bowater’sResolute FP US Inc.’s claim including all accrued interest and therefore, the amount of this dividend would include post-petition accrued interest on the note. As a result,Since we had ceased accruing interest on the note during the Creditor Protection Proceedings, in 2010, we recorded catch-up interest on the note of $139$167 million, of which $134$161 million (through the Emergence Date) and $5$6 million (subsequent to the Emergence Date and through December 31, 2010) is included in “Reorganization items, net” and “Interest expense,” respectively, in our Condensed Statements of OperationsOperations. In 2012 and Retained Earnings (Deficit). In 2011, we recorded interest on the note of $81$127 million and $115 million, respectively, which is included in “Interest expense” in our Condensed Statements of OperationsOperations. As of December 31, 2012 and Retained Earnings (Deficit).2011, the outstanding balance of the note and accrued interest on the note totaled $332 million and $1,010 million, respectively, and approximated fair value and was included in “Notes and interest payable to subsidiaries” in our Condensed Balance Sheets. On December 20, 2012, we completed a series of internal transactions with our subsidiaries, Resolute FP US Inc. and Resolute FP Canada Inc. These transactions involved cash transfers related to capital reductions, the issuance of intercompany notes, and the partial repayment of existing intercompany obligations. As a result of these transactions, we reduced both our obligation to Resolute FP US Inc. and our paid-in capital in Resolute FP Canada Inc. by $805 million.
In 2008, AbitibiBowater US Holding LLC (“Holding”), a subsidiary of ours, entered into a 13.75% promissory note payable to Donohue in the amount of $139 million due March 31, 2013. On the Emergence Date, we assumed, by merger with Holding, its obligations with respect to this promissory note. In 2012, 2011 and 2010, we recorded interest on the note of $32 million, $29 million and $2 million, respectively, which is included in “Interest expense” in our Statements of Operations. As of December 31, 2012 and 2011, the outstanding balance of the note and accrued interest on the note totaled $261 million and $228 million, respectively, and approximated fair value and was included in “Notes and interest payable to subsidiaries” in our Condensed Balance Sheets.
AbitibiBowaterNote receivable from a subsidiary
On December 9, 2010, Resolute FP Canada Inc. entered into a promissory note payable to us in the amount of $250 million, bearing interest at the Applicable Federal Rate set forth by the Internal Revenue Service for obligations of this type, due on demand by us. Interest recorded on the note was less than $1 million in each of 2012, 2011 and 2010, and is included in “Other income (expense),
F- 6
Resolute Forest Products Inc.
(Parent Company Only)
Notes to Condensed Financial Statements
net” in our Statements of Operations. As of both December 31, 20112012 and 2010,2011, the outstanding balance of the note and accrued interest on the note totaled $945$41 million and $864 million, respectively, and approximated fair value and was classified asincluded in “Note and interest payable toreceivable from a subsidiary” in our Condensed Balance Sheets.
On April 1, 2008, a former subsidiaryEquity
In connection with our acquisition of ours transferred all of the outstanding common and preferred stock of Donohue to AbitibiBowater US Holding LLC (“Holding”)Fibrek, Resolute FP Canada Inc., a direct subsidiary of ours, for a combination of notes issued or assumed by Holding. As part of this transaction, we loaned Holding $350paid us $43 million which was the amount of the proceeds from our issuance of the pre-petition convertible notes, and this note receivable was due on March 31, 2013. In 2009, pre-petition interest on the note was $13 million and was included in “Other income (expense), net”2012 in our Condensed Statements of Operations and Retained Earnings (Deficit). However, Holding was also a debtor in the Creditor Protection Proceedings and since the note and accrued interest were subject to compromise by Holding, in 2009, we recorded a reserveexchange for the entire outstanding balance of the note and accrued interest of $3783.3 million which was included in “Reserve for receivables from subsidiaries” in our Condensed Statements of Operations and Retained Earnings (Deficit). Upon emergence from the Creditor Protection Proceedings, the entire amount outstanding was compromised and Holding’s obligations were discharged. Accordingly, we are not entitled to any recovery.
Someshares of our subsidiaries provide certain corporate administrative services oncommon stock that were distributed to Fibrek’s shareholders as partial consideration for the Fibrek shares purchased by Resolute FP Canada Inc.
On May 22, 2012, our behalf and certainBoard of Directors approved a share repurchase program of up to 10% of our subsidiaries, including legal, finance, tax, risk management, IT, executive management, payroll and employee benefits. As such, these subsidiaries have charged uscommon stock, for an aggregate purchase price of up to $100 million. In 2012, we repurchased 5,610,152 shares at a portioncost of their general and administrative expenses, based on specific identification or on an appropriate allocation key (e.g., sales, purchases, headcount, etc.) determined by the type$67 million. The repurchases of expense or department. During the years ended December 31, 2011, 2010 and 2009, these subsidiaries charged us $23 million, $27 million and $23 million, respectively, for certain corporate administrative expenses, whichshares were recorded in “Selling, general and administrative expenses” in our Condensed Statements of Operations and Retained Earnings (Deficit).
As discussed in Note D, “Financing Arrangements,” in 2011, AbiBow US Inc. paid on our behalf $264 million of principal amount of the 2018 Notes plus the redemption premiums (approximately $10 million) and all interest on the notes (approximately $85 million). Additionally, in 2011, AbiBow US Inc. paid on our behalf $90 million of principal amount of the ANC promissory note plus $2 million of interest on the note. In 2010, Bowater paid on our behalf $45 million relating to reorganization items, which were comprised of: (i) the backstop commitment agreement termination fee of $15 million discussed above, (ii) the exit financing costs of $27 million discussed above and (iii) other professional fees of $3 million.
In prior years, AbitibiBowater had recorded a $32 million intercompany receivable for a tax benefit it recorded that was used to offset the current income tax liability of its U.S. subsidiaries with which it filed a consolidated U.S. income tax return. Since this intercompany receivable was due from subsidiaries that were also debtors in the Creditor Protection Proceedings and was subject to compromisefunded by our subsidiaries in 2009, we recorded a reserve for the entire balance of this intercompany receivable, which was included in “Reserve for receivables($51 million from subsidiaries” in our Condensed Statements of OperationsResolute FP US Inc. and Retained Earnings (Deficit). Upon emergence$16 million from the Creditor Protection Proceedings, our debtor subsidiaries retained these liabilities. Accordingly, in 2010, we reversed the “Reserve for receivables from subsidiaries” in our Condensed Statements of Operations and Retained Earnings (Deficit) and reinstated this receivable to “Accounts receivable from subsidiaries” in our Condensed Balance Sheets as of December 31, 2010. Additionally, in 2011 and 2010, AbitibiBowater recorded a tax benefit of $63 million and $8 million, respectively, which will be used to offset the current income tax liability of its U.S. subsidiaries with which it files a consolidated U.S. income tax return; accordingly, we have recorded these amounts through intercompany.Resolute FP Canada Inc.).
On December 31, 2010, AbitibiBowaterwe issued 17,010,728 shares of unregistered common stock to Donohue as part of an internal tax restructuring contemplated by the Plans of Reorganization. The shares were issued to Donohue in exchange for all of the outstanding shares of common stock of two of Donohue’s wholly-owned subsidiaries (each of which also was an indirect wholly-owned subsidiary of ours), which have a fair value of $335 million. We recorded the issuance of these shares in additional paid-in capital in our Condensed Balance Sheets. The issuance of the shares to Donohue was made without registration under the Securities Act in reliance on the exemption from registration provided under section 4(2) thereof.
Other
Some of our subsidiaries provide certain corporate administrative services on our behalf and certain of our subsidiaries, including legal, finance, tax, risk management, IT, executive management, payroll and employee benefits. As such, these subsidiaries have charged us a portion of their general and administrative expenses, based on specific identification or on an appropriate allocation key (e.g., sales, purchases, headcount, etc.) determined by the type of expense or department. In 2012, 2011 and 2010, these subsidiaries charged us $17 million, $23 million and $27 million, respectively, for certain corporate administrative expenses, which were recorded in “Selling, general and administrative expenses” in our Statements of Operations.
As discussed in Note D, “Financing Arrangements,” in 2012 and 2011, Resolute FP US Inc. paid on our behalf $85 million and $264 million, respectively, of principal amount of the 2018 Notes plus the redemption premiums (approximately $3 million and $10 million, respectively) and all interest on the notes (approximately $60 million and $85 million, respectively). Additionally, in 2011, Resolute FP US Inc. paid on our behalf $90 million of principal amount of the ANC promissory note plus $2 million of interest on the note. In 2010, Resolute FP US Inc. paid on our behalf $45 million relating to reorganization items, which were comprised of: (i) the backstop commitment agreement termination fee of $15 million discussed above, (ii) the exit financing costs of $27 million discussed above and (iii) other professional fees of $3 million.
In prior years, we had recorded a $32 million intercompany receivable for a tax benefit we recorded that was used to offset the current income tax liability of our U.S. subsidiaries with which we filed a consolidated U.S. income tax return. Since this intercompany receivable was due from subsidiaries that were also debtors in the Creditor Protection Proceedings and was subject to compromise by our subsidiaries, in 2009, we recorded a reserve for the entire balance of this intercompany receivable. Upon emergence from the Creditor Protection Proceedings, our debtor subsidiaries retained these liabilities. Accordingly, in 2010, we reversed this reserve in “Reserve for receivables from subsidiaries” in our Statements of Operations. Additionally, in 2012, 2011 and 2010, we recorded a tax benefit of $84 million, $85 million and $8 million, respectively, which will be used to offset the current income tax liability of our U.S. subsidiaries with which we file a consolidated U.S. income tax return; accordingly, we have recorded these amounts through intercompany.
As part of the agreements that AbiBowResolute FP Canada Inc. entered into with the provinces of Quebec and Ontario for funding relief with respect to aggregate solvency deficits in its material Canadian registered pension plans, AbiBowResolute FP Canada Inc. agreed to a number of undertakings, one of which is a restriction on the payment of dividends to us. For additional information, see Note 18, “Pension and Other Postretirement Benefit Plans – Canadian pension funding, relief,” to the Consolidated Financial Statements.
F- 7
EXHIBIT INDEX
Exhibit No. | Description | |
| 2.1* | Sanction Order, dated September 23, 2010 (incorporated by reference from Exhibit 2.1 of AbitibiBowater Inc.’s Current Report on Form 8-K filed November 30, 2010, SEC File No. 001-33776). | |
2.2* | Confirmation Order, dated November 23, 2010, which includes theDebtors’ Second Amended Joint Plan of Reorganization under Chapter 11 of the Bankruptcy Code, dated November 16, 2010 (as amended) (incorporated by reference from Exhibit 2.2 of AbitibiBowater Inc.’s Current Report on Form 8-K filed November 30, 2010, SEC File No. 001-33776). | |
2.3* | CCAA Plan of Reorganization and Compromise, dated August 2, 2010 (incorporated by reference from Exhibit 99.2 to AbitibiBowater Inc.’s Current Report on Form 8-K filed August 5, 2010, SEC File No. 001-33776). | |
| ||
| 3.1** | Amended and Restated Certificate of Incorporation of AbitibiBowater Inc. | |
3.2* | Third Amended and Restated By-laws of AbitibiBowater Inc. (incorporated by reference from Exhibit 3(ii) to AbitibiBowater Inc.’s Form 8-A filed on December 9, 2010). | |
4.1* | ||
| ||
| ||
|
| |
| Secured Promissory Note, dated January 14, 2011, made by Augusta Newsprint Company LLC in favor of Woodbridge International Holdings Limited (incorporated by reference from Exhibit 4.4 to AbitibiBowater Inc.’s Annual Report on Form 10-K for the year ended December 31, 2010 filed April 5, 2011, SEC File No. 001-33776). | |
| Amended and Restated Indenture, dated as of May 12, 2011, among AbitibiBowater Inc., each of the guarantors from time to time party hereto, as guarantors, and Wells Fargo Bank, National Association, as trustee and as collateral agent (incorporated by reference from Exhibit 4.1 to AbitibiBowater Inc.’s Quarterly Report on Form 10-Q for the quarter ended March 31, 2011 filed May 16, 2011, SEC File No. 001-33776). | |
4.3* | Form of 10.25% Senior Note due 2018 (included in Exhibit 4.1 to AbitibiBowater Inc.’s Quarterly Report on Form 10-Q for the quarter ended March 31, 2011 filed May 16, 2011, SEC File No. 001-33776). | |
| 4.4* | Second Supplemental Indenture, dated as of March 9, 2012, among AbitibiBowater Inc., the guarantors party thereto and Wells Fargo Bank, National Association, as trustee (incorporated by reference from Exhibit 4.1 to AbitibiBowater Inc.’s Quarterly Report on Form 10-Q for the quarter ended March 31, 2012 filed May 10, 2012, SEC File No. 001-33776). | |
| 10.1* | ABL Credit Agreement, dated as of December 9, 2010, among AbitibiBowater Inc., Bowater Incorporated, Abitibi-Consolidated Corp., Abitibi-Consolidated Inc., Barclays Bank PLC, JPMorgan Chase Bank, N.A., and Citibank, N.A., as administrative agent and collateral agent (incorporated by reference from Exhibit 10.1 to AbitibiBowater Inc.’s Current Report on Form 8-K filed December 15, 2010, SEC File No. 001-33776). | |
10.2* | Stock Purchase Agreement, dated as of December 23, 2010, among Woodbridge International Holdings Limited, The Woodbridge Company Limited, Abitibi Consolidated Sales Corporation, AbitibiBowater Inc., Augusta Newsprint Company and Augusta Newsprint Inc. (incorporated by reference from Exhibit 10.2 to AbitibiBowater Inc.’s Annual Report on Form 10-K for the year ended December 31, 2010 filed April 5, 2011, SEC File No. 001-33776). | |
Exhibit No. | Description | |
10.3* | Securities Purchase Agreement, dated February 11, 2011, among AbiBow Canada Inc., Caisse de depot et placement du Quebec and CDP Investissements Inc., as vendors, and Infra H2O GP Partners Inc., Infra H2O LP Partners Inc. and BluEarth Renewables Inc., as the purchaser (incorporated by reference from Exhibit 2.1 to AbitibiBowater Inc.’s Current Report on Form 8-K filed February 17, 2011, SEC File No. 001-33776). | |
†10.4* | AbitibiBowater 2010 Canadian DB Supplemental Executive Retirement Plan, effective as of December 9, 2010 (incorporated by reference from Exhibit 10.4 to AbitibiBowater Inc.’s Annual Report on Form 10-K for the year ended December 31, 2010 filed April 5, 2011, SEC File No. 001-33776). | |
†10.5* | AbitibiBowater 2010 DC Supplemental Executive Retirement Plan, effective as of December 9, 2010 (incorporated by reference from Exhibit 10.5 to AbitibiBowater Inc.’s Annual Report on Form 10-K for the year ended December 31, 2010 filed April 5, 2011, SEC File No. 001-33776). | |
†10.6* | ||
| ||
| AbitibiBowater Inc. 2010 Equity Incentive Plan Form of Restricted Stock Unit Agreement (incorporated by reference from Exhibit 10.2 to AbitibiBowater Inc.’s Registration Statement on Form S-8 filed January 7, 2011, SEC Registration No. 333-171602). | |
† | AbitibiBowater Inc. 2010 Equity Incentive Plan Form of Director Nonqualified Stock Option Agreement (incorporated by reference from Exhibit 10.3 to AbitibiBowater Inc.’s Registration Statement on Form S-8 filed January 7, 2011, SEC Registration No. 333-171602). | |
† | AbitibiBowater Inc. 2010 Equity Incentive Plan Form of Employee Nonqualified Stock Option Agreement (incorporated by reference from Exhibit 10.4 to AbitibiBowater Inc.’s Registration Statement on Form S-8 filed January 7, 2011, SEC Registration No. 333-171602). | |
|
| ||
† | AbitibiBowater Inc. 2010 Equity Incentive Plan Form of | ||
† | AbitibiBowater Inc. 2010 Equity Incentive Plan Form of | ||
† | |||
| |||
| AbitibiBowater Executive Restricted Stock Unit Plan, effective as of April 1, 2011 (incorporated by reference from Exhibit 10.13 to AbitibiBowater Inc.’s Annual Report on Form 10-K for the year ended December 31, 2010 filed April 5, 2011, SEC File No. 001-33776). | ||
† | 2011 AbitibiBowater Inc. Short-Term Incentive | ||
† | Summary of 2012 AbitibiBowater Inc. Short-Term Incentive | ||
| |||
| |||
† | |||
| |||
| |||
| |||
| |||
| |||
| Offer Letter between Yves Laflamme and AbitibiBowater Inc., dated October 26, 2010 (incorporated by reference from Exhibit 10.23 to AbitibiBowater Inc.’s Annual Report on Form 10-K for the year ended December 31, 2010 filed April 5, 2011, SEC File No. 001-33776). | ||
† | Employment Agreement between Yves Laflamme and AbitibiBowater Inc., dated February 14, 2011 (incorporated by reference from Exhibit 10.2 to AbitibiBowater Inc.’s Current Report on Form 8-K filed February 18, 2011, SEC File No. 001-33776). | ||
|
| |
|
| |
† | Executive Employment Agreement between AbitibiBowater Inc. and Richard Garneau, dated January 1, 2011 (incorporated by reference from Exhibit 10.26 to AbitibiBowater Inc.’s Annual Report on Form 10-K for the year ended December 31, 2010 filed April 5, 2011, SEC File No. 001-33776). | |
Exhibit No. | Description | |
† | Change in Control Agreement between AbitibiBowater Inc. and Richard Garneau, dated January 1, 2011 (incorporated by reference from Exhibit 10.27 to AbitibiBowater Inc.’s Annual Report on Form 10-K for the year ended December 31, 2010 filed April 5, 2011, SEC File No. 001-33776). | |
† | Employment Agreement between Alain Boivin and AbitibiBowater Inc., dated February 22, 2011 (incorporated by reference from Exhibit 10.28 to AbitibiBowater Inc.’s Annual Report on Form 10-K for the year ended December 31, 2010 filed April 5, 2011, SEC File No. 001-33776). | |
† | Offer Letter between John Lafave and AbitibiBowater Inc., dated February 14, 2011 (incorporated by reference from Exhibit 10.29 to AbitibiBowater Inc.’s Annual Report on Form 10-K for the year ended December 31, 2010 filed April 5, 2011, SEC File No. 001-33776). | |
† | Offer Letter between Jo-Ann Longworth and AbitibiBowater Inc., dated July 25, 2011 (incorporated by reference from Exhibit 10.2 to AbitibiBowater Inc.’s Quarterly Report on Form 10-Q for the quarter ended September 30, 2011 filed November 14, 2011, SEC File No. 001-33776). | |
† |
| |
| Offer Letter between Pierre Laberge and AbitibiBowater Inc., dated June 9, | |
† | Director compensation program | |
† |
| |
|
| |
| Retirement Compensation Trust Agreement (with Letter of Credit) between AbiBow Canada Inc. and | |
† | Agreement Concerning the Pulp and Paper Operations of AbiBow Canada in Ontario, dated November 10, 2010, between Bowater Canadian Forest Products Inc. and Abitibi-Consolidated Company of Canada and The Province of Ontario (incorporated by reference from Exhibit 10.32 to AbitibiBowater Inc.’s Annual Report on Form 10-K for the year ended December 31, 2010 filed April 5, 2011, SEC File No. 001-33776). | |
† | Agreement Concerning the Pulp and Paper Operations of AbiBow Canada in Quebec, dated September 13, 2010, between Bowater Canadian Forest Products Inc. and Abitibi-Consolidated Company of Canada and The Government of Quebec (incorporated by reference from Exhibit 10.33 to AbitibiBowater Inc.’s Annual Report on Form 10-K for the year ended December 31, 2010 filed April 5, 2011, SEC File No. 001-33776). | |
|
| ||
| Settlement Agreement, dated as of August 24, 2010, between AbitibiBowater Inc., Abitibi-Consolidated Company of Canada, Abitibi-Consolidated Inc. and AbitibiBowater Canada Inc. and The Government of Canada (incorporated by reference from Exhibit 10.1 to AbitibiBowater Inc.’s Quarterly Report on Form 10-Q filed for the quarter ended September 30, 2010, SEC File No. 001-33776). | ||
| Amendment No. 1, dated as of April 28, 2011, to the ABL Credit Agreement, dated as of December 9, 2010, among AbitibiBowater Inc., the subsidiaries of AbitibiBowater party thereto, the lenders party thereto from time to time and Citibank, N.A., as administrative agent and collateral agent (incorporated by reference from Exhibit 10.1 to AbitibiBowater Inc.’s Quarterly Report on Form 10-Q for the quarter ended March 31, 2011 filed May 16, 2011, SEC File No. 001-33776). | ||
| Amendment No. 2, dated October 28, 2011, to ABL Credit Agreement, dated as of December 9, 2010, among AbitibiBowater Inc., AbiBow US Inc. (f/k/a Bowater Incorporated) and AbiBow Recycling LLC (f/k/a Abitibi-Consolidated Corp.) and AbiBow Canada Inc. (f/k/a Abitibi-Consolidated Inc.), and Citibank, N.A., as administrative agent and collateral agent (incorporated by reference from Exhibit 10.1 to AbitibiBowater Inc.’s Current Report on Form 8-K filed October 31, 2011, SEC File No. 001-33776). | ||
| Lock-up Agreement between AbitibiBowater Inc. and Fairfax Financial Holdings Limited, dated as of November 28, 2011 (incorporated by reference from Exhibit 10.1 to AbitibiBowater Inc.’s Current Report on Form 8-K filed November 29, 2011, SEC File No. 001-33776). | ||
| Lock-up Agreement between AbitibiBowater Inc. and Oakmont Capital Inc., dated as of November 28, 2011 (incorporated by reference from Exhibit 10.2 to AbitibiBowater Inc.’s Current Report on Form 8-K filed November 29, 2011, SEC File No. 001-33776). | ||
Exhibit No. | Description | |
| Lock-up Agreement between AbitibiBowater Inc. and Dalal Street, LLC, dated as of November 28, 2011 (incorporated by reference from Exhibit 10.3 to AbitibiBowater Inc.’s Current Report on Form 8-K filed November 29, 2011, SEC File No. 001-33776). | |
| †10.32* | 2012 AbitibiBowater Inc. Short-Term Incentive Plan (incorporated by reference from Exhibit 10.1 to AbitibiBowater Inc.’s Quarterly Report on Form 10-Q for the quarter ended March 31, 2012 filed May 10, 2012, SEC File No. 001-33776). | |
| †10.33* | Offer Letter between Jacques Vachon and AbitibiBowater Inc., dated March 19, 2012 (incorporated by reference from Exhibit 10.2 to AbitibiBowater Inc.’s Quarterly Report on Form 10-Q for the quarter ended March 31, 2012 filed May 10, 2012, SEC File No. 001-33776). | |
| †10.34* | Resolute Forest Products DC Make-up Program, effective January 1, 2012 (incorporated by reference from Exhibit 10.3 to AbitibiBowater Inc.’s Quarterly Report on Form 10-Q for the quarter ended March 31, 2012 filed May 10, 2012, SEC File No. 001-33776). | |
| 10.35* | Waiver and Amendment No. 3, dated as of March 21, 2012, under and to the ABL Credit Agreement, dated as of December 9, 2010, among AbitibiBowater Inc., the subsidiaries of AbitibiBowater party thereto, the lenders party thereto from time to time and Citibank, N.A., as administrative agent and collateral agent (incorporated by reference from Exhibit 10.4 to AbitibiBowater Inc.’s Quarterly Report on Form 10-Q for the quarter ended March 31, 2012 filed May 10, 2012, SEC File No. 001-33776). | |
| †10.36* | Resolute Forest Products Inc. Severance Policy – Chief Executive Officer and Direct Reports, effective as of August 1, 2012 (incorporated by reference from Exhibit 10.1 to Resolute Forest Products Inc.’s Quarterly Report on Form 10-Q for the quarter ended June 30, 2012 filed August 9, 2012, SEC File No. 001-33776). | |
| †10.37* | First Amendment to the AbitibiBowater 2010 DC Supplemental Executive Retirement Plan, effective as of December 31, 2011 (incorporated by reference from Exhibit 10.1 to Resolute Forest Products Inc.’s Quarterly Report on Form 10-Q for the quarter ended September 30, 2012 filed November 9, 2012, SEC File No. 001-33776). | |
| †10.38* | Resolute Forest Products Equity Incentive Plan (previously named the AbitibiBowater Inc. 2010 Equity Incentive Plan), effective as of December 9, 2010 (incorporated by reference from Exhibit 10.2 to Resolute Forest Products Inc.’s Quarterly Report on Form 10-Q for the quarter ended September 30, 2012 filed November 9, 2012, SEC File No. 001-33776). | |
| †10.39* | Resolute Forest Products Outside Director Deferred Compensation Plan (previously named the AbitibiBowater Inc. Outside Director Deferred Compensation Plan), effective as of April 1, 2011 (incorporated by reference from Exhibit 10.3 to Resolute Forest Products Inc.’s Quarterly Report on Form 10-Q for the quarter ended September 30, 2012 filed November 9, 2012, SEC File No. 001-33776). | |
| †10.40* | Summary of 2013 Resolute Forest Products Inc. Short-Term Incentive Plan (incorporated by reference from Exhibit 10.1 to Resolute Forest Products Inc.’s Current Report on Form 8-K filed February 28, 2013, SEC File No. 001-33776). | |
| †10.41** | Form of Indemnification Agreement for Directors and Officers of Resolute Forest Products Inc. | |
Exhibit No. | Description | |
†10.42** | AbiBow Canada Inc. and AbitibiBowater Inc. Security Protocol with respect to the AbitibiBowater 2010 Canadian DB Supplemental Executive Retirement Plan and the AbiBow Canada SERP, amended and restated effective April 1, 2012. | |
| 12.1** | Computation of Ratio of Earnings to Fixed Charges. | |
21.1** | Subsidiaries of the registrant. | |
23.1** | Consent of PricewaterhouseCoopers LLP. | |
24.1** | Power of attorney for certain Directors of the registrant. | |
31.1** | Certification of President and Chief Executive Officer Pursuant to Section 302 of the Sarbanes-Oxley Act of 2002. | |
31.2** | Certification of Senior Vice President and Chief Financial Officer Pursuant to Section 302 of the Sarbanes-Oxley Act of 2002. | |
|
| ||
32.1** | Certification of President and Chief Executive Officer Pursuant to Section 906 of the Sarbanes-Oxley Act of 2002. | ||
32.2** | Certification of Senior Vice President and Chief Financial Officer Pursuant to Section 906 of the Sarbanes-Oxley Act of 2002. | ||
| XBRL Instance Document. | ||
| XBRL Taxonomy Extension Schema Document. | ||
| XBRL Taxonomy Extension Calculation Linkbase Document. | ||
| XBRL Taxonomy Extension Label Linkbase Document. | ||
| XBRL Taxonomy Extension Presentation Linkbase Document. | ||
| XBRL Taxonomy Extension Definition Linkbase Document. | ||
| * | Previously filed and incorporated herein by reference. |
| † | This is a management contract or compensatory plan or arrangement. |
| ** |
6