
| Florida | 59-0324412 | |
| (State of Incorporation) | (I.R.S. Employer Identification No.) | |
| 3300 Publix Corporate Parkway | ||
| Lakeland, Florida | 33811 | |
| (Address of principal executive offices) | (Zip code) | |
months.
(X)
Large accelerated filer | Accelerated filer | Non-accelerated filer X | Smaller reporting company | |||
15, 2014.
| |||||||||
Item | |||||||||
| Item 1A. | |||||||||
Item 1B. | |||||||||
| Item 2. | |||||||||
Item | |||||||||
| |||||||||
Item 4. | |||||||||
Item 5. | |||||||||
Item 6. | |||||||||
Item 7. | |||||||||
Item 7A. | |||||||||
Item 8. | |||||||||
Item 9. | |||||||||
| Item 9A. | |||||||||
| Item 9B. | |||||||||
| |||||||||
| |||||||||
Item 10. | |||||||||
| Item 11. | |||||||||
| |||||||||
Item 12. | |||||||||
Item 13. | |||||||||
Item 14. | |||||||||
Item 15. | |||||||||
Grocery Other Tennessee and one in Alabama. 2014. assumptions or a catastrophic event involving property, plant and equipment losses. Name Business Experience During Last Five Years Served as Officer of Company John A. Attaway, Jr. Senior Vice President, General Counsel and Secretary of the Company. Hoyt R. Barnett Vice Chairman of the Company and Trustee of the Employee Stock Ownership Plan. David E. Bornmann Vice President of the Company. David E. Bridges Vice President of the Company. Scott E. Brubaker Vice President of the Company. Jeffrey G. Chamberlain Director of Real Estate Strategy of the Company to January 2011, Vice President thereafter. William E. Crenshaw President of the Company to March 2008, Chief Executive Officer thereafter. Joseph DiBenedetto, Jr. Regional Director of Retail Operations of the Company to January 2011, Vice President thereafter. G. Gino DiGrazia Vice President and Controller of the Company. Laurie Z. Douglas Senior Vice President and Chief Information Officer of the Company. David S. Duncan Vice President of the Company. Sandra J. Estep Vice President and Controller of the Company. William V. Fauerbach Vice President of the Company. Linda S. Hall Vice President of the Company. M. Clayton Hollis, Jr. Vice President of the Company. John T. Hrabusa Senior Vice President of the Company. Mark R. Irby Vice President of the Company. Randall T. Jones, Sr. Senior Vice President of the Company to March 2008, President thereafter. Linda S. Kane Vice President and Assistant Secretary of the Company. Thomas M. McLaughlin Vice President of the Company. Dale S. Myers Vice President of the Company. Alfred J. Ottolino Vice President of the Company. David P. Phillips Chief Financial Officer and Treasurer of the Company. Charles B. Roskovich, Jr. Regional Director of Retail Operations of the Company to January 2008, Vice President to January 2011, Senior Vice President thereafter. Marc H. Salm Director and Counsel of Risk Management of the Company to June 2008, Vice President thereafter. Richard J. Schuler II Vice President of the Company. Michael R. Smith Vice President of the Company. William V. Fauerbach and Richard J. Schuler II are effective March 31, 2014 and May 2, 2014, respectively. 2011 2010 January - February March - April May - July August - October November - December Total Number of Period Purchased Share Programs (1) Programs (1) September 25, 2011 through October 29, 2011 October 30, 2011 through November 26, 2011 November 27, 2011 through December 31, 2011 Total Sales: Sales Percent change Comparable store sales percent change Earnings: Gross profit(2) Earnings before income tax expense Net earnings Net earnings as a percent of sales Common stock: Weighted average shares outstanding Basic and diluted earnings per share Cash dividends per share Financial data: Capital expenditures Working capital Current ratio Total assets Long-term debt (including current portion) Common stock related to ESOP Total equity Supermarkets site in subsequent periods and one supermarket will not be replaced. dividend payments. the dividends paid in 2013 as compared with 2012. 2013 were less than in 2012. Payments Due by Period Total 2012 2014 2016 after Contractual obligations: Operating leases(1) Purchase obligations(2)(3)(4) Other long-term liabilities: Self-insurance reserves(5) Accrued postretirement benefit cost(6) Long-term debt(7) Other Total 28, 2013: cash flows. Inventories are valued at the lower of cost or market. The cost for 84% 2013. Consolidated Balance Sheets – December 2011 2010 Current assets: Cash and cash equivalents Short-term investments Trade receivables Merchandise inventories Deferred tax assets Prepaid expenses Total current assets Long-term investments Other noncurrent assets Property, plant and equipment: Land Buildings and improvements Furniture, fixtures and equipment Leasehold improvements Construction in progress Accumulated depreciation Net property, plant and equipment 2011 2010 Current liabilities: Accounts payable Accrued expenses: Contribution to retirement plans Self-insurance reserves Salaries and wages Other Current portion of long-term debt Federal and state income taxes Total current liabilities Deferred tax liabilities Self-insurance reserves Accrued postretirement benefit cost Long-term debt Other noncurrent liabilities Total liabilities Common stock related to Employee Stock Ownership Plan (ESOP) Stockholders’ equity: Common stock of $1 par value. Authorized 1,000,000 shares; issued and outstanding 779,675 shares in 2011 and 780,969 shares in 2010 Additional paid-in capital Retained earnings Accumulated other comprehensive earnings Common stock related to ESOP Total stockholders’ equity Noncontrolling interests Total equity Commitments and contingencies 2011 2010 2009 Revenues: Sales Other operating income Total revenues Costs and expenses: Cost of merchandise sold Operating and administrative expenses Total costs and expenses 25,043,839 Operating profit Investment income Other-than-temporary impairment losses Investment income, net Other income, net Earnings before income tax expense Income tax expense Net earnings Weighted average shares outstanding Basic and diluted earnings per share 2011 2010 2009 Net earnings Other comprehensive (losses) earnings: Unrealized gain on available-for-sale (AFS) securities, net of tax effect of $6,324, $8,251 and $33,777 in 2011, 2010 and 2009, respectively Reclassification adjustment for net realized (gain) loss on AFS securities, net of tax effect of ($7,684), ($9,473) and $2,628 in 2011, 2010 and 2009, respectively Adjustment to postretirement benefit plan obligation, net of tax effect of ($3,655), ($1,913) and ($1,246) in 2011, 2010 and 2009, respectively Comprehensive earnings 2011 2010 2009 Cash flows from operating activities: Cash received from customers Cash paid to employees and suppliers Income taxes paid Self-insured claims paid Dividends and interest received Other operating cash receipts Other operating cash payments Net cash provided by operating activities Cash flows from investing activities: Payment for property, plant and equipment Proceeds from sale of property, plant and equipment Payment for investments Proceeds from sale and maturity of investments Net cash used in investing activities Cash flows from financing activities: Payment for acquisition of common stock Proceeds from sale of common stock Dividends paid Repayments of long-term debt Other, net Net cash used in financing activities Net (decrease) increase in cash and cash equivalents Cash and cash equivalents at beginning of year Cash and cash equivalents at end of year 2011 2010 2009 Reconciliation of net earnings to net cash provided by operating activities: Net earnings Adjustments to reconcile net earnings to net cash provided by operating activities: Depreciation and amortization Retirement contributions paid or payable in common stock Deferred income taxes Loss on disposal and impairment of property, plant and equipment (Gain) loss on AFS securities Net amortization of investments Change in operating assets and liabilities providing (requiring) cash: Trade receivables Merchandise inventories Prepaid expenses and other noncurrent assets Accounts payable and accrued expenses Self-insurance reserves Federal and state income taxes Other noncurrent liabilities Total adjustments Net cash provided by operating activities Common Stock Common Stock (Acquired from) Sold to Stock- holders Accumulated Other Comprehensive Earnings (Losses) Common Stock Related to ESOP Total Stock- holders’ Equity Balances at December 27, 2008 Comprehensive earnings Cash dividends, $0.41 per share Contribution of 15,013 shares to retirement plans Acquired 37,895 shares from stockholders Sale of 9,482 shares to stockholders Retirement of 16,929 shares Change for ESOP related shares Balances at December 26, 2009 Comprehensive earnings Cash dividends, $0.46 per share Contribution of 14,363 shares to retirement plans Acquired 23,731 shares from stockholders Sale of 9,771 shares to stockholders Retirement of 14,820 shares Change for ESOP related shares Balances at December 25, 2010 Comprehensive earnings Cash dividends, $0.53 per share Contribution of 12,508 shares to retirement plans Acquired 23,513 shares from stockholders Sale of 9,711 shares to stockholders Retirement of 14,278 shares Change for ESOP related shares Balances at December 31, 2011 Business Principles of Consolidation Fiscal Year Cash Equivalents Trade Receivables Inventories Investments Property, Plant and Equipment and Depreciation 10 – 40 years Furniture, fixtures and equipment 3 – 20 years Capitalized Computer Software Costs Long-Lived Assets Self-Insurance Comprehensive Earnings Revenue Recognition Sales Taxes Other Operating Income Cost of Merchandise Sold Advertising Costs Other Income, net Income Taxes Common Stock and Earnings Per Share Use of Estimates Value Level 1 Level 2 Level 3 December 31, 2011 December 25, 2010 29, 2012: Cost Gains Losses Value 2011 2010 2012: 2011. Due in one year or less Due after one year through five years Due after five years through ten years Due after ten years Restricted investments Equity securities Less Than 12 Months 12 Months or Longer Total Fair Value Unrealized Losses Fair Value Unrealized Losses Fair Value Unrealized Losses (Amounts are in thousands) 2011 Tax exempt bonds Taxable bonds Restricted investments Equity securities Total temporarily impaired AFS securities 2010 Tax exempt bonds Taxable bonds Equity securities Total temporarily impaired AFS securities 29, 2012: fluctuations that are expected to recover. As of December Year 2012 2013 2014 2015 2016 Thereafter The Company provides postretirement life insurance benefits for certain salaried and hourly full-time employees who meet the eligibility requirements. Effective January 1, 2002, the Company amended the retiree life insurance benefit under its Group Life Insurance Plan. To receive the retiree life insurance benefit after the amendment, an employee must have had at least five years of full-time service and the employee’s age plus years of credited service must have equaled 65 or greater as of October 1, 2001. At retirement, such employees also must be at least age 55 with at least 10 years of full-time service to be eligible to receive postretirement life insurance benefits. Change in benefit obligation: Benefit obligation as of beginning of year Service cost Interest cost Actuarial loss Benefit payments Benefit obligation as of end of year Change in fair value of plan assets: Fair value of plan assets as of beginning of year Employer contributions Benefit payments Fair value of plan assets as of end of year Unfunded status of the plan as of end of year Current liability Noncurrent liability Total recognized liability 29, 2012: Year 2012 2013 2014 2015 2016 2017 through 2021 Thereafter Service cost Interest cost Amortization of actuarial losses Net periodic postretirement benefit cost Discount rate Rate of compensation increase Discount rate Rate of compensation increase The Company has a trusteed, noncontributory ESOP for the benefit of eligible employees. The Company recognizes an expense related to the Company’s discretionary contribution to the ESOP based on a percent of net earnings before taxes that is approved by the Board of Directors each year. ESOP contributions can be made in Company common stock or cash. Compensation expense recorded for contributions to this plan was 2011 2010 2009 Earnings Other comprehensive (losses) earnings Current Deferred Total 2011 Federal State 2010 Federal State 2009 Federal State 2011 2010 2009 Federal tax at statutory tax rate State income taxes (net of federal tax benefit) ESOP dividend Other, net 2011 2010 Deferred tax assets: Self-insurance reserves Retirement plan contributions Postretirement benefit cost Reserves not currently deductible Inventory capitalization Advance purchase allowances Other Total deferred tax assets Deferred tax liabilities: Property, plant and equipment, primarily due to depreciation Other Total deferred tax liabilities 29, 2012. The Company conducts a major portion of its retail operations from leased premises. Initial terms of the leases are typically 2011 2010 2009 Minimum rentals Contingent rentals Sublease rental income Year Minimum Rental Commitments Sublease Rental Income 2012 2013 2014 2015 2016 Thereafter As of December Litigation Following is a summary of the quarterly results of operations for First Second Third Fourth 2011 Revenues Costs and expenses Net earnings Basic and diluted earnings per share 2010 Revenues Costs and expenses Net earnings Basic and diluted earnings per share Description Balance at Beginning of Year Additions Charged to Income Deductions From Reserves Balance at End of Year Year ended December 31, 2011 Reserves not deducted from assets: Self-insurance reserves: Current Noncurrent Year ended December 25, 2010 Reserves not deducted from assets: Self-insurance reserves: Current Noncurrent Year ended December 26, 2009 Reserves not deducted from assets: Self-insurance reserves: Current Noncurrent Consolidated Financial Statements and Schedule Composite of the Restated Articles of Incorporation of the Company dated June 25, 1979 as amended by (i) Articles of Amendment dated February 22, 1984, (ii) Articles of Amendment dated June 24, 1992, (iii) Articles of Amendment dated June 4, 1993, and (iv) Articles of Amendment dated April 18, 2006 are incorporated by reference to the exhibits to the Quarterly Report of the Company on Form 10-Q for the quarter ended April 1, 2006. Articles of Amendment of the Restated Articles of Incorporation of the Company dated April 18, 2006 are incorporated by reference to the exhibits to the Quarterly Report of the Company on Form 10-Q for the quarter ended April 1, 2006. Amended and Restated Indemnification Agreement is incorporated by reference to the form attached as an exhibit to the Quarterly Report of the Company on Form 10-Q for the quarter ended March 31, 2001, between the Company and all of its directors and officers as reported in the Company’s Quarterly Reports on Form 10-Q, Annual Reports on Form 10-K and Current Reports on Form 8-K for the periods ended March 31, 2001, June 30, 2001, September 29, 2001, June 29, 2002, December 28, 2002, September 27, 2003, December 27, 2003, March 27, 2004, May 18, 2005, July 1, 2005, January 30, 2006, January 30, 2008, December 22, 2008, April 14, 2009, Incentive Bonus Indemnification Agreement is incorporated by reference to the form attached as an exhibit to the Current Report of the Company on Form 8-K dated December 14, 2011, between the Company and the Trustee of its ESOP, one of the Trustees of its 401(k) SMART Plan and with each member of its 401(k) SMART Plan investment committee. Code of Ethical Conduct for Financial Managers is incorporated by reference to the exhibits to the Annual Report of the Company on Form 10-K for the year ended December 28, 2002. Subsidiaries of the Registrant. Consent of Independent Registered Public Accounting Firm. Certification Pursuant to Section 302 of the Sarbanes-Oxley Act of 2002. Certification Pursuant to Section 302 of the Sarbanes-Oxley Act of 2002. Certification Pursuant to 18 U.S.C. Section 1350, as Adopted Pursuant to Section 906 of the Sarbanes-Oxley Act of 2002. Certification Pursuant to 18 U.S.C. Section 1350, as Adopted Pursuant to Section 906 of the Sarbanes-Oxley Act of 2002. The following financial information from the Company’s Annual Report on Form 10-K for the year ended December /s/ John A. Attaway, Jr. John A. Attaway, Jr. Secretary2011, 20102013, 2012 and 20092011 was as follows: 2011 2010 2009 86% 85% 85% 14% 15% 15% 100% 100% 100% 2013 2012 2011 Grocery 85 % 85 % 86 % Other 15 % 15 % 14 % 100 % 100 % 100 % private labelprivate-label brands as well as unbranded merchandise such as produce, meat and seafood. The Company receives the food and non-food products it distributes from many sources. These products are delivered to the supermarkets through Company distribution centers or directly from the suppliers and are generally available in sufficient quantities to enable the Company to adequately satisfy its customers. Approximately 72%74% of the total cost of products purchased is delivered to the supermarkets through the Company’s distribution centers. The Company believes that its sources of supply of these products and raw materials used in manufacturing are adequate for its needs and that it is not dependent upon a single supplier or relatively few suppliers. Private labelPrivate-label items are produced in the Company’s dairy, bakery and deli manufacturing facilities or are manufactured for the Company by outside suppliers.1,0461,079 supermarkets at the end of 2011,2013, compared with 1,0341,069 at the beginning of the year. In 2011, 292013, 22 supermarkets were opened (including 11seven replacement supermarkets) and 126109 supermarkets were remodeled. SeventeenTwelve supermarkets were closed during the same period. ReplacementThe replacement supermarkets opened in 20112013 replaced 11seven of the 17 supermarkets closed during the same period. FiveFour of the remaining supermarkets closed in 2011 will be replaced in subsequent periods, all of which2013 will be replaced on site. Net newsite in subsequent periods and one supermarket will not be replaced. New supermarkets added 0.60.5 million square feet in 2011,2013, an increase of 1.3%1.0%. At the end of 2011,2013, the Company had 743759 supermarkets located in Florida, 179181 in Georgia, 4955 in Alabama, 4548 in South Carolina and 3036 in Tennessee. Also, as of year end, the Company had 10five supermarkets under construction in Florida, and two each in Alabama, GeorgiaNorth Carolina, South Carolina and Tennessee.2012.20112013 consisted of $2,803.2$3,260.1 million in current assets and $2,050.8$2,378.9 million in current liabilities. Normal operating fluctuations in these balances can result in changes to cash flows from operating activities presented in the consolidated statements of cash flows that are not necessarily indicative of long-term operating trends. There are no unusual industry practices or requirements relating to working capital items.152,000166,000 full-time and part-time employees at the end of 2011, 71,000 on a full-time basis and 81,000 on a part-time basis. By comparison, the Company had 148,000 employees at the end of 2010, 70,000 on a full-time basis and 78,000 on a part-time basis.2013. The Company considers its employee relations to be good.20112013 had no material effect upon capital expenditures, results of operations or the competitive position of the Company.20122014 Proxy Statement will be mailed on or about March 15, 201213, 2014 to stockholders of record as of the close of business on February 7, 2012.4, 2014. These reports as well as Quarterly Reports on Form 10-Q, Current Reports on Form 8-K and any amendments to those reports may also be obtained electronically, free of charge, through the Company’s website at www.publix.com/stock.significant home foreclosures and weakness in the housing market, declines in the stock market and the instability of the credit markets, could continue to cause a reduction in consumer spending. Other conditions that could also affect disposable consumer income include increases in tax rates, increases in fuel and energy costs, increases in health care costs, the impact of natural disasters or acts of terrorism, and other factors. This reduction in the level of consumer spending could cause customers to purchase lower-profitlower-margin items or to shift spending to lower-priced competitors, which could adversely affect the Company’s financial condition and results of operations.existing supermarkets on commercially reasonable terms.property losses, fleet liability, employee benefits and directors and officers liability. The Company is self insured for property, plant and equipment losses. There is no assurance that the Company will be able to continue to maintain its insurance coverage or obtain comparable insurance coverage at a reasonable cost. Self-insurance reserves are determined based on actual claims experience and an estimate of claims incurred but not reported including, where necessary, actuarial studies. Actuarial projections of losses are subject to a high degree of variability caused by, but not limited to, such factors as future interest and inflation rates, future economic conditions, litigation trends and benefit level changes. The Company’s financial condition and results of operations could be adversely affected by an increase in the frequency or costs of claims and changes in actuarial assumptions.a party insubject from time to time to various legallawsuits, claims and actions consideredcharges arising in the normal course of business including labor and employment, personal injury, intellectual propertycommercial and other issues.matters. Some lawsuits also contain class action allegations. The Company estimates its exposure to these legal proceedings and establishes reserves for the estimated liabilities. Assessing and predicting the outcome of these matters involves substantial uncertainties. Although not currently anticipated by management, the results of pendingCompany, material differences in actual outcomes or future legal proceedingschanges in the Company’s evaluation could adversely affectarise that could have a material adverse effect on the Company’s financial condition andor results of operations.UnresolvedStaffUnresolved Staff Comments48.750.3 million square feet of supermarket space. The Company’s supermarkets vary in size. Current supermarket prototypes range from 28,000 to 61,000 square feet. Supermarkets are often located in strip shopping centers where the Company is the anchor tenant. The majority of the Company’s supermarkets are leased. Substantially all of these leases will expire during the next 20 years. However, in the normal course of business, it is expected that the leases will be renewed or replaced by leases on other properties.new leases. Both the building and land are owned at 120143 locations. The building is owned while the land is leased at 4853 other locations.a party insubject from time to time to various legallawsuits, claims and actions consideredcharges arising in the normal course of business. The Company believes its recorded reserves are adequate in light of the probable and estimable liabilities. The estimated amount of reasonably possible losses for lawsuits, claims and charges, individually and in the aggregate, is considered to be immaterial. In the opinion of management, the ultimate resolution of these legal proceedings will not have a material adverse effect on the Company’s financial condition, results of operations or cash flows.NoneExecutive OfficersName Age Business Experience During Last Five Years Executive Officers of the Company John A. Attaway, Jr. 55 Senior Vice President, General Counsel and Secretary of the Company. 2000 Hoyt R. Barnett 70 Vice Chairman of the Company and Trustee of the Employee Stock Ownership Plan. 1977 David E. Bornmann 56 Vice President of the Company to March 2013, Senior Vice President thereafter. 1998 William E. Crenshaw 63 Chief Executive Officer of the Company. 1990 Laurie Z. Douglas 50 Senior Vice President and Chief Information Officer of the Company. 2006 John T. Hrabusa 58 Senior Vice President of the Company. 2004 Randall T. Jones, Sr. 51 President of the Company. 2003 David P. Phillips 54 Chief Financial Officer and Treasurer of the Company. 1990 Michael R. Smith 54 Vice President of the Company to March 2013, Senior Vice President thereafter. 2005 Officers of the Company David E. Bridges 64 Vice President of the Company. 2000 Scott E. Brubaker 55 Vice President of the Company. 2005 Jeffrey G. Chamberlain 57 2011 Joseph DiBenedetto, Jr. 54 2011 G. Gino DiGrazia 51 Vice President of the Company. 2002 David S. Duncan 60 Vice President of the Company. 1999 Sandra J. Estep 54 Vice President of the Company. 2002 William V. Fauerbach 67 Vice President of the Company. 1997 Linda S. Hall 54 Vice President of the Company. 2002 Mark R. Irby 58 Vice President of the Company. 1989 Linda S. Kane 48 Vice President and Assistant Secretary of the Company. 2000 Erik J. Katenkamp 42 2013 L. Renee Kelly 52 2013 Thomas M. McLaughlin 63 Vice President of the Company. 1994 54 2013 Dale S. Myers 61 Vice President of the Company. 2001 Alfred J. Ottolino 48 Vice President of the Company. 2004 Charles B. Roskovich, Jr. 52 Vice President of the Company to January 2011, Senior Vice President to January 2013, Vice President thereafter. 2008 Marc H. Salm 53 Vice President of the Company. 2008 Richard J. Schuler II 58 Vice President of the Company. 2000 Alison Midili Smith 43 2013 Jeffrey D. Stephens 58 Director of Fresh Product Manufacturing of the Company to September 2010, Director of Manufacturing Operations to March 2013, Vice President thereafter. 2013 Steven B. Wellslager 47 2013 the Company Age
Since 53 2000 68 1977 54 1998 62 2000 53 2005 55 2011 61 1990 52 2011 49 2002 48 2006 58 1999 52 2002 65 1997 52 2002 55 1994 56 2004 56 1989 49 2003 46 2000 61 1994 59 2001 46 2004 52 1990 50 2008 51 2008 56 2000 52 2005 20122014 or upon the election of their successors.(a)(a) Market Information 20112013 and 20102012 were as follows: $ 19.85 16.30 20.90 17.35 21.65 18.50 22.05 18.45 20.20 19.85 2013 2012 January - February $ 22.50 20.20 March - April 23.20 22.40 May - July 26.90 22.70 August - October 27.55 22.00 November - December 30.00 22.50 (b)(b) Approximate Number of Equity Security Holders 7, 2012,4, 2014, the approximate number of holders of the Company’s common stock was 152,000.161,000.(c)(c) Dividends The cash dividend on its common stock of $0.53$0.59 per share or $464.6 million. Due to the growth of the Company's dividend over the last several years, the Company decided in 2011 and $0.462012 to begin paying a semi-annual dividend rather than an annual dividend. To not delay any dividend payments to the Company's stockholders, the first semi-annual dividend of $0.30 per share in 2010.or $234.1 million was paid on December 3, 2012. Payment of dividends is within the discretion of the Company’sCompany's Board of Directors and depends on, among other factors, net earnings, capital requirements and the financial condition of the Company. It is believed that comparable cash dividends will be paid in the future.(d)(d) Purchases of Equity Securities by the Issuer 31, 201128, 2013 were as follows (amounts are in thousands, except per share amounts): Total
Number of
Shares Average
Price
Paid per
Shares
Purchased as
Part of Publicly
Announced
Plans or Approximate
Dollar Value of
Shares
that May Yet Be
Purchased Under
the Plans or 1,025 $22.05 N/A N/A 2,766 20.22 N/A N/A 1,920 20.20 N/A N/A 5,711 $20.54 N/A N/A (1) Common stock is made available for sale only to the Company’s current employees through the Company’s ESPP and to participants of the Company’s 401(k) Plan. In addition, common stock is made available under the ESOP. Common stock is also made available for sale to members of the Company’s Board of Directors through the Directors Plan. The Company currently repurchases common stock subject to certain terms and conditions. The ESPP, 401(k) Plan, ESOP and Directors Plan each contain provisions prohibiting any transfer for value without the owner first offering the common stock to the Company.Period 381 $ 27.62 N/A N/A 2,246 30.00 N/A N/A 1,442 30.00 N/A N/A 4,069 $ 29.78 N/A N/A (1) Common stock is made available for sale only to the Company’s current employees through the Company’s ESPP and to participants of the Company’s 401(k) Plan. In addition, common stock is made available under the ESOP. Common stock is also made available for sale to members of the Company’s Board of Directors through the Directors Plan. The Company currently repurchases common stock subject to certain terms and conditions. The ESPP, 401(k) Plan, ESOP and Directors Plan each contain provisions prohibiting any transfer for value without the owner first offering the common stock to the Company. 31, 201128, 2013 required to be disclosed in the last two columns of the table.(e)(e) Performance Graph 31, 2011,28, 2013, compared to the cumulative total return on the S&P 500 Index and a custom Peer Group Index including retail food supermarket companies.(1)(1) The Peer Group Index is weighted based on the various companies’ market capitalization. The comparison assumes $100 was invested at the end of 20062008 in the Company’s common stock and in each of the related indices and assumes reinvestment of dividends.BecauseDue to the Company’s fiscal year end valuationtiming of the Company’s shares is effective after the datefiling of this document is to be filed with the Securities and Exchange Commission (SEC), a performance graph based on the fiscal year end valuation (market price as of March 1, 2012)2014) is not presented below. Rather, for comparative purposes, a performance graph based on the fiscal year end valuation is provided in the 20122014 Proxy Statement.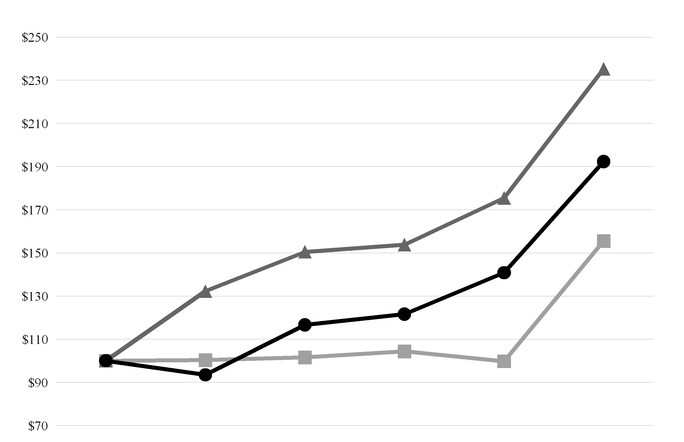
2008 2009 2010 2011 2012 2013 l Publix $100.00 93.46 116.65 121.61 140.78 192.34 p S&P 500 100.00 132.21 150.48 153.77 175.41 235.25 n 100.00 100.32 101.61 104.36 99.78 155.54 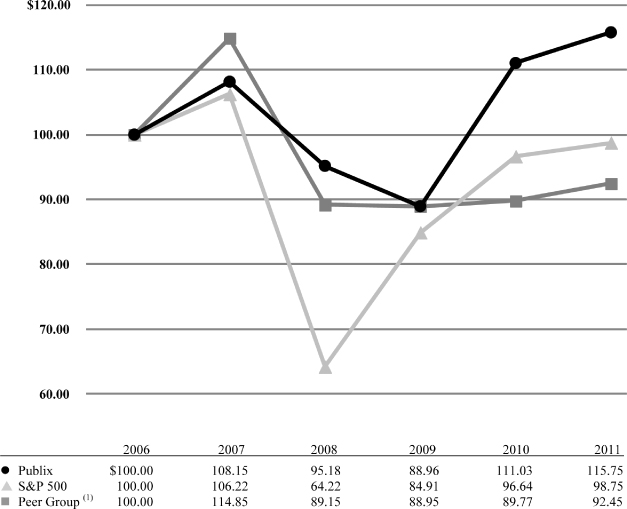
(1)Companies included in the Peer Group are:are Ahold, Delhaize Group, Kroger, Safeway, Supervalu and Weis Markets and Winn-Dixie.Markets. 2011(1) 2010 2009 2008 2007 (Amounts are in thousands, except per share amounts and number of supermarkets.) $26,967,389 25,134,054 24,319,716 23,929,064 23,016,568 7.3% 3.3% 1.6% 4.0% 6.3% 4.1% 2.3% (3.2% ) 1.3% 4.3% $ 7,447,019 7,022,611 6,727,037 6,442,241 6,210,739 $ 2,261,773 2,039,418 1,774,714 1,651,412 1,817,573 $ 1,491,966 1,338,147 1,161,442 1,089,770 1,183,925 5.5% 5.3% 4.8% 4.6% 5.1% 784,815 786,378 788,835 818,248 840,523 $ 1.90 1.70 1.47 1.33 1.41 $ 0.53 0.46 0.41 0.44 0.40 $ 602,952 468,530 693,489 1,289,707 683,290 $ 752,464 771,918 469,260 232,809 319,826 1.37 1.37 1.24 1.13 1.18 $11,268,232 10,159,087 9,004,292 8,089,672 8,053,157 $ 134,584 149,361 99,326 71,940 35,482 $ 2,137,217 2,016,696 1,862,350 1,777,153 1,729,498 $ 8,341,457 7,305,592 6,303,538 5,643,298 5,642,186 1,046 1,034 1,014 993 926 (1)Fiscal year 2011 includes 53 weeks. All other years include 52 weeks.(2) Gross profit represents sales less cost of merchandise sold as reported in the consolidated statements of earnings. 2013 2012 2010 2009 (Amounts are in thousands, except per share amounts and number of supermarkets) Sales: Sales $ 28,917,439 27,484,766 26,967,389 25,134,054 24,319,716 Percent change 5.2 % 1.9 % 7.3 % 3.3 % 1.6% Comparable store sales percent change 3.6 % 2.2 % 4.1 % 2.3 % (3.2%) Earnings: $ 7,980,120 7,573,782 7,447,019 7,022,611 6,727,037 Earnings before income tax expense $ 2,465,689 2,302,594 2,261,773 2,039,418 1,774,714 Net earnings $ 1,653,954 1,552,255 1,491,966 1,338,147 1,161,442 Net earnings as a percent of sales 5.7 % 5.6 % 5.5 % 5.3 % 4.8 % Common stock: Weighted average shares outstanding 780,188 782,553 784,815 786,378 788,835 Basic and diluted earnings per share $ 2.12 1.98 1.90 1.70 1.47 Dividends per share $ 0.70 0.53 0.46 0.41 Financial data: Capital expenditures $ 668,485 697,112 602,952 468,530 693,489 Working capital $ 881,222 928,138 752,464 771,918 469,260 Current ratio 1.37 1.42 1.37 1.37 1.24 Total assets $ 13,546,641 12,278,320 11,268,232 10,159,087 9,004,292 Long-term debt (including current portion) $ 162,154 158,472 134,584 149,361 99,326 Common stock related to ESOP $ 2,322,903 2,272,963 2,137,217 2,016,696 1,862,350 Total equity $ 10,267,796 9,128,818 8,341,457 7,305,592 6,303,538 Supermarkets 1,079 1,069 1,046 1,034 1,014 (1) Fiscal year 2011 includes 53 weeks. All other years include 52 weeks. (2) Gross profit represents sales less cost of merchandise sold as reported in the consolidated statements of earnings. (3) The Company paid dividends on its common stock of $0.89 per share in 2012, which included an annual dividend of $0.59 per share paid in June 2012 and a semi-annual dividend of $0.30 per share paid in December 2012. 31, 2011,28, 2013, the Company operated 1,0461,079 supermarkets including 743759 located in Florida, 179181 in Georgia, 4955 in Alabama, 4548 in South Carolina and 3036 in Tennessee. In 2011, 292013, 22 supermarkets were opened (including 11seven replacement supermarkets) and 126109 supermarkets were remodeled. SeventeenTwelve supermarkets were closed during the same period. The Company opened 2013 supermarkets in Florida, fourthree in Alabama, twothree in South Carolina,Tennessee, two in Georgia and one in TennesseeSouth Carolina during 2011. Replacement2013. The replacement supermarkets opened in 20112013 replaced 11seven of the 17 supermarkets closed during the same period. FiveFour of the remaining supermarkets closed in 2011 will be replaced in subsequent periods, all of which2013 will be replaced on site.payment of the annual cash dividend.private label brands.private-label brands as well as unbranded merchandise such as produce, meat and seafood. The Company’s private labelprivate-label brands play an increasingly important role in its merchandising strategy.$4,620.1$6,293.4 million as of December 31, 2011,28, 2013, as compared with $3,701.9$5,370.5 million as of December 25, 2010.29, 2012. This increase is primarily due to the Company generating cash from operating activitiesin excess of $2,341.2 millionthe amount needed for 2011 of which $1,221.7 million was investedcurrent operations and the decrease in short-term and long-term investments.as compared with $2,266.0 million and $1,998.2 million for 2010 and 2009, respectively. The increase inNet cash provided by operating activities for 20112013 as compared with 2010 was primarily due to an2012 remained relatively unchanged. The increase in net earnings of $153.8 million. The increase in cash provided by operating activities for 20102012 as compared with 20092011 was primarily due to an increase in net earningsthe timing of $176.7 million.payments, particularly for merchandise. Any net cash in excess of the amount needed for current operations is invested in short-term and long-term investments.comparedthe anchor tenant, the construction of new warehouses and new or enhanced information technology hardware and applications. During the first quarter of 2013, the Company wrote off $1,061.6 million of fully depreciated furniture, fixtures and equipment. Since the assets were fully depreciated, the write off had no effect on the Company’s financial condition, results of operations or cash flows. In 2013, the payment for investments, net of the proceeds from the sale and maturity of such investments, was $1,074.4 million.$1,408.7the opening of 31 new supermarkets (including 12 replacement supermarkets) and remodeling 113 supermarkets. Eight supermarkets were closed during 2012. Replacement supermarkets opened in 2012 replaced seven of the supermarkets closed during the same period and five supermarkets closed in 2011 that were replaced on site. The remaining supermarket closed in 2012 was not replaced. New supermarkets added 1.1 million square feet in 2012, an increase of 2.3%. Expenditures were also incurred for the acquisition of shopping centers with the Company as the anchor tenant, the expansion of warehouses and $1,045.4 millionnew or enhanced information technology hardware and applications. For the same period, the payment for 2010investments, net of the proceeds from the sale and 2009, respectively. maturity of such investments, was $871.9 million.remaining supermarkets closed in 2011 will be replaced in subsequent periods, all of which will bewere replaced on site. Net newsite in 2012. The remaining supermarket closed in 2011 was not replaced. New supermarkets added 0.6 million square feet in 2011, an increase of 1.3%. Expenditures were also incurred for the acquisition of shopping centers with the Company as the anchor tenant and new or enhanced information technology hardware and applications. For the same period, the payment for investments, net of the proceeds from the sale and maturity of such investments, was $1,221.7 million.The primary use of net cash in investing activities for 2010 was funding capital expenditures and net increases in investment securities. Capital expenditures for 2010 totaled $468.5 million. These expenditures were incurred in connection with the opening of 41 new supermarkets (including 21 replacement supermarkets) and remodeling 115 supermarkets. Twenty-one supermarkets were closed during 2010. Replacement supermarkets opened in 2010 replaced 19 of the 21 supermarkets closed during the same period and two supermarkets closed in 2009. The remaining two supermarkets closed in 2010 were not replaced. New supermarkets opened included five of the remaining Florida supermarket locations acquired from Albertson’s LLC (Albertson’s) not opened in 2008 or 2009. Net new supermarkets added 1.1 million square feet in 2010, an increase of 2.4%. Expenditures were also incurred for new or enhanced information technology hardware and applications. For the same period, the payment for investments, net of the proceeds from the sale and maturity of such investments, was $943.0 million.The primary use of net cash in investing activities for 2009 was funding capital expenditures and net increases in investment securities. Capital expenditures for 2009 totaled $693.5 million. These expenditures were incurred in connection with the opening of 48 new supermarkets (including 15 replacement supermarkets) and remodeling 85 supermarkets. Twenty-seven supermarkets were closed during 2009. Replacement supermarkets opened in 2009 replaced 14 of the 27 supermarkets closed during the same period and one supermarket closed in 2008. Two of the remaining supermarkets closed in 2009 were opened as replacement supermarkets in 2010 and the other 11 supermarkets were not replaced. Both replacement supermarkets opened in 2010 from supermarkets closed in 2009 were replaced on site. New supermarkets opened included 17 of the remaining 25 Florida supermarket locations acquired from Albertson’s not opened in 2008. Net new supermarkets added 1.3 million square feet in 2009, an increase of 2.7%. Expenditures were also incurred for the construction of a second data center, expansion of warehouses and new or enhanced information technology hardware and applications. For the same period, the payment for investments, net of the proceeds from the sale and maturity of such investments, was $356.1 million.2012,2014, the Company plans to open 3032 supermarkets, some of which will be replacement supermarkets. Although real estate development is unpredictable, the Company’s 20122014 new store growth represents a reasonable estimate of anticipated future growth. Capital expenditures for 20122014 are expected to be approximately $730$875 million, primarily consisting of new supermarkets, remodeling certain existing supermarkets, expansionconstruction of new warehouses, new or enhanced information technology hardware and applications and the acquisition of certain shopping centers with the Company as the anchor tenant. The shopping center acquisitions are financed with internally generated funds and assumed debt, if prepayment penalties for the debt are determined to be significant. This capital program is subject to continuing change and review. In the normal course of operations, the Company replaces supermarkets and closes supermarkets that are not meeting performance expectations. The impact of future supermarket closings is not expected to be material.$621.9 million and $784.12012 was primarily due to the Company paying dividends of $0.70 per share or $547.3 million in 2010 and 2009, respectively. The primary use2013 as compared to dividends of net cash$0.89 per share or $698.7 million in financing activities was funding net common stock repurchases and payment of the annual cash dividend.2012, as noted in Dividends below. Net common stock repurchases totaled $321.3 million in 2013, as compared with $354.4 million and $291.3 million in 2011, as compared with $257.3 million2012 and $477.4 million in 2010 and 2009,2011, respectively. The Company currently repurchases common stock at the stockholders’ request in accordance with the terms of the Company’s ESPP, 401(k) Plan, ESOP and Directors Plan. The amount of common stock offered to the Company for repurchase is not within the control of the Company, but is at the discretion of the stockholders. The Company expects to continue to repurchase its common stock, as offered by its stockholders from time to time, at its then current value for amounts similar to those in prior years. However, with the exception of certain shares distributed from the ESOP, such purchases are not required and the Company retains the right to discontinue them at any time.an annual cash dividenddividends on its common stock of $0.70 per share or $547.3 million, $0.89 per share or $698.7 million and $0.53 per share or $418.7 million $0.46in 2013, 2012 and 2011, respectively. Due to the growth of the Company’s dividend over the last several years, the Company decided in 2012 to begin paying a semi-annual dividend rather than an annual dividend. To not delay any dividend payments to the Company’s stockholders, the first semi-annual dividend of $0.30 per share or $364.1$234.1 million and $0.41 per share or $325.3 millionwas paid on December 3, 2012. As a result, dividends paid in 2011, 2010 and 2009, respectively.2012,2014, the cash requirements for current operations, capital expenditures, common stock repurchases and payment of the annual cash dividend payments are expected to be financed by internally generated funds or liquid assets. Based on the Company’s financial position, it is expected that short-term and long-term borrowings would be available to support the Company’s liquidity requirements, if needed.31, 2011: 2013- 2015- There- (Amounts are in thousands) $ 4,261,198 419,541 780,139 676,315 2,385,203 1,856,700 829,504 266,482 183,767 576,947 345,229 125,569 101,346 37,261 81,053 107,624 4,029 8,830 9,778 84,987 134,584 15,124 83,721 17,807 17,932 16,364 500 382 450 15,032 $ 6,721,699 1,394,267 1,240,900 925,378 3,161,154 Payments Due by Period Total 2014 (Amounts are in thousands) Contractual obligations: $ 4,169,945 431,712 801,075 697,977 2,239,181 1,978,312 969,116 297,717 187,822 523,657 Other long-term liabilities: 356,041 150,860 90,925 36,571 77,685 107,324 4,561 9,858 10,762 82,143 162,154 37,509 62,714 47,854 14,077 Other 16,542 500 541 420 15,081 Total $ 6,790,318 1,594,258 1,262,830 981,406 2,951,824 (1)(1) For a more detailed description of the operating lease obligations, refer to Note 8(a)9(a) Commitments and Contingencies - Operating Leases in the Notes to Consolidated Financial Statements.(2)(2) Purchase obligations include agreements to purchase goods or services that are enforceable and legally binding on the Company and that specify all significant terms, including fixed or minimum quantities to be purchased, fixed, minimum or variable price provisions and the approximate timing of the transaction. Purchase obligations exclude agreements that are cancelable within 30 days without penalty. (3)(3) 31, 2011,28, 2013, the Company had $10.2$6.8 million outstanding in trade letters of credit and $3.7$4.7 million in standby letters of credit to support certain of these purchase obligations.(4)(4) Purchase obligations include $1,062.8$1,029.4 million in real estate taxes, insurance and maintenance commitments related to operating leases. The actual amounts to be paid are variable and have been estimated based on current costs.(5)(5) 31, 2011,28, 2013, the Company had a restricted trust account in the amount of $170.0$169.9 million for the benefit of the Company’s insurance carrier to support this obligation.(6)(6) For a more detailed description of the postretirement benefit obligations, refer to Note 5 Postretirement Benefits in the Notes to Consolidated Financial Statements. (7)(7) For a more detailed description of the long-term debt obligations, refer to Note 4 Consolidation of Joint Ventures and Long-Term Debt in the Notes to Consolidated Financial Statements. ResultsOperationsThe Company’s fiscal year endsaccumulated other comprehensive earnings by component. Additionally, entities are required to present, either on the last Saturdayface of the financial statements or in December. Fiscal year 2011 includes 53 weeks and fiscal years 2010 and 2009 include 52 weeks.SalesSales for 2011 were $27.0 billion as compared with $25.1 billion in 2010, an increasethe notes, significant amounts reclassified out of $1,833.3 million or a 7.3% increase. The Company estimates that its sales increased $485.2 million or 1.9% from the additional week in 2011, $317.6 million or 1.3% from new supermarkets (excluding replacement supermarkets) and $1,030.5 million or 4.1% from comparable store sales (supermarkets open for the same weeks in both periods, including replacement supermarkets). Sales for supermarkets that are replaced on site are classified as new supermarket sales since the replacement period for the supermarket is generally 9 to 12 months. Comparable store sales for 2011 increased primarily due to product cost inflation and increased customer counts resulting from a better economic climate.Sales for 2010 were $25.1 billion as compared with $24.3 billion in 2009, an increase of $814.3 million or a 3.3% increase. The Company estimates that its sales increased $254.9 million or 1.0% from new supermarkets and $559.4 million or 2.3% from comparable store sales. Comparable store sales for 2010 increased primarily due to increased customer counts resulting from a better economic climate.Sales for 2009 were $24.3 billion as compared with $23.9 billion in 2008, an increase of $390.7 million or a 1.6% increase. The Company estimates that its sales increased $1,156.4 million or 4.8% from new supermarkets and decreased $765.7 million or 3.2% from comparable store sales. Comparable store sales were negatively impactedaccumulated other comprehensive earnings by the economic downturn, deflationary pressures andrespective line items of net earnings. The amended guidance does not change the large numbercurrent requirements for reporting net earnings or other comprehensive earnings. The amendments are effective prospectively for reporting periods beginning after December 15, 2012. The adoption of the Company’s supermarkets openedthese amendments during the fourth quarter ended March 30, 2013 did not have an effect on the Company's financial condition, results of 2008 that were located near existing supermarkets.Gross profitGross profit (sales less cost of merchandise sold) as a percentage of sales was 27.6%, 27.9% and 27.7% in 2011, 2010 and 2009, respectively. The decrease in gross profit as a percentage of sales for 2011 as compared with 2010 was primarily due to an increase in the last-in, first-out (LIFO) reserve and product cost increases some of which were not passed on to customers. Gross profit as a percentage of sales for 2010 as compared with 2009 remained relatively unchanged.Operating and administrative expensesOperating and administrative expenses as a percentage of sales were 20.5%, 21.1% and 21.6% in 2011, 2010 and 2009, respectively. The decrease in operating and administrative expenses as a percentage of sales for 2011 as compared with 2010 was primarily due to incremental sales from the additional week in 2011. Excluding the effect of the incremental sales from the additional week, operating and administrative expenses as a percentage of sales would have been 20.9%. The decrease in operating and administrative expenses as a percentage of sales for 2010 as compared with 2009 was primarily due to decreases in rent, payroll, utilities and repairs and maintenance expenses as a percentage of sales. Rent expense decreased 0.2% of sales primarily due to a decrease in rent related to closed supermarkets; payroll expense decreased 0.1% of sales primarily due to more effective scheduling; utilities expense decreased 0.1% of sales primarily due to lower electric rates; and repairs and maintenance expense decreased 0.1% of sales primarily due to better expense control.Investment income, netInvestment income, net was $93.0 million, $91.8 million and $68.3 million in 2011, 2010 and 2009, respectively. The increase in investment income, net for 2011 as compared with 2010 was primarily due to an increase in dividend income partially offset by other-than-temporary impairment (OTTI) losses on equity securities. The increase in investment income, net for 2010 as compared with 2009 was primarily due to a decrease in OTTI losses on equity securities.The Company recorded OTTI losses on equity securities of $6.1 million and $19.3 million in 2011 and 2009, respectively. There were no OTTI losses on equity securities in 2010. There were no OTTI losses on debt securities in 2011, 2010 and 2009.Income taxesThe effective income tax rate was 34.0%, 34.4% and 34.6% in 2011, 2010 and 2009, respectively. The decrease in the effective income tax rate for 2011 as compared with 2010 was primarily due to increases in dividends paid to ESOP participants and jobs tax credits. The effective income tax rate for 2010 as compared with 2009 remained relatively unchanged.Net earningsNet earnings were $1,492.0 millionoperations or $1.90 per share, $1,338.1 million or $1.70 per share and $1,161.4 million or $1.47 per share for 2011, 2010 and 2009, respectively. Net earnings as a percentage of sales were 5.5%, 5.3% and 4.8% for 2011, 2010 and 2009, respectively. The increase in net earnings as a percentage of sales for 2011 as compared with 2010 was primarily due to incremental sales from the additional week partially offset by the decrease in gross profit as a percentage of sales, as noted above. The increase in net earnings as a percentage of sales for 2010 as compared with 2009 was primarily due to increases in gross profit as a percentage of sales and decreases in operating and administrative expenses as a percentage of sales, as noted above.Inventories and 85% of inventories was determined using the dollar value LIFOlast-in, first-out method as of December 31, 201128, 2013 and December 25, 2010, respectively.29, 2012. Under this method, inventory is stated at cost, which is determined by applying a cost-to-retail ratio to each similar merchandise category’s ending retail value. The cost of the remaining inventories was determined using the first-in, first-out (FIFO) method. The FIFO cost of inventory approximates replacement or current cost. The FIFO method is used to value manufactured, seasonal, certain perishable and other miscellaneous inventory items because of fluctuating costs and inconsistent product availability. The Company also reduces inventory for estimated losses related to shrink.available-for-sale (AFS)AFS and carried at fair value. The Company evaluates whether AFS securities are OTTI based on criteria that include the extent to which cost exceeds market value, the duration of the market decline, the credit rating of the issuer or security, the failure of the issuer to make scheduled principal or interest payments and the financial health and prospects of the issuer or security. Declines in the value of AFS securities determined to be OTTI are recognized in earnings and reported as OTTI losses, while declines in the value of AFS securities determined to be temporary are reported, net of tax, as other comprehensive losses and included as a component of stockholders’ equity. If market or issuer conditions decline, the Company may incur future impairments.one percentage50 basis point increase in long-term interest rates or 100 basis points, would result in an immaterial unrealized loss on its debt securities. Since the Company does not intend to sell its debt securities or will likely not be required to sell its debt securities prior to any anticipated recovery, such a theoretical temporary unrealized loss would impact comprehensive earnings, but not net earnings or cash flows.10%5% in the value of the Company’s equity securities would result in an immaterial decrease in the value of long-term investments.Property, Plant and Equipment and DepreciationAssets are recorded at cost and are depreciated using the straight-line method over their estimated useful lives or the terms of their leases, if shorter, as follows: buildings and improvements are at 10 – 40 years, furniture, fixtures and equipment are at 3 – 20 years and leasehold improvements are at 5 – 40 years. The Company considers lease renewals in the useful life of its leasehold improvements when such renewals are reasonably assured.2011.Revenue RecognitionRevenue is recognized at the point of sale for retail sales. Customer returns are immaterial. Vendor coupons that are reimbursed are accounted for as sales. Coupons and other sales incentives offered by the Company that are not reimbursed are recorded as a reduction of sales. the self-insurance limits for fleet liability, general liability and workers’ compensation claims. Historically, it has been infrequent for incurred claims to exceed these self-insurance limits.a high degree of variability. The causes of variability include, but are not limited to, such factors as future interest and inflation rates, future economic conditions, claims experience, litigation trends and benefit level changes. The Company believes a one percentage100 basis point change in the discount rate or 100 basis points, would result in an immaterial change in the Company’s self-insurance reserves.namely:namely interest rate risk, credit risk and secondary market risk. Most of the cash equivalents and short-term investments are held in money market investments and debt securities that mature in less than one year. Due to the quality of the short-term investments held, the Company does not expect the valuation of these investments to be significantly impacted by future market conditions.one percentage50 basis point increase in long-term interest rates or 100 basis points, would result in an immaterial unrealized loss on its debt securities. Since the Company does not intend to sell its debt securities or will likely not be required to sell its debt securities prior to any anticipated recovery, such a theoretical temporary unrealized loss would impact comprehensive earnings, but not net earnings or cash flows.10%5% in the value of the Company’s equity securities would result in an immaterial decrease in the value of long-term investments.31, 2011.28, 2013. In making this assessment, management used the criteria set forth by the Committee of Sponsoring Organizations of the Treadway Commission inInternal Control – Integrated Framework (2013). Based on this assessment and these criteria, management believes that the Company’s internal control over financial reporting was effective as of December 31, 2011.28, 2013.The Company’s independent registered public accounting firm, KPMG LLP, has issued an audit report on the effectiveness of the Company’s internal control over financial reporting, which is included on page 21.Index to Consolidated Financial Statements and ScheduleIndex to Consolidated Financial Statements and Schedule Page Page ReportsReport of Independent Registered Public Accounting FirmConsolidated Financial Statements: 20 Consolidated Financial Statements:31, 201128, 2013 and December 25, 2010 22 24 25 26 28 29 December 25, 2010 and December 26, 2009 is submitted herewith: 42 31, 201128, 2013 and December 25, 2010,29, 2012, and the related consolidated statements of earnings, comprehensive earnings, cash flows and stockholders’ equity for each of the years in the three-year period ended December 31, 2011.28, 2013. In connection with our audits of the consolidated financial statements, we also have audited the financial statement schedule listed in the accompanying index. These consolidated financial statements and financial statement schedule are the responsibility of the Company’s management. Our responsibility is to express an opinion on these consolidated financial statements and financial statement schedule based on our audits.31, 201128, 2013 and December 25, 2010,29, 2012, and the results of their operations and their cash flows for each of the years in the three-year period ended December 31, 2011,28, 2013, in conformity with U.S. generally accepted accounting principles. Also in our opinion, the related financial statement schedule, when considered in relation to the basic consolidated financial statements taken as a whole, presents fairly, in all material respects, the information set forth therein.We also have audited, in accordance with the standards of the Public Company Accounting Oversight Board (United States), Publix Super Markets, Inc.’s internal control over financial reporting as of December 31, 2011, based on criteria established in Internal Control – Integrated Frameworkissued by the Committee of Sponsoring Organizations of the Treadway Commission, and our report dated February 29, 2012 expressed an unqualified opinion on the effectiveness of the Company’s internal control over financial reporting.February 29, 2012Report of Independent Registered Public Accounting FirmThe Board of Directors and StockholdersPublix Super Markets, Inc.:We have audited Publix Super Markets, Inc.’s internal control over financial reporting as of December 31, 2011, based on criteria established in Internal Control – Integrated Frameworkissued by the Committee of Sponsoring Organizations of the Treadway Commission. Publix Super Markets, Inc.’s management is responsible for maintaining effective internal control over financial reporting and for its assessment of the effectiveness of internal control over financial reporting, included in the accompanying Management’s Report on Internal Control over Financial Reporting. Our responsibility is to express an opinion on the Company’s internal control over financial reporting based on our audit.We conducted our audit in accordance with the standards of the Public Company Accounting Oversight Board (United States). Those standards require that we plan and perform the audit to obtain reasonable assurance about whether effective internal control over financial reporting was maintained in all material respects. Our audit included obtaining an understanding of internal control over financial reporting, assessing the risk that a material weakness exists, and testing and evaluating the design and operating effectiveness of internal control based on the assessed risk. Our audit also included performing such other procedures as we considered necessary in the circumstances. We believe that our audit provides a reasonable basis for our opinion.A company’s internal control over financial reporting is a process designed to provide reasonable assurance regarding the reliability of financial reporting and the preparation of financial statements for external purposes in accordance with generally accepted accounting principles. A company’s internal control over financial reporting includes those policies and procedures that (1) pertain to the maintenance of records that, in reasonable detail, accurately and fairly reflect the transactions and dispositions of the assets of the company; (2) provide reasonable assurance that transactions are recorded as necessary to permit preparation of financial statements in accordance with generally accepted accounting principles, and that receipts and expenditures of the company are being made only in accordance with authorizations of management and directors of the company; and (3) provide reasonable assurance regarding prevention or timely detection of unauthorized acquisition, use, or disposition of the company’s assets that could have a material effect on the financial statements.Because of its inherent limitations, internal control over financial reporting may not prevent or detect misstatements. Also, projections of any evaluation of effectiveness to future periods are subject to the risk that controls may become inadequate because of changes in conditions, or that the degree of compliance with the policies or procedures may deteriorate.In our opinion, Publix Super Markets, Inc. maintained, in all material respects, effective internal control over financial reporting as of December 31, 2011, based on criteria established in Internal Control – Integrated Frameworkissued by the Committee of Sponsoring Organizations of the Treadway Commission.We also have audited, in accordance with the standards of the Public Company Accounting Oversight Board (United States), the consolidated balance sheets of Publix Super Markets, Inc. and subsidiaries as of December 31, 2011 and December 25, 2010, and the related consolidated statements of earnings, comprehensive earnings, cash flows and stockholders’ equity for each of the years in the three-year period ended December 31, 2011, and our report dated February 29, 2012 expressed an unqualified opinion on those consolidated financial statements.KPMG LLPTampa, FloridaFebruary 29, 2012Certified Public Accountants31, 2011 and29, 2012December 25, 2010Assets (Amounts are in thousands) $ 366,853 605,901 447,972 336,282 542,990 492,311 1,361,709 1,359,028 59,400 59,126 24,316 25,354 2,803,240 2,878,002 3,805,283 2,759,751 171,179 168,398 592,843 504,415 2,062,833 1,918,940 4,540,988 4,488,139 1,321,646 1,293,578 103,006 110,909 8,621,316 8,315,981 (4,132,786 ) (3,963,045 ) 4,488,530 4,352,936 $ 11,268,232 10,159,087 Assets 2013 2012 (Amounts are in thousands) Current assets: Cash and cash equivalents $ 301,868 337,400 Short-term investments 829,559 797,260 Trade receivables 540,156 519,137 Merchandise inventories 1,506,977 1,409,367 Deferred tax assets 55,761 57,834 Prepaid expenses 25,823 28,124 Total current assets 3,260,144 3,149,122 Long-term investments 5,161,927 4,235,846 Other noncurrent assets 319,818 202,636 Property, plant and equipment: Land 716,071 688,812 Buildings and improvements 2,352,447 2,249,176 Furniture, fixtures and equipment 3,759,007 4,587,883 Leasehold improvements 1,438,871 1,385,823 Construction in progress 152,240 67,775 8,418,636 8,979,469 Accumulated depreciation (3,613,884 ) (4,288,753 ) Net property, plant and equipment 4,804,752 4,690,716 $ 13,546,641 12,278,320 Liabilities and Equity (Amounts are in thousands,
except par value) $ 1,133,120 1,156,181 405,818 376,002 125,569 114,133 110,207 113,794 221,713 249,633 15,124 72,879 39,225 23,462 2,050,776 2,106,084 316,802 225,695 219,660 221,337 103,595 90,935 119,460 76,482 116,482 132,962 2,926,775 2,853,495 2,137,217 2,016,696 779,675 780,969 1,354,881 1,092,008 6,131,193 5,349,387 30,261 38,226 (2,137,217 ) (2,016,696 ) 6,158,793 5,243,894 45,447 45,002 8,341,457 7,305,592 --- --- $ 11,268,232 10,159,087 Liabilities and Equity 2013 2012 Current liabilities: Accounts payable $ 1,383,134 1,306,996 Accrued expenses: Contributions to retirement plans 448,339 430,395 Self-insurance reserves 150,860 138,998 Salaries and wages 116,116 109,091 Other 223,048 230,486 Current portion of long-term debt 37,509 5,018 Federal and state income taxes 19,916 — Total current liabilities 2,378,922 2,220,984 Deferred tax liabilities 356,956 327,294 Self-insurance reserves 205,181 212,728 Accrued postretirement benefit cost 102,763 116,721 Long-term debt 124,645 153,454 Other noncurrent liabilities 110,378 118,321 Total liabilities 3,278,845 3,149,502 Common stock related to Employee Stock Ownership Plan (ESOP) 2,322,903 2,272,963 Stockholders’ equity: 776,721 776,094 Additional paid-in capital 1,898,974 1,627,258 Retained earnings 7,454,448 6,640,538 Accumulated other comprehensive earnings 86,999 38,289 Common stock related to ESOP (2,322,903 ) (2,272,963 ) Total stockholders’ equity 7,894,239 6,809,216 Noncontrolling interests 50,654 46,639 Total equity 10,267,796 9,128,818 Commitments and contingencies — — $ 13,546,641 12,278,320 31, 2011,28, 2013, December 25, 201029, 201226, 200931, 2011 (Amounts are in thousands, except per share amounts) $26,967,389 25,134,054 24,319,716 211,375 194,000 195,244 27,178,764 25,328,054 24,514,960 19,520,370 18,111,443 17,592,679 5,523,469 5,295,287 5,241,368 23,406,730 22,834,047 2,134,925 1,921,324 1,680,913 99,039 91,835 87,555 (6,082) --- (19,283) 92,957 91,835 68,272 33,891 26,259 25,529 2,261,773 2,039,418 1,774,714 769,807 701,271 613,272 $ 1,491,966 1,338,147 1,161,442 784,815 786,378 788,835 $ 1.90 1.70 1.47 2013 2012 2011 (Amounts are in thousands, except per share amounts) Revenues: Sales $ 28,917,439 27,484,766 26,967,389 Other operating income 230,079 222,006 211,375 Total revenues 29,147,518 27,706,772 27,178,764 Costs and expenses: Cost of merchandise sold 20,937,319 19,910,984 19,520,370 Operating and administrative expenses 5,890,461 5,630,537 5,523,469 Total costs and expenses 26,827,780 25,541,521 25,043,839 Operating profit 2,319,738 2,165,251 2,134,925 Investment income 127,299 88,449 99,039 Other-than-temporary impairment losses — — (6,082 ) Investment income, net 127,299 88,449 92,957 Other income, net 18,652 48,894 33,891 Earnings before income tax expense 2,465,689 2,302,594 2,261,773 Income tax expense 811,735 750,339 769,807 Net earnings $ 1,653,954 1,552,255 1,491,966 Weighted average shares outstanding 780,188 782,553 784,815 Basic and diluted earnings per share $ 2.12 1.98 1.90 31, 2011,28, 2013, December 25, 201029, 201226, 200931, 2011 (Amounts are in thousands) $ 1,491,966 1,338,147 1,161,442 10,041 13,102 53,637 (12,202 ) (15,043 ) 4,173 (5,804 ) (3,038 ) (1,979 ) $ 1,484,001 1,333,168 1,217,273 2013 2012 2011 (Amounts are in thousands) Net earnings $ 1,653,954 1,552,255 1,491,966 Other comprehensive earnings: 65,861 19,956 10,041 (29,311 ) (6,373 ) (12,202 ) 12,160 (5,555 ) (5,804 ) Comprehensive earnings $ 1,702,664 1,560,283 1,484,001 31, 2011,28, 2013, December 25, 201029, 201226, 200931, 2011 (Amounts are in thousands) $ 26,980,492 25,209,753 24,231,980 (24,024,194 ) (22,253,046 ) (21,646,622 ) (658,213 ) (686,037 ) (553,235 ) (285,362 ) (274,305 ) (283,079 ) 139,727 95,794 73,087 203,112 184,760 185,331 (14,375 ) (10,951 ) (9,230 ) 2,341,187 2,265,968 1,998,232 (602,952 ) (468,530 ) (693,489 ) 5,312 2,815 4,150 (2,062,775 ) (1,598,759 ) (1,133,449 ) 841,028 655,799 777,381 (1,819,387 ) (1,408,675 ) (1,045,407 ) (497,570 ) (436,224 ) (629,453 ) 206,245 178,914 152,096 (418,680 ) (364,087 ) (325,295 ) (49,076 ) (10,875 ) (1,138 ) (1,767 ) 10,364 19,668 (760,848 ) (621,908 ) (784,122 ) (239,048 ) 235,385 168,703 605,901 370,516 201,813 $ 366,853 605,901 370,516 2013 2012 2011 (Amounts are in thousands) Cash flows from operating activities: Cash received from customers $ 28,942,460 27,579,893 26,980,492 Cash paid to employees and suppliers (25,673,800 ) (24,279,245 ) (24,024,194 ) Income taxes paid (789,721 ) (785,147 ) (658,213 ) Self-insured claims paid (321,060 ) (293,359 ) (285,362 ) Dividends and interest received 205,923 182,025 139,727 Other operating cash receipts 222,178 214,022 203,112 Other operating cash payments (18,677 ) (13,982 ) (14,375 ) Net cash provided by operating activities 2,567,303 2,604,207 2,341,187 Cash flows from investing activities: Payment for capital expenditures (668,485 ) (697,112 ) (602,952 ) Proceeds from sale of property, plant and equipment 21,360 5,503 5,312 Payment for investments (2,442,298 ) (1,882,223 ) (2,062,775 ) Proceeds from sale and maturity of investments 1,367,922 1,010,277 841,028 Net cash used in investing activities (1,721,501 ) (1,563,555 ) (1,819,387 ) Cash flows from financing activities: Payment for acquisition of common stock (563,470 ) (551,816 ) (497,570 ) Proceeds from sale of common stock 242,211 197,448 206,245 Dividends paid (547,287 ) (698,652 ) (418,680 ) Repayments of long-term debt (16,803 ) (18,277 ) (49,076 ) Other, net 4,015 1,192 (1,767 ) Net cash used in financing activities (881,334 ) (1,070,105 ) (760,848 ) Net decrease in cash and cash equivalents (35,532 ) (29,453 ) (239,048 ) Cash and cash equivalents at beginning of year 337,400 366,853 605,901 Cash and cash equivalents at end of year $ 301,868 337,400 366,853 (Amounts are in thousands) $ 1,491,966 1,338,147 1,161,442 492,639 507,341 496,106 291,240 275,547 256,110 95,848 20,722 27,018 13,734 19,896 32,482 (19,886 ) (24,516 ) 6,801 80,890 48,113 15,625 (50,782 ) 16,165 (140,082 ) (3,132 ) 26,245 2,302 (15,635 ) (8,054 ) (5,825 ) (51,741 ) 63,852 103,014 9,762 (13,494 ) (14,381 ) 15,763 (5,113 ) 33,186 (9,479 ) 1,117 24,434 849,221 927,821 836,790 $ 2,341,187 2,265,968 1,998,232 2013 2012 2011 (Amounts are in thousands) Reconciliation of net earnings to net cash provided by operating activities: Net earnings $ 1,653,954 1,552,255 1,491,966 Depreciation and amortization 501,689 493,239 492,639 Increase in LIFO reserve 14,787 28,419 67,145 319,175 304,285 291,240 Deferred income taxes 1,061 7,002 95,848 26,065 24,855 13,734 Gain on AFS securities (47,769 ) (10,386 ) (19,886 ) Net amortization of investments 133,422 108,300 80,890 Change in operating assets and liabilities providing (requiring) cash: Trade receivables (21,086 ) 22,517 (50,782 ) Merchandise inventories (112,397 ) (76,077 ) (70,277 ) Prepaid expenses and other noncurrent assets (1,757 ) (3,374 ) (15,635 ) Accounts payable and accrued expenses 76,083 181,916 (51,741 ) Self-insurance reserves 4,315 6,497 9,762 Federal and state income taxes 21,844 (41,153 ) 15,763 Other noncurrent liabilities (2,083 ) 5,912 (9,479 ) Total adjustments 913,349 1,051,952 849,221 Net cash provided by operating activities $ 2,567,303 2,604,207 2,341,187 31, 2011,28, 2013, December 25, 201029, 201226, 200931, 2011 Additional
Paid-in
Capital Retained
Earnings (Amounts are in thousands, except per share amounts) $793,966 806,526 4,055,432 --- (12,626 ) (1,777,153 ) 3,866,145 --- --- 1,161,442 --- 55,831 --- 1,217,273 --- --- (325,295 ) --- --- --- (325,295 ) 3,522 31,594 --- 206,589 --- --- 241,705 --- --- --- (629,453 ) --- --- (629,453 ) 7 (151 ) --- 152,240 --- --- 152,096 (16,929 ) --- (253,695 ) 270,624 --- --- --- --- --- --- --- --- (85,197 ) (85,197 ) 780,566 837,969 4,637,884 --- 43,205 (1,862,350 ) 4,437,274 --- --- 1,338,147 --- (4,979 ) --- 1,333,168 --- --- (364,087 ) --- --- --- (364,087 ) 12,968 214,414 --- 21,813 --- --- 249,195 --- --- --- (436,224 ) --- --- (436,224 ) 2,255 39,625 --- 137,034 --- --- 178,914 (14,820 ) --- (262,557 ) 277,377 --- --- --- --- --- --- --- --- (154,346 ) (154,346 ) 780,969 1,092,008 5,349,387 --- 38,226 (2,016,696 ) 5,243,894 --- --- 1,491,966 --- (7,965 ) --- 1,484,001 --- --- (418,680 ) --- --- --- (418,680 ) 10,064 202,761 --- 48,599 --- --- 261,424 --- --- --- (497,570 ) --- --- (497,570 ) 2,920 60,112 --- 143,213 --- --- 206,245 (14,278 ) --- (291,480 ) 305,758 --- --- --- --- --- --- --- --- (120,521 ) (120,521 ) $779,675 1,354,881 6,131,193 --- 30,261 (2,137,217 ) 6,158,793 (Amounts are in thousands, except per share amounts) Balances at December 25, 2010 $ 780,969 1,092,008 5,349,387 — 38,226 (2,016,696 ) 5,243,894 Comprehensive earnings — — 1,491,966 — (7,965 ) — 1,484,001 Dividends, $0.53 per share — — (418,680 ) — — — (418,680 ) Contribution of 12,508 shares to retirement plans 10,064 202,761 — 48,599 — — 261,424 Acquisition of 23,513 shares from stockholders — — — (497,570 ) — — (497,570 ) Sale of 9,711 shares to stockholders 2,920 60,112 — 143,213 — — 206,245 Retirement of 14,278 shares (14,278 ) — (291,480 ) 305,758 — — — Change for ESOP related shares — — — — — (120,521 ) (120,521 ) Balances at December 31, 2011 779,675 1,354,881 6,131,193 — 30,261 (2,137,217 ) 6,158,793 Comprehensive earnings — — 1,552,255 — 8,028 — 1,560,283 Dividends, $0.89 per share — — (698,652 ) — — — (698,652 ) Contribution of 12,451 shares to retirement plans 9,845 216,232 — 52,829 — — 278,906 Acquisition of 24,889 shares from stockholders — — — (551,816 ) — — (551,816 ) Sale of 8,857 shares to stockholders 2,650 56,145 — 138,653 — — 197,448 Retirement of 16,076 shares (16,076 ) — (344,258 ) 360,334 — — — Change for ESOP related shares — — — — — (135,746 ) (135,746 ) Balances at December 29, 2012 776,094 1,627,258 6,640,538 — 38,289 (2,272,963 ) 6,809,216 Comprehensive earnings — — 1,653,954 — 48,710 — 1,702,664 Dividends, $0.70 per share — — (547,287 ) — — — (547,287 ) Contribution of 12,967 shares to retirement plans 9,548 214,371 — 76,926 — — 300,845 Acquisition of 21,602 shares from stockholders — — — (563,470 ) — — (563,470 ) Sale of 9,262 shares to stockholders 2,275 57,345 — 182,591 — — 242,211 Retirement of 11,196 shares (11,196 ) — (292,757 ) 303,953 — — — Change for ESOP related shares — — — — — (49,940 ) (49,940 ) Balances at December 28, 2013 $ 776,721 1,898,974 7,454,448 — 86,999 (2,322,903 ) 7,894,239 (a) (b) (JV) in which the Company has a controlling financial interest. All significant intercompany balances and transactions are eliminated in consolidation.(c) weeks and fiscal years 2010 and 2009 include 52 weeks.(d) (e) (f) and 85% of inventories was determined using the dollar value last-in, first-out method as of December 31, 201128, 2013 and December 25, 2010, respectively.29, 2012. The cost of the remaining inventories was determined using the first-in, first-out (FIFO) method. The FIFO cost of inventory approximates replacement or current cost. The FIFO method is used to value manufactured, seasonal, certain perishable and other miscellaneous inventory items because of fluctuating costs and inconsistent product availability. The Company also reduces inventory for estimated losses related to shrink. If the FIFO method of valuing inventories had been used by the Company to value all inventories, then inventories and current assets would have been higher than reported by $346,558,000$389,764,000 and $279,413,000$374,977,000 as of December 31, 201128, 2013 and December 25, 2010,29, 2012, respectively.(g) PUBLIX SUPER MARKETS, INC.Notes to Consolidated Financial Statementsstock.security. The cost of AFS securities sold is based on the FIFO method.(h) Buildings and improvements Buildings and improvements Leasehold improvements Leasehold improvements 5 10 – 4020 years(i) $9,818,000, $7,514,000$11,588,000, $11,144,000 and $11,959,000$9,818,000 for 2013, 2012 and 2011, 2010 and 2009, respectively.(j) (k) The Company has insurance coverage for losses in excess of the self-insurance limits for fleet liability, general liability and workers’ compensation claims. Historically, it has been infrequent for incurred claims to exceed these self-insurance limits.(l) As of December 31, 2011, accumulated other comprehensive earnings included net unrealized gains on AFS securities of $72,879,000, less tax effect of $28,176,000, and an unfunded postretirement benefit obligation of $23,536,000, less tax effect of $9,094,000. As of December 25, 2010, accumulated other comprehensive earnings included net unrealized gains on AFS securities of $76,400,000, less tax effect of $29,536,000, and an unfunded postretirement benefit obligation of $14,077,000, less tax effect of $5,439,000.PUBLIX SUPER MARKETS, INC.Notes to Consolidated Financial Statements(m) (o) vending machine commissions, mall gift card commissions, vending machine commissions, money transfer fees and coupon redemption income.(p) $8,898,000, $10,715,000$11,155,000, $9,190,000 and $7,982,000$8,898,000 for 2013, 2012 and 2011, 2010 and 2009, respectively.(q) $202,405,000, $191,788,000$217,451,000, $208,295,000 and $180,159,000$202,405,000 for 2013, 2012 and 2011, 2010 and 2009, respectively.(r) (s) (t) would impact the calculation of diluted earnings per share. All shares owned by the Employee Stock Ownership Plan (ESOP) are included in the earnings per share calculations. Cash dividendsDividends paid to the ESOP, as well as dividends on all other common stock shares, are reflected as a reduction of retained earnings. All common stock shares, including ESOP and 401(k) Plan shares, receive one vote per share and have the same dividend rights. The voting rights for ESOP shares allocated to participants’ accounts are passed through to the participants. The Trustee of the 401(k) Plan votes the shares held in that plan.PUBLIX SUPER MARKETS, INC.Notes to Consolidated Financial Statements(u) (2)Fair Value of Financial Instrumentsapproximateapproximates their respective carrying amounts due to their short-term maturity.31, 201128, 2013 and December 25, 2010: Fair (Amounts are in thousands) $4,253,255 473,099 3,780,156 --- 3,096,033 223,655 2,872,378 --- PUBLIX SUPER MARKETS, INC.Notes to Consolidated Financial Statements(3)Investments Fair Value Level 1 Level 2 Level 3 (Amounts are in thousands) December 28, 2013 $ 5,991,486 1,085,194 4,906,292 — December 29, 2012 5,033,106 713,741 4,319,365 — 31, 201128, 2013 and December 25, 2010: Gross Gross Amortized Unrealized Unrealized Fair (Amounts are in thousands) Tax exempt bonds $2,488,135 36,657 550 2,524,242 Taxable bonds 1,226,136 20,015 1,514 1,244,637 Restricted investments 170,000 --- 3,019 166,981 Equity securities 296,105 35,564 14,274 317,395 $4,180,376 92,236 19,357 4,253,255 Tax exempt bonds $1,932,466 13,308 8,322 1,937,452 Taxable bonds 867,430 16,108 2,542 880,996 Equity securities 219,737 60,536 2,688 277,585 $3,019,633 89,952 13,552 3,096,033 On December 29, 2010, the Company funded a restricted trust account in the amount of $170,000,000 for the benefit of its insurance carrier related to the Company’s workers’ compensation self-insurance reserves in lieu of providing a standby letter of credit or other security. The restricted trust account is invested in a mutual fund primarily comprised of short-term, investment grade bonds. Earnings from the investments held in the restricted trust account are paid to the Company in accordance with the terms of the trust agreement. Fair Value (Amounts are in thousands) 2013 Tax exempt bonds $ 3,430,028 25,588 9,917 3,445,699 Taxable bonds 1,445,901 7,641 3,863 1,449,679 Restricted investments 170,000 — 86 169,914 Equity securities 790,975 139,119 3,900 926,194 $ 5,836,904 172,348 17,766 5,991,486 2012 Tax exempt bonds $ 3,115,963 33,787 2,646 3,147,104 Taxable bonds 1,141,514 17,667 355 1,158,826 Restricted investments 170,000 431 — 170,431 Equity securities 510,613 58,631 12,499 556,745 $ 4,938,090 110,516 15,500 5,033,106 $35,864,000, $28,935,000 and $21,423,000$64,637,000 for 2011, 2010 and 2009, respectively.2013. Realized losses on sales and OTTI of AFS securities totaled $15,978,000, $4,419,000 and $28,224,000$16,868,000 for 2013. There were no OTTI losses on AFS securities in 2013.2010 and 2009, respectively. The Company recordedincluding OTTI losses on equity securities of $6,082,000 and $19,283,000 in 2011 and 2009, respectively. There were no OTTI losses on equity securities in 2010.$6,082,000. There were no OTTI losses on debt securities in 2011, 2010 and 2009.31, 201128, 2013 and December 25, 201029, 2012 are as follows: 2011 2010 Amortized
Cost Fair
Value Amortized
Cost Fair
Value (Amounts are in thousands) $ 445,296 447,972 332,992 336,282 2,492,484 2,524,020 1,499,176 1,506,731 348,427 356,808 337,677 335,056 428,064 440,079 630,051 640,379 3,714,271 3,768,879 2,799,896 2,818,448 170,000 166,981 --- --- 296,105 317,395 219,737 277,585 $4,180,376 4,253,255 3,019,633 3,096,033 PUBLIX SUPER MARKETS, INC.Notes to Consolidated Financial Statements 2013 2012 (Amounts are in thousands) Due in one year or less $ 824,780 829,559 792,946 797,260 Due after one year through five years 3,590,615 3,609,115 2,725,036 2,755,043 Due after five years through ten years 295,407 288,421 520,800 526,924 Due after ten years 165,127 168,283 218,695 226,703 4,875,929 4,895,378 4,257,477 4,305,930 Restricted investments 170,000 169,914 170,000 170,431 Equity securities 790,975 926,194 510,613 556,745 $ 5,836,904 5,991,486 4,938,090 5,033,106 31, 201128, 2013 and December 25, 2010: $138,892 536 6,026 14 144,918 550 201,538 1,514 --- --- 201,538 1,514 166,981 3,019 --- --- 166,981 3,019 86,236 13,899 1,889 375 88,125 14,274 $593,647 18,968 7,915 389 601,562 19,357 $624,553 8,321 54 1 624,607 8,322 155,160 2,045 4,130 497 159,290 2,542 30,065 1,914 3,571 774 33,636 2,688 $809,778 12,280 7,755 1,272 817,533 13,552 Total (Amounts are in thousands) 2013 Tax exempt bonds $ 502,304 6,710 106,985 3,207 609,289 9,917 Taxable bonds 535,233 3,347 19,367 516 554,600 3,863 Restricted investments 169,914 86 — — 169,914 86 Equity securities 31,400 3,499 3,152 401 34,552 3,900 $ 1,238,851 13,642 129,504 4,124 1,368,355 17,766 2012 Tax exempt bonds $ 566,914 2,646 — — 566,914 2,646 Taxable bonds 81,876 355 — — 81,876 355 Equity securities 209,759 8,878 14,260 3,621 224,019 12,499 $ 858,549 11,879 14,260 3,621 872,809 15,500 298262 AFS securities contributing to the total unrealized loss of $19,357,000$17,766,000 as of December 31, 2011.28, 2013. Unrealized losses related to debt securities are primarily driven bydue to interest rate volatility impacting the market value of certain bonds. The Company continues to receive scheduled principal and interest payments on these debt securities. Unrealized losses related to the equity securities are primarily driven by stockdue to temporary equity market volatility.(4)Consolidation of Joint Ventures and Long-Term DebtJVs,Joint Ventures (JV), in the legal form of limited liability companies, with certain real estate developers to partner in the development of shopping centers with the Company as the anchor tenant. Effective December 27, 2009, theThe Company adopted a new accounting standard on variable interest entities (VIE) that resulted in the consolidationconsolidates certain of certainthese JVs in which the Companyit has a controlling financial interest. The Company is considered to have a controlling financial interest in a JV when it has (1) the power to direct the activities of the JV that most significantly impact the JV’s economic performance and (2) the obligation to absorb losses or the right to receive benefits from the JV that could potentially be significant to such JV.PUBLIX SUPER MARKETS, INC.Notes to Consolidated Financial Statements31, 2011,28, 2013, the carrying amounts of the assets and liabilities of the consolidated JVs were $177,226,000$156,164,000 and $76,249,000,$50,205,000, respectively. As of December 29, 2012, the carrying amounts of the assets and liabilities of the consolidated JVs were $157,675,000 and $60,364,000, respectively. The assets are owned by, and the liabilities are obligations of, the JVs, not the Company, except for a portion of the long-term debt of certain JVs guaranteed by the Company. The JVs are financed with capital contributions from the members, loans and/or the cash flows generated by the JV owned shopping centers once in operation. Total earnings attributable to noncontrolling interests for 2011, 20102013, 2012 and 20092011 were immaterial. The Company’s involvement with these JVs does not have a significant effect on the Company’s financial condition, results of operations or cash flows.$34,299,000$20,485,000 and $42,165,000 during 2011. No loans were assumed during 2010.2013 and 2012, respectively. Maturities of JV loans range from July 2012April 2014 through January 2015June 2016 and have either (1) fixed interest rates ranging from 4.5% to 5.3% or (2) variable interest rates based on a LIBOR index plus basis points ranging from 195 basis points to 250 basis points. Maturities of assumed shopping center loans range from September 2013March 2014 through June 2024January 2027 and have fixed interest rates ranging from 5.1% to 7.1%7.5%.31, 2011,28, 2013, the aggregate annual maturities and scheduled payments of long-term debt are as follows: (Amounts are in thousands) $ 15,124 45,401 38,320 8,550 9,257 17,932 $ 134,584 Year (Amounts are in thousands) 2014 $ 37,509 2015 32,093 2016 30,621 2017 25,235 2018 22,619 Thereafter 14,077 $ 162,154 (5)Postretirement BenefitsActuarial losses were recognized in other comprehensive earnings of $9,459,000, less tax effect of $3,655,000, in 2011, $4,951,000, less tax effect of $1,913,000, in 2010 and $3,225,000, less tax effect of $1,246,000, in 2009.$3,146,000, $2,626,000$3,769,000, $3,785,000 and $4,483,000$3,146,000 during 2013, 2012 and 2011, 2010 and 2009, respectively.PUBLIX SUPER MARKETS, INC.Notes to Consolidated Financial Statements31, 201128, 2013 and December 25, 2010:0000000 0000000 2011 2010 (Amounts are in thousands) $ 94,776 86,890 163 175 5,301 5,291 10,530 5,046 (3,146) (2,626) 107,624 94,776 --- --- 3,146 2,626 (3,146) (2,626) --- --- $107,624 94,776 $ 4,029 3,841 103,595 90,935 $107,624 94,776 2013 2012 (Amounts are in thousands) Change in benefit obligation: Benefit obligation as of beginning of year $ 121,021 107,624 Service cost 114 148 Interest cost 4,521 4,866 Actuarial (gain) loss (14,563 ) 12,168 Benefit payments (3,769 ) (3,785 ) Benefit obligation as of end of year 107,324 121,021 Change in fair value of plan assets: Fair value of plan assets as of beginning of year — — Employer contributions 3,769 3,785 Benefit payments (3,769 ) (3,785 ) Fair value of plan assets as of end of year — — Unfunded status of the plan as of end of year $ 107,324 121,021 Current liability $ 4,561 4,300 Noncurrent liability 102,763 116,721 Total recognized liability $ 107,324 121,021 (Amounts are in thousands) $ 4,029 4,291 4,539 4,776 5,002 28,663 56,324 $ 107,624 Year (Amounts are in thousands) 2014 $ 4,561 2015 4,811 2016 5,047 2017 5,275 2018 5,487 2019 through 2023 30,781 Thereafter 51,362 $ 107,324 00000 00000 00000 2011 2010 2009 (Amounts are in thousands) $ 163 175 194 5,301 5,291 5,204 1,071 95 --- $6,535 5,561 5,398 2013 2012 2011 (Amounts are in thousands) Service cost $ 114 148 163 Interest cost 4,521 4,866 5,301 Amortization of actuarial losses 5,253 3,115 1,071 Net periodic postretirement benefit cost $ 9,888 8,129 6,535 PUBLIX SUPER MARKETS, INC.Notes to Consolidated Financial Statements 2011 2010 2009 4.6% 5.7% 6.2% 4.0% 4.0% 4.0% 2013 2012 2011 Discount rate 4.7 % 3.8 % 4.6 % Rate of compensation increase 4.0 % 4.0 % 4.0 % 2011 2010 2009 5.7% 6.2% 6.4% 4.0% 4.0% 4.0% 2013 2012 2011 Discount rate 3.8 % 4.6 % 5.7 % Rate of compensation increase 4.0 % 4.0 % 4.0 % corporate bonds with a rating of AA or better.(6)Retirement Plans$267,099,000, $253,093,000$292,075,000, $278,529,000 and $234,336,000$267,099,000 for 2013, 2012 and 2011, 2010 and 2009, respectively.15-month15-month period after distribution of the shares from the ESOP. The fair value of distributed shares subject to the put option totaled $116,824,000$42,568,000 and $114,815,000$126,647,000 as of December 31, 201128, 2013 and December 25, 2010,29, 2012, respectively. The cost of the shares held by the ESOP totaled $2,020,393,000$2,280,335,000 and $1,901,881,000$2,146,316,000 as of December 31, 201128, 2013 and December 25, 2010,29, 2012, respectively. Due to the Company’s obligation under the put option, the distributed shares subject to the put option and the shares held by the ESOP (collectively referred to as ESOP related shares) are classified as temporary equity in the mezzanine section of the consolidated balance sheets and totaled $2,137,217,000$2,322,903,000 and $2,016,696,000$2,272,963,000 as of December 31, 201128, 2013 and December 25, 2010,29, 2012, respectively. The fair value of the shares held by the ESOP totaled $4,917,283,000$7,139,235,000 and $4,887,626,000$5,418,856,000 as of December 31, 201128, 2013 and December 25, 2010,29, 2012, respectively. See Note 9.2011, 20102013, 2012 and 2009,2011, the Board of Directors approved a match of 50% of eligible contributions up to 3% of eligible wages, not to exceed a maximum match of $750$750 per employee. The match, which is determined as of the last day of the plan year and paid in the subsequent plan year, is in common stock of the Company. Compensation expense recorded for the Company’s match to the 401(k) plan was $24,141,000, $22,454,000$26,714,000, $24,957,000 and $21,774,000$24,141,000 for 2013, 2012 and 2011, 2010 and 2009, respectively.(7)Income Taxes2011, 20102013, 2012 and 20092011 were allocated as follows: (Amounts are in thousands) $ 769,807 701,271 613,272 (5,015 ) (3,135 ) 35,159 $ 764,792 698,136 648,431 2013 2012 2011 (Amounts are in thousands) Earnings $ 811,735 750,339 769,807 Other comprehensive earnings (losses) 30,674 5,056 (5,015 ) $ 842,409 755,395 764,792 (Amounts are in thousands) $592,275 90,486 682,761 81,684 5,362 87,046 $673,959 95,848 769,807 $601,098 23,778 624,876 79,451 (3,056 ) 76,395 $680,549 20,722 701,271 $518,269 28,064 546,333 67,985 (1,046 ) 66,939 $586,254 27,018 613,272 Current Deferred Total (Amounts are in thousands) 2013 Federal $ 725,463 (17 ) 725,446 State 85,211 1,078 86,289 $ 810,674 1,061 811,735 2012 Federal $ 654,715 9,861 664,576 State 88,622 (2,859 ) 85,763 $ 743,337 7,002 750,339 2011 Federal $ 592,275 90,486 682,761 State 81,684 5,362 87,046 $ 673,959 95,848 769,807 (Amounts are in thousands) $ 791,621 713,796 621,150 56,580 49,657 43,511 (46,675 ) (40,718 ) (36,033 ) (31,719 ) (21,464 ) (15,356 ) $ 769,807 701,271 613,272 2013 2012 2011 (Amounts are in thousands) Federal tax at statutory tax rate $ 862,991 805,908 791,621 State income taxes (net of federal tax benefit) 56,088 55,746 56,580 ESOP dividend (59,561 ) (76,900 ) (46,675 ) Other, net (47,783 ) (34,415 ) (31,719 ) $ 811,735 750,339 769,807 31, 201128, 2013 and December 25, 201029, 2012 are as follows: (Amounts are in thousands) $114,522 113,557 48,825 44,686 41,515 36,551 18,047 24,731 11,687 12,650 6,454 7,768 4,357 9,378 $245,407 249,321 $491,485 409,736 11,324 6,154 $502,809 415,890 2013 2012 (Amounts are in thousands) Deferred tax assets: Self-insurance reserves $ 118,276 116,901 Retirement plan contributions 53,299 49,876 Postretirement benefit cost 41,384 46,688 Lease accounting 22,890 12,489 Inventory capitalization 13,178 11,768 Reserves not currently deductible 11,760 15,986 Other 11,626 10,556 Total deferred tax assets $ 272,413 264,264 Deferred tax liabilities: $ 507,308 497,932 Investment valuation 56,358 24,086 Other 9,942 11,706 Total deferred tax liabilities $ 573,608 533,724 31, 201128, 2013 and December 25, 2010.20082010 through 20102012 tax years, and the Internal Revenue Service is currently auditing the 2008 and 20092010 through 2011 tax years. The periods subject to examination for the Company’s state returns are the 20072010 through 20102012 tax years. The Company believes that the outcome of any examination will not have a material effect on its financial condition, results of operations or cash flows. As of December 31, 2011 and December 25, 2010, the Company had immaterial accruals for income tax related interest expense.20112013 and 2010.2012. Because the Company does not have any unrecognized tax benefits as of December 31, 2011,28, 2013, there will be no effect on the Company’s effective income tax rate in future periods due to the recognition of unrecognized tax benefits.(8)Commitments and Contingencies(8) Accumulated Other Comprehensive Earnings 2011, 20102013, 2012 and 20092011 is as follows: (Amounts are in thousands) $ 410,590 410,390 437,857 110,900 117,249 123,736 (4,699 ) (5,912 ) (5,953 ) $ 516,791 521,727 555,640 2013 2012 2011 (Amounts are in thousands) Minimum rentals $ 429,755 432,450 410,590 Contingent rentals 116,445 112,819 110,900 Sublease rental income (4,820 ) (4,564 ) (4,699 ) $ 541,380 540,705 516,791 31, 2011,28, 2013, future minimum lease payments for all noncancelable operating leases and related subleases are as follows: Net (Amounts are in thousands) $ 423,516 3,975 419,541 407,277 3,831 403,446 380,002 3,309 376,693 351,137 1,025 350,112 326,609 406 326,203 2,385,617 414 2,385,203 $4,274,158 12,960 4,261,198 Year Net (Amounts are in thousands) 2014 $ 436,827 5,115 431,712 2015 415,546 3,185 412,361 2016 390,627 1,913 388,714 2017 364,356 1,609 362,747 2018 336,491 1,261 335,230 Thereafter 2,242,082 2,901 2,239,181 $ 4,185,929 15,984 4,169,945 Total rental amounts included in trade receivables were $1,827,000 and $1,459,000 as of December 31, 2011 and December 25, 2010, respectively. Rental income was $36,057,000, $32,576,000$47,056,000, $40,367,000 and $25,590,000$36,057,000 for 2011, 20102013, 2012 and 2009,2011, respectively. The amounts of minimum future rental payments to be received under noncancelable operating leases are $34,381,000, $28,711,000, $21,897,000, $15,433,000$38,814,000, $32,218,000, $25,634,000, $19,524,000 and $10,634,000$13,384,000 for the years 20122014 through 2016,2018, respectively, and $59,964,000$54,823,000 thereafter.(b)Letters of Credit31, 2011,28, 2013, the Company had $10,200,000$3,700,000$4,736,000 in standby letters of credit to support certain purchase obligations.(c)Litigationa party insubject from time to time to various legallawsuits, claims and actions consideredcharges arising in the normal course of business. The Company believes its recorded reserves are adequate in light of the probable and estimable liabilities. The estimated amount of reasonably possible losses for lawsuits, claims and charges, individually and in the aggregate, is considered to be immaterial. In the opinion of management, the ultimate resolution of these legal proceedings will not have a material adverse effect on the Company’s financial condition, results of operations or cash flows.(9)Correction of ErrorThe Company’s ESOP includes a put option for shares of the Company’s common stock distributed from the ESOP. Shares are distributed from the ESOP primarily to separated vested participants and certain eligible participants who elect to diversify their account balances. Since the Company’s common stock is not currently traded on an established securities market, if the owners of distributed shares desire to sell their shares, the Company is required to purchase the shares at fair value for a 15-month period after distribution of the shares from the ESOP. Due to the Company’s obligation under the put option, the ESOP related shares should be classified as temporary equity in the mezzanine section of the consolidated balance sheets. The ESOP related shares were previously classified in permanent equity. This correction of an error resulted in the December 25, 2010 permanent equity decreasing by $2,016,696,000 and temporary equity increasing by $2,016,696,000 from amounts previously reported. See Note 6.(10)Quarterly Information (unaudited)20112013 and 2010.2012. All quarters have 13 weeks, except the fourth quarter of 2011 which has 14 weeks. Quarter (Amounts are in thousands, except per share amounts) $6,836,402 6,621,633 6,425,379 7,295,350 6,264,682 6,079,262 5,978,544 6,721,351 398,167 382,369 311,902 399,528 0.51 0.48 0.40 0.51 $6,548,665 6,261,831 6,086,076 6,431,482 6,024,959 5,762,828 5,676,395 5,942,548 364,399 348,424 283,222 342,102 0.47 0.44 0.36 0.44 Quarter First Second Third Fourth (Amounts are in thousands, except per share amounts) 2013 Revenues $ 7,559,054 7,096,675 7,077,528 7,414,261 Costs and expenses 6,874,363 6,523,255 6,574,650 6,855,512 Net earnings 471,253 400,882 359,867 421,952 Basic and diluted earnings per share 0.61 0.51 0.46 0.54 2012 Revenues $ 7,126,096 6,838,426 6,702,251 7,039,999 Costs and expenses 6,526,747 6,291,900 6,208,015 6,514,859 Net earnings 409,411 381,631 368,426 392,787 Basic and diluted earnings per share 0.52 0.49 0.47 0.50 31, 2011,28, 2013, December 25, 201029, 201226, 200931, 2011 (Amounts are in thousands) $114,133 296,798 285,362 125,569 221,337 --- 1,677 219,660 $335,470 296,798 287,039 345,229 $119,375 269,063 274,305 114,133 229,589 --- 8,252 221,337 $348,964 269,063 282,557 335,470 $132,275 270,179 283,079 119,375 231,070 --- 1,481 229,589 $363,345 270,179 284,560 348,964 Description (Amounts are in thousands) Year Ended December 28, 2013 Reserves not deducted from assets: Self-insurance reserves: Current $ 138,998 332,922 321,060 150,860 Noncurrent 212,728 — 7,547 205,181 $ 351,726 332,922 328,607 356,041 Year Ended December 29, 2012 Reserves not deducted from assets: Self-insurance reserves: Current $ 125,569 306,788 293,359 138,998 Noncurrent 219,660 — 6,932 212,728 $ 345,229 306,788 300,291 351,726 Year Ended December 31, 2011 Reserves not deducted from assets: Self-insurance reserves: Current $ 114,133 296,798 285,362 125,569 Noncurrent 221,337 — 1,677 219,660 $ 335,470 296,798 287,039 345,229 Securities and Exchange Commission’sSEC’s rules and forms, and that such information has been accumulated and communicated to the Company’s management, including the Company’s Chief Executive Officer and Chief Financial Officer, in a manner that allows timely decisions regarding required disclosure. There have been no changes in the Company’s internal control over financial reporting identified in connection with the evaluation that occurred during the quarter ended December 31, 201128, 2013 that have materially affected, or are reasonably likely to materially affect, the internal control over financial reporting.1819 of this report. The Company’s independent registered public accounting firm, KPMG LLP, has issued their audit report on the effectiveness of the Company’s internal control over financial reporting, which is included on page 21.in Part I under the caption “Executive Officers of the Company.”on page 5. All other information concerning the directors and executive officers of the Company is incorporated by reference from the Proxy Statement of the Company (2012(2014 Proxy Statement), which the Company intends to file no later than 120 days after its fiscal year end.20122014 Proxy Statement.20122014 Proxy Statement.20122014 Proxy Statement.20122014 Proxy Statement.(a)Consolidated Financial Statements and Schedule(b)Exhibits3.1(a) 3.1(b) 3.2 By-lawsBy-Laws of the Company are incorporated by reference to the exhibitsan exhibit to the QuarterlyCurrent Report of the Company on Form 10-Q for the quarter ended June 29, 2002.10 and January 1, 2011.10.1Non-Employee Directors Stock Purchase Plan Summary Plan Description, as registered in the Form S-8 filed with the Securities and Exchange Commission on June 21, 2001, is incorporated by reference to the exhibits to the Quarterly Report of the Company on Form 10-Q for the quarter ended June 30, 2001.10.2 Plan.10.3Employee Stock Ownership Plan as amended and restated as of January 1, 2007 is incorporated by reference to the exhibits to the Annual Report of the Company on Form 10-K for the year ended December 29, 2007.10.4401(k) SMART Plan as amended and restated as of January 1, 2007 is incorporated by reference to the exhibits to the Annual Report of the Company on Form 10-K for the year ended December 29, 2007.10.5 10.6 Supplemental Executive Retirement Plan is incorporated by reference to an exhibit to the Current Report on Form 8-K dated November 14, 2012. 14 21 23 31.1 31.2 32.1 32.2 101 31, 2011,28, 2013, is formatted in Extensible Business Reporting Language: (i) Consolidated Balance Sheets, (ii) Consolidated Statements of Earnings, (iii) Consolidated Statements of Comprehensive Earnings, (iv) Consolidated Statements of Cash Flows, (v) Consolidated Statements of Stockholders’ Equity and (vi) Notes to Consolidated Financial Statements. PUBLIX SUPER MARKETS, INC. February 29, 2012 March 3, 2014 By: /s/ Carol Jenkins Barnett Director February 29, 2012March 3, 2014Carol Jenkins Barnett /s/ Hoyt R. Barnett Vice Chairman and Director February 29, 2012March 3, 2014Hoyt R. Barnett /s/ William E. Crenshaw Chief Executive Officer and Director February 29, 2012March 3, 2014William E. Crenshaw (Principal Executive Officer) /s/ Jane B. Finley Director February 29, 2012March 3, 2014Jane B. Finley /s/ Sherrill W. Hudson Director February 29, 2012March 3, 2014Sherrill W. Hudson /s/ Charles H. Jenkins, Jr. Chairman of the Board and Director February 29, 2012March 3, 2014Charles H. Jenkins, Jr. /s/ Howard M. Jenkins Director February 29, 2012March 3, 2014Howard M. Jenkins /s/ Stephen M. Knopik Director March 3, 2014 Stephen M. Knopik /s/ E. Vane McClurg Director February 29, 2012March 3, 2014E. Vane McClurg /s/ Maria A. Sastre Director February 29, 2012March 3, 2014Maria A. Sastre /s/ David P. Phillips Chief Financial Officer and Treasurer February 29, 2012March 3, 2014David P. Phillips (Principal Financial and Accounting Officer)