Form 10-K
| x | ANNUAL REPORT PURSUANT TO SECTION 13 OR 15(d) OF THE SECURITIES EXCHANGE ACT OF 1934 |
| ¨ | TRANSITION REPORT PURSUANT TO SECTION 13 OR 15(d) OF THE SECURITIES EXCHANGE ACT OF 1934 |
Chatham Lodging Trust
| Maryland | 27-1200777 | |
|
| |
| 50 Cocoanut Row, Suite | ||
| Palm Beach, Florida | 33480 | |
| (Address of Principal Executive Offices) | (Zip Code) | |
Telephone Number, Including Area Code)
Title of Each Class | Name of Each Exchange on Which Registered | |
| Common Shares of Beneficial Interest, par value $0.01 per share | New York Stock Exchange | |
¨ No
| Large accelerated filer | ¨ | Accelerated filer | ||||
| Non-accelerated filer | ¨ (Do not check if a smaller reporting company) | Smaller reporting company | ¨ | |||
28, 2013.
26,391,655.
Chatham Lodging Trust
1. 1A. 1B. 2. 3. 4. 5. 6. 7. Management’s Discussion and Analysis of Financial Condition and Results of Operations 7A. 8. 9. Changes in and Disagreements With Accountants on Accounting and Financial Disclosure 9A. 9B. 10. 11. 12. Security Ownership of Certain Beneficial Owners and Management and Related Stockholder Matters 13. Certain Relationships and Related Transactions, and Trustee Independence 14. 15. On February 8, 2011, Marriott International, Inc. ("Marriott"). Property Homewood Suites by Hilton Boston-Billerica/ Bedford/Burlington Homewood Suites by Hilton Minneapolis-Mall of America Homewood Suites by Hilton Nashville-Brentwood Homewood Suites by Hilton Dallas-Market Center Homewood Suites by Hilton Hartford-Farmington Homewood Suites by Hilton Orlando-Maitland Homewood Suites by Hilton Carlsbad (North San Diego County) Hampton Inn & Suites Houston-Medical Center Courtyard Altoona Springhill Suites Washington Residence Inn Long Island Holtsville Residence Inn White Plains Residence Inn New Rochelle Residence Inn Garden Grove Residence Inn Mission Valley Homewood Suites by Hilton San Antonio River Walk Doubletree Suites by Hilton Washington DC Residence Inn Tysons Corner Total/ Weighted Average 2013 as a REIT depends upon our ability to meet, on a continuing basis, through actual investment and operating results, various complex requirements under the Code relating to, among other things, the sources of our gross income, the composition and values of our assets, our distribution levels and the diversity of ownership of our shares of beneficial interest. We believe that we are organized in conformity with the requirements for qualification as a REIT under the Code and that our current and intended manner of operation will enable us to meet the requirements for qualification and taxation as a REIT for federal income tax purposes. For the years ended 2013, 2012 and 2011, the Company accrued incentive fees for IHM of $63,000, $16,000 and $0.0, respectively. rooms revenue and a agreement for the Denver Tech Hotel has an initial term of approximately 15 years and expires on October 31, 2028. The franchise agreement provides for a monthly program fee equal to 4.3% of the hotel's gross rooms revenue and a monthly royalty fee of approximately 5.5% of the hotel's gross rooms revenue. The Denver Tech Hotel franchise agreement does not have a built-in automatic renewal option. The HGI franchise agreement is terminable by HGI in the event that the applicable franchisee fails to cure an event of default or, in certain circumstances, such as the franchisee’s bankruptcy or insolvency, are terminable by HGI at will. 2012 2013 2014 2015 2016 Thereafter Total hotels and all our hotels (including capital improvements that may be required by franchisors), we may be unable to declare or pay distributions to our shareholders, or maintain our then-current dividend rate. The timing and amount of distributions are in the sole discretion of our Board of Trustees, which considers, among other factors, our financial performance, debt service obligations and applicable debt covenants (if any), and capital expenditure requirements. We cannot assure you we will generate sufficient cash in order to continue to fund distributions. If we violate covenants in our debt agreements, we could be required to repay all or a portion of our indebtedness before maturity at a time when we might be unable to arrange financing for such repayment on attractive terms, if at all. and future debt could impair our planned investment strategy and, if violated, result in a default. If we are unable to refinance our debt on acceptable terms, we may be forced to dispose of hotel properties on disadvantageous terms, potentially resulting in losses. We have placed mortgages on certain of our hotel properties to secure our credit facility, have assumed mortgages on assets. In any joint venture, we may have the right to buy our co-venturer’s interest or to sell our own interest on specified terms and conditions in the event of an impasse regarding a sale. However, it is possible that neither party will have the funds necessary to complete such a buy-out. In addition, we may experience difficulty in locating a third-party purchaser for our joint venture interest and in obtaining a favorable sale price for the interest. As a result, it is possible that we may not be able to exit the relationship if an impasse develops. In addition, there is no limitation under our declaration of trust and bylaws as to the amount of funds that we may invest in joint ventures. Accordingly, we may invest a substantial amount of our funds in joint ventures which ultimately may not be profitable as a result of disagreements with or among our co-venturers. . These factors could reduce the net operating profits of our TRSs and the rental income we receive from our TRS Lessees, which in turn could adversely affect our ability to make distributions to our shareholders. The costs of all these capital improvements could adversely affect our financial condition and amounts available for distribution to our shareholders. The impact that terrorist attacks in the U.S. or elsewhere could have on domestic and international travel and our business in particular cannot be determined but any such attacks or the threat of such attacks could have a material adverse effect on our business, our ability to finance our business, our ability to insure our properties and our results of operations and financial condition. We may seek to sell hotel properties in the future. There can be no assurance that we will be able to sell any hotel property on acceptable terms. the maximum extent permitted by Maryland law, in the defense of any proceeding to which he or she is made, or threatened to be made, a party by reason of his or her service to us. In addition, we may be obligated to advance the defense costs incurred by our trustees and officers. As a result, we and our shareholders may have more limited rights against our trustees and officers than might otherwise exist absent the current provisions in our declaration of trust and bylaws or that might exist with other companies. distribute less than 100% of our taxable income, we will be subject to federal corporate income tax on our undistributed REIT taxable income. In addition, we will be subject to a 4% nondeductible excise tax if the actual amount that we pay out to our shareholders in a calendar year is less than a minimum amount specified under the Code. Our only source of funds to make these distributions comes from distributions that we will receive from our operating partnership. Accordingly, we may be required to borrow money, sell assets or make taxable distributions of our capital shares or debt securities, to enable us to pay out enough of our REIT taxable income to satisfy the distribution requirement and to avoid federal corporate income tax and the 4% nondeductible excise tax in a particular year. TRS Lessee will not be treated as a general, no more than 5% of the value of our gross assets (other than government securities, securities that constitute qualified real estate assets and securities of our TRSs) can consist of the securities of any one issuer, and no more than 25% of the value of our total gross assets can be represented by the securities of one or more TRSs. If we fail to comply with these requirements at the end of any calendar quarter, we must correct the failure within 30 days after the end of the calendar quarter or qualify for certain statutory relief provisions to avoid losing our REIT qualification and suffering adverse tax consequences. As a result, we may be required to liquidate otherwise attractive investments. These actions could have the effect of reducing our income and amounts available for distribution to our shareholders. Because we have a indebtedness will be governed by an indenture or other instrument containing covenants restricting our operating flexibility and limiting our ability to make distributions to our shareholders. Additionally, any convertible or exchangeable securities that we issue in the future may have rights, preferences and privileges, including with respect to distributions, more favorable than those of our common shares and may result in dilution to owners of our common shares. Because our decision to issue debt or equity securities in any future offering or otherwise incur indebtedness will depend on market conditions and other factors beyond our control, we cannot predict or estimate the amount, timing or nature of our future offerings or financings, any of which could reduce the market price of our common shares and dilute the value of our common shares. The following table sets forth certain operating information for our wholly-owned hotels as of December 31, Property Homewood Suites by Hilton Boston-Billerica/ Bedford/ Burlington Homewood Suites by Hilton Minneapolis-Mall of America Homewood Suites by Hilton Nashville-Brentwood Homewood Suites by Hilton Dallas-Market Center Homewood Suites by Hilton Hartford-Farmington Homewood Suites by Hilton Orlando-Maitland Homewood Suites by Hilton Carlsbad (North San Diego County) Hampton Inn & Suites Houston-Medical Center Courtyard Altoona Springhill Suites Washington Residence Inn Long Island Holtsville Residence Inn White Plains Residence Inn New Rochelle Residence Inn Garden Grove Residence Inn Mission Valley Homewood Suites by Hilton San Antonio River Walk Doubletree Suites by Hilton Washington DC Residence Inn Tysons Corner Total/Weighted Average 2013: First quarter Second quarter Third quarter Fourth quarter First quarter Second quarter (From April 16, 2010) Third quarter Fourth quarter Chatham Lodging Trust Russell 2000 Index FTSE NAREIT All Equity REIT Index FTSE NAREIT Lodging/Resorts Index The following table sets forth information regarding the declaration, payment and income tax characterization of our distributions by the Company on our common shares for the Quarter to which distribution relates Second quarter (From April 16, 2010) Third quarter Fourth quarter Quarter to which distribution relates First quarter Second quarter Third quarter Fourth quarter 2014. Equity compensation plans approved by security Equity compensation plans not approved by security holders Pursuant to the terms of the amended secured senior credit facility, we will no longer be able to repurchase shares in the future. The following tables present selected historical financial information as of and for the years ended Statements of Operations Data: Total revenue Hotel operating expenses General and administrative Hotel property acquisition costs Property taxes and insurance Depreciation and amortization Total operating expenses Operating income (loss) Interest expense, including amortization of deferred financing fees Loss in unconsolidated entity Interest and other income Loss before income tax expense Income tax expense Net loss attributable to common shareholders Loss per common share, basic and diluted Weighted average number of common shares, basic and diluted Other Data: Cash provided by operating activities Cash used in investing activities Cash provided by financing activities Cash dividends declared per common share Balance Sheet Data: Investment in hotel properties, net Cash and cash equivalents Restricted cash Investment in unconsolidated real estate entities Hotel receivables (net of allowance for doubtful accounts) Deferred costs, net Prepaid expenses and other assets Total assets Debt Accounts payable and accrued expenses Distributions payable Total liabilities Total shareholders’ equity Noncontrolling interest in operating partnership Total liabilities and equity On February 8, 2011, 6,847 rooms, and held a 5.0% noncontrolling interest in a joint venture (the "Torrance JV") with Cerberus that owns the 248-room Residence Inn by Marriott in Torrance, CA. Revenue Average Daily Rate (“ADR”), Occupancy percentage, Funds From Operations (“FFO”), Adjusted FFO, Earnings before interest, taxes, depreciation and amortization (“EBITDA”), and Adjusted EBITDA. performance, and more specifically hotel revenue. 7.5%. as follows (in thousands): Total revenue was 2012, respectively, with $14.0 million of this increase attributable to the six recently acquired hotels and $6.5 million attributable to the Portland hotel acquired in late December 2012. Portfolio ADR Occupancy RevPar our ownership interest during the periods presented: 2012. Overall, total Insurance income real estate depreciation and amortization, gain or loss on sale of real estate assets and certain other items that we believe are not indicative of the performance of our underlying hotel properties. We believe that these items are more representative of our asset base and our acquisition and disposition activities than our ongoing operations, and that by excluding the effects of the items, FFO is useful to investors in comparing our operating performance between periods and between REITs that report FFO using the NAREIT definition. Funds From Operations (“FFO”): Net loss attributable to common shareholders Depreciation Adjustments for joint venture items FFO attributable to common shareholders Hotel property acquisition costs Other charges included in general and administrative expenses Adjustments for joint venture items Adjusted FFO Weighted average number of common shares Basic Diluted Earnings Before Interest, Taxes, Depreciation and Amortization (“EBITDA”): Net loss attributable to common shareholders Interest expense Income tax expense Depreciation and amortization Adjustments for joint venture items EBITDA Hotel property acquisition costs Adjustments for joint venture items Other charges included in general and administrative expenses Share based compensation Adjusted EBITDA FFO, Adjusted FFO, EBITDA and Adjusted EBITDA do not reflect changes in, or cash requirements for, our working capital needs; FFO, Adjusted FFO, EBITDA and Adjusted EBITDA do not reflect funds available to make cash distributions; EBITDA and Adjusted EBITDA do not reflect the significant interest expense, or the cash requirements necessary to service interest or principal payments, on our debts; Although depreciation and amortization are non-cash charges, the assets being depreciated and amortized may need to be replaced in the future, and FFO, Adjusted FFO, EBITDA and Adjusted EBITDA do not reflect any cash requirements for such replacements; Non-cash compensation is and will remain a key element of our overall long-term incentive compensation package, although we exclude it as an expense when evaluating our ongoing operating performance for a particular period using Adjusted EBITDA; Adjusted FFO and Adjusted EBITDA do not reflect the impact of certain cash charges (including acquisition transaction Other companies in our industry may calculate FFO, Adjusted FFO, EBITDA and Adjusted EBITDA differently than we do, limiting their usefulness as a comparative measure. FFO, EBITDA and Adjusted EBITDA are not measures of our liquidity. Because of these limitations, FFO, Adjusted FFO, EBITDA and Adjusted EBITDA should not be considered in isolation or as a substitute for performance measures calculated in accordance with GAAP. We compensate for these limitations by relying primarily on our GAAP results and using FFO, Adjusted FFO, EBITDA and Adjusted EBITDA only supplementally. Our consolidated financial statements and the notes to those statements included elsewhere are prepared in accordance with GAAP. 2013 any impairment charges) to less than additional year. Other key terms are as follows: 2013 securities or the possible sale of existing assets. Contractual Obligations Corporate office lease Revolving credit facility, including interest (1) Ground leases Property loans, including interest (1) shares, except for performance based shares for which dividends on unvested shares are not paid until these shares are vested. Qualitative Disclosures about Market Risk. Liabilities Floating rate: Debt Average interest rate (1) Fixed rate: Debt Average interest rate See our Consolidated Financial Statements and the Notes thereto beginning at page F-1 included in Item 15. The information required by this item is incorporated by reference to the 22, 2014. 22, 2014. 22, 2014. 22, 2014. 22, 2014. F-30 F-31: 10-K is set forth in the Exhibit Index, which immediately precedes such exhibits. Description of Exhibit SIGNATURE TITLE DATE Trustee Consolidated Balance Sheets at December 31, Consolidated Statements of Operations for the years ended December 31, Consolidated Statements of Equity for the years ended December 31, Consolidated Statements of Cash Flows for the years ended December 31, Schedule III Chatham Lodging Trust: Assets: Investment in hotel properties, net Cash and cash equivalents Restricted cash Investment in unconsolidated real estate entities Hotel receivables (net of allowance for doubtful accounts of approximately $17 and $15, respectively) Deferred costs, net Prepaid expenses and other assets Total assets Liabilities and Equity: Debt Accounts payable and accrued expenses Distributions payable Total liabilities Commitments and contingencies Equity: Shareholders’ Equity: Preferred shares, $0.01 par value, 100,000,000 shares authorized and unissued at December 31, 2011 and 2010 Common shares, $0.01 par value, 500,000,000 shares authorized; 13,820,854 and 13,819,939 shares issued and outstanding, respectively at December 31, 2011 and 9,208,750 shares issued and outstanding at December 31, 2010 Additional paid-in capital Accumulated deficit Total shareholders’ equity Noncontrolling Interests: Noncontrolling Interest in Operating Partnership Total equity Total liabilities and equity Revenue: Room Other operating Total revenue Expenses: Hotel operating expenses: Room Other operating Total hotel operating expenses Depreciation and amortization Property taxes and insurance General and administrative Hotel property acquisition costs Total operating expenses Operating income (loss) Interest and other income Interest expense, including amortization of deferred fees Loss in unconsolidated entity Loss before income tax expense Income tax expense Net loss attributable to common shareholders Loss per Common Share—Basic: Net loss attributable to common shareholders (Note 11) Loss per Common Share—Diluted: Net loss attributable to common shareholders (Note 11) Weighted average number of common shares outstanding: Basic Diluted Balance, January 1, 2010 Issuance of shares, net of offering costs of $13,752 Repurchase of common shares Issuance of restricted shares Forfeiture of restricted shares Amortization of share based compensation Dividends declared on common shares ($0.525 per share) Distributions declared on LTIP units ($0.525 per unit) Net loss Balance, December 31, 2010 Issuance of shares pursuant to Equity Incentive Plan Issuance of shares, net of offering costs of $4,153 Repurchase of vested common shares Amortization of share based compensation Dividends declared on common shares ($0.70 per share) Distributions declared on LTIP units ($0.70 per unit) Net loss Balance, December 31, 2 011 Cash flows from operating activities: Net loss Adjustments to reconcile net loss to net cash provided by operating activities: Depreciation Amortization of deferred franchise fees Amortization of deferred fees included in interest expense Share based compensation Equity in loss from unconsolidated entities Changes in assets and liabilities: Hotel receivables Deferred costs Prepaid expenses and other assets Accounts payable and accrued expenses Net cash provided by operating activities Cash flows from investing activities: Improvements and additions to hotel properties Acquisition of hotel properties, net of cash acquired Investment in unconsolidated entities Restricted cash Net cash used in investing activities Cash flows from financing activities: Proceeds from the issuance of long-term debt Borrowings on revolving credit facility Repayments on revolving credit facility Payments on debt Payment of financing costs Payment of offering costs Proceeds from issuance of common shares In-substance repurchase of vested common shares Distributions-common shares/units Net cash provided by financing activities Net change in cash and cash equivalents Cash and cash equivalents, beginning of period Cash and cash equivalents, end of period Supplemental disclosure of cash flow information: Cash paid for interest Cash paid for income taxes respectively. Land Building and improvements Furniture, fixtures and equipment Cash Restricted cash Accounts receivable Prepaid expenses and other assets Debt Accounts payable and accrued expenses Net assets acquired Net assets acquired, net of cash On February 8, 2011, the Company completed a follow-on common share offering generating gross proceeds of $73.6 million and net proceeds of approximately $69.4 Marriott International, Inc. ("Marriott"). 6. Loan costs Franchise fees Other Less accumulated amortization Deferred costs, net shares, except for performance based shares, for which dividends on unvested shares are not paid until those shares are vested. for shares that are anti-dilutive during the period. The Company’s restricted share awards and long-term incentive plan units are entitled to receive dividends, if declared. The rights to dividends declared are non-forfeitable, and therefore, the unvested restricted shares and long-term incentive plan units qualify as participating securities requiring the allocation of earnings under the two-class method to calculate EPS. The percentage of earnings allocated to the unvested restricted shares is based on the proportion of the weighted average unvested restricted shares outstanding to the total of the basic weighted average common shares outstanding and the weighted average unvested restricted shares outstanding. Basic EPS is then computed by dividing income less earnings allocable to unvested restricted shares by the basic weighted average number of shares outstanding. Diluted EPS is computed similar to basic EPS, except the weighted average number of shares outstanding is increased to include the effect of potentially dilutive securities. customers. was (in thousands): The Company incurred acquisition costs of Acquisition date Land Building and improvements Furniture, fixtures and equipment Cash Restricted cash Accounts receivable, net Deferred costs, net Prepaid expenses and other assets Debt Accounts payable and accrued expenses Net assets acquired Net assets acquired, net of cash (unaudited) Pro forma total revenue Pro forma net loss Pro forma income (loss) per share: Basic and diluted Weighted average Common Shares Outstanding Basic and diluted the Company assumed approximately 26,295,558 shares were issued as of January 1, 2011 to fund the acquisition of the properties. Consequently, the weighted average shares outstanding was adjusted to reflect this amount of such shares were treated as outstanding as of the beginning of the periods presented. Investment in hotel properties as of December 31, Land and improvements Building and improvements Furniture, fixtures and equipment Construction in progress Less accumulated depreciation Investment in hotel properties, net On During the years ended December 31, 2013 and 2012, the Company received cash distributions from the Torrance JV as follows (in thousands): Assets Investment in hotel properties, net Other assets Total Assets Liabilities and Equity Mortgages and notes payable Other liabilities Total Liabilities Equity: Chatham Lodging Trust Joint Venture Partner Total Equity Total Liabilities and Equity Revenue Total operating expenses Operating loss Net loss Chatham’s 10.3% interest of net loss reported as Equity in loss in unconsolidated entities Collateral Courtyard by Marriott Altoona, PA SpringHill Suites by Marriott Washington, PA Residence Inn by Marriott New Rochelle, NY Residence Inn by Marriott Garden Grove, CA Residence Inn by Marriott San Diego, CA Homewood Suites by Hilton San Antonio, TX Doubletree Suite by Hilton Washington, DC Residence Inn by Marriott Vienna, VA Company’s variable rate debt as of 2012 2013 2014 2015 2016 Thereafter purposes. Current: Federal State Current tax expense Deferred: Federal State Deferred tax expense Total tax expense Book income (loss) before income taxes Statutory rate of 34% applied to pre-tax income (loss) Effect of state and local income taxes, net of federal tax benefit Other items Total expense (benefit) Effective tax rate Deferred tax assets: Current: Allowance for doubtful accounts Net operating loss carryforwards Accrued compensation Valuation allowance Deferred tax asset current Non-current Total book/tax difference fixed assets Net deferred tax asset The Company declared total common share dividends of as follows: Common Shares 2013 Numerator: Net loss attributable to common shareholders Dividends paid on unvested restricted shares Net loss attributable to common shareholders excluding amounts attributable to unvested restricted shares Denominator: Weighted average number of common shares—basic Effect of dilutive securities: Unvested shares (1) Weighted average number of common shares—diluted Basic Earnings per Common Share: Net loss attributable to common shareholders per weighted average common share excluding amounts attributable to unvested restricted shares Diluted Earnings per Common Share: Net loss attributable to common shareholders per weighted average common share excluding amounts attributable to unvested restricted shares The Company maintains its Equity Incentive Plan to attract and retain independent trustees, executive officers and other key employees and service providers. The plan provides for the grant of options to purchase common shares, share awards, share appreciation rights, performance units and other equity-based awards. The plan was amended and restated as of May 17, 2013 to increase the maximum number of shares available under the plan to 3,000,000 shares. Share awards under this plan generally vest over three to five years, though compensation for the Company’s independent trustees 2013 awards. The Company measures compensation expense for time-based vesting restricted share awards based upon the fair market value of its common shares at the date of grant. For the performance-based shares granted in 2012, compensation expense is based on a valuation of $10.20 per performance share granted, which takes into account that some or all of the awards may not vest if long-term performance criteria are not met during the vesting period. For the performance-based shares granted in 2013, compensation expense is based on a valuation of $10.93 per performance share granted. Compensation expense is recognized on a straight-line basis over the vesting period and is included in general and administrative expense in the accompanying consolidated statements of operations. The Company pays dividends on Dividends for performance-based shares are accrued and paid annually only if and to the extent that long-term performance criteria established by the Board of Trustees are met and the recipient remains employed by the Company on the vesting date. Nonvested at beginning of the period Granted Vested Forfeited Nonvested at end of the period units were allocated their pro-rata share of the Company's net income (loss). threatened against the Company or its properties. 2012 2013 2014 2015 2016 Thereafter Total The manager. $0.0, respectively. There have been no incentive management fees paid to Concord. $9.4 million, $7.5 million and $5.6 million , respectively, for the years ended December 31, 2013, 2012 and 2011. 2011 Total revenue Total operating expenses Operating income (loss) Net loss attributable to common shareholders Loss per common share, basic and diluted (1) Weighted average number of common shares outstanding: Basic Diluted Incentive management fees paid to IHM for the years ended December 31, 2013, and 2012 and the 2011 period from October 27, 2011 (commencement of operations) to December 31, 2011 were $0, $400 and $0 (unaudited), respectively. During the year ended December 31, 2012, the Company recognized a net gain on sale of nine hotels in the amount of $2,496. Description Homewood Suites Orlando—Maitland, FL Homewood Suites Boston—Billerica, MA Homewood Suites Minneapolis—Mall of America, Bloomington, Homewood Suites Nashville—Brentwood, TN Homewood Suites Dallas—Market Center, Dallas, TX Homewood Suites Hartford—Farmington, CT Hampton Inn & Suites Houston—Houston, TX Residence Inn Holtsville—Holtsville, NY Courtyard Altoona—Altoona, PA SpringHill Suites Washington—Washington, PA Residence Inn White Plains—White Plains, NY Residence Inn New Rochelle—New Rochelle, NY Homewood Suites Carlsbad—Carlsbad, CA Residence Inn Garden Grove—Garden Grove, CA Residence Inn Mission Valley—San Diego, CA Homewood Suites San Antonio—San Antonio, TX Doubletree Suites Washington DC—Washington, DC Residence Inn Tyson’s Corner—Vienna, VA Grand Total(s) Balance at the beginning of the year Acquisitions Dispositions during the year Capital expenditures and transfers from construction-in-progress Investment in Real Estate Balance at the beginning of the year Depreciation and amortization Balance at the end of the year Page 1 PART I 2 11 30 31 32 32 PART II 33 37 39 49 50 50 50 51 PART III 52 52 52 52 52 PART IV 53 1Page Item 1. Business Item 1A. Risk Factors Item 1B. Unresolved Staff Comments Item 2. Properties Item 3. Legal Proceedings Item 4. Mine Safety Disclosures Item 5. Market for Registrant's Common Equity, Related Stockholder Matters and Issuer Purchases of Equity Securities Item 6. Selected Financial Data Item 7. Management's Discussion and Analysis of Financial Condition and Results of Operations Item 7A. Quantitative and Qualitative Disclosures about Market Risk Item 8. Consolidated Financial Statements and Supplementary Data Item 9. Changes in and Disagreements With Accountants on Accounting and Financial Disclosure Item 9A Controls and Procedures Item 9B. Other Information PART III. Item 10. Trustees, Executive Officers and Corporate Governance Item 11. Executive Compensation Item 12. Security Ownership of Certain Beneficial Owners and Management and Related Stockholder Matters Item 13. Certain Relationships and Related Transactions, and Trustee Independence Item 14. Principal Accountant Fees and Services PART IV Item 15. Exhibits and Financial Statement Schedules “intend,” “plan,” “may,” “should,” “will,” “project,” “estimate,” “anticipate,” “believe,” “expect,” “continue,” “potential,” “opportunity,”"intend," "plan," "may," "should," "will," "project," "estimate," "anticipate," "believe," "expect," "continue," "potential," "opportunity," and similar expressions, whether in the negative or affirmative. All statements regarding our expected financial position, business and financing plans are forward-looking statements. Factors which could have a material adverse effect on our operations and future prospects include those discussed in “Business,” “Risk"Business," "Risk Factors,” “Management’s" "Management's Discussion and Analysis of Financial Condition and Results of Operations,”" and elsewhere in this Annual Report on Form 10-K. These risks and uncertainties should be considered in evaluating any forward-looking statement contained in this report or incorporated by reference herein.1(“REIT”) on October 26, 2009. We elected to be taxed as a real estate investment trust for federal income tax purposes (a "REIT") commencing with our 2010 taxable year. The Company is internally-managed and was organized to invest primarily in premium-branded upscale extended-stay and select-service hotels.Weourits initial public offering (the “IPO”) on April 21, 2010. The IPO resulted in the sale of 8,625,000 common shares at $20.00 per share, generating $172.5 million in gross proceeds. Net proceeds, after underwriters’ discounts and commissions and other offering costs, were approximately $158.7 million. Concurrently with the closing of the IPO, in a separate private placement pursuant to Regulation D under the Securities Act of 1933, as amended (the “Securities Act”), wethe Company sold 500,000 of ourits common shares to Jeffrey H. Fisher, ourthe Company’s Chairman, President and Chief Executive Officer (“Mr. Fisher”), at the public offering price of $20.00 per share, for proceeds of $10.0 million.wethe Company completed a follow-on common share offering of 4,000,000 shares, generating gross proceeds of $73.6 million and net proceeds of approximately $69.4 million.adding capitaland net proceeds of approximately $48.4 million. On January 31, 2013, the Company issued an additional 92,677 common shares pursuant to our balance sheet. Using these funds as well as borrowing capacitythe exercise of the underwriters’ over-allotment option in the offering that closed on ourJanuary 14, 2013, generating gross proceeds of approximately $1.4 million and net proceeds of approximately $1.3 million. Proceeds from the January 2013 offering were used to repay debt under the Company’s secured revolving credit facility, including debt incurred in connection with the $28.0 million acquisition of the Hampton Inn Portland Downtown-Waterfront hotel in Portland, ME (the “Portland Hotel”) and the $34.8 million acquisition of the Courtyard by Marriott Houston Medical Center hotel in Houston, TX (the “Houston CY Hotel”).July 14, 2011, we acquired five hotels forJune 18, 2013, generating gross proceeds of approximately $7.8 million and net proceeds of approximately $7.4 million. Proceeds from the June 2013 offering were used to repay debt under the Company’s secured revolving credit facility, including debt incurred in connection with the $40.0 million acquisition of the Hyatt Place Pittsburgh North Shore hotel in Pittsburgh, PA (the “Pittsburgh Hotel”) and the August 9, 2013, $15.2 million acquisition of the Hampton Inn and Suites by Hilton in Exeter, NH (the "Exeter Hotel").aggregateadditional 487,500 common shares pursuant to the exercise of the underwriter's over-allotment option in the offering that closed on September 30, 2013, generating gross proceeds of approximately $8.9 million and net proceeds of approximately $8.5 million. Proceeds from the September 2013 offering were used to repay debt under the Company's secured revolving credit facility, including debt incurred in connection with the $27.9 million acquisition of the Denver Tech Hilton Garden Inn hotel in Denver, CO (the "Denver Tech Hotel") and to partially fund the $71.8 million purchase price for the Company's acquisition of $195 million, including the assumption of five individual mortgage loans secured by the hotels totaling $134.2 million. Additionally, we invested $37.0 million for an approximate 10.3% interestResidence Inn Seattle Bellevue/Downtown in a joint venture (the “JV”) with Cerberus Capital Management (“Cerberus”) that acquired 64 hotels from Innkeepers USA Trust (“Innkeepers”) on October 27, 2011. Bellevue, WA. accounts for this investment under the equity method.We had no operations prior to the consummation of the IPO. Following the closing of the IPO, we contributed theThe net proceeds from the IPO and the concurrent private placement, as well as the proceeds of our February 2011 offering,offerings are contributed to Chatham Lodging, L.P., our operating partnership (the “Operating Partnership”), in exchange for partnership interests in the Operating Partnership.interests. Substantially all of ourthe Company’s assets are held by, and all of our operations are conducted through, the Operating Partnership. Chatham Lodging Trust is the sole general partner of the Operating Partnership and owns 100% of the common units of limited partnership interest in the Operating Partnership. Certain of ourthe Company’s executive officers hold vested and unvested long-term incentive plan units in the Operating Partnership, which are presented as noncontrollingnon-controlling interests on our consolidated balance sheets.2011, we2013, the Company owned 1825 hotels with an aggregate of 2,4143,591 rooms located in 1015 states and the District of Columbia, and wealso held a 10.3% minoritynoncontrolling interest in the JV, whicha joint venture (the “Innkeepers JV”) with Cerberus Capital Management (“Cerberus”) that owns 6451 hotels comprising an aggregate of 8,329 rooms.6,847 rooms and held a 5.0% noncontrolling interest in a joint venture (the "Torrance JV", together with the Innkeepers JV, the JVs) with Cerberus that owns the 248-room Residence Inn by Marriott in Torrance, CA. To qualify as a REIT, wethe Company cannot operate theits hotels. Therefore, the Operating Partnership and its subsidiaries lease ourthe Company’s wholly owned hotels to taxable REIT subsidiary lessees (“TRS Lessees”), which are wholly owned by one of ourthe Company’s taxable REIT subsidiary (“TRS”) holding companies. We indirectly own our interest in [51] of the 64 JV hotels through the Operating Partnership, and we own our interest in the remaining [13] JV hotels through one of our TRS holding companies. All of the JVCompany's joint venture hotels are leased to TRS Lessees in which wethe Company indirectly own a 10.3% minority interestsowns noncontrolling interest through one of ourits TRS holding companies.company's. Each hotel is leased to a TRS Lessee under a percentage lease that provides for rental payments equal to the greater of (i) a fixed base rent amount or (ii) a percentage rent based on hotel room revenue. The initial term of each of the TRS leases is five years. Lease revenue from each TRS Lessee is eliminated in consolidation.Mr.Jeffrey H. Fisher, manages 10the Company's Chairman, President and Chief Executive Officer, managed 23 of ourthe Company’s wholly owned hotels; Homewood Suites Management LLC, a subsidiary of Hilton Worldwide Inc. (“Hilton”) manages six of our wholly owned hotels;hotels and Concord Hospitality Enterprises Company (“Concord”) managesmanaged two of ourthe Company’s wholly owned hotels. All but oneAs of December 31, 2013, all of the Innkeepers JV hotels arewere managed by IHM. OneThe Torrance JV hotel is managed by Dimension Development Company.2OurAs of December 31, 2013, our wholly owned hotels includes upscale extended-stay hotels that operate under the Homewood Suites by Hilton® brand (eight hotels) and Residence Inn by Marriott® brand (six(eight hotels), as well as premium-branded select-service hotels that operate under the Courtyard by Marriott® brand (one hotel)(two hotels), the Hampton Inn or Hampton Inn and Suites by Hilton® brand (one hotel)(three hotels), the SpringHill Suites by Marriott® brand (two hotels), the Hilton Garden Inn by Hilton® brand (one hotel) and the Doubletree Suites by Hilton®Hyatt Place® brand (one hotel).principal customer base includes business travelers who are on extended assignments and corporate relocations;services and amenities include complimentary breakfast and evening hospitality hour, high-speed internet access, in-room movie channels, limited meeting space, daily linen and room cleaning service, 24-hour front desk, guest grocery services, and an on-site maintenance staff; and • principal customer base includes business travelers who are on extended assignments and corporate relocations; • services and amenities include complimentary breakfast and evening hospitality hour, high-speed internet access, in-room movie channels, limited meeting space, daily linen and room cleaning service, 24-hour front desk, guest grocery services, and an on-site maintenance staff; and • physical facilities include large suites, quality construction, full separate kitchens in each guest suite, quality room furnishings, pool, and exercise facilities. physical facilities include large suites, quality construction, full separate kitchens in each guest suite, quality room furnishings, pool, and exercise facilities., and SpringHill Suites by Marriott® and Doubletree Suites®. The service and amenity offerings of these hotels typically include complimentary breakfast, high-speed internet access, local calls, in-room movie channels, and daily linen and room cleaning service.31825 wholly-owned hotels at December 31, 2011: Location Management
Company Date of
Acquisition Year
Opened Number
of
Rooms Purchase
Price Purchase
Price per
Room Debt (Unaudited) Billerica, Massachusetts Hilton April 23, 2010 1999 147 $ 12.5 million $ 85,714 — Bloomington, Minnesota Hilton April 23, 2010 1998 144 $ 18.0 million $ 125,000 — Brentwood, Tennessee Hilton April 23, 2010 1998 121 $ 11.3 million $ 93,388 — Dallas, Texas Hilton April 23, 2010 1998 137 $ 10.7 million $ 78,102 — Farmington, Connecticut Hilton April 23, 2010 1999 121 $ 11.5 million $ 95,041 — Maitland, Florida Hilton April 23, 2010 2000 143 $ 9.5 million $ 66,433 — Carlsbad, California Island Hospitality November 3, 2010 2008 145 $ 32.0 million $ 220,690 — Houston, Texas Island Hospitality July 2, 2010 1997 120 $ 16.5 million $ 137,500 — Altoona, Pennsylvania Concord August 24, 2010 2001 105 $ 11.3 million $ 107,619 $ 6.8 million Washington, Pennsylvania Concord August 24, 2010 2000 86 $ 12.0 million $ 139,535 $ 5.3 million Holtsville, New York Island Hospitality August 3, 2010 2004 124 $ 21.3 million $ 171,774 — White Plains, New York Island Hospitality September 23, 2010 1982 133 $ 21.2 million $ 159,398 — New Rochelle, New York Island Hospitality October 5, 2010 2000 124 $ 21.0 million $ 169,355 $ 15.7 million Garden Grove, CA Island Hospitality July 14, 2011 2003 200 $ 43.6 million $ 218,000 $ 32.4 million San Diego, CA Island Hospitality July 14, 2011 2003 192 $ 52.5 million $ 273,438 $ 40.0 million San Antonio, TX Island Hospitality July 14, 2011 1996 146 $ 32.5 million $ 222,603 $ 18.4 million Washington, DC Island Hospitality July 14, 2011 1974 105 $ 29.4 million $ 280,000 $ 19.9 million Vienna, VA Island Hospitality July 14, 2011 2001 121 $ 37.0 million $ 305,785 $ 22.9 million 2,414 $ 403.8 million $ 163,854 $ 161.4 million 4Property Location Management Company Date of Acquisition Year Opened Number of Rooms Purchase Price Purchase Price per Room Mortgage Debt Balance Homewood Suites by Hilton Boston-Billerica/ Bedford/ Burlington Billerica, Massachusetts Island Hospitality 4/23/2010 1999 147 $12.5 million $ 85,714 — Homewood Suites by Hilton Minneapolis-Mall of America Bloomington, Minnesota Island Hospitality 4/23/2010 1998 144 $18.0 million $ 125,000 — Homewood Suites by Hilton Nashville-Brentwood Brentwood, Tennessee Island Hospitality 4/23/2010 1998 121 $11.3 million $ 93,388 — Homewood Suites by Hilton Dallas-Market Center Dallas, Texas Island Hospitality 4/23/2010 1998 137 $10.7 million $ 78,102 — Homewood Suites by Hilton Hartford-Farmington Farmington, Connecticut Island Hospitality 4/23/2010 1999 121 $11.5 million $ 95,041 — Homewood Suites by Hilton Orlando-Maitland Maitland, Florida Island Hospitality 4/23/2010 2000 143 $9.5 million $ 66,433 — Homewood Suites by Hilton Carlsbad (North San Diego County) Carlsbad, California Island Hospitality 11/3/2010 2008 145 $32.0 million $ 220,690 — Hampton Inn & Suites Houston-Medical Center Houston, Texas Island Hospitality 7/2/2010 1997 120 $16.5 million $ 137,500 — Courtyard Altoona Altoona, Pennsylvania Concord 8/24/2010 2001 105 $11.3 million $ 107,619 $6.4 million Springhill Suites Washington Washington, Pennsylvania Concord 8/24/2010 2000 86 $12.0 million $ 139,535 $4.9 million Residence Inn Long Island Holtsville Holtsville, New York Island Hospitality 8/3/2010 2004 124 $21.3 million $ 171,774 — Residence Inn White Plains White Plains, New York Island Hospitality 9/23/2010 1982 133 $21.2 million $ 159,398 — Residence Inn New Rochelle New Rochelle, New York Island Hospitality 10/5/2010 2000 124 $21.0 million $ 169,355 $15.2 million Residence Inn Garden Grove Garden Grove, California Island Hospitality 7/14/2011 2003 200 $43.6 million $ 218,000 $32.3 million Residence Inn Mission Valley San Diego, California Island Hospitality 7/14/2011 2003 192 $52.5 million $ 273,438 $30.5 million Homewood Suites by Hilton San Antonio River Walk San Antonio, Texas Island Hospitality 7/14/2011 1996 146 $32.5 million $ 222,603 $17.5 million Residence Inn Washington DC Washington, DC Island Hospitality 7/14/2011 1974 103 $29.4 million $ 280,000 — Residence Inn Tysons Corner Vienna, Virginia Island Hospitality 7/14/2011 2001 121 $37.0 million $ 305,785 $23.9 million Hampton Inn Portland Downtown Portland, Maine Island Hospitality 12/27/2012 2011 122 $28.0 million $ 229,508 — Courtyard Houston Houston, Texas Island Hospitality 2/5/2013 2010 197 $34.8 million $ 176,395 $19.8 million Hyatt Place Pittsburgh North Shore Pittsburgh, Pennsylvania Island Hospitality 6/17/2013 2011 178 $40.0 million $ 224,719 $24 million Hampton Inn Exeter Exeter, New Hampshire Island Hospitality 8/9/2013 2010 111 $15.2 million $ 136,937 — Hilton Garden Inn Denver Tech Denver, Colorado Island Hospitality 9/26/2013 1999 180 $27.9 million $ 155,000 — Residence Inn Bellevue Bellevue, Washington Island Hospitality 10/31/2013 2008 231 $71.8 million $ 316,883 $47.6 million Springhill Suites Savannah Savannah, Georgia Island Hospitality 12/5/2013 2008 160 $39.8 million $ 248,438 — Total 3,591 $661.3 million $ 184.155 $222.1 million • • • brands’brands' marketing programs, develop effective sales management policies and plans, operate properties efficiently, control costs, and develop operational initiatives for our hotels that increase guest satisfaction. As part of our asset management activities, we regularly review opportunities to reinvest in our hotels to maintain quality, increase long-term value and generate attractive returns on invested capital. • both brand-affiliated management companies and independent management companies, including IHM, a hotel management company 90% owned by Mr. Fisher that currently manages ten23 of our hotels.hotels and all of the hotels owned by the Innkeepers JV. We believe this strategy increases the universe of potential acquisition opportunities we can consider because many hotel properties are encumbered by long-term management contracts. • requirenot necessarily cause us to repay debt. In the 2011 second quarter,debt to comply with this limitation. However, our Board of Trustees approved the temporary increase in our targeted leverage to not more than 55 percent, not including our share of assets and liabilities of the JV. Our Board of Trusteescurrently believes that temporarily increasing our leverage limit at this stage of the lodging recovery cycle recovery, while interest rates on a historical basis are very attractive, is prudent to take advantage of the opportunity to buy hotels in the near term. appropriate. At December 31, 2013, our current leverage ratio was 38 percent, which is down from 51 percent at December 31, 2012. Over time, we intend to finance our growth with issuances of common andshares, preferred shares and debt. Our debt may include mortgage debt collateralized by our hotel properties and unsecured debt.5the acquisition and investmentinvestments in hotel properties from institutional pension funds, private equity investors, REITs, hotel companies and others who are engaged in the acquisition of hotels.hotel investments. Some of these entities have substantially greater financial and operational resources than we have.have or may be willing to use higher leverage. This competition may increase the bargaining power of property owners seeking to sell, reduce the number of suitable investment opportunities available to us and increase the cost of acquiring our targeted hotel properties.(“ADA”("ADA") to the extent that such properties are “public accommodations”"public accommodations" as defined by the ADA. Under the ADA, all public accommodations must meet federal requirements related to access and use by disabled persons. The ADA may require removal of structural barriers to access by persons with disabilities in certain public areas of our properties where such removal is readily achievable. Although we believe that the properties in our portfolio substantially comply with present requirements of the ADA, we have not conducted a comprehensive audit or investigation of all of our properties to determine our compliance, and one or more properties may not be fully compliant with the ADA.will taketook effect. The new guidelines could causehave caused us to renovate some of our hotel properties to incur costly measurescosts to become fully compliant.6owner’sowner's liability therefore as to any property are generally not limited under such laws and could exceed the value of the property and/or the aggregate assets of the owner. The presence of such substances, or the failure to properly remediate contamination from such substances, may adversely affect the owner’sowner's ability to sell the real estate or to borrow funds using such property as collateral, which could have an adverse effect on our return from such investment.future laws, ordinances or regulations will not impose material environmental liability; orthe current environmental condition of a hotel will not be affected by the condition of properties in the vicinity of the hotel (such as the presence of leaking underground storage tanks) or by third parties unrelated to us.Employment RegulationsA number of members of the U.S. Congress and President Obama have stated that they support the Employee Free Choice Act, which, if enacted, would discontinue the current practice of having an open process where both the union and the employer are permitted to educate employees regarding the pros and cons of joining a union before having an election by secret ballot. Under the Employee Free Choice Act, employees would only hear the union’s side of the argument before making a commitment to join the union. The Employee Free Choice Act would permit unions to quietly collect employee signatures supporting the union without notifying the employer and permitting the employer to explain its views before a final decision is made by the employees. Once a union has collected signatures from a majority of the employees, the employer would have to recognize, and bargain with, the union. If the employer and the union fail to reach agreement on a collective bargaining contract within a certain number of days, both sides would be forced to submit their respective proposals to binding arbitration and a federal arbitrator would be permitted to create an employment contract binding on the employer. If the Employee Free Choice Act is enacted, a number of the hotel properties we own or seek to acquire could become unionized.Generally, unionized hotel employees are subject to a number of work rules that could decrease operating margins at the unionized hotels. If that is the case, we believe that the unionization of hotel employees at hotels that we acquire may result in a significant decline in hotel profitability and value, which could adversely affect our financial condition, results of operations, the market price of our common shares and our ability to make distributions to our shareholders.• there are not existing environmental liabilities related to our properties of which we are not aware • future laws, ordinances or regulations will not impose material environmental liability; or • the current environmental condition of a hotel will not be affected by the condition of properties in the vicinity of the hotel (such as the presence of leaking underground storage tanks) or by third parties unrelated to us. 7 Moreover, our TRS holding company that indirectly owns our interest in 13 of the JV hotels will be subject to federal, state and local corporate income tax on its allocable share of all of the income from those hotels.We assumed the existing hotel management agreements in place at six of our hotels—the Boston-Billerica Homewood Suites, Minneapolis-Bloomington Homewood Suites, Nashville-Brentwood Homewood Suites, Dallas Homewood Suites, Hartford-Farmington Homewood Suites and Orlando-Maitland Homewood Suites—all of which are managed by Promus Hotels, Inc., a subsidiary of Hilton Hotels Worldwide (“Hilton”). Each of these hotel management agreements became effective on December 20, 2000, has an initial term of 15 years and may be renewed for an additional five-year period at the manager’s option by written notice to us no later than 120 days prior to the expiration of the initial term.Under these six hotel management agreements, the manager receives a base management fee equal to 2% of the hotel’s gross room revenue and, if certain financial thresholds are met or exceeded, an incentive management fee equal to 10% of the hotel’s net operating income, less fixed costs, base management fees, agreed-upon return on the owner’s original investment and debt service payments. In addition to the management fee, a franchise royalty fee equal to 4% of the hotel’s gross room revenue and program fees equal to 4% of the hotel’s gross room revenue are also payable to Hilton. See “Hotel Franchise Agreements”. Prior to April 23, 2013, each of these six management agreements may be terminated for cause, including the failure of the managed hotel to meet specified performance levels, and may be terminated by the manager in the event we undergo a change in control. If the new owner does not assume the existing management agreement and does not obtain a Homewood Suites franchise license upon such a change of control, we will be required to pay a termination fee to the manager. Beginning on April 23, 2013, we may terminate the six Hilton management agreements upon six months notice to the manager without payment of a termination fee. If we were to terminate the management agreements prior to the termination date, we may be responsible for paying termination fees to the manager.Ourourthe TRS lessee or the manager by written notice to the other party no later than 90 days prior to the then current term’s expiration date. The management agreements may be terminated for cause, including the failure of the managed hotel operating performance to meet specified levels. If wethe Company were to terminate the management agreements during the first nine years of the term until February 28, 2016, other than for breach or default by the manager, we maythe Company would be responsible for paying termination fees to the manager.8Allour remainingDecember 31, 2013, all but two of the hotels owned by the Company are managed by IHM, which is 90% owned by Mr. Fisher. OurIHM. The management agreements with IHM have an initial term of five years and may be renewed for two five-year periods at IHM’s option by written notice to us no later than 90 days prior to the then current term’s expiration date. The IHM management agreements provide for early termination at ourthe Company’s option upon sale of any IHM-managed hotel for no termination fee, with six months advance notice. The IHM management agreements may be terminated for cause, including the failure of the managed hotel to meet specified performance levels. Management agreements with IHM provide for a base management fee of 3%between 2-3% of the managed hotel’s gross revenuesrevenues. Management agreements with IHM also provide for the Hampton Inn Houston, TX, Residence Inn Holtsville, NY, Residence Inn White Plains, NY, Residence Inn New Rochelle, NY and Homewood Suites Carlsbad, CA and 2.5% of the managed hotel’s gross revenues for the Residence Inn Garden Grove, CA, Residence Inn San Diego, CA, Homewood Suites San Antonio, TX, Doubletree Suites Washington, DC and Residence Inn Tysons Corner, VA and an accounting fee offees up to $1,500 per month per hotel, revenue management fees up to $1,000 per month per hotel and, if certain financial thresholds are met or exceeded, an incentive management fee equal to 10% of the hotel’s net operating income less fixed costs, base management fees and a specified return threshold. The incentive management fee is capped at 1% of gross hotel revenues for the applicable calculation.the Company’sour TRS Lessees has entered into hotel franchise agreements with Promus Hotels, Inc., a subsidiary of Hilton, for our eight Homewood Suites by Hilton® hotels. Each of the hotel franchise agreements has an initial term ranging from 15-18 years.years and will expire between 2025 and 2028. These Hilton hotel franchise agreements provide for a franchise royalty fee equalup to 4%6% of the hotel’s gross room revenue and a program fee equal to 4% of the hotel’s gross room revenue. The Hilton franchise agreements provide that the franchisor may terminate the franchise agreement in the event that the applicable franchisee fails to cure an event of default, or in certain circumstances such as the franchisee’s bankruptcy or insolvency, are terminable by Hilton at will.the Company’sour TRS Lessees has entered into franchise agreements with Marriott International, Inc., (“Marriott”), relating to oureight Residence Inn properties, in Holtsville, New York, New Rochelle, New York, White Plains, New York, Garden Grove, CA, San Diego, CAtwo Courtyard properties and Vienna, VA, our Courtyard property in Altoona, Pennsylvania and ourtwo SpringHill Suites property in Washington, Pennsylvania.properties. These franchise agreements have initial terms ranging from 15 to 20 years and will expire between 2025 and 2031.2033. None of the agreements hashave a built-in automatic renewal option. The Marriott franchise agreements provide for franchise fees ranging from 5.0% to 5.5% of the hotel’s gross room sales and marketing fees ranging from 2.0% to 2.5% of the hotel’s gross room sales. The Marriott franchise agreements are terminable by Marriott in the event that the applicable franchisee fails to cure an event of default or, in certain circumstances, such as the franchisee’s bankruptcy or insolvency, are terminable by Marriott at will. The Marriott franchise agreements provide that, in the event of a proposed transfer of (i) the hotel, our(ii) the TRS Lessee’s interest in the agreement or (iii) more than a specified amount of the TRS Lessee to a competitor of Marriott, Marriott has the right to purchase or lease the hotel under terms consistent with those contained in the respective offer and may terminate if our TRS Lessee elects to proceed with such a transfer.the Company’sour TRS Lessees has entered into a franchise agreementagreements with Hampton Inns Franchise LLC (“Hampton Inns”), relating to thefor three Hampton Inn & Suites® Houston-Medical Center.. The franchise agreement for the Houston Hotel has an initial term of approximately 10 years and expires on July 31, 2020. There is no renewal option.The franchise agreement for the Portland Hotel has an initial term of approximately 20 years and expires on February 29, 2032. The franchise agreement for the Exeter Hotel has an initial term of approximately 18 years and expires on July 31, 2031. The Hampton Inns franchise agreement providesagreements provide for a monthly program fee equal to 4% of the managed hotel’s gross rooms revenue and a monthly royalty fee equalfees ranging from 5% to 5%6% of the managed hotel’s gross rooms revenue. None of the agreements have a built-in automatic renewal option. Hampton Inns may terminate the franchise agreement in the event that the franchisee fails to cure an event of default or, in certain circumstances, such as the franchisee’s bankruptcy or insolvency, Hampton Inns may terminate the agreement at will.the Company’sour TRS Lessees haslessees entered into a franchise agreement with Doubletree Franchise LLC (“Doubletree”("Doubletree"), relating to the Company's Washington, D.C. hotel, which formerly operated as a Doubletree Guest Suites by Hilton in Washington, DC.Hilton. The Doubletree franchise agreement was terminated on January 31, 2013 for no costs. As of December 31, 2013, the hotel is operating as a Residence Inn by Marriott.10approximately 17 years and will expireexpires on July 31, 2021.December 2, 2030. The franchise agreement is non-renewable. The Doubletree hotel franchise agreement provides for a franchise royaltymonthly program fee equal to 5% of the hotel’shotel's gross room9programmonthly royalty fee equal to 4%of approximately 3.5% of the hotel’shotel's gross roomrooms revenue. The DoubletreePittsburgh Hotel franchise agreement generally has no termination rights unlessis not renewable. The Hyatt franchise agreement is terminable by Hyatt in the event that the applicable franchisee fails to cure an event of default or, in accordancecertain circumstances, such as the franchisee’s bankruptcy or insolvency, are terminable by Hyatt at will.agreements.garagegarages leases for the next five years and thereafter as of December 31, 2013 (in thousands): Amount $ 203 205 207 210 212 11,660 $ 12,697 Condominium LeasesThe Residence Inn White Plains hotel is part of a condominium known as La Reserva Condominium (the “Condominium”). The Condominium is comprised of 143 residential units and four commercial units. The four commercial units are owned by us and are part of the White Plains hotel. The White Plains hotel is comprised of 129 of the residential units owned by us and four residential units leased by us from unaffiliated third party owners. The remaining 10 residential units are owned and occupied by unaffiliated third party owners.We lease 4 residential units in the White Plains hotel from individual owners (the “Condo Owner”). The lease agreements are for 6 years with a one-time 5 year renewal option. The White Plains hotel has the right to sublease the unit to any third party, including hotel guests, for such rent and on such terms as the White Plains hotel may determine. Each Condo Owner may reserve the unit for seven days in any calendar quarter or two weeks in any calendar year. In the event of such a reservation by the Condo Owner, the White Plains hotel will have no obligation to pay rent during such period. Each Condo Owner is also obligated to reimburse the White Plains hotel for renovations that were completed in 2008. Minimum annual rents payable to the Condo Owner are approximately $70 thousand per year and amounts receivable from the Condo Owner for its renovation reimbursements are approximately $11 thousand per year, subject to a balloon repayment at the end of the lease term of any remaining reimbursements. The White Plains hotel is responsible for paying assessments to the Condominium association on a monthly basis for all residential units owned and leased. The White Plains hotel provides certain services to the Condominium association for housekeeping, maintenance and certain other services and receives compensation from the Condominium association for these services.10 Amount 2014 $ 207 2015 210 2016 212 2017 214 2018 217 Thereafter 11,228 Total $ 12,288 5, 2012,10, 2014, we had six employees.27 employees, 20 of which are shared with or allocated to the Innkeepers JV. All persons employed in the day to dayday-to-day operations of our hotels are employees of the management companies engaged by our TRS Lessees to operate such hotels. None of our employees areis represented by a collective bargaining agreement.15 (d)15(d) of the Securities Exchange Act of 1934, as amended, as soon as reasonably practicable after such documents are electronically filed with, or furnished to, the Securities and Exchange Commission (“SEC”). In addition, our website includes corporate governance information, including the charters for committees of the Board of Trustees, our Corporate Governance Guidelines, Conflict of Interest Policy and our Code of Business Conduct. This information is available in print to any shareholder who requests it by writing to Investor Relations, Chatham Lodging Trust, 50 Cocoanut Row, Suite 216,211, Palm Beach, FL 33480. The information on our website is not, and shall not be deemed to be, a part of this report or incorporated into any other filings that we make with the SEC.Item 1A.Risk FactorsWe have limited operating history, which may affect our ability to generate sufficient operating cash flows to make or sustain distributions to our shareholders.We were organized in October 2009 and have limited operating history. Our ability to make or sustain distributions to our shareholders depends on many factors, including the availability of acquisition opportunities that satisfy our investment strategies and our success in identifying and consummating them on favorable terms, readily accessible short-term and long-term financing on favorable terms and conditions in the financial markets, the real estate market, the hotel industry and the economy. We cannot assure you that we will be able to acquire properties with attractive returns or will not seek properties with greater risk to obtain the same level of returns or that the value of our properties in the future will not decline substantially.board’sBoard of Trustees' discretion, which could diminish shareholder returns below expectations.investors’investors' expectations.11officers’officers' business contacts and their ability to successfully hire, train, supervise and manage additional personnel. We may not be able to hire and train sufficient personnel or develop management, information and operating systems suitable for our expected growth. If we are unable to manage any future growth effectively, our operating results and financial condition could be adversely affected.intoon operating decisions for those hotels leased by our TRS Lessees and operated under management agreements, we have less control than if we were managing the hotels ourselves. Even if we believe that our hotels are not being operated efficiently, we may not be able to require an operator to change the way it operates our hotels. If this is the case, we may decide to terminate the management agreement and potentially incur costs associated with the termination. Additionally, Jeffrey H. Fisher, our chief executive officer, controls IHM, a hotel management company that currently manages ten23 of our12but one of the 6451 hotels acquiredowned by the Innkeepers JV as of “Conflicts- There are conflicts of interest could result in future business transactions between us and affiliates owned by our Chief Executive Officer”Officer below.arm’s-lengtharm's-length basis due to Mr. Fisher’sFisher's control of IHM and therefore may not contain terms as favorable to us as we could obtain in an arm’s-lengtharm's-length transaction with a third party. See “Conflicts- there are conflicts of interest could result in future business transactions between us and affiliates owned by our Chief Executive Officer”Officer below. five to six years, and the franchisors may also impose upgraded or new brand standards, such as substantially upgrading the bedding, enhancing the complimentary breakfast or increasing the value of guest awards under its ‘frequent guest’guest' program, which can add substantial expense for the hotel. The franchisors also may require us to make certain capital improvements to maintain the hotel in accordance with system standards, the cost of which can be substantial and may reduce cash available for distribution to our shareholders.franchisors’franchisors' operating standards. The failure of a hotel to maintain standards could result in the loss or cancellation of a franchise license. We rely on our operatorshotel managers to conform to operational standards. In addition, when the term of a franchise expires, the franchisor has no obligation to issue a new franchise. The loss of a franchise could have a material adverse effect on the operations or the underlying value of the affected hotel because of the loss of associated name recognition, marketing support and centralized reservation systems provided by the franchisor. The loss of a franchise or adverse developments with respect to a franchise brand under which our hotels operate could also have a material adverse effect on our financial condition, results of operations and cash available for distribution to shareholders.13ventureventures and capital expenditures at our hotels, including capital expenditures required by the franchisors of our hotels. Hotel revenue can decrease for a number of reasons, including increased competition from new hotels and decreased demand for hotel rooms. These factors can reduce both occupancy and room rates at hotels and could directly affect us negatively by:reducing the hotel revenue that we recognize with respect to hotels leased to our TRS Lessees; and • reducing the hotel revenue that we recognize with respect to hotels leased to our TRS Lessees; and • correspondingly reducing the profits (or increasing the loss) of hotels leased to our TRS Lessees. We may be unable to reduce many of our expenses in tandem with revenue declines, (or we may choose not to reduce them for competitive reasons), and certain expenses may increase while our revenue declines. In fact, duringDuring 2011, our Board of Trustees approved theauthorized an increase in our targeted leverage to not more than 55 percent,above this target, which authorization remains in effect, excluding our pro rata share of assets and liabilities of the JV.Innkeepers and Torrance JV's. Incurring additional debt could subject us to many risks, including the risks that:operating cash flow will be insufficient to make required payments of principal and interest;our leverage may increase our vulnerability to adverse economic and industry conditions;we may be required to dedicate a substantial portion of our cash flow from operations to payments on our debt, thereby reducing cash available for distribution to our shareholders, funds available for operations and capital expenditures, future business opportunities or other purposes; • operating cash flow will be insufficient to make required payments of expenses, principal and interest; • our leverage may increase our vulnerability to adverse economic and industry conditions; • we may be required to dedicate a substantial portion of our cash flow from operations to payments on our debt, thereby reducing cash available for distribution to our shareholders, funds available for operations and capital expenditures, future business opportunities or other purposes; • the terms of any refinancing will not be as favorable as the terms of the debt being refinanced; and • the terms of our debt may limit our ability to make distributions to our shareholders. the terms of any refinancing will not be as favorable as the terms of the debt being refinanced; andthe terms of our debt may limit our ability to make distributions to our shareholders.14seven other hotels we acquired placed a mortgage on one other hotel and may place additional mortgages on certain of our hotels to secure other debt. To the extent we cannot meet any future debt service obligations, we will risk losing some or all of our hotel properties that are pledged to secure our obligations to foreclosure.protection—protection - in the form of swap agreements, interest rate cap contracts or similar agreements—agreements - to hedge against the possible negative effects of interest rate fluctuations. However, such hedging implies costs and we cannot assure you that any hedging will adequately relieve the adverse effects of interest rate increases or that counterparties under these agreement will honor their obligations there under. Furthermore, any such hedge agreements would subject us to the risk of incurring significant non-cash losses on our hedges due to declines in interest rates if our hedges were not considered effective under applicable accounting standards.partners’partners' financial condition and disputes between us and our joint venture partners.6451 hotels and the Torrance JV which owns the 248-room Residence Inn by Marriott in Torrance, CA, and we may invest in additional joint ventures in the future. We may not be in a position to exercise sole decision-making authority regarding the properties owned through the JVJV's or other joint ventures. Investments in joint ventures may, under certain circumstances, involve risks not present when a third party is not involved, including reliance on our joint venture partners and the possibility that joint venture partners might become bankrupt or fail to fund their share of required capital contributions, thus exposing us to liabilities in excess of our share of the investment. Joint venture partners may have business interests or goals that are inconsistent with our business interests or goals, and may be in a position to take actions contrary to our policies or objectives. Such investments may also have the potential risk of impasses on decisions, such as a sale, because neither we nor the partner would have full control over the partnership or joint venture. Any disputes that may arise between us and our joint venture partners may result in litigation or arbitration that would increase our expenses and prevent our officers and/or trustees from focusing their time and effort on our business. Consequently, actions by, or disputes with, our joint venture partners might result in subjecting properties owned by the partnership or joint venture to additional risk. In addition, we may in certain circumstances be liable for the actions of our third-party partners or co-venturers.15actacts as guarantor under certain debt obligations of the JV.JV'sinterestand 5% interests respectively in the Innkeepers JV or Torrance JV, in connection with certain customary non-recourse carve-out provisions such as environmental conditions, misuse of funds and material misrepresentations.Conflicts could result in future business transactions between us and affiliates owned by our Chief Executive Officer.currently manages ten23 of our hotels and all but one of the 6451 hotels acquiredown by the Innkeepers JV as of December 31, 2013, and may manage additional hotels that we acquire or own in the future. Because Mr. Fisher is our Chief Executive Officer and controls IHM, conflicts of interest may arise between us and Mr. Fisher as to whether and on what terms new management contracts will be awarded to IHM, whether and on what terms management agreements will be renewed upon expiration of their terms, enforcement of the terms of the management agreements and whether hotels managed by IHM will be sold.16competition from other hotel properties in our prospective markets, some of which may have greater marketing and financial resources;an over-supply or over-building of hotel properties in our prospective markets, which could adversely affect occupancy rates and revenues;dependence on business and commercial travelers and tourism; • competition from other hotel properties in our prospective markets, some of which may have greater marketing and financial resources; • an over-supply or over-building of hotel properties in our prospective markets, which could adversely affect occupancy rates and revenues; • dependence on business and commercial travelers and tourism; • increases in energy costs and other expenses affecting travel, which may affect travel patterns and reduce the number of business and commercial travelers and tourists; • increases in operating costs due to inflation and other factors that may not be offset by increased room rates; • necessity for periodic capital reinvestment to repair and upgrade hotel properties; • changes in interest rates and in the availability, cost and terms of debt financing; • changes in governmental laws and regulations, fiscal policies and zoning ordinances and the related costs of compliance with laws and regulations, fiscal policies and ordinances; • unforeseen events beyond our control, such as terrorist attacks, travel related health concerns including pandemics and epidemics such as H1N1 influenza (swine flu), avian bird flu and SARS, political instability, regional hostilities, imposition of taxes or surcharges by regulatory authorities, travel related accidents and unusual weather patterns, including natural disasters such as hurricanes, tsunamis or earthquakes; • adverse effects of a downturn in the economy or in the hotel industry; and • risk generally associated with the ownership of hotel properties and real estate, as we discuss in detail below. increases in energy costs and other expenses affecting travel, which may affect travel patterns and reduce the number of business and commercial travelers and tourists;increases in operating costs due to inflation and other factors that may not be offset by increased room rates;necessity for periodic capital reinvestment to repair and upgrade hotel properties;changes in interest rates and in the availability, cost and terms of debt financing;changes in governmental laws and regulations, fiscal policies and zoning ordinances and the related costs of compliance with laws and regulations, fiscal policies and ordinances;unforeseen events beyond our control, such as terrorist attacks, travel related health concerns including pandemics and epidemics such as H1N1 influenza (swine flu), avian bird flu and SARS, political instability, regional hostilities, imposition of taxes or surcharges by regulatory authorities, travel related accidents and unusual weather patterns, including natural disasters such as hurricanes, tsunamis or earthquakes;adverse effects of a downturn in the economy or in the hotel industry; andrisk generally associated with the ownership of hotel properties and real estate, as we discuss in detail below.17hotels’hotels' revenues and profitability. highly cyclical in nature. Fluctuations in lodging demand and, therefore, operating performance, are caused largely by general economic and local market conditions, which subsequently affects levels of business and leisure travel. In addition to general economic conditions, new hotel room supply is an important factor that can affect the lodging industry’sindustry's performance and overbuilding has the potential to further exacerbate the negative impact of an economic recession. Room rates and occupancy, and thus RevPAR, tend to increase when demand growth exceeds supply growth. Decline in lodging demand, or a continued growth in lodging supply, could result in returns that are substantially below expectations or result in losses, which could have a material adverse effect on our business, financial condition, results of operations and our ability to make distributions to our shareholders.possible environmental problems;18construction cost overruns and delays; • possible environmental problems; • construction cost overruns and delays; • possibility that revenues will be reduced temporarily while rooms or restaurants offered are out of service due to capital improvement projects; • a possible shortage of available cash to fund capital improvements and the related possibility that financing for these capital improvements may not be available on affordable terms; • uncertainties as to market demand or a loss of market demand after capital improvements have begun; and • disputes with franchisors/managers regarding compliance with relevant management/franchise agreements. possibility that revenues will be reduced temporarily while rooms or restaurants offered are out of service due to capital improvement projects;a possible shortage of available cash to fund capital improvements and the related possibility that financing for these capital improvements may not be available on affordable terms;uncertainties as to market demand or a loss of market demand after capital improvements have begun; anddisputes with franchisors/managers regarding compliance with relevant management/franchise agreements.intermediaries, including, but not limited to, Travelocity.com, Expedia.com and Priceline.com.intermediaries. As Internet bookings increase, these intermediaries may be able to obtain higher commissions, reduced room rates or other significant contract concessions from us and our management companies. Moreover, some of these Internet travel intermediaries are attempting to offer hotel rooms as a commodity, by increasing the importance of price and general indicators of quality (such as “three-star"three-star downtown hotel”hotel") at the expense of brand identification. These agencies hope that consumers will eventually develop brand loyalties to their reservations system rather than to the brands under which our properties are franchised. Although most of the business for our hotels is expected to be derived from traditional channels, if the amount of sales made through Internet intermediaries increases significantly, room revenues may flatten or decrease and our profitability may be adversely affected.19Potential future outbreaks of contagious diseases, such as H1N1, could have a material adverse effect on our revenues and results of operations due to decreased travel, especially in areas significantly affected by the disease.The widespread outbreak of infectious or contagious disease in the United States, such as the H1N1 influenza, could reduce travel and adversely affect the hotel industry generally and our business in particular.owner’sowner's liability therefore as to any property are generally not limited under such laws and could exceed the value of the property and/or the aggregate assets of the owner. The presence of such substances, or the failure to properly remediate contamination from such substances, may adversely affect the owner’sowner's ability to sell the real estate or to borrow funds using such property as collateral, which could have an adverse effect on our return from such investment.20that future laws, ordinances or regulations will not impose material environmental liability; orthat the current environmental condition of a hotel will not be affected by the condition of properties in the vicinity of the hotel (such as the presence of leaking underground storage tanks) or by third parties unrelated to us.• There are no existing liabilities related to our properties of which we are not aware; • that future laws, ordinances or regulations will not impose material environmental liability; or • that the current environmental condition of a hotel will not be affected by the condition of properties in the vicinity of the hotel (such as the presence of leaking underground storage tanks) or by third parties unrelated to us. will taketook effect. The new guidelines could causecaused some of our hotel properties to incur costly measurescosts to become fully compliant.adverse changes in international, national, regional and local economic and market conditions;changes in interest rates and in the availability, cost and terms of debt financing;changes in governmental laws and regulations, fiscal policies and zoning ordinances and the related costs of compliance with laws and regulations, fiscal policies and ordinances;• adverse changes in international, national, regional and local economic and market conditions; • changes in interest rates and in the availability, cost and terms of debt financing; • changes in governmental laws and regulations, fiscal policies and zoning ordinances and the related costs of compliance with laws and regulations, fiscal policies and ordinances; • the ongoing need for capital improvements, particularly in older structures; • changes in operating expenses; and • civil unrest, acts of God, including earthquakes, floods and other natural disasters, which may result in uninsured losses, and acts of war or terrorism. the ongoing need for capital improvements, particularly in older structures;changes in operating expenses; andcivil unrest, acts of God, including earthquakes, floods and other natural disasters, which may result in uninsured losses, and acts of war or terrorism, such as those that occurred on September 11, 2001.21Currently, limited credit is available to purchasers of hotel properties and financing structures such as CMBS, which have been used to finance hotel acquisitions in recent years, have been reduced. actual receipt of an improper benefit or profit in money, property or services; oractive and deliberate dishonesty by the trustee or officer that was established by a final judgment as being material to the cause of action adjudicated• actual receipt of an improper benefit or profit in money, property or services; or • active and deliberate dishonesty by the trustee or officer that was established by a final judgment as being material to the cause of action adjudicated 22(“MGCL”("MGCL") applicable to Maryland real estate investment trusts may have the effect of inhibiting a third party from making a proposal to acquire us or of impeding a change of control under circumstances that otherwise could provide our common shareholders with the opportunity to realize a premium over the then-prevailing market price of such shares, including:• “"Business combination”combination" provisions that, subject to limitations, prohibit certain business combinations between us and an “interested shareholder”"interested shareholder" (defined generally as any person who beneficially owns 10% or more of the voting power of our shares) or an affiliate of any interested shareholder for five years after the most recent date on which the shareholder becomes an interested shareholder, and thereafter imposes special appraisal rights and special shareholder voting requirements on these combinations; and • “"Control share”share" provisions that provide that our “control shares”"control shares" (defined as shares which, when aggregated with other shares controlled by the shareholder, entitle the shareholder to exercise one of three increasing ranges of voting power in electing trustees) acquired in a “control"control share acquisition”acquisition" (defined as the direct or indirect acquisition of ownership or control of “control shares”"control shares") have no voting rights except to the extent approved by our shareholders by the affirmative vote of at least two-thirds of all the votes entitled to be cast on the matter, excluding all interested shares.8,3, Subtitle 38 of the MGCL permits our Board of Trustees, without shareholder approval and regardless of what is currently provided in our declaration of trust or bylaws, to implement certain takeover defenses, such asincluding, but not limited to, the adoption of a classified board, some of which we do not yet have.currently have in place. These provisions may have the effect of inhibiting a third party from making an acquisition proposal for usour company or of delaying, deferring or preventing a change in control of usour company under the circumstances that otherwise could provide our common shareholders with the opportunity to realize a premium over the then current market price.23 us rent based in part on revenues from our hotels. Our operating risks include decreases in hotel revenues and increases in hotel operating expenses, which would adversely affect our TRS Lessees’Lessees' ability to pay us rent due under the leases, including but not limited to the increases in wage and benefit costs, repair and maintenance expenses, energy costs, property taxes, insurance costs and other operating expenses.Additionally, we own our interest in 13 of the JV hotels through one of our TRS holding companies. With respect to those hotels the TRS holding company will pay federal, state and local income tax on its allocable share of all of the income from those hotels.24arm’s-lengtharm's-length terms.REIT’sREIT's gross assets may consist of stock or securities of one or more TRSs. In addition, the TRS rules limit the deductibility of interest paid or accrued by a TRS to its parent REIT to assure that the TRS is subject to an appropriate level of corporate taxation. The rules also impose a 100% excise tax on certain transactions between a TRS and its parent REIT that are not conducted on an arm’s-lengtharm's-length basis.arm’s-lengtharm's-length terms to avoid incurring the 100% excise tax described above. There can be no assurance, however, that we will be able to comply with the 25% limitation discussed above or to avoid application of the 100% excise tax discussed above.income from “qualified dividends”"qualified dividend income" payable to U.S. shareholders that are individuals, trusts and estates has been reduced by legislation to 15% currently (through the end of 2012)taxed at individual rates is 20%. Dividends payable by REITs, however, generally are not eligible for the reduced rates. The more favorable rates applicable to regular corporate qualified dividends could cause investors who are individuals, trusts and estatestaxed at individual rates to perceive investments in REITs to be relatively less attractive than investments in the stocks of non-REIT corporations that pay dividends, which could adversely affect the value of the shares of REITs, including our common shares.“eligible"eligible independent contractors,”" we would fail to qualify as a REIT.“related"related party tenant”tenant" of ours will not be qualifying income for purposes of the two gross income tests applicable to REITs. We lease substantially all of our hotels to our TRS Lessees. A25“related"related party tenant,”" and will not be treated as directly operating a lodging facility to the extent the TRS Lessee leases properties from us that are managed by an “eligible"eligible independent contractor.”" In addition, our TRS holding companies will fail to qualify as “taxable REIT subsidiaries” if they lease or own a lodging facility that is not managed by an “eligible independent contractor.”“eligible"eligible independent contractors,”" we would fail to qualify as a REIT. Each of the hotel management companies that enters into a management contract with our TRS Lessees must qualify as an “eligible"eligible independent contractor”contractor" under the REIT rules in order for the rent paid to us by our TRS Lessees to be qualifying income for our REIT income test requirements and for our TRS holding companies to qualify as “taxable REIT subsidiaries”. Among other requirements, in order to qualify as an eligible independent contractor a manager must not own more than 35% of our outstanding shares (by value) and no person or group of persons can own more than 35% of our outstanding shares and the ownership interests of the manager, taking into account only owners of more than 5% of our shares and, with respect to ownership interests in such managers that are publicly traded, only holders of more than 5% of such ownership interests. Complex ownership attribution rules apply for purposes of these 35% thresholds. Although we intend to monitor ownership of our shares by our property managers and their owners, there can be no assurance that these ownership levels will not be exceeded. taxable year beginning with our 2011 taxable year. To assist us to satisfy the requirements for our REIT qualification, our declaration of trust contains an ownership limit on each class and series of our shares. Under applicable constructive ownership rules, any common shares owned by certain affiliated owners generally will be added together for purposes of the common share ownership limit, and any shares of a given class or series of preferred shares owned by certain affiliated owners generally will be added together for purposes of the ownership limit on such class or series.“gross income”"gross income" for purposes of the 75% or 95% gross income tests applicable to REITs. To the extent that we enter into other types of hedging transactions, the income from those transactions is likely to be treated as non-qualifying income for purposes of both of the gross income tests. As a result of these rules, we intend to limit our use of advantageous hedging techniques or implement those hedges through a TRS. This could increase the cost of our hedging activities because our TRSs would be subject to tax on gains or expose us to greater risks associated with changes in interest rates than we would otherwise want to bear. In addition, losses in our TRSs will generally not provide any tax benefit, except for being carried forward against future taxable income in the TRSs.yourour shareholders’ interest. implement and maintain an effective system of internal controls, we may not be able to accurately determine our financial results or prevent fraud. As a result, our investors could lose confidence in our reported financial information, which could harm our business and the market value of our common shares. rapidly grow our business and acquire new hotel properties with existing internal controls that may not be consistent with our own, our internal controls will become more complex, and we will require significantly more resources to ensure our internal controls remain effective. If we or our independent auditors discover a material weakness, the disclosure of that fact, even if quickly remedied, could reduce the market value of our common shares. In particular, we will need to establish, or cause our third party hotel managers to establish, controls and procedures to ensure that hotel revenues and expenses are properly recorded at our hotels. The existence of any material weakness or significant deficiency would require management to devote significant time and incur significant expense to remediate any such material weaknesses or significant deficiencies and management may not be able to remediate any such material weaknesses or significant deficiencies in a timely manner. Any such failure could cause investors to lose confidence in our reported financial information and adversely affect the market value of our common shares or limit our access to the capital markets and other sources of liquidity.27prospectus.Form 10-K. Subject to satisfying the requirements for REIT qualification, we intend over time to make regular quarterly distributions to our shareholders. Our Board of Trustees has the sole discretion to determine the timing, form and amount of any distributions to our shareholders. Our Board of Trustees makes determinations regarding distributions based upon, among other factors, our historical and projected results of operations, financial condition, cash flows and liquidity, satisfaction of the requirements for REIT qualification and other tax considerations, capital expenditure and other expense obligations, debt covenants, contractual prohibitions or other limitations and applicable law and such other matters as our Board of Trustees may deem relevant from time to time. Among the factors that could impair our ability to make distributions to our shareholders are:our inability to realize attractive returns on our investments;unanticipated expenses that reduce our cash flow or non-cash earnings;decreases in the value of the underlying assets; and • our inability to realize attractive returns on our investments; • unanticipated expenses that reduce our cash flow or non-cash earnings; • decreases in the value of the underlying assets; and • the fact that anticipated operating expense levels may not prove accurate, as actual results may vary from estimates. the fact that anticipated operating expense levels may not prove accurate, as actual results may vary from estimates.shareholder’sshareholder's basis in its common shares. We also could use borrowed funds or proceeds from the sale of assets to fund distributions.shareholder’sshareholder's investment in our common shares.28actual or anticipated variations in our quarterly results of operations;changes in market valuations of companies in the hotel or real estate industries; • actual or anticipated variations in our quarterly results of operations; • changes in market valuations of companies in the hotel or real estate industries; • changes in expectations of future financial performance or changes in estimates of securities analysts; • fluctuations in stock market prices and volumes; • issuances of common shares or other securities in the future; • the addition or departure of key personnel and • announcements by us or our competitors of acquisitions, investments or strategic alliances changes in expectations of future financial performance or changes in estimates of securities analysts;fluctuations in stock market prices and volumes;issuances of common shares or other securities in the future;the addition or departure of key personnel;announcements by us or our competitors of acquisitions, investments or strategic alliances; andunforeseen events beyond our control, such as terrorist attacks, travel related health concerns including pandemics and epidemics such as H1N1 influenza, avian bird flu and SARS, political instability, regional hostilities, increases in fuel prices, imposition of taxes or surcharges by regulatory authorities, travel related accidents and unusual weather patterns, including natural disasters such as hurricanes, tsunamis or earthquakes.limitedsmaller equity market capitalization compared to some other hotel REITs and our common shares are tradedmay trade in low volumes, the stock market price of our common shares ismay be susceptible to fluctuation to a greater extent than companies with larger market capitalization. As a result, your ability to liquidate your investment may be limited and the sale of common shares in this offering could cause the stock market price of our common shares to decline.565,3593,000,000 common shares and we may seek to increase shares available under our Equity Incentive Plan in the future.29Unresolved Staff CommentsNone30Item 2.Properties2011: Location Management
Company Date of Acquisition Year
Opened Number
of
Rooms Purchase Price Purchase
Price per
Room Debt (Unaudited) Billerica, Massachusetts Hilton April 23, 2010 1999 147 $ 12.5 million $ 85,714 — Bloomington, Minnesota Hilton April 23, 2010 1998 144 $ 18.0 million $ 125,000 — Brentwood, Tennessee Hilton April 23, 2010 1998 121 $ 11.3 million $ 93,388 — Dallas, Texas Hilton April 23, 2010 1998 137 $ 10.7 million $ 78,102 — Farmington, Connecticut Hilton April 23, 2010 1999 121 $ 11.5 million $ 95,041 — Maitland, Florida Hilton April 23, 2010 2000 143 $ 9.5 million $ 66,433 — Carlsbad, California Island Hospitality November 3, 2010 2008 145 $ 32.0 million $ 220,690 — Houston, Texas Island Hospitality July 2, 2010 1997 120 $ 16.5 million $ 137,500 — Altoona, Pennsylvania Concord August 24, 2010 2001 105 $ 11.3 million $ 107,619 $ 6.8 million Washington, Pennsylvania Concord August 24, 2010 2000 86 $ 12.0 million $ 139,535 $ 5.3 million Holtsville, New York Island Hospitality August 3, 2010 2004 124 $ 21.3 million $ 171,774 — White Plains, New York Island Hospitality September 23, 2010 1982 133 $ 21.2 million $ 159,398 — New Rochelle, New York Island Hospitality October 5, 2010 2000 124 $ 21.0 million $ 169,355 $ 15.7 million Garden Grove, CA Island Hospitality July 14, 2011 2003 200 $ 43.6 million $ 218,000 $ 32.4 million San Diego, CA Island Hospitality July 14, 2011 2003 192 $ 52.5 million $ 273,438 $ 40.0 million San Antonio, TX Island Hospitality July 14, 2011 1996 146 $ 32.5 million $ 222,603 $ 18.4 million Washington, DC Island Hospitality July 14, 2011 1974 105 $ 29.4 million $ 280,000 $ 19.9 million Vienna, VA Island Hospitality July 14, 2011 2001 121 $ 37.0 million $ 305,785 $ 22.9 million 2,414 $ 403.8 million $ 163,854 $ 161.4 million 31Property Location Management Company Date of Acquisition Year Opened Number of Rooms Purchase Price Purchase Price per Room Mortgage Debt Balance Homewood Suites by Hilton Boston-Billerica/ Bedford/ Burlington Billerica, Massachusetts Island Hospitality 4/23/2010 1999 147 $12.5 million $ 85,714 — Homewood Suites by Hilton Minneapolis-Mall of America Bloomington, Minnesota Island Hospitality 4/23/2010 1998 144 $18.0 million $ 125,000 — Homewood Suites by Hilton Nashville-Brentwood Brentwood, Tennessee Island Hospitality 4/23/2010 1998 121 $11.3 million $ 93,388 — Homewood Suites by Hilton Dallas-Market Center Dallas, Texas Island Hospitality 4/23/2010 1998 137 $10.7 million $ 78,102 — Homewood Suites by Hilton Hartford-Farmington Farmington, Connecticut Island Hospitality 4/23/2010 1999 121 $11.5 million $ 95,041 — Homewood Suites by Hilton Orlando-Maitland Maitland, Florida Island Hospitality 4/23/2010 2000 143 $9.5 million $ 66,433 — Homewood Suites by Hilton Carlsbad (North San Diego County) Carlsbad, California Island Hospitality 11/3/2010 2008 145 $32.0 million $ 220,690 — Hampton Inn & Suites Houston-Medical Center Houston, Texas Island Hospitality 7/2/2010 1997 120 $16.5 million $ 137,500 — Courtyard Altoona Altoona, Pennsylvania Concord 8/24/2010 2001 105 $11.3 million $ 107,619 $6.4 million Springhill Suites Washington Washington, Pennsylvania Concord 8/24/2010 2000 86 $12.0 million $ 139,535 $4.9 million Residence Inn Long Island Holtsville Holtsville, New York Island Hospitality 8/3/2010 2004 124 $21.3 million $ 171,774 — Residence Inn White Plains White Plains, New York Island Hospitality 9/23/2010 1982 133 $21.2 million $ 159,398 — Residence Inn New Rochelle New Rochelle, New York Island Hospitality 10/5/2010 2000 124 $21.0 million $ 169,355 $15.2 million Residence Inn Garden Grove Garden Grove, California Island Hospitality 7/14/2011 2003 200 $43.6 million $ 218,000 $32.3 million Residence Inn Mission Valley San Diego, California Island Hospitality 7/14/2011 2003 192 $52.5 million $ 273,438 $30.5 million Homewood Suites by Hilton San Antonio River Walk San Antonio, Texas Island Hospitality 7/14/2011 1996 146 $32.5 million $ 222,603 $17.5 million Residence Inn Washington DC Washington, DC Island Hospitality 7/14/2011 1974 103 $29.4 million $ 280,000 — Residence Inn Tysons Corner Vienna, Virginia Island Hospitality 7/14/2011 2001 121 $37.0 million $ 305,785 $23.9 million Hampton Inn Portland Downtown Portland, Maine Island Hospitality 12/27/2012 2011 122 $28.0 million $ 229,508 — Courtyard Houston Houston, Texas Island Hospitality 2/5/2013 2010 197 $34.8 million $ 176,395 $19.8 million Hyatt Place Pittsburgh North Shore Pittsburgh, Pennsylvania Island Hospitality 6/17/2013 2011 178 $40.0 million $ 224,719 $24 million Hampton Inn Exeter Exeter, New Hampshire Island Hospitality 8/9/2013 2010 111 $15.2 million $ 136,937 — Hilton Garden Inn Denver Tech Denver, Colorado Island Hospitality 9/26/2013 1999 180 $27.9 million $ 155,000 — Residence Inn Bellevue Bellevue, Washington Island Hospitality 10/31/2013 2008 231 $71.8 million $ 316,883 $47.6 million Springhill Suites Savannah Savannah, Georgia Island Hospitality 12/5/2013 2008 160 $39.8 million $ 248,438 — Total 3,591 $661.3 million $ 184.155 $222.1 million located at 50 Cocoanut Row, Suite 216,211, Palm Beach, FL 33480. The Altoona hotel is subject to a ground lease with an expiration of April 30, 2029 with an option of up to 12 additional terms of five years each. In connection with the New Rochelle hotel, there isare an air rights lease and garage lease that each expire on December 1, 2104.Item 3.Legal ProceedingsItem 4.Mine Safety Disclosures32PARTItem 5.Market for Registrant’s Common Equity, Related Stockholder Matters and Issuer Purchases of Equity Securities“NYSE”"NYSE"), on April 16, 2010 under the symbol “CLDT”"CLDT". The closing price of our common shares on the NYSE on December 30, 201131, 2013 was $10.78$20.45 per share. The following table sets forth, for the periods indicated, the high and low closing sales prices per share reported on the New York Stock Exchange as traded and the cash dividends declared per share:2011 High Low Dividends $ 17.50 $ 16.00 $ 0.175 17.09 15.47 0.175 16.44 9.34 0.175 11.62 9.20 0.175 2010 High Low Dividends $ — $ — $ — 20.70 17.45 — 18.92 14.25 0.175 19.46 16.11 0.175 332013 High Low Dividends First quarter $ 17.61 $ 14.60 $ 0.21 Second quarter 19.58 16.25 0.21 Third quarter 19.85 17.25 0.21 Fourth Quarter 21.15 17.85 0.21 2012 High Low Dividends First quarter $ 13.58 $ 10.99 $ 0.175 Second quarter 14.40 11.59 0.200 Third quarter 14.81 13.45 0.200 Fourth Quarter 15.38 12.89 0.200 5, 2012,10, 2014, there were 1314 registered holders of record of our common shares. This figure does not include beneficial owners who hold shares in nominee name. However, because many of our common shares are held by brokers and other institutions, we believe that there are more beneficial holders of our common shares than record holders. In order to comply with certain requirements related to our qualification as a REIT, our charter, subject to certain exceptions, limits the number of common shares that may be owned by any single person or affiliated group to 9.8% of the outstanding common shares. Initial
investment at
April 21, 2010 Value of initial
investment at
December 31, 2010 Value of initial
investment at
December 31, 2011 $ 100.00 $ 87.13 $ 54.78 $ 100.00 $ 109.57 $ 102.91 $ 100.00 $ 110.50 $ 119.69 $ 100.00 $ 106.10 $ 90.95 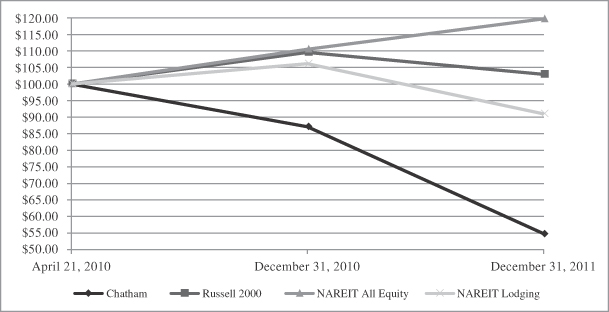
Initial investment at April 16, 2010 Value of initial investment at December 31, 2010 Value of initial investment at December 31, 2011 Value of initial investment at December 31, 2012 Value of initial investment at December 31, 2013 Chatham Lodging Trust $ 100.00 $ 87.88 $ 58.02 $ 87.36 $ 121.55 Russell 2000 Index $ 100.00 $ 109.17 $ 104.61 $ 121.72 $ 168.97 FTSE NAREIT All Equity REIT Index $ 100.00 $ 112.70 $ 120.9 $ 145.25 $ 149.91 FTSE NAREIT Lodging/Resorts Index $ 100.00 $ 110.28 $ 94.49 $ 106.34 $ 135.24 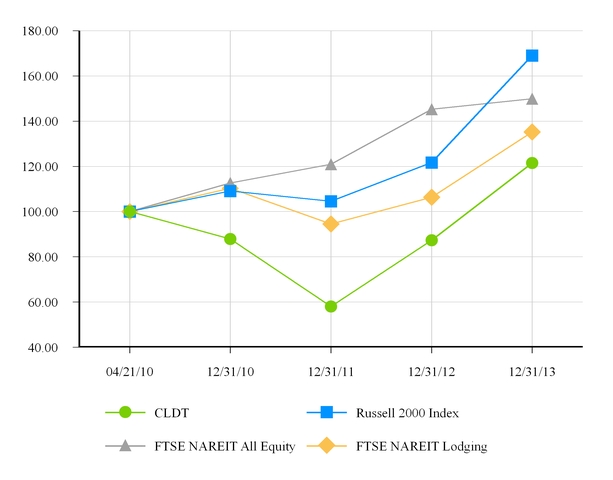
30, 201131, 2013 with the cumulative total return on the Russell 2000 Index (the “Russell 2000”), the FTSE NAREIT All Equity REIT Index (the “NAREIT All Equity”) and the NAREIT Lodging/Resorts Index (the “NAREIT Lodging”). The total return values were calculated assuming a $100 investment on April 21, 2010 with reinvestment of all dividends in (i) our common shares, (ii) the Russell 2000, (iii) the NAREIT All Equity and (iv) the NAREIT Lodging. The total return values include any dividends paid during the period.34▪ 90% of our REIT taxable income determined without regard to the dividends paid deduction and excluding net capital gains, plus; ▪ 90% of the excess of our net income from foreclosure property over the tax imposed on such income by the Code, minus ▪ Any excess non-cash income (as defined in the Code). 90% of our REIT taxable income determined without regard to the dividends paid deduction and excluding net capital gains, plus;90% of the excess of our net income from foreclosure property over the tax imposed on such income by the Code, minusAny excess non-cash income (as defined in the Code).yearyears ended December 31, 20112013 and the period ended December2012 and respectively:2013 Month to which distribution relates Record Date Payment Date Common Share Distribution amount Ordinary Income Return of Capital January 1/31/2013 2/22/2013 $ 0.07 $ 0.06 $ 0.01 February 2/28/2013 3/29/2013 0.07 0.06 0.01 March 3/29/2013 4/26/2013 0.07 0.06 0.01 April 4/30/2013 5/31/2013 0.07 0.06 0.01 May 5/31/2013 6/28/2013 0.07 0.06 0.01 June 6/28/2013 7/26/2013 0.07 0.06 0.01 July 7/31/2013 8/30/2013 0.07 0.06 0.01 August 8/30/2013 9/27/2013 0.07 0.06 0.01 September 9/30/2013 10/25/2013 0.07 0.06 0.01 October 10/31/2013 11/29/2013 0.07 0.06 0.01 November 11/29/2013 12/27/2013 0.07 0.06 0.01 December 12/31/2013 1/31/2014 0.07 0.06 0.01 $ 0.84 $ 0.72 $ 0.12 2012 Quarter to which distribution relates Record Date Payment Date Common Share Distribution amount Ordinary Income Return of Capital First quarter 3/30/2012 4/27/2012 $ 0.175 $ 0.092 $ 0.083 Second quarter 6/29/2012 7/27/2012 0.200 0.106 0.094 Third quarter 9/28/2012 10/26/2012 0.200 0.106 0.094 Fourth quarter 12/31/2012 1/25/2013 0.200 0.106 0.094 $ 0.775 $ 0.410 $ 0.365 2010:2010 Record Date Payment Date Common
share
distribution
amount Ordinary
income Return of
capital $ — $ — $ — 10/15/2010 10/29/2010 0.175 0.175 $ — 12/31/2010 1/14/2011 0.175 0.175 $ — $ 0.350 $ 0.350 $ — 2011 Record Date Payment Date Common
share
distribution
amount Ordinary
income Return of
capital 3/31/2011 4/15/2011 $ 0.175 $ 0.01 $ 0.165 6/30/2011 7/15/2011 0.175 $ 0.01 0.165 9/30/2011 10/14/2011 0.175 $ 0.01 0.165 12/30/2011 1/27/2012 0.175 $ 0.01 0.165 $ 0.700 $ 0.04 $ 0.660 352011,2013, relating to our Equity Incentive Plan pursuant to which grants of common share options, share awards, share appreciation rights, performance units and other equity-based awards options may be granted from time to time. Number of Securities to be
Issued Upon Exercise of
Outstanding Options,
Warrants and RightsWeighted-Average Exercise Price of Outstanding Options, Warrants and Rights Number of Securities Remaining Available for Future Issuance under Equity Compensation Plans Weighted-AverageExercise Price ofOutstanding Options,Warrants and RightsNumber of SecuritiesRemaining Availablefor Future Issuance underEquity CompensationPlans holders (1)holders¹ — — 2,400,018 211,730 — — — Total — — Total2,400,018 211,730(1)Our Equity Incentive Plan was approved by our company’s sole trustee and our company’s sole shareholder prior to completion of our IPO.915445 and 0 common shares purchased in the yearyears ended December 31, 20112013 and 2012, respectively, related to such repurchases.36Selected Financial Data20112013, 2012 and 2010.2011. The selected historical financial information as of and for the years ended December 31, 20112013, 2012 and 2010 have2011 has been derived from our audited consolidated financial statements. The results are not necessarily indicative of the results we expect when our investment strategy has been fully implemented. The selected historical financial data should be read in conjunction with “Management’s"Management’s Discussion and Analysis of Financial Condition and Results of Operations,”" and the financial statements and notes thereto, both included hereinin this Annual Report on Form 10-K. Year Ended
December 31,
2011 Year Ended
December 31,
2010 (In thousands, except share and
per-share data) $ 73,096 $ 25,470 42,167 15,025 5,802 3,547 7,706 3,189 5,321 1,606 11,971 2,564 72,967 25,931 129 (461 ) (8,190 ) (932 ) (997 ) — 22 193 (9,036 ) (1,200 ) (69 ) (17 ) $ (9,105 ) $ (1,217 ) $ (0.69 ) $ (0.20 ) 13,280,149 6,377,333 8,946 5,274 (112,523 ) (201,511 ) 103,489 200,981 0.70 0.35 37 Year Ended Year Ended Year Ended December 31, 2013 December 31, 2012 December 31, 2011 (In thousands, except share and per-share data) Statement of Operations Data: Total revenue $ 126,228 $ 100,464 $ 73,096 Hotel operating expenses 68,596 55,030 42,167 Depreciation and amortization 18,249 14,273 11,971 Property taxes and insurance 8,915 7,088 5,321 General and administrative 8,131 7,565 5,802 Hotel property acquisition costs and other charges 3,341 236 7,706 Reimbursed costs from unconsolidated real estate entities 1,635 1,622 — Total operating expenses 108,867 85,814 72,967 Operating income 17,361 14,650 129 Interest and other income 132 55 22 Interest expense, including amortization of deferred fees (11,580 ) (14,641 ) (8,190 ) Loss on early extinguishment of debt (933 ) — — Loss from unconsolidated real estate entities (1,874 ) (1,439 ) (997 ) Income (loss) before income tax expense 3,106 (1,375 ) (9,036 ) Income tax expense (124 ) (75 ) (69 ) Net income (loss) $ 2,982 $ (1,450 ) $ (9,105 ) Income per Common Share - Basic: Net income (loss) attributable to common shareholders $ 0.13 $ (0.12 ) $ (0.69 ) Income per Common Share - Diluted: Net income (loss) attributable to common shareholders $ 0.13 $ (0.12 ) $ (0.69 ) Weighted average number of common shares outstanding: Basic 21,035,892 13,811,691 13,280,149 Diluted 21,283,831 13,811,691 13,280,149 Other Data: Net cash provided by operating activities 31,571 14,885 8,946 Net cash used in investing activities (235,190 ) (13,036 ) (112,523 ) Net cash provided by (used in) financing activities 203,344 (2,033 ) 103,489 Cash dividends declared per common share 0.84 0.775 0.70 As of December 31,
2011 As of December 31,
2010 (Audited)
(In thousands) (Audited)
(In thousands) $ 402,815 $ 208,080 4,680 4,768 5,299 3,018 36,003 — 2,057 891 6,350 4,710 1,502 735 $ 458,706 $ 222,202 $ 228,940 $ 50,133 10,184 5,248 2,464 1,657 241,588 57,038 216,090 164,739 1,028 425 $ 458,706 $ 222,202 38 As of As of As of December 31, 2013 December 31, 2012 December 31, 2011 (In thousands) Balance Sheet Data: Investment in hotel properties, net $ 652,877 $ 426,074 $ 402,815 Cash and cash equivalents 4,221 4,496 4,680 Restricted cash 4,605 2,949 5,299 Investment in unconsolidated real estate entities 774 13,362 36,003 Hotel receivables (net of allowance for doubtful accounts) 2,455 2,098 2,057 Deferred costs, net 7,113 6,312 6,350 Prepaid expenses and other assets 1,879 1,930 1,502 Total assets $ 673,924 $ 457,221 $ 458,706 Mortgage debt $ 222,063 $ 159,746 $ 161,440 Revolving credit facility 50,000 79,500 67,500 Accounts payable and accrued expenses 12,799 8,488 10,184 Distributions in excess of investments of unconsolidated real estate entities 1,576 — — Distributions payable 1,950 2,875 2,464 Total liabilities 288,388 250,609 241,588 Total shareholders’ equity 383,369 205,001 216,090 Noncontrolling Interest in Operating Partnership 2,167 1,611 1,028 Total liabilities and equity $ 673,924 $ 457,221 $ 458,706 Item 7.Management’s Discussion and Analysis of Financial Condition and Results of OperationsWeourits initial public offering (the “IPO”) on April 21, 2010. The IPO resulted in the sale of 8,625,000 common shares at $20.00 per share, generating $172.5 million in gross proceeds. Net proceeds, after underwriters’ discounts and commissions and other offering costs, were approximately $158.7 million. Concurrently with the closing of the IPO, in a separate private placement pursuant to Regulation D under the Securities Act of 1933, as amended (the “Securities Act”), wethe Company sold 500,000 of ourits common shares to Jeffrey H. Fisher, ourthe Company’s Chairman, President and Chief Executive Officer (“Mr. Fisher”), at the public offering price of $20.00 per share, for proceeds of $10.0 million.wethe Company completed a follow-on common share offering of 4,000,000 shares, generating gross proceeds of $73.6 million and net proceeds of approximately $69.4 million. On January 14, 2013, the Company completed a follow-on common share offering of 3,500,000 shares, generating gross proceeds of approximately $51.4 million and net proceeds of approximately $48.4 million. On January 31, 2013, the Company issued an additional 92,677 common shares pursuant to the exercise of the underwriters’ over-allotment option in the offering that closed on January 14, 2013, generating gross proceeds of approximately $1.4 million and net proceeds of approximately $1.3 million. On June 18, 2013, the Company completed a follow-on common share offering generating gross proceeds of $73.6 million and net proceeds of approximately $69.4$70.0 million. On June 28, 2013, the Company issued an additional 475,823 common shares pursuant to the exercise of the underwriters’ over-allotment option in the offering that closed on June 18, 2013, generating gross proceeds of approximately $7.8 million adding capitaland net proceeds of approximately $7.4 million. On September 30, 2013, the Company completed a follow-on common share offering generating gross proceeds of $59.6 million and net proceeds of approximately $56.8 million. On October 11, 2013, the Company issued an additional 487,500 common shares pursuant to our balance sheet. Using these funds as well as borrowing capacitythe exercise of the underwriter's over-allotment option in the offering that closed on our lineSeptember 30, 2013, generating gross proceeds of credit, on July 14, 2011, we acquired fiveapproximately $8.9 million and net proceeds of approximately $8.5 million.forwith an aggregate purchase price of $195 million, including3,591 rooms located in 15 states and the assumptionDistrict of five individual mortgage loans secured by the hotels totaling $134.2 million. Additionally, we invested $37.0 million for an approximateColumbia, held a 10.3% noncontrolling interest in a joint venture (“(the “Innkeepers JV”) with Cerberus Capital Management (“Cerberus”) that acquired 64 hotels from Innkeepers USA Trust (“Innkeepers”) on October 27, 2011. The Company accounts for this investment under the equity method.As of December 31, 2011, we owned 18 hotels with an aggregate of 2,414 rooms located in 10 states and the District of Columbia and we held a 10.3% minority interest in the JV,, which owns 6451 hotels comprising an aggregate of 8,329 rooms.operating metricsmeasures such as:perPer Available Room (“RevPAR”),towardstoward providing income to our shareholders through increases in distributable cash flow and increasing long-term total returns through appreciation in the value of our common shares. RevPAR, ADR and Occupancy are hotel industry measures commonly used to evaluate operating performance. RevPAR, which is calculated as total room revenue divided by total number of available rooms, is an important metric for monitoring hotel operating performance.39withspecifically key economic indicators such as GDP growth, employment trends, corporate profits improving, wetravel and corporate profits. We expect a continuing improvement in the performance of the hotel industry.industry as GDP is forecast to grow 3.1% in 2014, unemployment is forecast to continue to decline and corporate profits and travel expense are expected to continue to rise. As reported by Smith Travel Research, monthly industry RevPAR has been higher year over year since March 2010. As reported by Smith Travel Research, RevParWith industry RevPAR in 2011 was up 8.2%., 2012 up 6.8% and 2013 up 5.4% compared to the previous years. Industry expertsanalysts such as Smith Travel Research and PKF Hospitality and PricewaterhouseCoopers are projecting industry RevParRevPAR to grow 4-7%5-6% in 20122014 based on sustained economic growth, lack of new supply and increased business travel spending. Of the projected growth, industry analysts believe growth in ADR will comprise the majority of the expected RevPAR growth. We are currently projecting RevParRevPAR at our hotels to grow 6-8%5-6% in 2012. 132014 with ADR comprising most of our 18 hotels were renovatedRevPAR growth. Industry analysis predict that RevPAR will continue to grow in 2011 so we expect our growth2015 with preliminary estimates from Smith Travel Research and PFK Hospitality between 4.7% to outperform industry projections. Year ended December 31, 2011 to the Year ended December 31, 2010Results of operations for the years ended December 31, 2011 and 2010 include the operating activities of the 18 hotels owned at December 31, 2011, which includes the 5 Sister hotels acquired in the third quarter of 2011 compared to the results of operations for the 13 hotels that we owned for all or part of the year ended December 31, 2010. The Company completed its IPO on April 21, 2010 and acquired2013 (“2013”) to the 13 hotels at varying times during the second, third and fourth quarters of 2010.As reported by Smith Travel Research, industry RevPar for the yearsyear ended December 31, 20112012 (“2012”)2010 was up 8.2%our investments in the Innkeepers JV and up 5.5% respectively. RevParthe Torrance JV. We owned 19 hotels atDecember 31, 2012. Accordingly, the comparisons below are influenced by the fact that six hotels and the Torrance JV were not owned by us for the year ended December 31, 2012, whereas they were owned by us for all or part of 2013.was up 2.8% and 3.3% in 2011 and 2010, which includes periods prior to our ownership. Our RevPar growth was adversely impacted because 13 of our 18 hotels were undergoing renovations in 2011. Years ended December 31, 2013 December 31, 2012 % Change Room $ 118,169 $ 94,566 25.0 % Food and beverage 1,311 253 418.2 % Other 5,113 4,023 27.1 % Cost reimbursements from unconsolidated real estate entities 1,635 1,622 0.8 % Total revenue $ 126,228 $ 100,464 25.6 % Revenue$73.1$126.2 million for the year ended December 31, 20112013 compared to total revenue of $25.4$100.5 million for the 2010 period due to the increase in the number of hotels owned in 2011 from 13 to 18. We owned 13 hotels for all of 2011 compared to owning zero hotels for all of 2010.2012 period. Since all of our hotels are premium branded upscale extended-stay hotels and select service or limited service hotels, room revenue is the primary revenue source as these hotels do not have significant food and beverage revenue or large group conference facilities. Room revenue was $70.4$118.2 and $24.7$94.6 million for the years ended December 31, 20112013 and 2010, respectively.ADR and RevPARADR at our hotels. Occupancy, ADR, and RevPAR results are presented in the following table in each period to reflect operationsoperation of the hotels regardless of ownership: For the year ended
December 31, 2011 For the year ended
December 31, 2010 $ 126.26 $ 124.19 78.5 % 77.6 % $ 99.08 $ 96.37 For the year ended For the year ended December 31, 2013 December 31, 2012 Occupancy 79.5 % 78.8 % ADR $ 137.11 $ 132.15 RevPAR $ 108.96 $ 104.14 $2.7$5.1 million and $0.7$4.0 million respectively, for the years ended December 31, 20112013 and 2010.2012, respectively. Total other operating revenue related to seven hotels acquired since late December 2012 contributed $1.0 million of the increase. Years ended December 31, 2013 December 31, 2012 % Change Hotel operating expenses: Room $ 25,709 $ 20,957 22.7 % Food and beverage expense 944 307 207.5 % Telephone expense 899 718 25.2 % Other expense 1,580 1,508 4.8 % General and administrative 11,529 9,320 23.7 % Franchise and marketing fees 9,394 7,529 24.8 % Advertising and promotions 2,782 2,257 23.3 % Utilities 4,955 4,081 21.4 % Repairs and maintenance 6,310 4,958 27.3 % Management fees 3,752 2,872 30.6 % Insurance 742 523 41.9 % Total hotel operating expenses $ 68,596 $ 55,030 24.7 % $27.2$13.6 million from $15.0to $68.6 million for the year ended December 31, 2010 to $42.22013 from $55.0 million for the year ended December 31, 2011 due to the increased number of hotels owned in the 2011 period and owning 13 hotels for all of 2011 compared to owning no hotels for all of 2010. As a percentage of40 revenue, hotel operating expenses were 58% for 2011 and 59% for 2010, a downward trend we hope will continue as ADR growth comprises a larger component of RevPar increasesincreased 24.7%, which is consistent with the 25.6% increase in 2012. total revenue. The increase in total hotel operating expenses attributable to the seven hotels acquired since late December 2012 is $11.5 million. Excluding the acquired hotels, total operating expenses increased 3.8%.$10.0$4.7 million from $6.0$21.0 million in 20102012 to $16.0$25.7 million in 2011. Other direct2013. Total room expenses which include management and franchise fees, insurance, utilities, repairs and maintenance, advertising and sales, and hotel general and administrativerelated to the seven hotels recently acquired contributed $4.0 million of the increase. Excluding those hotels, room expenses increased $17.1$0.7 million or 3.3%, due primarily to increased hotel employee compensation and benefits.$9.0$34.1 million in 20102012 to $26.1$42.9 million in 2011.2013, which increase is consistent with the 48.9% increase (excluding Portland, ME, which was acquired in late December 2012) in the number of rooms owned in 2013 compared to rooms owned for most of 2012. The number of rooms increased from 2,412 rooms in 2012 (excluding Portland, ME) to 3,591 rooms in 2013 due to acquisitions. The increase attributable to the recent acquisitions is $7.4 million. Food and beverage expense increased due to the Hyatt Place Pittsburgh, Houston Courtyard and Denver Tech hotels that were acquired in 2013 and have food and beverage operations where as most of our other hotels have limited for sale food and beverage activities.$9.4$3.9 million from $2.6$14.3 million for the year ended December 31, 20102012 to $12.0$18.2 million for the year ended December 31, 2011.2013. The increase is dueattributable to the increased number ofseven hotels owned during the 2011 period and the disposition and replacement of furniture and fixtures at six hotels where major property improvement plans were completed during the year ended December 30, 2011.acquired since late 2012 is $3.8 million. Depreciation is recorded on our hotel buildings over 40 years from the date of acquisition. Depreciable lives of hotel furniture, fixtures and equipment are generally three to ten years between the date of acquisition and the expected date that the furniture, fixtures and equipment will be replaced. Amortization of franchise fees is recorded on a straight-line basis over the term of the respective franchise agreement.Real EstatePersonal Property Taxestaxtaxes and insurance expenses increased $3.7$1.8 million from $1.6$7.1 million for the year ended December 31, 20102012 to $5.3$8.9 million for the year ended December 31, 2011.2013. The increase related to the seven hotels acquired since late 2012, which contributed $1.3 million of the increase. The remaining increase of $0.5 million or 6.7% for the remaining hotels is due primarily to increased numberincremental increase in values and assessments.Corporate generalcorporate general and administrative expenses (excluding amortization of stock based compensation of $1.6$2.1 and $1.1$2.0 million for the years ended December 31, 2013 and 2012, respectively) increased $0.4 million or 7.1% to $6.0 million in 2013 from $5.6 million in 2012 with the increase due to employee compensation.2011 and for the year ended December 31, 2010, respectively) increased $1.8 million2012 to $4.2 million in 2011 from $2.4 million in 2010. This increase was primarily due to the fact the 2010 period comprised only 253 days.Hotel Property Acquisition CostsHotel property acquisition costs increased $4.6 million from $3.1$3.3 million for the year ended December 31, 20102013. Expenses during $7.7our acquisitions of the Houston, Pittsburgh, Exeter, Denver Tech, Bellevue and Savannah Hotels. Acquisition-related costs are expensed when incurred. Only one acquisition, the Portland hotel, occurred in 2012. Years ended December 31, 2013 December 31, 2012 % Change Mortgage debt interest $ 8,639 $ 9,654 (10.5 )% Credit facility interest and unused fees 1,593 2,932 (45.7 )% Other fees 258 213 21.1 % Amortization of deferred financing costs 1,090 1,842 (40.8 )% Total $ 11,580 $ 14,641 (20.9 )% 2011.2012 to a loss of $1.9 million for the year ended December 31, 2013. The 2011 expenses relatemajority of the increase is due to the acquisition of hotels formerly owned by Innkeepers described in Note 3, Acquisition of Hotel Properties and Note 6, Investment in Unconsolidated Entities, in the notes to our consolidated financial statements. The 2010 expenses represent costs associated with the purchaseearly debt extinguishment and refinancing of $8.9 million for the 13 hotels owned at December 31, 2010. These acquisition-related costs are expensed when incurred in accordance with GAAP.Interest and Other Innkeepers JV, of which our share was $0.9 million.Interest income on cash and cash equivalents decreased $171 Tax Expense$193an expense of $75 thousand for the year ended December 31, 20102012 to $22 thousandan expense of $124 for the year ended December 31, 2011. This decrease was due to the decrease in cash and cash equivalents in 2011. The Company had not fully invested the cash from its IPO in the 2010 period and the excess cash was held in an interest bearing account.41Interest ExpenseInterest expense increased $7.3 million from $0.9 million for the year ended December 31, 2010 to $8.2 million for the year ended December 31, 2011. The increase is due primarily to the following: 1) assumption of $134.2 million of loans on the five hotels acquired in July 2011 bearing interest at a rate of approximately 6%; 2) increase in weighted average borrowings on our credit facility of $22.6 million from $7.1 million in 2010 to $29.7 million in 2011; and debt issued in August 2011 on our New Rochelle hotel of $15.8 million at a rate of 5.75%. The interest rate on the senior secured revolving credit facility was 4.5% in 2010 and increased to 5.25% November 14, 2011.Income Tax ExpenseIncome tax expense increased $52 thousand in 2011 from $17 thousand for the year ended December 31, 2010 to $69 thousand for the year ended December 31, 2011.2013. We are subject to income taxes based on the taxable income of our TRStaxable REIT subsidiary holding companies at a combined federal and state tax rate of approximately 40%.loss applicable to Common Shareholdersloss applicable to common shareholders increased $7.9income was $3.0 million in 2011 from a loss of $1.2 million, or $0.20 per diluted share for the year ended December 31, 20102013, compared to a net loss of $9.1$1.5 million or $0.69 per diluted share for the year ended December 31, 2011. This2012. The increase in our net income was due to the factors discussed above. Years Ended December 31, 2012 December 31, 2011 % Change Room $ 94,566 $ 70,421 34.3 % Food and beverage 253 181 39.8 % Other 4,023 2,494 61.3 % Cost reimbursements from unconsolidated real estate entities 1,622 — 100.0 % Total revenue $ 100,464 $ 73,096 37.4 % For the year ended For the year ended December 31, 2012 December 31, 2011 Occupancy 81.8 % 78.5 % ADR $ 130.73 $ 126.26 RevPAR $ 106.95 $ 99.08 Years Ended December 31, 2012 December 31, 2011 % Change Hotel operating expenses: Room $ 20,957 $ 16,011 30.9 % Food and beverage expense 307 197 55.8 % Telephone expense 718 599 19.9 % Other expense 1,508 960 57.1 % General and administrative 9,320 6,842 36.2 % Franchise and marketing fees 7,529 5,621 33.9 % Advertising and promotions 2,257 2,055 9.8 % Utilities 4,081 3,590 13.7 % Repairs and maintenance 4,958 3,619 37.0 % Management fees 2,872 2,159 33.0 % Insurance 523 514 1.8 % Total hotel operating expenses $ 55,030 $ 42,167 30.5 % Years Ended December 31, 2012 December 31, 2011 % Change Mortgage debt interest $ 9,654 $ 4,899 97.1 % Credit facility interest and unused fees 2,932 1,417 106.9 % Other fees 213 296 (28.0 )% Amortization of deferred financing costs 1,842 1,578 16.7 % Total $ 14,641 $ 8,190 78.8 % ventures.ventures following the same approach. We believe that the presentation of FFO provides useful information to investors regarding our operating performance because it measures our performance without regard to specified non-cash items such as42costs associated withand other charges, losses on the departureearly extinguishment of the Company’s former Chief Financial Officer which are referred to as “other charges” belowdebt and acquisition costssimilar items related to the joint venture.our unconsolidated real estate entities that we believe do not represent recurring operations. We believe that Adjusted FFO provides investors with another financial measure that may facilitate comparisons of operating performance between periods and between REITs that make similar adjustments to FFO.lossincome (loss) to FFO and Adjusted FFO for the years ended December 31, 20112013, 2012 and 20102011 (in thousands, except share data): December 31 2011 2010 $ (9,105 ) $ (1,217 ) 11,909 2,537 900 — 3,704 1,320 7,706 3,189 — 345 473 — $ 11,883 $ 4,854 13,280,149 6,377,333 13,280,149 6,377,333 For the year ended December 31, 2013 2012 2011 Funds From Operations (“FFO”): Net income (loss) $ 2,982 $ (1,450 ) $ (9,105 ) Loss (gain) on the sale of assets within the unconsolidated real estate entity 252 (257 ) — Depreciation 18,162 14,198 11,909 Adjustments for unconsolidated real estate entity items 5,055 5,340 900 FFO 26,451 17,831 3,704 Hotel property acquisition costs and other charges 3,341 236 7,706 Loss on early extinguishment of debt 933 — — Adjustments for unconsolidated real estate entity items 964 49 473 Adjusted FFO $ 31,689 $ 18,116 11,883 Weighted average number of common shares Basic 21,035,892 13,811,691 13,280,149 Diluted 21,283,831 13,937,726 13,324,584 joint ventureunconsolidated real estate entity items including interest, depreciation and amortization .excluding gains or losses from sales of real estate. We believe EBITDA is useful to investors in evaluating our operating performance because it helps investors compare our operating performance between periods and between REITs by removing the impact of our capital structure (primarily interest expense) and asset base (primarily depreciation and amortization) from our operating results. In addition, we use EBITDA as one measure in determining the value of hotel acquisitions and dispositions.costs associated withand other charges, losses on the departureearly extinguishment of the former Chief Financial Officer which are referred to as “other charges” below,debt, amortization of non-cash share-based compensation and similar items related to our unconsolidated real estate entities which we believe are not indicative of the performance of our underlying hotel properties and acquisition costs related to the joint venture.entities. We believe that Adjusted EBITDA provides investors with another financial measure that may facilitate comparisons of operating performance between periods and between REITs that report similar measures.43lossincrease to EBITDA and Adjusted EBITDA for the years ended December 31, 20112013, 2012 and 20102011 (in thousands): For the years ended December 31 2011 2010 $ (9,105 ) $ (1,217 ) 8,190 932 69 17 11,971 2,564 1,773 — 11,125 2,296 7,706 3,189 473 — — 345 1,571 1,070 $ 22,648 $ 6,900 For the year ended December 31, 2013 2012 2011 Earnings Before Interest, Taxes, Depreciation and Amortization (“EBITDA”): Net income (loss) $ 2,982 $ (1,450 ) $ (9,105 ) Interest expense 11,580 14,641 8,190 Income tax expense 124 75 69 Depreciation and amortization 18,249 14,273 11,971 Adjustments for unconsolidated real estate entity items 10,934 11,319 1,773 EBITDA 43,869 38,858 12,898 Hotel property acquisition costs and other charges 3,341 236 7,706 Loss on early extinguishment of debt 933 — — Adjustments for unconsolidated real estate entity items 964 49 473 Loss (gain) on the sale of assets within the unconsolidated real estate entity 252 (257 ) — Share based compensation 2,086 2,004 1,571 Adjusted EBITDA $ 51,445 $ 40,890 $ 22,648 costs or costs associated with the departure of the former Chief Financial Officer which are referred to as “other charges”)costs) that result from matters we consider not to be indicative of the underlying performance of our hotel properties; and4420112013 and 2010,December 31, 2012, we had cash and cash equivalents of approximately $4.7$4.2 million and $4.8$4.5 million, respectively. We typically maintain approximately $5.0 million of unrestricted cash and cash equivalents. Additionally, we had $17.5$125.0 million available under our $85.0$175.0 million senior secured revolving credit facility as of December 31, 2011.the issuance of a mortgage loan on our New Rochelle Residence Inn hotel of $15.8 million, net borrowings on our secured credit facility of $29.7 million, offset by principal payments on mortgage debt of $0.9 million, payment of financing costs associated with our amended secured revolving credit facility, and the six new loans acquired or assumed of $1.5 million and distributionsdistribution to shareholders of $9.0 million.For the year ended December 31, 2010, net cash flows provided by operations were $5.3 million, as our net loss of $1.2 million was due in significant part to non-cash expenses, including $2.8 million of depreciation and amortization and $1.2 million of share-based compensation expense. In addition, changes in operating assets and liabilities due to the timing of cash receipts and payments from our hotels resulted in net cash inflow of $2.5 million. Net cash flows used in investing activities were $201.5 million, which represents the acquisition price for thirteen hotels of $197.5 million as well as additional capital improvements to those hotels of $3.6 million and $0.4 million of funds placed into escrows for lender or manager required escrows. Net cash flows provided by financing activities were $201.0 million, comprised primarily of proceeds generated from the initial public offering, net of underwriting fees and offering costs paid or payable to third parties, of $168.7 million and borrowings on our secured credit facility of $37.8 million, offset by costs paid to issue debt of $3.8 million and distributions to shareholders of $1.7 million. have paid regular quarterly dividends and distributions on common shares and LTIP units sincebeginning with the third quarter of 2010.2010 through 2012. In January 2013, we changed our dividend payment frequency from a quarterly dividend to a monthly dividend. Dividends and distributions for each of the quarters of 2011 and the first quarter of 20112012 were $0.175 per common share and LTIP unit. Dividends and distributions for the second, third and fourth quarters of 2012 increased to $0.20 per common share and LTIP unit. We declared total dividends of $0.07 per common share and LTIP unit for each month of 2013. On January 27, 2012,31, 2014, we paid an aggregate of $2.5$1.9 million in fourth quarter dividends on our common shares and distributions on our LTIP units.4535 percent35% measured at the time we incur debt, and a subsequent decrease in hotel property values will not necessarily cause us to repay debt to comply with this limitation. In the 2011 second quarter,However, our Board of Trustees approved the temporary increase in our targeted leverage to not more than 55 percent, not including our share of assets and liabilities of the JV. Our Board of Trusteescurrently believes that temporarily increasing our leverage limit at this stage of the lodging recovery cycle recoverywhile interest rates on a historical basis are very attractive is prudentappropriate, so we will continue to take advantagemake acquisitions where suitable. Our current leverage ratio is 36%, which is down from 51% at December 31, 2012. We will pay down borrowings on our secured revolving credit facility with excess cash flow until we find other uses of the opportunity to buy the 5 Sisterscash such as investments in our existing hotels, hotel acquisitions or further joint venture investments.invest2012, we had $50.0 million and $79.5 million, respectively, in the JV.On October 12, 2010, we entered into an $85 millionborrowings under our senior secured revolving credit facility. At 2011 and December 31, 2010, we had $67.5 million and $37.8 million, respectively, in borrowings under this credit facility. At December 31, 2011,2013, there were ten12 properties in the borrowing base under the credit agreement and the maximum borrowing availability under the revolving credit facility was $75.0 million. Subsequent to approximately $175.0 million. We also had mortgage debt on individual hotels aggregating $222.1 million and $159.7 million at December 31, 2011, we repaid $5.5 million on the credit facility.We2013our $85 millionand restated senior secured revolving credit facility effective May 2011.on December 11, 2013. The amendment provides forextends the maturity date to November 5, 2016 and includes an increase inoption to extend the allowable consolidated leverage ratio to 60 percent through 2012, reducing to 55 percent in 2013; and a decrease in the consolidated fixed charge coverage ratio from 2.3x to 1.7x through March 2012, increasing to 1.75x through December 2012 and 2.0x in 2013. Subject to certain conditions, the credit facility still hasmaturity date by an accordion feature that provides us with the ability to increase the facility to $110 million.Facility amount $175 million Accordion feature Increase additional $50 million LIBOR floor None Interest rate applicable margin 200-300 basis points, based on leverage ratio Unused fee 25 basis points if less than 50% unused, 35 basis points if more than 50% unused Minimum fixed charge coverage ratio 1.5x The five mortgage loans we assumed in connection withSuch limitations on distributions also includes a limitation on the acquisitionextent of allowable distributions to the 5 Sisters as well asCompany not to exceed the New Rochelle Residence Inn loan do not contain any financial covenants.greater of 95% of Adjusted Funds from Operations and the minimum amount of distributions required for the Company to maintain its REIT status. We were in compliance with theseall financial covenants at December 31, 2011.On February 8, 2011, we completed a public offering of 4.6 million common shares, raising net proceeds of $69.4 million. We used $42.8 million to pay down debt outstanding on the revolving credit facility. We used the remaining funds to fund a portion of our acquisition of the 5 Sisters, described under Note 4, Acquisition of Hotel Properties, in the notes to our consolidated financial statements above.facility.facility or through the encumbrance of any unencumbered hotels. We believe that our net cash provided by operations will be adequate to fund operating obligations, pay interest on any borrowings and fund dividends in accordance with the requirements for qualification as a REIT under the Code. We expect to meet our long-term liquidity requirements, such as hotel property acquisitions and debt maturities or repayments through additional long-term secured and unsecured borrowings, and the issuance of additional equity or debt securities.46 in certain instances, we may be required to complete a property improvement plan (“PIP”) in order to be granted a new franchise license for that particular hotel property. PIPs are intended to bring the hotel property up to the franchisor’s standards. Certain of our loans require that we make availableescrow for suchproperty improvement purposes, at the hotels collateralizing these loans, amountsa rate up to 5% of gross revenue from such hotels.the hotel collateralizing the borrowing. We intend to cause the expenditure ofspend amounts in excess of such obligated amounts, if necessary to comply with any reasonableloan or franchisor requirements and otherwise to the extent that we deem such expenditures to beare in the best interestsinterest of the hotel. To the extent that we spend more on capital expenditures than is available from our operations, we intend to fund those capital expenditures withutilize available cash and borrowings under the revolving credit facility.Factors”Related to Our Business” and Note 14,13, “Related Party Transactions”, to our consolidated financial statements included in this Annual Report on Form 10-K.2011,2013, and the effect these obligations are expected to have on our liquidity and cash flow in future periods (in thousands). We had no other material off-balance sheet arrangements at December 31, 2011. Payments Due by Period Total Less Than
One Year One to Three
Years Three to Five
Years More Than
Five Years $ 141 $ 38 $ 79 $ 24 $ — 73,854 3,631 70,223 — — 12,698 203 413 422 11,660 211,887 11,585 23,170 159,394 17,738 $ 298,580 $ 15,457 $ 93,885 $ 159,840 $ 29,398 Payments Due by Period Contractual Obligations Total Less Than
One Year One to Three
Years Three to Five
Years More Than Five
YearsCorporate office lease $ 64 $ 40 $ 24 $ — $ — Revolving credit facility, including interest (1) 55,170 1,773 53,397 — — Ground leases 12,288 207 422 431 11,228 Property loans, including interest (1) 286,174 14,153 71,028 22,775 178,218 Total $ 353,696 $ 16,173 $ 124,871 $ 23,206 $ 189,446 (1) 2011 and interest2013. Interest payments are based on the interest rate in effect as of December 31, 2011.2013. See Note 7,6, “Debt” to our consolidated financial statements for additional information relating to our property loans.47 investment in hotel properties are carried at cost and are depreciated using the straight-line method over the estimated useful lives of the assets, generally 40 years for buildings, 20 years for land improvements, 15 years for building improvements and threetwo to tenseven years for furniture, fixtures and equipment. Renovations and/or replacements at the hotel properties that improve or extend the life of the assets are capitalized and depreciated over their useful lives, while repairs and maintenance are expensed as incurred. Upon the sale or retirement of property and equipment, the cost and related accumulated depreciation are removed from the Company’s accounts and any resulting gain or loss is recognized in the consolidated statements of operations.We will periodically review oursuchthis conditions exist, management will perform an analysis to determine if the estimated undiscounted future cash flows, without interest charges, from operations and the proceeds from the ultimate disposition of a hotel property exceed its carrying value. If the estimated undiscounted future cash flows are less than the carrying amount, an adjustment to reduce the carrying amount to the related hotel property’sproperty's estimated fair market value is recorded and an impairment loss recognized. As of December 31, 2013, 2012 and 2011, we had no hotels that were impaired.sheets.sheets if we no longer have significant continuing involvement. As of December 31, 2011,2013, we had no hotel properties held for sale.shares.48purposes.purposes commencing with our 2010 taxable year. In order to qualify as a REIT under the Code, we must meet certain organizational and operational requirements, including a requirement to distribute at least 90% of our annual REIT taxable income to our shareholders (which is computed without regard to the dividends paid deduction or net capital gain and which does not necessarily equal net income as calculated in accordance with GAAP). As a REIT, we generally will not be subject to federal income tax to the extent we currently distribute our taxable income to our shareholders. If we fail to qualify as a REIT in any taxable year, we will be subject to federal income tax on our taxable income at regular corporate income tax rates and generally will not be permitted to qualify for treatment as a REIT for federal income tax purposes for the four taxable years following the year during which qualification is lost unless the IRS grants us relief under certain statutory provisions. Such an event could materially adversely affect our net income and net cash available for distribution to shareholders. However, we believe we have been organized and that we operate in such a manner as to qualify for treatment as a REIT.Recently Issued Accounting StandardsIn May 2011, the FASBInternational Accounting Standards Board (“IASB”) (collectively the “Boards”) issued ASU No. 2011-04, Fair Value Measurement (Topic 820): Amendments to Achieve Common Fair Value Measurement and Disclosure Requirements in U.S. GAAP and IFRSs (“ASU 2044-04”). ASC 2011-04 created a uniform framework for applying fair value measurement principles for companies around the world and clarified existing guidance in U.S. GAAP. ASU 2011-04 is effective for the first annual reporting period beginning after December 15, 2011 and shall be applied prospectively. The Company does not expect this standard to have any material effect on our consolidated financial statements.In June 2011, the FASB issued ASU No. 2011-05, Comprehensive Income (Topic 220), Presentation of Comprehensive Income. This update is intended to increase the prominence of other comprehensive income in the financial statements by requiring public companies to present comprehensive income either as a single statement detailing the components of net income and total net income, the components of other comprehensive income and total other comprehensive income, and a total for comprehensive income or using a two statement approach including both a statement of income and a statement of comprehensive income. The option to present other comprehensive income in the statement of changes in equity has been eliminated. The amendments in this update, which should be applied retrospectively, are effective for public companies for fiscal years, and interim periods beginning after December 15, 2011. Currently, the Company has no items of other comprehensive income in any periods presented and adoption of this standard is not expected to impact us.Item 7A.Quantitative and Qualitative Disclosures about Market RiskInterest rate riskmaturity.maturity and fair value of the underlying collateral. The estimated fair value of the Company’s fixed rate debt as of at December 31, 20112013 and 2010December 31, 2012 was $159.4$220.0 million and $12.6$168.2 million, respectively.492011,2013, our consolidated debt was comprised of floating and fixed interest rate debt. The fair value of our fixed rate debt indicates the estimated principal amount of debt having the same debt service requirements that could have been borrowed at the date presented, at then current market interest rates. The following table provides information about the maturities of our financial instruments that are sensitive to changes in interest rates (in thousands):Expected Maturities 2012 2013 2014 2015 2016 Thereafter Total Fair
Value $ — $ 67,500 $ 67,500 $ 67,513 5.25 % 5.25 % 5.25 % $ 1,848 $ 1,981 $ 2,106 $ 6,778 $ 134,587 $ 14,140 $ 161,440 $ 159,386 5.95 % 5.95 % 5.95 % 5.88 % 6.00 % 5.75 % 5.97 % 2014 2015 2016 2017 2018 Thereafter Total Fair Value Floating rate: Debt — — $ 50,000 — — — $ 50,000 $ 49,995 Average interest rate (1) — — 2.67 % — — — 2.67 % Fixed rate: Debt $2,974 $8,375 $40,424 $ 3,290 $ 3,383 $163,617 $ 222,063 $ 219,990 Average interest rate 5.05 % 5.47 % 5.88 % 4.76 % 4.78 % 4.75 % 4.99 % (1) floor rate of 1.25%0.17% plus a margin of 4.0%2.50% at December 31, 2011. The one-month LIBOR rate was 0.28% at December 31, 2011.2013.$0.7$0.5 million annually. This assumes that the amount outstanding under our floating rate debt remains at $67.5$50.0 million, the balance as of December 31, 2011.2013. Consolidated Financial Statements and Supplementary DataF-1.Item 9.Changes in and Disagreements with Accountants on Accounting and Financial DisclosureNone.Item 9A.Controls and ProceduresSEC’sSEC's rules and forms, and that such information is accumulated and communicated to our management to allow timely decisions regarding required disclosure.502011.2013. In making this assessment, management used the criteria set forth by the Committee of Sponsoring Organizations of the Treadway Commission (COSO) in “Internal Control-Integrated Framework” (1992 framework). Based on our assessment, management has concluded that, as of December 31, 2011,2013, our internal control over financial reporting is effective, based on those criteria.2011,2013, has been audited by PricewaterhouseCoopers LLP, an independent registered certified public accounting firm as stated in their report, which appears on page F-2 of this Annual Report on Form 10-K.Other InformationNone.51PART IIIItem 10.Trustees, Executive Officers and Corporate GovernanceCompany’sCompany's Proxy Statement for the 20112014 Annual Meeting of Shareholders to be held on May 1, 2012.Item 11.Executive CompensationCompany’sCompany's Proxy Statement for the 20112014 Annual Meeting of Shareholders to be held on May 1, 2012.Item 12.Security Ownership of Certain Beneficial Owners and Management and Related Stockholder MattersCompany’sCompany's Proxy Statement for the 20112014 Annual Meeting of Shareholders to be held on May 1, 2012.Item 13.Certain Relationships and Related Transactions, and Trustee IndependenceCompany’sCompany's Proxy Statement for the 20112014 Annual Meeting of Shareholders to be held on May 1, 2012.Item 14.Principal Accountant Fees and ServicesCompany’sCompany's Proxy Statement for the 20112014 Annual Meeting of Shareholders to be held on May 1, 2012.52F-24-25F-26:III—III - Real Estate and Accumulated DepreciationThe followingarerequired to be filed as part of this Annual Reportreport on Form 10-K:53 Description 3.1 3.2 Form of3.3 (1)(2) 3.3 3.4 10.1* (2)Amended and Restated as of May 17, 2013 (3) 10.2(a)* 10.2(b)12.2(b)* 10.2(c)* (3)(4) 10.3 Agreement of Purchase and Sale, dated as of May 18, 2010, by and among Chatham Lodging Trust, as purchaser, and certain affiliates of Moody National Companies, as sellers, for the Residence Inn by Marriott, White Plains, NY; Hampton Inn & Suites Houston—Medical Center, Houston, TX; SpringHill Suites by Marriott, Washington, PA; and Courtyard by Marriott, Altoona, PA (2) 10.410.3* Agreement of Purchase and Sale, dated as of June 17, 2010, by and among Chatham Lodging Trust, as purchaser, and Holtsville Hotel Group LLC and FB Holtsville Utility LLC, as sellers, for the Residence Inn Long Island Holtsville, Holtsville, NY (2) 10.5Agreement of Purchase and Sale, dated as of August 6, 2010, by and between Chatham Lodging Trust, as purchaser, and New Roc Hotels, LLC, as seller, for the Residence Inn New Rochelle, New Rochelle, NY (3) 10.6Agreement of Purchase and Sale, dated as of August 18, 2010, by and among Chatham Lodging Trust, as purchaser, and Royal Hospitality Washington, LLC and Lee Estates, LLC, as sellers, for the Homewood Suites Carlsbad, Carlsbad, CA (3) 10.7* 10.8* 10.4* 10.9* 10.5* 10.10* 10.6* 10.11 10.7* 10.8* 10.9* 10.10* 10.11* 10.12* 10.13 10.12 10.14 October 12, 2010,November 5, 2012, among Chatham Lodging Trust, Chatham Lodging, L.P., as borrower, the lenders and other guarantors party thereto and Barclays Bank PLC, as administrative agent (4)(7) 10.13 10.15 10.16 IncInc.(9) 10.14 10.17 LP,L.P., as purchaser, and KPA RIMV, LLC, KPA RIGG LLC, KPA Tysons Corner RI, LLC, KPA Washington DC, LLC and KPA San Antonio, LLC, as sellers, for the Residence Inn, San Diego, CA, Residence Inn, Anaheim, CA, Residence Inn Tysons Corner, VA, Double Tree Washington, DC and Homewood Suites, San Antonio, TX (5)54(10) ExhibitNumber Exhibit Description 10.1510.18 LP,L.P., as purchaser, and KPA RIMV, LLC, KPA RIGG LLC, KPA Tysons Corner RI, LLC, KPA Washington DC, LLC and KPA San Antonio, LLC, as sellers, for the Residence Inn, San Diego, CA, Residence Inn, Anaheim, CA, Residence Inn Tysons Corner, VA, Double Tree Washington, DC and Homewood Suites, San Antonio, TX (5)(10) 10.1610.19 (5)(10) 12.1 Statement of computation of ratio of earnings to fixed charges and preferred share dividends 21.1 List of Subsidiaries of Chatham Lodging Trust 23.1 PricewaterhouseCoopers LLP Consent to include Report on Financial Statements of Chatham Lodging Trust and Report on Financial Statements of INK Acquisitions, LLC and Affiliates 31.1 Certification of Chief Executive Officer pursuant to Rule 13a-14(a)/15d-14(a) of the Securities Exchange Act of 1934, as amended, as adopted pursuant to Section 302 of the Sarbanes-Oxley Act of 2002 31.2 Certification of Chief Financial Officer pursuant to Rule 13a-14(a)/15d-14(a) of the Securities Exchange Act of 1934, as amended, as adopted pursuant to Section 302 of the Sarbanes-Oxley Act of 2002 32.1 Certification of Chief Executive Officer and Chief Financial Officer pursuant to 18 U.S.C. 1350, as adopted pursuant to Section 906 of the Sarbanes-Oxley Act of 2002 101.INS** XBRL Instance Document 101.SCH** XBRL Taxonomy Extension Schema Document 101.CAL** XBRL Taxonomy Extension Calculation Linkbase Document 101.DEF* XBRL Taxonomy Extension Definition Linkbase Document101.LAB** XBRL Taxonomy Extension Definition Linkbase Document 101.PRE*101.LAB** XBRL Taxonomy Extension Label Linkbase Document 101.PRE** XBRL Taxonomy Extension Presentation Linkbase Document * Denotes management contract or compensation plan or arrangement in which trustees or officers are eligible to participate. ** Furnished herewith. Pursuant to Rule 406T of Regulation S-T, the interactive data files on Exhibit 101 hereto are deemed not filed or part of a registration statement or prospectus for purposes of Sections 11 or 12 of the Securities Act of 1933, as amended, are deemed not filed for purposes of Section 18 of the Securities and Exchange Act of 1934, as amended, and otherwise are not subject to liability under those sections. (1)Incorporated by reference to Amendment No. 4 to the Registrant’s Registration Statement on Form S-11 filed with the SEC on February 12, 2010 (File No. 333-162889).(2)Incorporated by reference to the Registrant’s Quarterly Report on Form 10-Q filed with the SEC on August 13, 2010 (File No. 001-34693).(3)Incorporated by reference to the Registrant’s Registration Statement on Form S-11 filed with the SEC on October 28, 2010 (File No. 333-170176).(4)Incorporated by reference to the Registrant’s Current Report on Form 8-K filed with the SEC on October 18, 2010.(5)Incorporated by reference to the Registrant’s Quarterly Report on Form 10-Q filed with the SEC on August 11, 2011 (File No. 001-34693).55authorizedauthorized. CHATHAM LODGING TRUST CHATHAM LODGING TRUSTDated: March 9, 201210, 2014 /s/ JEFFREY H. FISHER /s/ JEFFREYJeffrey H. FISHER Fisher Jeffrey H. FisherChairman of the Board, President and Chief Executive Officer (Principal Executive Officer) /s/ JEFFERY H. FISHER Jeffrey H. Fisher /s/ JEFFREY H. FISHER Chairman of the Board, President and Chief Executive Officer (Principal Executive Officer) March 9, 201210, 2014/s/ DENNIS M. CRAVEN Dennis M. Craven /s/ DENNIS M. CRAVEN Executive Vice President and Chief Financial Officer (Principal Financial and Accounting Officer) March 9, 201210, 2014/s/ MILES BERGER Miles Berger /s/ MILES BERGER Trustee March 9, 201210, 2014/s/ THOMAS J. CROCKER Thomas J. Crocker /s/ THOMAS J. CROCKER Trustee March 9, 201210, 2014/s/ JACK P. DEBOER Jack P. DeBoer /s/ JACK P. DEBOER Trustee March 9, 201210, 2014/s/ GLEN R. GILBERT Glen R. Gilbert /s/ GLEN R. GILBERT Trustee March 9, 201210, 2014Glen R. Gilbert /s/ C. GERALD GOLDSMITH C. Gerald Goldsmith March 9, 201210, 2014/s/ ROBERT PERLMUTTER Robert Perlmutter /s/ ROBERT PERLMUTTER Trustee March 9, 201210, 2014/s/ ROLF E. RUHFUS Rolf E. Ruhfus /s/ ROLF E. RUHFUS Trustee March 9, 201210, 2014/s/ JOEL F. ZEMANS Joel F. Zemans /s/ JOEL F. ZEMANS Trustee March 9, 201210, 2014Joel F. Zemans 56 PageNo. Page No. Report of Independent Registered Certified Public Accounting Firm F-2 20112013 and 20102012 F-3 20112013, 2012 and 20102011 F-4 20112013, 2012 and 20102011 F-5 20112013, 2012 and 20102011 F-6 F-7 F-7Financial Statement Schedule Financial Statement Schedule–- Real Estate and Accumulated Depreciation at December 31, 2011 F-26F-31 Trust20112013 and 2010,2012, and the results of their operations and their cash flows for each of the three years thenin the period ended December 31, 2013in conformity with accounting principles generally accepted in the United States of America. In addition, in our opinion, the financial statement schedule listed in the accompanying indexpresents fairly, in all material respects, the information set forth therein when read in conjunction with the related consolidatedfinancial statements. Also in our opinion, the Company maintained, in all material respects, effective internal control over financial reporting as of December 31, 2011,2013, based on criteria established inInternal Control—Control - Integrated Framework (1992 framework)issued by the Committee of Sponsoring Organizations of the Treadway Commission (COSO). The Company’sCompany's management is responsible for these financial statements and financial statement schedule, for maintaining effective internal control over financial reporting and for its assessment of the effectiveness of internal control over financial reporting, included in Management’s Report on Internal Control over Financial Reporting appearing under Item 9A. Our responsibility is to express opinions on these financial statements, on the financial statement schedule, and on the Company’sCompany's internal control over financial reporting based on our audits (which was an integrated audit in 2011).audits. We conducted our audits in accordance with the standards of the Public Company Accounting Oversight Board (United States). Those standards require that we plan and perform the audits to obtain reasonable assurance about whether the financial statements are free of material misstatement and whether effective internal control over financial reporting was maintained in all material respects. Our audits of the financial statements included examining, on a test basis, evidence supporting the amounts and disclosures in the financial statements, assessing the accounting principles used and significant estimates made by management, and evaluating the overall financial statement presentation. Our audit of internal control over financial reporting included obtaining an understanding of internal control over financial reporting, assessing the risk that a material weakness exists, and testing and evaluating the design and operating effectiveness of internal control based on the assessed risk. Our audits also included performing such other procedures as we considered necessary in the circumstances. We believe that our audits provide a reasonable basis for our opinions./s/ PricewaterhouseCoopers LLPFort Lauderdale, FloridaMarch 8, 2012 December 31, December 31, 2011 2010 $ 402,815 $ 208,080 4,680 4,768 5,299 3,018 36,003 — 2,057 891 6,350 4,710 1,502 735 $ 458,706 $ 222,202 $ 228,940 $ 50,133 10,184 5,248 2,464 1,657 241,588 57,038 — — 137 91 239,173 169,089 (23,220 ) (4,441 ) 216,090 164,739 1,028 425 217,118 165,164 $ 458,706 $ 222,202 December 31,
2013 December 31,
2012 Assets: Investment in hotel properties, net $ 652,877 $ 426,074 Cash and cash equivalents 4,221 4,496 Restricted cash 4,605 2,949 Investment in unconsolidated real estate entities 774 13,362 Hotel receivables (net of allowance for doubtful accounts of $30 and $28, respectively) 2,455 2,098 Deferred costs, net 7,113 6,312 Prepaid expenses and other assets 1,879 1,930 Total assets $ 673,924 $ 457,221 Liabilities and Equity: Mortgage debt $ 222,063 $ 159,746 Revolving credit facility 50,000 79,500 Accounts payable and accrued expenses 12,799 8,488 Distributions and losses in excess of investments of unconsolidated real estate entities 1,576 — Distributions payable 1,950 2,875 Total liabilities 288,388 250,609 Commitments and contingencies Equity: Shareholders’ Equity: Preferred shares, $0.01 par value, 100,000,000 shares authorized and unissued at December 31, 2013 and 2012 — — Common shares, $0.01 par value, 500,000,000 shares authorized; 26,295,558 and 13,908,907 shares issued and outstanding at December 31, 2013 and 2012, respectively 261 137 Additional paid-in capital 433,900 240,355 Accumulated deficit (50,792 ) (35,491 ) Total shareholders’ equity 383,369 205,001 Noncontrolling Interests: Noncontrolling interest in operating partnership 2,167 1,611 Total equity 385,536 206,612 Total liabilities and equity $ 673,924 $ 457,221 For the year ended
December 31, 2011 2010 $ 70,421 $ 24,743 2,675 727 73,096 25,470 16,011 5,989 26,156 9,036 42,167 15,025 11,971 2,564 5,321 1,606 5,802 3,547 7,706 3,189 72,967 25,931 129 (461 ) 22 193 (8,190 ) (932 ) (997 ) — (9,036 ) (1,200 ) (69 ) (17 ) $ (9,105 ) $ (1,217 ) $ (0.69 ) $ (0.20 ) $ (0.69 ) $ (0.20 ) 13,280,149 6,377,333 13,280,149 6,377,333 For the year ended December 31, 2013 2012 2011 Revenue: Room $ 118,169 $ 94,566 $ 70,421 Food and beverage 1,311 253 181 Other 5,113 4,023 2,494 Cost reimbursements from unconsolidated real estate entities 1,635 1,622 — Total revenue 126,228 100,464 73,096 Expenses: Hotel operating expenses: Room 25,709 20,957 16,011 Food and beverage expense 944 307 197 Telephone expense 899 718 599 Other hotel operating expense 1,580 1,508 960 General and administrative 11,529 9,320 6,842 Franchise and marketing fees 9,394 7,529 5,621 Advertising and promotions 2,782 2,257 2,055 Utilities 4,955 4,081 3,590 Repairs and maintenance 6,310 4,958 3,619 Management fees 3,752 2,872 2,159 Insurance 742 523 514 Total hotel operating expenses 68,596 55,030 42,167 Depreciation and amortization 18,249 14,273 11,971 Property taxes and insurance 8,915 7,088 5,321 General and administrative 8,131 7,565 5,802 Hotel property acquisition costs and other charges 3,341 236 7,706 Reimbursable costs from unconsolidated real estate entities 1,635 1,622 — Total operating expenses 108,867 85,814 72,967 Operating income 17,361 14,650 129 Interest and other income 132 55 22 Interest expense, including amortization of deferred fees (11,580 ) (14,641 ) (8,190 ) Loss on early extinguishment of debt (933 ) — — Loss from unconsolidated real estate entities (1,874 ) (1,439 ) (997 ) Income (loss) before income tax expense 3,106 (1,375 ) (9,036 ) Income tax expense (124 ) (75 ) (69 ) Net income (loss) $ 2,982 $ (1,450 ) $ (9,105 ) Income per Common Share - Basic: Net income (loss) attributable to common shareholders (Note 10) $ 0.13 $ (0.12 ) $ (0.69 ) Income per Common Share - Diluted: Net income (loss) attributable to common shareholders (Note 10) $ 0.13 $ (0.12 ) $ (0.69 ) Weighted average number of common shares outstanding: Basic 21,035,892 13,811,691 13,280,149 Diluted 21,283,831 13,811,691 13,280,149 For the years ended December 31, 2011 and 2010 Additional Total Noncontrolling
Interest in Common Shares Paid-In Accumulated Shareholders’ Operating Total Shares Amount Capital Deficit Equity Partnership Equity 1,000 — 10 — 10 — 10 9,125,000 91 168,657 — 168,748 — 168,748 (1,000 ) — (10 ) (10 ) — (10 ) 87,000 — — — — — — (3,250 ) — — — — — — — — 432 — 432 515 947 — — — (3,224 ) (3,224 ) — (3,224 ) — — — — — (90 ) (90 ) — — — (1,217 ) (1,217 ) (1,217 ) 9,208,750 91 169,089 (4,441 ) 164,739 425 165,164 12,104 — 210 — 210 — 210 4,600,000 46 69,401 — 69,447 — 69,447 (915 ) — (15 ) — (15 ) — (15 ) — — 488 — 488 783 1,271 — — — (9,674 ) (9,674 ) — (9,674 ) — — — — — (180 ) (180 ) — — — (9,105 ) (9,105 ) — (9,105 ) 13,819,939 $ 137 $ 239,173 $ (23,220 ) $ 216,090 $ 1,028 $ 217,118 Common Shares Shares Amount Balance January 1, 2011 9,208,750 91 169,089 (4,441 ) 164,739 425 165,164 Issuance of shares pursuant to Equity Incentive Plan 12,104 — 210 — 210 — 210 Issuance of shares, net of offering costs of $4,153 4,600,000 46 69,401 — 69,447 — 69,447 Repurchase of common shares (915 ) — (15 ) — (15 ) — (15 ) Amortization of share based compensation — — 488 — 488 783 1,271 Dividends declared on common shares ($0.70 per share) — — — (9,674 ) (9,674 ) — (9,674 ) Distributions declared on LTIP units ($0.70 per unit) — — — — — (180 ) (180 ) Net loss — — — (9,105 ) (9,105 ) — (9,105 ) Balance, December 31, 2011 13,819,939 137 239,173 (23,220 ) 216,090 1,028 217,118 Issuance of shares pursuant to Equity Incentive Plan 27,592 — 300 — 300 — 300 Issuance of restricted time-based shares 61,376 — — — — — — Amortization of share based compensation — — 882 — 882 781 1,663 Dividends declared on common shares ($0.775 per share) — — — (10,821 ) (10,821 ) — (10,821 ) Distributions declared on LTIP units ($0.775 per unit) — — — — — (198 ) (198 ) Net loss — — — (1,450 ) (1,450 ) — (1,450 ) Balance, December 31, 2012 13,908,907 137 240,355 (35,491 ) 205,001 1,611 206,612 Issuance of shares pursuant to Equity Incentive Plan 22,536 — 337 — 337 — 337 Issuance of shares, net of offering costs of $10,388 12,306,000 124 192,239 — 192,363 — 192,363 Issuance of restricted time-based shares 40,829 — — — — — — Issuance of performance based shares 17,731 — — — — — — Repurchase of common shares (445 ) — (7 ) — (7 ) — (7 ) Amortization of share based compensation — — 966 — 966 782 1,748 Dividends declared on common shares ($0.84 per share) — — — (18,283 ) (18,283 ) — (18,283 ) Distributions declared on LTIP units ($0.84 per unit) — — — — — (216 ) (216 ) Reallocation of noncontrolling interest — — 10 — 10 (10 ) — Net income — — — 2,982 2,982 — 2,982 Balance, December 31, 2013 26,295,558 $ 261 $ 433,900 $ (50,792 ) $ 383,369 $ 2,167 $ 385,536 For the years ended December 31, 2011 2010 $ (9,105 ) $ (1,217 ) 11,908 2,537 63 27 1,575 280 1,571 1,157 997 — (1,022 ) (336 ) (96 ) (1,218 ) (633 ) (76 ) 3,688 4,120 8,946 5,274 (12,721 ) (3,610 ) (61,981 ) (197,525 ) (37,000 ) — (821 ) (376 ) (112,523 ) (201,511 ) 15,800 — 127,500 37,800 (97,800 ) — (853 ) (101 ) (1,543 ) (3,799 ) (4,153 ) (13,752 ) 73,600 182,490 (15 ) — (9,047 ) (1,657 ) 103,489 200,981 (88 ) 4,744 4,768 24 $ 4,680 $ 4,768 $ 6,197 $ 527 $ 162 $ 27 For the year ended December 31, 2013 2012 2011 Cash flows from operating activities: Net income (loss) $ 2,982 $ (1,450 ) $ (9,105 ) Adjustments to reconcile net income (loss) to net cash provided by operating activities: Depreciation 18,162 14,198 11,908 Amortization of deferred franchise fees 87 75 63 Amortization of deferred financing fees included in interest expense 1,088 1,840 1,575 Loss on early extinguishment of debt 933 — — Loss on write-off of deferred franchise fee 64 — — Share based compensation 2,085 2,003 1,571 Loss from unconsolidated real estate entities 1,874 1,439 997 Changes in assets and liabilities: Hotel receivables (68 ) (41 ) (1,022 ) Deferred costs (493 ) (148 ) (96 ) Prepaid expenses and other assets 338 (428 ) (633 ) Accounts payable and accrued expenses 4,519 (2,603 ) 3,688 Net cash provided by operating activities 31,571 14,885 8,946 Cash flows from investing activities: Improvements and additions to hotel properties (16,178 ) (8,590 ) (12,721 ) Acquisition of hotel properties, net of cash acquired (229,646 ) (27,998 ) (61,981 ) Distributions from unconsolidated entities 13,939 21,202 — Investment in unconsolidated real estate entities (1,649 ) — (37,000 ) Restricted cash (1,656 ) 2,350 (821 ) Net cash used in investing activities (235,190 ) (13,036 ) (112,523 ) Cash flows from financing activities: Borrowings on revolving credit facility 234,000 38,500 127,500 Repayments on revolving credit facility (263,500 ) (26,500 ) (97,800 ) Payments on debt (2,166 ) (1,694 ) (853 ) Proceeds from the issuance of debt 164,613 — 15,800 Principal prepayment of mortgage debt (100,130 ) — — Payments of financing costs (2,405 ) (1,452 ) (1,543 ) Payment of offering costs (10,388 ) (277 ) (4,153 ) Proceeds from issuance of common shares 202,751 — 73,600 In-substance repurchase of vested common shares (7 ) — (15 ) Distributions-common shares/units (19,424 ) (10,610 ) (9,047 ) Net cash provided by (used in) financing activities 203,344 (2,033 ) 103,489 Net change in cash and cash equivalents (275 ) (184 ) (88 ) Cash and cash equivalents, beginning of period 4,496 4,680 4,768 Cash and cash equivalents, end of period $ 4,221 $ 4,496 $ 4,680 Supplemental disclosure of cash flow information: Cash paid for interest $ 10,169 $ 12,677 $ 6,197 Cash paid for income taxes $ 77 $ 135 $ 162 The Company has accrued distributions payable of $2,464. These distributions were paid on January 27, 2012.11, 2011,15, 2013, the Company issued 12,10422,536 shares to its independent Trusteestrustees pursuant to the Company’s Equity Incentive Plan as compensation for services performed in 2012. On January 6, 2012, the Company issued 27,592 shares to its independent trustees pursuant to the Company’s Equity Incentive Plan as compensation for services performed in 2011. On January 11, 2011, the Company issued 12,104 shares to its independent trustees pursuant to the Company's Equity Incentive Plan as compensation for services performed in 2010.$210 was$337, $337 and $300 is included in Accountsaccounts payable and accrued expenses as of December 31, 2010. 2013, 2012 and 2011.share based compensationcapital improvements of $300 is$323, $869 and $528 are included in Accountsaccounts payable and acrruedaccrued expenses as of December 31, 2011.For the year ended December 31,2013the Company assumed the mortgages on the purchase of the 5 Sisters for $134,160 (Note 3). For the year ended December 31, 2010, the Company assumed the mortgages on the purchase of the Altoona and Washington hotels for $12,434.1.Organization$20.00$20.00 per share, generating $172.5 million in gross proceeds. Net proceeds, after underwriters’ discounts and commissions and other offering costs, were approximately $158.7 million. Concurrently with the closing of the IPO, in a separate private placement pursuant to Regulation D under the Securities Act of 1933, as amended (the “Securities Act”), the Company sold 500,000 of its common shares to Jeffrey H. Fisher, the Company’s Chairman, President and Chief Executive Officer (“Mr. Fisher”), at the public offering price of $20.00$20.00 per share, for proceeds of $10.0 million.The company utilized the proceeds to acquire the following thirteen properties in 2010:PropertyLocationManagementCompanyDate ofAcquisitionDebtPurchasePriceHomewood Suites by Hilton Boston-Billerica/ Bedford/ BurlingtonBillerica, MassachusettsHiltonApril 23, 2010— $12.5 millionHomewood Suites by Hilton Minneapolis-Mall of AmericaBloomington, MinnesotaHiltonApril 23, 2010— $18.0 millionHomewood Suites by Hilton Nashville-BrentwoodBrentwood, TennesseeHiltonApril 23, 2010— $11.3 millionHomewood Suites by Hilton Dallas-Market CenterDallas, TexasHiltonApril 23, 2010— $10.7 millionHomewood Suites by Hilton Hartford-FarmingtonFarmington, ConnecticutHiltonApril 23, 2010— $11.5 millionHomewood Suites by Hilton Orlando-MaitlandMaitland, FloridaHiltonApril 23, 2010— $9.5 millionHomewood Suites by Hilton Carlsbad (North San Diego County)Carlsbad, CaliforniaIsland HospitalityNovember 3, 2010— $32.0 millionHampton Inn & Suites Houston-Medical CenterHouston, TexasIsland HospitalityJuly 2, 2010— $16.5 millionCourtyard AltoonaAltoona, PennsylvaniaConcordAugust 24, 2010$7.0 million$11.3 millionSpringhill Suites WashingtonWashington, PennsylvaniaConcordAugust 24, 2010$5.4 million$12.0 millionResidence Inn Long Island HoltsvilleHoltsville, New YorkIsland HospitalityAugust 3, 2010— $21.3 millionResidence Inn White PlainsWhite Plains, New YorkIsland HospitalitySeptember 23, 2010— $21.2 millionResidence Inn New RochelleNew Rochelle, New YorkIsland HospitalityOctober 5, 2010— $21.0 millionTotal$12.4 million$208.8 millionThe Company allocated the following total purchase price allocation to those thirteen properties acquired in 2010: Total $ 24,620 176,349 6,038 48 2,642 555 659 (12,434 ) (904 ) $ 197,573 $ 197,525 F-7million, adding capital to the Company’s balance sheet.million. Using these funds as well as borrowing capacity on ourits secured revolving credit facility, on July 14, 2011, the Company acquired the JVINK Acquisition, LLC with Cerberus Capital Management ( “Cerberus”(“Cerberus”) that acquired 64 hotels from Innkeepers USA Trust (“Innkeepers”) on October 27, 2011. The Company accounts for this investment under the equity method.Thehad no operations priorcompleted a follow-on common share offering generating gross proceeds of $51.4 million and net proceeds of approximately $48.4 million. On January 31, 2013, the Company issued an additional 92,677 common shares pursuant to the consummationexercise of the IPO. Followingunderwriters’ over-allotment option in the closingoffering that closed on January 14, 2013, generating gross proceeds of approximately $1.4 million and net proceeds of approximately $1.3 million. Proceeds from the January 2013 offering were used to repay debt under the Company’s secured revolving credit facility, including debt incurred in connection with the $28.0 million acquisition of the IPO,Hampton Inn Portland Downtown-Waterfront hotel in Portland, ME (the “Portland Hotel”) and the $34.8 million acquisition of the Courtyard by Marriott Houston Medical Center hotel in Houston, TX (the “Houston CY Hotel”).contributedcompleted a follow-on common share offering of 4,500,000 shares, generating gross proceeds of $73.6 million and net proceeds of approximately $70.1 million. On June 28, 2013, the Company issued an additional 475,823 common shares pursuant to the exercise of the underwriters’ over-allotment option in the offering that closed on June 18, 2013, generating gross proceeds of approximately $7.8 million and net proceeds of approximately $7.4 million. Proceeds from the June 2013 offering were used to repay debt under the Company’s secured revolving credit facility, including debt incurred in connection with the $40.0 million acquisition of the Hyatt Place Pittsburgh North Shore hotel in Pittsburgh, PA (the “Pittsburgh Hotel”) and the $15.2 million August 9, 2013 acquisition of the Hampton Inn and Suites by Hilton in Exeter, NH (the "Exeter Hotel")..the IPO and the concurrent private placement, as well as the proceeds of our February 2011 offering,offerings are contributed to Chatham Lodging, L.P., our operating partnership (the “Operating Partnership”), in exchange for partnership interests in the Operating Partnership.interests. Substantially all of ourthe Company’s assets are held by, and all of the Company’s operations are conducted through, the Operating Partnership. Chatham Lodging Trust is the sole general partner of the Operating Partnership and owns 100% of the common units of limited partnership interest in the Operating Partnership. Certain of ourthe Company’s executive officers hold vested and unvested long-term incentive plan units in the Operating Partnership, which are presented as noncontrollingnon-controlling interests on our consolidated balance sheets.2011,2013, the Company owned 1825 hotels with an aggregate of 2,4143,591 (unaudited) rooms located in 1015 states and the District of Columbia, and held a minority10.3% noncontrolling interest in the JV,a joint venture (the “Innkeepers JV”) with Cerberus Capital Management (“Cerberus”), which owns 6451 hotels comprising an aggregate of 8,329 rooms. 6,847 (unaudited) rooms, and held a 5.0% noncontrolling interest in a joint venture (the "Torrance JV") with Cerberus that owns the 248-room (unaudited) Residence Inn by Marriott in Torrance, CA.ourthe Company’s taxable REIT subsidiary (“TRS”) holding companies. WeThe Company indirectly own ourowns its interest in 51 of the 64Innkeepers JV hotels and its interest in the Torrance JV through the Operating Partnership, and we own our interest in the remaining 13 JV hotels through one of our TRS holding companies.Partnership. All of the Innkeepers JV hotels and the Torrance JV hotel are leased to TRS Lessees, in which wethe Company indirectly own a 10.3% minorityowns noncontrolling interests through one of ourits TRS holding companies. Each hotel is leased to a TRS Lessee under a percentage lease that provides for rental payments equal to the greater of (i) a fixed base rent amount or (ii) a percentage rent based on hotel room revenue. The initial term of each of the TRS leases is five years.5 years. Lease revenue from each TRS Lessee is eliminated in consolidation.manages 10the Company's Chairman, President and Chief Executive Officer, managed 23 of ourthe Company’s wholly owned hotels; Homewood Suites Management LLC, a subsidiary of Hilton Worldwide Inc. (“Hilton”) manages six of our wholly owned hotels;hotels and Concord Hospitality Enterprises Company manages managed two of ourthe Company’s wholly owned hotels. All but oneAs of December 31, 2013, all of the Innkeepers JV hotels arewere managed by IHM. OneThe Torrance JV hotel is managed by Dimension Development Company.2.Summary of Significant Accounting Policiesand consolidated statements of operations, consolidated statements of equity, and consolidated statements of cash flows for the periods presented.assets and liabilities and disclosuredisclosures of contingent assets and liabilities at the balance sheet date and the reported amounts of revenues and expenses during the reporting period.periods. Actual results could differ from those estimates.F-87.threetwo to tenseven years for furniture, fixtures and equipment. Renovations and/or replacements at the hotel properties that improve or extend the life of the assets are capitalized and depreciated over their useful lives, while repairs and maintenance are expensed as incurred. Upon the sale or retirement of property and equipment, the cost and related accumulated depreciation are removed from the Company’s accounts and any resulting gain or loss is recognized in the consolidated statements of operations.property’sproperty's estimated fair market value is recorded and an impairment loss recognized. As of December 31, 2013, 2012 and 2011, there were no hotel properties impaired.occurbe completed within one year. If these criteria are met, depreciation and amortization of the hotel property will cease and an impairment loss if any will be recognized if the fair value of the hotel property, less the costs to sell, is lower than the carrying amount of the hotel property. The Company will classify the loss, together with the related operating results, as discontinued operations in the consolidated statements of operations and classify the assets and related liabilities as held for sale in the consolidated balance sheets.sheets if we no longer have significant continuing involvement. As of December 31, 2011,2013, the Company had no hotel properties held for sale.F-9Included in restrictedRestricted cash on the accompanying consolidated balance sheet at December 31, 2011 are $5.32013 is $4.6 million and at December 31, 2012 is $2.9 million of renovation, property tax and insurance escrows and at December 31, 2010 are deposits for hotel acquisitions of $0.1 million and $3.0 million of renovation, property tax and insurance escrows. Certain of the hotel mortgage loan agreements require the Company to fund 5% of gross hotel revenues on a monthly basis for furnishings, fixtures and equipment and general repair maintenance reserves (“Replacement Reserve”) in an account with the Lender. Property tax and insurance reserves are required to be deposited into an escrow account held by Lender.atin the Company’s hotels at year end and amounts due from business and group customers. An allowance for doubtful accounts is provided and maintained at a level believed to be adequate to absorb estimated probable receivable losses. At December 31, 20112013 and 2010, respectively,2012, the allowance for doubtful accounts was $17$30 thousand and $15 thousand. For the years ended December 31, 2011 and 2010, the Company recorded no hotel receivable writeoffs.$28 thousand, respectively.deferred loan costs and deferred costs related to the Company’s shelf registration statement. senior secured revolving credit facility and mortgage loans and costs related to the Company’s share offerings or share plans. December 31, 2013 December 31, 2012 Loan Costs $ 9,529 $ 8,462 Franchise Fees 2,215 1,273 Other 91 467 11,835 10,202 Less accumulated amortization (4,722 ) (3,890 ) Deferred costs, net $ 7,113 $ 6,312 The deferred offeringOffering costs of $0.1 million and $0.4 million, classified as “Other” in 2013 and 2012 respectively, will be reclassified intorecorded as a reduction in additional paid-in capital as shares are sold. Offering costs of $0.4 million, classified as “Other” in 2010, were reclassed to into additional paid-in capital after the completion of the follow-on common share offering on February 8 , 2011. For the years ended December 31, 20112013, 2012 and 2010,2011, amortization expense related to franchise fees of $62$87 thousand, $75 thousand and $27$62 thousand, respectively, is included in depreciation and amortization and amortizationamortization. Amortization expense related to loan costs of $1.1 million, $1.8 million and $1.6 million for the years ended December 31, 2013, 2012 and $0.3 million,2011, respectively, is included in interest expense in the consolidated statementstatements of operations.Deferred costs consisted of the following at December 31, 2011 and 2010 (in thousands): December 31,
2011 December 31,
2010 $ 7,010 $ 3,798 1,198 809 116 409 8,324 5,016 (1,974 ) (306 ) $ 6,350 $ 4,710 F-10Hotel Management AgreementsThe Company assumed the existing hotel management agreements in place at six of its hotels—the Boston-Billerica Homewood Suites, Minneapolis-Bloomington Homewood Suites, Nashville-Brentwood Homewood Suites, Dallas Homewood Suites, Hartford-Farmington Homewood Suites and Orlando-Maitland Homewood Suites—all of which are managed by Promus Hotels, Inc., a subsidiary of Hilton Hotels Worldwide (“Hilton”). Each of these hotel management agreements became effective on December 20, 2000, has an initial term of 15 years and may be renewed for an additional five-year period at the manager’s option by written notice to us no later than 120 days prior to the expiration of the initial term.Under these six hotel management agreements, the manager receives a base management fee equal to 2% of the hotel’s gross room revenue and, if certain financial thresholds are met or exceeded, an incentive management fee equal to 10% of the hotel’s net operating income, less fixed costs, base management fees, agreed-upon return on the owner’s original investment and debt service payments. In addition to the management fee, a franchise royalty fee equal to 4% of the hotel’s gross room revenue and program fees equal to 4% of the hotel’s gross room revenue are also payable to Hilton. See “Hotel Franchise Agreements”. Prior to April 23, 2013, each of these six management agreements may be terminated for cause, including the failure of the managed hotel to meet specified performance levels, and may be terminated by the manager in the event we undergo a change in control. If the new owner does not assume the existing management agreement and does not obtain a Homewood Suites franchise license upon such a change of control, we will be required to pay a termination fee to the manager. Beginning on April 23, 2013, we may terminate the six Hilton management agreements upon six months notice to the manager without payment of a termination fee. If we were to terminate the management agreements prior to the termination date, we would be responsible for paying termination fees to the manager.The management agreements with Concord, the manager of the Altoona, Pennsylvania Courtyard and the Washington, Pennsylvania SpringHill Suites, provide for base management fees equal to 4% of the managed hotel’s gross room revenue. The initial ten-year term of each management agreement expires on February 28, 2017 and will renew automatically for successive one-year terms unless terminated by our TRS lessee or the manager by written notice to the other party no later than 90 days prior to the then current term’s expiration date. The management agreements may be terminated for cause, including the failure of the managed hotel operating performance to meet specified levels. If we were to terminate the management agreements during the first nine years of the term other than for breach or default by the manager, we would be responsible for paying termination fees to the manager.All of the remaining hotels are managed by IHM, which is 90% owned by Mr. Fisher. The management agreements with IHM have an initial term of five years and may be renewed for two five-year periods at IHM’s option by written notice to us no later than 90 days prior to the then current term’s expiration date. The IHM management agreements provide for early termination at our option upon sale of any IHM-managed hotel for no termination fee, with six months advance notice. The IHM management agreements may be terminated for cause, including the failure of the managed hotel to meet specified performance levels. Management agreements with IHM provide for a base management fee of 3% of the managed hotel’s gross revenues for the Hampton Inn Houston, TX, Residence Inn Holtsville, NY, Residence Inn White Plains, NY, Residence Inn New Rochelle, NY and Homewood Suites Carlsbad, CA and a 2.5% of the managed hotel’s gross revenues for the Residence Inn Garden Grove, CA, Residence Inn San Diego, CA, Homewood Suites San Antonio, TX, Doubletree Suites Washington, DC and Residence Inn Tysons Corner, VA and an accounting fee of $1,000 per month per hotel and, if certain financial thresholds are met or exceeded, an incentive management fee equal to 10% of the hotel’s net operating income less fixed costs, base management fees and a specified return threshold. The incentive management fee is capped at 1% of gross hotel revenues for the applicable calculation.Hotel Franchise AgreementsOne of the Company’s TRS Lessees has entered into hotel franchise agreements with Promus Hotels, Inc., a subsidiary of Hilton, for our eight Homewood Suites by Hilton® hotels. Each of the hotel franchise agreementsF-11has an initial term ranging from 15-18 years. These Hilton hotel franchise agreements provide for a franchise royalty fee equal to 4% of the hotel’s gross room revenue and a program fee equal to 4% of the hotel’s gross room revenue. The Hilton franchise agreements provide that the franchisor may terminate the franchise agreement in the event that the applicable franchisee fails to cure an event of default, or in certain circumstances such as the franchisee’s bankruptcy or insolvency, are terminable by Hilton at will.One of the Company’s TRS Lessees has entered into franchise agreements with Marriott International, Inc., (“Marriott”), relating to our Residence Inn properties in Holtsville, New York, New Rochelle, New York, White Plains, New York, Garden Grove, CA, San Diego, CA and Vienna, VA, our Courtyard property in Altoona, Pennsylvania and our SpringHill Suites property in Washington, Pennsylvania. These franchise agreements have initial terms ranging from 15 to 20 years and will expire between 2025 and 2031. None of the agreements has a renewal option. The Marriott franchise agreements provide for franchise fees ranging from 5.0% to 5.5% of the hotel’s gross room sales and marketing fees ranging from 2.0% to 2.5% of the hotel’s gross room sales. The Marriott franchise agreements are terminable by Marriott in the event that the applicable franchisee fails to cure an event of default or, in certain circumstances such as the franchisee’s bankruptcy or insolvency, are terminable by Marriott at will. The Marriott franchise agreements provide that, in the event of a proposed transfer of the hotel, our TRS Lessee’s interest in the agreement or more than a specified amount of the TRS Lessee to a competitor of Marriott, Marriott has the right to purchase or lease the hotel under terms consistent with those contained in the respective offer and may terminate if our TRS Lessee elects to proceed with such a transfer.One of the Company’s TRS lessees has entered into a franchise agreement with Hampton Inns Franchise LLC, (“Hampton Inns”), relating to the Hampton Inn & Suites® Houston-Medical Center. The franchise agreement has an initial term of approximately 10 years and expires on July 31, 2020. There is no renewal option. The Hampton Inns franchise agreement provides for a monthly program fee equal to 4% of the hotel’s gross rooms revenue and a monthly royalty fee equal to 5% of the hotel’s gross rooms revenue. Hampton Inns may terminate the franchise agreement in the event that the franchisee fails to cure an event of default or, in certain circumstances such as the franchisee’s bankruptcy or insolvency, Hampton Inns may terminate the agreement at will.One of the Company’s TRS lessees has entered into a franchise agreement with Doubletree Franchise LLC (“Doubletree”), relating to the Doubletree Guest Suites by Hilton in Washington, DC. The new hotel franchise agreement has an initial term of 10 years and will expire on July 31, 2021. The franchise agreement is non-renewable. The Doubletree hotel franchise agreement provides for a franchise royalty fee equal to 5% of the hotel’s gross room revenue and a program fee equal to 4% of the hotel’s gross room revenue. The Doubletree franchise agreement generally has no termination rights unless the franchisee fails to cure an event of default in accordance with the franchise agreements.shares.(“EPS”("EPS") is computed by dividing net income (loss) available for common shareholders, adjusted for dividends on unvested share grants, by the weighted average number of common shares outstanding for the period. Diluted EPS is computed by dividing net income (loss) available for common shareholders, adjusted for dividends on unvested share grants, by the weighted average number of common shares outstanding plus potentially dilutive securities such as share grants or shares issuable in the event of conversion of operating partnership units. No adjustment is madeF-12 Because the Company reported a net loss for the period, no allocation was made to the unvested restricted shares or the long-term incentive plan units.The Company is currently subject to corporate federal and state income taxes. Prior to April 21, 2010, the Company had no operating results subject to taxation. Such an event could materially adversely affect the Company’s net income and net cash available for distribution to shareholders. However, the Company has been organized and operates in such a manner as to qualify for treatment as a REIT.64Innkeepers JV hotels through the Operating Partnership and owns its interest in the remaining 13Torrance JV through the Operating Partnership. All of the Innkeepers JV hotels and the Torrance JV hotel are leased to TRS Lessees in which the Company indirectly owns noncontrolling interests through one of its TRSs.TRS holding companies. Each TRS is subject to federal and state income taxes and the Company accounts for taxes, where applicable, in accordance with the provisions of [FinancialFinancial Accounting Standards Board Accounting Standards Codification 740]740 using the asset and liability method which recognizes deferred tax assets and liabilities for future tax consequences arising from differences between financial statement carrying amounts and income tax bases.2010,with few exceptions to state examinations before 2010. The Company evaluates whether a tax position of the Company didis more likely than not haveto be sustained upon examination, including resolution of any uncertainrelated appeals or litigation processes, based on the technical merits of the position. For tax positions meeting the more likely than not threshold, the tax amount recognized in the financial statements is reduced by the largest benefit that has a greater than fifty percent likelihood of being realized upon ultimate settlement with the relevant taxing authority. The Company has reviewed its tax positions for open tax years and had not incurred any interest or penalties on such positions duringhas concluded no provisions for income taxes is required in the periods presented.Company's consolidated financial statements as of December 31, 2013. Interest and penalties related to uncertain tax benefits, if any, in the future will be recognized as operating expense.expensesexpensed organizational costs as incurred. Offering costs, which include selling commissions, are recorded as a reduction in additional paid-in capital in shareholders’ equity.equity as shares are sold. Costs related to the Company’s shelf registration statement filing in 2012potential share offerings are included in deferred costs at December 31, 20112013 and 2012, respectively, and will be recorded as a reduction in additional paid-in capital as shares are sold.F-13Recently Issued Accounting StandardsIn May 2011,FASB and International Accounting Standards Board (“IASB”) (collectively the “Boards”) issued ASU No. 2011-04, Fair Value Measurement (Topic 820): Amendments to Achieve Common Fair Value Measurement and Disclosure Requirements in U.S. GAAP and IFRSs (“ASU 2044-04”). ASC 2011-04 created a uniform framework for applying fair value measurement principles for companies around the world and clarified existing guidance in U.S. GAAP. ASU 2011-04 is effective for the first reporting annual period beginning after December 15, 2011 and shall be applied prospectively. The Company does not expect this standard to have any material effect on our consolidated financial statements.In June 2011, the FASB issued ASU No. 2011-05, Comprehensive Income (Topic 220), Presentation of Comprehensive income. This update is intended to increase the prominence of other comprehensive income in the financial statements by requiring public companies to present comprehensive income eitherCompany's hotels as a single statement detailingindustry segment because all of the componentshotels have similar economic characteristics and provide similar services to similar types of net income and total net income, the components of other comprehensive income and total other comprehensive income, and a total for comprehensive income or using a two statement approach including both a statement of income and a statement of comprehensive income. The option to present other comprehensive income in the statement of changes in equity has been eliminated. The amendments in this update, which should be applied retrospectively, are effective for public companies for fiscal years, and interim periods beginning after December 15, 2011. Currently, the Company has no items of other comprehensive income in any periods presented and adoption of this standard is not expected to impact us.3.Acquisition of Hotel PropertiesOn July 14, 2011, Company acquired five hotels (the “5 Sisters”) for an aggregate purchase price of $195.0 million, plus customary pro-rated amounts and closing costs, from affiliateseach of Innkeepers USA Trust. The Company funded the 5 Sistershotels, based on the fair value on the date of its acquisition with available cash, the assumption of debt of $134.2 million and borrowings under the Company’s secured revolving credit facility. The 5 Sisters are as follows:• 5 Sisters Portland Hotel Houston CY Hotel Pittsburgh Hotel Exeter Hotel Denver Tech Hotel Bellevue Hotel Savannah Hotel Total Acquisition date 7/14/2011 12/27/2012 2/5/2013 6/17/2013 8/9/2013 9/26/2013 10/31/2013 12/5/2013 Number of rooms (unaudited) 762 122 197 178 111 180 231 160 1,941 Land $ 35,231 $ 4,315 $ 5,600 $ 3,000 $ 1,900 $ 4,100 $ 13,800 $ 2,400 $ 70,346 Building and improvements 150,764 22,664 27,350 35,576 12,350 23,100 56,957 36,050 364,811 Furniture, fixtures and equipment 7,399 1,021 1,800 1,424 900 700 1,000 1,300 15,544 Cash 26 1 3 6 4 5 3 3 51 Restricted cash 1,460 — — — — — — — 1,460 Accounts receivable 144 9 7 5 — 2 240 35 442 Deferred costs, net 1,639 — — — — — — — 1,639 Prepaid expenses and other assets 134 8 10 272 40 5 60 1 530 Mortgage Debt (134,160 ) — — — — — — — (134,160 ) Accounts payable and accrued expenses (630 ) (19 ) (30 ) — (35 ) (271 ) (1 ) (1 ) (987 ) Net assets acquired $ 62,007 $ 27,999 $ 34,740 $ 40,283 $ 15,159 $ 27,641 $ 72,059 $ 39,788 $ 319,676 Net assets acquired, net of cash $ 61,981 $ 27,998 $ 34,737 $ 40,277 $ 15,155 $ 27,636 $ 72,056 $ 39,785 $ 319,625 Residence Inn by Marriott® Anaheim—Garden Grove, CA.; 200 rooms.•Homewood Suites by Hilton® San Antonio Riverwalk—San Antonio, TX.; 146 rooms.•Residence Inn by Marriott® Tysons Corner—Vienna, VA.; 121 rooms.•Doubletree Guest Suites by Hilton® Washington DC—Washington, DC; 105 rooms.•Residence Inn by Marriott® San Diego Mission Valley—San Diego, CA.; 192 rooms.$7.7$3.2 million and $3.2$0.2 million, respectively, during the years ended December 31, 20112013 and 2010. $3.7 million2012.costs are related to the JV.F-14Hotel Purchase Price AllocationThe allocation of the purchase price to the hotels based on their fair value wasthrough December 31, 2013 is as follows (in thousands): 5 Sisters
Acquisition 07/14/11 $ 35,231 150,764 7,399 26 1,460 144 1,639 134 (134,160 ) (630 ) $ 62,007 $ 61,981 December 31,
2013 Revenue Operating Income Houston CY $ 7,531 $ 3,725 Pittsburgh 4,621 2,289 Exeter 1,448 579 Denver Tech 1,636 615 Bellevue 1,537 783 Savannah 334 149 Total $ 17,107 $ 8,140 unaudited pro forma financial information presents the unaudited results of operations as if the hotels acquired in 2010the years endedDecember 31, 2013, 2012 and 2011 including the acquisition of the 5 Sisters had taken place on January 1, 2010. The unaudited2011. Since the acquisition of the Portland hotel was not significant, the pro forma numbers presented below do not include the operating results belowof the Portland hotel prior to the acquisition date. 2013 supplemental pro forma earnings were adjusted to exclude acquisition$1,667 of acquisition-related costs of $3.2 million and $3.2 million for the years ended December 31,incurred in 2013. 2011 and 2010, respectively.supplemental pro forma earnings were adjusted to include these charges. The unaudited pro forma results have been prepared for comparative purposes only and are not necessarily indicative of what actual results of operations would have been had the acquisitions taken place on January 1, 2010,2011, nor do they purport to represent the results of operations for future periods (in thousands, except share and per share data). For the years ended
December 31, 2011 2010 $ 91,305 $ 83,122 $ (9,290 ) $ (3,380 ) $ (0.67 ) $ (0.24 ) 13,819,939 13,819,939 4.Allowance for Doubtful AccountsThe Company maintains an allowance for doubtful accounts at For the year ended December 31, 2013 2012 2011 Pro forma total revenue $ 153,586 $ 141,557 $ 127,396 Pro forma net income $ 7,571 $ 2,582 $ (10,819 ) Pro forma income per share: Basic $ 0.29 $ 0.10 $ (0.41 ) Diluted $ 0.29 $ 0.10 $ (0.41 ) Weighted average Common Shares Outstanding Basic 26,295,558 26,295,558 26,295,558 Diluted 26,543,497 26,543,497 26,295,558 level believed to be adequate to absorb estimated probable losses. That estimate is based on past loss experience, current economic and market conditions and other relevant factors. The allowance for doubtful accounts was $17 thousand and $15 thousandresult of the properties being treated as acquired as of December 31,January 1, 2011, and 2010 respectively.F-155.Investment in Hotel Properties20112013 and 20102012 consisted of the following (in thousands): December 31,
2011 December 31,
2010 $ 60,064 $ 24,620 332,399 176,354 17,469 6,138 3,897 3,505 413,829 210,617 (11,014 ) (2,537 ) $ 402,815 $ 208,080 October 27, 2011,April 17, 2013, the Company acquired a 10.3%5.0% interest in a joint venture (the “JV”) betweenthe Torrance JV with Cerberus Capital Management (“Cerberus”) and Chatham Lodging, L.P.for $1.7 million. The Torrance JV owns 64 properties which it acquired the 248-room (unaudited) Residence Inn by Marriott in Torrance, CA for a total purchase price of approximately $1.02 billion, including the assumption of approximately $675$31.0 million of mortgage debt secured by 45 of the hotels with a weighted average interest rate of 6.71% and maturing in 2017. The Company’s investment of $37 million in the JV was funded through borrowings under the Company’s secured revolving credit facility. The Company incurred approximately $3.7 million in acquisition costs.. The Company accounts for this investment under the equity method. For the year ended December 31, 2013 2012 Cash generated from other activities and excess cash $ 40 $ — Cash generated from debt refinancing 908 — Total $ 948 $ — For the year ended December 31, 2013 2012 Cash generated from other activities and excess cash $ 2,716 $ 4,368 Cash generated from asset sales 130 5,075 Cash generated from debt refinancing 10,145 11,759 Total $ 12,991 $ 21,202 interestinterests in the Innkeepers JV isand the Torrance JV (the "JVs") are subject to change in the event that either Chathamthe Company or Cerberus calls for additional capital contributions to the JVJVs necessary for the conduct of business, including contributions to fund costs and expenses related to capital expenditures. The Company will managemanages the JVJVs and will receive a promote interest based on meetingin each applicable JV if it meets certain return thresholds. Cerberus may also approve certain actions by theeach JV without the Company’s consent, including certain property dispositions conducted at arm’s length, certain actions related to the restructuring of theeach JV and removal of the Company as managing member in the event the Company fails to fulfill its material obligations under the applicable joint venture agreement.$4.6$48.9 million in acquisition costs, $49.1 million and $8.6$8.8 million in depreciation expense during the years ended December 31, 2013, 2012 and 2011. The Torrance JV incurred $0.6 million, $0.0 million and $0.0 million, respectively, in depreciation expense during the years ended December 31, 2013, 2012 and 2011. The Company's investment in the Innkeepers JV is $(1.6) million and the Torrance JV is $0.8 million at December 31, 2013. The following tables setsets forth the total assets, liabilities, equity and components of net loss, including the Company’s share, related to both JVs for the unconsolidated joint venture discussed above from the acquisition date throughyears ended December 31, 2013, 2012 and 2011 (in thousands):Balance Sheet December 31, 2011 $ 972,925 79,107 1,052,032 $ 675,000 26,729 701,729 36,003 314,300 350,303 $ 1,052,032 Balance Sheet December 31, 2013 December 31, 2012 December 31, 2011 Assets Investment in hotel properties, net $ 874,058 $ 862,747 $ 894,288 Other assets 114,034 86,149 154,256 Total Assets $ 988,092 $ 948,896 $ 1,048,544 Liabilities Mortgages and notes payable $ 969,023 $ 792,239 675,000 Other Liabilities 19,211 27,041 23,630 Total Liabilities 988,234 819,280 698,630 Equity Chatham Lodging Trust (802 ) 13,362 36,003 Joint Venture Partner 660 116,254 313,911 Total Equity (142 ) 129,616 349,914 Total Liabilities and equity $ 988,092 $ 948,896 $ 1,048,544 For the year ended Statement of Operations December 31, 2013 2012 2011 Revenue $ 271,224 $ 251,612 $ 34,340 Total hotel operating expenses 151,823 143,525 21,259 Hotel operating income $ 119,401 $ 108,087 $ 13,081 Net loss from continuing operations $ (14,376 ) $ (16,093 ) $ (10,432 ) Net loss $ (17,106 ) $ (14,001 ) $ (10,086 ) Total loss from unconsolidated real estate entities attributable to Chatham $ (1,874 ) $ (1,439 ) $ (997 ) StatementOperations Acquisition Date to
December 31, 2011 $ 34,339 37,411 $ (3,072 ) $ (9,697 ) $ (997 ) 7.DebtOn August 16, 2011, the Company entered into a $15.8 million new mortgage loan on the Residence Inn New Rochelle in New Rochelle, NY. On July 14, 2011, the Company assumed $134.2 million in existing mortgage loans on the 5 Sisters in connection with their acquisition. Each of theContentsisand its secured revolving credit facility are collateralized by a first-mortgage lienliens on the underlying property.certain properties. The mortgages are non-recourse except for instances of fraud or misapplication of funds. Mortgage debt consisted of the following (in thousands): 12/31/11 Balance Outstanding as of Interest Rate Maturity Date Property
Carrying Value December 31, 2011 December 31, 2010 5.96 % April 1, 2016 $ 10,622 $ 6,753 $ 6,925 5.84 % April 1, 2015 11,420 5,260 5,408 5.75 % September 1, 2021 20,336 15,731 — 5.98 % November 1, 2016 42,914 32,417 — 5.98 % November 1, 2016 50,914 39,986 — 6.03 % October 1, 2016 31,966 18,380 — 6.03 % October 1, 2016 29,010 19,960 — 6.03 % October 1, 2016 35,998 22,953 — $ 233,180 $ 161,440 $ 12,333 Collateral Maturity Date Balance Outstanding as of December 31, 2013 December 31,
2012Senior Secured Revolving Credit Facility (1) 2.67 % November 5, 2016 $ 235,721 $ 50,000 $ 79,500 Courtyard by Marriott Altoona, PA 5.96 % April 1, 2016 10,841 6,378 6,572 SpringHill Suites by Marriott Washington, PA 5.84 % April 1, 2015 11,925 4,937 5,104 Residence Inn by Marriott New Rochelle, NY 5.75 % September 1, 2021 21,700 15,150 15,450 Residence Inn by Marriott Garden Grove, CA 5.98 % November 1, 2016 44,474 32,253 32,417 Residence Inn by Marriott San Diego, CA (2) 4.66 % February 6, 2023 48,322 30,546 39,557 Homewood Suites by Hilton San Antonio, TX (3) 4.59 % February 6, 2023 30,403 17,454 18,184 Residence Inn by Marriott Washington, D.C. (4) 6.03 % (4) — — 19,752 Residence Inn by Marriott Vienna, VA (3) 4.49 % February 6, 2023 33,901 23,925 22,710 Courtyard by Marriott Houston, TX (5) 4.19 % May 6, 2023 33,662 19,812 — Hyatt Place Pittsburgh, PA (6) 4.65 % July 6, 2023 39,373 24,028 — Residence Inn by Marriott Bellevue, WA (7) 4.97 % December 6, 2023 71,345 47,580 — Total $ 581,667 $ 272,063 $ 239,246 (1) (2) (3) (4) On January 31, 2013, the Company paid off the mortgage loan for the Washington, D.C. hotel. This hotel was rebranded as a Residence Inn by Marriott on September 20, 2013. (5) (6) (7) On November 8, 2013, the Company obtained debt secured by a first mortgage on the Bellevue Hotel. The loan has a 10-year term, a 30-year amortization payment schedule but is interest only for the first 12 months. Facility amount $175 million Accordion feature Increase additional $50 million LIBOR floor None Interest rate applicable margin 200-300 basis points, based on leverage ratio Unused fee 25 basis points if less than 50% unused, 35 basis points if more than 50% unused Minimum fixed charge coverage ratio 1.5x maturity.estimated value of collateral and maturity of debt with similar credit terms and are classified within level 3 of the fair value hierarchy. Level 3 typically consists of mortgages because of the significance of the collateral value to the value of the loan. The estimated fair value of the Company’s fixed rate debt as of December 31, 20112013 and 20102012 was $159.4$220.0 million and $12.6$168.2 million, respectively.On October 12, 2010,Company enteredfair value of its variable rate debt by taking into an $85 million senior secured revolvingaccount general market conditions and the estimated credit facility. At December 31, 2011terms it could obtain for debt with similar maturity and 2010,is classified within level 3 of the Company had $67.5 million and $37.8 million, respectively, of outstanding borrowingsfair value hierarchy. The Company’s only variable rate debt is under this credit facility. There were ten properties in the borrowing base securing borrowings under the credit facility at December 31, 2011. At December 31, 2011, the maximum borrowing availability under the revolving credit facility was $75.0 million.F-17In May 2011, the Company amended its $85 million senior secured revolving credit facility. The amendment provides for an increase to the allowable consolidated leverage ratio to 60 percent through 2012, reducing to 55 percent in 2013; and a decrease to the consolidated fixed charge coverage ratio from 2.3x to 1.7x through March 2012, increasing to 1.75x through December 2012 and 2.0x in 2013. Subject to certain conditions, the credit facility has an accordion feature that provides the Company with the ability to increase the facility to $110 million, subject to lender approval. The Company paid $0.5 million in fees and related expenses in connection with this amendment. The fees are capitalized and amortized over the termestimated fair value of the credit facility.2011,2013, the Company was in compliance with all of its financial covenants. At December 31, 2013, the Company’s consolidated fixed charge coverage ratio was 2.59. Future scheduled principal payments of debt obligations as of December 31, 20112013, for each of the next five calendar years and thereafter are as follows (in thousands): Amount $ 1,848 69,481 2,106 6,778 134,587 14,140 $ 228,940 8.Income Taxes Amount 2014 $ 2,974 2015 8,375 2016 90,424 2017 3,290 2018 3,383 Thereafter 163,617 Total $ 272,063 one of two TRS holding companies, thatwhich are referred to as TRS 1 and TRS 2, which are treated separately for income tax purposes (TRS 1 and TRS 2, respectively). For the Years Ended December 31 2011 2010 $ 73 $ 13 21 4 $ 94 $ 17 $ (21 ) $ — (4 ) — $ (25 ) $ — $ 69 $ 17 For the year ended December 31, 2013 2012 2011 Current: Federal $ 93 $ 55 $ 73 State 30 19 21 Current tax expense $ 123 $ 74 $ 94 Deferred: Federal — 1 (21 ) State 1 — (4 ) Deferred tax expense (benefit) 1 1 (25 ) Total tax expense $ 124 $ 75 $ 69 totalincome tax expense and the amount computed by applying the statutory federal income tax rate to the combined income byof the Company’sCompany's TRSs before taxes were as follows (in thousands): For the Years Ended December 31 2011 2010 $ 143 $ (238 ) 48 13 7 4 14 — 69 17 48.25 % -7.14 % For the year ended December 31, 2013 2012 2011 Book income (loss) before income taxes $ (2,080 ) $ 159 $ 143 Statutory rate of 34% applied to pre-tax income $ (707 ) $ 54 $ 48 Effect of state and local income taxes, net of federal tax benefit (82 ) 20 7 Provision to return and deferred adjustment 118 — — Change in valuation allowance 795 1 14 Total expense $ 124 $ 75 $ 69 Effective tax rate (5.96 )% 47.17 % 48.25 % 2010,2013, TRS 1 had future taxable income deductions of $0.3 million related to accumulated net operating losses from 2010 and thea gross deferred tax asset associated with these future tax deductions was $0.1 million.of $1.1 million. TRS 1 has recordedcontinued to record a full valuation allowance equal to 100% of the gross deferred tax asset due to the uncertainty of realizing the benefit of its deferred assets due to the limited operating history and the cumulative taxable losses incurred by TRS 1 since its inception. During 2011, TRS I2 has generated taxable income to partially utilize thea gross deferred tax asset. TRS 2 had no deferred tax assets or liabilities at asset of $0.0 million as of December 31, 20102013 and no valuation allowance has been recorded in connection with the gross deferred tax assets of TRS 2 for December 31, 20112013 and 2010.2012. Accordingly, the net deferred tax asset of the Company solely relates to the deferred tax assets generated by TRS 2 during the yearyears ended December 31, 2011.2013 and 2012. The tax effect of each type of temporary difference and carry forward that gives rise to the deferred tax asset as of December 31, 20112013 and 20102012 are as follows (in thousands): For the Years Ended December 31 2011 2010 $ 6 $ — — 106 192 (148 ) (106 ) 50 — — — (25 ) — $ 25 $ — For the year ended December 31, 2013 2012 Deferred tax assets: Allowance for doubtful accounts $ 11 $ 5 Net operating loss carry forwards 1,100 35 Other (48 ) 229 Valuation allowance (1,040 ) (245 ) Deferred tax asset 23 24 9.Dividends Declared and Paid$0.175$0.175$0.84 per unit for each of the four quarters of 2011.year ended December 31, 2013. The dividends and distributions for the first quarter were paid on April 15, 2011 to common shareholders and LTIP unit holders of record on March 31, 2011. The dividends and distributions for the second quarter were paid on July 15, 2011 to common shareholders and LTIP unit holders of record on June 30, 2011. The dividends and distributions for the third quarter were paid on October 14, 2011 to common shareholders and LTIP unit holders of record on September 30, 2011. The Ordinary Income Return of Capital January 1/31/2013 2/22/2013 $ 0.07 $ 0.07 $ 0.06 $ 0.01 February 2/28/2013 3/29/2013 0.07 0.07 0.06 0.01 March 3/28/2013 4/26/2013 0.07 0.07 0.06 0.01 1st Quarter 2013 $ 0.21 $ 0.21 $ 0.18 $ 0.03 April 4/30/2013 5/31/2013 $ 0.07 $ 0.07 $ 0.06 $ 0.01 May 5/31/2013 6/28/2013 0.07 0.07 0.06 0.01 June 6/28/2013 7/26/2013 0.07 $ 0.07 0.06 0.01 2nd Quarter 2013 $ 0.21 $ 0.21 $ 0.18 $ 0.03 July 7/31/2013 8/30/2013 $ 0.07 $ 0.07 $ 0.06 $ 0.01 August 8/30/2013 9/27/2013 0.07 0.07 0.06 0.01 September 9/30/2013 10/25/2013 $ 0.07 0.07 $ 0.06 $ 0.01 3rd Quarter 2013 $ 0.21 $ 0.21 $ 0.18 $ 0.03 October 10/31/2013 11/29/2013 $ 0.07 $ 0.07 $ 0.06 $ 0.01 November 11/29/2013 12/27/2013 $ 0.07 $ 0.07 $ 0.06 $ 0.01 December 12/31/2013 1/31/2014 $ 0.07 $ 0.07 $ 0.06 $ 0.01 4th Quarter 2013 $ 0.21 $ 0.21 $ 0.18 $ 0.03 Total 2013 $ 0.84 $ 0.84 $ 0.72 $ 0.12 Ordinary Income Return of Capital First Quarter 3/30/2012 4/27/2012 $ 0.175 $ 0.175 $ 0.092 $ 0.083 Second Quarter 6/29/2012 7/27/2012 0.200 0.200 0.106 0.094 Third Quarter 9/28/2012 10/26/2012 0.200 0.200 0.106 0.094 Fourth Quarter 12/31/2012 1/25/2013 0.200 0.200 0.106 0.094 Total 2012 $ 0.775 $ 0.775 $ 0.410 $ 0.365 F-19dividends and distributions for the fourth quarter were paid on January 27, 2012 to common shareholders and LTIP unit holders of record on December 30, 2011. For the years ended December 31, 20112013 and 2010,2012, approximately 5.7%85.7% and 100%52.9% of the distributions paid to the stockholders were considered taxable income and approximately 94.3%14.3% and 0.0%47.1% were considered a return of capital for federal income tax purposes, respectively.10.Shareholders’ Equity$.01$.01 par value per share. Each outstanding common share entitles the holder to one vote on all matters submitted to a vote of shareholders. Holders of the Company’s common shares are entitled to receive dividends when authorized by ourits Board of Trustees.underwriters’underwriter's discounts and commissions and other offering costs paid to third parties. As of December 31, 2011, 13,819,9392013, 26,295,558 common shares were outstanding.yearyears ended December 31, 2013 and 2011, the Company withheld 445 and 915, respectively, of common shares of beneficial interest that had vested to an executiveexecutives in accordance with the Equity Incentive Plan, the shares were withheld at a value of $16.31 and $16.43, respectively, per share to meet the minimum statutory tax withholding requirements of the executive which were directly remitted by the Company to the appropriate taxing jurisdiction. The price per share is determined by using the closing price of the common shares the day before they are withheld.$.01$.01 par value per share. No preferred shares were outstanding at December 31, 2011.If and when issued, holders20112013 and 2010,2012, there were no Operating Partnership common units held by unaffiliated third parties.20112013 and 2010,2012, an aggregate of 257,775 LTIP Units, a special class of operating partnership units, were held by executive officers. The LTIP Units receive per unit distributions equal to the per share distribution paid on common shares.The Upon the closing of the Company's equity offering on September 30, 2013, the Company contributeddetermined that a revaluation event occurred, as defined in the net proceeds fromInternal Revenue Code of 1986, as amended, and 26,250 LTIPS units of one of the February 8, 2011officers of the Company achieved full parity with the common share offering to the Operating Partnership in exchange for 4,600,000 common units with respect to liquidating distributions and all other purposes. Three-fifths of these units have vested. Accordingly, these LTIP units will be allocated their pro-rata share of the Operating Partnership.F-20Company's net income (loss).11.Earnings Per Shareshare.share because unvested restricted shares and unvested long-term incentive plan units are considered to be participating shares. Unvested restricted shares and unvested long-term incentive plan units that could potentially dilute basic earnings per share in the future would not be included in the computation of diluted loss per share, for the periods where a loss has been recorded, because they would have been anti-dilutive for the periods presented. The following is a reconciliation of the amounts used in calculating basic and diluted net lossincome (loss) per share (in thousands, except share and per share data): For the years ended
December 31 2011 2010 $ (9,105 ) $ (1,217 ) (41 ) — $ (9,146 ) $ (1,217 ) 13,280,149 6,377,333 — — 13,280,149 6,377,333 $ (0.69 ) $ (0.20 ) $ (0.69 ) $ (0.20 ) (1)Unvested restricted shares and unvested long-term incentive plan units that could potentially dilute basic earnings per share in the future that were not included in the computation of diluted earnings (loss) per share, because they would have been anti-dilutive for the periods presented. For the year ended December 31, 2013 2012 2011 Numerator: Net income (loss) $ 2,982 $ (1,450 ) $ (9,105 ) Dividends paid on unvested shares and units (294 ) (272 ) (41 ) Net income (loss) attributable to common shareholders $ 2,688 $ (1,722 ) $ (9,146 ) Denominator: Weighted average number of common shares - basic 21,035,892 13,811,691 13,280,149 Effect of dilutive securities: Unvested shares (1) 247,939 — — Weighted average number of common shares - diluted 21,283,831 13,811,691 13,280,149 Basic income per Common Share: Net income (loss) attributable to common shareholders per weighted average common share $ 0.13 $ (0.12 ) $ (0.69 ) Diluted income per Common Share: Net income (loss) attributable to common shareholders per weighted average common share $ 0.13 $ (0.12 ) $ (0.69 ) 12.Equity Incentive Plan share compensation includes shares granted that vest immediately. The Company pays dividends on unvested shares and units.units, except for performance based shares, for which dividends on unvested performance based shares are not paid until those shares are vested. Certain awards may provide for accelerated vesting if there is a change in control. In January 2011,2013 and 2012, the Company issued 12,10422,536 and 27,592 common shares, respectively, to its independent trustees as compensation for services performed in 2010. A portion of the Company’s share-based compensation to the Company’s trustees for the year ended December 31, 2011 was distributed on January 6,2013 and 2012, in the form of common shares.respectively. The quantity of shares was calculated based on the average of the closing prices for the Company’s common shares on the New York Stock Exchange for the last ten trading days preceding the reporting date. TheOn January 15, 2014, the Company distributed 27,59216,542 common shares.shares to its independent trustees for services performed in 2013. As of December 31, 2011,2013, there were 211,7302,400,018 common shares available for issuance under the 2010 Equity Incentive Plan.In2010 Annual Report on Form 10-K,executive officers pursuant to the Equity Incentive Plan, consisting of time-based awards of 61,376 shares that will vest over a three-year period and 53,191 shares granted as performance-based equity awards. The performance-based shares will be issued and vest over a three-year period only if and to the extent that long-term performance criteria established by the Board of Trustees are met and the recipient remains employed by the Company separately presented unvested stock-based compensation as a contra account to shareholder’s equity. In connection withthrough the preparation ofvesting date. The Company met its financial statementscriteria for the year ended December 31, 2011,2012, therefore, on January 15, 2013 the Company has presentedissued an aggregate of 17,731 shares to its executive officers as performance based equity compensation under the stock-based compensation2012 awards. Included in the grant of 61,376 time-based shares in 2012 are 8,184 shares granted to certain non-executive employees. On January 29, 2013, the Company granted 40,829 shares as an additiontime-based awards and, effective as of May 17, 2013 upon shareholder approval of the Amended and Restated Equity Incentive Plan, 40,829 shares of performance-base equity awards. The 2013 time-based equity awards will vest over a three-year period. The 2013 awards of performance-based shares will be issued and vest over a three-year period only if and to additional paid-in-capital when recognized as expense, in accordance with the standards which apply to stock-based compensation, for all periods presented.extent that long-term performance criteria established by the Board of Trustees are met and the recipient remains employed by the Company through the vesting date. The Company concluded thatmet its criteria for 2013, therefore, on January 15, 2014 the revisionCompany issued an aggregate of 17,731 shares to its executive officers as performance based equity compensation under the amounts as of December 31, 2010 do not have a material impact on any of its previously issued financial statements.F-21Restricted Share Awardsnonvestednon-vested time-based restricted shares.and 2010 areis as follows: 2011 2010 Number of
Shares Weighted-
Average Grant
Date Fair Value Number of
Shares Weighted-
Average Grant
Date Fair Value 76,550 $ 19.04 87,000 $ 19.02 — — — — (25,521 ) 19.04 (7,200 ) 18.86 — — (3,250 ) 18.86 51,029 $ 19.04 76,550 $ 19.04 December 31, 2013 December 31, 2012 December 31, 2011 Non-vested at beginning of the period 140,077 $ 12.70 51,029 $ 19.04 $ 76,550 $ 19.04 Granted 81,658 13.43 114,567 11.28 — — Vested (63,700 ) 14.39 (25,519 ) 19.04 (25,521 ) 19.04 Non-vested at end of the period 158,035 $ 12.39 140,077 $ 12.70 $ 51,029 $ 19.04 20112013 and 2010, respectively,2012, there were $0.7$1.2 million and $1.2$1.1 million, respectively, of unrecognized compensation costs related to restricted share awards. As of December 31, 2011,2013, these costs were expected to be recognized over a weighted–average period of approximately 1.4 years.1.7 years. For the years ended December 31, 20112013, 2012 and 2010, respectively,2011, the Company recognized approximately $1.0 million, $0.9 million and $0.5 million and $0.4 million inrespectively of expense related to the restricted share awards. This expense is included in general and administrative expenses in the accompanying consolidated statementstatements of operations. As[FASBFASB Codification Topic (“ASC”) 718, “Stock Compensation”.] On September 9, 2010, the Company’s Operating Partnership granted 26,250 LTIP units to the Company’s then new Chief Financial Officer and 15,435 LTIP units granted to the Company’s former Chief Financial Officer were forfeited. These LTIP Units vest ratably over a five-yearfive years period beginning on the date of grant.F-22Company’sCompany's business plan; available acquisition opportunities; and economic environment and conditions. The Company used an expected stabilized dividend yield of 5.0% and a risk free interest rate of 2.33% based on a five-year U.S. Treasury yield.$0.8$0.8 million, $0.8 million and $0.5$0.8 million in compensation expense related to the LTIP Unitsunits for the years ended December 31, 20112013, 2012 and 2010,2011, respectively. As of December 31, 2011,2013 and 2012, there was $2.6$1.0 million and $1.8 million, respectively, of total unrecognized compensation cost related to LTIP Units. This cost is expected to be recognized over 3.3approximately 1.4 years, which represents the weighted average remaining vesting period of the LTIP Units. AsUpon the closing of the Company's equity offering on December 31, 2011, none2013, the Company determined that a revaluation event occurred, as defined in the Internal Revenue Code of 1986, as amended, and 26,250 LTIPS units of one of the officers of the Company achieved full parity with the common Operating Partnership units with respect to liquidating distributions and all other purposes. Three-fifths of these units have vested. Accordingly, these LTIP Units have reached parity.13.Commitments and Contingenciesthreatened.$7,000$7,000 per month when monthly occupancy is less than 85% and can increase up to approximately $20,000$20,000 per month if occupancy is 100%, with minimum rent increased on an annual basis by two and one-half percent (2.5%(2.5%).2104.2104. The lease agreements with the City of New Rochelle cover the space above the parking garage that is occupied by the hotel as well as 128 parking spaces in a parking garage that is attached to the hotel. The annual base rent for the garage lease is the hotel’s proportionate share of the city’s adopted budget for the operations, management and maintenance of the garage and established reserves to fund for the cost of capital repairs. Amount $ 203 205 207 210 212 11,660 $ 12,697 Amount 2014 $ 207 2015 210 2016 212 2017 214 2018 217 Thereafter 11,228 Total $ 12,288 F-23Condominium LeasesWhite Plains hotel is part of a condominium known as La Reserva Condominium (the “Condominium”). The Condominium is comprised of 143 residential unitsmanagement agreements with Concord have an initial ten-year term that expires on February 28, 2017 and four commercial units. The four commercial units are ownedwill renew automatically for successive one-year terms unless terminated by the Company and are partTRS lessee or the manager by written notice to the other party no later than 90 days prior to the then current term’s expiration date. The management agreements may be terminated for cause, including the failure of the White Plains hotel. The White Plainsmanaged hotel is comprised of 129operating performance to meet specified levels. If the Company were to terminate the management agreements during the first nine years of the residential units ownedterm other than for breach or default by the Company and four residential units leased bymanager, the Company from unaffiliated third party owners. The remaining 10 residential units are owned and occupied by unaffiliated third party owners.The Company leases four residential units in the White Plains hotel from individual owners (the “Condo Owner”). The lease agreements are for 6 years with a one-time five year renewal option. The White Plains hotel has the right to sublease the unit to any third party (a “Hotel Guest”) for such rent and on such terms as the White Plains hotel may determine. Each Condo Owner may reserve the unit for seven days in any calendar quarter or two weeks in any calendar year. Each Condo Owner is also obligated to reimburse the White Plains hotel for renovations that were completed in 2008. Minimum annual rents payable to the Condo Owner are approximately $70 thousand per year and amounts receivable from the Condo Owner for its renovation reimbursements are approximately $11 thousand per year, subject to a balloon repayment at the end of the lease term of any remaining reimbursements. The White Plains hotel iswould be responsible for paying assessmentstermination fees to the Condominium association on a monthly basis for all residential units owned and leased. The White Plains hotel provides certain services to the Condominium association for housekeeping, maintenance and certain other services and receives compensation from the Condominium association for said services.Management AgreementsOur hotels are operated under various management agreements that call for base management fees, which generally range from 2-4% of the hotel’s gross room revenue and generally have an incentive provision, if certain financial thresholds are met or exceeded, of 10% of the hotel’s net operating income less fixed costs, base management fees and a specified return threshold. The management agreements with IHM have an initial terms from 5term of five years and may be renewed for twofive-year periods at IHM’s option by written notice to 15 years and generally have renewal options.us no later than 90 days prior to the then current term’s expiration date. The IHM management agreements provide for early termination at the Company’s option upon sale of any IHM-managed hotel for no termination fee, with six months advance notice. The IHM management agreements may be terminated for cause, including the failure of the managed hotel to meet specified performance levels, and may be terminated bylevels.manager in the event we undergo a change in control. Company's management agreements are:Property Management Company Base Management Fee Monthly Accounting Fee Monthly Revenue Management Fee Incentive Management Fee Courtyard Altoona Concord 4.0 % 1,211 — — % Springhill Suites Washington Concord 4.0 % 991 — — % Homewood Suites by Hilton Boston-Billerica/ Bedford/ Burlington IHM 2.0 % 1,000 550 1.0 % Homewood Suites by Hilton Minneapolis-Mall of America IHM 2.0 % 1,000 550 1.0 % Homewood Suites by Hilton Nashville-Brentwood IHM 2.0 % 1,000 550 1.0 % Homewood Suites by Hilton Dallas-Market Center IHM 2.0 % 1,000 550 1.0 % Homewood Suites by Hilton Hartford-Farmington IHM 2.0 % 1,000 550 1.0 % Homewood Suites by Hilton Orlando-Maitland IHM 2.0 % 1,000 550 1.0 % Homewood Suites by Hilton Carlsbad (North San Diego County) IHM 3.0 % 1,000 — 1.0 % Hampton Inn & Suites Houston-Medical Center IHM 3.0 % 1,000 — 1.0 % Residence Inn Long Island Holtsville IHM 3.0 % 1,000 — 1.0 % Residence Inn White Plains IHM 3.0 % 1,000 — 1.0 % Residence Inn New Rochelle IHM 3.0 % 1,000 — 1.0 % Residence Inn Garden Grove IHM 2.5 % 1,000 — 1.0 % Residence Inn Mission Valley IHM 2.5 % 1,000 — 1.0 % Homewood Suites by Hilton San Antonio River Walk IHM 2.5 % 1,000 — 1.0 % Residence Inn Washington DC IHM 2.5 % 1,000 — 1.0 % Residence Inn Tysons Corner IHM 2.5 % 1,000 — 1.0 % Hampton Inn Portland Downtown IHM 3.0 % 1,000 550 1.0 % Courtyard Houston IHM 3.0 % 1,000 550 1.0 % Hyatt Place Pittsburgh North Shore IHM 3.0 % 1,500 1,000 1.0 % Hampton Inn Exeter IHM 3.0 % 1,200 1,000 1.0 % Hilton Garden Inn Denver Tech IHM 3.0 % 1,500 1,000 1.0 % Residence Inn Bellevue IHM 3.0 % 1,200 1,000 1.0 % Springhill Suites Savannah IHM 3.0 % 1,200 1,000 1.0 % are recorded within hotel other operating expenses on the consolidated statements of operations and totaled approximately $2.0$3.8 million, $2.9 million and $0.7$2.2 million, respectively, for the years ended December 31, 2013, 2012 and 2011. Incentive management fees paid to IHM for the years ended December 31, 2013, 2012 and 2011 were $63.0 thousand, $16.0 thousand and 2010.Property Franchise/Royalty Fee Marketing/Program Fee Expiration Homewood Suites by Hilton Boston-Billerica/ Bedford/ Burlington 4.0 % 4.0 % 2025 Homewood Suites by Hilton Minneapolis-Mall of America 4.0 % 4.0 % 2025 Homewood Suites by Hilton Nashville-Brentwood 4.0 % 4.0 % 2025 Homewood Suites by Hilton Dallas-Market Center 4.0 % 4.0 % 2025 Homewood Suites by Hilton Hartford-Farmington 4.0 % 4.0 % 2025 Homewood Suites by Hilton Orlando-Maitland 4.0 % 4.0 % 2025 Homewood Suites by Hilton Carlsbad (North San Diego County) 4.0 % 4.0 % 2028 Hampton Inn & Suites Houston-Medical Center 5.0 % 4.0 % 2020 Courtyard Altoona 5.5 % 2.0 % 2030 Springhill Suites Washington 5.0 % 2.5 % 2030 Residence Inn Long Island Holtsville 5.5 % 2.5 % 2025 Residence Inn White Plains 5.5 % 2.5 % 2030 Residence Inn New Rochelle 5.5 % 2.5 % 2030 Residence Inn Garden Grove 5.0 % 2.5 % 2031 Residence Inn Mission Valley 5.0 % 2.5 % 2031 Homewood Suites by Hilton San Antonio River Walk 4.0 % 4.0 % 2026 Residence Inn Washington DC 5.5 % 2.5 % 2033 Residence Inn Tysons Corner 5.0 % 2.5 % 2031 Hampton Inn Portland Downtown 6.0 % 4.0 % 2032 Courtyard Houston 5.5 % 2.0 % 2030 Hyatt Place Pittsburgh North Shore 5.0 % 3.5 % 2030 Hampton Inn Exeter 6.0 % 4.0 % 2031 Hilton Garden Inn Denver Tech 4.3 % 5.5 % 2028 Residence Inn Bellevue 5.5 % 2.5 % 2033 Springhill Suites Savannah 5.0 % 2.5 % 2033 Quarter Ended - 2013 March 31 June 30 September 30 December 31 (in thousands, except share and per share data) Total revenue $ 25,779 $ 30,746 $ 35,370 $ 34,333 Total operating expenses 22,997 25,730 29,359 30,781 Operating income 2,782 5,016 6,011 3,552 Net income (loss) attributable to common shareholders (1,696 ) 2,103 2,469 (188 ) Income (loss) per common share, basic (1) (0.10 ) 0.12 0.11 (0.01 ) Income (loss) per common share, diluted (1) (0.10 ) 0.11 0.11 (0.01 ) Weighted average number of common shares outstanding: Basic 17,212,124 18,147,108 22,508,988 26,160,823 Diluted 17,212,124 18,383,626 22,769,282 26,160,823 Quarter Ended - 2012 March 31 June 30 September 30 December 31 (in thousands, except share and per share data) Total revenue $ 22,827 $ 26,359 $ 27,002 $ 16,850 Total operating expenses 20,180 21,943 21,774 21,917 Operating income (loss) 2,647 4,416 5,228 2,359 Net income (loss) attributable to common shareholders (1,731 ) 1,157 1,498 (2,374 ) Income (loss) per common share, basic and diluted (1) (0.13 ) 0.08 0.10 (0.18 ) Weighted average number of common shares outstanding: Basic 13,794,986 13,810,190 13,819,371 13,822,021 Diluted 13,794,986 13,908,907 13,908,907 13,822,021 Initial Cost Gross Amount at End of Year Description Year of Acquisition Encumbrances Land Buildings & Improvements Cost Cap. Sub. To Acq. Land Cost Cap. Sub. To Acq. Bldg & Improvements Land Buildings & Improvements Total Bldg & Improvements Accumulated Depreciation Year of Original Construction Depreciation Life Homewood Suites Orlando - Maitland, FL 2010 (1) $ 1,800 $ 7,200 $ 34 $ 1,173 $ 1,834 $ 8,373 $ 10,207 $ 8,373 $ 840 2000 (2) Homewood Suites Boston - Billerica, MA 2010 (1) 1,470 10,555 48 937 1,518 11,492 13,010 11,492 1,208 1999 (2) Homewood Suites Minneapolis - Mall of America, Bloomington, MN 2010 (1) 3,500 13,960 19 1,093 3,519 15,053 18,572 15,053 1,528 1998 (2) Homewood Suites Nashville - Brentwood, TN 2010 (1) 1,525 9,300 12 994 1,537 10,294 11,831 10,294 1,058 1998 (2) Homewood Suites Dallas - Market Center, Dallas, TX 2010 (1) 2,500 7,583 17 946 2,517 8,529 11,046 8,529 928 1998 (2) Homewood Suites Hartford - Farmington, CT 2010 (1) 1,325 9,375 92 965 1,417 10,340 11,757 10,340 1,092 1999 (2) Hampton Inn & Suites Houston - Houston, TX 2010 (1) 3,200 12,709 52 575 3,252 13,284 16,536 13,284 1,193 1997 (2) Residence Inn Holtsville - Holtsville, NY 2010 (1) 2,200 18,765 — 812 2,200 19,577 21,777 19,577 1,727 2004 (2) Courtyard Altoona - Altoona, PA 2010 6,378 — 10,730 — 867 — 11,597 11,597 11,597 1,029 2001 (2) SpringHill Suites Washington - Washington, PA 2010 4,937 1,000 10,692 — 787 1,000 11,479 12,479 11,479 1,013 2000 (2) Residence Inn White Plains - White Plains, NY 2010 (1) 2,200 17,677 — 1,542 2,200 19,220 21,420 19,220 1,570 1982 (2) Residence Inn New Rochelle - New Rochelle, NY 2010 15,150 — 20,281 9 2,018 9 22,299 22,308 22,299 1,891 2000 (2) Homewood Suites Carlsbad - Carlsbad, CA 2010 (1) 3,900 27,520 — 87 3,900 27,607 31,507 27,607 2,186 2008 (2) Residence Inn Garden Grove - Garden Grove, CA 2011 32,253 7,109 35,484 — 993 7,109 36,477 43,586 36,477 2,246 2003 (2) Residence Inn Mission Valley - San Diego, CA 2011 30,546 9,856 39,535 — 244 9,856 39,779 49,635 39,779 2,458 2003 (2) Homewood Suites San Antonio - San Antonio, TX 2011 17,454 5,999 24,764 2 338 6,001 25,103 31,104 25,103 1,562 1996 (2) Doubletree Suites Washington DC - Washington, DC 2011 (1) 6,083 22,063 28 4,053 6,111 26,116 32,227 26,116 1,400 1974 (2) Residence Inn Tyson's Corner - Vienna, VA 2011 23,925 5,752 28,917 — 37 5,752 28,954 34,706 28,954 1,791 2001 (2) Hampton Inn Portland Downtown - Portland, ME 2012 (1) 4,315 22,664 — 3 4,315 22,667 26,982 22,667 574 2011 (2) Courtyard Houston - Houston, TX 2013 19,812 5,600 27,350 — 13 5,600 27,363 32,963 27,363 618 2010 (2) Hyatt Place Pittsburgh - Pittsburgh, PA 2013 24,028 3,000 35,576 — 72 3,000 35,648 38,648 35,648 483 2011 (2) Hampton Inn & Suites Exeter - Exeter, NH 2013 (1) 1,900 12,350 — 2 1,900 12,352 14,252 12,352 123 2010 (2) Hilton Garden Inn Denver Tech - Denver, CO 2013 none 4,100 23,100 — 3 4,100 23,103 27,203 23,103 153 1999 (2) Residence Inn Bellevue - Bellevue, WA 2013 47,580 13,800 56,957 — — 13,800 56,957 70,757 56,957 242 2008 (2) SpringHill Suites Savannah - Savannah, GA 2013 none 2,400 36,050 — — 2,400 36,050 38,450 36,050 67 2009 (2) Grand Total(s) $ 94,534 $ 541,157 $ 313 $ 18,556 $ 94,847 $ 559,713 $ 654,560 $ 559,713 $ 28,980 (1) This property is pledged as collateral to borrowings made under the revolving credit facility obtained on October 12, 2010, which had outstanding borrowings of $50,000 as of December 31, 2013. (2) Depreciation is computed based upon the following estimated useful lives: Years Building 40 Land improvements 20 Building improvements 5-20 Notes: (a) The change in total cost of real estate assets for the year ended is as follows: 2013 2012 2011 2010 Balance at the beginning of the year $ 423,729 $ 392,463 $ 200,974 — Acquisitions 222,273 26,979 185,995 200,967 Dispositions during the year — (951 ) — — Capital expenditures and transfers from construction-in-progress 8,558 5,238 5,494 7 Investment in Real Estate $ 654,560 $ 423,729 $ 392,463 $ 200,974 (b) The change in accumulated depreciation and amortization of real estate assets for the year ended is as follows: Balance at the beginning of the year $ 17,398 $ 8,394 $ 1,901 — Depreciation and amortization 11,582 9,004 6,493 1,901 Balance at the end of the year $ 28,980 $ 17,398 $ 8,394 $ 1,901 (c) The aggregate cost of properties for federal income tax purposes (in thousands) is approximately $652,877 as of December 31, 2013. Page No. Report of Independent Registered Certified Public Accounting Firm 3 Combined Balance Sheets at December 31, 2013 and 2012 4 Combined Statements of Operations for the year ended December 31, 2013, the year ended December 31, 2012 and the period from October 27, 2011 (commencement of operations) to December 31, 2011 5 Combined Statements of Equity for the year ended December 31, 2013, the year ended December 31, 2012 and the period from October 27, 2011 (commencement of operations) to December 31, 2011 6 Combined Statements of Cash Flows for the year ended December 31, 2013, the year ended December 31, 2012 and the period from October 27, 2011 (commencement of operations) to December 31, 2011 7 Notes to Combined Financial Statements 8 December 31,
2013 December 31,
2012 Assets: Investment in hotel properties, net $ 843,442 $ 862,747 Hotels held for sale, net — 13,338 Cash and cash equivalents 22,850 26,554 Restricted cash 58,082 25,798 Hotel receivables (net of allowance for doubtful accounts of $400 and $417, respectively) 3,371 3,553 Deferred costs, net 20,622 10,630 Prepaid expenses and other assets 5,145 6,276 Total assets $ 953,512 $ 948,896 Liabilities and Owners' Equity: Debt $ 950,000 $ 792,239 Hotels held for sale — 639 Accounts payable and accrued expenses 18,863 26,402 Total liabilities 968,863 819,280 Commitments and contingencies Owners' Equity (Deficit): Contributions 360,000 360,000 Distributions and accumulated deficit (375,351 ) (230,384 ) Total owners’ equity (deficit) (15,351 ) 129,616 Total liabilities and owners' equity (deficit) $ 953,512 $ 948,896 For the Period from October 27, 2011 For the year ended For the year ended (Commencement of Operations) to December 31, 2013 December 31, 2012 December 31, 2011 (unaudited) Revenue: Room $ 246,931 $ 234,576 $ 31,500 Food and beverage 11,749 11,263 1,973 Other 5,518 5,773 867 Total revenue 264,198 251,612 34,340 Expenses: Hotel operating expenses: Room 49,658 47,738 7,375 Food and beverage expense 8,794 8,486 1,384 Telephone expense 2,119 2,073 344 Other hotel operating expense 2,474 2,472 365 General and administrative 24,630 23,842 3,002 Franchise and marketing fees 19,021 17,471 2,347 Advertising and promotions 6,856 7,778 1,266 Utilities 11,670 11,158 1,861 Repairs and maintenance 14,444 14,135 2,156 Management fees — 261 16 Management fees to related party 6,347 6,750 938 Insurance 2,082 1,361 205 Total hotel operating expenses 148,095 143,525 21,259 Depreciation and amortization 50,127 51,622 9,181 Property taxes and insurance 12,595 11,828 1,811 General and administrative 4,898 4,774 985 Hotel property acquisition costs and other charges 24 413 4,599 Total operating expenses 215,739 212,162 37,835 Operating income (loss) 48,459 39,450 (3,495 ) Interest and other income 233 62 1,467 Interest expense, including amortization of deferred fees (55,672 ) (55,605 ) (8,404 ) Loss on early extinguishment of debt (8,863 ) — — Loss from continuing operations (15,843 ) (16,093 ) (10,432 ) Income (loss) from discontinued operations (274 ) (404 ) 346 Gain (loss) on sale of discontinued operations (2,456 ) 2,496 — Net Income (loss) from discontinued operations (2,730 ) 2,092 346 Net Loss $ (18,573 ) $ (14,001 ) $ (10,086 ) Contributions Distributions and Accumulated (Deficit) Total Owners' Equity (Deficit) Balance at October 27, 2011 (unaudited) $ 360,000 — $ 360,000 Net loss (unaudited) — (10,086 ) (10,086 ) Balance at December 31, 2011 (unaudited) 360,000 (10,086 ) 349,914 Balance at January 1, 2012 360,000 (10,086 ) 349,914 Net loss — (14,001 ) (14,001 ) Distributions — (206,297 ) (206,297 ) Balance at December 31, 2012 360,000 (230,384 ) 129,616 Net loss — (18,573 ) (18,573 ) Distributions — (126,394 ) (126,394 ) Balance at December 31, 2013 $ 360,000 $ (375,351 ) $ (15,351 ) For the Period from October 27, 2011 For the year ended For the year ended (Commencement of Operations) to December 31, 2013 December 31, 2012 December 31, 2011 (unaudited) Cash flows from operating activities: Net loss $ (18,573 ) $ (14,001 ) $ (10,086 ) Adjustments to reconcile net loss to net cash provided by operating activities: Depreciation 48,869 49,068 8,755 Loss on early extinguishment of debt 4,381 Amortization of deferred franchise fees 1,264 2,594 436 Amortization of deferred financing fees included in interest expense 3,517 1,906 87 Loss on disposition of property and equipment — — — Impairment on hotels classified as held for sale — 2,894 — Loss (gain) on sale of hotels included in discontinued operations 2,456 (2,496 ) — Changes in assets and liabilities: Hotel receivables 214 3,331 (1,278 ) Prepaid expenses and other assets 1,209 (4,299 ) 9,727 Deferred costs 11 1,194 (2,865 ) Accounts payable and accrued expenses (6,895 ) 5,215 4,569 Net cash provided by operating activities 36,453 45,406 9,345 Cash flows from investing activities: Improvements and additions to hotel properties (30,133 ) (19,901 ) (2,055 ) Acquisition of hotel properties, net of cash acquired — — (335,096 ) Proceeds from sale of assets 11,300 63,113 — Restricted cash (32,284 ) (284 ) 1,688 Net cash provided by (used in) investing activities (51,117 ) 42,928 (335,463 ) Cash flows from financing activities: Proceeds from the issuance of long-term debt 950,000 130,000 — Payments of financing costs (19,111 ) (4,771 ) — Payments on debt (792,239 ) (12,761 ) — Payment of franchise obligation (1,323 ) (1,804 ) — Contributions from owners — — 360,000 Distributions to owners (126,394 ) (206,297 ) — Net cash provided by (used in) financing activities 10,933 (95,633 ) 360,000 Change in cash and cash equivalents for assets held for sale 27 (29 ) — Net change in cash and cash equivalents (3,731 ) (7,299 ) 33,882 Cash and cash equivalents, beginning of period 26,554 33,882 — Cash and cash equivalents, end of period $ 22,850 $ 26,554 $ 33,882 Supplemental disclosure of cash flow information: Cash paid for interest $ 53,139 $ 53,131 $ 5,419 Supplemental disclosure of non-cash information: Accrued improvements and additions to hotel properties $ 1,594 $ 932 $ 1,662 1. Organization variousthe following brands: Residence Inn by Marriott (34 hotels), Hampton Inn by Hilton (5 hotels), Hyatt House (5 hotels), Courtyard by Marriott (3 hotels), Four Points by Sheraton (1 hotel), Sheraton (1 hotel), TownePlace Suites (1 hotel), and Westin (1 hotel). The day to day management of the hotels is provided pursuant to management agreements with Island Hospitality Management ("IHM"). Jeffrey H. Fisher is the 90% owner of IHM. Year ended December 31, 2013 Cash flows provided by operating activities, as reported $ 50,398 Cash flows provided by operating activities, as revised 45,406 Cash flows used in investing activities, as reported 37,936 Cash flows used in investing activities, as revised 42,928 December 31, 2013 December 31, 2012 Loan Costs $ 19,110 $ 7,791 Franchise Fees 3,801 3,801 Other 4,053 4,018 26,964 15,610 Less accumulated amortization (6,342 ) (4,980 ) Deferred costs, net $ 20,622 $ 10,630 Innkeepers Land $ 178,949 Building and improvements 721,690 Furniture, fixtures and equipment 70,276 Cash 24,904 Restricted cash 27,201 Accounts receivable 5,638 Prepaid and other assets 11,783 Deferred expenses 9,632 Debt (675,000 ) Accounts payable & accrued expenses (15,073 ) Net assets acquired $ 360,000 Net assets acquired, net of cash $ 335,096 2013 2012 Land and improvements $ 159,854 $ 158,164 Building and improvements 705,120 689,633 Furniture, fixtures and equipment 80,168 68,000 Renovations in progress 4,992 4,773 950,134 920,570 Less accumulated depreciation (106,692 ) (57,823 ) Investment in hotel properties, net $ 843,442 $ 862,747 Monthly Payment Principal Balance Property Carrying Value (In thousands) (In thousands) (In thousands) Interest Rate Amount Beginning Maturity Date 2013 2012 2013 2012 Variable rate debt JPM Chase loan (1) 4.97 % $ 4,063 09/04/2013 09/03/2016 950,000 — 838,333 — Mortgage loan (2) 359 03/09/2012 (1) 03/09/2015 — 90,000 — 127,060 Mezzanine loan (3) 420 03/09/2012 (2) 03/09/2015 — 40,000 — 56,472 Fixed rate debt Mortgage loan $ 3,809 11/09/2011 07/09/2017 $ — $ 662,239 $ — $ 687,577 $ 950,000 $ 792,239 $ 838,333 $ 871,109 (1) During 2013, the Company refinanced its existing debt with a new $950 million, non-recourse loan with JP Morgan Chase Bank, National Association, collateralized by the remaining 51, core hotels in the Innkeepers portfolio. The new loan is a five-year, interest only loan comprised of a two-year loan with three, one-year extension options. The first extension is not contingent on any factors. As such the Company treats the loan as a three year loan and amortizes over the three year life. Interest only payments are due monthly. The interest rate is based on one-month LIBOR plus 4.8%. Monthly payments are based on a number of days and loan balance and they will not be the same every month, payments reflected above are based on last three months average LIBOR plus 4.8%. (2) Interest only payments are due monthly. The interest rate is based on one month LIBOR plus 4.0%, subject to minimum LIBOR rate of 0.6% and the rate disclosed is based on the minimum aggregate rate of 4.6%. The loan is subject to two one-year extensions at the Company's option. (3) Interest only payments are due monthly. The interest rate is based on one-month LIBOR plus 11.5%, subject to a minimum LIBOR rate of 0.6% and the rate disclosed is based on the minimum rate of 12.1%. The loan is subject to tow one-year extensions at the Company's option. (1) Cerberus Guarantor and Chatham Guarantor shall collectively maintain a Net Worth of not less than $225,000 in the aggregate, (2) Cerberus Guarantor shall maintain Unencumbered Liquid Assets of not less than $15,000, and (3) Chatham Guarantor shall maintain Unencumbered Liquid Assets of not less than $7,500 of which (i) not less than $3,000 of Unencumbered Liquid Cash Assets and (ii) not less than $4,500 in Unencumbered Credit Line Capacity. Amount 2014 $ — 2015 — 2016 950,000 2017 — 2018 — Thereafter — Total $ 950,000 Owners' Name 12/31/2013 12/31/2012 12/31/2011 (unaudited) CRE-Ink REIT Member LLC 89.72 % 89.72 % 89.72 % Chatham Lodging, LP 10.28 % 10.28 % 10.28 % Total 100.00 % 100.00 % 100.00 % Amount 2014 $ 109 2015 111 2016 112 2017 114 2018 116 Thereafter 2,031 Total $ 2,593 operatethirty-four Residence Inns, three Courtyards by Marriott and one TownePlace Suites. These franchise agreements expire between 2016 and 2028. The Marriott franchise agreements provide for franchise fees ranging from 5.0% to 6.5% of the hotelshotel’s gross room sales and marketing fees ranging from 1.5% to 2.5% of the hotel’s gross room sales. The Marriott franchise agreements are terminable by Marriott in the event that the applicable franchisee fails to cure an event of default or, in certain circumstances such as the franchisee’s bankruptcy or insolvency, are terminable by Marriott at will. The Marriott franchise agreements provide that, in the event of a proposed transfer of the hotel, the TRS Lessee’s interest in the agreement or more than a specified amount of the TRS Lessee to a competitor of Marriott, Marriott has the right to purchase or lease the hotel under specific brands. Typically, ourterms consistent with those contained in the respective offer and may terminate if the TRS Lessee elects to proceed with such a transfer.royaltymonthly program fee of 4-5.5%equal to 4% of the hotel’s gross roomrooms revenue and a program fee of 2-4%royalty fees equal to 5% of the hotel’s gross roomrooms revenue. Hampton Inns may terminate the franchise agreements in the event that the franchisee fails to cure an event of default or, in certain circumstances such as the franchisee’s bankruptcy or insolvency.10-2020 years and generally haveexpires in 2031. Neither of the agreements has a renewal option. The Sheraton franchise agreements provide for royalty fees ranging from 5.0% to 6.0% of gross rooms sales and royalty fees of 3% of gross food and beverage sales as to one of the Sheratons. The agreements provide for marketing fees ranging from 1.0% to 1.25% of gross rooms sales. Sheraton may terminate the franchise agreements in the event that the franchisee fails to cure an event of default or, in certain circumstances such as franchisee’s bankruptcy or insolvency.options. Franchiseoption. The Westin franchise agreement provides for royalty fees are recorded withinof 7% of gross rooms sales and 3% of gross food and beverage sales. The agreement provides for marketing fees of 2% of gross rooms sales. Westin may terminate the franchise agreement in the event that the franchisee fails to cure an event of default or, in certain circumstances such as franchisee’s bankruptcy or insolvency.other operating expensesproperty classified as held for sale. As of December 31, 2012, the Company had four properties held for sale and all four hotels were sold during the year ended December 31, 2013 and recognized a net loss on sale of the consolidated statementsfour hotels of operations$2,456. During the year ended December 31, 2012, the Company sold nine properties previously classified as held for sale and totaled approximately $5.6 million and $1.9 million, respectively,recognized a net gain on sale of the nine hotels for $2,496.20112013, 2012 and 2010.14.Related Party Transactions 2013 2012 2011 (unaudited) Hotel operating revenue $ 1,854 $ 17,155 $ 4,050 Hotel operating expenses (1,933 ) (13,166 ) (3,222 ) Depreciation — — — Amortization of franchise fees (6 ) (40 ) (10 ) Property taxes and insurance (187 ) (1,449 ) (419 ) General and administrative (2 ) (10 ) (27 ) Impairment on hotels classified as held for dale — (2,894 ) — Other charges — — (26 ) Loss from discontinued operations (274 ) (404 ) 346 Gain (loss) on sale of assets from discontinued operations (2,456 ) 2,496 — Net income (loss) from discontinued operations $ (2,730 ) $ 2,092 $ 346 Company paid $3.2 million to reimburse Mr. Fisherfollowing table includes the four properties held for expenses he incurred in connection with the Company’s formationsale as of December 31, 2013 and the IPO, including $2.5 million he funded as earnest money deposits for the Company’s purchase2012. 2013 2012 Land and improvements $ — $ 3,003 Building and improvements — 8,310 Furniture, fixtures and equipment — 1,834 Renovations in progress — — Other assets — 191 Total assets held for sale $ — $ 13,338 Accounts payable and accrued expenses $ — $ 639 the six Homewood SuitesDecember 31, 2013, all 51 hotels are managed by Hilton. Mr. Fisher had also advanced $14 thousand to the Company which was reimbursed following the close of the IPO.Mr. Fisher owns 90% of Island HospitalityIHM. Management, Inc. (“IHM”), a hotelrevenue management company. The Company has hotel management agreements with IHM to manage ten of its hotels in 2011 and 5 of its hotels in 2010. All but one of the 64 hotels acquired by the JV from Innkeepers will continue to be managed by IHM.F-24Management and accounting fees paid by the Company to IHM for the years ended December 31, 2013, and 2012 and the 2011 period from October 27, 2011 (commencement of operations) to December 31, 2011 were $6,347 and 2010 were $1.3 million$6,750 and $0.2 million,$938 (unaudited), respectively. At December 31, 20112013, 2012 and 20102011, the amounts due to IHM were $0.3$130, $568 and $0.07 million,$499 (unaudited), respectively.15.Quarterly Operating Results (unaudited) Quarter Ended—2011 March 31 June 30 September 30 December 31 (in thousands, except per share data) $ 12,487 $ 14,902 $ 23,578 $ 22,129 11,737 16,190 21,390 23,650 750 (1,288 ) 2,188 (1,521 ) (19 ) (1,936 ) (955 ) (6,195 ) 0.00 (0.14 ) (0.07 ) (0.45 ) 11,800,771 13,757,449 13,766,297 13,768,910 11,800,771 13,757,449 13,766,297 13,768,910 (1)The sum of per share amounts for the four quarters may differ from the annual per share amounts due to the required method of computing weighted-average number of common shares outstanding in the respective periods.16.Subsequent Eventsjoint venture between Chatham and Cerberus Capital Management LP, which owns 64 hotels with 8,329 rooms/suites, closed on a $130 million mortgage loan secured byCompany has performed an evaluation of subsequent events since the balance sheet date through March 10, previously unencumbered hotels comprising 1,707 rooms. Eastdil Secured, L.L.C. arranged2014, the $130 million first mortgage and mezzanine non-recourse financing with lenders Citibank, N.A., Wells Fargo Bank, National Association and an affiliate of Starwood Property Trust, Inc. The maturitydate of the facilities is three years with two one-year extension options and carries an all-in interest rate of 6.9 percent.In addition to net proceeds from the financing, additional cash generated from operations was distributed to the partners, resulting in a distribution to Chatham of approximately $13.1 million, approximately $1 per share. The $13.1 million distribution represents 35 percentissuance of the company’s initial $37 million investment. Chatham will use partfinancial statements. During 2014, the owners decided to offer for sale all 51 of the distribution to pay down borrowings outstanding on its senior secured credit facility, reducing the outstanding balance to $62 million.F-25SCHEDULE REAL ESTATE AND ACCUMULATED DEPRECIATIONCHATHAM LODGING TRUSTSCHEDULE III—REAL ESTATE AND ACCUMULATED DEPRECIATIONDecember 31, 2011(in thousands) Initial Cost Gross Amount at End of Year Year of
Acquisition Encumbrances Land Buildings &
Improvements Cost Cap.
Sub
To Acq.
Land. Cost Cap.
Sub. To
Acq. Bldg &
Improvements Land Buildings &
Improvements Total Bldg &
Improvements Accumulated
Depreciation Year of
Original
Construction Depreciation
Life 2010 (1 ) 1,800 7,200 34 658 1,834 7,858 9,692 7,858 315 2000 40 Years 2010 (1 ) 1,470 10,555 36 858 1,506 11,413 12,919 11,413 498 1999 40 Years 2010 (1 ) 3,500 13,960 19 864 3,519 14,824 18,343 14,824 641 1998 40 Years 2010 (1 ) 1,525 9,300 12 687 1,537 9,987 11,524 9,987 433 1998 40 Years 2010 (1 ) 2,500 7,583 17 867 2,517 8,450 10,967 8,450 369 1998 40 Years 2010 (1 ) 1,325 9,375 92 798 1,417 10,173 11,590 10,173 445 1999 40 Years 2010 (1 ) 3,200 12,709 — 20 3,200 12,729 15,929 12,729 479 1997 40 Years 2010 (1 ) 2,200 18,765 — 65 2,200 18,830 21,030 18,830 672 2004 40 Years 2010 6,753 — 10,730 — 26 — 10,756 10,756 10,756 367 2001 40 Years 2010 5,260 1,000 10,692 — 23 1,000 10,715 11,715 10,715 366 2000 40 Years 2010 (1 ) 2,200 17,677 — 14 2,200 17,691 19,891 17,691 563 1982 40 Years 2010 15,731 — 20,281 — 273 — 20,554 20,554 20,554 680 2000 40 Years 2010 (1 ) 3,900 27,520 — — 3,900 27,520 31,420 27,520 799 2008 40 Years 2011 32,417 7,432 35,484 6 7,432 35,490 42,922 35,490 416 2003 40 Years 2011 39,986 9,876 39,535 55 9,876 39,590 49,466 39,590 463 2003 40 Years 2011 18,380 6,059 24,764 2 14 6,061 24,778 30,839 24,778 290 1996 40 Years 2011 19,960 6,044 22,063 53 6,044 22,116 28,160 22,116 259 1974 40 Years 2011 22,953 5,821 28,917 8 5,821 28,925 34,746 28,925 339 2001 40 Years 59,852 327,110 212 5,289 60,064 332,399 392,463 332,399 8,394 (1)This property is pledged as collateral to borrowings made under the revolving credit facility obtained on October 12, 2010, which had outstanding borrowings of $67,500 as of December 31, 2011.F-26Notes:(a)The change in total cost of real estate assets for the year ended is as follows: 2011 2010 $ 200,974 $ — 185,995 200,967 — — 5,494 7 $ 392,463 $ 200,974 (b)The change in accumulated depreciation and amortization of real estate assets for the year ended is as follows: $ 1,901 $ — 6,493 1,901 $ 8,394 $ 1,901 (c)The aggregate cost of properties for federal income tax purpose (in thousands) is approximately $402,509 as of December 31, 2011.F-27