Form
| þ | ANNUAL REPORT PURSUANT TO SECTION 13 OR 15(d) OF THE SECURITIES |
SECURITIES
OR
| ¨ | TRANSITION REPORT PURSUANT TO SECTION 13 OR 15(d) OF THE SECURITIES |
__________
000-03134
Ohio | 34-1867219 | |
(State or other jurisdiction of incorporation or organization) | (I.R.S. Employer Identification No.) | |
6065 Parkland Boulevard, Cleveland, Ohio | 44124 | |
| (Address of principal executive offices) | (Zip Code) | |
Title of each class | Name of each exchange on which registered | |
| Common Stock, Par Value $1.00 Per Share | The NASDAQ Stock Market LLC | |
Large accelerated filer | ¨ | Accelerated filer | |||||||
| Non-accelerated filer | ¨ (Do not check if a smaller reporting company) | Smaller reporting company | ¨ | ||||||
28, 2013.
28, 2014
, 12,430,446 shares of the registrant’s common stock, $1 par value, were outstanding.December 31, 2013: Supply Technologies Rubber and thermoplastic hose manufacture fluid routing, injection molded rubber and thermoplastic and screw products. melting systems are engineered and built to customer specifications and are used primarily for melting, heating, and surface hardening of metals and curing of coatings. Approximately $13.0 million in cash, which payment was made in June 2012. the engineering staff of OEM customers in designing new products and improving existing products. 2014. growing product lines. the loss of any key customer, in whole or in part; the insolvency or bankruptcy of any key customer; a declining market in which customers reduce orders or demand reduced prices; or a strike or work stoppage at a key customer facility, which could affect both their suppliers and customers. of integrating operations could cause an interruption of, or loss of momentum in, our activities. Any delays or difficulties encountered in connection with any acquisition and the integration of our operations could have a material adverse effect on our business, results of operations, financial condition or prospects of our business. While we currently maintain what we believe to be suitable and adequate product liability insurance, we cannot assure you that we will be able to maintain our insurance on acceptable terms or that our insurance will provide adequate protection against potential liabilities. In the event of a claim against us, a lack of sufficient insurance coverage could have a material adverse effect on our financial condition, liquidity and results of operations. Moreover, even if we maintain adequate insurance, any successful claim could have a material adverse effect on our financial condition, liquidity and results of operations. fluctuations in currency exchange rates; limitations on ownership and on repatriation of earnings; transportation delays and interruptions; political, social and economic instability and disruptions; potential disruption that could be caused with the partial or complete reconfiguration of the European Union; the imposition of duties and tariffs and other trade barriers; import and export controls; labor unrest and current and changing regulatory environments; the potential for nationalization of enterprises; disadvantages of competing against companies from countries that are not subject to U.S. laws and regulations including the U.S. Foreign Corrupt Practices Act (“FCPA”); difficulties in staffing and managing multinational operations; limitations on our ability to enforce legal rights and remedies; and potentially adverse tax consequences. may conflict with local customs and practices. We cannot assure you that our internal controls and procedures always will protect us from the reckless or criminal acts committed by our employees or agents. For example, in connection with responding to a subpoena from the staff of the SEC, regarding a third party, we disclosed to the staff that the third party participated in a payment on our behalf to a foreign tax official that implicates the FCPA. If we are found to be liable for FCPA violations (either due to our own acts or our inadvertence or due to the acts or inadvertence of others), we could suffer from criminal or civil penalties or other sanctions, which could have a material adverse effect on our business. and have sufficient productive capacity to meet our current needs. Related Industry Segment Location Owned or Leased Approximate Square Footage Use ALUMINUM PRODUCTS MANUFACTURED PRODUCTS(4) 2013 any injuries that they have incurred did in fact result from alleged exposure to asbestos; and (e) the complaints assert claims against multiple defendants and, in most cases, the damages alleged are not attributed to individual defendants. Additionally, we do not believe that the amounts claimed in any of the asbestos cases are meaningful indicators of our potential exposure because the amounts claimed typically bear no relation to the extent of the Contents Quarter 1st 2nd 3rd 4th 490. Period October 1 — October 31, 2011 November 1 — November 30, 2011(2) December 1 — December 31, 2011 TOTAL Selected Statement of Operations Data: Net sales Cost of products sold(a) Gross profit Selling, general and administrative expenses Goodwill impairment charge Gain on sale of assets held for sale Restructuring and impairment charges(a) Operating income (loss)(a) Gain on purchase of 8.375% senior subordinated notes Gain on acquisition of business Interest expense Income (loss) before income taxes Income tax (benefit) expense Net income (loss) Amounts per common share: Basic Diluted Other Financial Data: Net cash flows provided by operating activities Net cash flows used by investing activities Net cash flows provided (used) by financing activities Depreciation and amortization Capital expenditures, net Selected Balance Sheet Data (as of period end): Cash and cash equivalents Working capital Property, plant and equipment Total assets Total debt Shareholders’ equity Non-cash charges: Cost of products sold (inventory write-down) Asset impairment Restructuring and severance Total Charges reflected as restructuring and impairment charges on income statement 2013. 2012. 2013. Supply Technologies Aluminum Products Manufactured Products Consolidated Net Sales changes in segment revenues for 2012 compared to the prior year are contained within the “Segment Analysis” section. Consolidated cost of products sold Consolidated gross profit Gross Margin FRS acquisition. Consolidated SG&A expenses SG&A percent Consolidated SG&A expenses increased in cash, which payment was made in June 2012. Interest expense Debt extinguishment costs included in interest expense Amortization of deferred financing costs and bank service charges Average outstanding borrowings Average borrowing rate Income before income taxes Income tax (benefit) expense Effective income tax rate settlement costs and net interest expense and by adding the gain on acquisition of business. Supply Technologies Aluminum Products Manufactured Products Consolidated Net Sales Consolidated cost of products sold Consolidated gross profit Gross margin Consolidated SG&A expenses SG&A percent Interest expense Average outstanding borrowings Average borrowing rate Income before income taxes Income tax expense (benefit) Effective income tax rate balance due at maturity (April 7, 2016). liabilities and access the capital necessary to grow and maintain its business. Accordingly, (In thousands) Long-term debt obligations Interest obligations(1) Operating lease obligations Purchase obligations Postretirement obligations(2) Standby letters of credit and bank guarantees Total we cannot predict with reasonable reliability, the timing of potential cash settlements with the respective taxing authorities. Allowance for Obsolete and Slow Moving Inventory: Inventories are stated at the lower of cost or market value and have been reduced by an allowance for obsolete and slow-moving inventories. The estimated allowance is based on management’s review of inventories on hand with minimal sales activity, which is compared to estimated future usage and sales. Inventories identified by management as slow-moving or obsolete are reserved for based on estimated selling prices less disposal costs. Though we consider these allowances adequate and proper, changes in economic conditions in specific markets in which we operate could have a material effect on reserve allowances required. impairment indicators, we determined whether the carrying amount of our long-lived assets was recoverable by comparing the carrying value to the sum of the undiscounted cash flows expected to result from the use and eventual disposition of the assets. We considered whether impairments existed at the lowest level of independent identifiable cash flows within a reporting unit (for example, plant location, program level or asset level). If the carrying value of the assets exceeded the expected cash flows, exists and must be recognized. In accordance with ASC 350, management tests goodwill for impairment at the reporting unit level. A reporting unit is Operational management, considering industry and company-specific historical and projected data, develops growth rates and cash flow projections. Terminal value rate determination follows common methodology of capturing the present value of perpetual cash flow estimates beyond the last projected period assuming a constant WACC and low long-term growth rates. There were no interim indicators of impairment and management concluded that the indefinite-lived intangibles were not impaired and that the two-step approach was not required to be performed through they become known. statements because it aligns with our current presentation. 2013 14, 2014 14, 2014 Current Assets Cash and cash equivalents Accounts receivable, less allowances for doubtful accounts of $5,483 in 2011 and $6,011 in 2010 Inventories, net Deferred tax assets Unbilled contract revenue Other current assets Total Current Assets Property, plant and equipment: Land and land improvements Buildings Machinery and equipment Less accumulated depreciation Other Assets: Goodwill Other Current Liabilities Trade accounts payable Accrued expenses Current portion of long-term debt Current portion of other postretirement benefits Total Current Liabilities Long-Term Liabilities, less current portion Senior Notes Credit facility Other long-term debt Deferred tax liability Other postretirement benefits and other long-term liabilities Shareholders’ Equity Capital stock, par value $1 per share Serial preferred stock: Authorized — 632,470 shares; Issued and outstanding — none Common stock: Authorized — 40,000,000 shares; Issued — 13,813,774 shares in 2011 and 13,396,674 in 2010 Additional paid-in capital Retained earnings (deficit) Treasury stock, at cost, 1,673,926 shares in 2011 and 1,558,996 shares in 2010 Accumulated other comprehensive (loss) income Net sales Cost of products sold Gross profit Selling, general and administrative expenses Restructuring and asset impairment charges Operating income Gain on purchase of 8.375% senior subordinated notes Gain on acquisition of business Interest expense Income (loss) before income taxes Income tax (benefit) expense Net income (loss) Amounts per common share: Basic Diluted Balance at January 1, 2009 Comprehensive (loss): Net loss Foreign currency translation adjustment Unrealized loss on marketable securities, net of income tax of $182 Pension and postretirement benefit adjustments, net of income tax of $1,179 Comprehensive income Restricted stock award, net of forfeiture Amortization of restricted stock Purchase of treasury stock (30,445 shares) Exercise of stock options (410,000 shares) Share-based compensation Balance at December 31, 2009 Comprehensive income (loss): Net income Foreign currency translation adjustment Pension and postretirement benefit adjustments, net of income tax of $1,143 Comprehensive income Amortization of restricted stock Restricted share units exchange for restricted stock Restricted stock awards Restricted stock cancelled Purchase of treasury stock (85,027 shares) Exercise of stock options (23,166 shares) Share-based compensation Balance at December 31, 2010 Comprehensive income (loss): Net income Foreign currency translation adjustment Pension and postretirement benefit adjustments, net of income tax of $5,571 Comprehensive income Amortization of restricted stock Restricted stock awards Purchase of treasury stock (114,930 shares) Exercise of stock options (223,300 shares) Share-based compensation Balance at December 31, 2011 OPERATING ACTIVITIES Net income (loss) Adjustments to reconcile net income (loss) to net cash provided by operations: Depreciation and amortization Restructuring and asset impairment charges Debt extinguishment costs Gain on purchase of 8.375% senior subordinated notes Gain on acquisition of business Deferred income taxes Share-based compensation expense Changes in operating assets and liabilities excluding acquisitions of businesses: Accounts receivable Inventories and other current assets Accounts payable and accrued expenses Other Net cash provided by operating activities INVESTING ACTIVITIES Purchases of property, plant and equipment Business acquisitions, net of cash acquired Proceeds from the sale of property Purchases of marketable securities Sales of marketable securities Net cash used by investing activities FINANCING ACTIVITIES (Payments) on term loans and other debt Bank debt issue costs Proceeds from (payments on) revolving credit facility Issuance of 8.125% senior notes due 2021, net of deferred financing costs Redemption of 8.375% senior subordinated notes due 2014 Purchase of 8.375% senior subordinated notes Issuance of common stock under stock option plan Purchase of treasury stock Net cash provided (used) by financing activities Increase in cash and cash equivalents Cash and cash equivalents at beginning of year Cash and cash equivalents at end of year Income taxes paid Interest paid (includes $5,720 of senior subordinated notes redemption costs in 2011) Finished goods Work in process Raw materials and supplies Property, Plant and Equipment: Property, plant and equipment are carried at cost. Additions and associated interest costs are capitalized and expenditures for repairs and maintenance are charged to operations. Depreciation of fixed assets is computed principally by the straight-line method based on the estimated useful lives of the assets ranging from 15. events or changes in circumstances indicate that we may not be able to recover the assets’ carrying amount. We measure the recoverability of assets to be held and used by a comparison of the carrying amount of the asset to the expected net future undiscounted cash flows to be generated by that asset, or, for identifiable intangibles with finite useful lives, by determining whether the amortization of the intangible asset balance over its remaining life can be recovered through undiscounted future cash flows. The amount of impairment of identifiable intangible assets with finite useful lives, if any, to be recognized is measured based on projected discounted future cash flows. We measure the amount of impairment of other long-lived assets (excluding goodwill) as the amount by which the carrying value of the asset exceeds the fair market value of the asset, which is generally determined, based on projected discounted future cash flows or appraised values. We classify long-lived assets to be disposed of other than by sale as held and used until they are disposed. . an indication of fair value from a potential buyer or similar specific transactions, we believe that using this methodology provides reasonable estimates of a reporting unit’s fair value. The income approach is based on projected future debt-free cash flow that is discounted to present value using factors that consider the timing and risk of the future cash flows. We believe that this approach is appropriate because it provides a fair value estimate based upon the reporting 9) approximate fair value at December 31, 2013 and December 31, 2012. The fair values of long-term debt and pension plan assets are disclosed in Note 9 and Note 13, respectively. Concentration of Credit Risk: The Company sells its products to customers in diversified industries. The Company performs ongoing credit evaluations of its customers’ financial condition but does not require collateral to support customer receivables. The Company establishes an allowance for doubtful accounts based upon factors surrounding the credit risk of specific customers, historical trends and other information. As of December 31, statements because it aligns with our current presentation. December 31, 2013 are included in the Assembly Components operating/reportable segment. The business segment results for the prior years have been reclassified to reflect these changes. The following is a description of our three operating/reportable segments. Net sales: Supply Technologies Aluminum Products Manufactured Products Income (loss) before income taxes: Supply Technologies Aluminum Products Manufactured Products Corporate costs Gain on purchase of 8.375% senior subordinated notes Gain on acquisition of business Asset impairment charge Interest expense (includes $7,335 of debt extinguishment costs in 2011) Identifiable assets: Supply Technologies Aluminum Products Manufactured Products General corporate Depreciation and amortization expense: Supply Technologies Aluminum Products Manufactured Products General corporate Capital expenditures: Supply Technologies Aluminum Products Manufactured Products General corporate The percentage of net sales by product line included in each segment Manufactured Products: Capital equipment Forged and machined products Rubber products Supply Technologies: Supply Technologies Engineered specialty products Other United States Asia Canada Mexico Europe Other the acquisition method of accounting, the total Accounts receivable Inventories Prepaid expenses and other current assets Property, plant and equipment Customer relationships Accounts payable Accrued expenses Deferred tax liability Gain on acquisition Total purchase price Accounts receivable Inventories Property, plant and equipment Accounts payable Accrued expenses Goodwill Total purchase price Accounts receivable Inventories Prepaid expenses and other current assets Property, plant and equipment Customer relationships Technological know how Trade name and other intangible assets Accounts payable Accrued expenses Goodwill Total purchase price The following unaudited pro forma information is provided to present a summary of the combined results of the Company’s operations with Pro forma revenues Pro forma net income (loss) Earnings per share: Basic Diluted Balance at January 1, 2009 Foreign Currency Translation Balance at December 31, 2009 Foreign Currency Translation Acquisitions Balance at December 31, 2010 Foreign Currency Translation Finalization of Pillar Purchase Price Allocation Balance at December 31, 2011 ETM in the fourth quarter of 2012. Non-contractual customer relationships Other December 31, 2013 follows: Accrued salaries, wages and benefits Advance billings Warranty accrual Interest payable Taxes, income and other Other Totals business unit. Warranty liabilities are primarily associated with the Company’s industrial equipment business unit and the fluid routing solutions business. Balance at beginning of year Claims paid during the year Warranty expense Other Balance at end of year 2011: 8.125% senior notes due 2021 8.375% senior subordinated notes due 2014 Revolving credit Term Loan A Term Loan B Other Less current maturities Total 8.125% per annum, payable semi-annually in arrears on April 1 and October 1 of each 2021 at United States Outside the United States Current (benefit) expense: Federal State Foreign Deferred: Federal State Foreign Income tax (benefit) expense Rate Reconciliation Tax at statutory rate Effect of state income taxes, net Effect of foreign operations Valuation allowance, federal and foreign Non-deductable items Gain on asset purchase Other, net Total Deferred tax assets: Postretirement benefit obligation Inventory Net operating loss and credit carryforwards Goodwill Other Total deferred tax assets Deferred tax liabilities: Depreciation and amortization Pension Intangible assets and other Total deferred tax liabilities Net deferred tax assets prior to valuation allowances Valuation allowances Net deferred tax asset 2033. Unrecognized Tax Benefit — January 1, Gross Increases — Tax Positions in Prior Period Gross Decreases — Tax Positions in Prior Period Gross Increases — Tax Positions in Current Period Settlements Lapse of Statute of Limitations Unrecognized Tax Benefit — December 31, The Company has determined that it is not practicable to determine the unrecognized tax liability on such undistributed earnings. Stock-Based Compensation 2011. The compensation expense related to option awards was $0.1 million for 2011. Outstanding — beginning of year Granted Exercised Canceled or Expired Outstanding — end of year Options Exercisable 20% discount and recognized compensation expense of $0.1 million. Outstanding — beginning of year Granted Vested Canceled or expired Outstanding — end of year 267,953. Litigation Judgment Change in benefit obligation Benefit obligation at beginning of year Service cost Interest cost Actuarial losses Benefits and expenses paid, net of contributions Benefit obligation at end of year Change in plan assets Fair value of plan assets at beginning of year Actual (loss) return on plan assets Company contributions Cash transfer to fund postretirement benefit payments Benefits and expenses paid, net of contributions Fair value of plan assets at end of year Funded (underfunded) status of the plans 2012: Noncurrent assets Noncurrent liabilities Current liabilities Amounts recognized in accumulated other comprehensive (income) loss Net actuarial loss Net prior service cost Net transition (asset) Accumulated other comprehensive loss Asset Category Equity securities Debt securities Other Collective trust and pooled insurance funds: Common stock Equity Funds Foreign Stock Convertible Securities U.S. Government Obligations Fixed income funds Corporate Bonds Cash and Cash Equivalents Hedge funds Other Hedge Funds 2013 and 2012. Discount rate Expected return on plan assets Rate of compensation increase in the following year. Components of net periodic benefit cost Service costs Interest costs Expected return on plan assets Transition obligation Amortization of prior service cost Recognized net actuarial loss Benefit (income) costs Other changes in plan assets and benefit obligations recognized in accumulated other comprehensive (income) loss AOCI at beginning of year Net (gain)/loss Recognition of prior service cost/(credit) Recognition of (gain)/loss Total recognized in accumulated other comprehensive loss at end of year immaterial. 2012 2013 2014 2015 2016 2017 to 2021 Effect on total of service and interest cost components in 2011 Effect on postretirement benefit obligation as of December 31, 2011 2014. NUMERATOR Net income (loss) DENOMINATOR Denominator for basic earnings per share — weighted average shares Effect of dilutive securities: Employee stock options and restricted shares Denominator for diluted earnings per share — weighted average shares and assumed conversions Amounts per common share: Basic Diluted Foreign currency translation adjustment Pension and postretirement benefit adjustments, net of tax Total Selected Quarterly Financial Data (Unaudited) 2011 Net sales Gross profit Net income (loss) Amounts per common share: Basic Diluted 2010 Net sales Gross profit Net income Amounts per common share: Basic Diluted Note Note Note Description Year Ended December 31, 2011: Allowances deducted from assets: Trade receivable allowances Inventory obsolescence reserve Tax valuation allowances Product warranty liability Year Ended December 31, 2010: Allowances deducted from assets: Trade receivable allowances Inventory obsolescence reserve Tax valuation allowances Product warranty liability Year Ended December 31, 2009: Allowances deducted from assets: Trade receivable allowances Inventory obsolescence reserve Tax valuation allowances Product warranty liability There were no changes in or disagreements with the 2013 reference into this Item 9A. 2013. Plan Category Equity compensation plans approved by security holders(1) Equity compensation plans not approved by security holders Total The following consolidated financial statement schedule of Park-Ohio Holdings Corp. is included in Item 8: 14, 2014 ExhibitItem No. Page 1. 1A. 1B. 2. 3. 4. 5. 6. 7. 7A. 8. 9. 9A. 9B. 10. 11. 12 13. 14 15. Aluminum ProductsAssembly Components and ManufacturedEngineered Products.TM™ services for a broad range of high-volume, specialty production components. Our Aluminum Products businessTotal Supply Management™ manages the efficiencies of every aspect of supplying production parts and materials to our customers’ manufacturing floor, from strategic planning to program implementation, and includes such services as engineering and design support, part usage and cost analysis, supplier selection, quality assurance, bar coding, product packaging and tracking, just-in-time and point-of-use delivery, electronic billing services and ongoing technical support. The principal customers of Supply Technologies are in the heavy-duty truck; automotive, truck and vehicle parts; power sports and recreational equipment; bus and coaches; electrical distribution and controls; agricultural and construction equipment; consumer electronics; HVAC; lawn and garden; semiconductor equipment; aerospace and defense; and plumbing. Assembly Components manufactures cast and machined aluminum components, automotive and our Manufacturedindustrial rubber and thermoplastic products, fuel filler and hydraulic assemblies for automotive, agricultural equipment, construction equipment, heavy-duty truck and marine equipment industries. Assembly Components also provides value-added services such as design and engineering, machining and assembly. Engineered Products business isoperates a major manufacturerdiverse group of highly-engineered industrial products. Ourniche manufacturing businesses serve large, industrialthat design and manufacture a broad range of high quality products engineered for specific customer applications. The principal customers of Engineered Products are original equipment manufacturers (“OEMs”) and end users in a variety of industrial sectors, including the automotiveferrous and vehicle parts,non-ferrous metals, silicon, coatings, forging, foundry, heavy-duty truck, industrialconstruction equipment, steel,automotive, oil and gas, rail electrical distribution and controls,locomotive manufacturing and aerospace and defense oilindustries.gas, power sports/fitness equipment, HVAC, electrical components, appliancerepresentatives. Intersegment sales are immaterial and semiconductor equipment industries.eliminated in consolidation and are not included in the financial results presented. Intersegment sales are accounted for at values based on market prices. Income allocated to segments excludes certain corporate expenses, interest expense, and certain other infrequent or unusual charges or credits. Identifiable assets by industry segment include assets directly identified with those operations. As of December 31, 20112013, we employed approximately 3,2005,000 persons.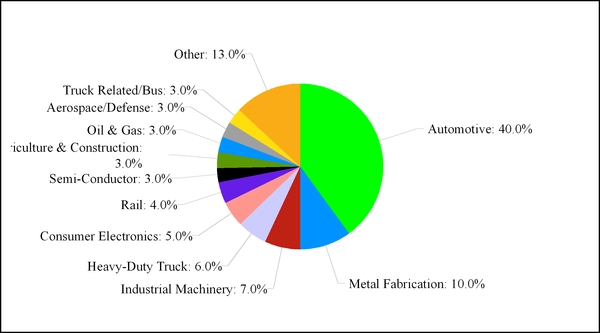
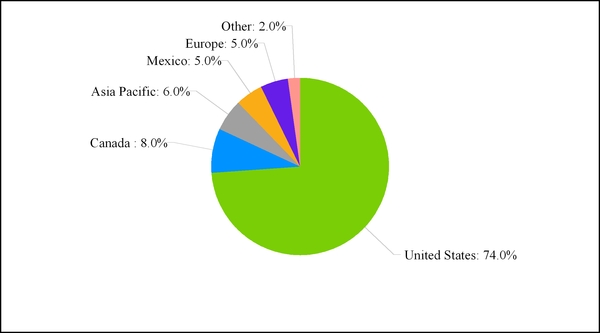
AluminumAssembly ComponentsEngineered Products Manufactured Products NET SALES FOR 20112013 493.0412.8 million51%34% of total) 127.0318.5 million13%27% of total)$346.6 million(36% of total)SELECTED PRODUCTS • Cooling modulesPinion housings • Injection molded rubber componentsSELECTED INDUSTRIES SERVED Power sports/fitnessAgricultural and construction equipmentElectrical components• Appliance• Semiconductor equipment• Recreational vehicles• Lawn and garden equipment • equipment TM™, a proactive solutions approach that manages the efficiencies of every aspect of supplying production parts and materials to our customers’ manufacturing floor, from strategic planning to program implementation. Total Supply ManagementTM™ includes such services as engineering and design support, part usage and cost analysis, supplier selection, quality assurance, bar coding, product packaging and tracking, just-in-time and point-of-use delivery, electronic billing services and ongoing technical support. We operate 4452 logistics service centers in the United States, Mexico, Canada, Puerto Rico, Scotland, Hungary, China, Taiwan, Singapore, India, United Kingdom and India,Ireland, as well as production sourcing and support centers in Asia. Through our supply chain management programs, we supply more than 190,000 globally-sourced production components, many of which are specialized and customized to meet individual customers’ needs.TM™ provides our customers with an expert partner in strategic planning, global sourcing, technical services, parts and materials, logistics, distribution and inventory management of production components. Some production components are characterized by low per unit supplier prices relative to the indirect costs of supplier management, quality assurance, inventory management and delivery to the production line. In addition, Supply Technologies delivers an increasingly broad range of higher-cost production components including valves, electro-mechanical hardware, fittings, steering components and many others. Applications engineering specialists and the direct sales force work closely with the engineering staff of OEM customers to recommend the appropriate production components for a new productrecently began providingalso provides spare parts and aftermarket products to end users of its customers’ products.TM™ services are typically provided to customers pursuant to sole-source arrangements. We believe our services distinguish us from traditional buy/sell distributors, as well as manufacturers who supply products directly to customers, because we outsource our customers’ high-volume production components supply chain management, providing processes customized to each customer’s needs and replacing numerous current suppliers with a sole-source relationship. Our highly-developed, customized, information systems provide transparency and flexibility through the complete supply chain. This enables our customers to: (1) significantly reduce the direct and indirect cost of production component processes by outsourcing internal purchasing, quality assurance and inventory fulfillment responsibilities; (2) reduce the amount of working capital invested in inventory and floor space; (3) reduce component costs through purchasing efficiencies, including bulk buying and supplier consolidation; and (4) receive technical expertise in production component selection and design and engineering. Our sole-source arrangements foster long-term, entrenched supply relationships with our customers and, as a result, the average tenure of service for our top 50 Supply Technologies clients exceeds six years. Supply Technologies’ remaining sales are generated through the wholesale supply of industrial products to other manufacturers and distributors pursuant to master or authorized distributor relationships.2011,2013, approximately 84%79% of Supply Technologies’ net sales were to domestic customers. Remaining sales were primarily to manufacturing facilities of large, multinational customers located in Canada, Mexico, Europe and Asia. Total Supply ManagementTM™ services and production components are used extensively in a variety of industries, and demand is generally related to the state of the economy and to the overall level of manufacturing activity.5,5006,500 customers domestically and internationally. The principal markets served by Supply Technologies are the heavy-duty truck; automotive, truck automotive and vehicle parts,parts; power sports and recreational equipment; bus and coaches; electrical distribution and controls, consumer electronics, power sports/fitness equipment, recreational vehicles, HVAC,controls; agricultural and construction equipment,equipment; consumer electronics; HVAC; lawn and garden; semiconductor equipment,equipment; aerospace and defense,defense; and appliance industries.plumbing. The five largest customers, within which Supply Technologies sells through sole-source contracts to multiple operating divisions or locations, accounted for approximately 27% and 26%31% of the sales of Supply Technologies for 2011both 2013 and 2010, respectively.2012. The loss of any two of its top five customers could have a material adverse effect on the results of operations and financial conditionscondition of this segment.The Company evaluated its long-lived assets to determine whether the carrying amount of such assets was recoverable in accordance with accounting guidance by comparing the carrying amount to the sum of the undiscounted cash flows expected to result from the use and eventual disposition of the assets. If the carrying value of the assets exceeded the expected cash flows, the Company estimated the fair value of these assets to determine whether an impairment existed. The Company recorded restructuring and asset impairment charges of $4.0 million during the fourth quarter of 2009. See Note O to the consolidated financial statements included elsewhere herein.TM™ services, including engineering and design support, part usage and cost analysis, supplier selection, quality assurance, bar coding, product packaging and tracking, just-in-time and point-of-use delivery, electronic billing services and ongoing technical support, and its geographic reach, extensive product selection, price and reputation for high service levels. Numerous North American and foreign companies compete with Supply Technologies in manufacturing cold-formed and cold-extruded products. During In November 2013, we acquired all the third quarteroutstanding capital stock of 2010, Supply Technologies completed the acquisition of certain assets and assumed specific liabilities relating to the Assembly Components Systems (“ACS”QEF Global Limited ("QEF") business of Lawson Products, Inc. for $16.0 million in cash and a $2.2 million subordinated promissory note payable in equal quarterly installments over three years. ACS. QEF is a provider of supply chain management solutions with four locations throughout Ireland, Scotland and England. QEF's net sales for the year ended December 31, 2012 totaled approximately $14.0 million.broad rangeprovider of production components throughsupply chain management solutions throughout the United Kingdom and Ireland. For its service centers throughout North America. Thefiscal year ended March 31, 2013, Henry Halstead generated net sales of approximately $24.0 million.recordedsold all of the outstanding equity interests of a non-core business unit in the Supply Technologies segment, for $8.5 million in cash, which resulted in a net gain of $2.2approximately $3.8 million, representing the excessafter taxes of $1.5 million. The business unit sold is a provider of high-quality machine to machine information technology solutions, products and services. As a result of the aggregate fair valuesale, this business had been removed from the Supply Technologies segment and presented as a discontinued operation for all of purchased netthe periods presented. Additionally, the assets overand liabilities of the purchase price. See Note C tobusiness are classified as held for sale under the caption other current assets and accrued expenses and other, respectively, in the Company's consolidated financial statements included elsewhere herein.Aluminum ProductsWebalance sheet as of December 31, 2012.that we areis one of the few aluminum component suppliers that has the capability to provide a wide range of high-volume, high-quality products utilizing a broad range of processes including gravity and low pressure permanent mold, die-cast and lost-foam, as well as emerging alternative casting technologies. Our abilityIn 2012, we added machining capabilities to offer our customers this comprehensive range ofcapabilities at a low cost provides us with a competitive advantage. We produce our aluminum components at six manufacturing facilities in Ohio, Indianaproducts service offerings. We also design and Georgia. Our Aluminum Products business casts Assembly Components manufactures cast aluminum components, automotive and machines aluminum engine, transmission, brake, suspensionindustrial rubber and other componentsthermoplastic products, fuel filler and hydraulic assemblies for automotive, agricultural equipment, construction equipment, heavy-duty truck and marine equipment OEMs, primarily on a sole-source basis. Aluminum Products’industries. Assembly Components’ principal products include front engine covers, cooling modules, control arms, knuckles, pump housings, clutch retainers and pistons, master cylinders, pinion housings, oil pans and flywheel spacers.spacers, injected molded rubber and silicone products, including wire harnesses, shock and vibration mounts, spark plug boots and nipples and general sealing gaskets, rubber and thermoplastic hose and fuel filler assemblies. We produce our Assembly Components at twenty-four manufacturing facilities in Ohio, Michigan, Indiana, Tennessee, Florida, Georgia, Mexico, China and the Czech Republic. In addition, we also provide value-added services such as design engineering, machining and part assembly. Although these parts are lightweight, they possess high durability and integrity characteristics even under extreme pressure and temperature conditions.Demand by automotive OEMs for aluminum castings has increased in recent years as they have sought lighter alternatives to steel and iron, primarily to increase fuel efficiency without compromising structural integrity. We believe that this replacement trend will continue as end-users and the regulatory environment require greater fuel efficiency.withinto which Aluminum ProductsAssembly Components sells to multiple operating divisions through sole-source contracts, accounted for approximately 59% and 57%45% of Aluminum ProductsAssembly Components sales for 2011both 2013 and 2010, respectively.2012. The loss of any one of these customers could have a material adverse effect on the results of operations and financial condition of this segment. Aluminum Products Assembly Components competes principally on the basis of its ability to: (1) engineer and manufacture high-quality, cost-effective, machined castingsassemblies utilizing multiple casting technologies in large volumes; (2) provide timely delivery; and (3) retain the manufacturing flexibility necessary to quickly adjust to the needs of its customers. There are few domestic companies with aluminum casting capabilities able to meet the customers’ stringent quality and service standards and lean manufacturing techniques. As one of these suppliers, Aluminum ProductsAssembly Components is well-positioned to benefit as customers continue to consolidate their supplier base. Principal competitors in the Assembly Components segment are Chassix, Martinrea and Stant. On September 30, 2010, Effective April 26, 2013, the Company enteredacquired certain assets and assumed specific liabilities relating to Bates Acquisition, LLC and Bates Real Estate Acquisition, LLC (collectively, “Bates”) for a Billtotal purchase consideration of Sale with Rome Die Casting LLC (“Rome”),$20.8 million in cash. The acquisition was funded from borrowings under the revolving credit facility provided by the Credit Agreement (as defined herein). Bates is a producerleading manufacturer of aluminum high pressure die castings, pursuant to which Rome agreed to transfer toextruded, formed and molded products and assemblies for the Company substantially alltransportation and industrial markets. Bates’ production facilities are located in Tennessee. The financial results of its assetsBates are included in exchange for approximately $7.5the Company’s Assembly Components segment and contributed $30.4 million in revenues and $2.2 million of notes receivable duenet income from Rome held by the Company. See Note C todate acquired through December 31, 2013. The acquisition was accounted for under the consolidated financial statements included elsewhere herein.acquisition method of accounting.ManufacturedManufacturedEngineered Products segment operates a diverse group of niche manufacturing businesses that design and manufacture a broad range of highly-engineered products, including induction heating and melting systems, pipe threading systems rubber products and forged and machined products. We manufacture these products in twelveeleven domestic facilities and tennine international facilities in Canada, Mexico, the United Kingdom, Belgium, Germany, China and Japan.49%57% of our induction heating and melting systems’ revenues are derived from the sale of replacement parts and provision of field service, primarily for the installed base of our own products. Our pipe threading business serves the oil and gas industry. We also engineer and install mechanical forging presses, sell spare parts and provide field service for the large existing base of mechanical forging presses and hammers in North America. We machine, induction harden and surface finish crankshafts and camshafts, used primarily in locomotives. We forge aerospace and defense structural components such as landing gears and struts, as well as rail products such as railcar center plates and draft lugs. We manufacture injection mold rubber and silicone products, including wire harnesses, shock and vibration mounts, spark plug boots and nipples and general sealing gaskets. We sell rubber products primarily to sub-assemblers in the automotive, food processing and consumer appliance industries.small- tosmall-to medium-sized domestic and international equipment manufacturers on the basis of service capability, ability to meet customer specifications, delivery performance and engineering expertise. We compete domestically and internationally with small- tosmall-to medium-sized forging and machining businesses on the basis of product quality and precision. We compete with other domestic small- to medium-sized manufacturers of injection molded rubber and silicone products primarily on the basis of price and product quality. During the fourth quarter of 2009, the Company evaluated its long-lived assets at one of its forging units to determine whether the carrying amount of such assets was recoverable in accordance with accounting guidance by comparing the carrying amount to the sum of undiscounted cash flows expected to result from the use and eventual disposition of the assets and recorded restructuring and asset impairment charges of $3.0 million in 2009. See Note O to the consolidated financial statements included elsewhere herein. On December 31, 2010, the Company through its subsidiary, Ajax Tocco Magnethermic acquiredCorporation (“ATM”) was the defendant in a lawsuit in the United States District Court for the Eastern District of Arkansas. The plaintiff is IPSCO Tubulars Inc. d/b/a TMK IPSCO. The complaint alleged claims for breach of contract, gross negligence and constructive fraud, and TMK IPSCO sought approximately $6.0 million in direct and $4.0 million in consequential damages as well as an unspecified amount of punitive damages. ATM denied the allegations against it, believes it has a number of meritorious defenses and vigorously defended the lawsuit. A motion for partial summary judgment filed by ATM that, among other things, denied the plaintiff's fraud claims was granted by the district court. The remaining claims were the subject of a bench trial in May 2013. At the close of TMK IPSCO's case, the court entered partial judgment in favor of ATM, dismissing the gross negligence claim, dismissing a portion of the breach of contract claim, and dismissing any claim for punitive damages. The trial proceeded with respect to the remainder of TMK IPSCO's claim for damages and, in September 2013, the district court awarded TMK IPSCO damages of approximately $5.2 million. ATM is appealing the court's decision. TMK IPSCO is also appealing the decision and, additionally, it has asked the court for $3.8 million in attorney's fees.the related induction heating intellectual propertyliabilities of ABP Induction’s U.S. heatinga small business, operating as Pillar Induction (“Pillar”) for $10.3which resulted in a pre-tax gain of $0.6 million in cash. Pillar provides complete turnkey automated induction power systems and aftermarket parts and service to a worldwide market. See Note C to the consolidated financial statements included elsewhere herein.As a result of incurred losses induring the third quarter of 2011, projected losses2013. The small business is engaged in the business of designing, manufacturing, selling, distributing and installing various tube bending machines and related tooling, spare and replacement parts and ancillary services for fiscal year 2011 and planned restructuring,commercial applications. The small business is included in our Engineered Products segment from the date of acquisition. The purchase price was not significant to the results of operations, financial condition or liquidity.evaluated the long-lived assetsentered into an agreement to sell 25% of its rubber productsSouthwest Steel Processing LLC, ("SSP") business unitto Arkansas Steel Associates, LLC for impairment. Based on management’s analysis, certain long-lived assets were deemed abandoned$5.0 million in cash. SSP is included in our Engineered Products segment. This transaction facilitates the Company's capacity expansion in one of its growing product lines.were written down to their scrap or liquidation value andVanadium (“Evraz”) arbitration proceeding for the Company recorded a chargesum of $5.4 million.Aluminum ProductsAssembly Components primarily markets and sells its products in North America through internal sales personnel and independent sales representatives. ManufacturedEngineered Products primarily markets and sells its products in North America through both internal sales personnel and independent sales representatives. Induction heating and pipe threading equipment is also marketed and sold in Europe, Asia, Latin America and Africa through both internal sales personnel and independent sales representatives. In some instances, the internal engineering staff assists in the sales and marketing effort through joint design and applications-engineering efforts with major customers.We areSupply Technologies is dependent upon the ability of such suppliers to meet stringent quality and performance standards and to conform to delivery schedules. Aluminum ProductsAssembly Components and ManufacturedEngineered Products purchase substantially all of their raw materials, principally metals and certain component parts incorporated into their products, from third-party suppliers and manufacturers. Most raw materials required by Aluminum ProductsAssembly Components and ManufacturedEngineered Products are commodity products available from several domestic suppliers. Management believes that raw materials and component parts other than certain specialty products are available from alternative sources.Aluminum Products’Assembly Components’ backlog as of any particular date is not a meaningful measure of sales for any future period as a significant portion of sales are on a release or firm order basis. The backlog of ManufacturedEngineered Products’ orders believed to be firm as of December 31, 20112013 was $226.7$145.3 million compared with $174.4$180.0 million as of December 31, 2010. Approximately $1.9 million2012. Predominantly all of theEngineered Products’ backlog as of December 31, 2011 is scheduled to be shipped after 2012. The remainder2013 is scheduled to be shipped in 2012.B2 to the consolidated financial statements included elsewhere herein relating to (1) net sales, income before income taxes, identifiable assets and other information by industry segment and (2) net sales and assets by geographic region for the years ended December 31, 2011, 20102013, 2012 and 20092011 is incorporated herein by reference.containedtechnology solutions, products and services. As a result of the sale, this business had been removed from the Supply Technologies segment and presented as a discontinued operation for all of the periods presented. Additionally, the assets and liabilities of the business are classified as held for sale under the caption other current assets and accrued expenses and other, respectively, in Note C, Note D, Note Oour consolidated balance sheet as of December 31, 2012.Note Passumed specific liabilities relating to Bates for a total purchase consideration of $20.8 million in cash. The acquisition was funded from borrowings under the revolving credit facility provided by the Credit Agreement (as defined herein). Bates is a leading manufacturer of extruded, formed and molded products and assemblies for the transportation and industrial markets. Bates’ production facilities are located in Tennessee. The financial results of Bates are included in our Assembly Components segment and contributed $30.4 million in revenues and $2.2 million of net income from the date acquired through December 31, 2013. The acquisition was accounted for under the acquisition method of accounting.consolidated financial statements included elsewhere hereinremainder of TMK IPSCO's claim for damages and, in September 2013, the district court awarded TMK IPSCO damages of approximately $5.2 million. ATM is incorporated herein by reference.On March 5, 2012,appealing the Companycourt's decision. TMK IPSCO is also appealing the decision and, additionally, it has asked the court for $3.8 million in attorney's fees.acquire Fluid Routing Solutions Holding Corp. (“FRS”),purchase certain assets and liabilities of a leading manufacturersmall business, which resulted in a pre-tax gain of industrial hose products and fuel filler and hydraulic fluid assemblies, in an all cash transaction valued at $97.5 million. FRS products include fuel filler, hydraulic, and thermoplastic assemblies and several forms of manufactured hose including bulk and formed fuel, power steering, transmission oil cooling, hydraulic, and thermoplastic hose. FRS sells to automotive and industrial customers throughout North America, Europe and Asia. FRS has five production facilities located in Florida, Michigan, Ohio, Tennessee and the Czech Republic. The transaction is expected to close by March 30, 2012 subject to a number of customary conditions, including the expiration of waiting periods and the receipt of approvals under Hart-Scott-Rodino Antitrust Improvements Act.On April 7, 2011, the Company completed the sale of $250$0.6 million aggregate principal amount of 8.125% senior notes due 2021 (the “Notes”). The Notes bear an interest rate of 8.125% per annum, payable semi-annually in arrears on April 1 and October 1 of each year commencing on October 1, 2011. The Notes mature on April 1, 2021. In connection with the sale of the Notes, the Company also entered into a fourth amended and restated credit agreement (the “Amended Credit Agreement”). The Amended Credit Agreement, among other things, provides an increased credit facility up to $200 million, extends the maturity date of the borrowings under the facility to April 7, 2016 and amends fee and pricing terms. Furthermore, the Company has the option,pursuant to the Amended Credit Agreement, to increase the availability under the revolving credit facility by $50 million. The Company also purchased all of its outstanding $183.8 million aggregate principal amount of 8.375% senior subordinated notes due 2014 (the “Senior Subordinated Notes”) that were not held by its affiliates pursuant to a tender offer and subsequent redemption, repaid all of the term loan A and term loan B outstanding under its then existing credit facility and retired the Senior Subordinated Notes in the aggregate principal amount of $26.2 million that were held by an affiliate. The Company incurred debt extinguishment costs related to premiums and other transaction costs associated with the tender offer and subsequent redemption of the Senior Subordinated Notes and wrote off deferred financing costs totaling $7.3 million and recorded a provision for foreign income taxes of $2.1 million resulting from the retirement of the Senior Subordinated Notes that were held by an affiliate.Duringduring the third quarter of 2011,2013. The small business is engaged in the Company recordedbusiness of designing, manufacturing, selling, distributing and installing various tube bending machines and related tooling, spare and replacement parts and ancillary services for commercial applications. The small business is included in our Engineered Products segment from the date of acquisition. The purchase price was not significant to the results of operations, financial condition or liquidity.asset impairment chargeagreement to sell 25% of $5.4our SSP business to Arkansas Steel Associates, LLC for $5.0 million associated with the underperformance of the assetsin cash. SSP is included in our Engineered Products segment. This transaction facilitates our capacity expansion in one of its rubber products business unit.Name Age Position Edward F. Crawford 74 Chairman of the Board, Chief Executive Officer and Director Matthew V. Crawford 44 President and Chief Operating Officer and Director W. Scott Emerick 49 Vice President and Chief Financial Officer Robert D. Vilsack 53 Secretary and General Counsel Patrick W. Fogarty 52 Director of Corporate Development The recentfinancial crisiseconomic conditions may have significant effects on our customers and suppliers that wouldcould result in material adverse effects on our business and operating results.The recent global financial crisis, which included, among other things, significantthe recentunfavorable global financial crisiseconomic conditions may materially adversely affect our suppliers’ access to capital and liquidity with which tothey maintain their inventories, production levels and product quality, which could cause them to raise prices or lower production levels.the recentadverse global financial crisiseconomic conditions are difficult to forecast and mitigate. As a consequence, our operating results for a particular period are difficult to predict, and, therefore, prior results are not necessarily indicative of results to be expected in future periods. Any of the foregoing effects could have a material adverse effect on our business, results of operations and financial condition.The recentfinancial crisiseconomic conditions may have significant effects on our customers that would result in our inability to borrow or to meet our debt service coverage ratio in our revolving credit facility.2011,2013, we were in compliance with our debt service coverage ratio covenant and other covenants contained in our revolving credit facility. While we expect to remain in compliance throughout 2012,2014, declines in demand in the automotive industry and in sales volumes could adversely impact our ability to remain in compliance with certain of these financial covenants. Additionally, to the extent our customers are adversely affected by thea decline in the economy in general, they may not be able to pay their accounts payable to us on a timely basis or at all, which would make the accounts receivable ineligible for purposes of the revolving credit facility and could reduce our borrowing base and our ability to borrow.power sports/fitnessrecreational equipment, HVAC, electrical components, appliance and semiconductor equipment industries, are affected by consumer spending, general economic conditions and the impact of international trade. A downturn in any of the industries we serve could have a material adverse effect on our financial condition, liquidity and results of operations.heavy-dutyheavy-duty truck industries are highly cyclical and may be adversely affected by international competition. In addition, the automotive and heavy-duty truck industries are significantly unionized and subject to work slowdowns and stoppages resulting from labor disputes. We derived 19%40% and 7%6% of our net sales during the year ended December 31, 20112013 from the automobileautomotive and heavy-duty truck industries, respectively.2011,2013, our ten largest customers accounted for approximately 26%28% of our net sales. Many of our customers place orders for products on an as-needed basis and operate in cyclical industries and, as a result, their order levels have varied from period to period in the past and may vary significantly in the future. Due to competitive issues, we have lost key customers in the past and may again in the future. Customer orders are dependent upon their markets and may be subject to delays or cancellations. As a result of dependence on our key customers, we could experience a material adverse effect on our business and results of operations if any of the following were to occur:During 2009, Chrysler’s U.S. operations, General Motor’s U.S. operations and Metaldyne Corporation filed for bankruptcy protection under Chapter 11 of the United States Bankruptcy Code. We have collected substantially all amounts that were due from Chrysler and General Motors as of the dates of the respective bankruptcy filings and as such there was no charge to earnings as a result of these bankruptcies. The account receivable from Metaldyne at the time of the bankruptcy was $4.2 million. We recorded a $4.2 million charge to reserve for the collection ofthe account receivable when Metaldyne announced it had completed the sale of substantially all of its assets to MD Investors Corporation, effectively making no payments to its unsecured creditors, including us.Aluminum ProductsAssembly Components and ManufacturedEngineered Products segments are product quality andourHoldings’ outstanding common stock and if at such time neither Mr. E. Crawford nor Mr. M. Crawford holds the office of chairman, chief executive officer or president. The loss of the services of Messrs. E. Crawford and M. Crawford, senior and executive officers, and/or other key individuals could have a material adverse effect on our financial condition, liquidity and results of operations.IT technologies,information technology, services and products into our business, diversion of management’s attention, the assumption of unknown liabilities, increases in our indebtedness, the failure to achieve the strategic objectives of those acquisitions and other unanticipated problems, some or all of which could materially and adversely affect us. The processAluminum ProductsAssembly Components and ManufacturedEngineered Products businesses could be interrupted for a variety of reasons, including availability and pricing. Prices for raw materials necessary for production have fluctuated significantly in the past and significant increases could adversely affect our results of operations and profit margins. While we generally attempt to pass along increased raw materials prices to our customers in the form of price increases, there may be a time delay between the increased raw materials prices and our ability to increase the price of our products, or we may be unable to increase the prices of our products due to pricing pressure or other factors.2011,2013, we were a party to seveneight collective bargaining agreements with various labor unions that covered approximately 400650 full-time employees. Our inability to negotiate acceptable contracts with these unions could result in, among other things, strikes, work stoppages or other slowdowns by the affected workers and increased operating costs as a result of higher wages or benefits paid to union members. If the unionized workers were to engage in a strike, work stoppage or other slowdown, or other employees were to become unionized, we could experience a significant disruption of our operations and higher ongoing labor costs, which could have a material adverse effect on our business, financial condition and results of operations.for example out offrom, among other things, discovery of previously unknown conditions or more aggressive enforcement actions, could adversely affect our results of operations, and there is no assurance that they will not exceed our reserves or have a material adverse effect on our financial condition.willcould be materially affected.Aluminum ProductsAssembly Components and ManufacturedEngineered Products segments. We depend on our information systems to process orders, manage inventory and accounts receivable collections, purchase products, maintain cost-effective operations, route and re-route orders and provide superior service to our customers. We cannot assure you that a disruption in the operation of our information systems used by Supply Technologies, including the failure of the supply chain management software to function properly, or those used by Aluminum ProductsAssembly Components and ManufacturedEngineered Products will not occur. Any such disruption could have a material adverse effect on our financial condition, liquidity and results of operations.A1 to the consolidated financial statements included elsewhere herein.ourHoldings’ outstanding common stock and their interests may conflict with yours.February 29, 2012,December 31, 2013, Edward Crawford, our Chairman of the Board and Chief Executive Officer, and Matthew Crawford, our President and Chief Operating Officer, collectively beneficially owned approximately 27%26% of ourHoldings’ common stock. Mr. E. Crawford is Mr. M. Crawford’s father. Their interests could conflict with your interests. For example, if we encounter financial difficulties or are unable to pay our debts as they mature, the interests of Messrs. E. Crawford and M. Crawford may conflict with your interests as a shareholder.interests.2011,2013, our operations included numerous manufacturing and supply chain logistics services facilities located in 26 states in the United States and in Puerto Rico, as well as in Asia, Canada, Europe and Mexico. Approximately 88% of the available square footage wasWe lease our world headquarters located in Cleveland, Ohio, which includes the United States. Approximately 45%world headquarters for certain of the available square footage was owned. As of December 31, 2011, approximately 31% of the available domestic square footage was used by the Supply Technologies segment, 49% was used by the Manufactured Products segmentour businesses. We believe our manufacturing, logistics and 20% was used by the Aluminum Products segment. Approximately 50% of the available foreign square footage was used by the Supply Technologies segment and 50% was used by the Manufactured Products segment. In the opinion of management, ourcorporate office facilities are generally well maintainedwell-maintained and are suitable and adequate, for their intended uses.2011. SUPPLY TECHNOLOGIES(1) Cleveland, OH Leased 60,450 (2) Supply Technologies Corporate Office Dayton, OH Leased 70,600 Logistics Lawrence, PA Leased 116,000 Logistics and Manufacturing Minneapolis, MN Leased 87,100 Logistics Allentown, PA Leased 43,800 Logistics Atlanta, GA Leased 56,000 Logistics Memphis, TN Leased 48,750 Logistics Louisville, KY Leased 30,000 Logistics Chicago, IL Leased 51,000 Logistics Tulsa, OK Leased 40,000 Logistics Lenexa, KS Leased 67,400 Logistics Austin, TX Leased 30,000 Logistics Streetsboro, OH Leased 45,000 Logistics Mississauga, Ontario, Canada Leased 145,000 Manufacturing Solon, OH Leased 47,100 Logistics Dublin, VA Leased 40,000 Logistics Delaware, OH Owned 45,000 Manufacturing Conneaut, OH(3) Leased/Owned 258,300 Manufacturing Huntington, IN Leased 132,000 Manufacturing Fremont, IN Owned 112,000 Manufacturing Wapakoneta, OH Owned 188,000 Manufacturing Rootstown, OH Owned 209,300 Manufacturing Ravenna, OH Owned 70,000 Manufacturing Cuyahoga Hts., OH Owned 427,000 Manufacturing Cicero, IL Owned 450,000 Manufacturing Le Roeulx, Belgium Owned 120,000 Manufacturing Wickliffe, OH Owned 110,000 Manufacturing Brookfield, WI Leased 116,000 Manufacturing Warren, OH Owned 195,000 Manufacturing Canton, OH Leased 125,000 Manufacturing Madison Heights, MI Leased 128,000 Manufacturing Newport, AR Leased 200,000 Manufacturing Cleveland, OH Leased 150,000 Manufacturing Location Use SUPPLY Mississauga, Ontario, Canada Leased 145,000 Manufacturing TECHNOLOGIES (1) Lawrence, PA Leased 116,000 Logistics and Manufacturing Minneapolis, MN Leased 87,100 Logistics Dayton, OH Leased 70,600 Logistics Cleveland, OH (2) Leased 60,450 Supply Technologies Corporate Office Carol Stream, IL Leased 51,000 Logistics Memphis, TN Leased 48,750 Logistics Solon, OH Leased 47,100 Logistics Streetsboro, OH Leased 45,000 Manufacturing Allentown, PA Leased 43,800 Logistics Suwanee, GA Leased 42,500 Logistics Dublin, VA Leased 40,000 Logistics Tulsa, OK Leased 40,000 Logistics Lenexa, KS Leased 29,500 Logistics ASSEMBLY Ocala, FL Owned 433,000 Manufacturing COMPONENTS Conneaut, OH (4) Leased/Owned 283,800 Manufacturing Lexington, TN Owned 240,000 Manufacturing Lobelville, TN (5) Owned 208,700 Manufacturing Rootstown, OH Owned 208,000 Manufacturing Cleveland, OH (3) Leased/Owned 190,000 Manufacturing Wapakoneta, OH Owned 188,000 Manufacturing Huntington, IN Leased 124,500 Manufacturing Fremont, IN Owned 112,000 Manufacturing Big Rapids, MI Owned 97,000 Manufacturing Ravenna, OH Owned 69,000 Manufacturing Delaware, OH Owned 45,000 Manufacturing Bedford, OH Leased 43,300 Manufacturing ENGINEERED Cicero, IL Owned 450,000 Manufacturing PRODUCTS (6) Cuyahoga Heights, OH Owned 427,000 Manufacturing Newport, AR Owned 200,000 Manufacturing Warren, OH Owned 195,000 Manufacturing Madison Heights, MI Leased 128,000 Manufacturing Canton, OH Leased 124,000 Manufacturing La Roeulx, Belgium Owned 120,000 Manufacturing Brookfield, WI Leased 116,000 Manufacturing Wickliffe, OH Owned 110,000 Manufacturing Albertville, AL Leased 56,000 Office Cortland, OH Owned 30,000 Office and Manufacturing (1) Supply Technologies has other facilities, none of which is deemed to be a principal facility. (2) Includes 20,150 square feet used by Holdings’ and Park-Ohio’s corporate office. (3) Includes twoone leased property with 150,000 square feet and one owned property with 40,000 square feet.(4) Includes three leased properties with square footage of 91,800, 64,000 and 64,000, respectively,45,700 and twoone owned propertiesproperty with 82,300 and 20,200 square feet, respectively.feet.(4)Manufactured(5) Includes five facilities, which make up the total square footage of 208,700. (6) Engineered Products has other owned and leased facilities, none of which is deemed to be a principal facility. at as of December 31, 2011:260269 cases asserting claims on behalf of approximately 1,140609 plaintiffs alleging personal injury as a result of exposure to asbestos. These asbestos cases generally relate to production and sale of asbestos-containing products and allege various theories of liability, including negligence, gross negligence and strict liability, and seek compensatory and, in some cases, punitive damages.plaintiff’splaintiff's injury, if any.Oneour subsidiaries, Ajax Tocco Magnethermic (“ATM”),Arkansas. The plaintiff is IPSCO Tubulars Inc. d/b/a party to a binding arbitration proceeding pending in South Africa with one of its customers, Evraz Highveld Steel and Vanadium (“Evraz”).TMK IPSCO. The arbitration involves a dispute over the design and installation of a melting furnace. Evraz sought binding arbitration in September of 2011complaint alleged claims for breach of contract, gross negligence and seeks compensatoryconstructive fraud, and TMK IPSCO sought approximately $10.0 million in damages as well as an unspecified amount of$37.0$5.2 million as well as fees. ATM is appealing the court’s decision. TMK IPSCO is also appealing the decision and, expenses relatedadditionally, it has asked for $3.8 million in attorney's fees.arbitration. ATM intends to counterclaim arbitration, alleging breach of contract for non-payment in the amount of $2.7 million as well as fees and expenses relatedstaff’s subpoena, we disclosed to the arbitration. We believe we have meritorious defensesstaff of the SEC that, in November 2007, the third party participated in a payment on behalf of us to these claimsa foreign tax official that implicates the Foreign Corrupt Practices Act (“FCPA”).vigorously defend such allegations.cooperate fully with the SEC and the DOJ in connection with their investigations of the third party and with the SEC in light of our disclosure. We are unable to predict the outcome or impact of the special committee’s investigation or the length, scope or results of the SEC’s review or the impact, if any, on our results of operations.Item 4A. Executive Officersthe RegistrantInformation with respect to the executive officers of the Company as of March 15, 2012 is as follows:NameAgePositionEdward F. Crawford72Chairman of the Board, Chief Executive Officer and DirectorMatthew V. Crawford42President and Chief Operating Officer and DirectorJeffrey L. Rutherford51Vice President and Chief Financial OfficerRobert D. Vilsack51Secretary and General CounselPatrick W. Fogarty50Director of Corporate DevelopmentMr. E. Crawfordhas been a director and our Chairman of the Board and Chief Executive Officer since 1992. He has also served as the Chairman of Crawford Group, Inc., a management company for a group of manufacturing companies, since 1964.Mr. M. Crawfordhas been President and Chief Operating Officer since 2003 and joined us in 1995 as Assistant Secretary and Corporate Counsel. He was also our Senior Vice President from 2001 to 2003. Mr. M. Crawford became one of our directors in August 1997 and has served as President of Crawford Group, Inc. since 1995. Mr. E. Crawford is the father of Mr. M. Crawford.Mr. Rutherfordhas been Vice President and Chief Financial Officer since joining us in July 2008. From 2007 until his employment with us, Mr. Rutherford served as Senior Vice President, Chief Financial Officer of UAP Holding Corp., an independent distributor of agricultural inputs and professional non-crop products. Mr. Rutherford previously served as President and Chief Executive Officer of Lesco, Inc., a provider of professional turf care products and a divisionof John Deere & Co., from 2005 to 2007, and as Lesco’s Chief Financial Officer from 2002 to 2005. From 1998 to 2002, he was the Senior Vice President, Treasurer and Chief Financial Officer of OfficeMax, Inc., an office products company. Prior to joining Office Max, he spent fourteen years with the accounting firm Arthur Andersen & Co.Mr. Vilsackhas been Secretary and General Counsel since joining us in 2002. From 1999 until his employment with us, Mr. Vilsack was engaged in the private practice of law. From 1997 to 1999, Mr. Vilsack was Vice President, General Counsel and Secretary of Medusa Corporation, a manufacturer of Portland cement, and prior to that he was Vice President, General Counsel and Secretary of Figgie International Inc., a manufacturing conglomerate.Mr. Fogartyhas been Director of Corporate Development since 1997 and served as Director of Finance from 1995 to 1997.Item 5.Market for the Registrant’s Common Equity, Related Stockholder Matters and Issuer Purchases of Equity SecuritiesThe Company’s2011. There is no present intention to pay dividends.2013. Additionally, the terms of the Company’scredit agreement governing our revolving credit facility and the indenture governing the Notes restrict8.125% senior notes due 2021 provide some restrictions on the Company’s ability to payamounts of dividends.Quarterly Common Stock Price Ranges 2011 2010 High Low High Low $ 24.48 $ 16.95 $ 9.96 $ 5.69 24.40 17.46 16.40 8.80 23.27 10.95 15.66 10.01 20.29 10.59 23.70 12.77 Quarterly Common Stock Price Ranges 2013 2012 Quarter High Low High Low 1st $ 33.35 $ 19.96 $ 21.00 $ 16.13 2nd 39.00 30.61 22.61 16.85 3rd 38.75 31.29 22.88 16.42 4th 53.32 36.19 23.21 18.33 the Company’sour common stock as of February 29, 201228, 2014 was 561.the Company’srepurchases of our common stock repurchases during the fourth quarter of the fiscal year ended December 31, 2011. Total
Number
of Shares
Purchased Average
Price Paid
Per Share Total Number
of Shares
Purchased as
Part of Publicly
Announced Plans Maximum Number of Shares
That May Yet Be Purchased
Under the Plans or Program(1) -0- $ -0- -0- 340,920 79,427 19.05 -0- 340,920 -0- -0- -0- 340,920 79,427 $ 19.05 -0- 340,920 Period Total Number of Shares Purchased Average Price Paid Per Share Total Number of Shares Purchased as Part of Publicly Announced Plans (1) Maximum Number of Shares That May Yet Be Purchased Under the Plans or Program (1) October 1 — October 31, 2013 — $ — — 988,334 November 1 — November 30, 2013 3,714 (2) 38.47 — 988,334 December 1 — December 31, 2013 — — — 988,334 Total 3,714 $ 38.47 — 988,334 (1) On September 27, 2006, the CompanyMarch 4, 2013, we announced a share repurchase program whereby the Companywe may repurchase up to 1.0 million shares of itsour outstanding common stock. During the fourth quarter of 2011, no shares were purchased as part of this program.(2) ConsistConsists of 3,714 shares of common stock the Companywe acquired from recipients of restricted stock awards at the time of vesting of such awards in order to settle recipient minimum withholding tax liabilities.(Dollars in thousands, except per share data) Year Ended December 31, 2011 2010 2009 2008 2007 $ 966,573 $ 813,522 $ 701,047 $ 1,068,757 $ 1,071,441 799,248 679,425 597,200 919,297 912,337 167,325 134,097 103,847 149,460 159,104 105,582 91,755 87,786 105,546 98,679 -0- -0- -0- 95,763 -0- -0- -0- -0- -0- (2,299 ) 5,359 3,539 5,206 25,331 -0- 56,384 38,803 10,855 (77,180 ) 62,724 -0- -0- (6,297 ) (6,232 ) -0- -0- (2,210 ) -0- -0- -0- 32,152 23,792 23,189 27,869 31,551 24,232 17,221 (6,037 ) (98,817 ) 31,173 (5,203 ) 2,034 (828 ) 20,986 9,976 $ 29,435 $ 15,187 $ (5,209 ) $ (119,803 ) $ 21,197 $ 2.54 $ 1.34 $ (.47 ) $ (10.88 ) $ 1.91 $ 2.45 $ 1.29 $ (.47 ) $ (10.88 ) $ 1.82 Year Ended December 31, 2011 2010 2009 2008 2007 $ 35,861 $ 67,059 $ 43,865 $ 8,547 $ 31,466 (11,098 ) (29,851 ) (4,772 ) (20,398 ) (21,991 ) 17,927 (24,995 ) (33,820 ) 15,164 (16,600 ) 16,177 17,132 18,918 20,933 20,611 11,098 3,951 5,575 17,466 21,876 $ 78,001 $ 35,311 $ 23,098 $ 17,825 $ 14,512 291,454 219,193 222,748 252,873 270,939 61,810 68,783 76,631 90,642 105,557 613,940 552,532 502,268 619,220 769,189 347,580 316,213 333,997 374,646 360,049 65,442 46,375 22,810 12,755 171,478 Year Ended December 31, 2013 2012 2011 2010 2009 (In millions, except per share data) Selected Statement of Operations Data: Net sales $ 1,203.2 $ 1,128.2 $ 961.4 $ 808.9 $ 696.6 992.2 920.9 793.7 674.0 592.3 Gross profit 211.0 207.3 167.8 134.9 104.3 Selling, general and administrative expenses 119.3 113.4 102.2 88.3 82.8 — — 5.4 3.5 5.2 Litigation judgment and settlement costs 5.2 13.0 — — — Operating income 86.5 80.9 60.1 43.1 16.3 Gain on purchase of 8.375% senior subordinated notes — — — — (6.3 ) Gain on acquisition of business (0.6 ) — — (2.2 ) — Interest expense 26.8 26.4 32.2 23.8 23.2 Income (loss) from continuing operations before income taxes 60.3 54.5 27.9 21.5 (0.6 ) Income tax expense (benefit) 19.4 20.3 (3.8 ) 2.0 (0.8 ) Net income from continuing operations 40.9 34.2 31.7 19.5 0.2 Income (loss) from discontinued operations, net of taxes 3.0 (2.4 ) (2.3 ) $ (4.3 ) $ (5.4 ) Net income (loss) 43.9 31.8 29.4 15.2 (5.2 ) Net income attributable to noncontrolling interest (0.5 ) — — — — Net income (loss) attributable to ParkOhio common shareholders $ 43.4 $ 31.8 $ 29.4 $ 15.2 $ (5.2 ) Earnings (loss) per common share attributable to ParkOhio common shareholders - Basic: Continuing operations $ 3.40 $ 2.87 $ 2.74 $ 1.72 $ 0.02 Discontinued operations $ 0.25 $ (0.20 ) $ (0.20 ) $ (0.38 ) $ (0.49 ) Total $ 3.65 $ 2.67 $ 2.54 $ 1.34 $ (0.47 ) Earnings (loss) per common share attributable to ParkOhio common shareholders - Diluted: Continuing operations $ 3.31 $ 2.82 $ 2.64 $ 1.65 $ 0.02 Discontinued operations $ 0.25 $ (0.20 ) $ (0.19 ) $ (0.36 ) $ (0.49 ) Total $ 3.56 $ 2.62 $ 2.45 $ 1.29 $ (0.47 ) Weighted-average shares used to compute earnings per share: Basic 11.9 11.9 11.6 11.3 11.0 Diluted 12.2 12.1 12.0 11.8 11.0 (a)Adjusted to reflect the discontinued operations. In each of the years ended December 31, 2011, 2010, 2009, 2008 and 2007,2009, we recorded restructuring and asset impairment charges related to exiting product lines and closing or consolidating operating facilities. The restructuringAny charges related to the write-down of inventory, have no cash impact and are reflected by an increase in cost of products sold in the applicable period. The restructuring charges relating to asset impairment attributable to the closing or consolidating of operating facilities have no cash impact and are reflected in the restructuring and asset impairment charges. The charges for restructuring and severance are accruals for cash expenses. We made cash payments of $.1 million, $.5$0.1 million and $.3$0.5 million in the years ended December 31, 2010 2009 and 2007,2009, respectively, related to our severance accrued liabilities. The table below provides a summary of these restructuring and impairment charges. Year Ended December 31, 2011 2010 2009 2008 2007 (Dollars in thousands) $ -0- $ -0- $ 1,797 $ 5,544 $ 2,214 5,359 3,539 5,206 24,767 -0- -0- -0- -0- 564 -0- $ 5,359 $ 3,539 $ 7,003 $ 30,875 $ 2,214 $ 5,359 $ 3,539 $ 5,206 $ 25,331 $ -0- Year Ended December 31, 2011 2010 2009 (In millions) Non-cash charges: Cost of products sold (inventory write-down) $ — $ — $ 1.8 Asset impairment 5.4 3.5 5.2 Restructuring and severance — — — Total $ 5.4 $ 3.5 $ 7.0 Charges reflected as restructuring and impairment charges on income statement $ 5.4 $ 3.5 $ 5.2 Year Ended December 31, 2013 2012 2011 2010 2009 (In millions) Other Financial Data: Net cash flows provided by operating activities $ 60.3 $ 55.9 $ 35.9 $ 67.1 $ 43.9 Net cash flows used by investing activities (54.3 ) (120.3 ) (11.1 ) (29.9 ) (4.8 ) Net cash flows provided (used) by financing activities 3.9 30.5 17.9 (25.0 ) (33.8 ) Depreciation and amortization 19.2 18.0 16.2 17.1 18.9 Capital expenditures, net 22.7 23.3 11.1 4.0 5.6 Cash and cash equivalents $ 55.2 $ 44.4 $ 78.0 $ 35.3 $ 23.1 Working capital 298.3 273.5 293.8 222.5 227.3 Property, plant and equipment 115.4 100.0 61.4 68.4 76.2 Total assets 818.7 726.6 614.8 552.5 502.3 Long-term debt 379.2 374.2 346.2 302.4 323.1 Total debt 383.6 378.6 347.6 316.2 334.0 Shareholders’ equity 164.0 101.8 65.4 46.4 22.8 2011.Item 7.Management’s Discussion and Analysis of Financial Condition and Results of Operationsunusualimpairment charges in 2011, 2010acquisitions and 2009 acquisitionslitigation costs in 20102013 and 2012, dispositions in 2013 and a refinancing in 2011.Executive OverviewManagementTMManagement™ and diversified manufacturing business, operating in three segments: Supply Technologies, Aluminum ProductsAssembly Components and ManufacturedEngineered Products.ManagementTMManagement™, a proactive solutions approach that manages the efficiencies of every aspect of supplying production parts and materials to our customers’ manufacturing floor, from strategic planning to program implementation. Total Supply ManagementTMManagement™ includes such services as engineering and design support, part usage and cost analysis, supplier selection, quality assurance, bar coding, product packaging and tracking, just-in-time and point-of-use delivery, electronic billing services and ongoing technical support. The principal customers ofOur Supply Technologies arebusiness services customers in the following principal industries: heavy-duty truck; automotive, truck automotive and vehicle parts,parts; power sports and recreational equipment; bus and coaches; electrical distribution and controls, consumer electronics, power sports/fitness equipment, HVAC,controls; agricultural and construction equipment,equipment; consumer electronics; HVAC; lawn and garden; semiconductor equipment, plumbing,equipment; aerospace and defense,defense; and appliance industries. Aluminum Products castsplumbing.machinesassemblies and provides value-added design, engineering and assembly services that are incorporated into our customer’s end products. Our product offerings include cast and machined aluminum engine, transmission, brake, suspension and other components, such as pump housings, clutch retainers/pistons, control arms, knuckles, master cylinders, pinion housings, brake calipers, oil pans and flywheel spacers forspacers; industrial hose and injected molded rubber components; and fuel filler assemblies. Our products are primarily used in the following industries: automotive, agricultural, equipment, construction, equipment, heavy-duty truck and marine original equipment OEMs,manufacturers (“OEMs”), primarily on a sole-source basis. Aluminum Products also provides value-added services such as design and engineering and assembly. Manufacturedinjection molded rubber components, and forged and machined products. ManufacturedEngineered Products also produces and provides services and spare parts for the equipment it manufactures. The principal customers of ManufacturedEngineered Products are OEMs, sub-assemblers and end users in the steel,ferrous and non-ferrous metals, silicon, coatings, forging, foundry, heavy-duty truck, construction equipment, bottling, automotive, oil and gas, raillocomotive and locomotiverail manufacturing, and aerospace and defense industries. Sales, earnings and other relevant financial data for these three segments are provided in Note B to thefinancial statements, included elsewhere herein.Sales and profitability continued to grow substantially in 2011, continuing the trend of the prior year, as the domestic and international economies come out of the recession. Net sales increased 19% and net income increased 94% in 2011 compared to 2010. Net income in 2011 was affected by a $16.8 million reversal of the deferred tax asset valuation allowance, $5.4 million of restructuring and impairment charges and debt refinancing costs of $7.3 million.During the fourth quarter of 2009, the Company recorded $7.0 million of asset impairment charges associated with general weakness in the economy including the railroad industry.2013 results: charges were composed of $1.8 million of inventory impairment included in Cost of Products Sold and $5.2 million for impairment of property and equipmentIn 2009, the Company recorded a gain of $6.3 million on the purchase of $15.2 million principal amount of the Senior Subordinated Notes.Approximately 19% of the Company’s consolidated net sales are to the automotive markets. In 2009, the Company recorded a charge of $4.2 million to fully reserve for the account receivable from Metaldyne resulting from its bankruptcy.During the third quarter of 2010, Supply Technologies completed the acquisition of certain assetsgrowth in 2013 principally was driven by strategic acquisitions in 2012 and assumed specific liabilities relating to the ACS business of Lawson Products, Inc. for $16.0 million in cash and a $2.2 million subordinated promissory note payable in equal quarterly installments over three years. ACS is a provider of supply chain management solutions for a broad range of production components through its service centers throughout North America. The Company recorded a gain of $2.2 million representing the excess of the aggregate fair value of purchased net assets over the purchase price. See Note C to the consolidated financial statements included elsewhere herein.September 30, 2010, the Company entered a Bill of Sale with Rome, a producer of aluminum high pressure die castings, pursuant to which Rome agreed to transfer to the Company substantially all of its assets in exchange for approximately $7.5 million of notes receivable due from Rome held by the Company. See Note C to the consolidated financial statements included elsewhere herein.On December 31, 2010, the Company through its subsidiary, Ajax Tocco Magnethermic, acquired the assets and the related induction heating intellectual property of Pillar for $10.3 million in cash. Pillar provides complete turnkey automated induction power systems and aftermarket parts and service to a worldwide market. See Note C to the consolidated financial statements included elsewhere herein.During the third quarter of 2010, the Company recorded an asset impairment charge of $3.5 million related to the writedown of one of its investments.On April 7, 2011,March 23, 2012, the Company completed the salea transformational acquisition of $250 million aggregate principal amount of the Notes. The Notes bear an interest rate of 8.125% per annum, payable semi-annually in arrears on April 1 and October 1 of each year commencing on October 1, 2011. The Notes mature on April 1, 2021. In connection with the sale of the Notes, the Company also entered into the Amended Credit Agreement. The Amended Credit Agreement among other things, provides an increased credit facility up to $200 million, extends the maturity date of the borrowings under the facility to April 7, 2016 and amends fee and pricing terms. Furthermore, the Company has the option, pursuant to the Amended Credit Agreement, to increase the availability under the revolving credit facility by $50 million. The Company also purchased all of its outstanding $183.8 million aggregate principal amount of the Senior Subordinated Notes that were not held by its affiliates pursuant to a tender offer and subsequent redemption, repaid all of the term loan A and term loan B outstanding under its then existing credit facility and retired the Senior Subordinated Notes in the aggregate principal amount of $26.2 million that were held by an affiliate. The Company incurred debt extinguishment costs related to premiums and other transaction costs associated with the tender offer and subsequent redemption of the Senior Subordinated Notes and wrote off deferred financing costs totaling $7.3 million and recorded a provision for foreign income taxes of $2.1 million resulting from the retirement of the Senior Subordinated Notes that were held by an affiliate.During the third quarter of 2011, the Company recorded an asset impairment charge of $5.4 million associated with the underperformance of the assets of its rubber products business unit.On March 5, 2012, the Company entered into an agreement to acquire FRS,Fluid Routing Solutions Holding Corp. (“FRS”), a leading manufacturer of automotive and industrial rubber and thermoplastic hose products and fuel filler and hydraulic fluid assemblies, in an all cash transaction valued at $97.5 million.The transactionFRS is expected to close by March 30, 2012 subject to a number of customary conditions, including the expiration of waiting periods and the receipt of approvals under Hart-Scott-Rodino Antitrust Improvements Act. The transaction is expected to be funded byincluded in the Company’s cashAssembly Components segment. In 2013, $43.2 million of $40.0 million ($10.0 million domestic and $30.0 million foreign), a new $25.0 million seven-year amortizing term loan secured by certain real estate and machinery and equipmentincremental revenues were generated for the additional nearly full quarter of operations that FRS contributed to consolidated results in 2013.which the Company has received a commitment lettertotal purchase consideration of $20.8 million in cash. The acquisition was funded from its bank group and $32.5 million of borrowings under the Company’s revolving credit facility.Resultsfacility provided by the Credit Agreement (as defined herein). Bates is a leading manufacturer of Operations2011 versus 2010Net Sales by Segment: Year Ended
December 31, Change Percent
Change 2011 2010 (Dollars in millions) $ 493.0 $ 402.1 $ 90.9 23 % 127.0 143.7 (16.7 ) (12 )% 346.6 267.7 78.9 29 % $ 966.6 $ 813.5 $ 153.1 19 % Net sales increased $153.1 million to $966.6extruded, formed and molded products and assemblies for the transportation and industrial markets. Bates’ production facilities are located in Tennessee. The business has been integrated into our Assembly Components segment and the financial results of Bates are included in the Assembly Components Segment results. The Bates acquisition contributed approximately $30.4 million in 2011 compared to $813.5revenues for 2013 during the period of our ownership.2010the aggregate for these two businesses, which are subject to insignificant deferred and contingent purchase price consideration, respectively. Henry Halstead and QEF results, which include approximately $8.5 million in net sales, are included in our Supply Technologies segment results from their respective dates of acquisition.Company experienced volume increasesstrength of new automotive platform business in our Aluminum business within the Assembly Components segment was offset by industrial slowness for the truck and defense industries in the Supply Technologies segment and Manufacturedthe capital equipment business of the industrial equipment business in the Engineered Products segments.segment. 2013 vs. 2012 2012 vs. 2011 2013 2012 2011 $ Change % Change $ Change % Change (Dollars in millions, except per share data) Net sales $ 1,203.2 $ 1,128.2 $ 961.4 $ 75.0 7 % $ 166.8 17 % Cost of sales 992.2 920.9 793.7 71.3 8 % 127.2 16 % Gross profit 211.0 207.3 167.8 3.7 2 % 39.5 24 % Gross profit as a percentage of net sales 17.5 % 18.4 % 17.5 % Selling, general and administrative expenses 119.3 113.4 102.2 5.9 5 % 11.2 11 % SG&A as a percentage of net sales 9.9 % 10.1 % 10.6 % Restructuring and asset impairment charges — — 5.4 — — % (5.4 ) * Litigation judgment and settlement costs 5.2 13.0 — (7.8 ) * 13.0 * Operating income 86.5 80.9 60.1 5.6 7 % 20.8 35 % Gain on acquisition of business (0.6 ) — — (0.6 ) * — — % Interest expense 26.8 26.4 32.2 0.4 2 % (5.8 ) (18 )% Income from continuing operations before income taxes 60.3 54.5 27.9 5.8 11 % 26.6 95 % Income tax expense (benefit) 19.4 20.3 (3.8 ) (0.9 ) (4 )% 24.1 * Net income from continuing operations 40.9 34.2 31.7 6.7 20 % 2.5 8 % Income (loss) from discontinued operations, net of taxes 3.0 (2.4 ) (2.3 ) 5.4 * (0.1 ) (4 )% Net income 43.9 31.8 29.4 12.1 38 % 2.4 8 % Net income attributable to noncontrolling interest (0.5 ) — — (0.5 ) * — — % Net income attributable to ParkOhio common shareholders $ 43.4 $ 31.8 $ 29.4 $ 11.6 36 % $ 2.4 8 % Earnings (loss) per common share attributable to ParkOhio common shareholders - Basic: Continuing operations $ 3.40 $ 2.87 $ 2.74 $ 0.53 18 % $ 0.13 5 % Discontinued operations 0.25 (0.20 ) (0.20 ) 0.45 * — — % Total $ 3.65 $ 2.67 $ 2.54 $ 0.98 37 % $ 0.13 5 % Earnings (loss) per common share attributable to ParkOhio common shareholders - Diluted: Continuing operations $ 3.31 $ 2.82 $ 2.64 $ 0.49 17 % $ 0.18 7 % Discontinued operations 0.25 (0.20 ) (0.19 ) 0.45 * (0.01 ) 5 % Total $ 3.56 $ 2.62 $ 2.45 $ 0.94 36 % $ 0.17 7 % 23%$71.3 million, or 8%, to $992.2 million in 2013, compared to $920.9 million in 2012. The increase in cost of sales was primarily due to volume ($53.8 million) increasesthe increase in net sales volumes, which increased 7%. The gross profit margin percentage was 17.5% in 2013 compared to 18.4% in 2012. This 90 basis point decline in gross margin percentage is largely due to a change in the heavy-duty truck, electrical, industrial equipment, auto, power sports, HVAC, furniture, agricultural and construction equipment industries and price increasessales mix between the comparable periods as the Assembly Components net sales, carrying a lower gross margin percentage, were a higher percentage of $7.3 million, which were offset primarily by declinesconsolidated net sales than in the instruments, medical and semi-conductor industries. In addition, there were $29.8prior year.sales resulting fromexpense associated with FRS, Bates, Henry Halstead and QEF, increases in payroll, payroll related expenses and share-based compensation offset by FRS acquisition expenses of $1.1 million in 2012. Year Ended December 31, 2013 2012 Change (Dollars in millions) Interest expense $ 26.8 $ 26.4 $ 0.4 2 % Debt extinguishment costs included in interest expense $ — $ 0.3 $ (0.3 ) (100 )% Average outstanding borrowings $ 385.5 $ 379.2 $ 6.3 2 % Average borrowing rate 6.95 % 6.88 % 7 basis points ACS business. Aluminum Products sales decreased 12%, resulting primarily from the completion of certain automotive supply contracts ($31.7 million) offset by sales of $9.6 million resulting from the acquisition of the Rome business and price increases of $5.4 million. Manufactured Products sales increased 29%effective tax rate is primarily due to our ability to realize certain deductions, such as the Manufacturer’s Deduction, now that our net operating loss carryforwards were utilized in 2012 combined with the reversal of valuation allowances against certain U.S. net deferred tax assets in 2013 that reduced tax expense by $1.6 million.capital equipment andincome of $0.5 million attributable to the noncontrolling interest is deducted from net income to derive net income attributable to ParkOhio common shareholders.units offset by a minor declineunit and 4% increased volume in the rubber productsindustrial equipment business unit. In addition, there were $26.3 million of incremental sales resulting fromacquisition of Pillar.Products SoldSales & Gross Profit: Year Ended
December 31, Change Percent
Change 2011 2010 (Dollars in millions) $ 799.2 $ 679.4 $ 119.8 18 % $ 167.3 $ 134.1 $ 33.2 25 % 17.3 % 16.5 % products soldsales increased $119.8$127.2 million, or 16%, to $920.9 million for 2012, compared to $793.7 million in 2011 to $799.2 million compared to $679.4 million in 2010, while gross margin increased to 17.3% in 2011 from 16.5% in 2010.2011. Cost of products sold increased primarily due to sales increases and increasesthe inclusion of FRS results of $125.7 million in commodity prices, including2012.prices17.4% gross profit margin in the prior year. Supply Technologies gross margin increased primarily due to product mix. Engineered Productsincreases.increases and the resulting favorable absorption of overhead. Gross margin in the Aluminum ProductsAssembly Components segment decreasedincreased primarily due to the favorable margins realized from reduced sales volume. Gross margin in the Supply Technologies segment was essentially unchanged from 2010.Selling, General & Administrative (SG&A) Expenses: Year Ended
December 31, Change Percent
Change 2011 2010 (Dollars in millions) $ 105.6 $ 91.8 $ 13.8 15 % 10.9 % 11.3 % 15%11% in 20112012 compared to 2011; however, SG&A expenses as a percentage of sales declined by 50 basis points to 10.1%. SG&A expenses increased in 2012 compared to the same period in 2010. SG&A expenses increased $13.8 million in 2011 compared to 2010prior year primarily due to increased sales volume and to$7.6 million of incremental expense associated with FRS, increases in payroll and payroll related expenses of $8.2$1.9 million, FRS acquisition expenses of $1.1 million and legal expenses of $1.0 million associated with the Evraz litigation settlement.$3.4the write down of underperforming assets in its rubber products business unit.of incremental expenses resulting from the acquisitions of ACS, Rome and Pillar. Year Ended
December 31, Change Percent
Change 2011 2010 (Dollars in millions) $ 32.2 $ 23.8 $ 8.4 35% $ 7.3 $ 1.9 $ 1.9 $ 337.3 $ 322.0 $ 15.3 5% 7.38 % 7.39 % (1) basis point Year Ended December 31, Adjusted Adjusted 2012 2011 Change (Dollars in millions) Interest expense $ 26.4 $ 32.2 $ (5.8 ) (18 )% Debt extinguishment costs included in interest expense $ 0.3 $ 7.3 $ (7.0 ) (96 )% Average outstanding borrowings $ 379.2 $ 337.3 $ 41.9 12 % Average borrowing rate 6.88 % 7.38 % 50 basis points increased $8.4decreased $5.8 million in 2012 compared to 2011, primarily due to higher debt extinguishment costs in 2011 as a result of the refinancing of our Senior Subordinated Notes and the amendment of the Credit Agreement. Average borrowings in 2012 were higher when compared to 2011 due to additional borrowings to fund the acquisition of FRS and the Evraz litigation settlement. The lower average borrowing rate in 2012 was due primarily to the interest rate mix of our credit facility and Notes when compared to the interest rate mix in 2011.compared to 2010, primarily due to debt extinguishment costs of $7.3 million related to premiums and other transaction costs associated with the tender and early redemption and write off of deferred financing costs associated with the Senior Subordinated Notes. Excluding these costs, interest increased due primarily to outstanding borrowings.Income Tax: Year Ended
December 31, 2011 2010 (Dollars in millions) $ 24.2 $ 17.2 $ (5.2 ) $ 2.0 (21.5 )% 11.6 % The Company released $16.8 million of the valuation allowance attributable to continuing operations in 2011 compared to $5.8 million in 2010. a 13.6% effective income tax rate benefit.the Company waswe were not in a cumulative three-year loss position and determined that it was more likely than not that its U.S.our U. S. net deferred tax assets would be realized. As of December 31, 2010,2011, we released $16.8 million of the Company determined that it was not more likely than not that its net U.S. and certain foreign deferred tax assets would be realized.The provision for income taxes was $(5.2) millionvaluation allowance attributable to continuing operations in 2011 compared to $2.0 million in 2010. The effective income tax rate was (21.5)% in 2011 compared to 11.6% in 2010.The Company’s2011.20112012 and 2010, and may preclude substantial payments in 2012.2011. At December 31, 2011,2012, we had fully utilized the Company had net operating loss carryforwards for U.S. federal income tax purposespurposes.expire between 2024reconcile to consolidated income from continuing operations before income taxes by deducting corporate costs that are not attributable to the segments, litigation judgment and 2031.2010 versus 2009The proportion of consolidated revenues and segment operating income attributed to each segment was as follows: Year Ended December 31, 2013 2012 2011 Revenues: Supply Technologies 39 % 43 % 50 % Assembly Components 34 % 27 % 16 % Engineered Products 27 % 30 % 34 % Segment Operating Income: Supply Technologies 31 % 33 % 43 % Assembly Components 28 % 18 % 2 % Engineered Products 41 % 49 % 55 % 2013 vs. 2012 2012 vs. 2011 2013 2012 2011 $ Change % Change $ Change % Change (Dollars in millions) Net sales $ 471.9 $ 483.8 $ 481.4 $ (11.9 ) (2 )% $ 2.4 — % Segment operating income 35.9 37.9 35.1 (2.0 ) (5 )% 2.8 8 % Segment operating income margin 7.6 % 7.8 % 7.3 % Sales by Segment:Sales: Year Ended
December 31, Change Percent
Change 2010 2009 (Dollars in millions) $ 402.1 $ 328.8 $ 73.3 22 % 143.7 111.4 32.3 29 % 267.7 260.8 6.9 3 % $ 813.5 $ 701.0 $ 112.5 16 % Consolidated The decrease in net sales increased $112.5 million to $813.5 millionin 2013 compared to $701.0 million in 2009 aswith the Company experienced volume increases in each segment. Supply Technologies sales increased 22%prior year was primarily due to a 13% decline in volume increasesassociated with the heavy-duty truck market and a 25% decline in volume associated with the defense industry market combined with the exit of low margin business approximating $11.0 million. These unfavorable impacts to revenues were partially offset by approximately $8.5 million in sales from our two fourth quarter acquisitions, Henry Halstead and QEF, greater volume in our power sports and recreational equipment market of 7% and increased tooling sales in our small fastener manufacturing division.industry, automotive, semi-conductor,market, which reflected an increase of 19%, and the power sports and recreational equipment market, which increased 22%, were significantly offset by the exit of low margin business in the appliance and HVAC agriculturalmarket, which combined to be $13.0 million, and construction equipment industries.by other sales declines in other industrial markets. 2013 vs. 2012 2012 vs. 2011 2013 2012 2011 $ Change % Change $ Change % Change (Dollars in millions) Net sales $ 412.8 $ 304.0 $ 157.8 $ 108.8 36 % $ 146.2 93 % Segment operating income 31.8 19.9 1.4 11.9 60 % 18.5 * Segment operating income margin 7.7 % 6.5 % 0.9 % there were $16.9 million of sales resulting from the acquisition of the ACS business. These additions were offset by declines in the lawn and garden and medical industries. Aluminum Products salesaluminum business revenues increased 29% as volumesnew programs with our automotive customers were launched in 2013. In total, approximately 72% of our revenue growth is attributable to acquisitions and the remainder of the growth is organic. 2013 vs. 2012 2012 vs. 2011 2013 2012 2011 $ Change % Change $ Change % Change (Dollars in millions) Net sales $ 318.5 $ 340.4 $ 322.2 $ (21.9 ) (6 )% $ 18.2 6 % Segment operating income 47.1 55.0 45.3 (7.9 ) (14 )% 9.7 21 % Segment operating income margin 14.8 % 16.2 % 14.1 % auto industry along with additionalindustrial equipment business was just 2% less in 2013 compared to 2012. Offsetting these net sales from new contracts. In addition, there were $7.0 million of sales resulting from the acquisition of the Rome business. Manufactured Productsdeclines, our forging business demand continued to be very strong in 2013 led by our rail business, and net sales increased 3% primarily from increases7% over the prior year.capitalindustrial equipment and rubber products business units partially offset by declining volume inunit and the forged and machined products business unit because of volume declinesunit. The 4% increase in the railroad industry. Approximately 24%volumes of the Company’s consolidated net sales are to the automotive markets. Net sales to the automotive markets as a percentage of salesindustrial equipment business was entirely driven by segmentwere approximately 15%, 77% and 8% for the Supply Technologies, Aluminum Products and Manufactured Products Segments, respectively for the year ended December 31, 2010.Cost of Products Sold & Gross Profit: Year Ended
December 31, Change Percent
Change 2010 2009 (Dollars in millions) $ 679.4 $ 597.2 $ 82.2 14 % $ 134.1 $ 103.8 $ 30.3 29 % 16.5 % 14.8 % Cost of products sold increased $82.2 million in 2010 to $679.4 million compared to $597.2 million in 2009, primarily due tovolume increases in sales volume, while gross margin increased to 16.5% in 2010 from 14.8% in the same periodaftermarket business of 2009.Supply Technologies and Aluminum Products gross margin increased resulting from volume increases while gross margin in the Manufactured Products segment remained essentially unchanged from the prior year.SG&A: Year Ended
December 31, Change Percent
Change 2010 2009 (Dollars in millions) $ 91.8 $ 87.8 $ 4.0 5 % 11.3 % 12.5 % Consolidated SG&A expenses increased $4.0 million to $91.8 million in 2010 compared to $87.8 million in 2009 representing a 120 basis point decrease in SG&A expenses as a percent of sales. SG&A expenses increased on a dollar basis in 2010 compared to 2009 primarily due to an increase in salaries and benefits levels resulting from restoration to 2008 salary levels along with a bonus accrual12%, slightly offset by a $4.2 million charge4% decrease in 2009 for a reserve for an account receivable from a customercapital equipment volume. In addition, our forging business demand was very strong in bankruptcy2012 led by our rail business, and an increasenet sales increased 15% over the prior year.pension income.Interest Expense: Year-Ended
December 31, Change Percent
Change 2010 2009 (Dollars in millions) $ 23.8 $ 23.2 $ .6 3 % $ 322.0 $ 363.9 $ (41.9 ) (11.5 )% 7.39 % 6.38 % 101 basis points Interest expense2012 increased $.6 million in 201021% compared to 2009, primarilywith 2011 due to a higher average borrowing rate during 2010, offset by lower average borrowings. The decreasethe volume increases in average borrowings in 2010 resulted primarily from earningsthe aftermarket business for the industrial equipment business and the reduction in working capital requirements. The higher average borrowing rate in 2010 was due primarily to increased interest rates under our revolving credit facility compared to 2009.Impairment Charges:During 2010, the Company reviewed one of its investments and determined there was diminution in value and therefore recorded an asset impairment charge of $3.5 million.During 2009, the Company recorded asset impairment charges totaling $5.2 million associated with general weakness in the economy, including the railroad industry.During 2008, the Company recorded goodwill impairment charges of $95.8 million. The Company also recorded asset impairment charges of $25.3 millionvolume increases associated with the volume declines and volatility in the automotive markets, loss from the disposal of a foreign subsidiary and restructuring expenses associated with the Company’s exit from its relationship with its largest customer, Navistar, along with realignment of its distribution network.Gain on Purchase of Senior Subordinated Notes:In 2009, the Company recorded a gain of $6.3 million on the purchase for $8.9 million of $15.2 million aggregate principal amountforging business unit. Because of the Senior Subordinated Notes.In 2008, the Company purchased $11.0 million aggregate principal amountexcellent utilization of the Senior Subordinated Notes for $4.7 million. After writing off $.1 million of deferred financing costs, the Company recorded a net gain of $6.2 million. The Senior Subordinated Notes were not contributedour capacity in 2012, our segment operating margin increased 210 basis points to Park-Ohio Industries, Inc. in 2008 but were held by Holdings. During the fourth quarter of 2009, these notes were sold to a wholly-owned foreign subsidiary of Park-Ohio Industries, Inc.Income Taxes:16.2%. Year Ended
December 31, 2010 2009 (Dollars in
millions) $ 17.2 $ (6.0 ) $ 2.0 $ (.8 ) 11.6 % 13 % The Company released $5.8 million of the valuation allowance attributable to continuing operations in 2010 compared to $1.8 million in 2009. As of December 31, 2010 and 2009, the Company determined that it was not more likely than not that its net U.S. and certain foreign deferred tax assets would be realized.The provision for income taxes was $2.0 million in 2010 compared to $(.8) million in 2009. The effective income tax rate was 11.6% in 2010, compared to 13% in 2009.The Company’s net operating loss carryforward precluded the payment of most U.S. federal income taxes in both 2010 and 2009. At December 31, 2010, the Company had net operating loss carryforwards for U.S. federal income tax purposes of approximately $24.7 million, which will expire between 2023 and 2029. 2013 2012 (Dollars in millions) Cash and cash equivalents $ 55.2 $ 44.4 Working capital $ 298.3 $ 273.5 Current ratio 2.51 2.43 Debt as a % of capitalization 70 % 79 % Net debt as a % of capitalization 61 % 70 % 2013 2012 2011 Cash provided (used) by: (In millions) Operating activities $ 60.3 $ 55.9 $ 35.9 Investing activities (54.3 ) (120.3 ) (11.1 ) Financing activities 3.9 30.5 17.9 Effect of exchange rate changes on cash 0.9 0.3 — Increase (decrease) in cash and cash equivalents $ 10.8 $ (33.6 ) $ 42.7 long-term debt securities. On April 7, 2011, we completed the sale of $250.0 million aggregate principal amount of Senior Notes. The Senior Notes bear an interest rate of 8.125% per annum payable semi-annually in arrears on April 1 and October 1 of each year. The Senior Notes mature on April 1, 2021.a revolving credit facilitythe Credit Agreement with a group of banks which, as subsequently amended, matures at April 7, 20162016. Pursuant to the Credit Agreement, we may borrow or issue standby letters of credit or commercial letters of credit. On March 23, 2012, the Credit Agreement was amended and as amended, currently providesrestated to, among other things, increase the revolving loan commitment from $200.0 million to $220.0 million, and provide a term loan for availability of up to $200$25.0 million subject to an asset-based formula.that is secured by certain real estate and machinery and equipment. We have the option to increase the availability under the revolving loan portion of the credit facility by $50.0$30.0 million. The revolving credit facility is secured by substantially all our accounts receivable and inventory in the United States and Canada. Borrowings from this revolving credit facility will be used for general corporate purposes.As of December 31, 2011, the Company had $93.0 million outstanding Amounts borrowed under the revolving credit facility and approximately $68.1 millionmay be borrowed at either (i) LIBOR plus 1.75% to 2.75% or (ii) the bank’s prime lending rate minus 0.25% to 1.00%, at the Company's election. The LIBOR-based interest rate isavailability.On March 5, 2012,base formula provides borrowing availability to the Company entered into an agreementbased on percentages of eligible accounts receivable and inventory. On April 3, 2013, the Credit Agreement was amended to acquire FRS, a leading manufacturer of industrial hose productsincrease the advance rate on eligible accounts receivable and fuel filler and hydraulic fluid assemblies, in an all cash transaction valued at $97.5 million. FRS products include fuel filler, hydraulic, and thermoplastic assemblies and several forms of manufactured hose including bulk and formed fuel, power steering, transmission oil cooling, hydraulic and thermoplastic hose. FRS sells to automotive and industrial customers throughout North America, Europe and Asia. FRS has five production facilities located in Florida, Michigan, Ohio, Tennessee andinventory. Interest on the Czech Republic. The transaction is expected to close by March 30, 2012 subject to a number of customary conditions, including the expiration of waiting periods and the receipt of approvals under Hart-Scott-Rodino Antitrust Improvements Act. The transaction is expected to be funded by the Company’s cash of $40.0 million ($10.0 million domestic and $30.0 million foreign), a new $25.0 million seven-year amortizing term loan secured by certain real estate and machinery and equipment ofis at either (i) LIBOR plus 2.75% or (ii) the Company for whichbank’s prime lending rate plus 0.25%, at the Company has receivedCompany's election. The term loan is amortized based on a commitment letter from its bank group and $32.5 million of borrowings underseven-year schedule with the Company’s revolving credit facility.loan portion ofcredit facility provided by the credit facilityCredit Agreement is based on the Company’sour ability to meet a debt service ratio covenant, which could be materially impacted by negative economic trends. Failure to meet the debt service ratio could materially impact the availability and interest rate of future borrowings.In 2009, the Company purchased $15.2 million aggregate principal amount of the 8.375% Notes for $8.9 million. After writing off $.1 million of deferred financing costs, the Company recorded a net gain of $6.3 million.The Companyitsour outstanding debt through cash purchases and/or exchanges for equity securities, in open market purchases, privately negotiated transactions or otherwise. ItWe may also repurchase shares of itsour outstanding common stock. Any such actions will depend on prevailing market conditions, our liquidity requirements, contractual restrictions and other factors. The amounts involved may be material.the Company’sour ability to replace, in a timely manner, maturingthe Companywe may be forced to delay raising capital or pay unattractive interest rates, which could increase itsour interest expense, decrease itsour profitability and significantly reduce its financial flexibility.$61.2$40.0 million and $33.7 million at December 31, 20112013 and 2010, respectively.$42.2 million at December 31, 2012. For each of itsour foreign subsidiaries, the Company makeswe make a determination regarding the amount of earnings intended for permanent reinvestment, with the balance, if any, available to be repatriated to the United States. The cash held by foreign subsidiaries for permanent reinvestment is generally used to finance the foreign subsidiaries’ operational activities and/or future foreign investments. At December 31, 2011,2013, management believed that sufficient liquidity was available in the United States, and it is our current intention to permanently reinvest undistributed earnings of our foreign subsidiaries outside of the United States. However, the Company is contemplating intercompany financing arrangements from foreign subsidiaries that may result in adverse U.S. federal income tax consequences. OtherwiseAlthough we have no intention to repatriate the approximately $80.8$82.6 million of undistributed earnings of our foreign subsidiaries, as of December 31, 2011,2013, if we were to repatriate these earnings, there would potentially be an adverse tax impact.2011, the Company’s2013, our debt service coverage ratio was 2.2,1.5, and, therefore, it waswe were in compliance with the debt service coverage ratio covenant contained in the revolving credit facility. The Company wasfacility provided by the Credit Agreement. We were also in compliance with the other covenants contained in the revolving credit facility as of December 31, 2011.2013. The debt service coverage ratio is calculated at the end of each fiscal quarter and is based on the most recently ended four fiscal quarters of consolidated EBITDA minus cash taxes paid, minus unfunded capital expenditures, plus cash tax refunds to consolidated debt charges whichthat are consolidated cash interest expense plus scheduled principal payments on indebtedness plus scheduled reductions in our term debt as defined in the revolving credit facility.Credit Agreement. The debt service coverage ratio must be greater than 1.0 and not less than 1.1 for any two consecutive fiscal quarters. While we expect to remain in compliance throughout 2012,2014, declines in sales volumes in 20122014 could adversely impact our ability to remain in compliance with certain of these financial covenants. Additionally, to the extent our customers are adversely affected by declines in the economy in general, they may not be able to pay their accounts payable to us on a timely basis or at all, which would make the accounts receivable ineligible for purposes of the revolving credit facility and could reduce our borrowing base and our ability to borrow under such facility. We expect to remain in compliance throughout 2012.2.652.51 at December 31, 20112013, versus 2.282.43 at December 31, 2010.2012. Working capital increased by $72.2$24.8 million to $291.4$298.3 million at December 31, 20112013, from $219.2$273.5 million at December 31, 2010.2012. Accounts receivable increased $13.5$5.3 million to $139.9$165.7 million in 2011 at December 31, 2013, from $126.4$160.4 million in 2010 primarily the result of the increase in sales volume in 2011. Inventory increased by $9.5 million in 2011 to $202.0 million from $192.5 million in 2010 at December 31, 2012, primarily resulting from the acquisitions in 2013. Inventory increased by $5.8 million at December 31, 2013, to $221.4 million from $215.6 million at December 31, 2012, primarily resulting from $6.8 million of increases associated with the acquisitions in 2013 offset by some planned inventory reductions. Accounts payable increased$10.2 million to $112.0 million at December 31, 2013 from $101.8 million at December 31, 2012, primarily resulting from $6.2 million ofdue to sales volume increases.associated with the 2013 acquisitions and the timing of payments at December 31, 2013. Accrued expenses increaseddecreased by $14.2$3.7 million to $73.7$79.9 million in 2011 at December 31, 2013, from $59.5$83.6 million in 2010 at December 31, 2012, primarily resulting from an increasea reduction in advance billings partially offset by the accrued liabilities of $7.0the 2013 acquisitions of $6.2 million. an to $60.3 million in 2013 compared to $55.9 million in 2012. The increase in accrued interest of $2.6 million resulting from the terms of the payments of interest due on the Notes, an increase in accrued salaries, wages and benefits of $2.0 million and an increase in accrued professional fees of $2.6 million and accounts payable increased $3.9 million to $99.6 million in 2011 from $95.7 million in 2010.During 2011, the Company provided $35.9 million from operating activities as compared to providing $67.1 million in 2010. The decrease in cash provision of $31.2 millionflows was primarily the result of increases in net income in 2013 compared to 2012 of $12.1 million, offset by an increase in net working capitalgains on sales of businesses and assets and gains of acquisitions of $6.4 million. compared to decreases of $32.8million in 2010 offset by an increase in net income of $14.2 million. During 2011,$2.4 million and an increase in deferred taxes of $20.3 million, offset by the Company investednon-cash expenses added back to reconcile net income to net cash provided by operating activities for debt extinguishment costs of $7.3 million and restructuring and asset impairment charges of $5.4 million in 2011.expenditures whichexpenditure spending for 2012 and 2013 compared to 2011 were offset byprimarily associated with growth capital spending in the receiptaluminum business of $1.6 millionthe Assembly Components segment.property. Theseassets of $14.2 million, primarily associated with the $8.5 million sale of the outstanding equity interests of a non-core business unit in the Supply Technologies segment and the $5.0 million sale of a 25% interest in the SSP business in the Engineered Products segment.plus cash interestof $3.9 million in 2013 primarily consisted of net borrowings on debt instruments of $4.9 million, offset by financing activities related to stock compensation.taxredeemed the 8.375% senior subordinated notes due 2014 for $189.6 million. In addition, net payments of $31.6 million, a net increase in borrowings ofon other debt instruments totaled $34.8 million the issuance of the Notes, and purchases of treasury stock of $2.1 million, resulted in an increase in cash of $42.7 million in 2011.During 2010, the Company provided $67.1 million from operating activities as compared to providing $43.9 million in 2009. The increase in cash provision of $23.2 million was primarily the result of net income of $15.2 million in 2010 compared to a net loss of $5.2 million in 2009 (a change of $20.4 million) and net working capital decreases of $33.7 million in 2010 compared to $30.7 million in 2009 offset by a reduction in depreciation and amortization of $1.8 million in 2010 compared to 2009. During 2010, the Company also invested $4.0 million in capital expenditures and made acquisitions for $25.9 million in cash. These activities, plus cash interest and tax payments of $24.5 million, a reduction in borrowings of $19.9 million, purchase of treasury stock of $1.1 million and debt issue costs of $4.1 million resulted in an increase of cash of $12.2 million in 2010.2011,2013, none were outstanding. We currently have no other derivative instruments.2011: Payments Due or Commitment Expiration Per
Period Total Less Than
1 Year 1-3 Years 3-5 Years More than
5 Years $ 347,580 $ 1,415 $ 1,000 $ 94,000 $ 251,165 196,816 22,368 44,639 43,216 86,593 42,840 12,784 14,847 7,436 7,773 131,084 130,701 383 -0- -0- 17,502 2,282 4,191 3,739 7,290 15,705 10,109 2,141 3,455 -0- $ 751,527 $ 179,659 $ 67,201 $ 151,846 $ 352,821 Payments Due or Commitment Expiration Per Period (In millions) Total 1-3 Years 3-5 Years Long-term debt obligations $ 383.6 $ 4.4 $ 127.8 $ 1.2 $ 250.2 147.2 20.3 40.6 40.6 45.7 Operating lease obligations 50.1 13.5 20.3 12.3 4.0 Purchase obligations 165.3 165.2 0.1 — — 14.7 1.9 3.5 3.1 6.2 Standby letters of credit and bank guarantees 19.1 10.9 8.2 — — Total $ 780.0 $ 216.2 $ 200.5 $ 57.2 $ 306.1 (1) Interest obligations are included on the Notes only and assume the notesNotes are paid at maturity. The calculation of interest on debt outstanding under our revolving credit facility and other variable rate debt ($1.92.9 million based on 2.04%2.21% average interest rate and outstanding borrowings of $93.0$129.7 million at December 31, 2011)2013) is not included above due to the subjectivity and estimation required.(2) Postretirement obligations include projected postretirement benefit payments to participants only through 2021.2023.H10 to the consolidated financial statements included elsewhere herein, since the Company The Company recognizes We recognize revenue, other than from long-term contracts, when title is transferred to the customer, typically upon shipment. Revenue from long-term contracts (approximately 12%9% of consolidated revenue) is accounted for under the percentage of completion method, and recognized on the basis of the percentage each contract’s cost to date bears to the total estimated contract cost. Revenue earned on contracts in process that are in excess of billings, is classified in other current assetsunbilled contract revenue in the accompanying consolidated balance sheet. The Company’sBillings that are in excess of revenue earned on contracts in process are classified in accrued expenses on the accompanying balance sheet. Our revenue recognition policies are in accordance with the SEC’s Staff Accounting Bulletin (“SAB”) No. 104, “Revenue Recognition.”Allowance for Doubtful Accounts: Accounts receivable have been reduced by an allowance for amounts that may become uncollectible in the future. Allowances are developed by the individual operating units based on historical losses, adjusting for economic conditions. Our policy is to identify and reserve for specific collectability concerns based on customers’ financial condition and payment history. The establishment of reserves requires the use of judgment and assumptions regarding the potential for losses on receivable balances.Equipment”,Equipment,” management performs impairment tests of long-lived assets, including property and equipment, whenever an event occurs or circumstances change that indicate that the carrying value may not be recoverable or the useful lifethe Companywe estimated the fair value of these assets by using appraisals or recent selling experience in selling similar assets or for certain assets with reasonably predicablepredictable cash flows by performing discounted cash flow analysis using the same discount rate used as the weighted average cost of capital in the respective goodwill impairment analysis to estimate fair value when market information wasn’twas not available to determine whether an impairment existed. Certain assets were abandoned and written down to scrap or appraised value. The CompanyWe recorded $7.0 million and $5.4 million of asset impairment charges in 2009 and 2011 respectively, based on appraisals and scrap values. See Note O15 to the consolidated financial statements included elsewhere herein.Restructuring: We recognize costsBusiness Combinations, Goodwill and Indefinite-Lived Assets: Business combinations are accounted for using the purchase method of accounting. This method requires the Company to record assets and liabilities of the business acquired at their estimated fair market values as of the acquisition date. Any excess of the cost of the acquisition over the fair value of the net assets acquired is recorded as goodwill. The Company uses valuation specialists to perform appraisals and assist in accordance with ASC 420, “Exitthe determination of the fair values of the assets acquired and liabilities assumed. These valuations require management to make estimates and assumptions.Disposal Cost Obligations”. Detailed contemporaneous documentation is maintained and updated on a quarterly basis to ensure that accruals are properly supported. If management determines that there is aeconomic conditions deteriorate soon after an acquisition, it could result in the impairment of the acquired goodwill. A change in macroeconomic conditions in the United States or Europe, as well as future changes in the judgments, assumptions and estimates that were used in the Company's goodwill impairment testing for these three reporting units, including the discount rate and future cash flow projections, could result in a significantly different estimate of the accruals are adjusted to reflect the changes.Goodwill:fair value.—- Goodwill and Other” (“ASC 350”), management performs impairment testing of goodwill and indefinite-lived assets at least annually, as of October 1 of each year, or more frequently if impairment indicators arise. In September 2011,FASB issued ASU 2011-08, which amendscarrying amount of the rules for testingreporting unit to its estimated fair value. To the extent that the carrying value of the reporting unit exceeds its estimated fair value, step two is performed, where the reporting unit’s carrying value of goodwill for impairment. Underis compared to the new rules, an entity has the option to first assess qualitative factors to determine whether the existence of events or circumstances leads to a determination that it is more likely than not that theimplied fair value of a reporting unit is less than itsgoodwill. To the extent that the carrying amount. If, after assessingvalue of goodwill exceeds the totality of events or circumstances, an entity determines it is not more likely than not that theimplied fair value of a reporting unit is less than its carrying amount, then performing the two-step impairment test is unnecessary. The Company early adopted ASU 2011-08 for its October 1, 2011 annual goodwill, impairment test.a reportablean operating segment pursuant to ASC 280, “Segment Reporting”, or one level below the reportable operating segment (component level) as determined by the availability of discrete financial information that is regularly reviewed by operating segment management or an aggregate of component levels of a reportablean operating segment having similar economic characteristics. The Company completedassessmentprovisions of Accounting Standards Update (“ASU”) No. 2011-8, “Intangibles - Goodwill and Other (Topic 350): Testing Goodwill for Impairment,” which allows companies to assess qualitative factors to determine if goodwill might be impaired and whether it is necessary to perform the two-step goodwill impairment test. Based on a review of various qualitative factors, as set forth in ASC 350, management concluded that the goodwill for the Industrial Equipment reporting unit was not impaired and that the two-step approach was not required to be performed for this reporting unit. Based on a review of various qualitative factors, management concluded that the goodwill for the Aluminum Products reporting unit would be tested under the two-step approach. In 2011, we prepared the quantitative goodwill impairment analysis by comparing the estimated fair value of the qualitative factors and determined that there was no impairment with respectAluminum Products reporting unit to the Capital Equipment reporting unit’s goodwill. With respect to aluminum products, managementits carrying value. Management determined fair value through the use of a discounted cash flow valuation model incorporating discount rates commensurate with the risks involved for the reporting unit. If the calculated fair value is less than the carrying value, impairment of the reporting unit may exist. The use of a discounted cash flow valuation model to determine estimated fair value is common practice in impairment testing insetdetermined by using the weighted average cost of capital (“WACC”) methodology. The WACC methodology considers market and industry data as well as company-specific risk factors for each reporting unityunit in determining the appropriate discount rates to be used. TheIn 2011, the discount rate utilized for the Aluminum reporting unit which ranged fromwas 12% to 13%,which is indicative of the return an investor would expect to receive for investing in such a business.At December 31, 2009,In 2013 and 2012, based on a review of the Companyqualitative factors set forth above, combined with the results of the quantitative analysis performed in 2011 for the Aluminum Products reporting unit, management concluded that as of October 1, 2013 and 2012, the reporting units had goodwillfair values that exceeded their carrying values. As a result of $4.1 million in the Capital Equipment reporting unit. On December 31, 2010, the Companythis analysis, we concluded that no impairment existed.acquisitionacquisitions of PillarQEF, Henry Halstead, and Bates and recorded additional goodwill of $1.0 million in the Capital Equipment reporting unit.$10.4 million. At December 31, 2011 the Company2013, we had goodwill of $9.5$60.4 million. We completedThere were no interim indicators of impairment and management concluded that the annualgoodwill related to the Aluminum Products, FRS, Capital Equipment and Supply Technologies reporting units was not impaired and that the two-step approach was not required to be performed through December 31, 2013.teststesting in 2012, we estimated the fair value of the trade name using a “relief from royalty” approach. This approach involves two steps: (1) estimating a reasonable royalty rate for the trade name and (2) applying this royalty rate to a net sales stream and discounting the resulting cash flows to determine fair value. Fair value is then compared with the carrying value of the trade name. As a result of this analysis, we concluded that no impairment existed.2009, 2010 and 2011 and2013, the indefinite-lived intangibles had fair values that exceeded their carrying values. As a result of this analysis, we concluded that no goodwill impairment existed.the Company accountswe account for income taxes under the asset and liability method, whereby deferred tax assets and liabilities are determined based on temporary differences between the financial reporting and the tax bases of assets and liabilities and are measured using the currently enacted tax rates. Specifically, we measure gross deferred tax assets for deductible temporary differences and carryforwards, such as operating losses and tax credits, using the applicable enacted tax rates and apply the more likely than not measurement criterion.ASC 740 provides thatrealizationtaxable temporary differences. We intend to maintain any recorded valuation allowances until sufficient positive evidence, for example cumulative positive foreign earnings or additional foreign source income exists, to support reversal of the tax benefitvaluation allowances.an existing deductible temporary differenceglobal income tax laws and regulations and when projecting the jurisdictional mix of income. Additionally, interpretation of tax laws, court decisions or carryforward ultimately depends on the existence of sufficient taxable incomeother guidance provided by taxing authorities influences our estimate of the appropriate character withineffective income tax rates. As a result, our actual effective income tax rates and related income tax liabilities may differ materially from our estimated effective tax rates and related income tax liabilities. Any resulting differences are recorded in the carryback, carryforward period available under the tax law. The Company analyzed the four possible sources of taxable income as set forth in ASC 740 and concluded that the only relevant sources of taxable income is the reversal of its existing taxable temporary differences. The Company reviewed the projected timing of the reversal of its taxable temporary differences and determined that such reversals will offset the Company’s deferred tax assets prior to their expiration. As of December 31, 2011, the Company was not in a cumulative three-year loss position and it was determined that it was more likely than not that its U.S. net deferred tax assets will be realized. As of December 31, 2011, the Company reversed a valuation allowance against its U.S. net deferred tax assets. See Note H to the consolidated financial statements included elsewhere herein.Stock-Based Compensation:4.51%ASC 718, “Compensation-Stock Compensation,” requires for 2013, compared with 3.66% in 2012. For the other postretirement benefit plan, the rate is 4.21% for 2013 and 3.35% for 2012. This rate represents the interest rates generally available in the United States, which is the Company’s only country with other postretirement benefit liabilities. Another assumption that affects the Company’s pension expense is the expected long-term rate of return on assets. The Company’s plans are funded. The weighted-average expected long-term rate of return on assets assumption is 8.25% for 2013.Change in Assumption Impact on 2014 Benefit Expense Impact on 2014 Projected Benefit Obligation for Pension Benefits Impact on 2014 Projected Benefit Obligation for Postretirement Benefits 50 basis point decrease in discount rate $ — $ 2.5 $ 0.6 50 basis point increase in discount rate $ — $ (2.3 ) $ (0.6 ) 50 basis point decrease in expected return on assets $ 0.6 $ — $ — resulting from all share-based payment transactionscan be recognizedestimated within a range, we accrue the minimum amount in the financial statementsrange. Based upon facts and establishesinformation currently available, we believe the amounts reserved are adequate for such pending matters. We monitor the development of legal proceedings on a fair-value measurement objective in determiningregular basis and will adjust our reserves when, and to the valueextent, additional information becomes available.such a cost. The Company recorded expense related to stock-based compensation in 2011, 2010, and 2009 of $2.1 million, $1.7 million and $2.4 million (before tax), respectively.RecentDecember 31, 2013PronouncementsIn June 2011, the FASBStandards Board (“FASB”) issued ASU No. 2011-05,2013-02, “Comprehensive Income (Topic 220): PresentationReporting of Amounts Reclassified Out of Accumulated Other Comprehensive Income.Income,” ASU No. 2011-05 amends existing guidance by allowing only two options for presentingwhich requires entities to provide information about the components of net income and other comprehensive income: (1) in a single continuous financial statement, statement of comprehensive income or (2) in two separate but consecutive financial statements, consisting of an income statement followed by a separate statement of other comprehensive income. Also, items that are reclassified from other comprehensive income to net income must be presented on the face of the financial statements. ASU No. 2011-05 requires retrospective application, and is effective for fiscal years, and interim periods within those years, beginning after December 15, 2011, with early adoption permitted. In December 2011, the FASB issued ASU 2011-12, deferring its requirement that companies present reclassification adjustments for each component of accumulated other comprehensive income in both net income and OCI on the face of the financial statements. Entities continue to be required to present amounts reclassified out of accumulated other comprehensive income by component. In addition, entities are required to present, either on the face of the financial statementsstatement where net income is presented or to disclose those amounts in the notes, significant amounts reclassified out of accumulated other comprehensive income by the respective line items of net income but only if the amount reclassified is required under U.S. GAAP to be reclassified to net income in its entirety in the financial statements. The requirementsame reporting period. For other amounts that are not required under U.S. GAAP to present reclassification adjustmentsbe reclassified in interim periods was also deferred. However,their entirety to net income, entities are required to report a total for comprehensive income in condensed financial statements of interim periods in a single continuous statement or in two consecutive statements. The FASB is reconsidering the presentation requirements for reclassification adjustments.The Company planscross-reference to adopt ASU No. 2011-05 in the first quarter of fiscal 2012. The Company believes the adoption of ASU No. 2011-05 will change the order in which certain financial statements are presented andother disclosures required under U.S. GAAP that provide additional detail on those financial statements when applicable, but will not have any other impact on its consolidated financial statements.In May 2011, the FASB amended ASC 820, “Fair Value Measurement.”these amounts. This amendment is intended to result in convergence between U.S. GAAP and International Financial Reporting Standards (“IFRS”) requirements for measurement of and disclosures about fair value. This guidance clarifies the application of existing fair value measurements and disclosures, and changes certain principles or requirements for fair value measurements and disclosures. The amendmentASU is effective prospectively for interim and annualreporting periods beginning after December 15, 2011.2012. The updated standard affects the Company’s disclosures but has no impact on its results of operations, financial condition or liquidity.amendmentASU will not have a material impacteffect on our consolidated financial statements.capitalindustrial equipment businesses,business unit included in the ManufacturedEngineered Products segment, which typically shipships a few large systems per year.annual reportAnnual Report on Form 10-K contains certain statements that are “forward-looking statements” within the meaning of Section 27A of the Securities Act and Section 21E of the Exchange Act. The words “believes”, “anticipates”, “plans”, “expects”, “intends”, “estimates” and similar expressions are intended to identify forward-looking statements.continuationthe uncertainty of the current negative global economic environment; general business conditions and competitive factors, including pricing pressures and product innovation; demand for our products and services; raw material availability and pricing; fluctuations in energy costs; component part availability and pricing; changes in our relationships with customers and suppliers; the financial condition of our customers, including the impact of any bankruptcies; our ability to successfully close the acquisition of FRS in the expected timeframe or at all; our ability to successfully integrate FRS and achieve the expected results of the acquisition; our ability to retain FRS’s management team and FRS’s relationship with customers and suppliers; our ability to successfully integrate recent and future acquisitions into existing operations; the amounts and timing, if any, of purchases of our common stock; changes in general domestic economic conditions such as inflation rates, interest rates, tax rates, unemployment rates, higher labor and healthcare costs, recessions and changing government policies, laws and regulations, including the uncertainties related to the current global financial crisis;crises; adverse impacts to us, our suppliers and customers from acts of terrorism or hostilities; our ability to meet various covenants, including financial covenants, contained in the agreements governing our indebtedness; disruptions, uncertainties or volatility in the credit markets that may limit our access to capital; potential disruption due to a partial or complete reconfiguration of the European Union; increasingly stringent domestic and foreign governmental regulations, including those affecting the environment; inherent uncertainties involved in assessing our potential liability for environmental remediation-related activities; the outcome of pending and future litigation and other claims and disputes with customers; the outcome of the review being conducted by the special committee of our board of directors; our dependence on the automotive and heavy-duty truck industries, which are highly cyclical; the dependence of the automotive industry on consumer spending, which could be lower due to the effects of the currentrecent financial crisis;crises; our ability to negotiate contracts with labor unions; our dependence on key management; our dependence on information systems; and the other factors we describe under the “Item 1A. Risk Factors”. included in the Company’s Annual Report on Form 10-K. Any forward-looking statement speaks only as of the date on which such statement is made, and we undertake no obligation to update any forward-looking statement, whether as a result of new information, future events or otherwise, except as required by law. In light of these and other uncertainties, the inclusion of a forward-looking statement herein should not be regarded as a representation by us that our plans and objectives will be achieved.ourborrowings under the floating rate revolving credit facility and term loan provided by our Credit Agreement, which consisted of borrowings of $93.0$129.7 million at December 31, 2011.2013. A 100 basis point increase in the interest rate would have resulted in an increase in interest expense of approximately $.9$1.3 million for during the year ended December 31, 2011.2011,2013, we recorded an unfavorable foreign currency translation adjustment of $1.4$2.6 million related to net assets located outside the United States. This foreign currency translation adjustment resulted primarily from weakeningthe strengthening of the U.S. dollar. Our foreign operations are also subject to other customary risks of operating in a global environment, such as unstable political situations, the effect of local laws and taxes, tariff increases and regulations and requirements for export licenses, the potential imposition of trade or foreign exchange restrictions and transportation delays. Page 474849737374Corp.Corp and subsidiaries as of December 31, 20112013 and 2010,2012 and the related consolidated statements of operations, shareholders’income, comprehensive income, shareholders' equity and cash flows for each of the three years in the period ended December 31, 2011.2013. Our audits also included the financial statement schedule listed in the Index at Item 15(a). These financial statements and schedule are the responsibility of the Company’s management. Our responsibility is to express an opinion on these financial statements and schedule based on our audits.20112013 and 20102012 and the consolidated results of their operations and their cash flows for each of the three years in the period ended December 31, 20112013, in conformity with U.S. generally accepted accounting principles. Also, in our opinion, the related financial statement schedule, when considered in relation to the basic financial statements taken as a whole, presents fairly in all material respects the information set forth therein.subsidiariessubsidiaries' internal control over financial reporting as of December 31, 2011,2013, based on criteria established in the Internal Control —- Integrated Framework issued by the Committee of Sponsoring Organizations of the Treadway Commission (1992 framework) and our report dated March 15, 201214, 2014 expressed an unqualified opinion thereon.
15, 2012HoldingHoldings Corp. and subsidiaries’ internal control over financial reporting as of December 31, 2011,2013, based on criteria established in Internal Control — IntegratedControl-Integrated Framework issued by the Committee of Sponsoring Organizations of the Treadway Commission (1992 framework) (the COSO criteria). Park-Ohio Holdings Corp. and subsidiaries’ management is responsible for maintaining effective internal control over financial reporting, and for its assessment of the effectiveness of internal control over financial reporting included in the accompanying Management’s Report on Internal Control overOver Financial Reporting. Our responsibility is to express an opinion on the Company’scompany’s internal control over financial reporting based on our audit.that:that (1) pertain to the maintenance of records that, in reasonable detail, accurately and fairly reflect the transactions and dispositions of the assets of the company; (2) provide reasonable assurance that transactions are recorded as necessary to permit preparation of financial statements in accordance with generally accepted accounting principles, and that receipts and expenditures of the company are being made only in accordance with authorizations of management and directors of the company; and (3) provide reasonable assurance regarding prevention or timely detection of unauthorized acquisition, use, or disposition of the company’s assets that could have a material effect on the financial statements.2011,2013, based on the COSO criteria. also audited, in accordance with the standards of the Public Company Accounting Oversight Board (United States), the consolidated balance sheets of Park-Ohio Holdings Corp. and subsidiaries as of December 31, 20112013 and 2010,2012, and the related consolidated statements of operations,income, comprehensive income, shareholders’ equity, and cash flows for each of the three years in the period ended December 31, 20112013 of Park-Ohio Holdings Corp. and subsidiaries and our report dated March 15, 201214, 2014 expressed an unqualified opinion thereon.15, 2012 December 31, 2011 2010 (Dollars in thousands) ASSETS $ 78,001 $ 35,311 139,941 126,409 202,039 192,542 20,561 10,496 18,778 12,751 8,790 12,800 468,110 390,309 3,654 3,678 47,594 47,479 208,727 201,920 259,975 253,077 198,165 184,294 61,810 68,783 9,463 9,100 74,557 84,340 �� $ 613,940 $ 552,532 LIABILITIES AND SHAREHOLDERS’ EQUITY $ 99,588 $ 95,695 73,651 59,487 1,415 13,756 2,002 2,178 176,656 171,116 250,000 183,835 93,000 113,300 3,165 5,322 1,392 9,721 24,285 22,863 371,842 335,041 -0- -0- 13,814 13,397 70,248 68,085 10,392 (19,043 ) (20,607 ) (18,502 ) (8,405 ) 2,438 65,442 46,375 $ 613,940 $ 552,532 See December 31,
2013 December 31,
2012 (In millions, except share
and per share data)ASSETS Current assets: Cash and cash equivalents $ 55.2 $ 44.4 Accounts receivable, less allowances for doubtful accounts of $3.7 million at December 31, 2013 and $3.5 million at December 31, 2012 165.7 160.4 Inventories, net 221.4 215.6 Deferred tax assets 25.2 19.8 Unbilled contract revenue 8.7 1.4 Other current assets 20.1 23.6 Total current assets 496.3 465.2 Net property, plant and equipment 115.4 100.0 Goodwill 60.4 49.7 Intangible assets, net 66.2 49.6 Other long-term assets 80.4 62.1 Total assets $ 818.7 $ 726.6 LIABILITIES AND SHAREHOLDERS' EQUITY Current liabilities: Trade accounts payable $ 112.0 $ 101.8 Accrued expenses and other 79.9 83.6 Current portion of long-term debt 4.4 4.4 Current portion of other postretirement benefits 1.7 1.9 Total current liabilities 198.0 191.7 Long-term liabilities, less current portion: Senior Notes 250.0 250.0 Credit facility 126.2 120.6 Other long-term debt 3.0 3.6 Deferred tax liabilities 45.3 31.5 Other postretirement benefits and other long-term liabilities 32.2 27.4 Total long-term liabilities 456.7 433.1 Park-Ohio Holdings Corp. and Subsidiaries shareholders' equity: Capital stock, par value $1 a share Serial preferred stock: Authorized -- 632,470 shares: Issued and outstanding -- none — — Common stock: Authorized - 40,000,000 shares; Issued - 14,364,239 shares in 2013 and 14,109,255 in 2012 14.4 14.1 Additional paid-in capital 82.4 76.9 Retained earnings 85.6 42.2 Treasury stock, at cost, 1,934,959 shares in 2013 and 1,872,265 shares in 2012 (26.8 ) (24.6 ) Accumulated other comprehensive income (loss) 3.4 (6.8 ) Total Park-Ohio Holdings Corp. and Subsidiaries shareholders' equity 159.0 101.8 Noncontrolling interest 5.0 — Total equity 164.0 101.8 Total liabilities and shareholders' equity $ 818.7 $ 726.6 (1) Adjusted to reflect the discontinued operations. toare an integral part of these consolidated financial statements.Operations Year Ended December 31, 2011 2010 2009 (Dollars in thousands,
except per share data) $ 966,573 $ 813,522 $ 701,047 799,248 679,425 597,200 167,325 134,097 103,847 105,582 91,755 87,786 5,359 3,539 5,206 56,384 38,803 10,855 -0- -0- (6,297 ) -0- (2,210 ) -0- 32,152 23,792 23,189 24,232 17,221 (6,037 ) (5,203 ) 2,034 (828 ) $ 29,435 $ 15,187 $ (5,209 ) $ 2.54 $ 1.34 $ (.47 ) $ 2.45 $ 1.29 $ (.47 ) SeeIncome Year Ended December 31, 2013 2012 2011 (In millions, except earnings per share data) Net sales $ 1,203.2 $ 1,128.2 $ 961.4 Cost of sales 992.2 920.9 793.7 Gross profit 211.0 207.3 167.7 Selling, general and administrative expenses 119.3 113.4 102.2 Restructuring and asset impairment charges — — 5.4 Litigation judgment and settlement costs 5.2 13.0 — Operating income 86.5 80.9 60.1 Gain on acquisition of business (0.6 ) — — Interest expense 26.8 26.4 32.2 Income from continuing operations before income taxes 60.3 54.5 27.9 Income tax expense (benefit) 19.4 20.3 (3.8 ) Net income from continuing operations 40.9 34.2 31.7 Income (loss) from discontinued operations, net of taxes 3.0 (2.4 ) (2.3 ) Net income 43.9 31.8 29.4 Net income attributable to noncontrolling interest (0.5 ) — — Net income attributable to ParkOhio common shareholders $ 43.4 $ 31.8 $ 29.4 Earnings (loss) per common share attributable to ParkOhio common shareholders - Basic: Continuing operations $ 3.40 $ 2.87 $ 2.74 Discontinued operations 0.25 (0.20 ) (0.20 ) Total $ 3.65 $ 2.67 $ 2.54 Earnings (loss) per common share attributable to ParkOhio common shareholders - Diluted: Continuing operations $ 3.31 $ 2.82 $ 2.64 Discontinued operations 0.25 (0.20 ) (0.19 ) Total $ 3.56 $ 2.62 $ 2.45 Weighted-average shares used to compute earnings per share: Basic 11.9 11.9 11.6 Diluted 12.2 12.1 12.0 (1) Adjusted to reflect the discontinued operations. toare an integral part of these consolidated financial statements. Year Ended December 31, 2013 2012 2011 (In millions) Net income $ 43.9 $ 31.8 $ 29.4 Other comprehensive income (loss): Foreign currency translation (loss) gain (2.6 ) 0.6 (1.4 ) Pension and postretirement benefit adjustments, net of tax 12.8 1.0 (9.4 ) Total other comprehensive income (loss) 10.2 1.6 (10.8 ) Total comprehensive income, net of tax 54.1 33.4 18.6 Comprehensive income attributable to noncontrolling interest (0.5 ) — — Comprehensive income attributable to ParkOhio common shareholders $ 53.6 $ 33.4 $ 18.6 Common
Stock Additional
Paid-In
Capital Retained
Earnings
(Deficit) Treasury
Stock Accumulated
Other
Comprehensive
Income (Loss) Total (Dollars in thousands) $ 12,237 $ 64,212 $ (29,021 ) $ (17,192 ) $ (17,481 ) $ 12,755 (5,209 ) (5,209 ) 2,968 2,968 413 413 8,986 8,986 7,158 627 (627 ) -0- 1,969 1,969 (251 ) (251 ) 410 373 783 396 396 13,274 66,323 (34,230 ) (17,443 ) (5,114 ) 22,810 15,187 15,187 (711 ) (711 ) 8,263 8,263 22,739 1,463 1,463 13 (13 ) -0- 101 (101 ) -0- (14 ) 14 -0- (1,059 ) (1,059 ) 23 127 150 272 272 13,397 68,085 (19,043 ) (18,502 ) 2,438 46,375 29,435 29,435 (1,387 ) (1,387 ) (9,456 ) (9,456 ) 18,592 1,988 1,988 194 (194 ) -0- (2,105 ) (2,105 ) 223 271 494 98 98 $ 13,814 $ 70,248 $ 10,392 $ (20,607 ) $ (8,405 ) $ 65,442 See Common Stock Shares Amount Additional
Paid-In
Capital Retained (Deficit)
Earnings Treasury Stock Accumulated
Other
Comprehensive
Income (Loss) Noncontrolling Interest Total (In whole shares) (In millions) Balance at January 1, 2011 13,396,674 $ 13.4 $ 68.1 $ (19.0 ) $ (18.5 ) $ 2.4 $ — $ 46.4 Other comprehensive income (loss) — — — 29.4 — (10.8 ) — 18.6 Amortization of restricted stock — — 2.0 — — — — 2.0 Restricted stock awards 194,000 0.2 (0.2 ) — — — — — Restricted stock cancelled (200 ) — — — — — — — Purchase of treasury stock (114,930 shares) — — — — (2.1 ) — — (2.1 ) Exercise of stock options 223,300 0.2 0.3 — — — — 0.5 Share-based compensation — — 0.1 — — — — 0.1 Balance at December 31, 2011 13,813,774 13.8 70.3 10.4 (20.6 ) (8.4 ) — 65.5 Other comprehensive income — — — 31.8 — 1.6 — 33.4 Share-based compensation — — 2.6 — — — — 2.6 Restricted stock awards 258,000 0.3 (0.3 ) — — — — — Common stock award 31,606 — 0.6 — — — — 0.6 Restricted stock cancelled (32,375 ) — — — — — — — Purchase of treasury stock (198,339 shares) — — — — (4.0 ) — — (4.0 ) Exercise of stock options 38,250 — 0.5 — — — — 0.5 Income tax effect of share-based compensation exercises and vesting — — 0.4 — — — — 0.4 Income tax effect of suspended benefits from share-based compensation — — 2.8 — — — — 2.8 Balance at December 31, 2012 14,109,255 14.1 76.9 42.2 (24.6 ) (6.8 ) — 101.8 Other comprehensive income — — — 43.4 — 10.2 0.5 54.1 Share-based compensation — — 4.1 — — — — 4.1 Restricted stock awards 204,650 0.2 (0.2 ) — — — — — Restricted stock cancelled (4,000 ) — — — — — — — Performance shares issued 14,000 — 0.4 — — — — 0.4 Capital contribution from noncontrolling interest — — 0.5 — — — 4.5 5.0 Purchase of treasury stock (62,694 shares) — — — — (2.2 ) — — (2.2 ) Exercise of stock options 40,334 0.1 0.3 — — — — 0.4 Income tax effect of share-based compensation exercises and vesting — — 0.4 — — — — 0.4 Balance at December 31, 2013 14,364,239 $ 14.4 $ 82.4 $ 85.6 $ (26.8 ) $ 3.4 $ 5.0 $ 164.0 toare an integral part of these consolidated financial statements. Year Ended December 31, 2011 2010 2009 (Dollars in thousands) $ 29,435 $ 15,187 $ (5,209 ) 16,177 17,132 18,918 5,359 3,539 5,206 7,335 -0- -0- -0- -0- (6,297 ) -0- (2,210 ) -0- (12,817 ) (1,126 ) (1,842 ) 2,086 1,735 2,365 (13,533 ) (7,624 ) 61,136 (8,763 ) 10,067 46,701 18,057 28,068 (82,113 ) (7,475 ) 2,291 5,000 35,861 67,059 43,865 (12,673 ) (3,951 ) (5,575 ) -0- (25,900 ) -0- 1,575 -0- -0- -0- -0- (62 ) -0- -0- 865 (11,098 ) (29,851 ) (4,772 ) (37,598 ) (8,944 ) (2,099 ) (1,079 ) (4,142 ) -0- 2,800 (11,000 ) (23,400 ) 244,970 -0- -0- (189,555 ) -0- -0- -0- -0- (8,853 ) 494 150 783 (2,105 ) (1,059 ) (251 ) 17,927 (24,995 ) (33,820 ) 42,690 12,213 5,273 35,311 23,098 17,825 $ 78,001 $ 35,311 $ 23,098 $ 4,648 $ 1,217 $ 3,146 26,993 23,324 23,018 See Year Ended December 31, 2013 2012 2011 OPERATING ACTIVITIES (In millions) Net income $ 43.9 $ 31.8 $ 29.4 Adjustments to reconcile net income to net cash provided by operating activities: Depreciation and amortization 19.2 18.0 16.2 Debt extinguishment costs — 0.3 7.3 Restructuring and asset impairment charges — — 5.4 Share-based compensation 4.7 2.7 2.1 Gain on sale of business and assets (6.0 ) (0.2 ) — Gain on acquisition of business (0.6 ) — — Deferred income taxes (2.3 ) 7.5 (12.8 ) Changes in operating assets and liabilities, excluding business acquisitions: Accounts receivable 8.5 9.8 (13.5 ) Inventories and other current assets (4.9 ) 7.1 (8.8 ) Accounts payable and accrued expenses (7.5 ) (21.4 ) 18.1 Other 5.3 0.3 (7.5 ) Net cash provided by operating activities 60.3 55.9 35.9 INVESTING ACTIVITIES Purchases of property, plant and equipment (30.1 ) (29.6 ) (12.7 ) Proceeds from sale and leaseback transactions 7.4 5.9 — Proceeds from sale of assets 14.2 0.4 1.6 Business acquisitions, net of cash acquired (45.8 ) (97.0 ) — Net cash used by investing activities (54.3 ) (120.3 ) (11.1 ) FINANCING ACTIVITIES Proceeds from term loans and other debt — 25.9 — Payments on term loans and other debt (4.2 ) (3.7 ) (37.6 ) Proceeds from revolving credit facility, net 9.1 8.9 2.8 Bank debt issue costs — (0.9 ) (1.1 ) Issuance of 8.125% senior notes due 2021, net of deferred financing costs — — 245.0 Redemption of 8.375% senior subordinated notes due 2014 — — (189.6 ) Issuance of common stock awards 0.8 1.1 0.5 Income tax effect of suspended benefits from share-based compensation — 2.8 — Income tax effect of share-based compensation exercises and vesting 0.4 0.4 — Purchase of treasury stock (2.2 ) (4.0 ) (2.1 ) Net cash provided by financing activities 3.9 30.5 17.9 Effect of exchange rate changes on cash 0.9 0.3 — Increase (decrease) in cash and cash equivalents 10.8 (33.6 ) 42.7 Cash and cash equivalents at beginning of period 44.4 78.0 35.3 Cash and cash equivalents at end of period $ 55.2 $ 44.4 $ 78.0 Income taxes paid $ 25.0 $ 5.5 $ 4.6 Interest paid $ 24.8 $ 23.8 $ 27.0 toare an integral part of these consolidated financial statements.2011, 20102013, 2012 and 20092011thousands,millions, except per share data)A1 — Summary of Significant Accounting PoliciesL.12. Transactions with related parties are in the ordinary course of business, are conducted on an arm’s-length basis, and are not material to the Company’s financial position, results of operations or cash flows.Inventory reserves were $24,881 and $22,788 at December 31, 2011 and 2010, respectively. Inventory consigned to others was $6,546 and $6,940 at December 31, 2011 and 2010, respectively.Major Classes of Inventories December 31, 2013 December 31, 2012 (In millions) Finished goods $ 114.7 $ 113.0 Work in process 30.3 27.9 Raw materials and supplies 76.4 74.7 Inventories, net $ 221.4 $ 215.6 Other inventory items Inventory reserves $ 28.4 $ 27.2 Consigned Inventory $ 6.6 $ 6.6 Major Classes of Inventories December 31, 2011 2010 $ 122,010 $ 116,202 20,660 24,339 59,369 52,001 $ 202,039 $ 192,542 25five to 4050 years for buildings, and 3one to 20 years for machinery and equipment. The Company reviews long-lived assets for impairment when events or changes in business conditions indicate that their full carrying value may not be recoverable. See Note O. December 31,
2013 December 31,
2012Property, plant and equipment: Land and land improvements $ 6.5 $ 5.7 Buildings 58.2 55.8 Machinery and equipment 261.5 245.2 Total property, plant and equipment 326.2 306.7 Less accumulated depreciation 210.8 206.7 Net property, plant and equipment $ 115.4 $ 100.0 PARK-OHIO HOLDINGS CORP. AND SUBSIDIARIESNOTES TO CONSOLIDATED FINANCIAL STATEMENTS — (Continued)Other IntangibleIndefinite-Lived Assets: In accordance with Accounting Standards Codification (“ASC”) 350, “Intangibles“Intangibles — Goodwill and Other”Other” (“ASC 350”), the Company does not amortize goodwill or indefinite-lived intangible assets recorded in connection with business acquisitions. Other intangible assets, which consist primarily of non-contractual customer relationships, are amortized over their estimated useful lives.Intangibles — Goodwill and Other.assets.assets, compared to the fair value. In September 2011, the Financial Accounting Standards Board (“FASB”) issuedaccordance with Accounting Standard Update “ASU”(“ASU”) 2011-08, which amends the rules for testing goodwill for impairment. Under the new rules, an entity has the option to first assess qualitative factors to determine whether the existence of events or circumstances leads to a determination that it is more likely than not that the fair value of a reporting unit is less than its carrying amount. If, after assessing the totality of events or circumstances, an entity determines it is not more likely than not that the fair value of a reporting unit is less than its carrying amount, then performing the two-step impairment test is unnecessary. The CompanyWe early adopted ASU 2011-08 for itsour October 1, 2011 annual goodwill impairment test.judgmentjudgments and assumptions include the identification of macroeconomic conditions, industry and market considerations, cost factors, overall financial performance, Company-specific events and share price trends, and the assessment of whether each relevant factor will impact the impairment test positively or negatively and the magnitude of any such impact.PARK-OHIO HOLDINGS CORP. AND SUBSIDIARIESNOTES TO CONSOLIDATED FINANCIAL STATEMENTS — (Continued)Stock-Based Compensation:Fair Values of Financial Instruments: Certain financial instruments are required to be recorded at fair value. The Company followsmeasures financial assets and liabilities at fair value in three levels of inputs. The three-tier fair value hierarchy, which prioritizes the provisions of ASC 718, “Compensation — Stock Compensation” (“ASC 718”), which requires all share-based payments to employees, including grants of employee stock options, to be recognizedinputs used in the income statementvaluation methodologies, is:theirquoted prices for identical assets and liabilities in active markets.values.Additional information regardingvalue estimates; however, we do not believe any such changes would have a material impact on our share-based compensation program is providedfinancial condition, results of operations or cash flows. The carrying value of cash and cash equivalents, accounts receivable, accounts payable and borrowings under the Credit Agreement (as defined in Note I.12%9% of consolidated revenue) is accounted for under the percentage of completion method, and recognized on the basis of the percentage each contract’s cost to date bears to the total estimated contract cost. Revenue earned on contracts in process that are in excess of billings, is classified in unbilled contract revenues in the accompanying consolidated balance sheet. Billings that are in excess of revenues earned on contracts in process are classified in accrued expenses in the accompanying balance sheet.PARK-OHIO HOLDINGS CORP. AND SUBSIDIARIESCost of SalesNOTES TO CONSOLIDATED FINANCIAL STATEMENTS — (Continued): Cost of sales is primarily comprised of direct materials and supplies consumed in the manufacture of product, as well as manufacturing labor, depreciation expense and direct overhead expense necessary to acquire and convert the purchased materials and supplies into finished product. Cost of sales also includes the cost to distribute products to customers, inbound freight costs, internal transfer costs, warehousing costs and other shipping and handling activity.uncollectibleuncollectable in the future. The Company’s policy is to identify and reserve for specific collectability concerns based on customers’ financial condition and payment history. During 20112013 and 2010,2012, we sold approximately $63,202$75.4 million and $37,272,$76.8 million, respectively, of accounts receivable to mitigate accounts receivable concentration risk and to provide additional financing capacity. In compliance with ASC 860, “Transfers and Servicing”, sales of accounts receivable are reflected as a reduction of accounts receivable in the Consolidated Balance Sheets and the proceeds are included in the cash flows from operating activities in the Consolidated Statements of Cash flows. In 20112013 and 2010, a loss2012, an expense in the amount of $281$0.4 million and $165,$0.3 million, respectively, related to the discount on sale of accounts receivable is recorded in the Consolidated Statements of Operations. These losses represented implicit interest on the transactions.Income.Software Development Costs: Software development costs incurred subsequent to establishing feasibility through the general release of the software products are capitalized and included in other assets in the consolidated balance sheet. Technological feasibility is demonstrated by the completion of a working model. All costs prior to the development of the working model are expensed as incurred. Capitalized costs are amortized on a straight-line basis over five years, which is the estimated useful life of the software product. Amortization expense was $1,533, $2,213 and $1,454 in 2011, 2010 and 2009, respectively.2011,2013, the Company had uncollateralized receivables with threefour customers in the automotive industry, each with several locations, aggregating $9,529,$24.2 million, which represented approximately 8%15% of the Company’s trade accounts receivable. During 2011,2013, sales to these customers amounted to approximately $72,871,$179.4 million, which represented approximately 8%15% of the Company’s net sales.Shipping and Handling Costs: All shipping and handling costs are included in cost of products sold in the Consolidated Statements of Operations.Environmental: Environmental:The Company accrues environmental costs related to existing conditions resulting from past or current operations and from which no current or future benefit is discernible. Costs that extend the life of the related property or mitigate or prevent future environmental contamination are capitalized. The Company records a liability when environmental assessments and/or remedial efforts are probable and can be reasonably estimated. The estimated liability of the Company is not discounted or reduced for possible recoveries from insurance carriers.as tofor assets and liabilities and weighted-average exchange rates as tofor revenues and expenses. The resulting translation adjustments are recorded in accumulated comprehensive income (loss) in shareholders’ equity.PARK-OHIO HOLDINGS CORP. AND SUBSIDIARIESWeighted-Average Number of Shares Used in Computing Earnings Per Share: NOTES TO CONSOLIDATED FINANCIAL STATEMENTS — (Continued)The following table sets forth the weighted-average number of shares used in the computation of earnings per share: Year Ended December 31, 2013 2012 2011 (In whole shares) Weighted average basic shares outstanding 11,936,772 11,920,593 11,579,819 Plus dilutive impact of employee stock options 295,393 195,836 419,042 Weighted average diluted shares outstanding 12,232,165 12,116,429 11,998,861 Not Yet AdoptedJune 2011,February 2013, the FASBFinancial Accounting Standards Board (“FASB”) issued ASU No. 2011-05,2013-02, “Comprehensive Income (Topic 220): PresentationReporting of Amounts Reclassified Out of Accumulated Other Comprehensive Income”. ASU No. 2011-05 amends existing guidance by allowing only two options for presentingIncome,” which requires entities to provide information about the components of net income and other comprehensive income: (1) in a single continuous financial statement, statement of comprehensive income or (2) in two separate but consecutive financial statements, consisting of an income statement followed by a separate statement of other comprehensive income. Also, items that are reclassified from other comprehensive income to net income must be presented on the face of the financial statements. ASU No. 2011-05 requires retrospective application, and is effective for fiscal years, and interim periods within those years, beginning after December 15, 2011, with early adoption permitted. In December 2011, the FASB issued ASU 2011-12, deferring its requirement that companies present reclassification adjustments for each component of accumulated other comprehensive income in both net income and OCI on the face of the financial statements. Entities continue to be required to present amounts reclassified out of accumulated other comprehensive income by component. In addition, entities are required to present, either on the face of the financial statementsstatement where net income is presented or to disclose those amounts in the notes, significant amounts reclassified out of accumulated other comprehensive income by the respective line items of net income but only if the amount reclassified is required under U.S. GAAP to be reclassified to net income in its entirety in the financial statements. The requirementsame reporting period. For other amounts that are not required under U.S. GAAP to present reclassification adjustmentsbe reclassified in interim periods was also deferred. However,their entirety to net income, entities are required to report a total for comprehensive income in condensed financial statements of interim periods in a single continuous statement or in two consecutive statements. The FASB is reconsidering the presentation requirements for reclassification adjustments.The Company planscross-reference to adopt ASU No. 2011-05 in the first quarter of fiscal 2012. The Company believes the adoption of ASU No. 2011-05 will change the order in which certain financial statements are presented andother disclosures required under U.S. GAAP that provide additional detail on those financial statements when applicable, but will not have any other impact on its consolidated financial statements.In May 2011, the FASB amended ASC 820, “Fair Value Measurement.”these amounts. This amendment is intended to result in convergence between U.S. GAAP and International Financial Reporting Standards (“IFRS”) requirements for measurement of and disclosures about fair value. This guidance clarifies the application of existing fair value measurements and disclosures, and changes certain principles or requirements for fair value measurements and disclosures. The amendmentASU is effective prospectively for interim and annualreporting periods beginning after December 15, 2011.2012. The updated standard affects the Company’s disclosures but has no impact on its results of operations, financial condition or liquidity.amendmentASU will not have a material impacteffect on our consolidated financial statements.B2 — SegmentsAluminum ProductsAssembly Components and ManufacturedEngineered Products. Supply Technologies provides our customers with Total Supply ManagementTMManagement™ services for a broad range of high-volume, specialty production components. Total Supply ManagementTMManagement™ manages the efficiencies of every aspect of supplying production parts and materials to our customers’ manufacturing floor, from strategic planning to program implementation, and includes such services as engineering and design support, part usage and cost analysis, supplier selection, quality assurance, bar coding, product packaging and tracking, just-in-time and point-of-use delivery, electronic billing services and ongoing technical support. The principal customers of Supply Technologies are in the heavy-duty truck,Assembly Components manufactures cast aluminum components, automotive and vehicle parts, electrical distributionindustrial rubber and controls, consumer electronics, power sports/fitness equipment, HVAC, agriculturalthermoplastic products, fuel filler and construction equipment, semiconductor equipment, plumbing, aerospace and defense, and appliance industries. Aluminum Products manufactures castPARK-OHIO HOLDINGS CORP. AND SUBSIDIARIESNOTES TO CONSOLIDATED FINANCIAL STATEMENTS — (Continued)aluminum componentshydraulic assemblies for automotive, agricultural equipment, construction equipment, heavy-duty truck and marine equipment industries. Aluminum ProductsAssembly Components also provides value-added services such as design and engineering,ManufacturedEngineered Products operates a diverse group of niche manufacturing businesses that design and manufacture a broad range of high quality products engineered for specific customer applications.principal customers of Manufactured Products are original equipment manufacturersCompany primarily evaluates performance and end users inallocates resources based on segment operating income as well as projected future performance. Segment operating income is defined as revenues less expenses identifiable to the steel, coatings, forging, foundry, heavy-duty truck, construction equipment, automotive, oilproduct lines included within each segment. Segment operating income reconciles to consolidated income from continuing operations before income taxes by deducting corporate costs and gas, rail and locomotive manufacturing and aerospace and defense industries.The Company’s sales are made through its own sales organization, distributors and representatives. Intersegment sales are immaterial and eliminated in consolidation andother income or expense items that are not included inattributed to the figures presented. Intersegment sales are accounted for at values based on market prices. Income allocatedsegments and net interest expense. Year Ended December 31, 2013 2012 2011 (In millions) Net sales: Supply Technologies $ 471.9 $ 483.8 $ 481.4 Assembly Components 412.8 304.0 157.8 Engineered Products 318.5 340.4 322.2 $ 1,203.2 $ 1,128.2 $ 961.4 Segment operating income: Supply Technologies $ 35.9 $ 37.9 $ 35.1 Assembly Components 31.8 19.9 1.4 Engineered Products 47.1 55.0 45.3 Total segment operating income 114.8 112.8 81.8 Corporate costs (23.1 ) (18.9 ) (16.3 ) Restructuring and asset impairment charges — — (5.4 ) Litigation judgment and settlement costs (5.2 ) (13.0 ) — Gain on acquisition of business 0.6 — — Interest expense (26.8 ) (26.4 ) (32.2 ) Income from continuing operations before income taxes $ 60.3 $ 54.5 $ 27.9 segments excludes certain corporate expenses and interest expense. Identifiable assets by industry segment include assets directly identified with thosereflect the discontinued operations.Corporate assets generally consist of cash and cash equivalents, deferred tax assets, property and equipment, and other assets. Year Ended December 31, 2011 2010 2009 $ 492,974 $ 402,169 $ 328,805 127,044 143,672 111,388 346,555 267,681 260,854 $ 966,573 $ 813,522 $ 701,047 $ 32,565 $ 22,216 $ 8,531 1,781 6,582 (5,155 ) 43,671 28,739 26,472 78,017 57,537 29,848 (16,274 ) (15,195 ) (13,787 ) -0- -0- 6,297 -0- 2,210 -0- (5,359 ) (3,539 ) (5,206 ) (32,152 ) (23,792 ) (23,189 ) $ 24,232 $ 17,221 $ (6,037 ) $ 228,629 $ 217,915 $ 207,729 61,002 66,219 76,443 203,782 188,017 178,715 120,527 80,381 39,381 $ 613,940 $ 552,532 $ 502,268 $ 4,632 $ 5,272 $ 4,812 5,844 6,488 7,556 5,159 5,001 6,022 542 371 528 $ 16,177 $ 17,132 $ 18,918 $ 1,463 $ 1,613 $ 2,380 7,015 156 1,385 1,472 2,138 2,006 2,723 44 (196 ) $ 12,673 $ 3,951 $ 5,575 Year Ended December 31, 2013 2012 2011 (In millions) Identifiable assets: Supply Technologies $ 241.7 $ 207.0 $ 225.3 Assembly Components 276.7 230.0 73.1 Engineered Products 183.1 199.4 195.8 General corporate 117.2 90.2 120.6 $ 818.7 $ 726.6 $ 614.8 Depreciation and amortization expense: Supply Technologies $ 3.0 $ 3.9 $ 4.6 Assembly Components 11.6 9.5 7.2 Engineered Products 3.4 3.2 3.9 General corporate 1.2 1.4 0.5 $ 19.2 $ 18.0 $ 16.2 Capital expenditures: Supply Technologies $ 3.8 $ 1.6 $ 1.3 Assembly Components 21.5 22.1 7.7 Engineered Products 3.6 3.1 0.9 General corporate 1.2 2.8 2.8 $ 30.1 $ 29.6 $ 12.7 PARK-OHIO HOLDINGS CORP. AND SUBSIDIARIESNOTES TO CONSOLIDATED FINANCIAL STATEMENTS — (Continued)werewas as follows: Year Ended December 31, 2011 2010 2009 76 % 73 % 68 % 17 % 18 % 26 % 7 % 9 % 6 % 100 % 100 % 100 % 87 % 86 % 88 % 12 % 13 % 11 % 1 % 1 % 1 % 100 % 100 % 100 % Year Ended December 31, 2013 2012 2011 Supply Technologies: Supply Technologies 87 % 88 % 89 % Engineered specialty products 13 % 12 % 11 % 100 % 100 % 100 % Assembly Components: Fluid routing 54 % 50 % — % Aluminum products 37 % 39 % 81 % Rubber and plastics 7 % 9 % 15 % Screw products 2 % 2 % 4 % 100 % 100 % 100 % Engineered Products: Industrial equipment business 77 % 80 % 81 % Forged and machined products 23 % 20 % 19 % 100 % 100 % 100 % werewas as follows: Year Ended
December 31, 2011 2010 2009 76 % 73 % 73 % 9 % 10 % 9 % 5 % 6 % 6 % 3 % 3 % 2 % 5 % 5 % 9 % 2 % 3 % 1 % 100 % 100 % 100 % 2013 2012 2011 United States 74 % 77 % 76 % Canada 8 % 8 % 5 % Mexico 5 % 4 % 3 % Asia 6 % 6 % 9 % Europe 5 % 4 % 5 % Other 2 % 1 % 2 % 100 % 100 % 100 % 2010approximately 77%, 81% and 2009, approximately 68%, 75% and 77%, respectively, of the Company’s assets were maintained in the United States.C3 — AcquisitionsEffective August 31, 2010,completedacquired all the acquisitionoutstanding capital stock of certain assets and assumed specific liabilities relating to Assembly Components Systems (“ACS”QEF Global Limited ("QEF") business unit of Lawson Products, Inc. for $16,000 in cash and a $2,160 subordinated promissory note payable in equal quarterly installments over three years. ACS. QEF is a provider of supply chain management solutions with four locations throughout Ireland, Scotland and England. QEF's sales for the year ended December 31, 2012 totaled approximately $14.0 million.broad rangeprovider of production components throughsupply chain management solutions throughout the United Kingdom and Ireland. For its service centers throughout North America. fiscal year ended March 31, 2013, Henry Halstead generated net sales of approximately $24.0 million.net assets acquired were integrated intoCompany paid $25.8 million in the Company’saggregate for QEF and Henry Halstead, which are subject to insignificant deferred and contingent purchase price consideration, respectively. QEF and Henry Halstead are included in our Supply Technologies business segment. The fair value of the net assets acquired of $20,370 exceeded the total purchase price and, accordingly, resulted in a gain on acquisition of business of $2,210. Net sales of $16,931 were added to the Company’s Supply Technologies business segment in 2010 since the datefrom their respective dates of acquisition. The acquisition wasacquisitions were accounted for under the acquisition method of accounting. UnderPARK-OHIO HOLDINGS CORP. AND SUBSIDIARIESNOTES TO CONSOLIDATED FINANCIAL STATEMENTS — (Continued)estimated purchase price is allocated to ACS’sQEF and Henry Halstead’s net tangible assets and intangible assets acquired and liabilities assumed based on their estimated fair values as of the respective effective dates of the acquisitions. Management's valuation of the fair value of tangible and intangible assets acquired and liabilities assumed are based on estimates and assumptions and are preliminary at December 31, 2013. The purchase price allocations are subject to further adjustment until all pertinent information regarding the property, plant and equipment, intangible assets, goodwill, other long-term liabilities and deferred income tax assets and liabilities acquired are fully evaluated by the Company and independent valuations are complete. Assuming these acquisitions had taken place at the beginning of 2012, results would not have been materially different.2010,2013. The acquisition was accounted for under the acquisition method of accounting and the purchase price allocation is preliminary at December 31, 2013. Management's valuation of the fair value of tangible and intangible assets acquired and liabilities assumed are based on estimates and assumptions. The purchase price $ 9,059 16,711 42 299 990 (5,047 ) (330 ) (1,354 ) (2,210 ) $ 18,160 Direct transaction costs associated with this acquisition included in selling, general and administrative expenses during the year ended December 31, 2010 were approximately $346.On September 30, 2010, the Company entered a Bill of Sale with Rome Die Casting LLC (“Rome”), a producer of aluminum high pressure die castings, pursuant to which, Rome agreed to transfer to the Company substantially all of the assets of Rome in exchange for approximately $7,500 of notes receivable from Rome. The assets of Rome were integrated into the Company’s aluminum segment. Net sales of $7,031 were added to the Company’s Aluminum segment in 2010 since the date of acquisition. The acquisition was accounted for under the acquisition method of accounting. Under the acquisition method of accounting, the purchase price is allocated to Rome’s tangible assets and intangible assets acquired and liabilities assumed based on their estimated fair values as of September 30, 2010, the effective date of the acquisition. Based on management’s valuation of the fair value of tangible and intangible assets acquired and liabilities assumed, the purchase price is as follows: $ 1,918 1,000 2,800 (2,314 ) (516 ) 4,572 $ 7,460 Direct transaction costs associated with this acquisition included in selling, general and administrative expenses during the year ended December 31, 2010 were approximately $256.On December 31, 2010, the Company, through its subsidiary Ajax Tocco Magnathermic, acquired the assets and the related induction heating intellectual property of ABP Induction’s United States heating business operating as Pillar Induction (“Pillar”). Pillar provides complete turnkey automated induction power systems and aftermarket parts and service to a worldwide market. (In Millions) Cash and cash equivalents $ 2.8 Accounts receivable 30.9 Inventories 12.4 Prepaid expenses and other current assets 2.7 Property, plant and equipment 30.2 Customer relationships 29.4 Trademarks and trade name 11.5 Other assets 0.2 Accounts payable (17.8 ) Accrued expenses (15.6 ) Deferred tax liability (26.4 ) Other long-term liabilities (0.8 ) Goodwill 39.3 Total purchase price $ 98.8 PARK-OHIO HOLDINGS CORP. AND SUBSIDIARIESNOTES TO CONSOLIDATED FINANCIAL STATEMENTS — (Continued)The assets of Pillar have been integrated into the Company’s manufactured products segment. The acquisition was accounted for under the acquisition method of accounting. Under the acquisition method of accounting, the total estimated purchase price is allocated to Pillar’s net tangible assets and intangible assets acquired and liabilities assumed based on their estimated fair values as of December 31, 2010, the effective date of the acquisition. Based on management’s valuation of the fair value of tangible and intangible assets acquired and liabilities assumed, which are based on estimates and assumptions that are subject to change, the purchase price is allocated as follows: $ 3,164 2,782 178 447 3,480 1,890 710 (1,202 ) (2,133 ) 990 $ 10,306 The purchase price allocation was finalized during March 2011 and reflects the working capital adjustment as of December 31, 2010. There were no significant direct transaction costs included in selling, general and administrative expenses during the year ended December 31, 2011.ACS, Rome and PillarFRS as if the acquisitionsacquisition had occurred on January 1, 2009.2011. The unaudited pro forma financial information is for informational purposes only and is not necessarily indicative of what the results would have been had the acquisitionsacquisition been completed at the date indicated above. Year Ended
December 31, 2010 2009 $ 881,271 $ 770,603 $ 15,072 $ (12,744 ) $ 1.33 $ 1.16 $ 1.28 $ 1.16 Year Ended December 31, 2012 2011 (In millions) Pro forma revenues $ 1,179.1 $ 1,146.9 Pro forma net income $ 39.1 $ 39.4 D4 — Dispositions Year Ended December 31, 2013 2012 2011 (In millions) Net sales $ 5.2 $ 5.8 $ 5.2 Loss from discontinued operations before tax (1.3 ) (4.0 ) (3.7 ) Income tax benefit from operations 0.5 1.6 1.4 Net loss from discontinued operations (0.8 ) (2.4 ) (2.3 ) Gain on sale of business before tax 5.3 — — Income tax expense from gain on sale of business (1.5 ) — — Net gain on sale of business 3.8 — — Income (loss) from discontinued operations, net of taxes $ 3.0 $ (2.4 ) $ (2.3 ) and Other Intangible Assets Supply Technologies Assembly Components Engineered Products Total (In millions) Balance at January 1, 2011 $ — $ 4.6 $ 4.5 $ 9.1 Finalization of Pillar purchase price allocation — — 0.4 0.4 Balance at December 31, 2011 — 4.6 4.9 9.5 Acquisitions — 40.2 — 40.2 Balance at December 31, 2012 — 44.8 4.9 49.7 Acquisitions 6.2 4.2 — 10.4 Foreign currency translation 0.2 — 0.1 0.3 Balance at December 31, 2013 $ 6.4 $ 49.0 $ 5.0 $ 60.4 2010to December 31, 2012 is due to the acquisitions of FRS in the first quarter of 2012 and 2009 were as follows: Supply
Technologies Aluminum Manufactured
Products Total $ -0- $ -0- $ 4,109 $ 4,109 -0- -0- 46 46 -0- -0- 4,155 4,155 -0- -0- (211 ) (211 ) -0- 4,572 584 5,156 -0- 4,572 4,528 9,100 -0- -0- (43 ) (43 ) -0- -0- 406 406 $ -0- $ 4,572 $ 4,891 $ 9,463 intangible assets were acquired in connection with acquisitions. Intangible Assets20112013 and 2010December 31, 2012 follows: 2011 2010 Acquisition
Costs Accumulated
Amortization Net Acquisition
Costs Accumulated
Amortization Net $ 11,670 $ 3,320 $ 8,350 $ 11,670 $ 2,422 $ 9,248 3,420 1,046 2,374 3,420 495 2,925 $ 15,090 $ 4,366 $ 10,724 $ 15,090 $ 2,917 $ 12,173 Amortization December 31, 2013 December 31, 2012 Weighted Average Useful Life Acquisition
Costs Accumulated
Amortization Net Acquisition
Costs Accumulated
Amortization Net (In millions) Non-contractual customer relationships 13.2 years $ 61.1 $ 8.7 $ 52.4 $ 41.7 $ 5.7 $ 36.0 Other 9.4 years 3.9 1.8 2.1 3.4 1.3 2.1 $ 65.0 $ 10.5 $ 54.5 $ 45.1 $ 7.0 $ 38.1 Indefinite-lived tradenames 11.7 11.5 Total $ 66.2 $ 49.6 was $1,449 for the year ended December 31, 2011, $745 for the year ended December 31, 2010 and $724 for the year ended December 31, 2009. Amortization expense for eachfollows: Year Ended December 31, 2013 2012 2011 (In millions) Amortization expense $ 3.5 $ 2.5 $ 1.4 Amortization Expense (In millions) 2014 $ 4.5 2015 $ 4.4 2016 $ 4.3 2017 $ 4.2 2018 $ 4.1 F7 — Other Long-Term Assets December 31, 2013 2012 (In millions) Pension assets $ 73.3 $ 52.9 Deferred financing costs, net 5.7 7.0 Other 1.4 2.2 Total $ 80.4 $ 62.1 includeconsists of the following: December 31, 2011 2010 $ 15,771 $ 13,832 30,180 23,218 4,208 4,046 5,106 2,504 4,331 3,252 14,055 12,635 $ 73,651 $ 59,487 December 31, 2013 2012 (In millions) Accrued salaries, wages and benefits $ 22.2 $ 20.1 Advance billings 20.4 27.2 Warranty accrual 5.4 6.9 Interest payable 5.6 5.5 Taxes, income and other 2.9 6.1 Other 23.4 17.8 Total $ 79.9 $ 83.6 and warranty accruals relate to the Company’s capitalindustrial equipment businesses.aggregateCompany’s product warranty liability are as follows for the yearyears ended December 31, 2011, 20102013, 2012, and 2009: 2011 2010 2009 $ 4,046 $ 2,760 $ 5,402 (3,421 ) (1,260 ) (3,367 ) 3,583 2,294 704 -0- 252 21 $ 4,208 $ 4,046 $ 2,760 Year Ended December 31, 2013 2012 2011 (In millions) Balance at January 1, $ 6.9 $ 4.2 $ 4.0 Claims paid during the year (6.4 ) (6.0 ) (3.4 ) Warranty expense 4.9 5.4 3.6 Acquired warranty liabilities — 3.3 — Balance at December 31, $ 5.4 $ 6.9 $ 4.2 G9 — Financing Arrangements December 31, 2011 2010 $ 250,000 $ -0- -0- 183,835 93,000 90,200 -0- 25,900 -0- 8,400 4,580 7,878 347,580 316,213 1,415 13,756 $ 346,165 $ 302,457 December 31, 2013 December 31, 2012 (In millions) 8.125% Senior Notes due 2021 $ 250.0 $ 250.0 Revolving credit 111.0 101.9 Term loan 18.7 22.3 Other 3.9 4.4 Total debt 383.6 378.6 Less current maturities 4.4 4.4 Total long-term debt, net of current portion $ 379.2 $ 374.2 $250,000$250.0 million in the aggregate principal amount of 8.125% senior notes due 2021 (the “Notes”"Notes"). The Notes bear an interest rate ofPARK-OHIO HOLDINGS CORP. AND SUBSIDIARIESNOTES TO CONSOLIDATED FINANCIAL STATEMENTS — (Continued)year commencing on October 1, 2011.year. The Notes mature on April 1, 2021. The Company is a party to a credit and security agreement, dated November 5, 2003, as amended (the “Credit Agreement”), with a group of banks, under which it may borrow or issue standby letters of credit or commercial letters of credit. In connection withOn March 23, 2012, the sale of the Notes, the Company also entered into a fourthCredit Agreement was amended and restated credit agreement (the “Amended Credit Agreement”). The Amended Credit Agreementto, among other things, providesincrease the revolving loan commitment from increased credit facility up to $200,000, extendsadditional $30.0 million during the maturity dateterm of the facility to April 7, 2016 and amends fee and pricing terms. Furthermore, the Company has the option, pursuant to the Amended Credit Agreement, to increase the availability under the revolving credit facility by $50,000.Agreement. At December 31, 2011,2013, in addition to amounts borrowed under the revolving credit facility, there was $7,387$12.0 million outstanding for standby letters of credit. An annual fee of up to .5%0.5% is imposed by the bank on the unused borrowing capacity and is based on the total aggregate credit facility used. Amounts borrowed under the revolving credit facility may be borrowed at either (i) LIBOR plus 1.75% to 2.75% or (ii) the bank’s prime lending rate minus 1%0.25% to 1.00%, at the Company’s election. The LIBOR-based interest rate is dependent on the Company’s debt service coverage ratio, as defined in the Amended Credit Agreement. Under the Credit Agreement, a detailed borrowing base formula provides borrowing availability to the Company based on percentages of eligible accounts receivable and inventory. On April 3, 2013, the Credit Agreement was amended to increase the advance rate on eligible accounts receivable and inventory. The interest rate on the revolving credit facility was 1.94% at December 31, 2013. At December 31, 20112013, the Company had approximately $68,140$67.8 million of unused borrowing capacity available under the revolving credit facility. The Company also purchased all of its outstanding $183,835 aggregate principal amount of 8.375% senior subordinated notes due 2014 that were not held by its affiliates, repaid all ofInterest on the term loan A andis at either (i) LIBOR plus 2.75% or (ii) the bank’s prime lending rate plus 0.25%, at the Company’s election. The term loan B outstanding under its then existing credit facility and retired the 8.375% senior subordinated notes due 2014 totaling $26,165 that were held by an affiliate. The Company incurred debt extinguishment costs related primarily to premiums and other transaction costs associatedis amortized based on a seven-year schedule with the tender and early redemption and wrote off deferred financing costs totaling $7,335 and recorded a provision for foreign income taxes of $2,100 resulting frombalance due at maturity (April 7, 2016). The interest rate on the retirementterm loan was 3.00% at December 31, 2013.8.375% senior subordinated notesCompany's 8.125% Senior Notes due 2014 that were held by an affiliate. December 31, 2013 December 31, 2012 (In millions) Carrying amount $ 250.0 $ 250.0 Fair value $ 275.6 $ 266.3 following subsequent to December 31, 2011 are approximately $1,415 in 2012, $500 in 2013 $500 in 2014, $500 in 2015 and $93,500 in 2016. follows: (In millions) 2014 4.4 2015 4.4 2016 123.4 2017 0.7 2018 0.5 of $0 and $1,299 at December 31, 20112013 and 2010, respectively2012 and outstanding bank guarantees of approximately $8,318$7.2 million and $9.2 million at December 31, 20112013 and 2012, respectively, under their credit arrangements.2011,2013, the Company was in compliance with all financial covenants of the Credit Agreement.6.44%6.10% at December 31, 2011.The carrying value2013 and 6.15% at December 31, 2012.cashthe Notes, the Company incurred debt extinguishment costs related primarily to premiums and cash equivalents, accounts receivable, accounts payableother transaction costs and borrowings underwrote off deferred financing costs totaling $7.3 million in 2011. In connection with the amendment to the Credit Agreement approximate fair value at December 31, 2011 and 2010. The approximate fair valuein 2012, the Company wrote off deferred financing costs of the Notes was $247,500 at December 31, 2011. The approximate fair value$0.3 million.In 2009, a foreign subsidiary of the Company purchased $15,150 aggregate principal amount of the 8.375% senior subordinated notes due 2014 for $8,853 and recorded a net gain of $6,297.H10 — Income Taxes (loss) from continuing operations before income tax expense consists of the following: Year Ended December 31 2011 2010 2009 $ 13,844 $ 6,723 $ (10,160 ) 10,388 10,498 4,123 $ 24,232 $ 17,221 $ (6,037 ) Year Ended December 31, 2013 2012 2011 (In millions) United States $ 48.4 $ 39.1 $ 17.5 Outside the United States 11.9 15.4 10.4 $ 60.3 $ 54.5 $ 27.9 Year Ended December 31, 2011 2010 2009 $ (41 ) $ 61 $ (147 ) 497 573 179 7,158 2,526 982 7,614 3,160 1,014 (9,661 ) (2,014 ) (1,231 ) (2,563 ) 689 (39 ) (593 ) 199 (572 ) (12,817 ) (1,126 ) (1,842 ) $ (5,203 ) $ 2,034 $ (828 ) Year Ended December 31, 2013 2012 2011 (In millions) Current expense (benefit): Federal $ 16.0 $ 7.5 $ — State 1.5 0.8 0.5 Foreign 4.2 4.4 7.1 21.7 12.7 7.6 Deferred expense (benefit): Federal 1.2 7.5 (8.3 ) State (2.6 ) (0.2 ) (2.5 ) Foreign (0.9 ) 0.3 (0.6 ) (2.3 ) 7.6 (11.4 ) Income tax expense (benefit) $ 19.4 $ 20.3 $ (3.8 ) 2011 2010 2009 $ 8,477 $ 6,027 $ (2,113 ) 153 1,048 (161 ) 2,910 1,472 1,247 (16,820 ) (6,475 ) (1,815 ) 378 480 735 -0- (772 ) -0- (301 ) 254 1,279 $ (5,203 ) $ 2,034 $ (828 ) Rate Reconciliation 2013 2012 2011 (In millions) Tax at statutory rate $ 21.1 $ 19.3 $ 9.9 Effect of state income taxes, net 1.1 0.9 0.1 Effect of foreign operations (0.2 ) (0.1 ) 2.9 Valuation allowance (1.6 ) (0.2 ) (16.8 ) Non-deductible items 0.7 0.6 0.4 Manufacturer's deduction (1.4 ) (0.6 ) — Other, net (0.3 ) 0.4 (0.3 ) Total $ 19.4 $ 20.3 $ (3.8 ) December 31, 2011 2010 $ 6,970 $ 7,003 11,682 12,363 9,677 16,184 1,862 3,177 12,725 11,138 42,916 49,865 83 1,090 17,491 21,423 1,764 4,191 19,338 26,704 23,578 23,161 (4,409 ) (22,386 ) $ 19,169 $ 775 December 31, 2013 2012 (In millions) Deferred tax assets: Postretirement benefit obligation $ 5.9 $ 7.0 Inventory 13.2 11.5 Net operating loss and credit carryforwards 3.8 5.3 Goodwill 0.5 0.6 Other 17.1 13.1 Total deferred tax assets 40.5 37.5 Deferred tax liabilities: Depreciation and amortization 11.7 8.7 Inventory 0.6 0.6 Pension 26.4 19.2 Goodwill 2.7 — Intangible assets and other 16.6 16.5 Total deferred tax liabilities 58.0 45.0 Net deferred tax liabilities prior to valuation allowances (17.5 ) (7.5 ) Valuation allowances (2.6 ) (4.2 ) Net deferred tax liability $ (20.1 ) $ (11.7 ) 2011,2013, the Company has federal, state and foreign net operating loss carryforwards for income tax purposes. The U.S. federal net operating loss carryforward is approximately $10,435 which expires between 2024 and 2031. The foreign net operating loss carryforward is $2,417$5.2 million, of which $2.9 million expires between 2014 and 2025 and the remainder has no expiration date. The Company also has a tax benefit from a state net operating loss carryforward of $5,428 which$4.1 million that expires between 20122014 and 2031.At December 31, 2011, the Company has research and development credit carryforwards of approximately $2,875 which expire between 2012 and 2031. The Company also has alternative minimum tax credit carryforwards of $1,023 which have no expiration date.20082010 through 20112013 remain open for examination by the U.S. and various state and foreign taxing authorities.2011,2013 and 2012, the Company was not in a cumulative three-year loss position and it was determined that it was more likely than not that its U.S. net deferred tax assets will be realized. As of December 31, 2011,2013, the Company reversed a valuation allowance of $16,820$1.6 million against its U.S.state net deferred tax assets.operating loss carryforward. As of December 31, 2010, the Company recorded a full valuation allowance of $20,089 against its U.S. net deferred tax assets. In addition, the Company determined that it was not more likely than not that certain foreign net deferred tax assets will be realized. As of December 31, 20112013 and 2010,2012, the Company recorded valuation allowances of $565$1.2 million and $2,297,$0.2 million, respectively, against certain foreign net deferred tax assets. The ultimate realization of deferred tax assets is dependent upon the generation of future taxable income (including reversals of deferred tax liabilities). The Company reviews all valuation allowances related to deferred tax assets and will reverse these valuation allowances, partially or totally, when appropriate under ASC 740. 2011 2010 2009 $ 6,142 $ 5,718 $ 5,806 32 283 101 (129 ) (4 ) (55 ) 135 341 97 -0- (18 ) -0- (203 ) (178 ) (231 ) $ 5,977 $ 6,142 $ 5,718 2013 2012 2011 (In millions) Unrecognized Tax Benefit — January 1, $ 6.1 $ 6.0 $ 6.2 Gross Increases — Tax Positions in Prior Period 0.4 0.1 — Gross Decreases — Tax Positions in Prior Period (0.6 ) — (0.1 ) Gross Increases — Tax Positions in Current Period — 0.1 0.1 Settlements — — — Lapse of Statute of Limitations — (0.1 ) (0.2 ) Unrecognized Tax Benefit — December 31, $ 5.9 $ 6.1 $ 6.0 $4,794$4.7 million at December 31, 20112013 and $4,916$4.9 million at December 31, 2010.2012. The Company recognizes accrued interest and penalties related to unrecognized tax benefits in income tax expense. During the year ended December 31, 20112013 and 2010,2012, the Company recognized approximately $19$0.7 million and $9,$0.1 million, respectively, in net interest and penalties. The Company had approximately $701$1.4 million and $682$0.8 million for the payment of interest and penalties accrued at December 31, 20112013 and 2010,2012, respectively. The Company does not expect that the unrecognized tax benefit will change significantly within the next twelve months.The Company has accrued a U.S. federal tax liability of $1,359 at December 31, 2011 related to the U.S. taxation of $3,882 of undistributed earnings of the Company’s foreign subsidiaries. Given this one exception, deferred$80,795$82.6 million of undistributed earnings of the Company’s foreign subsidiaries as it is the Company’s policy and intent to permanently reinvest such earnings.I11 — Stock Planshares,share units, performance shares or stock awards may be awarded to directors and all employees of the Company and its subsidiaries. Stock options will be exercisable in whole or in installments as may be determined provided that no options will be exercisable more than ten years from date of grant. The exercise price will be the fair market value at the date of grant. The aggregate number of shares of the Company’s common stock that may be awarded under the 1998 Plan is 3,100,000,3,700,000, all of which may be incentive stock options. No more than 500,000 shares shall be the subject of awards to any individual participant in any one calendar year.2011, 20102013, 2012 and 2009.PARK-OHIO HOLDINGS CORP. AND SUBSIDIARIESNOTES TO CONSOLIDATED FINANCIAL STATEMENTS — (Continued)20112013 and changes during the year then ended is presented below: 2011 Number
of Shares Weighted
Average
Exercise
Price Weighted
Average
Remaining
Contractual
Term Aggregate
Intrinsic
Value 458,634 $ 6.17 -0- -0- (223,300 ) 2.18 (7,000 ) 1.91 228,334 $ 14.58 4.6 years $ 930 224,584 14.59 4.6 years 914 2013 (in whole shares) (in millions) Outstanding — beginning of year 186,334 15.02 Granted — — Exercised (40,334 ) 8.89 Canceled or expired — — Outstanding — end of year 146,000 16.71 2.7 years $ 5.2 Options exercisable 146,000 16.71 2.7 years $ 5.2 20112013 range from $3.05 to $6.28, $13.40$14.12 to $15.61 and $20.00 to $24.92. The number of options outstanding and exercisable at December 31, 2011,2013, which correspond with these ranges, are 36,500, 151,834111,000 and 40,000, respectively. The number of options exercisable at December 31, 2011, which correspond to these ranges are 36,500, 148,084 and 40,000,35,000, respectively. The weighted average contractual life of these options is 4.62.7 years.The fair value provisions for option awards resulted in compensation expense of $98, $272 and $396 (before tax), for 2011, 2010 and 2009, respectively.2010was $1.1 million, $0.8 million and 2009 was $3,609, $368 and $104,$3.6 million, respectively. Net cash proceeds from the exercise of stock options were $494, $150$0.4 million, $0.5 million and $783$0.5 million, respectively. There were no income tax benefits becausehadawarded an employee the option to purchase up to an aggregate of $0.5 million of common stock at its then-current market value at a net operating loss carryforward.20112013 is as follows: 2011 Number of
Shares Weighted
Average
Grant Date
Fair Value 419,390 $ 6.26 194,000 20.35 (220,096 ) 6.73 (200 ) 3.18 393,094 $ 9.77 2013 Time-Based Performance-Based (in whole shares) (in whole shares) Outstanding — beginning of year 385,168 $ 14.94 56,000 $ 20.30 Granted 212,050 30.37 — Vested (170,320 ) 18.86 (14,000 ) 20.30 Canceled or expired (4,000 ) 21.59 — Outstanding — end of year 422,898 $ 21.04 42,000 $ 20.30 $1,988, $1,463$4.7 million, $2.7 million and $1,969$2.1 million for the years ended December 31, 2011, 20102013, 2012 and 2009,2011, respectively, relating to restricted shares and performance shares.2010was $6.1 million, $4.6 million and 2009 was $3,986, $4,043, and $797,$4.0 million, respectively.PARK-OHIO HOLDINGS CORP. AND SUBSIDIARIESNOTES TO CONSOLIDATED FINANCIAL STATEMENTS — (Continued) an expense on a straight-line basis over the vesting period of the awards.2011,2013, the Company had unrecognized compensation expense of $3,699,$8.0 million, before taxes, related to stock option awards and restricted shares. The unrecognized compensation expense is expected to be recognized over a total weighted average period of 2.32.1 years.20112013 is 144,484.J12 — Commitments, Contingencies and Contingencies (In millions) 2014 $ 13.5 2015 10.9 2016 9.4 2017 7.2 2018 5.1 Thereafter 4.0 K13 — Pensions and Postretirement Benefits$1,100.$1.1 million. Under a cash balance formula, a plan participant accumulates a retirement benefit consisting of pay credits that are based upon a percentage of current eligible earnings and current interest credits. For the remaining defined benefit plans, benefits are based on the employee’s years of service. For the defined contribution plans, the costs charged to operations and the amount funded are based upon a percentage of the covered employees’ compensation.20112013 and 2010: Pension Postretirement
Benefits 2011 2010 2011 2010 $ 49,672 $ 48,820 $ 18,432 $ 18,288 1,627 295 52 31 2,329 2,596 857 959 3,015 2,622 1,346 1,364 (4,384 ) (4,661 ) (2,128 ) (2,210 ) $ 52,259 $ 49,672 $ 18,559 $ 18,432 $ 110,458 $ 98,255 $ -0- $ -0- (2,740 ) 18,364 -0- -0- -0- -0- 2,128 2,210 (1,500 ) (1,500 ) -0- -0- (4,384 ) (4,661 ) (2,128 ) (2,210 ) $ 101,834 $ 110,458 $ -0- $ -0- $ 49,575 $ 60,786 $ (18,559 ) $ (18,432 ) Pension Benefits Postretirement Benefits 2013 2012 2013 2012 (In millions) Change in benefit obligation Benefit obligation at beginning of year $ 56.4 $ 52.3 $ 18.5 $ 18.6 Service cost 2.6 2.2 0.1 — Interest cost 2.0 2.2 0.6 0.8 Actuarial (gains) losses (4.4 ) 4.2 (1.3 ) 1.1 Benefits and expenses paid, net of contributions (4.5 ) (4.5 ) (1.7 ) (2.0 ) Benefit obligation at end of year $ 52.1 $ 56.4 $ 16.2 $ 18.5 Change in plan assets Fair value of plan assets at beginning of year $ 109.4 $ 101.8 $ — $ — Actual return on plan assets 21.8 13.7 — — Company contributions — — 1.7 2.0 Cash transfer to fund postretirement benefit payments (1.3 ) (1.6 ) — — Benefits and expenses paid, net of contributions (4.5 ) (4.5 ) (1.7 ) (2.0 ) Fair value of plan assets at end of year $ 125.4 $ 109.4 $ — $ — Funded (underfunded) status of the plans $ 73.3 $ 53.0 $ (16.2 ) $ (18.5 ) Pension Postretirement
Benefits 2011 2010 2011 2010 $ 49,575 $ 60,786 $ -0- $ -0- -0- -0- 16,557 16,255 -0- -0- 2,002 2,177 $ 49,575 $ 60,786 $ 18,559 $ 18,432 $ 22,345 $ 7,641 $ 7,052 $ 6,059 148 192 -0- -0- (91 ) (132 ) -0- -0- $ 22,402 $ 7,701 $ 7,052 $ 6,059 Pension Benefits Postretirement Benefits 2013 2012 2013 2012 (In millions) Noncurrent assets $ 73.3 $ 53.0 $ — $ — Noncurrent liabilities — — 14.5 16.6 Current liabilities — — 1.7 1.9 $ 73.3 $ 53.0 $ 16.2 $ 18.5 Amounts recognized in accumulated other comprehensive loss Net actuarial loss $ 2.1 $ 20.3 $ 6.3 $ 8.2 Net prior service cost (credit) 0.1 0.1 (0.5 ) (0.6 ) Net transition (asset) — (0.1 ) — — Accumulated other comprehensive loss $ 2.2 $ 20.3 $ 5.8 $ 7.6 20112013 and 2010,2012, the Company’s defined benefit pension plans did not hold a material amount of shares of the Company’s common stock.20112013 and 20102012 and target allocation for 20122014 are as follows: Plan Assets Target 2012 2011 2010 45-75 % 66.4 % 78.3 % 10-40 24.6 19.3 0-20 9.0 2.4 100 % 100 % 100 % Plan Assets Target 2014 2013 2012 Asset Category Equity securities 45-75% 67.2 % 64.4 % Debt securities 10-40 25.4 % 27.8 % Other 0-20 7.4 % 7.8 % 100% 100 % 100 % 2011 2010 Level 1 Level 2 Level 3 Total Level 1 Level 2 Total $ 42,737 $ -0- $ -0- $ 42,737 $ 65,362 $ -0- $ 65,362 19,014 2,088 -0- 21,102 12,729 3,413 16,142 3,820 -0- -0- 3,820 5,000 -0- 5,000 -0- -0- -0- -0- 967 -0- 967 7,176 -0- -0- 7,176 9,840 -0- 9,840 12,492 -0- -0- 12,492 5,242 -0- 5,242 5,420 -0- -0- 5,420 5,295 -0- 5,295 2,964 -0- -0- 2,964 2,381 -0- 2,381 -0- -0- 5,936 5,936 -0- -0- -0- 187 -0- -0- 187 229 -0- 229 $ 93,810 $ 2,088 $ 5,936 $ 101,834 $ 107,045 $ 3,413 $ 110,458 The fair value hierarchy has three levels based on the reliability of the inputs used to determine the fair value. Level 1 refers to the fair value determined based on unadjusted quoted prices for identical assets in active markets. Level 2 refers to the fair values based on quoted markets that are not active, quoted prices for similar assets in active markets, and inputs that are observable for the asset either directly or indirectly, for substantially the full term of the asset and inputs that are derived principally from or corroborated by observable market data by correlation or other means. Level 3 refers to fair value based on prices or valuation techniques that require inputs that are both unobservable and significant to the fair value measurement. 2013 2012 Level 1 Level 2 Level 3 Total Level 1 Level 2 Level 3 Total (In millions) Collective trust and pooled insurance funds: Common stock $ 48.3 $ 2.5 $ — $ 50.8 $ 40.1 $ 2.5 $ — $ 42.6 Equity Funds 26.9 — — 26.9 23.9 — — 23.9 Foreign Stock 5.6 — — 5.6 4.1 — — 4.1 U.S. Government obligations 5.1 — — 5.1 6.5 — — 6.5 Fixed income funds 18.8 — — 18.8 17.1 — — 17.1 Balanced funds 2.1 — — 2.1 — — — — Corporate Bonds 6.8 — — 6.8 6.8 — — 6.8 Cash and Cash Equivalents 2.0 — — 2.0 2.0 — — 2.0 Hedge funds — — 7.3 7.3 — — 6.4 6.4 $ 115.6 $ 2.5 $ 7.3 $ 125.4 $ 100.5 $ 2.5 $ 6.4 $ 109.4 yearyears ended December 31, 2011. Balance
Jan. 1, 2011 Net Unrealized
Loss Purchases Balance
Dec. 31, 2011 $ -0- $ (64 ) $ 6,000 $ 5,936 Purchases (In millions) Hedge Funds: 2013 $ 6.4 $ 0.9 $ — $ 7.3 2012 $ 5.9 $ 0.5 $ — $ 6.4 byin the consulting actuaryvaluation of pension and postretirement benefit obligations at December 31, and to measure the relatednet periodic benefit cost information. Weighted-Average assumptions as of December 31, Pension Postretirement
Benefits 2011 2010 2009 2011 2010 2009 4.50 % 5.00 % 5.50 % 4.50 % 5.00 % 5.50 % 8.25 % 8.25 % 8.25 % N/A N/A N/A 2.00 % N/A N/A N/A N/A N/A Weighted-Average assumptions as of December 31, Pension Benefits Postretirement Benefits 2013 2012 2011 2013 2012 2011 Discount rate 4.51 % 3.66 % 4.50 % 4.21 % 3.35 % 4.50 % Expected return on plan assets 8.25 % 8.25 % 8.25 % N/A N/A N/A Rate of compensation increase 2.00 % 2.00 % 2.00 % N/A N/A N/A Medical health care benefits rate increase N/A N/A N/A 6.50 % 7.00 % 6.50 % Medical drug benefits rate increase N/A N/A N/A 6.50 % 7.25 % 8.00 % Ultimate health care cost trend rate N/A N/A N/A 5.00 % 5.00 % 5.00 % Year of ultimate trend rate N/A N/A N/A 2042 2042 2042 2011,2013, the Company considered historical experience, its asset allocation, expected future long-term rates of return for each major asset class, and an assumed long-term inflation rate. Based on these factors, the Company derived an expected return on plan assets for the year ended December 31, 20112013 of 8.25%. This assumption was supported by the asset return generation model, which projected future asset returns using simulation and asset class correlation.For measurement purposes, a 6.5% and a 8.0% annual rate of increase in the per capita cost of covered medical health care benefits and drug benefits, respectively were assumed for 2011. The rates were assumed to decrease gradually to 5.0% for medical and drug for 2042 and remain at that level thereafter. Pension Benefits Postretirement Benefits 2011 2010 2009 2011 2010 2009 $ 1,627 $ 295 $ 471 $ 52 $ 31 $ 61 2,329 2,596 2,748 857 959 1,053 (8,950 ) (7,932 ) (7,036 ) -0- -0- -0- (40 ) (40 ) (40 ) -0- -0- -0- 44 61 129 (96 ) (96 ) -0- -0- 366 910 449 381 294 $ (4,990 ) $ (4,654 ) $ (2,818 ) $ 1,262 $ 1,275 $ 1,408 $ 7,701 $ 15,900 $ 25,131 $ 6,059 $ 4,980 $ 5,914 14,704 (7,811 ) (8,241 ) 1,346 1,364 280 (44 ) (62 ) (120 ) 96 96 (920 ) 41 (326 ) (870 ) (449 ) (381 ) (294 ) $ 22,402 $ 7,701 $ 15,900 $ 7,052 $ 6,059 $ 4,980 Pension Benefits Postretirement Benefits 2013 2012 2011 2013 2012 2011 (In millions) Components of net periodic benefit cost Service costs $ 2.6 $ 2.2 $ 1.6 $ 0.1 $ — $ 0.1 Interest costs 2.0 2.2 2.3 0.6 0.8 0.9 Expected return on plan assets (8.9 ) (8.2 ) (8.9 ) — — — Amortization of prior service credit — — — (0.1 ) (0.1 ) (0.1 ) Recognized net actuarial loss 0.8 0.9 — 0.7 0.7 0.4 Benefit (income) costs $ (3.5 ) $ (2.9 ) $ (5.0 ) $ 1.3 $ 1.4 $ 1.3 Other changes in plan assets and benefit obligations recognized in accumulated other comprehensive (income) loss AOCI at beginning of year $ 20.3 $ 22.4 $ 7.7 $ 7.6 $ 7.1 $ 6.1 Net (gain) loss arising during the year (17.3 ) (1.2 ) 14.7 (1.2 ) 1.1 1.3 Recognition of prior service credit — — — 0.1 0.1 0.1 Recognition of actuarial loss (0.8 ) (0.9 ) — (0.7 ) (0.7 ) (0.4 ) Total recognized in accumulated other comprehensive loss at end of year $ 2.2 $ 20.3 $ 22.4 $ 5.8 $ 7.6 $ 7.1 20122014 are $965, $44 and $(40), respectively.PARK-OHIO HOLDINGS CORP. AND SUBSIDIARIESNOTES TO CONSOLIDATED FINANCIAL STATEMENTS — (Continued)20122014 is $703$0.6 million and $(96),$(0.1) million, respectively. Postretirement Benefits Pension
Benefits Gross Expected
Medicare Subsidy Net including
Medicare Subsidy $ 4,002 $ 2,282 $ 236 $ 2,046 4,027 2,143 230 1,913 4,086 2,048 220 1,828 4,095 1,945 208 1,737 4,107 1,794 196 1,598 21,807 7,290 798 6,492 Postretirement Benefits Pension Benefits Gross (In millions) 2014 $ 4.2 $ 1.9 $ 0.2 $ 1.7 2015 4.2 1.8 0.2 1.6 2016 4.1 1.7 0.2 1.5 2017 4.3 1.6 0.2 1.4 2018 4.2 1.5 0.1 1.4 2019 to 2023 21.9 6.2 0.6 5.6 1-Percentage
Point
Increase 1-Percentage
Point
Decrease $ 68 $ (60 ) $ 1,456 $ (1,291 ) The total contribution charged to pension expense for the Company’s defined contribution plans was $0 in 2011, $0 in 2010 and $301 in 2009. During March 2009, the Company suspended indefinitely its voluntary contribution to its 401(k) defined contribution plan covering substantially all U.S. employees. (In millions) Effect on total of service and interest cost components in 2013 $ 0.1 $ — Effect on postretirement benefit obligation as of December 31, 2013 $ 1.3 $ (1.1 ) 2012.$375$0.4 million upon the CEO’s termination of employment with the Company. The vested retirement benefit will be equal to a percentage of the Supplemental Pension that is equal to the ratio of the sum of his credited service with the Company prior to January 1, 2008 (up to a maximum of thirteen years), and his credited service on or after January 1, 2008 (up to a maximum of seven years) to twenty years of credited service. In the event of a change in control before the CEO’s termination of employment, he will receive 100% of the Supplemental Pension. The Company recorded an expense of $389$0.5 million in 2013 and 2012 related to the SERP and $0.4 millionin 2011, 2010 and 2009.2011. Additionally, a non-qualified defined contribution retirement benefit was also approved in which the Company will credit $94$0.1 million quarterly ($3750.4 million annually) for a seven yearseven-year period to an account in which the CEO will always be 100% vested. The seven year period began on March 31, 2008.L — LeasesFuture minimum lease commitments during each of the five years following December 31, 2011 and thereafter are as follows: $12,784 in 2012, $9,135 in 2013, $5,712 in 2014, $4,080 in 2015, $3,356 in 2016 and $7,773 thereafter. Rental expense for 2011, 2010 and 2009 was $16,363, $13,068 and $12,812, respectively.Certain of the Company’s leases are with related parties at an annual rental expense of approximately $2,598. Transactions with related parties are in the ordinary course of business, are conducted on an arms length basis, and are not material to the Company’s financial position, results of operations or cash flows.NOTE M — Earnings Per ShareThe following table sets forth the computation of basic and diluted earnings (loss) per share: Year Ended December 31, 2011 2010 2009 $ 29,435 $ 15,187 $ (5,209 ) 11,580 11,314 10,968 419 493 -0- 11,999 11,807 10,968 $ 2.54 $ 1.34 $ (.47 ) $ 2.45 $ 1.29 $ (.47 ) Basic earnings per common share is computed as net income available to common shareholders divided by the weighted average basic shares outstanding. Diluted earnings per common share is computed as net income available to common shareholders divided by the weighted average diluted shares outstanding. Pursuant to ASC 260, “Earnings Per Share,” when a loss is reported the denominator of diluted earnings per share cannot be adjusted for the dilutive impact of stock options and awards because doing so will result in anti-dilution. Therefore, for the year ended December 31, 2009, basic weighted-average shares outstanding are used in calculating diluted earnings per share.Outstanding stock options with exercise prices greater that the average price of the common shares are anti-dilutive and are not included in the computation of diluted earnings per share. Stock options for 201,100 shares of common stock were excluded in the year ended December 31, 2010.PARK-OHIO HOLDINGS CORP. AND SUBSIDIARIESNOTES TO CONSOLIDATED FINANCIAL STATEMENTS — (Continued)NOTE N14 — Accumulated Other Comprehensive Income (Loss)at for the years ended December 31, 2013, 2012, and 2011 and 2010 arewere as follows: December 31, 2011 2010 $ 4,852 $ 6,239 (13,257 ) (3,801 ) $ (8,405 ) $ 2,438 Cumulative Translation Adjustment Pension and Postretirement Benefits Total (In millions) Balance at January 1, 2011 $ 6.2 $ (3.8 ) $ 2.4 Foreign currency translation adjustments (a) (1.4 ) — (1.4 ) Loss arising during the year — (16.0 ) (16.0 ) Tax adjustment (c) — 6.4 6.4 Net loss arising during the year — (9.6 ) (9.6 ) Recognition of actuarial gain (b) — 0.4 0.4 Tax adjustment (c) — (0.2 ) (0.2 ) Recognition of actuarial gain, net — 0.2 0.2 Balance at December 31, 2011 4.8 (13.2 ) (8.4 ) Foreign currency translation adjustments (a) 0.6 — 0.6 Recognition of actuarial gain, net (b) — 1.6 1.6 Tax adjustment (c) — (0.6 ) (0.6 ) Recognition of actuarial gain, net — 1.0 1.0 Balance at December 31, 2012 5.4 (12.2 ) (6.8 ) Foreign currency translation adjustments (a) (2.6 ) — (2.6 ) Recognition of actuarial gain, net (b) — 19.9 19.9 Tax adjustment (c) — (7.1 ) (7.1 ) Recognition of actuarial gain, net — 12.8 12.8 Balance at December 31, 2013 $ 2.8 $ 0.6 $ 3.4 (a) (b) The recognition of actuarial gains are reclassified out of accumulated other comprehensive income and included in the computation of net periodic benefit cost in selling, general and administrative expenses. (c) The tax adjustments are reclassified out of accumulated other comprehensive income and included in income tax expenses. O15 — Restructuring and Unusual Charges$5,359$5.4 million restructuring and asset impairment charge related to the write down of underperforming assets in its rubber products business unit.During the third quarterAssembly Components segment.P16 — Subsequent EventOn March 5, 2012, the Company entered into an agreement to acquire Fluid Routing Solutions Holding Corp. (“FRS”), a leading manufacturer of industrial hose products and fuel filler and hydraulic fluid assemblies, in an all cash transaction valued at $97,500. FRS products include fuel filler, hydraulic, and thermoplastic assemblies and several forms of manufactured hose including bulk and formed fuel, power steering, transmission oil cooling, hydraulic and thermoplastic hose. FRS sells to automotive and industrial customers throughout North America, Europe and Asia. FRS has five production facilities located in Florida, Michigan, Ohio, Tennessee and the Czech Republic. The transaction is expected to close by March 30, 2012 subject to a number of customary conditions, including the expiration of waiting periods and the receipt of approvals under Hart-Scott-Rodino Antitrust Improvements Act. The transaction is expected to be funded by the Company’s cash of $40,000 ($10,000 domestic and $30,000 foreign), a new $25,000 seven-year amortizing term loan secured by certain real estate and machinery and equipment of the Company for which the Company has received a commitment letter from its bank group and $32,500 of borrowings under the Company’s revolving credit facility. Quarter Ended March 31 June 30 Sept. 30 Dec. 31 (Dollars in thousands, except per share data) $ 241,628 $ 246,808 $ 243,544 $ 234,593 41,935 45,180 41,844 38,366 $ 8,729 $ (1,107) $ 2,870 $ 18,943 $ .76 $ .(10) $ .25 $ 1.62 $ .73 $ .(10) $ .24 $ 1.58 $ 191,701 $ 198,303 $ 202,986 $ 220,532 29,338 33,298 34,980 36,481 $ 2,066 $ 3,415 $ 6,184 $ 3,522 $ .19 $ .30 $ .54 $ .31 $ .18 $ .29 $ .52 $ .30 Quarter Ended Mar. 31, Jun. 30, Sept. 30, Dec. 31, (Dollars in millions, except per share data) 2013 Net sales $ 283.0 $ 307.3 $ 303.5 $ 309.4 Gross profit 51.6 57.5 54.6 47.3 Net income from continuing operations 10.7 12.1 8.7 9.4 Income (loss) from discontinued operations, net of taxes (0.4 ) (0.1 ) 3.7 (0.2 ) Net income attributable to noncontrolling interest — — (0.2 ) (0.3 ) Net income attributable to ParkOhio common shareholders $ 10.3 $ 12.0 $ 12.2 $ 8.9 Earnings (loss) per common share attributable to ParkOhio common shareholders - Basic: Continuing operations $ 0.90 $ 1.02 $ 0.71 $ 0.76 Discontinued operations (0.03 ) (0.01 ) 0.31 (0.02 ) Total $ 0.87 $ 1.01 $ 1.02 $ 0.74 Earnings (loss) per common share attributable to ParkOhio common shareholders - Diluted: Continuing operations $ 0.88 $ 0.99 $ 0.69 $ 0.74 Discontinued operations (0.03 ) (0.01 ) 0.30 (0.02 ) Total $ 0.85 $ 0.98 $ 0.99 $ 0.72 2012 Net sales $ 261.7 $ 307.3 $ 285.2 $ 274.0 Gross profit 49.0 55.9 54.2 48.2 Net income from continuing operations 9.6 5.0 11.4 8.2 Loss from discontinued operations, net of taxes (0.6 ) (0.6 ) (0.7 ) (0.5 ) Net income attributable to ParkOhio common shareholders $ 9.0 $ 4.4 $ 10.7 $ 7.7 Earnings (loss) per common share attributable to ParkOhio common shareholders - Basic: Continuing operations $ 0.81 $ 0.42 $ 0.95 $ 0.68 Discontinued operations (0.05 ) (0.05 ) (0.06 ) (0.04 ) Total $ 0.76 $ 0.37 $ 0.89 $ 0.64 Earnings (loss) per common share attributable to ParkOhio common shareholders - Diluted: Continuing operations $ 0.79 $ 0.42 $ 0.94 $ 0.67 Discontinued operations (0.05 ) (0.05 ) (0.06 ) (0.04 ) Total $ 0.74 $ 0.37 $ 0.88 $ 0.63 Note 1 —In the third quarter of 2010, the Company recorded a bargain purchase gain of $2,210 from the acquisition of certain assets and assumption of specific liabilities of Assembly Component Systems Inc. representing the excess of the aggregate fair value of purchased net assets over the purchase price and $3,539 asset impairment charge relating to the write down of an investment.2A —In the second quarter of 2011,2013, the Company incurred debt extinguishment costs related primarily to premiumscompleted the acquisition of substantially all of the assets of Bates, a manufacturer of extruded, formed and other transactions costs associated with the tendermolded products and early redemption and wrote off deferred financing costs associated with the 8.375% senior subordinated notes due 2014 totaling $7,335 and recorded a provision for foreign taxes of $2,100 resulting from the retirement of $26,165 that were held by an affiliate.is included in our Assembly Components segment.3B —Note C — Note D — In the third quarter of 2011,September 2013, the Company recorded a $5,359 restructuring and asset impairment charge related to the write down of underperforming assets in its rubber products business unit$5.2 million pre-tax litigation judgment.4E —InDuring the fourth quarter of 2011,2013, the Company reversed its deferred tax valuation allowanceacquired the outstanding capital stock of $11,271.Henry Halstead and QEF. Both companies are providers of supply chain management solutions.Note F — Note G — In the second quarter of 2012, the Company entered into a settlement agreement with a customer pursuant to which it agreed to settle all claims subject to an arbitration agreement by paying the customer $13.0 million in cash. Schedule VALUATION AND QUALIFYING ACCOUNTS AND RESERVES Balance at
Beginning of
Period Charged to
Costs and
Expenses Deductions
and
Other Balance at
End of
Period $ 6,011 $ 708 $ (1,236 )(A) $ 5,483 22,788 7,433 (5,340 )(B) 24,881 22,386 (17,977 ) -0- (D) 4,409 4,046 3,583 (3,421 )(C) 4,208 $ 8,388 $ 2,581 $ (4,958 )(A) $ 6,011 21,456 8,956 (7,624 )(B) 22,788 30,668 (5,754 ) (2,528 )(D) 22,386 2,760 2,294 (1,008 )(C) 4,046 $ 3,044 $ 6,527 $ (1,183 )(A) $ 8,388 22,313 7,153 (8,010 )(B) 21,456 34,921 (1,815 ) (2,438 )(D) 30,668 5,402 704 (3,346 )(C) 2,760 Description (In millions) Year Ended December 31, 2013: Allowances deducted from assets: Trade receivable allowances 3.5 1.8 (1.6 ) (A) 3.7 Inventory obsolescence reserve 27.2 9.4 (8.2 ) (B) 28.4 Tax valuation allowances 4.2 (1.6 ) — 2.6 Year Ended December 31, 2012: Allowances deducted from assets: Trade receivable allowances 5.5 1.8 (3.8 ) (A) 3.5 Inventory obsolescence reserve 24.9 11.6 (9.3 ) (B) 27.2 Tax valuation allowances 4.4 (0.2 ) — 4.2 Year Ended December 31, 2011: Allowances deducted from assets: Trade receivable allowances 6.0 0.6 (1.1 ) (A) 5.5 Inventory obsolescence reserve 22.8 7.4 (5.3 ) (B) 24.9 Tax valuation allowances 22.4 (18.0 ) — 4.4 UncollectibleUncollectable accounts written off, net of recoveries.Note (C)- Loss and loss adjustment.Note (D)- Amounts recorded in other comprehensive income.Changes in and Disagreements With Accountants on Accounting and Financial DisclosureCompany’sour independent auditors on accounting and financial disclosure matters within the two-year period ended 2011.annual reportAnnual Report on Form 10-K, our disclosure controls and procedures were effective.Management of the Companythe Company’sour Chairman and Chief Executive Officer and Vice President and Chief Financial Officer, of the effectiveness of itsour internal control over financial reporting as of December 31, 2011.2013. The framework on which such evaluation was based is contained in the report entitled “Internal Control — Integrated Framework” issued by the Committee of Sponsoring Organizations of the Treadway Commission (1992 Framework) (the “COSO Report”). Management’s assessment and conclusion on the effectiveness of internal control over financial reporting did not include the internal controls of Bates, Henry Halstead and QEF Global, which in the aggregate constituted 8% of total assets as of December 31, 2013 and 3% of revenues for the year then ended. Based upon the evaluation described above under the framework contained in the COSO Report, the Company’sour management has concluded that the Company’sour internal control over financial reporting was effective as of December 31, 2011.the Company’sour independent registered public accounting firm, haswho audited the consolidated financial statements of the Company for the year ended December 31, 2013, also issued an auditattestation report on the effectiveness of the Company’s internal control over financial reporting asunder Auditing Standard No. 5 of December 31, 2011 based on the framework contained in the COSO Report.Public Company Accounting Oversight Board. This attestation report is included atset forth on page 44 of this annual reportAnnual Report on Form 10-K and is incorporated herein by reference.the Company’sour internal control over financial reporting that occurred during the fourth quarter of 20112013 that have materially affected, or are reasonably likely to materially affect, the Company’sour internal control over financial reporting.the Company’sour code of ethics required under this item is incorporated herein by reference from the material contained under the captions “Election of Directors” and “Certain Matters Pertaining to the Board of Directors and Corporate Governance,” as applicable, in the Company’sour definitive proxy statement for the 20122014 annual meeting of shareholders to be filed with the SEC pursuant to Regulation 14A not later than 120 days after the close of the fiscal year (the “Proxy Statement”). The information concerning Section 16(a) beneficial ownership reporting compliance is incorporated herein by reference from the material contained under the caption “Principal Shareholders — Section 16(a) Beneficial Ownership Reporting Compliance” in the Proxy Statement. Information relating to executive officers is contained in Part I of this annual reportAnnual Report on Form 10-K.Item 12.Security Ownership of Certain Beneficial Owners and Management and Related Stockholder Mattersthe Company’sour common stock that may be issued under the Company’sour equity compensation plan as of December 31, 2011. Number of securities
to be issued upon
exercise price of
outstanding options
warrants and rights Weighted-average
exercise price of
outstanding
options, warrants
and rights Number of securities
remaining available for
future issuance under
equity compensation plans
(excluding securities
reflected in column (a)) (a) (b) (c) 228,334 $ 14.58 144,484 -0- -0- -0- 228,334 $ 14.58 144,484 Plan Category (a) (b) (c) Equity compensation plans approved by security holders (1) 146,000 $ 16.71 267,953 Equity compensation plans not approved by security holders — — — Total 146,000 $ 16.71 267,953 (1) Includes the Company’sour Amended and Restated 1998 Long-Term Incentive Plan.Item 13. CertainRelationships and Related Transactions, and Director IndependenceAccountantAccounting Fees and Services Page 4243444546474871(2) Financial Statement Schedules (2) Financial Statement Schedules 72annual reportAnnual Report on Form 10-K are listed on the Exhibit Index immediately preceding such exhibits and are incorporated herein by reference. of Section 13 or 15(d) of the Securities Exchange Act of 1934, the registrant has duly caused this report to be signed on its behalf by the undersigned thereunto duly authorized.PARK-OHIO HOLDINGS CORP. (Registrant) By: /s/ JEFFREY L. RUTHERFORDW. Scott EmerickName: Jeffrey L. Rutherford, Vice PresidentW. Scott EmerickTitle: 15, 2012reportreport has beenbeen signed by the following persons in the capacities and on the dates indicated. Chairman, Chief Executive Officer and Director March 14, 2014 Jeffrey L. Rutherford (Principal President, Chief Operating Officer and Director Director Director March 15, 2012 Director Director Director Director*James W. Wert Director Director * The undersigned, pursuant to a Power of Attorney executed by each of the directors and officers identified above and filed with the Securities and Exchange Commission, by signing his name hereto, does hereby sign and execute this report on behalf of each of the persons noted above, in the capacities indicated. March 15, 201214, 2014 By: Robert D. Vilsack, Attorney-in-Fact 20112013EXHIBIT INDEX2.1 Agreement and Plan of Merger by and among Fluid Routing Solutions Holding Corp., FRS Group, LLP, Automotive Holding Acquisition Corp and Park-Ohio Industries, Inc., dated as of March 5, 2012 (filed as Exhibit 2.1 to From 10-Q of Park-Ohio Holdings Corp. filed on May 10, 2012, SEC File No. 000-03134 and incorporated by reference and made a part hereof) 3.1 Amended and Restated Articles of Incorporation of Park-Ohio Holdings Corp. (filed as Exhibit 3.1 to the Form 10-K of Park-Ohio Holdings Corp. for the year ended December 31, 1998, SEC File No. 000-03134 and incorporated by reference and made a part hereof) 3.2 Code of Regulations of Park-Ohio Holdings Corp. (filed as Exhibit 3.2 to the Form 10-K of Park-Ohio Holdings Corp. for the year ended December 31, 1998, SEC File No. 000-03134 and incorporated by reference and made a part hereof) 4.1 FourthFifth Amended and Restated Credit Agreement, dated April 7, 2011,March 23, 2012, among Park-Ohio Industries, Inc., RB&W Corporation of Canada Inc., the Ex-Im Borrowers party thereto, the other loan parties thereto, the lenders party thereto andLoan Parties (as defined therein), JP Morgan Chase Bank, N.A., as Administrative Agent, JP Morgan, Chase Bank, N.A., Toronto Branch, as Canadian Agent, RBS Business Capital, as Syndication Agent, Key Bank National Association as Co-Documentation Agent,and First National Bank of America, N.A.,Pennsylvania, as Co-Documentation Agent, U.S. Bank National Association, as Co-Documentation Agent, and Joint Bookrunner, PNC Bank, National Association , as Joint Bookrunner, and J.P. Morgan Securities, Inc. as Sole Lead Arranger and Bookrunning Manager (filed as Exhibit 4.34.1 to the Form 8-K of Park-Ohio Holdings Corp., filed on April 13, 2011,March 27, 2012, SEC File No. 000-03134 and incorporated by reference and made a part hereof)4.2 Amendment No. 1 to Fifth Amended and Restated Credit Agreement, dated April 3, 2013, among Park-Ohio Industries, Inc. and RB&W Corporation of Canada, as borrowers, the Ex-Im Borrowers party to the Credit Agreement (as defined therein) the other Loan Parties party to the Credit Agreement, the lenders party to the Credit Agreement, JPMorgan Chase Bank, N.A., as Administrative Agent and JPMorgan Chase Bank, N.A., Toronto Branch, as Canadian Agent (filed as Exhibit 4.1 to the Form 10-Q of Park-Ohio Holdings Corp., filed on May 6, 2013, SEC File No. 000-03134 and incorporated by reference and made a part hereof) 4.2 4.3 Indenture, dated as of April 7, 2011, among Park-Ohio Industries, Inc., the Guarantors (as defined therein) and Wells Fargo Bank, NA, as trustee (filed as Exhibit 4.1 to the Form 8-K of Park-Ohio Holdings Corp. filed on April 13, 2011, SEC File No. 000-03134 and incorporated herein by reference and made a part hereof) 10.1 Form of Indemnification Agreement entered into between Park-Ohio Holdings Corp. and each of its directors and certain officers (filed as Exhibit 10.1 to the Form 10-K of Park-Ohio Holdings Corp. for the year ended December 31, 1998, SEC File No. 000-03134 and incorporated by reference and made a part hereof) 10.2* Amended and Restated 1998 Long-Term Incentive Plan (filed as Exhibit 10.1 to Form 8-K of Park-Ohio Holdings Corp., filed on June 3, 2009,May 30, 2012, SEC File No. 000-03134 and incorporated by reference and made a part hereof)10.3* Form of Restricted Share Agreement between the Company and each non-employee director (filed as Exhibit 10.1 to Form 8-K of Park-Ohio Holdings Corp., filed on January 25, 2005, SEC File No. 000-03134 and incorporated herein by reference and made a part hereof) 10.4*Exhibit10.4* Form of Restricted Share Agreement for Employees (filed as Exhibit 10.1 to Form 10-Q for Park-Ohio Holdings Corp. for the quarter ended September 30, 2006, SEC File No. 000-03134 and incorporated herein by reference and made a part hereof) 10.5* Form of Incentive Stock Option Agreement (filed as Exhibit 10.5 to Form 10-K of Park-Ohio Holdings Corp. for the year ended December 31, 2004, SEC File No. 000-03134 and incorporated by reference and made a part hereof) Exhibit 10.6* Form of Non-Statutory Stock Option Agreement (filed as Exhibit 10.6 to Form 10-K of Park-Ohio Holdings Corp. for the year ended December 31, 2004, SEC File No. 000-03134 and incorporated herein by reference and made a part hereof) 10.7* Park-Ohio Industries, Inc. Annual Cash Bonus Plan (filed as Exhibit 10.1 to the Form 8-K for Park-Ohio Holdings Corp, filed June 1, 2011, SEC File No. 000-03134 and incorporated by reference and made a part hereof) 10.8* Supplemental Executive Retirement Plan for Edward F. Crawford, effective as of March 10, 2008 (filed as Exhibit 10.9 to Form 10-K of Park-Ohio Holdings Corp. for the year ended December 31, 2007, SEC File No. 000-03134 and incorporated by reference and made a part hereof) 10.9* Non-qualified Defined Contribution Retirement Benefit Letter Agreement for Edward F. Crawford, dated March 10, 2008 (filed as Exhibit 10.10 to Form 10-K of Park-Ohio Holdings Corp. for the year ended December 31, 2007, SEC File No. 000-03134 and incorporated by reference and made a part hereof) 10.10* 2009 Director Supplemental Defined Contribution Plan of Park-Ohio Holdings Corp. (Filed as Exhibit 10 to Form 10-Q of Park-Ohio Holdings Corp. filed on May 10, 2011, SEC File No. 000-03134 and incorporated by reference and made a part hereof) 10.11 Agreement of Settlement and Release, dated July 1, 2008 (filed as Exhibit 10.1 to Form 10-Q of Park-Ohio Holdings Corp. for the quarter ended September 30, 2008, SEC File No. 000-03134 and incorporated herein by reference and made a part hereof) 10.12 Asset Purchase Agreement, dated as of August 31, 2010, by and among Assembly Component Systems, Inc., Lawson Products, Inc., Supply Technologies LLC and Park-Ohio Industries, Inc. (filed as Exhibit 10.1 to the Form 10-Q of Park-Ohio Holdings Corp., filed on November 15, 2010, SEC File No. 000-03134 and incorporated by reference and made a part hereof)10.13Bill of Sale, dated September 30, 2010, by Rome Die Casting LLC and Johnny Johnson in favor of General Aluminum Mfg. Company (filed as Exhibit 10.2 to the Form 10-Q of Park-Ohio Holdings Corp., filed on November 15, 2010, SEC File No. 000-03134 and incorporated by reference and made a part hereof)10.14Registration Rights Agreement, dated as of April 7, 2011, by and among Park-Ohio Industries, Inc., the Guarantors (as defined therein) and the initial purchasers party thereto (filed as Exhibit 10.1 to Form 8-K of Park-Ohio Holdings Corp., filed April 7, 2011, SEC File No. 000-03134 and incorporated by reference and made a part hereof)21.1 List of Subsidiaries of Park-Ohio Holdings Corp. 23.1 Consent of Independent Registered Public Accounting Firm 24.1 Power of Attorney 31.1Exhibit31.1 Principal Executive Officer’s Certification Pursuant to Section 302 of the Sarbanes-Oxley Act of 2002 31.2 Principal Financial Officer’s Certification Pursuant to Section 302 of the Sarbanes-Oxley Act of 2002 Exhibit 32.1 Certification requirement under Section 906 of the Sarbanes-Oxley Act of 2002 101.INS XBRL Instance Document 101.SCH XBRL Taxonomy Extension Schema Document 101.CAL XBRL Taxonomy Extension Calculation Linkbase Document 101.LAB101.DEF XBRL Taxonomy Extension Label Linkbase Document 101.PRE101.LAB XBRL Taxonomy Extension Presentation Linkbase Document 101.DEF101.PRE XBRL Taxonomy Extension Definition Linkbase Document * Reflects management contract or other compensatory arrangement required to be filed as an exhibit pursuant to Item 15(c) of this Report. 82