| x | ANNUAL REPORT PURSUANT TO SECTION 13 OR 15(d) OF THE SECURITIES EXCHANGE ACT OF 1934 |
| ¨ | TRANSITION REPORT PURSUANT TO SECTION 13 OR 15(d) OF THE SECURITIES EXCHANGE ACT OF 1934 |
|
| ||
| 04-2833935 | |||
(State or other jurisdiction of incorporation or organization) | (I.R.S. Employer Identification No.) | ||
| 01581-3335 | |||
| (Address of principal executive offices) | (Zip Code) | ||
Registrant’s telephone number, including area code: | (508) | |
Securities registered pursuant to Section 12(b) of the Act: | Common Stock, par value $.01 per share | |
Name of each exchange on which registered | NASDAQ Global Market | |
Securities registered pursuant to Section 12(g) of the Act: | None | |
Large Accelerated Filer | ¨ | Accelerated Filer | x | Non-Accelerated Filer | ¨ | Smaller Reporting Company | ¨ |
$235,280,802.
our target markets is essential to our growth; (Olympus) and Fuji Corporation (Fuji) for digital still Customer Military Customers in Total Raytheon Company DRS Technologies sales to Skyworks Solutions and the customers who use our displays for military applications will represent a significant portion of our revenues for 2012; our expectation that we will continue developing HBT transistor wafers and other gallium arsenide products for advanced integrated circuit applications from other compound materials; our expectation that we will continue to pursue other U.S. government development contracts for applications that relate to our commercial product applications; our expectation that sales of our III-V products for wireless handset applications and our display products for consumer electronic applications will decline; our belief that products using HBT transistor wafers are easier to design, which can translate into reduced component costs and smaller equipment; our expectation that we will prosecute and defend our proprietary technology aggressively; our belief that it is important to retain personnel with experience and expertise relevant to our business;our belief that our products are targeted towards markets that are still developing and our competitive strength is creating new technologies;our belief that it is important to invest in research and development to remain profitableachieve profitability even during periods when we are not profitable; our belief that we are a leading developer and manufacturer of advanced semiconductor materials and miniature displays; our belief that our products enable our customers to develop and market an improved generation of products; our belief that therethat the technical nature of our products and markets demands a commitment to close relationships with our customers; our belief that our Golden-i industrial reference design will provide for increased worker productivity, safety and improved manufacturing quality; our belief that our ability to develop and expand the our wearable technologies and to market and license our wearable technologies will be increased salesimportant for our revenue growth and ability to achieve profitability and positive cash flow; the impact of 3G, 4Gthe timing of development of the market segment for our wearable computing products on our ability to grow revenues; our expectation that we will incur significant development and smart phonesmarketing costs in 2012;2014 to commercialize the our wearable technologies; our statement that we may make equity investments in companies; our expectation that KoBrite will incur additional losses in the near term; our expectation that the operations at our Korean facility, Kowon, will cease and the cash and marketable debt securities held by Kowon will eventually be remitted back to the U.S.; our expectation that revenue will be between $110between $18 million and $120$22 million for 2012; 2014;our ability to forecast our revenues and operating results;our expectation that 2012 revenueswe will primarily be to customers locatedhave a consolidated net loss in the range of $32 million to $40 million in 2014; our expectation that excluding the effects of working capital, stock buybacks, and other investing activities our cash usage will be between $30 million and $35 million to fund operations for fiscal year 2014; our expectation that the U.S.; government will significantly reduce funding for programs through which we sell high margin military products; our belief that a strengthening of the U.S. dollar could increase the price of our products in foreign markets; the impact of new regulations relating to conflict minerals on customer demands and increased costs related to compliance with such regulations; our expectationbelief that our future success will depend primarily upon the technical expertise, creative skills and management abilities of our officers and key employees rather than on patent ownership;our belief that our extensive portfolio of patents, trade secrets and non-patented know-how provides us with a manufacturing/distribution partner will commence selling Golden-icompetitive advantage in the wearable technologies market; our belief that our ability to develop innovative products enhances our opportunity to grow within our targeted markets; our belief that continued introduction of new products in 2012; our expectation that we will not receive additional amounts from the sale of patents;target markets is essential to our growth; our expectation that our CyberDisplaydisplay products will benefit from further general technological advances in the design and production of integrated circuits and active matrix LCDs, resulting in further improvements in resolution and miniaturization; our expectation that a significant reduction or delay in orders from any of our significant military customers could result in us not being able to achieve profitability in 2012; our belief that our HBT transistor wafers offer greater power efficiency, improved signal quality and less complexity over gallium arsenide field effect transistors; our belief that our manufacturing process offers greater miniaturization, reduced cost, higher pixel density, full color capability and lower power consumption compared to conventional active matrix LCD manufacturing approaches; our expectation not to pay cash dividends for the foreseeable future and to retain earnings for the development of our businesses; our expectation based on current negotiations with our customers and certain contractual obligations, that the sales prices of certain products will decline in fiscal year 2012; our expectation that sales prices of our displays for military applications will remain relatively flat in 2012; our plan to base production and inventory levels based on internal forecasts of customer demands; our belief that the overall increase or decrease in the average sales price of our display products will be dependent on the sales mix of commercial and military display sales; our belief that we may have impairment charges on Kowon’s long-lived assets; our expectation that we will expend between $5.0between $2.0 million and $8.0 $3.0 million on capital expenditures over the next twelve months; our intent to reduce our per unit production costs primarily through increasing manufacturing yield, lowering fixed costs per unit through increased sales volume, and increasing productivity and efficiency; our expectation that the market for display products for military applications will not be seasonal; our expectation that prices of our HBT transistor and display products sold for consumer electronic applications will decline by approximately 5 to 7 percent during fiscal year 2012, but may decline more depending on final negotiations with our customers; our expectation that competition will increase; our belief that our CyberDisplay products are well suited for new applications such as reading e-mail and browsing the Internet using digital wireless devices and other consumer electronics devices; our belief that small form factor displays will be a critical component in the development of advanced wireless communications systems; our belief that wireless handset makers are looking to create products that complement or eventually replace wireless handsets; our belief that general technological advances in the design and fabrication of integrated circuits, LCD technology and LCD manufacturing processes will allow us to continue to enhance our CyberDisplaydisplay product manufacturing process; our expectation that a significant market for new wireless communication devices, including personal entertainment systems, will develop; our belief that continued introduction of new products in2 our belief that our future success will depend primarily upon the technical expertise, creative skills and management abilities of our officers and key employees rather than on patent ownership; our belief that our available cash resources will support our operations and capital needs for at least the next twelve months; our expectation that we will have taxes based on federal alternative minimum tax rules and on our foreign operations in 2014; our expectation that we will have a state tax provision in 2014; our expectation that the adoption of certain accounting standards will not have a material impact on our financial position or results of operations;our belief that our business is not disproportionately affected by climate change regulations; our belief that our operations have not been materially affected by inflation; and our belief that the effect, if any, of reasonably possible near-term changes in interest rates on our financial position, results of operations, and cash flows should not be material. These forward-looking statements are based on current expectations, estimates, forecasts and projections about the industries in which we operate, management’smanagement's beliefs, and assumptions made by management. In addition, other written or oral statements, which constitute forward-looking statements, may be made by or on behalf of us. Words such as “expects”, “anticipates”, “intends”, “plans”, “believes”, “could”, “seeks”, “estimates”, and variations of such words and similar expressions are intended to identify such forward-looking statements. These statements are not guarantees of future performance and involve certain risks, uncertainties and assumptions, which are difficult to predict. Therefore, actual outcomes and results may differ materially from what is expressed or forecasted in such forward-looking statements, whether as a result of new information, future events or otherwise. Factors that could cause or contribute to such differences in outcomes andItem 1. Business manufacturerdisplay products. 2012 2011 Consolidated III-V Product Line Pro Forma Consolidated III-V Product Line Pro Forma Revenues $ 93.4 $ 58.8 $ 34.6 $ 131.1 $ 66.5 $ 64.6 2012 Consolidated III-V Product Line Pro Forma Total Assets $ 176.2 $ 50.7 $ 125.5 We useWearable technologies integrate a variety of commercially available software packages such as Microsoft Windows CE, Nuance Dragon NaturallySpeaking and Hillcrest Labs with our proprietary semiconductor material technologysoftware and display products to create a reference design manufacture and market our products. Our products enable ourwhich we offer to license to customers who wish to develop and market an improved generation of products for applicationsmobile industrial products. We licensed our first reference design known as Golden-i® in wireless and consumer electronic devices. Our fiscal year ends on the last Saturday in December. The fiscal years ended December 31, 2011, December 25, 2010 and December 26, 2009 are referred to herein as fiscal years 2011, 2010 and 2009, respectively. Our principal executive offices are located at 200 John Hancock Road, Taunton, Massachusetts. Our telephone number is (508) 824-6696.We commercially develop and manufacture Gallium Arsenide-based heterojunction bipolar transistor wafers (HBT transistor wafers) and other commercial semiconductor products that use Gallium Nitride and Gallium Arsenide-based substrates. We collectively refer to our customer began shipping products based on compound semiconductor materials,our technology in 2013. Through 2013 our revenues from licensing our Golden-i technologies has been de minimis. We have rebranded the category and refer to the headset reference designs and other technologies we developed as Kopin Wearable technologies of which primarily consists of our HBT transistor wafers, as our “III-V” products because we use elements categorized on the III and V columns ofGolden-i headset reference design is for the periodic table of elements to manufacture such products. industrial market segment.HBT transistor wafers are customer-specific arrays of vertically oriented transistors that our customers use primarily to produce high performance integrated circuits for wireless communications products. Sales of our HBT transistor wafers to Skyworks Solutions, Inc. (Skyworks Solutions) accounted for approximately 28%, 25% and 20% of our total revenues for fiscal years 2011, 2010 and 2009, respectively. Skyworks Solutions also uses the foundry services of Advanced Wireless Semiconductor Company (AWSC) to process our HBT transistor wafers on its behalf. We sell HBT transistor wafers directly to AWSC for eventual resale by AWSC to Skyworks Solutions and its other customers. Although we do not know exactly how much of our sales to AWSC are for Skyworks we believe an investor should view our sales to Skyworks Solutions and AWSC in the aggregate when evaluating the importance of Skyworks Solutions as a customer to Kopin. Sales to AWSC were 9%, 12% and 8%, of our 2011, 2010 and 2009 revenues, respectively. In addition to Skyworks Solutions, original equipment manufacturers such as RF Micro Devices and TriQuint Semiconductor purchase our HBT transistor wafers.Our CyberDisplay™display products consist of miniature, high performance, high resolution displays either sold separately or in various configurations with optical lenses and electronics contained in either plastic or metal housings. Current applications which include CyberDisplayminiature, high performance, high resolution display products are military devices, such as thermal weapon sights, and consumer devices such as camcorders, digital cameras,cameras; and devices that are capable of browsingaccessing the Internet usingor digital wirelessstorage devices for viewing data or video. When our display products are configured as spatial light modulators, the applications include industrial equipment for 3D Automated Optical Inspection and viewing video from other consumer electronics devices such as MP3 or iPod™ storage devices.training simulation equipment. We have sold our CyberDisplay productdisplay products to Raytheon Company, DRS RSTA Inc., BAE Systems (directly and through a third party QiOptiq), and ITT for use in military applications and to Samsung Electronics Co., Ltd. (Samsung) for use in digital camcorders,, Eastman Kodak Company (Kodak), Olympus Corporation3cameras and DRS Technologies, BAE Systems (through a third party QiOptic), Raytheon and ITT for use in military applications.cameras. For fiscal years 2013, 2012 and 2011, 2010 and 2009, significantwere as follows: (Note theare shown below. The caption “Military Customers in Total” in the table below includes Raytheon, DRS Technologies and QiOptic but excludes research and development contractscontracts. We sell our displays to Japanese customers through Ryoden Trading Company. (“*” denotes that the customer’scustomer's revenues were less than 10% of our total company revenues)) Percent of Total
Revenues 2011 2010 2009 30 % 33 % 45 % 12 % 18 % 14 % * * 19 % Customer 2013 2012 2011 Military Customers in Total 38% 57% 60% Raytheon Company 14% 22% 23% DRS RSTA Inc. * 21% 18% QiOptiq Defense Inc. * * 10% Ryoden Trading Company 18% 12% 15% U. S. Government funded research and development contracts 10% 10% 8% Golden-i™ productfiscal year ends on the last Saturday in December. The fiscal years ended December 28, 2013, December 29, 2012, and December 31, 2011 are referred to herein as fiscal years 2013, 2012 and 2011, respectively. Our principal executive offices are located at 125 North Drive, Westborough, Massachusetts. Our telephone number is (508) 870-5959.head worn computer headset which we developed that includes a microprosessorbillion wireless hand-held devices are sold annually for communication, data input, storage and an optical pod which includes a CyberDisplay product. In 2010, we entered into a license agreement with a customer who acquiredretrieval, accessing the exclusive rights to develop Golden-i productsinternet, and other purposes. Derivative wireless devices such as Bluetooth headsets and Smart Watches are available for the industrial market. In 2011 we commenced selling Golden-i Developer Kits which providedpurpose of allowing the basic functionality in orderuser to spur interest from potential end customers of our licenseeaccess their wireless handsets' voice and also software application developers. Sales of the Golden-i Developer Kits were diminimis in 2011 and we do not expect significant revenue from this product in 2012.Industry OverviewIII-V ProductsAdvanced semiconductor materials are used in the manufacture of integrated circuits for high frequency, low power applications. The rapid growth intext communication features without holding the wireless communications industry has fueled demandhandset. Wearable computing devices also include body-worn devices such as scanners and terminals which are sold in industrial markets to improve worker productivity. The user interface for these integrated circuits for use indevices is typically either a key pad or a touch screen however some wireless handsets.In first generationdevices include voice recognition software as an additional feature to allow the user to search the Internet. We believe wireless handset makers are looking to create products that work as a complement to the wireless handsets integrated circuits used in high frequency, low power amplifiers were generally constructed with silicon-based semiconductors. These integrated circuits, while relatively inexpensiveor to manufacture, were unable to delivereventually replace the ever increasing performance demanded by wireless handset manufacturers and their customers. This inability led tohandset. Wireless network companies are encouraging the development of gallium arsenidemore products that utilize their network capacity and other companies are developing products which provide continuous access to social media outlets. In order for usethe markets for these new products to develop further advances in wireless communications. Gallium arsenide is generally regarded as having better performance characteristics than silicon due, in part, to its inherent physical properties that permit gallium arsenide integrated circuits to operate at muchthe devices and application software will be required. Device improvements include smaller higher frequencies than silicon integrated circuits, or operate at the same frequency withresolution displays, lower power consumption. The reduction in system power requirements is particularly important in portable applications, such as wireless handsets, because it extends battery life.The high performance characteristics of gallium arsenide have led to an increased use of gallium arsenide-based transistors to satisfy the industry’s need for even greater performance. Since the mid 1990s these gallium arsenide transistors include our HBT transistor wafer for use in wireless handset products which use digital signal processingprocessors, longer-life batteries, compact optics and generally operate at higher cellular frequencies. Air interface standards in these frequency bands include Global System Mobile, or GSM, Time Division Multiple Access, or TDMA,software including voice recognition and Code Division Multiple Access, or CDMA, and provide improved capacity, sound quality and capabilities at cellular and wireless frequency bands, but are incompatible with each other and have fragmentednoise cancellation. For the market for equipment. Suppliers of wireless handsets now offer multi-modethese devices to grow application software must be developed that exploit their new features and multi-band wireless handsets which are capable of switching from one high frequency band to another to enable consumers to use wireless handsets across various territories and different interface standards. This new generation of products is significantly more complex than the prior generation and requires certain key features, including:Simpler system design;Support for higher frequencies;
4
Lower power consumption;
Improved signal quality; and
Wider range of operating temperatures.
CyberDisplay™ Products
Small form factor displays are used in military, consumer electronic and industrial products such as thermal weapon sights, camcordersdigital cameras, training and digital cameras.simulation products and metrology tools. We expect the market for wireless communications devices, including personal entertainment systems, will continue to grow. In order for this market to develop, advances in wireless communications systems such as greater bandwidth and increased functionality, including real-time wireless data, broadband Internet access and mobile television, will be necessary. We believe small form factor displays will be a critical component in the development of advanced mobile wireless communications systems as these systems must provide high resolution images without compromising the portability of the product.
|
|
We believe that the high growth potential for portable communications products can be realized effectively only if these products are available at a reasonable priceintegrated to create headset reference designs which use voice as the user interface and are able to clearly present to end users the information they wish to access without compromising the size of the product. These products, as well as future models of digital cameras and other consumer electronics, are well suited forthrough the use of wireless technologies can contact other users or information from the cloud. The headset reference designs range from a miniature, low cost display with low power consumption and sharp monochrome or rich, full color high resolution images. To date, display technologies have not fully addressed these needs due to constraints with respect to size, power consumption, resolution, cost or full color capability.
Golden-i™ Products
Laptop computers, PCs and tablets are used in the work place as stand alone devices or as part of systems. These devices requireheadset which resembles typical eyeglasses but include audio capabilities allowing the user to operatecommunicate with other users to our industrial headset reference design, called Golden-i, which includes an optical pod with one of our display products, a key board for data inputmicroprocessor, memory and information retrieval. Ifvarious commercially available software packages that we license such as Microsoft Windows CE or Android, Nuance Dragon NaturallySpeaking, Ask Ziggy natural speech, and Hillcrest Labs motion control. All of our headset reference designs utilize operating system software we developed and include our proprietary noise cancellation technologies. The optical pod allows the user of these devices works outdoorsto view information such as WEB data, technical diagrams, streaming video or in environments withface to face communication. When viewing schematics or similar conditions the device may have to be “ruggedized”, which adds weight, increases its size and adds cost. The display performance of these devices is affected by ambient lighting conditions. In addition ifdocuments the user is requiredcapable of zooming-in to wear gloves insee finer details or zooming out to see an entire system perspective. Some headset reference designs have a camera feature which enables the performanceuser to stream live video to a remote subject matter expert so that both the user and expert can analyze the issue at the same time.
5
Our Solution
III-Vprimary interface as opposed to a touch screen or keyboard.
We manufacture our HBT transistor wafers using our proprietary metal organic chemical vapor deposition (MOCVD) semiconductor growth techniques and our Wafer Engineering™ process. Our Wafer Engineering™ process significantly reduces the number of defects which naturally occur when different semiconductor materials are combined. By depositing films of atomic-level thickness on gallium arsenide or indium phosphide wafers, we are able to create HBT transistor wafers that consist of a series of material layers which form a vertical transistor. This transistor structure enables the design of integrated circuits in which individual transistors are vertically arranged.
We believe that the vertical structure of an HBT transistor offers the following advantages to an integrated circuit manufacturer:
|
|
We believe our HBT transistor wafers also offer the following additional advantages over gallium arsenide field effect transistors:
|
|
|
CyberDisplay™ Products
6
a Binocular Display Module or BDM, and thermal weapon sight eyepieces which contain a CyberDisplay, light emitting diode, optics, and electronics in a hermetically sealed housing. In contrastrefer to current passive matrix and active matrix LCD approaches, our CyberDisplayas CyberDisplay™ products, utilize high quality, single crystal silicon—thesilicon-the same high quality silicon used in conventional integrated circuits. This single crystal silicon is not grown on glass; rather, it is first formed on a silicon wafer and patterned into an integrated circuit (including the active matrix, driver circuitry and other logic circuits) in an integrated circuit foundry. The silicon wafer is then sent to our facilities and the integrated circuit is lifted off as a thin film and transferred to glass using our proprietary Wafer™ Engineering technology, so that the transferred layer is a fully functional active matrix integrated circuit.
circuit which now resides on a transparent substrate.
Greater miniaturization;
Higher pixel density;
Full color capability; and
Lower power consumption.
After the CyberDisplay display, has been packaged and if it is to be used in a weapon sight such as a thermal weapon sight, the packaged display is sentfabricated, tested and routed to our “Higher Level Assembly” or HLA assembly area, where it is incorporated in tointo a module we manufacture.module. We offer a variety of models with varying levels of complexity but common to all is a light emitting diode,our display, illuminations source, optics and electronics in a housingsealed unit.
Golden-i™ Technology
7
commands and head gestures. The systemcamera feature which allows the user to access information or operate remote devices through the internet using WiFi or Bluetooth or potentially other wireless networks. The optical pod allows the user to view information such as technical diagrams, streaming video or face to face communication. When viewing schematics or similar documents the user is capable of zooming-in to see finer details or zooming out to see an entire system perspective. The Golden-i product has a camera feature which enables the user to stream livesend video to a Remote Subject Matter Expert so that both the user and expert can analyze the issue at the same time.remote third party. Our Golden-i products are significantly lighter than competing solutions such as laptops, PCs or tablets. We believe our Golden-i technology will provide for increased worker productivity, safety and improved manufacturing quality through more efficient issue resolution and improved communication.
Strategy
Our strategybusiness model is to develop products which are centered on the mobile world. Our III-V products improve the speedlicense our reference designs and volume of voice and data which can be transmitted wirelessly to mobile devices such as 3G and 4G smartphones, our micro display was created to be the destination pointenter into agreements for the data flowing oversale of the wireless networksoptical pod or to sell our display and components separately. We offer our Golden-i device is designedproducts to provide a hands-free remote access, controldevelopers and collaboration via the internet through the wireless networks. Our objective is to be the leading suppliermanufacturers of advanced semiconductor materials and miniature displays and display systems that enable our customers to develop and manufacture differentiated communications,industrial products, military industrial andproducts, consumer electronic devices in high volumes.products, 3d metrology equipment manufacturers and manufacturers of the next generation of mobile devices. The critical elements of our strategy include:
|
|
|
|
8
III-V Products
We
Using our HBT transistor wafers, our customers have developed gallium arsenide power amplifiers for wireless handsets. Our HBT transistor wafers are used in Code Division Multiple Access, Global System Mobile and Time Division Multiple Access power amplifiers, third generation (3G) and fourth generation (4G) wireless handset standards.
In addition to wireless handset power amplifiers, our HBT transistor wafers are also being used in the fabrication of power amplifiers for devices which communicate using wireless fidelity or “WiFi” integrated circuits. Our HBT transistor wafers are also used in high-speed fiber optic switching.
WeGolden-i headset reference design our HBT transistor wafers in collaboration with our customers’ engineering teams in order to create customized products that meet their specific application needs. Our largest customer for our HBT transistor wafers is Skyworks Solutions. Skyworks Solutions also uses the foundry services of Advanced Wireless Semiconductor Company to process our HBT transistor wafers on its behalf. We sell HBT transistor wafers directly to AWSC for eventual resale by AWSC to Skyworks Solutions and their other customers. Other customers of our gallium arsenide products include RF Micro Devices and TriQuint Semiconductor. For fiscal years 2011, 2010 and 2009, sales of gallium arsenide products to Skyworks Solutions accounted for approximately 28%, 25%, and 20% of our total revenues, respectively. Sales to AWSC in 2011, 2010 and 2009 were 9%, 12% and 8% of our 2011, 2010 and 2009 revenues, respectively. Although we do not know exactly how much of our sales to AWSC are for products sold to Skyworks Solutions, we believe an investor should view our sales to Skyworks Solutions and AWSC in the aggregate for evaluating the importance of Skyworks Solutions as a customer to Kopin. We have a supply agreement with Skyworks Solutions which is scheduled to terminate in July 2012, excluding the agreement’s last buy option.
CyberDisplay™significant.
9
Golden-i™ Products
Our business model is to generate revenues by licensing for a royalty fee the Golden-i technology and knowhow, which includes the operating software and patented product designs, and selling a CyberDisplay product to a partner who develops and manufactures or distributes products based on the Golden-i technology. Our revenues in 2011 from the sale of Golden-i Development Kits were not significant and while we anticipate our licensee customer will introduce a product in 2012, we do not believe the revenues will be material in 2012.
We principally sell
20102013, 2012, and 20092011 we incurred total research and development expenses of $25.9$17.5 million, $19.7$14.3 million and $14.1
10
$16.6 million, respectively. Included in total research and development expenses are our internal development programs for new HBT and CyberDisplay products and development of the processes to manufacture CyberDisplay products using 8 inch wafers, which were $22.1 million, $17.0 million and $10.6 million, respectively, for fiscal years 2011, 2010 and 2009.
We intend to continue developing HBT transistor wafers and other gallium arsenide products for advanced integrated circuit applications from other compound materials. We are working with current and potential customers in the development of the next generation of HBT transistor wafers, including developing GaN (Gallium Nitride) HEMT (high electron mobility transistor) wafers.
CyberDisplay™ Products
Our display product development efforts are focused towards continually enhancing the resolution, performance and manufacturability of our CyberDisplaydisplay products. A principal focus of this effort is the improvement of manufacturing processes for very small active matrix pixels with our eight inch manufacturing line, which we will use in succeeding generations of our CyberDisplaydisplay products. The pixel size of our current CyberDisplaytransmissive display products ranges from 8.46.8 to 15 microns. These pixel sizes are much smaller than a pixel size of approximately 100 microns in a typical laptop computer display. The resolutions of our current commercially available CyberDisplaydisplay products are 320 x 240, 432 x 240, 640 x 480, 854 x 480, 800 x 600, and1,024 x 768, 1,280 x 1,024 pixels.and 2,048 x 1,536 pixels. In addition, we have demonstrated 2,048 x 2,048 resolution displays in a 0.96-inch diagonal size. We are also working on further decreasing the power consumption of our CyberDisplaydisplay products. The pixel size of our current reflective display products ranges from 8.2 to 13.6 microns. The resolutions of our current commercially available reflective display products are 1,024 x 768 and 1,280 x 1,024 pixels. Additional display development efforts include expanding the resolutions offered, increasing the quantity of CyberDisplay’sdisplay active matrix pixel arrays processed on each wafer by further reducing the display size, increasing the light throughput of our pixels, increasing manufacturing yields, and increasing the functionality of our HLA products.
Golden-i™
unit and improving the overall fit and fashion of the reference design.
III-V
With respect to our HBT transistor wafers, we presently compete with several companies, including IQE, Visual Photonics Epitaxy Co. Ltd. (VPEC), and Hitachi Cable, as well as integrated circuit manufacturers with in-house transistor growth capabilities, such as RF Micro Devices and Fujitsu. For our III-V products, pricing
11
competition is intense. The production of gallium arsenide integrated circuits has been and continues to be more costly than the production of silicon integrated circuits. Although we have reduced production costs of our HBT transistor wafers by achieving higher volumes and reducing raw material costs, we cannot be certain we will be able to continue to decrease production costs. In addition, we believe the costs of producing gallium arsenide integrated circuits by our customers will continue to exceed the costs associated with the production of competing silicon integrated circuits. As a result, we must target markets where these higher costs are justified by their superior performance.
CyberDisplay™ Products
Golden-i™
These companies are substantially larger than Kopin from revenue, cash flow and asset perspectives. In addition, Google has developed a device named Google Glass which is a headset product with similar form and function as our headsets. Google is substantially larger than Kopin from revenue, cash flow and asset perspectives.
12
months after their earliest claim to priority and since publication of discoveries in the scientific and patent literature lags behind actual discoveries, we cannot be certain that we were the first to conceive of inventions covered by pending patent applications or the first to file patent applications on such inventions. We cannot be certain that our pending patent applications or those of our licensorslicensor's will result in issued patents or that any issued patents will afford protection against a competitor. In addition, we cannot be certain that others will not obtain patents that we would need to license, circumvent or cease manufacturing and sales of products covered by these patents, nor can we be sure that licenses, if needed, would be available to us on favorable terms, if at all.
13
production, or a cessation of operations. Any failure on our part to control the use of, or adequately restrict the discharge of, hazardous substances, or otherwise comply with environmental regulations, could subject us to significant future liabilities. Any failure on our part to obtain any required licenses for the export of technical data and/or sales of our products or to otherwise comply with ITAR, could subject us to significant future liabilities. In addition, we cannot be certain that we have not in the past violated applicable laws or regulations, which violations could result in required remediation or other liabilities.
On January 11, 2011, we purchased
We own 78%FDD within our consolidated financial statements.
From Kopin Taiwan Corp’s (KTC) inception in 2002 through July 2009April 2013, the Company owned approximately 35% of KTC. In July 2009, the Company purchased 19,572,468 and 128,226 shares of KTC common stock for approximately $5,975,000 and $300,000, respectively, which increased the Company’s ownership to approximately 87%. Accordingly since July 2009 the Company has included KTC in its consolidated financial statements. In 2010, the Company purchased 14,349,809 shares of KTC common stock for approximately $6,150,000 to increase the Company’s ownership to approximately 90%.
One of our Directors is chairman of KTC and owns approximately 1%acquired 51% of the outstanding common stock of KTC.
eMDT America, Inc. (eMDT), a private company, for $400,000 and began consolidating eMDT, Inc into our financial statements in April of that year.
we wrote it down to $0.
14
display module, and other modules include lenses, backlights, printed circuit boards and other components, which we purchase from third party suppliers. Some of these third party contractors and suppliers are small companies with limited financial resources. In addition, relative to the commercial market, the military buys a small number of units which prevents us from qualifying and buying components
01581.
Officers
John C.C. Fan, age 68
President, Chief Executive Officer and Chairman
Founded Kopin in 1985
Richard A. Sneider, age 51
Treasurer and Chief Financial Officer
Joined Kopin 1998
Hong Choi, age 60
Vice President and Chief Technology Officer
Joined Kopin in 2000
Bor-Yeu Tsaur, age 56
| John C.C. Fan, age 70 | Bor-Yeu Tsaur, age 58 | |||||
| Ÿ | President, Chief Executive Officer and Chairman | Ÿ | Executive Vice President—Display Operations | |||
| Ÿ | Founded Kopin in 1984 | Ÿ | Joined Kopin in 1997 | |||
| Richard A. Sneider, age 53 | Michael Presz, age 60 | |||||
| Ÿ | Treasurer and Chief Financial Officer | Ÿ | Vice President—Government Programs and Special Projects | |||
| Ÿ | Joined Kopin in 1998 | Ÿ | Joined Kopin in 1994 | |||
| Hong Choi, age 62 | ||||||
| Ÿ | Vice President and Chief Technology Officer | |||||
| Ÿ | Joined Kopin in 2000 | |||||
Executive Vice President—Display Operations
Joined Kopin in 1997
Michael Presz, age 58
Vice President—Government Programs and Special Projects
Joined Kopin in 1994
Daily Hill, age 54
Senior Vice President—III-V Operations
Joined Kopin in 1987
| Item 1A. | Risk Factors |
15
Our revenues, profitability and cash flows could be negatively affected if sales of our CyberDisplay products for military applications significantly decline. A significant part of our fiscal year 2011 income from operations and our strategy to maintain profitability in fiscal year 2012 and beyond is to sell our CyberDisplay products for use in U.S. military applications because these products are sold with higher margins than our commercial display or III-V products. Our ability to continue to generate revenues and profits from sales to the U.S. military will be affected by the following events:
The U.S. federal government has incurred and is expected to continue to incur large federal budget deficits. As part of its plan to deal with the federal deficits the U.S. federal government has stated its intention to reduce spending on military programs. The current federal budget forecasts lower unit purchases of thermal weapon sights (TWS) that incorporate our display products.
We are currently selling our display products to three defense contractors who in turn incorporate our product in to their TWS product which they sell to the U.S. military. The U.S. military has stated its intention to reduce the number of suppliers for this TWS program. We sell different display products to each of the three suppliers. One supplier buys only a display while the other two buy a display module. Our sales price and profits are different by product type ; accordingly our revenues and profits will be affected by who the military decides to source the TWS product. In addition the winner of the program has the option to procure displays from our competition in which case we may significantly less revenue than we have historically from this program.
There are new U.S. military production and development programs that we are bidding on such as the Enhanced Night Vision Goggle. We are competing against other display solutions and we may not be awarded contracts. In addition the government may delay awarding or implementing these programs.
If the U.S. government significantly reduces funding for the TWS programs, and we are not able to win additional programs, we will not be profitable.
Our revenues, profitability and cash flows could be negatively affected if certain wireless handset trends do not meet expectations. Our Heterojunction Bipolar Transistor (HBT) wafers are sold to manufacturers who in turn produce Power Amplifier (PA) chip sets which are sold to wireless handset manufactures. The PA chip set amplifies signal strength in a wireless handset such as the voice signal. With the advent of smartphone the number of signals emitting from a wireless handset has increased. For instance the handset may have a voice signal, a GPS signal, and a WiFi signal. The number of our products which ultimately end up in a wireless handset is dependent on the number of signals emitting from a wireless handset. For instance smartphones, “3G” and “4G” wireless handsets typically contains more of our III-V products than a basic wireless handset. An important factor in our strategy to grow our III-V product sales is based on the expectation that the sales of smart phones, 3G and 4G wireless handsets and similar devices will become an increasing percentage of the overall sales of wireless handsets. Some industry estimates have smartphones growing at a constant annual rate of 25% or more over the next four to five years. We anticipate at least double digit growth rates for smartphones, 3G and 4G handsets and similar devices over the next few years.
In addition to the fact that a smartphone would generally contain more content of our product a smartphone typically requires our latest HBT products, called Bifets and BiHEMTs, which are more complex than the traditional HBT used in a basic wireless handset. Our Bifet and BiHEMT products have higher average selling prices than our traditional HBT. Our revenues, profits and cash flows may be negatively impacted if the following occur:
The rate of growth of smartphones, 3G and 4G wireless handset and similar devices is lower than expected;
Our customers are able to design and sell products which can meet the increasing needs of smartphones, 3G, 4G and similar devices without the need to increase the amount content of our products in their products so that our expectation of demand increase because of smartphone, 3G and 4G wireless handsets and similar devices does not happen; and
16
We and our competitors overestimate the growth rate of smartphones, 3G and 4G wireless handsets and similar devices and we expand capacity at a rate in excess of demand. Historically this over capacity situation results in average sales prices declining at faster than normal rate.
and profitability. If we are unable to reduce the cost ofcommercialize our wearable computing products our financial results couldwe may not be negatively impacted. The sales prices of our commercial products and, to a lesser extent, our military products, have historically declined each year. Our strategy to maintain our gross margin is to improve manufacturing efficiencies and yields, consolidate production facilities, shift production of legacy III-V products to Kopin Taiwan Corporation (KTC) which has is a lower cost production facility, increase production of larger diameter wafers (8-inch for display products) and use our purchasing power to obtain reduced raw material and component pricing from our vendors. In 2009, we obtained an 87% interest in KTCable to increase our capacity to produce 6-inch HBT transistor wafers. In order to use KTC’s production capacity KTC’s production processes must be qualified by our customers.revenues, achieve profitability or positive cash flow.
| Sales as a Percent of Total Revenue | ||||||||||||
Customer | 2011 | 2010 | 2009 | |||||||||
Skyworks Solutions, Inc (A) | 28 | % | 25 | % | 20 | % | ||||||
Advanced Wireless Semiconductor Company | 9 | 12 | 8 | |||||||||
Military Customers (B) | 30 | 33 | 45 | |||||||||
United States Government Funded Research and Development Contracts | 4 | 3 | 6 | |||||||||
Raytheon Company (B) | 12 | 18 | 14 | |||||||||
DRS Technologies (B) | * | * | 19 | |||||||||
17
A significant reduction or delay in orders from any of our significant commercial customers would materially reduce our revenue and cash flow are expected to come from sales of military products. The U.S. federal government has incurred and adversely affectis expected to continue to incur large federal budget deficits and the U.S. federal government has stated its intention to reduce spending on military programs. Accordingly our ability to achieve or maintain profitabilitygenerate revenues and cash flow from sales to the U.S. military is dependent on our displays being qualified in new U.S. military programs and the future.U.S. military funding these new programs. If we experience a significant reductionare unable to be qualified into new U.S. military programs or delay in orders from any ofthese programs are not funded our significant military customers ourability to generate revenues, achieve profitability and positive cash flow will be negatively impacted and we will not achieve profitability in 2011, unless the other military customers increased orders to sufficiently offset the decline. The sales to Skyworks Solutions and, to some extent, AWSC have been under a purchase and supply agreement with Skyworks Solutions which expires in July 2012.impacted.
Ifunable to supply our display products to our customers. In the past, we failexperienced several power outages at our facilities which ranged in duration from one to keep pace with changing technologies,four days. Additionally, as we may lose customers. Rapidly changing customer requirements, evolving technologies and industry standards characterize the wireless communications, semiconductor materials andintroduce new equipment into our manufacturing processes, our display industries. To achieve our goals, we need to enhance our existing products and develop and market new products that keep pace with continuing changes in industry standards, requirements and customer preferences. If we cannot keep pace with these changes, our business could suffer.
If our security systems are penetrated and confidential and or proprietary information were taken we could be subject to fines, law suitsespecially wide variations in manufacturing yields and loss of customers.efficiency. We rely on our electronic information systems to perform the routine transactions to run our business.may experience manufacturing problems that would result in delays in product introduction and delivery or yield fluctuations. We transact business over the internet with customers, vendors electronically and our subsidiaries. We have implemented security measures to protect unauthorized access to this information. We haveare also implemented security policies which limit access via the internet from the companysubject to the outside world based onrisks associated with the individual’s positionshortage of raw materials used in the company. We routinely receive security patches for the software we use from the software providers. Our primary concerns are inappropriate access to personnel information, information covered under the International Traffic in Arms Regulation, product designs and manufacturing information, financial information andmanufacture of our intellectual property, trade secrets and know-how. If our security systems are penetrated and confidential and or proprietary information where taken we could be subject to fines, law suites and loss of customersproducts.
Lack of control over production capacity and delivery schedules;
Limited control over quality assurance, manufacturing yields and production costs;
The risks associated with international commerce, including unexpected changes in legal and regulatory requirements, changes in tariffs and trade policies and political and economic instability; and
Natural disasters such as earthquakes, tsunami, mudslides, drought, hurricanes and tornadoes.
18
19
subcontractor to perform under the contract. If the federal government terminates a contract with our customer our contract with our customers generally would entitle us to recover only our incurred or committed costs, settlement expenses and profit on the work completed prior to termination. However, under certain circumstances, our recovery costs upon termination for convenience of such a contract may be limited. As is common with government contractors, we have experienced occasional performance issues under some of our contracts. We may in the future receive show-cause or cure notices under contracts that, if not addressed to the federal government’sgovernment's satisfaction, could give the government the right to terminate those contracts for default or to cease procuring our services under those contracts.
Our CyberDisplay™products may not be widely accepted by the market. Our success will in large part depend on the widespread adoption of the viewing format of our CyberDisplay products in multiple applications. Our success also depends upon the widespread consumer acceptance of our customers’ products. CyberDisplay products work best when used close to the eye, which may not be acceptable to consumers. In addition, CyberDisplay products are not designed for a shared experience amongst multiple viewers at the same time. Potential customers may be reluctant to adopt our CyberDisplay products because of concerns surrounding perceived risks relating to:
The introduction of our display technology generally;
20
Consumer acceptance of our CyberDisplay products; and
The relative complexity, reliability, usefulness and cost-effectiveness of our display products compared to other display products available in the market or that may be developed by our competitors. In addition, our customers may be reluctant to rely upon a relatively small company like us for a critical component. We cannot assure investors that prospective customers will adopt our CyberDisplay products or that consumers will accept our CyberDisplay products in future applications. If we fail to achieve market acceptance of our CyberDisplay products, our business may not be successful and we may not be able to maintain profitability.
We generally do not have long-term contracts with our CyberDisplay customers, which makes forecasting our revenues and operating results difficult. We generally do not enter into long-term agreements with our commercial CyberDisplaydisplay customers obligating them to purchase our products. Our business is characterized by short-term purchase orders and shipment schedules and we generally permit orders to be canceled or rescheduled before shipment without significant penalty. As a result, our customers may cease purchasing our products at any time, which makes forecasting our revenues difficult. In addition, due to the absence of substantial non-cancelable backlog, we typically plan our production and inventory levels based on internal forecasts of customer demand, which are highly unpredictable and can fluctuate substantially. Our operating results are difficult to forecast because we are continuing to invest in capital equipment and increasing our operating expenses for new product development. If we fail to accurately forecast our revenues and operating results, our business may not be successful and the value of investors’investors' investment in us may decline.
fines, law suites and loss of customers.
The timing and successful introduction of additional manufacturing capacity;
The timing of the initial selection of our III-VWearable technology and CyberDisplaydisplay products as a component in our customers’customers' new products;
Availability of interface electronics for our CyberDisplay;
Competitive pressures on selling prices of our products;
The timing and cancellation of customer orders;
Our ability to introduce new products and technologies on a timely basis;
21
Our ability to successfully reduce costs;
The cancellation of U.S. government contracts; and
Our ability to secure agreements from our major customers for the purchase of our products.
The Federal Acquisition Regulation, which comprehensively regulates the formation, administration and performance of federal government contracts;
The Truth in Negotiations Act, which requires certification and disclosure of all cost and pricing data in connection with contract negotiations;
The Cost Accounting Standards and Cost Principles, which impose accounting requirements that govern our right to reimbursement under certain cost-based federal government contracts; and
Laws, regulations and executive orders restricting the use and dissemination of information classified for national security purposes and the export of certain products, services and technical data. We engage in international work falling under the jurisdiction of U.S. export control laws. Failure to comply with these control regimes can lead to severe penalties, both civil and criminal, and can include debarment from contracting with the U.S. government.
Termination of contracts;
Forfeiture of profits;
Cost associated with triggering of price reduction clauses;
Suspension of payments;
•Fines; and
•Suspension or debarment from doing business with federal government agencies.
22
Increased competition may resultprofit on contracts that did not have government funding in decreased demand or lower prices for our products. Competition in the markets for our products is intense and we may not be able to compete successfully. We compete with several companies, mostplace, any of whom are much larger than us, who are primarily engaged in the business of designing, manufacturing and selling integrated circuits or alternative display technologies, as well as the supply of other discrete products. Our competitorswhich could develop new process technologies that may be superior to ours, including technologies that target markets in which our products are sold. Many of our existing and potential competitors have strong market position, considerable internal manufacturing capacity, established intellectual property rights and substantial technological capabilities. Furthermore, they also have greater financial, technical, manufacturing, and marketing resources than we do, and we may not be able to compete successfully with them.
In addition, many of our existing and potential customers manufacture or assemble displays and wireless communications devices and have substantial in-house technological capabilities and substantially greater resources than we do. We may not be able to sell our products to these customers and they may commercialize their internal capabilities to become our competitors. If one of our large customers establishes internal design and manufacturing capabilities, it could have an adverse effect on our operating results.
We expect competition to increase. This could mean lower prices or reduced demand for our products. Any of these developments would have an adverse effect on our operating results.
Disruptions of our production of our III-V and CyberDisplay products would adversely affect our operatingoperations, cash flow and financial results. If we were
Our supply chain is complex and we may be unable to verify the origins for all metals used in our products. We purchase materials from foreign sources and they may not cooperate and provide us with the necessary information to allow us to comply with the Act. This may require us to find alternative sources which could delay product shipments. We may not be successful in protectingalso encounter challenges with our intellectual propertycustomers and proprietary rights. Our success depends in part on our ability to protect our intellectual property and proprietary rights. We have obtained certain domestic and foreign patents and we intend to continue to seek patents on our inventions when appropriate. We also attempt to protect our proprietary information with contractual arrangements and under trade secret laws. Our employees and consultants generally enter into agreements containing provisions with respect to confidentiality and the assignment of rights to inventions made by them while in our employ. These measures may not adequately protect our intellectual and proprietary rights. Existing trade secret, trademark and copyright laws afford only limited protection and our patents could be invalidated or circumvented. Moreover, the laws of certain foreign countries in which our products are or may be manufactured or sold may not fully protect our
23
intellectual property rights. Misappropriation of our technology and the costs of defending our intellectual property rights from misappropriation could substantially impair our business. Ifstockholders if we are unable to protect our intellectual property and proprietary rights, our business may not be successful and the value of investors’ investment in us may decline.
Our products could infringe on the intellectual property rights of others. Companies in the wireless communications, semiconductor and display industries steadfastly pursue and protect intellectual property rights. This has resulted in considerable and costly litigation to determine the validity of patents and claims by third parties of infringement of patents or other intellectual property. Our products could be found to infringe on the intellectual property rights of others. Other companies may hold or obtain patents or inventions or other proprietary rights in technology necessary for our business. Periodically companies inquire aboutcertify that our products and technology in their attempts to assess whether we violate their intellectual property rights. If we are forced to defend against infringement claims, we may face costly litigation, diversion of technical and management personnel, and product shipment delays, even if the allegations of infringement are unwarranted. If there is a successful claim of infringement against us and we are unable to develop non-infringing technology or license the infringed or similar technology on a timely basis, or if we are required to cease using one or more of our business or product names due to a successful trademark infringement claim against us, it could adversely affect our business.conflict free.
We may pursue acquisitions and investments that could adversely affect our business. In the past we have made, and in the future we may make, acquisitions of, and investments in, businesses, products and technologies that could complement or expand our business. If we identify an acquisition candidate, we may not be able to successfully negotiate or finance the acquisition or integrate the acquired businesses, products or technologies into our existing business and products. Future acquisitions could result in potentially dilutive issuances of equity securities, the incurrence of debt and contingent liabilities, amortization expenses and write-downs of acquired assets. In January 2011 we acquired Forth Dimension Displays Ltd. (FDD). If we are unable to operate FDD profitably our results of operations will be negatively affected.
We may incur significant liabilities if we fail to comply with stringent environmental laws and regulations and the International Traffic in Arms Regulations or if we did not comply with these regulations in the past. We are subject to a variety of federal, state and local governmental regulations related to the use, storage, discharge and disposal of toxic or otherwise hazardous chemicals used in our manufacturing process. We are also subject to federal International Traffic in Arms Regulations (ITAR) laws which regulate the export of technical data and sale of products to other nations which may use these products for military purposes. The failure to comply with present or future regulations could result in fines being imposed on us, suspension of production, or a cessation of operations. Any failure on our part to control the use of, or adequately restrict the discharge of, hazardous substances, or otherwise comply with environmental regulations, could subject us to significant future liabilities. Any failure on our part to obtain any required licenses for the export of technical data and/or sales of our products or to otherwise comply with ITAR, could subject us to significant future liabilities. In addition, we cannot be certain
24
| Item 1B. | Unresolved Staff Comments |
| Item 2. | Properties |
We lease our domestic III-V product manufacturing facilities and corporate headquarters located in Taunton, Massachusetts. The Taunton facilities occupy 25,100 and 60,000 square feet, including 6,000 and 6,400 square feet of contiguous environmentally controlled production clean rooms under leases that expire in 2012 and 2020, respectively. We do not anticipate renewing the Taunton lease which expires in 2012.
Santa Clara, California which houses our wearable computing Tech center. These facility leases expire in 2014 and 2016, respectively.
2016. Ikanos Consulting, Ltd., our subsidiary in the United Kingdom, leases two properties which occupy an aggregate of 7,000 square feet. These leases expire in 2016 and 2017.
| Item 3. | Legal Proceedings |
| Item 4. | Mine Safety Disclosures |
25
applicable.
Fiscal Year Ended December 31, 2011 First Quarter Second Quarter Third Quarter Fourth Quarter Fiscal Year Ended December 25, 2010 First Quarter Second Quarter Third Quarter Fourth Quarter Plan Category Total equity compensation plans approved by security holders (1)Item 5. Market for Registrant’s Common Equity, Related Stockholder Matters and Issuer Purchases of Equity Securities High Low $ 4.40 $ 3.97 5.22 4.29 4.85 3.31 4.24 3.07 $ 4.74 $ 3.60 4.50 3.21 3.85 2.75 4.48 3.37 High Low Fiscal Year Ended December 28, 2013 First Quarter $ 3.71 $ 3.17 Second Quarter 3.78 3.13 Third Quarter 4.33 3.30 Fourth Quarter 4.28 3.43 Fiscal Year Ended December 29, 2012 First Quarter $ 4.08 $ 3.30 Second Quarter 4.05 3.06 Third Quarter 3.86 3.23 Fourth Quarter 3.87 2.94 9, 2012,7, 2014, there were approximately 481458 stockholders of record of our common stock, which does not reflect those shares held beneficially or those shares held in “street” name.31, 201128, 2013 about shares of the Company’s common stock issuable upon exercise of outstanding options, warrants and rights and available for issuance under our existing equity compensation plans. Number of securities to
be issued upon exercise
of outstanding options,
warrants and rights Weighted-average
exercise price of
outstanding options,
warrants and rights Number of securities
remaining available
for future issuance
under equity
compensation plans
(excluding securities
reflected in column (a)) (a) 1,903,325 $ 5.07 580,178 (2) Plan Category Weighted-average exercise price of outstanding options, warrants and rights Number of securities remaining available for future issuance under equity compensation plans (excluding securities reflected in column a) Total equity compensation plans approved by security holders (1) 558,850 $ 5.09 1,237,080 (2) (1) Consists of the 2001 Equity Incentive Plan and the 2010 Equity Incentive Plan. (2) Shares available under the 2010 Equity Incentive Plan.
26
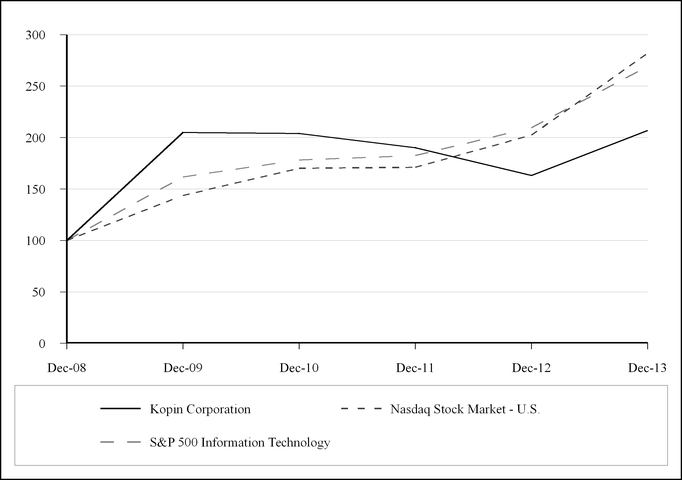
Period September 25, 2011 through October 22, 2011 October 23, 2011 through November 19, 2011 November 20, 2011 through December 31, 2011 (1)(2) Total Statement of Operations Data: Revenues: Net product revenues Research and development revenues Total revenues Expenses: Cost of product revenues Research and development—funded programs Research and development—internal Selling, general and administrative Impairment of intangible assets and goodwill (Loss) income from operations Other income and expense: Interest income Other income and expense, net Foreign currency transaction (losses) gains Gain (loss) on loans to KTC Gain on remeasurement of investment in KTC Impairment of investment in Kenet Other-than-temporary impairment of marketable debt securities Other-than-temporary impairment of Micrel common stock Gain on sales of investments Gain on sales of patents Income (loss) before benefit (provision) for income taxes, equity (losses) earnings in unconsolidated affiliates and net (income) loss of noncontrolling interest Tax benefit (provision) Income (loss) before equity (losses) earnings in unconsolidated affiliates and net (income) loss of noncontrolling interest Equity (losses) earnings in unconsolidated affiliates Net income (loss) Net (income) loss attributable to the noncontrolling interest Net income (loss) attributable to the controlling interest Net income (loss) per share: Basic Diluted Weighted average number of common shares outstanding: Basic Diluted Balance Sheet Data: Cash and cash equivalents and marketable debt securities Working capital Total assets Long-term obligations Total stockholders’ equity GAAP operating (loss) income Share-based compensation expense Impairment of intangible assets and goodwill Insurance proceeds Non-GAAP operating income GAAP net income Share-based compensation expense Impairment of intangible assets and goodwill Insurance proceeds Release of valuation allowance Non-GAAP net income GAAP net income per share, diluted Share-based compensation expense Impairment of intangible assets and goodwill Insurance proceeds Release of valuation allowance Non-GAAP net income per share, diluted 31, 2006.xx, 2008. Data points on the graph are annual. Note that historical price performance is not necessarily indicative of future performance.
The following table provides information regarding repurchases of common stock made by us during the fiscal quarter ended December 31, 2011: Total number
of Shares
Purchased Average
Price Paid
per Share Total Number
of Shares
Purchased as
Part of
Publicly
Announced
Plans or
Programs Maximum
Approximate
Dollar of
Shares that
May Yet Be
Purchased
Under the
Plans or
Programs (a) 117,920 $ 3.62 117,920 $ 11,512,702 99,694 $ 3.98 99,694 $ 11,116,085 383,785 $ 3.88 144,486 $ 10,585,373 601,399 $ 3.84 362,100 (1)Amount in column (a) includes shares of our common stock withheld from employees in connection with the satisfaction of tax withholding obligations under restricted stock agreements between Kopin and certain of its key employees.(2)On December 8, 2010 the Board of Directors of the Company approved a stock repurchase plan for up to $15 million of our common stock through December 8, 2012.27Item 6. Selected Financial Data Fiscal Year Ended 2011 2010 2009 2008 2007 (in thousands, except per share data) $ 125,465 $ 116,623 $ 108,118 $ 107,582 $ 94,191 5,680 3,763 6,537 7,223 3,958 131,145 120,386 114,655 114,805 98,149 82,110 81,224 75,983 77,980 78,625 3,742 2,693 3,586 5,076 3,157 22,133 17,041 10,561 10,898 8,300 18,929 14,838 14,136 15,980 18,009 5,000 — — — — 131,914 115,796 104,266 109,934 108,091 (769 ) 4,590 10,389 4,871 (9,942 ) 1,305 2,192 2,181 3,281 4,451 93 77 728 49 17 12 (419 ) (1,005 ) 2,296 93 — — 1,188 (1,188 ) — — — 599 — — — — — (2,691 ) — (151 ) — (927 ) (1,252 ) — — — — (224 ) (123 ) 369 2,598 — — — 156 770 6,324 — — 1,784 5,218 9,088 271 4,438 1,015 9,808 19,477 5,142 (5,504 ) 3,541 (252 ) (690 ) (792 ) (465 ) 4,556 9,556 18,787 4,350 (5,969 ) (296 ) (600 ) 483 (1,081 ) (275 ) $ 4,260 $ 8,956 $ 19,270 $ 3,269 $ (6,244 ) (662 ) (22 ) 173 (683 ) (312 ) $ 3,598 $ 8,934 $ 19,443 $ 2,586 $ (6,556 ) $ 0.06 $ 0.14 $ 0.29 $ 0.04 $ (0.10 ) $ 0.06 $ 0.13 $ 0.29 $ 0.04 $ (0.10 ) 64,406 66,020 66,850 67,876 67,544 65,234 66,712 67,458 68,164 67,544 Fiscal Year Ended 2011 2010 2009 2008 2007 105,419 110,947 114,547 100,016 93,304 123,948 132,098 134,198 116,841 107,931 194,564 192,096 183,224 159,677 161,054 1,296 945 903 867 806 170,788 170,625 164,302 141,394 141,034 28DISCUSSION REGARDING THE USE OF NON-GAAP FINANCIAL MEASURESOur earnings release contains some or all We have revised the prior period amounts for the sale of the following financial measuresIII-V product line, which have not been calculated in accordance with United States Generally Accepted Accounting Principles (GAAP): (i) non-GAAP operating income and operating margin, (ii) non-GAAP net income, and (iii) non-GAAP net income per share (diluted). As set forth in the “Unaudited Reconciliation of Non-GAAP Financial Measures” table found below, we derive such non-GAAP financial measures by excluding certain expenses and other items from the respective GAAP financial measure that is most directly comparable to each non-GAAP financial measure. Management uses these non-GAAP financial measures to evaluate our operating performance and compare it against past periods, make operating decisions, forecast for future periods, compare operating performance against peer companies and determine payments under certain compensation programs. These non-GAAP financial measures provide management with additional means to understand and evaluate the operating results and trends in our ongoing business by eliminating certain non-recurring expenses (which may not occur in each period presented) and other items that management believes might otherwise make comparisons of our ongoing business with prior periods and competitors more difficult, obscure trends in ongoing operations or reduce management's ability to make useful forecasts.We provide investors with non-GAAP operating income and operating margin and non-GAAP net income because we believe it is important for investors to be able to closely monitor and understand changes in our ability to generate income from ongoing businessreflected as discontinued operations. We believe these non-GAAP financial measures give investors an additional method to evaluate historical operating performance and identify trends, additional means of evaluating period-over-period operating performance and a method to facilitate certain comparisons of operating results to peer companies. We also believe that providing non-GAAP operating income and operating margin allows investors to assess the extent to which ongoing operations impact our overall financial performance. We further believe that providing non-GAAP net income and non-GAAP net income per share (diluted) allows investors to assess the overall financial performance of ongoing operations by eliminating the impact of certain tax items which may not occur in each period for which financial information is presented and which represent gains unrelated to our ongoing operations. We believe that disclosing these non-GAAP financial measures contributes to enhanced financial reporting transparency and provides investors with added clarity about complex financial performance measures.We calculate non-GAAP operating income by excluding from GAAP operating income, stock compensation expense and intangible assets and goodwill impairment charges. We calculate non-GAAP net income and net income per share (diluted) by excluding from GAAP net income and net income per share (diluted), stock compensation expense, goodwill impairment charges, insurance proceeds, and certain tax items, which may not occur in all periods for which financial information is presented. We exclude the items identified above from the respective non-GAAP financial measure referenced above for the reasons set forth with respect to each such excluded item below:Stock Compensation—we believe (1) the total amount of expense is partially outside of our control because it is based on factors such as stock price volatility and interest rates, which may be unrelated to our performance during the period in which the expense is incurred, (2) it is an expense based upon a valuation methodology premised on assumptions that vary over time, and (3) the amount of the expense can vary significantly between companies due to factors that can be outside of the control of such companies.Impairment of Intangible Assets and Goodwill—we believe such losses reflect forecasted results and do not necessarily reflect the performance of our ongoing operations for the period in which such charges are recognized.Gains from Insurance Proceeds—we believe such gains are outside the control of management and we do not believe that they reflect the underlying performance of ongoing business operations for such period.Certain Income Tax Items—includes the release of the valuation allowance which was recorded against the deferred tax assets of our Taiwanese subsidiary which do not result in a current tax refund.29 Fiscal Year Ended 2013 2012 2011 2010 2009 (in thousands, except per share data) Statement of Operations Data: Revenues: Net product revenues $ 20,575 $ 31,299 $ 59,509 $ 54,969 $ 62,512 Research and development revenues 2,323 3,343 5,150 3,172 5,691 Total revenues 22,898 34,642 64,659 58,141 68,203 Expenses: Cost of product revenues 20,655 22,042 34,659 35,597 39,003 Research and development—funded programs 1,551 2,178 3,341 2,175 3,060 Research and development—internal 15,983 12,121 13,218 10,972 8,295 Selling, general and administrative 19,125 17,166 15,991 12,322 13,047 Impairment of intangible assets and goodwill 1,511 1,705 5,000 — — 58,825 55,212 72,209 61,066 63,405 (Loss) income from operations (35,927 ) (20,570 ) (7,550 ) (2,925 ) 4,798 Other income and expense: Interest income 1,119 1,126 1,291 1,978 2,053 Other income and (expense), net 235 174 143 (31 ) 464 Foreign currency transaction (losses) gains (387 ) (1,032 ) 10 (304 ) (942 ) Impairment of investments (5,000 ) — — — — Loss on remeasurement of investment in Ikanos — (558 ) — — — Other-than-temporary impairment of marketable debt securities — — (151 ) — (927 ) Gain on sales of investments 1,899 856 369 2,598 — Gain on sales of patents — — 156 770 6,324 (2,134 ) 566 1,818 5,011 6,972 (Loss) income before benefit (provision) for income taxes, equity losses in unconsolidated affiliates and net loss (income) of noncontrolling interest (38,061 ) (20,004 ) (5,732 ) 2,086 11,770 Tax benefit (provision) 12,933 (1,099 ) — 54 (690 ) (Loss) income before equity losses in unconsolidated affiliates and net loss (income) of noncontrolling interest (25,128 ) (21,103 ) (5,732 ) 2,140 11,080 Equity losses in unconsolidated affiliates (625 ) (680 ) (297 ) (600 ) (341 ) (Loss) income from continuing operations $ (25,753 ) $ (21,783 ) $ (6,029 ) $ 1,540 $ 10,739 Income from discontinued operations, net of tax 20,147 2,789 9,713 7,300 8,436 The non-GAAP financial measures presented in the table below should not be considered in isolation and are not an alternative for the respective GAAP financial measure that is most directly comparable to each such non-GAAP financial measure. Investors are cautioned against placing undue reliance on these non-GAAP financial measures and are urged to review and consider carefully the adjustments made by management to the most directly comparable GAAP financial measures to arrive at these non-GAAP financial measures. Non-GAAP financial measures may have limited value as analytical tools because they may exclude certain expenses that some investors consider important in evaluating operating performance or ongoing business. Further, non-GAAP financial measures are likely to have limited value for purposes of drawing comparisons between companies because different companies may calculate similarly titled non-GAAP financial measures in different ways because non-GAAP measures are not based on any comprehensive set of accounting rules or principles.Fiscal year ended: 2011 2010 (769,339 ) $ 4,589,969 3,924,000 2,584,000 4,999,512 — — (1,500,000 ) $ 8,154,173 $ 5,673,969 $ 3,597,927 $ 8,934,151 3,924,000 2,584,000 4,999,512 — — (1,787,000 ) (4,266,000 ) — $ 8,255,439 $ 9,731,151 $ 0.06 $ 0.13 0.06 0.04 0.08 — — (0.03 ) (0.07 ) — $ 0.13 $ 0.15
30
| Net (loss) income | (5,606 | ) | (18,994 | ) | 3,684 | 8,840 | 19,175 | ||||||||||||
| Net loss (income) attributable to the noncontrolling interest | 896 | 632 | (605 | ) | (11 | ) | 268 | ||||||||||||
| Net (loss) income attributable to the controlling interest | $ | (4,710 | ) | $ | (18,362 | ) | $ | 3,079 | $ | 8,829 | $ | 19,443 | |||||||
| Net (loss) income per share: | |||||||||||||||||||
| Basic: | |||||||||||||||||||
| Continuing operations | $ | (0.40 | ) | $ | (0.33 | ) | $ | (0.10 | ) | $ | 0.02 | $ | 0.16 | ||||||
| Discontinued operations | 0.32 | 0.04 | 0.15 | 0.12 | 0.13 | ||||||||||||||
| Net (loss) income per share: | $ | (0.08 | ) | $ | (0.29 | ) | $ | 0.05 | $ | 0.14 | $ | 0.29 | |||||||
| Diluted: | |||||||||||||||||||
| Continuing operations | $ | (0.40 | ) | $ | (0.33 | ) | $ | (0.10 | ) | $ | 0.02 | $ | 0.16 | ||||||
| Discontinued operations | 0.32 | 0.04 | 0.15 | 0.11 | 0.13 | ||||||||||||||
| Net (loss) income per share: | $ | (0.08 | ) | $ | (0.29 | ) | $ | 0.05 | $ | 0.13 | $ | 0.29 | |||||||
| Weighted average number of common shares outstanding: | |||||||||||||||||||
| Basic | 62,348 | 63,618 | 64,406 | 66,020 | 66,850 | ||||||||||||||
| Diluted | 62,348 | 63,618 | 65,234 | 66,712 | 67,458 | ||||||||||||||
| Fiscal Year Ended | |||||||||||||||||||
| 2013 | 2012 | 2011 | 2010 | 2009 | |||||||||||||||
| Balance Sheet Data: | |||||||||||||||||||
| Cash and equivalents and marketable debt securities | $ | 112,729 | $ | 92,485 | $ | 105,419 | $ | 110,947 | $ | 114,547 | |||||||||
| Working capital | 108,369 | 106,791 | 123,257 | 132,098 | 134,198 | ||||||||||||||
| Total assets | 146,132 | 176,209 | 193,872 | 192,096 | 183,224 | ||||||||||||||
| Long-term obligations | 329 | 946 | 1,296 | 945 | 903 | ||||||||||||||
| Total stockholders’ equity | 134,563 | 155,086 | 170,097 | 170,625 | 164,302 | ||||||||||||||
| Item 7. | Management’s Discussion and Analysis of Financial Condition and Results of Operations |
Management’s
31
At December 31, 2011 we held minority investments in Advance Wireless Semiconductor Company (AWSC) and WIN Semiconductor Corp. (WIN), publicly traded companies on the Taiwan stock exchange whose share prices have been, and may continue to be, highly volatile. We consider these investments to be “available for sale” and accordingly account for fluctuations in the value of these investments in accumulated other comprehensive income. The fair market values of AWSC and WIN were $1.6 million and $1.7 million, respectively, at December 31, 2011.
32
33
performance or market criteria. The performance or market criteria primarilymay consist of the achievement of the Company’sCompany's annual incentive plan goals.goals, technology development or the Company’s stock attaining a certain price for a period of time. For nonvested restricted common stock awards which solely require the recipient to remain employed with the Company, the stock compensation expense is amortized over the anticipated service period. For nonvested restricted common stock awards which require the achievement of performance criteria, the Company reviews the probability of achieving the performance goals on a periodic basis. If the Company determines that it is probable that the performance criteria will be achieved, the amount of compensation cost derived for the performance goal is amortized over the service period. If the performance criteria are not met, no compensation cost is recognized and any previously recognized compensation cost is reversed. The Company recognizes compensation costs on a straight-line basis over the requisite service period for time vested awards.
We have an award to the CEO which vests For awards that vest upon our stock price achieving a certain price for 10 consecutive business days. Thea period of time the compensation expense associated with this award is recognized over the derived service period.
| 2012 | 2011 | ||||||||||||||||||||||
| Consolidated | III-V Product Line | Pro Forma | Consolidated | III-V Product Line | Pro Forma | ||||||||||||||||||
| Revenues | $ | 93.4 | $ | 58.8 | $ | 34.6 | $ | 131.1 | $ | 66.5 | $ | 64.6 | |||||||||||
| 2012 | |||||||||||
| Consolidated | III-V Product Line | Pro Forma | |||||||||
| Total Assets | $ | 176.2 | $ | 50.7 | $ | 125.5 | |||||
Our III-V products are manufactured by us in our manufacturing facilities in Taunton, Massachusetts, U.S.A. and Kopin Taiwan Corporation (KTC), our Taiwanese subsidiary and one of our reportable segments. Our CyberDisplay products arerevenues.
was a 53 weeks year.
Revenues. Our revenues, which include product sales and amounts earned from research and development contracts, for fiscal years 20112013 and 2010,2012, by category, were as follows (in millions):follows:
Revenues | 2011 | 2010 | ||||||
III-V | $ | 66.5 | $ | 62.2 | ||||
Display | 64.6 | 58.2 | ||||||
|
|
|
| |||||
Total | $ | 131.1 | $ | 120.4 | ||||
|
|
|
| |||||
34
The increase in our III-V revenues resulted from an increase in demand for our products, specifically HBT transistors, from customers that use our products in the production of components sold to makers of wireless handsets. We believe this increase in demand was the result of both an increase in the number of wireless handsets that were sold over the prior year and because the percentage of “3G” or “smartphones”, which is a more technologically advanced type of wireless handset, increased over the prior year as a percentage of the total wireless handsets sold. 3G and smart phones offer more functions, for example web browsing, than a standard wireless handset. 3G and smart phones require more HBT transistors than a standard wireless handset to support the increased functionality. We believe the increase in industry sales of 3G and smart phones will continue in 2012.
In July 2012, our purchase and supply agreement with our largest III-V customer, a customer which represented 37% of our 2011 revenues, expires (see Item 1A, Risk Factors for explanation of percent of revenue calculation), subject to a last time buy option. If we do not renew this agreement or increase HBT sales to other customers our sales may decline.
Display revenues for 2011 and 2010 were as follows:
Display Revenues by Category (in millions) | 2011 | 2010 | ||||||
Military Applications | $ | 38.9 | $ | 40.0 | ||||
Consumer Electronic Applications | 16.5 | 10.9 | ||||||
Eyewear Applications | 4.0 | 4.1 | ||||||
Research & Development | 5.2 | 3.2 | ||||||
|
|
|
| |||||
Total | $ | 64.6 | $ | 58.2 | ||||
|
|
|
| |||||
| Display Revenues by Category (in millions) | 2013 | 2012 | |
| Military Applications | $8.6 | $19.6 | |
| Consumer Electronic Applications and other | 8.1 | 8.6 | |
| Eyewear Applications | 3.9 | 3.0 | |
| Research & Development | 2.3 | 3.4 | |
| Total | $22.9 | $34.6 | |
The increasedecrease in the Consumer Electronic Applications and other category is the result of an increasea decrease in sales of our products for digital still cameras. Our ability to forecast our revenues in this category is very difficult as sales of our product ultimately depend on how successful our customers are in promoting their digital still camerascamera (DSC) models. There are many digital still cameraDSC models offered by a number of large consumer electronicelectronics companies and it is a very competitive product category. In addition we typically rebid to win this business each year. The customers for our eyewear products tend to be smaller companies and the economic down turn during the recent years has affected their ability to obtain credit with which to purchase our products. The increasedecrease in Research and
35
Development revenues is the result of an increasea decrease in funding from the U.S. government. We are unable to predict the amount of funding for research and development by the U.S. government as it addresses its fiscal deficit issues.
The markets the Kopin Wearable technologies can be used in already have a number of existing product offerings such as ruggedized lap-top computers and tablets. The companies that offer these products are significantly larger than we are. We expect to incur significant development and marketing costs in 2014 to commercialize the Kopin Wearable technologies. We have a product category which we refer to as “Eyewear Applications”. This category is the predecessor of wearable products as it refers to devices that use our display products to show entertainment, emails or similar data. We currently expect revenue of between $18 million and $22 million for fiscal year 2014, however our ability to forecast revenues derived from Kopin Wearable technologies, which may significantly impact our results of operations, is very limited. We currently expect to have a consolidated net loss in the range of $32 million to $40 million in 2014 and, excluding the impact of the effects of working capital, our stock buyback program, and other investing activities, we expect cash usage between $30 million and $35 million to fund operations for fiscal 2014..
We also anticipate, based on current discussions with our customers and certain contractual obligations that the prices of certain of our products will decline in fiscal year 2012. We anticipate the average selling price of our HBT transistor wafers and display products sold to customers for consumer electronics applications will decline approximately 5% to 7% during fiscal year 2012 relative to 2011. We expect sales prices of our display products for military applications to remain relatively flat for 2012 as compared to 2011. The overall increase or decrease in the average sales price of our display products will be dependent on the sales mix of commercial and military displays.
We currently expect revenue of between $110 million and $120 million for fiscal year 2012, however due to the current worldwide economic situation our ability to forecast revenues and results of operations is very limited. Our forecasts are based on our discussions with customers and our expectations about the future global economy and are not based on firm non-cancellable orders.
Kopin Wearable technologies.
36
| 2011 | 2010 | |||||||
Cost of product revenues (in millions) | $ | 82.1 | $ | 81.2 | ||||
Cost of product revenues as a % of revenues | 65.4 | % | 69.6 | % | ||||
| 2013 | 2012 | ||||||
| Cost of product revenues (in millions) | $ | 20.7 | $ | 22.0 | |||
| Cost of product revenues as a % of revenues | 100.4 | % | 70.3 | % | |||
sales resulted in an increase in fixed cost per display which reduced the gross margin per display sale.
Research and development expense | 2011 | 2010 | ||||||
Funded | $ | 3.8 | $ | 2.7 | ||||
Internal | 22.1 | 17.0 | ||||||
|
|
|
| |||||
Total | $ | 25.9 | $ | 19.7 | ||||
|
|
|
| |||||
| Research and development expense | 2013 | 2012 | |||||
| Funded | $ | 1.5 | $ | 2.2 | |||
| Internal | 16.0 | 12.1 | |||||
| Total | $ | 17.5 | $ | 14.3 | |||
government funded product development.
| 2011 | 2010 | |||||||
Selling, general and administrative expense (in millions) | $ | 18.9 | $ | 14.8 | ||||
Selling, general and administrative expense as a % of revenues | 14.4 | % | 12.3 | % | ||||
| 2013 | 2012 | ||||||
| Selling, general and administrative expense (in millions) | $ | 19.1 | $ | 17.2 | |||
| Selling, general and administrative expense as a % of revenues | 82.3 | % | 49.6 | % | |||
| (in millions) | Intangible Assets | ||
| Assets acquired with acquisition of FDD at January 11, 2011 | $ | 4.6 | |
| Amortization | (0.7 | ) | |
| Impairment | (2.0 | ) | |
| As of December 31, 2011 | $ | 1.9 | |
| Amortization | (0.3 | ) | |
| Impairment of goodwill | — | ||
| Foreign currency translation | 0.1 | ||
| As of December 29, 2012 | $ | 1.7 | |
| Amortization | (0.4 | ) | |
| Impairment of goodwill | (1.2 | ) | |
| Foreign currency translation | 0.1 | ||
| As of December 28, 2013 | $ | 0.2 | |
| (in millions) | 2013 | 2012 | |||||
| Interest income | $ | 1.1 | $ | 1.1 | |||
| Other income and expense, net | 0.3 | 0.2 | |||||
| Foreign currency transaction losses | (0.4 | ) | (1.0 | ) | |||
| Subtotal | 1.0 | 0.3 | |||||
| Gain on sales of investments | 1.9 | 0.9 | |||||
| Impairment of investments | (5.0 | ) | — | ||||
| Loss on investment in Ikanos | — | (0.6 | ) | ||||
| Other income and expense | $ | (2.1 | ) | $ | 0.6 | ||
37
The Compensation Committeeour approximate 23% shares of the Company approvedlosses of Ask Ziggy, totaling $0.2 million, and our approximate 12% share of the following issuanceslosses of restricted stock:
| ||
| ||
| ||
| ||
| ||
|
We issue restricted stock awards to either current employees as partKoBrite, totaling $0.4 million. Our equity losses in unconsolidated affiliates in 2012 consisted of our annual incentive plan (incentiveapproximate 12% share of the losses of KoBrite totaling $0.6 million, and our 25% share of the losses of Ikanos totaling $0.1 million. In July of 2012 we increased our investment in Ikanos to 51% and commenced consolidating Ikanos's results of operations into our results of operations.
| 2013 | 2012 | ||
| Kowon | $0.1 | $0.3 | |
| Ikanos | 0.5 | 0.7 | |
| eMDT | 0.3 | — | |
| Total | $0.9 | $1.0 | |
| Display Revenues by Category (in millions) | 2012 | 2011 | |
| Military Applications | $19.6 | $38.9 | |
| Consumer Electronic Applications | 8.6 | 16.5 | |
| Eyewear Applications | 3.0 | 4.0 | |
| Research & Development | 3.4 | 5.2 | |
| Total | $34.6 | $64.6 | |
In connection with the issuance of the awards above, we recorded stock compensation expenses of $3.9 million and $2.6 millionproduct revenues for fiscal years 2012 and 2011, respectively. Our international sales are primarily denominated in U.S. currency. We have not taken any protective measures against exchange rate fluctuations, such as purchasing hedging instruments with respect to such fluctuations, because of the historically stable exchange rate between the Japanese yen, Korean won and 2010, respectively.
the U.S. dollar.
| 2012 | 2011 | ||||||
| Cost of product revenues (in millions) | $ | 22.0 | $ | 34.7 | |||
| Cost of product revenues as a % of revenues | 70.3 | % | 58.2 | % | |||
| Research and development expense | 2012 | 2011 | |||||
| Funded | $ | 2.2 | $ | 3.3 | |||
| Internal | 12.1 | 13.2 | |||||
| Total | $ | 14.3 | $ | 16.5 | |||
| 2012 | 2011 | ||||||
| Selling, general and administrative expense (in millions) | $ | 17.2 | $ | 16.0 | |||
| Selling, general and administrative expense as a % of revenues | 49.6 | % | 24.7 | % | |||
| Intangible Assets | Goodwill | |||||||
Assets acquired with acquisition of FDD at Jan. 11, 2011, | $ | 4,620,000 | $ | 4,604,459 | ||||
Amortization | (665,066 | ) | — | |||||
Impairment | (2,035,399 | ) | (2,964,114 | ) | ||||
Foreign currency translation | 34,125 | 24,112 | ||||||
|
|
|
| |||||
As of December 31, 2011 | $ | 1,953,660 | $ | 1,664,457 | ||||
|
|
|
| |||||
38
| (in millions) | Intangible Assets | Goodwill | |
| Assets acquired with acquisition of FDD at Jan. 11, 2011 | $4.6 | $4.6 | |
| Amortization | (0.7) | — | |
| Impairment | (2.0) | (2.9) | |
| Foreign currency translation | — | — | |
| As of December 31, 2011 | $1.9 | $1.7 | |
| Amortization | (0.3) | — | |
| Impairment of goodwill | — | (1.7) | |
| Foreign currency translation | 0.1 | — | |
| As of December 29, 2012 | $1.7 | $— | |
(in millions) | 2011 | 2010 | ||||||
Interest income | $ | 1.3 | $ | 2.2 | ||||
Other income and expense, net | 0.1 | 0.0 | ||||||
Foreign currency transaction (losses) gains | — | (0.4 | ) | |||||
Other-than-temporary impairment of marketable debt securities | (0.2 | ) | — | |||||
|
|
|
| |||||
Subtotal | 1.2 | 1.8 | ||||||
Gain on sales of investments | 0.4 | 2.6 | ||||||
Gain on sales of patents | 0.2 | 0.8 | ||||||
|
|
|
| |||||
Other income and expense | $ | 1.8 | $ | 5.2 | ||||
|
|
|
| |||||
| (in millions) | 2012 | 2011 | |||||
| Interest income | $ | 1.1 | $ | 1.3 | |||
| Other income and expense, net | 0.2 | 0.1 | |||||
| Foreign currency transaction losses | (1.0 | ) | — | ||||
| Other-than-temporary Impairment of marketable debt securities | — | (0.2 | ) | ||||
| Subtotal | 0.3 | 1.2 | |||||
| Gain on sales of investments | 0.9 | 0.4 | |||||
| Gain on sales of patents | (0.6 | ) | 0.2 | ||||
| Other income and expense | $ | 0.6 | $ | 1.8 | |||
As our marketable debt securities have matured we have been reinvesting in securities which, due to current interest rates, have lower yields than the securities which matured, accordingly we anticipate that our interest income will decline in 2012.
| 2011 | 2010 | |||||||
Kowon | $ | — | $ | — | ||||
KTC | (0.7 | ) | — | |||||
|
|
|
| |||||
Total | $ | (0.7 | ) | $ | — | |||
|
|
|
| |||||
39
Fiscal Year 2010 Compared to Fiscal Year 2009
Revenues. Our revenues, which include product sales and amounts earned from research and development contracts, for fiscal years 2010 and 2009 were as follows (in millions):
Revenues | 2010 | 2009 | ||||||
III-V | $ | 62.2 | $ | 46.5 | ||||
CyberDisplay | 58.2 | 68.2 | ||||||
|
|
|
| |||||
Total | $ | 120.4 | $ | 114.7 | ||||
|
|
|
| |||||
The increase in our III-V revenues resulted from an increase in demand for our products, specifically HBT transistors, from customers that use our products in the production of components sold to makers of wireless handsets. We believe this increase in demand was the result of both an increase in the number of wireless handsets that were sold over the prior year and because the percentage of “3G” or “smartphones”, which is a more technologically advanced type of wireless handset, increased over the prior year as a percentage of the total wireless handsets sold. 3G and smart phones offer more functions, for example web browsing, than a standard wireless handset. 3G and smart phones require more HBT transistors than a standard wireless handset to support the increased functionality.
Display revenues for 2010 and 2009 were as follows:
Display Revenues by Category (in millions) | 2010 | 2009 | ||||||
Military Applications | $ | 40.0 | $ | 51.5 | ||||
Consumer Electronic Applications | 10.9 | 9.2 | ||||||
Eyewear Applications | 4.1 | 1.8 | ||||||
Research & Development | 3.2 | 5.7 | ||||||
|
|
|
| |||||
Total | $ | 58.2 | $ | 68.2 | ||||
|
|
|
| |||||
Sales of our products for military applications declined in 2010 because of reduced demand from the U.S. government. The U.S. government is projected to incur large budget deficits for the near future and is expected to reduce spending on military programs as part of the solution to decrease these deficits. As a result of this anticipated reduction in military spending demand for our military products may decline. Our military products have higher profit margins than our other display products. The increase in the Consumer Electronic Applications category is the result of an increase in sales of our products for digital still cameras. Our ability to forecast our revenues in this category is very difficult as sales of our product ultimately depend on how successful our customers are in promoting their digital still cameras models. There are many digital still camera models offered by a number of large consumer electronic companies and it is a very competitive product category. The customers for our eyewear products tend to be smaller companies and the economic down turn in 2008 and 2009 affected their ability to obtain credit with which to purchase our products. The increase in sale of our products in 2010 to customers that use them for eyewear products is the result of a few of these customers being able to obtain financing in 2010. We believe that some of the increase is from these customers refilling their inventory as well as for meeting current demand. The decline in Research and Development revenues is the result of a decline in funding from the U.S. government. We believe the amount of funding for research and development which is funded by the U.S. government may decline as it addresses its fiscal deficit issues.
In 2011 we anticipate offering a head-worn, hands-free cloud computing product that has an optical pod with a microdisplay. We do not believe revenue will be significant in 2011 from sales of these products but we do believe in successive years products such as this will be important for our revenue growth and ability to maintain profitability. This is the first product that we have developed that has a significant software component. We anticipate a business model whereby we will sell the optical pod and license the software.
40
We have been the sole supplier of displays to the US military for its thermal weapon sight programs, TWS, TWS II and currently TWS-Bridge. We believe the U.S. military will evaluate competitors’ products for the next thermal weapon sight program, TWS III. This could result in our receiving a lower percentage of these total programs than we historically have. There are a number of different display technologies which can produce displays in small form factors. We believe one of the benefits of our display technology is the ability to produce high resolution displays in small form factors. The digital still camera market is mature and the majority of these devices use low-resolution display products which results in our having limited, if any, competitive advantage over our competitors and, therefore, the ability to sell displays into these markets is very price dependent. Accordingly for us to maintain or increase display revenues with above average gross margins, we will need to increase sales to customers who buy our higher resolution display products, such as the military, or develop new categories, such as eyewear.
We also anticipate, based on current discussions with our customers and certain contractual obligations that the prices of certain of our products will decline in fiscal year 2011. We anticipate the average selling price of our HBT transistor wafers and display products sold to customers for consumer electronics applications will decline approximately 5% during fiscal year 2011 relative to 2010. We expect sales prices of our display products for military applications to remain relatively flat for 2011 as compared to 2010. The overall increase or decrease in the average sales price of our display products will be dependent on the sales mix of commercial and military display sales.
International sales represented 23% and 17% of product revenues for fiscal years 2010 and 2009 respectively. The increase in international sales is primarily attributable to an increase in sales of our CyberDisplay products for digital still cameras and III-V products to customers who sell components to manufacturers of wireless handsets. We expect our 2011 revenues will primarily be from customers located in the U.S. International sales are primarily sales of CyberDisplay products to consumer electronic manufacturers located in Japan, Korea and China. Our international sales are primarily denominated in U.S. currency. Consequently, a strengthening of the U.S. dollar could increase the price in local currencies of our products in foreign markets and make our products relatively more expensive than competitors’ products that are denominated in local currencies, leading to a reduction in sales or profitability in those foreign markets. In addition, sales of our CyberDisplay products in Korea are transacted through our Korean subsidiary, Kowon Technology Co., LTD. Kowon’s sales are primarily denominated in U.S. dollars. However, Kowon’s local operating costs are primarily denominated in Korean won. Kowon also holds U.S. dollars in order to pay various expenses. As a result, our financial position and results of operations are subject to exchange rate fluctuation in transactional and functional currency. We have not taken any protective measures against exchange rate fluctuations, such as purchasing hedging instruments with respect to such fluctuations, because of the historically stable exchange rate between the Japanese yen, Korean won and the U.S. dollar.
Cost of Product Revenues.
| 2010 | 2009 | |||||||
Cost of product revenues (in millions) | $ | 81.2 | $ | 76.0 | ||||
Cost of product revenues as a % of revenues | 69.6 | % | 70.3 | % | ||||
Cost of product revenues, which is comprised of materials, labor and manufacturing overhead related to the production of our products remained relatively consistent from 2009 to 2010 as a percentage of revenues. Our gross margin is affected by increases or decreases in the sales prices of our products, changes in raw material prices, unit volume of sales, manufacturing efficiencies and the mix of products sold. As discussed above our sales prices historically decline on an annual basis. Our overhead costs and, to a lesser extent, our labor costs are normally stable and do not fluctuate significantly during any twelve month period. Essentially, we consider labor and overhead costs to be fixed in nature over the short term and therefore profitability is very dependent on the sales prices of our products and the volume of sales. Gross margins, as a percentage of sales, remained relatively consistent from 2009 to 2010 because the gross margins as a percent of sales for our III-V products increased
41
which offset the reduced gross margin contribution resulting from the decline in military display product sales. The gross margins on our III-V products increased because of the increase in unit volume of sales. Essentially the fixed cost per unit declined as we produced more units for approximately the same infrastructure cost as the prior year.
Research and Development. Research and development (R&D) expenses are incurred in support of internal display and III-V product development programs or programs funded by agencies or prime contractors of the U.S. government and commercial partners. R&D revenues associated with funded programs are presented separately in revenue in the statement of operations. Research and development costs include staffing, purchases of materials and laboratory supplies, circuit design costs, fabrication and packaging of display products, and overhead. For fiscal years 2010 and 2009 R&D expense was as follows (in millions):
Research and development expense | 2010 | 2009 | ||||||
Funded | $ | 2.7 | $ | 3.6 | ||||
Internal | 17.0 | 10.5 | ||||||
|
|
|
| |||||
Total | $ | 19.7 | $ | 14.1 | ||||
|
|
|
| |||||
R&D expense increased in 2010 as compared to the prior year primarily because of increases in costs to develop III-V products for use in 3G and smartphones and a new head-worn hands-free cloud computing display product.
Selling, General and Administrative. Selling, general and administrative (S,G&A) expenses consist of the expenses incurred by our sales and marketing personnel and related expenses, and administrative and general corporate expenses.
| 2010 | 2009 | |||||||
Selling, general and administrative expense (in millions) | $ | 14.8 | $ | 14.1 | ||||
Selling, general and administrative expense as a % of revenues | 12.3 | % | 12.3 | % | ||||
The increase in S,G&A expenses in 2010 as compared to 2009 is attributable to an increase in investor relations expense of $0.4 million, insurance expense of $0.2 million, labor expense of $0.3 million and bad debts of $0.3 million partially offset by a reduction in professional fees of $1.0 million. The decrease in bad debts expense was not a true increase per se but rather in 2009 there was a credit in bad debt expense as a result of a reversal of $0.5 million allowance for doubtful accounts established at December 27, 2008 for the possible uncollectible receivables from KTC. This allowance was reversed when we acquired control of KTC in the third quarter of 2009. The reduction in professional fees was the result of insurance proceeds which reimbursed the Company for expenses previously incurred in dealing with certain legal actions.
In April 2010, December 2009 and April 2009, the Compensation Committee of the Company approved the issuance of 465,500, 778,213 and 676,726, respectively, of restricted stock awards to certain of our employees. We issue restricted stock awards either as part of our annual incentive plan (incentive equity awards) or to induce a prospective employee to join us or current employee to remain with us for at least a certain period of time (retention equity awards). The number of shares of our common stock that an employee will ultimately receive and the compensation expense that we will ultimately recognize under an incentive equity award is based on achieving certain financial milestones and remaining with the Company for a specific period of time. In the case of retention equity awards shares earned are solely a function of time employed. We filed a proxy statement on March 17, 2010 describing our 2010 equity incentive plan, and we have also filed on behalf of certain officers and directors Form 4s with the Securities and Exchange Commission which detail the conditions under our
42
officers can earn the restricted stock awards. The 2010 proxy statement and Form 4s are available on our website www.kopin.com. In December 2008 the Compensation Committee approved the issuance of 363,191 restricted stock awards to our employees, subject to certain conditions. These conditions were essentially the same conditions for the awards made in 2009. In addition, as part of its Board of Director compensation in fiscal years 2010 and 2009 we issued 120,000 shares of restricted stock to our board members representing the annual grants for fiscal years 2010 and 2009. The equity awards to the Board of Directors vest 25% per year over the four years following the grant.
In connection with the issuance of the awards above, and the amortization of awards issued before fiscal year 2008, we recorded stock compensation expenses of $2.6 million and $1.9 million for fiscal years 2010 and 2009, respectively.
Other Income and Expense.
(in millions) | 2010 | 2009 | ||||||
Interest income | $ | 2.2 | $ | 2.2 | ||||
Other income and expense, net | 0.0 | 0.7 | ||||||
Foreign currency transaction (losses) gains | (0.4 | ) | (1.0 | ) | ||||
Other-than-temporary Impairment of marketable debt securities | — | (0.9 | ) | |||||
|
|
|
| |||||
Subtotal | 1.8 | 1.0 | ||||||
Gain on sales of investments | 2.6 | — | ||||||
Gain on loans to KTC | — | 1.2 | ||||||
Gain on remeasurement of investment in KTC | — | 0.6 | ||||||
Gain on sales of patents | 0.8 | 6.3 | ||||||
|
|
|
| |||||
Other income and expense | $ | 5.2 | $ | 9.1 | ||||
|
|
|
| |||||
Other income and expense, net, as shown above, is composed of interest income, foreign currency transaction and remeasurement gains and losses incurred by our Korean and Taiwanese subsidiaries, other-than temporary impairment on marketable debt securities, gains resulting from our obtaining a controlling interest in KTC and license fees. For 2010, we recorded $0.4 million of foreign currency losses as compared to $1.0 million of foreign currency losses for 2009. This was primarily attributable to decreased fluctuations in the US dollar and Korean won currency exchange rate. Other income and expense, net for 2009 also includes expense of $0.9 million to record an impairment of certain marketable debt securities which were deemed other-than-temporarily impaired.
As announced in our 2010 earnings released on March 3, 2011 and as filed in the Current Report on Form 8-K, our income from operations was $4.1 million. Subsequent to the release we reclassified $0.4 million from other income and expense, net, to income from operations.
As our marketable debt securities have matured we have been reinvesting in securities which, due to current interest rates, have lower yields than the securities which matured, accordingly we anticipate that our interest income will decline in 2011.
In conjunction with our obtaining a controlling interest in KTC in 2009 we recorded a gain of $0.6 million for the remeasurement of our investment in KTC to fair market value and $1.2 million related to the repayment of loans from KTC which had been previously written-off. A more complete explanation of the impact on our financial statements from our obtaining a controlling interest in KTC is below.
In fiscal year 2008 we entered into an agreement to sell certain patents which we were not using and that had a carrying value of $0 to a buyer who would attempt to sublicense the patents. The total consideration the Company would receive for the sale of the patents would be a percentage of any sublicense fees, after expenses,
43
the buyer received. In 2009 we recorded $6.3 million of income which represented the Company’s share of sublicense fees income. In 2010 we sold certain additional patents we were no longer using for $0.8 million. We do not expect to receive any material additional amounts from the sales of these patents.Equity earnings (losses) in unconsolidated affiliates. Our equity earnings (losses) in unconsolidated affiliates consists of our approximate 19% share of the losses of KoBrite totaling $0.6 million in 2010 and $0.3 million in 2009, offset by the effects of the repayment of a loan by KTC which is discussed in more detail below, in 2009 of $0.8 million.
Tax (provision) benefit. The provision for income taxes for the fiscal years ended 2010 and 2009 represent alternative minimum taxes owed to U.S. federal and state taxing authorities of $0.3 million and $0.7 million, respectively. For 2011 we expect to have taxes based on U.S. federal tax liabilities based on Alternative Minimum Tax rules and on our foreign operations. We also expect to have a state tax provision for financial reporting purposes in 2011.
Net (income) loss attributable to noncontrolling interest. We own approximately 78% of the equity of Kowon Technology Co. Ltd. (Kowon) and 90% of the equity of KTC.29, 2012. Net loss (income) attributable to the noncontrolling interest on the consolidated statement of operations represents the portion of the results of operations of Kowon and KTCIkanos which are allocated to the shareholdersstockholders of the approximately 22% of Kowon and 10%49% of KTCIkanos not owned by us. The change in the net (income) loss (income) attributable to the noncontrolling interest of our subsidiaries is as follows (in millions):
| 2010 | 2009 | |||||||
Kowon | $ | — | $ | 0.3 | ||||
KTC | — | (0.1 | ) | |||||
|
|
|
| |||||
Total | $ | — | $ | 0.2 | ||||
|
|
|
| |||||
Acquisition of the controlling interest in Kopin Taiwan Corporation (KTC).
From Kopin Taiwan Corp’s (KTC) inception in 2002 through July 2009 the Company owned approximately 35% of KTC. In July 2009, the Company purchased 19,572,468 and 128,226 shares of KTC common stock for approximately $5,975,000 and $300,000, respectively which increased the Company’s ownership to approximately 87%. Subsequent to the purchase of additional shares in July 2009, KTC repaid the outstanding balance of loans due to us from KTC in the aggregate amount of approximately $2,012,000. We began consolidating KTC on July 31, 2009. In 2010, the Company purchased 14,349,809 shares of KTC common stock for approximately $6,150,000 to increase the Company’s ownership to approximately 90%.
The consolidated statement of operations for the periods shown below includes the following amounts (in millions) which were related to transactions with KTC:
| 2009 | ||||
Gain on remeasurement of Kopin’s previous investment in KTC | $ | 0.6 | ||
Repayment of loan by KTC which was previously written-off | 2.0 | |||
Reduction (increase) in bad debt allowance | 0.5 | |||
In the year ended December 27, 2008 we recorded equity losses of approximately $0.8 million and a loan loss reserve of approximately $1.2 million in connection with $2.0 million we loaned KTC in fiscal 2008. As a result of the acquisition in July 2009 the loan was repaid, and in 2009 we recorded a gain on the loan repayment of approximately $1.2 million and equity in earnings of unconsolidated affiliates of $0.8 million.
In fiscal 2008, due to KTC’s liquidity problems we recorded allowances for possible bad debts for the excess amount KTC owed to us over what we owed KTC. At December 27, 2008, the allowance for possible bad debts was approximately $0.5 million. During the nine months ended September 26, 2009 we reduced the allowance to $0, resulting in a reduction of selling, general and administrative expenses of $0.5 million.
44
Prior to July 2009 we recorded our investment in KTC under the equity method and wrote down the investment to $0. We remeasured and wrote-up our investment in KTC by approximately $0.6 million which represented the fair market value of the investment immediately prior to the acquisition in July 2009.
| 2012 | 2011 | ||||||
| Kowon | $ | 0.3 | $ | — | |||
| Ikanos | 0.7 | — | |||||
| Total | $ | 1.0 | $ | — | |||
Domestic | $ | 89,803,174 | ||
Foreign | 11,160,189 | |||
|
| |||
Subtotal cash and marketable debt securities | 100,963,363 | |||
Cash and marketable debt securities held in other currencies and converted to U.S. dollars | 4,455,187 | |||
|
| |||
Total cash and marketable debt securities | $ | 105,418,550 | ||
|
|
at December 28, 2013 were:
| Domestic | $ | 99,206,478 | |
| Foreign | 10,394,377 | ||
| Subtotal cash and marketable debt securities | 109,600,855 | ||
| Cash and marketable debt securities held in other currencies and converted to U.S. dollars | 3,128,346 | ||
| Total cash and marketable debt securities | $ | 112,729,201 | |
We have entered into a product development agreement under In 2013, we ceased operations at our Korean facility, Kowon. Kowon has approximately $13.1 million of cash and marketable debt securities which we have agreed to fund up to $2.4 million of development expenses if certain milestones are achieved.
Included in the $2,467,461 of Billings in excess of revenue earned on the consolidated balance sheet at December 31, 2011 is approximately $2.2 million which we received from the state of Massachusetts as an incentive to retain jobs in Massachusetts. We earn amounts under the agreement by meeting certain employment milestones each year and amounts not earnedanticipate will eventually be repaidremitted to the state of Massachusetts at the end of the agreement in 2017. The agreement also contains repayment provisions which require us to repay certain amounts back to the state of Massachusetts if we fail to achieve certain employment milestones after years threeU.S. and five of the agreement, or if we move certain parts of our operations out of the state. Based on our current estimates we believe that we may be required to repay $1.0 million to the state of Massachusetts in 2012.
We have a purchase and supply agreement with a significant HBT customer that expires in July 2012. This agreement also provides for a last time buy option. Under the terms of this agreementaccordingly we have agreed to maintain capacity levels for manufacturing HBT wafers and we committed to a pricing schedule under certain circumstances. The agreement also requires us to give prior notice if we exit our HBT product line. In consideration for this agreement the customer agreed to source a certain percentage ofrecorded deferred tax liabilities associated with its HBT wafer needs from us subject to the customer’s right to source HBT wafers from other sources if we are unable to meet their requirements under certain circumstances. We agreed that failure to meet our supply obligations under the agreement would allow our customer to obtain court ordered specific performance and if we do not perform we could then be liable for monetary damages up to a maximum of $40 million.
unremitted earnings.
45
November 2014.
2016, and also lease two facilities in Nottingham, United Kingdom, which expire in 2016 and 2017.
cost based investments.
The markets for our III-V and consumer electronic CyberDisplay products
2014.
Contractual Obligations | Total | Less than 1 year | 1-3 Years | 3-5 years | More than 5 years | |||||||||||||||
Operating Lease Obligations | $ | 4,986,820 | $ | 1,031,419 | $ | 1,490,276 | $ | 1,706,625 | $ | 758,500 | ||||||||||
46
28, 2013:
| Contractual Obligations | Total | Less than 1 year | 1-3 Years | 3-5 years | More than 5 years | ||||||||||||||
| Operating Lease Obligations | $ | 7,353,133 | $ | 1,266,185 | $ | 2,678,281 | $ | 1,279,333 | $ | 2,129,334 | |||||||||
| Item 7A. | Quantitative and Qualitative Disclosures About Market Risk |
| Item 8. | Financial Statements and Supplementary Data |
| Item 9. | Changes in and Disagreements with Accountants on Accounting and Financial Disclosure |
| Item 9A. | Controls and Procedures |
47
Provide reasonable assurance that transactions are recorded as necessary to permit preparation of financial statements in accordance with generally accepted accounting principles, and that receipts and expenditures of the company are being made in accordance with authorizations of management and directors of the company; and
Provide reasonable assurance regarding prevention or timely detection of unauthorized acquisition, use or disposition of the company’s assets that could have a material effect on the financial statements.
48
schedule and included an explanatory paragraph regarding the Company's sale of its III-V product line, including its investment in subsidiary Kopin Taiwan Corporation. 17, 2014 License Agreement by and between the Company and Massachusetts Institute of Technology dated April 22, 1985, as amended Facility Lease, by and between the Company and Massachusetts Technology Park Corporation, dated October 15, 1993 Joint Venture Agreement, by and among the Company, Kowon Technology Co., Ltd., and Korean Investors, dated as of March 3, 1998 Seventh Amended and Restated Employment Agreement between the Company and Dr. John C.C. Fan, dated as of December 8, 2010 Kopin Corporation Form of Stock Option Agreement under 2001 and 2010 Equity Incentive Plans Kopin Corporation 2001 and 2010 Equity Incentive Plan Form of Restricted Stock Purchase Agreement Kopin Corporation Fiscal Year 2012 Incentive Bonus Plan Kopin Corporation Stock Purchase Agreement of 19,572,468 shares of Kopin Taiwan Corporation, (KTC) common stock Kopin Corporation 2010 Equity Incentive Plan Subsidiaries of Kopin Corporation Consent of Independent Registered Public Accounting Firm Chief Executive Officer Certification Pursuant to 18 U.S.C. Section 1350, as Adopted Pursuant to Section 302 of the Sarbanes-Oxley Act of 2002 17, 2014 Current assets: Cash and equivalents Marketable debt securities, at fair value Accounts receivable, net of allowance of $513,000 and $737,000 in 2011 and 2010, respectively Accounts receivable from unconsolidated affiliates Unbilled receivables Inventory Prepaid taxes Prepaid expenses and other current assets Total current assets Property, plant and equipment, net Deferred tax assets Goodwill Intangible assets, net Other assets Total assets Current liabilities: Accounts payable Accrued payroll and expenses Accrued warranty Billings in excess of revenue earned Other accrued liabilities Total current liabilities Asset retirement obligations Commitments and contingencies Stockholders’ equity: Preferred stock, par value $.01 per share: authorized, 3,000 shares; none issued Common stock, par value $.01 per share: authorized, 120,000,000 shares; issued 76,123,940 shares in 2011 and 74,604,442 shares in 2010; outstanding 64,361,491 in 2011 and 64,775,234 in 2010 Additional paid-in capital Treasury stock (8,864,767 and 7,795,605 shares in 2011 and 2010, respectively, at cost) Accumulated other comprehensive income Accumulated deficit Total Kopin Corporation stockholders’ equity Noncontrolling interest Total stockholders’ equity Total liabilities and stockholders’ equity Fiscal year ended Revenues: Net product revenues Research and development revenues Expenses: Cost of product revenues Research and development-funded programs Research and development-internal Selling, general and administrative Impairment of intangible assets and goodwill (Loss) income from operations Other income and expense: Interest income Other income and expense, net Foreign currency transaction gains (losses) Gain on loans to KTC Gain on remeasurement of investment in KTC Gain on sales of investments Other-than-temporary impairment of marketable debt securities Gain on sales of patents Income before benefit (provision) for income taxes, and equity (losses) earnings in unconsolidated affiliates and net (income) loss of noncontrolling interest Tax benefit (provision) Income before equity (losses) earnings in unconsolidated affiliates and net (income) loss of noncontrolling interest Equity (losses) earnings in unconsolidated affiliates Net income Net (income) loss attributable to the noncontrolling interest Net income attributable to the controlling interest Net income per share Basic Diluted Weighted average number of common shares outstanding: Basic Diluted Fiscal years ended Net income Foreign currency translation adjustments Holding (loss) gain on marketable securities Reclassifications of gains in net income Comprehensive income Comprehensive loss attributable to the noncontrolling interest Comprehensive income attributable to the controlling interest Balance December 27, 2008 Exercise of stock options Vesting of restricted stock Stock based compensation expense Net unrealized holding gain on marketable securities Foreign currency translation adjustments Cumulative effect adjustment as of March 29, 2009 related to non credit-related losses on investments recorded in operations Change in other-than-temporary impairment loss recorded in other comprehensive income (loss) Acquisition of KTC equity interest Restricted stock for tax withholding obligations Treasury stock purchase Net income Balance December 26, 2009 Exercise of stock options Vesting of restricted stock Stock based compensation expense Net unrealized holding gain on marketable securities Foreign currency translation adjustments Change in other-than-temporary impairment loss recorded in other comprehensive income (loss) Acquisition of KTC equity interest Restricted stock for tax withholding obligations Treasury stock purchase Net income Balance December 25, 2010 Exercise of stock options Vesting of restricted stock Stock based compensation expense Net unrealized holding loss on marketable securities Foreign currency translation adjustments Change in other-than-temporary impairment loss recorded in other comprehensive income Restricted stock for tax withholding obligations Treasury stock purchase Net income Balance December 31, 2011 COMPREHENSIVE (LOSS) INCOME Fiscal year ended Cash flows from operating activities: Net income Adjustments to reconcile net income to net cash provided by operating activities: Depreciation and amortization Accretion (amortization) of premium or discount on marketable debt securities Stock-based compensation Net gain on investment transactions Losses (earnings) in unconsolidated affiliates Impairment on marketable debt securities Impairment of intangible assets and goodwill Release of valuation allowance on deferred tax assets Gain on loans to KTC Gain on remeasurement of investment in KTC Foreign currency losses Change in allowance for bad debt Change in other non-cash items Changes in assets and liabilities: Accounts receivable Inventory Prepaid expenses and other current assets Accounts payable and accrued expenses Billings in excess of revenue earned Net cash provided by operating activities Cash flows from investing activities: Proceeds from sale of marketable debt securities Purchase of marketable debt securities Other assets Proceeds from sale of investments Net cash received from KTC equity interest investment Cash paid to acquire FDD, net of cash acquired Purchase of cost based investment Proceeds from sale of property and equipment Capital expenditures Net cash used in investing activities Cash flows from financing activities: Treasury stock purchases Investment in KTC as controlling interest was acquired Issuance of KTC shares to noncontrolling interest Settlements of restricted stock for tax withholding obligations Proceeds from exercise of stock options Net cash used in financing activities Effect of exchange rate changes on cash Net decrease in cash and equivalents Cash and equivalents: Beginning of year End of year Supplemental disclosure of cash flow information: Income taxes paid Supplemental schedule of noncash investing activities: Construction in progress included in accrued expenses STOCKHOLDERS’ EQUITY Raw materials Work-in-process Finished goods 29, 2012 improvements and leased equipment are amortized over the shorter of the term of the lease or the useful life of the improvement or equipment. As discussed below, obligations for asset retirement are accrued at the time property, plant and equipment is initially purchased or as such obligations are generated from use. Asset retirement obligation as of December 25, 2010 Additions liabilities incurred Accretion Asset retirement obligation as of December 31, 2011 stock. Weighted-average common shares outstanding—basic Stock options and nonvested restricted common stock Weighted-average common shares outstanding—diluted Nonvested restricted common stock Stock options Total anti-dilutive or performance conditions have not been met at the end of the period. December 28, 2013, these awards were not yet earned and no compensation expense has been recorded. Balance as of December 27, 2008 Changes during year Balance as of December 26, 2009 Changes during year Balance as of December 25, 2010 Changes during year Balance as of December 31, 2011 28, 2013. Land Buildings Equipment Leasehold improvements Furniture and fixtures Equipment under construction Accumulated depreciation and amortization 29, 2012 Note Receivable Marketable Equity Securities AWSC. WIN Non-Marketable Securities—Equity Method Investments KoBrite Non-Marketable Securities-Cost Based Investments Other 29, 2012 AWSC AWSC which are reflected in discontinued operations: KoBrite KTC Total AZ for $200,000 if certain milestones are achieved. Current assets Non current assets Current liabilities Revenues Margin loss Loss from operations Net loss The Company has a loan to a non-officer employee for approximately Gain on remeasurement of Kopin’s previous investment in KTC Repayment of loan by KTC which was previously written-off Reduction in bad debt allowance operations of the eMDT acquisition have been included in the consolidated statements of operations from the time the Company assumed majority ownership, approximately April 17, 2013. eMDT's net loss from operations included in the consolidated results of operation for the year ended December 28, 2013 was $0.3 million. The transaction related costs associated with the eMDT acquisition were considered immaterial and are included within selling, general and administrative expense for the fiscal year ended December 28, 2013. The goodwill will not be deductible for tax purposes. Revenues Net income Cash consideration Contingent consideration Total purchase price Cash and marketable securities Accounts receivable Inventory Plant and equipment Other identifiable assets Customer relationships Developed technology Trademark portfolio Identifiable liabilities Goodwill Total Intangibles The Company’s goodwill balance is as follows: Goodwill, December 26, 2010 Goodwill from the acquisition of FDD at Jan. 11, 2011 Reduction in goodwill as a result of change in contingent consideration Goodwill from the acquisition of FDD at Jan. 11, 2011, as adjusted Impairment of goodwill Foreign currency translation Goodwill, December 31, 2011 portfolio during the year ended 2011 Customer relationships Revenue Net Income Money Markets and Cash Equivalents U.S. Government Securities Corporate Debt Certificates of Deposit WIN Semiconductor Corp. Advanced Wireless Semiconductor Company Money Markets and Cash Equivalents U.S. Government Securities Corporate Debt Certificates of Deposit Advanced Wireless Semiconductor Company U.S. government and agency backed securities Corporate debt and certificates of deposits Total 29, 2012 The contractual maturity of the Company’s marketable debt securities is as follows at December U.S. government and agency backed securities Corporate debt and certificates of deposits Total 28, 2013: fiscal years 2013 and 2012. Included in other income and expense is an impairment charge on investments in corporate debt instruments of option price of nonqualified stock options is determined by the Board or Compensation Committee. Options must be exercised within a Balance, beginning of year Options forfeited/cancelled Options exercised Balance, end of year Exercisable, end of year Range of Exercise Prices $ 0.01—$ 3.50 $ 3.75—$ 4.82 $ 5.00—$ 8.72 $10.00—$10.42 Aggregate intrinsic value on December 31, 2011 28, 2013 Cash received from option exercises under all share-based payment arrangements was approximately Balance December 25, 2010 Granted Forfeited Vested Balance, December 31, 2011 Cost of product revenues Research and development Selling, general and administrative Total Customer Skyworks Solutions, Inc. Advanced Wireless Semiconductor Co. DRS Technologies Raytheon Company indicated. (The symbol “*” indicates that accounts receivables from that customer were less than 10% of the Company’s total accounts receivable.) Customer Skyworks Solutions, Inc. Advanced Wireless Semiconductor Company DRS Technologies Raytheon Company Military Customers in Total United States Government Funded Research and Development Contracts Current Federal State Foreign Total current provision Deferred Federal State Foreign Change in valuation allowance Total deferred provision Total (benefit) provision for income taxes Tax provision at federal statutory rates State tax liability Foreign deferred Goodwill Nondeductible expenses Utilized/expired net state operating loss carryforwards Provision to tax return adjustments and state tax rate change Tax credits Non-deductible equity compensation Other, net Change in valuation allowance unremitted earnings. Deferred tax liability: Intangible asset Deferred tax assets: Federal net operating loss carryforwards State net operating loss carryforwards Foreign net operating loss carryforwards Equity awards Tax credits Equipment Investments Other Net deferred tax assets Valuation allowance 28, 2013 recognized, and is updated as additional information becomes available. The Company’s estimate of future costs to satisfy warranty obligations is based primarily on historical warranty expense experienced and a provision for potential future product failures. Changes in the accrued warranty for fiscal years Beginning Balance Additions Claim and reversals Ending Balance The Company leases facilities located in Fiscal Year ending, 2012 2013 2014 2015 2016 Thereafter Total minimum lease payments 28, 2013: simulation products, and Kopin, which is comprised of Kopin Corporation, Kowon, Ikanos and eMDT. The segment information for the prior periods presented has been recast to reflect the change in reportable segments. 2011 Revenues Net income (loss) attributable to the controlling interest Total assets Long lived assets 2010 Revenues Net income (loss) attributable to the controlling interest Total assets Long lived assets 2009 Revenues Net income (loss) attributable to the controlling interest Total assets Long lived assets Asia-Pacific Americas III-V Display Total revenues United States of America United Kingdom Republic of Korea Taiwan, ROC Revenue Gross profit (2) Net income attributable to the controlling interest Net income per share (1): Basic Diluted Shares used in computing net income per share: Basic Diluted : Revenue Gross profit (2) Net income attributable to the controlling interest Net income per share (1): Basic Diluted Shares used in computing net income per share: Basic Diluted Signature Title Date Chairman of the Board, Chief Executive Officer, President and Director (Principal Executive Officer) Treasurer and Chief Financial Officer (Principal Financial and Accounting Officer) Description Reserve deducted from assets—allowance for doubtful accounts: 2009 2010 2011 31, 2011 Exhibits Exhibits The following materials from the Company’s Annual Report on Form 10-K for the fiscal year ended December Taunton,31, 2011,28, 2013, based on criteria established inInternal Control—Integrated Framework(1992)issued by the Committee of Sponsoring Organizations of the Treadway Commission. The Company’s management is responsible for maintaining effective internal control over financial reporting and for itstheir assessment of the effectiveness of internal control over financial reporting, included in the accompanying Management’s Annual Report On Internal Control over Financial Reporting. Our responsibility is to express an opinion on the Company’s internal control over financial reporting based on our audit.31, 2011,28, 2013, based on the criteria established inInternal Control—Integrated Framework (1992)issued by the Committee of Sponsoring Organizations of the Treadway Commission.31, 2011,28, 2013, of the Company and our report dated March 15, 201217, 2014 expressed an unqualified opinion on those financial statements and financial statement schedule.15, 201249Item 9B.Other Information.NonePart IIIItem 10. Directors, Executive Officers and Corporate Governance 20122014 Annual Meeting of Shareholders (the Proxy Statement). In addition to the disclosures made in our Proxy Statement and incorporated by reference herein, information with respect to executive officers required by this item is set forth in Part I of this Report.Item 11. Executive Compensation under the caption “Stock Ownership of Principal Stockholders and Management” and is incorporated herein by reference from the Proxy Statement.Item 12. Security Ownership of Certain Beneficial Owners and Management and Related Stockholder Matters Item 13. Certain Relationships and Related Transactions, and Director Independence Item 14. Principal AccountantAccounting Fees and ServicesItem 15. Exhibits, and Financial Statement Schedules(a) Documents filed as part of the Report: Page 54 55 56 56 57 58 5950 3.1 Amended and Restated Certificate of Incorporation (2 ) 3.2 Amendment to Certificate of Incorporation (5 ) 3.3 Amendment to Certificate of Incorporation (5 ) 3.4 Fourth Amended and Restated By-laws (8 ) 4 Specimen Certificate of Common Stock (1 ) 10.1 Form of Employee Agreement with Respect to Inventions and Proprietary Information (1 ) 10.2 Amended and Restated 1992 Stock Option Plan (2 )* 10.3 1992 Stock Option Plan Amendment (5 )* 10.4 1992 Stock Option Plan Amendment (6 )* 10.5 Kopin Corporation 2001 Equity Incentive Plan (7 )* 10.6 Kopin Corporation 2001 Equity Incentive Plan Amendment (9 )* 10.7 Kopin Corporation 2001 Equity Incentive Plan Amendment (10 )* 10.8 Kopin Corporation 2001 Equity Incentive Plan Amendment (11 )* 10.9 Kopin Corporation 2001 Equity Incentive Plan Amendment (13 )* 10.10 Kopin Corporation 2001 Supplemental Equity Incentive Plan (6 )* 10.11 Form of Key Employee Stock Purchase Agreement (1 )* 10.12 (1 ) 10.13 (3 ) 10.14 (4 ) 10.15 10.16 (12 )* 10.17 (12 )* 10.18 * 10.19 (14 ) 10.20 (15 ) 21.1 23.1 31.1 513.1 Amended and Restated Certificate of Incorporation (2 ) 3.2 Amendment to Certificate of Incorporation (5 ) 3.3 Amendment to Certificate of Incorporation (5 ) 3.4 Fourth Amended and Restated By-laws (8 ) 4 Specimen Certificate of Common Stock (1 ) 10.1 Form of Employee Agreement with Respect to Inventions and Proprietary Information (1 ) 10.5 Kopin Corporation 2001 Equity Incentive Plan (7 ) * 10.6 Kopin Corporation 2001 Equity Incentive Plan Amendment (9 ) * 10.7 Kopin Corporation 2001 Equity Incentive Plan Amendment (10 ) * 10.8 Kopin Corporation 2001 Equity Incentive Plan Amendment (11 ) * 10.9 Kopin Corporation 2001 Equity Incentive Plan Amendment (13 ) * 10.10 Kopin Corporation 2001 Supplemental Equity Incentive Plan (6 ) * 10.11 Form of Key Employee Stock Purchase Agreement (1 ) * 10.12 License Agreement by and between the Company and Massachusetts Institute of Technology dated April 22, 1985, as amended (1 ) 10.13 Facility Lease, by and between the Company and Massachusetts Technology Park Corporation, dated October 15, 1993 (3 ) 10.14 Joint Venture Agreement, by and among the Company, Kowon Technology Co., Ltd., and Korean Investors, dated as of March 3, 1998 (4 ) 10.15 Seventh Amended and Restated Employment Agreement between the Company and Dr. John C.C. Fan, dated as of December 8, 2010 (16 ) 10.16 Kopin Corporation Form of Stock Option Agreement under 2001 and 2010 Equity Incentive Plans (12 ) * 10.17 Kopin Corporation 2001 and 2010 Equity Incentive Plan Form of Restricted Stock Purchase Agreement (12 ) * 10.18 Kopin Corporation Fiscal Year 2013 Incentive Bonus Plan * 10.20 Kopin Corporation 2010 Equity Incentive Plan (15 ) 10.21 Purchase Agreement, dated January 10, 2013, by and among Kopin Corporation, IQE KC, LLC and IQE plc 21.1 Subsidiaries of Kopin Corporation 23.1 Consent of Independent Registered Public Accounting Firm 31.1 Chief Executive Officer Certification Pursuant to 18 U.S.C. Section 1350, as Adopted Pursuant to Section 302 of the Sarbanes-Oxley Act of 2002 31.2 Chief Financial Officer Certification Pursuant to 18 U.S.C. Section 1350, as Adopted Pursuant to Section 302 of the Sarbanes-Oxley Act of 2002 32.1 Chief Executive Officer Certification Pursuant to 18 U.S.C. Section 1350, as Adopted Pursuant to Section 906 of the Sarbanes-Oxley Act of 2002 ** 32.2 Chief Financial Officer Certification Pursuant to 18 U.S.C. Section 1350, as Adopted Pursuant to Section 906 of the Sarbanes-Oxley Act of 2002 ** 101 The following materials from the Company’s Annual Report on Form 10-K for the fiscal year ended December 28, 2013, formatted in XBRL (Extensible Business Reporting Language): (i) Consolidated Balance Sheets, (ii) Consolidated Statements of Operations, (iii) Consolidated Statements of Comprehensive (Loss), (iv) Consolidated Statements of Stockholder's Equity, (v)Consolidated Statements of Cash Flows, and (vi) Notes to Consolidated Financial Statements, tagged as blocks of text * 31.2Chief Financial Officer Certification Pursuant to 18 U.S.C. Section 1350, as Adopted Pursuant to Section 302 of the Sarbanes-Oxley Act of 200232.1Chief Executive Officer Certification Pursuant to 18 U.S.C. Section 1350, as Adopted Pursuant to Section 906 of the Sarbanes-Oxley Act of 200232.2Chief Financial Officer Certification Pursuant to 18 U.S.C. Section 1350, as Adopted Pursuant to Section 906 of the Sarbanes-Oxley Act of 2002101The following materials from the Company’s Annual Report on Form 10-K for the fiscal year ended December 31, 2011, formatted in XBRL (Extensible Business Reporting Language): (i) Consolidated Balance Sheets, (ii) Consolidated Statements of Income, (iii) Consolidated Statements of Cash Flows, and (iv) Notes to Consolidated Financial Statements, tagged as blocks of text* Management contract or compensatory plan required to be filed as an Exhibit to this Form 10-K. (1)**This exhibit shall not be deemed "filed" for purposes of Section 18 of the Securities Exchange Act of 1934 or otherwise subject to the liabilities of that Section, nor shall it be deemed incorporated by reference in any filings under the Securities Act of 1933 or the Securities Exchange Act of 1934, whether made before or after the date hereof and irrespective of any general incorporation language in any filing. (1 ) Filed as an exhibit to Registration Statement on Form S-1, File No. 33-45853, and incorporated herein by reference. (2)(2) Filed as an exhibit to Registration Statement on Form S-1, File No. 33-57450, and incorporated herein by reference. (3)(3) Filed as an exhibit to Annual Report on Form 10-K for the fiscal year ended December 31, 1993 and incorporated herein by reference. (4)(4) Filed as an exhibit to Annual Report on Form 10-Q for the quarterly period ended June 27, 1998 and incorporated herein by reference. (5)(5) Filed as an exhibit to Quarterly Report on Form 10-Q for the quarterly period ended July 1, 2000 and incorporated herein by reference. (6)(6) Filed as an exhibit to Registration Statement on Form S-8, filed on November 13, 20012011 and incorporated herein by reference.(7)(7) Filed as an appendix to Proxy Statement filed on April 20, 2001 and incorporated herein by reference. (8)(8) Filed as an exhibit to Current Report on Form 8-K filed on December 12, 2008 and incorporated herein by reference. (9)(9) Filed as an exhibit to Registration Statement on Form S-8 filed on August 16, 2002 and incorporated herein by reference.reference(10)(10) Filed as an exhibit to Registration Statement on Form S-8 filed on March 15, 2004 and incorporated herein by reference. (11)(11) Filed as an exhibit to Registration Statement on Form S-8 filed on May 10, 2004 and incorporated herein by reference. (12)(12) Filed as an exhibit to Annual Report on Form 10-K for the fiscal year ended December 25, 2004 and incorporated herein by reference. (13)(13) Filed as an exhibit to Registration Statement on Form S-8 filed on April 15, 2008 and incorporated herein by reference. (14)(14) Filed as an exhibit to Annual Report on Form 10-K for the fiscal year ended December 26, 2009 and incorporated by reference herein. (15)(15) Filed with the Corporation’sCompany's Definitive Proxy Statement on Schedule 14 filed as of March 17,April 5, 2013 and incorporated by reference herein.(16 ) Filed as an exhibit to Annual Report on Form 10-K for the fiscal year ended December 25, 2010 and incorporated by reference herein. (17 ) Filed as an exhibit to Current Report on Form 8-K on January 10, 2013 and incorporated by reference herein. 52 Page 5431, 201128, 2013 and December 25, 201029, 201255565657585953Taunton,31, 201128, 2013 and December 25, 2010,29, 2012, and the related consolidated statements of operations, comprehensive (loss) income, stockholders’ equity, and cash flows for each of the three years in the period ended December 31, 2011.28, 2013. Our audits also included the financial statement schedule listed in the Index at Item 15(a)(2). These financial statements and financial statement schedule are the responsibility of the Company’s management. Our responsibility is to express an opinion on the financial statements and financial statement schedule based on our audits.31, 201128, 2013 and December 25, 2010,29, 2012, and the results of their operations and their cash flows for each of the three years in the period ended December 31, 2011,28, 2013, in conformity with accounting principles generally accepted in the United States of America. Also, in our opinion, such financial statement schedule, when considered in relation to the basic consolidated financial statements taken as a whole, presents fairly, in all material respects, the information set forth therein.31, 2011,28, 2013, based on the criteria established inInternal Control—Integrated Framework(1992) issued by the Committee of Sponsoring Organizations of the Treadway Commission and our report dated March 15, 201217, 2014 expressed an unqualified opinion on the Company’s internal control over financial reporting.15, 201254 December 31,
2011 December 25,
2010 ASSETS $ 43,095,163 $ 49,834,547 62,323,387 61,112,843 16,510,851 14,539,664 1,340,788 2,558,513 36,115 391,171 21,415,517 21,462,871 412,068 664,320 1,294,368 2,060,833 146,428,257 �� 152,624,762 32,369,441 32,613,961 4,201,627 — 1,664,457 — 1,953,660 — 7,946,087 6,857,675 $ 194,563,529 $ 192,096,398 LIABILITIES AND STOCKHOLDERS’ EQUITY $ 12,384,870 $ 11,317,865 4,182,505 2,741,004 1,318,000 1,300,000 2,467,461 3,210,895 2,126,954 1,956,642 22,479,790 20,526,406 1,295,670 944,617 — — 732,263 725,708 315,710,160 313,311,889 (30,995,449 ) (26,580,823 ) 4,146,024 5,985,345 (124,008,273 ) (127,606,200 ) 165,584,725 165,835,919 5,203,344 4,789,456 170,788,069 170,625,375 $ 194,563,529 $ 192,096,398 December 28,
2013 December 29, 2012 ASSETS Current assets: Cash and equivalents $ 16,756,666 $ 27,135,387 Marketable debt securities, at fair value 95,972,535 65,349,962 Accounts receivable, net of allowance of $202,000 and $311,000 in 2013 and 2012, respectively 2,388,461 5,254,549 Accounts receivable from unconsolidated affiliates — 84,780 Unbilled receivables — 178,036 Inventory 3,078,055 5,789,753 Prepaid taxes 233,642 683,032 Prepaid expenses and other current assets 1,178,643 917,841 Current assets held for sale — 21,573,729 Total current assets 119,608,002 126,967,069 Property, plant and equipment, net 6,034,963 8,486,406 Goodwill 1,016,132 684,789 Intangible assets, net 1,581,502 2,316,924 Other assets 3,024,458 8,607,882 Notes receivable 14,866,666 — Noncurrent assets held for sale — 29,145,732 Total assets $ 146,131,723 $ 176,208,802 LIABILITIES AND STOCKHOLDERS’ EQUITY Current liabilities: Accounts payable $ 3,868,865 $ 5,121,324 Accrued payroll and expenses 1,436,391 2,147,512 Accrued warranty 716,000 716,000 Billings in excess of revenue earned 547,681 1,220,395 Other accrued liabilities 3,157,394 2,563,797 Deferred tax liabilities 1,512,771 1,304,513 Current liabilities held for sale — 7,102,895 Total current liabilities 11,239,102 20,176,436 Asset retirement obligations 329,435 322,477 Noncurrent liabilities held for sale — 623,979 Commitments and contingencies Stockholders’ equity: Preferred stock, par value $.01 per share: authorized, 3,000 shares; none issued — — Common stock, par value $.01 per share: authorized, 120,000,000 shares; issued 77,567,631 shares in 2013 and 75,979,695 shares in 2012; outstanding 62,560,946 in 2013 and 63,835,508 in 2012, respectively 745,935 736,966 Additional paid-in capital 320,511,458 318,928,495 Treasury stock (12,032,537 and 9,861,139 shares in 2013 and 2012, respectively, at cost) (42,442,932 ) (34,450,978 ) Accumulated other comprehensive income 3,441,997 6,512,792 Accumulated deficit (147,703,211 ) (142,993,595 ) Total Kopin Corporation stockholders’ equity 134,553,247 148,733,680 Noncontrolling interest 9,939 6,352,230 Total stockholders’ equity 134,563,186 155,085,910 Total liabilities and stockholders’ equity $ 146,131,723 $ 176,208,802 55 2011 2010 2009 $ 125,464,687 $ 116,622,692 $ 108,118,271 5,679,908 3,763,074 6,536,486 131,144,595 120,385,766 114,654,757 82,110,464 81,224,350 75,982,694 3,741,602 2,692,488 3,586,372 22,133,360 17,041,440 10,560,662 18,928,996 14,837,519 14,136,482 4,999,512 — — 131,913,934 115,795,797 104,266,210 (769,339 ) 4,589,969 10,388,547 1,305,240 2,192,334 2,180,678 93,125 77,202 728,686 12,403 (418,710 ) (1,005,184 ) — — 1,187,937 — — 599,328 368,641 2,597,505 — (150,644 ) — (926,630 ) 155,658 769,797 6,323,934 1,784,423 5,218,128 9,088,749 1,015,084 9,808,097 19,477,296 3,541,000 (252,000 ) (690,200 ) 4,556,084 9,556,097 18,787,096 (296,451 ) (600,299 ) 483,057 $ 4,259,633 $ 8,955,798 $ 19,270,153 (661,706 ) (21,647 ) 173,217 $ 3,597,927 $ 8,934,151 $ 19,443,370 $ 0.06 $ 0.14 $ 0.29 $ 0.06 $ 0.13 $ 0.29 64,405,776 66,019,847 66,849,890 65,234,212 66,711,501 67,457,751 CONSOLIDATED STATEMENTS OF COMPREHENSIVE INCOME 2011 2010 2009 $ 4,259,633 $ 8,955,798 $ 19,270,153 (1,368,829 ) 2,216,793 1,682,514 (135,519 ) 1,274,580 4,615,316 (457,808 ) (1,732,568 ) (172,466 ) $ 2,297,477 $ 10,714,603 $ 25,395,517 $ (413,888 ) $ (351,920 ) $ (188,854 ) $ 1,883,589 $ 10,362,683 $ 25,206,663 Fiscal year ended 2013 2012 2011 Revenues: Net product revenues $ 20,574,812 $ 31,298,419 $ 59,508,959 Research and development revenues 2,322,897 3,343,441 5,149,644 22,897,709 34,641,860 64,658,603 Expenses: Cost of product revenues 20,655,216 22,041,953 34,659,020 Research and development-funded programs 1,550,873 2,178,472 3,341,075 Research and development-internal 15,983,147 12,121,689 13,218,018 Selling, general and administrative 19,124,750 17,165,870 15,990,881 Impairment of intangible assets and goodwill 1,511,414 1,704,770 4,999,512 58,825,400 55,212,754 72,208,506 Loss from operations (35,927,691 ) (20,570,894 ) (7,549,903 ) Other income and expense: Interest income 1,118,617 1,126,344 1,291,591 Other income and (expense), net 235,917 173,829 142,948 Foreign currency transaction (losses) gains (387,351 ) (1,032,588 ) 9,672 Gain on sales of investments 1,899,291 856,170 368,641 Loss on investment in Ikanos — (557,594 ) — Other-than-temporary impairment of marketable debt securities — — (150,644 ) Impairment of investments (5,000,442 ) — — Gain on sales of patents — — 155,658 (2,133,968 ) 566,161 1,817,866 Loss from continuing operations before benefit (provision) for income taxes, and equity losses in unconsolidated affiliates and net loss (income) of noncontrolling interest (38,061,659 ) (20,004,733 ) (5,732,037 ) Tax benefit (provision) 12,933,209 (1,099,000 ) — Loss before equity losses in unconsolidated affiliates and net loss (income) of noncontrolling interest (25,128,450 ) (21,103,733 ) (5,732,037 ) Equity losses in unconsolidated affiliates (625,098 ) (679,587 ) (296,451 ) Loss from continuing operations (25,753,548 ) (21,783,320 ) (6,028,488 ) Income from discontinued operations, net of tax 20,147,532 2,789,048 9,713,059 Net (loss) income $ (5,606,016 ) $ (18,994,272 ) $ 3,684,571 Net loss (income) attributable to the noncontrolling interest 896,400 632,342 (605,207 ) Net (loss) income attributable to the controlling interest $ (4,709,616 ) $ (18,361,930 ) $ 3,079,364 Net (loss) income per share: Basic: Continuing operations $ (0.40 ) $ (0.33 ) $ (0.10 ) Discontinued operations 0.32 0.04 0.15 Net (loss) income per share $ (0.08 ) $ (0.29 ) $ 0.05 Diluted: Continuing operations $ (0.40 ) $ (0.33 ) $ (0.10 ) Discontinued operations 0.32 0.04 0.15 Net (loss) income per share $ (0.08 ) $ (0.29 ) $ 0.05 Weighted average number of common shares outstanding: Basic 62,347,852 63,617,680 64,405,776 Diluted 62,347,852 63,617,680 65,234,212 STOCKHOLDERS’ EQUITY Common Stock Additional
Paid-in
Capital Treasury
Stock Accumulated
Other
Comprehensive
Income Accumulated
Deficit Total Kopin
Corporation
Stockholders’
Equity Noncontrolling
interest Total
Stockholders’
Equity Shares Amount 71,873,228 $ 718,732 $ 310,241,805 $ (14,552,865 ) $ (168,303 ) $ (157,757,433 ) $138,481,936 $ 2,912,519 $ 141,394,455 32,010 320 123,055 — — — 123,375 — 123,375 555,604 5,556 (5,556 ) — — — — — — — — 1,884,340 — — — 1,884,340 — 1,884,340 — — — — 4,442,850 — 4,442,850 — 4,442,850 — — — — 1,320,443 — 1,320,443 362,071 1,682,514 — — — — (1,773,712 ) 1,773,712 — — — — — — — 735,535 — 735,535 — 735,535 — — (259,739 ) — — — (259,739 ) 1,014,381 754,642 (193,000 ) (1,930 ) (684,193 ) — — — (686,123 ) — (686,123 ) — — — (5,299,451 ) — — (5,299,451 ) — (5,299,451 ) — — — — — 19,443,370 19,443,370 (173,217 ) 19,270,153 72,267,842 $ 722,678 $ 311,299,712 $ (19,852,316 ) $ 4,556,813 $ (136,540,351 ) $160,186,536 $ 4,115,754 $ 164,302,290 9,665 97 36,147 — — — 36,244 — 36,244 419,838 4,198 (4,198 ) — — — — — — — — 2,583,728 — — — 2,583,728 — 2,583,728 — — — — (1,243,327 ) — (1,243,327 ) — (1,243,327 ) — — — — 1,886,520 — 1,886,520 330,273 2,216,793 — — — — 785,339 — 785,339 — 785,339 — — (72,882 ) — — — (72,882 ) 321,782 248,900 (126,510 ) (1,265 ) (530,618 ) — — — (531,883 ) — (831,883 ) — — — (6,728,507 ) — — (6,728,507 ) — (6,728,507 ) — — — — — 8,934,151 8,934,151 21,647 8,955,798 72,570,835 $ 725,708 $ 313,311,889 $ (26,580,823 ) $ 5,985,345 $ (127,606,200 ) $165,835,919 $ 4,789,456 $ 170,625,375 19,700 197 72,248 — — — 72,445 — 72,445 897,953 8,980 (8,980 ) — — — — — — — — 3,361,948 — — — 3,361,948 — 3,361,948 — — — — (971,148 ) — (971,148 ) — (971,148 ) — — — — (1,121,011 ) — (1,121,011 ) (247,818 ) (1,368,829 ) — — — — 252,838 — 252,838 — 252,838 (262,230 ) (2,622 ) (1,026,945 ) — — — (1,029,567 ) — (1,029,567 ) — — — (4,414,626 ) — — (4,414,626 ) — (4,414,626 ) — — — — — 3,597,927 3,597,927 661,706 4,259,633 73,226,258 $ 732,263 $ 315,710,160 $ (30,995,449 ) $ 4,146,024 $ (124,008,273 ) $165,584,725 $ 5,203,344 $ 170,788,069 Fiscal years ended 2013 2012 2011 Net (loss) income $ (5,606,016 ) $ (18,994,272 ) $ 3,684,571 Other comprehensive (loss) income: Foreign currency translation adjustments 231,321 2,687,344 (1,368,829 ) Unrealized holding (loss) gain on marketable securities (116,134 ) 730,967 (260,502 ) Reclassifications of gains in net loss (1,936,121 ) (586,433 ) (457,808 ) Other comprehensive (loss) income $ (1,820,934 ) $ 2,831,878 $ (2,087,139 ) Comprehensive (loss) income (7,426,950 ) (16,162,394 ) 1,597,432 Comprehensive gain (loss) attributable to the noncontrolling interest 871,867 167,232 (357,389 ) Comprehensive (loss) income attributable to the controlling interest $ (6,555,083 ) $ (15,995,162 ) $ 1,240,043 57CASH FLOWS 2011 2010 2009 $ 4,259,633 $ 8,955,798 $ 19,270,153 8,598,672 6,565,365 5,990,951 (152,665 ) 69,891 (260,687 ) 3,923,628 2,583,728 1,884,340 (368,641 ) (2,597,505 ) — 296,451 600,299 (483,057 ) 150,644 — 926,630 4,999,512 — — (4,266,000 ) — — — — (1,187,937 ) — — (599,328 ) 14,150 418,710 942,462 (224,644 ) 154,000 (588,066 ) 379,246 (203,526 ) 564,252 256,190 1,926,676 3,703,840 162,575 (4,287,717 ) (2,666,190 ) 1,311,173 (718,074 ) 132,458 655,611 338,863 (4,228,801 ) (743,434 ) 126,833 (43,861 ) 19,252,101 13,933,341 23,357,159 40,732,353 47,956,856 31,328,136 (42,345,935 ) (48,730,506 ) (48,712,270 ) 16,906 196,578 (41,781 ) 392,196 4,223,536 — — — 212,380 (10,084,307 ) — — (1,980,609 ) — — — — 426,537 (7,132,371 ) (15,849,823 ) (3,684,630 ) (20,401,767 ) (12,203,359 ) (20,471,628 ) (4,414,626 ) (6,728,507 ) (5,299,451 ) — (72,085 ) (300,000 ) — 111,144 — (1,029,567 ) (531,883 ) (686,123 ) 72,445 36,244 123,375 (5,371,749 ) (7,185,087 ) (6,162,199 ) (217,970 ) 456,908 159,963 (6,739,384 ) (4,998,197 ) (3,116,705 ) 49,834,547 54,832,744 57,949,449 43,095,163 $ 49,834,547 $ 54,832,744 $ 186,000 $ 221,000 $ 1,304,000 $ 469,000 $ 1,194,000 $ 124,058 Common Stock Shares Amount Balance December 25, 2010 72,570,835 $ 725,708 $ 313,311,889 $ (26,580,823 ) $ 5,985,345 $ (127,711,030 ) $ 165,731,089 $ 4,778,034 $ 170,509,123 Exercise of stock options 19,700 197 72,248 — — — 72,445 — 72,445 Vesting of restricted stock 897,953 8,980 (8,980 ) — — — — — — Stock based compensation expense — — 3,361,948 — — — 3,361,948 — 3,361,948 Other comprehensive loss — — — — (1,839,321 ) — (1,839,321 ) (247,818 ) (2,087,139 ) Restricted stock for tax withholding obligations (262,230 ) (2,622 ) (1,026,945 ) — — — (1,029,567 ) — (1,029,567 ) Treasury stock purchase — — — (4,414,626 ) — — (4,414,626 ) — (4,414,626 ) Net income — — — — — 3,079,364 3,079,364 605,207 3,684,571 Balance December 31, 2011 73,226,258 732,263 315,710,160 (30,995,449 ) 4,146,024 (124,631,666 ) 164,961,332 5,135,423 170,096,756 Exercise of stock options $ — $ — $ — $ — $ — $ — Vesting of restricted stock 671,568 6,716 (6,716 ) — — — — — — Stock based compensation expense — — 3,851,672 — — — 3,851,672 — 3,851,672 Other comprehensive income — — — — 2,366,768 — 2,366,768 465,110 2,831,878 Foreign currency translation adjustments — — — — — — — Acquisition of Ikanos equity interest — — — — — — — 1,384,039 1,384,039 Restricted stock for tax withholding obligations (201,182 ) (2,013 ) (626,621 ) — — — (628,634 ) — (628,634 ) Treasury stock purchase — — — (3,455,529 ) — — (3,455,529 ) — (3,455,529 ) Net loss — — — — — (18,361,930 ) (18,361,930 ) (632,342 ) (18,994,272 ) Balance, December 29, 2012 73,696,644 $ 736,966 $ 318,928,495 $ (34,450,978 ) $ 6,512,792 $ (142,993,595 ) $ 148,733,680 $ 6,352,230 $ 155,085,910 Vesting of restricted stock 1,216,900 12,169 (12,169 ) — — — — — — Stock based compensation expense — — 3,804,408 — — — 3,804,408 — 3,804,408 Other comprehensive loss — — — — (1,845,466 ) — (1,845,466 ) 24,532 (1,820,934 ) Sale of III-V product line — — — — (1,580,629 ) — (1,580,629 ) (2,673,051 ) (4,253,680 ) Acquisition of eMDT — — — — — — — 200,198 200,198 Acquisition of noncontrolling interest in Kowon — — (1,020,130 ) — 355,300 — (664,830 ) (2,997,570 ) (3,662,400 ) Restricted stock for tax withholding obligations (320,061 ) (3,200 ) (1,189,146 ) — — — (1,192,346 ) — (1,192,346 ) Treasury stock purchase — — — (7,991,954 ) — — (7,991,954 ) — (7,991,954 ) Net loss — — — — — (4,709,616 ) (4,709,616 ) (896,400 ) (5,606,016 ) Balance, December 28, 2013 74,593,483 $ 745,935 $ 320,511,458 $ (42,442,932 ) $ 3,441,997 $ (147,703,211 ) $ 134,553,247 $ 9,939 $ 134,563,186 58Fiscal year ended 2013 2012 2011 Cash flows from operating activities: Net (loss) income $ (5,606,016 ) $ (18,994,272 ) $ 3,684,571 Adjustments to reconcile net (loss) income to net cash (used in) provided by operating activities: Depreciation and amortization 3,646,725 9,111,943 8,598,672 Accretion (amortization) of premium or discount on marketable debt securities 360,403 (287,439 ) (152,665 ) Stock-based compensation 4,203,408 4,486,990 3,923,628 Net gain on investment transactions (1,899,291 ) (856,170 ) (368,641 ) Losses in unconsolidated affiliates 625,098 679,587 296,451 Impairment on marketable debt securities — — 150,644 Impairment of intangible assets and goodwill 1,511,414 1,704,770 4,999,512 Gain on sale of III-V product line (33,452,176 ) — — Release of valuation allowance on deferred tax assets — — (4,266,000 ) Deferred income taxes 252,687 2,162,246 — Foreign currency losses 341,590 1,236,194 14,150 Loss on remeasurement of investment in Ikanos — 557,594 — Impairment of investments 5,000,442 — — Change in allowance for bad debt (107,694 ) (129,370 ) (224,644 ) Other non-cash items 733,428 402,938 379,246 Changes in assets and liabilities: Accounts receivable 4,853,073 4,363,447 256,190 Inventory 2,262,547 3,466,568 993,328 Prepaid expenses and other current assets (179,858 ) 126,580 1,055,482 Accounts payable and accrued expenses (773,471 ) (2,996,339 ) 655,611 Billings in excess of revenue earned (672,714 ) (1,247,066 ) (743,434 ) Net cash (used in) provided by operating activities (18,900,405 ) 3,788,201 19,252,101 Cash flows from investing activities: Proceeds from sale of marketable debt securities 17,130,488 37,305,871 40,732,353 Purchase of marketable debt securities (49,329,891 ) (39,853,837 ) (42,345,935 ) Proceeds from sale of III-V product line 55,188,020 — — Cash included in current assets held for sale — (2,388,812 ) — Cash paid to acquire Ikanos, net of cash acquired — 93,872 — Cash paid to acquire eMDT, net of cash acquired 211,484 — — Cash paid to acquire FDD, net of cash acquired — 94,351 (10,084,307 ) Purchases of cost based investment (3,583,611 ) (2,249,784 ) (1,980,609 ) Proceeds from sale of investments 2,597,289 856,170 392,196 Other assets (10,552 ) 43,564 16,906 Capital expenditures (741,543 ) (9,831,967 ) (7,132,371 ) Net cash provided by (used in) investing activities 21,461,684 (15,930,572 ) (20,401,767 ) Cash flows from financing activities: Treasury stock purchases (7,991,954 ) (3,455,529 ) (4,414,626 ) Purchase of noncontrolling interest in Kowon (3,662,400 ) — — Settlements of restricted stock for tax withholding obligations (1,192,346 ) (628,634 ) (1,029,567 ) Proceeds from exercise of stock options — — 72,445 Net cash used in financing activities (12,846,700 ) (4,084,163 ) (5,371,748 ) Effect of exchange rate changes on cash (93,300 ) 266,758 (217,970 ) Net decrease in cash and equivalents (10,378,721 ) (15,959,776 ) (6,739,384 ) Cash and equivalents: Beginning of year 27,135,387 43,095,163 49,834,547 End of year $ 16,756,666 $ 27,135,387 $ 43,095,163 Supplemental disclosure of cash flow information: Income taxes paid $ 95,000 $ 75,000 $ 186,000 Supplemental schedule of noncash investing activities: Construction in progress included in accrued expenses $ 105,000 $ 360,000 $ 469,000 Non-cash proceeds from sale of III-V product line $ 14,866,000 $ — $ — weeks, the fiscal years ended December 25, 2010 and December 26, 2009 each include 52 weeks, and are referred to as fiscal years 2011, 20102013, 2012 and 2009,2011, respectively, herein.(78%)93% subsidiary, Kowon Technology Co., Ltd. (Kowon), located in Korea, a majority owned (58)% subsidiary, Ikanos Consulting Ltd. (Ikanos), located in the United Kingdom, and a majority owned (90%)(51)% subsidiary, Kopin Taiwan Corporation (KTC)eMDT America Inc (eMDT), located in TaiwanCalifornia (collectively the “Company”)Company). All inter-companyintercompany transactions and balances have been eliminated. Amounts of Kowon, Ikanos and KTCeMDT not attributable to the Company are referred to as noncontrolling interests in the consolidated statements of operations. Investmentoperations and consolidated statements of comprehensive (loss) income. Investments in business entities in which the Company does not have control but has the ability to exercise significant influence over operating and financial policies are accounted for by the equity method.59KOPIN CORPORATIONNOTES TO CONSOLIDATED FINANCIAL STATEMENTS—(Continued) and III-V product development programs or programs funded by agencies or prime contractors of the U.S. government and commercial partners. Research and development costs include staffing, purchases of materials and laboratory supplies, circuit design costs, fabrication and packaging of experimental display products, and overhead, and are expensed immediately.Securities.debt securities, at fair value.” TheIn fiscal year 2013, the investment in Vuzix Corporation (Vuzix) was included in "Other Assets" as available-for-sale and at fair value. In fiscal year 2012, the investments in Advanced Wireless Semiconductor Company (AWSC) and WIN Semiconductor Corp. (WIN) arewere included in “Other Assets”assets” as available-for-sale and at fair value.value and these securities were sold in 2013. The Company records the amortization of premium and accretion of discounts on marketable debt securities in the results of operations.2011, 20102013, 2012 and 2009.2011.or specific identification method) or market and consists of the following at December 31, 201128, 2013 and December 25, 2010: 2011 2010 $ 9,934,724 $ 10,775,935 5,220,353 4,159,064 6,260,440 6,527,872 $ 21,415,517 $ 21,462,871 Inventory on consignment at customer locations was $3.9 million and $4.4 million at December 31, 2011 and December 25, 2010, respectively. Included in prepaid expenses and other current assets is a deposit of $0.4 million for raw materials in advance of delivery. 2013 2012 Raw materials $ 1,441,569 $ 2,540,497 Work-in-process 1,003,540 1,880,202 Finished goods 632,946 1,369,054 $ 3,078,055 $ 5,789,753 years.years. Leasehold60KOPIN CORPORATIONNOTES TO CONSOLIDATED FINANCIAL STATEMENTS—(Continued)31, 201128, 2013 and December 25, 2010,29, 2012, the Company had warranty reserves of $1.3 million.$0.7 million. For the fiscal years 2011, 20102013, 2012 and 20092011 warranty claims and reversals were approximately $1.4$0.8 million $0.8, $2.2 million and $1.2$1.4 million, respectively.$1.3$0.3 million at December 28, 2013 and $0.9 million at December 31, 2011 and December 25, 2010,29, 2012, respectively. This represents the legal obligations associated with retirement of the Company’s assets when the timing and/or method of settling the obligation are conditional on a future event that may or may not be within the control of the Company. The Company also recorded accumulated depreciation charges of $0.6 million and $0.6 million, at December 31, 2011 and December 25, 2010, respectively, which represents the cumulative amortization of the capitalized long-lived asset associated with this obligation. The Company estimated the ARO using a discounted cash flow model that considered the Company’s cost of capital as well as increases in costs prior to settlement of the obligations and considered the probability that performance would be required. 2011 2010 $ 944,617 $ 903,133 309,119 — 41,934 — $ 1,295,670 $ 944,617 2013 2012 Beginning balance $ 322,477 $ 1,295,670 Additions — 32,360 Charges — (424,785 ) Accretion and exchange rate change 6,958 43,211 Reclassified to noncurrent liabilities held for sale — (623,979 ) Ending balance $ 329,435 $ 322,477 Taiwan tax law requires a 10% tax on unappropriated earnings of the Company’s subsidiary KTC. The Company records this tax in the year the earnings are recorded.61KOPIN CORPORATIONNOTES TO CONSOLIDATED FINANCIAL STATEMENTS—(Continued)stock units. 2011 2010 2009 64,405,776 66,019,847 66,849,890 828,436 691,654 607,861 65,234,212 66,711,501 67,457,751 2013 2012 2011 Weighted-average common shares outstanding—basic 62,347,852 63,617,680 64,405,776 Stock options and nonvested restricted common stock — — 828,436 Weighted-average common shares outstanding—diluted 62,347,852 63,617,680 65,234,212 anti-dilutive. 2011 2010 2009 613,934 229,159 419,213 1,561,925 2,544,411 3,953,387 2,175,859 2,773,570 4,372,600 2013 2012 2011 Nonvested restricted common stock 3,024,148 2,283,048 613,934 Stock options 558,850 983,680 1,561,925 Total 3,582,998 3,266,728 2,175,859 2011, 20102013, 2012 or 2009.62KOPIN CORPORATION2011NOTES TO CONSOLIDATED FINANCIAL STATEMENTS—(Continued).2011,2013, the Company granted compensation awards to its Chief Executive Officer that consisted of a granttwo grants of 260,000150,000 shares of restricted stock and a granteach. One of 380,000 shares of phantom stock to be settled in cash. The 260,000 shares of restricted stock and the 380,000 shares of phantom stockgrants will vest at the end of the first 10 consecutive trading day period following the grant date during which the Company’s common stock trades at a price per share equal to or greater than $5.25,$6.00. The other award will vest at the end of the first 10 consecutive trading day period following the grant date during which the Company’s common stock trades at a price per share equal to or greater than $7.00. In 2011, the Company granted compensation awards to its Chief Executive Officer that consisted of a grant of 260,000 shares of restricted stock and a grant of 380,000 shares of phantom stock to be settled in cash. The 260,000 shares of restricted stock and the 380,000 shares of phantom stock will vest at the end of the first 10 consecutive trading day period following the grant date during which the Company’s common stock trades at a price per share equal to or greater than $5.25, prior to September 12, 2016.2016. The vesting of the awards upon achieving a closing stock price of $6.00, $7.00 and $5.25 for 10 consecutive days is considered a market condition. The accounting for the 150,000, 150,000 and 260,000 shares requires that the fair market value of the shares is determineto be determined on the grant day and then this fair market value is expensed straight-line over the derived service period. The accounting for the phantom stock award requires the Company to periodically assess the fair market value of the award, with increases or decrease in the fair market value being reflected in the statementstatements of operations.fair market valuecompensation cost of the awardsthis award will be expensedrecognized over a derived service period currently estimated to be approximately 12 months. However, if the market condition occurs before the estimated service period of 12 months or if there are material changes in the underlying data used in the fair market valuation, the fair market valuation may increase or decrease and the period over which the fair market valuation is recognized inCompany ships the statementdisplays. As of operations may increase or decrease. (losses) on marketable equity and debt securities classified as available-for-sale and foreign currency translation adjustments.(loss) isare as follows: Cumulative
Translation
Adjustment Unrealized��Holding
(Loss) Gain on
Marketable
Securities Non-Credit
Related
Losses on
Investments Accumulated Other
Comprehensive
Income (Loss) $ (766,082 ) $ 597,779 $ — $ (168,303 ) 1,320,443 4,442,850 (1,038,177 ) 4,725,116 554,361 5,040,629 (1,038,177 ) 4,556,813 1,886,520 (1,243,327 ) 785,339 1,428,532 2,440,881 3,797,302 (252,838 ) 5,985,345 (1,121,011 ) (971,148 ) 252,838 (1,839,321 ) $ 1,319,870 $ 2,826,154 $ — $ 4,146,024 63KOPIN CORPORATIONNOTES TO CONSOLIDATED FINANCIAL STATEMENTS—(Continued) Balance as of December 25, 2010 $ 2,440,881 $ 3,797,302 $ (252,838 ) $ 5,985,345 Changes during year (1,121,011 ) (971,148 ) 252,838 (1,839,321 ) Balance as of December 31, 2011 1,319,870 2,826,154 — 4,146,024 Changes during year 2,222,234 144,534 — 2,366,768 Balance as of December 29, 2012 3,542,104 2,970,688 — 6,512,792 Changes during year (1,017,403 ) (2,053,392 ) — (3,070,795 ) Balance as of December 28, 2013 $ 2,524,701 $ 917,296 $ — $ 3,441,997 $32.4$6.0 million at December 31, 2011.Intangibles, Goodwill and OtherDecember 2010 and September 2011,February 2013, the FASBFinancial Accounting Standards Board (FASB) issued Accounting Standards Update (ASU) No. 2013-02, Comprehensive Income (Topic 220): Reporting of Amounts Reclassified Out of Accumulated Other Comprehensive Income. ASU 2010-28 and ASU 2011-08Intangibles—Goodwill and Other, respectively, which both modifyNo. 2013-02 requires an entity to provide information about the annual goodwill impairment testing procedures. ASU 2010-28 focusesamounts reclassified out of accumulated other comprehensive income by component. In addition, an entity is required to present, either on the carrying amount of goodwill for purposes of performing step oneface of the goodwill test andstatement where net income is presented or in the notes, significant amounts reclassified out of accumulated other comprehensive income by the respective line items of net income but only if the amount reclassified is required under United States Generally Accepted Accounting Principles (U.S. GAAP) to be reclassified to net income in its entirety in the same reporting period. For other amounts that are not required under U.S. GAAP to be reclassified in their entirety to net income, an entity is required to cross-reference to other disclosures required under U.S. GAAP that provide additional detail about those amounts. ASU 2011-08 focuses on allowing entities the ability to first assess the qualitative factors to determine whether itNo. 2013-02 is necessary to perform the two-step quantitative goodwill impairment test. Both of these updates are effective for annual and interim reporting periods beginning after December 15, 2011 and early adoption is permitted. ASU 2010-28 requires retrospective application.2012. The Company elected not to early adopt either of these updates and does not expect the adoption will have a material impactadopted this ASU on its goodwill impairment calculation, financial position or results of operations.Fair Value MeasurementIn May 2011, the FASB issued ASU-2011-04Fair Value Measurement that modifies the fair value measurements and disclosure requirements in U.S. GAAP and IFRS. This newly issued accounting standard clarifies the application of certain existing fair value measurement guidance and expands the disclosures for fair value measurements that are estimated using significant unobservable inputs. This guidance is effective on a prospective basis for annual and interim reporting periods beginning after December 15, 2011. The Company does not expect that adoption of this standard will have a material30, 2012 with no impact on its financial position or results of operations.statements.Statement of Comprehensive IncomeIn June 2011,During the FASB issued ASU 2011-05Statement of Comprehensive Income which (1) eliminatestwelve months ended December 28, 2013, the option to presentchange in the components ofCompany's accumulated other comprehensive income as partwas the net of $0.2 million cumulative translation adjustment, $(0.1) million unrealized holding losses on marketable securities, $(1.9) million of reclassified holding gains, $(1.6) million related to the sale of its III-V product line and $0.4 million million related to its acquisition of additional noncontrolling interest in Kowon.statement of changesoutstanding equity interest in stockholders’ equity; (2) requires the consecutive presentationKTC Wireless, LLC, a wholly owned subsidiary of the statementCompany that held the Company's investment in KTC, to IQE KC, LLC (IQE) and IQE plc (Parent, and collectively with IQE, the Buyer) pursuant to a Purchase Agreement (the Purchase Agreement) entered into on January 10, 2013 for an aggregate purchase price of net incomeapproximately $75 million, subject to certain adjustments, including working capital adjustments and other comprehensive income;escrow (the Sale). After adjustments for working capital items the final purchase price was $70.2 million of which $55.2 million was paid to the Company in 2013 and (3) requires an entity to present reclassification adjustments on the face of the financial statements from other comprehensive income to net income. The FASB has deferred the third requirement under this ASU. This amendment does not change the items that must be reported in other comprehensive income or when an item of other comprehensive income must be reclassified to net income nor does this amendment affect how earnings per share is calculated or presented. This guidance is required to be applied retrospectively and is effective for fiscal years and interim periods beginning after December 15, 2011. The Company does not expect that adoption of this standardremaining $15 million will have a material impact on its financial position or results of operations.642.$15 million was recorded at its estimated discount value of $14.8 million and is secured by liens on certain assets of the business sold. Fiscal Years Ended (in millions) December 28, 2013 December 29, 2012 December 31, 2011 Net product and research and development revenues $ 2.3 $ 58.8 $ 66.5 (Loss) gain from discontinued operations before income taxes (0.2 ) 4.5 5.9 (Provision) benefit for income taxes on discontinued operations — (1.7 ) 3.8 Discontinued operations, net of tax (0.2 ) 2.8 9.7 Gain on sale, net of $13.1 million of tax 20.4 — — Income from discontinued operations, net of tax $ 20.2 $ 2.8 $ 9.7 (in millions) Current assets Cash and equivalents $ 2.4 Accounts receivable, net of allowance of $0.1 million 7.6 Accounts receivable from unconsolidated affiliates 0.6 Inventory 10.6 Prepaid taxes 0.2 Prepaid expenses and other current assets 0.2 Total current assets held for sale 21.6 Property, plant and equipment, net 25.7 Deferred tax assets 3.3 Other assets 0.1 Total noncurrent assets held for sale 29.1 Total assets held for sale $ 50.7 Current liabilities Accounts payable $ 3.7 Accrued payroll and expenses 1.8 Accrued warranty 0.2 Other accrued liabilities 1.4 Total current liabilities held for sale $ 7.1 Total noncurrent liabilities held for sale $ 0.6 31, 201128, 2013 and December 25, 2010: Useful Life 2011 2010 $ 831,387 $ 867,573 10 years 5,773,270 5,106,251 3-5 years 68,794,841 48,225,704 Life of the lease 15,263,804 14,357,251 3 years 400,304 404,143 1,889,396 16,536,645 92,953,002 85,497,567 (60,583,561 ) (52,883,606 ) $ 32,369,441 $ 32,613,961 Useful Life 2013 2012 Land $ 915,595 $ 901,934 Buildings 10 years 2,398,188 2,424,152 Equipment 3-5 years 20,993,220 23,219,534 Leasehold improvements Life of the lease 3,441,553 11,157,960 Furniture and fixtures 3 years 910,270 783,030 Equipment under construction 623,503 1,673,390 29,282,329 40,160,000 Accumulated depreciation and amortization (23,247,366 ) (31,673,594 ) Net property, plant and equipment $ 6,034,963 $ 8,486,406 2011, 20102013, 2012 and 2009.2011. Depreciation expense for the fiscal years 2011, 20102013, 2012 and 20092011 was approximately $7,934,000, $6,565,000$2.4 million, $3.5 million and $5,991,000$3.8 million, respectively.3.Amounts Due To / Due From Affiliates31, 201128, 2013 and December 25, 2010: 2011 2010 $ 1,602,096 $ 4,001,937 1,709,189 — 2,401,669 2,698,120 1,980,609 — 252,525 157,618 $ 7,946,087 $ 6,857,675 2013 2012 Marketable Equity Securities AWSC $ — $ 1,764,657 WIN — 1,410,388 Vuzix Corporation 1,433,102 — Non-Marketable Securities—Equity Method Investments KoBrite 1,421,592 1,828,404 Non-Marketable Securities-Cost Based Investments — 3,485,394 Other 169,764 119,039 $ 3,024,458 $ 8,607,882 31, 201128, 2013, the Company had an investment in Vuzix with a fair market value of $1.4 million and an adjusted cost basis of $0. In 2013, the Company sold its investments in Advanced Wireless Semiconductor Company (AWSC) and WIN Semiconductor Corp. (WIN) for $1.2 million and $1.4 million, respectively, and recorded a gain on the sale of the investments of $1.9 million. As of December 25, 201029, 2012, the Company had an investment in WIN, with a fair market value of $1.4 million and an adjusted cost basis of $0. In the twelve month period ended December 29, 2012 the Company sold 500,000 shares of WIN and recorded a gain of $0.9 million. As of December 29, 2012, the Company had an investment in AWSC, with a fair market value of $1.6$1.8 million and $4.0 million, respectively and an adjusted cost basis of $0.7 million and $0.7 million, respectively. During the second quarter of 2011 the Company sold 300,000 shares of AWSC and recorded a gain of $0.4 million.AWSC: 2011 2010 2009 $ 11,800,000 $ 14,466,000 $ 8,641,000 2013 2012 2011 AWSC $ — $ 8,192,000 $ 11,800,000 31, 201129, 2012 the Company was owed $1.1$0.5 million from AWSC and $0.2$0.1 million from other related parties. As of December 25, 2010, the Company was owed $2.6 million from AWSC.65KOPIN CORPORATIONNOTES TO CONSOLIDATED FINANCIAL STATEMENTS—(Continued)One of the Company’s Directors is a director of AWSC and several directors and officers of Kopin own amounts ranging from 0.1% to 0.5% of the outstanding stock of AWSC.As of December 31, 2011 the Company had an investment in WIN, with a fair market value of $1.7 million and an adjusted cost basis of $0. In 2011 WIN completed an initial public offering on a Taiwanese stock market. The investment is now classified as an available-for-sale marketable equity security and its fair market value is determined by reference to quoted market prices. The Company had previously written the investment off. As a result of the reclassification as an available for sale marketable security the Company recorded an unrealized gain of $1.7 million in accumulated other comprehensive income.AWSC and WIN are listed on the Gre Tai stock exchange in Taiwan. The Company determines the fair market value of these investments based on the quoted prices from this exchange.During the year ended December 25, 2010 the Company sold its investment in Micrel, Inc. for $2.2 million and recorded a gain of $0.7 million and sold shares of AWSC for $1.7 million and recorded a gain of $1.6 million. In addition, in 2010 the Company received and recorded a gain of $0.3 million representing an amount escrowed from the sale of the Company’s Kenet investment in 2008.(losses) gainslosses in unconsolidated affiliates recorded in the consolidated statement of operations are as follows: 2011 2010 2009 $ (296,451 ) $ (600,299 ) $ (341,219 ) — — 824,276 $ (296,451 ) $ (600,299 ) $ 483,057 2013 2012 2011 KoBrite $ (406,811 ) $ (573,265 ) $ (296,451 ) Ikanos — (106,322 ) — Ask Ziggy $ (218,287 ) $ — $ — Total $ (625,098 ) $ (679,587 ) $ (296,451 ) 31, 2011.28, 2013. The Company accounts for its interest using the equity method and at December 31, 201128, 2013 the carrying value of the investment was $2.4 million.$1.4 million. KoBrite’s results are recorded one quarter in arrears. One of the Company’s Directors, who is the chairman of KTC,IQE Taiwan, is a member of the Board of Directors of Bright LED, one of the other principal investors of KoBrite.Inyearthree months ended December 27, 2008March 31, 2012, the Company acquired a 25% interest in Ikanos, a private company, for $0.7 million. On July 10, 2012, the Company invested an additional $2.5 million, which increased the Company’s interest in Ikanos to 51%. For the six month period ended June 30, 2012, the Company recorded the results of operation of Ikanos on the equity lossesmethod of approximately $0.8 millionaccounting and commencing in the third quarter of 2012 the Company consolidated Ikanos.loan loss reserve of approximately $1.2 million in connection with $2.0 million it loaned KTC in fiscal 2008. Subsequent to the close of the July 2009 acquisition of additional equity5% interest in KTC (described in Note 4) the loan was repaida private company Ask Ziggy (AZ), for $1.0 million. In January and in 2009August of 2013, the Company recordedacquired an additional 10% and 5.8% for $900,000 and $700,000, respectively. During the third quarter of 2013, AZ repurchased shares of its common stock from an unrelated third party stockholder and as a gain onresult the loan repaymentCompany now owns approximately 23.0% of approximately $1.2AZ. At December 28, 2013, the Company determined that the AZ investment of $2.5 million was impaired and equity in earningswrote the investment down to $0. The Company has also entered into an agreement to purchase an additional 2.0% of unconsolidated affiliates of approximately $0.8 million.KTC from2011 includes KoBrite for the year ended September 30, 2011. (Kobrite's results are recorded one quarter in arrears). Summarized financial information for 2012 includes Kobrite for the period ended September 30, 2012 and Ikanos, operating results only, for the six month period January 1, 2010 to July 31, 2010 and2012 through June 30, 2012. Summarized financial information for 2013 includes Kobrite for the year ended December 31, 2009September 30, 2013 and for KoBriteAZ for the years ended September 30, 2011, 2010five month period August 1, 2013 through December 28, 2013, and 2009 are as follows: 2011 2010 2009 $ 12,468,000 $ 8,952,000 $ 19,378,000 15,927,000 15,389,000 18,782,000 5,397,000 9,052,000 12,487,000 7,938,000 12,288,000 13,573,000 (794,000 ) (1,316,000 ) (389,000 ) (2,685,000 ) (3,292,000 ) (2,793,000 ) $ (2,526,000 ) $ (3,091,000 ) $ (2,410,000 ) 66 2013 2012 2011 Current assets $ 7,769,000 $ 9,581,000 $ 12,468,000 Noncurrent assets 10,663,000 12,701,000 15,927,000 Current liabilities 1,207,000 1,215,000 5,397,000 Revenues 5,085,000 6,010,000 7,938,000 Margin loss (2,501,000 ) (2,732,000 ) (794,000 ) Loss from operations (6,114,000 ) (4,938,000 ) (2,685,000 ) Net loss (5,526,000 ) (5,308,000 ) (2,526,000 ) KOPIN CORPORATIONNOTES TO CONSOLIDATED FINANCIAL STATEMENTS—(Continued)Non-Marketable Securities—Cost Method InvestmentsIn the fourth quarter of 2011 the Company invested approximately $2.0 million in a private company which makes display related products.$140,000$140,000 at December 31, 2011,28, 2013, which is currently due.entered into agreements to sell certain patents which it is not using and that had a carrying value of $0. The total consideration the Company receives for the sale of the patents is a percentage of any sublicense fees, after expenses, the buyer received. In 2011, 2010 and 2009 the Company recorded $0.2$14.9 million $0.8 million and $6.3 million of income, respectively, which represented the Company’s share of sublicense fees income. The Company does not expect to receive any material additional amounts from the sales of these patents. There is no additional consideration to be received for the patents sold. The Company continues to evaluate the patents in its portfolio for opportunities to moneterize these assets.4. Business CombinationsKopin Taiwan CorpFrom Kopin Taiwan Corp’s (KTC) inception in 2002 through July 2009 the Company owned approximately 35% of KTC. In July 2009, the Company purchased 19,572,468 and 128,226 shares of KTC common stock for approximately $5,975,000 and $300,000, respectively, which increased the Company’s ownership to approximately 87%. In 2010, the Company purchased 14,349,809 shares of KTC common stock for approximately $6,150,000 to increase the Company’s ownership to approximately 90%.The consolidated statements of operations for the periods includes the following amounts which were recorded receivable as a result of the transaction in 2009: 2009 $ 599,000 2,012,000 507,000 In fiscal 2008, the Company recorded allowances for possible bad debts for the excesssale of what KTC owed the Company over what the Company owed KTC. During the nine months ended September 26, 2009 the Company reduced the allowance to $0, resulting in a reduction of selling, generalits III-V product line and administrative expenses of approximately $0.5 million.Prior to July 2009 the Company recorded its investment in KTC underwhich is due January 16, 2016. The receivable is collateralized by certain assets of the Buyer of III-V product line. The Buyer has outstanding debt and the repayment of the receivable is subject to the Buyer remaining within its debt compliance obligations at the time of repayment.had written down the Company's previous investment to $0. in Ikanos, the Company owns approximately 51% of the outstanding stock of Ikanos. The remaining 49% is held by other investors and employees of Ikanos. The Company began consolidating Ikanos on July 1, 2012.Cash consideration $ 2,500,000 Fair market value of Kopin's previously held equity method investment in Ikanos 81,000 Total purchase price $ 2,581,000 July 10, 2012 (As initially reported) Measurement period adjustments July 10, 2012 (As adjusted) Cash and marketable securities $ 2,594,000 $ — $ 2,594,000 Accounts receivable 167,000 — 167,000 Property, plant and equipment 277,000 — 277,000 Customer Relationships — 400,000 400,000 Trade name — 170,000 170,000 Goodwill 1,141,000 (456,000 ) 685,000 Other identifiable assets 111,000 — 111,000 Identifiable liabilities (325,000 ) (114,000 ) (439,000 ) Noncontrolling interest in Ikanos (1,384,000 ) — (1,384,000 ) Total $ 2,581,000 $ — $ 2,581,000 wrote-updecreased its investment in KTCIkanos by approximately $0.6 million$558,000 within the statement of operations which represented the fair market value of the investment immediately prior to the purchaseTransaction.sharesIkanos acquisition have been included in the consolidated statements of operations from the time the Company assumed majority ownership, approximately July 2009.One1, 2012. Ikanos' net loss from operations included in the consolidated results of operation for the Company’s Directors is chairmanyear ended December 29, 2012 was KTCits outstanding common stock and owns approximately 1%the Company increased its ownership of Ikanos to 58%.common stock of KTC. This director is alsoeMDT, a private company, for $400,000. The Company has an employee and stockholder of MTI and is a memberoption to acquire an additional 25% of the BoardCompany for $200,000. In connection with the acquisition, the Company has preliminarily allocated excess purchase price in the amount of Directorsapproximately $400,000 to goodwill. The Company's has finalized the purchase accounting.KoBrite.67Included inCompany’s consolidated statement of operations for 2009 is $0.6 million of net income from KTC which represents KTC’sfiscal years ended December 28, 2013 and December 29, 2012 combine the unaudited historical results of operations from July 30, 2009, the date the Company took a controlling interest in KTC, through December 26, 2009.along with the unaudited historical results of Ikanos and eMDT. The following supplementalresults include the effects of unaudited pro forma disclosures are provided for the year ended December 26, 2009 assuming the acquisition of the controlling interest in KTC had occurredadjustments as December 28, 2008if Ikanos and eMDT were acquired on January 1, 2012 (the first day of the Company’s 2009Company's fiscal year)year 2012). All intercompany transactions have been eliminated. December 26,
2009 $ 115,114,000 16,629,000 Forth Dimension DisplaysOn January 11, 2011,There were no material nonrecurring pro forma adjustments in the Company purchased 100%calculation of revenue or earnings. The pro forma financial results presented below do not include any anticipated synergies or other expected benefits of the outstanding common stockacquisition. These results are presented for informational purposes only and are not necessarily indicative of Forth Dimension Displays Ltd. (FDD) for approximately $11.0 million plus contingent consideration. In addition to the approximate $11.0 million cash paid there were provisions for contingent consideration if certain revenue milestones were met. The revenue milestones were not metfuture operations. Twelve Months Ended December 28, 2013 December 29, 2012 Revenue $ 23,103,000 $ 36,142,000 Net Loss (4,670,000 ) (18,805,000 ) no additional consideration was owed. Commencing in the first quarter of 2011, the Company consolidated the financial results of FDD. Accounting standards for business combinations require that an acquiring entity measures and recognizes identifiable assets acquired and liabilities assumed at the acquisition date fair value of the acquired company with limited exceptions.The 2011 purchase of FDD shares was accounted for as follows: $ 11,000,000 — $ 11,000,000 The allocation of the purchase price is as follows: Jan 11, 2011
(As adjusted (A)) $ 1,000,605 341,156 638,331 1,500,202 247,711 3,300,000 1,100,000 220,000 (1,952,464 ) 4,604,459 $ 11,000,000 (A)At the acquisition date the Company estimated that the contingent consideration would be $1.3 million and during 2011 it revised its estimate to $0.68KOPIN CORPORATIONNOTES TO CONSOLIDATED FINANCIAL STATEMENTS—(Continued) $ — 5,538,491 (934,032 ) 4,604,459 (2,964,114 ) 24,112 $ 1,664,457 Fiscal Year Ended December 28, 2013 December 29, 2012 Beginning Balance $ 684,789 $ 1,664,457 Acquisition of Ikanos — 684,789 Acquisition of eMDT 395,713 — Adjustments (64,370 ) (1,704,770 ) Translation adjustments — 40,313 Ending Balance $ 1,016,132 $ 684,789 year.Onyear unless factors indicate that an impairment may have occurred. As of December 28, 2013, the Company performed a qualitative analysis in determining no impairment of the Company's goodwill was indicated. Goodwill is included in the Kopin reportable segment.This analysis resulted in the determinationAs of December 31, 2011, it was determined that a potential impairment was present. As a result of this analysis, the Company was required to determine the fair value of its finite-lived intangible assets and compare their respective fair values to their carrying values. The fair value of the acquired customer relationships is based on the benefit derived from the incremental revenue and related cash flows as a direct result of the customer relationships. The fair values of the acquired developed technology and trademark portfolio were determined by estimating the royalty expense that would be expected to be paid for the technology and trade name portfolio had they not been owned by the Company using market participant royalty rates and discounting the expected expense that is avoided given the Company’s ownership of these intangible assets. These forecasted cash flows are discounted to present value using an appropriate discount rate. As a result, the carrying values of the finite-lived intangible assets exceeded their fair values and the Company recorded impairments of $1.5$1.5 million related to customer relationships, $0.4$0.4 million related to developed technology, and $57,000$57,000 related to trademark portfolio.2011. Determining2011. Based onfair value of goodwill required determining the fair value of the FDD reporting unit using certain assumptions, including the consideration of two generally accepted valuation methodologies: (i) the income approach and (ii) the market approach. The income approach is based upon the present value of the expected income that can be generated through the ownership of the property. The market approach is a process by which the market value estimate is derived analyzing similar assets that have been recently sold or licensed and then comparing them to the subject. The Company concluded that, given the size of FDD and its relatively niche business, the income approach provided the most accurate method of valuation.Based on this analysis,year ended $3.0 million goodwill impairment charge of $3.0 million, as of and for the year ended December 31, 2011.69KOPIN CORPORATIONNOTES TO CONSOLIDATED FINANCIAL STATEMENTS—(Continued) Years 7 Developed technology 7 Developed technologyTrademark portfolio 7 Trademark portfolio7$170,000 and $665,000$0.3 million in amortization for the threefiscal years ended December 28, 2013 and twelve monthsDecember 29, 2012, respectively, and $0.7 million for the fiscal year ended December 31, 2011, related to its intangible assets.Customer relationships represent the fair value of the underlying relationships and agreements with FDD customers. Developed technology represents the fair value of FDD’s technology The estimated aggregate annual amortization expense relating to acquired intangible assets is as it exists in current products and has value through its continued use or reuse. The trademark represents the brand and name recognition associated with the marketing of FDD products and was determined to have a finite life.The results of operations of the FDD acquisition have been included in the consolidated statements of operations from its acquisition date of January 11, 2011. FDD contributed approximately $4.9 million of net revenue to the consolidated results of operations for the fiscal year ended December 31, 2011. FDD’s net loss from operations included in the consolidated results of operation for the year ended December 31, 2011 was $6.9 million. The transaction related costs associated to the FDD acquisition were considered immaterial and included within selling, general and administrative expense for the fiscal year ended December 31, 2011.The unaudited pro forma financial results for the fiscal year ended December 25, 2010 combine the unaudited historical results of the Company along with the unaudited historical results of FDD. The results include the effects of unaudited pro forma adjustments as if FDD was acquired on December 27, 2009 (the first day of the Company’s fiscal year 2010). There were no material nonrecurring pro forma adjustments in the calculation of revenue or earnings. The pro forma financial results presented below do not include any anticipated synergies or other expected benefits of the acquisition. The results of operations of FDD for the period January 1, 2011 through January 10, 2011 were immaterial. These results are presented for informational purposes only and are not necessarily indicative of future operations (in thousands, except per share amounts): Three Months Ended
December 25, 2010 Twelve Months Ended
December 25, 2010 $ 34,590,000 $ 126,049,000 $ 4,637,000 $ 8,497,000 5.follows.Fiscal Year ending, Amount 2014 $ 711,324 2015 710,422 2016 94,266 2017 21,830 2018 21,830 Thereafter 21,830 Total annual amortization expense $ 1,581,502 Financial70 Fair Value Measurement at December 31, 2011 Using: Total Level 1 Level 2 Level 3 $ 43,095,163 $ 43,095,163 $ — $ — 32,145,653 12,892,670 19,252,983 — 18,754,992 — 18,754,992 — 11,422,742 — 11,422,742 — 1,709,189 1,709,189 1,602,096 1,602,096 — — $ 108,729,835 $ 59,299,118 $ 49,430,717 $ — Fair Value Measurement at December 25, 2010 Using: Total Level 1 Level 2 Level 3 $ 49,834,547 $ 49,834,547 $ — $ — 24,194,630 9,806,380 14,388,250 — 23,212,833 — 23,212,833 — 13,705,380 — 13,705,380 — 4,001,937 4,001,937 — — $ 114,949,327 $ 63,642,864 $ 51,306,463 $ — Fair Value Measurement at December 28, 2013 Using: Total Level 1 Level 2 Level 3 Money Markets and Cash Equivalents $ 16,756,666 $ 16,756,666 $ — $ — U.S. Government Securities 68,284,392 16,542,003 51,742,389 — Corporate Debt 12,984,331 — 12,984,331 — Certificates of Deposit 14,703,812 — 14,703,812 — Vuzix Corporation 1,433,102 1,433,102 — — $ 114,162,303 $ 34,731,771 $ 79,430,532 $ — Fair Value Measurement at December 29, 2012 Using: Total Level 1 Level 2 Level 3 Money Markets and Cash Equivalents $ 27,135,387 $ 27,135,387 $ — $ — U.S. Government Securities 38,582,956 17,576,878 21,006,078 — Corporate Debt 11,095,227 — 11,095,227 — Certificates of Deposit 15,671,779 — 15,671,779 — WIN Semiconductor Corp. 1,410,388 1,410,388 — — Advanced Wireless Semiconductor Company 1,764,657 1,764,657 — — $ 95,660,394 $ 47,887,310 $ 47,773,084 $ — 31, 201128, 2013 and December 25, 2010: Amortized Cost Unrealized Gains Unrealized Losses Fair Value 2011 2010 2011 2010 2011 2010 2011 2010 $ 31,480,482 $ 23,899,218 $ 665,171 $ 295,412 $ — $ — $ 32,145,653 $ 24,194,630 30,879,717 36,949,546 — — (701,983 ) (31,333 ) 30,177,734 36,918,213 $ 62,360,199 $ 60,848,764 $ 665,171 $ 295,412 $ (701,983 ) $ (31,333 ) $ 62,323,387 $ 61,112,843 71KOPIN CORPORATION: Amortized Cost Unrealized Gains Unrealized Losses Fair Value 2013 2012 2013 2012 2013 2012 2013 2012 U.S. government and agency backed securities $ 68,970,505 $ 38,074,136 $ — $ 508,820 $ (686,113 ) $ — $ 68,284,392 $ 38,582,956 Corporate debt and certificates of deposits 27,767,513 27,031,866 — — (79,370 ) (264,860 ) 27,688,143 26,767,006 Total $ 96,738,018 $ 65,106,002 $ — $ 508,820 $ (765,483 ) $ (264,860 ) $ 95,972,535 $ 65,349,962 NOTES TO CONSOLIDATED FINANCIAL STATEMENTS—(Continued)31, 2011: Less than
One year One to
Five years Greater than
Five years Total $ 5,301,740 $ 25,061,877 $ 1,782,036 $ 32,145,653 21,089,896 8,405,338 682,500 30,177,734 $ 26,391,636 $ 33,467,215 $ 2,464,536 $ 62,323,387 Total U.S. government and agency backed securities $ 12,207,098 $ 44,260,888 $ 11,816,406 $ 68,284,392 Corporate debt and certificates of deposits 22,768,523 3,919,620 1,000,000 27,688,143 Total $ 34,975,621 $ 48,180,508 $ 12,816,406 $ 95,972,535 reclassified $1.8 million of noncredit-relateddid not record any OTTI recognized in its earnings prior to March 29, 2009 from retained earnings to accumulated OCI as a cumulative effect adjustment when it adopted a new accounting standard infor the second quarter of 2009.$0.2 and $0.9 million for fiscal years 2011 and 2010, respectively.6.year 2011.December 2010March 2013, the Company’s Board of Directors authorized the repurchase of up to $15$30 million of the Company’s common stock in open market or negotiated transactions through December 2012.March 2014. Since the plan’s inception through December 31, 201128, 2013, the Company has purchased 1,069,1622,171,400 shares of its common stock for $4,414,626.$7,991,954. and a 2001 Supplemental Equity Plan (the Supplemental Plan). The Equity Plan authorized 7,100,000 shares of common stock, to be issued to employees, non-employees, and members of the Board of Directors (the Board). The Supplemental Plan authorized 1,300,000 shares of common stock, to be issued to employees and certain non-employees and only permits the issuance of nonqualified stock options and restricted common stock awards. The Equity Plan and the Supplemental had a ten year liveslife and therefore no new equity awards may be issued under these plans.this plan. In 2010, the Company adopted a 2010 Equity Incentive Plan (the 2010 Equity Plan) which authorized the issuance of shares of common stock to employees, non-employees, and the Board. The 2010 Equity Plan has been subsequently amended to increase the number of authorized shares. The number of shares authorized is 1,800,0002,600,000 plus the number of shares of common stock which were available for grant under the Equity Plan, the number of shares of common stock which were the subject of awards outstanding under the Equity Plan and are forfeited, terminated, cancelledcanceled or expire after the adoption of the 2010 Equity Plan and the number of shares of common stock delivered to the Company either in exercise of a Equity Plan award or in satisfaction of a tax withholding obligation. The option price of statutory incentive stock options shall not be less than 100% of the fair market value of the stock at the date of grant, or in the case of certain statutory incentive stock options, at 110% of the fair market value at the time of the grant. The72KOPIN CORPORATIONNOTES TO CONSOLIDATED FINANCIAL STATEMENTS—(Continued)ten-year0.61.2 million shares of common stock available for issuance under the Company’s 2010 Equity Plan in excess of shares of common stock which have already been reserved for under previously issued equity awards.31, 201128, 2013 and changes during the twelve month period is as follows: 2011 Shares Weighted
Average
Exercise
Price 2,899,261 $ 6.45 (976,236 ) 9.19 (19,700) 3.68 1,903,325 $ 5.07 1,903,325 2013 Shares Balance, beginning of year 983,680 $ 5.26 Options forfeited/canceled (424,830 ) 5.48 Options exercised — — Balance, end of year 558,850 $ 5.09 Exercisable, end of year 558,850 31, 2011: Options Outstanding Options Exercisable Number
Outstanding Weighted
Average
Remaining
Contractual
Life (Years) Weighted
Average
Exercise
Price Number
Exercisable Weighted
Average
Exercise
Price 130,000 4.00 $ 3.49 130,000 $ 3.49 1,077,010 1.60 4.45 1,077,010 4.45 596,215 2.13 5.70 596,215 5.70 100,100 4.00 10.00 100,100 10.00 1,903,325 2.06 $ 5.07 1,903,325 $ 5.07 $ 78,637 $ 78,637 Options Outstanding Options Exercisable Range of Exercise Prices $ 0.01—$ 3.50 130,000 2.00 $ 3.49 130,000 $ 3.49 $ 3.75—$ 4.82 328,850 1.00 4.23 328,850 4.23 $ 5.00—$ 8.03 — 2.23 5.40 — 5.40 $10.00—$10.00 100,000 1.00 10.00 100,000 10.00 558,850 1.23 $ 5.09 558,850 $ 5.09 Aggregate intrinsic value on December 28, 2013 $ 182,643 $ 182,643 2011, 20102013, 2012 or 2009.2011. The intrinsic value of options exercised in 2011, 20102013, 2012 and 20092011 was approximately $23,000, $41,000$0, $0 and $81,000,$23,000, respectively. In June 2010 theThe Company has issued a warrantwarrants to purchase 200,000 shares of the Company’s stock at $3.49. The warrant vests ratably over a two$3.49. During the year period and as ofended December 31, 2011 150,000 shares had29, 2012, the warrants became fully vested. The intrinsic value of the warrant at December 31, 2011 was approximately $78,000.73KOPIN CORPORATIONNOTES TO CONSOLIDATED FINANCIAL STATEMENTS—(Continued)$0.1$0.1 million and $0.1 million for fiscal years 2011 and 2010, respectively. year 2011. No tax benefits were realized during the three year period ended 20112013 due to the existence of tax net operating loss carryforwards.31, 201128, 2013 and changes during the twelve months then ended is presented below: Shares Weighted
Average
Grant
Fair Value 2,033,607 $ 3.79 1,891,012 4.12 (128,988 ) 4.17 (897,949 ) 3.13 2,897,682 $ 4.20 Shares Balance, December 29, 2012 2,283,048 $ 4.76 Granted 2,135,000 3.22 Forfeited (227,000 ) 3.87 Vested (1,216,900 ) 3.46 Balance, December 28, 2013 2,974,148 $ 4.25 20112013 were primarily due to fact that the performance criteria were not met related to these awards.2011, 20102013, 2012 and 20092011 (no tax benefits were recognized): 2011 2010 2009 $ 613,274 $ 590,950 $ 475,461 577,514 428,123 231,890 2,732,840 1,564,655 1,176,989 $ 3,923,628 $ 2,583,728 $ 1,884,340 2013 2012 2011 Cost of product revenues $ 414,842 $ 513,789 $ 613,274 Research and development 423,548 366,443 577,514 Selling, general and administrative 3,365,018 3,606,758 2,732,840 Total $ 4,203,408 $ 4,486,990 $ 3,923,628 31, 201128, 2013 totals $7,388,000$6.2 million and is expected to be recognized over a period of 3two years.7. Concentrations of RiskFinancial instruments that potentially subject the Company to concentration of credit risk other than marketable securities consist principally of trade accounts receivable. Trade receivables are primarily derived from sales to manufacturers of consumer electronic devices and wireless components or military applications.74indicated: Percent of Gross
Accounts Receivable 2011 2010 28 % 24 % * 14 * 11 14 11 Customer 2013 2012 Company A 22 * Company B 12 * Company C 12 * Company D * 37 Company E * 12 2011, 20102013, 2012 and 2009,2011, as a percentage of total revenues, is shown in the table below. Note the caption “Military Customers in Total” in the table below includes Raytheon and DRS Technologies but excludes research and development contracts. The Company sells its displays to Japanese customers through Ryoden Trading Company. (The symbol “*” indicates that sales to that customer were less than 10% of the Company’s total revenues.) Sales as a Percent
of Total Revenue Fiscal Year 2011 2010 2009 28 % 25 % 20 % 9 12 8 * * 19 12 18 14 30 33 45 4 3 6 Skyworks Solutions, Inc. (Skyworks Solutions) also uses the foundry services of Advanced Wireless Semiconductor Company (AWSC) to process the Company’s HBT transistor wafers on their behalf. The Company sells HBT transistor wafers directly to AWSC for eventual resale by AWSC to Skyworks Solutions. AWSC also purchases HBT transistor wafers from the Company for the processing and sale to other customers. The Company does not know exactly how many HBT transistor wafers sold to AWSC are for eventual delivery to Skyworks Solutions but believes the sales to Skyworks Solutions and AWSC should be aggregated for purposes of assessing the concentration of risk.75 Fiscal Year Customer 2013 2012 2011 Military Customers in Total 38 57 60 Company A 18 12 15 Company D 13 22 23 Company E * 21 18 Company F * * 10 United States Government Funded Research and Development Contracts 7 10 8 8. Fiscal Year 2011 2010 2009 $ 150,000 $ 141,000 $ 251,000 242,000 231,000 468,000 333,000 (120,000 ) (29,000 ) 725,000 252,000 690,000 3,977,000 10,253,000 6,532,000 (30,000 ) 513,000 1,414,000 (467,000 ) (700,000 ) (100,000 ) (7,746,000 ) (10,066,000 ) (7,846,000 ) (4,266,000 ) — — $ (3,541,000 ) $ 252,000 $ 690,000 Fiscal Year 2013 2012 2011 Current Federal $ (13,124,000 ) $ — $ 52,000 State 12,000 64,000 88,000 Foreign (34,000 ) — (137,000 ) Total current (benefit) provision (13,146,000 ) 64,000 3,000 Deferred Federal (3,616,000 ) (2,878,000 ) 3,977,000 State 644,000 (505,000 ) (30,000 ) Foreign (565,000 ) 73,000 (898,000 ) Change in valuation allowance 3,750,000 4,345,000 (3,052,000 ) Total deferred provision 213,000 1,035,000 (3,000 ) Total (benefit) provision for income taxes $ (12,933,000 ) $ 1,099,000 $ — 2011, 20102013, 2012 and 20092011 to offset federal and state taxes were $2,698,000, $2,743,000$0, $0 and $6,923,000,$2,698,000, respectively. provision reported from operations are different than those which would have been computed by applying the federal statutory tax rate to loss before income tax benefit. A reconciliation of income tax benefit(benefit) provision from continuing operations as computed at the U.S. federal statutory income tax rate to the provision for income tax benefit is as follows: Fiscal Year 2011 2010 2009 $ 355,000 $ 3,212,000 $ 6,817,000 158,000 150,000 1,718,000 663,000 (203,000 ) 10,000 771,000 — — 415,000 (35,000 ) (40,000 ) — (28,000 ) (134,000 ) 1,191,000 544,000 (1,432,000 ) (858,000 ) (312,000 ) (636,000 ) 1,542,000 2,630,000 3,882,000 (32,000 ) (47,000 ) (1,649,000 ) (7,746,000 ) (5,659,000 ) (7,846,000 ) $ (3,541,000 ) $ 252,000 $ 690,000 Fiscal Year 2013 2012 2011 Tax provision at federal statutory rates $ (13,322,000 ) $ (7,002,000 ) $ (2,006,000 ) State tax liability 8,000 42,000 57,000 Foreign deferred (644,000 ) 734,000 611,000 Foreign withholding 308,000 1,170,000 — Outside basis in KTC and Kowon, net (202,000 ) 2,422,000 — Goodwill — 417,000 771,000 Nondeductible expenses 864,000 180,000 415,000 Increase in net state operating loss carryforwards (2,868,000 ) — — Provision to tax return adjustments and state tax rate change (33,000 ) (462,000 ) 888,000 Tax credits (390,000 ) (100,000 ) 1,188,000 Non-deductible equity compensation (418,000 ) 136,000 1,542,000 Other, net 14,000 (783,000 ) (414,000 ) Change in valuation allowance 3,750,000 4,345,000 (3,052,000 ) $ (12,933,000 ) $ 1,099,000 $ — (losses) earningslosses from continuing operations were approximately $(4,559,000)$(4,966,000), 237,000$(6,870,000) and ($401,000)$(6,879,000) for fiscal years 2011, 20102013, 2012 and 2009,2011, respectively. The Company has not received remittance of any earnings from its foreign operations nor does it intendmade the decision to in the foreseeable future. Accordingly, U.S. income taxes were not providedclose Kowon and accordingly reflected a liability for approximately $10.2 million of undistributed earnings of the Company’s Korean subsidiary and $6.5 million of undistributed earnings of the Company’s Taiwan subsidiary.76 Fiscal Year 2011 2010 $ (508,000 ) — 3,398,000 6,137,000 13,000 — 5,533,000 4,080,000 886,000 2,491,000 5,599,000 4,576,000 5,068,000 5,300,000 3,867,000 3,818,000 3,903,000 4,342,000 27,759,000 30,744,000 (23,493,000 ) (30,744,000 ) $ 4,266,000 $ — Fiscal Year 2013 2012 Deferred tax liability: Intangible asset $ (141,000 ) $ (636,000 ) Foreign withholding liability (1,478,000 ) (1,170,000 ) Foreign unremitted earnings (3,276,000 ) (3,478,000 ) Deferred tax assets: Federal net operating loss carryforwards 15,322,000 9,493,000 State net operating loss carryforwards 624,000 580,000 Foreign net operating loss carryforwards 3,202,000 3,028,000 Equity awards 1,666,000 1,111,000 Tax credits 5,657,000 5,267,000 Equipment 838,000 4,131,000 Investments 4,594,000 4,760,000 Other 3,365,000 3,582,000 Net deferred tax assets 30,373,000 26,668,000 Valuation allowance (31,886,000 ) (27,973,000 ) $ (1,513,000 ) $ (1,305,000 ) 31, 2011,28, 2013, the Company has available for tax purposes federal net operating loss carryforwards (NOLs) of $9.7$43.7 millionexpiring through 2021.2032. The Company has recognized a full valuation allowance on its net deferred tax assets excluding the net deferred tax assets of KTC, as the Company has concluded that such assets are not more likely than not to be realized. Based upon KTC’s 2011 results of operations and 2012 projected results of operations the Company concluded that it was more likely than not that the benefit of the net deferred tax assets would be realized and removed the valuation allowance. The $7.7$3.7 million decrease increase in valuation allowance during fiscal year 20112013 was primarily due to the reversal of the $4.9 million KTC valuation allowance partially offset by a net decrease in deferred tax assets of approximately $1.7 million and utilization of net operating losses generated of $1.1 million.$8.6 million and the sale of III-V assets. The change in valuation allowance during fiscal year 20102012 was due to a net decrease in deferred tax assets of approximately $2.5 million and utilization of net operating losses generated of $3.1$6.0 million and significant equipment disposals of $2.0 million. The Company has not historically recorded, nor does it intend to record the tax benefits from stock awards until realized. Unrecorded benefits from stock awards approximated $12.9$10.1 million at December 31, 2011.2002.2001. State income tax returns are generally subject to examination for a period of 3three to 5five years after filing of the respective return. The state impact of any federal changes remains subject to examination by various states for a period of up to one year after formal notification to the states.3three to 7seven years after filing of the respective return. Years still open to examination by tax authorities in major jurisdictions include Korea (2006 onward)(2006 onward), Japan (2006 onward)(2008 onward)(2008 onward) and Taiwan (2010 onward) and UK returns (2011 onwards)United Kingdom (2011 onward). The Company is not currently under examination in these jurisdictions.9.77KOPIN CORPORATIONNOTES TO CONSOLIDATED FINANCIAL STATEMENTS—(Continued)201120102012 are as follows: Fiscal Year Ended December 31,
2011 December 25,
2010 $ 1,300,000 $ 1,600,000 1,442,000 757,000 (1,424,000 ) (1,057,000 ) $ 1,318,000 $ 1,300,000 10. Fiscal Year Ended December 28,
2013 December 29, 2012 Beginning Balance $ 716,000 $ 1,318,000 Additions 798,000 1,777,000 Claim and reversals (798,000 ) (2,229,000 ) Reclassified to current liabilities held for sale — (150,000 ) Ending Balance $ 716,000 $ 716,000 2011,2013, the plan allowed employees to defer an amount of their annual compensation up to a current maximum of $16,500$17,000 if they are under the age of 50 and $22,000$22,500 if they are over the age of 50.50. The Company matches 50% of all deferred compensation up to a maximum of on the first 3% of each employee’s annualdeferred compensation. The amount charged to operations in connection with this plan was approximately $229,000, $238,000$146,000, $210,000 and $200,000$229,000 in fiscal years 2011, 20102013, 2012 and 2009,2011, respectively.11.LeasesTaunton and Westborough, Massachusetts, Santa Clara, California, Scotts Valley, California, and Dalgety Bay, Scotland and Nottingham, United Kingdom, under non-cancelable operating leases. The Taunton leases expire in 2012 and 2020. The Westborough lease expires in 2023.2023. The Santa Clara lease expires in 2016. The Scotts Valley lease terminatesexpires in 2012.TheNovember 2014. The Dalgety Bay lease expires in 2013.2016. The Company also leases two facilities in Nottingham, United Kingdom which expire in 2016 and 2017. Substantially all real estate taxes, insurance and maintenance expenses under these leases are the Company’s obligations and are expensed as incurred and were immaterial. The following is a schedule of minimum rental commitments under non-cancelable operating leases at December 31, 2011: Amount 1,031,000 496,000 461,000 533,000 569,000 1,897,000 $ 4,987,000 Fiscal Year ending, Amount 2014 $ 1,266,000 2015 1,177,000 2016 836,000 2017 665,000 2018 641,000 Thereafter 2,768,000 Total minimum lease payments $ 7,353,000 $1.8$1.3 million in fiscal year 2011, $1.62013, $0.8 million in fiscal year 20102012 and $1.5$1.1 million in fiscal year 2009.2011.$18,000, $27,000$20,000, $18,000 and $20,000,$18,000, respectively, in fiscal years 2011, 20102013, 2012 and 2009.78KOPIN CORPORATION2011NOTES TO CONSOLIDATED FINANCIAL STATEMENTS—(Continued).hasreceived a purchase and supply agreement with$3.0 million grant in fiscal year 2008 from the Commonwealth of Massachusetts as an incentive to retain jobs in Massachusetts. As a significant HBT customer that expires in July 2012, excluding a last time buy option contained inresult of the agreement. Undersale of the terms of this agreement,III-V product line the Company agreed to maintain capacity levels for manufacturing HBT wafers and the Company committed to a pricing schedule under certain circumstances. The agreement also requires the Company to give prior notice if the Company exits its HBT product line. In consideration for this agreement the customer agreed to source a certain percentage of its HBT wafer needs from the Company subject to the customer’s right to source HBT wafers from other sources if the Company is unable to meet their requirements under certain circumstances. The Company agreed that failure to meet its supply obligations under the agreement would allow the Company’s customer to obtain court ordered specific performance and if the Company does not perform it could then be liable for monetary damages up to a maximum of $40.0 million. To date the Company has met its commitments under this agreement.Included in Billings in excess of revenue earned is $2.2 million which was received in 2008 from a state grant. Amounts from this grant are earned by achieving certain employment levels and other conditions through 2017. In the event the Company does not achieve these employment levels some orrepaid all of the $2.2 million will be refunded. The agreement also contains repayment provisions which require us to repay certainsuch amounts back to the state if the Company fails to achieve certain employment milestones after years three and five of the agreement, or if we move certain parts of the Company’s operations out of the state. Based on current the Company has estimated that it may be required to repay $1.0 million to the state in 2012.12.2013.13.The Company’s chief operating decision maker evaluatesDuring the operating resultsyear ended December 28, 2013, the Company transferred the manufacturing operations of Kowon to the Company’sCompany's manufacturing facility in the United States and sold its III-V product line including, its investment in KTC. As a result of these transactions, the Company has reorganized its operations to align with its new strategy to primarily focus on developing its wearable computing systems and its reflective display products. Accordingly, the Company has determined it has two reportable segments, based on revenuesFDD, the manufacturer of its reflective display products for test and net income (loss).79 Kopin FDD Total 2013 Revenues $ 19,883 $ 3,014 $ 22,898 Net income (loss) attributable to the controlling interest (2,003 ) (2,707 ) (4,710 ) Total assets from continuing operations 143,953 2,179 146,132 Long-lived assets from continuing operations 5,488 547 6,035 2012 Revenues $ 31,879 $ 2,763 $ 34,642 Net (loss) income attributable to the controlling interest (17,067 ) (4,083 ) (21,150 ) Total assets from continuing operations 134,375 4,202 138,577 Long-lived assets from continuing operations 7,728 758 8,486 2011 Revenues $ 59,785 $ 4,874 $ 64,659 Net income (loss) attributable to the controlling interest 244 (6,878 ) (6,634 ) Total assets from continuing operations 187,215 6,657 193,872 Long-lived assets from continuing operations 31,331 1,038 32,369 Effective as of January 11, 2011, when the Company acquired FDD, FDD is now a reportable segment. The Company has four operating and reportable segments: i) Kopin US, which includes the operations in the United States and the Company’s equity method investments, ii) Kowon iii) KTC and iv) FDD (commencing in 2011). The following table presents the Company’s reportable segment results for the years ended 2011, 2010 and 2009: Kopin U.S. Kowon KTC FDD Adjustments Total $ 125,961,000 $ 10,989,000 $ 20,995,000 $ 4,874,000 $ (31,674,000 ) $ 131,145,000 4,887,000 134,000 6,117,000 (6,878,000 ) (662,000 ) 3,598,000 183,555,000 19,287,000 29,618,000 6,657,000 (44,553,000 ) 194,564,000 14,022,000 2,689,000 14,624,000 1,038,000 (4,000 ) 32,369,000 $ 117,476,000 $ 11,603,000 $ 8,766,000 $ — $ (17,459,000 ) $ 120,386,000 8,577,000 (112,000 ) 433,000 — 36,000 8,934,000 174,973,000 19,992,000 19,652,000 — (22,521,000 ) 192,096,000 15,945,000 2,950,000 13,723,000 — (4,000 ) 32,614,000 $ 113,183,000 $ 8,644,000 $ 3,346,000 $ — $ (10,518,000 ) $ 114,655,000 19,642,000 (1,095,000 ) 723,000 — 173,000 19,443,000 168,603,000 19,316,000 9,691,000 — (14,386,000 ) 183,224,000 13,906,000 2,969,000 3,882,000 — (4,000 ) 20,753,000 The Company has $1.7 million of goodwill related to its FDD segment.The adjustments to reconcile to the consolidated financial statement total revenue, net income (loss) and total assets include the elimination of intercompany sales and intercompany receivables and the recording of the noncontrolling interest in Kowon and KTC. December 25, 2010 and December 26, 2009 was based on the location of the customers and is as follows: Fiscal Year 2011 2010 2009 Revenue % of Total Revenue % of Total Revenue % of Total $ 28,246,000 22 % $ 27,977,000 23 % $ 19,822,000 17 % 102,899,000 78 % 92,409,000 77 % 94,833,000 83 % $ 131,145,000 100 % $ 120,386,000 100 % $ 114,655,000 100 % Revenues by product group consisted of approximately the following: Fiscal Year 2011 2010 2009 $ 66,486,000 $ 62,244,000 $ 46,452,000 64,659,000 58,142,000 68,203,000 $ 131,145,000 $ 120,386,000 $ 114,655,000 80KOPIN CORPORATIONNOTES TO CONSOLIDATED FINANCIAL STATEMENTS—(Continued) Fiscal Year 2013 2012 2011 Revenue % of Total Revenue % of Total Revenue % of Total US $ 11,927,000 53 % $ 25,356,000 73 % $ 48,707,000 75 % Other Americas 230,000 1 % 93,000 — % 632,000 1 % Total Americas 12,157,000 54 % 25,449,000 73 % 49,339,000 76 % Asia-Pacific 8,292,000 36 % 7,132,000 21 % 12,300,000 19 % Europe 2,449,000 10 % 2,061,000 6 % 3,020,000 5 % Total Revenues $ 22,898,000 100 % $ 34,642,000 100 % $ 64,659,000 100 % Fiscal Years 2011 2010 $ 14,022,000 $ 15,944,000 1,038,000 — 2,685,000 2,947,000 14,624,000 13,723,000 $ 32,369,000 $ 32,614,000 14. Fiscal Years 2013 2012 United States of America $ 3,050,000 $ 4,840,000 United Kingdom 795,000 1,072,000 Republic of Korea 2,190,000 2,574,000 $ 6,035,000 $ 8,486,000 31, 201128, 2013 and December 25, 2010.29, 2012. The information for each of these quarters is unaudited and has been prepared on the same basis as the audited consolidated financial statements. In the opinion of management, all necessary adjustments, consisting only of normal recurring adjustments, have been included to present fairly the unaudited consolidated quarterly results when read in conjunction with Kopin’s audited consolidated financial statements and related notes. These operating results are not necessarily indicative of the results of any future period.31, 2011:28, 2013 Three months
ended
March 26,
2011 Three months
ended
June 25,
2011 Three months
ended
September 24,
2011 Three months
ended
December 31,
2011 (In thousands, except per share data) $ 34,934 $ 31,431 $ 29,566 $ 35,213 10,974 10,482 9,467 12,431 $ 2,066 $ 802 $ 797 $ (67 ) $ 0.03 $ 0.01 $ 0.01 $ 0.00 $ 0.03 $ 0.01 $ 0.01 $ 0.00 64,737 64,529 64,292 64,065 65,655 66,775 65,441 64,065 (1)Net income per share is computed independently for each of the quarters presented; accordingly, the sum of the quarterly net income per share may not equal the total computed for the year.(2)Gross profit is defined as net product revenue less cost of product revenues.81 Three months ended March 30, 2013 Three months ended June 29, 2013 Three months ended September 28, 2013 Three months
ended
December 28,
2013 (3) (In thousands, except per share data) Revenue $ 6,319 $ 6,079 $ 4,950 $ 5,550 Gross profit (2) $ (396 ) $ (595 ) $ 267 $ 645 (Loss) income from continuing operations $ 1,168 $ (8,062 ) $ (9,015 ) $ (9,844 ) Net loss attributable to the controlling interest $ 21,634 $ (7,910 ) $ (8,771 ) $ (9,660 ) Net loss per share from continuing operations (1): Basic $ 0.34 $ (0.13 ) $ (0.14 ) $ (0.16 ) Diluted $ 0.34 $ (0.13 ) $ (0.14 ) $ (0.16 ) Shares used in computing net loss per share from continuing operations: Basic 63,936 62,492 63,542 61,529 Diluted 63,936 62,492 63,542 61,529 Quarterly Periods During Fiscal Year Ended December 25, 2010: Three months
ended
March 27
2010 Three months
ended
June 26
2010 Three months
ended
September 25
2010 Three months
ended
December 25,
2010 (3) (In thousands, except per share data) $ 25,454 $ 30,189 $ 31,602 $ 33,140 6,338 7,275 10,054 11,731 $ 1,037 $ 1,861 $ 1,361 $ 4,676 $ 0.02 $ 0.03 $ 0.02 $ 0.07 $ 0.02 $ 0.03 $ 0.02 $ 0.07 66,588 66,626 66,115 64,751 67,311 67,357 66,779 65,399 (1) Net income (loss) per share is computed independently for each of the quarters presented; accordingly, the sum of the quarterly net income per share may not equal the total computed for the year. (2) Gross profit is defined as net product revenue less cost of product revenues. (3) TheIncludes $4.0 million impact in loss from continuing operations and net incomeloss attributable to the controlling interest attributable to the impairment of intangibles and write off of investments for the fourth quarterthree month period ended December 28, 2013, as described in Notes 4 and 6. Three months ended March 31, 2012 Three months ended June 30, 2012 Three months ended September 29, 2012 Three months ended December 29, 2012 (In thousands, except per share data) Revenue $ 10,866 $ 7,012 $ 8,190 $ 8,574 Gross profit (2) $ 3,253 $ 1,127 $ 2,451 $ 2,425 (Loss) income from continuing operations $ (2,712 ) $ (6,456 ) $ (6,849 ) $ (5,766 ) Net loss attributable to the controlling interest $ (2,578 ) $ (5,199 ) $ (6,724 ) $ (3,861 ) Net loss per share from continuing operations (1): Basic $ (0.04 ) $ (0.08 ) $ (0.11 ) $ (0.06 ) Diluted $ (0.04 ) $ (0.08 ) $ (0.11 ) $ (0.06 ) Shares used in computing net loss per share from continuing operations: Basic 64,225 63,078 63,415 63,836 Diluted 64,225 63,078 63,415 63,836 (1) Net loss per share is computed independently for each of fiscal year 2010 was impacted by gainsthe quarters presented; accordingly, the sum of $1.4 million related to reimbursementthe quarterly net income per share may not equal the total computed for the year.(2) Gross profit is defined as net product revenue less cost of insurance claims.product revenues.8215, 201217, 2014By: By: John C.C. Fan March 15, 201217, 2014John C.C. Fan James Brewington Director March 15, 201217, 2014James Brewington David E. Brook Director March 15, 201217, 2014David E. Brook Morton Collins Director March 15, 201217, 2014Morton Collins Andrew H. Chapman Director March 15, 201217, 2014Andrew H. Chapman /s/ CHI CHIA HSIEH Chi Chia Hsieh Director March 15, 201217, 2014Chi Chia Hsieh Michael J. Landine Director March 15, 201217, 2014Michael J. Landine Richard A. Sneider March 15, 201217, 2014Richard A. Sneider 8331, 2011,28, 2013, December 25, 201029, 2012 and December 26, 2009 Balance at
Beginning
of Year Additions
Charged
to
Income Deductions
from
Reserve Balance at
End of
Year $ 1,171,000 114,000 (702,000 ) 583,000 583,000 156,000 (2,000 ) 737,000 737,000 182,000 (406,000 ) 513,000 84Description Reserve deducted from assets—allowance for doubtful accounts: 2011 $ 737,000 $ 182,000 $ (406,000 ) $ 513,000 2012 513,000 139,000 (341,000 ) 311,000 2013 311,000 19,000 (128,000 ) 202,000 Sequential
page number 3.1 Amended and Restated Certificate of Incorporation (2 ) 3.2 Amendment to Certificate of Incorporation (5 ) 3.3 Amendment to Certificate of Incorporation (5 ) 3.4 Fourth Amended and Restated By-laws (8 ) 4 Specimen Certificate of Common Stock (1 ) 10.1 Form of Employee Agreement with Respect to Inventions and Proprietary Information (1 ) 10.2 Amended and Restated 1992 Stock Option Plan (2 )* 10.3 1992 Stock Option Plan Amendment (5 )* 10.4 1992 Stock Option Plan Amendment (6 )* 10.5 Kopin Corporation 2001 Equity Incentive Plan (7 )* 10.6 Kopin Corporation 2001 Equity Incentive Plan Amendment (9 )* 10.7 Kopin Corporation 2001 Equity Incentive Plan Amendment (10 )* 10.8 Kopin Corporation 2001 Equity Incentive Plan Amendment (11 )* 10.9 Kopin Corporation 2001 Equity Incentive Plan Amendment (13 )* 10.10 Kopin Corporation 2001 Supplemental Equity Incentive Plan (6 )* 10.11 Form of Key Employee Stock Purchase Agreement (1 )* 10.12 License Agreement by and between the Company and Massachusetts Institute of Technology dated April 22, 1985, as amended (1 ) 10.13 Facility Lease, by and between the Company and Massachusetts Technology Park Corporation, dated October 15, 1993 (3 ) 10.14 Joint Venture Agreement, by and among the Company, Kowon Technology Co., Ltd., and Korean Investors, dated as of March 3, 1998 (4 ) 10.15 Seventh Amended and Restated Employment Agreement between the Company and Dr. John C.C. Fan, dated as of December 8, 2010 (16 ) 10.16 Kopin Corporation Form of Stock Option Agreement under 2001 and 2010 Equity Incentive Plans (12 )* 10.17 Kopin Corporation 2001 and 2010 Equity Incentive Plan Form of Restricted Stock Purchase Agreement (12 )* 10.18 Kopin Corporation Fiscal Year 2012 Incentive Bonus Plan * 10.19 Kopin Corporation Stock Purchase Agreement of 19,572,468 shares of Kopin Taiwan Corporation, (KTC) common stock (14 ) 10.20 Kopin Corporation 2010 Equity Incentive Plan (15 ) 21.1 Subsidiaries of Kopin Corporation 23.1 Consent of Independent Registered Public Accounting Firm 31.1 Chief Executive Officer Certification Pursuant to 18 U.S.C. Section 1350, as Adopted Pursuant to Section 302 of the Sarbanes-Oxley Act of 2002 31.2 Chief Financial Officer Certification Pursuant to 18 U.S.C. Section 1350, as Adopted Pursuant to Section 302 of the Sarbanes-Oxley Act of 2002 32.1 Chief Executive Officer Certification Pursuant to 18 U.S.C. Section 1350, as Adopted Pursuant to Section 906 of the Sarbanes-Oxley Act of 2002 85Exhibits 3.1 Amended and Restated Certificate of Incorporation (2 ) 3.2 Amendment to Certificate of Incorporation (5 ) 3.3 Amendment to Certificate of Incorporation (5 ) 3.4 Fourth Amended and Restated By-laws (8 ) 4 Specimen Certificate of Common Stock (1 ) 10.1 Form of Employee Agreement with Respect to Inventions and Proprietary Information (1 ) 10.5 Kopin Corporation 2001 Equity Incentive Plan (7 ) * 10.6 Kopin Corporation 2001 Equity Incentive Plan Amendment (9 ) * 10.7 Kopin Corporation 2001 Equity Incentive Plan Amendment (10 ) * 10.8 Kopin Corporation 2001 Equity Incentive Plan Amendment (11 ) * 10.9 Kopin Corporation 2001 Equity Incentive Plan Amendment (13 ) * 10.10 Kopin Corporation 2001 Supplemental Equity Incentive Plan (6 ) * 10.11 Form of Key Employee Stock Purchase Agreement (1 ) * 10.12 License Agreement by and between the Company and Massachusetts Institute of Technology dated April 22, 1985, as amended (1 ) 10.13 Facility Lease, by and between the Company and Massachusetts Technology Park Corporation, dated October 15, 1993 (3 ) 10.14 Joint Venture Agreement, by and among the Company, Kowon Technology Co., Ltd., and Korean Investors, dated as of March 3, 1998 (4 ) 10.15 Seventh Amended and Restated Employment Agreement between the Company and Dr. John C.C. Fan, dated as of December 8, 2010 (16 ) 10.16 Kopin Corporation Form of Stock Option Agreement under 2001 and 2010 Equity Incentive Plans (12 ) * 10.17 Kopin Corporation 2001 and 2010 Equity Incentive Plan Form of Restricted Stock Purchase Agreement (12 ) * 10.18 Kopin Corporation Fiscal Year 2012 Incentive Bonus Plan * 10.20 Kopin Corporation 2010 Equity Incentive Plan (15 ) 10.21 Purchase Agreement, dated January 10, 2013, by and among Kopin Corporation, IQE KC, LLC and IQE plc (17 ) 21.1 Subsidiaries of Kopin Corporation 23.1 Consent of Independent Registered Public Accounting Firm 31.1 Chief Executive Officer Certification Pursuant to 18 U.S.C. Section 1350, as Adopted Pursuant to Section 302 of the Sarbanes-Oxley Act of 2002 31.2 Chief Financial Officer Certification Pursuant to 18 U.S.C. Section 1350, as Adopted Pursuant to Section 302 of the Sarbanes-Oxley Act of 2002 32.1 Chief Executive Officer Certification Pursuant to 18 U.S.C. Section 1350, as Adopted Pursuant to Section 906 of the Sarbanes-Oxley Act of 2002 Sequentialpage number32.2 32.2 Chief Financial Officer Certification Pursuant to 18 U.S.C. Section 1350, as Adopted Pursuant to Section 906 of the Sarbanes-Oxley Act of 2002 101 101 31, 2011,29, 2012, formatted in XBRL (Extensible Business Reporting Language): (i) Consolidated Balance Sheets, (ii) Consolidated Statements of Income,Operations, (iii) Consolidated Statements of Comprehensive (Loss), (iv) Consolidated Statements of Stockholder's Equity, (v) Consolidated Statements of Cash Flows, and (iv)(vi) Notes to Consolidated Financial Statements, tagged as blocks of text * Management contract or compensatory plan required to be filed as an Exhibit to this Form 10-K. (1)**This exhibit shall not be deemed "filed" for purposes of Section 18 of the Securities Exchange Act of 1934 or otherwise subject to the liabilities of that Section, nor shall it be deemed incorporated by reference in any filings under the Securities Act of 1933 or the Securities Exchange Act of 1934, whether made before or after the date hereof and irrespective of any general incorporation language in any filing. (1 ) Filed as an exhibit to Registration Statement on Form S-1, File No. 33-45853, and incorporated herein by reference. (2)(2) Filed as an exhibit to Registration Statement on Form S-1, File No. 33-57450, and incorporated herein by reference. (3)(3) Filed as an exhibit to Annual Report on Form 10-K for the fiscal year ended December 31, 1993 and incorporated herein by reference. (4)(4) Filed as an exhibit to Annual Report on Form 10-Q for the quarterly period ended June 27, 1998 and incorporated herein by reference. (5)(5) Filed as an exhibit to Quarterly Report on Form 10-Q for the quarterly period ended July 1, 2000 and incorporated herein by reference. (6)(6) Filed as an exhibit to Registration StatementQuarterly Report on Form S-8, filed on November 13, 200110-Q for the quarterly period ended July 1, 2000 and incorporated herein by reference. (7)(7) Filed as an appendix to Proxy Statement filed on April 20, 2001 and incorporated herein by reference. (8)(8) Filed as an exhibit to Current Report on Form 8-K filed on December 12, 2008 and incorporated herein by reference. (9)(9) Filed as an exhibit to Registration StatementCurrent Report on Form S-88-K filed on August 16, 2002December 12, 2008 and incorporated herein by reference. (10)(10) Filed as an exhibit to Registration Statement on Form S-8 filed on March 15, 2004 and incorporated herein by reference. (11)(11) Filed as an exhibit to Registration Statement on Form S-8 filed on May 10, 2004 and incorporated herein by reference. (12)(12) Filed as an exhibit to Annual Report on Form 10-K for the fiscal year ended December 25, 2004 and incorporated herein by reference. (13)(13) Filed as an exhibit to Registration Statement on Form S-8 filed on April 15, 2008 and incorporated herein by reference. (14)(14) Filed as an exhibit to Annual Report on Form 10-K for the fiscal year ended December 26, 2009 and incorporated by reference herein. (15)(15) Filed with the Corporation’sCompany's Definitive Proxy Statement on Schedule 14 filed as of March 17, 2010April 5, 2013 and incorporated by reference herein. (16)(16) Filed as an exhibit to Annual Report on Form 10-K for the fiscal year ended December 25, 2010 and incorporated by reference herein. (17 ) Filed as an exhibit to Current Report on Form 8-K on January 10, 2013 and incorporated by reference herein. 86