UNITED STATES
SECURITIES AND EXCHANGE COMMISSION
WASHINGTON, DC 20549
FORM 10-K
FORM 10-K (Mark One)
(Mark One)
X | ANNUAL REPORT PURSUANT TO SECTION 13 OR 15(d) OF THE SECURITIES EXCHANGE ACT OF 1934 |
For the fiscal year ended December 31, 20112013
OR
TRANSITION REPORT PURSUANT TO SECTION 13 OR 15(d) OF THE SECURITIES EXCHANGE ACT OF 1934 |
For the transition period fromto
Commission file number 1-13677
MID PENN BANCORP, INC.
(Exact Name of Registrant as Specified in its Charter)
Pennsylvania | 25-1666413 | |
(State or Other Jurisdiction of Incorporation or Organization) | (I.R.S. Employer Identification Number) | |
349 Union Street Millersburg, Pennsylvania | 17061 | |
(Address of Principal Executive Offices) | (Zip Code) | |
Registrant’s telephone number, including area code 717.692.2133
Securities registered pursuant to Section 12(b) of the Act:
Title of Each Class | Name of Each Exchange on Which Registered | |
Common Stock, $1.00 | The NASDAQ Stock Market, Inc. |
Securities registered pursuant to Section 12(g) of the Act: None.
Indicate by check mark if the registrant is a well-known seasoned issuer, as defined in Rule 405 of the Securities Act. Yes ¨ No xX
Indicate by check mark if the registrant is not required to file reports pursuant to Section 13 or Section 15(d) of the Act. Yes ¨ No xX
Indicate by check mark whether the registrant: (1) has filed all reports required to be filed by Section 13 or 15(d) of the Securities Exchange Act of 1934 during the preceding 12 months (or for such shorter period that the registrant was required to file such reports), and (2) has been subject to such filing requirements for the past 90 days. Yes xX No ¨
Indicate by check mark if disclosure of delinquent filers pursuant to Item 405 of Regulation S-K is not contained herein, and will not be contained, to the best of registrant’s knowledge, in definitive proxy or information statements incorporated by reference in Part III of this Form 10-K or any amendment to this Form 10-K. ¨
Indicate by check mark whether the registrant has submitted electronically and posted on its corporate Web site, if any, every Interactive Data File required to be submitted and posted pursuant to Rule 405 of Regulation S-T (§(§232.405 of this chapter) during the preceding 12 months (or for such shorter period that the registrant was required to submit and post such files). Yes xX No ¨
Indicate by check mark whether the registrant is a large accelerated filer, an accelerated filer, a non-accelerated filer or a smaller reporting company. See definition of “large accelerated filer”, “accelerated filer”, and “smaller reporting company” in Rule 12b-2 of the Exchange Act. (Check One).
Large accelerated filer Accelerated Filer Non-accelerated Filer Smaller Reporting Company X
Indicated by check mark whether the registrant is a shell company (as defined in Rule 12b-2 of the Act). Yes ¨ No xX
The aggregate market value of the registrant’s voting and non-voting common equity held by non-affiliates computed by reference to the closing price of the common equity of $8.20$11.14 per share, as reported by NASDAQ, on June 30, 2011,28, 2013, the last business day of the registrant’s most recently completed second fiscal quarter was approximately $28,551,777.$38,903,264.
As of February 15, 2012,14, 2014, the registrant had 3,484,5093,494,397 shares of common stock outstanding.
DOCUMENTS INCORPORATED BY REFERENCE
Portions of the registrant’s definitive proxy statement to be used in connection with the 20122014 Annual Meeting of Shareholders is incorporated herein by reference in partial response to Part III, hereof.
FORM 10-K
TABLE OF CONTENTS
PAGE | ||||||||||||
PART I | ||||||||||||
Item 1 - | 3 | |||||||||||
Item 1A - | 12 | |||||||||||
Item 1B - | 17 | |||||||||||
Item 2 - | 18 | |||||||||||
Item 3 - | 18 | |||||||||||
Item 4 - | 18 | |||||||||||
Item 5 - | 19 | |||||||||||
Item 6 - | 21 | |||||||||||
Item 7 - | Management’s Discussion and Analysis of Financial Condition and Results of Operations | 22 | ||||||||||
Item 7A - | 41 | |||||||||||
Item 8 - | 42 | |||||||||||
Item 9 - | Changes In and Disagreements With Accountants on Accounting and Financial Disclosure | 85 | ||||||||||
Item 9A - | 85 | |||||||||||
Item 9B - | 85 | |||||||||||
Item 10 - | 86 | |||||||||||
Item 11 - | 86 | |||||||||||
Item 12 - | Security Ownership of Certain Beneficial Owners and Management and Related Shareholder Matters | 86 | ||||||||||
Item 13 - | Certain Relationships and Related Transactions, and Director Independence | 86 | ||||||||||
Item 14 - | 86 | |||||||||||
Item 15 - | 87 | |||||||||||
| Signatures | 89 | ||||||||||
EXHIBITS | 90 | |||||||||||
2
MID PENN BANCORP, INC.
PART I
The disclosures set forth in this Item are qualified by the section captioned “Special Cautionary Notice Regarding Forward-Looking Statements” contained in Part II, Item 7. Management’s Discussion and Analysis of Financial Condition and Results of Operations of this report and other cautionary statements set forth elsewhere in this report.
Mid Penn Bancorp, Inc.
Mid Penn Bancorp, Inc. is a one-bank holding company, incorporated in the Commonwealth of Pennsylvania in August 1991. Mid Penn Bancorp, Inc. and its wholly owned subsidiaries are collectively referred to herein as “Mid Penn” or the “Corporation.” On December 31, 1991, Mid Penn acquired, as part of the holding company formation, all of the outstanding common stock of Mid Penn Bank, and the Bank became a wholly owned subsidiary of Mid Penn. Mid Penn’s other wholly owned subsidiaries aresubsidiary is Mid Penn Insurance Services, LLC and Mid Penn Investment Corporation.LLC. Mid Penn’s primary business is to supervise and coordinate the business of its subsidiaries and to provide them with capital and resources.
Mid Penn Investment Corporation engaged in investing activities. A decision was made to close the Mid Penn Investment Corporation, effective August 31, 2010 due to lack of activity within the subsidiary.
Mid Penn Insurance Services, LLC provided title insurance. Due to the lack of activity within this subsidiary, the decision was made to exit this line of business effective December 31, 2009. In August of 2010, Mid Penn Insurance Services, LLC was revived asis a wholly-owned subsidiary of Mid Penn Bank to providethat provides a wide range of personal and commercial insurance products.
Mid Penn’s consolidated financial condition and results of operations consist almost entirely of that of Mid Penn Bank, which is managed as a single business segment. At December 31, 2011,2013, Mid Penn had total consolidated assets of $715,383,000,$713,125,000, total deposits of $634,055,000,$608,130,000, and total shareholders’ equity of $53,452,000.$52,916,000.
As of December 31, 2011,2013, Mid Penn Bancorp, Inc. did not own or lease any properties. Mid Penn Bank owns or leases the banking offices as identified in Part I, Item 2.
All Mid Penn employees are employed by Mid Penn Bank. At December 31, 2011,2013, the Bank had 175178 full-time and 2620 part-time employees. The Bank and its employees are not subject to a collective bargaining agreement, and the Bank believes it enjoys good relations with its personnel.
Mid Penn Bank
Millersburg Bank, the predecessor to Mid Penn Bank (the “Bank”), was organized in 1868, and became a state chartered bank in 1931, obtaining trust powers in 1935, at which time its name was changed to Millersburg Trust Company. In 1962, the Lykens Valley Bank merged with and into1971, Millersburg Trust Company. In 1971, Farmer’s State Bank of Dalmatia merged with Millersburg Trust Company and the resulting entity adopted the name “Mid Penn Bank.” In 1985, the Bank acquired Tower City National Bank. In 1998, Mid Penn acquired Miners Bank of Lykens, which was merged into Mid Penn Bank. The Pennsylvania Department of Banking and Securities and the Federal Deposit Insurance Corporation supervise the Bank. Mid Penn’s and the Bank’s legal headquarters are located at 349 Union Street, Millersburg, Pennsylvania 17061. The Bank presently has 14 offices located in Dauphin, Northumberland, Schuylkill, and Cumberland Counties, Pennsylvania.
Mid Penn’s primary business consists of attracting deposits and loans from its network of community banking offices operated by the Bank. The Bank engages in full-service commercial banking and trust business, making available to the community a wide range of financial services, including, but not limited to, installment loans, personal loans, mortgage and home equity loans, secured and unsecured commercial and consumer loans, lines of credit, construction financing, farm loans, community development and local government loans and various types of time and demand deposits. Deposits of the Bank are insured by the BankDeposit Insurance Fund of the FDIC to the maximum extent provided by law. In addition, the Bank provides a full range of trust services through its Trust Department.and retail investment services. The Bank also offers other services such as Internet banking, telephone banking, cash management services, automated teller services and safe deposit boxes.
In addition, the Bank has a wholly-owned subsidiary, Mid Penn Insurance Services, LLC, which provides a wide range of personal and commercial insurance products.
Business Strategy
The Bank engages in a full-service commercial banking and trust business, making available to the community a wide range of financial services. These services are provided to small and middle-market businesses, high net worth individuals, and retail consumers through 14 full service banking facilities. Mid Penn’s market currently, and historically, has lower unemployment than the U.S. as a whole. This is due in part to a diversified manufacturing and services base and the presence of state government offices, which help shield the local area from national trends. At December 31, 2013, the unadjusted unemployment rate for the Harrisburg/Carlisle area was 5.3% versus the seasonally adjusted national unemployment rate of 6.7%
The Bank seeks to develop long-term customer relationships, maintain high quality service and provide quick responses to customer needs. Mid Penn believes that an emphasis on local relationship building and its conservative approach to lending are important factors in the success and growth of Mid Penn.
MID PENN BANCORP, INC.
The Bank seeks credit opportunities of good quality within its target market that exhibit positive historical trends, stable cash flows and secondary sources of repayment from tangible collateral. The Bank extends credit for the purpose of obtaining and continuing long-term
3
MID PENN BANCORP, INC.
relationships. Lenders are provided with detailed underwriting policies for all types of credit risks accepted by the Bank and must obtain appropriate approvals for credit extensions in excess of conservatively assigned lending limits. The Bank also maintains strict documentation requirements and extensive credit quality assurance practices in order to identify credit portfolio weaknesses as early as possible so any exposures that are discovered might be reduced.
Lending Activities
The Bank offers a variety of loan products to its customers, including loans secured by real estate, commercial and consumer loans. The Bank’s lending objectives are as follows:
· | to establish a diversified commercial loan portfolio; and |
· | to provide a satisfactory return to Mid Penn’s shareholders by properly pricing loans to include the cost of funds, administrative costs, bad debts, local economic conditions, competition, customer relationships, the term of the loan, credit risk, collateral quality and a reasonable profit margin. |
to provide a satisfactory return to Mid Penn’s shareholders by properly pricing loans to include the cost of funds, administrative costs, bad debts, local economic conditions, competition, customer relationships, the term of the loan, credit risk, collateral quality and a reasonable profit margin.
Credit risk is managed through portfolio diversification, underwriting policies and procedures and loan monitoring practices. The Bank generally secures its loans with real estate with such collateral values dependent and subject to change based on real estate market conditions within its market area. As of December 31, 2011,2013, the Bank’s highest concentration of credit is in Commercial Real Estate. Most of the Bank’s business activity with customers wasis located in Central Pennsylvania, specifically in Dauphin, lower Northumberland, western Schuylkill, and eastern Cumberland Counties.
Investment Activities
Mid Penn’s investment portfolio is used to improve earnings through investments of funds in higher-yielding assets than overnight funding alternatives, while maintaining asset quality, which provides the necessary balance sheet liquidity for Mid Penn. Mid Penn does not have any significant concentrations within investment securities.
Mid Penn’s entire portfolio of investment securities is considered available for sale. As such, the investments are recorded on the balance sheet at fair value. Mid Penn’s investments include US Treasury, agency and municipal securities that are given a market pricederive fair values relative to investments of the same type with similar maturity dates. As the interest rate environment changes, Mid Penn’s fair value of existing securities will change. This difference in value, or unrealized gain,loss, amounted to $3,096,000,$1,132,000, as of December 31, 2011.2013. A majority of the investments are high quality United States and municipal securities that, if held to maturity, are expected to result in no loss to the Bank.
For additional information with respect to Mid Penn’s business activities, see Part II, Item 7 of this report, which is incorporated herein by reference.
Sources of Funds
The Bank primarily uses deposits and borrowings to finance lending and investment activities. Borrowing sources include advances from the Federal Home Loan Bank of Pittsburgh and overnight borrowings from the Bank’s customers and correspondent bank.banks. All borrowings, except for the linelines of credit with the Bank’s correspondent bank,banks, require collateral in the form of loans or securities. Collateral levels, therefore, limit borrowings and the available lines of credit extended by the Bank’s creditors. As a result, deposits remain critical to the future funding and growth of the business. Deposit growth within the banking industry has been subject to strong competition from a variety of financial services companies. This competition may require financial institutions to adjust their product offerings and pricing to adequately grow deposits.
Competition
The banking business is highly competitive, and the profitability of Mid Penn depends principally upon the Bank’s ability to compete in its market area. The Bank actively competes with other financial services companies for deposit, loan, and trust business. Competitors include other commercial banks, credit unions, savings banks, savings and loan associations, insurance companies, securities brokerage firms, finance companies, mutual funds, and service alternatives via the Internet. Financial institutions compete primarily on the quality of services rendered, interest rates on loans and deposits, service charges, the convenience of banking facilities, location and hours of operation and, in the case of loans to larger commercial borrowers, relative lending limits.
Many competitors are significantly larger than the Bank and have significantly greater financial resources, personnel and locations from which to conduct business. In addition, the Bank is subject to banking regulations while certain competitors may not be. There are relatively few barriers for companies wanting to enter into the financial services industry. For more information, see the “Supervision and Regulation” section below.
MID PENN BANCORP, INC.
Mid Penn has been able to compete effectively with other financial institutions by emphasizing customer service. Mid Penn’s customer service model is based on convenient hours, efficient and friendly employees, local decision making, and quality products. The Gramm-Leach-Bliley
4
MID PENN BANCORP, INC.
Act (see discussion below), which breaks down many barriers between the banking, securities and insurance industries, may significantly affect the competitive environment in which Mid Penn operates.
The flow of cash into mutual funds, much of which is made through tax deferred investment vehicles such as 401(k) plans, and a generally strong economy, have, until recently, fueled high returns for these investments, in particular, certain equity funds. The recent economic turmoil has negatively impacted the returns on many of these investments and impacted the manner in which investors distribute their funds across investment alternatives. The safety of traditional bank products has again become an attractive option during this period of market volatility. Mid Penn’s ability to attract funds in the future will be impacted by the public’s appetite for the safety of insured or local investments versus the returns offered by alternative choices as part of their personal investment mix.
Supervision and Regulation
General
Bank holding companies and banks are extensively regulated under both Federal and state laws. The regulation and supervision of Mid Penn and the Bank are designed primarily for the protection of depositors, the Deposit Insurance Fund, and the monetary system, and not Mid Penn or its shareholders. Enforcement actions may include the imposition of a conservator or receiver, cease-and-desist orders and written agreements, the termination of insurance on deposits, the imposition of civil money penalties, and removal and prohibition orders. If a banking regulator takes any enforcement action, the value of an equity investment in Mid Penn could be substantially reduced or eliminated.
Federal and state banking laws contain numerous provisions affecting various aspects of the business and operations of Mid Penn and the Bank. Mid Penn is subject to, among others, the regulations of the Securities and Exchange Commission and the Federal Reserve Board, and the Bank is subject to, among others, the regulations of the Pennsylvania Department of Banking and Securities and the Federal Deposit Insurance Corporation (“FDIC”). The following descriptions of and references to applicable statutes and regulations are not intended to be complete descriptions of these provisions or their effects on Mid Penn or the Bank. They are summaries only and are qualified in their entirety by reference to such statutes and regulations.
Holding Company Regulation
Mid Penn is a registered bank holding company subject to supervision and regulation by the Board of Governors of the Federal Reserve System (the “Federal Reserve”). As such, it is subject to the Bank Holding Company Act of 1956 (“BHCA”) and many of the Federal Reserve’s regulations promulgated thereunder. The Federal Reserve has broad enforcement powers over bank holding companies, including the power to impose substantial fines and civil penalties.
The BHCA requires Mid Penn to file an annual report with the Federal Reserve regarding the holding company and its subsidiary bank. The Federal Reserve Board also makes examinations of the holding company. The Bank is not a member of the Federal Reserve System; however, the Federal Reserve possesses cease-and-desist powers over bank holding companies and their subsidiaries where their actions would constitute an unsafe or unsound practice or violation of law. The Federal Reserve Board also makes policy that guides the declaration and distribution of dividends by bank holding companies.
The BHCA restricts a bank holding company’s ability to acquire control of additional banks. In addition, the BHCA restricts the activities in which bank holding companies may engage directly or through non-bank subsidiaries.
Gramm-Leach-Bliley Financial Modernization Act
The Gramm-Leach-Bliley Act (“GLB”) became effective on March 11, 2000. The primary purpose of GLB was to eliminate barriers between investment banking and commercial banking and to permit, within certain limitations, the affiliation of financial service providers. Generally, GLB:
· | repealed the historical restrictions against, and eliminated many federal and state law barriers to affiliations among banks, securities firms, insurance companies and other financial service providers; |
· | provided a uniform framework for the activities of banks, savings institutions and their holding companies; |
· | broadened the activities that may be conducted by and through national banks and other banking subsidiaries of bank holding companies; |
· | provided an enhanced framework for protecting the privacy of consumers’ information; |
· | adopted a number of provisions related to the capitalization, membership, corporate governance and other measures designed to modernize the Federal Home Loan Bank System; |
· | modified the laws governing the implementation of the Community Reinvestment Act; and |
· | addressed a variety of other legal and regulatory issues affecting both day-to-day operations and long-term activities of financial institutions. |
5
provided a uniform framework for the activities of banks, savings institutions and their holding companies;
broadened the activities that may be conducted by and through national banks and other banking subsidiaries of bank holding companies;
provided an enhanced framework for protecting the privacy of consumers’ information;
adopted a number of provisions related to the capitalization, membership, corporate governance and other measures designed to modernize the Federal Home Loan Bank System;
modified the laws governing the implementation of the Community Reinvestment Act; and
addressed a variety of other legal and regulatory issues affecting both day-to-day operations and long-term activities of financial institutions.
MID PENN BANCORP, INC.
More specifically, under GLB, bank holding companies, such as Mid Penn, that meet certain management, capital, and Community Reinvestment Act standards, are permitted to become financial holding companies and, by doing so, to affiliate with securities firms and insurance companies and to engage in other activities that are financial in nature, incidental to such financial activities, or complementary to such activities. A bank holding company may become a financial holding company if each of its subsidiary banks is well capitalized under the FDIC Improvement Act’s prompt corrective action provisions, is well managed and has at least a satisfactory rating under the Community Reinvestment Act. The required filing is a declaration that the bank holding company wishes to become a financial holding company and meets all applicable requirements. Mid Penn has not elected to become a financial holding company at this time.
No prior regulatory approval will be required for a financial holding company to acquire a company, other than a bank or savings association, engaged in activities permitted under GLB. Activities cited by GLB as being financial in nature include:
· | securities underwriting, dealing and market making; |
· | sponsoring mutual funds and investment companies; |
· | insurance underwriting and agency; |
· | merchant banking activities; and |
· | activities that the Federal Reserve has determined to be closely related to banking. |
sponsoring mutual funds and investment companies;
insurance underwriting and agency;
merchant banking activities; and
activities that the Federal Reserve has determined to be closely related to banking.
In addition to permitting financial services providers to enter into new lines of business, the law allows firms the freedom to streamline existing operations and to potentially reduce costs. The Act may increase both opportunity as well as competition. Many community banks are less able to devote the capital and management resources needed to facilitate broad expansion of financial services including insurance and brokerage services.
Corporate Governance
On July 30, 2002, the Sarbanes-Oxley Act of 2002 was enacted. The Sarbanes-Oxley Act represents a comprehensive revision of laws affecting corporate governance, auditor independence and accounting standards, executive compensation, insider loans, whistleblower protection, and enhanced and timely disclosure of corporate information. The Sarbanes-Oxley Act is applicable to all companies with equity securities registered or that file reports under the Securities Exchange Act of 1934. In particular, the Sarbanes-Oxley Act established:
· | new requirements for audit committees, including independence, expertise and responsibilities; |
· | additional responsibilities regarding financial statements for the Chief Executive Officer and Chief Financial Officer of the reporting company; |
· | new standards for auditors and regulation of audits; |
· | increased disclosure and reporting obligations for the reporting company and its directors and executive officers; and |
· | new and increased civil and criminal penalties for violations of the securities laws. |
additional responsibilities regarding financial statements for the Chief Executive Officer and Chief Financial Officer of the reporting company;
new standards for auditors and regulation of audits;
increased disclosure and reporting obligations for the reporting company and its directors and executive officers; and
new and increased civil and criminal penalties for violations of the securities laws.
The SEC and NASDAQ have adopted numerous rules implementing the provisions of the Sarbanes-Oxley Act that affect Mid Penn. The changes are intended to allow shareholders to monitor more effectively the performance of companies and management.
Bank Regulation
The Bank, a Pennsylvania-chartered institution, is subject to supervision, regulation and examination by the Pennsylvania Department of Banking and Securities and the FDIC. The deposits of the Bank are insured by the FDIC to the extent provided by law. The FDIC assesses deposit insurance premiums the amount of which may, in the future, depend in part on the condition of the Bank. Moreover, the FDIC may terminate deposit insurance of the Bank under certain circumstances. The Bank regulatory agencies have broad enforcement powers over depository institutions under their jurisdiction, including the power to terminate deposit insurance, to impose fines and other civil and criminal penalties, and to appoint a conservator or receiver if any of a number of conditions is met. In addition, the Bank is subject to a variety of local, state and federal laws that affect its operations.
Banking regulations include, but are not limited to, permissible types and amounts of loans, investments and other activities, capital adequacy, branching, interest rates on loans and the safety and soundness of banking practices.
Capital Requirements
Under risk-based capital requirements for bank holding companies, Mid Penn is required to maintain a minimum ratio of total capital to risk-weighted assets (including certain off-balance-sheet activities, such as standby letters of credit) of eight percent. At least half of the total capital is to be composed of common equity, retained earnings and qualifying perpetual preferred stock, less goodwill (“Tier 1 Capital” and together with Tier 2 Capital, Total Capital”). The remainder may consist of subordinated debt, non-qualifying preferred stock and a limited amount of the loan loss allowance (“Tier 2 Capital”).
6
MID PENN BANCORP, INC.
In addition, the Federal Reserve Board has established minimum leverage ratio requirements for bank holding companies. These requirements provide for a minimum leverage ratio of Tier 1 Capital to adjusted average quarterly assets (“leverage ratio”) equal to 3% for bank holding companies that meet certain specified criteria, including having the highest regulatory rating. All other bank holding companies will generally
MID PENN BANCORP, INC.
be required to maintain a leverage ratio of at least 4-5%. The requirements also provide that bank holding companies experiencing internal growth or making acquisitions will be expected to maintain strong capital positions substantially above the minimum supervisory levels without significant reliance on intangible assets. Furthermore, the requirements indicate that the Federal Reserve Board will continue to consider a “Tangible Tier 1 Leverage Ratio” (deducting all intangibles) in evaluating proposals for expansion or new activity. The Federal Reserve Board has not advised Mid Penn of any specific minimum Tier 1 leverage ratio.
The Bank is subject to similar capital requirements adopted by the FDIC. The FDIC has not advised the Bank of any specific minimum leverage ratios.
The capital ratios of Mid Penn and the Bank are described in Note 17 to Mid Penn’s Consolidated Financial Statements, which are incorporated herein by reference.
Banking regulators continue to indicate their desire to further develop capital requirements applicable to banking organizations. Changes to capital requirements could materially affect the profitability of Mid Penn or the fair value of Mid Penn stock.
Regulatory Capital Changes
In July 2013, the federal banking agencies issued final rules to implement the Basel III regulatory capital reforms and changes required by the Dodd-Frank Act. The phase-in period for community banking organizations begins January 1, 2015, while larger institutions (generally those with assets of $250 billion or more) must begin compliance on January 1, 2014. The final rules call for the following capital requirements:
· | A minimum ratio of common tier 1 capital to risk-weighted assets of 4.5%. |
· | A minimum ratio of tier 1 capital to risk-weighted assets of 6%. |
· | A minimum ratio of total capital to risk-weighted assets of 8% (no change from the current rule). |
· | A minimum leverage ratio of 4%. |
In addition, the final rules establishes a common equity tier 1 capital conservation buffer of 2.5% of risk-weighted assets applicable to all banking organizations. If a banking organization fails to hold capital above the minimum capital ratios and the capital conservation buffer, it will be subject to certain restrictions on capital distributions and discretionary bonus payments. The phase-in period for the capital conservation and countercyclical capital buffers for all banking organizations will begin on January 1, 2016.
Under the proposed rules, accumulated other comprehensive income (AOCI) would have been included in a banking organization’s common equity tier 1 capital. The final rules allow community banks to make a one-time election not to include these additional components of AOCI in regulatory capital and instead use the existing treatment under the general risk-based capital rules that excludes most AOCI components from regulatory capital. The opt-out election must be made in the first call report or FR Y-9 series report that is filed after the financial institution becomes subject to the final rule.
The final rules permanently grandfather non-qualifying capital instruments (such as trust preferred securities and cumulative perpetual preferred stock) issued before May 19, 2010 for inclusion in the tier 1 capital of banking organizations with total consolidated assets less than $15 billion as of December 31, 2009 and banking organizations that were mutual holding companies as of May 19, 2010.
The proposed rules would have modified the risk-weight framework applicable to residential mortgage exposures to require banking organizations to divide residential mortgage exposures into two categories in order to determine the applicable risk weight. In response to commenter concerns about the burden of calculating the risk weights and the potential negative effect on credit availability, the final rules do not adopt the proposed risk weights but retain the current risk weights for mortgage exposures under the general risk-based capital rules.
Consistent with the Dodd-Frank Act, the new rules replace the ratings-based approach to securitization exposures, which is based on external credit ratings, with the simplified supervisory formula approach in order to determine the appropriate risk weights for these exposures. Alternatively, banking organizations may use the existing gross-ups approach to assign securitization exposures to a risk weight category or choose to assign such exposures a 1,250% risk weight.
Under the new rules, mortgage servicing assts (MSAs) and certain deferred tax assets (DTAs) are subject to stricter limitations than those applicable under the current general risk-based capital rule. The new rules also increase the risk weights for past-due loans, certain risk weights and credit conversion factors.
Mid Penn is in the process of assessing the impact of these changes on the regulatory ratios of Mid Penn and Mid Penn Bank on the capital, operations, liquidity and earnings of Mid Penn and Mid Penn Bank.
7
MID PENN BANCORP, INC.
FDIC Improvement Act
As a result of the FDIC Improvement Act of 1991, banks are subject to increased reporting requirements and more frequent examinations by the bank regulatory agencies. The agencies also have the authority to dictate certain key decisions that formerly were left to management, including compensation standards, loan underwriting standards, asset growth, and payment of dividends. Failure to comply with these standards, or failure to maintain capital above specified levels set by the regulators, could lead to the imposition of penalties or the forced resignation of management. If a bank becomes critically undercapitalized, the banking agencies have the authority to place an institution into receivership.
Safety and Soundness Standards
Pursuant to FDICIA, the federal banking regulatory agencies have adopted a set of guidelines prescribing safety and soundness standards for depository institutions such as the Bank. The guidelines establish general standards relating to internal controls and information systems, internal audit systems, loan documentation, credit underwriting, interest rate exposure, asset growth, asset quality, earnings and compensation, fees and benefits. In general, the guidelines require, among other things, appropriate systems and practices to identify and manage the risks and exposures specified in the guidelines. The guidelines prohibit excessive compensation as an unsafe and unsound practice and describe compensation as excessive when the amounts paid are unreasonable or disproportionate to the services performed by an executive officer, employee, director or principal shareholder. In addition, the agencies adopted regulations that authorize an agency to order an institution that has been given notice by an agency that it is not satisfying any of such safety and soundness standards to submit a compliance plan. If the institution fails to submit an acceptable compliance plan or fails to implement an accepted plan, the agency must issue an order directing action to correct the deficiency and may issue an order directing other actions be taken, including restricting asset growth, restricting interest rates paid on deposits, and requiring an increase in the institution’s ratio of tangible equity to assets.
Payment of Dividends and Other Restrictions
Mid Penn is a legal entity separate and distinct from its subsidiary, the Bank. There are various legal and regulatory limitations on the extent to which the Bank can, among other things, finance, or otherwise supply funds to, Mid Penn. Specifically, dividends from the Bank are the principal source of Mid Penn’s cash funds and there are certain legal restrictions under Pennsylvania law and Pennsylvania banking regulations on the payment of dividends by state-chartered banks. The relevant regulatory agencies also have authority to prohibit Mid Penn and the Bank from engaging in what, in the opinion of such regulatory body, constitutes an unsafe or unsound banking practice. The payment of dividends could, depending upon the financial condition of Mid Penn and the Bank, be deemed to constitute such an unsafe or unsound practice. Further, under the terms of the Capital Purchase Program (“CPP”), Mid Penn is restricted from increasing its dividends on its common stock above the last per share quarterly dividend declared prior to October 14, 2008 ($0.20 per share) without permission as long as the CPP preferred stock is outstanding.
Prompt Corrective Action
In addition to the required minimum capital levels described above, federal law establishes a system of “prompt corrective actions” which Federal banking agencies are required to take, and certain actions which they have discretion to take, based upon the capital category into which a federally regulated depository institution falls. Regulations set forth detailed procedures and criteria for implementing prompt corrective action in the case of any institution, which is not adequately capitalized. Under the rules, an institution will be deemed to be “adequately capitalized” if it exceeds the minimum Federal regulatory capital requirements. However, it will be deemed “undercapitalized” if it fails to meet the minimum capital requirements, “significantly undercapitalized” if it has a total risk-based capital ratio that is less than 6.0%, a Tier 1 risk-based capital ratio that is less than 3.0%, or a leverage ratio that is less than 3.0%, and “critically undercapitalized” if the institution has a ratio of tangible equity to total assets that is equal to or less than 2.0%.
The prompt corrective action rules require an undercapitalized institution to file a written capital restoration plan, along with a performance guaranty by its holding company or a third party. In addition, an undercapitalized institution becomes subject to certain automatic restrictions
MID PENN BANCORP, INC.
including a prohibition on payment of dividends, a limitation on asset growth and expansion, in certain cases, a limitation on the payment of bonuses or raises to senior executive officers, and a prohibition on the payment of certain “management fees” to any “controlling person”. Institutions that are classified as undercapitalized are also subject to certain additional supervisory actions, including increased reporting burdens and regulatory monitoring, a limitation on the institution’s ability to make acquisitions, open new branch offices, or engage in new lines of business, obligations to raise additional capital, restrictions on transactions with affiliates, and restrictions on interest rates paid by the institution on deposits. In certain cases, bank regulatory agencies may require replacement of senior executive officers or directors, or sale of the institution to a willing purchaser. If an institution is deemed “critically undercapitalized” and continues in that category for four quarters, the statute requires, with certain narrowly limited exceptions, that the institution be placed in receivership.
Deposit Insurance
The FDIC insures deposits of the Bank through the Deposit Insurance Fund (“DIF”). The FDIC maintains the DIF by assessing depository institutions an insurance premium. The amount each institution is assessed is based upon a variety of factors that include the balance of insured deposits as well as the degree of risk the institution poses to the insurance fund. The FDIC recently increased the amount ofinsures deposits it insures from $100,000up to $250,000. The Bank pays an insurance premium into the DIF based on the quarterly average daily deposit liabilities net of certain exclusions. The FDIC uses a risk-based premium system that assesses higher rates on those institutions that pose greater risks to the DIF. The FDIC places each institution in one of four risk categories using a two-step process based first on capital ratios (the capital group assignment) and then on other relevant information (the supervisory group assignment). Subsequently, the rate for each institution within a risk category may be adjusted depending upon different
8
MID PENN BANCORP, INC.
factors that either enhance or reduce the risk the institution poses to the DIF, including the unsecured debt, secured liabilities and brokered deposits related to each institution. Finally, certain risk multipliers may be applied to the adjusted assessment. In 2009, the FDIC increased the amount assessed from financial institutions by increasing its risk-based deposit insurance assessment scale. The quarterly annualized assessment scale for 2009 ranged from twelve basis points of assessable deposits for the strongest institutions to 77.5 basis points for the weakest. In 2009, the FDIC also adopted a uniform special assessment rate for all institutions not to exceed 10 basis points on the individual bank’s assessment base. The total amount paid by the Bank for FDIC insurance for the year ended December 31, 2009 under these provisions was $1,163,000.
On November 12, 2009, the FDIC approved a rule to require insured institutions to prepay their estimated quarterly risk-based assessments for the fourth quarter of 2009, and for all of 2010, 2011, and 2012. An insured institution’s risk-based deposit insurance assessments will continue to be calculated on a quarterly basis, but will be paid from the amount the institution prepaid until the later of the date that amount is exhausted or June 30, 2013, at which point any remaining funds would be returned to the insured institution. Consequently, Mid Penn’s prepayment of DIF premiums made in December 2009 resulted in a prepaid asset of $2,719,000 at December 31, 2009. At December 31, 2010, 2011, and 2011,2012 the prepaid asset was $1,878,000, $871,000, and $871,000,$12,000, respectively. At December 31, 2013, the prepaid asset was $0.
Beginning with the second quarter of 2011, as mandated by the recently enacted Dodd-Frank Wall Street Reform and Consumer Protection Act (the “Dodd-Frank Act”), the assessment base that the FDIC will use to calculate assessment premiums will be a bank’s average assets minus average tangible equity. As the asset base of the banking industry is larger than the deposit base, the range of assessment rates will change to a low of 2.5 basis points through a high of 45 basis points, per $100 of assets; however, the dollar amount of total actual premiums is expected to be roughly the same.
The FDIC is required under the Dodd-Frank Act to establish assessment rates that will allow the Deposit Insurance Fund to achieve a reserve ratio of 1.35% of Insurance Fund insured deposits by September 2020. In addition, the FDIC has established a “designated reserve ratio” of 2.0%, a target ratio that, until it is achieved, will not likely result in the FDIC reducing assessment rates. In attempting to achieve the mandated 1.35% ratio, the FDIC is required to implement assessment formulas that charge banks over $10 billion in asset size more than banks under that size. Those new formulas began in the second quarter of 2011, but did not affect the Bank. Under the Dodd-Frank Act, the FDIC is authorized to make reimbursements from the insurance fund to banks if the reserve ratio exceeds 1.50%, but the FDIC has adopted the “designated reserve ratio” of 2.0% and has announced that any reimbursements from the fund are indefinitely suspended.
Environmental Laws
Management does not anticipate that compliance with environmental laws and regulations will have any material effect on Mid Penn’s capital, expenditures, earnings, or competitive position. However, environmentally related hazards have become a source of high risk and potentially unlimited liability for financial institutions.
In 1995, the Pennsylvania General Assembly enacted the Economic Development Agency, Fiduciary and Lender Environmental Liability Protection Act, which among other things, provides protection to lenders from environmental liability and remediation costs under the environmental laws for releases and contamination caused by others. A lender who engages in activities involved in the routine practices of commercial lending, including, but not limited to, the providing of financial services, holding of security interests, workout practices, foreclosure or the recovery of funds from the sale of property shall not be liable under the environmental acts or common law equivalents to the Pennsylvania Department of Environmental Resources or to any other person by virtue of the fact that the lender engages in such commercial lending practice. A lender, however, will be liable if it, its employees or agents, directly cause an immediate release or directly exacerbate a release of regulated substance on or from the property, or known and willfully compelled the borrower to commit an action which caused such release or violate an environmental act. The Economic Development Agency, Fiduciary and Lender Environmental Liability Protection Act does not limit federal liability which still exists under certain circumstances.
MID PENN BANCORP, INC.
Consumer Protection Laws
A number of laws govern the relationship between the Bank and its customers. For example, the Community Reinvestment Act is designed to encourage lending by banks to persons in low and moderate income areas. The Home Mortgage Disclosure Act and the Equal Credit Opportunity Act attempt to minimize lending decisions based on impermissible criteria, such as race or gender. The Truth-in-Lending Act and the Truth-in-Savings Act require banks to provide certain disclosure of relevant terms related to loans and savings accounts, respectively. Anti-tying restrictions (which prohibit conditioning the availability or terms of credit on the purchase of another banking product) further restrict the Bank’s relationships with its customers.
9
MID PENN BANCORP, INC.
Privacy Laws
In 2000, the federal banking regulators issued final regulations implementing certain provisions of GLB governing the privacy of consumer financial information. The regulations limit the disclosure by financial institutions, such as Mid Penn and the Bank, of nonpublic personal information about individuals who obtain financial products or services for personal, family, or household purposes. Subject to certain exceptions allowed by law, the regulations cover information sharing between financial institutions and nonaffiliated third parties. More specifically, the regulations require financial institutions to:
· | provide initial notices to customers about their privacy policies, describing the conditions under which they may disclose nonpublic personal financial information to nonaffiliated third parties and affiliates; |
· | provide annual notices of their privacy policies to their current customers; and |
· | provide a reasonable method for consumers to “opt out” of disclosures to nonaffiliated third parties. |
provide annual notices of their privacy policies to their current customers; and
provide a reasonable method for consumers to “opt out” of disclosures to nonaffiliated third parties.
Protection of Customer Information
In 2001, the federal banking regulators issued final regulations implementing the provisions of GLB relating to the protection of customer information. The regulations, applicable to Mid Penn and the Bank, relate to administrative, technical, and physical safeguards for customer records and information. These safeguards are intended to:
· | insure the security and confidentiality of customer records and information; |
· | protect against any anticipated threats or hazards to the security or integrity of such records; and |
· | protect against unauthorized access to or use of such records or information that could result in substantial harm or inconvenience to any customer. |
protect against any anticipated threats or hazards to the security or integrity of such records; and
protect against unauthorized access to or use of such records or information that could result in substantial harm or inconvenience to any customer.
Affiliate Transactions
Transactions between Mid Penn and the Bank and its affiliates are governed by Sections 23A and 23B of the Federal Reserve Act. An “affiliate” of a bank or savings institution is any company or entity that controls, is controlled by, or is under common control with the bank or savings institution. Generally, a subsidiary of a depository institution that is not also a depository institution is not treated as an affiliate of the bank for purposes of Sections 23A and 23B. Sections 23A and 23B are intended to protect insured depository institutions from suffering losses arising from transactions with non-insured affiliates, by limiting the extent to which a bank or its subsidiaries may engage in covered transactions with any one affiliate and with all affiliates of the bank in the aggregate, and requiring that such transactions be on terms that are consistent with safe and sound banking practices.
Effective April 1, 2003, Regulation W of the Federal Reserve comprehensively amended Sections 23A and 23B. The regulation unifies and updates staff interpretations issued over the years, incorporates several new interpretative proposals (such as to clarify when transactions with an unrelated third party will be attributed to an affiliate), and addresses new issues arising as a result of the expanded scope of non-banking activities engaged in by bank and bank holding companies in recent years and authorized for financial holding companies under the GLB.
The USA Patriot Act
In 2001, the Uniting and Strengthening America by Providing Appropriate Tools Required to Intercept and Obstruct Terrorism Act of 2001 (USA Patriot Act) was signed into law. The USA Patriot Act broadened the application of anti-money laundering regulations to apply to additional types of financial institutions, such as broker-dealers, and strengthened the ability of the U.S. government to detect and prosecute international money laundering and the financing of terrorism. The principal provisions of Title III of the USA Patriot Act require that regulated financial institutions, including state-chartered banks:
· | establish an anti-money laundering program that includes training and audit components; |
· | comply with regulations regarding the verification of the identity of any person seeking to open an account; |
· | take additional required precautions with non-U.S. owned accounts; and |
· | perform certain verification and certification of money laundering risk for their foreign correspondent banking relationships. |
MID PENN BANCORP, INC.
The USA Patriot Act also expanded the conditions under which funds in a U.S. interbank account may be subject to forfeiture and increased the penalties for violation of anti-money laundering regulations. Failure of a financial institution to comply with the USA Patriot Act’s requirements could have serious legal and reputational consequences for the institution. The Bank has adopted policies, procedures and controls to address compliance with the requirements of the USA Patriot Act under the existing regulations and will continue to revise and update its policies, procedures and controls to reflect changes required by the USA Patriot Act and implementing regulations.
10
MID PENN BANCORP, INC.
Anti-Money Laundering and Anti-Terrorism Financing
Under Title III of the USA PATRIOT Act, also known as the International Money Laundering Abatement and Anti-Terrorism Financing Act of 2001, all financial institutions, including Mid Penn and the Bank, are required in general to identify their customers, adopt formal and comprehensive anti-money laundering programs, scrutinize or prohibit altogether certain transactions of special concern, and be prepared to respond to inquiries from U.S. law enforcement agencies concerning their customers and their transactions. Additional information-sharing among financial institutions, regulators, and law enforcement authorities is encouraged by the presence of an exemption from the privacy provisions of the GLB Act for financial institutions that comply with this provision and the authorization of the Secretary of the Treasury to adopt rules to further encourage cooperation and information-sharing. The effectiveness of a financial institution in combating money-laundering activities is a factor to be considered in any application submitted by the financial institution under the Bank Merger Act, which applies to the Bank.
Emergency Economic StabilizationJOBS Act
In 2012, the Jumpstart Our Business Startups Act of 2008(the “JOBS Act”) became law. The JOBS Act is aimed at facilitating capital raising by smaller companies and Related Programsbanks and bank holding companies by implementing the following changes:
Mid Penn
· | raising the threshold requiring registration under the Securities Exchange Act of 1934 (the "Exchange Act") for banks and bank holdings companies from 500 to 2,000 holders of record; |
· | raising the threshold for triggering deregistration under the Exchange Act for banks and bank holding companies from 300 to 1,200 holders of record; |
· | raising the limit for Regulation A offerings from $5 million to $50 million per year and exempting some Regulation A offerings from state blue sky laws; |
· | permitting advertising and general solicitation in Rule 506 and Rule 144A offerings; |
· | allowing private companies to use "crowdfunding" to raise up to $1 million in any 12-month period, subject to certain conditions; and |
· | creating a new category of issuer, called an "Emerging Growth Company," for companies with less than $1 billion in annual gross revenue, which will benefit from certain changes that reduce the cost and burden of carrying out an equity IPO and complying with public company reporting obligations for up to five years. |
While the JOBS Act is subjectnot expected to have any immediate application to the Corporation, management will continue to monitor the implementation rules and regulations promulgated underfor potential effects which might benefit the Emergency Economic Stabilization Act of 2008 (“EESA”) and related legislation as a result of its sale of preferred stock to the U.S. Treasury under the U.S. Treasury’s Capital Purchase Program (“CPP”). Additional information relating to the CPP, including restrictions on dividends and redemptions of common stock, is included in the information set forth in Item 7 of this report under the caption, “Capital Purchase Program Participation.” Furthermore, under rules and regulations of EESA to which the Mid Penn is subject, no dividends may be declared or paid on Mid Penn’s common stock and Mid Penn may not repurchase or redeem any common stock unless dividends then due and payable with respect to Treasury’s preferred stock have been paid in full. Moreover, the consent of Treasury would be required for any increase in the per share dividend amount on the common stock beyond the per share dividend declared immediately prior to October 14, 2008 ($0.20 per share per quarter) until the third anniversary of the date of Treasury’s investment, unless prior to the third anniversary, Treasury’s preferred stock is redeemed in whole or Treasury has transferred all of its preferred shares to third parties. Because of Mid Penn’s participation in the CPP, Mid Penn is subject to certain restrictions on its executive compensation practices, which are discussed in Item 7 of this report under the caption, “Capital Purchase Program Participation.”Corporation.
Dodd-Frank Act
The Dodd-Frank Act, which became law in July 2010, significantly changes regulation of financial institutions and the financial services industry, including: creating a Financial Services Oversight Council to identify emerging systemic risks and improve interagency cooperation; centralizing responsibility for consumer financial protection by creating a new agency, the Consumer Financial Protection Bureau, which will be responsible for implementing, examining and enforcing compliance with federal consumer financial laws; permanently raising the current standard maximum deposit insurance amount to $250,000; establishing strengthened capital standards for banks, and disallowing certain trust preferred securities from qualifying as Tier 1 capital (subject to certain grandfather provisions for existing trust preferred securities); establishing new minimum mortgage underwriting standards; granting the Federal Reserve Board the power to regulate debit card interchange fees; and implementing corporate governance changes. Many aspects of the Dodd-Frank Act are subject to rulemaking that will take effect over several years, thus making it difficult to assess the impact of the statute on the financial industry, including Mid Penn, at this time.
It is difficult to predict at this time the specific impact the Dodd-Frank Act and the yet to be written implementing rules and regulations will have on community banks. Given the uncertainty associated with the manner in which the provisions of the Dodd-Frank Act will be implemented by the various regulatory agencies and through regulations, the full extent of the impact such requirements will have on financial institutions’ operations is presently unclear. The changes resulting from the Dodd-Frank Act may impact the profitability of our business activities, require changes to certain of our business practices, impose upon us more stringent capital, liquidity and leverage ratio requirements or otherwise adversely affect our business. These changes may also require us to invest significant management attention and resources to evaluate and make necessary changes in order to comply with new statutory and regulatory requirements.
Effects of Government Policy and Potential Changes in Regulation
Changes in regulations applicable to Mid Penn or the Bank, or shifts in monetary or other government policies, could have a material affecteffect on our business. Mid Penn’s and the Bank’s business is also affected by the state of the financial services industry in general. As a result of legal and industry changes, management believes that the industry will continue to experience an increased rate of change as the financial services industry strives for greater product offerings, market share and economies of scale.
From time to time, legislation is enacted that has the effect of increasing the cost of doing business, limiting or expanding permissible activities or affecting the competitive balance between banks and other financial institutions. Proposals to change the laws and regulations governing the
11
MID PENN BANCORP, INC.
operations and taxation of banks, bank holding companies and other financial institutions are frequently made in Congress, and before various
MID PENN BANCORP, INC.
bank regulatory agencies. Mid Penn cannot predict the likelihood of any major changes or the impact such changes might have on Mid Penn and/or the Bank. Various congressional bills and other proposals have proposed a sweeping overhaul of the banking system, including provisions for: limitations on deposit insurance coverage; changing the timing and method financial institutions use to pay for deposit insurance; expanding the power of banks by removing the restrictions on bank underwriting activities; and tightening the regulation of bank derivatives activities; and allowing commercial enterprises to own banks.
Mid Penn’s earnings are, and will be affected by domestic economic conditions and the monetary and fiscal policies of the United States government and its agencies. The monetary policies of the Federal Reserve have had, and will likely continue to have, an impact on the operating results of commercial banks because of the Federal Reserve’s power to implement national monetary policy to, among other things, curb inflation or combat recession. The Federal Reserve has a major impact on the levels of bank loans, investments and deposits through its open market operations in United States government securities and through its regulation of, among other things, the discount rate on borrowings of member banks and the reserve requirements against member bank deposits. It is not possible to predict the nature and impact of future changes in monetary and fiscal policies.
From time to time, various types of federal and state legislation have been proposed that could result in additional regulation of, and restrictions on, the business of Mid Penn and the Bank. As a consequence of the extensive regulation of commercial banking activities in the United States, the Bank’s business is particularly susceptible to being affected by federal legislation and regulations that may increase the costs of doing business. Congress is currently debating major legislation that may fundamentally change the regulatory oversight of banking institutions in the United States. Whether any legislation will be enacted or additional regulations will be adopted, and how they might impact Mid Penn cannot be determined at this time.
Available Information
Mid Penn’s common stock is registered under Section 12(b) of the Securities Exchange Act of 1934 and is traded on the NASDAQ Stock Market under the trading symbol MPB. Mid Penn is subject to the informational requirements of the Exchange Act, and, accordingly, files reports, proxy statements and other information with the Securities and Exchange Commission. The reports, proxy statements and other information filed with the SEC are available for inspection and copying at the SEC’s Public Reference Room at 100 F Street, NE, Room 1580, Washington, D.C. 20549. You may obtain information on the operation of the Public Reference Room by calling the SEC at 1-800-SEC-0330. Mid Penn is an electronic filer with the SEC. The SEC maintains an Internet site that contains reports, proxy and information statements, and other information regarding issuers that file electronically with the SEC. The SEC’s Internet site address iswww.sec.gov. www.sec.gov.
Mid Penn’s headquarters are located at 349 Union Street, Millersburg, Pennsylvania 17061, and its telephone number is (717) 692-2133.1-866-642-7736. Mid Penn’s Internet address iswww.midpennbank.com. midpennbank.com. Mid Penn makes available through its website, free of charge, its annual report on Form 10-K, quarterly reports on Form 10-Q, current reports on Form 8-K, and amendments to those reports as soon as reasonably practicable after filing with the Securities and Exchange Commission. Mid Penn has adopted a Code of Ethics that applies to all employees. This document is also available on Mid Penn’s website. The information included on our website is not a part of this document.
ITEM 1A.RISK FACTORS
Future dividend payments and common stock repurchases are restricted by the terms of the U.S. Treasury’s equity investment in Mid Penn
Under the terms of the CPP, for so long as any preferred stock issued under the CPP remains outstanding, Mid Penn is prohibited from increasing dividends to holders of its common stock above the last per share quarterly amount in effect immediately prior to October 14, 2008 ($0.20 per share), and from making certain repurchases of equity securities, including our common stock, without the U.S. Treasury’s consent until the third anniversary of the U.S. Treasury’s investment or until the U.S. Treasury has transferred all of the preferred stock it purchased under the CPP to third parties. As long as the preferred stock issued to the U.S. Treasury is outstanding, dividend payments and repurchases or redemptions relating to certain equity securities, including Mid Penn’s common stock, are prohibited until all accrued and unpaid dividends are paid on such preferred stock, subject to certain limited exceptions.
Mid Penn is subject to interest rate risk
Mid Penn’s earnings and cash flows are largely dependent upon its net interest income. Net interest income is the difference between interest income earned on interest-earning assets such as loans and securities and interest expense paid on interest-bearing liabilities such as deposits and borrowed funds. Interest rates are highly sensitive to many factors that are beyond Mid Penn’s control, including general economic conditions and policies of various governmental and regulatory agencies and, in particular, the Board of Governors of the Federal Reserve System. Changes in monetary policy, including changes in interest rates, could influence not only the interest Mid Penn receives on loans and securities and the amount of interest it pays on deposits and borrowings, but such changes could also affect (i) Mid Penn’s ability to originate loans and obtain deposits, (ii) the fair value of Mid Penn’s financial assets and liabilities, and (iii) the average duration of Mid Penn’s mortgage-backed securities portfolio. If the interest rates paid on deposits and other borrowings increase at a faster rate than the interest rates received on loans and other investments, Mid Penn’s net interest income, and therefore earnings, could be adversely affected. Earnings could also be adversely affected if the interest rates received on loans and other investments fall more quickly than the interest rates paid on deposits and other borrowings.
MID PENN BANCORP, INC.
Management believes it has implemented effective asset and liability management strategies to reduce the potential effects of changes in interest rates on Mid Penn’s results of operations. Any substantial, unexpected, prolonged change in market interest rates could have a material adverse effect on Mid Penn’s financial condition and results of operations.
12
MID PENN BANCORP, INC.
Mid Penn is subject to lending risk
As of December 31, 2011,2013, approximately 68.0%70.0% of Mid Penn’s loan portfolio consisted of commercial and industrial, construction and commercial real estate loans. These types of loans are generally viewed as having more risk of default than residential real estate loans or consumer loans. These types of loans are also typically larger than residential real estate loans and consumer loans. Because Mid Penn’s loan portfolio contains a significant number of commercial and industrial, construction and commercial real estate loans with relatively large balances, the deterioration of one or a few of these loans could cause a significant increase in non-performing loans. An increase in non-performing loans could result in a net loss of earnings from these loans, an increase in the provision for possible loan and lease losses and an increase in loan charge-offs, all of which could have a material adverse effect on Mid Penn’s financial condition and results of operations.
Mid Penn’s allowance for possible loan and lease losses may be insufficient
Mid Penn maintains an allowance for possible loan and lease losses, which is a reserve established through provisions for possible losses charged to expense, that represents management’s best estimate of probable losses that have been incurred within the existing portfolio of loans. The allowance, in the judgment of management, is necessary to reserve for estimated loan and lease losses and risks inherent in the loan portfolio. The level of the allowance reflects management’s continuing evaluation of industry concentrations; specific credit risks; loan loss experience; current loan portfolio quality; present economic, political and regulatory conditions and unidentified losses inherent in the current loan portfolio. The determination of the appropriate level of the allowance for possible loan and lease losses inherently involves a high degree of subjectivity and requires Mid Penn to make significant estimates of current credit risks and future trends, all of which may undergo material changes. Changes in economic conditions affecting borrowers, new information regarding existing loans, identification of additional problem credits and other factors, both within and outside of Mid Penn’s control, may require an increase in the allowance. In addition, bank regulatory agencies periodically review Mid Penn’s allowance for possible loan and lease losses and may require an increase in the provision for possible loan and lease losses or the recognition of further loan charge-offs, based on judgments different than those of management. In addition, if charge-offs in future periods exceed the allowance, Mid Penn willmay need additional provisions to increase the allowance for possible loan and lease losses. Any increases in the allowance will result in a decrease in net income and, possibly, capital, and may have a material adverse effect on Mid Penn’s financial condition and results of operations.
Competition from other financial institutions may adversely affect Mid Penn’s profitability
Mid Penn’s banking subsidiary faces substantial competition in originating both commercial and consumer loans. This competition comes principally from other banks, credit unions, savings institutions, mortgage banking companies and other lenders. Many of its competitors enjoy advantages, including greater financial resources and higher lending limits, a wider geographic presence, more accessible branch office locations, the ability to offer a wider array of services or more favorable pricing alternatives, as well as lower origination and operating costs. This competition could reduce the Corporation’s net income by decreasing the number and size of loans that its banking subsidiary originates and the interest rates it may charge on these loans.
In attracting business and consumer deposits, its banking subsidiary faces substantial competition from other insured depository institutions such as banks, savings institutions and credit unions, as well as institutions offering uninsured investment alternatives, including money market funds. Many of Mid Penn’s competitors enjoy advantages, including greater financial resources, more aggressive marketing campaigns, better brand recognition, and more convenient branch locations. These competitors may offer higher interest rates than Mid Penn, which could decrease the deposits that Mid Penn attracts or require Mid Penn to increase its rates to retain existing deposits or attract new deposits. Increased deposit competition could adversely affect Mid Penn’s ability to generate the funds necessary for lending operations. As a result, Mid Penn may need to seek other sources of funds that may be more expensive to obtain and could increase its cost of funds.
Mid Penn’s banking subsidiary also competes with non-bank providers of financial services, such as brokerage firms, consumer finance companies, credit unions, insurance agencies and governmental organizations, which may offer more favorable terms. Some of its non-bank competitors are not subject to the same extensive regulations that govern its banking operations. As a result, such non-bank competitors may have advantages over Mid Penn’s banking subsidiary in providing certain products and services. This competition may reduce or limit Mid Penn’s margins on banking services, reduce its market share and adversely affect its earnings and financial condition.
We have 5,000 shares of Series B Preferred Stock outstanding which have preference over the common stock as to dividends and liquidation distributions, among other preferential rights
As of the date hereof, we have issued and outstanding 5,000 shares of 7% Non-Cumulative, Non-Voting, Non-Convertible Perpetual Preferred Stock, Series B, par value $1.00 per share (the “Series B Preferred Stock”). The Series B Preferred Stock affords holders a preference to assets upon liquidation and an annual dividend which rights impact the outstanding shares of common stock.The Preferred Stock's right to annual dividends makes less likely the possibility that we will declare dividends on the common stock. In the event of a liquidation of the Corporation's assets, holders of Series B Preferred Stock will have a right to receive as a liquidation payment any remaining assets of the Corporation prior to any distributions to holders of the common stock and the holders of the Series B Preferred Stock may be able to block actions otherwise approved by the holders of the common stock if such action is adverse to their rights.
13
MID PENN BANCORP, INC.
The Basel III capital requirements may require us to maintain higher levels of capital, which could reduce our profitability
Basel III targets higher levels of base capital, certain capital buffers and a migration toward common equity as the key source of regulatory capital. Although the new capital requirements are phased in over the next decade and may change substantially before final implementation, Basel III signals a growing effort by domestic and international bank regulatory agencies to require financial institutions, including depository institutions, to maintain higher levels of capital. The direction of the Basel III implementation activities or other regulatory viewpoints could require additional capital to support our business risk profile prior to final implementation of the Basel III standards. If Mid Penn is required to maintain higher levels of capital, Mid Penn may have fewer opportunities to invest capital into interest-earning assets, which could limit the profitable business operations available to Mid Penn and adversely impact our financial condition and results of operations.
Future credit downgrades of the United States Government due to issues relating to debt and the deficit may adversely affect the Mid Penn
As a result of failure of the federal government to reach agreement over federal debt and the ongoing issues connected with the debt ceiling, certain rating agencies placed the United States government’s long-term sovereign debt rating on their equivalent of negative watch and announced the possibility of a rating downgrade. The rating agencies, due to constraints related to the rating of the United States, also placed government-sponsored enterprises in which Mid Penn invests and receives lines of credit on negative watch and a downgrade of the United State’s credit rating would trigger a similar downgrade in the credit rating of these government sponsored enterprises. Furthermore, the credit rating of other entities, such as state and local governments, may also be downgraded should the United States credit rating be downgraded. The impact that a credit rating downgrade may have on the national and local economy could have an adverse effect on Mid Penn’s financial condition and results of operations.
If Mid Penn’s information systems are interrupted or sustain a breach in security, those events may negatively affect Mid Penn’s financial performance and reputation
In conducting its business, Mid Penn relies heavily on its information systems. Maintaining and protecting those systems is difficult and expensive, as is dealing with any failure, interruption, or breach in security of these systems, whether due to acts or omissions by Mid Penn or by a third party, and whether intentional or not. Any such failure, interruption, or breach could result in failures or disruptions in Mid Penn’s customer relationship management, general ledger, deposit, loan and other systems. A breach of Mid Penn’s information security may result from fraudulent activity committed against Mid Penn or its clients, resulting in financial loss to Mid Penn or its clients, or privacy breaches against Mid Penn’s clients. Such fraudulent activity may consist of check fraud, electronic fraud, wire fraud, “phishing”, social engineering or other deceptive acts. The policies, procedures, and technical safeguards put in place by Mid Penn to prevent or limit the effect of any failure, interruption, or security breach of its information systems may be insufficient to prevent or remedy the effects of any such occurrences. The occurrence of any failures, interruptions, or security breaches of Mid Penn’s information systems could damage Mid Penn’s reputation, cause Mid Penn to incur additional expenses, result in online services or other businesses, subject Mid Penn to regulatory sanctions or additional regular scrutiny, or expose Mid Penn to civil litigation and possible financial liability, any of which could have a material adverse effect on Mid Penn’s financial condition and results of operations.
Mid Penn’s controls and procedures may fail or be circumvented
Management periodically reviews and updates Mid Penn’s internal controls, disclosure controls and procedures, and corporate governance policies and procedures. Any system of controls, however well designed and operated, is based in part on certain assumptions and can provide only reasonable, not absolute, assurances that the objectives of the system are met. Any failure or circumvention of Mid Penn’s controls and procedures or failure to comply with regulations related to controls and procedures could have a material adverse effect on Mid Penn’s business, results of operations, and financial condition.
MID PENN BANCORP, INC.
Mid Penn’s ability to pay dividends depends primarily on dividends from its banking subsidiary, which is subject to regulatory limits
Mid Penn is a bank holding company and its operations are conducted by its subsidiaries. Its ability to pay dividends depends on its receipt of dividends from its subsidiaries. Dividend payments from its banking subsidiary are subject to legal and regulatory limitations, generally based on net profits, and retained earnings, imposed by the various banking regulatory agencies. The ability of Mid Penn’s subsidiaries to pay dividends is also subject to their profitability, financial condition, capital expenditures and other cash flow requirements. There is no assurance that Mid Penn’s subsidiaries will be able to pay dividends in the future or that Mid Penn will generate adequate cash flow to pay dividends in the future. Federal Reserve Board policy, which applies to Mid Penn as a registered bank holding company, also provides that dividends by bank holding companies should generally be paid out of current earnings looking back over a one-year period. Mid Penn’s failure to pay dividends on its common stock could have a material adverse effect on the market price of its common stock.
Mid Penn’s profitability depends significantly on economic conditions in the central Pennsylvania
Mid Penn’s success is dependent to a significant degree on economic conditions in central Pennsylvania, especially in Dauphin, lower Northumberland, western Schuylkill and eastern Cumberland Counties, which Mid Penn defines as our primary market. The banking industry is affected by general economic conditions including the effects of inflation, recession, unemployment, real estate values, trends in the national and global economics, and other factors beyond our control. An economic recession or a delayed recovery over a prolonged period of time in the
14
MID PENN BANCORP, INC.
Central Pennsylvania area could cause an increase in the level of the Bank’s non-performing assets and loan and lease losses, thereby causing operating losses, impairing liquidity, and eroding capital. Mid Penn cannot assure you that adverse changes in the local economy would not have a material adverse effect on Mid Penn’s consolidated financial condition, results of operations, and cash flows.
Mid Penn may not be able to attract and retain skilled people
Mid Penn’s success depends, in large part, on its ability to attract and retain key people. Competition for the best people in most activities engaged in by Mid Penn can be intense and Mid Penn may not be able to hire people or to retain them. The unexpected loss of services of one or more of Mid Penn’s key personnel could have a material adverse impact on Mid Penn’s business because of their skills, knowledge of Mid Penn’s market, years of industry experience, and the difficulty of promptly finding qualified replacement personnel.
Mid Penn is subject to claims and litigation pertaining to fiduciary responsibility
From time to time, customers make claims and take legal action pertaining to Mid Penn’s performance of its fiduciary responsibilities. Whether customer claims and legal action related to Mid Penn’s performance of its fiduciary responsibilities are founded or unfounded, if such claims and legal actions are not resolved in a manner favorable to Mid Penn they may result in significant financial liability and/or adversely affect the market perception of Mid Penn and its products and services as well as impact customer demand for those products and services. Any financial liability or reputation damage could have a material adverse effect on Mid Penn’s business, which, in turn, could have a material adverse effect on Mid Penn’s financial condition and results of operations.
The trading volume in Mid Penn’s common stock is less than that of other larger financial services companies
Mid Penn’s common stock is listed for trading on NASDAQ; the trading volume in its common stock, however, is less than that of other larger financial services companies. A public trading market having the desired characteristics of depth, liquidity and orderliness depends on the presence in the marketplace of willing buyers and sellers of Mid Penn’s common stock at any given time. This presence depends on the individual decisions of investors and general economic and market conditions over which Mid Penn has no control. Given the lower trading volume of Mid Penn’s common stock, significant sales of Mid Penn’s common stock, or the expectation of these sales, could cause Mid Penn’s stock price to fall.
Mid Penn operates in a highly regulated environment and may be adversely affected by changes in federal, state and local laws and regulations
Mid Penn is subject to extensive regulation, supervision and examination by federal and state banking authorities. Any change in applicable regulations or federal, state or local legislation could have a substantial impact on Mid Penn and its operations. Additional legislation and regulations that could significantly affect Mid Penn’s powers, authority and operations may be enacted or adopted in the future, which could have a material adverse effect on its financial condition and results of operations. Further, regulators have significant discretion and authority to prevent or remedy unsafe or unsound practices or violations of laws by banks and bank holding companies in the performance of their supervisory and enforcement duties. The exercise of regulatory authority may have a negative impact on Mid Penn’s results of operations and financial condition.
In response to the financial crisis that commenced in 2008, Congress has taken actions that are intended to strengthen confidence and encourage liquidity in financial institutions, and the Federal Deposit Insurance Corporation has taken actions to increase insurance coverage on deposit accounts. The recently enacted Dodd-Frank Act provides for the creation of a consumer protection division at the Board of Governors of the
MID PENN BANCORP, INC.
Federal Reserve System that will have broad authority to issue regulations governing the services and products we provide consumers. This additional regulation could increase our compliance costs and otherwise adversely impact our operations. That legislation also contains provisions that, over time, could result in higher regulatory capital requirements and loan loss provisions for the Bank, and may increase interest expense due to the ability in July 2011 to pay interest on all demand deposits. In addition, there have been proposals made by members of Congress and others that would reduce the amount delinquent borrowers are otherwise contractually obligated to pay under their mortgage loans and limit an institution’s ability to foreclose on mortgage collateral. These proposals could result in credit losses or increased expense in pursuing our remedies as a creditor. Recent regulatory changes impose limits on our ability to charge overdraft fees, which may decrease our non-interest income as compared to more recent prior periods.
The potential exists for additional federal or state laws and regulations, or changes in policy, affecting many aspects of our operations, including capital levels, lending and funding practices, and liquidity standards. New laws and regulations may increase our costs of regulatory compliance and of doing business and otherwise affect our operations, and may significantly affect the markets in which we do business, the markets for and value of our loans and investments, the fees we can charge and our ongoing operations, costs and profitability.
The soundness of other financial institutions may adversely affect Mid Penn
Financial services institutions are interrelated as a result of trading, clearing, counterparty, or other relationships. Mid Penn has exposure to many different industries and counterparties, and routinely executes transactions with counterparties in the financial services industry, including commercial banks, brokers and dealers, investment banks, and other institutional clients. Many of these transactions expose Mid Penn to credit risk in the event of a default by a counterparty or client. In addition, Mid Penn’s credit risk may be exacerbated when the collateral held by Mid Penn cannot be realized upon or is liquidated at prices not sufficient to recover the full amount of the credit or derivative exposure due to Mid Penn. Any such losses could have a material adverse affect on the Mid Penn’s financial condition and results of operations.
Current
Prior levels of market volatility arewere unprecedented and future volatility may have materially adverse effects on our liquidity and financial condition
The
In the recent past, the capital and credit markets have been experiencingexperienced extreme volatility and disruption for more than two years. In some cases, the markets have exerted downward pressure on stock prices, security prices, and credit availability for certain issuers without regard to their underlying financial strength. If the currentsuch levels of market disruption and volatility continue or worsen,return, there can be no assurance that we will not experience adverse effects, which may be material, on our liquidity, financial condition, and profitability.
15
MID PENN BANCORP, INC.
Mid Penn’s banking subsidiary may be required to pay higher FDIC insurance premiums or special assessments which may adversely affect its earnings.earning
Poor economic conditions and the resulting bank failures have increased the costs of the FDIC and depleted its deposit insurance fund. Additional bank failures may prompt the FDIC to increase its premiums above the recently increased levels or to issue special assessments. Mid Penn generally is unable to control the amount of premiums or special assessments that its subsidiary is required to pay for FDIC insurance. Any future changes in the calculation or assessment of FDIC insurance premiums may have a material adverse effect on our results of operations, financial condition, and our ability to continue to pay dividends on our common stock at the current rate or at all.
Pennsylvania Business Corporation Law and various anti-takeover provisions under our articles and bylaws could impede the takeover of Mid Penn.Penn
Various Pennsylvania laws affecting business corporations may have the effect of discouraging offers to acquire Mid Penn, even if the acquisition would be advantageous to shareholders. In addition, we have various anti-takeover measures in place under our articles of incorporation and bylaws, including a supermajority vote requirement for mergers, a staggered board of directors, and the absence of cumulative voting. Any one or more of these measures may impede the takeover of Mid Penn without the approval of our board of directors and may prevent our shareholders from taking part in a transaction in which they could realize a premium over the current market price of our common stock.
Mid Penn may need to or be required to raise additional capital in the future, and capital may not be available when needed and on terms favorable to current shareholders.shareholders
Federal banking regulators require Mid Penn and its subsidiary bank to maintain adequate levels of capital to support their operations. These capital levels are determined and dictated by law, regulation, and banking regulatory agencies. In addition, capital levels are also determined by Mid Penn’s management and board of directors, based on capital levels that they believe are necessary to support Mid Penn’s business operations.
If Mid Penn raises capital through the issuance of additional shares of its common stock or other securities, it would likely dilute the ownership interests of current investors and could dilute the per share book value and earnings per share of its common stock. Furthermore, a capital raise through issuance of additional shares may have an adverse impact on Mid Penn’s stock price. New investors also may have rights, preferences and privileges senior to Mid Penn’s current shareholders, which may adversely impact its current shareholders.
MID PENN BANCORP, INC.
Mid Penn’s ability to raise additional capital will depend on conditions in the capital markets at that time, which are outside of its control, and on its financial performance. Accordingly, Mid Penn cannot be certain of its ability to raise additional capital on acceptable terms and acceptable time frames or to raise additional capital at all. If Mid Penn cannot raise additional capital in sufficient amounts when needed, its ability to comply with regulatory capital requirements could be materially impaired. Additionally, the inability to raise capital in sufficient amounts may adversely affect Mid Penn’s financial condition and results of operations and its ability to repurchase the preferred stock and the warrant to purchase shares of Mid Penn’s common stock issued under the CPP (see Item 7 of this report under the caption, “Capital Purchase Program Participation.”).operations.
Mid Penn’s profitability depends significantly on the economic conditions in the Commonwealth of Pennsylvania and the local region in which it does business.business
Mid Penn’s profitability depends primarily on the general economic conditions of the Commonwealth of Pennsylvania and the specific markets in which Mid Penn operates. Unlike larger national or other regional banks that are more geographically diversified, Mid Penn provides banking and financial services to customers primarily in south central Pennsylvania. The local economic conditions in this area has a significant impact on the demand for Mid Penn’s products and services, as well as the ability of Mid Penn’s customers to repay loans, the value of collateral securing loans, and the stability of Mid Penn’s deposit funding sources. A significant decline in general economic conditions caused by inflation, recession, unemployment, changes in securities markets, or other factors could impact these local economic conditions and, consequently, have a material adverse effect on Mid Penn’s financial condition and results of operation.
If we conclude that the decline in the value of any of our investment securities is other than temporary, we are required to write down the value of that security through a charge to earnings.earnings
We review our investment securities portfolio at each quarter-end reporting period to determine whether the fair value is below the current carrying value. When the fair value off any of our investment securities has declined below its carrying value, we are required to assess whether the decline is other than temporary. If we conclude that the decline is other than temporary, we are required to write down the value of that security through a charge to earnings. Changes in the expected cash flows of these securities and/or prolonged price declines have resulted and may result in our concluding in future periods that there is additional impairment of these securities that is other than temporary, which would require a charge to earnings to write down these securities to their fair value. Due to the complexity of the calculations and assumptions used in determining whether an asset is impaired, the impairment disclosed may not accurately reflect the actual impairment in the future.
16
MID PENN BANCORP, INC.
Mid Penn’s operations of its business, including its interaction with customers, are increasingly done via electronic means, and this has increased its risks related to cyber security
Mid Penn is exposed to the risk of cyber-attacks in the normal course of business. In general, cyber incidents can result from deliberate attacks or unintentional events. Mid Penn has observed an increased level of attention in the industry focused on cyber-attacks that include, but are not limited to, gaining unauthorized access to digital systems for purposes of misappropriating assets or sensitive information, corrupting data, or causing operational disruption. To combat against these attacks, policies and procedures are in place to prevent or limit the effect of the possible security breach of its information systems and it has insurance against some cyber-risks and attacks. While Mid Penn has not incurred any material losses related to cyber-attacks, nor is it aware of any specific or threatened cyber-incidents as of the date of this report, it may incur substantial costs and suffer other negative consequences if it falls victim to successful cyber-attacks. Such negative consequences could include remediation costs that may include liability for stolen assets or information and repairing system damage that may have been caused; deploying additional personnel and protection technologies, training employees, and engaging third party experts and consultants; lost revenues resulting from unauthorized use of proprietary information or the failure to retain or attract customers following an attack; litigation; and reputational damage adversely affecting customer or investor confidence.
Mid Penn is Subject To Environmental Liability Risk Associated with Lending Activities
A significant portion of Mid Penn’s loan portfolio is secured by real property. During the ordinary course of business, Mid Penn may foreclose on and take title to properties securing certain loans. In doing so, there is a risk that hazardous or toxic substances could be found on these properties. If hazardous or toxic substances are found, Mid Penn may be liable for remediation costs, as well as for personal injury and property damage. Environmental laws may require Mid Penn to incur substantial expenses and may materially reduce the affected property’s value or limit Mid Penn’s ability to use or sell the affected property. In addition, future laws or more stringent interpretations or enforcement policies with respect to existing laws, may increase Mid Penn’s exposure to environmental liability. Although Mid Penn has policies and procedures to perform an environmental review before initiating any foreclosure action on real property, these reviews may not be sufficient to detect all potential environmental hazards. The remediation costs and any other financial liabilities associated with an environmental hazard could have a material adverse effect on Mid Penn’s financial condition and results of operations.
Mid Penn’s financial performance may suffer if its information technology is unable to keep pace with its growth or industry developments.developments
Effective and competitive delivery of Mid Penn’s products and services is increasingly dependent upon information technology resources and processes, both those provided internally as well as those provided through third party vendors. In addition to better serving customers, the effective use of technology increases efficiency and enables Mid Penn to reduce costs. Mid Penn’s future success will depend, in part, upon its ability to address the needs of its customers by using technology to provide products and services to enhance customer convenience, as well as to create additional efficiencies in its operations. Many of Mid Penn’s competitors have greater resources to invest in technological improvements. Additionally, as technology in the financial services industry changes and evolves, keeping pace becomes increasingly complex and expensive for Mid Penn. There can be no assurance that Mid Penn will be able to effectively implement new technology-driven products and services, which could reduce its ability to compete effectively.
There can be no assurance that Mid Penn will repurchase the preferred stock and warrant issued under the CPP or that its regulators would approve such repurchase.
To repurchase the preferred stock and the warrant to purchase shares of Mid Penn’s common stock issued under the CPP (see Item 7 of this report under the caption, “Capital Purchase Program Participation.”), Mid Penn must raise sufficient capital and obtain regulatory approval. There can be no assurance when or if the preferred stock or the warrant can be repurchased or what the redemption price for the warrant will be. Until such time as the preferred stock and the warrant are repurchased, Mid Penn will remain subject to the terms and conditions set forth in the purchase agreement with the U.S. Treasury, the preferred stock and the warrant, which, among other things impose restrictions on quarterly cash dividends on its common stock and, with some exceptions, on repurchases of its common stock. Further, Mid Penn’s continued participation in the CPP subjects it to increased regulatory and legislative oversight.
ITEM 1B.UNRESOLVED STAFF COMMENTS
None
17
MID PENN BANCORP, INC.
ITEM 2.PROPERTIES
With the exception of the Market Square Office and Derry Street Loan Operations Center in Harrisburg, PA, the Bank owns its main office, Operations Center, and branch offices and certain parking facilities related to its banking offices, all of which are free and clear of any lien. The Bank’s main office and all branch offices are located in Pennsylvania. All of these properties are in good condition and are deemed by management to be adequate for the Bank’s purposes. The table below sets forth the location of each of the Bank’s properties.
Property Location | Description of Property | Property Location | Description of Property | |||||||
Millersburg | Lykens Office | |||||||||
349 Union Street | Main Office & | 550 Main Street | Branch Office | |||||||
Millersburg, PA 17061 | Branch Office | Lykens, PA 17048 | ||||||||
Elizabethville Office | Allentown Boulevard Office | |||||||||
4642 State Route 209 | Branch Office | 5500 Allentown Boulevard | Branch Office | |||||||
Elizabethville, PA 17023 | Harrisburg, PA 17112 | |||||||||
Dalmatia Office | Market Square Office | |||||||||
132 School House Road | Branch Office | 17 N. Second Street | Branch Office | |||||||
Dalmatia, PA 17017 | Harrisburg, PA 17101 | |||||||||
Carlisle Pike Office | Steelton Office | |||||||||
4622 Carlisle Pike | Branch Office | 51 South Front Street | Branch Office | |||||||
Mechanicsburg, PA 17050 | Steelton, PA 17113 | |||||||||
|
| |||||||||
Derry Street | Middletown Office | |||||||||
4509 Derry Street | Branch Office | 1100 Spring Garden Drive | Branch Office | |||||||
Harrisburg, PA 17111 | Middletown, PA 17057 | |||||||||
Front Street Office | Camp Hill Office | |||||||||
2615 North Front Street | Branch Office | 2101 Market Street | Branch Office | |||||||
Harrisburg, PA 17110 | Camp Hill, PA 17011 | |||||||||
Tower City Office | Operations Center | |||||||||
545 East Grand Avenue | Branch Office | 894 N. River Road | Operations Center | |||||||
Tower City, PA 17980 | Halifax, PA 17032 | |||||||||
Dauphin Office 1001 Peters Mountain Road | Branch Office | Derry Street Loan Administrative Operations | Administrative Office | |||||||
Dauphin, PA 17018 | 4099 Derry Street | |||||||||
Harrisburg, PA 17111 | ||||||||||
ITEM 3.LEGAL PROCEEDINGS
Management is not aware of any litigation that would have a material adverse effect on the consolidated financial position of the Corporation. Mid Penn and the Bank have no proceedings pending other than ordinary routine litigation occurring in the normal course of business. In addition, management does not know of any material proceedings contemplated by governmental authorities against Mid Penn or the Bank or any of its properties.
ITEM 4.MINE SAFETY DISCLOSURES
Not Applicable
18
MID PENN BANCORP, INC.
PART II
ITEM 5.MARKET FOR REGISTRANT’S COMMON EQUITY, RELATED SHAREHOLDER MATTERS AND ISSUER PURCHASES OF EQUITY SECURITIES
The Corporation’s common stock is traded on the NASDAQ Stock Market under the symbol MPB. The following table shows the range of high and low sale prices for the Corporation’s stock and cash dividends paid for the quarters indicated.
|
|
|
|
|
|
|
|
|
|
|
|
|
|
|
|
|
|
| High |
| Low |
| Cash Dividends Paid | |||
Quarter Ended: |
|
|
|
|
|
|
|
|
March 31, 2013 | $ | 11.60 |
| $ | 10.15 |
| $ | - |
June 30, 2013 |
| 11.34 |
|
| 9.80 |
|
| 0.05 |
September 30, 2013 |
| 12.70 |
|
| 10.80 |
|
| 0.05 |
December 31, 2013 |
| 14.85 |
|
| 11.38 |
|
| 0.15 |
|
|
|
|
|
|
|
|
|
March 31, 2012 | $ | 11.43 |
| $ | 6.09 |
| $ | 0.05 |
June 30, 2012 |
| 11.50 |
|
| 9.45 |
|
| 0.05 |
September 30, 2012 |
| 10.95 |
|
| 8.97 |
|
| 0.05 |
December 31, 2012 |
| 11.19 |
|
| 9.75 |
|
| 0.10 |
| High | Low | Cash Dividends Paid | ||||||||||
Quarter Ended: | ||||||||||||
March 31, 2011 | $ | 12.33 | $ | 7.10 | $ | 0.05 | ||||||
June 30, 2011 | 9.75 | 8.10 | 0.05 | |||||||||
September 30, 2011 | 8.97 | 7.20 | 0.05 | |||||||||
December 31, 2011 | 8.50 | 6.60 | 0.05 | |||||||||
March 31, 2010 | $ | 10.60 | $ | 9.05 | $ | — | ||||||
June 30, 2010 | 10.60 | 9.10 | — | |||||||||
September 30, 2010 | 9.81 | 5.93 | — | |||||||||
December 31, 2010 | 8.00 | 6.35 | — | |||||||||
Transfer Agent: Registrar and Transfer Company, 10 Commerce Drive, Cranford, NJ 07016. Phone: 1-800-368-5948.
Number of Shareholders: As of February 15, 2012,14, 2014, there were approximately 1,4861,471 shareholders of record of Mid Penn’s common stock.
Dividends: Cash dividends of $0.25 were paid in both 2013 and 2012, while $0.20 per sharein cash dividends were paid during 2011. There were no cash dividends paid during 2010. Cash dividends of $0.52 per share were paid during 2009. The quarterly dividend payment was suspended during the fourth quarter of 2009 consistent with the Federal Reserve Board policy that dividend payouts should not exceed net income for the previous four quarters, net of dividends previously paid during that period. Furthermore, Mid Penn is restricted from increasing its dividends on its common stock above the last per share quarterly dividend declared prior to October 14, 2008 ($0.20 per share) without prior regulatory approval as long as the Capital Purchase Plan preferred stock is outstanding. On January 25, 2012, Mid Penn declared a cash dividend of $0.05 per common share, payable on February 27, 2012 to shareholders of record as of February 8, 2012.
Dividend Reinvestment and Stock Purchases: Shareholders of Mid Penn may acquire additional shares of common stock by reinvesting their cash dividends under the Dividend Reinvestment Plan without paying a brokerage fee. Voluntary cash contributions may also be made under the Plan. For additional information about the Plan, contact the Transfer Agent.
Annual Meeting: The Annual Meeting of the Shareholders of Mid Penn will be held at 10:00 a.m. on Tuesday, May 1, 2012,6, 2014, at 349 Union Street, Millersburg, Pennsylvania.
Accounting, Auditing and Internal Control Complaints: Information on how to report a complaint regarding accounting, internal accounting controls or auditing matters is available at Mid Penn’sPenn's website:www.midpennbank.com. midpennbank.com.
19
MID PENN BANCORP, INC.
Stock Performance Graph
Stock Performance Graph![]()
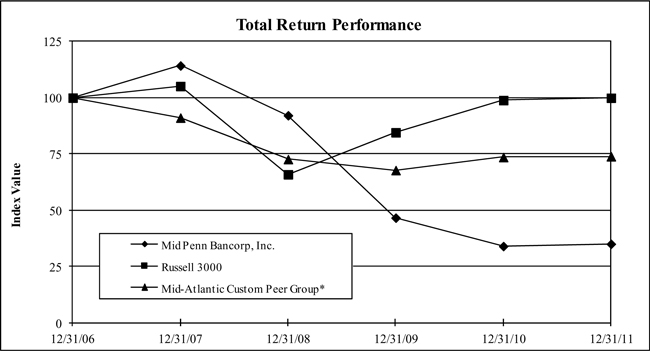
|
|
|
|
|
|
|
| Period Ending | |||||
Index | 12/31/08 | 12/31/09 | 12/31/10 | 12/31/11 | 12/31/12 | 12/31/13 |
Mid Penn Bancorp, Inc. | 100.00 | 50.59 | 36.87 | 37.96 | 57.79 | 75.59 |
Russell 3000 | 100.00 | 128.34 | 150.07 | 151.61 | 176.49 | 235.71 |
Mid-Atlantic Custom Peer Group* | 100.00 | 93.85 | 102.75 | 102.43 | 119.35 | 143.98 |
|
|
|
|
|
|
|
*Mid-Atlantic Custom Peer Group consists of Mid-Atlantic commercial banks with assets less than $1B. |
|
| ||||
|
|
|
|
|
|
|
Source : SNL Financial LC, Charlottesville, VA |
|
|
|
| ||
© 2014 |
|
|
|
|
|
|
www.snl.com |
|
|
|
|
|
|
| Period Ending | ||||||||||||||||||||||||
Index | 12/31/2006 | 12/31/2007 | 12/31/2008 | 12/31/2009 | 12/31/2010 | 12/31/2011 | ||||||||||||||||||
Mid Penn Bancorp, Inc. | 100.00 | 114.28 | 92.16 | 46.62 | 33.98 | 34.98 | ||||||||||||||||||
Russell 3000 | 100.00 | 105.14 | 65.92 | 84.60 | 98.92 | 99.93 | ||||||||||||||||||
Mid-Atlantic Custom Peer Group* | 100.00 | 91.11 | 72.66 | 67.78 | 73.57 | 73.91 | ||||||||||||||||||
Source: SNL Financial LC, Charlottesville, VA
© 2011
www.snl.com
A detailed list of the Banks comprising the Mid-Atlantic Custom Peer Group is incorporated herein by reference to Exhibit 99.1, which is attached to this Annual Report on Form 10-K.
20
MID PENN BANCORP, INC.
ITEM 6.SELECTED FINANCIAL DATA
Summary of Selected Financial Data
|
|
|
|
|
|
|
|
|
|
|
|
|
|
|
(Dollars in thousands, except per share data) |
|
|
|
|
|
|
|
|
|
|
|
|
|
|
|
|
|
|
|
|
|
|
|
|
|
|
|
|
|
| 2013 |
| 2012 |
| 2011 |
| 2010 |
| 2009 | |||||
INCOME: |
|
|
|
|
|
|
|
|
|
|
|
|
|
|
Total Interest Income | $ | 28,983 |
| $ | 30,366 |
| $ | 31,545 |
| $ | 30,148 |
| $ | 31,336 |
Total Interest Expense |
| 5,057 |
|
| 7,125 |
|
| 9,522 |
|
| 10,642 |
|
| 13,304 |
Net Interest Income |
| 23,926 |
|
| 23,241 |
|
| 22,023 |
|
| 19,506 |
|
| 18,032 |
Provision for Loan and Lease Losses |
| 1,685 |
|
| 1,036 |
|
| 1,205 |
|
| 2,635 |
|
| 9,520 |
Noninterest Income |
| 3,290 |
|
| 3,683 |
|
| 2,996 |
|
| 3,414 |
|
| 3,656 |
Noninterest Expense |
| 19,391 |
|
| 19,693 |
|
| 18,048 |
|
| 17,121 |
|
| 16,671 |
Income (Loss) Before Provision for (Benefit from) |
|
|
|
|
|
|
|
|
|
|
|
|
|
|
Income Taxes |
| 6,140 |
|
| 6,195 |
|
| 5,766 |
|
| 3,164 |
|
| (4,503) |
Provision for (Benefit from) Income Taxes |
| 1,201 |
|
| 1,244 |
|
| 1,223 |
|
| 416 |
|
| (2,208) |
Net Income (Loss) |
| 4,939 |
|
| 4,951 |
|
| 4,543 |
|
| 2,748 |
|
| (2,295) |
Series A Preferred Stock Dividends and Discount Accretion |
| 14 |
|
| 514 |
|
| 514 |
|
| 514 |
|
| 514 |
Series B Preferred Stock Dividends |
| 309 |
|
| - |
|
| - |
|
| - |
|
| - |
Net Income (Loss) Available to Common Shareholders |
| 4,616 |
|
| 4,437 |
|
| 4,029 |
|
| 2,234 |
|
| (2,809) |
|
|
|
|
|
|
|
|
|
|
|
|
|
|
|
COMMON STOCK DATA PER SHARE: |
|
|
|
|
|
|
|
|
|
|
|
|
|
|
Earnings (Loss) Per Common Share (Basic) | $ | 1.32 |
| $ | 1.27 |
| $ | 1.16 |
| $ | 0.64 |
| $ | (0.81) |
Earnings (Loss) Per Common Share (Fully Diluted) |
| 1.32 |
|
| 1.27 |
|
| 1.16 |
|
| 0.64 |
|
| (0.81) |
Cash Dividends |
| 0.25 |
|
| 0.25 |
|
| 0.20 |
|
| - |
|
| 0.52 |
Book Value Per Common Share |
| 13.71 |
|
| 13.57 |
|
| 12.47 |
|
| 10.98 |
|
| 10.55 |
Tangible Book Value Per Common Share |
| 13.35 |
|
| 13.19 |
|
| 12.10 |
|
| 10.58 |
|
| 10.15 |
|
|
|
|
|
|
|
|
|
|
|
|
|
|
|
AVERAGE SHARES OUTSTANDING (BASIC) |
| 3,491,653 |
|
| 3,486,543 |
|
| 3,481,414 |
|
| 3,479,780 |
|
| 3,479,780 |
AVERAGE SHARES OUTSTANDING (FULLY DILUTED) |
| 3,491,653 |
|
| 3,486,543 |
|
| 3,481,414 |
|
| 3,479,780 |
|
| 3,479,780 |
|
|
|
|
|
|
|
|
|
|
|
|
|
|
|
AT YEAR-END: |
|
|
|
|
|
|
|
|
|
|
|
|
|
|
Investments | $ | 122,803 |
| $ | 154,295 |
| $ | 159,043 |
| $ | 70,702 |
| $ | 47,345 |
Loans and Leases, Net of Unearned Discount |
| 546,462 |
|
| 484,220 |
|
| 482,717 |
|
| 467,735 |
|
| 480,385 |
Allowance for Loan and Lease Losses |
| 6,317 |
|
| 5,509 |
|
| 6,772 |
|
| 7,061 |
|
| 7,686 |
Total Assets |
| 713,125 |
|
| 705,200 |
|
| 715,383 |
|
| 637,457 |
|
| 606,010 |
Total Deposits |
| 608,130 |
|
| 625,461 |
|
| 634,055 |
|
| 554,982 |
|
| 500,015 |
Short-term Borrowings |
| 23,833 |
|
| - |
|
| - |
|
| 1,561 |
|
| 16,044 |
Long-term Debt |
| 23,145 |
|
| 22,510 |
|
| 22,701 |
|
| 27,883 |
|
| 38,057 |
Shareholders' Equity |
| 52,916 |
|
| 52,220 |
|
| 53,452 |
|
| 48,201 |
|
| 46,704 |
|
|
|
|
|
|
|
|
|
|
|
|
|
|
|
RATIOS: |
|
|
|
|
|
|
|
|
|
|
|
|
|
|
Return on Average Assets |
| 0.71% |
|
| 0.69% |
|
| 0.66% |
|
| 0.44% |
|
| -0.39% |
Return on Average Shareholders' Equity |
| 9.37% |
|
| 8.78% |
|
| 8.96% |
|
| 5.71% |
|
| -4.43% |
Cash Dividend Payout Ratio |
| 18.94% |
|
| 19.69% |
|
| 17.24% |
|
| 0.00% |
|
| -64.20% |
Allowance for Loan and Lease Losses to |
|
|
|
|
|
|
|
|
|
|
|
|
|
|
Loans and Leases |
| 1.16% |
|
| 1.14% |
|
| 1.40% |
|
| 1.51% |
|
| 1.60% |
Average Shareholders' Equity to |
|
|
|
|
|
|
|
|
|
|
|
|
|
|
Average Assets |
| 7.56% |
|
| 7.98% |
|
| 7.37% |
|
| 7.73% |
|
| 8.88% |
21
Summary of Selected Financial DataITEM 7.MANAGEMENT’S DISCUSSION AND ANALYSIS OF FINANCIAL CONDITION AND RESULTS OF OPERATIONS
| (Dollars in thousands, except per share data) | ||||||||||||||||||||
| 2011 | 2010 | 2009 | 2008 | 2007 | ||||||||||||||||
INCOME: | ||||||||||||||||||||
Total Interest Income | $ | 31,545 | $ | 30,148 | $ | 31,336 | $ | 31,856 | $ | 31,444 | ||||||||||
Total Interest Expense | 9,522 | 10,642 | 13,304 | 14,890 | 15,339 | |||||||||||||||
Net Interest Income | 22,023 | 19,506 | 18,032 | 16,966 | 16,105 | |||||||||||||||
Provision for Loan and Lease Losses | 1,205 | 2,635 | 9,520 | 1,230 | 925 | |||||||||||||||
Noninterest Income | 2,996 | 3,414 | 3,656 | 3,682 | 3,481 | |||||||||||||||
Noninterest Expense | 18,048 | 17,121 | 16,671 | 14,726 | 12,596 | |||||||||||||||
Income (Loss) Before Provision for (Benefit from) Income Taxes | 5,766 | 3,164 | (4,503 | ) | 4,692 | 6,065 | ||||||||||||||
Provision for (Benefit from) Income Taxes | 1,223 | 416 | (2,208 | ) | 1,104 | 1,394 | ||||||||||||||
Net Income (Loss) | 4,543 | 2,748 | (2,295 | ) | 3,588 | 4,671 | ||||||||||||||
Preferred Stock Dividends and Discount Accretion | 514 | 514 | 514 | 16 | — | |||||||||||||||
Net Income (Loss) Available to Common Shareholders | 4,029 | 2,234 | (2,809 | ) | 3,572 | 4,671 | ||||||||||||||
COMMON STOCK DATA PER SHARE: | ||||||||||||||||||||
Earnings (Loss) Per Common Share (Basic) | $ | 1.16 | $ | 0.64 | $ | (0.81 | ) | $ | 1.03 | $ | 1.34 | |||||||||
Earnings (Loss) Per Common Share (Fully Diluted) | 1.16 | 0.64 | (0.81 | ) | 1.03 | 1.34 | ||||||||||||||
Cash Dividends | 0.20 | — | 0.52 | 0.80 | 0.80 | |||||||||||||||
Book Value Per Common Share | 12.47 | 10.98 | 10.55 | 11.75 | 11.56 | |||||||||||||||
Tangible Book Value Per Common Share | 12.10 | 10.58 | 10.15 | 11.34 | 11.03 | |||||||||||||||
AVERAGE SHARES OUTSTANDING (BASIC) | 3,481,414 | 3,479,780 | 3,479,780 | 3,483,097 | 3,497,806 | |||||||||||||||
AVERAGE SHARES OUTSTANDING (FULLY DILUTED) | 3,481,414 | 3,479,780 | 3,479,780 | 3,483,153 | 3,497,806 | |||||||||||||||
AT YEAR-END: | ||||||||||||||||||||
Investments | $ | 159,043 | $ | 70,702 | $ | 47,345 | $ | 52,739 | $ | 50,250 | ||||||||||
Loans and Leases, Net of Unearned Discount | 482,717 | 467,735 | 480,385 | 434,643 | 377,128 | |||||||||||||||
Allowance for Loan and Lease Losses | 6,772 | 7,061 | 7,686 | 5,505 | 4,790 | |||||||||||||||
Total Assets | 715,383 | 637,457 | 606,010 | 572,999 | 509,757 | |||||||||||||||
Total Deposits | 634,055 | 554,982 | 500,015 | 436,824 | 372,817 | |||||||||||||||
Short-term Borrowings | — | 1,561 | 16,044 | 23,977 | 37,349 | |||||||||||||||
Long-term Debt | 22,701 | 27,883 | 38,057 | 55,223 | 54,581 | |||||||||||||||
Shareholders’ Equity | 53,452 | 48,201 | 46,704 | 50,890 | 40,444 | |||||||||||||||
RATIOS: | ||||||||||||||||||||
Return on Average Assets | 0.66 | % | 0.44 | % | -0.39 | % | 0.67 | % | 0.94 | % | ||||||||||
Return on Average Shareholders’ Equity | 8.96 | % | 5.71 | % | -4.43 | % | 8.87 | % | 11.84 | % | ||||||||||
Cash Dividend Payout Ratio | 15.32 | % | 0.00 | % | -64.40 | % | 77.67 | % | 59.70 | % | ||||||||||
Allowance for Loan and Lease Losses to Loans and Leases | 1.40 | % | 1.51 | % | 1.60 | % | 1.27 | % | 1.27 | % | ||||||||||
Average Shareholders’ Equity to Average Assets | 7.37 | % | 7.73 | % | 8.88 | % | 7.55 | % | 7.82 | % | ||||||||||
SPECIAL CAUTIONARY NOTICE REGARDING FORWARD-LOOKING STATEMENTS
Certain of the matters discussed in this document may constitute forward-looking statements for purposes of the Securities Act of 1933, as amended, and the Securities Exchange Act of 1934, as amended, and as such may involve known and unknown risks, uncertainties and other factors which may cause the actual results, performance or achievements of Mid Penn to be materially different from future results, performance or achievements expressed or implied by such forward-looking statements. The words “expect,” “anticipate,” “intend,” “plan,” “believe,” “estimate,” and similar expressions are intended to identify such forward-looking statements.
Mid Penn’s actual results may differ materially from the results anticipated in these forward-looking statements due to a variety of factors, including, without limitation:
The effects of economic deterioration
· | The effects of weak economic conditions on current customers, specifically the effect of the economy on loan customers’ ability to repay loans; |
· | Governmental monetary and fiscal policies, as well as legislative and regulatory changes, including the effects of the Dodd-Frank Wall Street Reform and Consumer Protection Act; |
· | The effects of the failure of the federal government to reach a deal to raise the debt ceiling and the negative results on economic or business conditions resulting therefrom; |
· | Possible impacts of the capital and liquidity requirements of Basel III standards and other regulatory pronouncements; |
· | The effect of changes in accounting policies and practices, as may be adopted by the regulatory agencies, as well as the Public Company Accounting Oversight Board, Financial Accounting Standards Board, and other accounting standard setters; |
· | The risks of changes in interest rates on the level and composition of deposits, loan demand, and the values of loan collateral, securities and interest rate protection agreements, as well as interest rate risks; |
· | The effects of competition from other commercial banks, thrifts, mortgage banking firms, consumer finance companies, credit unions, securities brokerage firms, insurance companies, money market and other mutual funds and other financial institutions operating in Mid Penn’s market area and elsewhere, including institutions operating locally, regionally, nationally and internationally, together with such competitors offering banking products and services by mail, telephone, computer and the internet; |
· | The costs and effects of litigation and of unexpected or adverse outcomes in such litigation; |
· | Technological changes; |
· | Acquisitions and integration of acquired businesses; |
· | The failure of assumptions underlying the establishment of reserves for loan and lease losses and estimations of values of collateral and various financial assets and liabilities; |
· | Acts of war or terrorism; |
· | Volatilities in the securities markets; and |
· | Deteriorating economic conditions. |
Governmental monetary and fiscal policies, as well as legislative and regulatory changes, including the effects of the Dodd-Frank Wall Street Reform and Consumer Protection Act;
The effect of changes in accounting policies and practices, as may be adopted by the regulatory agencies, as well as the Financial Accounting Standards Board and other accounting standard setters;
The risks of changes in interest rates on the level and composition of deposits, loan demand, and the values of loan collateral, securities and interest rate protection agreements, as well as interest rate risks;
The effects of competition from other commercial banks, thrifts, mortgage banking firms, consumer finance companies, credit unions, securities brokerage firms, insurance companies, money market and other mutual funds and other financial institutions operating in Mid Penn’s market area and elsewhere, including institutions operating locally, regionally, nationally and internationally, together with such competitors offering banking products and services by mail, telephone, computer and the internet;
The costs and effects of litigation and of unexpected or adverse outcomes in such litigation;
Technological changes;
Acquisitions and integration of acquired businesses;
The failure of assumptions underlying the establishment of reserves for loan and lease losses and estimations of values of collateral and various financial assets and liabilities;
Acts of war or terrorism;
Volatilities in the securities markets; and
Deteriorating economic conditions.
All written or oral forward-looking statements attributable to Mid Penn are expressly qualified in their entirety by these cautionary statements.
Management’s Discussion and Analysis of Financial Condition and Results of Operations analyzes the major elements of Mid Penn’s consolidated financial statements and should be read in conjunction with the Consolidated Financial Statements of the Corporation and Notes thereto and other detailed information appearing elsewhere in this Annual Report. Mid Penn is not aware of any known trends, events, uncertainties or of any current recommendations by the regulatory authorities which, if they were to be implemented, would have a material effect on Mid Penn’s liquidity, capital resources or operations.
Financial Summary
The consolidated earnings of Mid Penn are derived primarily from the operations of its wholly owned subsidiary, Mid Penn Bank.
Mid Penn recorded net income available to common shareholders of $4,029,000 for the year 2011, compared to $2,234,000 in 2010, which was an increase of $1,795,000 or 80.3%. This represents net income in 2011 of $1.16 per common share compared to $0.64 per common share in 2010, and a net loss of ($0.81) per common share in 2009.
Total assets of Mid Penn continued to grow in 2011, reaching $715,383,000, an increase of $77,926,000, or 12.2% over $637,457,000 at year-end 2010. The majority of growth in assets came from increases in investments, which increased to $159,043,000 or 124.9% over $70,702,000 at the end of 2010. This growth was funded primarily through growth in deposits, which increased 14.2% to $634,055,000 from $554,982,000 at year-end 2010.
The continued soft economy was the major contributor to modest loan growth during 2011. Loan balances increased 3.2% to $482,717,000 from $467,735,000 in 2010. The modest growth numbers were a welcome improvement over the loan balance contraction experienced in 2010 from the end of 2009. Mid Penn experienced weak loan demand during 2011 despite a desire to sensibly lend to support creditworthy existing and new customers in the marketplace.
Mid Penn’s return on average shareholders’ equity, (ROE), a widely recognized performance indicator in the financial industry, was 8.96% in 2011, 5.71% in 2010, and (4.43%) in 2009. Return on average assets (ROA), another performance indicator, was 0.66% in 2011, 0.44% in 2010, and (0.39%) in 2009.
Mid Penn’s performance during 2011 was a dramatic improvement over the results reported in 2010. This improvement was the result of reduced loan charge-offs and provision for loan and lease losses, improving cost of funds, consistent management of controllable expenses, and positive loan growth throughout 2011.
Net charge-offs decreased from $3,260,000 in 2010 to $1,494,000 during 2011. The reduction from 2010 allowed for a reduced provision for loan and lease losses from $2,635,000 in 2010 to $1,205,000 in 2011. The recession and problems in the commercial real estate sector of the economy continued to negatively impact a number of loans in the portfolio, causing continued elevation in the level of nonperforming loans from those experienced prior to 2009. Further discussion of these issues can be found in the Provision for Loan and Lease Losses section below.
Net interest margin improved to 3.52% in 2011 from 3.47% in 2010. This improvement was driven by a 40 basis point improvement in the rate on supporting liabilities from 2.08% in 2010 to 1.68% in 2011. This improvement allowed average interest spread to increase to 3.29% from 3.20% in 2010 and net interest income on a tax equivalent basis to increase from $20,468,000 in 2010 to $23,094,000 in 2011. This increase was achieved in spite of the substantial pool of nonperforming loans being carried on the balance sheet. The amount of interest income lost on this pool of troubled loans in 2011 amounted to $2,200,000. Further discussion of net interest margin can be found in the Net Interest Income section below.
FDIC insurance premiums increased in 2011 from 2010 and this expense remains at historically high levels as the FDIC continues its efforts to restore the Deposit Insurance Fund and keep it solvent to handle future bank failures should they occur. In addition to high deposit insurance premiums, the increasing regulatory and compliance burden necessitated the hiring of a dedicated compliance officer in 2010 to ensure Mid Penn’s continued compliance with current and anticipated future regulatory changes. This hiring was followed in 2011 with the addition of three additional positions dedicated to compliance with the Bank Secrecy Act, U.S. Patriot Act, and general regulatory compliance. Mid Penn was negatively impacted by recent regulatory changes governing overdraft charges, which has resulted in a reduction in NSF revenue of $425,000 during 2011.
In addition to the interest lost on nonperforming loans, this pool of troubled assets increases Mid Penn’s costs associated with the management and collection of this pool of assets. During 2011, the expenses associated with the increased collection and management efforts on troubled assets were $299,000 as compared to $307,000 in 2010. These expenses remain at historically high levels as Mid Penn resolves problems associated with the pool of troubled assets.
Mid Penn’s fundamental operating performance in 2011 was sound despite these issues and the general economic conditions and credit crisis issues experienced by the banking industry as a whole.
The Bank’s tier one capital (to risk weighted assets) of $50,265,000 or 10.4% and total capital (to risk weighted assets) of $56,327,000 or 11.6% at December 31, 2011, are above the regulatory requirements. Tier one capital consists primarily of the Bank’s shareholders’ equity. Total capital includes qualifying subordinated debt, if any, and the allowance for loan and lease losses, within permitted limits. Risk-weighted assets are determined by assigning various levels of risk to different categories of assets and off-balance sheet activities.
Critical Accounting Estimates
Mid Penn’s consolidated financial statements are prepared in accordance with accounting principles generally accepted in the United States of America (“GAAP”) and conform to general practices within the banking industry. Application of these principles involves significant judgments and estimates by management that have a material impact on the carrying value of certain assets and liabilities. The judgments and estimates that we used are based on historical experiences and other factors, which are believed to be reasonable under the circumstances. Because of the nature of the judgments and estimates that we have made, actual results could differ from these judgments and estimates, which could have a material impact on the carrying values of assets and liabilities and the results of our operations.
Management of the Corporation considers the accounting judgments relating to the allowance for loan and lease losses, the evaluation of the Corporation’s investment securities for other-than-temporary impairment, the valuation of deferred tax assets, and the assessment of goodwill for impairment to be the accounting areas that require the most subjective and complex judgments.
The allowance for loan and lease losses represents management’s estimate of probable incurred credit losses inherent in the loan and lease portfolio. Determining the amount of the allowance for loan and lease losses is considered a critical accounting estimate because it requires significant judgment and the use of estimates related to the amount and timing of expected future cash flows on impaired loans, estimated losses
22
MID PENN BANCORP, INC.Management’s Discussion and Analysis
on pools of homogeneous loans based on historical loss experience, and consideration of current economic trends and conditions, all of which may be susceptible to significant change. The loan and lease portfolio also represents the largest asset type on the consolidated balance sheet. Throughout the remainder of this report, the terms “loan” or “loans” refers to both loans and leases.
Valuations for the investment portfolio are determined using quoted market prices, where available. If quoted market prices are not available, investment valuation is based on pricing models, quotes for similar investment securities, and observable yield curves and spreads. In addition to valuation, management must assess whether there are any declines in value below the carrying value of the investments that should be considered other than temporary or otherwise require an adjustment in carrying value and recognition of the loss in the consolidated statement of operations.income.
Accounting Standards Codification (ASC) Topic 350,Intangibles-Goodwill and Other, requires that goodwill is not amortized to expense, but rather that it be tested for impairment at least annually. Impairment write-downs are charged to results of operations in the period in which the impairment is determined. The Corporation did not identify any impairment on its outstanding goodwill from its most recent testing, which was performed as of December 31, 2011.2013. If certain events occur which might indicate goodwill has been impaired, the goodwill is tested when such events occur.
The Corporation recognizes deferred tax assets and liabilities for the future effects of temporary differences and tax credits. Enacted tax rates are applied to cumulative temporary differences based on expected taxable income in the periods in which the deferred tax asset or liability is anticipated to be realized. Future tax rate changes could occur that would require the recognition of income or expense in the consolidated statements of income in the period in which they are enacted. Deferred tax assets must be reduced by a valuation allowance if in management's judgment it is "more likely than not" that some portion of the asset will not be realized. Management may need to modify their judgments in this regard from one period to another should a material change occur in the business environment, tax legislation, or in any other business factor that could impair the Corporation's ability to benefit from the asset in the future.
Financial Summary
The consolidated earnings of Mid Penn are derived primarily from the operations of its wholly owned subsidiary, Mid Penn Bank.
2013 versus 2012
Mid Penn’s net income available to common shareholders of $4,616,000 for the year 2013 reflects an increase of $179,000, or 4.0%, over the $4,437,000 for the year 2012. This represents net income in 2013 of $1.32 per common share compared to $1.27 per common share in 2012.
Total assets of Mid Penn grew $7,925,000, or 1.1%, in 2013 to close the year at $713,125,000, compared to $705,200,000 at year-end 2012. The majority of the asset growth was centered in the loan portfolio, which increased $62,242,000, or 12.9%, to $546,462,000. This loan growth was supported by a decrease in investments, which fell to $122,803,000, or 20.4%, from $154,295,000 at the end of 2012.
Total deposits decreased $17,331,000, or 2.8%, from $625,461,000 at the end of 2012 to $608,130,000 at December 31, 2013. This was part of a comprehensive effort to improve Mid Penn’s overall funding mix by reducing reliance on higher-priced money market and certificate of deposit funds and placing greater emphasis on less expensive demand deposits and savings balances. As a result of these efforts, demand deposits and savings comprise 45.9% of total deposits at the end of 2013 versus 40.2% of total deposits at the end of 2012. Mid Penn also had shifted to a short-term borrowing position of $23,833,000 as part of its funding strategy by the end of 2013.
Mid Penn’s return on average shareholders’ equity, (ROE), a widely recognized performance indicator in the financial industry, was 9.37% in 2013 and 8.78% in 2012. Return on average assets (ROA), another performance indicator, was 0.71% in 2013 and 0.69% in 2012.
Mid Penn’s performance during 2013 improved over the results reported in 2012. This improvement was the result of increased loan production, improving cost of funds, improvement in nonperforming loans, and consistent management of controllable expenses throughout 2013.
Net interest margin improved to 3.80% in 2013 from 3.63% in 2012. This improvement was driven by a 34 basis point improvement in the rate on supporting liabilities to 0.86% in 2013 from 1.20% in 2012. This improvement allowed average interest spread to increase to 3.70% from 3.49% in 2012 and net interest income on a tax equivalent basis to increase to $25,250,000 in 2013 from $24,494,000 in 2012. This increase was achieved in spite of the substantial pool of nonperforming loans being carried on the balance sheet. The amount of interest income lost on this pool of troubled loans in 2013 amounted to $861,000. Further discussion of net interest margin can be found in the Net Interest Income section below.
Total nonperforming assets decreased $425,000 from $13,100,000 in 2012 to $12,675,000 at the end of 2013. Decreasing nonaccrual loans were the leading source of improvement in nonperforming assets. Further discussion of these components can be found in the Credit Quality, Credit Risk, and Allowance for Loan and Lease Losses section below.
23
MID PENN BANCORP, INC.Management’s Discussion and Analysis
Net charge-offs decreased to $877,000 in 2013 from $2,299,000 during 2012. Mid Penn increased provision for loan and lease losses from $1,036,000 in 2012 to $1,685,000 in 2013. This was largely driven by the increase in loans in the overall portfolio. Further discussion of these issues can be found in the Provision for Loan and Lease Losses section below.
The Bank’s tier one capital (to risk weighted assets) of $52,693,000, or 9.9%, and total capital (to risk weighted assets) of $59,100,000, or 11.1%, at December 31, 2013, are above the regulatory requirements. Tier one capital consists primarily of the Bank’s shareholders' equity and any qualifying preferred stock. Total capital also includes qualifying subordinated debt, if any, and the allowance for loan and lease losses, within permitted limits. Risk-weighted assets are determined by assigning various levels of risk to different categories of assets and off-balance sheet activities.
2012 versus 2011
Mid Penn recorded net income available to common shareholders of $4,437,000 for the year 2012, compared to $4,029,000 in 2011, which was an increase of $408,000 or 10.1%. This represents net income in 2012 of $1.27 per common share compared to $1.16 per common share in 2011.
Total assets of Mid Penn contracted in 2012, falling to $705,200,000, a decrease of $10,183,000, or 1.4% from $715,383,000 at year-end 2011. The majority of asset contraction came from a decrease in investments, which fell to $154,295,000 or 3.0% from $159,043,000 at the end of 2011. Federal funds sold also decreased, falling $3,439,000 or 53.4% from $6,439,000 at the end of 2011. These asset reductions were used to offset a reduction in deposits, which decreased 1.4% to $625,461,000 from $634,055,000 at year-end 2011. This deposit decrease was the result of the maturity of a $10,000,000 brokered certificate of deposit early in 2012.
The continued soft economy was the major contributor to modest loan growth during 2012. Loan balances increased 0.3% to $484,220,000 from $482,717,000 in 2011. Mid Penn experienced weak loan demand during 2012 despite a desire to sensibly lend to support creditworthy existing and new customers in the marketplace. Adding additional strain to weakened demand was the increase in unscheduled payoffs of large loans within the portfolio. The continued low interest rate environment and weak economy has increased the competitive pressure from other lending institutions to attract borrowers from other institutions as well as incenting borrowers to use surplus cash reserves to pay down debt rather than expand their operations.
Mid Penn’s return on average shareholders’ equity, (ROE), a widely recognized performance indicator in the financial industry, was 8.78% in 2012 and 8.96% in 2011. Return on average assets (ROA), another performance indicator, was 0.69% in 2012 and 0.66% in 2011.
Mid Penn’s performance during 2012 was a solid improvement over the results reported in 2011. This improvement was the result of reduced provision for loan and lease losses, improving cost of funds, consistent management of controllable expenses, and growth in noninterest income sources throughout 2012.
Net charge-offs increased from $1,494,000 in 2011 to $2,299,000 during 2012. Despite the increase in net charge-offs from 2011, Mid Penn was able to reduce provision for loan and lease losses from $1,205,000 in 2011 to $1,036,000 in 2012. This stemmed from the fact that $1,499,000 of the net charge-offs during 2012 had a previously recorded balance included in the allowance for loan and lease losses. As Mid Penn continues to work to resolve the elevated levels of nonperforming loans, the relationship between net charge-offs and provision for loan and lease losses may continue to have a more tenuous link. Further discussion of these issues can be found in the Provision for Loan and Lease Losses section below.
Net interest margin improved to 3.63% in 2012 from 3.52% in 2011. This improvement was driven by a 48 basis point improvement in the rate on supporting liabilities from 1.68% in 2011 to 1.20% in 2012. This improvement allowed average interest spread to increase to 3.49% from 3.29% in 2011 and net interest income on a tax equivalent basis to increase from $23,094,000 in 2011 to $24,494,000 in 2012. This increase was achieved in spite of the substantial pool of nonperforming loans being carried on the balance sheet. The amount of interest income lost on this pool of troubled loans in 2012 amounted to $2,974,000. Further discussion of net interest margin can be found in the Net Interest Income section below.
In addition to the interest lost on nonperforming loans, this pool of troubled assets increases Mid Penn’s costs associated with the management and collection of this pool of assets. During 2012, the expenses associated with the increased collection and management efforts on troubled assets were $369,000 as compared to $299,000 in 2011. These expenses remain at historically high levels as Mid Penn resolves problems associated with the pool of troubled assets.
Mid Penn’s fundamental operating performance in 2012 was sound despite these issues and the general economic conditions experienced by the banking industry as a whole.
The Bank’s tier one capital (to risk weighted assets) of $48,764,000, or 10.0%, and total capital (to risk weighted assets) of $54,363,000, or 11.1%, at December 31, 2012, are above the regulatory requirements. Tier one capital consists primarily of the Bank’s shareholders' equity and any qualifying preferred stock. Total capital also includes qualifying subordinated debt, if any, and the allowance for loan and lease losses,
24
MID PENN BANCORP, INC.Management’s Discussion and Analysis
within permitted limits. Risk-weighted assets are determined by assigning various levels of risk to different categories of assets and off-balance sheet activities.
Net Interest Income
Net interest income, Mid Penn’sPenn's primary source of revenue, represents the difference between interest income and interest expense. Net interest income is affected by changes in interest rates and changes in average balances (volume) in the various interest-sensitive assets and liabilities.
TABLE 1: AVERAGE BALANCES, EFFECTIVE INTEREST DIFFERENTIAL AND INTEREST YIELDS
|
|
|
|
|
|
|
|
|
|
|
|
|
|
|
|
|
|
|
|
|
|
| |||||||||||||||||||||||||||||||||||||
| Income and Rates on a Taxable Equivalent Basis for Years Ended | |||||||||||||||||||||||||||||||||||||||||||||||||||||||||||
|
|
|
|
|
|
|
|
|
|
|
|
|
|
|
|
|
|
|
|
|
|
|
| ||||||||||||||||||||||||||||||||||||
| (Dollars in thousands) | Income and Rates on a Taxable Equivalent Basis for Years Ended | ||||||||||||||||||||||||||||||||||||||||||||||||||||||||||
| December 31, 2011 | December 31, 2010 | December 31, 2009 | December 31, 2013 |
| December 31, 2012 |
| December 31, 2011 | ||||||||||||||||||||||||||||||||||||||||||||||||||||
| Average | Average | Average | Average | Average | Average | Average |
|
|
| Average |
| Average |
|
|
| Average |
| Average |
|
|
|
| Average | ||||||||||||||||||||||||||||||||||||
| Balance | Interest | Rates | Balance | Interest | Rates | Balance | Interest | Rates | Balance |
| Interest |
| Rates |
| Balance |
| Interest |
| Rates |
| Balance |
| Interest |
| Rates | ||||||||||||||||||||||||||||||||||
ASSETS: |
|
|
|
|
|
|
|
|
|
|
|
|
|
|
|
|
|
|
|
|
|
|
| ||||||||||||||||||||||||||||||||||||
Interest Earning Balances | $ | 50,458 | $ | 520 | 1.03 | % | $ | 45,244 | $ | 818 | 1.81 | % | $ | 41,925 | $ | 1,460 | 3.48 | % | $ | 14,818 |
| $ | 109 |
| 0.74% |
| $ | 26,092 |
| $ | 236 |
| 0.90% |
| $ | 50,458 |
| $ | 520 |
| 1.03% | ||||||||||||||||||
Investment Securities: |
|
|
|
|
|
|
|
|
|
|
|
|
|
|
|
|
|
|
|
|
|
|
| ||||||||||||||||||||||||||||||||||||
Taxable | 81,017 | 1,632 | 2.01 | % | 31,981 | 800 | 2.50 | % | 18,829 | 665 | 3.53 | % |
| 68,524 |
|
| 617 |
| 0.90% |
|
| 99,906 |
|
| 1,154 |
| 1.16% |
|
| 81,017 |
|
| 1,632 |
| 2.01% | ||||||||||||||||||||||||
Tax-Exempt | 35,238 | 2,015 | 5.72 | % | 26,254 | 1,679 | 6.40 | % | 25,188 | 1,774 | 7.04 | % |
| 66,147 |
|
| 2,911 |
| 4.40% |
|
| 55,033 |
|
| 2,609 |
| 4.74% |
|
| 35,238 |
|
| 2,015 |
| 5.72% | ||||||||||||||||||||||||
|
|
| |||||||||||||||||||||||||||||||||||||||||||||||||||||||||
Total Securities | 116,255 | 58,235 | 44,017 |
| 134,671 |
|
|
|
|
|
|
| 154,939 |
|
|
|
|
|
|
| 116,255 |
|
|
|
|
| |||||||||||||||||||||||||||||||||
|
|
| |||||||||||||||||||||||||||||||||||||||||||||||||||||||||
Federal Funds Sold | 9,922 | 25 | 0.25 | % | 9,222 | 25 | 0.27 | % | 279 | 1 | 0.30 | % |
| 3,580 |
|
| 11 |
| 0.31% |
|
| 6,197 |
|
| 16 |
| 0.26% |
|
| 9,922 |
|
| 25 |
| 0.25% | ||||||||||||||||||||||||
Loans and Leases, Net: | |||||||||||||||||||||||||||||||||||||||||||||||||||||||||||
Taxable | 458,533 | 27,290 | 5.95 | % | 455,927 | 26,660 | 5.85 | % | 446,649 | 27,370 | 6.13 | % | |||||||||||||||||||||||||||||||||||||||||||||||
Tax-Exempt | 17,144 | 1,134 | 6.61 | % | 16,655 | 1,128 | 6.77 | % | 17,504 | 1,013 | 5.79 | % | |||||||||||||||||||||||||||||||||||||||||||||||
|
|
| |||||||||||||||||||||||||||||||||||||||||||||||||||||||||
Total Loans and Leases, Net | 475,677 | 472,582 | 464,153 | ||||||||||||||||||||||||||||||||||||||||||||||||||||||||
Restricted Investment in Bank Stocks | 3,441 | — | 0.00 | % | 3,995 | — | 0.00 | % | 3,929 | 1 | 0.03 | % | |||||||||||||||||||||||||||||||||||||||||||||||
|
|
|
|
|
| ||||||||||||||||||||||||||||||||||||||||||||||||||||||
Loans and Leases, Net |
| 508,638 |
|
| 26,639 |
| 5.24% |
|
| 483,977 |
|
| 27,599 |
| 5.70% |
|
| 475,677 |
|
| 28,424 |
| 5.98% | ||||||||||||||||||||||||||||||||||||
Restricted Investment |
|
|
|
|
|
|
|
|
|
|
|
|
|
|
|
|
|
|
|
|
|
|
| ||||||||||||||||||||||||||||||||||||
in Bank Stocks |
| 2,545 |
|
| 20 |
| 0.79% |
|
| 2,772 |
|
| 5 |
| 0.18% |
|
| 3,441 |
|
| - |
| 0.00% | ||||||||||||||||||||||||||||||||||||
Total Earning Assets | 655,753 | 32,616 | 4.97 | % | 589,278 | 31,110 | 5.28 | % | 554,303 | 32,284 | 5.82 | % |
| 664,252 |
|
| 30,307 |
| 4.56% |
|
| 673,977 |
|
| 31,619 |
| 4.69% |
|
| 655,753 |
|
| 32,616 |
| 4.97% | ||||||||||||||||||||||||
|
|
| |||||||||||||||||||||||||||||||||||||||||||||||||||||||||
Cash and Due from Banks | 7,941 | 7,466 | 6,795 |
| 8,156 |
|
|
|
|
|
|
| 8,057 |
|
|
|
|
|
|
| 7,941 |
|
|
|
|
| |||||||||||||||||||||||||||||||||
Other Assets | 24,756 | 26,330 | 22,071 |
| 25,472 |
|
|
|
|
|
|
| 24,422 |
|
|
|
|
|
|
| 24,756 |
|
|
|
|
| |||||||||||||||||||||||||||||||||
|
|
| |||||||||||||||||||||||||||||||||||||||||||||||||||||||||
Total Assets | $ | 688,450 | $ | 623,074 | $ | 583,169 | $ | 697,880 |
|
|
|
|
|
| $ | 706,456 |
|
|
|
|
|
| $ | 688,450 |
|
|
|
|
| ||||||||||||||||||||||||||||||
|
|
| |||||||||||||||||||||||||||||||||||||||||||||||||||||||||
LIABILITIES & SHAREHOLDERS’ EQUITY: | |||||||||||||||||||||||||||||||||||||||||||||||||||||||||||
LIABILITIES & |
|
|
|
|
|
|
|
|
|
|
|
|
|
|
|
|
|
|
|
|
|
|
| ||||||||||||||||||||||||||||||||||||
SHAREHOLDERS' EQUITY: |
|
|
|
|
|
|
|
|
|
|
|
|
|
|
|
|
|
|
|
|
|
|
| ||||||||||||||||||||||||||||||||||||
Interest Bearing Deposits: |
|
|
|
|
|
|
|
|
|
|
|
|
|
|
|
|
|
|
|
|
|
|
| ||||||||||||||||||||||||||||||||||||
NOW | $ | 57,342 | 144 | 0.25 | % | $ | 48,024 | 69 | 0.14 | % | $ | 38,198 | 33 | 0.09 | % | $ | 182,118 |
|
| 659 |
| 0.36% |
| $ | 126,171 |
|
| 458 |
| 0.36% |
| $ | 57,342 |
|
| 144 |
| 0.25% | |||||||||||||||||||||
Money Market | 248,615 | 2,992 | 1.20 | % | 163,415 | 2,357 | 1.44 | % | 87,427 | 1,383 | 1.58 | % |
| 202,393 |
|
| 1,194 |
| 0.59% |
|
| 236,434 |
|
| 1,992 |
| 0.84% |
|
| 248,615 |
|
| 2,992 |
| 1.20% | ||||||||||||||||||||||||
Savings | 27,801 | 15 | 0.05 | % | 26,585 | 16 | 0.06 | % | 26,241 | 17 | 0.06 | % |
| 29,597 |
|
| 15 |
| 0.05% |
|
| 28,632 |
|
| 14 |
| 0.05% |
|
| 27,801 |
|
| 15 |
| 0.05% | ||||||||||||||||||||||||
Time | 209,574 | 5,358 | 2.56 | % | 239,761 | 6,877 | 2.87 | % | 255,123 | 9,293 | 3.64 | % |
| 148,863 |
|
| 2,568 |
| 1.73% |
|
| 180,356 |
|
| 3,683 |
| 2.04% |
|
| 209,574 |
|
| 5,358 |
| 2.56% | ||||||||||||||||||||||||
Short-term Borrowings | 803 | 4 | 0.50 | % | 3,798 | 18 | 0.47 | % | 19,715 | 112 | 0.57 | % |
| 10,533 |
|
| 26 |
| 0.25% |
|
| 1,044 |
|
| 3 |
| 0.29% |
|
| 803 |
|
| 4 |
| 0.50% | ||||||||||||||||||||||||
Long-term Debt | 23,394 | 1,009 | 4.31 | % | 28,860 | 1,305 | 4.52 | % | 47,241 | 2,466 | 5.22 | % |
| 16,268 |
|
| 595 |
| 3.66% |
|
| 22,605 |
|
| 975 |
| 4.31% |
|
| 23,394 |
|
| 1,009 |
| 4.31% | ||||||||||||||||||||||||
|
|
|
|
|
| ||||||||||||||||||||||||||||||||||||||||||||||||||||||
Total Interest Bearing Liabilities | 567,529 | 9,522 | 1.68 | % | 510,443 | 10,642 | 2.08 | % | 473,945 | 13,304 | 2.81 | % | |||||||||||||||||||||||||||||||||||||||||||||||
|
|
| |||||||||||||||||||||||||||||||||||||||||||||||||||||||||
Total Interest |
|
|
|
|
|
|
|
|
|
|
|
|
|
|
|
|
|
|
|
|
|
|
| ||||||||||||||||||||||||||||||||||||
Bearing Liabilities |
| 589,772 |
|
| 5,057 |
| 0.86% |
|
| 595,242 |
|
| 7,125 |
| 1.20% |
|
| 567,529 |
|
| 9,522 |
| 1.68% | ||||||||||||||||||||||||||||||||||||
Demand Deposits | 63,484 | 58,480 | 51,464 |
| 49,318 |
|
|
|
|
|
|
| 47,670 |
|
|
|
|
|
|
| 63,484 |
|
|
|
|
| |||||||||||||||||||||||||||||||||
Other Liabilities | 6,722 | 6,010 | 5,985 |
| 6,051 |
|
|
|
|
|
|
| 7,184 |
|
|
|
|
|
|
| 6,722 |
|
|
|
|
| |||||||||||||||||||||||||||||||||
Shareholders’ Equity | 50,715 | 48,141 | 51,775 | ||||||||||||||||||||||||||||||||||||||||||||||||||||||||
|
|
| |||||||||||||||||||||||||||||||||||||||||||||||||||||||||
Total Liabilities and Shareholders’ Equity | $ | 688,450 | $ | 623,074 | $ | 583,169 | |||||||||||||||||||||||||||||||||||||||||||||||||||||
|
|
| |||||||||||||||||||||||||||||||||||||||||||||||||||||||||
Shareholders' Equity |
| 52,739 |
|
|
|
|
|
|
| 56,360 |
|
|
|
|
|
|
| 50,715 |
|
|
|
|
| ||||||||||||||||||||||||||||||||||||
Total Liabilities and |
|
|
|
|
|
|
|
|
|
|
|
|
|
|
|
|
|
|
|
|
|
|
| ||||||||||||||||||||||||||||||||||||
Shareholders' Equity | $ | 697,880 |
|
|
|
|
|
| $ | 706,456 |
|
|
|
|
|
| $ | 688,450 |
|
|
|
|
| ||||||||||||||||||||||||||||||||||||
Net Interest Income | $ | 23,094 | $ | 20,468 | $ | 18,980 |
|
|
| $ | 25,250 |
|
|
|
|
|
| $ | 24,494 |
|
|
|
|
|
| $ | 23,094 |
|
| ||||||||||||||||||||||||||||||
|
|
| |||||||||||||||||||||||||||||||||||||||||||||||||||||||||
|
|
|
|
|
|
|
|
|
|
|
|
|
|
|
|
|
|
|
|
|
|
| |||||||||||||||||||||||||||||||||||||
Net Yield on Interest Earning Assets: |
|
|
|
|
|
|
|
|
|
|
|
|
|
|
|
|
|
|
|
|
|
|
| ||||||||||||||||||||||||||||||||||||
Total Yield on Earning Assets | 4.97 | % | 5.28 | % | 5.82 | % |
|
|
|
|
|
| 4.56% |
|
|
|
|
|
|
| 4.69% |
|
|
|
|
|
|
| 4.97% | ||||||||||||||||||||||||||||||
Rate on Supporting Liabilities | 1.68 | % | 2.08 | % | 2.81 | % |
|
|
|
|
|
| 0.86% |
|
|
|
|
|
|
| 1.20% |
|
|
|
|
|
|
| 1.68% | ||||||||||||||||||||||||||||||
Average Interest Spread | 3.29 | % | 3.20 | % | 3.01 | % |
|
|
|
|
|
| 3.70% |
|
|
|
|
|
|
| 3.49% |
|
|
|
|
|
|
| 3.29% | ||||||||||||||||||||||||||||||
Net Interest Margin | 3.52 | % | 3.47 | % | 3.42 | % |
|
|
|
|
|
| 3.80% |
|
|
|
|
|
|
| 3.63% |
|
|
|
|
|
|
| 3.52% | ||||||||||||||||||||||||||||||
Interest and average rates are presented on a fully taxable equivalent basis, using an effective tax rate of 34%. For purposes of calculating loan yields, average loan balances include nonaccrual loans.
Loan fees of $701,000, $710,000,$1,020,000, $1,148,000, and $683,000$635,000 are included with interest income in Table 1 for the years 2011, 20102013, 2012 and 2009,2011, respectively.
25
MID PENN BANCORP, INC.Management’s Discussion and Analysis
TABLE 2: VOLUME ANALYSIS OF CHANGES IN NET INTEREST INCOME
| (Dollars in thousands) | 2011 Compared to 2010 | 2010 Compared to 2009 | ||||||||||||||||||||||
| Increase (Decrease) Due to Change In: | Increase (Decrease) Due to Change In: | |||||||||||||||||||||||
| Taxable Equivalent Basis | Volume | Rate | Net | Volume | Rate | Net | ||||||||||||||||||
INTEREST INCOME: | ||||||||||||||||||||||||
Interest Bearing Balances | $ | 94 | $ | (392 | ) | $ | (298 | ) | $ | 116 | $ | (758 | ) | $ | (642 | ) | ||||||||
Investment Securities: | ||||||||||||||||||||||||
Taxable | 1,227 | (395 | ) | 832 | 465 | (330 | ) | 135 | ||||||||||||||||
Tax-Exempt | 575 | (239 | ) | 336 | 75 | (170 | ) | (95 | ) | |||||||||||||||
|
|
|
|
|
|
|
|
|
|
|
| |||||||||||||
Total Investment Securities | 1,801 | (633 | ) | 1,168 | 540 | (500 | ) | 40 | ||||||||||||||||
Federal Funds Sold | 2 | (2 | ) | — | 27 | (3 | ) | 24 | ||||||||||||||||
Loans and Leases, Net | 186 | 450 | 636 | 519 | (1,114 | ) | (595 | ) | ||||||||||||||||
Restricted Investment Bank Stocks | — | — | — | — | (1 | ) | (1 | ) | ||||||||||||||||
|
|
|
|
|
|
|
|
|
|
|
| |||||||||||||
Total Interest Income | 2,083 | (577 | ) | 1,506 | 1,202 | (2,376 | ) | (1,174 | ) | |||||||||||||||
|
|
|
|
|
|
|
|
|
|
|
| |||||||||||||
INTEREST EXPENSE: | ||||||||||||||||||||||||
Interest Bearing Deposits: | ||||||||||||||||||||||||
NOW | 13 | 62 | 75 | 8 | 28 | 36 | ||||||||||||||||||
Money Market | 1,229 | (594 | ) | 635 | 1,202 | (228 | ) | 974 | ||||||||||||||||
Savings | 1 | (2 | ) | (1 | ) | — | (1 | ) | (1 | ) | ||||||||||||||
Time | (866 | ) | (653 | ) | (1,519 | ) | (560 | ) | (1,856 | ) | (2,416 | ) | ||||||||||||
|
|
|
|
|
|
|
|
|
|
|
| |||||||||||||
Total Interest Bearing Deposits | 376 | (1,186 | ) | (810 | ) | 650 | (2,057 | ) | (1,407 | ) | ||||||||||||||
Short-term Borrowings | �� | (14 | ) | — | (14 | ) | (90 | ) | (4 | ) | (94 | ) | ||||||||||||
Long-term Debt | (247 | ) | (49 | ) | (296 | ) | (959 | ) | (202 | ) | (1,161 | ) | ||||||||||||
|
|
|
|
|
|
|
|
|
|
|
| |||||||||||||
Total Interest Expense | 115 | (1,235 | ) | (1,120 | ) | (400 | ) | (2,262 | ) | (2,662 | ) | |||||||||||||
|
|
|
|
|
|
|
|
|
|
|
| |||||||||||||
NET INTEREST INCOME | $ | 1,968 | $ | 658 | $ | 2,626 | $ | 1,601 | $ | (113 | ) | $ | 1,488 | |||||||||||
|
|
|
|
|
|
|
|
|
|
|
| |||||||||||||
|
|
|
|
|
|
|
|
|
|
|
|
|
|
|
|
|
|
|
|
|
|
|
|
|
|
|
|
|
|
|
|
|
|
|
|
(Dollars in thousands) | 2013 Compared to 2012 |
| 2012 Compared to 2011 | ||||||||||||||
| Increase (Decrease) Due to Change In: |
| Increase (Decrease) Due to Change In: | ||||||||||||||
|
|
|
|
|
|
|
|
|
|
|
|
|
|
|
|
|
|
Taxable Equivalent Basis | Volume |
| Rate |
| Net |
| Volume |
| Rate |
| Net | ||||||
INTEREST INCOME: |
|
|
|
|
|
|
|
|
|
|
|
|
|
|
|
|
|
Interest Bearing Balances | $ | (102) |
| $ | (25) |
| $ | (127) |
| $ | (251) |
| $ | (33) |
| $ | (284) |
Investment Securities: |
|
|
|
|
|
|
|
|
|
|
|
|
|
|
|
|
|
Taxable |
| (363) |
|
| (174) |
|
| (537) |
|
| 380 |
|
| (858) |
|
| (478) |
Tax-Exempt |
| 527 |
|
| (225) |
|
| 302 |
|
| 1,132 |
|
| (538) |
|
| 594 |
Total Investment Securities |
| 164 |
|
| (399) |
|
| (235) |
|
| 1,512 |
|
| (1,396) |
|
| 116 |
|
|
|
|
|
|
|
|
|
|
|
|
|
|
|
|
|
|
Federal Funds Sold |
| (7) |
|
| 2 |
|
| (5) |
|
| (9) |
|
| - |
|
| (9) |
Loans and Leases, Net |
| 1,406 |
|
| (2,366) |
|
| (960) |
|
| 496 |
|
| (1,321) |
|
| (825) |
Restricted Investment Bank Stocks |
| - |
|
| 15 |
|
| 15 |
|
| - |
|
| 5 |
|
| 5 |
Total Interest Income |
| 1,462 |
|
| (2,774) |
|
| (1,312) |
|
| 1,748 |
|
| (2,745) |
|
| (997) |
|
|
|
|
|
|
|
|
|
|
|
|
|
|
|
|
|
|
INTEREST EXPENSE: |
|
|
|
|
|
|
|
|
|
|
|
|
|
|
|
|
|
Interest Bearing Deposits: |
|
|
|
|
|
|
|
|
|
|
|
|
|
|
|
|
|
NOW |
| 203 |
|
| (2) |
|
| 201 |
|
| 173 |
|
| 141 |
|
| 314 |
Money Market |
| (286) |
|
| (512) |
|
| (798) |
|
| (147) |
|
| (853) |
|
| (1,000) |
Savings |
| - |
|
| 1 |
|
| 1 |
|
| - |
|
| (1) |
|
| (1) |
Time |
| (643) |
|
| (472) |
|
| (1,115) |
|
| (747) |
|
| (928) |
|
| (1,675) |
Total Interest Bearing Deposits |
| (726) |
|
| (985) |
|
| (1,711) |
|
| (721) |
|
| (1,642) |
|
| (2,362) |
|
|
|
|
|
|
|
|
|
|
|
|
|
|
|
|
|
|
Short-term Borrowings |
| 27 |
|
| (4) |
|
| 23 |
|
| 1 |
|
| (2) |
|
| (1) |
Long-term Debt |
| (273) |
|
| (107) |
|
| (380) |
|
| (34) |
|
| - |
|
| (34) |
Total Interest Expense |
| (972) |
|
| (1,096) |
|
| (2,068) |
|
| (754) |
|
| (1,644) |
|
| (2,397) |
|
|
|
|
|
|
|
|
|
|
|
|
|
|
|
|
|
|
NET INTEREST INCOME | $ | 2,434 |
| $ | (1,678) |
| $ | 756 |
| $ | 2,502 |
| $ | (1,102) |
| $ | 1,400 |
The effect of changing volume and rate has been allocated entirely to the rate column. Tax-exempt income is shown on a tax equivalent basis assuming a federal income tax rate of 34%.
During 2011,2013, net interest income increased $2,626,000$756,000, or 12.8%3.1%, as compared to an increase of $1,488,000$1,400,000, or 7.8%6.1%, in 2010.2012. The average balances, effective interest differential, and interest yields for the years ended December 31, 2011, 2010,2013, 2012, and 20092011 and the components of net interest income, are presented in Table 1. A comparative presentation of the changes in net interest income for 20112013 compared to 2010,2012, and 20102012 compared to 2009,2011, is provided in Table 2. This analysis indicates the changes in interest income and interest expense caused by the volume and rate components of interest earning assets and interest bearing liabilities.
The yield on earning assets decreased to 4.97%4.56% in 20112013 from 5.28%4.69% in 2010.2012. The yield on earning assets for 20092011 was 5.82%4.97%. The change in the yield on earning assets was due primarily to changes in market interest rates and extreme rate competition within our market. The average “prime rate” for 2011, 2010,2013, 2012, and 20092011 was 3.25%. The yield on earning assets is also negatively impacted by the loss of interest on nonperforming loans. During 2011,2013, this loss of interest amounted to $2,200,000.$861,000. Had this interest been included in Mid Penn’s earnings, the yield on earning assets would have increased by 3413 basis points.
Interest expense decreased by $1,120,000,$2,068,000, or 10.5%29.0%, in 20112013 as compared to a decrease of $2,662,000,$2,397,000, or 20.0%25.2%, in 2010.2012. The cost of interest bearing liabilities decreased to 1.68%0.86% in 20112013 from 2.08%1.20% in 2010.2012. The cost of interest bearing liabilities for 20092011 was 2.81%1.68%. The reduction in the cost of interest bearing liabilities was due to changes in market interest rates and Mid Penn’s ability to reduce the rates on Money Market accounts and Certificates of Deposit.replace higher-cost time deposits with lower-cost demand deposits.
Net interest margin, on a tax equivalent basis was 3.80% in 2013 compared to 3.63% in 2012 and 3.52% in 2011 compared to 3.47% in 2010 and 3.42% in 2009.2011. The interest rate impact of earning assets and funding sources due to changes in interest rates can be reasonably estimated at current interest rate levels, the options selected
by customers, and the future mix of the loan, investment, and deposit products in the Bank’sBank's portfolios, may significantly change the estimates used in the simulation models. In addition, our net interest income may be impacted by further interest rate actions of the Federal Reserve Bank. Management continues to monitor the net interest margin closely.
26
MID PENN BANCORP, INC.Management’s Discussion and Analysis
Provision for Loan and Lease Losses
The provision for loan and lease losses is the expense necessary to maintain the allowance for loan and lease losses at a level adequate to absorb management’s estimate of probable losses in the loan and lease portfolio. Mid Penn’s provision for loan and lease losses is based upon management’s monthly review of the loan portfolio. The purpose of the review is to assess loan quality, identify impaired loans and leases, analyze delinquencies, ascertain loan and lease growth, evaluate potential charge-offs and recoveries, and assess general economic conditions in the markets we serve.
During 2011,2013, Mid Penn continued to experience a challenging economic and operating environment. Given the economic pressures that impact some borrowers, Mid Penn has maintained the allowance for loan and lease losses in accordance with Mid Penn’s assessment process, which took into consideration the risk characteristics of the loan and lease portfolio and shifting collateral values from December 31, 20102012 to December 31, 2011.2013. For the year ended December 31, 2011,2013, the provision for loan and lease losses was $1,205,000,$1,685,000, as compared to $2,635,000$1,036,000 for the year ended December 31, 2010.2012.
For the year ended December 31, 2011,2013, Mid Penn had net charge-offs of $1,494,000$877,000 compared to net charge-offs of $3,260,000$2,299,000 during the year ended December 31, 2010.2012. Loans charged off during 20112013 were comprised of 12 residential real estate loans totaling $310,000, 9 commercial and industrial loans totaling $546,000, 8 commercial real estate loans totaling $545,000,$936,000. Seven of these loans totaling $801,000 were to two borrowers with the remaining loans to unrelated borrowers. In addition, there were charge-offs for eight residential real estate loans to unrelated borrowers totaling $167,000, four commercial and 4 leasesindustrial loans to unrelated borrowers totaling $183,000, and one home equity loan representing $44,000$91,000 of the total charged off during 2011.2013. The remaining $142,000$96,000 was comprised primarily of various consumer loans. loans to unrelated borrowers.
During 2013, Mid Penn recovered $596,000 against loans previously charged off compared to $89,000 in 2012. The majority of the recoveries in 2013 were on six loans to unrelated borrowers totaling $531,000. Of these six loans, a total of $20,000 was recovered on two loans following regular repayment plans, $60,000 was recovered on a loan following the liquidation of collateral by the borrower on which the Bank could not establish a reliable value, and a $165,000 recovery was made on a charged off credit after a successful court challenge. Mid Penn recorded an additional $264,000 recovery following the sale of a large tract of land securing a charged down note and another $22,000 on a loan when the original borrower repurchased a property for more than the appraised value. The remaining $65,000 was recovered on a variety of loans to unrelated borrowers through ongoing collection efforts.
Mid Penn may need to make future adjustments to the allowance and the provision for loan and lease losses if economic conditions or loan credit quality differs substantially from the assumptions used in making Mid Penn’s evaluation of the level of the allowance for loan losses as compared to the balance of outstanding loans.
Following its model for loan and lease loss allowance adequacy, management recorded a $1,205,000$1,685,000 provision in 2011,2013, as well as a provision of $2,635,000$1,036,000 in 2010,2012, and $9,520,000$1,205,000 in 2009.2011. The allowance for loan and lease losses as a percentage of total loans was 1.16% at December 31, 2013, compared to 1.14% at December 31, 2012 and 1.40% at December 31, 2011, compared2011. Several factors contributed to 1.51%this increase in provision expense in 2013. First, the growth in the loan portfolio was substantial in 2013. This growth had a material impact on the amount of required reserves within the allowance for loan and lease losses from qualitative and quantitative factors. Secondly, total impaired loans increased $720,000, from $10,192,000 at December 31, 2010 and 1.60%2012 to $10,912,000 at December 31, 2009.
27
MID PENN BANCORP, INC.Management’s Discussion and Analysis
A summary of charge-offs and recoveries of loans and leases are presented in Table 3.
TABLE 3: ANALYSIS OF THE ALLOWANCE FOR LOAN AND LEASE LOSSES
| (Dollars in thousands) | Years ended December 31, | |||||||||||||||||||
| 2011 | 2010 | 2009 | 2008 | 2007 | ||||||||||||||||
Balance, beginning of year | $ | 7,061 | $ | 7,686 | $ | 5,505 | $ | 4,790 | $ | 4,187 | ||||||||||
Loans and leases charged off: | ||||||||||||||||||||
Commercial real estate, construction and land development | 545 | 1,413 | 2,841 | 384 | — | |||||||||||||||
Commercial, industrial and agricultural | 546 | 787 | 4,158 | 70 | 100 | |||||||||||||||
Real estate - residential | 310 | 858 | 115 | — | — | |||||||||||||||
Consumer | 142 | 146 | 209 | 188 | 231 | |||||||||||||||
Leases | 44 | 230 | 108 | 5 | 129 | |||||||||||||||
|
|
|
|
|
|
|
|
|
| |||||||||||
Total loans and leases charged off | 1,587 | 3,434 | 7,431 | 647 | 460 | |||||||||||||||
|
|
|
|
|
|
|
|
|
| |||||||||||
Recoveries on loans and leases previously charged off: | ||||||||||||||||||||
Commercial real estate, construction and land development | 26 | 21 | — | 1 | — | |||||||||||||||
Commercial, industrial and agricultural | 10 | 3 | 16 | 20 | 5 | |||||||||||||||
Real estate - residential | 19 | 70 | — | — | — | |||||||||||||||
Consumer | 32 | 80 | 76 | 111 | 49 | |||||||||||||||
Leases | 6 | — | — | — | 84 | |||||||||||||||
|
|
|
|
|
|
|
|
|
| |||||||||||
Total loans and leases recovered | 93 | 174 | 92 | 132 | 138 | |||||||||||||||
|
|
|
|
|
|
|
|
|
| |||||||||||
Net charge-offs | 1,494 | 3,260 | 7,339 | 515 | 322 | |||||||||||||||
|
|
|
|
|
|
|
|
|
| |||||||||||
Provision for loan and lease losses | 1,205 | 2,635 | 9,520 | 1,230 | 925 | |||||||||||||||
|
|
|
|
|
|
|
|
|
| |||||||||||
Balance, end of year | $ | 6,772 | $ | 7,061 | $ | 7,686 | $ | 5,505 | $ | 4,790 | ||||||||||
|
|
|
|
|
|
|
|
|
| |||||||||||
| Years ended December 31, | ||||||||||||||||||||
| 2011 | 2010 | 2009 | 2008 | 2007 | ||||||||||||||||
Ratio of net charge-offs during the year to average loans and leases outstanding during the year, net of unearned discount | 0.31 | % | 0.69 | % | 1.58 | % | 0.13 | % | 0.09 | % | ||||||||||
|
|
|
|
|
|
|
|
|
| |||||||||||
Allowance for loan and lease losses as a percentage of total loans and leases at December 31 | 1.40 | % | 1.51 | % | 1.60 | % | 1.27 | % | 1.27 | % | ||||||||||
|
|
|
|
|
|
|
|
|
| |||||||||||
Allowance for loan and lease losses as a percentage of non-performing assets at December 31 | 50.91 | % | 35.05 | % | 48.33 | % | 96.92 | % | 97.68 | % | ||||||||||
|
|
|
|
|
|
|
|
|
| |||||||||||
|
|
|
|
|
|
|
|
|
|
|
|
|
|
|
|
|
|
|
|
|
|
|
|
|
|
|
|
|
|
(Dollars in thousands) | Years ended December 31, | |||||||||||||
| 2013 |
| 2012 |
| 2011 |
| 2010 |
| 2009 | |||||
Balance, beginning of year | $ | 5,509 |
| $ | 6,772 |
| $ | 7,061 |
| $ | 7,686 |
| $ | 5,505 |
Loans and leases charged off: |
|
|
|
|
|
|
|
|
|
|
|
|
|
|
Commercial real estate, construction |
|
|
|
|
|
|
|
|
|
|
|
|
|
|
and land development |
| 936 |
|
| 499 |
|
| 545 |
|
| 1,413 |
|
| 2,841 |
Commercial, industrial and agricultural |
| 183 |
|
| 834 |
|
| 546 |
|
| 787 |
|
| 4,158 |
Real estate - residential |
| 167 |
|
| 195 |
|
| 310 |
|
| 858 |
|
| 115 |
Consumer |
| 187 |
|
| 860 |
|
| 142 |
|
| 146 |
|
| 209 |
Leases |
| - |
|
| - |
|
| 44 |
|
| 230 |
|
| 108 |
Total loans and leases charged off |
| 1,473 |
|
| 2,388 |
|
| 1,587 |
|
| 3,434 |
|
| 7,431 |
|
|
|
|
|
|
|
|
|
|
|
|
|
|
|
Recoveries on loans and leases previously |
|
|
|
|
|
|
|
|
|
|
|
|
|
|
charged off: |
|
|
|
|
|
|
|
|
|
|
|
|
|
|
Commercial real estate, construction |
|
|
|
|
|
|
|
|
|
|
|
|
|
|
and land development |
| 286 |
|
| 15 |
|
| 26 |
|
| 21 |
|
| - |
Commercial, industrial and agricultural |
| 193 |
|
| 31 |
|
| 10 |
|
| 3 |
|
| 16 |
Real estate - residential |
| 23 |
|
| - |
|
| 19 |
|
| 70 |
|
| - |
Consumer |
| 92 |
|
| 43 |
|
| 32 |
|
| 80 |
|
| 76 |
Leases |
| 2 |
|
| - |
|
| 6 |
|
| - |
|
| - |
Total loans and leases recovered |
| 596 |
|
| 89 |
|
| 93 |
|
| 174 |
|
| 92 |
|
|
|
|
|
|
|
|
|
|
|
|
|
|
|
Net charge-offs |
| 877 |
|
| 2,299 |
|
| 1,494 |
|
| 3,260 |
|
| 7,339 |
Provision for loan and lease losses |
| 1,685 |
|
| 1,036 |
|
| 1,205 |
|
| 2,635 |
|
| 9,520 |
Balance, end of year | $ | 6,317 |
| $ | 5,509 |
| $ | 6,772 |
| $ | 7,061 |
| $ | 7,686 |
|
|
|
|
|
|
|
|
|
|
|
|
|
|
|
|
|
|
|
|
| Years ended December 31, | ||||||||
| 2013 |
| 2012 |
| 2011 |
| 2010 |
| 2009 |
Ratio of net charge-offs during the year |
|
|
|
|
|
|
|
|
|
to average loans and leases outstanding during |
|
|
|
|
|
|
|
|
|
the year, net of unearned discount | 0.17% |
| 0.48% |
| 0.31% |
| 0.69% |
| 1.58% |
|
|
|
|
|
|
|
|
|
|
Allowance for loan and lease losses as a percentage |
|
|
|
|
|
|
|
|
|
of total loans and leases at December 31 | 1.16% |
| 1.14% |
| 1.40% |
| 1.51% |
| 1.60% |
|
|
|
|
|
|
|
|
|
|
Allowance for loan and lease losses as a percentage |
|
|
|
|
|
|
|
|
|
of non-performing assets at December 31 | 49.84% |
| 42.05% |
| 50.91% |
| 35.05% |
| 48.33% |
Noninterest Income
A summary
2013 versus 2012
Income from fiduciary activities for 2013 was $492,000, an $83,000, or 14.4%, decrease from $575,000 in 2012. This revenue source is comprised of fees generated by Mid Penn’s Trust department and fees from the major componentssale of noninterestthird-party mutual funds and annuities to the Bank’s retail and commercial customers. Fees from third-party mutual fund and annuity sales were $267,000 in 2013 and $389,000 in 2012. This decline in fee revenue is responsible for the variance from 2012.
Mid Penn recognized gains on sale of investment securities in 2013 of $220,000 and $267,000 in 2012 as a result of efforts to position the portfolio to provide improved earnings and cash flow in support of future loan growth.
Mortgage banking income suffered from increasing mortgage rates earlier in the year, which effectively shut off the flow of customers seeking to refinance their existing mortgages from higher rates. Mortgage banking income for the years ended December 31, 2011, 2010,2013 was $348,000, a decrease of $327,000, or 48.4%, from $675,000 in 2012.
28
MID PENN BANCORP, INC.Management’s Discussion and 2009 is foundAnalysis
Merchant services revenue increased to $330,000 in Table 4. During 2011, Mid Penn earned $2,996,000 in noninterest income,2013, an increase of $74,000, or 28.9%, compared to $3,414,000 earned$256,000 for 2012. Sales efforts in 2010this area were also very positive in 2013, adding to the enhanced revenue.
2012 versus 2011
Income from fiduciary activities for 2012 was $575,000, a $36,000, or 6.7%, increase from $539,000 in 2011. This revenue source is comprised of fees generated by Mid Penn’s Trust department and $3,656,000 earnedfees from the sale of third-party mutual funds and annuities to the Bank’s retail and commercial customers. Fees from third-party mutual fund and annuity sales were $389,000 in 2009.2012 and $354,000 in 2011.
Service charges on deposit accounts amounted to $704,000$565,000 for 2011,2012, a decrease of $435,000$139,000, or 38.2%19.7%, compared to $1,139,000$704,000 for 2010, which was a decrease of $340,000 or 23.0% below 2009.2011. The decrease in service charges in 20112012 occurred in spite of general growth in transaction accounts during 2011.2012. During this period of economic downturn, customers seem to have become more conscientious about their account balances and avoiding unnecessary charges related to insufficient funds. In addition to this behavioral change, Mid Penn was negatively impacted by regulatory changes contained in the Dodd-Frank Act governing overdraft charges, which has resulted in a reduction in NSF revenue.
Income from fiduciary activities for 2011 was $539,000, a $108,000 or 25.1% increase from $431,000 in 2010, which was a $14,000 or 3.4% increase from $417,000 in 2009. This revenue source is comprised of fees generated by Mid Penn’s Trust department and fees from thePenn recognized gains on sale of third-party mutual fundsinvestment securities in 2012 of $267,000 as a result of efforts to position the portfolio to provide improved earnings and annuities to the Bank’s retail and commercial customers. Trust department income for 2011 was $185,000, a $15,000 or 7.5% decrease from $200,000cash flow in 2010, which was a $43,000 or 17.7% decrease from $243,000 in 2009. Trust Department income can fluctuate from year to year, due to the numbersupport of estates settled during the year. Fees from third-party mutual fund and annuity sales were $354,000 in 2011, $231,000 in 2010, and $174,000 in 2009.future loan growth.
Mortgage banking income remained robust during the year ended December 31, 2011.2012. Historically low long-term mortgage rates triggered a wave of refinancing and increasing purchase activity, generating robust fee income from this line of business. Mortgage banking income for 2012 was $675,000, an increase of $285,000, or 73.1%, over $390,000 in 2011.
Merchant services revenue increased to $256,000 in 2012, an increase of $91,000, or 55.2%, compared to $165,000 for 2011. During 2011,2012, Mid Penn decidedsuccessfully renegotiated the revenue sharing contract with its vendor, significantly augmenting the revenue stream. Sales efforts in this area were also very positive in 2012, adding to the enhanced revenue.
TABLE 4: NONINTEREST INCOME
|
|
|
|
|
|
|
|
|
|
|
|
|
|
|
|
|
|
(Dollars in thousands) | Years ended December 31, | |||||||
| 2013 |
| 2012 |
| 2011 | |||
Income from fiduciary activities | $ | 492 |
| $ | 575 |
| $ | 539 |
Service charges on deposits |
| 576 |
|
| 565 |
|
| 704 |
Net gain on sales of investment securities |
| 220 |
|
| 267 |
|
| - |
Earnings from cash surrender value of life insurance |
| 231 |
|
| 247 |
|
| 258 |
Mortgage banking income |
| 348 |
|
| 675 |
|
| 390 |
ATM debit card interchange income |
| 508 |
|
| 472 |
|
| 452 |
Merchant services revenue |
| 330 |
|
| 256 |
|
| 165 |
Other income |
| 585 |
|
| 626 |
|
| 488 |
Total Noninterest Income | $ | 3,290 |
| $ | 3,683 |
| $ | 2,996 |
Noninterest Expense
2013 versus 2012
Salaries and employee benefits represent the major component of noninterest expense. During 2013, increases in the workforce primarily included adding experienced team members to add approximately $1,960,000 in secondary market qualified loansdepth to the loan portfolio.sales and support areas of Mid Penn. In 2013, Mid Penn also recognized a full year of salary and employee benefits expense from the 2012 additions within the support functions throughout the Corporation to enhance controls and support future growth. Commissions paid to employees in the retail investment and mortgage banking lines of business in 2013 were down $192,000 from 2012 due to reduced activity in both of these business lines.
FDIC Assessment decreased $548,000 to $486,000 in 2013. Prior to 2011, assessments were calculated based on the total deposits of a financial institution. Beginning in the second quarter of 2011, the assessment base was changed from deposits to average total assets less tangible equity. This resulted in significant savings for Mid Penn. In addition, 2013 reflects the recognition of a slight declinerefund of $139,000 in mortgage banking incomeoverbillings from the FDIC due to $390,000an error by the FDIC in 2011Mid Penn’s assessment calculation.
Legal and professional fees increased to $705,000 in 2013 from $423,000$604,000 in 2010.2012. This increase was primarily related to consultants used in the information technology area to improve the Bank’s network capabilities and successfully migrate to a service bureau processing environment.
Software licensing increased from $648,000 in 2012 to $947,000 in 2013. During 2013, Mid Penn owns cash surrender valueincurred one-time charges of life insurance policies on$26,000 associated with the migration its directors. The income on these policies amountedcore banking data processing software from an in-house environment to $258,000 duringa service bureau hosted platform. This migration allowed for staffing reductions in the information technology and operations areas of $39,000 for part of the year 2011, $270,000 in 2010,2013. The
29
MID PENN BANCORP, INC.Management’s Discussion and $280,000 in 2009. In additionAnalysis
remaining increase is due to new service contracts on software to comply with various regulatory requirements and to expand the income on these life insurance policies, Bank’s online loan and deposit application capabilities.
Mid Penn recognized a gain on life insurance proceedssale or write-down on foreclosed assets of $302,000 in 20092013. During 2013, Mid Penn recognized a gain of $158,000 from$340,000 on the deathsale of a retired director in February 2009.
Other income amountedrepossessed property. This gain was offset by Mid Penn’s ongoing analysis of the carrying values of repossessed properties and the adjustment of their values to $1,105,000 in 2011, $1,151,000 in 2010, and $1,198,000 in 2009.
TABLE 4: NONINTEREST INCOMEcurrent market rates.
| (Dollars in thousands) | Years ended December 31, | |||||||||||
| 2011 | 2010 | 2009 | ||||||||||
Income from fiduciary activities | $ | 539 | $ | 431 | $ | 417 | ||||||
Service charges on deposits | 704 | 1,139 | 1,479 | |||||||||
Investment securities gains, net | — | — | — | |||||||||
Earnings from cash surrender value of life insurance | 258 | 270 | 280 | |||||||||
Gain on life insurance proceeds | — | — | 158 | |||||||||
Mortgage banking income | 390 | 423 | 124 | |||||||||
Merchant services revenue | 165 | 141 | 128 | |||||||||
ATM debit card interchange income | 452 | 408 | 341 | |||||||||
Other income | 488 | 602 | 729 | |||||||||
|
|
|
|
|
| |||||||
Total Noninterest Income | $ | 2,996 | $ | 3,414 | $ | 3,656 | ||||||
|
|
|
|
|
| |||||||
Noninterest Expense
A summary of the major components of noninterest expense for the years ended December 31, 2011, 2010, and 2009 is reflectedLoan collection costs decreased to $214,000 in Table 5. Noninterest2013 from $369,000 in 2012. OREO expense increased to $18,048,000$290,000 in 20112013 from $17,121,000$253,000 in 20102012. These items represent the costs associated with working through collection efforts on the pool of nonperforming assets within the loan portfolio. While decreasing in total during 2013, they continue to be at historically elevated levels due to the size and $16,671,000nature of the nonperforming assets pool.
ATM debit card processing and internet banking expenses have both increased in 2009.recent years due to increasing customer demand for these banking services.
2012 versus 2011
The major component of noninterest expense is salaries and employee benefits. Increases in the 20112012 workforce primarily included additionsadding experienced team members to complianceadd depth to the sales and operations support functions within Mid Penn, in order to provide enhanced controls and procedures to support a more sophisticated product line and customer base. The escalating compliance and regulatory burden experienced by banks throughout the industry necessitated the hiring of dedicated compliance staff as well as dedicating resources from support areas throughoutand bolster compliance functions of Mid Penn to complying with the expanding regulatory changes.Penn. Mid Penn also recognized in 20112012 a full year of salary and employee benefits expense from the 20102011 additions within the support functions throughout the Corporation to enhance controls and support future growth. During 2011,2012, medical benefits increased $126,000$184,000 from 2010 levels.2011 levels, primarily due to the increase in actual medical claims experienced from Mid Penn’s self-funded medical insurance plan. In addition, commission-based compensation paid to mortgage originators and retail investment representatives increased $107,000$144,000 from 2010 levels.2011 levels and are reflective of the enhanced revenues generated from these lines of business.
Occupancy
Legal and equipment expenses alsoprofessional fees increased from $444,000 in 2011 primarilyto $604,000 in connection with utility and snow removal costs from the harsh winter months early in the year.
FDIC insurance expense increased in 2011, closing the year at $1,057,000 as compared to $897,000 during 2010. The historically high levels of FDIC insurance expense during 2009, 2010, and 2011 stem from the escalation in Deposit Insurance premiums assessed by the FDIC on all its member banks to restore the Deposit Insurance Fund and keep it solvent to handle future bank failures should they occur. Mid Penn’s premium level was also negatively impacted by the increase in assets used in the calculation of Deposit Insurance premiums.
Computer expense increased from $578,000 in 2010 to $697,000 in 2011.2012. Mid Penn has been making significant enhancements to technology platforms to enhance efficiencies withinincurred elevated legal fees in 2012 stemming from coordination with the support departments and enable updated products and services to customers. These charges reflectU.S. Treasury on the ongoing service contracts for these enhancements.
Internet banking expense increased to $195,000 in 2011 from $138,000 in 2010. A major focus throughout 2010 was the implementation of an enhanced website and internet banking platform. The cost of providing enhanced functionality is reflected in this line item and is partrepayment of Mid Penn’s effortsCapital Purchase Program funds and the buyout of the related warrants. In addition, Mid Penn engaged a computer consultant to provideperform an evaluation of the core computer system and its ancillary programs as a robust suite of technology-related products and services to the marketplace.resource in making future enhancement decisions.
The final significant item was the loss
Loss on sale or write-down on foreclosed assets of ($20,000)increased to $96,000 in 2011 and $283,000 in 2010.2012. During 2010,2012, this item increased as a result of Mid Penn’s ongoing analysis of the carrying values of repossessed properties and the adjustment of their values to current market ratesrates.
Loan collection costs increased to $369,000 in 2012 from $299,000 in 2011. OREO expense increased to $253,000 in 2012 from $161,000 in 2011. These items have risen as Mid Penn continues to work through collection efforts on the facepool of nonperforming assets within the overall declineloan portfolio.
ATM debit card processing and internet banking expenses have both increased in real estate values plaguingrecent years due to increasing customer demand for these banking services.
During 2012, Mid Penn reached the real estate market. In 2011,end of a three year contract for its insurance coverage and experienced an increase in premium costs upon renewal of its policies. Also during 2012, Mid Penn made increasing use of temporary employees to finalize the carrying values on repossessed properties have stabilizedconversion of loan and some small gains have been realizedcredit documents from paper storage to an electronic storage mechanism, significantly reducing the ongoing liquidation ofneed for floor space and fire protection safeguards for these properties.documents.
30
MID PENN BANCORP, INC.Management’s Discussion and Analysis
TABLE 5: NONINTEREST EXPENSE
| (Dollars in thousands) | Years ended December 31, | |||||||||||
| 2011 | 2010 | 2009 | ||||||||||
Salaries and employee benefits | $ | 9,519 | $ | 8,760 | $ | 8,173 | ||||||
Occupancy expense, net | 1,075 | 916 | 844 | |||||||||
Equipment expense | 1,292 | 1,361 | 1,170 | |||||||||
Pennsylvania Bank Shares tax expense | 449 | 443 | 366 | |||||||||
FDIC Assessment | 1,057 | 897 | 1,163 | |||||||||
Legal and Professional fees | 444 | 529 | 814 | |||||||||
Director fees and benefits expense | 304 | 303 | 291 | |||||||||
Marketing and advertising expense | 354 | 308 | 679 | |||||||||
Computer expense | 697 | 578 | 393 | |||||||||
Telephone expense | 377 | 362 | 344 | |||||||||
(Gain) loss / write-down on sale of foreclosed assets | (20 | ) | 283 | 110 | ||||||||
Core deposit intangible amortization | 65 | 65 | 65 | |||||||||
Stationery and supplies expense | 166 | 156 | 151 | |||||||||
Postage expense | 167 | 172 | 156 | |||||||||
Courier expense | 30 | 60 | 96 | |||||||||
Meals, travel, and lodging expense | 228 | 211 | 200 | |||||||||
Correspondent service charge expense | 79 | 87 | 95 | |||||||||
Contributions expense | 77 | 35 | 77 | |||||||||
ATM debit card processing expense | 152 | 122 | 126 | |||||||||
Internet banking expense | 195 | 138 | 88 | |||||||||
Other expenses | 1,341 | 1,335 | 1,270 | |||||||||
|
|
|
|
|
| |||||||
Total Noninterest Expense | $ | 18,048 | $ | 17,121 | $ | 16,671 | ||||||
|
|
|
|
|
| |||||||
|
|
|
|
|
|
|
|
|
|
|
|
|
|
|
|
|
|
(Dollars in thousands) | Years ended December 31, | |||||||
| 2013 |
| 2012 |
| 2011 | |||
Salaries and employee benefits | $ | 10,788 |
| $ | 10,518 |
| $ | 9,519 |
Occupancy expense, net |
| 1,128 |
|
| 1,077 |
|
| 1,075 |
Equipment expense |
| 1,299 |
|
| 1,234 |
|
| 1,292 |
Pennsylvania Bank Shares tax expense |
| 464 |
|
| 462 |
|
| 449 |
FDIC Assessment |
| 486 |
|
| 1,034 |
|
| 1,057 |
Legal and Professional fees |
| 705 |
|
| 604 |
|
| 444 |
Director fees and benefits expense |
| 319 |
|
| 335 |
|
| 304 |
Marketing and advertising expense |
| 253 |
|
| 378 |
|
| 354 |
Software licensing |
| 947 |
|
| 648 |
|
| 697 |
Telephone expense |
| 436 |
|
| 411 |
|
| 377 |
(Gain) loss / write-down on sale of foreclosed assets |
| (302) |
|
| 96 |
|
| (20) |
Intangible amortization |
| 29 |
|
| 45 |
|
| 65 |
Loan collection costs |
| 214 |
|
| 369 |
|
| 299 |
ATM debit card processing expense |
| 202 |
|
| 171 |
|
| 152 |
Internet banking expense |
| 252 |
|
| 240 |
|
| 195 |
Meals, travel, and lodging expense |
| 271 |
|
| 266 |
|
| 228 |
Insurance |
| 129 |
|
| 126 |
|
| 86 |
OREO expense |
| 290 |
|
| 253 |
|
| 161 |
Investor services |
| 68 |
|
| 76 |
|
| 72 |
Contract labor |
| 55 |
|
| 42 |
|
| - |
Other expenses |
| 1,358 |
|
| 1,308 |
|
| 1,242 |
Total Noninterest Expense | $ | 19,391 |
| $ | 19,693 |
| $ | 18,048 |
Investments
Mid Penn’s investment portfolio is utilized to provide liquidity and managed to maximize return within reasonable risk parameters.
Mid Penn’s entire portfolio of investment securities is considered available for sale. As such, the investments are recorded at fair value. Our investments are valued at a market price relative to investments of the same type with similar maturity dates. As the interest rate environment of these securities changes, the value of securities changes accordingly.
As of December 31, 2011,2013, the unrealized loss on investment securities resulted in a decrease in shareholders’ equity of $747,000 (unrealized loss on securities of $1,132,000 plus estimated income tax benefit of $385,000). At December 31, 2012, the unrealized gain on investment securities resulted in an increase in shareholders’ equity of $2,044,000$2,432,000 (unrealized gain on securities of $3,096,000$3,685,000 less estimated income tax expense of $1,052,000). At December 31, 2010, the unrealized gain on investment securities resulted in an increase in shareholders’ equity of $176,000 (unrealized gain on securities of $266,000 less estimated income tax expense of $90,000) compared to a December 31, 2009 increase in the unrealized gain included in other comprehensive income of $817,000 (unrealized gain on securities of $1,238,000 less estimated income tax expense of $421,000)$1,253,000). Mid Penn does not have any significant concentrations within its portfolio of investment securities. Table 6 provides a summary of our available for sale investment securities.
TABLE 6: FAIR VALUE OF INVESTMENT SECURITIES
| (Dollars in thousands) | December 31, | |||||||||||
| 2011 | 2010 | 2009 | ||||||||||
U.S. Treasury and U.S. government agencies | $ | 27,617 | $ | 17,394 | $ | 15,700 | ||||||
Mortgage-backed U.S. government agencies | 82,668 | 25,387 | 4,619 | |||||||||
State and political subdivision obligations | 48,366 | 27,678 | 26,781 | |||||||||
Equity securities | 392 | 243 | 245 | |||||||||
|
|
|
|
|
| |||||||
| $ | 159,043 | $ | 70,702 | $ | 47,345 | |||||||
|
|
|
|
|
| |||||||
|
|
|
|
|
|
|
|
|
|
|
|
|
|
|
|
|
|
(Dollars in thousands) | December 31, | |||||||
| 2013 |
| 2012 |
| 2011 | |||
U.S. Treasury and U.S. government agencies | $ | 12,834 |
| $ | 17,740 |
| $ | 27,617 |
Mortgage-backed U.S. government agencies |
| 39,392 |
|
| 66,686 |
|
| 82,668 |
State and political subdivision obligations |
| 69,038 |
|
| 69,479 |
|
| 48,366 |
Equity securities |
| 1,539 |
|
| 390 |
|
| 392 |
| $ | 122,803 |
| $ | 154,295 |
| $ | 159,043 |
31
MID PENN BANCORP, INC.Management’s Discussion and Analysis
Maturity and yield information relating to the investment portfolio is shown in Table 7.
TABLE 7: INVESTMENT MATURITY AND YIELD
| (Dollars in thousands) | After One | After Five | ||||||||||||||||||
| As of December 31, 2011 | One Year | Year thru | Years thru | After Ten | ||||||||||||||||
| and Less | Five Years | Ten Years | Years | Total | ||||||||||||||||
U.S. Treasury and U.S. government agencies | $ | 2,011 | $ | 19,726 | $ | 5,880 | $ | — | $ | 27,617 | ||||||||||
Mortgage-backed U.S. government agencies | 1 | — | 9,961 | 72,706 | 82,668 | |||||||||||||||
State and political subdivision obligations | 565 | 5,130 | 13,099 | 29,572 | 48,366 | |||||||||||||||
Equity securities | — | — | — | 392 | 392 | |||||||||||||||
|
|
|
|
|
|
|
|
|
| |||||||||||
| $ | 2,577 | $ | 24,856 | $ | 28,940 | $ | 102,670 | $ | 159,043 | |||||||||||
|
|
|
|
|
|
|
|
|
| |||||||||||
| After One | After Five | |||||||||||||||||||
| One Year | Year thru | Years thru | After Ten | |||||||||||||||||
| and Less | Five Years | Ten Years | Years | Total | ||||||||||||||||
Weighted Average Yields | ||||||||||||||||||||
U.S. Treasury and U.S. government agencies | 0.99 | % | 2.62 | % | 4.77 | % | — | 2.96 | % | |||||||||||
Mortgage-backed U.S. government agencies | 5.51 | % | — | 4.36 | % | 4.64 | % | 4.61 | % | |||||||||||
State and political subdivision obligations | 7.38 | % | 6.62 | % | 5.67 | % | 5.39 | % | 5.62 | % | ||||||||||
Equity securities | — | — | — | 3.46 | % | 3.46 | % | |||||||||||||
|
|
|
|
|
|
|
|
|
| |||||||||||
| 2.39 | % | 3.45 | % | 5.04 | % | 4.85 | % | 4.63 | % | |||||||||||
|
|
|
|
|
|
|
|
|
| |||||||||||
|
|
|
|
|
|
|
|
|
|
|
|
|
|
|
|
|
|
|
|
|
|
|
|
|
|
|
|
|
|
(Dollars in thousands) |
|
|
| After One |
| After Five |
|
|
|
|
|
| ||
As of December 31, 2013 | One Year |
| Year thru |
| Years thru |
| After Ten |
|
|
| ||||
| and Less |
| Five Years |
| Ten Years |
| Years |
| Total | |||||
U.S. Treasury and U.S. government agencies | $ | - |
| $ | 12,834 |
| $ | - |
| $ | - |
| $ | 12,834 |
Mortgage-backed U.S. government agencies |
| - |
|
| 415 |
|
| 3,845 |
|
| 35,132 |
|
| 39,392 |
State and political subdivision obligations |
| - |
|
| 6,977 |
|
| 26,596 |
|
| 35,465 |
|
| 69,038 |
Equity securities |
| - |
|
| 1,020 |
|
| - |
|
| 519 |
|
| 1,539 |
| $ | - |
| $ | 21,246 |
| $ | 30,441 |
| $ | 71,116 |
| $ | 122,803 |
|
|
|
|
|
|
|
|
|
|
|
|
|
|
|
|
|
|
|
|
|
|
| After One |
| After Five |
|
|
|
|
| One Year |
| Year thru |
| Years thru |
| After Ten |
|
|
Weighted Average Yields | and Less |
| Five Years |
| Ten Years |
| Years |
| Total |
U.S. Treasury and U.S. government agencies | - |
| 3.44% |
| - |
| - |
| 3.44% |
Mortgage-backed U.S. government agencies | - |
| 3.88% |
| 4.06% |
| 4.17% |
| 4.16% |
State and political subdivision obligations | - |
| 5.52% |
| 4.81% |
| 4.90% |
| 4.93% |
Equity securities | - |
| 6.38% |
| - |
| 2.76% |
| 5.16% |
| - |
| 4.27% |
| 4.72% |
| 4.52% |
| 4.53% |
Loans
At December 31, 2011,2013, loans and leases totaled $482,717,000;$546,462,000, a $14,982,000$62,242,000 or 3.2%12.9% increase from December 31, 2010.2012. During 2011,2013, Mid Penn experienced a net increase in commercial real estate, commercial/industrial, and commercial/industrialresidential real estate loans of approximately $4,650,000.$64,060,000. This increase was attributed to the result of an increase in business lending opportunities to credit-worthy borrowers within the markets Mid Penn serves as well as enhancements to the lending sales team during the latter portion of 2011. Mid Penn also experienced an increase in residential real estate loans of approximately $10,798,000 during 2011 as real estate values stabilized and borrowers felt more comfortable refinancing higher-priced debt. Mid Penn added $7,143,000 in conventional residential mortgages within the loan portfolio as an alternative to purchasing lower-yielding investment securities as part of this increase.2013.
At December 31, 2011,2013, loans, net of unearned income, represented 71.0%80.2% of earning assets as compared to 78.3%72.4% on December 31, 2010,2012, and 84.8%71.0% on December 31, 2009.2011.
The Bank’sBank's loan portfolio is diversified among individuals and small and medium-sized businesses generally located within the Bank’sBank's trading area of Dauphin County, lower Northumberland County, western Schuylkill County and eastern Cumberland County. Commercial real estate, construction and land development loans are collateralized mainly by mortgages on the income-producing real estate or land involved. Commercial, industrial and agricultural loans are made to business entities and may be secured by business assets, including commercial real estate, or may be unsecured. Residential real estate loans are secured by liens on the residential property. Consumer loans include installment loans, lines of credit and home equity loans. The Bank has no concentration of credit to any one borrower. The Bank’s highest concentration of credit is in Commercial Real Estate financings.
32
MID PENN BANCORP, INC.Management’s Discussion and Analysis
A distribution of the Bank’sBank's loan portfolio according to major loan classification is shown in Table 8.
TABLE 8: LOAN PORTFOLIO
|
|
|
|
|
|
|
|
|
|
|
|
|
|
|
|
|
|
|
|
|
| ||||||||||||||||||||||||||||||||||||||||||||
|
|
|
|
|
|
|
|
|
|
|
|
|
|
|
|
|
|
|
|
|
|
|
|
| |||||||||||||||||||||||||||||||||||||||||
| (Dollars in thousands) | December 31, |
| December 31, | ||||||||||||||||||||||||||||||||||||||||||||||||||||||||||||||
| 2011 | 2010 | 2009 | 2008 | 2007 |
| 2013 |
| 2012 |
| 2011 |
|
|
| 2010 |
|
|
| 2009 |
|
| |||||||||||||||||||||||||||||||||||||||||||||
| Amount | % | Amount | % | Amount | % | Amount | % | Amount | % |
| Amount |
| % |
| Amount |
| % |
| Amount |
| % |
| Amount |
| % |
| Amount |
| % | ||||||||||||||||||||||||||||||||||||
Commercial real estate, construction and land development | $ | 249,204 | 51.6 | $ | 252,915 | 54.0 | $ | 253,878 | 52.8 | $ | 234,762 | 53.9 | $ | 197,192 | 52.1 | ||||||||||||||||||||||||||||||||||||||||||||||||||
Commercial, industrial and agricultural | 78,656 | 16.3 | 70,295 | 15.0 | 85,795 | 17.8 | 71,385 | 16.4 | 65,421 | 17.3 | |||||||||||||||||||||||||||||||||||||||||||||||||||||||
Commercial real estate, |
|
|
|
|
|
|
|
|
|
|
|
|
|
|
|
|
|
|
|
|
|
|
|
|
| ||||||||||||||||||||||||||||||||||||||||
construction and land |
|
|
|
|
|
|
|
|
|
|
|
|
|
|
|
|
|
|
|
|
|
|
|
|
| ||||||||||||||||||||||||||||||||||||||||
development |
| $ | 274,279 |
| 50.2 |
| $ | 255,231 |
| 52.7 |
| $ | 249,204 |
| 51.6 |
| $ | 252,915 |
| 54.0 |
| $ | 253,878 |
| 52.8 | ||||||||||||||||||||||||||||||||||||||||
Commercial, industrial |
|
|
|
|
|
|
|
|
|
|
|
|
|
|
|
|
|
|
|
|
|
|
|
|
| ||||||||||||||||||||||||||||||||||||||||
and agricultural |
|
| 107,492 |
| 19.7 |
|
| 79,228 |
| 16.4 |
|
| 78,656 |
| 16.3 |
|
| 70,295 |
| 15.0 |
|
| 85,795 |
| 17.8 | ||||||||||||||||||||||||||||||||||||||||
Real estate - residential | 146,846 | 30.4 | 136,048 | 29.1 | 128,522 | 26.7 | 118,547 | 27.2 | 106,141 | 28.0 |
|
| 160,294 |
| 29.3 |
|
| 143,243 |
| 29.6 |
|
| 146,846 |
| 30.4 |
|
| 136,048 |
| 29.1 |
|
| 128,522 |
| 26.7 | ||||||||||||||||||||||||||||||
Consumer | 8,327 | 1.7 | 8,922 | 1.9 | 12,884 | 2.7 | 11,103 | 2.5 | 9,987 | 2.6 |
|
| 4,646 |
| 0.8 |
|
| 6,770 |
| 1.4 |
|
| 8,327 |
| 1.7 |
|
| 8,922 |
| 1.9 |
|
| 12,884 |
| 2.7 | ||||||||||||||||||||||||||||||
|
|
|
|
|
|
|
|
|
| ||||||||||||||||||||||||||||||||||||||||||||||||||||||||
Total Loans | 483,033 | 100.0 | 468,180 | 100.0 | 481,079 | 100.0 | 435,797 | 100.0 | 378,741 | 100.0 |
|
| 546,711 |
| 100.0 |
|
| 484,472 |
| 100.0 |
|
| 483,033 |
| 100.0 |
|
| 468,180 |
| 100.0 |
|
| 481,079 |
| 100.0 | ||||||||||||||||||||||||||||||
|
|
|
|
|
|
|
|
|
| ||||||||||||||||||||||||||||||||||||||||||||||||||||||||
Unearned income | (316 | ) | (445 | ) | (694 | ) | (1,154 | ) | (1,613 | ) |
|
| (249) |
|
|
|
| (252) |
|
|
|
| (316) |
|
|
|
| (445) |
|
|
|
| (694) |
|
| ||||||||||||||||||||||||||||||
|
|
|
|
| |||||||||||||||||||||||||||||||||||||||||||||||||||||||||||||
Loans net of unearned discount | 482,717 | 467,735 | 480,385 | 434,643 | 377,128 | ||||||||||||||||||||||||||||||||||||||||||||||||||||||||||||
Allowance for loan and lease losses | (6,772 | ) | (7,061 | ) | (7,686 | ) | (5,505 | ) | (4,790 | ) | |||||||||||||||||||||||||||||||||||||||||||||||||||||||
|
|
|
|
| |||||||||||||||||||||||||||||||||||||||||||||||||||||||||||||
Loans net of unearned |
|
|
|
|
|
|
|
|
|
|
|
|
|
|
|
|
|
|
|
|
|
|
|
|
| ||||||||||||||||||||||||||||||||||||||||
discount |
|
| 546,462 |
|
|
|
| 484,220 |
|
|
|
| 482,717 |
|
|
|
| 467,735 |
|
|
|
| 480,385 |
|
| ||||||||||||||||||||||||||||||||||||||||
Allowance for loan and |
|
|
|
|
|
|
|
|
|
|
|
|
|
|
|
|
|
|
|
|
|
|
|
|
| ||||||||||||||||||||||||||||||||||||||||
lease losses |
|
| (6,317) |
|
|
|
| (5,509) |
|
|
|
| (6,772) |
|
|
|
| (7,061) |
|
|
|
| (7,686) |
|
| ||||||||||||||||||||||||||||||||||||||||
Net loans | $ | 475,945 | $ | 460,674 | $ | 472,699 | $ | 429,138 | $ | 372,338 |
| $ | 540,145 |
|
|
| $ | 478,711 |
|
|
| $ | 475,945 |
|
|
| $ | 460,674 |
|
|
| $ | 472,699 |
|
| ||||||||||||||||||||||||||||||
|
|
|
|
| |||||||||||||||||||||||||||||||||||||||||||||||||||||||||||||
Mid Penn’s maturity and rate sensitivity information related to the loan portfolio is reflected in Table 9.
TABLE 9: LOAN MATURITY AND INTEREST SENSITIVITY
| (Dollars in thousands) | After One | |||||||||||||||
| As of December 31, 2011 | One Year | Year thru | After Five | |||||||||||||
| and Less | Five Years | Years | Total | |||||||||||||
Commercial real estate, construction and land development | $ | 20,911 | $ | 26,303 | $ | 201,990 | $ | 249,204 | ||||||||
Commercial, industrial and agricultural | $ | 8,725 | 50,565 | 19,366 | 78,656 | |||||||||||
Real estate - residential mortgages | 13,830 | 35,070 | 97,946 | 146,846 | ||||||||||||
Consumer | 2,785 | 3,543 | 1,683 | 8,011 | ||||||||||||
|
|
|
|
|
|
|
| |||||||||
| $ | 46,251 | $ | 115,481 | $ | 320,985 | $ | 482,717 | |||||||||
|
|
|
|
|
|
|
| |||||||||
Rate Sensitivity | ||||||||||||||||
Predetermined rate | $ | 45,820 | $ | 109,446 | $ | 114,543 | $ | 269,809 | ||||||||
Floating or adjustable rate | 431 | 6,035 | 206,442 | 212,908 | ||||||||||||
|
|
|
|
|
|
|
| |||||||||
| $ | 46,251 | $ | 115,481 | $ | 320,985 | $ | 482,717 | |||||||||
|
|
|
|
|
|
|
| |||||||||
|
|
|
|
|
|
|
|
|
|
|
|
|
|
|
|
|
|
|
|
|
|
|
|
(Dollars in thousands) |
|
|
| After One |
|
|
|
|
|
| |
As of December 31, 2013 | One Year |
| Year thru |
| After Five |
|
|
| |||
| and Less |
| Five Years |
| Years |
| Total | ||||
Commercial real estate, construction |
|
|
|
|
|
|
|
|
|
|
|
and land development | $ | 18,323 |
| $ | 44,063 |
| $ | 211,893 |
| $ | 274,279 |
Commercial, industrial and |
|
|
|
|
|
|
|
|
|
|
|
agricultural |
| 41,892 |
|
| 33,058 |
|
| 32,542 |
|
| 107,492 |
Real estate - residential mortgages |
| 6,876 |
|
| 19,284 |
|
| 134,134 |
|
| 160,294 |
Consumer |
| 1,150 |
|
| 2,392 |
|
| 855 |
|
| 4,397 |
| $ | 68,241 |
| $ | 98,797 |
| $ | 379,424 |
| $ | 546,462 |
|
|
|
|
|
|
|
|
|
|
|
|
|
|
|
|
|
|
|
|
|
|
|
|
Rate Sensitivity |
|
|
|
|
|
|
|
|
|
|
|
Predetermined rate | $ | 67,197 |
| $ | 83,488 |
| $ | 253,620 |
| $ | 404,305 |
Floating or adjustable rate |
| 1,044 |
|
| 15,309 |
|
| 125,804 |
|
| 142,157 |
| $ | 68,241 |
| $ | 98,797 |
| $ | 379,424 |
| $ | 546,462 |
Credit Quality, Credit Risk, and Allowance for Loan and Lease Losses
Other than as described herein, we do not believe there are any trends, events or uncertainties that are reasonably expected to have a material impact on future results of operations, liquidity, or capital resources. Further, based on known information, we believe that the effects of current and past economic conditions and other unfavorable business conditions may influence certain borrowers’ abilities to comply with their repayment terms. Mid Penn continues to monitor closely the financial strength of these borrowers. Mid Penn does not engage in practices which may be used to artificially shield certain borrowers from the negative economic or business cycle effects that may compromise their ability to repay. Mid Penn does not normally structure construction loans with interest reserve components. Mid Penn has not in the past performed any commercial real estate or other type loan workouts whereby an existing loan was restructured into multiple new loans. Also, Mid Penn does not extend loans at maturity solely due to the existence of guarantees, without recognizing the credit as impaired. While the existence of a guarantee may be a mitigating factor in determining the proper level of allowance once impairment has been identified, the guarantee does not affect the impairment analysis.
33
MID PENN BANCORP, INC.Management’s Discussion and Analysis
TABLE 10: NONPERFORMING ASSETS
| (Dollars in thousands) | December 31, | |||||||||||||||||||
| 2011 | 2010 | 2009 | 2008 | 2007 | ||||||||||||||||
Nonperforming Assets: | ||||||||||||||||||||
Nonaccrual loans | $ | 11,800 | $ | 17,228 | $ | 14,933 | $ | 4,113 | $ | 4,317 | ||||||||||
Loans renegotiated with borrowers | 571 | 2,323 | 308 | 51 | — | |||||||||||||||
|
|
|
|
|
|
|
|
|
| |||||||||||
Total nonperforming loans | 12,371 | 19,551 | 15,241 | 4,164 | 4,317 | |||||||||||||||
Foreclosed real estate | 931 | 596 | 663 | 1,516 | 528 | |||||||||||||||
Other repossessed property | — | — | — | — | 59 | |||||||||||||||
|
|
|
|
|
|
|
|
|
| |||||||||||
Total non-performing assets | 13,302 | 20,147 | 15,904 | 5,680 | 4,904 | |||||||||||||||
Accruing loans 90 days or more past due | — | 19 | 661 | 1,860 | 2,439 | |||||||||||||||
|
|
|
|
|
|
|
|
|
| |||||||||||
Total risk elements | $ | 13,302 | $ | 20,166 | $ | 16,565 | $ | 7,540 | $ | 7,343 | ||||||||||
|
|
|
|
|
|
|
|
|
| |||||||||||
Nonperforming loans as a % of total loans outstanding | 2.56 | % | 4.18 | % | 3.17 | % | 0.96 | % | 1.14 | % | ||||||||||
Nonperforming assets as a % of total loans outstanding and other real estate | 2.76 | % | 4.31 | % | 3.31 | % | 1.30 | % | 1.30 | % | ||||||||||
Ratio of allowance for loan losses to nonperforming loans | 54.74 | % | 36.12 | % | 50.43 | % | 132.20 | % | 110.96 | % | ||||||||||
|
|
|
|
|
|
|
|
|
|
|
|
|
|
|
|
|
|
|
|
|
|
|
|
|
|
|
|
|
|
(Dollars in thousands) | December 31, | |||||||||||||
| 2013 |
| 2012 |
| 2011 |
| 2010 |
| 2009 | |||||
Nonperforming Assets: |
|
|
|
|
|
|
|
|
|
|
|
|
|
|
Nonaccrual loans | $ | 10,877 |
| $ | 11,831 |
| $ | 11,800 |
| $ | 17,228 |
| $ | 14,933 |
Accruing troubled debt restructured loans |
| 833 |
|
| 426 |
|
| 571 |
|
| 2,323 |
|
| 308 |
Total nonperforming loans |
| 11,710 |
|
| 12,257 |
|
| 12,371 |
|
| 19,551 |
|
| 15,241 |
|
|
|
|
|
|
|
|
|
|
|
|
|
|
|
Foreclosed real estate |
| 965 |
|
| 843 |
|
| 931 |
|
| 596 |
|
| 663 |
Total nonperforming assets |
| 12,675 |
|
| 13,100 |
|
| 13,302 |
|
| 20,147 |
|
| 15,904 |
|
|
|
|
|
|
|
|
|
|
|
|
|
|
|
Accruing loans 90 days or more past due |
| - |
|
| - |
|
| - |
|
| 19 |
|
| 661 |
Total risk elements | $ | 12,675 |
| $ | 13,100 |
| $ | 13,302 |
| $ | 20,166 |
| $ | 16,565 |
|
|
|
|
|
|
|
|
|
|
|
|
|
|
|
Nonperforming loans as a % of total |
|
|
|
|
|
|
|
|
|
|
|
|
|
|
loans outstanding |
| 2.14% |
|
| 2.53% |
|
| 2.56% |
|
| 4.18% |
|
| 3.17% |
Nonperforming assets as a % of total |
|
|
|
|
|
|
|
|
|
|
|
|
|
|
loans outstanding and other real estate |
| 2.32% |
|
| 2.71% |
|
| 2.76% |
|
| 4.31% |
|
| 3.31% |
Ratio of allowance for loan losses |
|
|
|
|
|
|
|
|
|
|
|
|
|
|
to nonperforming loans |
| 53.94% |
|
| 44.95% |
|
| 54.74% |
|
| 36.12% |
|
| 50.43% |
Mid Penn assesses a specific allocation for both commercial loans and commercial real estate loans prior to charging down or charging off the loan. Once the charge down is taken, the remaining balance remains a nonperforming loan with the original terms and interest rate intact and is not treated as a restructured credit. During 2011,2013, nonperforming loans declined $7,180,000$547,000 from $19,551,000$12,257,000 at December 31, 2010.2012. This improvement has been the result of slight improvement in some sectors of the general economy and maintaining a close relationship with troubled borrowers as they navigate their plan toward a resolution of credit issues.
Mid Penn’s troubled debt restructured loans at December 31, 20112013 totaled $4,602,000,$7,765,000 of which, $571,000$833,000 are accruing residential mortgages in compliance with the terms of the modification. $6,932,000 of the troubled debt restructured loans are included in nonaccrual loans. As a result of the evaluation, a specific allocation and, subsequently, charge offs have been taken as appropriate. Further discussion of troubled debt restructured loans can be found in Note 7 to Mid Penn’s Consolidated Financial Statements, which are incorporated herein by reference.included in Item 8. As of December 31, 2011,2013, there were no defaulted troubled debt restructured loans as all troubled debt restructured loans were current with respect to their associated forbearance agreements.
Mid Penn entered into forbearance agreements on all loans currently classified as troubled debt restructures and all of these agreements have resulted in additional principal repayment. The terms of these forbearance agreements vary whereby principal payments have been decreased, interest rates have been reduced and/or the loan will be repaid as collateral is sold.
As a result of adopting the amendments in ASU No. 2011-02, Mid Penn reassessed all restructurings that occurred on or after the beginning of the current fiscal year (January 1, 2011) for identification as troubled debt restructurings. Mid Penn identified no loans for which the allowance for loan losses had previously been measured under a general allowance for credit losses methodology that are now considered troubled debt restructurings in accordance with ASU No. 2011-02.
34
MID PENN BANCORP, INC.Management’s Discussion and Analysis
The following table provides additional analysis of partially charged-off loans:
TABLE 11: PARTIALLY CHARGED OFF LOANS
| (Dollars in thousands) | ||||||||
| December 31, 2011 | December 31, 2010 | |||||||
Period ending total loans outstanding (net of unearned income) | $ | 482,717 | $ | 467,735 | ||||
Allowance for loan and lease losses | 6,772 | 7,061 | ||||||
Total Nonperforming loans | 12,371 | 19,551 | ||||||
Nonperforming and impaired loans with partial charge-offs | 4,505 | 7,487 | ||||||
Ratio of nonperforming loans with partial charge-offs to total loans | 0.93 | % | 1.60 | % | ||||
Ratio of nonperforming loans with partial charge-offs to total nonperforming loans | 36.42 | % | 38.29 | % | ||||
Coverage ratio net of nonperforming loans with partial charge-offs | 86.09 | % | 58.53 | % | ||||
Ratio of total allowance to total loans less nonperforming loans with partial charge-offs | 1.42 | % | 1.53 | % | ||||
|
|
|
|
|
|
(Dollars in thousands) |
|
|
|
|
|
| December 31, 2013 |
| December 31, 2012 | ||
Period ending total loans outstanding (net of unearned income) | $ | 546,462 |
| $ | 484,220 |
Allowance for loan and lease losses |
| 6,317 |
|
| 5,509 |
Total Nonperforming loans |
| 11,710 |
|
| 12,257 |
Nonperforming and impaired loans with partial charge-offs |
| 2,103 |
|
| 3,744 |
|
|
|
|
|
|
Ratio of nonperforming loans with partial charge-offs |
|
|
|
|
|
to total loans |
| 0.38% |
|
| 0.77% |
|
|
|
|
|
|
Ratio of nonperforming loans with partial charge-offs |
|
|
|
|
|
to total nonperforming loans |
| 17.96% |
|
| 30.55% |
|
|
|
|
|
|
Coverage ratio net of nonperforming loans with |
|
|
|
|
|
partial charge-offs |
| 65.75% |
|
| 64.71% |
|
|
|
|
|
|
Ratio of total allowance to total loans less |
|
|
|
|
|
nonperforming loans with partial charge-offs |
| 1.16% |
|
| 1.15% |
Mid Penn has not experienced any additional charge-offs on loans for which a partial charge-off had originally been taken.
Mid Penn considers a commercial loan or commercial real estate loan to be impaired when it becomes 90 days or more past due and not in the process of collection. This methodology assumes the borrower cannot or will not continue to make additional payments. At that time the loan would be considered collateral dependent as the discounted cash flow (“DCF”) method indicates no operating income is available for evaluating the collateral position; therefore, all impaired loans are deemed to be collateral dependent.
Mid Penn evaluates loans for charge-off on a monthly basis. Policies that govern the recommendation for charge-off are unique to the type of loan being considered. Commercial loans rated as nonaccrual or lower will first have a collateral evaluation completed in accordance with the guidance on impaired loans. Once the collateral evaluation has been completed, a specific allocation of allowance is made based upon the results of the evaluation. In the event the loan is unsecured, the loan would have been charged-off at the recognition of impairment. If the loan is secured, it will undergo a 90 day waiting period to ensure the collateral shortfall identified in the evaluation is accurate and then charged down by the specific allocation. Once the charge down is taken, the remaining balance remains a nonperforming loan with the original terms and interest rate intact (not restructured). Commercial real estate loans rated as impaired will also have an initial collateral evaluation completed in accordance with the guidance on impaired loans. An updated real estate valuation is ordered and the collateral evaluation is modified to reflect any variations in value. A specific allocation of allowance is made for any anticipated collateral shortfall and a 90-day waiting period begins to ensure the accuracy of the collateral shortfall. The loan is then charged down by the specific allocation. Once the charge down is taken, the remaining balance remains a nonperforming loan with the original terms and interest rate intact (not restructured). The process of charge-off for residential mortgage loans begins upon a loan becoming delinquent for 90 days and not in the process of collection. The existing appraisal is reviewed and a lien search is obtained to determine lien position and any instances of intervening liens. A new appraisal of the property will be ordered if deemed necessary by management and a collateral evaluation is completed. The loan will then be charged down to the value indicated in the evaluation. Consumer loans are recommended for charge-off after reaching delinquency of 90 days and the loan is not in the process of collection. The entire balance of the consumer loan is recommended for charge-off at this point.
As noted above, Mid Penn assesses a specific allocation for both commercial loans and commercial real estate loans prior to charging down or charging off the loan. Once the charge down is taken, the remaining balance remains a nonperforming loan with the original terms and interest rate intact (not restructured). In addition, Mid Penn takes a preemptive step when any commercial loan or commercial real estate loan becomes classified under its internal classification system. A preliminary collateral evaluation in accordance with the guidance on impaired loans is prepared using the existing collateral information in the loan file. This process allows Mid Penn to review both the credit and documentation files to determine the status of the information needed to make a collateral evaluation. This collateral evaluation is preliminary but allows Mid Penn to determine if any potential collateral shortfalls exist.
Larger groups of small-balance loans, such as residential mortgages and consumer installment loans are collectively evaluated for impairment. Accordingly, individual consumer and residential loans are not separately identified for impairment disclosures unless such loans are the subject of a restructuring agreement.
35
MID PENN BANCORP, INC.Management’s Discussion and Analysis
Mid Penn’s rating system assumes any loans classified as sub-standard non-accrual to be impaired, and all of these loans are considered collateral dependent; therefore, all of Mid Penn’s impaired loans, whether reporting a specific allocation or not, are considered collateral dependent.
It is Mid Penn’s policy to obtain updated third party valuations on all impaired loans collateralized by real estate within 30 days of the credit being classified as sub-standard non-accrual. Prior to receipt of the updated real estate valuation Mid Penn will use any existing real estate valuation to determine any potential allowance issues; however no allowance recommendation will be made until which time Mid Penn is in receipt of the updated valuation. The credit department employs an electronic tracking system to monitor the receipt of and need for updated appraisals. To date, there have been no significant time lapses noted with the above processes.
In some instances Mid Penn is not holding real estate as collateral and is relying on business assets (personal property) for repayment. In these circumstances a collateral inspection is performed by Mid Penn personnel to determine an estimated value. The value is based on net book value, as provided by the financial statements, and discounted accordingly based on determinations made by management. Occasionally, Mid Penn will employ an outside service to provide a fair estimate of value based on auction sales or private sales. Management reviews the estimates of these third parties and discounts them accordingly based on management’s judgment, if deemed necessary.
For impaired loans with no valuation allowance required, Mid Penn’s practice of obtaining independent third party market valuations on the subject property within 30 days of being placed on non-accrual status sometimes indicates that the loan to value ratio is sufficient to obviate the need for a specific allocation in spite of significant deterioration in real estate values in Mid Penn’s primary market area. These circumstances are determined on a case by case analysis of the impaired loans.
Mid Penn actively monitors the values of collateral on impaired loans. This monitoring may require the modification of collateral values over time or changing circumstances by some factor, either positive or negative, from the original values. All collateral values will be assessed by management at least every 1812 months for possible revaluation by an independent third party.
Mid Penn does not currently, or plan in the future to, use automated valuation methodologies as a method of valuing real estate collateral.
As of December 31, 2011,2013, Mid Penn had several unrelated loan relationships, with an aggregate carrying balance of $10,926,000,$10,912,000, deemed impaired. This pool of loans is further broken down into a group of loans with an aggregate carrying balance of $5,155,000$7,838,000 for which specific allocations totaling $1,846,000$1,933,000 have been included within the loan loss reserve for these loans. The remaining $5,771,000$3,074,000 of loans requires no specific allocation within the loan loss reserve. The $10,926,000$10,912,000 pool of impaired loan relationships is comprised of $7,834,000$9,014,000 in real estate secured commercial relationships and $3,092,000$1,898,000 in business relationships. There are specific allocations against the real estate secured pool totaling $523,000,$1,343,000, spread among seventeenthirteen relationships composed primarily of customers engaged in real estate investment activities. The group of impaired business relationships with specific allocations is made up of eightfour relationships and a specific allocation of $1,323,000$590,000 has been set aside against these credits. Seven small business relationships account for $451,000 of the specific allocations due to the negative effects of the economy on their businesses. One additional large commercial participation loan in this pool has shown exceptional collateral devaluation and is responsible for a specific allocation of $872,000$548,000 of the total pool attributable to this segment. Management currently believes that the specific reserves are adequate to cover probable future losses related to these relationships.
The allowance for loan losses is a reserve established in the form of a provision expense for loan and lease losses and is reduced by loan charge-offs net of recoveries. In conjunction with an internal loan review function that operates independently of the lending function, management monitors the loan portfolio to identify risk on a monthly basis so that an appropriate allowance is maintained. Based on an evaluation of the loan portfolio, management presents a monthly review of the allowance for loan and lease losses to the Board of Directors, indicating any changes in the allowance since the last review. In making the evaluation, management considers the results of recent regulatory examinations, which typically include a review of the allowance for loan and lease losses an integral part of the examination process.
In establishing the allowance, management evaluates on a quantitative basis individual classified loans and nonaccrual loans, and determines an aggregate reserve for those loans based on that review. In addition, an allowance for the remainder of the loan and lease portfolio is determined based on historical loss experience within certain components of the portfolio. These allocations may be modified if current conditions indicate that loan and lease losses may differ from historical experience.
36
MID PENN BANCORP, INC.Management’s Discussion and Analysis
In addition, a portion of the allowance is established for losses inherent in the loan and lease portfolio which have not been identified by the quantitative processes described above. This determination inherently involves a higher degree of subjectivity, and considers risk factors that may not have yet manifested themselves in historical loss experience. These factors include:
Changes in local, regional, and national economic and business conditions affecting the collectability of the portfolio, the values of underlying collateral, and the condition of various market segments.
Changes in the volume and severity of past due loans, the volume of nonaccrual loans, and the volume and severity of adversely classified loans.
Changes in the experience, ability, and depth of lending management and other relevant staff as well as the quality of the institution’s loan review system.
Changes in the nature and volume of the portfolio and the terms of loans generally offered.
The existence and effect of any concentrations of credit and changes in the level of such concentrations.
· | ||
Changes in local, regional, and |
· | Changes in the volume and severity of past due loans, the volume of nonaccrual loans, and the volume and severity of adversely classified loans. |
· | Changes in the experience, ability, and depth of lending management and other relevant staff as well as the quality of the institution’s loan review system. |
· | Changes in the nature and volume of the portfolio and the terms of loans generally offered. |
· | The existence and effect of any concentrations of credit and changes in the level of such concentrations. |
While the allowance for loan and lease losses is maintained at a level believed to be adequate by management for covering estimated losses in the loan and lease portfolio, determination of the allowance is inherently subjective, as it requires estimates, all of which may be susceptible to significant change. Changes in these estimates may impact the provisions charged to expense in future periods.
Management believes, based on information currently available, that the allowance for loan and lease losses of $6,772,000$6,317,000 is adequate as of December 31, 2011.2013.
The allocation of the allowance for loan and lease losses among the major classifications is shown in Table 12 as of December 31 of each of the past five years.
TABLE 12: ALLOCATION OF THE ALLOWANCE FOR LOAN AND LEASE LOSSES
| (Dollars in thousands) | December 31, | |||||||||||||||||||
| 2011 | 2010 | 2009 | 2008 | 2007 | ||||||||||||||||
Commercial real estate, construction and land development | $ | 2,988 | $ | 3,002 | $ | 3,334 | $ | 3,326 | $ | 2,908 | ||||||||||
Commercial, industrial and agricultural | 2,874 | 3,246 | 3,545 | 1,860 | 1,607 | |||||||||||||||
Real estate - residential | 332 | 206 | 175 | 87 | 75 | |||||||||||||||
Consumer | 435 | 412 | 467 | 172 | 148 | |||||||||||||||
Unallocated | 143 | 195 | 165 | 60 | 52 | |||||||||||||||
|
|
|
|
|
|
|
|
|
| |||||||||||
| $ | 6,772 | $ | 7,061 | $ | 7,686 | $ | 5,505 | $ | 4,790 | |||||||||||
|
|
|
|
|
|
|
|
|
| |||||||||||
|
|
|
|
|
|
|
|
|
|
|
|
|
|
|
|
|
|
|
|
|
|
|
|
|
|
|
|
|
|
(Dollars in thousands) | December 31, | |||||||||||||
| 2013 |
| 2012 |
| 2011 |
| 2010 |
| 2009 | |||||
Commercial real estate, construction |
|
|
|
|
|
|
|
|
|
|
|
|
|
|
and land development | $ | 4,015 |
| $ | 3,122 |
| $ | 3,567 |
| $ | 3,775 |
| $ | 3,334 |
Commercial, industrial and agricultural |
| 1,187 |
|
| 1,299 |
|
| 2,276 |
|
| 2,448 |
|
| 3,545 |
Real estate - residential |
| 581 |
|
| 635 |
|
| 362 |
|
| 219 |
|
| 175 |
Consumer |
| 513 |
|
| 444 |
|
| 424 |
|
| 424 |
|
| 467 |
Unallocated |
| 21 |
|
| 9 |
|
| 143 |
|
| 195 |
|
| 165 |
| $ | 6,317 |
| $ | 5,509 |
| $ | 6,772 |
| $ | 7,061 |
| $ | 7,686 |
The 20112013 provision of $1,205,000$1,685,000 is a decreasean increase of $1,430,000$649,000 from the $2,635,000$1,036,000 provision in 2010.2012. The smaller provision is reflective of the aggressive loan charge-offs taken at the end of 2009 and in 2010, resulting from the deteriorationgrowth in the overall quality of our loan portfolio caused by the recession and problems in the commercial real estate sector. The continued slowness in the economy and continuing credit quality concerns of Mid Penn’s loan portfolio during 20112013, as well as increases in some specific reserves, necessitated a larger than pre-2009 provision levels, even thoughin 2013. See also the amount was a reduction from 2010.discussion in the Provision for Loan and Lease Losses section.
The allowance for loan and lease losses at December 31, 20112013 was $6,772,000,$6,317,000, or 1.40%1.16%, of total loans less unearned discount as compared to $7,061,000,$5,509,000, or 1.51%1.14%, at December 31, 20102012 and $7,686,000,$6,772,000, or 1.60%1.40%, at December 31, 2009.2011.
Deposits and Other Funding Sources
Mid Penn’sPenn's primary source of funds are deposits. Total deposits at December 31, 2011, increased2013 decreased by $79,073,000$17,331,000, or 14.2%2.8%, over December 31, 2010,2012, which increaseddecreased by $54,967,000$8,594,000, or 11.0%1.4%, over December 31, 2009.2011. Average balances and average interest rates applicable to the major classifications of deposits for the years ended December 31, 2011, 2010,2013, 2012, and 20092011 are presented in Table 13.
Average short-term borrowings for 20112013 were $803,000$10,533,000 as compared to $3,798,000$1,044,000 in 2010.2012. These borrowings included customer repurchase agreements, treasury tax and loan note option borrowings andconsisted of federal funds purchased. One $5,000,000 long-term borrowing matured in 2011, while no new long-term borrowing arrangements were entered into during the year.
At December 31, 2011,2013, the Bank had $13,354,000$2,750,000 in brokered deposits.deposits, a decrease of $1,378,000, or 33.4%, over December 31, 2012, which decreased by $9,226,000, or 69.1%, over the same period in 2011. With additionalcontinued success in the local deposit environment, along with the maturity of a $10,000,000 brokered certificate of deposit in 2012, the Bank reducedhas virtually eliminated its brokered deposit funding by $3,140,000 in 2011, after having reduced such funding by $11,395,000 in 2010.
37
MID PENN BANCORP, INC.Management’s Discussion and Analysis
TABLE 13: DEPOSITS BY MAJOR CLASSIFICATION
| (Dollars in thousands) | December 31, | |||||||||||||||||||||||
| 2011 | 2010 | 2009 | ||||||||||||||||||||||
| Average Balance | Average Rate | Average Balance | Average Rate | Average Balance | Average Rate | |||||||||||||||||||
Noninterest-bearing demand deposits | $ | 63,484 | 0.00 | % | $ | 58,480 | 0.00 | % | $ | 51,464 | 0.00 | % | ||||||||||||
Interest-bearing demand deposits | 57,342 | 0.25 | % | 48,024 | 0.14 | % | 38,198 | 0.09 | % | |||||||||||||||
Money market | 248,615 | 1.20 | % | 163,415 | 1.44 | % | 87,427 | 1.58 | % | |||||||||||||||
Savings | 27,801 | 0.05 | % | 26,585 | 0.06 | % | 26,241 | 0.06 | % | |||||||||||||||
Time | 209,574 | 2.56 | % | 239,761 | 2.87 | % | 255,123 | 3.64 | % | |||||||||||||||
|
|
|
|
|
|
|
|
|
|
|
| |||||||||||||
| $ | 606,816 | 1.40 | % | $ | 536,265 | 1.74 | % | $ | 458,453 | 2.34 | % | |||||||||||||
|
|
|
|
|
|
|
|
|
|
|
| |||||||||||||
|
|
|
|
|
|
|
|
|
|
|
|
|
|
|
|
|
|
|
|
|
|
|
|
|
|
|
|
|
|
(Dollars in thousands) | December 31, | |||||||||||||
| 2013 |
| 2012 |
| 2011 | |||||||||
| Average |
| Average |
| Average |
| Average |
| Average |
| Average | |||
| Balance |
| Rate |
| Balance |
| Rate |
| Balance |
| Rate | |||
Noninterest-bearing demand deposits | $ | 49,318 |
| 0.00% |
| $ | 47,670 |
| 0.00% |
| $ | 63,484 |
| 0.00% |
Interest-bearing demand deposits |
| 182,118 |
| 0.36% |
|
| 126,171 |
| 0.36% |
|
| 57,342 |
| 0.25% |
Money market |
| 202,393 |
| 0.59% |
|
| 236,434 |
| 0.84% |
|
| 248,615 |
| 1.20% |
Savings |
| 29,597 |
| 0.05% |
|
| 28,632 |
| 0.05% |
|
| 27,801 |
| 0.05% |
Time |
| 148,863 |
| 1.73% |
|
| 180,356 |
| 2.04% |
|
| 209,574 |
| 2.56% |
| $ | 612,289 |
| 0.72% |
| $ | 619,263 |
| 0.99% |
| $ | 606,816 |
| 1.40% |
The maturity distribution of time deposits of $100,000 or more is reflected in Table 14.
TABLE 14: MATURITY OF TIME DEPOSITS $100,000 OR MORE
| (Dollars in thousands) | December 31, | |||||||||||
| 2011 | 2010 | 2009 | ||||||||||
Three months or less | $ | 7,824 | $ | 7,322 | $ | 22,712 | ||||||
Over three months to twelve months | 21,979 | 21,031 | 37,443 | |||||||||
Over twelve months | 36,807 | 37,870 | 25,682 | |||||||||
|
|
|
|
|
| |||||||
| $ | 66,610 | $ | 66,223 | $ | 85,837 | |||||||
|
|
|
|
|
| |||||||
|
|
|
|
|
|
|
|
|
|
|
|
|
|
|
|
|
|
(Dollars in thousands) | December 31, | |||||||
| 2013 |
| 2012 |
| 2011 | |||
Three months or less | $ | 4,745 |
| $ | 7,207 |
| $ | 7,824 |
Over three months to twelve months |
| 16,953 |
|
| 18,340 |
|
| 21,979 |
Over twelve months |
| 24,230 |
|
| 32,763 |
|
| 36,807 |
| $ | 45,928 |
| $ | 58,310 |
| $ | 66,610 |
Capital Resources
Shareholders’
Shareholders' equity, or capital, is evaluated in relation to total assets and the risk associated with those assets. The detailed computation of the Bank’s regulatory capital ratios can be found in Note 17 of Item 8, Notes to Consolidated Financial Statements. The greater a corporation’s capital resources, the more likely it is to meet its cash obligations and absorb unforeseen losses. Too much capital, however, indicates that not enough of the corporation’s earnings have been invested in the continued growth of the business or paid to shareholders. The buildup makes it difficult for a corporation to offer a competitive return on the shareholders’ capital going forward. For these reasons capital adequacy has been, and will continue to be, of paramount importance.
Shareholders’ equity increased in 2013 by $696,000, or 1.3%, following a decrease in 2012 of $1,232,000, or 2.3%, and an increase in 2011 by $5,251,000, or 10.9%, following. Capital was positively impacted in 2013 by the net income available to common shareholders of $4,616,000; however, the increase was muted by an increase in 2010accumulated other comprehensive loss. Capital was negatively impacted in 2012 by the repayment and redemption of $1,497,000 or 3.2%the $10,000,000 in the Series A preferred stock, but the impact was softened by the net income available to common shareholders of $4,437,000 and a decreasethe issuance of the $4,880,000 in 2009Series B preferred stock in 2012. Subsequently, the Series B preferred stock offering of $4,186,000 or 8.2%.$5,000,000 was completed on January 3, 2013. Capital was positively impacted in 2011 by the net income available to common shareholders of $4,029,000 and the increase in other comprehensive income from the increase in value of the assets in the available for sale investment portfolio. Capital was positively impacted in 2010 by the net income of $2,234,000 and the continued suspension of the common dividend to shareholders. Capital was negatively impacted in 2009 by the net loss of $2,809,000 and the payment of cash dividends to common shareholders of $1,809,000.
Mid Penn’s normal intent for dividend payout is to provide quarterly cash returns to shareholders and earnings retention at a level sufficient to finance future growth. During the fourth quarter of 2009, Mid Penn suspended the quarterly cash dividend consistent with Federal Reserve Board policy that dividend payouts should not exceed net income for the previous four quarters, net of dividends paid during that period. Mid Penn continued the suspension of the quarterly cash dividend to shareholders throughout 2010, consistent with Federal Reserve Board policy. Mid Penn reinstated a dividend payout of $0.05 per common share during each of the calendar quarters in 2011. The dividends paid on common shares totaled $0.25 for the years ended December 31, 2013 and December 31, 2012, while $0.20 in dividends were paid for the year ended December 31, 2011. On January 25, 2012, Mid Penn declared a cash dividend of $0.05 per common share, payable on February 27, 2012 to shareholders of record as of February 8, 2012.
The dividend payout ratio, which represents the percentage of annual net income returned to shareholders in the form of cash dividends, was 15.3%18.94% for 20112013 and 0.0%19.69% for 2010.
38
MID PENN BANCORP, INC.Management’s Discussion and Analysis
Mid Penn maintained the following regulatory capital levels, leverage ratios, and risk-based capital ratios as of December 31, 2011,2013, and 2010,2012, as follows:
|
|
|
|
|
|
|
|
|
|
|
|
|
|
| ||||||||||||||||||||||||
|
|
|
|
|
|
|
|
|
|
|
|
|
| |||||||||||||||||||||||||
| (Dollars in thousands) | Capital Adequacy | Capital Adequacy | ||||||||||||||||||||||||||||||||||||
| To Be Well-Capitalized |
|
|
|
|
|
|
|
|
|
| To Be Well-Capitalized | |||||||||||||||||||||||||||
| Under Prompt |
|
|
|
|
|
|
|
|
|
| Under Prompt | |||||||||||||||||||||||||||
| Minimum Capital | Corrective |
|
|
|
|
| Minimum Capital |
| Corrective | |||||||||||||||||||||||||||||
| Actual: | Required: | Action Provisions: | Actual |
| Required |
| Action Provisions | |||||||||||||||||||||||||||||||
| Amount | Ratio | Amount | Ratio | Amount | Ratio | Amount |
| Ratio |
| Amount |
| Ratio |
| Amount |
| Ratio | ||||||||||||||||||||||
Corporation |
|
|
|
|
|
|
|
|
|
|
|
|
|
| ||||||||||||||||||||||||
As of December 31, 2011: | ||||||||||||||||||||||||||||||||||||||
As of December 31, 2013: |
|
|
|
|
|
|
|
|
|
|
|
|
|
| ||||||||||||||||||||||||
Tier 1 Capital (to Average Assets) | $ | 50,451 | 7.0 | % | $ | 28,679 | 4.0 | % | N/A | N/A | $ | 52,693 |
| 7.5% |
| $ | 28,031 |
| 4.0% |
| $ | N/A |
| N/A | ||||||||||||||
Tier 1 Capital (to Risk Weighted Assets) | 50,451 | 10.3 | % | 19,566 | 4.0 | % | N/A | N/A |
| 52,693 |
| 9.9% |
|
| 21,234 |
| 4.0% |
|
| N/A |
| N/A | ||||||||||||||||
Total Capital (to Risk Weighted Assets) | 56,513 | 11.6 | % | 39,132 | 8.0 | % | N/A | N/A |
| 59,100 |
| 11.1% |
|
| 42,467 |
| 8.0% |
|
| N/A |
| N/A | ||||||||||||||||
|
|
|
|
|
|
|
|
|
|
|
|
|
| |||||||||||||||||||||||||
Bank |
|
|
|
|
|
|
|
|
|
|
|
|
|
| ||||||||||||||||||||||||
As of December 31, 2011: | ||||||||||||||||||||||||||||||||||||||
As of December 31, 2013: |
|
|
|
|
|
|
|
|
|
|
|
|
|
| ||||||||||||||||||||||||
Tier 1 Capital (to Average Assets) | $ | 50,265 | 7.1 | % | $ | 28,326 | 4.0 | % | $ | 35,408 | 5.0 | % | $ | 52,598 |
| 7.5% |
| $ | 28,041 |
| 4.0% |
| $ | 35,051 |
| 5.0% | ||||||||||||
Tier 1 Capital (to Risk Weighted Assets) | 50,265 | 10.4 | % | 19,367 | 4.0 | % | 29,051 | 6.0 | % |
| 52,598 |
| 9.9% |
|
| 21,234 |
| 4.0% |
|
| 31,850 |
| 6.0% | |||||||||||||||
Total Capital (to Risk Weighted Assets) | 56,327 | 11.6 | % | 38,735 | 8.0 | % | 48,419 | 10.0 | % |
| 59,005 |
| 11.1% |
|
| 42,467 |
| 8.0% |
|
| 53,084 |
| 10.0% | |||||||||||||||
|
|
|
|
|
|
|
|
|
|
|
|
|
| |||||||||||||||||||||||||
Corporation |
|
|
|
|
|
|
|
|
|
|
|
|
|
| ||||||||||||||||||||||||
As of December 31, 2010: | ||||||||||||||||||||||||||||||||||||||
As of December 31, 2012: |
|
|
|
|
|
|
|
|
|
|
|
|
|
| ||||||||||||||||||||||||
Tier 1 Capital (to Average Assets) | $ | 46,957 | 7.4 | % | $ | 25,352 | 4.0 | % | N/A | N/A | $ | 48,822 |
| 6.8% |
| $ | 28,530 |
| 4.0% |
| $ | N/A |
| N/A | ||||||||||||||
Tier 1 Capital (to Risk Weighted Assets) | 46,957 | 10.2 | % | 18,501 | 4.0 | % | N/A | N/A |
| 48,822 |
| 10.0% |
|
| 19,593 |
| 4.0% |
|
| N/A |
| N/A | ||||||||||||||||
Total Capital (to Risk Weighted Assets) | 52,711 | 11.4 | % | 37,002 | 8.0 | % | N/A | N/A |
| 54,421 |
| 11.1% |
|
| 39,185 |
| 8.0% |
|
| N/A |
| N/A | ||||||||||||||||
|
|
|
|
|
|
|
|
|
|
|
|
|
| |||||||||||||||||||||||||
Bank |
|
|
|
|
|
|
|
|
|
|
|
|
|
| ||||||||||||||||||||||||
As of December 31, 2010: | ||||||||||||||||||||||||||||||||||||||
As of December 31, 2012: |
|
|
|
|
|
|
|
|
|
|
|
|
|
| ||||||||||||||||||||||||
Tier 1 Capital (to Average Assets) | $ | 46,799 | 7.4 | % | $ | 25,388 | 4.0 | % | $ | 31,735 | 5.0 | % | $ | 48,764 |
| 6.9% |
| $ | 28,111 |
| 4.0% |
| $ | 35,138 |
| 5.0% | ||||||||||||
Tier 1 Capital (to Risk Weighted Assets) | 46,799 | 10.2 | % | 18,357 | 4.0 | % | 27,536 | 6.0 | % |
| 48,764 |
| 10.0% |
|
| 19,593 |
| 4.0% |
|
| 29,389 |
| 6.0% | |||||||||||||||
Total Capital (to Risk Weighted Assets) | 52,553 | 11.5 | % | 36,714 | 8.0 | % | 45,893 | 10.0 | % |
| 54,363 |
| 11.1% |
|
| 39,185 |
| 8.0% |
|
| 48,981 |
| 10.0% | |||||||||||||||
Capital Purchase Program Participation
On December 19, 2008, Mid Penn Bancorp, Inc. (the “Corporation”) entered into anand closed a letter agreement (including the Securities Purchase Agreement – Standard Terms) (the “Purchase Agreement”) with the United States Department of the Treasury (the “Treasury”) pursuant to which the Treasury invested $10,000,000 in the CorporationMid Penn under the Treasury’s Capital Purchase Program (the “CPP”).
Under the Purchase Agreement,letter agreement, the Treasury received (1) 10,000 shares of Series A Fixed Rate Cumulative Perpetual Preferred Stock, $1,000 liquidation preference (“Series A Preferred Stock”), and (2) Warrantswarrants to purchase up to 73,099 shares of the Corporation’sMid Penn common stock at an exercise price of $20.52 per share.share (the “Warrants”).
The preferred shares pay cumulative dividends at
On December 28, 2012, Mid Penn entered into a rate of 5% per annum for the first five years and 9% per annum thereafter. The preferred shares are non-voting, other than class voting rights on certain matters that could adversely affect the preferred shares. If dividends on the preferred shares have not been paid for an aggregate of six quarterly dividend periods or more, whether consecutive or not, the Corporation’s authorized number of directors will automatically be increased by two, and holders of the preferred stock, voting togetherletter agreement with holders of any then outstanding parity stock, will have the right to elect those directors at the Corporation’s next annual meeting of shareholders or special meeting of shareholders called for that purpose. These preferred share directors would be elected annually and serve until all accrued and unpaid dividends on the preferred shares have been paid.
Pursuant to the American Recovery and Reinvestment Act of 2009 (“ARRA”), the Secretary of the Treasury shall permit, subjectpursuant to consultation withwhich Mid Penn repurchased from the appropriate Federal banking agency, the Corporation to redeem the Series A Preferred Stock. The Corporation may do so without regard to the sourceTreasury all 10,000 shares of the funds to be used to redeem the Series A Preferred Stock or any minimum waiting period. Ifissued to the Corporation elects to redeemTreasury, which constitutes all of the issued and outstanding shares of Series A Preferred Stock. Mid Penn repurchased the Series A Preferred Stock priorfor a purchase price equal to February 15, 2012, and receives approvalthe aggregate liquidation amount of the Preferred Stock of $10,000,000, plus accrued but unpaid dividends of $59,722. All 10,000 shares of Series A Preferred Stock have subsequently been cancelled.
On January 23, 2013, Mid Penn entered into a letter agreement with the Treasury pursuant to which Mid Penn repurchased from the Treasury andon that date the Board of GovernorsWarrants for $58,479. The Warrants have subsequently been cancelled.
As of the Federal Reserve System, it must redeem at least $2,500,000 ofdate hereof, Mid Penn has no further financial obligations under the Series A Preferred Stock. Upon redemption ofStock, the Series A Preferred Stock,
the Secretary of the Treasury is required to liquidate the warrants associated with the Corporation’s participation in the CPP at the current market price. Any redemption is subject to the consent of the Board of Governors of the Federal Reserve System. Until December 19, 2011, or such earlier time as all preferred shares have been redeemed by the Corporation or transferred by Treasury to third parties that are not affiliated with Treasury, the Corporation may not, without Treasury’s consent, increase its dividend rate per share of common stock above the per share quarterly amount in effect immediately prior to October 14, 2008 ($0.20 per share) or, with certain limited exceptions, repurchase its common stock.
The warrants are immediately exercisable and have a 10-year term. The exercise price and number of shares subject to the warrants are both subject to anti-dilution adjustments. Treasury has agreed not to exercise voting power with respect to any shares of common stock issued upon exercise of the warrants; however, this agreement not to vote the shares does not apply to any person who may acquire such shares.
The preferred shares and the warrants were issued in a private placement exempt from registration pursuant to Section 4(2) of the Securities Act of 1933. The Corporation has filed a shelf registration statement covering the preferred shares, the warrants, and the common stock underlying the warrants. Treasury and other future holders of the preferred shares, the warrants, or the common stock issued pursuant to the warrants also have piggyback and demand registration rights with respect to these securities. None of the preferred shares, the warrants, or the shares issuable upon exercise of the warrants are subject to any contractual restrictions on transfer.
In the Purchase Agreement, the Corporation agreed that, until such time as the Treasury ceases to own any securities acquired from Mid Penn pursuant to the Purchase Agreement, the Corporation will take all necessary action to ensure that benefit plans with respect to our senior executive officers comply with Section 111(b) of the Emergency Economic Stability Act of 2008 (the “EESA”) and applicable guidance or regulations issued by the Secretary of the Treasury. The applicable executive compensation requirements apply to the compensation of the Corporation’s Chief Executive Officer, Chief Financial Officer, and certain other highly compensated executive officers.
These requirements, the compliance of which must be annually certified by Mid Penn’s chief executive officer and chief financial officer, include:
In compliance with the EESA and ARRA, on February 27, 2009, Rory G. Ritrievi entered into a Capital Purchase Plan Executive Compensation Restriction Agreement with Mid Penn Bancorp, Inc. and Mid Penn Bank (the “Agreement”). The Agreement prohibits, during the period which any obligation to the Federal Government remains outstanding, any payment to Mr. Ritrievi (including bonus payments and payments upon a termination) which would violate the EESA and ARRA.
In addition to these requirements, Mid Penn must have in place a company-wide policy regarding excessive or luxury expenditures and must permit a separate nonbinding shareholder vote to approve the compensation of executives as disclosed pursuant to the compensation disclosure rules of the Securities and Exchange Commission. Mid Penn has adopted such a luxury and expense policy and it appears on the Corporation’s website at www.midpennbank.com.
Federal Income Taxes
Federal income tax expense for 20112013 was $1,223,000$1,201,000 compared to $416,000$1,244,000 in 20102012 and a federal income tax benefit of $2,208,000$1,223,000 in 2009.2011. The effective tax rate was 20% for 2013 and 2012, and 21% for 2011, 13% for 2010,2011.
39
MID PENN BANCORP, INC.Management’s Discussion and 49% for 2009.Analysis
The tax expense in 20112013 and 20102012 resulted from net income generated in the normal course of business. The tax benefit recorded in 2009 was related to a loss stemming from the increased provision for loan losses and increased noninterest expenses during 2009. Generally, our effective tax rate is below the statutory rate due to earnings on tax-exempt loans, investments, and bank-owned life insurance, and the impact of tax credits. The realization of deferred tax assets is dependent on future earnings. As a result of Mid Penn’s adoption of ASC Topic 740,Income Taxes, no significant income tax uncertainties were identified; therefore, Mid Penn recognized no adjustment for unrealized income tax benefits for the periods ended December 31, 20112013 and December 31, 2010.2012. We currently anticipate that future earnings will be adequate to fully utilize deferred tax assets.
Liquidity
Mid Penn’sPenn's asset-liability management policy addresses the management of Mid Penn’sPenn's liquidity position and its ability to raise sufficient funds to meet deposit withdrawals, fund loan growth and meet other operational needs. Mid Penn utilizes its investments as a source of liquidity, along with deposit growth and increases in repurchase agreements and borrowings. (See Deposits and Other Funding Sources which appears earlier in this discussion.) Liquidity from investments is provided primarily through investments and interest-bearing balances with maturities of one year or less. Funds are available to Mid Penn through loans from the Federal Home Loan Bank and established federal funds (overnight) lines of credit. Mid Penn’sPenn's major source of funds is its core deposit base.
Major sources of cash in 2011 came from the net increase in deposits of $79,073,000, as well as the decrease in interest-bearing balances of $27,564,000.
The major uses of cash in 2011 were the net purchase of investment securities of $84,744,000 and the increase in loans and leases of $17,774,000.
Major sources of cash in 20102013 came from the netmaturity of investment securities and interest-bearing time deposits totaling $53,151,000, the increase in short-term borrowings of $23,833,000, and the sale of investment securities of $15,118,000.
Major uses of cash in 2013 were the increase in net loans and leases of $65,896,000, the purchases of investment securities of $27,881,000 and decrease in time deposits of $54,967,000, as well as the proceeds$31,280,000.
Major sources of cash in 2012 came from the maturity of investment securities of $8,982,000$39,453,000, the sale of investment securities of $17,895,000, and the decreaseincrease in loansdemand deposit and leasessavings accounts of $8,690,000.$29,645,000.
The major
Major uses of cash in 20102012 were the purchasepurchases of investment securities of $33,472,000 and$53,553,000, as well as the reductiondecrease in short-term borrowings and long-term debttime deposits of $14,483,000 and $10,174,000, respectively. Another major use of cash in 2010 was the increase in interest-bearing balances of $16,437,000.$38,239,000.
Aggregate Contractual Obligations
Table 15 represents Mid Penn’s on-and-off balance sheet aggregate contractual obligations to make future payments as of December 31, 2011:2013.
TABLE 15: AGGREGATE CONTRACTUAL OBLIGATIONS
| (Dollars in thousands) | Payments Due by Period | |||||||||||||||||||||
| Note Reference | Total | One Year or Less | One to Three Years | Three to Five Years | More than Five Years | |||||||||||||||||
Certificates of deposit | 9 | $ | 201,892 | $ | 94,171 | $ | 76,938 | $ | 29,153 | $ | 1,630 | |||||||||||
Long-term debt | 11 | 22,701 | — | 14,213 | 5,000 | 3,488 | ||||||||||||||||
Operating lease obligations | 19 | 341 | 109 | 211 | 21 | — | ||||||||||||||||
Payments under benefit plans | 13 | 1,574 | 103 | 245 | 316 | 910 | ||||||||||||||||
|
|
|
|
|
|
|
|
|
| |||||||||||||
| $ | 226,508 | $ | 94,383 | $ | 91,607 | $ | 34,490 | $ | 6,028 | |||||||||||||
|
|
|
|
|
|
|
|
|
| |||||||||||||
|
|
|
|
|
|
|
|
|
|
|
|
|
|
|
|
|
|
|
|
|
|
|
|
|
|
|
|
|
|
|
|
|
|
(Dollars in thousands) |
|
|
|
|
| Payments Due by Period | ||||||||||
| Note Reference |
| Total |
| One Year or Less |
| One to Three Years |
| Three to Five Years |
| More than Five Years | |||||
Certificates of deposit | 9 |
| $ | 132,373 |
| $ | 60,006 |
| $ | 59,196 |
| $ | 11,451 |
| $ | 1,720 |
Long-term debt | 11 |
|
| 23,145 |
|
| - |
|
| 20,000 |
|
| - |
|
| 3,145 |
Operating lease obligations | 19 |
|
| 141 |
|
| 113 |
|
| 28 |
|
| - |
|
| - |
Payments under benefit plans | 13 |
|
| 1,681 |
|
| 133 |
|
| 320 |
|
| 344 |
|
| 884 |
|
|
| $ | 157,340 |
| $ | 60,252 |
| $ | 79,544 |
| $ | 11,795 |
| $ | 5,749 |
We are not aware of any other commitments or contingent liabilities which may have a material adverse impact on Mid Penn’s liquidity or capital resources.
Effects of Inflation
Effects of Inflation
A bank’sbank's asset and liability structure is substantially different from that of an industrial company in that virtually all assets and liabilities of a bank are monetary in nature. Management believes the impact of inflation on its financial results depends principally upon Mid Penn’sPenn's ability to manage the balance sheet sensitivity to changes in interest rates and, by such reaction, mitigate the inflationary impact on performance. Interest rates do not necessarily move in the same direction or at the same magnitude as the prices of other goods and services. As discussed previously, Management seeks to manage the relationship between interest sensitive assets and liabilities in order to protect against wide interest rate fluctuations, including those resulting from inflation.
Information shown elsewhere in this Annual Report will assist in the understanding of how Mid Penn is positioned to react to changing interest rates and inflationary trends. In particular, the summary of net liabilities, as well as the composition of loans, investments and deposits should be considered.
40
MID PENN BANCORP, INC.Management’s Discussion and Analysis
Off-Balance Sheet Items
Mid Penn makes contractual commitments to extend credit and extends lines of credit, which are subject to Mid Penn’sPenn's credit approval and monitoring procedures.
As of December 31, 2011,2013, commitments to extend credit amounted to $91,619,000$141,616,000 as compared to $86,141,000$99,958,000 as of December 31, 2010.2012.
Mid Penn also issues standby letters of credit to its customers. The risk associated with standby letters of credit is essentially the same as the credit risk involved in loan extensions to customers. Standby letters of credit decreased to $7,320,000$8,458,000 at December 31, 2011,2013, from $10,048,000$10,417,000 at December 31, 2010.
Comprehensive Income (Loss)
Comprehensive Income (Loss) is a measure of all changes in equity of a corporation, excluding transactions with owners in their capacity as owners (such as proceeds from issuances of stock and dividends). The difference between Net Income (Loss) and Comprehensive Income (Loss) is termed “Other Comprehensive Income (Loss).” For Mid Penn, Other Comprehensive Income (Loss) consists primarily of unrealized gains and losses on available for sale securities, net of deferred income tax. Other Comprehensive Income (Loss) also includes a pension component in accordance with ASC Topic 715. Comprehensive Income (Loss) should not be construed to be a measure of Net Income (Loss). The amount of unrealized gains or losses reflected in Comprehensive Income (Loss) may vary widely at statement dates depending on the markets as a whole and how interest rate movements affect the market value of the portfolio of available for sale securities. Other Comprehensive Income (Loss) for the years ended December 31, 2011, 2010 and 2009 was $1,880,000, ($737,000), and $369,000, respectively.
ITEM 7A.QUANTITATIVE AND QUALITATIVE DISCLOSURES ABOUT MARKET RISK
As a financial institution, Mid Penn’s primary source of market risk is interest rate risk. Interest rate risk is the exposure to fluctuations in Mid Penn’s future earnings (earnings at risk) resulting from changes in interest rates. This exposure or sensitivity is a function of the repricing characteristics of Mid Penn’sPenn's portfolio of assets and liabilities. Each asset and liability reprices either at maturity or during the life of the instrument. Interest rate sensitivity is measured as the difference between the volume of assets and liabilities that are subject to repricing in a future period of time.
The principal purpose of asset-liability management is to maximize current and future net interest income within acceptable levels of interest rate risk while satisfying liquidity and capital requirements. Net interest income is increased by increasing the net interest margin and by volume growth. Thus the goal of interest rate risk management is to maintain a balance between risk and reward such that net interest income is maximized while risk is maintained at an acceptable level.
Mid Penn utilizes an asset-liability management model to measure the impact of interest rate movements on its interest rate sensitivity position. Mid Penn’s management also reviews the traditional maturity gap analysis regularly. Mid Penn does not always attempt to achieve an exact match between interest sensitive assets and liabilities because it believes that an actively managed amount of interest rate risk is inherent and appropriate in the management of the Corporation’s profitability.
Modeling techniques and simulation analysis involve assumptions and estimates that inherently cannot be measured with complete precision. Key assumptions in the analyses include maturity and repricing characteristics of assets and liabilities, prepayments on amortizing assets, non-maturing deposit sensitivity, and loan and deposit pricing. These assumptions are inherently uncertain due to the timing, magnitude and frequency of rate changes and changes in market conditions and management strategies, among other factors. However, the analyses are useful in quantifying risk and provide a relative gauge of Mid Penn’s interest rate risk position over time.
Management reviews interest rate risk on a quarterly basis. This analysis includes earnings scenarios whereby interest rates are increased and decreased by 100, 200, and 300 basis points. These scenarios, detailed in Table 16, indicate that thereMid Penn would not be a significant variance inexperience enhanced net interest income over a one-year time frame due to upward interest rate changes;changes, while a reduction in interest rates would result in a less pronounced reduction in net interest income over a one-year time frame; however, actual results could vary significantly from the calculations prepared by Management. At December 31, 2011,2013, all interest rate risk levels according to the model were within the tolerance limits of Board approved policy. In addition, the table does not take into consideration changes, which Management would make to realign its portfolio in the event of a changing rate environment.
TABLE 16: EFFECT OF HYPOTHETICAL CHANGES IN INTEREST RATES
December 31, 2011 | December 31, 2010 | |||||||||||||||||
Change in Basis Points | % Change in Net Interest Income | Risk Limit | Change in Basis Points | % Change in Net Interest Income | Risk Limit | |||||||||||||
300 | 6.29 | % | +/- 25 | % | 300 | 4.84 | % | +/- 25 | % | |||||||||
200 | 4.19 | % | +/- 15 | % | 200 | 3.32 | % | +/- 15 | % | |||||||||
100 | 2.01 | % | +/- 10 | % | 100 | 1.72 | % | +/- 10 | % | |||||||||
0 | 0 | |||||||||||||||||
(100) | -3.36 | % | +/- 10 | % | (100) | -1.87 | % | +/- 10 | % | |||||||||
(200) | -4.73 | % | +/- 15 | % | (200) | -3.89 | % | +/- 15 | % | |||||||||
(300) | -7.02 | % | +/- 25 | % | (300) | -5.88 | % | +/- 25 | % | |||||||||
|
|
|
|
|
|
|
|
|
|
|
|
|
|
|
|
|
|
|
|
|
|
December 31, 2013 |
| December 31, 2012 | ||||||||
|
| % Change in |
|
|
|
|
| % Change in |
|
|
Change in |
| Net Interest |
|
|
| Change in |
| Net Interest |
|
|
Basis Points |
| Income |
| Risk Limit |
| Basis Points |
| Income |
| Risk Limit |
300 |
| 22.98% |
| ≥ -25% |
| 300 |
| 23.42% |
| ≥ -25% |
200 |
| 15.20% |
| ≥ -15% |
| 200 |
| 15.49% |
| ≥ -15% |
100 |
| 7.21% |
| ≥ -10% |
| 100 |
| 7.32% |
| ≥ -10% |
0 |
|
|
|
|
| 0 |
|
|
|
|
(100) |
| -5.32% |
| ≥ -10% |
| (100) |
| -5.03% |
| ≥ -10% |
(200) |
| -10.37% |
| ≥ -15% |
| (200) |
| -9.86% |
| ≥ -15% |
(300) |
| -15.43% |
| ≥ -25% |
| (300) |
| -14.72% |
| ≥ -25% |
41
MID PENN BANCORP, INC.
ITEM 8.FINANCIAL STATEMENTS AND SUPPLEMENTARY DATA
The following audited financial statements are set forth in this Annual Report of Form 10-K on the following pages:
Index to Financial Statements and Supplementary Data