UNITED STATES
SECURITIES AND EXCHANGE COMMISSION
Washington, D.C. 20549
FORM 10-K
(Mark One)
| x | ANNUAL REPORT PURSUANT TO SECTION 13 OR 15(d) OF THE SECURITIES EXCHANGE ACT OF 1934 |
For the fiscal year ended December 31, 201129, 2012
OR
| ¨ | TRANSITION REPORT PURSUANT TO SECTION 13 OR 15(d) OF THE SECURITIES EXCHANGE ACT OF 1934 |
For the transition period from to
Commission file number 001-33264
U.S. AUTO PARTS NETWORK, INC.
(Exact Name of Registrant as Specified in Its Charter)
| Delaware | 68-0623433 | |
(State or Other Jurisdiction of Incorporation or Organization) | (I.R.S. Employer Identification No.) |
16941 Keegan Avenue, Carson, CA 90746
(Address of Principal Executive Offices) (Zip Code)
Registrant’s Telephone Number, Including Area Code: (310) 735-0085
Securities registered pursuant to Section 12(b) of the Act:
Title of each class | Name of each exchange on which registered | |
| Common Stock, $0.001 par value per share | The NASDAQ Stock Market LLC (NASDAQ Global Market) |
Securities registered pursuant to Section 12(g) of the Act: None
Indicate by check mark if the registrant is a well-known seasoned issuer, as defined in Rule 405 of the Securities Act. Yes ¨ No x
Indicate by check mark if the registrant is not required to file reports pursuant to Section 13 or Section 15(d) of the Act. Yes ¨ No x
Indicate by check mark whether the registrant (1) has filed all reports required to be filed by Section 13 or 15(d) of the Securities Exchange Act of 1934 during the preceding 12 months (or for such shorter period that the registrant was required to file such reports), and (2) has been subject to such filing requirements for the past 90 days. Yes x No ¨
Indicate by check mark whether the registrant has submitted electronically and posted on its corporate Website, if any, every Interactive Data File required to be submitted and posted pursuant to Rule 405 of Regulation S-T (§232.405 of this chapter) during the preceding 12 months (or for such shorter period that the registrant was required to submit and post such files). Yes x No ¨
Indicate by a check mark if disclosure of delinquent filers pursuant to Item 405 of Regulation S-K is not contained herein, and will not be contained, to the best of registrant’s knowledge, in definitive proxy or information statements incorporated by reference in Part III of this Form 10-K or any amendment to this Form 10-K. x
Indicate by check mark whether the registrant is a large accelerated filer, an accelerated filer, or a non-accelerated filer, or a smaller reporting company. See the definitions of “large accelerated filer,” “accelerated filer,” and “smaller reporting company” in Rule 12b-2 of the Exchange Act. (Check one):
| Large accelerated filer | ¨ | Accelerated filer | x | |||
| Non-accelerated filer | ¨ (Do not check if a smaller reporting company) | Smaller reporting company | ¨ | |||
Indicate by check mark whether the registrant is a shell company (as defined in Exchange Act Rule 12b-2). Yes ¨ No x
The aggregate market value of the common stock held by non-affiliates of the registrant as of July 2, 2011June 30, 2012 was approximately $112,924,090$61.6 million (based on the closing sales price of the registrant’s common stock on that date). For the purposes of this calculation, shares owned by officers, directors and 10% stockholders known to the registrant have been deemed to be owned by affiliates. This determination of affiliate status is not necessarily a conclusive determination for other purposes.
As of March 19, 2012,2013, there were 30,645,76431,151,075 shares of the registrant’s common stock outstanding.
DOCUMENTS INCORPORATED BY REFERENCE
Portions of our proxy statement for the 20122013 Annual Meeting of Stockholders (the “Proxy Statement”) are incorporated by reference in Part III hereof. Except with respect to information specifically incorporated by reference in this Form 10-K, the Proxy Statement is not deemed to be filed as a part hereof.
ANNUAL REPORT ON FORM 10-K
FOR THE FISCAL YEAR ENDED DECEMBER 31, 201129, 2012
| Page | |||||||
| PART | |||||||
Item | Business | 1 | |||||
Item 1A. | Risk Factors | 5 | |||||
Item 1B. | Unresolved Staff Comments | 17 | |||||
Item 2. | Properties | 18 | |||||
Item 3. | Legal Proceedings | 18 | |||||
Item 4. | Mine Safety Disclosures | 18 | |||||
| PART II | |||||||
Item 5. | Market for Registrant’s Common Equity, Related Stockholder Matters and Issuer Purchases of Equity Securities | ||||||
Item 6. | 21 | ||||||
Item 7. | Management’s Discussion and Analysis of Financial Condition and Results of Operations | 22 | |||||
Item 7A. | |||||||
Item 8. | |||||||
Item 9. | Changes in and Disagreements With Accountants on Accounting and Financial Disclosure | ||||||
Item 9A. | |||||||
| 44 | |||||||
Item 9B. | Other Information | 46 | |||||
| PART III | |||||||
Item 10. | |||||||
Item 11. | |||||||
Item 12. | Security Ownership of Certain Beneficial Owners and Management and Related Stockholder Matters | ||||||
Item 13. | Certain Relationships and Related Transactions, and Director Independence | ||||||
Item 14. | |||||||
| PART IV | |||||||
Item 15. | |||||||
Unless the context requires otherwise, as used in this report, the terms “U.S. Auto Parts,” the “Company,” “we,” “us” and “our” refer to U.S. Auto Parts Network, Inc. and its subsidiaries.
U.S. Auto Parts®, U.S. Auto Parts Network™, PartsTrain®, Partsbin™, Kool-Vue™, Auto-Vend™, JC Whitney®, and StylintrucksTM, amongst others, are our United States trademarks. All other trademarks and trade names appearing in this report are the property of their respective owners.
SPECIAL NOTE REGARDING FORWARD-LOOKING STATEMENTS
The statements included in this report, other than statements or characterizations of historical or current fact, are forward-looking statements within the meaning of Section 27A of the Securities Act of 1933, as amended (the “Securities Act”) and Section 21E of the Securities Exchange Act of 1934, as amended (the “Exchange Act”), and we intend that such forward-looking statements be subject to the safe harbors created thereby. Any forward-looking statements included herein are based on management’s beliefs and assumptions and on information currently available to management. We have attempted to identify forward-looking statements by terms such as “anticipates,” “believes,” “could,” “estimates,” “expects,” “intends,” “may,” “plans,” “potential,” “predicts,” “projects,” “should,” “will,” “would”, “will likely continue,” “will likely result” and variations of these words or similar expressions. These forward-looking statements include, but are not limited to, statements regarding future events, our future operating and financial results, financial expectations, expected growth and strategies, current business indicators, capital needs, financing plans, capital deployment, liquidity, contracts, litigation, product offerings, customers, acquisitions, competition and the status of our facilities. Forward-looking statements, no matter where they occur in this document or in other statements attributable to the Company involve known and unknown risks, uncertainties and other factors that may cause our actual results, performance or achievements to be materially different from any future results, performances or achievements expressed or implied by the forward-looking statements. We discuss many of these risks in greater detail under the heading “Risk Factors” in Part I, Item 1A of this report. Given these uncertainties, you should not place undue reliance on these forward-looking statements. You should read this report and the documents that we reference in this report and have filed as exhibits to the report completely and with the understanding that our actual future results may be materially different from what we expect. Also, forward-looking statements represent our management’s beliefs and assumptions only as of the date of this report. Except as required by law, we assume no obligation to update these forward-looking statements publicly, or to update the reasons actual results could differ materially from those anticipated in these forward-looking statements, even if new information becomes available in the future.
| ITEM 1. | BUSINESS |
Overview
We are one of the leading online sources for automotive aftermarket parts and repair information. Our vision is that vehicle owners never overpay for service and repair. Our mission is to be the service and repair advocate for vehicle owners, to increase their confidence in the repair process, and to provide the most affordable option for their service and repair needs.
We principally sell our products, identified as stock keeping units (“SKUs”), to individual consumers through our network of websites and online marketplaces. Our user-friendly websites provide customers with a comprehensive selection of approximately 21.1 million SKUs with detailed product descriptions and photographs. We have developed a proprietary product database that maps our SKUs to product applications based on vehicle makes, models and years.
Our online sales channel and relationships with suppliers enable us to eliminate several intermediaries in the traditional auto parts supply chain and offer a broad selection of SKUs. Additionally, as an online retailer, we believe greater economies of scale can be achieved online than in brick and mortar stores.
We were incorporated in Delaware in 1995 as a distributor of aftermarket auto parts and launched our first website in 2000. Since then, we have continued to expand our online operations, increasing the number of SKUs sold through our e-commerce network, adding additional websites, improving our internet marketing proficiency, and commencing sales on online marketplaces. In October 2008, we acquired AutoMD.com for the purpose of developing content and a user community to educate consumers on maintenance and service of their vehicles. The site provides auto information, with tools for diagnosing car troubles, locating repair shops and do-it-yourself (“DIY”) repair guides. Currently, AutoMD estimates auto repair costs to make servicing your car less stressful. The repair cost calculator uses real-time shop repair estimates from accredited repair shops in the U.S.
In August 2010, we acquired all of the issued and outstanding shares of Automotive Specialty Accessories and Parts, Inc. and its wholly-owned subsidiary Whitney Automotive Group, Inc. (referred to herein as “WAG”), at the time, the nation’s leading catalog and internet direct marketer of automotive aftermarket performance parts and accessories. This acquisition has expanded our product line into all terrain vehicles, recreational vehicles and motorcycles, as well as provided us deep product knowledge into niche segments like Jeep, Volkswagen and trucks. The expansion of our product line increases our ability to reach customers in the do-it-yourself (“DIY”)DIY automobile and off-road accessories market. Our flagship websites are located atwww.autopartswarehouse.com ,,www.partstrain.com,www.jcwhitney.com,www.jcwhitney.comwww.stylintrucks.com,andwww.stylintrucks.comwww.AutoMD.com andwww.AutoMD.comand our corporate website is located atwww.usautoparts.net.
Our Products
We offer a broad selection of aftermarket auto parts. We frequently refine our product offering by introducing new merchandise and updating the existing product selection to offer a more complete and relevant product line and to remove low-selling or obsolete SKUs. We broadly classify our products into three categories: body parts, engine parts, and performance parts and accessories.
Body Parts. The body parts category is primarily comprised of parts for the exterior of an automobile. Our parts in this category are typically replacement parts for original body parts that have been damaged as a result of a collision or through general wear and tear. The majority of these products are sold through our websites. In addition, we sell an extensive line of mirror products, including our own private-label brand called Kool-Vue™, which are marketed and sold as aftermarket replacement parts and as upgrades to existing parts.
Engine/Hard Parts. The engine parts category is comprised of engine components and other mechanical and electrical parts, which are often referred to as hard parts. These parts serve as replacement parts for existing engine parts and are generally used by professionals and do-it-yourselfers for engine and mechanical maintenance and repair.
Performance Parts and Accessories. We offer performance versions of many parts sold in each of the above categories. Performance parts and accessories generally consist of parts that enhance the performance of the automobile, upgrade existing functionality of a specific part or improve the physical appearance or comfort of the automobile.
Our Sales Channels
Our sales channels include the online channel and the offline channel.
Online Sales Channel. Our online sales channel consists of our e-commerce channel, online marketplaces and online advertising. Our e-commerce channel includes a network of e-commerce websites, supported by our call-center sales agents. We also sell our products through online marketplaces, including third-party auction sites and shopping portals, which provide us with access to additional consumer segments. The majority of our online sales are to individual consumers. We sell online advertising and sponsorship positions on our e-commerce websites to highlight vendor brands and offer complementary products and services that benefit our customers. Advertising is targeted to specific sections of the websites and can also be targeted to specific users based on the vehicles they drive. Advertising partners primarily include part vendors, national automotive aftermarket brands, and automobile manufacturers.
Offline Sales Channel. We sell and deliver to collision repair shops throughout Southern California and the state of Virginia via our offline sales channel. We also market our Kool-Vue™ products nationwide to auto parts wholesale distributors and serve consumers by operating retail outlet stores in Independence, Ohio and LaSalle, Illinois.
Our Fulfillment Operations
We fulfill customer orders using two primary methods: (i) stock-and-ship, where we take physical delivery of merchandise and store it in one of our distribution centers until it is shipped to a customer, and (ii) drop-ship, where merchandise is shipped directly to customers from our suppliers. We believe that the flexibility of fulfilling orders using two different fulfillment methods allows us to offer a broader product selection, helps optimize product inventory and enhances our overall business profitability.
The selection of fulfillment methodology occurs at the time of order submission. When a customer submits an order, our fulfillment system performs a check on the ordered item to determine if it is in stock at any of our distribution centers. Fulfillment teams in our distribution centers then process orders for in-stock products. Orders for non-stocked products are sent to our suppliers and processed via drop-ship.
Stock-and-Ship Fulfillment. Our stock-and-ship products are sourced primarily from manufacturers and other suppliers located in Asia and in the U.S. and are stored in one of our distribution centers in Carson, California; Chesapeake, Virginia; LaSalle, Illinois; and Independence, Ohio. All products received into our distribution centers are entered into our inventory management systems, allowing us to closely monitor inventory availability. We consider a number of factors in determining which items to stock in our distribution centers, including which products can be purchased at a meaningful discount to domestic prices for similar items, which products have historically sold in high volumes, and which products may be out of stock when we attempt to fulfill via drop-ship.
Drop-Ship Fulfillment. We have developed relationships with several U.S.-based automobile parts distributors that operate their own distribution centers and will deliver products directly to our customers. We internally developed a proprietary distributor selection system, Auto-Vend™, which allows us to electronically select multiple vendors for a given order. Auto-Vend™ will attempt to first direct an order to one of our warehouses. If the product is not in stock, Auto-Vend™ will process the order to the next appropriate vendor based on customer location, contractual agreements, and service level history.
Suppliers
We source our products from foreign manufacturers and importers located in Taiwan and China, and from U.S. manufacturers and distributors. We drop-ship orders for low demand products manufactured in the U.S. directly from our manufacturers and distributors. We generally place large-volume orders with these suppliers and, as a result, may receive volume discounts on certain ordered products. Our domestic suppliers offer direct-to-customer shipping, allowing us to save on fulfillment costs and offer a broader selection of products. We have developed application programming interfaces with several of these suppliers that allow us to electronically transmit orders and check inventory availability. We are a significant customer for many of our drop-ship vendors and have long standing relationships and contracts with many of these suppliers. For the fiscal year ended December 31, 2011,29, 2012, two of our drop-ship vendors provided 18.7%16.0% of our total product purchases.
Marketing
Our online marketing efforts are designed to attract visitors to our websites, convert visitors into purchasing customers and encourage repeat purchases among our existing customer base. We use a variety of online marketing methods to attract visitors, including paid search advertising, search engine optimization, affiliate programs, e-mail marketing and inclusion in online shopping engines. To convert visitors into paying customers, we periodically run in-site promotions for discounted purchases. We seek to create cross-selling opportunities by displaying complementary and related products available for sale throughout the purchasing process. We utilize several marketing techniques, including targeted e-mails about specific vehicle promotions, to increase customer awareness of our products.
International Operations
In April 2007, we established offshore operations in the Philippines. Our offshore operations allow us to access a workforce with the necessary technical skills at a significantly lower cost than comparably experienced U.S.-based professionals. Our offshore operations are responsible for a majority of our website development, catalog management, and back office support. Our offshore operations also house our main call center. We have 1,005had 945 employees in the Philippines.Philippines as of December 29, 2012. In January 2013, we laid off 163 employees in the Philippines which reduced our workforce to 782 in the Philippines (for additional details, refer to“Note 16-Subsequent Events” of the Notes to Consolidated Financial Statements, included in Part IV, Item 15 of this report).
In addition to our operations in the Philippines, we have a Canadian subsidiary to facilitate sales of our products in Canada; the subsidiary has no distribution center or employees. We also ship parts directly to Canada and elsewhere throughout the world through a freight forwarding partner.partner throughout the world. In 2011,2012, we shipped auto parts to over 160 different countries.
Competition
The auto repair information and parts industry is competitive and highly fragmented, with products distributed through multi-tiered and overlapping channels. We compete with both online and offline retailers who offer original equipment manufacturer (“OEM”) and aftermarket parts to either the DIY or do-it-for-me (“DIFM”) customer segments. Current or potential competitors include the following:
national auto parts retailers such as Advance Auto Parts, AutoZone, Napa Auto Parts, CarQuest, O’Reilly Automotive and Pep Boys;
large online marketplaces such as Amazon.com and sellers on eBay;
other online retailers and auto repair information websites;
local independent retailers or niche auto parts retailers; and
wholesale aftermarket auto parts distributors such as LKQ Corporation.
We believe the principal competitive factors in our market are helping customers easily find their parts, educating consumers on the service and maintenance of their vehicles, maintaining a proprietary product catalog that maps individual parts to relevant vehicle applications, broad product selection and availability, price, knowledgeable customer service, and rapid order fulfillment and delivery. We believe we compete favorably on the basis of these factors. However, some of our competitors may be larger, have stronger brand recognition or may have access to greater financial, technical and marketing resources or have been operating longer than we have.
Government Regulation
We are subject to federal and state consumer protection laws, including laws protecting the privacy of customer non-public information and the handling of customer complaints and regulations prohibiting unfair and deceptive trade practices. The growth and demand for online commerce has and may continue to result in more stringent consumer protection laws that impose additional compliance burdens on online companies. These laws may cover issues such as user privacy, spyware and the tracking of consumer activities, marketing e-mails and communications, other advertising and promotional practices, money transfers, pricing, content and quality of products and services, taxation, electronic contracts and other communications and information security. In addition, most states have passed laws that prohibit or limit the use of aftermarket auto parts in collision repair work and/or require enhanced disclosure or vehicle owner consent before using aftermarket auto parts in such repair work and additional legislation of this kind may be introduced in the future.
There is also great uncertainty over whether or how existing laws governing issues such as property ownership, sales and other taxes, auctions, libel and personal privacy apply to the Internet and commercial online services. These issues may take years to resolve. For example, tax authorities in a number of states, as well as a Congressional advisory commission, are currently reviewing the appropriate tax treatment of companies engaged in online commerce, and new state tax regulations may subject us to additional state sales and income taxes. New legislation or regulation, the application of laws and regulations from jurisdictions whose laws do not currently apply to our business or the application of existing laws and regulations to the Internet and commercial online services could result in significant additional taxes or regulatory restrictions on our business. These taxes or restrictions could have an adverse effect on our cash flows and results of operations. Furthermore, there is a possibility that we may be subject to significant fines or other payments for any past failures to comply with these requirements.
Environmental
We are subject to environmental regulation as it affects certain of the products we sell. For instance, California currently only allows catalytic converters approved by the state to be sold within the state and, during 2010 and early 2011, the Company met with the California Air Resources Board (“CARB”) to discuss alleged sales of catalytic converters into California by the Company and third-party suppliers that are not compliant with California regulations. CARB informed the Company that penalties shall be assessed with regard to any non-compliant sales. On October 26, 2011, the Company and CARB entered into a settlement agreement related to this inquiry. Without admitting any liability, the Company agreed to pay a non-material cash penalty, subject to being offset by contributions from some of the Company’s third-party suppliers, in exchange for a release from CARB of the Company and such third-party suppliers. There has been an indication that other states may be pursuing the enactment of similar regulations. In addition, if we expanded our product lines, we may be subject to additional environmental regulation.
Seasonality
We believe our business is subject to seasonal fluctuations. We have historically experienced higher sales of body parts in winter months when inclement weather and hazardous road conditions typically result in more automobile collisions. Engine parts and performance parts and accessories have historically experienced higher sales in the summer months when consumers have more time to undertake elective projects to maintain and enhance the performance of their automobiles and the warmer weather during that time is conducive for such projects. We expect the historical seasonality trends to continue to have a material impact on our financial condition and results of operations in subsequent periods.
Employees
As of December 31, 2011,29, 2012, we had 516425 employees in the United States and 1,005945 employees in the Philippines for a total of 1,5211,370 employees. In January 2013, we laid off 13 employees in the United States and 163 employees in the Philippines reducing our workforce to a total of 1,194 employees (for additional details, refer to“Note 16-Subsequent Events” of the Notes to Consolidated Financial Statements, included in Part IV, Item 15 of this report). None of our employees are represented by a labor union, and we have never experienced a work stoppage.
Available Information
Our Annual Reports on Form 10-K, Quarterly Reports on Form 10-Q, Current Reports on Form 8-K, and amendments to those reports are available free of charge on the Investor Relations section of our corporate website located atwww.usautoparts.net as soon as reasonably practicable after such reports are electronically filed with, or furnished to, the Securities and Exchange Commission (“SEC”). The inclusion of our website address in this report does not include or incorporate by reference into this report any information on our website.
| ITEM 1A. | RISK FACTORS |
Our business is subject to a number of risks which are discussed below. Other risks are presented elsewhere in this report and in our other filings with the information incorporated by reference into this report.SEC. You should consider carefully the following risks in addition to the other information contained in this report and our other filings with the SEC, including our subsequent reports on Forms 10-Q and 8-K, and any amendments thereto, before deciding to buy, sell or hold our common stock. If any of thesethe following known or unknown risks or uncertainties actually occurs with material adverse effects on us, our business, financial condition, results of operations and/or liquidity could be seriously harmed. In that event, the market price for our common stock will likely decline and you may lose all or part of your investment.
Risks Related To Our Business
Purchasers of aftermarket auto parts may not choose to shop online, which would prevent us from acquiring new customers who are necessary to the growth of our business.
The online market for aftermarket auto parts is less developed than the online market for many other business and consumer products, and currently represents only a small part.part of the overall aftermarket auto parts market. Our success will depend in part on our ability to attract new customers and to convert customers who have historically purchased auto parts through traditional retail and wholesale operations. Furthermore, we may have to incur significantly higher and more sustained advertising and marketing expenditures or may need to price our products more competitively than we currently anticipate in order to attract additional online consumers and convert them into purchasing customers. Specific factors that could discourage or prevent prospective customers from purchasing from us include:
concerns about buying auto parts without face-to-face interaction with sales personnel;
the inability to physically handle, examine and compare products;
delivery time associated with Internet orders;
concerns about the security of online transactions and the privacy of personal information;
delayed shipments or shipments of incorrect or damaged products;
increased shipping costs; and
the inconvenience associated with returning or exchanging items purchased online.
If the online market for auto parts does not gain widespread acceptance, our sales may decline and our business and financial results may suffer.
We depend on search engines and other online sources to attract visitors to our websites, and if we are unable to attract these visitors and convert themthose into customers in a cost-effective manner, our business and results of operations will be harmed.
Our success depends on our ability to attract online consumers to our websites and convert them into customers in a cost-effective manner. We are significantly dependent upon search engines, shopping comparison sites and other online sources for our website traffic. We are included in search results as a result of both paid search listings, where we purchase specific search terms that will result in the inclusion of our listing, and algorithmic searches that depend upon the searchable content on our sites. We reduced our paid search listings in 2012 and are substantially dependent on algorithmic listings to attract online consumers to our websites.
Algorithmic listings cannot be purchased and instead are determined and displayed solely by a set of formulas utilized by the search engine. Search engines, shopping comparison sites and other online sources have in the past, and will continue to revise their algorithms from time to time in an attempt to optimize their search results. If one or moreFor example, since 2011, Google has released changes to Google’s search results ranking algorithm aimed to lower the rank of certain sites and return other sites near the top of the search engines, shopping comparison sites or other online sources on which we rely for website traffic were to modify its general methodology for how it displays or selects our websites, it could result in fewer consumers clicking through to our websites, and our financial results could be adversely affected.based upon the quality of the particular site as determined by Google. Google made additional updates throughout fiscal year 2012. We operate a multiple website platform that generally allows us to provide multiple search results for a particular algorithmic search. If the search, engines were to limithowever Google is now limiting our display results to a single result or entirely eliminate our results from the algorithmic search. We were negatively impacted by the changes in methodology for how Google displayed or selected our different websites for customer search results, which reduced our unique visitor count and adversely affected our financial results. We expect declines in our unique visitors and our total number of orders to continue in the next twelve months as we address the challenges we are experiencing from Google’s changes in methodology. If other search engines, shopping comparison sites or similar online sources on which we rely for website traffic would significantly decreasewere to modify their general methodology for how they display or select our websites in a manner similar to the changes made by Google, or if Google
continues to make changes to Google’s search results ranking algorithms that cause those algorithms to interact with our platform in a manner that continues to reduce our unique visitors, even fewer consumers may click through to our websites, and our business wouldfinancial results could be materially harmed. Iffurther adversely affected.
Similarly, if any free search engine or shopping comparison site on which we rely begins charging fees for listing or placement, or if one or more of the search engines, shopping comparison sites and other online sources on which we rely for purchased listings, modifies or terminates its relationship with us, our expenses could rise, we could lose customers and traffic to our websites could decrease.
We are in the process of implementing several strategies to attempt to overcome these changes, including the consolidation of our multiple websites to improve our ranking on the search results and pursuing opportunities in third-party online marketplaces, which may not be successful. If these strategies are not successful, our operating results and financial condition could be materially and adversely affected. Additionally, if search engines other than Google begin to limit our display results to a single result or entirely eliminate our results from the algorithmic search due to our multiple website platform, our website traffic could be further impacted and our business would be materially harmed.
In addition, our success in attracting visitors who convert to customers will depend in part upon our ability to identify and purchase relevant search terms, provide relevant content on our sites, and effectively target our other marketing programs such as e-mail campaigns and affiliate programs. If we are unable to attract visitors to our websites and convert them to customers in a cost-effective manner, then our sales may decline and our business and financial results may be harmed.
During fiscal 2012, we experienced a downward trend in our revenues and our net loss continued, and we expect the downward trend in our revenues and net loss to continue for at least the next twelve months.
For fiscal year 2012, we experienced a decrease of 7.0% in net sales, as compared to the same period in 2011, and also had continued net loss during the same period. Overall, we expect these downward trends in our revenues and net loss to continue for at least the next twelve months. If these trends continued it could severely impact our liquidity, as we may not be able to provide positive cash flows from operations in order to meet our working capital requirements. We may need to borrow additional funds from our credit facility, which under certain circumstances may not be available, sell assets or seek equity or additional debt financing in the future. There can be no assurance that we would be able to raise such additional financing or engage in such asset sales on acceptable terms, or at all. If our expected downward trend in revenues and net loss continues for longer than we expect because our strategies to return to positive sales growth and profitability are not successful or otherwise, and if we are not able to raise adequate additional financing or proceeds from asset sales to continue to fund our ongoing operations, we will need to defer, reduce or eliminate significant planned expenditures, restructure or significantly curtail our operations, sell some of our assets, file for bankruptcy or cease operations.
Our operations are restricted by our credit facility, and our ability to borrow funds under our credit facility is subject to a borrowing base.
Our credit facility includes a number of restrictive covenants. These covenants could impair our financing and operational flexibility and make it difficult for us to react to market conditions and satisfy our ongoing capital needs and unanticipated cash requirements. Specifically, such covenants restrict our ability and, if applicable, the ability of our subsidiaries to, among other things:
incur additional debt;
make certain investments and acquisitions;
enter into certain types of transactions with affiliates;
use assets as security in other transactions;
pay dividends on our capital stock or repurchase our equity interests;
sell certain assets or merge with or into other companies;
guarantee the debts of others;
enter into new lines of business;
pay or amend our subordinated debt;
form any joint ventures or subsidiary investments.
In addition, our credit facility is subject to a borrowing base derived from certain of our receivables, inventory, property and equipment. In the event that components of the borrowing base are adversely affected for any reason, including adverse market conditions or downturns in general economic conditions, we could be restricted in the amount of funds we can borrow
under the credit facility. Furthermore, in the event that components of the borrowing base decrease to a level below the amount of loans then-outstanding under the credit facility, we could be required to immediately repay loans to the extent of such shortfall. If any of these events were to occur, it could severely impact our liquidity and capital resources, limit our ability to operate our business and could have a material adverse effect on our financial condition and results of operation.
Furthermore, under certain circumstances, our credit facility may require us to satisfy a financial covenant, which could limit our ability to react to market conditions or satisfy extraordinary capital needs and could otherwise impact our liquidity and capital resources, restrict our financing and have a material adverse effect on our results of operations.
Our ability to comply with the covenants and other terms of our debt obligations will depend on our future operating performance. If we fail to comply with such covenants and terms, we would be required to obtain waivers from our lenders to maintain compliance with our debt obligations. In the future, if we are unable to obtain any necessary waivers and the debt is accelerated, a material adverse effect on our financial condition and future operating performance would result. Additionally, our indebtedness could have important consequences, including the following:
we will have to dedicate a portion of our cash flow to making payments on our indebtedness, thereby reducing the availability of our cash flow to fund working capital, capital expenditures, acquisitions or other general corporate purposes;
certain levels of indebtedness may make us less attractive to potential acquirers or acquisition targets;
certain levels of indebtedness may limit our flexibility to adjust to changing business and market conditions, and make us more vulnerable to downturns in general economic conditions as compared to competitors that may be less leveraged; and
as described in more detail above, the documents providing for our indebtedness contain restrictive covenants that may limit our financing and operational flexibility.
Furthermore, our ability to satisfy our debt service obligations will depend, among other things, upon fluctuations in interest rates, our future operating performance and ability to refinance indebtedness when and if necessary. These factors depend partly on economic, financial, competitive and other factors beyond our control. We may not be able to generate sufficient cash from operations to meet our debt service obligations as well as fund necessary capital expenditures and general operating expenses. In addition, if we need to refinance our debt, or obtain additional debt financing or sell assets or equity to satisfy our debt service obligations, we may not be able to do so on commercially reasonable terms, if at all. If this were to occur, we may need to defer, reduce or eliminate significant planned expenditures, restructure or significantly curtail our operations, sell some of our assets, file for bankruptcy or cease operations.
We may not be able to successfully acquire new businesses or integrate acquisitions, which could cause our business to suffer.
We may not be able to successfully complete potential strategic acquisitions if we cannot reach agreement on acceptable terms or for other reasons. If we buy a company or a division of a company, we may experience difficulty integrating that company’s or division’s personnel and operations, which could negatively affect our operating results. In addition:
the key personnel of the acquired company may decide not to work for us;
customers of the acquired company may decide not to purchase products from us;
we may experience business disruptions as a result of information technology systems conversions;
we may experience additional financial and accounting challenges and complexities in areas such as tax planning, treasury management, and financial reporting;
we may be held liable for environmental, tax or other risks and liabilities as a result of our acquisitions, some of which we may not have discovered during our due diligence;
we may intentionally assume the liabilities of the companies we acquire, which could materially and adversely affect our business;
our ongoing business may be disrupted or receive insufficient management attention;
we may not be able to realize the cost savings or other financial benefits or synergies we anticipated, either in the amount or in the time frame that we expect; and
we may incur debt or issue equity securities to pay for any future acquisition, the issuance of which could involve the imposition of restrictive covenants or be dilutive to our existing stockholders.
As part of our growth strategy, we acquired WAG on August 12, 2010 and we expect that we will selectively pursue additional acquisitions of businesses, technologies or services in order to expand our capabilities, enter new markets or increase our market share. In conjunction with the acquisition of WAG, we recorded a significant valuation allowance against our deferred tax asset, and have incurred greater than usual legal and accounting fees, as well as general and administrative expenses. During the fiscal year ended December 31, 2011, we incurred acquisition and integration related costs of $7.4 million related to the WAG acquisition. During the fourth quarter of 2012 and 2011, we recorded an impairment charge on certain intangible assets related to the WAG acquisition totaling $3.8 million and $5.1 million, respectively. Additionally, because the acquisition of WAG was a stock purchase, we may incur liability for acts taken prior to our acquisition that may involve costly litigation. Integrating any newly acquired businesses’ websites, technologies or services is likely to be expensive and time consuming. For example, our acquisition of All OEM Parts, Inc., Partsbin.com, Inc., and other affiliated companies (collectively “Partsbin”), resulted in significant costs, including a material impairment charge, a write-down of goodwill associated with the acquisition, and a number of challenges, including retaining employees of the acquired company, integrating our order processing and credit processing, integrating our product pricing strategy, and integrating the diverse technologies and differing e-commerce platforms and accounting systems used by each company. Our integration activities in connection with our acquisitions have also caused a substantial diversion of our management’s attention. If we are unable to successfully complete the integration of acquisitions, we may not realize the anticipated synergies from such acquisitions, we may take impairment charges and write-downs associated with such acquisitions, and our business and results of operations could suffer. If our goodwill or intangible assets become impaired we may be required to record a significant charge to earnings. We review our goodwill and intangible assets for impairment when events or changes in circumstances indicate the In connection withacquisitioncarrying value may not be recoverable. Goodwill is required to be evaluated for impairment at least annually. Factors that may be considered are changes in circumstances indicating that the carrying value of WAG,our goodwill or intangible assets may not be recoverable include a decline in stock price and market capitalization, decrease in future cash flows, and slower growth rates in our industry. We may be required to record a significant charge to earnings in our financial statements during the period in which any impairment of our goodwill or intangible assets is determined, resulting in an impact on our results of operations. For example, during the fourth quarter of 2012, we recorded an impairment charge on goodwill of $18.9 million and $5.6 million on other intangible assets. During the fiscal year ended December 31, 2011, we incurred acquisition and integration related costs of $7.4 million and recorded a non-cashan impairment charge on certain trade name intangible assets totalingof $5.1 million (see“Note 6- Goodwill and Intangibles” of the Notes to Consolidated Financial Statements included in Part IV, Item 15 of this report).
Our operations are restricted by our credit facility.
Our credit facility includes a number of restrictive covenants. These covenants could impair our financing and operational flexibility and make it difficult for us to react to market conditions and satisfy our ongoing capital needs and unanticipated cash requirements. Specifically, such covenants restrict our ability and, if applicable, the ability of our subsidiaries to, among other things:
incur additional debt;
make certain investments and acquisitions;
enter into certain types of transactions with affiliates;
use assets as security in other transactions;
pay dividends on our capital stock or repurchase our equity interests;
sell certain assets or merge with or into other companies;
guarantee the debts of others;
enter into new lines of business;
pay or amend our subordinated debt;
form any joint ventures or subsidiary investments.
In addition, our current credit facility requires us to satisfy certain financial covenants. These financial covenants and tests could limit our ability to react to market conditions or satisfy extraordinary capital needs and could otherwise restrict our financing and operations.
Our ability to comply with the covenants and other terms of our debt obligations will depend on our future operating performance. If we fail to comply with such covenants and terms, we would be required to obtain waivers from our lenders to maintain compliance with our debt obligations. As of January 1, 2011 and October 1, 2011, in connection with our credit facility, our consolidated fixed charge coverage ratio was lower than the ratio required by the covenants in the credit facility. In February 2011 and October 2011, we and Silicon Valley Bank (“Bank”) entered into Amendment No. 1 and Amendment No. 2, respectively, to Loan and Security Agreement and Limited Waiver (collectively, the “Amendments”). The Amendments waived our lack of compliance with the consolidated fixed charge coverage ratio covenant in the loan agreement as of January 1, 2011 and October1, 2011. The Amendments also amended the definition of “Consolidated EBITDA” (Earnings Before Interest, Taxes, Depreciation and Amortization) to more readily accommodate our integration of the WAG acquisition. In December 2011, the Company and the Bank entered into Amendment No. 3 to Loan and Security Agreement in connection with a vendor purchasing card program with J.P Morgan Chase Bank, N.A. During March 2012, the Company determined it was probable that the consolidated fixed charge coverage ratio would not be in compliance with the required minimum level for the quarter ending March 31, 2012. This determination was made during the Company’s monitoring of their covenants, which includes monthly calculations of “Consolidated EBITDA” projected to quarter end. As a result, on March 23, 2012, the Company and the Bank entered into Amendment No. 4 to Loan and Security Agreement (the “Fourth Amendment”). The Fourth Amendment reduced the required consolidated fixed charge coverage ratio to a level we are projected to be in compliance with as of March 31, 2012. In the future, if we are unable to obtain any necessary waivers and the debt is accelerated, a material adverse effect on our financial condition and future operating performance would result. Additionally, our indebtedness could have important consequences, including the following:
we will have to dedicate a portion of our cash flow to making interest and principal payments on our indebtedness, thereby reducing the availability of our cash flow to fund working capital, capital expenditures, acquisitions or other general corporate purposes;
certain levels of indebtedness may make us less attractive to potential acquirers or acquisition targets;
certain levels of indebtedness may limit our flexibility to adjust to changing business and market conditions, and make us more vulnerable to downturns in general economic conditions as compared to competitors that may be less leveraged; and
as described in more detail above, the documents providing for our indebtedness contain restrictive covenants that may limit our financing and operational flexibility.
Furthermore, our ability to satisfy our debt service obligations will depend, among other things, upon fluctuations in interest rates, our future operating performance and ability to refinance indebtedness when and if necessary. These factors depend partly on economic, financial, competitive and other factors beyond our control. We may not be able to generate sufficient cash from operations to meet our debt service obligations as well as fund necessary capital expenditures and general operating expenses. In addition, if we need to refinance our debt, or obtain additional financing or sell assets or equity to satisfy our debt service obligations, we may not be able to do so on commercially reasonable terms, if at all.million.
If we are unable to manage the challenges associated with our international operations, the growth of our business could be limited and our business could suffer.
We maintain international business operations in the Philippines. This international operation includes development and maintenance of our websites, Internet marketing personnel,our main call center, and sales and customerback office support services. We also operate a Canadian subsidiary to facilitate sales in Canada. We are subject to a number of risks and challenges that specifically relate to our international operations. Our international operations may not be successful if we are unable to meet and overcome these challenges, which could limit the growth of our business and may have an adverse effect on our business and operating results. These risks and challenges include:
the amount and timing of operating costs and capital expenditures relating to the maintenance and expansion of our business, operations and infrastructure;
difficulties and costs of staffing and managing foreign operations;operations, including any impairment to our relationship with employees caused by a reduction in force;
restrictions imposed by local labor practices and laws on our business and operations;
exposure to different business practices and legal standards;
unexpected changes in regulatory requirements;
the imposition of government controls and restrictions;
political, social and economic instability and the risk of war, terrorist activities or other international incidents;
the failure of telecommunications and connectivity infrastructure;
natural disasters and public health emergencies;
potentially adverse tax consequences;
the failure of local laws to provide a sufficient degree of protection against infringement of our intellectual property; and
fluctuations in foreign currency exchange rates and relative weakness in the U.S. dollar.
We are dependent upon relationships with suppliers in Taiwan, China and the United States for the vast majority of our products.
We acquire substantially all of our products from manufacturers and distributors located in Taiwan, China and the United States. Our top ten suppliers represented approximately 41%43.7% of our total product purchases during the fifty-two weeks ended December 31, 2011 (“fiscal 2011”).29, 2012. We do not have any long-term contracts or exclusive agreements with our foreign suppliers that would ensure our ability to acquire the types and quantities of products we desire at acceptable prices and in a timely manner. In addition, our ability to acquire products from our suppliers in amounts and on terms acceptable to us is dependent upon a number of factors that could affect our suppliers and which are beyond our control. For example, financial or operational difficulties that some of our suppliers may face could result in an increase in the cost of the products we purchase from them. In addition, the increasing consolidation among auto parts suppliers may disrupt or end our relationship with some suppliers, result in product shortages and/or lead to less competition and, consequently, higher prices. Furthermore, as part of our routine business, suppliers extend credit to us in connection with our purchase of their products. In the future, our suppliers may limit the amount of credit they are willing to extend to us in connection with our purchase of their products, if any. If this were to occur, it could impair our ability to acquire the types and quantities of products that we desire from the applicable suppliers on acceptable terms, severely impact our liquidity and capital resources, limit our ability to operate our business and could have a material adverse effect on our financial condition and results of operation.
In addition, because many of our suppliers are outside of the United States, additional factors could interrupt our relationships or affect our ability to acquire the necessary products on acceptable terms, including:
political, social and economic instability and the risk of war or other international incidents in Asia or abroad;
fluctuations in foreign currency exchange rates that may increase our cost of products;
tariffs and protectionist laws and business practices that favor local businesses;
difficulties in complying with import and export laws, regulatory requirements and restrictions; and
natural disasters and public health emergencies.
IfAdditionally, if we do not maintain our relationships with our existing suppliers or develop relationships with new suppliers on acceptable commercial terms, we may not be able to continue to offer a broad selection of merchandise at competitive prices and, as a result, we could lose customers and our sales could decline.
We are dependent upon third parties for distribution and fulfillment operations with respect to many of our products.
For a number of the products that we sell, we outsource the distribution and fulfillment operation and are dependent on our distributors to manage inventory, process orders and distribute those products to our customers in a timely manner. For fiscal 2011,the fifty-two weeks ended December 29, 2012, our product purchases from two drop-ship suppliers represented 18.7%16.0% of our total product purchases. If we do not maintain our existing relationships with these suppliers and our other distributors on acceptable commercial terms, we will need to obtain other suppliers and may not be able to continue to offer a broad selection of merchandise at competitive prices, and our sales may decrease.
In addition, because we outsource to distributors a number of these traditional retail functions relating to those products, we have limited control over how and when orders are fulfilled. We also have limited control over the products that our distributors purchase or keep in stock. Our distributors may not accurately forecast the products that will be in high demand or they may allocate popular products to other resellers, resulting in the unavailability of certain products for delivery to our customers. Any inability to offer a broad array of products at competitive prices and any failure to deliver those products to our customers in a timely and accurate manner may damage our reputation and brand and could cause us to lose customers.
We depend on third-party delivery services to deliver our products to our customers on a timely and consistent basis, and any deterioration in our relationship with any one of these third parties or increases in the fees that they charge could harm our reputation and adversely affect our business and financial condition.
We rely on third parties for the shipment of our products and we cannot be sure that these relationships will continue on terms favorable to us, or at all. Shipping costs have increased from time to time, and may continue to increase, which could harm our business, prospects, financial condition and results of operations by increasing our costs of doing business and resulting in reduced gross margins. In addition, if our relationships with these third parties are terminated or impaired, or if these third parties are unable to deliver products for us, whether due to labor shortage, slow down or stoppage, deteriorating financial or business condition, responses to terrorist attacks or for any other reason, we would be required to use alternative carriers for the shipment of products to our customers. Changing carriers could have a negative effect on our business and operating results due to reduced visibility of order status and package tracking and delays in order processing and product delivery, and we may be unable to engage alternative carriers on a timely basis, upon terms favorable to us, or at all.
If commodity prices such as fuel, plastic and steel continue to increase, our margins may shrink.
Our third party delivery services have increased fuel surcharges from time to time, and such increases negatively impact our margins, as we are generally unable to pass all of these costs directly to consumers. Increasing prices in the component materials for the parts we sell may impact the availability, the quality and the price of our products, as suppliers search for alternatives to existing materials and as they increase the prices they charge. We cannot ensure that we can recover all the increased costs through price increases, and our suppliers may not continue to provide the consistent quality of product as they may substitute lower cost materials to maintain pricing levels, all of which may have a negative impact on our business and results of operations.
If our fulfillment operations are interrupted for any significant period of time or are not sufficient to accommodate increased demand, our sales would decline and our reputation could be harmed.
Our success depends on our ability to successfully receive and fulfill orders and to promptly deliver our products to our customers. The majority of orders for our auto body parts products are filled from our inventory in our distribution centers, where all our inventory management, packaging, labeling and product return processes are performed. Increased demand and other considerations may require us to expand our distribution centers or transfer our fulfillment operations to larger facilities in the future.
Our distribution centers are susceptible to damage or interruption from human error, fire, flood, power loss, telecommunications failures, terrorist attacks, acts of war, break-ins, earthquakes and similar events. We do not currently maintain back-up power systems at our fulfillment centers. We do not presently have a formal disaster recovery plan and our business interruption insurance may be insufficient to compensate us for losses that may occur in the event operations at our fulfillment center are interrupted. Any interruptions in our fulfillment operations for any significant period of time, including interruptions resulting from the expansion of our existing facilities or the transfer of operations to a new facility, could damage our reputation and brand and substantially harm our business and results of operations and alternate arrangements may increase the cost of fulfillment. In addition, if we do not successfully expand our fulfillment capabilities in response to increases in demand, we may not be able to substantially increase our net sales.
We rely on bandwidth and data center providers and other third parties to provide products to our customers, and any failure or interruption in the services provided by these third parties could disrupt our business and cause us to lose customers.
We rely on third-party vendors, including data center and bandwidth providers. Any disruption in the network access or co-location services, which are the services that house and provide Internet access to our servers, provided by these third-party providers or any failure of these third-party providers to handle current or higher volumes of use could significantly harm our business. Any financial or other difficulties our providers face may have negative effects on our business, the nature and extent of which we cannot predict. We exercise little control over these third-party vendors, which increases our vulnerability to problems with the services they provide. We also license technology and related databases from third parties to facilitate elements of our e-commerce platform. We have experienced and expect to continue to experience interruptions and delays in service and availability for these elements. Any errors, failures, interruptions or delays experienced in connection with these third-party technologies could negatively impact our relationship with our customers and adversely affect our business.
Our systems also heavily depend on the availability of electricity, which also comes from third-party providers. If we were to experience a major power outage, we would have to rely on back-up generators. These back-up generators may not operate properly through a major power outage, and their fuel supply could also be inadequate during a major power outage. Information systems such as ours may be disrupted by even brief power outages, or by the fluctuations in power resulting from switches to and from backup generators. This could disrupt our business and cause us to lose customers.
We face intense competition and operate in an industry with limited barriers to entry, and some of our competitors may have greater resources than us and may be better positioned to capitalize on the growing e-commerce auto parts market.
The auto parts industry is competitive and highly fragmented, with products distributed through multi-tiered and overlapping channels. We compete with both online and offline retailers who offer OEMoriginal equipment manufacturer (“OEM”) and aftermarket auto parts to either the DIY or DIFMdo-it-for-me customer segments. Current or potential competitors include the following:
national auto parts retailers such as Advance Auto Parts, AutoZone, Napa Auto Parts, CarQuest, O’Reilly Automotive and Pep Boys;
large online marketplaces such as Amazon.com and eBay;
other online retailers and auto repair information websites;
local independent retailers or niche auto parts online retailers; and
wholesale aftermarket auto parts distributors such as LKQ Corporation.
Barriers to entry are low, and current and new competitors can launch websites at a relatively low cost. Many of our current and potential offline competitors have longer operating histories, larger customer bases, greater brand recognition and significantly greater financial, marketing, technical, management and other resources than we do. For example, in the event that online marketplace companies such as Amazon or eBay, who have larger customer bases, greater brand recognition and significantly greater resources than we do, focus more of their resources on competing in the aftermarket auto parts market, it could have a material adverse effect on our business and results of operations. In addition, some of our competitors have used and may continue to use aggressive pricing tactics and devote substantially more financial resources to website and system development than we do. We expect that competition will further intensify in the future as Internet use and online commerce continue to grow worldwide. Increased competition may result in reduced sales, lower operating margins, reduced profitability, loss of market share and diminished brand recognition.
We would also experienceAdditionally, we have experienced significant competitive pressure if any offrom our suppliers were to sellwho are now selling their products directly to customers. Since our suppliers have access to merchandise at very low costs, they couldcan sell products at lower prices and maintain higher gross margins on their product sales than we can. In this event,Our financial results have been negatively impacted by direct sales from our suppliers to our current and potential customers, may decideand we expect our total number of orders and average order value to purchase directly from these suppliers. Increasedcontinue to decline in the next 12 months due to increased competition. Continued competition from any suppliersuppliers of ours that are capable of maintaining high sales volumes and acquiring products at lower prices than us could significantly reducewill continue to negatively impact our business and results of operations, including through reduced sales, lower operating margins, reduced profitability, loss of market share and diminished brand recognition. We are in the process of implementing several strategies to attempt to overcome the challenges created by our suppliers selling directly to our customers and potential customers, including by lowering our prices by increasing foreign sourced products and by improvements in our websites, which may not be successful. If these strategies are not successful, our operating results and financial conditions could be materially and adversely impact our financial results.affected.
If we fail to offer a broad selection of products at competitive prices to meet our customers’ demands, our revenue could decline.
In order to expand our business, we must successfully offer, on a continuous basis, a broad selection of auto parts that meet the needs of our customers.customers, including by being the first to market with new SKUs. Our auto parts are used by consumers for a variety of purposes, including repair, performance, improved aesthetics and functionality. In addition, to be successful, our product offerings must be broad and deep in scope, competitively priced, well-made, innovative and attractive to a wide range of consumers. We cannot predict with certainty that we will be successful in offering products that meet all of these requirements. If our product offerings fail to satisfy our customers’ requirements or respond to changes in customer preferences, our revenue could decline.
Challenges by OEMs to the validity of the aftermarket auto parts industry and claims of intellectual property infringement could adversely affect our business and the viability of the aftermarket auto parts industry.
OEMs have attempted to use claims of intellectual property infringement against manufacturers and distributors of aftermarket products to restrict or eliminate the sale of aftermarket products that are the subject of the claims. The OEMs have brought such claims in federal court and with the United States International Trade Commission. We have received in the past, and we anticipate we may in the future receive, communications alleging that certain products we sell infringe the patents, copyrights, trademarks and trade names or other intellectual property rights of OEMs or other third parties. For instance, after approximately three and a half years of litigation and related costs and expenses, on April 16, 2009, we entered into a settlement agreement with Ford Motor Company and Ford Global Technologies, LLC that ended the two legal actions that were initiated by Ford against us related to claims of intellectual property infringement.
The United States Patent and Trademark Office records indicate that OEMs are seeking and
obtaining more design patents then they have in the past. To the extent that the OEMs are successful with intellectual property infringement claims, we could be restricted or prohibited from selling certain aftermarket products which could have an adverse effect on our business. Infringement claims could also result in increased costs of doing business arising from increased legal expenses, adverse judgments or settlements or changes to our business practices required to settle such claims or satisfy any judgments. Litigation could result in interpretations of the law that require us to change our business practices or otherwise increase our costs and harm our business. We do not maintain insurance coverage to cover the types of claims that could be asserted. If a successful claim were brought against us, it could expose us to significant liability.
If we are unable to protect our intellectual property rights, our reputation and brand could be impaired and we could lose customers.
We regard our trademarks, trade secrets and similar intellectual property such as our proprietary back-end order processing and fulfillment code and process as important to our success. We rely on trademark and copyright law, and trade secret protection, and confidentiality and/or license agreements with employees, customers, partners and others to protect our proprietary rights. We cannot be certain that we have taken adequate steps to protect our proprietary rights, especially in countries where the laws may not protect our rights as fully as in the United States. In addition, our proprietary rights may be infringed or misappropriated, and we could be required to incur significant expenses to preserve them. For instance, on June 25, 2009,In the past we have filed a lawsuit in United States District Court, Central District of California against PartsGeek LLC, its members and several of its employees, alleging, among other things, misappropriation of trade secrets, breach of contract and unfair competition. We are requesting both monetary and injunctive relief.litigation to protect our intellectual property rights. The outcome of such litigation iscan be uncertain, and the cost of prosecuting thesuch litigation may have an adverse impact on our earnings. We have common law trademarks, as well as pending federal trademark registrations for several marks and several registered marks. Even if we obtain approval of such pending registrations, the resulting registrations may not adequately cover our intellectual property or protect us against infringement by others. Effective trademark, service mark, copyright, patent and trade secret protection may not be available in every country in which our products and services may be made available online. We also currently own or control a number of Internet domain names, includingwww.usautoparts.net,www.autopartswarehouse.com,www.partstrain.com,www.jcwhitney.com,www.AutoMD.com andwww.stylintrucks.com, and have invested time and money in the purchase of domain names and other intellectual property, which may be impaired if we cannot protect such intellectual property. We may be unable to protect these domain names or acquire or maintain relevant domain names in the United States and in other countries. If we are not able to protect our trademarks, domain names or other intellectual property, we may experience difficulties in achieving and maintaining brand recognition and customer loyalty.
If our product catalog database is stolen, misappropriated or damaged, or if a competitor is able to create a substantially similar catalog without infringing our rights, then we may lose an important competitive advantage.
We have invested significant resources and time to build and maintain our product catalog, which is maintained in the form of an electronic database, which maps SKUs to relevant product applications based on vehicle makes, models and years. We believe that our product catalog provides us with an important competitive advantage in both driving traffic to our websites and converting that traffic to revenue by enabling customers to quickly locate the products they require. We cannot assure you that we will be able to protect our product catalog from unauthorized copying or theft or that our product catalog will continue to operate adequately, without any technological challenges. In addition, it is possible that a competitor could develop a catalog or database that is similar to or more comprehensive than ours, without infringing our rights. In the event our product catalog is damaged or is stolen, copied or otherwise replicated to compete with us, whether lawfully or not, we may lose an important competitive advantage and our business could be harmed.
Our e-commerce system is dependent on open-source software, which exposes us to uncertainty and potential liability.
We utilize open-source software such as Linux, Apache, MySQL, PHP, Fedora and Perl throughout our web properties and supporting infrastructure although we have created proprietary programs. Open-source software is maintained and upgraded by a general community of software developers under various open-source licenses, including the GNU General Public License (“GPL”). These developers are under no obligation to maintain, enhance or provide any fixes or updates to this software in the future. Additionally, under the terms of the GPL and other open-source licenses, we may be forced to release to the public source-code internally developed by us pursuant to such licenses. Furthermore, if any of these developers contribute any code of others to any of the software that we use, we may be exposed to claims and liability for intellectual property infringement. A number of lawsuits are currently pending against third parties over the ownership rights to the various components within some open-source software that we use. If the outcome of these lawsuits is unfavorable, we may be held liable for intellectual property infringement based on our use of these open-source software components. We may also be forced to implement changes to the code-base for this software or replace this software with internally developed or commercially licensed software.
We face exposure to product liability lawsuits.
The automotive industry in general has been subject to a large number of product liability claims due to the nature of personal injuries that result from car accidents or malfunctions. As a distributor of auto parts, including parts obtained overseas, we could be held liable for the injury or damage caused if the products we sell are defective or malfunction. While we carry insurance against product liability claims, if the damages in any given action were high or we were subject to multiple lawsuits, the damages and costs could exceed the limits of our insurance coverage. If we were required to pay substantial damages as a result of these lawsuits, it may seriously harm our business and financial condition. Even defending against unsuccessful claims could cause us to incur significant expenses and result in a diversion of management’s attention. In addition, even if the money damages themselves did not cause substantial harm to our business, the damage to our reputation and the brands offered on our websites could adversely affect our future reputation and our brand, and could result in a decline in our net sales and profitability.
We rely on key personnel and may need additional personnel for the success and growth of our business.
Our business is largely dependent on the personal efforts and abilities of highly skilled executive, technical, managerial, merchandising, marketing, and call center personnel. Competition for such personnel is intense, and we cannot assure you that we will be successful in attracting and retaining such personnel. The loss of any key employee or our inability to attract or retain other qualified employees could harm our business and results of operations.
System failures, including failures due to natural disasters or other catastrophic events, could prevent access to our websites, which could reduce our net sales and harm our reputation.
Our sales would decline and we could lose existing or potential customers if they are not able to access our websites or if our websites, transactions processing systems or network infrastructure do not perform to our customers’ satisfaction. Any Internet network interruptions or problems with our websites could:
prevent customers from accessing our websites;
reduce our ability to fulfill orders or bill customers;
reduce the number of products that we sell;
cause customer dissatisfaction; or
damage our brand and reputation.
We have experienced brief computer system interruptions in the past, and we believe they will continue to occur from time to time in the future. Our systems and operations are also vulnerable to damage or interruption from a number of sources, including a natural disaster or other catastrophic event such as an earthquake, typhoon, volcanic eruption, fire, flood, terrorist attack, computer viruses, power loss, telecommunications failure, physical and electronic break-ins and other similar events. For example, our headquarters and the majority of our infrastructure, including some of our servers, are located in Southern California, a seismically active region. We also maintain offshore and outsourced operations in the Philippines, an area that has been subjected to a typhoon and a volcanic eruption in the past. In addition, California has in the past experienced power outages as a result of limited electrical power supplies and due to recent fires in the southern part of the state. Such outages, natural disasters and similar events may recur in the future and could disrupt the operation of our business. Our technology infrastructure is also vulnerable to computer viruses, physical or electronic break-ins and similar disruptions. Although the critical portions of our systems are redundant and backup copies are maintained offsite, not all of our systems and data are fully redundant. We do not presently have a formal disaster recovery plan in effect and may not have sufficient insurance for losses that may occur from natural disasters or catastrophic events. Any substantial disruption of our technology infrastructure could cause interruptions or delays in our business and loss of data or render us unable to accept and fulfill customer orders or operate our websites in a timely manner, or at all.
Risks Related To Our Common Stock
Our stock price has been and may continue to be volatile, which may result in losses to our stockholders.
The market prices of technology and e-commerce companies generally have been extremely volatile and have recently experienced sharp share price and trading volume changes. The trading price of our common stock is likely to be volatile and could fluctuate widely in response to, among other things, the risk factors described in this report and other factors beyond our control such as fluctuations in the operations or valuations of companies perceived by investors to be comparable to us, our ability to meet analysts’ expectations, or conditions or trends in the Internet or auto parts industries.
Since the completion of our initial public offering in February 2007 through December 29, 2012, the trading price of our common stock has been volatile, ranging from a high of $12.61 per share to a low per share of $1.00. We have also experienced significant fluctuations in the trading volume of our common stock. General economic and political conditions
unrelated to our performance may also adversely affect the price of our common stock. In the past, following periods of volatility in the market price of a public company’s securities, securities class action litigation has often been initiated. Due to the inherent uncertainties of litigation, we cannot predict the ultimate outcome of any such litigation if it were initiated. The initiation of any such litigation or an unfavorable result could have a material adverse effect on our financial condition and results of operation.
Our executive officers and directors own a significant percentage of our stock.
As of December 31, 2011,29, 2012, our executive officers and directors and entities that are affiliated with them beneficially owned in the aggregate approximately 46.1%45.1% of our outstanding shares of common stock. This significant concentration of share ownership may adversely affect the trading price for our common stock because investors often perceive disadvantages in owning stock in companies with controlling stockholders. Also, these stockholders, acting together, will be able to significantly influence our management and affairs and matters requiring stockholder approval including the election of our entire Board of Directors and certain significant corporate actions such as mergers, consolidations or the sale of substantially all of our assets. As a result, this concentration of ownership could delay, defer or prevent others from initiating a potential merger, takeover or other change in our control, even if these actions would benefit our other stockholders and us.
Our future operating results may fluctuate and may fail to meet market expectations.
We expect that our revenue and operating results will continue to fluctuate from quarter to quarter due to various factors, many of which are beyond our control. If our quarterly revenue or operating results fall below the expectations of investors or securities analysts, the price of our common stock could significantly decline. The factors that could cause our operating results to continue to fluctuate include, but are not limited to:
fluctuations in the demand for aftermarket auto parts;
price competition on the Internet or among offline retailers for auto parts;
our ability to attract visitors to our websites and convert those visitors into customers;customers, including to the extent based on our ability to successfully work with different search engines to drive visitors to our websites;
our ability to successfully sell our products through third-party online marketplaces;
competition from companies that have longer operating histories, larger customer bases, greater brand recognition, access to merchandise at lower costs and significantly greater resources than we do, like third-party online market places and our suppliers;
our ability to maintain and expand our supplier and distribution relationships without significant price increases or reduced service levels;
our ability to borrow funds under our credit facility;
the effects of seasonality on the demand for our products;
our ability to accurately forecast demand for our products, price our products at market rates and maintain appropriate inventory levels;
our ability to build and maintain customer loyalty;
our ability to successfully integrate our acquisitions;
infringement actions that could impact the viability of the auto parts aftermarket or portions thereof;
the success of our brand-building and marketing campaigns;
our ability to accurately project our future revenues, earnings, and results of operations;
government regulations related to use of the Internet for commerce, including the application of existing tax regulations to Internet commerce and changes in tax regulations;
technical difficulties, system downtime or Internet brownouts;
the amount and timing of operating costs and capital expenditures relating to expansion of our business, operations and infrastructure; and
the impact of adverse economic conditions on retail sales, in general.
If we fail to maintain an effective system of internal control over financial reporting or comply with Section 404 of the Sarbanes-Oxley Act of 2002, we may not be able to accurately report our financial results or prevent fraud, and our stock price could decline.
While management has concluded that our internal controls over financial reporting were effective as of December 31, 2011,29, 2012, we have in the past, and could in the future, have a significant deficiency or material weakness or significant deficiency in our control over financial reporting or fail to comply with Section 404 of the Sarbanes-Oxley Act of 2002. If we fail to properly maintain an effective system of internal control over financial reporting, it could impact our ability to prevent fraud or to issue our financial statements in a timely manner that presents fairly our financial condition and results of operations. The existence of any such deficiencies or weaknesses, even if cured, may also lead to the loss of investor confidence in the reliability of our financial statements, could harm our business and negatively impact the trading price of our common stock. Such deficiencies or material weaknesses may also subject us to lawsuits, investigations and other penalties.
Our charter documents could deter a takeover effort, which could inhibit your ability to receive an acquisition premium for your shares.
Provisions in our certificate of incorporation and bylaws could make it more difficult for a third party to acquire us, even if doing so would be beneficial to our stockholders. Such provisions include the following:
our Board of Directors are authorized, without prior stockholder approval, to create and issue preferred stock which could be used to implement anti-takeover devices;
advance notice is required for director nominations or for proposals that can be acted upon at stockholder meetings;
our Board of Directors is classified such that not all members of our board are elected at one time, which may make it more difficult for a person who acquires control of a majority of our outstanding voting stock to replace all or a majority of our directors;
stockholder action by written consent is prohibited except with regards to an action that has been approved by the Board;
special meetings of the stockholders are permitted to be called only by the chairman of our Board of Directors, our chief executive officer or by a majority of our Board of Directors;
stockholders are not permitted to cumulate their votes for the election of directors; and
|
stockholders are permitted to amend certain provisions of our bylaws only upon receiving at least 66 2/3% of the votes entitled to be cast by holders of all outstanding shares then entitled to vote generally in the election of directors, voting together as a single class.
We do not intend to pay dividends on our common stock.
We currently intend to retain any future earnings and do not expect to pay any cash dividends on our capital stock for the foreseeable future.
General Market and Industry Risk
Economic conditions have had, and may continue to have an adverse effect on the demand for aftermarket auto parts and could adversely affect our sales and operating results.
We sell aftermarket auto parts consisting of body and engine parts used for repair and maintenance, performance parts used to enhance performance or improve aesthetics and accessories that increase functionality or enhance a vehicle’s features. Demand for our products has been and may continue to be adversely affected by general economic conditions. In declining economies, consumers often defer regular vehicle maintenance and may forego purchases of nonessential performance and accessories products, which can result in a decrease in demand for auto parts in general. Consumers also defer purchases of new vehicles, which immediately impacts performance parts and accessories, which are generally purchased in the first six months of a vehicle’s lifespan. In addition, during economic downturns some competitors may become more aggressive in their pricing practices, which would adversely impact our gross margin and could cause large fluctuations in our stock price. Certain suppliers may exit the industry which may impact our ability to procure parts and may adversely impact gross margin as the remaining suppliers increase prices to take advantage of limited competition.
Vehicle miles driven, vehicle accident rates and insurance companies’ willingness to accept a variety of types of replacement parts in the repair process have fluctuated and may decrease, which could result in a decline of our revenues and negatively affect our results of operations.
We and our industry depend on the number of vehicle miles driven, vehicle accident rates and insurance companies’ willingness to accept a variety of types of replacement parts in the repair process. Decreased miles driven, caused in part by higher gas prices, reduce the number of accidents and corresponding demand for crash parts, and reduce the wear and tear on vehicles with a corresponding reduction in demand for vehicle repairs and replacement or hard parts, allparts. If consumers continue to drive less in the future, as a result of whichhigher gas prices or otherwise, our sales may reducedecline and our revenuesbusiness and adversely impact ourfinancial results of operations.may suffer.
The success of our business depends on the continued growth of the Internet as a retail marketplace and the related expansion of the Internet infrastructure.
Our future success depends upon the continued and widespread acceptance and adoption of the Internet as a vehicle to purchase products. If customers or manufacturers are unwilling to use the Internet to conduct business and exchange information, our business will fail. The commercial acceptance and use of the Internet may not continue to develop at historical rates, or may not develop as quickly as we expect. The growth of the Internet, and in turn the growth of our business, may be inhibited by concerns over privacy and security, including concerns regarding “viruses” and “worms,” reliability issues arising from outages or damage to Internet infrastructure, delays in development or adoption of new standards and protocols to handle the demands of increased Internet activity, decreased accessibility, increased government regulation, and taxation of Internet activity. In addition, our business growth may be adversely affected if the Internet infrastructure does not keep pace with the growing Internet activity and is unable to support the demands placed upon it, or if there is any delay in the development of enabling technologies and performance improvements.
Negative conditions in the global credit markets may impair the liquidity of a portion of our investments portfolio, and adversely affect our results of operations and access to financing.
Our investment securities consist of high-grade auction rate preferred securities (“ARPS”). As of December 31, 2011, our long-term marketable securities were comprised of $2.1 million (fair value) of high-grade (AAA rated) ARPS issued primarily by closed end funds that primarily hold debt obligations from municipalities. The recent negative conditions in the global credit markets have prevented some investors from liquidating their holdings, including their holdings of ARPS.
In response to the credit situation, in February 2008, we instructed our investment advisor to liquidate all our investments in closed end funds and move these funds into money market investments, but there was insufficient demand at auction for our remaining four high-grade ARPS, representing approximately $7.8 million (par value) at that time. As a result, our remaining ARPS currently are not liquid, and have been reclassified as long-term investments. For the period June 30, 2008 through December 31, 2011, approximately $5.7 million of our investments in ARPS were redeemed at par value, but we do not know when we will have access to the capital in our remaining $2.1 million (par value) of ARPS investments. In the event we need to access the funds that are in an illiquid state, we will not be able to do so without a loss of principal or until a future auction on these investments is successful, the securities are redeemed by the issuer or a secondary market emerges. If we cannot readily access these funds, we may be required to borrow funds or issue additional debt or equity securities to meet our capital requirements.
As of December 31, 2011, management concluded that these remaining investments were temporarily impaired and has recognized an unrealized loss in other comprehensive income totaling $21,000. Management is not sure that these investments will not be settled in the short term, although the market for these investments is presently uncertain. If the credit ratings of the security issuers deteriorate and any decline in market value is determined to be other-than-temporary, we would be required to adjust the carrying value of the investment through an additional impairment charge.
We may be subject to liability for sales and other taxes and penalties, which could have an adverse effect on our business.
We currently collect sales or other similar taxes only on the shipment of goods to the states of California, Kansas, Virginia, Illinois and Ohio. The U.S. Supreme Court has ruled that vendors whose only connection with customers in a state is by common carrier or the U.S. mail are free from state-imposed duties to collect sales and use taxes in that state. However, states could seek to impose additional income tax obligations or sales tax collection obligations on out-of-state companies such as ours, which engage in or facilitate online commerce, based on their interpretation of existing laws, including the Supreme Court ruling, or specific facts relating to us. If sales tax obligations are successfully imposed upon us by a state or other jurisdiction, we could be exposed to substantial tax liabilities for past sales and penalties and fines for failure to collect sales taxes. We could also suffer decreased sales in that state or jurisdiction as the effective cost of purchasing goods from us increases for those residing in that state or jurisdiction.
In addition, a number of states, as well as the U.S. Congress, have been considering various initiatives that could limit or supersede the Supreme Court’s apparent position regarding sales and use taxes on Internet sales. If any of these initiatives are enacted, we could be required to collect sales and use taxes in additional states and our revenue could be adversely affected. Furthermore, the U.S. Congress has not yet extended a moratorium, which was first imposed in 1998 but has since expired, on state and local governments’ ability to impose new taxes on Internet access and Internet transactions. The imposition by state and local governments of various taxes upon Internet commerce could create administrative burdens for us as well as substantially impair the growth of e-commerce and adversely affect our revenue and profitability. Since our service is available over the Internet in multiple states, these jurisdictions may require us to qualify to do business in these states. If we fail to qualify in a jurisdiction that requires us to do so, we could face liabilities for taxes and penalties.
Security threats to our IT infrastructure could expose us to liability, and damage our reputation and business
It is essential to our business strategy that our technology and network infrastructure remain secure and is perceived by our customers to be secure. Despite security measures, however, any network infrastructure may be vulnerable to cyber-attacks by hackers and other security threats. As a leading online source for automotive aftermarket parts and repair information, we may face cyber-attacks that attempt to penetrate our network security, including our data centers, to sabotage or otherwise disable our network of websites and online marketplaces, misappropriate our or our customers’ proprietary information, which may include personally identifiable information, or cause interruptions of our internal systems and services. If successful, any of these attacks could negatively affect our reputation, damage our network infrastructure and our ability to sell our products, harm our relationship with customers that are affected and expose us to financial liability.
If we do not respond to technological change, our websites could become obsolete and our financial results and conditions could be adversely affected.
We maintain a network of websites which requires substantial development and maintenance efforts, and entails significant technical and business risks. To remain competitive, we must continue to enhance and improve the responsiveness, functionality and features of our websites. The Internet and the e-commerce industry are characterized by rapid technological change, the emergence of
new industry standards and practices and changes in customer requirements and preferences. Therefore, we may be required to license emerging technologies, enhance our existing websites, develop new services and technology that address the increasingly sophisticated and varied needs of our current and prospective customers, and adapt to technological advances and emerging industry and regulatory standards and practices in a cost-effective and timely manner. Our ability to remain technologically competitive may require substantial expenditures and lead time and our failure to do so may harm our business and results of operations.
Existing or future government regulation could expose us to liabilities and costly changes in our business operations and could reduce customer demand for our products and services.
We are subject to federal and state consumer protection laws and regulations, including laws protecting the privacy of customer non-public information and regulations prohibiting unfair and deceptive trade practices, as well as laws and regulations governing businesses in general and the Internet and e-commerce and certain environmental laws. Additional laws and regulations may be adopted with respect to the Internet, the effect of which on e-commerce is uncertain. These laws may cover issues such as user privacy, spyware and the tracking of consumer activities, marketing e-mails and communications, other advertising and promotional practices, money transfers, pricing, content and quality of products and services, taxation, electronic contracts and other communications, intellectual property rights, and information security. Furthermore, it is not clear how existing laws such as those governing issues such as property ownership, sales and other taxes, trespass, data mining and collection, and personal privacy apply to the Internet and e-commerce. For example, California has enacted legislation banning the sale of catalytic converters that do not meet California emissions regulations, and the current federal administration has indicated that 13 additional states will be allowed to enact their own legislation that mirrors the California legislation. During 2010 and in early 2011, we met with CARB to discuss alleged sales of catalytic converters into California by us and our third-party suppliers that are not compliant with California regulations. CARB informed us that penalties may be assessed with regard to any non-compliant sales and, on October 26, 2011, we and CARB entered into a settlement agreement related this inquiry. Without admitting any liability, we agreed to pay a non-material cash penalty, which was partially offset by contributions from some of our third-party suppliers, in exchange for a release from CARB of us and such third-party suppliers. To the extent we expand into international markets, we will be faced with complying with local laws and regulations, some of which may be materially different than U.S. laws and regulations. Any such foreign law or regulation, any new U.S. law or regulation, or the interpretation or application of existing laws and regulations to the Internet or other online services or our business in general, may have a material adverse effect on our business, prospects, financial condition and results of operations by, among other things, impeding the growth of the Internet, subjecting us to fines, penalties, damages or other liabilities, requiring costly changes in our business operations and practices, and reducing customer demand for our products and services. We do not maintain insurance coverage to cover the types of claims or liabilities that could arise as a result of such regulation.
We may be affected by global climate change or by legal, regulatory, or market responses to such change.
The growing political and scientific sentiment is that global weather patterns are being influenced by increased levels of greenhouse gases in the earth’s atmosphere. This growing sentiment and the concern over climate change have led to legislative and regulatory initiatives aimed at reducing greenhouse gas emissions. For example, proposals that would impose mandatory requirements on greenhouse gas emissions continue to be considered by policy makers in the United States. Laws enacted that directly or indirectly affect our suppliers (through an increase in the cost of production or their ability to produce satisfactory products) or our business (through an impact on our inventory availability, cost of sales, operations or demand for the products we sell) could adversely affect our business, financial condition, results of operations and cash flows. Significant increases in fuel economy requirements or new federal or state restrictions on emissions of carbon dioxide that may be imposed on vehicles and automobile fuels could adversely affect demand for vehicles, annual miles driven or the products we sell or lead to changes in automotive technology. Compliance with any new or more stringent laws or regulations, or stricter interpretations of existing laws, could require additional expenditures by us or our suppliers. Our inability to respond to changes in automotive technology could adversely impact the demand for our products and our business, financial condition, results of operations or cash flows.
The United States government may substantially increase border controls and impose restrictions on cross-border commerce that may substantially harm our business.
We purchase a substantial portion of our products from foreign manufacturers and other suppliers who source products internationally. Restrictions on shipping goods into the United States from other countries pose a substantial risk to our business. Particularly since the terrorist attacks on September 11, 2001, the United States government has substantially increased border surveillance and controls. If the United States were to impose further border controls and restrictions, impose quotas, tariffs or import duties, increase the documentation requirements applicable to cross border shipments or take other actions that have the effect of restricting the flow of goods from other countries to the United States, we may have greater difficulty acquiring our inventory in a timely manner, experience shipping delays, or incur increased costs and expenses, all of which would substantially harm our business and results of operations.
| ITEM 1B. | UNRESOLVED STAFF COMMENTS |
None.
| ITEM 2. | PROPERTIES |
As of December 31, 2011,29, 2012, the square footage of our leased and owned office and warehouse space was 485,000353,000 and 347,000, respectively. Our corporate headquarters and primary distribution centers are located in Carson, California and LaSalle, Illinois, respectively, in approximately 510,000437,000 square feet of office and warehouse space. We have a 217,000159,000 square footfeet distribution center in Chesapeake, Virginia, and an additionalVirginia. In January 2013, our lease expired on our 61,000 square footfeet of warehouse space in Independence, Ohio.Ohio and we are currently on a month-to-month lease. We currently lease approximately 43,000 square feet of office space in the Philippines for our employees located in that country.Philippines.
In September 2011, we entered into a sublease agreement for the leasing of approximately 25,000 square feet of commercial office space located in Carson, California. The sublease will enableenabled us to consolidate our corporate office space from three buildings into one, and will allowallowed us to consolidate our California fulfillment operations into one warehouse, which will reducereduced our monthly rent expense and potentially createimproved warehouse operating efficiencies once the space consolidation has been completed.efficiencies. For additional information regarding our obligations under property leases, see“Note 12-Commitments11-Commitments and Contingencies” of the Notes to Consolidated Financial Statements, included in Part IV, Item 15 of this report.
| ITEM 3. | LEGAL PROCEEDINGS |
The information set forth under the caption “Legal Matters”“Legal Matters” in Note 1211 of the Notes to Consolidated Financial Statements, included in Part IV, Item 15 of this report, is incorporated herein by reference. For an additional discussion of certain risks associated with legal proceedings, see the section entitled “Risk Factors” in Item 1A of this report.
| ITEM 4. | MINE SAFETY DISCLOSURES |
Not applicable.
| ITEM 5. | MARKET FOR REGISTRANT’S COMMON EQUITY, RELATED STOCKHOLDER MATTERS AND ISSUER PURCHASES OF EQUITY SECURITIES |
Market Information
Our common stock is being trading on the NASDAQ Global Market under the symbol “PRTS.” The table below sets forth the high and low sales prices of our common stock for the periods indicated:
| High | Low | High | Low | |||||||||||||
Quarter ended April 3, 2010 | $ | 7.65 | $ | 5.11 | ||||||||||||
Quarter ended July 3, 2010 | 9.40 | 6.00 | ||||||||||||||
Quarter ended October 2, 2010 | 9.04 | 5.92 | ||||||||||||||
Quarter ended January 1, 2011 | 9.07 | 7.73 | ||||||||||||||
2012: | ||||||||||||||||
Quarter ended March 31, 2012 | $ | 5.40 | $ | 3.49 | ||||||||||||
Quarter ended June 30, 2012 | 4.47 | 2.82 | ||||||||||||||
Quarter ended September 29, 2012 | 4.67 | 2.85 | ||||||||||||||
Quarter ended December 29, 2012 | 3.61 | 1.71 | ||||||||||||||
2011: | ||||||||||||||||
Quarter ended April 2, 2011 | 9.85 | 6.75 | 9.85 | 6.75 | ||||||||||||
Quarter ended July 2, 2011 | 8.55 | 6.62 | 8.55 | 6.62 | ||||||||||||
Quarter ended October 1, 2011 | 7.85 | 4.31 | 7.85 | 4.31 | ||||||||||||
Quarter ended December 31, 2011 | 6.00 | 3.69 | 6.00 | 3.69 | ||||||||||||
On March 19, 2012,2013, the last reported sale price of our common stock on the NASDAQ Global Market was $3.60$1.24 per share.
Holders
As of March 19, 2012,2013, there were approximately 1,7021,404 holders of record of our common stock.
Stock Performance Graph
The material in this section is not “soliciting material,” is not deemed “filed” with the SEC, and shall not be deemed to be incorporated by reference into any of our filings under the Securities Act of 1933, as amended, or the Securities Exchange Act of 1934, as amended.
The following graph shows an annual comparison of the total cumulative returns of an investment of $100 in cash on February 9,December 31, 2007, the first trading day following our initial public offering in (i) our common stock, (ii) the Morgan Stanley Technology Index, (iii) the S&P 500 Retail Index and (iv) NASDAQ Composite Index, in each case through December 31, 2011.29, 2012. The comparisons in the graph are required by the SEC and are not intended to forecast or be indicative of the possible future performance of our common stock. The graph assumes that all dividends have been reinvested (to date, we have not declared dividends).
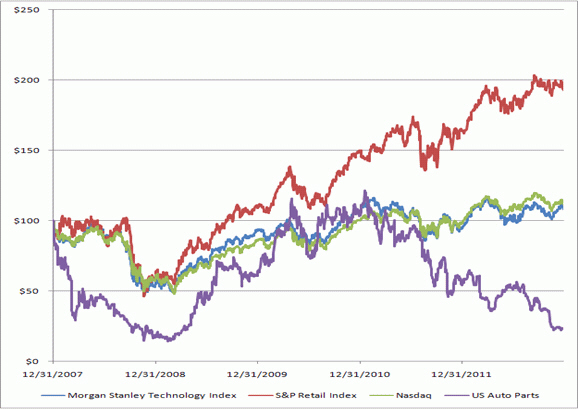
Dividend Policy
No dividends were paid during the fifty-two week periodsweeks ended January 1, 2011 and December 31, 2011.29, 2012. We currently intend to retain any future earnings to finance the growth and development of our business, and we do not anticipate that we will declare or pay any cash dividends on our common stock in the foreseeable future. In August 2010,April 2012, the Company, certain of its wholly-owned domestic subsidiaries and Silicon ValleyJPMorgan Chase Bank, N.A. entered into a Loan and SecurityCredit Agreement as amended, and other definitive documentationthat provides for a $35revolving commitment in an aggregate principal amount of up to $40 million secured credit facility.subject to a borrowing base derived from certain of our receivables, inventory and property and equipment. The Loan and SecurityCredit Agreement requires us to obtain a prior written consent from Silicon ValleyJPMorgan Chase Bank when we determine to pay any dividends on or make any distribution with respect to our common stock. See“Liquidity and Capital Resources” in Item 7 of Part II included in this report for further information on the covenants under the secured credit facility. Any future determination to pay cash dividends will be subject to the above restriction, as well as restrictions under any other existing indebtedness, at the discretion of our Board of Directors and will be dependent upon our financial condition, results of operations, capital requirements, and other factors the Board of Directors deems relevant.
Recent Sales of Unregistered Securities
None.
Use of Proceeds from Sales of Registered Securities
None.
Purchases of Equity Securities by the Issuer and Affiliated Purchasers
We did not repurchase any of our outstanding equity securities during the most recent quarter covered by this report.
| ITEM 6. | SELECTED FINANCIAL DATA |
The following selected financial information as of and for the dates and periods indicated have been derived from our audited consolidated financial statements. The information set forth below is not necessarily indicative of results of future operations, and should be read in conjunction with “Management’s Discussion and Analysis of Financial Condition and Results of Operations” in Part II, Item 7 of this report and our consolidated financial statements and related notes included elsewhere in this report.report (in thousands, except per share data).
| Year Ended December 31, 2007 (“calendar year 2007”)(1) | Year Ended December 31, 2008 (“calendar year 2008”)(2) | 52 Weeks Ended January 2, 2010 (“fiscal 2009”) | 52 Weeks Ended January 1, 2011 (“fiscal 2010”)(3) | 52 Weeks Ended December 31, 2011 (“fiscal 2011”)(4) | ||||||||||||||||||||||||||||||||||||
| (in thousands, except share and per share data) | 52 Weeks Ended December 29, 2012 (“fiscal year 2012”) (1) | 52 Weeks Ended December 31, 2011 (“fiscal year 2011”)(2) | 52 Weeks Ended January 1, 2011 (“fiscal year 2010”)(3) | 52 Weeks Ended January 2, 2010 (“fiscal year 2009”) | Year Ended December 31, 2008 (“calendar year 2008”) | |||||||||||||||||||||||||||||||||||
Consolidated Statements of Operations Data: | ||||||||||||||||||||||||||||||||||||||||
Net sales | $ | 160,957 | $ | 153,424 | $ | 176,288 | $ | 262,277 | $ | 327,072 | $ | 304,017 | $ | 327,072 | $ | 262,277 | $ | 176,288 | $ | 153,424 | ||||||||||||||||||||
Cost of sales | 107,132 | 100,869 | 112,415 | 172,668 | 220,072 | 212,379 | 220,072 | 172,668 | 112,415 | 100,869 | ||||||||||||||||||||||||||||||
|
|
|
|
|
|
|
|
|
| |||||||||||||||||||||||||||||||
Gross profit | 53,825 | 52,555 | 63,873 | 89,609 | 107,000 | 91,638 | 107,000 | 89,609 | 63,873 | 52,555 | ||||||||||||||||||||||||||||||
|
|
|
|
| ||||||||||||||||||||||||||||||||||||
Operating expenses: | ||||||||||||||||||||||||||||||||||||||||
Marketing | 21,551 | 22,965 | 23,419 | 38,757 | 55,785 | 51,416 | 55,785 | 38,757 | 23,419 | 22,965 | ||||||||||||||||||||||||||||||
General and administrative | 18,587 | 18,234 | 19,640 | 28,628 | 31,961 | 19,857 | 31,961 | 28,628 | 19,640 | 18,234 | ||||||||||||||||||||||||||||||
Fulfillment | 7,557 | 9,116 | 11,437 | 14,946 | 19,164 | 22,265 | 19,164 | 14,946 | 11,437 | 9,116 | ||||||||||||||||||||||||||||||
Technology | 1,987 | 3,642 | 4,467 | 5,902 | 7,274 | 6,274 | 7,274 | 5,902 | 4,467 | 3,642 | ||||||||||||||||||||||||||||||
Amortization of intangibles | 8,350 | 4,958 | 661 | 2,804 | 3,673 | |||||||||||||||||||||||||||||||||||
Impairment loss on intangibles | — | 18,938 | — | — | 5,138 | |||||||||||||||||||||||||||||||||||
Amortization of intangible assets | 1,189 | 3,673 | 2,804 | 661 | 4,958 | |||||||||||||||||||||||||||||||||||
Impairment loss on goodwill | — | 4,430 | — | — | — | 18,854 | — | — | — | 4,430 | ||||||||||||||||||||||||||||||
Impairment loss on property and equipment | 1,960 | — | — | — | — | |||||||||||||||||||||||||||||||||||
Impairment loss on intangible assets | 5,613 | 5,138 | — | — | 18,938 | |||||||||||||||||||||||||||||||||||
|
|
|
|
|
|
|
|
|
| |||||||||||||||||||||||||||||||
Total operating expenses | 58,032 | 82,283 | 59,624 | 91,037 | 122,995 | 127,428 | 122,995 | 91,037 | 59,624 | 82,283 | ||||||||||||||||||||||||||||||
|
|
|
|
| ||||||||||||||||||||||||||||||||||||
(Loss) income from operations | (4,207 | ) | (29,728 | ) | 4,249 | (1,428 | ) | (15,995 | ) | (35,790 | ) | (15,995 | ) | (1,428 | ) | 4,249 | (29,728 | ) | ||||||||||||||||||||||
Other income (expense), net | 1,148 | 1,000 | 191 | (280 | ) | (654 | ) | |||||||||||||||||||||||||||||||||
Other (expense) income, net | (1,125 | ) | (654 | ) | (280 | ) | 191 | 1,000 | ||||||||||||||||||||||||||||||||
|
|
|
|
|
|
|
|
|
| |||||||||||||||||||||||||||||||
(Loss) income before income taxes | (3,059 | ) | (28,728 | ) | 4,440 | (1,708 | ) | (16,649 | ) | (36,915 | ) | (16,649 | ) | (1,708 | ) | 4,440 | (28,728 | ) | ||||||||||||||||||||||
Income tax provision (benefit) | 538 | (11,822 | ) | 3,123 | 12,218 | (1,512 | ) | |||||||||||||||||||||||||||||||||
Income tax (benefit) provision | (937 | ) | (1,512 | ) | 12,218 | 3,123 | (11,822 | ) | ||||||||||||||||||||||||||||||||
|
|
|
|
|
|
|
|
|
| |||||||||||||||||||||||||||||||
Net (loss) income | $ | (3,597 | ) | $ | (16,906 | ) | $ | 1,317 | $ | (13,926 | ) | $ | (15,137 | ) | $ | (35,978 | ) | $ | (15,137 | ) | $ | (13,926 | ) | $ | 1,317 | $ | (16,906 | ) | ||||||||||||
|
|
|
|
|
|
|
|
|
| |||||||||||||||||||||||||||||||
Basic net (loss) income per share | $ | (0.13 | ) | $ | (0.57 | ) | $ | 0.04 | $ | (0.46 | ) | $ | (0.50 | ) | $ | (1.17 | ) | $ | (0.50 | ) | $ | (0.46 | ) | $ | 0.04 | $ | (0.57 | ) | ||||||||||||
Diluted net (loss) income per share | $ | (0.13 | ) | $ | (0.57 | ) | $ | 0.04 | $ | (0.46 | ) | $ | (0.50 | ) | $ | (1.17 | ) | $ | (0.50 | ) | $ | (0.46 | ) | $ | 0.04 | $ | (0.57 | ) | ||||||||||||
Shares used in computation of basic net (loss) income per share | 28,274,022 | 29,846,757 | 29,851,873 | 30,269,462 | 30,545,638 | 30,818 | 30,546 | 30,269 | 29,852 | 29,847 | ||||||||||||||||||||||||||||||
Shares used in computation of diluted net (loss) income per share | 28,274,022 | 29,846,757 | 30,809,111 | 30,269,462 | 30,545,638 | 30,818 | 30,546 | 30,269 | 30,809 | 29,847 | ||||||||||||||||||||||||||||||
|
|
|
|
| Year Ended December 31, 2007 | Year Ended December 31, 2008 | 52 Weeks Ended January 2, 2010 | 52 Weeks Ended January 1, 2011 | 52 Weeks Ended December 31, 2011 | ||||||||||||||||||||||||||||||||||||
| (in thousands) | December 29, 2012 | December 31, 2011 | January 1, 2011 | January 2, 2010 | December 31, 2008 | |||||||||||||||||||||||||||||||||||
Consolidated Balance Sheet Data: | ||||||||||||||||||||||||||||||||||||||||
Cash and cash equivalents | $ | 19,399 | $ | 32,473 | $ | 26,251 | $ | 17,595 | $ | 10,335 | $ | 1,030 | $ | 10,335 | $ | 17,595 | $ | 26,251 | $ | 32,473 | ||||||||||||||||||||
Working capital(1) | 40,421 | 36,013 | 42,049 | 19,175 | 8,666 | (4,027 | ) | 8,666 | 19,175 | 42,049 | 36,013 | |||||||||||||||||||||||||||||
Total assets(2) | 110,056 | 90,430 | 104,614 | 153,537 | 142,216 | 88,877 | 142,216 | 153,537 | 104,614 | 90,430 | ||||||||||||||||||||||||||||||
Notes payable to stockholders | 1,000 | — | — | — | — | |||||||||||||||||||||||||||||||||||
Long-term debt (excluding current portion) | 48 | — | — | 18,060 | 11,662 | |||||||||||||||||||||||||||||||||||
Revolving loan payable | 16,222 | — | — | — | — | |||||||||||||||||||||||||||||||||||
Current portion of long-term debt | — | 6,250 | 6,125 | — | — | |||||||||||||||||||||||||||||||||||
Long-term debt, net of current portion | — | 11,662 | 18,060 | — | — | |||||||||||||||||||||||||||||||||||
Stockholders’ equity | 91,643 | 77,522 | 82,687 | 72,804 | 60,924 | 27,644 | 60,924 | 72,804 | 82,687 | 77,522 | ||||||||||||||||||||||||||||||
| (1) |
|
| (2) |
|
| ITEM 7. | MANAGEMENT’S DISCUSSION AND ANALYSIS OF FINANCIAL CONDITION AND RESULTS OF OPERATIONS |
TheCautionary Statement
You should read the following discussion of our financial condition and results of operations should be read togetheranalysis in conjunction with our consolidated financial statements and the related notes includedthereto contained in Part IV, Item 15 of this report. This discussion containsCertain statements in this report, including statements regarding our business strategies, operations, financial condition, and prospects are forward-looking statementsstatements. Use of the words “anticipates,” “believes,” “could,” “estimates,” “expects,” “intends,” “may,” “plans,” “potential,” “predicts,” “projects,” “should,” “will,” “would”, “will likely continue,” “will likely result” and similar expressions that involvecontemplate future events may identify forward-looking statements.
The information contained in this section is not a complete description of our business or the risks associated with an investment in our common stock. We urge you to carefully review and uncertainties. As a result of many factors, such as those set forth underconsider the various disclosures made by us in this report and in our other reports filed with the SEC, which are available on the SEC’s website at http://www.sec.gov. The section entitled “Risk Factors” set forth in Part I, Item 1A and elsewhere inof this report, and similar discussions in our other SEC filings, describe some of the important factors, risks and uncertainties that may affect our business, results of operations and financial condition and could cause actual results mayto differ materially from those anticipated inexpressed or implied by these or any other forward-looking statements made by us or on our behalf. You are cautioned not to place undue reliance on these forward-looking statements, which are based on current expectations and reflect management’s opinions only as of the date thereof. We do not assume any obligation to revise or update forward-looking statements. Finally, our historic results should not be viewed as indicative of future performance.
Overview
We are one of the largest online providers of aftermarket auto parts, including body parts, engine parts, and performance parts and accessories. Our user-friendly websites provide customers with a broad selection of SKUs, with detailed product descriptions and photographs. Our proprietary product database maps our SKUs to product applications based on vehicle makes, models and years. We principally sell our products to individual consumers through our network of websites and online marketplaces. Our flagship websites are located atwww.autopartswarehouse.com,www.partstrain.com,www.jcwhitney.com,www.stylintrucks.com,www.AutoMD.comand our corporate website is located atwww.usautoparts.net. We believe our strategy of disintermediating the traditional auto parts supply chain and selling products directly to customers over the Internet allows us to more efficiently deliver products to our customers while generating higher margins.
Our History. We were formed in Delaware in 1995 as a distributor of aftermarket auto parts and launched our first website in 2000. We rapidly expanded our online operations, increasing the number of SKUs sold through our e-commerce network, adding additional websites, improving our Internet marketing proficiency and commencing sales in online marketplaces. Additionally, in August 2010, through our acquisition of WAG, we expanded our product-lines and increased our customer reach in the DIY automobile and off-road accessories market. As a result, our business has grown since 2000, generating net sales of $327.1$304.0 million for fiscal 2011.year ended December 29, 2012.
International Operations. In April 2007, we established offshore operations in the Philippines. Our offshore operations allow us to access a workforce with the necessary technical skills at a significantly lower cost than comparably experienced U.S.-based professionals. Our offshore operations are responsible for a majority of our website development, catalog management, and back
office support. Our offshore operations also house our main call center. We had 1,005945 employees in the Philippines as of December 31, 2011.29, 2012. In January 2013, we laid off 163 employees in the Philippines which reduced our workforce to 782 in the Philippines (for additional details, refer to“Note 16-Subsequent Events” of the Notes to Consolidated Financial Statements, included in Part IV, Item 15 of this report). In addition to our operations in the Philippines, we have a Canadian subsidiary to facilitate sales of our products in Canada; the subsidiary has no distribution center or employees. We also ship parts directly to Canada and through a freight forwarding partner throughout the world. In 2011,2012, we shipped auto parts to over 160 different countries. We believe that the cost advantages of our offshore operations provide us with the ability to grow our business in a cost-effective manner, and we expect to continue to add headcount and infrastructure to our offshore operations.manner.
Acquisitions.From time to time, we may acquire certain businesses, websites, domain names, or other assets. In the third quarter of fiscal 2009, we completed the acquisition of the assets of a small website and the related domain names which further expanded and enhanced our product offering and our ability to reach more customers. In the first quarter of fiscal 2010, we completed two additional website and domain name asset acquisitions, which increased our net sales and internet traffic. In August 2010, Go Fido, Inc., a wholly-owned subsidiary of ours, completed the purchase of all of the outstanding capital stock of Automotive Specialty Accessories and Parts, Inc. and its wholly-owned subsidiary Whitney Automotive Group, Inc. (referred to herein as “WAG”). WAG’s Midwest
facility expanded our distribution network and the merchandise WAG offers extended our go-to market product-lines into all terrain vehicles, recreational vehicles and motorcycles, as well as provides us with deep product knowledge into niche segments like Jeep, Volkswagen and trucks. This expansion of our product line increasesincreased our customer reach in the DIY automobile and off-road accessories market. The Company believes that the combination of WAG’s established brands and focus on the customer experience, coupled with the Company’s capacity to compete online, creates opportunity for growth. Related to the WAG acquisition, the Company has incurred acquisition and integration related costs of $3.1$7.4 million and $7.4$3.1 million for the fiscal year ended January 1, 2011and December 31, 2011 and 2010, respectively. These costs included one-time contract cancellation costs of $1.5 million that the Company recorded in September 2011, for terminating WAG’s sublease agreement related to its former corporate offices located in Chicago, Illinois. No significant integration costs are anticipated in the future, as such the majority of the acquisition and integration related costs have been paid as ofwere incurred subsequent to December 31, 2011. Since the WAG acquisition, certain residual WAG operations have been separately accounted for during the integration process. These operations relate to certain WAG product revenues, the related operating costs and integration costs. We have presented such residual WAG operations for purposes of providing comparable financial information for the impacted fiscal years ended 2010 and 2011. We will not provide this information going forward into 2012, since 2011 represented a full year with these residual WAG operations and will thus be more comparable to 2012. We expect such revenues and expenses that directly relate to WAG products will gradually decrease over fiscal 2012. For additional information, see“Note 5 – Business Combination” of the Notes to Consolidated Financial Statements, included in Part IV, Item 15 of this report. We may pursue additional acquisition opportunities in the future to increase our share of the aftermarket auto parts market or expand our product offering.offerings.
Executive Summary
For the fiscal year 2011, the Company generated net sales of $327.1 million, compared with $262.3 million for fiscal 2010, representing an increase of 25%. Excluding $83.4 million and $39.1 million of net sales from WAG in fiscal 2011 and 2010, respectively, our net sales for fiscal 2011 and 2010 were $243.7 million and $223.2 million, respectively, for an increase of 9% over the prior year. Net loss for fiscal 2011 was $15.1 million, or $0.50 per share, which included a non-cash write-down of intangibles and restructuring charges related to WAG of $3.4 million (net of a $1.7 million tax benefit) and $7.4 million, respectively, and $0.5 million of legal expenses to protect intellectual property. This compares to a net loss of $13.9 million, or $0.46 per share for fiscal 2010, which included $3.1 million of restructuring charges related to WAG, and $2.3 million of legal expenses to protect intellectual property. Earnings per share for fiscal 2011 and 2010 also included amortization expense related to intangibles of $3.7 million or $0.12 per share and $2.8 million or $0.09 per share, respectively. We generated Adjusted EBITDA (Earnings before Interest, Taxes, Depreciation, and Amortization plus current year’s share-based compensation expense, legal costs to enforce intellectual property rights, restructuring expenses related to acquisition and a fiscal 2010 only charge for change in revenue recognition) of $16.3 million in fiscal 2011 compared to $19.5 million in fiscal 2010. Adjusted EBITDA excludes share-based compensation expense of $2.6 million in fiscal 2011 and $2.7 million in fiscal 2010. Adjusted EBITDA is presented because such measure is used by rating agencies, securities analysts, investors and other parties in evaluating the Company. It should not be considered, however, as an alternative to operating income as an indicator of the Company’s operating performance or as an alternative cash flows as measures of the Company’s overall liquidity as presented in the Company’s consolidated financial statements. Further, the Adjusted EBITDA measure shown for the Company may not be comparable to similarly titled measures used by other companies.
To understand revenue generation through our network of e-commerce websites, we monitor several key business metrics, including the following:
| Fifty-Two Weeks Ended | ||||||||||||
| December 29, 2012 | December 31, 2011 | January 1, 2011 2 | ||||||||||
Unique Visitors (millions) 1 | 153.9 | 165.6 | 114.2 | |||||||||
Total Number of Orders (thousands) | 2,427 | 2,717 | 1,788 | |||||||||
Average Order Value | $ | 114.3 | $ | 121.8 | $ | 116.6 | ||||||
Revenue Capture | 83.9 | % | 81.7 | % | 83.2 | % | ||||||
| 1 | Visitors do not include traffic from media properties (e.g. AutoMD). |
| 2 | Fiscal year 2010 excluded metrics from WAG (acquired in August 2010). |
Unique Visitors: A unique visitor to a particular website represents a user with a distinct IP address that visits that particular website. We define the total number of unique visitors in a given month as the sum of unique visitors to each of our websites during that month. We measure unique visitors to understand the volume of traffic to our websites and to track the effectiveness of our online marketing efforts. The number of unique visitors has historically varied based on a number of factors, including our marketing activities and seasonality. We believe an increase in unique visitors to our websites will result in an increase in the number of orders. We seek to increase the number of unique visitors to our websites by attracting repeat customers and improving search engine marketing and other internet marketing activities. During fiscal year 2012, our unique visitors decreased by 7.1%. We expect declines in our unique visitors to continue in the next twelve months as we address the challenges we are experiencing from changes search engines have made to the formulas, or algorithms, that they use to optimize their search results, as described in further detail under “—Executive Summary” below.
Total Number of Orders: We monitor the total number of orders as an indicator of future revenue trends. During fiscal year 2012, total number of orders was down by 10.7% due to the decrease in unique visitors combined with overall increased competition. We expect the downward trend in the total number of orders to continue over the next twelve months due to continued declines in unique visitors and increased competition. We recognize revenue associated with an order when the products have been delivered, consistent with our revenue recognition policy.
Average Order Value: Average order value represents our net sales on a placed orders basis for a given period of time divided by the total number of orders recorded during the same period of time. During fiscal year 2012, our average order value decreased by 6.2%. We expect this trend to continue in the next twelve months primarily due to increased competition, as described in further detail under “Executive Summary” below. We seek to increase the average order value as a means of increasing net sales. Average order values vary depending upon a number of factors, including the components of our product offering, the order volume in certain online sales channels, macro-economic conditions, and the general level of competition online.
Revenue Capture: Revenue capture is the amount of actual dollars retained after taking into consideration returns, credit card declines and product fulfillment. During fiscal year 2012, our revenue capture increased by 2.2% to 83.9% compared to 81.7% in fiscal year 2011. The tables below reconcileincrease in revenue capture was due to lower returns, credit card declines and product fulfillment in fiscal year 2012 compared to fiscal year 2011. We expect our revenue capture level to stay the same in the next twelve months as we continue to improve our customers’ purchase experience.
Executive Summary
For fiscal year 2012, the Company generated net (loss) incomesales of $304.0 million, compared with $327.1 million for fiscal year 2011, representing a decrease of 7.0%. Net loss for fiscal year 2012 was $36.0 million, or $1.17 per share. This compares to consolidateda net loss of $15.1 million, or $0.50 per share, for fiscal year 2011. We generated Adjusted EBITDA (EBITDA plus current year’s share-based compensation expense, impairment losses, loss on debt extinguishment, legal costs related to intellectual property rights, and U.S.restructuring costs) of $9.4 million in fiscal year 2012 compared to $16.3 million in fiscal year 2011. Adjusted EBITDA is presented because such measure is used by rating agencies, securities analysts, investors and other parties in evaluating the Company. It should not be considered, however, as an alternative to operating income, as an indicator of the Company’s operating performance, or as an alternative to cash flows, as measures of the Company’s overall liquidity, as presented in the Company’s consolidated financial statements. Further, the Adjusted EBITDA measure shown for the Company may not be comparable to similarly titled measures used by other companies. Refer to the table presented below for reconciliation of net loss to Adjusted EBITDA.
Total revenues decreased compared to the same period in 2011 due to our decreased online sales. Our online sales, which include our e-commerce, online marketplace sales channels and online advertising, contributed 91.8% of total revenues, and our offline sales, which consist of our Kool-Vue™ and wholesale operations, contributed 8.2% of total revenues. Our online sales decreased by $28.8 million, or 9.3%, to $279.1 million compared to $307.9 million in fiscal year 2011. Our offline sales performed well throughout the year.
Like most e-commerce retailers, our success depends on our ability to attract online consumers to our websites and convert them into customers in a cost-effective manner. Historically, marketing through search engines provided the most efficient opportunity to reach millions of on-line auto part buyers. We are included in search results through paid search listings, where we purchase specific search terms that will result in the inclusion of our listing, and algorithmic searches that depend upon the searchable content on our websites. In fiscal year 2012, we decreased the amount we spent on paid search listings, as we have determined that it does not generate a sufficient amount of revenues to justify the expense. Algorithmic listings cannot be purchased and instead are determined and displayed solely by a set of formulas utilized by the search engine. We have had a history of success with our search engine marketing techniques, which gave our different websites preferred positions in search results. But search engines, like Google, revise their algorithms from time to time in an attempt to optimize their search results. Since 2011, Google has released changes to Google’s search results ranking algorithm aimed to lower the rank of certain sites and return other sites near the top of the search results based upon the quality of the particular site as determined by Google. Google made additional updates throughout fiscal year 2012. We were negatively impacted by the changes in methodology for how Google displayed or selected our different websites for customer search results. This reduced our unique visitor count which adversely affected our financial results for fiscal year 2012. Our unique visitor count decreased by 11.7 million, or 7.1%, for fiscal year 2012 to 153.9 million unique visitors compared to 165.6 million unique visitors in fiscal year 2011. We believe we were affected by these search engine algorithm changes due to the use of our product catalog across multiple websites. To address this issue we are consolidating to a significantly smaller number of websites to ensure unique catalog content. As we are significantly dependent upon search engines for our website traffic, if we are unable to attract unique visitors, our business and results of operations will be harmed.
Barriers to entry in the automotive aftermarket industry are low, and current and new competitors can launch websites at a relatively low cost. We experienced significant competitive pressure from certain of our suppliers as they are now selling their products online. Since our suppliers have access to merchandise at very low costs, they were able to sell products at lower prices and maintain higher gross margins, thus our financial results were negatively impacted by the increased level of competition. Total orders for fiscal year 2012 went down by 10.7% to 2.4 million compared to 2.7 million for fiscal year 2011 and our average order value went down by $7.5, or 6.2%, for fiscal year 2012 to $114.3 compared to $121.8 in fiscal year 2011 as a result of increased pricing competition. Our current and potential customers may decide to purchase directly from our suppliers. Continuing increased competition from our suppliers that have access to products at lower prices than us could result in reduced sales, lower operating margins, reduced profitability, loss of market share and diminished brand recognition. In addition, some of our competitors have used and may continue to use aggressive pricing tactics. We expect that competition will further intensify in the future as Internet use and online commerce continue to grow worldwide. We are taking a number of steps during 2013 to attempt to reduce the selling prices of our products while increasing margins, which are discussed below.
Total expenses increased compared to the same period in 2011. Our expenses primarily consist of direct costs associated with procuring parts from suppliers and delivering products to customers, which include direct product costs, outbound freight and shipping costs, warehouse supplies and warranty costs, advertising expenses, depreciation and amortization expense and personnel costs. Our personnel costs, which consist of compensation, benefits and payroll related taxes, and are primarily a function of our headcount, decreased in fiscal year 2012 compared to fiscal year 2011. Our employees at the end of fiscal year 2012 decreased to 1,370 compared to 1,521 at the end of fiscal year 2011. Our employees in the Philippines decreased to 945 at the end of fiscal year 2012 compared to 1,005 at the end of fiscal year 2011. In addition, our headcount decreased in 2012 due to the closure of our call center operations in La Salle, Illinois. In January 2013, as part of the Company’s initiatives to reduce labor costs and improve operating efficiencies in response to the challenges in the marketplace and general market conditions, we reduced our workforce to a total of 1,194 employees (for additional details, refer to“Note 16-Subsequent Events” of the Notes to Consolidated Financial Statements, included in Part IV, Item 15 of this report). If the downward trend in our revenues and net loss continue longer than twelve months from the end of fiscal year 2012, we may be required to further reduce our labor costs. Total expenses increased during the fiscal year 2012 compared to the same period in 2011 primarily due to impairment charges recorded on goodwill and property and equipment of $18.9 million and $1.9 million, respectively, during the fourth quarter of 2012, resulting from adverse events related to the Company’s overall financial performance and higher depreciation and amortization expense of $2.5 million related to software deployments. These increases were partially offset by the decrease in restructuring costs of $6.7 million, lower direct costs resulting from the reduced revenues in fiscal year 2012 compared to fiscal year 2011 and lower amortization of intangible assets due to certain acquired intangible assets that were fully amortized.
Overall, we expect the downward trend in our revenues and net loss to continue in the next twelve months primarily due to the factors mentioned above. This trend could severely impact our liquidity as we may not be able to provide positive cash flows from operations in order to meet our working capital requirements. We may need to borrow additional funds from our credit facility, which under certain circumstances may not be available, sell assets or seek equity or additional debt financing in the future. Refer to“Liquidity and Capital Resources” section below for additional details. There can be no assurance that we would be able to raise such additional financing or engage in such asset sales on acceptable terms, or at all. If our expected downward trend in revenues and net loss continues for longer than we expect because our strategies to return to positive sales growth and profitability are not successful or otherwise, and if we are not able to raise adequate additional financing or proceeds from asset sales to continue to fund our ongoing operations, we will need to defer, reduce or eliminate significant planned expenditures, restructure or significantly curtail our operations or sell some of our assets.
Our strategies to return to positive sales growth and profitability are to attempt to accomplish the following in 2013:
Return to positive e-commerce growth by consolidating our websites to ensure unique catalog content and providing better content on our websites thereby improving our ranking on the search results. In addition, we intend to build mobile enabled websites to take advantage of shifting consumer behaviors. We expect this to increase unique visitors to our website and help us grow our revenues.
Improve the website purchase experience for our customers by (1) helping our customers find the parts they want to buy by reducing failed searches and increasing user purchase confidence; (2) selling more highly customized accessories by partnering with manufacturers to build custom shopping experiences; (3) increasing order size across our sites through improved recommendation engines; and (4) completing the roll out of high quality images and videos with emphasis on accessory product lines. We expect this to increase the conversion rate of our visitors to customers, total number of orders and average order value, and contribute to our revenue growth.
Become one of the lowest priced options in the market. We will lower our prices by increasing foreign sourced products as they provide more low-cost products. We expect this to improve the conversion rate for our visitors to our website, grow our revenues and improve our margins.
Increase product selection by being the first to market with new SKUs. We will seek to add new categories and expand our existing specialty categories. We expect this to increase the total number of orders and contribute to our revenue growth.
Be the consumer advocate for auto repair through AutoMD.com. We will continue to devote resources to AutoMD.com and its system development. We expect this to improve our brand recognition and contribute to our revenue growth.
As we redesign our approach to attracting customers through search engines, we hope to offset much of the revenue loss by pursuing revenue opportunities in third-party online marketplaces, a number of which are growing in excess of 10% per year. Auto Parts (“USAP”) excludingparts buyers are finding third-party online marketplaces to be a very attractive environment, for many reasons, the WAG acquisitiontop four being: (1) the security of their personal information; (2) the ability to easily compare product offerings from multiple sellers; (3) transparency (consumers can leave positive or negative feedback about their experience); and (4) favorable pricing. Successful selling in these third-party online marketplaces depends on product innovation, and strong relationships with suppliers, both of which we believe to be our core competencies.
There are various macro-economic factors that indirectly affect our business, including the impact of the recession, continued high unemployment, and other challenging economic conditions. These factors decrease the overall discretionary spending of our customers and we believe it becomes more likely that consumers will keep their current vehicles longer, thus will need replacement parts as a result of general wear and tear, and perform repair and maintenance in order to keep those vehicles well maintained. At the same time, higher gas prices are negatively impacting the industry as consumers drive less and reduce the wear and tear on their vehicles. Given the nature of these factors, and the volatility of the overall economic environment, we cannot predict whether or for how long these trends will continue, nor can we predict to what degree these trends will impact us in the future.
The table below reconciles net loss to Adjusted EBITDA for the periods presented (in thousands):
| 00000000 | 00000000 | 00000000 | 00000000 | |||||||||||||||||||||||||
| Thirteen Weeks Ended January 1, 2011 | Thirteen Weeks Ended December 31, 2011 | Fifty-Two Weeks Ended January 1, 2011 | Fifty-Two Weeks Ended December 31, 2011 | Fifty-Two Weeks Ended December 29, 2012 | Fifty-Two Weeks Ended December 31, 2011 | Fifty-Two Weeks Ended January 1, 2011 | ||||||||||||||||||||||
Consolidated | ||||||||||||||||||||||||||||
Net loss | $ | (2,896 | ) | $ | (7,020 | ) | $ | (13,926 | ) | $ | (15,137 | ) | $ | (35,978 | ) | $ | (15,137 | ) | $ | (13,926 | ) | |||||||
Interest expense, net | 240 | 244 | 371 | 963 | 774 | 963 | 371 | |||||||||||||||||||||
Income tax provision (benefit) | 64 | (1,727 | ) | 12,218 | (1,512 | ) | (937 | ) | (1,512 | ) | 12,218 | |||||||||||||||||
Amortization of intangibles | 1,640 | 345 | 2,804 | 3,673 | 1,189 | 3,673 | 2,804 | |||||||||||||||||||||
Depreciation and amortization | 2,982 | 3,494 | 9,466 | 12,695 | 15,204 | 12,695 | 9,466 | |||||||||||||||||||||
|
|
|
|
|
|
| ||||||||||||||||||||||
EBITDA (loss) | 2,030 | (4,664 | ) | 10,933 | 682 | |||||||||||||||||||||||
EBITDA | (19,748 | ) | 682 | 10,933 | ||||||||||||||||||||||||
|
|
|
|
|
|
| ||||||||||||||||||||||
Impairment loss on intangibles | — | 5,138 | — | 5,138 | ||||||||||||||||||||||||
Impairment loss on goodwill | 18,854 | — | — | |||||||||||||||||||||||||
Impairment loss on property and equipment | 1,960 | — | — | |||||||||||||||||||||||||
Impairment loss on intangible assets | 5,613 | 5,138 | — | |||||||||||||||||||||||||
Share-based compensation | 630 | 660 | 2,742 | 2,607 | 1,673 | 2,607 | 2,742 | |||||||||||||||||||||
Legal costs to enforce intellectual property rights | 87 | 19 | 2,284 | 462 | ||||||||||||||||||||||||
Loss on debt extinguishment | 360 | — | — | |||||||||||||||||||||||||
Legal costs related to intellectual property rights | 67 | 462 | 2,284 | |||||||||||||||||||||||||
Charge for change in revenue recognition | — | — | 411 | — | — | — | 411 | |||||||||||||||||||||
Add back restructuring | 1,534 | 784 | 3,124 | 7,375 | ||||||||||||||||||||||||
Restructuring costs(1) | 640 | 7,375 | 3,124 | |||||||||||||||||||||||||
|
|
|
|
|
|
| ||||||||||||||||||||||
Adjusted EBITDA | $ | 4,281 | $ | 1,937 | $ | 19,494 | $ | 16,264 | $ | 9,419 | $ | 16,264 | $ | 19,494 | ||||||||||||||
|
|
|
|
|
|
| ||||||||||||||||||||||
| 00000000 | 00000000 | 00000000 | 00000000 | |||||||||||||
| Thirteen Weeks Ended January 1, 2011 | Thirteen Weeks Ended December 31, 2011 | Fifty-Two Weeks Ended January 1, 2011 | Fifty-Two Weeks Ended December 31, 2011 | |||||||||||||
USAP excluding WAG | ||||||||||||||||
Net income (loss) | $ | 218 | $ | 128 | $ | (7,909 | ) | $ | 4,745 | |||||||
Interest expense, net | 295 | 245 | 378 | 964 | ||||||||||||
Income tax provision (benefit) | 29 | (305 | ) | 12,182 | (144 | ) | ||||||||||
Amortization of intangibles | 125 | 125 | 494 | 500 | ||||||||||||
Depreciation and amortization | 2,325 | 2,564 | 8,458 | 9,928 | ||||||||||||
|
|
|
|
|
|
|
| |||||||||
EBITDA | 2,992 | 2,757 | 13,603 | 15,993 | ||||||||||||
|
|
|
|
|
|
|
| |||||||||
Share-based compensation | 630 | 660 | 2,742 | 2,607 | ||||||||||||
Legal costs to enforce intellectual property rights | 87 | 19 | 2,284 | 462 | ||||||||||||
Charge for change in revenue recognition | — | — | 411 | — | ||||||||||||
|
|
|
|
|
|
|
| |||||||||
Adjusted EBITDA | $ | 3,709 | $ | 3,436 | $ | 19,040 | $ | 19,062 | ||||||||
|
|
|
|
|
|
|
| |||||||||
| (1) | We incurred restructuring costs in the third quarter of 2012 related to the Company’s initiatives to reduce labor costs and improve operating efficiencies in response to the challenges in the marketplace and general market conditions. We closed our call center in La Salle, Illinois and reduced our workforce resulting in severance charges of approximately $640,000 recorded in marketing expense, fulfillment expense and technology expense of $396,000, $228,000 and $16,000, respectively. For fiscal year 2011 and 2010, related to our WAG acquisition, the Company incurred acquisition and integration related costs of $7.4 million and $3.1 million, respectively, which were recorded in general and administrative expenses. |
Basis of Presentation
Net Sales. Online and offline sales represent two different sales channels for our products. We generate online net sales primarily through the sale of auto parts to individual consumers through our network of e-commerce websites and online marketplaces, including online advertising. E-commerce sales are derived from our network of websites, which are company ownedwe own and operated.operate. E-commerce and online marketplace sales also include inbound telephone sales through our call center that supports these sales channels. Online marketplaces consist primarily of sales of our products on online auction websites, where we sell through auctions as well as through storefronts that we maintain on these third-party owned websites. We sell advertising and sponsorship positions on our e-commerce websites to highlight vendor brands and offer complementary products and services that benefit our customers. Advertising is targeted to specific sections of the websites and can also be targeted to specific users based on the vehicles they drive. Advertising partners primarily include part vendors, national automotive aftermarket brands and automobile manufacturers. Our offline sales channel represents our distribution of products directly to commercial customers by selling auto parts to collision repair shops located in Southern California and Virginia. Our offline sales channel also includes the distribution of our Kool-VueKool-Vue™ mirror line to auto parts distributors nationwide. We also serve consumers by operating retail outlet stores in Independence, Ohio and LaSalle, Illinois.
Cost of Sales. Cost of sales consists of the direct costs associated with procuring parts from suppliers and delivering products to customers. These costs include product costs, outbound freight and shipping costs, warehouse supplies and warranty costs, partially offset by purchase discounts freight and shipping costs and warehouse supplies.cooperative advertising. Depreciation and amortization expenses are excluded from cost of sales and included in marketing, general and administrative and fulfillment costsexpenses as noted below.
General and Administrative Expense. General and administrative expense consists primarily of administrative payroll and related expenses, payment processing fees, legal and professional fees, amortization of software and other administrative costs. General and administrative expense also includes depreciation and amortization expense and share-based compensation expense.
Marketing Expense. Marketing expense consists of online advertising spend, Internetinternet commerce facilitator fees and other advertising costs, as well as payroll and related expenses associated with our marketing catalog, customer service and sales personnel. These costs are generally variable and are typically a function of net sales. Marketing expense also includes depreciation and amortization expense and share-based compensation expense.
General and Administrative Expense. General and administrative expense consists primarily of administrative payroll and related expenses, payment processing fees, legal and professional fees, amortization of software and other administrative costs. General and administrative expense also includes depreciation and amortization expense and share-based compensation expense.
Fulfillment Expense.Expense. Fulfillment expense consists primarily of payroll and related costs associated with our warehouse employees and our purchasing group, facilityfacilities rent, building maintenance, depreciation and other costs associated with inventory management and our wholesale operations. Fulfillment expense also includes depreciation and amortization expense and share-based compensation expense.
Technology Expense. Technology expense consists primarily of payroll and related expenses of our information technology personnel, the cost of hosting our servers, communications expenses and Internet connectivity costs, computer support and software development. Technology expense also includes share-based compensation expense.
Amortization of IntangiblesIntangible Assets. Amortization of intangibles consists of the amortization expense associated with our definite-lived intangible assets, which primarily consist of the intangiblesassets.
Impairment Loss. Impairment loss recorded as a result of the WAG acquisition.impairment testing performed for goodwill and indefinite-lived intangible assets in accordance with ASC 350 Intangibles – Goodwill and Other, and long-lived assets, including intangible assets subject to amortization, in accordance with ASC 360 Property, Plant and Equipment.
Impairment loss on IntangiblesOther Income, Net.. Impairment loss on intangibles Other income, net consists of a fiscal 2011 non-cash impairment charge related to certain WAG trade name intangible assets.
Interest Income (Expense).Interestmiscellaneous income consistsor expense such as gains/losses from disposition of assets, and interest income comprised primarily of interest income on investments.
Interest Expense. Interest expense consists primarily of interest expense on our outstanding loan balances, deferred financing cost amortization and capital leases.lease interest.
Results of Operations
The following table sets forth selected statement of operations data for the periods indicated, expressed as a percentage of net sales:
| December 29, 2012 | December 31, 2011 | January 1, 2011 | ||||||||||
Net sales | 100.0 | % | 100.0 | % | 100.0 | % | ||||||
Cost of sales | 69.9 | 67.3 | 65.8 | |||||||||
|
|
|
|
|
| |||||||
Gross profit | 30.1 | 32.7 | 34.2 | |||||||||
|
|
|
|
|
| |||||||
Operating expenses: | ||||||||||||
Marketing | 16.9 | 17.1 | 14.8 | |||||||||
General and administrative | 6.5 | 9.8 | 10.9 | |||||||||
Fulfillment | 7.3 | 5.8 | 5.7 | |||||||||
Technology | 2.1 | 2.2 | 2.3 | |||||||||
Amortization of intangible assets | 0.4 | 1.1 | 1.1 | |||||||||
Impairment loss on goodwill | 6.2 | — | — | |||||||||
Impairment loss on property and equipment | 0.6 | — | — | |||||||||
Impairment loss on intangible assets | 1.9 | 1.6 | — | |||||||||
|
|
|
|
|
| |||||||
Total operating expenses | 41.9 | 37.6 | 34.7 | |||||||||
|
|
|
|
|
| |||||||
Loss from operations | (11.8 | ) | (4.9 | ) | (0.5 | ) | ||||||
|
|
|
|
|
| |||||||
Other income (expense): Other income, net Interest expense Loss on debt extinguishment Total other expense Loss before income taxes Income tax (benefit) provision Net loss December 29,
2012 December 31,
2011 January 1,
2011 — 0.1 — (0.2 ) (0.3 ) (0.1 ) (0.1 ) — — (0.3 ) (0.2 ) (0.1 ) (12.1 ) (5.1 ) (0.7 ) (0.3 ) (0.5 ) 4.7 (11.8 )% (4.6 )% (5.3 )%
Fifty-Two Weeks Ended December 29, 2012 Compared to the Fifty-Two Weeks Ended December 31, 2011
Net Sales and Gross Margin
| Fifty-Two Weeks Ended | ||||||||||||||||
| December 29, 2012 | December 31, 2011 | $ Change | % Change | |||||||||||||
| (in thousands) | ||||||||||||||||
Net sales | $ | 304,017 | $ | 327,072 | $ | (23,055 | ) | (7.0 | )% | |||||||
Cost of sales | 212,379 | 220,072 | (7,693 | ) | (3.5 | )% | ||||||||||
|
|
|
|
|
| |||||||||||
Gross profit | $ | 91,638 | $ | 107,000 | $ | (15,362 | ) | (14.4 | )% | |||||||
Gross margin | 30.1 | % | 32.7 | % | (2.6 | )% | ||||||||||
Net sales decreased $23.1 million, or 7.0%, for fiscal year 2012 compared to fiscal year 2011. Our net sales consisted of online sales, representing 91.8% of the total for fiscal year 2012 (compared to 94.1% in fiscal year 2011), and offline sales, representing 8.2% of the total for fiscal year 2012 (compared to 5.9% in fiscal year 2011). The net sales decrease was due to a decline of $28.8 million, or 9.3%, in online sales, partially offset by a $5.7 million, or 29.8%, increase in offline sales. Online sales decreased primarily due to a 7.1% reduction in unique visitors and a decline in average order value by 6.2%, partially offset by an increase of 2.2% in revenue capture. The decrease in unique visitors was due to the negative impact from customer traffic losses as a result of changes search engines have made to the algorithms that they use to optimize their search results. Also, our revenues were negatively impacted by the increased competition as described in further detail under “Executive Summary” above. Our offline sales, which consist of our Kool-Vue™ and wholesale operations, continued to show solid growth.
Gross profit decreased $15.4 million, or 14.4%, in fiscal year 2012 compared to fiscal year 2011. Gross margin rate decreased 2.6% to 30.1% in fiscal year 2012 compared to 32.7% in fiscal year 2011. Gross margin decreased in fiscal year 2012 compared to fiscal year 2011 due to reduced margins from both online and offline sales. Gross margin was unfavorably impacted by increased competition for fiscal year 2012 as certain of our suppliers are now selling directly to consumers online and an increase in inventory write downs of $1.0 million recorded in the fourth quarter of 2012.
Marketing Expense
| Fifty-Two Weeks Ended | $ Change | % Change | ||||||||||||||
| December 29, 2012 | December 31, 2011 | |||||||||||||||
| (in thousands) | ||||||||||||||||
Marketing expense | $ | 51,416 | $ | 55,785 | $ | (4,369 | ) | (7.8 | )% | |||||||
Percent of net sales | 16.9 | % | 17.1 | % | (0.2 | )% | ||||||||||
Total marketing expense decreased $4.4 million, or 7.8%, for fiscal year 2012 compared to fiscal year 2011. Online advertising expense, which includes catalog costs, was $21.1 million, or 7.5%, of online sales compared to $28.5 million, or 9.2%, of online sales for the prior year. Marketing expense, excluding online advertising, was $30.3 million, or 10.0%, of net sales compared to $27.3 million, or 8.4%, of net sales for the prior year. Online advertising expense decreased due to reduced catalog advertising costs of $3.5 million, and because our more substantial non-catalog online adverting expenses (including listing and placement fees paid to commercial and search engine websites) decreased by $3.9 million. Marketing expenses, excluding online advertising, increased primarily due to higher depreciation and amortization expense related to software deployments of $2.4 million.
General and Administrative Expense
| Fifty-Two Weeks Ended | ||||||||||||||||
| December 29, 2012 | December 31, 2011 | $ Change | % Change | |||||||||||||
| (in thousands) | ||||||||||||||||
General and administrative expense | $ | 19,857 | $ | 31,961 | $ | (12,104 | ) | (37.9 | )% | |||||||
Percent of net sales | 6.5 | % | 9.8 | % | (3.3 | )% | ||||||||||
General and administrative expense decreased $12.1 million, or 37.9%, for fiscal year 2012 compared to fiscal year 2011. The decrease was primarily due to the acquisition and integration related costs of $7.4 million for fiscal year 2011 related to our WAG acquisition, which were all recorded in general and administrative expense, compared to none in fiscal year 2012. Additionally, depreciation and amortization expense decreased by $2.4 million compared to the prior year due to certain assets that were fully depreciated, and merchant fees decreased by $1.4 million due to lower online sales compared to the prior year.
Fulfillment Expense
| Fifty-Two Weeks Ended | ||||||||||||||||
| December 29, 2012 | December 31, 2011 | $ Change | % Change | |||||||||||||
| (in thousands) | ||||||||||||||||
Fulfillment expense | $ | 22,265 | $ | 19,164 | $ | 3,101 | 16.2 | % | ||||||||
Percent of net sales | 7.3 | % | 5.9 | % | 1.4 | % | ||||||||||
Fulfillment expense increased $3.1 million, or 16.2%, for fiscal year 2012 compared to fiscal year 2011. The increase was primarily due to higher depreciation and amortization expense from software deployments of $2.7 million.
Technology Expense
| Fifty-Two Weeks Ended | ||||||||||||||||
| December 29, 2012 | December 31, 2011 | $ Change | % Change | |||||||||||||
| (in thousands) | ||||||||||||||||
Technology expense | $ | 6,274 | $ | 7,274 | $ | (1,000 | ) | (13.7 | )% | |||||||
Percent of net sales | 2.1 | % | 2.2 | % | (0.1 | )% | ||||||||||
Technology expense decreased $1.0 million, or 13.7%, for fiscal year 2012 compared to fiscal year 2011. Technology expense as a percentage of net sales remained consistent compared to the prior year. The decrease was primarily due to lower telephone expenses of $0.7 million in fiscal year 2012 compared to fiscal year 2011.
Amortization of Intangible Assets
| Fifty-Two Weeks Ended | ||||||||||||||||
| December 29, 2012 | December 31, 2011 | $ Change | % Change | |||||||||||||
| (in thousands) | ||||||||||||||||
Amortization of intangible assets | $ | 1,189 | $ | 3,673 | $ | (2,484 | ) | (67.6 | )% | |||||||
Percent of net sales | 0.4 | % | 1.1 | % | (0.7 | )% | ||||||||||
Amortization of intangibles decreased by $2.5 million, or 67.6%, for fiscal year 2012 compared to fiscal year 2011. The decrease was primarily due to certain acquired intangible assets that were fully amortized.
Impairment Loss on Goodwill
| Fifty-Two Weeks Ended | $ Change | % Change | ||||||||||||||
| December 29, 2012 | December 31, 2011 | |||||||||||||||
| (in thousands) | ||||||||||||||||
Impairment loss on goodwill | $ | 18,854 | $ | — | $ | 18,854 | N/M | |||||||||
Percent of net sales | 6.2 | % | — | % | 6.2 | % | ||||||||||
Impairment loss on goodwill consists of a non-cash impairment charge during the fourth quarter of 2012 for the excess of the carrying value over the implied fair value of goodwill in the amount of $18.9 million. See further detail in“Note 1- Summary of Significant Accounting Policies and Nature of Operations”,“Note 3 – Fair Value Measurements” and“Note 6- Goodwill and Intangible Assets” of the Notes to Consolidated Financial Statements included in Part IV, Item 15 of this report and under “Critical Accounting Policies and Estimates”section below.
Impairment Loss on Property and Equipment
| Fifty-Two Weeks Ended | $ Change | % Change | ||||||||||||||
| December 29, 2012 | December 31, 2011 | |||||||||||||||
| (in thousands) | ||||||||||||||||
Impairment loss on property and equipment | $ | 1,960 | $ | — | $ | 1,960 | N/M | |||||||||
Percent of net sales | 0.6 | % | — | % | 0.6 | % | ||||||||||
Impairment loss on property and equipment consists of a non-cash impairment charge during the fourth quarter of 2012 for the excess of the carrying value over the fair value of building and internally developed website and software development cost of $1.0 million and $0.9 million, respectively. See further detail in“Note 1- Summary of Significant Accounting Policies and Nature of Operations”,“Note 3 – Fair Value Measurements”and“Note 4- Property and Equipment” of the Notes to Consolidated Financial Statements included in Part IV, Item 15 of this report and under “Critical Accounting Policies and Estimates”section below.
Impairment Loss on Intangible Assets
| Fifty-Two Weeks Ended | $ Change | % Change | ||||||||||||||
| December 29, 2012 | December 31, 2011 | |||||||||||||||
| (in thousands) | ||||||||||||||||
Impairment loss on intangible assets | $ | 5,613 | $ | 5,138 | $ | 475 | 9.2 | % | ||||||||
Percent of net sales | 1.9 | % | 1.6 | % | 0.3 | % | ||||||||||
Impairment loss on intangibles consists of a fiscal year 2012 and 2011 non-cash impairment charge related to certain intangible assets in the amount of $5.6 million and $5.1 million. See further detail in1- Summary of Significant Accounting Policies and Nature of Operations”,“Note 3 – Fair Value Measurements” and“Note 6- Goodwill and Intangible Assets” of the Notes to Consolidated Financial Statements included in Part IV, Item 15 of this report and under “Critical Accounting Policies and Estimates”section below.
Total Other Expense, Net
| Fifty-Two Weeks Ended | $ Change | % Change | ||||||||||||||
| December 29, 2012 | December 31, 2011 | |||||||||||||||
| (in thousands) | ||||||||||||||||
Other expense, net | $ | 1,125 | $ | 654 | $ | 471 | 72.0 | % | ||||||||
Percent of net sales | 0.3 | % | 0.2 | % | 0.1 | % | ||||||||||
Total other expense, net increased $471,000, or 72.0%, for fiscal year 2012 compared to fiscal year 2011. The increase was primarily due to the loss on debt extinguishment of $360,000 in the second quarter of 2012 (refer to additional information in “Note 7 – Borrowings” of the Notes to Consolidated Financial Statements, included in Part IV, Item 15 of this report).
Income Tax Benefit
| Fifty-Two Weeks Ended | ||||||||||||||||
| December 29, 2012 | December 31, 2011 | $ Change | % Change | |||||||||||||
| (in thousands) | ||||||||||||||||
Income tax benefit | $ | 937 | $ | 1,512 | $ | (575 | ) | (38.0 | )% | |||||||
Percent of net sales | 0.3 | % | 0.5 | % | (0.2 | )% | ||||||||||
For fiscal year 2012 and 2011, the effective tax rate for the Company was 2.5% and 9.1% respectively. The Company’s effective tax rate for fiscal year 2012 differs from the U.S. federal statutory rate primarily as a result of the recording of an increase of $14.1 million valuation allowance primarily against the increase in the Company’s NOL’s generated as a result of the pre-tax loss of $36.9 million. The Company’s effective tax rate for fiscal 2011 differs from the U.S. federal statutory rate primarily as a result of the recording of an increase of $5.7 million of valuation allowance against the Company’s NOL’s generated as a result of pre-tax loss of $16.6 million.
Income tax provision (benefit) differs from the amount that would result from applying the federal statutory rate as follows (in thousands):
| Fifty-Two Weeks Ended | ||||||||
| December 29, 2012 | December 31, 2011 | |||||||
Income tax at U.S. federal statutory rate | $ | (12,551 | ) | $ | (5,661 | ) | ||
Share-based compensation | 38 | 21 | ||||||
State income tax, net of federal tax effect | (2,528 | ) | (1,629 | ) | ||||
Tax exempt interest | — | (3 | ) | |||||
Foreign tax | (27 | ) | (108 | ) | ||||
Other | 51 | 140 | ||||||
Change in valuation allowance | 14,080 | 5,728 | ||||||
|
|
|
| |||||
Effective income tax benefit | $ | (937 | ) | $ | (1,512 | ) | ||
|
|
|
| |||||
In 2012, the effective income tax benefit stems primarily from the reversal of the net deferred income tax liability resulting from the write down of goodwill and other intangible assets, and the impact of the Philippine tax holiday, partially offset by the accrual of withholding taxes related to potential repatriation of earnings in the Philippines (see below). The Company’s Philippine tax holiday was effective through September 2012. The Company is in the process of applying for a one-year extension. Although management expects the extension to be approved based on its discussion with the foreign taxing authority, the Philippines tax liability has been computed assuming no tax holiday on the post expiration earnings. The impact of this tax holiday decreased foreign taxes by $72,000, $144,000 and $182,000 for the fiscal year 2012, 2011 and 2010, respectively.
Prior to 2012, the Company treated earnings of the foreign subsidiaries as permanently invested in that jurisdiction. As a result, no additional income tax withholding was provided on the possible future repatriation of these earnings to the parent company in prior years. During fiscal year 2012, based on current year operating and future cash flow needs the Company decided that it could no longer represent that these funds would be indefinitely reinvested in the foreign jurisdictions but that such funds may be needed for general corporate purposes. As a result the Company has recorded future withholding taxes which would be due if the funds are required to be repatriated. The Company intends to continue to pursue all reasonable means to increase its investment in the foreign jurisdictions as dictated by future growth in general business activities or as allowed by the foreign jurisdictions to avoid incurring the income tax withholding expense.
As of December 29, 2012, the Company had no material unrecognized tax benefits, interest or penalties related to federal and state income tax matters.
Fifty-Two Weeks Ended December 31, 2011 Compared to the Fifty-Two Weeks Ended January 1, 2011
Net Sales and Gross Margin
| Fifty-Two Weeks Ended | ||||||||||||||||
| December 31, 2011 | January 1, 2011 | $ Change | % Change | |||||||||||||
| (in thousands) | ||||||||||||||||
Net sales | $ | 327,072 | $ | 262,277 | $ | 64,795 | 24.7 | % | ||||||||
Cost of sales | 220,072 | 172,668 | 47,404 | 27.5 | % | |||||||||||
|
|
|
|
|
| |||||||||||
Gross profit | $ | 107,000 | $ | 89,609 | $ | 17,391 | 19.4 | % | ||||||||
Gross margin | 32.7 | % | 34.2 | % | (1.5 | )% | ||||||||||
Consolidated net sales increased $64.8 million, or 24.7%, for fiscal year 2011 compared to fiscal year 2010. Excluding $83.4 million of sales from WAG, the USAP net sales for fiscal year 2011 were $243.7 million, an increase of 9.2% over fiscal year 2010 net sales, due to increases of $19.5 million, or 9.4%, in online sales and $1.0 million, or 6.2%, in offline sales, which consist of our Kool-Vue™ and wholesale operations.
The USAP increase in online sales is primarily due to a $15.6 million, or 9.0%, increase in e-commerce sales, which resulted from an increase of 211,007, or 11.8%, in total placed orders, an increase of 10.2 million, or 8.9%, in unique visitors, partially offset by a decrease of $2.49, or 2.1%, in average order value from fiscal year 2010 to fiscal year 2011. The increases in total placed orders and the unique visitors resulted from increased marketing spend driving higher paid traffic and better content on our websites driving more organic traffic. The increases were also attributed to more effective pricing, better catalog data and a better customer experience. Our average order value declined due to increased pricing competition and increased sales of lower cost direct sourced products.
Consolidated gross profit increased 19.4% from fiscal year 2010 to fiscal year 2011. Consolidated gross margin declined 1.5% to 32.7% compared to fiscal year 2010. Excluding the gross profit from WAG, USAP gross profit was $80.4 million, an increase of 6.1%, and USAP gross margin was 33.0% for fiscal year 2011 compared to 34.0% for fiscal year 2010. USAP gross margin was unfavorably impacted by a shift from body to engine parts and increased freight expenses.
Marketing Expense
| Fifty-Two Weeks Ended | ||||||||||||||||
| December 31, 2011 | January 1, 2011 | $ Change | % Change | |||||||||||||
| (in thousands) | ||||||||||||||||
Marketing expense | $ | 55,785 | $ | 38,757 | $ | 17,028 | 43.9 | % | ||||||||
Percent of net sales | 17.1 | % | 14.8 | % | 2.3 | % | ||||||||||
Marketing expense increased $17.0 million, or 43.9%, for fiscal year 2011 compared to fiscal year 2010. Excluding $20.7 million of marketing expense from WAG, the USAP marketing expense increased $4.9 million, or 16.4%, from fiscal year 2010, primarily due to higher amortization costs related to software deployments and an increase in advertising spend which resulted in higher listing and placement fees paid to commercial and search engine websites such as eBay, Google and MSN.
General and Administrative Expense
| Fifty-Two Weeks Ended | ||||||||||||||||
| December 31, 2011 | January 1, 2011 | $ Change | % Change | |||||||||||||
| (in thousands) | ||||||||||||||||
General and administrative expense | $ | 31,961 | $ | 28,628 | $ | 3,333 | 11.6 | % | ||||||||
Percent of net sales | 9.8 | % | 10.9 | % | (1.1 | )% | ||||||||||
General and administrative expense increased $3.3 million or 11.6%, for fiscal year 2011 compared to fiscal year 2010. Excluding $12.9 million and $22.7 million from WAG for fiscal year 2011 and 2010, respectively, the USAP general and administrative expense decreased $3.6 million primarily due to lower legal expense and depreciation and amortization.
Fulfillment Expense
| Fifty-Two Weeks Ended | $ Change | % Change | ||||||||||||||
| December 31, 2011 | January 1, 2011 | |||||||||||||||
| (in thousands) | ||||||||||||||||
Fulfillment expense | $ | 19,164 | $ | 14,946 | $ | 4,218 | 28.2 | % | ||||||||
Percent of net sales | 5.9 | % | 5.7 | % | 0.2 | % | ||||||||||
Fulfillment expense increased $4.2 million, or 28.2%, for fiscal year 2011 compared to fiscal year 2010. Excluding $3.9 million of fulfillment expense from WAG, the USAP fulfillment expense increased $2.0 million due to an increase in warehouse labor expense in connection with the WAG integration and higher depreciation and amortization from software deployments.
Technology Expense
| Fifty-Two Weeks Ended | $ Change | % Change | ||||||||||||||
| December 31, 2011 | January 1, 2011 | |||||||||||||||
| (in thousands) | ||||||||||||||||
Technology expense | $ | 7,274 | $ | 5,902 | $ | 1,372 | 23.2 | % | ||||||||
Percent of net sales | 2.2 | % | 2.3 | % | (0.1 | )% | ||||||||||
Technology expense increased $1.4 million, or 23.2%, for fiscal year 2011 compared to fiscal year 2010. Excluding $2.3 million of technology expense from WAG, the USAP technology expense increased $0.4 million, however, as a percentage of net sales, fiscal year 2011 remained consistent with fiscal year 2010.
Amortization of Intangible Assets
| Fifty-Two Weeks Ended | $ Change | % Change | ||||||||||||||
| December 31, 2011 | January 1, 2011 | |||||||||||||||
| (in thousands) | ||||||||||||||||
Amortization of intangibles | $ | 3,673 | $ | 2,804 | $ | 869 | 31.0 | % | ||||||||
Percent of net sales | 1.1 | % | 1.1 | % | — | % | ||||||||||
Amortization of intangibles increased by $0.9 million, or 31.0%, in fiscal year 2011, primarily due to a full year of amortization expense in the amount of $3.2 million related to the intangible assets acquired in connection with our acquisition of WAG in August 2010.
Impairment Loss on Intangible Assets
We recognized an impairment charge on intangible assets related to certain WAG trade names in the amount of $5.1 million. See further detail in“Note 6- Goodwill and Intangible Assets” of the Notes to Consolidated Financial Statements included in Part IV, Item 15 of this report and under “Critical Accounting Policies and Estimates”section below.
Other Income.Expense, Net
| Fifty-Two Weeks Ended | $ Change | % Change | ||||||||||||||
| December 31, 2011 | January 1, 2011 | |||||||||||||||
| (in thousands) | ||||||||||||||||
Other expense, net | $ | (654 | ) | $ | (280 | ) | $ | (374 | ) | (133.6 | )% | |||||
Percent of net sales | (0.2 | )% | (0.1 | )% | (0.1 | )% | ||||||||||
Other expense, net increased $0.4 million, or 133.6%, for fiscal year 2011 compared to fiscal year 2010, primarily due to the interest of $1.1 million paid in connection with the Company’s credit facility executed in August 2010.
Income Tax (Benefit) Provision
| Fifty-Two Weeks Ended | $ Change | % Change | ||||||||||||||
| December 31, 2011 | January 1, 2011 | |||||||||||||||
| (in thousands) | ||||||||||||||||
Income tax (benefit) provision | $ | (1,512 | ) | $ | 12,218 | $ | (13,730 | ) | (112.4 | )% | ||||||
Percent of net sales | (0.5 | )% | 4.7 | % | (5.2 | )% | ||||||||||
For fiscal year 2010 and 2011, the effective tax rate for the Company was (715.3)% and 9.1%, respectively. The Company’s effective tax rate is significantly higher in fiscal year 2010 than the U.S. federal statutory rate primarily due to the recognition of a full valuation allowance against the Company’s net deferred tax assets of $13.6 million. Prior to the acquisition of WAG, the Company concluded that it was more likely than not that we would realize the deferred tax assets in all jurisdictions. However, with the acquisition of WAG, based largely on the weight of the combined cumulative three-year adjusted loss position, it was determined that it was more likely than not that the Company would not realize its net deferred tax assets. Therefore, a valuation allowance balance of $18.3 million was recorded as of January 1, 2011, of which $4.7 million was recorded against the acquired deferred tax assets of WAG as of August 12, 2010. In fiscal 2011 an additional valuation allowance of $5.7 million was recorded to offset the increase in the NOL’s , resulting from the Company’s losses in fiscal 2011. The valuation allowance balance was $22.8 million at December 31, 2011. The Company’s effective tax rate for fiscal year 2011 differs from the U.S. federal statutory rate primarily as a result of the recording of the $5.7 million valuation allowance.
Income tax (benefit) provision differs from the amount that would result from applying the federal statutory rate as follows (in thousands):
| Fifty-Two Weeks Ended | ||||||||
| December 31, 2011 | January 1, 2011 | |||||||
Income tax at U.S. federal statutory rate | $ | (5,661 | ) | $ | (581 | ) | ||
Share-based compensation | 21 | (93 | ) | |||||
State income tax, net of federal tax effect | (1,629 | ) | (759 | ) | ||||
Tax exempt interest | (3 | ) | (8 | ) | ||||
Foreign tax | (108 | ) | (210 | ) | ||||
Non deductible acquisition costs | — | 258 | ||||||
Other | 140 | 1 | ||||||
Change in valuation allowance | 5,728 | 13,610 | ||||||
|
|
|
| |||||
Effective tax provision (benefit) | $ | (1,512 | ) | $ | 12,218 | |||
|
|
|
| |||||
The Company’s effective tax rate was impacted by income taxes incurred in foreign and state jurisdictions. With respect to the income of its foreign subsidiaries, the Company takes the position that the earnings of the foreign subsidiaries are permanently invested in that jurisdiction. Additionally, the foreign subsidiaries are currently in a cumulative deficit earning and profits position for tax purposes. As a result, no additional income taxes have been provided on the possible repatriation of these earnings to the parent company. The favorable impact of foreign taxes was due in large part to a tax holiday in the Philippines, which was effective through September 2011. As of the date of filing our Annual Report on Form 10-K for the fiscal year ended December 31, 2011, we were in the process of applying for a one year extension, which was subsequently approved and was effective through September 2012. Although management expected the extension to be approved based on its discussion with the foreign taxing authority, the Philippines tax rate was applied to the earnings after the expiration of the initial tax holiday. The impact of this tax holiday decreased foreign taxes by $136,000, $182,000 and $144,000 for fiscal years 2009, 2010 and 2011, respectively. The benefit of the tax holiday on net income (loss) per share (diluted) was immaterial for the related years.
As of December 31, 2011, the Company had no material unrecognized tax benefits, interest or penalties related to federal and state income tax matters.
Liquidity and Capital Resources
Sources of Liquidity
During the fifty-two weeks ended December 29, 2012, we funded our operations with cash and cash equivalents generated from operations, proceeds from sale of investments and our credit facility. We had cash and cash equivalents of $1.0 million as of December 29, 2012, representing a $9.3 million decrease from $10.3 million of cash and cash equivalents as of December 31, 2011. The decrease in cash and cash equivalents was primarily due to payments on accounts payable, capital expenditures, payments on debt and negative cash flows from other working capital sources, partially offset by
proceeds from revolving loan payable and net proceeds from sales of our investments. Based on our current operating plan, we believe that our existing cash and cash equivalents, investments, cash flows from operations and debt financing will be sufficient to finance our operational cash needs through at least the next twelve months, provided, however, that we may decide to augment our cash flows from operations and debt financing with sales of our equity or selected assets on terms that we determine to be satisfactory to us. For example, we are in discussions regarding possible multiple equity offerings that we expect to close in the near term and from which we expect to receive $6 million to $9 million of gross proceeds. There can be no assurance, however, that we will be able to close any equity offering in the near term or for those gross proceeds or at all.
As of December 29, 2012, we had $110,000 in short-term investments, comprised of mutual funds (refer to investment details in “Note 2 – Investments” Other incomeof the Notes to Consolidated Financial Statements, included in Part IV, Item 15 of this report). Our April 2012 credit facility provides for a revolving commitment of up to $40 million subject to a borrowing base derived from certain of our receivables, inventory and property and equipment (see “Debt and Available Borrowing Resources” below).
In May 2011, we filed a shelf registration statement covering the offer and sale of up to $200 million of common stock with the SEC. The shelf registration was declared effective by the SEC on August 10, 2011. The terms of any offering under our shelf registration statement will be determined at the time of the offering and disclosed in a prospectus supplement filed with the SEC.
Working Capital
As of December 29, 2012 and December 31, 2011, our working capital was $(4.0) million and $8.7 million, respectively. The negative working capital as of December 29, 2012 is primarily the result of the current classification of our $16.2 million revolving loan payable compared to our $6.3 million current portion of long-term debt as of December 31, 2011. We expect the level of our working capital to be the same until we significantly reduce or eliminate our revolving loan payable. Our credit facility consists of miscellaneousa five-year revolving loan with available funds of up to $40 million subject to a borrowing base derived from certain of our receivables, inventory and property and equipment (see further discussion in “Debt and Available Borrowing Resources” below). Our revolving loan does not require principal payments, however is classified as current due to certain U.S. GAAP requirements (see “Debt and Available Borrowing Resources” below for further details). The historical seasonality in our business during the year can cause cash and cash equivalents, inventory and accounts payable to fluctuate, resulting in changes in our working capital.
Cash Flows
The following table summarizes the key cash flow metrics from our consolidated statements of cash flows for fiscal year 2012, 2011 and 2010, respectively (in thousands):
| Fifty-Two Weeks Ended | ||||||||||||
| December 29, 2012 | December 31, 2011 | January 1, 2011 | ||||||||||
Net cash (used in) provided by operating activities | $ | (400 | ) | $ | 10,378 | $ | (1,709 | ) | ||||
Net cash used in investing activities | (7,178 | ) | (11,524 | ) | (31,048 | ) | ||||||
Net cash (used in) provided by financing activities | (1,736 | ) | (6,100 | ) | 23,883 | |||||||
Effect of exchange rate changes on cash | 9 | (14 | ) | 218 | ||||||||
|
|
|
|
|
| |||||||
Net decrease in cash and cash equivalents | $ | (9,305 | ) | $ | (7,260 | ) | $ | (8,656 | ) | |||
|
|
|
|
|
| |||||||
Operating Activities
Cash provided by operating activities is primarily comprised of net income (loss), adjusted for non-cash activities such as gaindepreciation and amortization expense, amortization of intangible assets, impairment losses and share-based compensation expense. These non-cash adjustments represent charges reflected in net income (loss) and, therefore, to the extent that non-cash items increase or decrease our operating results, there will be no corresponding impact on our cash flows. Net loss adjusted for non-cash adjustments to operating activities was $8.2 million (adjusted for non-cash charges primarily consisting of impairment losses of $26.4 million and depreciation and amortization expense of $15.2 million) for the period ended December 29, 2012, compared to $7.6 million (adjusted for non-cash charges primarily consisting of impairment losses of $5.1 million and depreciation and amortization expense of $12.7 million) for the period ended December 31, 2011. After excluding the effects of the non-cash charges, the primary changes in cash flows relating to operating activities resulted from dispositionchanges in operating assets and liabilities.
Inventory decreased to $42.7 million at December 29, 2012 from $52.2 million at December 31, 2011, resulting in a decrease in operating assets and reflecting a cash inflow of $9.5 million for the fifty-two weeks ended December 29, 2012. We expect the level of our inventory to continue to decrease over the next twelve months due to lower revenues over the same period.
Accounts payable and accrued expenses decreased to $38.5 million at December 29, 2012 compared to $52.9 million at December 31, 2011 resulting in a decrease in operating liabilities and reflecting a cash outflow of $14.9 million for the fifty-two weeks ended December 29, 2012. Accounts payable and accrued expenses decreased primarily due to the decrease in accounts payable of $13.3 million. Accounts payable could fluctuate in future periods due to the amount of our revenues and the related purchases and the timing of our payments.
Other current liabilities decreased to $4.7 million at December 29, 2012 compared to $7.7 million at December 31, 2011, resulting in a decrease in operating liabilities and reflecting a cash outflow of $3.0 million for the fifty-two weeks ended December 29, 2012. Other current liabilities decreased due to the decreases in sales return, warranty and gift card liabilities.
Investing Activities
For the fifty-two weeks ended December 29, 2012 and December 31, 2011, net cash used in investing activities was primarily the result of increases in property and equipment ($10.2 million and $14.3 million, respectively), partially offset from net proceeds received from the sales of our investments ($3.2 million and $2.6 million, respectively). We expect our capital expenditures to decrease over the next twelve months as we attempt to reduce expenditures in an effort to satisfy our operational cash needs during the same period.
Financing Activities
For the fifty-two weeks ended December 29, 2012, net cash used in financing activities was primarily the result of payments made on debt, totaling $28.4 million, which included the payoff of our previous term loan balance of $17.9 million and payments on our new revolving loan of $10.5 million, partially offset by the proceeds received from our revolving loan of $26.7 million (see further discussion in “Debt and Available Borrowing Resources” below). For the fifty-two weeks ended December 31, 2011, net cash used in financing activities was primarily the result of payments made on debt of $6.1 million.
Debt and Available Borrowing Resources
Total debt (primarily comprised of a revolving loan payable of $16.2 million, discussed further below) was $16.4 million as of December 29, 2012, compared to $18.0 million as of December 31, 2011. The decrease was due to net debt payments we made to our revolving loan payable during 2012 which were required in order to maintain a borrowing base sufficient to allow for continued borrowing under our loan (see further discussion below).
On April 26, 2012, the Company, certain of its wholly-owned domestic subsidiaries and JPMorgan Chase Bank, N.A., as sole lender and administrative agent entered into a Credit Agreement (the “Credit Agreement”). The Credit Agreement provides for a revolving commitment in an aggregate principal amount of up to $40,000,000 (the “Credit Facility”), which is subject to a borrowing base derived from certain receivables, inventory and property and equipment. The Credit Facility matures on April 26, 2017. The Company used the proceeds of the loans borrowed on the closing date to repay in full its previous credit facility with Silicon Valley Bank. In connection with the payoff of our previous credit facility, the Company recorded a loss on debt extinguishment of $360,000 which was comprised of a prepayment fee in the amount of $166,000, accelerated deferred financing costs in the amount of $185,000 and other direct expenses related to the previous debt. At December 29, 2012, our outstanding revolving loan balance was $16.2 million. The customary events of default under the Credit Facility include certain subjective acceleration clauses. Management has determined the likelihood of such acceleration is more than remote, considering the recurring losses experienced by the Company, therefore a current classification of our revolving loan payable was required as of December 29, 2012.
Loans drawn under the Credit Facility bear interest, at the Company’s option, at a per annum rate equal to either (a) LIBOR plus an applicable margin of 1.50%, or (b) an “alternate base rate” minus an applicable margin of 0.50%. Each applicable margin as set forth in the prior sentence is subject to increase or decrease by 0.25% per annum based upon the Company’s fixed charge coverage ratio. At December 29, 2012, the Company’s LIBOR based interest rate was 1.75% (on $15.0 million principal) and the Company’s Prime based rate was 2.75% (on $1.2 million principal). A commitment fee, based upon undrawn availability under the Credit Facility bearing interest at a rate of 0.20% per annum, is payable monthly. Under the terms of the Credit Agreement, cash receipts are deposited into a lock-box, which are at the Company’s discretion unless the “cash dominion period” is in effect, during which cash receipts will be used to reduce amounts owing under the Credit Agreement. The cash dominion period is triggered in an event of default or if excess availability is less than $6,000,000 at any time, as defined, and will continue until, during the preceding 60
consecutive days, no event of default existed and excess availability has been greater than $7,000,000 at all times. The Company’s excess availability was $10.8 million at December 29, 2012 or $4.8 million that was available above the cash dominion trigger of $6 million. On March 12, 2013, we entered into a first amendment to the previously entered credit agreement in April 2012 (“Amended Credit Agreement”). The Amended Credit Agreement includes an amendment to the definition of covenant testing trigger period to commence on any day that excess availability is less than $4 million solely during the period March 1, 2013 through and including April 15, 2013 and continuing until excess availability has been greater than or equal to $4 million solely during the period of March 1, 2013 through and including April 15, 2013 at all times for 45 consecutive calendar days. As of the date hereof, the cash dominion period has not been in effect; accordingly no principal payments are currently due. By amendment to the Credit Agreement, the Company, subject to the satisfaction of certain conditions, also has the right to request increases to the revolving commitments up to and above $60,000,000. The Company, to date, has not requested such increases. As of December 29, 2012, the Company was in compliance with all covenants under the Credit Agreement.
Our credit facility is subject to a borrowing base derived from certain of our receivables, inventory and property and equipment. In the event that components of the borrowing base are adversely affected for any reason, including adverse market conditions or downturns in general economic conditions, we could be restricted in the amount of funds we can borrow under the credit facility. Furthermore, in the event that components of the borrowing base decrease to a level below the amount of loans then-outstanding under the credit facility, we could be required to immediately repay loans to the extent of such shortfall. If we became unable to borrow under the credit facility, or are required to immediately repay loans under the credit facility, our liquidity and capital resources and ability to operate our business could be severely impacted, which would have a material adverse effect on our financial condition and results of operations. In those events, we may need to sell our assets or seek equity or additional debt financing. There can be no assurance in those circumstances that we would be able to raise such additional financing or engage in such asset sales on acceptable terms, or at all. If we are not able to raise adequate additional financing or proceeds from asset sales to continue to fund our operations as planned in those circumstances, we will need to defer, reduce or eliminate significant planned expenditures, restructure or significantly curtail our operations or sell some of our assets.
Our credit facility requires us to satisfy certain financial covenants. These financial covenants and tests could limit our ability to react to market conditions or satisfy extraordinary capital needs and could otherwise restrict our financing and operations. Under the Credit Agreement, the Company is not required to maintain a minimum fixed charge coverage ratio, unless excess availability is less than $6,000,000, whereby a ratio of 1.0 to 1.0 will be required. If our excess availability is reduced to less than $6 million, we will not comply with the minimum fixed charge coverage ratio. If we are unable to satisfy the financial covenants and tests at any time, we may as a result cease being able to borrow under the credit facility or are required to immediately repay loans under the credit facility, our liquidity and capital resources and ability to operate our business could be severely impacted, which would have a material adverse effect on our financial condition and results of operations. In those events, we may need to sell our assets or seek equity or additional debt financing or attempt to modify our existing Credit Agreement. There can be no assurance that we would be able to raise such additional financing or engage in such asset sales on acceptable terms, or at all.
See additional information in“Note 7 – Borrowings” of the Notes to Consolidated Financial Statements included in Part IV, Item 15 of this report.
Funding Requirements
Based on our current operating plan, we believe that our existing cash, cash equivalents, investments, cash flows from operations and available debt financing will be sufficient to finance our operational cash needs through at least the next twelve months, provided, however, that we may decide to augment our cash flows from operations and debt financing with sales of our equity or selected assets on terms that we determine to be satisfactory to us. For example, we are in discussions regarding possible multiple equity offerings that we expect to close in the near term and from which we expect to receive $6 million to $9 million of gross proceeds. There can be no assurance, however, that we will be able to close any equity offering in the near term or for those gross proceeds or at all. As discussed above, our Credit Facility provides a less restrictive asset-based funding limit, which gives us improved liquidity options at a lower cost of capital. Our future capital requirements may, however, vary materially from those now planned or anticipated. Changes in our operating plans, lower than anticipated net sales, increased expenses, continued or worsened economic conditions, worsening operating performance by us, or other events, including those described in “Risk Factors” included in Part I, Item 1A may force us to sell our existing assets and seek additional debt or equity financing in the future. We may need to issue common stock under our shelf registration, discussed above. There can be no assurance that we would be able to raise such additional financing or engage in such asset sales on acceptable terms, or at all. If we are not able to raise adequate additional financing or proceeds from asset sales, we will need to defer, reduce or eliminate significant planned expenditures, restructure or significantly curtail our operations, sell some of our assets.
Off-Balance Sheet Arrangements
We have no off-balance sheet arrangements.
Contractual Obligations
The following table sets forth our contractual cash obligations and commercial commitments as of December 29, 2012:
| Payment Due By Period (in thousands) | ||||||||||||||||||||
Contractual Obligations: | Total | Less than 1 year | 1-3 years | 3-5 years | More than 5 years | |||||||||||||||
Principal payments on debt(1) | $ | 16,222 | $ | — | $ | — | $ | 16,222 | $ | — | ||||||||||
Interest payments on long-term debt(2) | 1,297 | 300 | 600 | 397 | — | |||||||||||||||
Operating lease obligations(3) | 4,346 | 1,399 | 2,257 | 690 | — | |||||||||||||||
Capital lease obligations(4) | 149 | 75 | 45 | 29 | — | |||||||||||||||
| (1) | Amounts represent the expected principal cash payments relating to our debt and do not include any fair value adjustments or discounts and premiums. Our outstanding debt is comprised of a revolving loan which currently has no principal payment requirements, and matures in April 2017. See additional information in “Liquidity and Capital Resources – Debt and Available Borrowing Resources” above. |
| (2) | Amounts represent the expected interest cash payments relating to our revolving loan balance at December 29, 2012. The interest rates at December 29, 2012 were used to calculate the expected future interest payments. |
| (3) | Commitments under operating leases relate primarily to our leases on our principal facility in Carson, California, our distribution centers in Chesapeake, Virginia and Independence, Ohio, and our call center in the Philippines. Total operating lease commitments include payments due to a related party for one of our facilities leases in the amount of $156,000. |
| (4) | Commitments under capital leases relate to equipment lease agreements and include interest. |
Seasonality
We believe our business is subject to seasonal fluctuations. We have historically experienced higher sales of body parts in winter months when inclement weather and hazardous road conditions typically result in more automobile collisions. Engine parts and performance parts and accessories have historically experienced higher sales in the summer months when consumers have more time to undertake elective projects to maintain and enhance the performance of their automobiles and the warmer weather during that time is conducive for such projects. We expect the historical seasonality trends to continue to have a material impact on our financial condition and results of operations during the reporting periods in any given year.
Inflation
Inflation has not had a material impact upon our operating results, and we do not expect it to have such an impact in the near future. We cannot assure you that our business will not be affected by inflation in the future.
Recent Accounting Pronouncements
See “Note 1 – Summary of Significant Accounting Policies and Nature of Operations” of the Notes to Consolidated Financial Statements, included in Part IV, Item 15 of this report.
Critical Accounting Policies and Estimates
Our consolidated financial statements have been prepared in accordance with accounting principles generally accepted in the United States. The preparation of our financial statements requires us to make estimates and assumptions that affect the reported amounts of assets, liabilities, net sales, costs and expenses, as well as the disclosure of contingent assets and liabilities and other related disclosures. On an ongoing basis, we evaluate our estimates, including, but not limited to, those related to revenue recognition, uncollectible receivables, inventory reserve, intangible and other long-lived assets and contingencies. We base our estimates on historical experience and on various other assumptions that we believe to be reasonable under the circumstances, the results of which form the basis for making judgments about carrying values of our assets and liabilities that are not readily apparent from other sources. Actual results could differ from those estimates, and we include any revisions to our estimates in our results for the period in which the actual amounts become known.
We believe the critical accounting policies described below affect the more significant judgments and estimates used in the preparation of our consolidated financial statements. Accordingly, these are the policies we believe are the most critical to aid in fully understanding and evaluating our historical consolidated financial condition and results of operations:
Revenue Recognition. From the Company’s inception of business through the first quarter of fiscal 2010, the Company recognizedWe recognize revenue from product sales and shipping revenues, net of promotional discounts and return allowances , when the following four revenue recognition criteria wereare met: persuasive evidence of an arrangement exists, delivery has occurred (to the common carrier)both title and risk of loss or damage have transferred, , the selling price is fixed or determinable, and collectability is reasonably assured. These criteria followed the Company’s general policy to recognize revenue according to its shipping terms, which were F.O.B. shipping point. Under this policy, title and risk of loss were transferred to the customer upon delivery to the common carrier, at which time, revenue was recognized.
Although the Company had no legal obligation to compensate the customer, the Company generally replaces the product or reimburses the customer for goods that were lost or damaged in transit and filed a claim to the common carrier for reimbursement for such loss. The Company executed a new pricing agreement with its primary carrier which offered a lower price per delivery and eliminated the Company’s option to file reimbursement claims for product lost or damaged in transit. As a result of this agreement, the Company determined thatretains the risk of loss or damage during transit, would be retained by the Company. Therefore, the Company determined thattherefore, revenue from product sales should beis recognized at the delivery date notto customer. . Return allowances, which reduce product revenue by the ship date.
This change in the second quarterCompany’s best estimate of fiscal 2010 resulted in a deferral of $2.0 million of sales revenue and a decrease in cost of goods sold of $1.5 million, which reduced gross profit by $411,000. The Company has recognized revenue upon delivery to the customer starting the second quarter of fiscal 2010.expected product returns, are estimated using historical experience.
Revenue from sales of advertising is recorded when performance requirements of the related advertising program agreement are met. For fiscal 2011,
We evaluate the advertisingcriteria of ASC 605-45Revenue Recognition Principal Agent Considerations in determining whether it is appropriate to record the gross amount of product sales and related costs or the net amount earned as commissions. Generally, when the Company is the primary party obligated in a transaction, the Company is subject to inventory risk, has latitude in establishing prices and selecting suppliers, or has several but not all of these indicators, revenue represented approximately 2% of our total revenue.is recorded at gross.
We evaluated the criteria of Accounting Standards Codification (“ASC”) Topic 605-45 -Revenue Recognition - Principal Agent Considerations(“ASC 605-45”), in determining whether it is appropriate to record the gross amount of product sales and related costs or the net amount earned as commissions. WhenGenerally, when we are the primary party obligated in a transaction, are subject to inventory risk, have latitude in establishing prices and selecting suppliers or have several but not all of these indicators, revenue is recorded at gross.
Product sales and shipping revenues, net of promotional discounts and return allowances, are recorded when the products are delivered and title passes to customers. Retail items sold to customers are made pursuant to terms and conditions that provide for transfer of both title and risk of loss upon our delivery to the customer. Return allowances, which reduce product revenue by our best estimate of expected product returns, are estimated using historical experience.
Payments received prior to the delivery of goods to customers are recorded as deferred revenue.
We periodically provide incentive offers to our customers to encourage purchases. Such offers include current discount offers, such as percentage discounts off of current purchases and other similar offers. Current discount offers, when accepted by our customers, are treated as a reduction to the purchase price of the related transaction.
Sales discounts are recorded in the period in which the related sale is recognized. Sales return allowances are estimated based on historical amounts and are recorded upon recognizing the related sales. Credits are issued to customers for returned products.
Fair Value Measurements.We account for fair value measurements in accordance with ASC Topic 820Fair Value Measurements and Disclosures(“ASC 820”), which defines fair value, provides a framework for measuring fair value and provides the disclosure requirements for fair value measurements. ASC 820 also establishes a three-tier fair value hierarchy, which prioritizes the inputs used in measuring fair value. These tiers include: Level 1 - defined as observable inputs such as quoted prices in active markets; Level 2 - defined as inputs other than quoted prices in active markets that are either directly or indirectly observable; and Level 3 - defined as unobservable inputs in which little or no market data exists, therefore requiring an entity to develop its own assumptions.
We have evaluated both Level 2 and Level 3 evidence to measure the fair value of our $2.1 million of ARPS as of December 31, 2011. These investments consist solely of collateralized debt obligations supported by municipal and state agencies; do not include mortgage-backed securities or student loans; have redemption features that call for redemption at 100% of par value; and have a current credit rating of A or AAA. During fiscal 2011, we received partial redemptions at par value on our investments totaling $2.1 million. The fact that there continues to not be an active market as of December 31, 2011 to liquidate 100% of these investments, continues to be the final determination in classifying them as Level 3. We used a discounted cash flow valuation model to estimate the fair value of the securities. As a result of the temporary declines in fair value of our ARPS, which we attribute to liquidity issues rather than credit issues, we have recorded an unrealized loss of $21,000 to accumulated other comprehensive income. If our key assumptions used to determine estimated discounted cash flows change in the future, we may be required to record additional losses.
Inventory. Inventory consists of finished goods available-for-sale. We purchase inventory from suppliers both domestically and internationally, primarily in Taiwan and China. We believe that our products are generally available from more than one supplier, and we maintain multiple sources for many of our products, both internationally and domestically. We offer a broad line of auto parts for automobiles from model years 1965 to 2011.2012. Because of the continued demand for our products, we primarily purchase products in bulk quantities to take advantage of quantity discounts and to ensure inventory availability.
Inventory is accounted for using the first-in first-out (“FIFO”) method and valued at the lower of cost or market value. During this valuation, we are required to make judgments about expected disposition of inventory, generally, through sales, returns to product vendors, or liquidations of obsolete or scrap products, and expected recoverable values of each disposition category based on currently-available information. If actual market conditions are less favorable than those anticipated by management, additional write-down of the value of our inventory may be required.
Website and Software Development Costs. We capitalize certain costs associated with software developed for internal use according to ASC Topic 350-40-Intangibles – Goodwill and Other – Internal-Use Software(“ASC 350-40”), and ASC Topic
350-50-Intangibles – Goodwill and Other – Website Development Costs (“ASC 350-50”). Under these provisions, we capitalize costs associated with website development and software developed for internal use when both the preliminary project design and testing stage are completed and management has authorized further funding for the project, which it deems probable of completion and to be
used for the function intended. Capitalized costs include amounts directly related to website development and software development such as payroll and payroll-related costs for employees who are directly associated with, and who devote time to, the internal-use software project. Capitalization of these costs ceases when the project is substantially complete and ready for its intended use. These amounts are amortized on a straight-line basis over two to three years once the software is placed into service.
Long-Lived Assets and Intangibles. We acquire tangible and intangible assets in the normal course of business. We evaluate the recoverability of the carrying amount of these long-lived assets whenever events or changes in circumstances indicate that the carrying value of an asset may not be recoverable in accordance with ASC Topic 360-Property, Plant, and Equipment(“ASC 360”).Management. Management assesses potential impairments whenever events or changes in circumstances indicate that the carrying value of an asset may not be recoverable. An impairment loss will result when the carrying value exceeds the undiscounted cash flows estimated to result from the use and eventual disposition of the asset. Impairment losses will be recognized in operating results to the extent that the carrying value exceeds the discounted future cash flows estimated to result from the use and eventual disposition of the asset. We continually use judgment when applying these impairment rules to determine the timing of the impairment tests, undiscounted cash flows used to assess impairments, and the fair value of a potentially impaired asset. The reasonableness of our judgments could significantly affect the carrying value of our long-lived assets. For fiscal year 2012, we recorded impairment charges on property and equipment and intangibles subject to amortization of $1.9 million and $1.7 million, respectively. Any further reduction in the fair value of long-lived assets will result in additional impairment charges. We did not recognize any impairment losses on long-lived assets and intangibles subject to amortization for fiscal 2009, 2010year 2011 and 2011.2010.
Goodwill and Indefinite-Lived Intangibles. We account for goodwill under the guidance set forth in ASC Topic 350-Intangibles – Goodwill and Other(“ASC 350”), which specifies that goodwill and indefinite-lived intangibles should not be amortized. We have historically evaluated goodwill and indefinite-lived intangibles for impairment on an annual basis or more frequently if events or circumstances occur that would indicate a reduction in fair value. Our annual impairment testing date is October 31. In addition, we identified a singletwo reporting unitunits, Base USAP, which is the core auto parts business, and AutoMD, an online automotive repair source, (refer to “Segment Data” in“Note 1- Summary of Significant Accounting Policies and Nature of Operations” of the Notes to Consolidated Financial Statements included in Part IV, Item 15 of this report.) in accordance with ASC 350.280Segment Reporting. We identified AutoMD as a reporting unit for purposes of the goodwill impairment testing and no impairment charge was recorded related to this reporting unit. The results of the impairment testing discussed below refer solely to Base USAP. The goodwill impairment test is a two-step impairment test. The first step compares the fair value of each reporting unit with its carrying amount including goodwill. We estimate the fair value of the reporting unit based on an equal weighting of two market approaches and anthe income approach, which utilizes discounted future cash flows. The market approaches utilized market multiples of invested capital from 1) comparable publicly traded companies and 2) comparable transactions. The market multiples from invested capital include revenues, total assets, book equity plus debt and EBITDA. Assumptions critical to the fair value estimates under the discounted cash flow model include discount rates, cash flow projections, projected long-term growth rates and the determination of terminal values. Management has performedThe market approach was used as a sensitivity analysis ontest of reasonableness to corroborate the income approach. The market approach utilized market multiples of invested capital from publicly traded companies in similar lines of business. The market multiples from invested capital include revenues, total assets, book equity plus debt and EBITDA.
During the fourth quarter of 2012, the Company identified adverse events related to the Company’s overall financial performance, including the accelerating downward trend in the Company’s revenues and negative cash flows from operations, and a sustained decline in the Company’s share price, that would more likely than not reduce the fair value of our reporting unit below its significant assumptions and has determined that a change in its assumptions within selected sensitivity testing levels would not impact its conclusion.carrying amount. The excess of faircarrying value over carryingfair value for our reporting unit as of October 31, 2011,2012, the annual testing date, was approximately $50 million, and there would have to be a 38% decrease in the estimated fair value of the reporting unit to fail step1.$21.8 million. If the carrying amount exceeds estimated fair value, then the second step of the impairment test is performed to measure the amount of any impairment loss by comparing the implied fair value of the reporting unit to its carrying value. We completed our annual testingvalue and passedimpairment losses will be recognized in operating results. Therefore, the firstCompany performed the second step of the goodwill impairment test. Current guidance, adoptedtest to measure the amount of impairment loss. The second step compares the implied fair value of goodwill with the carrying amount of goodwill. The implied fair value of goodwill is determined in the fourth quartersame manner as the amount of fiscal 2011, provides the option to first assess qualitative factors to determine whether the existencegoodwill recognized in a business combination. The excess of events or circumstances leads to a determination that it is more likely than not that the fair value of a reporting unit over the amounts assigned to its assets and liabilities is less than its carrying amount. If, after assessing the totality of events or circumstances, an entity determines it is not more likely than not that theimplied fair value of a reporting unit is less than its carrying amount, then performing the two-step impairment test is unnecessary. We opted to continue to perform the step one test for fiscal 2011 as discussed above. We did not recognize anygoodwill.
Based on our analysis, we recognized impairment loss on goodwill and indefinite-lived intangiblesof $18.9 million for the fourth quarter of 2012. No impairment loss on goodwill was recognized for fiscal 2009year 2011 and 2010. During 2011,For indefinite lived intangible assets, we recorded a non-cashan impairment chargeloss on certain WAG trade name intangible assets totaling $3.9 million and $5.1 million in the fourth quarter of 2012 and 2011, respectively, and as further described in“Note 6- Goodwill and Intangibles”Intangible Assets” of the Notes to Consolidated Financial Statements included in Part IV, Item 15 of this report. The Company did not recognize any impairment loss for fiscal year 2010.
Income Taxes. The Company accounts for income taxes in accordance with ASC Topic740Topic 740Income Taxes(“ASC 740”).Under. Under ASC 740, deferred tax assets and liabilities are recognized for the future tax consequences attributable to temporary differences between the financial statement carrying amount of existing assets and liabilities and their respective tax bases. Deferred tax assets
and liabilities are measured using enacted tax rates expected to apply to taxable income in the years in which those temporary differences are expected to be recovered or settled. When appropriate, a valuation reserve is established to reduce deferred tax assets, which include tax credits and loss carry forwards, to the amount that is more likely than not to be realized. The ability to realize deferred tax assets depends on the ability to generate sufficient taxable income within the carryback or carryforward periods provided for in the tax law for each applicable tax jurisdiction.Wejurisdiction. We consider the following possible sources of taxable income when assessing the realization of our deferred tax assets:
Future reversals of existing taxable temporary differences;
Future taxable income exclusive of reversing temporary differences and carryforwards;
Taxable income in prior carryback years; and
Tax-planning strategies.
The assessment regarding whether a valuation allowance is required or should be adjusted also considers, among other matters, the nature, frequency and severity of recent losses of the combined USAP and WAG operations, forecasts of future profitability, the duration of statutory carryforward periods, our experience with tax attributes expiring unused and tax planning alternatives. In making such judgments, significant weight is given to evidence that can be objectively verified.
Concluding that a valuation allowance is not required is difficult when there is significant negative evidence that is objective and verifiable, such as cumulative losses in recent years. Although we expect that the operations of the recently acquired WAG business and our ability to achieve future profitability of these operations was enhanced by the cost reductions that occurred as a result of the acquisition and subsequent integration efforts, WAG’s historic operating results remain relevant as they are reflective of the industry and the effect of economic conditions. The fundamental businesses and inherent risks in which the WAG business operates did not change from those which existed prior to the acquisition. We utilized a three-year analysis of actual results as the primary measure of cumulative losses in recent years. However, because a substantial portion of those cumulative losses relate to impairment of intangible assets and goodwill, those three-year cumulative results are adjusted for the effect of these items. In addition, the near- and medium-term financial outlook is considered when assessing the need for a valuation allowance.
The valuation of deferred tax assets requires judgment and assessment of the future tax consequences of events that have been recorded in the financial statements or in the tax returns, and our future profitability represents our best estimate of those future events. Changes in our current estimates, due to unanticipated events or otherwise, could have a material effect on our financial condition and results of operations. Prior to the acquisition of WAG, the Company concluded that it was more likely than not that we would realize the deferred tax assets in all jurisdictions. However, withWith the acquisition of WAG in 2010, based largely on the weight of the combined cumulative three-year adjusted loss position, it was determined that it was not more likely than not that the Company would realize its net deferred tax assets as of January 1, 2011. Therefore, a valuation allowance of $18.3 million was recorded as of January 1, 2011, of which $4.7 million was recorded in relation to WAG in connection with our acquisition in August 2010. Based on the same determination, an additional valuation allowance of $5.7 million was recorded as of December 31, 2011, resulting in a valuation allowance balance of $22.8 million as of December 31, 2011. As of December 29, 2012, the valuation allowance was $36.9 million, after recording an additional valuation allowance of $14.1 million in fiscal year 2012.
If, in the future, we generate taxable income on a sustained basis in jurisdictions where we have recorded full valuation allowances, our conclusion regarding the need for full valuation allowances in these tax jurisdictions could change, resulting in the reversal of some or all of the valuation allowances. If our operations generate taxable income prior to reaching profitability on a sustained basis, we would reverse a portion of the valuation allowance related to the corresponding realized tax benefit for that period, without changing our conclusions on the need for a full valuation allowance against the remaining net deferred tax assets.
AtAs of December 31, 2011,29, 2012, federal and state net operating loss (“NOL”) carryforwards were $28.3$39.2 million and $42.2$53.9 million, respectively. Federal NOL carryforwards of $2.7 million were acquired in the acquisition of WAG which are subject to Internal Revenue Code section 382 and limited to an annual usage limitation of $135,000. Additionally, the tax benefit of $0.9$0.7 million of the federal and state NOL carryforwards which was created by the exercise of stock options will be credited to additional paid-in-capital once recognized. Federal NOL carryforwards expire in 2029, and 2030, while state NOL carryforwards begin to expire in 2016. The state NOL carryforwards expire in the respective tax years as follows (in thousands):
2016 - 2022 | $ | 36,025 | $ | 38,853 | ||||
2023 - 2031 | 6,200 | 15,083 | ||||||
|
| |||||||
| $ | 42,225 | $ | 53,936 | |||||
|
| |||||||
The Company utilizesWe utilize a two-step approach to recognizing and measuring uncertain tax positions. The first step is to evaluate the tax position for recognition by determining if the weight of available evidence indicates it is more likely than not that the position will be sustained on audit, including resolution of related appeals or litigation processes. The second step is to measure the tax benefit as the largest amount which is more than 50% likely of being realized upon ultimate settlement. We consider many factors when evaluating and estimating our tax positions and tax benefits, which may require periodic adjustments and which may not accurately forecast actual outcomes. As of December 31, 2011, the Company29, 2012, we had no material unrecognized tax benefits, interest or penalties related to federal and state income tax matters. The Company’s policy is to record interest and penalties as income tax expense.
The Company isWe are subject to U.S. federal income tax as well as income tax of foreign and state tax jurisdictions. During fiscal 2010, the Company was audited by the Internal Revenue Service for the year ended December 31, 2008. The audit was concluded with no change. The tax years 2007-20102008-2011 remain open to examination by the major taxing jurisdictions to which the Company is subject, except the Internal Revenue Service for which the tax years 2009-20102009-2011 remain open. The Company does not anticipate a significant change to the amount of unrecognized tax benefits within the next twelve months.
Share-Based Compensation. The Company accountsWe account for share-based compensation in accordance with ASC Topic 718-Compensation – Stock Compensation(“ASC 718”). ASC 718 requires that all share-based compensation to employees, including grants of employee stock options, be recognized in our financial statements based on their respective grant date fair values. Under this standard, the fair value of each share-based payment award is estimated on the date of grant using an option pricing model that meets certain requirements. We currently use the Black-Scholes option pricing model to estimate the fair value of our share-based payment awards, with the exception of options granted containing market conditions, for which we estimate the fair value using a Monte Carlo model.awards. The Black-Scholes and Monte Carlo valuation models require extensive use of accounting judgment and financial estimates, including estimates of the expected term participants will retain their vested stock options before exercising them, the estimated volatility of our common stock price over the expected term and the number of options that will be forfeited prior to the completion of their vesting requirements. Application of alternative assumptions could produce significantly different estimates of the fair value of share-based compensation and, consequently, the related amount of share-based compensation expense recognized in the Consolidated StatementStatements of Comprehensive Operations could have been significantly different than the amounts recorded. We estimate
Prior to January 1, 2012, the Company estimated volatility using the historical volatilities of similar public entities. The expected life of the awards is based on a simplified method that defines the life as the average of the contractual term of the options and the weighted average vesting period for all open tranches. Prior to our initial public offering in February 2007, we did not have a history of market prices of our common stock. Due to the limited period of time our equity shares havehad been publicly traded, we dodid not have sufficient historical market price data to provide a reasonable basis upon which to estimate volatility. As of January 1, 2012, the Company has incorporated its own historical volatility into the grant-date fair value calculations. The Company’s historical volatility was not materially different than the estimates applied to past award fair value calculations. The expected term of an award is based on combining historical exercise data with expected weighted time outstanding. Expected weighted time outstanding is calculated by assuming the settlement of outstanding awards is at the midpoint between the remaining weighted average vesting date and the expiration date. Prior to January 1, 2012, the expected life of an award was estimated using the “simplified” method as provided in ASC 718. Under this method, the expected life equals the arithmetic average of the vesting term and the original contractual term of the award. The Company used the simplified method as it did not have sufficient historical exercise data to provide a reasonable basis upon which to estimate an expected term. The risk-free interest rate assumption is based on observed interest rates appropriate for the expected life of our awards. The dividend yield assumption is based on our history andthe Company’s expectation of paying no dividends.
Forfeitures are estimated at the time of grant and revised, if necessary, in subsequent periods if actual forfeitures significantly differ from those estimates. We considerThe Company considers many factors when estimating expected forfeitures, including employee class, economic environment, and historical experience. Share-based compensation expense recognized
The Company accounts for equity instruments issued in our financial statements is based on awards thatexchange for the receipt of services from non-employee directors in accordance with the provisions of ASC 718. The Company accounts for equity instruments issued in exchange for the receipt of goods or services from other than employees in accordance with ASC 505-50Equity-Based Payments to Non-Employees. Costs are ultimately expected to vest. If factors change and we employ different assumptions, share-based compensation expense may differ significantly from what we have recorded inmeasured at the past. If there are any modifications or cancellations of the underlying unvested options, we may be required to accelerate, increase or cancel any remaining unrecognized share-based compensation expense.
We have granted to our employees options to purchase common stock at exercise prices equal to theestimated fair market value of the underlying common stock atconsideration received or the time of each grant, which is the closing market price of our common stock.
Under provisions of ASC 718, we recognized $3.3 million, $2.7 million and $2.6 million of share-based compensation expense for fiscal 2009, fiscal 2010 and fiscal 2011, respectively. At December 31, 2011, the total compensation cost related to unvested stock-based awards granted to employees and non-employee directors under our equity incentive plans but not yet recognized was approximately $3.5 million, net of estimated forfeitures of approximately $1.8 million. This cost will be amortized over a weighted-average period of approximately 2.4 years and will be adjusted for any subsequent changes in estimated forfeitures.
Recent Accounting Pronouncements
See “Note 1 – Summary of Significant Accounting Policies and Nature of Operations”fair value of the Notesequity instruments issued, whichever is more reliably measurable. The value of equity instruments issued for consideration other than employee services is determined on the earlier of a performance commitment or completion of performance by the provider of goods or services. Equity instruments awarded to Consolidated Financial Statements, included in Part IV, Item 15non-employees are periodically re-measured as the underlying awards vest unless the instruments are fully vested, immediately exercisable and non-forfeitable on the date of this report.
Results of Operations
The following table sets forth selected statement of operations data for the periods indicated, expressed as a percentage of net sales:
| 52 Weeks Ended January 2, 2010 | 52 Weeks Ended January 1, 2011 | 52 Weeks Ended December 31, 2011 | ||||||||||
Net sales | 100.0 | % | 100.0 | % | 100.0 | % | ||||||
Cost of sales | 63.8 | 65.8 | 67.3 | |||||||||
|
|
|
|
|
| |||||||
Gross profit | 36.2 | 34.2 | 32.7 | |||||||||
Operating expenses: Marketing General and administrative Fulfillment Technology Amortization of intangibles Impairment loss on intangibles Total operating expenses Income (loss) from operations Other income (expense): Other income, net Interest income (expense) Total other income (expense) Income (loss) before income taxes Income tax provision (benefit) Net income (loss) 52 Weeks Ended
January 2, 2010 52 Weeks Ended
January 1, 2011 52 Weeks Ended
December 31, 2011 13.3 14.8 17.1 11.1 10.9 9.8 6.5 5.7 5.8 2.5 2.3 2.2 0.4 1.1 1.1 — — 1.6 33.8 34.7 37.6 2.4 (0.5 ) (4.9 ) — — 0.1 0.1 (0.1 ) (0.3 ) 0.1 (0.1 ) (0.2 ) 2.5 (0.7 ) (5.1 ) 1.8 4.7 (0.5 ) 0.7 % (5.3 )% (4.6 )%
The impact of foreign currency is related to our offshore operations in the Philippines and sales of our products in Canada and was not material to our operations.
Fifty-Two Weeks Ended January 1, 2011 Compared to the Fifty-Two Weeks Ended December 31, 2011
Net Sales and Gross Margingrant.
| 52 Weeks Ended January 1, | 52 Weeks Ended December 31, | $ Change | % Change | |||||||||||||
| 2011 | 2011 | |||||||||||||||
| (in thousands) | ||||||||||||||||
Net sales | $ | 262,277 | $ | 327,072 | $ | 64,795 | 24.7 | % | ||||||||
Cost of sales | 172,668 | 220,072 | 47,404 | 27.5 | % | |||||||||||
|
|
|
|
|
| |||||||||||
Gross profit | $ | 89,609 | $ | 107,000 | $ | 17,391 | 19.4 | % | ||||||||
Gross margin | 34.2 | % | 32.7 | % | (1.5 | )% | ||||||||||
Consolidated net sales increased $64.8 million, or 24.7%, for fiscal 2011 compared to fiscal 2010. Excluding $83.4 million of sales from WAG, the USAP net sales for fiscal 2011 were $243.7 million, an increase of 9.2% over fiscal 2010 net sales, due to increases of $19.5 million, or 9.4%, in online sales and $1.0 million, or 6.2%, in offline sales, which consist of our Kool-Vue™ and wholesale operations. Our online sales consist of our e-commerce, online marketplace sales channels and online advertising. Our e-commerce channel includes our e-commerce websites supported by our call-center sales agents who generate cross-sell and up-sell opportunities. Our online marketplaces consist primarily of auction and other third-party websites. Online advertising is sold on our e-commerce websites.
The USAP increase in online sales is primarily due to a $15.6 million, or 9.0%, increase in e-commerce sales, which resulted from an increase of 211,007, or 11.8%, in total placed orders, an increase of 10.2 million, or 8.9%, in unique visitors, partially offset by a decrease of $2.49, or 2.1%, in average order value from fiscal 2010 to fiscal 2011. The increases in total placed orders and the unique visitors resulted from increased marketing spend driving higher paid traffic and better content on our websites driving more organic traffic. The increases were also attributed to more effective pricing, better catalog data and a better customer experience. Our average order value declined due to increased pricing competition and increased sales of lower cost direct sourced products.
Consolidated gross profit increased 19.4% from fiscal 2010 to fiscal 2011. Consolidated gross margin declined 1.5% to 32.7% compared to fiscal 2010. Excluding the gross profit from WAG, USAP gross profit was $80.4 million, an increase of 6.1%, and USAP gross margin was 33.0% for fiscal 2011 compared to 34.0% for fiscal 2010. USAP gross margin was unfavorably impacted by a shift from body to engine parts and increased freight expenses.
Marketing Expense
| 52 Weeks Ended January 1, | 52 Weeks Ended December 31, | $ Change | % Change | |||||||||||||
| 2011 | 2011 | |||||||||||||||
| (in thousands) | ||||||||||||||||
Marketing expense | $ | 38,757 | $ | 55,785 | $ | 17,028 | 43.9 | % | ||||||||
Percent of net sales | 14.8 | % | 17.1 | % | 2.3 | % | ||||||||||
Marketing expense increased $17.0 million, or 43.9%, for fiscal 2011 compared to fiscal 2010. Excluding $20.7 million of marketing expense from WAG, the USAP marketing expense increased $4.9 million, or 16.4%, from fiscal 2010, primarily due to higher amortization costs related to software deployments and an increase in advertising spend which resulted in higher listing and placement fees paid to commercial and search engine websites such as eBay, Google and MSN.
General and Administrative Expense
| 52 Weeks Ended January 1, | 52 Weeks Ended December 31, | |||||||||||||||
| 2011 | 2011 | $ Change | % Change | |||||||||||||
| (in thousands) | ||||||||||||||||
General and administrative expense | $ | 28,628 | $ | 31,961 | $ | 3,333 | 11.6 | % | ||||||||
Percent of net sales | 10.9 | % | 9.8 | % | (1.1 | )% | ||||||||||
General and administrative expense increased $3.3 million or 11.6% for fiscal 2011 compared to fiscal 2010. Excluding $12.9 million from WAG, the USAP general and administrative expense decreased $3.6 million primarily due to lower legal expense and depreciation and amortization.
Fulfillment Expense
| 52 Weeks Ended January 1, | 52 Weeks Ended December 31, | $ Change | % Change | |||||||||||||
| 2011 | 2011 | |||||||||||||||
| (in thousands) | ||||||||||||||||
Fulfillment expense | $ | 14,946 | $ | 19,164 | $ | 4,218 | 28.2 | % | ||||||||
Percent of net sales | 5.7 | % | 5.9 | % | 0.2 | % | ||||||||||
Fulfillment expense increased $4.2 million, or 28.2%, for fiscal 2011 compared to fiscal 2010. Excluding $3.9 million of fulfillment expense from WAG, the USAP fulfillment expense increased $2.0 million due to an increase in warehouse labor expense in connection with the WAG integration and higher depreciation and amortization from software deployments.
Technology Expense
| 52 Weeks Ended January 1, | 52 Weeks Ended December 31, | $ Change | % Change | |||||||||||||
| 2011 | 2011 | |||||||||||||||
| (in thousands) | ||||||||||||||||
Technology expense | $ | 5,902 | $ | 7.274 | $ | 1,372 | 23.2 | % | ||||||||
Percent of net sales | 2.3 | % | 2.2 | % | (0.1 | )% | ||||||||||
Technology expense increased $1.4 million, or 23.2%, for fiscal 2011 compared to fiscal 2010. Excluding $2.3 million of technology expense from WAG, the USAP technology expense increased $0.4 million, however, as a percentage of net sales, fiscal 2011 remained consistent with fiscal 2010.
Amortization of Intangibles
| 52 Weeks Ended January 1, | 52 Weeks Ended December 31, | $ Change | % Change | |||||||||||||
| 2011 | 2011 | |||||||||||||||
| (in thousands) | ||||||||||||||||
Amortization of intangibles | $ | 2,804 | $ | 3,673 | $ | 869 | 31.0 | % | ||||||||
Percent of net sales | 1.1 | % | 1.1 | % | — | % | ||||||||||
Amortization of intangibles increased by $0.9 million, or 31.0%, in fiscal 2011, primarily due to a full year of amortization expense in the amount of $3.2 million related to the intangible assets acquired in connection with our acquisition of WAG in August 2010.
Impairment loss on Intangibles
Impairment loss on intangibles consists of a fiscal 2011 non-cash impairment charge related to certain WAG trade name intangible assets in the amount of $5.1 million. See further detail in“Note 6- Goodwill and Intangibles” of the Notes to Consolidated Financial Statements included in Part IV, Item 15 of this report.
Other Expense, Net
| 52 Weeks Ended January 1, | 52 Weeks Ended December 31, | $ Change | % Change | |||||||||||||
| 2011 | 2011 | |||||||||||||||
| (in thousands) | ||||||||||||||||
Other expense, net | $ | (280 | ) | $ | (654 | ) | $ | (374 | ) | (133.6 | )% | |||||
Percent of net sales | (0.1 | )% | (0.2 | )% | (0.1 | )% | ||||||||||
Other expense, net increased $0.4 million, or 133.6%, for fiscal 2011 compared to fiscal 2010, primarily due to the interest of $1.1 million paid in connection with the Company’s credit facility executed in August 2010.
Income Tax Provision (Benefit)
| 52 Weeks Ended January 1, | 52 Weeks Ended December 31, | $ Change | % Change | |||||||||||||
| 2011 | 2011 | |||||||||||||||
| (in thousands) | ||||||||||||||||
Income tax provision (benefit) | $ | 12,218 | $ | (1,512 | ) | $ | (13,730 | ) | (112.4 | )% | ||||||
Percent of net sales | 4.7 | % | (0.5 | )% | (5.2 | )% | ||||||||||
For fiscal 2010 and 2011, the effective tax rate for the Company was (715.3)% and 9.1%, respectively. The Company’s effective tax rate is significantly higher in fiscal 2010 than the U.S. federal statutory rate primarily due to the recognition of a valuation allowance of $13.6 million. Prior to the acquisition of WAG, the Company concluded that it was more likely than not that we would realize the deferred tax assets in all jurisdictions. However, with the acquisition of WAG, based largely on the weight of the combined cumulative three-year adjusted loss position, it was determined that it was not more likely than not that the Company would realize its net deferred tax assets. Therefore, a valuation allowance balance of $18.3 million was recorded as of January 1, 2011, of which $4.7 million was recorded against the acquired deferred tax assets of WAG as of August 12, 2010. Based on the same determination, an additional valuation allowance of $5.7 million was recorded in fiscal 2011, resulting in a valuation allowance balance of $22.8 million at December 31, 2011. The Company’s effective tax rate for fiscal 2011 differs from the U.S. federal statutory rate primarily as a result of the recording of the $5.7 million valuation allowance against the Company’s deferred tax assets. Additionally, the Company’s fiscal 2011 tax benefit was substantially the result of the $5.1 million impairment loss, as further discussed above in “Impairment loss on Intangibles”.
Income tax provision (benefit) differs from the amount that would result from applying the federal statutory rate as follows:
| 52 Weeks Ended January 2, 2010 | 52 Weeks Ended January 1, 2011 | 52 Weeks Ended December 31, 2011 | ||||||||||
| (in thousands) | ||||||||||||
Income tax at U.S. federal statutory rate | $ | 1,511 | $ | (581 | ) | $ | (5,661 | ) | ||||
Share-based compensation | 1,086 | (93 | ) | 21 | ||||||||
State income tax, net of federal tax effect | 729 | (759 | ) | (1,629 | ) | |||||||
Tax exempt interest Foreign tax Non deductible acquisition costs Other Change in valuation allowance Effective tax provision (benefit) 52 Weeks
Ended
January 2,
2010 52 Weeks
Ended
January 1,
2011 52 Weeks
Ended
December 31,
2011 (in thousands) (16 ) (8 ) (3 ) (163 ) (210 ) (108 ) — 258 — (24 ) 1 140 — 13,610 5,728 $ 3,123 $ 12,218 $ (1,512 )
The Company’s effective tax rate was impacted by income taxes incurred in foreign and state jurisdictions. With respect to the income of its foreign subsidiaries, the Company takes the position that the earnings of the foreign subsidiaries are permanently invested in that jurisdiction. Additionally, the foreign subsidiaries are currently in a cumulative deficit earning and profits position for tax purposes. As a result, no additional income taxes have been provided on the possible repatriation of these earnings to the parent company. The favorable impact of foreign taxes is due in large part to a tax holiday in the Philippines, which was effective through September 2011. The Company is in the process of applying for a one year extension. Although management expects the extension to be approved based on its discussion with the foreign taxing authority, the full Philippines tax rate has been applied to the earnings after the expiration of the initial tax holiday. The impact of this tax holiday decreased foreign taxes by $136,000, $182,000 and $144,000 for fiscal 2009, fiscal 2010 and fiscal 2011, respectively. The benefit of the tax holiday on net income (loss) per share (diluted) was immaterial for the related years.
As of December 31, 2011, the Company had no material unrecognized tax benefits, interest or penalties related to federal and state income tax matters.
Fifty-Two Weeks Ended January 2, 2010 Compared to the Fifty-Two Weeks Ended January 1, 2011
Net Sales and Gross Margin
| 52 Weeks Ended January 2, | 52 Weeks Ended January 1, | $ Change | % Change | |||||||||||||
| 2010 | 2011 | |||||||||||||||
| (in thousands) | ||||||||||||||||
Net sales | $ | 176,288 | $ | 262,277 | $ | 85,989 | 48.8 | % | ||||||||
Cost of sales | 112,415 | 172,668 | 60,253 | 53.6 | % | |||||||||||
|
|
|
|
|
| |||||||||||
Gross profit | $ | 63,873 | $ | 89,609 | $ | 25,736 | 40.3 | % | ||||||||
Gross margin | 36.2 | % | 34.2 | % | (2.0 | )% | ||||||||||
Net sales increased $86.0 million, or 48.8%, for fiscal 2010 compared to fiscal 2009. Excluding $39.1 million of sales from WAG, the net sales for fiscal 2010 were $223.2 million, an increase of 26.6% over fiscal 2009 net sales due to increases of $42.5 million, or 25.9%, in online sales and $4.4 million, or 36%, in offline sales, which consist of our Kool-Vue™ and wholesale operations. Our online sales consist of our e-commerce, online marketplace sales channels and online advertising. Our e-commerce channel includes our e-commerce websites supported by our call-center sales agents who generate cross-sell and up-sell opportunities. Our online marketplaces consist primarily of auction and other third-party websites. Online advertising is sold on our e-commerce websites.
The increase in online sales resulted from an increase of 355,130, or 24.8%, in total placed orders, an increase of 8.0 million, or 7.6%, in unique visitors, partially offset by a decrease of $8.24, or 1.7%, in average order value from fiscal 2009 to fiscal 2010. The increases in total placed orders and the unique visitors resulted from increased marketing spend driving higher paid traffic and better content on our websites driving more organic traffic. The increases were also attributed to more effective pricing, better catalog data and a better customer experience. Our average order value declined due to increased pricing competition and increased sales of lower cost direct sourced products.
Gross profit increased 40.3% from fiscal 2009 to fiscal 2010. Excluding the acquisition of WAG, gross profit was $75.8 million, an increase of 18.6%. Gross margin declined 2.0% to 34.2% of net sales compared with fiscal 2009. Excluding the acquisition of WAG, gross margin was 34.0% for fiscal 2010. Gross margin was unfavorably impacted by increased freight expense and a discontinuation of high margin loyalty programs in fiscal 2010.
Marketing Expense
| 52 Weeks Ended January 2, | 52 Weeks Ended January 1, | $ Change | % Change | |||||||||||||
| 2010 | 2011 | |||||||||||||||
| (in thousands) | ||||||||||||||||
Marketing expense | $ | 23,419 | $ | 38,757 | $ | 15,338 | 65.8 | % | ||||||||
Percent of net sales | 13.3 | % | 14.8 | % | 1.5 | % | ||||||||||
Marketing expense increased $15.3 million, or 65.8%, for fiscal 2010 compared to fiscal 2009. Excluding $8.6 million of marketing expense from WAG, the marketing expense increased $6.7 million or 2.9% from fiscal 2009, primarily due to higher amortization costs related to software deployments and an increase in marketing spend which resulted in higher listing and placement fees paid to commercial and search engine websites such as eBay, Google and MSN.
General and Administrative Expense
| 52 Weeks Ended January 2, | 52 Weeks Ended January 1, | |||||||||||||||
| 2010 | 2011 | $ Change | % Change | |||||||||||||
| (in thousands) | ||||||||||||||||
General and administrative expense | $ | 19,640 | $ | 28,628 | $ | 8,988 | 45.8 | % | ||||||||
Percent of net sales | 11.1 | % | 10.9 | % | (0.2 | )% | ||||||||||
General and administrative expense increased $9.0 million or 45.8% for fiscal 2010 compared to fiscal 2009. Excluding $5.9 million from WAG, the general and administrative expense increased primarily due to the acquisition and integration costs of $1.4 million related to our acquisition of WAG.
Fulfillment Expense
| 52 Weeks Ended January 2, | 52 Weeks Ended January 1, | $ Change | % Change | |||||||||||||
| 2010 | 2011 | |||||||||||||||
| (in thousands) | ||||||||||||||||
Fulfillment expense | $ | 11,437 | $ | 14,946 | $ | 3,509 | 31.1 | % | ||||||||
Percent of net sales | 6.5 | % | 5.7 | % | (0.8 | )% | ||||||||||
Fulfillment expense increased $3.5 million, or 31.1%, for fiscal 2010 compared to fiscal 2009. Excluding $1.7 million of fulfillment expense from WAG, the fulfillment expense increased $1.8 million due to an increase in external labor, partially offset by the fixed cost leverage from higher sales during fiscal 2010. The increase in external labor is due to higher need of workforce at our distribution centers in fiscal 2010 in line with the increase in our inventory.
Technology Expense
| 52 Weeks Ended January 2, | 52 Weeks Ended January 1, | $ Change | % Change | |||||||||||||
| 2010 | 2011 | |||||||||||||||
| (in thousands) | ||||||||||||||||
Technology expense | $ | 4,467 | $ | 5,902 | $ | 1,435 | 32.3 | % | ||||||||
Percent of net sales | 2.5 | % | 2.3 | % | (0.2 | )% | ||||||||||
Technology expense increased $1.4 million, or 32.3% for fiscal 2010 compared to fiscal 2009. Excluding $1.3 million of technology expense from WAG, the technology expense for fiscal 2010 remained consistent from fiscal 2009.
Amortization of Intangibles
| 52 Weeks Ended January 2, | 52 Weeks Ended January 1, | $ Change | % Change | |||||||||||||
| 2010 | 2011 | |||||||||||||||
| (in thousands) | ||||||||||||||||
Amortization of intangibles | $ | 661 | $ | 2,804 | $ | 2,143 | 324.2 | % | ||||||||
Percent of net sales | 0.4 | % | 1.1 | % | 0.7 | % | ||||||||||
Amortization of intangibles and impairment loss increased by $2.1 million, or 324.2%, in fiscal 2010, primarily due to the amortization expense of $2.3 million related to the intangible assets acquired in connection with our acquisition of WAG in August 2010.
Other Income (Expense)
| 52 Weeks Ended January 2, | 52 Weeks Ended January 1, | $ Change | % Change | |||||||||||||
| 2010 | 2011 | |||||||||||||||
| (in thousands) | ||||||||||||||||
Other income (expense) | $ | 191 | $ | (280 | ) | $ | (471 | ) | (246.6 | )% | ||||||
Percent of net sales | 0.1 | % | (0.1 | )% | (0.2 | )% | ||||||||||
Other income, net decreased $0.5 million, or 246.6% for fiscal 2010 compared to fiscal 2009, primarily due to the interest of $0.4 million paid in connection with the Company’s credit facility executed in August 2010.
Income Tax Provision
| 52 Weeks Ended January 2, | 52 Weeks Ended January 1, | $ Change | % Change | |||||||||||||
| 2010 | 2011 | |||||||||||||||
| (in thousands) | ||||||||||||||||
Income tax provision | $ | 3,123 | $ | 12,218 | $ | 9,095 | 291.2 | % | ||||||||
Percent of net sales | 1.8 | % | 4.7 | % | 2.9 | % | ||||||||||
For fiscal 2010 and 2009, the effective tax rate for the Company was (715.3)% and 70.33%, respectively. The Company’s effective tax rate is significantly higher in fiscal 2010 than the U.S. federal statutory rate primarily due to the recognition of a valuation allowance of $13.6 million. Prior to the acquisition of WAG, the Company concluded that it was more likely than not that we would realize the deferred tax assets in all jurisdictions. However, with the acquisition of WAG, based largely on the weight of the combined cumulative three-year adjusted loss position, it was determined that it was not more likely than not that the Company would realize its net deferred tax assets. Therefore, a valuation allowance of $18.3 million was recorded as of January 1, 2011, of which $4.7 million was recorded against the acquired deferred tax assets of WAG as of August 12, 2010.
Income tax (benefit) expense differs from the amount that would result from applying the federal statutory rate as follows:
| Year Ended December 31, 2008 | 52 Weeks Ended January 2, 2010 | 52 Weeks Ended January 1, 2011 | ||||||||||
| (in thousands) | ||||||||||||
Income tax at U.S. federal statutory rate | $ | (9,768 | ) | $ | 1,511 | $ | (581 | ) | ||||
Share-based compensation | 161 | 1,086 | (93 | ) | ||||||||
State income tax, net of federal tax effect | (1,880 | ) | 729 | (759 | ) | |||||||
Tax exempt interest | (220 | ) | (16 | ) | (8 | ) | ||||||
Foreign tax | 60 | (163 | ) | (210 | ) | |||||||
Non deductible acquisition costs | — | — | 258 | |||||||||
Other | (175 | ) | (24 | ) | 1 | |||||||
Change in valuation allowance | — | — | 13,610 | |||||||||
|
|
|
|
|
| |||||||
Effective tax (benefit) provision | $ | (11,822 | ) | $ | 3,123 | $ | 12,218 | |||||
|
|
|
|
|
| |||||||
The Company’s effective tax rate was impacted by income taxes incurred in foreign and state jurisdictions. With respect to the income of its foreign subsidiaries, the Company takes the position that the earnings of the foreign subsidiaries are permanently invested in that jurisdiction. As a result, no additional income taxes have been provided on the possible repatriation of these earnings to the parent company. The Company has not calculated the amount of deferred tax liability that would result from such repatriation as such determination is not practicable.
The favorable impact of foreign taxes is due in large part to a tax holiday in the Philippines, which is effective through September 2011. The term of the tax holiday is four years, provided as an incentive for new business and no further requirements exist to maintain the tax holiday. The impact of this tax holiday decreased foreign taxes by $0, $136,000 and $182,000 for calendar year 2008, fiscal 2009 and fiscal 2010, respectively. The benefit of the tax holiday on net income per share (diluted) was immaterial for the related years.
As of January 1, 2011, the Company had no material unrecognized tax benefits, interest or penalties related to federal and state income tax matters.
Liquidity and Capital Resources
Sources of Liquidity
In fiscal 2011, we funded our operations with cash and cash equivalents generated from operations in prior years, credit facilities and capital lease financings. We had cash and cash equivalents of $10.3 million as of December 31, 2011, representing a $7.3 million decrease from $17.6 million of cash and cash equivalents as of January 1, 2011. The decrease in cash and cash equivalents was primarily due to capital expenditures and pay down of long-term debt, partially offset by positive cash flows from working capital and net proceeds from redemption of our ARPS. We had no balance outstanding under our bank line of credit at any time during the fifty-two weeks ended December 31, 2011.
On May 2, 2011, we filed a shelf registration statement covering the offer and sale of up to $200 million of common stock with the SEC. The shelf registration was declared effective by the SEC on August 10, 2011. We have no immediate plans or current commitments to sell this common stock. The terms of any offering under our shelf registration statement will be determined at the time of the offering and disclosed in a prospectus supplement filed with the SEC.
Cash Flows
The following table summarizes the key cash flow metrics from our consolidated statements of cash flow for fiscal 2009, fiscal 2010 and fiscal 2011, respectively, ended:
| January 2, | January 1, | December 31, | ||||||||||
| 2010 | 2011 | 2011 | ||||||||||
| (in thousands) | ||||||||||||
Net cash provided by (used in) operating activities | $ | 11,587 | $ | (1,709 | ) | $ | 10,378 | |||||
Net cash used in investing activities | (18,079 | ) | (31,048 | ) | (11,524 | ) | ||||||
Net cash provided by (used in) financing activities | 115 | 23,883 | (6,100 | ) | ||||||||
Effect of exchange rate changes on cash | 155 | 218 | (14 | ) | ||||||||
|
|
|
|
|
| |||||||
Net decrease in cash and cash equivalents | $ | (6,222 | ) | $ | (8,656 | ) | $ | (7,260 | ) | |||
|
|
|
|
|
| |||||||
Operating Activities
Net cash provided by operating activities increased by approximately $12.1 million for fiscal 2011, as compared to fiscal 2010. The increase over prior year was primarily due to a significant decrease in the purchase of inventory and an improvement in timing of payments on accounts payable. This was partially offset by an increase in accounts receivable and a reduction in net earnings in fiscal 2011 compared to 2010, after adjusting for non-cash items such as depreciation, amortization, impairment loss on intangibles, share-based compensation and deferred income taxes.
Net cash provided by operating activities decreased by approximately $13.3 million for fiscal 2010, as compared to fiscal 2009. The decrease was primarily due to an increase in purchase of inventory, which was offset by an improvement in timing of payments on accounts payable and net earnings in fiscal 2010 after adjusting for non-cash items such as depreciation and amortization and deferred income taxes.
Investing Activities
Net cash used in investing activities decreased by approximately $19.5 million for fiscal 2011, as compared to fiscal 2010. The decrease was primarily due to the cash paid for the WAG acquisition in fiscal 2010, which was partially offset by net proceeds from the sale of marketable securities.
Net cash used in investing activities increased by approximately $13.0 million for fiscal 2010, as compared to fiscal 2009. The increase was primarily due to our acquisition of WAG and purchase of property and equipment, which was partially offset by proceeds from the sale of marketable securities.
Financing Activities
Net cash flow from financing activities decreased by approximately $30.0 million in fiscal 2011, as compared to fiscal 2010. The decrease was primarily due to borrowings of $25 million under our credit facility in fiscal 2010 and the related payments made in fiscal 2011.
Net cash provided by financing activities increased by approximately $23.8 million for fiscal 2010, as compared to fiscal 2009. The increase was primarily due to borrowings of $25 million under our credit facility in fiscal 2010.
Funding Requirements
As of December 31, 2011, our working capital was $8.7 million. The historical seasonality in our business during the year can cause cash and cash equivalents, inventory and accounts payable to fluctuate, resulting in changes in our working capital.
In August 2010, the Company and Silicon Valley Bank (“Bank”) entered into a Loan and Security Agreement (the “Loan Agreement”) and other definitive documentation for a $35 million secured credit facility (the “Facility”). The Facility is comprised of a term loan in the original principal amount of $25 million and a revolving line of credit with availability up to $10 million. The Facility has a final maturity date of June 30, 2014, and borrowings under the Facility bear interest, at the election of the Company, at LIBOR (with a floor of 1.25%) plus a margin of from 2.00% to 3.00% per annum, or at the Wall Street Journal Prime Rate plus a margin of from 1.00% to 2.00% per annum, based upon the Company’s maximum funded debt ratio. An unused revolving line fee of 0.375% per annum is payable on the undrawn committed amount of the revolving line of credit. Interest on outstanding borrowings under the term loan and the revolving line of credit is payable no less than quarterly, and the outstanding principal of the term loan amortized over four years and payable quarterly, with any outstanding amount under the Facility to be paid in full on the final maturity date. Borrowings under the Facility are secured by liens over all assets of the Company, including shares of stock in each of the Company’s subsidiaries. Ten of the Company’s subsidiaries are acting as co-borrowers under the Facility. At December 31, 2011, the LIBOR rate and the margin were 1.25% (floor rate) and 2.5% per annum, respectively. The Company had no borrowings on the revolving line of credit during fiscal 2011. The remaining term loan balance was $17.9 million as of December 31, 2011 and is to be repaid according to the following schedule (in thousands):
| Payments Due by Period | ||||||||||||||
| Total | 2012 | 2013 | 2014 | |||||||||||
| $ | 17,875 | $ | 6,250 | $ | 6,875 | $ | 4,750 | |||||||
The Loan Agreement requires the Company to comply with a number of restrictive covenants, including financial covenants related to maximum funded debt to consolidated EBITDA, liquidity, and consolidated fixed charge coverage ratios; negative pledge requirements; requirements to deliver quarterly and annual consolidated financial statements; requirements to maintain adequate insurances; prohibitions on changes in the business and disposition of the Company’s assets; and other customary covenants. The Loan Agreement also requires the Company to obtain a prior written consent from the Bank when the Company determines to pay any dividends on or make any distribution related to its common stock. The Loan Agreement includes usual and customary events of defaults and remedies for facilities of this nature. In February and October 2011, the Company and the Bank entered into Amendment No. 1 and Amendment No. 2, respectively, to Loan and Security Agreement and Limited Waiver (collectively, the “Amendments”). The Amendments waived the Company’s lack of compliance with the consolidated fixed charge ratio covenant in the Loan Agreement as of January 1, 2011 and October 1, 2011 to more readily accommodate the Company’s integration of the WAG acquisition. In December 2011, the Company and the Bank entered into Amendment No. 3 to Loan and Security Agreement, to amend the Loan Agreement, as amended (the “Third Amendment”). The Third Amendment amends the Company’s permitted indebtedness to allow debt to certain other banks in connection with a vendor purchasing card program in an aggregate amount not to exceed $2,500,000 at any one time outstanding. For the quarter ended December 31, 2011, the Company was in compliance with all covenants, as amended, under the Loan Agreement.
During March 2012, the Company determined it was probable that the consolidated fixed charge coverage ratio would not be in compliance with the required 1.50:1.00 minimum level for the quarter ending March 31, 2012. This determination was made during the Company’s monitoring of their covenants, which includes monthly calculations of “Consolidated EBITDA” projected to quarter end. As a result, on March 23, 2012, the Company and the Bank entered into Amendment No. 4 to Loan and Security Agreement (the “Fourth Amendment”). The Fourth Amendment reduced the required consolidated fixed charge coverage ratio to a minimum of 1.00:1:00 for the one quarter ending March 31, 2012 and to 1.25:1.00 for each quarter ending thereafter. Based on the current covenant calculations, the Company’s consolidated fixed charge coverage ratio is projected to be in compliance as of March 31, 2012. All financial covenants are expected to be in compliance as of March 31, 2012 and through the remainder of fiscal 2012.
The Company expects to be in compliance with the financial covenants, as amended, in the Loan Agreement through the remaining term of the Loan Agreement, however, it is possible that a breach of the financial covenants may occur in the future, should the Company’s forecasted EBITDA levels not be achieved. If the Company breaches any of the covenants under the Loan Agreement and is unable to obtain waivers from the Bank, the Bank will be able to exercise their rights and remedies under the Loan Agreement, including a call provision on outstanding debt, which would have a material adverse effect on the Company’s business and financial condition. See“Note 7 – Borrowings”of the Notes to Consolidated Financial Statements included in Part IV, Item 15 of this report for additional information.
In September 2011, we recorded contract cancellation costs of $1.5 million in general and administrative expenses due to the termination of WAG’s sublease agreement related to its former corporate offices in Chicago, Illinois. The contract cancellation costs were paid during the fourth quarter of fiscal 2011.
We anticipate that funds generated from operations and cash on hand will be sufficient to meet our working capital needs, expected capital expenditures and the servicing of the debt for at least the next twelve months. Our future capital requirements may, however, vary materially from those now planned or anticipated. Changes in our operating plans, lower than anticipated net sales, additional acquisitions, increased expenses, continued or worsened economic conditions, or other events, including those described in “Risk Factors” included in Part I, Item 1A may cause us to seek debt or equity financings in the future. Financings may not be available on acceptable terms, on a timely basis, or at all, and our failure to raise adequate capital when needed could negatively impact our growth plans and our financial condition and results of operations. As of December 31, 2011, our $2.1 million (fair value) of ARPS investments remain classified as long-term investments as a result of failed auctions and market liquidity issues. We may not have immediate access to those funds.
We also plan to continue our technology investments in an effort to improve our websites, operating systems, and backend platforms.
Debt and Available Borrowing Resources
Long-term debt decreased by $6.4 million, while short-term debt remained relatively flat for fiscal 2011 as compared to fiscal 2010. The decrease is due to payments made on our fiscal 2010 barrowings. The Company had no new borrowings in fiscal 2011.
Our debt-equity ratio is calculated as the carrying value of debt divided by the carrying value of equity. As of December 31, 2011, our debt-equity ratio was 0.30. As of fiscal year-end 2010, our debt-equity ratio was 0.33.
As of December 31, 2011, an unused revolving line of credit with availability up to $10 million was available to the Company to obtain short-term and long-term financings if we need additional liquidity.
Off-Balance Sheet Arrangements
We have no off-balance sheet arrangements.
Contractual Obligations
The following table sets forth our contractual cash obligations and commercial commitments as of December 31, 2011:
| Payment Due By Period (in thousands) | ||||||||||||||||||||
Contractual Obligations: | Total | Less than 1 year | 1-3 years | 3-5 years | More than 5 years | |||||||||||||||
Principal payments on long-term debt(1) | $ | 17,875 | $ | 6,250 | $ | 11,625 | $ | — | $ | — | ||||||||||
Interest payments on long-term debt(2) | 1,020 | 591 | 429 | — | — | |||||||||||||||
Operating lease obligations(3) | 5,884 | 1,653 | 2,413 | 1,818 | — | |||||||||||||||
Capital lease obligations(4) | 181 | 143 | 38 | — | — | |||||||||||||||
|
|
|
|
Seasonality
We believe our business is subject to seasonal fluctuations. We have historically experienced higher sales of body parts in winter months when inclement weather and hazardous road conditions typically result in more automobile collisions. Engine parts and performance parts and accessories have historically experienced higher sales in the summer months when consumers have more time to undertake elective projects to maintain and enhance the performance of their automobiles and the warmer weather during that time is conducive for such projects. We expect the historical seasonality trends to continue to have a material impact on our financial condition and results of operations during the reporting periods in any given year.
Inflation
Inflation has not had a material impact upon our operating results, and we do not expect it to have such an impact in the near future. We cannot assure you that our business will not be affected by inflation in the future.
| ITEM 7A. | QUANTITATIVE AND QUALITATIVE DISCLOSURES ABOUT MARKET RISK |
Market Risk.Market risk represents the risk of loss that may impact our financial position, results of operations or cash flows due to adverse changes in financial commodity market prices and rates. We are exposed to market risk primarily in the area of changes in U.S. interest rates and conditions in the credit markets. We also have some exposure related to foreign currency fluctuations. We do not have derivative financial instruments. Under our current policies, we do not use interest rate derivative instruments to manage exposure to interest rate changes. We do not have any derivative financial instruments. We attempt to increase the safety and preservation of our invested principal funds by limiting default risk, market risk and reinvestment risk. We mitigate default risk by investing in investment grade securities and mutual funds that hold debt securities.
Interest Rate Risk. Our investment securities generally consist of high-grade ARPS.mutual funds. As of December 31, 2011,29, 2012, our long-term investments included $2.1 million (fair value)were comprised of $110,000 of investments in mutual funds that primarily hold debt securities. During the second quarter of 2012, the Company fully redeemed its remaining auction rate preferred securities (“ARPS”) investments. During the various ARPS which consistholding periods, the Company earned the stated rate of high-grade (A or AAA rated) collateralized debt obligations issued by municipalitiesinterest and state agencies. Our ARPS have an interest rate that is resetincurred no realized losses (refer to investment details in short intervals through auctions. The current conditions in the global credit markets have prevented some investors from liquidating their holdings of ARPS because the amount of securities submitted for sale has exceeded the amount of purchase orders for these securities. If there is insufficient demand for the securities at the time of an auction, the auction may not be completed“Note 2 – Investments” and the interest rates may be reset to predetermined higher rates. When auctions for these securities fail, the investments may not be readily convertible to cash until a future auction of these investments is successful or they are redeemed or mature. If the credit ratings“Note 3 – Fair Value Measurements” of the security issuers deteriorate and any declineNotes to Consolidated Financial Statements, included in market value is determined to be other- than- temporary, we would be required to adjust the carrying valuePart IV, Item 15 of the investment through an impairment charge.this report).
In February 2008, we were informed that there was insufficient demand at auctions for four of our high-grade ARPS, representing approximately $7.8 million (par value). As a result, these affected securities are currently not liquid and the interest rates have been reset to the predetermined higher rates. For the period June 30, 2008 through December 31, 2011, we have received partial redemptions at par value on all four ARPS holdings totaling approximately $5.7 million. The remaining principal balance on our ARPS is approximately $2.1 million (par value) as of December 31, 2011.
In the event we need to access the funds that are in an illiquid state, we will not be able to do so without the possible loss of principal until a future auction for these investments is successful or they are redeemed by the issuer. At this time, management has not obtained sufficient evidence to conclude that these investments are other-than-temporarily impaired or that they will not be settled in the short term, although the market for these investments is presently uncertain. If we are unable to sell these securities in the market or they are not redeemed, then we may be required to hold them indefinitely. We do not expect to have a need to access these funds for operational purposes for the foreseeable future. We plan to continue to monitor and evaluate these investments on an ongoing basis for impairment. Based on our ability to access our cash and other short-term investments, our expected cash flows, and our other sources of cash, we do not anticipate that the potential illiquidity of these investments will affect our ability to execute our current business plan. However, due to the illiquidity in the market, we have recorded $21,000 of unrealized losses on our ARPS investment portfolio as of December 31, 2011, resulting in a long-term investment balance at fair value of $2.1 million at December 31, 2011.
As of December 31, 2011,29, 2012, we had a balance of $17.9$16.2 million outstanding under a termrevolving loan under our credit facility with Silicon Valley Bank (“Bank”).facility. The interest rate on this loan is computed atbased on a LIBOR and Prime loan rate, adjusted by features specified in our loan agreement. At our current debt level as of December 31, 2011,29, 2012, a 100 basis point increase in interest rates would not materially affect our earnings and cash flows. If, however, we are unable to meet the covenants in our loan agreement, we would be required to renegotiate the terms of credit under the loan agreement, including the interest rate. There can be no assurance that any renegotiated terms of credit would not materially impact our earnings. In FebruaryAt December 29, 2012, our LIBOR based interest rate was 1.75% per annum (on $15.0 million principal) and October 2011, the Company and the Bank entered into Amendment No. 1 and Amendment No. 2, respectively,our Prime based rate was 2.75% per annum (on $1.2 million principal). Refer to Loan and Security Agreement and Limited Waiver (collectively, the “Amendments”). The Amendments waived the Company’s lack of compliance with the consolidated fixed charge ratio covenantadditional discussion in the Loan Agreement as of January 1, 2011 and October 1, 2011 to more readily accommodate the Company’s integration of the WAG acquisition. In December 2011, the Company and the Bank entered into Amendment No. 3 to Loan and Security Agreement, to amend the Loan Agreement, as amended (the “Third Amendment”). The Third Amendment amends the Company’s permitted indebtedness to allow debt to certain other banks in connection with a vendor purchasing card program in an aggregate amount not to exceed $2,500,000 at any one time outstanding. For the quarter ended December 31, 2011, the Company was in compliance with all covenants, as amended,Item 7, under the loan agreement.
During March 2012, the Company determined it was probable that the consolidated fixed charge coverage ratio would not becaption “Liquidity and Capital Resources – Debt and Available Borrowing Resources” and in compliance with the required 1.50:1.00 minimum level for the quarter ending March 31, 2012. This determination was made during the Company’s monitoring of their covenants, which includes monthly calculations of “Consolidated EBITDA” projected to quarter end. As a result, on March 23, 2012, the Company and the Bank entered into Amendment No. 4 to Loan and Security Agreement (the “Fourth Amendment”). The Fourth Amendment reduced the required consolidated fixed charge coverage ratio to a minimum of 1.00:1:00 for the one quarter ending March 31, 2012 and to 1.25:1.00 for each quarter ending thereafter. Based on the current covenant calculations, the Company’s consolidated fixed charge coverage ratio is projected to be in compliance as of March 31, 2012. All financial covenants are expected to be in compliance as of March 31, 2012 and through the remainder of fiscal 2012.
The Company expects to be in compliance with the financial covenants, as amended, in the loan agreement through the remaining term of the loan agreement, however, it is possible that a breach of the financial covenants may occur in the future, should the Company’s forecasted EBITDA levels not be achieved. If the Company breaches any of the covenants under the loan agreement and is unable to obtain waivers from the Bank, the Bank will be able to exercise their rights and remedies under the loan agreement, including a call provision on outstanding debt, which would have a material adverse effect on the Company’s business and financial condition. See““Note 7 – Borrowings”of the Notes to Consolidated Financial Statements, included in Part IV, Item 15 of this report for additional information.report.
Foreign Currency Risk. Our purchases of auto parts from our Asian suppliers are denominated in U.S. dollars; however, a change in the foreign currency exchange rates could impact our product costs over time. Our financial reporting currency is the U.S. dollar and changes in exchange rates significantly affect our reported results and consolidated trends. For example, if the U.S. dollar weakens year- over- yearyear-over-year relative to currencies in our international locations, our consolidated net sales, gross profit and operating expenses will be higher than if currencies had remained constant. Likewise, if the U.S. Dollardollar strengthens year- over- yearyear-over-year relative to currencies in our international locations, our consolidated net sales, gross profit and operating expenses will be lower than if currencies had remained constant. Our operating expenses in the Philippines are generally paid in Philippine Pesos, and as the exchange rate fluctuates, it adversely or favorably impacts our operating results. In light of the above, we believe that a fluctuation of 10% in the Peso/U.S. dollar exchange rate would have approximately a $1.2$1.4 million impact on our Philippine operating expenses for fiscal 2011.the fifty-two weeks ended December 29, 2012. Our Canadian website sales are denominated in Canadian dollars; however, fluctuations in exchange rates from these operations are only expected to have a nominal impact on our operating results due to the relatively small number of sales generated in Canada. We believe it is important to evaluate our operating results and growth rates before and after the effect of currency changes.
| ITEM 8. | FINANCIAL STATEMENTS AND SUPPLEMENTARY DATA |
The financial statements required by this Item 8 are set forth in Part IV, Item 15 of this report and are hereby incorporated into this Item 8 by reference.
| ITEM 9. | CHANGES IN AND DISAGREEMENTS WITH ACCOUNTANTS ON ACCOUNTING AND FINANCIAL DISCLOSURE |
None.
ITEM 9A. CONTROLS AND PROCEDURES
| ITEM 9A. | CONTROLS AND PROCEDURES |
Evaluation of Disclosure Controls and Procedures
We maintain disclosure controls and procedures designed to provide reasonable assurance that information required to be disclosed in reports filed with the SEC under the Securities Exchange Act of 1934, as amended (the “Exchange Act”), is recorded, processed, summarized and reported within the specified time periods, and that such information is accumulated and communicated to management, including our Chief Executive Officer and Chief Financial Officer, as appropriate, to allow timely decisions regarding required disclosure. Our management, with the participation of our Chief Executive Officer and Chief Financial Officer, evaluated the effectiveness of our disclosure controls and procedures as of December 31, 201129, 2012 pursuant to Rule 13a-15 and 15d-15 of the Exchange Act. Based on that evaluation, the CEO and CFO have concluded that, as of such date, our disclosure controls and procedures were effective to meet the objectives for which they were designed and operated at the reasonable assurance level.
Management’s Report on Internal Control Over Financial Reporting
Our management is responsible for establishing and maintaining adequate internal control over financial reporting (as defined in Rule 13a-15(f) under the Securities Exchange Act of 1934, as amended). We assessed the effectiveness of our internal control over financial reporting as of December 31, 2011,29, 2012, based on the “Internal Control — Integrated Framework” issued by the Committee of Sponsoring Organizations of the Treadway Commission (the “COSO framework”). This assessment was conducted utilizing our documentation of policies and procedures, risk control matrices, gap analysis, key process walk-throughs and management’s knowledge of and interaction with its controls and testing of our key controls.
Because of its inherent limitations, internal control over financial reporting may not prevent or detect misstatements. Also, projection of any evaluation of effectiveness to future periods is subject to the risk that controls may become inadequate because of changes in conditions, or that the degree of compliance with the policies or procedures may deteriorate.
A material weakness is a deficiency, or combination of deficiencies, in internal control over financial reporting, such that there is reasonable possibility that a material misstatement of our annual or interim financial statements will not be prevented or detected on a timely basis. Based on such assessment and criteria, management has concluded that the internal controls over financial reporting were effective, and were operating at the reasonable assurance level as of December 31, 2011.29, 2012. Our independent registered public accounting firm, Deloitte & Touche LLP, has included an attestation report on our internal controls over financial reporting, which is included below.
Changes in Internal Control Over Financial Reporting
The Company monitors and evaluates on an ongoing basis its internal control over financial reporting in order to improve its overall effectiveness. In the course of these evaluations, the Company modifies and refines its internal processes as conditions warrant. As required by Rule 13a-15(d), the Company’s management, including the Chief Executive Officer and the Chief Financial Officer, also conducted an evaluation of the Company’s internal control over financial reporting to determine whether any changes occurred during the quarter ended December 31, 201129, 2012 that have materially affected, or are reasonably likely to materially affect, the Company’s internal control over financial reporting. Based on that evaluation, there has been no such change during the period covered by this report.
REPORT OF INDEPENDENT REGISTERED PUBLIC ACCOUNTING FIRM
To the Board of Directors and Stockholders of
U.S. Auto Parts Network, Inc.
Carson, California
We have audited the internal control over financial reporting of U.S. Auto Parts Network, Inc and subsidiaries (the “Company”) as of December 31, 201129, 2012 based on criteria established inInternal Control — Integrated Frameworkissued by the Committee of Sponsoring Organizations of the Treadway Commission. The Company’s management is responsible for maintaining effective internal control over financial reporting and for its assessment of the effectiveness of internal control over financial reporting, included in the accompanying Management’s Report on Internal Control Over Financial Reporting. Our responsibility is to express an opinion on the Company’s internal control over financial reporting based on our audit.
We conducted our audit in accordance with the standards of the Public Company Accounting Oversight Board (United States). Those standards require that we plan and perform the audit to obtain reasonable assurance about whether effective internal control over financial reporting was maintained in all material respects. Our audit included obtaining an understanding of internal control over financial reporting, assessing the risk that a material weakness exists, testing and evaluating the design and operating effectiveness of internal control based on the assessed risk, and performing such other procedures as we considered necessary in the circumstances. We believe that our audit provides a reasonable basis for our opinion.
A company’s internal control over financial reporting is a process designed by, or under the supervision of, the company’s principal executive and principal financial officers, or persons performing similar functions, and effected by the company’s board of directors, management, and other personnel to provide reasonable assurance regarding the reliability of financial reporting and the preparation of financial statements for external purposes in accordance with generally accepted accounting principles. A company’s internal control over financial reporting includes those policies and procedures that (1) pertain to the maintenance of records that, in reasonable detail, accurately and fairly reflect the transactions and dispositions of the assets of the company; (2) provide reasonable assurance that transactions are recorded as necessary to permit preparation of financial statements in accordance with generally accepted accounting principles, and that receipts and expenditures of the company are being made only in accordance with authorizations of management and directors of the company; and (3) provide reasonable assurance regarding prevention or timely detection of unauthorized acquisition, use, or disposition of the company’s assets that could have a material effect on the financial statements.
Because of the inherent limitations of internal control over financial reporting, including the possibility of collusion or improper management override of controls, material misstatements due to error or fraud may not be prevented or detected on a timely basis. Also, projections of any evaluation of the effectiveness of the internal control over financial reporting to future periods are subject to the risk that the controls may become inadequate because of changes in conditions, or that the degree of compliance with the policies or procedures may deteriorate.
In our opinion, the Company maintained, in all material respects, effective internal control over financial reporting as of December 31, 2011,29, 2012, based on the criteria established inInternal Control — Integrated Frameworkissued by the Committee of Sponsoring Organizations of the Treadway Commission.
We have also audited, in accordance with the standards of the Public Company Accounting Oversight Board (United States), the consolidated financial statements as of and for the year ended December 31, 201129, 2012 of the Company and our report dated March 26, 201225, 2013 expressed an unqualified opinion on those financial statements.
/s/ DELOITTE & TOUCHE LLP
Los Angeles, CA
March 26, 201225, 2013
| ITEM 9B. | OTHER INFORMATION |
Entry into a Material Definitive AgreementNone.
On March 23, 2012, the Company and Silicon Valley Bank (the “Bank”) entered into an Amendment No. 4 to Loan and Security Agreement (the “Fourth Amendment”) pursuant to which the Company and the Bank amended that certain Loan and Security Agreement dated August 13, 2010, as amended by that certain Amendment No. 1 to Loan and Security Agreement and Limited Waiver dated February 28, 2011, that certain Amendment No. 2 to Loan Security Agreement and Limited Waiver dated November 7, 2011 and that certain Amendment No. 3 to Loan Security Agreement and Limited Waiver dated December 29, 2011, each of which has been previously filed by the Company with the Securities and Exchange Commission. The Fourth Amendment amended Section 6.7 (Financial Covenants), Subsection (c) Consolidated Fixed Charge Coverage Ratio, to reduce the previous ratio levels as follows: for the one quarter period ending March 31, 2012 to 1.00:1.00, and for the one quarter period ending each fiscal quarter thereafter to 1.25:1.00. See“Note 7 — Borrowings”of the Notes to Consolidated Financial Statements included in Part IV, Item 15 of this report for additional information.
The Fourth Amendment has been filed as Exhibit 10.76 with this report, and is included in Part IV, Item 15 “Exhibits, Financial Statement Schedules”.
| ITEM 10. | DIRECTORS, EXECUTIVE OFFICERS AND CORPORATE GOVERNANCE |
(a)Identification of Directors. The information under the caption “Election of Directors,” appearing in the Proxy Statement (“Proxy Statement”), is hereby incorporated by reference. The Proxy Statement will be filed with the SEC within 120 days from the end of fiscal year 2011.2012.
(b)Identification of Executive Officers and Certain Significant Employees. The information under the caption “Executive Compensation and Other Information—Executive Officers,” appearing in the Proxy Statement, is hereby incorporated by reference. The Proxy Statement will be filed with the SEC within 120 days from the end of fiscal year 2012.
(c)Compliance with Section 16(a) of the Exchange Act. The information under the caption “Section 16(a) Beneficial Ownership Reporting Compliance,” appearing in the Proxy Statement, is hereby incorporated by reference. The Proxy Statement will be filed with the SEC within 120 days from the end of fiscal year 2012.
(d)Code of Ethics. The information under the caption “Corporate Governance – Code of Ethics and Business Conduct,” appearing in the Proxy Statement, is hereby incorporated by reference. The Proxy Statement will be filed with the SEC within 120 days from the end of fiscal year 2012.
(e)Board Committees. The information under the caption “Corporate Governance — Board Committees and Meetings,” appearing in the Proxy Statement, is hereby incorporated by reference. The Proxy Statement will be filed with the SEC within 120 days from the end of fiscal year 2012.
| ITEM 11. | EXECUTIVE COMPENSATION |
The information under the caption “Executive Compensation and Other Information”, appearing in the Proxy Statement, is incorporated herein by reference. The Proxy Statement will be filed with the SEC within 120 days from the end of fiscal year 2012.
| ITEM 12. | SECURITY OWNERSHIP OF CERTAIN BENEFICIAL OWNERS AND MANAGEMENT AND RELATED STOCKHOLDER MATTERS |
The information under the captions “Equity Compensation Plans” and “Ownership of Securities by Certain Beneficial Owners and Management,” appearing in the Proxy Statement, is incorporated herein by reference. The Proxy Statement will be filed with the SEC within 120 days from the end of fiscal year 2012.
| ITEM 13. | CERTAIN RELATIONSHIPS AND RELATED TRANSACTIONS, AND DIRECTOR INDEPENDENCE |
The information under the captions “Corporate Governance — Director Independence” and “Certain Relationships and Related Transactions,” appearing in the Proxy Statement, is incorporated herein by reference. The Proxy Statement will be filed with the SEC within 120 days from the end of fiscal year 2012.
| ITEM 14. | PRINCIPAL ACCOUNTING FEES AND SERVICES |
The information under the caption “Fees Paid to Independent Registered Public Accounting Firm,” appearing in the Proxy Statement, is incorporated herein by reference. The Proxy Statement will be filed with the SEC within 120 days from the end of fiscal year 2012.
| ITEM 15. | EXHIBITS, FINANCIAL STATEMENT SCHEDULES |
(a) Documents filed as part of this report:
(1)Financial Statements. The following financial statements of U.S. Auto Parts Network, Inc. are included in a separate section of this Annual Report on Form 10-K commencing on the pages referenced below:
| Page | ||||
Report of Deloitte & Touche LLP, independent registered public accounting firm | F-1 | |||
| F-2 | ||||
Consolidated | ||||
(2)Financial Statement SchedulesSchedules..
All schedules have been omitted because they are not required or the required information is included in our consolidated financial statements and notes thereto.
(3)Exhibits.
The following exhibits are filed herewith or incorporated by reference to the location indicated below:
EXHIBIT INDEX
Exhibit No. | Description | |
2.1* | Acquisition Agreement dated May 19, 2006 by and among U.S. Auto Parts Network, Inc. and Partsbin, Inc., on the one hand, and The Partsbin.com, Inc., All OEM Parts, Inc., Power Host, Inc., Auto Parts Web Solutions, Inc., Web Chat Solutions, Inc., Everything Internet, LLC, Richard E. Pine, Lowell E. Mann, Brian Tinari and Todd Daugherty, on the other hand | |
2.2 | Stock Purchase Agreement executed August 2, 2010 among the Acquisition Sub, WAG, Riverside and the other stockholders of WAG (incorporated by reference to Exhibit 10.57 to the Company’s Current Report on Form 8-K filed with the Securities and Exchange Commission on August 4, 2010) | |
3.1 | Second Amended and Restated Certificate of Incorporation of U.S. Auto Parts Network, Inc. as filed with the Delaware Secretary of State on February 14, 2007 (incorporated by reference to Exhibit 3.1 to the Annual Report on Form 10-K filed with the Securities and Exchange Commission on April 2, 2007) | |
3.2 | Amended and Restated Bylaws of U.S. Auto Parts Network, Inc. (incorporated by reference to Exhibit 3.2 to the Annual Report on Form 10-K filed with the Securities and Exchange Commission on April 2, 2007) | |
4.1* | Specimen common stock certificate | |
10.1+* | U.S. Auto Parts Network, Inc. 2006 Equity Incentive Plan | |
10.2+* | Form of Stock Option Agreement under the U.S. Auto Parts Network, Inc. 2006 Equity Incentive Plan. | |
10.3+* | Form of Notice of Grant of Stock Option under the U.S. Auto Parts Network, Inc. 2006 Equity Incentive Plan. | |
10.4+* | Form of Acceleration Addendum to Stock Option Agreement under the U.S. Auto Parts Network, Inc. 2006 Equity Incentive Plan. | |
10.5+* | U.S. Auto Parts Network, Inc. 2007 Omnibus Plan and forms of agreements | |
10.8+* | Offer Letter of Employment dated May 19, 2006 by and between U.S. Auto Parts Network, Inc. and Richard Pine | |
|
| |
10.9+* | Non-Competition Agreement dated May 19, 2006 by and among U.S. Auto Parts Network, Inc. and Richard Pine, Lowell Mann, Brian Tinari and Todd Daugherty | |
10.10* | Shareholder’s Release dated May 19, 2006 by and between U.S. Auto Parts Network, Inc. and Richard Pine | |
10.23* | Commercial Lease Agreement dated January 1, 2004 by and between U.S. Auto Parts Network, Inc. and Nia Chloe Enterprises, LLC, amended effective February 1, 2010 | |
10.24* | Standard Industrial/Commercial Multi-Tenant Lease — Gross dated October 1, 2006 by and between U.S. Auto Parts Network, Inc. and Margay 2003, LLC, amended effective February 1, 2010 | |
10.25* | Standard Industrial/Commercial Multi-Tenant Lease — Gross dated July 12, 2004 by and between U.S. Auto Parts Network, Inc. and Isadore Socransky, amended effective February 1, 2010 | |
10.26* | Lease dated November 30, 2004 by and between U.S. Auto Parts Network, Inc. and William Coats | |
10.27†* | Catalog License and Parts Purchase Agreement dated November 20, 2006 by and between U.S. Auto Parts Network, Inc. and WORLDPAC, Inc. | |
10.29†* | Services Agreement dated October 3, 2006 by and between U.S. Auto Parts Network, Inc. and Efficient Frontier, Inc. | |
10.32+* | Offer Letter of Employment dated January 1, 2006 by and between U.S. Auto Parts Network, Inc. and Houman Akhavan | |
10.33+ | Form of Indemnification Agreement for Officers and Directors (incorporated by reference to Exhibit 10.33 to the Annual Report on Form 10-K filed with the Securities and Exchange Commission on March 15, 2010) | |
Exhibit No. | Description | |
10.35* | Deeds of Assignment and Declarations of Trust executed September 2006 regarding MBS Tek Corporation stock transfer | |
10.36 | Purchase Agreement, dated April 20, 2007, by and among U.S. Auto Parts Network, Inc., Access Worldwide Communications, Inc. and their respective Philippine affiliates (incorporated by reference to Exhibit 10.1 to the Quarterly Report on Form 10-Q filed with the Securities and Exchange Commission on May 15, 2007) | |
10.37 | Lease Agreements, dated August 8, 2007, by and among MBS Tek Corporation and Roshan Commercial Corp. (incorporated by reference to Exhibit 10.1 to the Quarterly Report on Form 10-Q filed with the Securities and Exchange Commission on August | |
10.38 | Form of Suppliers’ Agreement entered into between U.S. Auto Parts Network, Inc. and certain of its U.S. based suppliers and primary drop-ship vendors (incorporated by reference to Exhibit 10.2 to the Quarterly Report on Form 10-Q filed with the Securities and Exchange Commission on August | |
10.39+ | Employment Agreement dated | |
10.40+ | Non-Qualified Stock Option Agreement dated October 15, 2007 between U.S. Auto Parts Network, Inc. and Shane Evangelist (incorporated by reference to Exhibit 99.3 to the Current Report on Form 8-K filed with the Securities and Exchange Commission on October 17, 2007) | |
10.41+ | Non-Qualified Stock Option Agreement dated October 15, 2007 (performance grant) between U.S. Auto Parts Network, Inc. and Shane Evangelist (incorporated by reference to Exhibit 99.4 to the Current Report on Form 8-K filed with the Securities and Exchange Commission on October 17, 2007) | |
10.42+ | 2007 New Employee Incentive Plan (incorporated by reference to Exhibit 99.5 to the Current Report on Form 8-K filed with the Securities and Exchange Commission on October 17, 2007) | |
10.43 | Lease Agreement, dated October 11, 2007, by and between MBS Tek Corporation and Averon Holding Corporation (incorporated by reference to Exhibit 10.1 to the Quarterly Report on Form 10-Q filed with the Securities and Exchange Commission on November 14, 2007) | |
10.44+ | Employment Agreement, dated | |
|
| |
10.45 | Support Continuity Agreement, dated April 28, 2008, between the Company and Alexander Adegan (incorporated by reference to Exhibit 10.1 to the Current Report on Form 8-K filed with the Securities and Exchange Commission on | |
10.46 | Consulting Agreement, dated April 28, 2008, among the Company, uParts.com, Inc. and Alexander Adegan (incorporated by reference to Exhibit 10.2 to the Current Report on Form 8-K filed with the Securities and Exchange Commission on | |
10.47+ | Non-Incentive Stock Option Agreement, dated April 28, 2008, between the Company and Alexander Adegan (incorporated by reference to Exhibit 10.3 to the Current Report on Form 8-K filed with the Securities and Exchange Commission on April 28, 2008) | |
10.48+ | Non-Qualified Stock Option Agreement, dated May 15, 2008, by and between the Company and Shane Evangelist (incorporated by reference to Exhibit 10.1 to the Current Report on Form 8-K filed with the Securities and Exchange Commission on May 15, 2008) | |
10.49 | Stipulation of settlement in the matter entitled: In re U.S. Auto Parts Network, Inc. Securities Litigation, Case No. CV 07-2030-GW (JC) (incorporated by reference to Exhibit 10.1 to the Quarterly Report on Form 10-Q filed with the Securities and Exchange Commission on November 6, 2008) | |
10.50+ | Separation Agreement and Release of Claims, dated December 9, 2008, between the Company and Michael J. McClane (incorporated by reference to Exhibit 10.1 to the Current Report on Form 8-K filed with the Securities and Exchange Commission on December 9, 2008) | |
Exhibit No. | Description | |
10.51 | Consulting Agreement, dated December 9, 2008, between the Company and Michael J. McClane (incorporated by reference to Exhibit 10.2 to the Current Report on Form 8-K filed with the Securities and Exchange Commission on December 9, 2008) | |
10.52+ | Employment Agreement, dated March 29, 2010 between the Company and Theodore Sanders (incorporated by reference to Exhibit 10.53 to the Quarterly Report on Form 10-Q filed with the Securities and Exchange Commission on May 12, 2010) | |
10.53+ | Non-Qualified Stock Option Agreement, dated February 16, 2009, between the Company and Theodore Sanders (incorporated by reference to Exhibit 10.63 to the Current Report on Form 8-K filed with the Securities and Exchange Commission on February 17, 2009) | |
10.54+ | Non-Qualified Stock Option Agreement (performance grant), dated February 16, 2009, between the Company and Theodore Sanders (incorporated by reference to Exhibit 10.64 to the Current Report on Form 8-K filed with the Securities and Exchange Commission on February 17, 2009) | |
10.55 | Commercial Lease Agreement dated December 16, 2008 by and between U.S. Auto Parts Network, Inc. and Ashley Indian River, LLC (incorporated by reference to Exhibit 10.66 to the Annual Report on Form 10-K filed with the Securities and Exchange Commission on March 26, 2009) | |
10.56 | ||
10.58 | Guarantee executed August 2, 2010 by the Company (incorporated by reference to Exhibit 10.58 to the Company’s Current Report on Form 8-K filed with Securities and Exchange Commission on August 4, 2010) | |
| ||
| of Sublease | |
|
| |
10.63+ | 2011 Base Salaries and Target Bonuses of certain officers (incorporated by reference to Exhibit 10.1 to the Current Report on Form 8-K filed with the Securities and Exchange Commission on December | |
10.64 | Sublease dated December 4, 2007 by and between Marketing Werks, Inc. and J.C. Whitney & Co. (incorporated by reference to Exhibit 10.64 to the Annual Report on Form 10-K filed with the Securities and Exchange Commission on March 17, 2011) | |
10.65 | Second Amendment To Lease Agreement dated February 1, 2008 by and between JCM Management LLC and Stylin’ Concepts Corp. (incorporated by reference to Exhibit 10.65 to the Annual Report on Form 10-K filed with the Securities and Exchange Commission on March 17, 2011) | |
| ||
10.67 | Buyout Agreement dated October 11, 2011 by between the Company, Whitney Automotive Group Inc., and Discovery Communications, LLC. (incorporated by reference to Exhibit 10.67 to the Company’s Quarterly Report on Form 10-Q filed with the Securities and Exchange Commission on November 9, 2011) | |
10.68+ | U.S. Auto Parts Network Inc. Director Payment Election Plan (incorporated by reference to Exhibit 10.68 to the Company’s Quarterly Report on Form 10-Q filed with the Securities and Exchange Commission on November 9, 2011) | |
| ||
| ||
10.73+ | Amended and Restated Employment Agreement dated January 3, 2012 between the Company and Theodore R. Sanders. (incorporated by reference to Exhibit 10.62 to the Current Report on Form 8-k filed with the Securities and Exchange Commission on January 4, 2012) | |
10.74+ | Employment Agreement dated January 3, 2012 between the Company and David G. Robson. (incorporated by reference to Exhibit 10.63 to the Current Report on Form 8-k filed with the Securities and Exchange Commission on January 4, 2012) | |
Exhibit No. | Description | |
10.75+ | Non-Incentive Stock Option Agreement dated January 3, 2012 between the Company and David G. Robson. (incorporated by reference to Exhibit 10.64 to the Current Report on Form 8-k filed with the Securities and Exchange Commission on January 4, 2012) | |
| ||
10.78 | First Amended Credit Agreement, effective as of March 12, 2013, by and between U.S. Auto Parts Network, Inc., certain of its wholly-owned domestic subsidiaries and JPMorgan Chase Bank, N.A. | |
| 16.1 | June 21, 2010 Letter from E&Y to the SEC (incorporated herein by reference to the Company’s Current Report on Form 8-K filed with the SEC on June 23, 2010) | |
21.1 | Subsidiaries of U.S. Auto Parts Network, Inc. | |
23.1 | Consent of Independent Registered Public Accounting Firm | |
| ||
|
| |
31.1 | Certification of the | |
31.2 | Certification of the | |
32.1 | Certification of the Chief Executive Officer required by 18 U.S.C. Section 1350, as adopted pursuant to Section 906 of the Sarbanes-Oxley Act of 2002 | |
32.2 | Certification of the Chief Financial Officer required by 18 U.S.C. Section 1350, as adopted pursuant to Section 906 of the Sarbanes-Oxley Act of 2002 | |
101.INS¿ | XBRL Instance Document | |
101.SCH¿ | XBRL Taxonomy Extension Schema Document | |
101.CAL¿ | XBRL Taxonomy Extension Calculation Linkbase Document | |
101.DEF¿ | XBRL Taxonomy Extension Definition Linkbase Document | |
101.LAB¿ | XBRL Taxonomy Extension Label Linkbase Document | |
101.PRE¿ | XBRL Taxonomy Extension Presentation Linkbase Document | |
| * | Incorporated by reference to the exhibit of the same number from the registration statement on Form S-1 of U.S. Auto Parts Network, Inc. (File No. 333-138379) initially filed with the Securities and Exchange Commission on November 2, 2006, as amended. |
| + | Indicates a management contract or compensatory plan or arrangement |
| † | U.S. Auto Parts Network, Inc. has been granted confidential treatment with respect to certain portions of this exhibit (indicated by asterisks), which have been separately filed with the Securities and Exchange Commission. |
| ¿ | Furnished herewith. In accordance with Rule 406T of Regulation S-T, the information in these exhibits shall not be deemed to be “filed” for purposes of Section 18 of the Securities Exchange Act of 1934, as amended, or otherwise subject to liability under that section, and shall not be incorporated by reference into any registration statement or other document filed under the Securities Act of 1933, as amended, except as expressly set forth by specific reference in such filing. |
SIGNATURES
Pursuant to the requirements of Section 13 or 15(d) of the Securities Exchange Act of 1934, the registrant has duly caused this report on Form 10-K to be signed on its behalf by the undersigned, thereunto duly authorized.
Date: March | U.S. AUTO PARTS NETWORK, INC. | |||||
| By: | �� | /s/ Shane Evangelist | ||||
| Shane Evangelist | ||||||
| Chief Executive Officer | ||||||
POWER OF ATTORNEY
We, the undersigned officers and directors of U.S. Auto Parts Network, Inc., do hereby constitute and appoint Shane Evangelist and David Robson, and each of them, our true and lawful attorneys-in-fact and agents, each with full power of substitution and resubstitution, for him and in his name, place and stead, in any and all capacities, to sign any and all amendments to this report, and to file the same, with exhibits thereto, and other documents in connection therewith, with the Securities and Exchange Commission, granting unto said attorneys-in-fact and agents, and each of them, full power and authority to do and perform each and every act and thing requisite or necessary to be done in and about the premises, as fully to all intents and purposes as he might or could do in person, hereby, ratifying and confirming all that each of said attorneys-in-fact and agents, or his substitute or substitutes, may lawfully do or cause to be done by virtue hereof.
Pursuant to the requirements of the Securities Exchange Act of 1934, this report on Form 10-K has been signed below by the following persons on behalf of the registrant in the capacities and on the dates indicated:
Signature | Title | Date | ||
/s/ Shane Evangelist | Chief Executive Officer and Director | |||
Shane Evangelist | (principal executive officer) | March | ||
/s/ David Robson | Chief Financial Officer | |||
David Robson | (principal financial and accounting officer) | March | ||
/s/ Robert J. Majteles | ||||
Robert J. Majteles | Chairman of the Board | March | ||
/s/ Joshua L. Berman | ||||
Joshua L. Berman | Director | March | ||
/s/ Fredric W. Harman | ||||
Fredric W. Harman | Director | March | ||
/s/ Sol Khazani | ||||
Sol Khazani | Director | March | ||
/s/ Warren B. Phelps III | ||||
Warren B. Phelps III | Director | March | ||
/s/ Ellen F. Siminoff | ||||
Ellen F. Siminoff | Director | March | ||
INDEX TO CONSOLIDATED FINANCIAL STATEMENTS
Report of Deloitte & Touche LLP, independent registered public accounting firm | F-1 | |||
| F-2 | ||||
Consolidated | ||||
REPORT OF INDEPENDENT REGISTERED PUBLIC ACCOUNTING FIRM
To the Board of Directors and Stockholders of
U.S. Auto Parts Network, Inc.
Carson, CA
We have audited the accompanying consolidated balance sheets of U.S. Auto Parts Network, Inc. and subsidiaries (the “Company”) as of January 1, 2011December 29, 2012 and December 31, 2011 and the related consolidated statements of comprehensive operations, stockholders’ equity, and cash flows for each of the twothree years in the period ended December 31, 2011.29, 2012. These financial statements are the responsibility of the Company’s management. Our responsibility is to express an opinion on the financial statements based on our audits.
We conducted our audits in accordance with the standards of the Public Company Accounting Oversight Board (United States). Those standards require that we plan and perform the audit to obtain reasonable assurance about whether the financial statements are free of material misstatement. An audit includes examining, on a test basis, evidence supporting the amounts and disclosures in the financial statements. An audit also includes assessing the accounting principles used and significant estimates made by management, as well as evaluating the overall financial statement presentation. We believe that our audits provide a reasonable basis for our opinion.
In our opinion, such consolidated financial statements present fairly, in all material respects, the financial position of U.S. Auto Parts Network, Inc. and subsidiaries as of January 1, 2011December 29, 2012 and December 31, 2011 and the results of their operations and their cash flows for each of the twothree years in the period ended December 31, 2011,29, 2012, in conformity with accounting principles generally accepted in the United States of America.
We have also audited, in accordance with the standards of the Public Company Accounting Oversight Board (United States), the Company’s internal control over financial reporting as of December 31, 2011,29, 2012, based on the criteria established inInternal Control—Control – Integrated Framework issued by the Committee of Sponsoring Organizations of the Treadway Commission and our report dated March 26, 201225, 2013 expressed an unqualified opinion on the Company’s internal control over financial reporting.
/s/ DELOITTE & TOUCHE LLP
Los Angeles, CA
March 26, 201225, 2013
REPORT OF INDEPENDENT REGISTERED PUBLIC ACCOUNTING FIRM
Board of Directors and Stockholders
U.S. Auto Parts Network, Inc.
We have audited the accompanying consolidated statements of operations, stockholders’ equity and cash flows of U.S. Auto Parts Network, Inc. and subsidiaries (the Company) for the year ended January 2, 2010. These financial statements are the responsibility of the Company’s management. Our responsibility is to express an opinion on these financial statements based on our audit.
We conducted our audit in accordance with the standards of the Public Company Accounting Oversight Board (United States). Those standards require that we plan and perform the audit to obtain reasonable assurance about whether the financial statements are free of material misstatement. We were not engaged to perform an audit of the Company’s internal control over financial reporting. Our audit included consideration of internal control over financial reporting as a basis for designing audit procedures that are appropriate in the circumstances, but not for the purpose of expressing an opinion on the effectiveness of the Company’s internal control over financial reporting. Accordingly, we express no such opinion. An audit also includes examining, on a test basis, evidence supporting the amounts and disclosures in the financial statements, assessing the accounting principles used and significant estimates made by management, and evaluating the overall financial statement presentation. We believe that our audit provide a reasonable basis for our opinion.
In our opinion, the financial statements referred to above present fairly, in all material respects, the consolidated results of operations and cash flows of U.S. Auto Parts Network, Inc. and subsidiaries for the year ended January 2, 2010, in conformity with U.S. generally accepted accounting principles.
/s/ Ernst & Young LLP
Los Angeles, California
March 12, 2010
U.S. AUTO PARTS NETWORK, INC. AND SUBSIDIARIES
CONSOLIDATED BALANCE SHEETS
(in thousands, except share data and per share data)In Thousands, Except Par Value)
| January 1, 2011 | December 31, 2011 | December 29, 2012 | December 31, 2011 | |||||||||||||
ASSETS | ||||||||||||||||
Current assets: | ||||||||||||||||
Cash and cash equivalents | $ | 17,595 | $ | 10,335 | $ | 1,030 | $ | 10,335 | ||||||||
Short-term investments | 1,062 | 1,125 | 110 | 1,125 | ||||||||||||
Accounts receivable, net of allowances of $372 and $183, respectively | 5,339 | 7,922 | ||||||||||||||
Accounts receivable, net of allowances of $221 and $183 at December 29, 2012 and December 31, 2011, respectively | 7,431 | 7,922 | ||||||||||||||
Inventory | 48,100 | 52,245 | 42,727 | 52,245 | ||||||||||||
Deferred income taxes | 359 | 446 | 39 | 446 | ||||||||||||
Other current assets | 5,646 | 3,548 | 4,176 | 3,548 | ||||||||||||
|
|
|
| |||||||||||||
Total current assets | 78,101 | 75,621 | 55,513 | 75,621 | ||||||||||||
Property and equipment, net | 33,140 | 34,627 | 28,559 | 34,627 | ||||||||||||
Intangible assets, net | 18,718 | 9,984 | 3,227 | 9,984 | ||||||||||||
Goodwill | 18,647 | 18,854 | — | 18,854 | ||||||||||||
Investments | 4,141 | 2,104 | — | 2,104 | ||||||||||||
Other non-current assets | 790 | 1,026 | 1,578 | 1,026 | ||||||||||||
|
|
|
| |||||||||||||
Total assets | $ | 153,537 | $ | 142,216 | $ | 88,877 | $ | 142,216 | ||||||||
|
|
|
| |||||||||||||
LIABILITIES AND STOCKHOLDERS’ EQUITY | ||||||||||||||||
Current liabilities: | ||||||||||||||||
Accounts payable | $ | 31,660 | $ | 41,303 | $ | 28,025 | $ | 41,303 | ||||||||
Accrued expenses | 15,487 | 11,565 | 10,485 | 11,565 | ||||||||||||
Revolving loan payable | 16,222 | — | ||||||||||||||
Current portion of long-term debt | 6,125 | 6,250 | — | 6,250 | ||||||||||||
Current portion of capital leases payable | 132 | 135 | 70 | 135 | ||||||||||||
Other current liabilities | 5,522 | 7,702 | 4,738 | 7,702 | ||||||||||||
|
|
|
| |||||||||||||
Total current liabilities | 58,926 | 66,955 | 59,540 | 66,955 | ||||||||||||
Long-term debt, net of current portion | 17,875 | 11,625 | — | 11,625 | ||||||||||||
Capital leases payable, net of current portion | 185 | 37 | 70 | 37 | ||||||||||||
Deferred income taxes | 3,046 | 1,596 | 314 | 1,596 | ||||||||||||
Other non-current liabilities | 701 | 1,079 | 1,309 | 1,079 | ||||||||||||
|
|
|
| |||||||||||||
Total liabilities | 80,733 | 81,292 | 61,233 | 81,292 | ||||||||||||
|
| |||||||||||||||
Commitments and contingencies | ||||||||||||||||
Stockholders’ equity: | ||||||||||||||||
Common stock, $0.001 par value; 100,000,000 shares authorized at January 1, 2011 and December 31, 2011; 30,429,376 and 30,625,764 shares issued and outstanding at January 1, 2011 and December 31, 2011, respectively | 30 | 31 | ||||||||||||||
Common stock, $0.001 par value; 100,000 shares authorized; 31,128 and 30,626 shares issued and outstanding at December 29, 2012 and December 31, 2011, respectively | 31 | 31 | ||||||||||||||
Additional paid-in-capital | 153,962 | 157,140 | 159,781 | 157,140 | ||||||||||||
Accumulated other comprehensive income | 249 | 327 | 384 | 327 | ||||||||||||
Accumulated deficit | (81,437 | ) | (96,574 | ) | (132,552 | ) | (96,574 | ) | ||||||||
|
|
|
| |||||||||||||
Total stockholders’ equity | 72,804 | 60,924 | 27,644 | 60,924 | ||||||||||||
|
|
|
| |||||||||||||
Total liabilities and stockholders’ equity | $ | 153,537 | $ | 142,216 | $ | 88,877 | $ | 142,216 | ||||||||
|
|
|
| |||||||||||||
See accompanying notes to consolidated financial statements.
U.S. AUTO PARTS NETWORK, INC. AND SUBSIDIARIES
CONSOLIDATED STATEMENTS OF COMPREHENSIVE OPERATIONS
(in thousands, except share and per share data)In Thousands, Except Per Share Data)
| 52 Weeks Ended January 2, 2010 | 52 Weeks Ended January 1, 2011 | 52 Weeks Ended December 31, 2011 | ||||||||||
Net sales | $ | 176,288 | $ | 262,277 | $ | 327,072 | ||||||
Cost of sales(1) | 112,415 | 172,668 | 220,072 | |||||||||
|
|
|
|
|
| |||||||
Gross profit | 63,873 | 89,609 | 107,000 | |||||||||
Operating expenses: | ||||||||||||
Marketing | 23,419 | 38,757 | 55,785 | |||||||||
General and administrative | 19,640 | 28,628 | 31,961 | |||||||||
Fulfillment | 11,437 | 14,946 | 19,164 | |||||||||
Technology | 4,467 | 5,902 | 7,274 | |||||||||
Amortization of intangibles | 661 | 2,804 | 3,673 | |||||||||
Impairment loss on intangibles | — | — | 5,138 | |||||||||
|
|
|
|
|
| |||||||
Total operating expenses | 59,624 | 91,037 | 122,995 | |||||||||
|
|
|
|
|
| |||||||
Income (loss) from operations | 4,249 | (1,428 | ) | (15,995 | ) | |||||||
Other income (expense): | ||||||||||||
Other income, net | 2 | 191 | 364 | |||||||||
Interest income (expense) | 189 | (471 | ) | (1,018 | ) | |||||||
|
|
|
|
|
| |||||||
Total other income (expense) | 191 | (280 | ) | (654 | ) | |||||||
Income (loss) before income taxes | 4,440 | (1,708 | ) | (16,649 | ) | |||||||
Income tax provision (benefit) | 3,123 | 12,218 | (1,512 | ) | ||||||||
|
|
|
|
|
| |||||||
Net income (loss) | $ | 1,317 | $ | (13,926 | ) | $ | (15,137 | ) | ||||
|
|
|
|
|
| |||||||
Basic net income (loss) per share | $ | 0.04 | $ | (0.46 | ) | $ | (0.50 | ) | ||||
Diluted net income (loss) per share | $ | 0.04 | $ | (0.46 | ) | $ | (0.50 | ) | ||||
Shares used in computation of basic net income (loss) per share | 29,851,873 | 30,269,462 | 30,545,638 | |||||||||
Shares used in computation of diluted net income (loss) per share | 30,809,111 | 30,269,462 | 30,545,638 | |||||||||
| Fifty-Two Weeks Ended | ||||||||||||
| December 29, 2012 | December 31, 2011 | January 1, 2011 | ||||||||||
Net sales | $ | 304,017 | $ | 327,072 | $ | 262,277 | ||||||
Cost of sales(1) | 212,379 | 220,072 | 172,668 | |||||||||
|
|
|
|
|
| |||||||
Gross profit | 91,638 | 107,000 | 89,609 | |||||||||
|
|
|
|
|
| |||||||
Operating expenses: | ||||||||||||
Marketing | 51,416 | 55,785 | 38,757 | |||||||||
General and administrative | 19,857 | 31,961 | 28,628 | |||||||||
Fulfillment | 22,265 | 19,164 | 14,946 | |||||||||
Technology | 6,274 | 7,274 | 5,902 | |||||||||
Amortization of intangible assets | 1,189 | 3,673 | 2,804 | |||||||||
Impairment loss on goodwill | 18,854 | — | — | |||||||||
Impairment loss on property and equipment | 1,960 | — | — | |||||||||
Impairment loss on intangible assets | 5,613 | 5,138 | — | |||||||||
|
|
|
|
|
| |||||||
Total operating expenses | 127,428 | 122,995 | 91,037 | |||||||||
|
|
|
|
|
| |||||||
Loss from operations | (35,790 | ) | (15,995 | ) | (1,428 | ) | ||||||
|
|
|
|
|
| |||||||
Other income (expense): | ||||||||||||
Other income, net | 20 | 364 | 191 | |||||||||
Interest expense | (785 | ) | (1,018 | ) | (471 | ) | ||||||
Loss on debt extinguishment | (360 | ) | — | — | ||||||||
|
|
|
|
|
| |||||||
Total other expense, net | (1,125 | ) | (654 | ) | (280 | ) | ||||||
|
|
|
|
|
| |||||||
Loss before income taxes | (36,915 | ) | (16,649 | ) | (1,708 | ) | ||||||
Income tax (benefit) provision | (937 | ) | (1,512 | ) | 12,218 | |||||||
|
|
|
|
|
| |||||||
Net loss | (35,978 | ) | (15,137 | ) | (13,926 | ) | ||||||
|
|
|
|
|
| |||||||
Other comprehensive income, net of tax: | ||||||||||||
Foreign currency translation adjustments | 31 | 22 | 150 | |||||||||
Unrealized gains on investments | 26 | 56 | 15 | |||||||||
|
|
|
|
|
| |||||||
Total other comprehensive income | 57 | 78 | 165 | |||||||||
|
|
|
|
|
| |||||||
Comprehensive loss | $ | (35,921 | ) | $ | (15,059 | ) | $ | (13,761 | ) | |||
|
|
|
|
|
| |||||||
Basic and diluted net loss per share | $ | (1.17 | ) | $ | (0.50 | ) | $ | (0.46 | ) | |||
Shares used in computation of basic and diluted net loss per share | 30,818 | 30,546 | 30,269 | |||||||||
| (1) | Excludes depreciation and amortization expense which is included in marketing, general and administrative and fulfillment |
See accompanying notes to consolidated financial statements.
U.S AUTO PARTS NETWORK, INC. AND SUBSIDIARIES
CONSOLIDATED STATEMENTS OF STOCKHOLDERS’ EQUITY
(in thousands, except share data)In Thousands)
Common Stock | Additional Paid-in- Capital | Accumulated Other Comprehensive Income (Loss) | Accumulated Deficit | Total Stockholders’ Equity | Comprehensive Income (Loss) for the Period | Common Stock | Additional Paid-in- Capital | Accumulated Other Comprehensive Income (Loss) | Accumulated Deficit | Total Stockholders’ Equity | ||||||||||||||||||||||||||||||||||||||||||
| Shares | Amount | Shares | Amount | |||||||||||||||||||||||||||||||||||||||||||||||||
Balance, December 31, 2008 | 29,846,757 | $ | 30 | $ | 146,408 | $ | (88 | ) | $ | (68,828 | ) | $ | 77,522 | |||||||||||||||||||||||||||||||||||||||
|
|
|
|
|
| |||||||||||||||||||||||||||||||||||||||||||||||
Net income | — | — | — | — | 1,317 | 1,317 | $ | 1,317 | ||||||||||||||||||||||||||||||||||||||||||||
Issuance of shares in connection with stock option exercise | 46,874 | — | 162 | — | — | 162 | — | |||||||||||||||||||||||||||||||||||||||||||||
Share-based compensation | — | — | 3,514 | — | — | 3,514 | — | |||||||||||||||||||||||||||||||||||||||||||||
Unrealized gain on investments, net of tax | — | — | — | 19 | — | 19 | 19 | |||||||||||||||||||||||||||||||||||||||||||||
Effect of changes in foreign currencies | — | — | — | 153 | — | 153 | 153 | |||||||||||||||||||||||||||||||||||||||||||||
|
|
|
|
|
|
| ||||||||||||||||||||||||||||||||||||||||||||||
Total comprehensive income | $ | 1,489 | ||||||||||||||||||||||||||||||||||||||||||||||||||
| ||||||||||||||||||||||||||||||||||||||||||||||||||||
Balance, January 2, 2010 | 29,893,631 | $ | 30 | $ | 150,084 | $ | 84 | $ | (67,511 | ) | $ | 82,687 | 29,894 | $ | 30 | $ | 150,084 | $ | 84 | $ | (67,511 | ) | $ | 82,687 | ||||||||||||||||||||||||||||
|
|
|
|
|
| |||||||||||||||||||||||||||||||||||||||||||||||
|
|
|
|
|
| |||||||||||||||||||||||||||||||||||||||||||||||
Net loss | — | — | — | — | (13,926 | ) | (13,926 | ) | $ | (13,926 | ) | — | — | — | — | (13,926 | ) | (13,926 | ) | |||||||||||||||||||||||||||||||||
Issuance of shares in connection with stock option exercises | 323,103 | — | 999 | — | — | 999 | — | 323 | — | 999 | — | — | 999 | |||||||||||||||||||||||||||||||||||||||
Share-based compensation | 212,642 | — | 2,879 | — | — | 2,879 | — | 212 | — | 2,879 | — | — | 2,879 | |||||||||||||||||||||||||||||||||||||||
Unrealized gain on investments, net of tax | — | — | — | 15 | — | 15 | 15 | — | — | — | 15 | — | 15 | |||||||||||||||||||||||||||||||||||||||
Effect of changes in foreign currencies | — | — | — | 150 | — | 150 | 150 | — | — | — | 150 | — | 150 | |||||||||||||||||||||||||||||||||||||||
|
|
|
|
|
|
|
|
|
|
|
|
| ||||||||||||||||||||||||||||||||||||||||
Total comprehensive loss | $ | (13,761 | ) | |||||||||||||||||||||||||||||||||||||||||||||||||
| ||||||||||||||||||||||||||||||||||||||||||||||||||||
Balance, January 1, 2011 | 30,429,376 | $ | 30 | $ | 153,962 | $ | 249 | $ | (81,437 | ) | $ | 72,804 | 30,429 | $ | 30 | $ | 153,962 | $ | 249 | $ | (81,437 | ) | $ | 72,804 | ||||||||||||||||||||||||||||
|
|
|
|
|
| |||||||||||||||||||||||||||||||||||||||||||||||
|
|
|
|
|
| |||||||||||||||||||||||||||||||||||||||||||||||
Net loss | — | — | — | — | (15,137 | ) | (15,137 | ) | $ | (15,137 | ) | — | — | — | — | (15,137 | ) | (15,137 | ) | |||||||||||||||||||||||||||||||||
Issuance of shares in connection with stock option exercises | 136,770 | 1 | 353 | — | — | 354 | — | 137 | 1 | 353 | — | — | 354 | |||||||||||||||||||||||||||||||||||||||
Issuance of stock awards | 59,618 | — | — | — | — | — | 60 | — | — | — | — | |||||||||||||||||||||||||||||||||||||||||
Share-based compensation | — | — | 2,825 | — | — | 2,825 | — | — | — | 2,825 | — | — | 2,825 | |||||||||||||||||||||||||||||||||||||||
Unrealized gain on investments, net of tax | — | — | — | 56 | — | 56 | 56 | — | — | — | 56 | — | 56 | |||||||||||||||||||||||||||||||||||||||
Effect of changes in foreign currencies | — | — | — | 22 | — | 22 | 22 | — | — | — | 22 | — | 22 | |||||||||||||||||||||||||||||||||||||||
|
|
|
|
|
|
|
|
|
|
|
|
| ||||||||||||||||||||||||||||||||||||||||
Total comprehensive loss | — | — | — | — | — | — | $ | (15,059 | ) | |||||||||||||||||||||||||||||||||||||||||||
| ||||||||||||||||||||||||||||||||||||||||||||||||||||
Balance, December 31, 2011 | 30,625,764 | $ | 31 | $ | 157,140 | $ | 327 | $ | (96,574 | ) | $ | 60,924 | 30,626 | $ | 31 | $ | 157,140 | $ | 327 | $ | (96,574 | ) | $ | 60,924 | ||||||||||||||||||||||||||||
|
|
|
|
|
|
|
|
|
|
|
| |||||||||||||||||||||||||||||||||||||||||
Net loss | — | — | — | — | (35,978 | ) | (35,978 | ) | ||||||||||||||||||||||||||||||||||||||||||||
Issuance of shares in connection with stock option exercises | 489 | — | 636 | — | — | 636 | ||||||||||||||||||||||||||||||||||||||||||||||
Issuance of stock awards | 13 | — | 53 | — | — | 53 | ||||||||||||||||||||||||||||||||||||||||||||||
Share-based compensation | — | — | 1,952 | — | — | 1,952 | ||||||||||||||||||||||||||||||||||||||||||||||
Unrealized gain on investments, net of tax | — | — | — | 31 | — | 31 | ||||||||||||||||||||||||||||||||||||||||||||||
Effect of changes in foreign currencies | — | — | — | 26 | — | 25 | ||||||||||||||||||||||||||||||||||||||||||||||
|
|
|
|
|
| |||||||||||||||||||||||||||||||||||||||||||||||
Balance, December 29, 2012 | 31,128 | $ | 31 | $ | 159,781 | $ | 384 | $ | (132,552 | ) | $ | 27,644 | ||||||||||||||||||||||||||||||||||||||||
|
|
|
|
|
| |||||||||||||||||||||||||||||||||||||||||||||||
See accompanying notes to consolidated financial statements.
U.S. AUTO PARTS NETWORK, INC. AND SUBSIDIARIES
CONSOLIDATED STATEMENTS OF CASH FLOWS
(in thousands)In Thousands)
| 52 Weeks Ended January 2, 2010 | 52 Weeks Ended January 1, 2011 | 52 Weeks Ended December 31, 2011 | ||||||||||
Operating activities | ||||||||||||
Net income (loss) | $ | 1,317 | $ | (13,926 | ) | $ | (15,137 | ) | ||||
Adjustments to reconcile net income (loss) to net cash provided by (used in) operating activities: | ||||||||||||
Depreciation and amortization | 4,910 | 9,466 | 12,695 | |||||||||
Amortization of intangibles | 661 | 2,804 | 3,673 | |||||||||
Deferred income taxes | 3,634 | 12,572 | (1,537 | ) | ||||||||
Share-based compensation | 3,270 | 2,742 | 2,607 | |||||||||
Impairment loss on intangibles | — | — | 5,138 | |||||||||
Amortization of deferred financing costs | — | 50 | 147 | |||||||||
Gain from disposition of assets | — | (5 | ) | (12 | ) | |||||||
Changes in operating assets and liabilities: | ||||||||||||
Accounts receivable | (2,030 | ) | 919 | (2,583 | ) | |||||||
Inventory | (7,700 | ) | (17,124 | ) | (4,145 | ) | ||||||
Other current assets | (1,055 | ) | (910 | ) | 734 | |||||||
Other noncurrent assets | (3 | ) | (123 | ) | — | |||||||
Accounts payable and accrued expenses | 7,560 | (686 | ) | 6,218 | ||||||||
Other current liabilities | 1,023 | 1,812 | 2,202 | |||||||||
Other noncurrent liabilities | — | 700 | 378 | |||||||||
|
|
|
|
|
| |||||||
Net cash provided by (used in) operating activities | 11,587 | (1,709 | ) | 10,378 | ||||||||
Investing activities | ||||||||||||
Additions to property and equipment | (8,400 | ) | (12,068 | ) | (14,303 | ) | ||||||
Acquisition of assembled workforce and other intangibles | (739 | ) | (1,012 | ) | (74 | ) | ||||||
Cash paid for acquisition, net of cash acquired | — | (27,500 | ) | — | ||||||||
Proceeds from sale of marketable securities | 2,150 | 29,641 | 2,600 | |||||||||
Purchases of marketable securities | (11,090 | ) | (19,540 | ) | (572 | ) | ||||||
Changes in restricted cash | — | (319 | ) | 319 | ||||||||
Purchases of company-owned life insurance | — | (250 | ) | (281 | ) | |||||||
Proceeds from purchase price adjustment | — | — | 787 | |||||||||
|
|
|
|
|
| |||||||
Net cash used in investing activities | (18,079 | ) | (31,048 | ) | (11,524 | ) | ||||||
Financing activities | ||||||||||||
Proceeds from long-term debt | — | 25,000 | — | |||||||||
Payments made on long-term debt | — | (1,000 | ) | (6,125 | ) | |||||||
Changes in book overdraft | — | (529 | ) | (141 | ) | |||||||
Payments of debt financing costs | — | (467 | ) | (74 | ) | |||||||
Payments of short-term financing | (47 | ) | (77 | ) | (144 | ) | ||||||
Proceeds from exercise of stock options | 162 | 956 | 384 | |||||||||
|
|
|
|
|
| |||||||
Net cash provided by (used in) financing activities | 115 | 23,883 | (6,100 | ) | ||||||||
|
|
|
|
|
| |||||||
Effect of exchange rate changes on cash | 155 | 218 | (14 | ) | ||||||||
Net change in cash and cash equivalents | (6,222 | ) | (8,656 | ) | (7,260 | ) | ||||||
Cash and cash equivalents, beginning of period | 32,473 | 26,251 | 17,595 | |||||||||
|
|
|
|
|
| |||||||
Cash and cash equivalents, end of period | $ | 26,251 | $ | 17,595 | $ | 10,335 | ||||||
|
|
|
|
|
| |||||||
Supplemental disclosure of non-cash investing and financing activities: | ||||||||||||
Accrued asset purchases | $ | 451 | $ | 1,691 | $ | 1,286 | ||||||
Property acquired under capital lease | — | 370 | 49 | |||||||||
Estimated purchase price adjustment | — | 994 | — | |||||||||
Unrealized gain on investments | 19 | 15 | 60 | |||||||||
| 52 Weeks Ended January 2, 2010 | 52 Weeks Ended January 1, 2011 | 52 Weeks Ended December 31, 2011 | Fifty-Two Weeks Ended | |||||||||||||||||||||
| December 29, 2012 | December 31, 2011 | January 1, 2011 | ||||||||||||||||||||||
Operating activities | ||||||||||||||||||||||||
Net loss | $ | (35,978 | ) | $ | (15,137 | ) | $ | (13,926 | ) | |||||||||||||||
Adjustments to reconcile net loss to net cash (used in) provided by operating activities: | ||||||||||||||||||||||||
Depreciation and amortization expense | 15,204 | 12,695 | 9,466 | |||||||||||||||||||||
Amortization of intangible assets | 1,189 | 3,673 | 2,804 | |||||||||||||||||||||
Deferred income taxes | (875 | ) | (1,537 | ) | 12,572 | |||||||||||||||||||
Share-based compensation expense | 1,673 | 2,607 | 2,742 | |||||||||||||||||||||
Stock awards issued for non-employee director service | 53 | — | — | |||||||||||||||||||||
Impairment loss on goodwill | 18,854 | — | — | |||||||||||||||||||||
Impairment loss on property and equipment | 1,960 | — | — | |||||||||||||||||||||
Impairment loss on intangible assets | 5,613 | 5,138 | — | |||||||||||||||||||||
Amortization of deferred financing costs | 94 | 147 | 50 | |||||||||||||||||||||
Loss on debt extinguishment | 360 | — | — | |||||||||||||||||||||
Loss (gain) from disposition of assets | 14 | (12 | ) | (5 | ) | |||||||||||||||||||
Changes in operating assets and liabilities: | ||||||||||||||||||||||||
Accounts receivable | 491 | (2,583 | ) | 919 | ||||||||||||||||||||
Inventory | 9,520 | (4,145 | ) | (17,124 | ) | |||||||||||||||||||
Other current assets | (618 | ) | 734 | (910 | ) | |||||||||||||||||||
Other non-current assets | (281 | ) | — | (123 | ) | |||||||||||||||||||
Accounts payable and accrued expenses | (14,912 | ) | 6,218 | (686 | ) | |||||||||||||||||||
Other current liabilities | (2,964 | ) | 2,202 | 1,812 | ||||||||||||||||||||
Other non-current liabilities | 203 | 378 | 700 | |||||||||||||||||||||
|
|
| ||||||||||||||||||||||
Net cash (used in) provided by operating activities | (400 | ) | 10,378 | (1,709 | ) | |||||||||||||||||||
|
|
| ||||||||||||||||||||||
Investing activities | ||||||||||||||||||||||||
Additions to property and equipment | (10,155 | ) | (14,303 | ) | (12,068 | ) | ||||||||||||||||||
Proceeds from sale of property and equipment | 14 | — | — | |||||||||||||||||||||
Cash paid for intangibles | (34 | ) | (74 | ) | (1,012 | ) | ||||||||||||||||||
Cash paid for acquisition, net of cash acquired | — | — | (27,500 | ) | ||||||||||||||||||||
Proceeds from sale of marketable securities and investments | 3,171 | 2,600 | 29,641 | |||||||||||||||||||||
Purchases of marketable securities and investments | (8 | ) | (572 | ) | (19,540 | ) | ||||||||||||||||||
Changes in restricted cash | — | 319 | (319 | ) | ||||||||||||||||||||
Purchases of company-owned life insurance | (166 | ) | (281 | ) | (250 | ) | ||||||||||||||||||
Proceeds from purchase price adjustment | — | 787 | — | |||||||||||||||||||||
|
|
| ||||||||||||||||||||||
Net cash used in investing activities | (7,178 | ) | (11,524 | ) | (31,048 | ) | ||||||||||||||||||
|
|
| ||||||||||||||||||||||
Financing activities | ||||||||||||||||||||||||
Proceeds from revolving loan payable | 26,731 | — | — | |||||||||||||||||||||
Payments made on revolving loan payable | (10,509 | ) | — | — | ||||||||||||||||||||
Proceeds from long-term debt | — | — | 25,000 | |||||||||||||||||||||
Payments made on long-term debt | (17,875 | ) | (6,125 | ) | (1,000 | ) | ||||||||||||||||||
Payment of debt extinguishment costs | (175 | ) | — | — | ||||||||||||||||||||
Payments of debt financing costs | (407 | ) | (74 | ) | (467 | ) | ||||||||||||||||||
Payments on capital leases | (137 | ) | (144 | ) | (77 | ) | ||||||||||||||||||
Proceeds from exercise of stock options | 636 | 384 | 956 | |||||||||||||||||||||
Other | — | (141 | ) | (529 | ) | |||||||||||||||||||
|
|
| ||||||||||||||||||||||
Net cash (used in) provided by financing activities | (1,736 | ) | (6,100 | ) | 23,883 | |||||||||||||||||||
|
|
| ||||||||||||||||||||||
Effect of exchange rate changes on cash | 9 | (14 | ) | 218 | ||||||||||||||||||||
Net change in cash and cash equivalents | (9,305 | ) | (7,260 | ) | (8,656 | ) | ||||||||||||||||||
Cash and cash equivalents, beginning of period | 10,335 | 17,595 | 26,251 | |||||||||||||||||||||
|
|
| ||||||||||||||||||||||
Cash and cash equivalents, end of period | $ | 1,030 | $ | 10,335 | $ | 17,595 | ||||||||||||||||||
|
|
| ||||||||||||||||||||||
Supplemental disclosure of non-cash investing and financing activities: | ||||||||||||||||||||||||
Accrued asset purchases | $ | 1,803 | $ | 1,286 | $ | 1,691 | ||||||||||||||||||
Property acquired under capital lease | 104 | 49 | 370 | |||||||||||||||||||||
Estimated purchase price adjustment | — | — | 994 | |||||||||||||||||||||
Unrealized gain on investments | 26 | 60 | 15 | |||||||||||||||||||||
Supplemental disclosure of cash flow information: | ||||||||||||||||||||||||
Cash paid during the period for income taxes | $ | 589 | $ | 131 | $ | 9 | $ | — | $ | 9 | $ | 131 | ||||||||||||
Cash paid during the period for interest | 2 | 127 | 1,099 | 495 | 1,099 | 127 | ||||||||||||||||||
See accompanying notes to consolidated financial statements.
U.S. AUTO PARTS NETWORK, INC. AND SUBSIDIARIES
NOTES TO CONSOLIDATED FINANCIAL STATEMENTS
Note 1 – Summary of Significant Accounting Policies and Nature of Operations
U.S. Auto Parts Network, Inc. (including its subsidiaries, the “Company”)subsidiaries) is a distributor of aftermarket auto parts and accessories and was established in 1995. The Company entered the e-commerce sector by launching its first website in 2000 and currently derives the majority of its revenues from online sales channels. The Company sells its products to individual consumers through a network of websites and online marketplaces. Our flagship websites are located atwww.autopartswarehouse.com,www.partstrain.com,www.jcwhitney.com,www.stylintrucks.com,www.AutoMD.com and our corporate website is located atwww.usautoparts.net. References to the “Company,” “we,” “us,” or “our” refer to U.S. Auto Parts Network, Inc. and its consolidated subsidiaries.
The Company’s products consist of body parts, engine parts, performance parts and accessories. The body parts category is primarily comprised of parts for the exterior of an automobile. Our parts in this category are typically replacement parts for original body parts that have been damaged as a result of a collision or through general wear and tear. The majority of these products are sold through our websites. In addition, we sell an extensive line of mirror products, including our own private-label brand called Kool-Vue™, which are marketed and sold as aftermarket replacement parts and as upgrades to existing parts. The engine parts category is comprised of engine components and other mechanical and electrical parts, which are often referred to as hard parts. These parts serve as replacement parts for existing engine parts and are generally used by professionals and do-it-yourselfers for engine and mechanical maintenance and repair. We offer performance versions of many parts sold in each of the above categories. Performance parts and accessories generally consist of parts that enhance the performance of the automobile, upgrade existing functionality of a specific part or improve the physical appearance or comfort of the automobile.
The Company is a Delaware C corporation and is headquartered in Carson, California. The Company also has employees located in Kansas, Virginia, Tennessee, Texas, Wyoming, Illinois and Ohio, as well as in the Philippines.
Prior Year Balance Sheet Reclassification
Subsequent to the issuance of the Company’s fiscal 2010 consolidated financial statements, the Company identified an error which resulted in reclassifying $1.5 million from accounts receivable to goodwill. The Company considers this an immaterial reclassification and has changed the January 1, 2011 consolidated balance sheet. See“Note 5 – Business Combination” and “Note 6 – Goodwill and Intangibles”for details on the immaterial reclassification.
Fiscal Year
The Company’s fiscal year is based on a 52/53 week fiscal year ending on the Saturday closest to December 31. Prior to fiscal 2009, the Company reported on a calendar year basis.
Principles of Consolidation
The consolidated financial statements include the accounts of the Company and its wholly-owned subsidiaries. Intercompany balances and transactions have been eliminated.
Basis of Presentation
During fiscal year 2012, the Company incurred a net loss of $36.0 million and revenues declined to $304.0 million from $327.1 million after incurring a net loss of $15.1 million in fiscal year 2011. Overall, we expect the downward trend in our revenues and net loss to continue in the next twelve months. This trend could severely impact our liquidity as we may not be able to provide positive cash flows from operations in order to meet our working capital requirements. We may need to borrow additional funds from our credit facility, which under certain circumstances may not be available, sell our assets or seek equity or additional debt financing in the future. There can be no assurance that we would be able to raise such additional financing or engage in such asset sales on acceptable terms, or at all. If our expected downward trend in revenues and net loss continues for longer than we expect because our strategies to return to positive sales growth and profitability are not successful or otherwise, and if we are not able to raise adequate additional financing or proceeds from asset sales to continue to fund our ongoing operations, we will need to defer, reduce or eliminate significant planned expenditures, restructure or significantly curtail our operations or sell some of our assets.
Use of Estimates
The preparation of financial statements in conformity with U.S. generally accepted accounting principles (“U.S. GAAP”)GAAP requires management to make estimates and assumptions that affect the reported amounts of assets and liabilities and disclosure of contingent assets and liabilities at the date of the financial statements and the reported amounts of revenues and expenses during the reporting period. Significant estimates made by management include, but are not limited to, those related to revenue recognition, uncollectible receivables, the valuation of investments, valuation of inventory, valuation of deferred tax assets and liabilities, valuation of intangible assets including goodwill and other long-lived assets, recoverability of software development costs.costs, contingencies and share-based compensation expense that results from estimated grant date fair values and vesting of issued equity awards. Actual results could differ from these estimates.
Statement of Cash Flows
The net change in the Company’s book overdraft is presented as an operating activity in the consolidated statement of cash flows. The book overdraft represents a credit balance in the Company’s general ledger but the Company has a positive bank account balance.
Cash and Cash Equivalents
The Company considers all money market funds and short-term investments purchased with original maturities of ninety days or less to be cash equivalents. In connection with our acquisition of Automotive Specialty Accessories and Parts, Inc. and its wholly-owned subsidiary Whitney Automotive Group, Inc. (referred to herein as “WAG”) in August 2010, restricted cash of $319,000 was included in other current assets as of January 1, 2011. The restricted cash was related to collateral paid to the landlord for the sublease of WAG’s corporate offices in Chicago and a security deposit made to a payment processor for online market place transactions. The entire balance of $319,000 was released from the restriction and recorded as cash and cash equivalents in February 2011.
U.S. AUTO PARTS NETWORK, INC. AND SUBSIDIARIES
NOTES TO CONSOLIDATED FINANCIAL STATEMENTS—(Continued)
Fair Value of Financial Instruments
The carrying values of cash and cash equivalents, marketable securities, accounts receivable and accounts payable approximate fair value at January 1, 2011December 29, 2012 and December 31, 2011 due to their short-term maturities. Marketable securities and investments are carried at fair value, as discussed below. Based on the borrowing rates currently available to the Company for bank loans with similar terms and average maturities, the fair value of our long-term debt under credit facilityrevolving loan payable, classified as current liability in our consolidated balance sheet, approximates its carrying amount.amount because the interest rate is variable. If the Company’s revolving loan payable (see“Note 7 – Borrowings”) had been measured at fair value at December 29, 2012, it would be categorized in Level 2 of the fair value hierarchy, as the estimated value would be based on the quoted market prices for the same or similar issues or on the current rates available to the Company for debt of the same or similar terms. Accordingly, financial instruments that are not measured at fair value include accounts receivable, accounts payable and debt. Refer to “Note 3 – Fair Value Measurements” for additional fair value information.
Accounts Receivable and Concentration of Credit Risk
Accounts receivable are stated net of allowance for doubtful accounts. The allowance for doubtful accounts is determined primarily on the basis of past collection experience and general economic conditions. The Company determines terms and conditions for its customers primarily based on the volume purchased by the customer, customer creditworthiness and past transaction history. The allowance for doubtful accounts totaled $0.4 million and $0.2 million at January 1, 2011 and December 31, 2011, respectively.
Concentrations of credit risk are limited to the customer base to which the Company’s products are sold. The Company does not believe significant concentrations of credit risk exist.
Marketable Securities and Investments
Marketable securities and investments arewere comprised of closed-end funds primarily invested in mutual funds and auction rate preferred securities (“ARPS”). As of December 29, 2012, the Company’s investments were primarily comprised of closed-end mutual funds. Mutual funds are classified as short-term investments available-for-sale and mutual funds.recorded at fair market value, based on quoted prices of identical assets that are trading in active markets as of the end of the period for which the values are determined. The Company’s ARPS were fully redeemed at par value during the second quarter of 2012 (further described in Note 3 under the caption “Financial Assets Valued on a Recurring Basis”). The underlying investments in ARPS arewere tax-exempt municipal bonds with maturities of thirty or more years, for which the interest rates are reset through a “Dutch auction” every seven days. In accordance with Accounting Standards Codification (“ASC”) Topic 320Investments – Debt and Equity Securities(“ASC 320”)and based on the Company’s ability to market and sell these instruments, the Company classifiesclassified its ARPS as available-for-sale and carriescarried them at fair value. Mutual funds are classified as short-term investments available-for-sale and recorded at fair market value, based on quoted prices of identical assets that are trading in active markets as of the end of the period for which the values are determined.
During 2008, the Company discounted the fair value of the investment in ARPS for illiquidity in the market as further described in Note 3, under the caption “Financial Assets Valued on a Recurring Basis”. In fiscal 2009, there was an increase in liquidity which was evidenced by redemptions of $2.2 million (33% of the carrying amount at December 31, 2008 balance). For the period from June 30, 2008 to December 31, 2011, we have received partial redemptions at par value on ARPS totaling approximately $5.7 million.
Other-Than-Temporary Impairment
All of the Company’s marketable securities and investments are subject to a periodic impairment review. The Company recognizes an impairment charge when a decline in the fair value of its investments below the cost basis is judged to be other-than-temporary. The Company considers various factors in determining whether to recognize an impairment charge, including the length of time and extent to which the fair value has been less than the Company’s cost basis, the financial condition and near-term prospects of the investee, and the Company’s intent and ability to hold the investment for a period of time sufficient to allow for any anticipated recovery in the market value. No other-than-temporary impairment charges were recorded on any investments during fiscal 2009, 2010year 2012, 2011 and 2011.2010.
Inventory
Inventories consist of finished goods available-for-sale and are stated at the lower of cost or market value, determined using the first in, first outfirst-in first-out (“FIFO”) method. The Company purchases inventory from suppliers both domestically and internationally, and routinely enters into supply agreements with U.S. – based suppliers and its primary drop-ship vendors. The Company believes that its products are generally available from more than one supplier and seeks to maintain multiple sources for its products, both internationally and domestically. The Company primarily purchases products in bulk quantities to take advantage of quantity discounts and to assureensure inventory availability. Inventory is reported at the lower of cost or market, adjusted for slow moving, obsolete or scrap product. Inventory at January 1, 2011December 29, 2012 and December 31, 2011 were $48.1was $42.7 million and $52.2 million, respectively. Additionally, at January 1, 2011 and December 31, 2011, inventoryrespectively, which included items in-transit to our warehouses, in the amount of $4.4$6.4 million and $9.6 million, respectfully.
U.S. AUTO PARTS NETWORK, INC. AND SUBSIDIARIES
NOTES TO CONSOLIDATED FINANCIAL STATEMENTS—(Continued)
respectively.
Website and Software Development Costs
The Company capitalizes certain costs associated with website and software developed for internal use according to ASC 350-50Intangibles – Goodwill and Other – Website Development Costs (“ASC 350-50”) and ASC 350-50350-40Intangibles – Goodwill and Other – Internal-Use Software(“ASC 350-40”), when both the preliminary project design and testing stage are completed and management has authorized further funding for the project, which it deems probable of completion and to be used for the function intended. Capitalized costs include amounts directly related to website and software development such as payroll and payroll-related costs for employees who are directly associated with, and who devote time to, the internal-use software project. Capitalization of such costs ceases when the project is substantially complete and ready for its intended use. The Company capitalized $2.0 million and $15.3 million during fiscal 2010 and 2011, respectively. These amounts are amortized on a straight-line basis over two to fivethree years once the software is placed into use.service. The Company capitalized website and software development costs of $9.1 million and $15.3 million during fiscal year 2012 and 2011, respectively. At January 1, 2011December 29, 2012 and December 31, 2011, our internally developed website and software costcosts amounted to $18.0$42.1 million and $33.2 million, respectively, and the related accumulated amortization and impairment amounted to $10.7$30.2 million and $18.3 million, respectivelyrespectively. During the fourth quarter of 2012, we recorded an impairment loss of $0.9 million (see below for details of impairment charge). The Company did not recognize any impairment loss on website and software development costs for fiscal year 2011 and 2010. Refer to “Note 4).3 – Fair Value Measurements” and “Note 4 – Property and Equipment, Net” for further details.
Long-Lived Assets and Intangibles Subject to Amortization
The Company accounts for the impairment and disposition of long-lived assets, including intangibles subject to amortization, in accordance with ASC 360Property, Plant and Equipment(“ (“ASC 360”). Management assesses potential impairments whenever events or changes in circumstances indicate that the carrying value of an asset or asset group may not be recoverable. An impairment loss will result when the carrying value exceeds the undiscounted cash flows estimated to result from the use and eventual disposition of the asset.asset or asset group. Impairment losses will be recognized in operating results to the extent that the carrying value exceeds the discounted future cash flows estimated to result from the use and eventual disposition of the asset. Weasset or asset group. The Company continually useuses judgment when applying these impairment rules to determine the timing of the impairment tests, undiscounted cash flows used to assess impairments, and the fair value of a potentially impaired asset.asset or asset group. The reasonableness of our judgments could significantly affect the carrying value of our long-lived assets. Based on its analysis, the Company recognized an impairment loss on property and equipment and intangible assets subject to amortization of $1.9 million and $1.7 million, respectively, for fiscal year 2012. Future impairment losses could result if the fair value of the Company’s long lived assets continues to decline. The Company did notrecognizenot recognize any impairment lossesloss on long-lived assets and intangibles subject to amortization for fiscal 2009, 2010year 2011 and 2011.2010. Refer to “Note 3 – Fair Value Measurements”, “Note 4 – Property and Equipment, Net” and “Note 6 – Goodwill and Intangible Assets”for further details.
Goodwill and Indefinite-Lived Intangibles
The Company accounts for goodwill and indefinite-lived intangible assets in accordance with ASC 350-350Intangibles – Goodwill and Other(“ (“ASC 350”). Under ASC 350, goodwill and intangible assets with indefinite lives are not amortized but are tested for impairment annually or more frequently if events or circumstances occur that would indicate a reduction in fair value. In addition, we identified two reporting units, Base USAP, which is the Company identified a single reporting unit (the Company itself)core auto parts business, and AutoMD, an online automotive repair source, (refer to “Segment Data” below) in accordance with ASC 280-280Segment Reporting. We identified AutoMD as a reporting unit for purposes of the goodwill impairment testing and no impairment charge was recorded related to this reporting unit. The results of the impairment testing discussed below refer solely to Base USAP. The goodwill impairment test is a two-step impairment test. The first step compares the fair value of each reporting unit with its carrying amount including goodwill. The Company estimates the fair value of the reporting unit based on an equal weighting of two market approaches and anthe income approach, which utilizes discounted future cash flows. Assumptions critical to the fair value estimates under the discounted cash flow model include discount rates (13.0% was used in fiscal year 2012), cash flow projections, projected long-term growth rates and the determination of terminal values. The market approaches utilizedapproach is used as a test of reasonableness to corroborate the income approach. The market approach utilizes market multiples of invested capital from 1) comparable publicly traded companies and 2) comparable transactions.in similar lines of business. The market multiples from invested capital include revenues, total assets, book equity plus debt and earnings before interest, taxes, depreciation and amortization (“EBITDA”). Assumptions critical
During the fourth quarter of 2012, the Company identified adverse events related to the Company’s overall financial performance, including the continued downward trend in the Company’s revenues and negative cash flows from operations, and a sustained decline in the Company’s share price, that would more likely than not reduce the fair value estimates under the discounted cash flow model include discount rates, cash flow projections, projected long-term growth rates and the determination of terminal values. Management has performed a sensitivity analysis on its significant assumptions and has determined that a change in its assumptions within selected sensitivity testing levels would not impact its conclusion.our reporting units below their carrying amounts. The excess of faircarrying value over carryingfair value for our reporting unit as of October 31, 2011,2012, the annual testing date, was approximately $50 million, and there would have to be a 38% decrease in the estimated fair value of the reporting unit to fail step 1.$21.8 million. If the carrying amount exceeds the estimated fair value, then the second step of the impairment test is performed to measure the amount of any impairment loss. Impairmentloss and the impairment losses will be recognized in operating results. Current guidance, adoptedTherefore, the Company performed the second step of the goodwill impairment test to measure the amount of impairment loss. The second step compares the implied fair value of goodwill with the carrying amount of goodwill. The implied fair value of goodwill is determined in the fourth quartersame manner as the amount of fiscal 2011, provides the option to first assess qualitative factors to determine whether the existencegoodwill recognized in a business combination. The excess of events or circumstances leads to a determination that it is more likely than not that the fair value of a reporting unit over the amounts assigned to its assets and liabilities is less thanthe implied fair value of goodwill. Based on its analysis, the Company recognized an impairment loss on goodwill of $18.9 million, which represented the carrying amount. If, after assessingvalue of its goodwill as of October 31, 2012. No impairment loss on goodwill was recognized for fiscal year 2011 and 2010. For indefinite lived intangible assets, the totality of events or circumstances, an entity determines it is not more likely than not thatCompany utilized the royalty savings method to determine the fair value of a reporting unit is less than its carrying amount, then performing the two-step impairment test is unnecessary. We opted to continue to perform the step one testtrade name intangible assets using discounted rate of 15.0% and 18.5% for fiscal year 2012 and 2011, as discussed above. Werespectively, and royalty rate of 0.1% and 1.0%, respectively for fiscal year 2012 and 2011, respectively. During the fourth quarter of 2012 and 2011, we recorded an impairment loss on indefinite lived intangible assets totaling $3.9 million and $5.1 million.The Company did not recognize any impairment loss on goodwill and indefinite-lived intangiblesindefinite lived intangible assets for fiscal 2009 andyear 2010. During 2011, we recorded a non-cash impairment charge on certain WAG trade name intangible assets totaling $5.1 million as further described inRefer to“Note 6-3- Fair Value Measurements”and “Note 6 – Goodwill and Intangibles”.Intangible Assets”for additional details.
U.S. AUTO PARTS NETWORK, INC. AND SUBSIDIARIES
NOTES TO CONSOLIDATED FINANCIAL STATEMENTS—(Continued)
Deferred Catalog Expenses
Deferred catalog expenses consist of third-party direct costs including primarily creative design, paper, printing, postage and mailing costs for all Company direct response catalogs. Such costs are capitalized as deferred catalog expenses and are amortized over their expected future benefit period. Each catalog is fully amortized within nine months. Deferred catalog expenses are included in other current assets and amounted to $1.0$0.7 million and $0.7 million at January 1, 2011December 29, 2012 and December 31, 2011, respectively.
Deferred Financing Costs
In August 2010, the Company entered into a credit facility with Silicon Valley Bank. The credit facility is comprised of a $25 million term loan and a $10 million revolving line of credit. In connection with the credit facility, the Company paid $0.5 million in fees. These fees were recorded as deferred financing costs in other current assets and other non-current assets. Deferred financing costs are being amortized over the life of the loan using the straight-line method as it is not significantly different from effective interest method. As of January 1, 2011 and December 31, 2011, the remaining deferred financing costs were $0.4 million and $0.3 million, respectfully.
Revenue Recognition
From the Company’s inception of business through the first quarter of fiscal 2010, theThe Company recognizedrecognizes revenue from product sales and shipping revenues, net of promotional discounts and return allowances, when the following four revenue recognition criteria wereare met: persuasive evidence of an arrangement exists, both title and risk of loss or damage have transferred, delivery has occurred, (to the common carrier), the selling price is fixed or determinable, and collectability is reasonably assured. These criteria followed the Company’s general policy to recognize revenue according to its shipping terms, which were F.O.B. shipping point. Under this policy, title and risk of loss were transferred to the customer upon delivery to the common carrier, at which time, revenue was recognized.
Although the Company had no legal obligation to compensate the customer, the Company generally replaced the product or reimbursed the customer for goods that were lost or damaged in transit and filed a claim to the common carrier for reimbursement for such loss. The Company executed a new pricing agreement with its primary carrier which offered a lower price per delivery and eliminated the Company’s option to file reimbursement claims for product lost or damaged in transit. As a result of this agreement, the Company determined thatretains the risk of loss or damage during transit, would be retained by the Company. Therefore, the Company determined thattherefore, revenue from product sales should beis recognized at the delivery date to customer, not upon shipment. Return allowances, which reduce product revenue by the ship date.
This change in the second quarterCompany’s best estimate of fiscal 2010 resulted in a deferral of $2.0 million of sales revenue and a decrease in cost of goods sold of $1.5 million, which reduced gross profit by $411,000. The Company has recognized revenue upon delivery to the customer starting the second quarter of fiscal 2010.expected product returns, are estimated using historical experience.
Revenue from sales of advertising is recorded when performance requirements of the related advertising program agreement are met. DuringFor fiscal 2009,year ended 2012, 2011 and 2010, and 2011, the advertising revenue represented approximately 1%, 1%2% and 2%1% of our total revenue, respectively.
The Company evaluates the criteria of ASC 605-45 –Revenue Recognition Principal Agent Considerations in determining whether it is appropriate to record the gross amount of product sales and related costs or the net amount earned as commissions. Generally, when the Company is the primary party obligated in a transaction, the Company is subject to inventory risk, has latitude in establishing prices and selecting suppliers, or has several but not all of these indicators, revenue is recorded at gross.
Product sales and shipping revenues, net of promotional discounts and return allowances, are recorded when the products are delivered and title passes to customers. Retail items sold to customers are made pursuant to terms and conditions that provide for transfer of both title and risk of loss upon our delivery to the customer. Return allowances, which reduce product revenue by the Company’s best estimate of expected product returns, are estimated using historical experience.
Payments received prior to the delivery of goods to customers are recorded as deferred revenue.
The Company periodically provides incentive offers to its customers to encourage purchases. Such offers include current discount offers, such as percentage discounts off current purchases and other similar offers. Current discount offers, when accepted by the Company’s customers, are treated as a reduction to the purchase price of the related transaction.
U.S. AUTO PARTS NETWORK, INC. AND SUBSIDIARIES
NOTES TO CONSOLIDATED FINANCIAL STATEMENTS—(Continued)
Sales discounts are recorded in the period in which the related sale is recognized. Sales return allowances are estimated based on historical amounts and are recorded upon recognizing the related sales. Credits are issued to customers for returned products. Credits for returned products amounted to $19.0$30.4 million, $25.7$30.1 million, and $30.1$25.7 million for fiscal 2009,year 2012, 2011 and 2010, and 2011, respectively.
No customer accounted for more than 10% of the Company’s net sales in the past three years.sales.
The following table provides an analysis of the reserve for sales returns and the reserve for doubtful accounts:accounts (in thousands):
(In thousands) | Balance at Beginning of Period | Charged to Revenue, Cost or Expenses | Deductions | Balance at End of Period | ||||||||||||
Fifty-Two Weeks Ended January 2, 2010 | ||||||||||||||||
Reserve for sales returns | $ | 662 | $ | 19,295 | $ | (19,000 | ) | $ | 957 | |||||||
Reserve for doubtful accounts | 115 | 27 | (7 | ) | 135 | |||||||||||
Fifty-Two Weeks Ended January 1, 2011 | ||||||||||||||||
Reserve for sales returns | $ | 957 | $ | 26,034 | $ | (25,675 | ) | $ | 1,316 | |||||||
Reserve for doubtful accounts | 135 | 380 | (143 | ) | 372 | |||||||||||
Fifty-Two Weeks Ended December 31, 2011 | ||||||||||||||||
Reserve for sales returns | $ | 1,316 | $ | 30,527 | $ | (30,117 | ) | $ | 1,726 | |||||||
Reserve for doubtful accounts | 372 | 87 | (276 | ) | 183 | |||||||||||
Interest Income (Expense)
Interest income consists primarily of interest income on investments. Interest expense consists primarily of interest expense on our outstanding loan balance and capital leases.
Other Income
Other income consists of miscellaneous income such as gain from disposition of assets.
| Balance at Beginning of Period | Charged to Revenue, Cost or Expenses | Deductions | Balance at End of Period | |||||||||||||
Fifty-Two Weeks Ended December 29, 2012 | ||||||||||||||||
Reserve for sales returns | $ | 1,726 | $ | 30,058 | $ | (30,420 | ) | $ | 1,364 | |||||||
Reserve for doubtful accounts | 183 | 247 | (209 | ) | 221 | |||||||||||
Fifty-Two Weeks Ended December 31, 2011 | ||||||||||||||||
Reserve for sales returns | $ | 1,316 | $ | 30,527 | $ | (30,117 | ) | $ | 1,726 | |||||||
Reserve for doubtful accounts | 372 | 87 | (276 | ) | 183 | |||||||||||
Fifty-Two Weeks Ended January 1, 2011 | ||||||||||||||||
Reserve for sales returns | $ | 957 | $ | 26,034 | $ | (25,675 | ) | $ | 1,316 | |||||||
Reserve for doubtful accounts | 135 | 380 | (143 | ) | 372 | |||||||||||
Cost of Goods SoldSales
Cost of goods soldsales consists of the direct costs associated with procuring parts from suppliers and delivering products to customers. These costs include direct product costs, purchase discounts, outbound freight and shipping costs, warehouse supplies and warranty costs. The Company includes freightcosts, partially offset
by purchase discounts and shipping costs in cost of goods sold.cooperative advertising. Total freight and shipping expense included in cost of goods soldsales for fiscal 2009,year 2012, 2011 and 2010 and 2011 was $19.2$39.7 million, $31.6$41.1 million, and $41.1$31.6 million, respectively. Depreciation and amortization expenses are excluded from cost of goods soldsales and included in marketing, general and administrative and fulfillment costsexpenses as noted below.
Warranty Costs
The Company or the vendors supplying itits products provide the Company’s customers limited warranties on certain products that range from 30 days to lifetime. In most cases, the Company’s vendors are the party primarily responsible for warranty claims. Standard product warranties sold separately by the Company are recorded as deferred revenue and recognized ratably over the life of the warranty, ranging from one to five years. Since May 2010, weThe Company also offeroffers extended warranties withthat are imbedded in the price of selected brandedprivate label products we sell. The product brands that include the extended warranty coverage are offered at three different service levels: (a) a five year unlimited product replacement, (b) a five year one-time product replacement, and (c) a three year one-time product replacement. Warranty costs relating to merchandise sold under warranty not covered by vendors are estimated and recorded as warranty obligations at the time of sale based on each product’s historical return rate and historical warranty cost. During the second quarter of 2012, the Company updated its estimate of warranty obligations which resulted in a reduction to warranty liabilities of $232,000. The standard and extended warranty obligations are recorded as warranty liabilities and included in other current liabilities in the Consolidated Balance Sheets. For the fiscal 2010year 2012 and 2011, the activity in our aggregate warranty liabilities was as follows:follows (in thousands):
| January 1, 2011 | December 31, 2011 | |||||||
| (in thousands) | ||||||||
Warranty liabilities, beginning of period | $ | 89 | $ | 154 | ||||
Adjustments to preexisting warranty liabilities | — | — | ||||||
Additions to warranty liabilities | 134 | 352 | ||||||
Reductions to warranty liabilities | (69 | ) | (122 | ) | ||||
|
|
|
| |||||
U.S. AUTO PARTS NETWORK, INC. AND SUBSIDIARIES
NOTES TO CONSOLIDATED FINANCIAL STATEMENTS—(Continued)
| January 1, 2011 | December 31, 2011 | |||||||
| (in thousands) | ||||||||
Warranty liabilities, end of period | $ | 154 | $ | 384 | ||||
|
|
|
| |||||
| December 29, 2012 | December 31, 2011 | |||||||
Warranty liabilities, beginning of period | $ | 384 | $ | 154 | ||||
Adjustments to preexisting warranty liabilities | (232 | ) | — | |||||
Additions to warranty liabilities | 248 | 352 | ||||||
Reductions to warranty liabilities | (118 | ) | (122 | ) | ||||
|
|
|
| |||||
Warranty liabilities, end of period | $ | 282 | $ | 384 | ||||
|
|
|
| |||||
Marketing Expense
Marketing costs, including advertising, are expensed as incurred. The majority of marketingadvertising expense is paid to internet search engine service providers and internet commerce facilitators. For fiscal 2009,year 2012, 2011 and 2010, and 2011, the Company recognized advertising costs of $11.4$21.1 million, $16.5$28.5 million and $22.4$19.1 million, respectively. Marketing costs also include depreciation and amortization expense and share-based compensation expense.
General and Administrative Expense
General and administrative expense consistconsists primarily of administrative payroll and related expenses, merchant processing fees, legal and professional fees and other administrative costs. General and administrative expense also includes depreciation and amortization expense and share-based compensation expense.
Fulfillment Expense
Fulfillment costs consistexpense consists primarily of payroll and related costs associated with warehouse employees facilityand the Company’s purchasing group, facilities rent, building maintenance, depreciation and other costs associated with inventory management and wholesale operations. Fulfillment costsexpense also include depreciation and amortization expense andincludes share-based compensation expense.
Technology Expense
Technology expenses consistexpense consists primarily of payroll and related expenses of our information technology personnel, the cost of hosting the Company’s servers, communications expenses and Internet connectivity costs, associated with computer support information technology,and software development and connectivity.amortization expense. Technology expensesexpense also includeincludes share-based compensation expense.
Comprehensive IncomeShare-Based Compensation
The Company reports comprehensive incomeaccounts for share-based compensation in accordance with ASC 220718Comprehensive IncomeCompensation – Stock Compensation(“ASC 718”). Accumulated otherAll stock options issued to employees are recognized as share-based compensation expense in the financial statements based on their respective grant date fair values, and are recognized within the statement of comprehensive income includes net income or loss foreign currency translation adjustments relatedas marketing, general and administrative, fulfillment or technology expense, based on employee departmental classifications. Under this standard, the fair value of each share-based payment award is estimated on the date of grant using an option pricing model that meets certain requirements. The Company currently uses the Black-Scholes option pricing model to estimate the fair value of share-based payment
awards, with the exception of options granted containing market conditions (none in fiscal year 2012, 2011 and 2010), for which the Company estimates the fair value using a Monte Carlo model. The determination of the fair value of share-based payment awards utilizing the Black-Scholes and Monte Carlo model is affected by the Company’s stock price and a number of assumptions, including expected volatility, expected life, risk-free interest rate and expected dividends.
Prior to January 1, 2012, the Company estimated volatility using the historical volatilities of similar public entities. Due to the limited period of time the Company’s foreign operationsequity shares had been publicly traded, the Company did not have sufficient historical market price data to provide a reasonable basis upon which to estimate volatility. As of January 1, 2012, the Company has incorporated its own historical volatility into the grant-date fair value calculations. The Company’s historical volatility was not materially different than the estimates applied to past award fair value calculations. The expected term of an award is based on combining historical exercise data with expected weighted time outstanding. Expected weighted time outstanding is calculated by assuming the settlement of outstanding awards is at the midpoint between the remaining weighted average vesting date and unrealized gainsthe expiration date. Prior to January 1, 2012, the expected life of an award was estimated using the “simplified” method as provided in ASC 718. Under this method, the expected life equals the arithmetic average of the vesting term and lossesthe original contractual term of the award. The Company used the simplified method as it did not have sufficient historical exercise data to provide a reasonable basis upon which to estimate an expected term. The risk-free interest rate assumption is based on observed interest rates appropriate for the expected life of awards. The dividend yield assumption is based on the Company’s expectation of paying no dividends. Forfeitures are estimated at the time of grant and revised, if necessary, in subsequent periods if actual forfeitures significantly differ from investments in ARPS that hold tax-exempt municipal bondsthose estimates. The Company considers many factors when estimating expected forfeitures, including employee class, economic environment, and investments in mutual funds that hold debt securities.
Leaseshistorical experience.
The Company analyzes lease agreementsaccounts for operating versus capital lease treatmentequity instruments issued in exchange for the receipt of services from non-employee directors in accordance with the provisions of ASC 718. The Company accounts for equity instruments issued in exchange for the receipt of goods or services from other than employees in accordance with ASC 840505-50LeasesEquity-Based Payments to Non-Employees.. Rent expense for leases designated as operating is expensed on a straight-line basis over Costs are measured at the termestimated fair market value of the lease.consideration received or the estimated fair value of the equity instruments issued, whichever is more reliably measurable. The value of equity instruments issued for consideration other than employee services is determined on the earlier of a performance commitment or completion of performance by the provider of goods or services. Equity instruments awarded to non-employees are periodically re-measured as the underlying awards vest unless the instruments are fully vested, immediately exercisable and non-forfeitable on the date of grant.
Foreign Currency TranslationOther Income, net
For eachOther income, net consists of the Company’s foreign subsidiaries, the functional currency is its local currency. Assetsmiscellaneous income or expense such as gains/losses from disposition of assets, and liabilitiesinterest income comprised primarily of foreign operations are translated into U.S. dollars using the current exchange rates,interest income on investments.
Interest Expense
Interest expense consists primarily of interest expense on our outstanding loan balance, deferred financing cost amortization, and revenues and expenses are translated into U.S. dollars using average exchange rates. The effects of the foreign currency translation adjustments are included as a component of accumulated other comprehensive income (loss) in stockholders’ equity.capital lease interest.
Income Taxes
The Company accounts for income taxes in accordance with ASC 740Income Taxes(“ASC 740”). Under ASC 740, deferred tax assets and liabilities are recognized for the future tax consequences attributable to temporary differences between the financial statement carrying amount of existing assets and liabilities and their respective tax bases. Deferred tax assets and liabilities are measured using enacted tax rates expected to apply to taxable income in the years in which those temporary differences are expected to be recovered or settled. When appropriate, a valuation allowance is established to reduce deferred tax assets, which include tax credits and loss carry forwards, to the amount that is more likely than not to be realized. In making such determination, the Company considers all available positive and negative evidence, including future reversals of existing taxable temporary differences, future taxable income exclusive of reversing temporary differences and carryforwards, taxable income in prior carryback years, tax planning strategies and recent financial operations.
U.S. AUTO PARTS NETWORK, INC. AND SUBSIDIARIES
NOTES TO CONSOLIDATED FINANCIAL STATEMENTS—(Continued)
Prior to the acquisition of WAG, the Company concluded that it was more likely than not that we would realize the deferred tax assets in all jurisdictions. However, with the acquisition of WAG in 2010, based largely on the weight of the combined cumulative three-year adjusted loss position, it was determined that it was not more likely than not that the Company would realize its net deferred tax assets. Therefore, a valuation allowance of $18.3 million was recorded as of January 1, 2011, of which $4.7 million was recorded against the acquired deferred tax assets of WAG as of August 12, 2010. Based on the same determination, a valuation allowance of $5.7 million was recorded during 2011, resulting in a valuation allowance balance of $22.8 million as of December 31, 2011.
The Company utilizes a two-step approach to recognizing and measuring uncertain tax positions. The first step is to evaluate the tax position for recognition by determining if the weight of available evidence indicates it is more likely than not that the position will be sustained on audit, including resolution of related appeals or litigation processes. The second step is to measure the tax benefit as the largest amount which is more than 50% likely of being realized upon ultimate settlement. We considerThe Company considers many factors when evaluating and estimating our tax positions and tax benefits, which may require periodic adjustments and which may not accurately forecast actual outcomes. As of December 31, 2011,29, 2012, the Company had no material unrecognized tax benefits, interest or penalties related to federal and state income tax matters. The Company’s policy is to record interest and penalties as income tax expense.
Share-Based CompensationLeases
The Company accountsanalyzes lease agreements for share-based compensationoperating versus capital lease treatment in accordance with ASC 718840Compensation – Stock CompensationLeases. All stock options issued to employees are recognizedRent expense for leases designated as share-based compensation expense in the financial statements based on their respective grant date fair values, and are recognized within the statement of operations as general and administrative, marketing, fulfillment or technology, based on employee departmental classifications.
Under this standard, the fair value of each share-based payment awardoperating lease is estimated on the date of grant using an option pricing model that meets certain requirements. The Company currently uses the Black-Scholes option pricing model to estimate the fair value of share-based payment awards, with the exception of options granted containing market conditions, which the Company estimates the fair value using a Monte Carlo model. The determination of the fair value of share-based payment awards utilizing the Black-Scholes and Monte Carlo models is affected by the Company’s stock price and a number of assumptions, including expected volatility, expected life, risk-free interest rate and expected dividends.
The Company estimates volatility using historical volatilities of similar public entities. The expected life of the awards is basedexpensed on a simplified method that definesstraight-line basis over the life as the average of the contractual term of the options and the weighted average vesting period for all open tranches. Prior to our initial public offering in February 2007, we did not have a historylease.
Foreign Currency Translation
For each of market prices of our common stock. Due to the limited period time our equity shares have been publicly traded, we do not have sufficient historical exercise data to provide a reasonable basis upon which to estimate volatility and expected term. The risk-free interest rate assumption is based on observed interest rates appropriate for the expected life of awards. The dividend yield assumption is based on the Company’s expectationforeign subsidiaries, the functional currency is its local currency. Assets and liabilities of paying no dividends. Forfeituresforeign operations are estimated attranslated into U.S. dollars using the timecurrent exchange rates, and revenues and expenses are translated into U.S. dollars using average exchange rates. The effects of grant and revised, if necessary,the foreign currency translation adjustments are included as a component of accumulated other comprehensive income or loss in subsequent periods if actual forfeitures significantly differ from those estimates. The Company considers many factors when estimating expected forfeitures, including employee class, economic environment, and historical experience.the Company’s consolidated balance sheets.
The Company accounts for equity instruments issued in exchange for the receipt of services from non-employee directors in accordance with the provisions of ASC 718.Comprehensive Income
The Company accounts for equity instruments issued in exchange for the receipt of goodsreports comprehensive income or services from other than employeesloss in accordance with ASC 505-50220Equity-Based PaymentsComprehensive Income. Accumulated other comprehensive income or loss, included in the Company’s consolidated balance sheets, includes foreign currency translation adjustments related to Non-Employees. Costs are measured at the estimated fair market valueCompany’s foreign operations, and unrealized holding gains and losses from available-for-sale marketable securities and investments. The Company presents the components of the consideration receivednet income or the estimated fair valueloss and other comprehensive income or loss, in its consolidated statements of the equity instruments issued, whichever is more reliably measurable. The value of equity instruments issued for consideration other than employee services is determined on the earlier of a performance commitmentcomprehensive income or completion of performance by the provider of goods or services. Equity instruments awarded to non-employees are periodically re-measured as the underlying awards vest unless the instruments are fully vested, immediately exercisable and non-forfeitable on the date of grant.loss.
Segment Data
The Company operates in onea single reportable segment and reporting revenues by product line or geographic location is impracticable. Certain long-lived assets are held in the Philippines refer(refer to “Note“Note 4 – Property and Equipment, Net”). The criteria the Company used to identify ourits reporting segment are primarily the nature of the products the Company sells and the consolidated operating results that are regularly reviewed by the Company’s chief operating decision maker to assess performance and make operating decisions.
U.S. AUTO PARTS NETWORK, INC. AND SUBSIDIARIES
NOTES TO CONSOLIDATED FINANCIAL STATEMENTS—(Continued)
We identified two reporting units, Base USAP, which is the core auto parts business, and AutoMD, an online automotive repair source, in accordance with ASC 280 Segment Reporting. However, AutoMD is considered not material by the Company and did not meet the quantitative thresholds for a reportable segment, thus no segment reporting disclosures were presented.
Recent Accounting Pronouncements
In October 2009,May 2011, the Financial Accounting Standards Board (“FASB”) issued Accounting Standards Update (“ASU”) No. 2009-13,Revenue Arrangements with Multiple Deliverables, which amends ASC Topic 605, which modifies the accounting for multiple deliverable revenue arrangements to enable vendors to account for deliverables separately rather than as a combined unit. The Company adopted this ASU on January 2, 2011. The adoption did not have a material effect on the consolidated financial statements.
In January 2010, the FASB issued ASU No. 2010-6,Improving Disclosures About Fair Value Measurements, which requires reporting entities to make new disclosures about recurring or nonrecurring fair-value measurements including significant transfers into and out of Level 1 and Level 2 fair-value measurements and information on purchases, sales, issuances and settlements on a gross basis in the reconciliation of Level 3 fair-value measurements. This ASU was effective for annual reporting periods beginning after December 15, 2009, except for Level 3 reconciliation disclosures which were effective for annual periods beginning after December 15, 2010. The adoption of this ASU did not have a material effect on the consolidated financial statements.
In December 2010, the FASB issued ASU No. 2010-29,Disclosure of Supplementary Pro Forma Information for Business Combinations (“ASU 2010-29”), an update to ASC Topic 805,Business Combinations (“ASC 805”). The amendments in ASU 2010-29 specify that if a public entity presents comparative financial statements, the entity should disclose revenue and earnings of the combined entity as though the business combination(s) that occurred during the current year had occurred as of the beginning of the comparable prior annual reporting period only. The amendments in ASU 2010-29 also expand the supplemental pro forma disclosures under ASC 805 to include a description of the nature and amount of material, nonrecurring pro forma adjustments directly attributable to the business combination included in the reported pro forma revenue and earnings. The amendments are effective prospectively for business combinations for which the acquisition date is on or after the beginning of the first annual reporting period beginning on or after December 15, 2010. The Company will apply the provisions of ASU 2010-29 to future acquisitions which occur after January 2, 2011. The Company believes that the adoption will not have a material effect on the Company’s consolidated financial statements.
In May 2011, the FASB issued ASU No. 2011-04,Amendments to Achieve Common Fair Value Measurement and Disclosure Requirements in U.S. GAAP and IFRSs (“ASU 2011-04”), an update to ASC Topic 820Fair Value Measurement(“ (“ASC 820”). The amendments in ASU 2011-04 are the result of joint efforts by the FASB and International Accounting Standards Board to develop a single, converged fair value framework and provide converged guidance on how to measure fair value and on what disclosures to provide about fair value measurements. While ASU 2011-04 is largely consistent with existing fair value measurement principles in U.S. GAAP, it expands ASC 820’s existing disclosure requirements for fair value measurements and makes other amendments. Many of these amendments were made to eliminate unnecessary wording differences between U.S. GAAP and International Financial Reporting Standards (“IFRS”). However, some could change how the fair value measurement guidance in ASC 820 is applied. For public entities, amendments are effective for interim and annual periods beginning after December 15, 2011. The Company will adoptadopted the provisions of ASU 2011-04 on January 1, 2012, the starting date of its fiscal year ending December 29, 2012. The Company believes that the adoption willdid not have a material effectimpact on the Company’s consolidated financial statements.
In June and December 2011, the FASB issued two ASU’sASU No. 2011-05 which amendamended the guidance for the presentation of comprehensive income, an update to ASC Topic 220Comprehensive Income. The amended guidance requires an entity to present components of net income and other comprehensive income in one continuous statement, referred to as the statement of comprehensive income, or in two separate, but consecutive statements. The current option to report other comprehensive income and its components in the statement of stockholders’ equity will behas been eliminated. Although the new guidance changes the presentation of comprehensive income, there are no changes to the components that are recognized in net income or other comprehensive income under existing guidance. These ASU’s are effective forThe ASU was adopted by the Company on January 1, 2012 and retrospective application will be required. These ASU’s will changechanged our financial statement presentation of comprehensive incomeoperations, to one continuous statement, but willdid not impact ourthe Company’s net income,loss, financial position, or cash flows.
In September 2011,February 2013, the FASB issued ASU No. 2011-08,Testing Goodwill for Impairment (“ASU 2011-08”), an update2013-02 to ASC 350. Underimprove the amendments in ASU 2011-08, an entity hasreporting reclassifications out of accumulated other comprehensive income of various components. The guidance requires presentation of significant amounts reclassified from each component of accumulated other comprehensive income and the option to first assess qualitative factors to determine whetherincome statement line items affected by the existence of events or circumstances leads to a determination that it is more likely than not thatreclassification either parenthetically on the fair value of a reporting unit is less than its carrying amount. If, after assessing the totality of events or circumstances, an entity determines it is not more likely than not
U.S. AUTO PARTS NETWORK, INC. AND SUBSIDIARIES
NOTES TO CONSOLIDATED FINANCIAL STATEMENTS—(Continued)
that the fair value of a reporting unit is less than its carrying amount, then performing the two-step impairment test is unnecessary. However, if an entity concludes otherwise, then it is required to perform the first stepface of the two-step impairment test by calculatingfinancial statements or in the fair value of the reporting unit and comparing the fair value with the carrying amount of the reporting unit, as described in paragraph 350-20-35-4. If the carrying amount of a reporting unit exceeds its fair value, then the entity is required to perform the second step of the goodwill impairment test to measure the amount of the impairment loss, if any, as described in paragraph 350-20-35-9. ASU 2011-08notes. This guidance is effective for annualfiscal years, and interim goodwill impairment tests performed for fiscalperiods within those years, beginning after December 15, 2011. Early adoption is permitted, including for annual and interim goodwill impairment tests performed as of a date before September 15, 2011, if an entity’s financial statements for the most recent annual or interim period have not yet been issued.31, 2012. The Company adoptedbelieves that the provisions of ASU 2011-08 on October 2, 2011, the starting dateadoption of the fourth quarter of its fiscal year ending December 31, 2011. The adoption didamendments will not have a material effectimpact on the Company’s consolidated financial statements.
In December 2011, the FASB issued ASU No. 2011-11,Balance Sheet (Topic 210): Disclosures about Offsetting Assets and Liabilities. The amendments in this ASU require an entity to disclose information about offsetting and related arrangements to enable users of its financial statements to understand the effect of those arrangements on its financial position. The objective of this disclosure is to facilitate comparison between those entities that prepare their financial statements on the basis of U.S. GAAP and those entities that prepare their financial statements on the basis of IFRS. An entity is required to apply the amendments for annual reporting periods beginning on or after January 1, 2013, and interim periods within those annual periods. An entity should provide the disclosures required by those amendments retrospectively for all comparative periods presented. The Company believes that the adoption of the amendments will not have a material effectimpact on the Company’s consolidated financial statements.
U.S. AUTO PARTS NETWORK, INC. AND SUBSIDIARIES
NOTES TO CONSOLIDATED FINANCIAL STATEMENTS—(Continued)
Note 2 – Investments
As of January 1, 2011,December 29, 2012, the Company held the following securities and investments, recorded at fair value (in thousands):
| Amortized Cost | Unrealized | Fair Value | ||||||||||||||
| Gains | Losses | |||||||||||||||
Auction rate preferred securities in municipal and state agencies (1) | $ | 4,225 | $ | — | $ | (84 | ) | $ | 4,141 | |||||||
Mutual funds(2) | 1,070 | — | (8 | ) | 1,062 | |||||||||||
|
|
|
|
|
|
|
| |||||||||
Total | $ | 5,295 | $ | — | $ | (92 | ) | $ | 5,203 | |||||||
|
|
|
|
|
|
|
| |||||||||
| Amortized Cost | Unrealized | Fair Value | ||||||||||||||
| Gains | Losses | |||||||||||||||
Mutual funds(1) | $ | 110 | $ | — | $ | — | $ | 110 | ||||||||
|
|
|
|
|
|
|
| |||||||||
As of December 31, 2011, the Company held the following securities and investments, recorded at fair value (in thousands):
| Amortized Cost | Unrealized | Fair Value | ||||||||||||||
| Gains | Losses | |||||||||||||||
Auction rate preferred securities in municipal and state agencies (1) | $ | 2,125 | $ | — | $ | (21 | ) | $ | 2,104 | |||||||
Mutual funds(2) | 1,011 | 114 | — | 1,125 | ||||||||||||
|
|
|
|
|
|
|
| |||||||||
Total | $ | 3,136 | $ | 114 | $ | (21 | ) | $ | 3,229 | |||||||
|
|
|
|
|
|
|
| |||||||||
| Amortized Cost | Unrealized | Fair Value | ||||||||||||||
| Gains | Losses | |||||||||||||||
Mutual funds(1) | $ | 1,011 | $ | 114 | $ | — | $ | 1,125 | ||||||||
Auction rate preferred securities in municipal and state agencies (2) | 2,125 | — | (21 | ) | 2,104 | |||||||||||
|
|
|
|
|
|
|
| |||||||||
Total | $ | 3,136 | $ | 114 | $ | (21 | ) | $ | 3,229 | |||||||
|
|
|
|
|
|
|
| |||||||||
| (1) |
|
Mutual funds are classified as short-term investments available-for-sale and recorded at fair market value, based on quoted prices of identical assets that are trading in active markets as of the end of the period for which the values are determined. |
| (2) | Auction rate preferred securities in municipal and state agencies with maturities of 15 to 30 years were classified as investments available-for-sale and recorded at fair value. During the second quarter of 2012, the remaining securities balance at December 31, 2011 was fully redeemed. As of December 31, 2011, these securities were held in two tax-exempt municipal bonds managed under closed-end funds and were classified as long-term investments. Refer to additional information in Note 3 under the caption “Financial Assets Valued on a Recurring Basis”. |
Proceeds from the sale of available-for-sale securities are disclosed separately in the accompanying consolidated statements of cash flow. For fiscal 2009,year 2012, the Company recognized noa gross realized gain and losses.loss of $4,000. For fiscal year 2011, the Company recognized a gross realized loss of $3,000. For fiscal year 2010, the Company recognized gross realized gains and losses of $27,000 and $8,000, respectively. For fiscal 2011, the Company recognized gross realized gains and losses of zero and $3,000, respectively.
Note 3 – Fair Value Measurements
Fair value is defined as an exit price representing the amount that would be received to sell an asset or paid to transfer a liability in an orderly transaction between market participants. As such, fair value is a market-based measurement that should be determined based on assumptions that market participants would use in pricing an asset or liability.
Provisions of ASC 820 establish a three-tier fair value hierarchy, which prioritizes the inputs used in measuring fair value. These tiers include:
Level 1 – Observable inputs such as quoted prices in active markets;
Level 2 – Inputs other than quoted prices in active markets that are either directly or indirectly observable; and
Level 3 – Unobservable inputs in which little or no market data exists, therefore, requiring an entity to develop its own assumptions.
U.S. AUTO PARTS NETWORK, INC. AND SUBSIDIARIESWe measure our financial assets and liabilities at fair value on a recurring basis using the following valuation techniques:
NOTES TO CONSOLIDATED FINANCIAL STATEMENTS—(Continued)
(b) Income Approach – uses valuation techniques to convert future estimated cash flows to a single present amount based on current market expectations about those future amounts, using present value techniques.
Financial Assets Valued on a Recurring Basis
As of January 1, 2011December 29, 2012 and December 31, 2011, the Company held certain assets that are required to be measured at fair value on a recurring basis. These included the Company’s financial instruments, including investments associated withcash and cash equivalents and investments. The following table represents our fair value hierarchy and the ARPS. The Company measures the followingvaluation techniques used for financial assets measured at fair value on a recurring basis. The fair value of these financial assets was determined using the following inputs at January 1, 2011 and December 31, 2011basis (in thousands):
| As of January 1, 2011 | ||||||||||||||||||||||||||||||||||
| Total | Level 1 | Level 2 | Level 3 | As of December 29, 2012 | ||||||||||||||||||||||||||||||
| Total | Level 1 | Level 2 | Level 3 | Valuation Techniques | ||||||||||||||||||||||||||||||
Assets: | ||||||||||||||||||||||||||||||||||
Cash and cash equivalents(1) | $ | 17,595 | $ | 17,595 | $ | — | $ | — | $ | 1,030 | $ | 1,030 | $ | — | $ | — | (a) | |||||||||||||||||
Short-term investments(2) | 1,062 | 1,062 | — | — | ||||||||||||||||||||||||||||||
Non-current investments available-for-sale(3) | 4,141 | — | — | 4,141 | ||||||||||||||||||||||||||||||
Investments – mutual funds(2) | 110 | 110 | — | — | (a) | |||||||||||||||||||||||||||||
|
|
|
|
|
|
|
| |||||||||||||||||||||||||||
| $ | 22,798 | $ | 18,657 | $ | — | $ | 4,141 | $ | 1,140 | $ | 1,140 | $ | — | $ | — | |||||||||||||||||||
|
|
|
|
|
|
|
| |||||||||||||||||||||||||||
| As of December 31, 2011 | ||||||||||||||||||||||||||||||||||
| Total | Level 1 | Level 2 | Level 3 | As of December 31, 2011 | ||||||||||||||||||||||||||||||
| Total | Level 1 | Level 2 | Level 3 | Valuation Techniques | ||||||||||||||||||||||||||||||
Assets: | ||||||||||||||||||||||||||||||||||
Cash and cash equivalents(1) | $ | 10,335 | $ | 10,335 | $ | — | $ | — | $ | 10,335 | $ | 10,335 | $ | — | $ | — | (a) | |||||||||||||||||
Short-term investments(2) | 1,125 | 1,125 | — | — | ||||||||||||||||||||||||||||||
Non-current investments available-for-sale(3) | 2,104 | — | — | 2,104 | ||||||||||||||||||||||||||||||
Investments – mutual funds(2) | 1,125 | 1,125 | — | — | (a) | |||||||||||||||||||||||||||||
Investments – ARPS(3) | 2,104 | — | — | 2,104 | (b) | |||||||||||||||||||||||||||||
|
|
|
|
|
|
|
| |||||||||||||||||||||||||||
| $ | 13,564 | $ | 11,460 | $ | — | $ | 2,104 | $ | 13,564 | $ | 11,460 | $ | — | $ | 2,104 | |||||||||||||||||||
|
|
|
|
|
|
|
| |||||||||||||||||||||||||||
| (1) | Cash equivalents consist primarily of money market funds and short-term investments with original maturity dates of three months or less at the date of purchase, for which the Company determines fair value through quoted market prices. |
| (2) |
|
| (3) |
|
Before utilizing Level 3 inputs in the fair value measurement of our ARPS, the Company considered significant Level 2 observable inputs of similar assets in active and inactive markets. The Company’s broker dealer received estimated market values from an independent pricing service as of June 30, 2008 and the anticipated future market for such investments. These investments consistconsisted solely of collateralized debt obligations supported by municipal and state agencies; dodid not include mortgage-backed securities or student loans; havehad redemption features that callcalled for redemption at 100% of par value; and havehad a current credit rating of A or AAA. ForThe Company fully redeemed its investment at par value during the period between June 30, 2008 throughsecond quarter of 2012. As of December 31, 2011, we classified our ARPS as long-term due to the Company received partial redemptionshistorical uncertainties at par value on these investments totaling approximately $5.7 million.that time. The fact that there iswas not an active market to liquidate these investments was considereda determining factor in classifying them as Level 3. Due to the uncertainty with regard to the short-term liquidity of these securities, the Company determined that it could not rely on par value to represent fair value. Therefore, the Company estimated the fair values of these securities utilizing a discounted cash flow valuation model. On a quarterly basis we evaluated the reasonableness of the significant unobservable inputs used in our ARPS fair value measurements. The valuation model asused for our ARPS investments required an
evaluation of January 1, 2011 and December 31, 2011. This analysis considered the collateralization underlying the security investments, the creditworthiness of the counterparty, the timing of expected future cash flows, and the expectation the security will have a successful auction or market liquidity. These securities were also compared, when possible, to other observable market data with similar characteristics to the securities held by the Company.
Based on these factors, we assessed the risk of realizing expected cash flows and we applied an estimated term and observable discount rate that reflected this risk. As a result of the temporary declines in fair value for the Company’s ARPS, which the Company generally attributes to liquidity issues rather than credit issues, the Company recorded an unrealized holding loss of $84,000 and $21,000 to accumulated other comprehensive income as of January 1, 2011 and December 31, 2011, respectively. Due to the Company’s belief that the market for these collateralized instruments may take in excess of twelve months to fully recover, the Company has classified these investments as noncurrent and has included them in investments on the consolidated balance sheets at January 1, 2011 and December 31, 2011. As of December 31, 2011, to date,If the Company continues to earn interest on all of its ARPS instruments. Any future fluctuation in fair value related to these instruments that the Company deems to be temporary, including any recoveries of previous write-downs, would be recorded to accumulated other comprehensive income. If the Companyhad determined that any decrease in the value of the instruments was other-than-temporary, it would recordhave recorded a charge to earnings as appropriate. The Company is not certain how long it may be required to hold each security. However, given the Company’s current cash position, liquid cash equivalents and expected cash provided by operations, it believes it has the ability to hold, and intends to continue to hold the ARPS as long-term investments until the market stabilizes.
U.S. AUTO PARTS NETWORK, INC. AND SUBSIDIARIES
NOTES TO CONSOLIDATED FINANCIAL STATEMENTS—(Continued)
During fiscal 2009,year 2012, 2011 and 2010, and 2011, there were no transfers into or out of level 1 and level 2 assets. The following tables present the Company’s ARPS activity measured at fair value on a recurring basis using significant unobservable inputs (Level 3) during fiscal 2009, 2010year 2012 and 2011 (in thousands):
| Long-Term Investments | ||||
Balance as of January 1, 2009 | $ | 6,351 | ||
Redemption at par value | (2,150 | ) | ||
Unrealized gains included in other comprehensive income | 63 | |||
|
| |||
Balance as of January 2, 2010 | $ | 4,264 | ||
|
| |||
| Level 3 Investments | ||||
Balance as of December 31, 2011 | $ | 2,104 | ||
Redemption at par value | (2,125 | ) | ||
Realized gains | 21 | |||
|
| |||
Balance as of December 29, 2012 | $ | — | ||
|
| |||
| Long-Term Investments | ||||
Balance as of January 2, 2010 | $ | 4,264 | ||
Redemption at par value | (125 | ) | ||
Unrealized gains included in other comprehensive income | 2 | |||
|
| |||
Balance as of January 1, 2011 | $ | 4,141 | ||
|
| |||
| Long-Term Investments | Level 3 Investments | |||||||
Balance as of January 1, 2011 | $ | 4,141 | $ | 4,141 | ||||
Redemption at par value | (2,100 | ) | (2,100 | ) | ||||
Unrealized gains included in other comprehensive income | 63 | 63 | ||||||
|
| |||||||
Balance as of December 31, 2011 | $ | 2,104 | $ | 2,104 | ||||
|
| |||||||
Non-Financial Assets Valued on a Non-Recurring Basis
The Company’s long-lived orand indefinite-lived intangible assets are measured at fair value on a non-recurring basis. These assets are measured at cost but are written-down to fair value, if necessary, as a result of impairment.
AsDuring the fourth quarter of January 1, 2011,2012, the Company identified adverse events related to the Company’s overall financial performance, including the continued downward trend in the Company’s revenues and negative cash flows from operations, and a sustained decline in the Company’s share price, that would more likely than not reduce the fair value of the Company’s long-lived and indefinite-lived assets below its carrying amount. The Company performed its impairment testing of goodwill and indefinite-lived intangible assets did not indicate a potential impairment under the provisions ofin accordance with ASC 350 Intangibles – Goodwill and Other, and long-lived assets, including intangible assets subject to amortization, in accordance with ASC 360 Property, Plant and as such, they were not measuredEquipment.
We measure our non-financial assets at fair value on a non-recurring basis using the following valuation techniques:
(a) Market Approach – provides an estimation of fair value based on market prices in actual transactions and on asking prices for assets. Considerations such as time and condition of sale and terms of agreements are analyzed for comparable assets and are adjusted to arrive at an estimation of the fair value.
(b) Income Approach – uses valuation techniques to convert future estimated cash flows to a single present amount based on current market expectations about those future amounts, using present value techniques.
(c) Cost Approach – uses the concept of replacement cost as an indicator of fair value. The premise of the costs approach is that, if it were possible to replace the asset, a market participant would pay no more for an asset than the amount for which the asset could be replaced.
The following table represents the fair value measurements for assets measured on a non-recurring basis as of the Company’s impairment testing date, October 31, 2012 (in thousands):
| Fair Value | Impairment Charge | Valuation Techniques | Fair Value Hierarchy | |||||||||||
Assets: | ||||||||||||||
Goodwill | $ | — | $ | 18,854 | (b) | Level 3 | ||||||||
|
| |||||||||||||
Land and building | 9,500 | 1,000 | (a) | Level 3 | ||||||||||
Computer software (purchased and developed) and equipment | 15,813 | 960 | (c) | Level 3 | ||||||||||
|
| |||||||||||||
Property and equipment | 1,960 | |||||||||||||
|
| |||||||||||||
Websites | — | 695 | (b) | Level 3 | ||||||||||
Customer relationships | — | 911 | (b) | Level 3 | ||||||||||
Assembled workforce | — | 139 | (b) | Level 3 | ||||||||||
Trade names | 1,199 | 3,868 | (b) | Level 3 | ||||||||||
|
| |||||||||||||
Intangible assets | 5,613 | |||||||||||||
|
| |||||||||||||
Total impairment loss | $ | 26,427 | ||||||||||||
|
| |||||||||||||
As of DecemberOctober 31, 2011,2012, total impairment loss was $26.4 million. The Company recorded impairment losses on goodwill, property and equipment and intangible assets of $18.9 million, $1.9 million and $5.6 million, respectively. The fair value measurements are categorized as Level 3 of the fair value hierarchy, as the Company recorded an impairment loss on certain WAG trade name intangible assets, which adjusteddeveloped its own assumptions and analysis to determine if such assets were impaired. Refer to their fair value; refer to“Note 1 – Summary of Significant Accounting Policies and Nature of Operations”, “Note 4 – Property and Equipment, Net” and “Note 6 – Goodwill and Intangibles”Intangible Assets”for additional information. Accordingly, the Company’s other long-lived and indefinite-lived intangible assets were not measured at fair value, consistent with the prior year.details.
Note 4 – Property and Equipment, Net
The Company’s fixed assets consisted of building, computer software (internally developed(purchased and purchased)internally developed), machinery and equipment, furniture and fixtures, and vehicles, and are stated at cost less accumulated depreciation and amortization. Depreciation and amortization expense are provided for in amounts sufficient to relate the cost of depreciable and amortizable assets to operations over their estimated service lives. Depreciation and amortization expense for fiscal 2009,year 2012, 2011 and 2010 and 2011 was $2.0$15.2 million, $3.4$12.7 million and $4.7 million, respectively. Software amortization expense for the same periods was $2.9 million, $6.1 million and $8.0$9.5 million, respectively. The cost and related accumulated depreciation of assets retired or otherwise disposed of are removed from the accounts and the resultant gain or loss is reflected in earnings.
The Company accounts for the impairment of property and equipment in accordance with ASC 360. During the fourth quarter of 2012, the Company identified adverse events related to the Company’s overall financial performance, including the accelerating downward trend in the Company’s revenues and negative cash flows from operations, which indicate that the carrying amount of certain property and equipment may not be recoverable. Based on its analysis, the Company recognized an impairment loss on building and internally developed website and software development cost of $1.0 million and $0.9 million, respectively, for the fourth quarter of 2012. Any future decline in the fair value of an asset group result in future impairments. The Company did not recognize any impairment loss on property and equipment for fiscal year 2011 and 2010. Refer to“Note 1- Summary of Significant Accounting Policies and Nature of Operations”and “Note 3 – Fair Value Measurements”for additional details.
Property and equipment consisted of the following at January 1, 2011 and December 31, 2011:
| January 1, 2011 | December 31, 2011 | |||||||
| (in thousands) | ||||||||
Land | $ | 630 | $ | 630 | ||||
Building | 10,680 | 10,680 | ||||||
Machinery and equipment | 12,216 | 13,429 | ||||||
Computer software (purchased and developed) and equipment | 22,566 | 37,880 | ||||||
Vehicles | 173 | 221 | ||||||
Leasehold improvements | 1,961 | 2,122 | ||||||
Furniture and fixtures | 1,133 | 1,244 | ||||||
Construction in process | 5,241 | 2,467 | ||||||
|
|
|
| |||||
U.S. AUTO PARTS NETWORK, INC. AND SUBSIDIARIES
NOTES TO CONSOLIDATED FINANCIAL STATEMENTS—(Continued)
| January 1, 2011 | December 31, 2011 | |||||||
| (in thousands) | ||||||||
| 54,600 | 68,673 | |||||||
Less accumulated depreciation and amortization | (21,460 | ) | (34,046 | ) | ||||
|
|
|
| |||||
Property and equipment, net | $ | 33,140 | $ | 34,627 | ||||
|
|
|
| |||||
At January 1, 201129, 2012 and December 31, 2011 $2.1 million(in thousands):
| December 29, 2012 | December 31, 2011 | |||||||
Land | $ | 630 | $ | 630 | ||||
Building | 10,680 | 10,680 | ||||||
Machinery and equipment | 13,249 | 13,429 | ||||||
Computer software (purchased and developed) and equipment | 46,884 | 37,880 | ||||||
Vehicles | 261 | 221 | ||||||
Leasehold improvements | 2,364 | 2,122 | ||||||
Furniture and fixtures | 1,131 | 1,244 | ||||||
Construction in process | 3,043 | 2,467 | ||||||
|
|
|
| |||||
| 78,242 | 68,673 | |||||||
Less accumulated depreciation, amortization and impairment | (49,683 | ) | (34,046 | ) | ||||
|
|
|
| |||||
Property and equipment, net | $ | 28,559 | $ | 34,627 | ||||
|
|
|
| |||||
Construction in process primarily relates to the Company’s internally developed software (refer to caption “Website and $1.6 million, respectively,Software Development Costs” in “Note 1 – Summary of Significant Accounting Policies and Nature of Operations”). Certain of the Company’s net property and equipment waswere located in the Philippines. Additionally, gross property and equipment includes $0.3 million and $0.4 million, respectively, of equipment under capital lease arrangements and the related accumulated depreciation of $0.2 million and $0.2 million, respectively,Philippines as of January 1, 2011December 29, 2012 and December 31, 2011.2011, in the amount of $1.0 million and $1.6 million, respectively.
Depreciation of property and equipment is provided using the straight-line method for financial reporting purposes, at rates based on the following estimated useful lives:
| Years | ||||
Building | 19 | |||
Machinery and equipment | 2 - 5 | |||
Computer software (purchased and developed) | 2 - | |||
Computer equipment | 2 - 5 | |||
Vehicles | 3 - 5 | |||
Leasehold | 3 - 5 | |||
Furniture and fixtures | 3 - 7 | |||
| * | The estimated useful life is the lesser of 3-5 years or the lease term. |
Included above, in connection with the acquisition of WAG, the Company allocated $16.4 million of the purchase price to the following property and equipment:
| Weighted-Average Useful Life | Gross Carrying Amount | |||||||
| (in thousands) | ||||||||
Land | Indefinite life | $ | 630 | |||||
Building | 21 years | 10,680 | ||||||
Furniture and fixtures | 3 years | 403 | ||||||
Machinery and equipment | 2-3 years | 3,843 | ||||||
Leasehold improvements | 5 years | 561 | ||||||
Construction in process | 313 | |||||||
|
| |||||||
Total | $ | 16,430 | ||||||
|
| |||||||
The acquired property and equipment are being depreciated on a straight line basis in accordance with their estimated useful life. See“Note 5 – Business Combination”below for further details on the acquisition.
Note 5 – Business Combination
In August 2010, the Company completed the purchase (the “Acquisition”) of all of the issued and outstanding shares of Automotive Specialty Accessories and Parts, Inc. and its wholly-owned subsidiary Whitney Automotive Group, Inc. (referred to herein as “WAG”), at the time, a leader in the automobile aftermarket performance parts and accessories market. Assets acquired include intangible assets consisting of customer relationships, technology, and trade names, tangible assetsproperty and equipment such as furniture and fixtures, machinery and equipment, and a 350,000 square foot distribution center in LaSalle, Illinois with a headquarter office located in Chicago, Illinois (the office sublease related to WAG’s former headquarters was terminated in the fourth quarter of fiscal 2011) . The final purchase price of WAG was $26.7 million in cash, including certain adjustments as set forth in that certain Stock Purchase Agreement executed August 2, 2010 (the “Purchase Agreement”) among Go Fido, Inc., WAG, 2000 Riverside Capital Appreciation Fund, L.P. and the other stockholders of WAG. The Acquisition provided the Company with product line expansion into all terrain vehicles, recreational vehicles and motorcycles, as well as deep product knowledge into niche segments like Jeep, Volkswagen and truck enthusiasts. This expansion in the Company’s product line has increased its customer reach in the do-it-yourself automobile
U.S. AUTO PARTS NETWORK, INC. AND SUBSIDIARIES
NOTES TO CONSOLIDATED FINANCIAL STATEMENTS—(Continued)
and off-road accessories market. In addition, WAG’s facility located in Illinois, which was custom built for business-to-consumer distribution of auto parts, allowed the Company to complete aits three-distribution center network. The Company believes that the combination of WAG’s established brands and focus on the customer experience, coupled with the Company’s capacity to compete online, creates opportunity for growth. These expected synergies from the Acquisition contributed to the goodwill associated with the Acquisition of $9.1 million. See the purchase price allocation table below for further details.
The Acquisition has been accounted for under the purchase method of accounting in accordance with ASC 805,Business Combinations. Accordingly, the assets and liabilities of WAG have been recorded as of the acquisition date at their respective fair values, and combined with the Company’s assets and liabilities. The results of operations of WAG and the estimated fair market values of the acquired assets and liabilities have been included in the consolidated financial statements from the date of the Acquisition.
The following table summarizes our allocation of the purchase price for the Acquisition to the estimated fair values of the assets acquired and liabilities assumed at the date of the Acquisition (in thousands):
Purchase price paid in cash(1) | $ | 27,500 | ||
Purchase price adjustment(2) | (787 | ) | ||
|
| |||
Final purchase price | $ | 26,713 | ||
|
| |||
Purchase price allocation is presented below: | ||||
Assets: | ||||
Accounts receivable(3) | 1,132 | |||
Inventory | 12,366 | |||
Deferred income taxes | 120 | |||
Property and equipment | 16,430 | |||
Intangible assets | 17,378 | |||
Other assets | 2,287 | |||
|
| |||
Total assets | $ | 49,713 | ||
|
| |||
Liabilities: | ||||
Accounts payable | $ | (23,542 | ) | |
Accrued expenses | (4,534 | ) | ||
Deferred income taxes | (2,734 | ) | ||
Other liabilities | (1,272 | ) | ||
|
| |||
Total liabilities | $ | (32,082 | ) | |
|
| |||
Goodwill(4) | $ | 9,082 | ||
|
| |||
Final purchase price | $ | 26,713 | ||
|
| |||
Assets: | ||||
Accounts receivable(1) | $ | 1,132 | ||
Inventory | 12,366 | |||
Deferred income taxes | 120 | |||
Property and equipment(2) | 16,430 | |||
Intangible assets | 17,378 | |||
Other assets | 2,287 | |||
|
| |||
Total assets | $ | 49,713 | ||
|
|
Liabilities: Accounts payable Accrued expenses Deferred income taxes Other liabilities Total liabilities Goodwill(3) Final purchase price $ (23,542 ) (4,534 ) (2,734 ) (1,272 ) $ (32,082 ) $ 9,082 $ 26,713
| (1) |
|
|
Accounts receivable decreased by $1.5 million from $2.6 million in the third quarter of fiscal 2011 due to the Company’s correction of an immaterial balance sheet reclassification. |
| (2 | During the fourth quarter of 2012, the Company recorded an impairment charge of $1.0 million on building. Refer to “Note 4 – Property and Equipment, Net” for additional details. |
| (3) | The goodwill resulting from the Acquisition was non-deductible for tax purposes. Goodwill increased by $1.5 million from $7.6 million in the third quarter of fiscal 2011 due to the Company’s correction of an immaterial balance sheet reclassification. |
U.S. AUTO PARTS NETWORK, INC. AND SUBSIDIARIES
NOTES TO CONSOLIDATED FINANCIAL STATEMENTS—(Continued)
Of the total purchase price, approximately $8.2 million has beenwas allocated to trade name assets with an indefinite life and $9.2 million has beenwas allocated to amortizable intangible assets acquired. The amortizable intangible assets are being amortized on a straight line basis over their respective useful lives, except for internet platform intellectual property which is amortized on an accelerated basis over 10 months, based on the Company’s estimated usage of the asset as follows:follows (in thousands):
| Weighted-Average Useful Life | Gross Carrying Amount | |||||||||||||||
| (in thousands) | Weighted-Average Useful Life | Gross Carrying Amount | ||||||||||||||
Intangible assets subject to amortization: | ||||||||||||||||
Internet platform intellectual property | 10 months | $ | 4,300 | 10 months | $ | 4,300 | ||||||||||
Product design intellectual property | 9 years | 2,750 | 9 years | 2,750 | ||||||||||||
Customer relationships | 4 years | 2,050 | 4 years | 2,050 | ||||||||||||
Favorable leases | 2.5 years | 78 | 2.5 years | 78 | ||||||||||||
|
| |||||||||||||||
| 9,178 | 9,178 | |||||||||||||||
Intangible assets not subject to amortization: | ||||||||||||||||
Trade names | indefinite life | 8,200 | indefinite life | 8,200 | ||||||||||||
|
| |||||||||||||||
Total | $ | 17,378 | $ | 17,378 | ||||||||||||
|
| |||||||||||||||
For fiscal year 2012 and 2011, the Company recorded an impairment loss of $2.8 million and $5.1 million related to certain trade name intangible assets associated with the WAG acquisition. In addition, the Company recorded an impairment loss of $0.9 million on customer relationships in fiscal year 2012. The impairment loss was primarily the result of the deterioration in the economic environment and lower sales and profitability which generated losses from WAG. Refer to “Note 6 – Goodwill and Intangible Assets” for additional details.
WAG’s financial results have been included in our consolidated statementstatements of comprehensive operations since the acquisition date of August 12, 2010. Therefore, pro forma information for the fifty-two weeks ended December 31, 2011 has not been presented since the results of operations of WAG have been included in our actual consolidated results of operations for the entire period. The following pro forma financial information presents the results as if the WAG acquisition had occurred at the beginning of each prior fiscal year presented2010 (in thousands, except share and per share amounts):
| Fifty-Two Weeks Ended | ||||||||||||
| January 2, 2010 | January 1, 2011 | Fifty-Two Weeks Ended January 1, 2011 | ||||||||||
Net sales | $ | 299,552 | $ | 338,885 | $ | 338,885 | ||||||
Net loss | (30,824 | ) | (29,802 | ) | (29,802 | ) | ||||||
Basic net loss per share | (1.03 | ) | (0.98 | ) | (0.98 | ) | ||||||
Diluted net loss per share | (1.03 | ) | (0.98 | ) | (0.98 | ) | ||||||
Weighted average shares used in computing basic net loss per common share | 29,851,873 | 30,269,462 | ||||||||||
Weighted average shares used in computing diluted net loss per common share | 29,851,873 | 30,269,462 | ||||||||||
| Fifty-Two Weeks Ended January 1, 2011 | ||||
Weighted average shares used in computing basic net loss per common share | 30,269 | |||
Weighted average shares used in computing diluted net loss per common share | 30,269 | |||
During fiscal 2010, the net sales of $39.1 million and the net loss of $6.0 million of WAG were included in our consolidated statement of operations since the acquisition date of August 12, 2010.
Related to the Acquisition, the Company has incurred acquisition and integration related costs of $3.1$7.4 million and $7.4$3.1 million for the fiscal years ended January 1,December 31, 2011 and December 31,January 1, 2011, respectively, which have been recorded in general and administrative expenses. These costs included one-time contract cancellation costs of $1.5 million that the Company recorded in September 2011, pursuant to ASC 420Exit or Disposal Cost Obligations(“ASC 420”),for terminating WAG’s sublease agreement related to its former corporate offices located in Chicago, Illinois.
During the third quarter of fiscal 2011, the Company discovered that certain accounts receivable were erroneously overstated by $1.5 million which also resulted in an understatement of $1.5 million in related goodwill. Accordingly, the Company reclassified $1.5 million from accounts receivable to goodwill in the consolidated balance sheet as of January 1, 2011. The Company considers this an immaterial reclassification. This reclassification had no effect on the Company’s previously reported consolidated statements of operations, consolidated statements of shareholders’ equity nor the consolidated net cash provided by (used in) operating activities, the net cash used in investing activities and the net cash provided by (used in) financing activities within the consolidated statement of cash flows.
No significant integration costs are anticipated in the future, as such the majority of the acquisition and integration related costs have been paid as ofwere incurred subsequent to December 31, 2011.
Note 6 – Goodwill and IntangiblesIntangible Assets
The Company evaluates goodwill for impairment on an annual basis or more frequently if events or circumstances occur that would indicate a reduction in fair value. We identified two reporting units, Base USAP, which is the core auto parts business, and AutoMD, an online automotive repair source, (refer to “Segment Data” above in “Note 1 - Summary of Significant Accounting Policies and Nature of Operations”) in accordance with ASC 280Segment Reporting. We identified AutoMD as a reporting unit for purposes of the goodwill impairment testing and no impairment charge was recorded related to this reporting unit. The results of the impairment testing discussed below refer solely to Base USAP.
During the fourth quarter of 2012, the Company identified adverse events related to the Company’s overall financial performance, including the continued downward trend in the Company’s revenues and negative cash flows from operations, and a sustained decline in the Company’s share price, that would more likely than not reduce the fair value of our reporting unit below its carrying amount. As of October 31, 2011,2012, the Company performed its annual impairment test and the excess of faircarrying value estimates over carryingfair value for our reporting unit was approximately $50$21.8 million. Therefore, the Company performed the second step of the goodwill impairment test to measure the amount of impairment loss. The second step compares the implied fair value of goodwill with the carrying amount of goodwill. The implied fair value of goodwill is determined in the same manner as the amount of goodwill recognized in a business combination. The excess of the fair value of a reporting unit over the amounts assigned to its assets and liabilities is the implied fair value of goodwill. Based on its analysis, there would have to be a 38% decrease in the estimated fair value of the reporting unit to fail step 1. During the fiscal year ended December 31, 2011, there was no change to the Company’s reporting unit and no events or circumstances occurred that would indicateCompany recognized an impairment loss on goodwill of goodwill based on$18.9 million during the excessfourth quarter of estimated fair value over carrying value 2012. Refer to“Note 1 – Summary of Significant Accounting Policies and Nature of Operations”and “Note 3 – Fair Value Measurements”for our reporting unit.
U.S. AUTO PARTS NETWORK, INC. AND SUBSIDIARIESadditional details.
NOTES TO CONSOLIDATED FINANCIAL STATEMENTS—(Continued)
The following table summarizes the changes in our goodwill (in thousands):
Balance at December 31, 2008 and January 2, 2010 | $ | 9,772 | ||
Goodwill from WAG acquisition | 7,365 | |||
|
| |||
Balance at January 1, 2011 (as previously reported) | $ | 17,137 | ||
Adjustment to goodwill | 1,510 | |||
Balance at January 1, 2011 (as adjusted) | $ | 18,647 | ||
Adjustment to goodwill | 207 | |||
|
| |||
Balance at December 31, 2011 | $ | 18,854 | ||
|
|
| Gross Amount | Accum. Impairment Losses | Net Amount | ||||||||||
Balance at January 1, 2011 | $ | 23,077 | $ | (4,430 | ) | $ | 18,647 | |||||
Adjustment to goodwill | 207 | — | 207 | |||||||||
|
|
|
|
|
| |||||||
Balance at December 31, 2011 | $ | 23,284 | $ | (4,430 | ) | $ | 18,854 | |||||
Impairment loss on goodwill | — | (18,854 | ) | (18,854 | ) | |||||||
|
|
|
|
|
| |||||||
Balance at December 29, 2012 | $ | 23,284 | $ | (23,284 | ) | $ | — | |||||
|
|
|
|
|
| |||||||
Intangible assets, excluding goodwill, During fiscal 2011, the Company recordedadjustments of $1.7 million related to the immaterial balance sheet reclassification of WAG’s $1.5 million accounts receivable and the settlement amount of $0.2 million received from the shareholders of WAG for the negative working capital of WAG on the dateconsisted of the Acquisition. See“Note 5 – Business Combination” for additional information on the goodwill adjustments.
During fiscal 2009, the Company acquired certain websites and domain names for a purchase price of $739,000, of which $625,000 was allocated to amortizable intangibles. During fiscal 2010, the Company acquired certain websites and domain names for a purchase price of $1.0 million, of which $843,000 was allocated to amortizable intangibles. In addition, associated with the acquisition of WAG, approximately $8.2 million of the total purchase price had been allocated to trade name assets with an indefinite life and $9.2 million had been allocated to amortizable intangible assets during the third quarter of fiscal 2010, as noted in the table below. During fiscal 2011, the Company purchased certain domain and trade names for a purchase price of $74,000, all of which were allocated to intangibles assets not subject to amortization.
| December 29, 2012 | December 31, 2011 | |||||||||||||||||||||||||||
| Useful Life | Gross Carrying Amount | Accum. Amort. and Impairment | Net Carrying Amount | Gross Carrying Amount | Accum. Amort. and Impairment | Net Carrying Amount | ||||||||||||||||||||||
Intangible assets subject to amortization: | ||||||||||||||||||||||||||||
Websites | 5 years | $ | 2,035 | $ | (2,035 | ) | $ | — | $ | 2,035 | $ | (1,001 | ) | $ | 1,034 | |||||||||||||
Internet platform intellectual property | 10 months | 4,300 | (4,300 | ) | — | 4,300 | (4,300 | ) | — | |||||||||||||||||||
Product design intellectual property(1) | 2 years | 2,750 | (722 | ) | 2,028 | 2,750 | (416 | ) | 2,334 | |||||||||||||||||||
Customer relationships | 4 years | 2,050 | (2,050 | ) | — | 2,050 | (712 | ) | 1,338 | |||||||||||||||||||
Assembled workforce | 7 years | 512 | (512 | ) | — | 481 | (275 | ) | 206 | |||||||||||||||||||
Favorable lease | 2.5 years | 78 | (78 | ) | — | 78 | (56 | ) | 22 | |||||||||||||||||||
Domain and trade names (2) | 10 years | 5,067 | (3,868 | ) | 1,199 | 5,050 | — | 5,050 | ||||||||||||||||||||
|
|
|
|
|
|
|
|
|
|
|
| |||||||||||||||||
Total | $ | 16,792 | $ | (13,565 | ) | $ | 3,227 | $ | 16,744 | $ | (6,760 | ) | $ | 9,984 | ||||||||||||||
|
|
|
|
|
|
|
|
|
|
|
| |||||||||||||||||
The Company did not note events or changes in circumstances indicating that the carrying value of our intangible assets may not be recoverable in fiscal 2009 and 2010, therefore, no impairment loss was recognized for intangible assets as of fiscal year end 2009 and 2010.
| (1) | During the fourth quarter of 2012, the Company determined an estimated useful life of 2 years. Prior to this, estimated useful life was 9 years. |
| (2) | Prior to fiscal year 2012, domain and trade names had an indefinite useful life. During the fourth quarter of 2012, after the impairment charges were recognized (see discussion below), the Company determined an estimated useful life of 10 years. |
As of December 31, 2011, the Company recorded a non-cashan impairment charge of $5.1 million related to certain trade name intangible assets associated with the WAG acquisition. During the fourth quarter of 2012, we recognized additional impairment losses on certain trade names for $3.9 million. The impairment charge wascharges were primarily the result of the deterioration in the economic environment and lower sales and profitability which generated losses from WAG.profitability. Given the indicators of impairment, the Company utilized the Royalty Savings method in determining fair value of the trade name intangible assets. The decrease in future cash flows resulted in these indefinite-lived assets being impaired, as the carrying value of the trade names exceeded the fair value. No impairment loss was recognized for indefinite-lived intangible assets during fiscal year 2010. For intangibles subject to amortization, we recorded an impairment loss to websites, customer relationships and assembled workforce of $0.7 million, $0.9 million and $0.1 million, respectively, in the fourth quarter of 2012. The Company did not recognize impairment loss on intangible assets subject to amortization for fiscal year 2011 and 2010. Refer to“Note 1– Summary of Significant Accounting Policies and Nature of Operations”and “Note 3 – Fair Value Measurements”for additional details.
Intangibles subject to amortization are expensed on a straight-line basis, except for the internet platform intellectual property which was amortized on an accelerated basis. Amortization expense relating to intangibles totaled $0.7$1.2 million, $2.8$3.7 million and $3.7$2.8 million for fiscal 2009, fiscal 2010 and fiscal 2011, respectively.
Intangibles, excluding goodwill, consisted of the following at January 1,year 2012, 2011 and December 31, 2011 (in thousands):2010, respectively.
| January 1, 2011 | December 31, 2011 | |||||||||||||||||||||||||||
| Useful Life | Gross Carrying Amount | Accum. Amort. | Net Carrying Amount | Gross Carrying Amount | Accum. Amort. | Net Carrying Amount | ||||||||||||||||||||||
Intangible assets subject to amortization: | ||||||||||||||||||||||||||||
Websites | 5 years | $ | 2,035 | $ | (594 | ) | $ | 1,441 | $ | 2,035 | $ | (1,001 | ) | $ | 1,034 | |||||||||||||
Internet platform intellectual property(1) | 10 months | 4,300 | (1,984 | ) | 2,316 | 4,300 | (4,300 | ) | — | |||||||||||||||||||
Product design intellectual property(1) | 9 years | 2,750 | (116 | ) | 2,634 | 2,750 | (416 | ) | 2,334 | |||||||||||||||||||
Customer relationships(1) | 4 years | 2,050 | (197 | ) | 1,853 | 2,050 | (712 | ) | 1,338 | |||||||||||||||||||
Assembled workforce | 7 years | 478 | (182 | ) | 296 | 481 | (275 | ) | 206 | |||||||||||||||||||
U.S. AUTO PARTS NETWORK, INC. AND SUBSIDIARIES
NOTES TO CONSOLIDATED FINANCIAL STATEMENTS—(Continued)
| January 1, 2011 | December 31, 2011 | |||||||||||||||||||||||||||
| Useful Life | Gross Carrying Amount | Accum. Amort. | Net Carrying Amount | Gross Carrying Amount | Accum. Amort. | Net Carrying Amount | ||||||||||||||||||||||
Favorable lease(1) | 2.5 years | 78 | (14 | ) | 64 | 78 | (56 | ) | 22 | |||||||||||||||||||
|
|
|
|
|
|
|
|
|
|
|
| |||||||||||||||||
Sub-Total | 11,691 | (3,087 | ) | 8,604 | 11,694 | (6,760 | ) | 4,934 | ||||||||||||||||||||
Intangible assets not subject to amortization: | ||||||||||||||||||||||||||||
Domain and trade names(2) | Indefinite life | 10,114 | — | 10,114 | 5,050 | — | 5,050 | |||||||||||||||||||||
|
|
|
|
|
|
|
|
|
|
|
| |||||||||||||||||
Total | $ | 21,805 | $ | (3,087 | ) | $ | 18,718 | $ | 16,744 | $ | (6,760 | ) | $ | 9,984 | ||||||||||||||
|
|
|
|
|
|
|
|
|
|
|
| |||||||||||||||||
|
|
The following table summarizes the future estimated annual amortization expense for these assets over the next five years (in thousands):
2012 | $ | 1,656 | ||||||
2013 | 1,429 | $ | 1,134 | |||||
2014 | 508 | 1,134 | ||||||
2015 | 306 | 120 | ||||||
2016 | 306 | 120 | ||||||
2017 | 120 | |||||||
Thereafter | 729 | 599 | ||||||
|
| |||||||
Total | $ | 4,934 | $ | 3,227 | ||||
|
| |||||||
Note 7 – Borrowings
On April 26, 2012, the Company, certain of its wholly-owned domestic subsidiaries and JPMorgan Chase Bank, N.A., as sole lender and administrative agent entered into a Credit Agreement (the “Credit Agreement”). The Credit Agreement provides for a revolving commitment in an aggregate principal amount of up to $40,000,000 (the “Credit Facility”), which is subject to a borrowing base derived from certain receivables, inventory and property and equipment. The Credit Facility matures on April 26, 2017. The Company used the proceeds of the loans borrowed on the closing date to repay in full its previous credit facility with Silicon Valley Bank. In connection with the payoff of our previous credit facility, the Company recorded a loss on debt extinguishment of $360,000 which was comprised of a prepayment fee in the amount of $166,000, accelerated deferred financing costs in the amount of $185,000 and other direct expenses related to the previous debt. At December 29, 2012, our outstanding revolving loan balance was $16.2 million. The customary events of default under the Credit Facility (discussed below) include certain subjective acceleration clauses, which management has determined the likelihood of such acceleration is more than remote, considering the recurring losses experienced by the Company, therefore a current classification of our revolving loan payable was required.
Loans drawn under the Credit Facility bear interest, at the Company’s option, at a per annum rate equal to either (a) LIBOR plus an applicable margin of 1.50%, or (b) an “alternate base rate” minus an applicable margin of 0.50%. Each applicable margin as set forth in the prior sentence is subject to increase or decrease by 0.25% per annum based upon the Company’s fixed charge coverage ratio. At December 29, 2012, the Company’s LIBOR based interest rate was 1.75% (on $15.0 million principal) and the Company’s prime based rate was 2.75% (on $1.2 million principal). A commitment fee, based upon undrawn availability under the Credit Facility bearing interest at a rate of 0.20% per annum, is payable monthly. Under the terms of the Credit Agreement, cash receipts are deposited into a lock-box, which are at the Company’s discretion unless the “cash dominion period” is in effect, during which cash receipts will be used to reduce amounts owing under the Credit Agreement. The cash dominion period is triggered in an event of default or if excess availability is less than $6,000,000 at any time, as defined, and will continue until, during the preceding 60 consecutive days, no event of default existed and excess availability has been greater than $7,000,000 at all times. The Company’s excess availability was $10.8 million at December 29, 2012 or $4.8 million that was available above the cash dominion trigger of $6 million. On March 12, 2013, we entered into a first amendment to the previously entered credit agreement in April 2012 (“Amended Credit Agreement”). The Amendment Credit Agreement includes an amendment to the definition of covenant testing trigger period to commence on any day that excess availability is less than $4 million solely during the period March 1, 2013 through and including April 15, 2013 and continuing until excess availability has been greater than or equal to $4 million solely during the period of March 1, 2013 through and including April 15, 2013 at all times for 45 consecutive calendar days. As of the date hereof, the cash dominion period has not been in effect; accordingly no principal payments are currently due.
Certain of the Company’s wholly-owned domestic subsidiaries are co-borrowers (together with the Company, the “Borrowers”) under the Credit Agreement, and certain other wholly-owned domestic subsidiaries are guarantors (the “Guarantors” and, together with the Borrowers, the “Loan Parties”) under the Credit Agreement. The Borrowers and the Guarantors are jointly and severally liable for the Borrowers’ obligations under the Credit Agreement. The Loan Parties’ obligations under the Credit Agreement are secured, subject to customary permitted liens and certain exclusions, by a perfected security interest in (a) all tangible and intangible assets and (b) all of the capital stock owned by the Loan Parties (limited, in the case of foreign subsidiaries, to 65% of the capital stock of such foreign subsidiaries). The Borrowers may voluntarily prepay the loans at any time without payment of a premium. The Borrowers are required to make mandatory prepayments of the loans (without payment of a premium) with net cash proceeds received upon the occurrence of certain “prepayment events,” which include certain sales or other dispositions of collateral, certain casualty or condemnation events, certain equity issuance or capital contributions, and the incurrence of certain debt. Upon the satisfaction of certain conditions, the borrowers have the right to increase the revolving commitments up to and above $60,000,000. Borrowers may make a maximum of three such requests in a minimum amount of $5,000,000 each. Upon approval of such an increase, the aggregate revolving commitment amount will be revised and the Credit Agreement amended as appropriate. The Company, to date, has not requested such increases.
The Credit Agreement contains customary representations and warranties and customary affirmative and negative covenants applicable to the Company and its subsidiaries, including, among other things, restrictions on indebtedness, liens, fundamental changes, investments, dispositions, prepayment of other indebtedness, mergers, and dividends and other distributions. Under the Credit Agreement, the Company is not required to maintain a minimum fixed charge coverage ratio, unless excess availability is less than $6,000,000, as defined, whereby a ratio of 1.0 to 1.0 will be required. Events of default under the Credit Agreement include: failure to timely make payments due under the Credit Agreement; material misrepresentations or misstatements under the Credit Agreement and other related agreements; failure to comply with covenants under the Credit Agreement and other related agreements; certain defaults in respect of other material indebtedness; insolvency or other related events; certain defaulted judgments; certain ERISA-related events; certain security interests or liens under the loan documents cease to be, or are challenged by the Company or any of its subsidiaries as not being, in full force and effect; any loan document or any material provision of the same ceases to be in full force and effect; and certain criminal indictments or convictions of any Loan Party. As of December 29, 2012, the Company was in compliance with all covenants under the Credit Agreement.
In August 2010, the Company executed a Loan and Security Agreement (the “Loan“Prior Credit Agreement”) and other definitive documentation for a $35 million secured credit facility (the “Facility”“Prior Credit Facility”). Silicon Valley Bank (“Bank”) iswas the lender under the Prior Credit Facility. The Prior Credit Facility iswas comprised of a term loan in the original principal amount of $25 million and a revolving line of credit with availability up to $10 million. The Prior Credit Facility hashad a final maturity date of June 30, 2014, and borrowings under the Prior Credit Facility bearwere interest bearing, at the election of the Company, at LIBOR (with a floor of 1.25%) plus a margin of from 2.00% to 3.00% per annum, or at the Wall Street Journal Prime Rate plus a margin of from 1.00% to 2.00% per annum, based upon the Company’s maximum funded debt ratio. An unused revolving line fee of 0.375% per annum iswas payable on the undrawn committed amount of the revolving line of credit. Interest on outstanding borrowings under the term loan and the revolving line of credit iswas payable no less than quarterly and the outstanding principal of the term loan iswas amortized over four
years and payable quarterly, with any outstanding amount under the Prior Credit Facility to be paid in full on the final maturity date. Borrowings under the Prior Credit Facility arewere secured by liens over all assets of the Company, including shares of stock in each of the Company’s subsidiaries. Ten of the Company’s subsidiaries are acting as co-borrowers under the Facility.
The LoanPrior Credit Agreement requiresrequired the Company to comply with a number of restrictive covenants, including financial covenants related to maximum funded debt to consolidated EBITDA,earnings before interest, taxes, depreciation and amortization (“EBITDA”), as defined, liquidity, and consolidated fixed charge coverage ratios; negative pledge requirements; requirements to deliver quarterly and annual consolidated financial statements; requirements to maintain adequate insurances; prohibitions on changes in the business and disposition of the Company’s assets; and other customary covenants. The Loan Agreement also requires the Company to obtain a prior written consent from the Bank when the Company determines to pay any dividends on or make any distribution related to its common stock. The Loan Agreement includes usual and customary events of defaults and remedies for facilities of this nature. In February and October 2011, the Company and theSilicon Valley Bank entered into Amendment No. 1 and Amendment No. 2, respectively,four amendments to Loan and Securitythe Prior Credit Agreement and Limited Waiver (collectively,through March 2012. The Prior Credit Facility’s outstanding balance of $17.9 million was repaid in full in April 2012 through the “Amendments”). The Amendments waived the Company’s lack of compliance with the consolidated fixed charge ratio covenant in the Loan Agreement as of January 1, 2011 and October 1, 2011 to more readily accommodate the Company’s integrationproceeds of the WAG acquisition. In December 2011, the Company and the Bank entered into Amendment No. 3 to Loan and Security Agreement, to amend the Loan Agreement, as amended (the “Third Amendment”). The Third Amendment amends the Company’s permitted indebtedness to allow debt to certain other banks in connection with a vendor purchasing card program in an aggregate amount not to exceed $2,500,000 at any one time outstanding.
U.S. AUTO PARTS NETWORK, INC. AND SUBSIDIARIES
NOTES TO CONSOLIDATED FINANCIAL STATEMENTS—(Continued)
As of January 1, 2011, the required consolidated fixed charge coverage ratio was 1.10:1.00 and the Company’s consolidated fixed charge coverage ratio was 0.60:1.00. For purposes of calculating the consolidated fixed charge coverage ratio, the Amendment No. 1 amended the definition of “Consolidated EBITDA” to allow the Company to add back restructuring costs and transaction fees and expense related to the WAG acquisition to the extent paid on or before June 30, 2011 in an amount not to exceed $5,000,000 in the aggregate for the fourth quarter ending January 1, 2011 and three consecutive fiscal quarters thereafter to the extent paid during such periods. As amended, the Company’s consolidated fixed charge coverage ratio was 1.25:1.00 and was in compliance.
As of October 1, 2011, the required consolidated fixed charge coverage ratio was 1.25:1.00 and the Company’s consolidated fixed charge coverage ratio was 0.92:1.00. For purposes of calculating the consolidated fixed charge coverage ratio, the Amendment No. 2 amended the definition of “Consolidated EBITDA” to allow the Company to add back restructuring costs and transaction fees and expenses related to the WAG acquisition to the extent paid in the four consecutive fiscal quarters ended October 1, 2011. As amended, the Company’s consolidated fixed charge coverage ratio was 1.80:1.00 and was in compliance.loan borrowed from JP Morgan Chase Bank.
As of December 31, 2011, the Loan Agreement, as amended, contains the following remaining financial covenant requirements:
Maximum funded debt to consolidated EBITDA. A ratio of aggregate credit extensions outstanding to trailing 12 month consolidated EBITDA of not greater than the following:
1.50:1.00 for quarters ending October 1, 2011 through June 30, 2012
1.00:1.00 for each quarter ending thereafter
Consolidated fixed charge coverage ratio of not less than the ratio set forth below:
1.25:1.00 for quarters ending July 2, 2011, October 1, 2011 and December 31, 2011
1.50:1.00 for each quarter ending thereafter (refer to March 2012 amendment below)
Liquidity as follows:
Unrestricted cash and cash equivalents minus outstanding advances of at least $7,500,000.
U.S. AUTO PARTS NETWORK, INC. AND SUBSIDIARIES
NOTES TO CONSOLIDATED FINANCIAL STATEMENTS—(Continued)
For the quarter ended December 31, 2011, the Company was in compliance with all covenants, as amended, under the Loan Agreement. The Company’s financial covenant ratios under the Loan Agreement as of December 31, 2011, as amended, were 1.21 for maximum funded debt to consolidated EBITDA and 1.32 for consolidated fixed charge coverage. As of December 31, 2011, the Company’s liquidity was $11,460,000.
During March29, 2012, the Company determined it was probable that the consolidated fixed charge coverage ratio would not be in compliance with the required 1.50:1.00 minimum level for the quarter ending March 31, 2012. This determination was made during the Company’s monitoringhad capital leases payable of their covenants, which includes monthly calculations of “Consolidated EBITDA” projected to quarter end. As a result, on March 23, 2012, the Company and the Bank entered into Amendment No. 4 to Loan and Security Agreement (the “Fourth Amendment”). The Fourth Amendment reduced the required consolidated fixed charge coverage ratio to a minimum of 1.00:1:00 for the one quarter ending March 31, 2012 and to 1.25:1.00 for each quarter ending thereafter. Based on the current covenant calculations, the Company’s consolidated fixed charge coverage ratio is projected to be in compliance as of March 31, 2012. All financial covenants are expected to be in compliance as of March 31, 2012 and through the remainder of fiscal 2012.$140,000.
The Company expects to be in compliance with the financial covenants, as amended, in the Loan Agreement through the remaining term of the Loan Agreement, however, it is possible that a breach of the financial covenants may occur in the future, should the Company’s forecasted EBITDA levels not be achieved. If the Company breaches any of the covenants under the Loan Agreement and is unable to obtain waivers from the Bank, the Bank will be able to exercise their rights and remedies under the Loan Agreement, including a call provision on outstanding debt, which would have a material adverse effect on the Company’s business and financial condition.
At December 31, 2011, the LIBOR rate and the margin were 1.25% (floor rate) and 2.50% per annum, respectively. The Company had no borrowings on the revolving line of credit at December 31, 2011. The remaining term loan balance was $17.9 million as of December 31, 2011 and is to be repaid according to the following schedule (in thousands):
| Payments Due by Period | ||||||||||||||
Total | 2012 | 2013 | 2014 | |||||||||||
| $ 17,875 | $ | 6,250 | $ | 6,875 | $ | 4,750 | ||||||||
Based on the borrowing rates currently available to the Company for bank loans with similar terms and average maturities, the fair value of our long-term debt under the Facility approximated its carrying amount as of December 31, 2011.
As of December 31, 2011, the Company had a capital lease obligation of $172,000. See“Note 12 – Commitments and Contingencies”for further detail.
Note 8 – Stockholders’ Equity and Share-Based Compensation
Common Stock
The Company has 100,000,000 shares of common stock authorized. We have never paid cash dividends on our common stock. The following issuances of common stock were made during fiscal 2011:year 2012:
The Company issued 136,770489,105 shares of common stock from option exercises under its various share-based compensation plans, as discussed below.
13,174 shares of common stock were awarded and issued to one non-employee member of the Board of Directors for service fees earned in the aggregate amount of $53,125. Such common stock was awarded from the 2007 Omnibus Incentive Plan, as discussed below.
Effective in fiscal 2010, the Company’s compensation committee awarded 59,618 shares of restricted stock to certain officers of the Company. The shares were issued in February 2011. The compensation expense in the amount of $295,000 was accrued based on the market value of the Company’s stock as of the grant date, in fiscal 2010.
Share-Based Compensation Plan Information
The Company adopted the 2007 Omnibus Incentive Plan (the “2007 Omnibus Plan”) in January 2007, which became effective on February 8, 2007, the effective date (February 8, 2007) of the registration statement filed in connection with the Company’s initial public offering. Under the 2007 Omnibus Plan, the Company was initiallypreviously authorized to issue 2.4 million shares of common stock, under various instruments to eligible employees and non-employees of the Company, plus an automatic annual increase on the first day of each of the Company’s fiscal years beginning on January 1, 2008 and ending on January 1, 2017 equal to (i) the lesser of (A) 1,500,000 shares of common stock or (B) five percent (5%) of the number of shares of common stock outstanding on the last day of the immediately preceding fiscal year or (ii) such lesser number of shares of common stock as determined by the Company’s Board of Directors. Options granted under the 2007 Omnibus Plan generally expire no later than ten years from the date of grant and generally vest over a period of four years. The exercise price of all option grants must be equal to 100% of the fair market value on the date of grant. The 2007 Omnibus Plan also provides for automatic grant of options to purchase common stock and common stock awards to non-employee directors.
At As of December 31, 2011, 2,385,98729, 2012, 1,946,127 shares were available for future grants under the 2007 Omnibus Plan.
U.S. AUTO PARTS NETWORK, INC. AND SUBSIDIARIES
NOTES TO CONSOLIDATED FINANCIAL STATEMENTS—(Continued)
The following table summarizes the Company’s stock option activity under the 2007 Omnibus Plan:
| Shares | Weighted Average Exercise Price | Weighted Average Remaining Contractual Term (in years) | Aggregate Intrinsic Value | |||||||||||||
Options outstanding, January 1, 2011 | 4,815,119 | $ | 4.10 | 7.78 | ||||||||||||
Granted | 1,080,000 | $ | 6.57 | |||||||||||||
Exercised | (136,770 | ) | $ | 3.02 | ||||||||||||
Expired | (104,365 | ) | $ | 6.51 | ||||||||||||
Forfeited | (127,894 | ) | $ | 6.18 | ||||||||||||
|
| |||||||||||||||
Options outstanding, December 31, 2011 | 5,526,090 | $ | 4.51 | 6.95 | $ | 5,191,000 | ||||||||||
Vested and expected to vest at December 31, 2011 | 5,235,860 | $ | 4.42 | 6.84 | $ | 5,167,000 | ||||||||||
Options exercisable, December 31, 2011 | 3,540,908 | $ | 3.97 | 6.29 | $ | 4,039,000 | ||||||||||
The weighted-average fair value of options granted during fiscal 2009, fiscal 2010 and fiscal 2011 was $1.40, $3.75 and $3.28, respectively.
The intrinsic value of stock options at the date of the exercise is the difference between the fair value of the stock at the date of exercise and the exercise price. During fiscal 2010 and 2011, the total intrinsic value of the exercised options was $1.4 million and $0.5 million, respectively. There was no intrinsic value for options exercised in fiscal 2009. Aggregate Intrinsic Value (in the table) is calculated as the difference between the exercise price of underlying awards and the fair value price of the Company’s common stock for options that were in-the-money as of December 31, 2011.
Under the 2007 Omnibus Plan, the Company had $3.5 million of unrecognized share-based compensation expense related to stock options outstanding as of December 31, 2011, which expense is expected to be recognized over a weighted-average period of 2.47 years.
Additional information with respect to outstanding options under the 2007 Omnibus Plan as of December 31, 2011 is as follows:
| Options Outstanding | Options Exercisable | |||||||||||||||||||
Range of Exercise Prices | Options Outstanding | Weighted Average Remaining Contractual Term (in years) | Weighted- Average Exercise Price | Options Exercisable | Weighted- Average Exercise Price | |||||||||||||||
$1.31 | 75,000 | 7.17 | $ | 1.31 | 51,562 | $ | 1.31 | |||||||||||||
$1.59 | 725,000 | 7.01 | $ | 1.59 | 528,644 | $ | 1.59 | |||||||||||||
$1.74-$2.14 | 720,693 | 6.81 | $ | 1.91 | 547,689 | $ | 1.93 | |||||||||||||
$3.06-$3.24 | 722,589 | 6.25 | $ | 3.12 | 649,665 | $ | 3.12 | |||||||||||||
$3.64-$4.47 | 567,292 | 6.57 | $ | 3.90 | 503,333 | $ | 3.85 | |||||||||||||
$4.64-$5.00 | 616,602 | 8.48 | $ | 4.81 | 226,410 | $ | 4.91 | |||||||||||||
$5.38-$5.81 | 649,000 | 6.30 | $ | 5.58 | 526,081 | $ | 5.62 | |||||||||||||
$5.88-$7.80 | 598,375 | 6.56 | $ | 7.13 | 150,454 | $ | 6.95 | |||||||||||||
$7.99-$8.08 | 567,500 | 8.04 | $ | 8.00 | 117,500 | $ | 8.06 | |||||||||||||
$8.32-$9.41 | 284,039 | 6.45 | $ | 8.59 | 239,570 | $ | 8.65 | |||||||||||||
|
|
|
| |||||||||||||||||
Totals | 5,526,090 | 6.95 | $ | 4.51 | 3,540,908 | $ | 3.97 | |||||||||||||
The Company adopted the 2007 New Employee Incentive Plan (the “2007 New Employee Plan”) in October 2007. Under the 2007 New Employee Plan, the Company is authorized to issue 2.02 million shares of common stock under various instruments solely to new employees. Options granted under the 2007 New Employee Plan generally expire no later than ten years from the date of grant and generally vest over a period of four years. The exercise price of all option grants must not be less than 100% of the fair market value on the date of grant.
At As of December 31, 2011, 750,00029, 2012, 706,667 shares were available for future grants under the 2007 New Employee Plan.
U.S. AUTO PARTS NETWORK, INC. AND SUBSIDIARIES
NOTES TO CONSOLIDATED FINANCIAL STATEMENTS—(Continued)
The following table summarizes the Company’s stock option activity under the 2007 New Employee Plan:
| Shares | Weighted Average Exercise Price | Weighted Average Remaining Contractual Term (in years) | Aggregate Intrinsic Value | |||||||||||||
Options outstanding, January 1, 2011 | 1,250,000 | $ | 5.65 | 7.32 | ||||||||||||
Granted | — | — | ||||||||||||||
Exercised | — | — | ||||||||||||||
Expired | — | — | ||||||||||||||
Forfeited | — | — | ||||||||||||||
|
| |||||||||||||||
Options outstanding, December 31, 2011 | 1,250,000 | $ | 5.65 | 6.33 | $ | 1,610,000 | ||||||||||
Vested and expected to vest at December 31, 2011 | 1,246,348 | $ | 5.66 | 6.32 | $ | 1,598,000 | ||||||||||
Options exercisable, December 31, 2011 | 1,133,333 | $ | 6.11 | 6.24 | $ | 1,234,000 | ||||||||||
The weighted-average fair value of options granted during fiscal 2009 was $0.51, there were no new options granted in fiscal 2010 and fiscal 2011.
Aggregate Intrinsic Value (in the table) is calculated as the difference between the exercise price of the underlying awards and the fair value price of the Company’s common stock for options that were in-the-money as of December 31, 2011.
Under the 2007 New Employee Plan, the Company had $33,000 of unrecognized share-based compensation expense related to stock options outstanding as of December 31, 2011, which expense is expected to be recognized over a weighted-average period of 1.13 years.
Additional information with respect to outstanding options under the 2007 New Employee Plan as of December 31, 2011 is as follows:
| Options Outstanding | Options Exercisable | |||||||||||||||||||
Range of Exercise Prices | Options Outstanding | Weighted Average Remaining Contractual Term (in years) | Weighted- Average Exercise Price | Options Exercisable | Weighted- Average Exercise Price | |||||||||||||||
$1.15-$1.59 | 500,000 | 7.13 | $ | 1.15 | 383,333 | $ | 1.15 | |||||||||||||
$8.65 | 750,000 | 5.79 | $ | 8.65 | 750,000 | $ | 8.65 | |||||||||||||
|
|
|
| |||||||||||||||||
Totals | 1,250,000 | 6.33 | $ | 5.65 | 1,133,333 | $ | 6.11 | |||||||||||||
The Company adopted the U.S. Auto Parts Network, Inc. 2006 Equity Incentive Plan (the “2006 Plan”) in March 2006. All stock options to purchase common stock granted to employees in 2006 were granted under the 2006 Plan and had exercise prices equal to the fair value of the underlying stock, as determined by the Company’s Board of Directors on the applicable option grant date. At the time of grant, the Board of Directors determined the value of the underlying stock by considering a number of factors, including historical and projected financial results, the risks the Company faced, the preferences of the Company’s preferred stock holders and the lack of liquidity of the Company’s common stock. No stock options were granted by the Company prior to the adoption of the 2006 Plan. As of December 31, 2011, there wereAfter fiscal year 2008, no shares have been available for future grants under the 2006 Plan.
The following table summarizes the Company’s stock option activity for the fifty-two weeks ended December 29, 2012, and details regarding the options activity under the 2006 Plan:outstanding and exercisable at December 29, 2012:
| Shares | Weighted Average Exercise Price | Weighted Average Remaining Contractual Term (in years) | Aggregate Intrinsic Value | |||||||||||||
Options outstanding, January 1, 2011 | 713,304 | $ | 8.28 | 5.47 | ||||||||||||
Granted | — | $ | — | |||||||||||||
Exercised | — | $ | — | |||||||||||||
Expired | (34,676 | ) | $ | 11.45 | ||||||||||||
Forfeited | — | $ | — | |||||||||||||
|
| |||||||||||||||
Options outstanding, December 31, 2011 | 678,628 | $ | 8.12 | 4.44 | $ | — | ||||||||||
Vested and expected to vest at December 31, 2011 | 678,628 | $ | 8.12 | 4.44 | $ | — | ||||||||||
U.S. AUTO PARTS NETWORK, INC. AND SUBSIDIARIES
NOTES TO CONSOLIDATED FINANCIAL STATEMENTS—(Continued)
| Shares | Weighted Average Exercise Price | Weighted Average Remaining Contractual Term (in years) | Aggregate Intrinsic Value (1) | |||||||||||||
Options outstanding, December 31, 2011 | 7,454,718 | $ | 5.03 | 6.09 | ||||||||||||
Granted | 897,500 | $ | 4.02 | |||||||||||||
Exercised | (489,105 | ) | $ | 1.30 | ||||||||||||
Expired | (228,206 | ) | $ | 5.78 | ||||||||||||
Forfeited | (206,667 | ) | $ | 4.95 | ||||||||||||
|
| |||||||||||||||
Options outstanding, December 29, 2012 | 7,428,240 | $ | 5.13 | 6.23 | $ | 273,450 | ||||||||||
Vested and expected to vest at December 29, 2012 | 7,048,525 | $ | 5.16 | 6.08 | $ | 273,445 | ||||||||||
Options exercisable, December 29, 2012 | 5,827,185 | $ | 5.12 | 5.55 | $ | 266,990 | ||||||||||
| Shares | Weighted Average Exercise Price | Weighted Average Remaining Contractual Term (in years) | Aggregate Intrinsic Value | |||||||||||||
Options exercisable, December 31, 2011 | 678,628 | $ | 8.12 | 4.44 | $ | — | ||||||||||
| (1) | These amounts represent the difference between the exercise price and the closing price of U.S. Auto Parts Network, Inc. stock on December 29, 2012 as reported on the NASDAQ National Market, for all options outstanding that have an exercise price currently below the closing price. |
There were no newThe weighted-average fair value of options granted during fiscal 2009, fiscalyear 2012, 2011 and 2010 was $2.53, $3.28 and fiscal 2011.
Aggregate Intrinsic Value (in$3.75, respectively. The intrinsic value of stock options at the table)date of the exercise is calculated as the difference between the exercise pricefair value of underlying awardsthe stock at the date of exercise and the fairexercise price. During fiscal year 2012, 2011 and 2010, the total intrinsic value price of the Company’s common stock forexercised options that were in-the-money as of December 31, 2011.
was $1.2 million, $0.5 million and $1.4 million, respectively. The Company has fully recognizedhad $2.0 million of unrecognized share-based compensation expense related to the 2006 Plan stock options outstanding as of December 31, 2011.
Additional information with respect29, 2012, which expense is expected to outstanding options under the 2006 Plan asbe recognized over a weighted-average period of December 31, 2011 is as follows:2.6 years.
| Options Outstanding | Options Exercisable | |||||||||||||||||||
Range of Exercise Prices | Options Outstanding | Weighted Average Remaining Contractual Term (in years) | Weighted- Average Exercise Price | Options Exercisable | Weighted- Average Exercise Price | |||||||||||||||
$6.78 | 480,888 | 4.24 | $ | 6.78 | 480,888 | $ | 6.78 | |||||||||||||
$9.17 | 22,800 | 4.39 | $ | 9.17 | 22,800 | $ | 9.17 | |||||||||||||
$$11.68 | 174,940 | 4.99 | $ | 11.68 | 174,940 | $ | 11.68 | |||||||||||||
|
|
|
| |||||||||||||||||
Total | 678,628 | 4.44 | $ | 8.12 | 678,628 | $ | 8.12 | |||||||||||||
Warrants
The following table summarizes the outstanding warrants at December 31, 2011:
| Shares | Weighted Average Exercise Price | Weighted Average Remaining Contractual Term (in years) | Aggregate Intrinsic Value | |||||||||||||
Warrants outstanding, January 1, 2011 | 50,000 | $ | 4.61 | 5.73 | ||||||||||||
Granted | — | $ | — | |||||||||||||
Exercised | — | $ | — | |||||||||||||
Expired | — | $ | — | |||||||||||||
Forfeited | — | $ | — | |||||||||||||
|
| |||||||||||||||
Warrants outstanding, December 31, 2011 | 50,000 | $ | 4.61 | 4.74 | $ | 67,000 | ||||||||||
Warrants exercisable, December 31, 2011 | 43,333 | $ | 4.64 | 4.74 | $ | 58,000 | ||||||||||
On May 5, 2009, the Company issued warrants to purchase up to 30,000 shares of common stock at an exercise price of $2.14 per share, which warrants terminate seven years after their grant date. The warrants were issued in connection with the financial advisory services provided by a consultant to the Company. The warrants vestvested in thirty-six equal monthly increments of 833 shares each on the last calendar day of each calendar month commencing May 5, 2009. The grant date fair value of these warrants issued on May 5, 2009 was $1.09 per share. Accordingly, these non-employee equity instruments arewere re-measured as they vestvested over the requisite service period. TheThese warrants became fully vested during the second quarter of 2012, in which the final re-measured fair value of these warrants was $2.82$3.14 per share as of December 31, 2011. share.
On April 27, 2010, the Company issued additional warrants to purchase up to 20,000 shares of common stock at an exercise price of $8.32 per share, to the same holderconsultant in connection with the financial advisory services provided to the Company. The warrants terminate seven years after their grant date. The warrants vestvested in twenty-four equal monthly increments of 833 shares each on the last calendar day of each calendar month commencing April 27, 2010. The grant date fair value of the additional warrants issued on April 27, 2010 was $2.12 per share. Accordingly, these non-employee equity instruments arewere re-measured as they vestvested over the requisite service period. TheThese warrants became fully vested during the quarter ended March 31, 2012, in which the final re-measured fair value of these warrants was $1.20$1.42 per share as of December 31, 2011. share.
The Company determined the fair value of the warrants at the date of grant, and upon the re-measurement dates, using the Black-Scholes option pricing model based on the fair value of the underlying common stock, the exercise price, remaining contractual term, risk-free rate and expected volatility. No warrants were
U.S. AUTO PARTS NETWORK, INC. AND SUBSIDIARIES
NOTES TO CONSOLIDATED FINANCIAL STATEMENTS—(Continued)
exercised induring fiscal 2009, 2010year 2012. As of December 29, 2012, warrants to purchase 50,000 shares of common stock were outstanding and 2011. Aggregate Intrinsic Value (in the table) isexercisable. The aggregate intrinsic value of outstanding and exercisable warrants was $0 as of December 29, 2012, which was calculated as the difference between the exercise price of underlying awards and the fair valueclosing price of the Company’s common stock for warrants that were in-the-money as of December 31, 2011.in-the-money. Total warrants share-based compensation expense recognized induring the fiscal 2009,year 2012, 2011 and 2010 was $16,000, $65,000 and 2011, amounted$81,000, respectively. The Company had no unrecognized share-based compensation expense related to $20,154, $81,297 and $65,318, respectively.warrants outstanding as of December 29, 2012.
Performance Stock Options
In February 2009,fiscal year 2012, 2011 and 2010, the Company’s Board approved option grants, which contained market condition requirements. These options will vest based on the achievement of specified stock price appreciation milestones, which represents a market condition, over a five-year period commencing on February 16, 2009. The February 2009 option grants were for 100,000 shares. The fair value of the options were estimated on the date of grant using the Monte Carlo option pricing model with the following weighted-average assumptions for the period ended:
| January 2, 2010 | ||||
Expected life | 3.3 years | |||
Risk-free interest rate | 1.87 | % | ||
Expected volatility | 50 | % | ||
Expected dividend yield | 0 | % | ||
Initial stock price | $ | 1.15 | ||
In fiscal 2009, 2010 and 2011, the BoardDirectors approved 125,000 shares, 200,000125,000 shares and 125,000200,000 shares, respectively, of performance options that generally vest over a four-year period based on the achievement of operational goals. The performance option grants were valued using the Black-Scholes option pricing model in the same manner as other stock option grants, as discussed below. We record share-based compensation expense when it is probable that the performance criteria will be met.
Share-Based Compensation Expense
The fair value of each option grant was estimated on the date of grant using the Black-Scholes option pricing model with the following assumptions for each of the periods ended:
| Fifty-Two Weeks Ended | ||||||||||||
| January 2, 2010 | January 1, 2011 | December 31, 2011 | December 29, 2012 | December 31, 2011 | January 1, 2011 | |||||||
Expected life | 5.99 – 6.25 years | 6 – 6.25 years | 6 – 6.25 years | 5.73 years | 6 – 6.25 years | 6 – 6.25 years | ||||||
Risk-free interest rate | 2% – 3% | 2% – 3% | 1% – 3% | 1% | 1% – 3% | 2% – 3% | ||||||
Expected volatility | 50% – 52% | 51% | 50% – 52% | 71% – 74% | 50% – 52% | 51% | ||||||
Expected dividend yield | 0% | 0% | 0% | 0% | 0% | 0% | ||||||
Share-based compensation from options, warrants and stock awards, is included in our consolidated statements of comprehensive operations, as follows (in thousands):
| Fifty-Two Weeks Ended | ||||||||||||
| December 29, 2012 | December 31, 2011 | January 1, 2011 | ||||||||||
Marketing expense | $ | 505 | $ | 413 | $ | 321 | ||||||
General and administrative expense | 1,119 | 1,580 | 1,869 | |||||||||
Fulfillment expense(1) | (38 | ) | 370 | 376 | ||||||||
Technology expense | 87 | 244 | 176 | |||||||||
|
|
|
|
|
| |||||||
Total share-based compensation expense | $ | 1,673 | $ | 2,607 | $ | 2,742 | ||||||
|
|
|
|
|
| |||||||
| (1) | For the fifty-two weeks ended December 29, 2012, the negative balance was due to an adjustment of $279,500 related to performance stock options because the performance goal was not met or it is not probable that the performance goal will be met at the end of the requisite service period. |
The Company recognized share-based compensation expense of $3.3 million, $2.7 million and $2.6 million,is net of $245,000, $186,000 and $218,000 of expenseamounts capitalized asto internally-developed software for each of $252,000, $219,000 and $186,000 during the fiscal 2009,year 2012, 2011 and 2010, and 2011, respectively. The Company has recognized an income tax benefit of $1.2 million for fiscal 2009. No tax benefit was recognized for fiscal 2010year 2012, 2011 and fiscal 20112010 due to the valuation allowance position. Share-based compensation is included in our Consolidated Statements of Operations as follows:
| 52 Weeks Ended January 2, 2010 | 52 Weeks Ended January 1, 2011 | 52 Weeks Ended December 31, 2011 | ||||||||||
Marketing expense | $ | 436 | $ | 321 | $ | 413 | ||||||
General and administrative expense | 2,276 | 1,869 | 1,580 | |||||||||
Fulfillment expense | 213 | 376 | 370 | |||||||||
Technology expense | 345 | 176 | 244 | |||||||||
|
|
|
|
|
| |||||||
Total share-based compensation expense | $ | 3,270 | $ | 2,742 | $ | 2,607 | ||||||
|
|
|
|
|
| |||||||
Under ASC 718, forfeitures are estimated at the time of grant and revised, if necessary, in subsequent periods if actual forfeitures significantly differ from those estimates. OurThe Company’s estimated forfeiture rate wasrates are calculated based on actual historical forfeitures experienced under our equity plans. In the fourthfirst quarter of fiscal 2011,2012, the Company performed itsa periodic review of the estimated forfeiture raterates and determined an increase to the existing forfeiture rates was necessary. This increase was primarily attributed to higher terminations in the non-executive employee group than was previously expected. Accordingly, the Company updated the forfeiture rates from 10%-18%, to 16%-34% and has applied such revised rates during the last fifty-two weeks and noted no significant forfeitures which would change the estimated forfeiture rate from the previous year. Therefore, the weighted-average forfeiture rate from 10% to 18% was used as consistent with the prior year.
U.S. AUTO PARTS NETWORK, INC. AND SUBSIDIARIES
NOTES TO CONSOLIDATED FINANCIAL STATEMENTS—(Continued)
There was $3.5 million, net of estimated forfeitures of approximately $1.8 million, of unrecognized compensation expense related to stock options and warrants as ofended December 31, 2011, which expense is expected to be recognized over a weighted-average period of 2.40 years. The table below sets forth the expected amortization of share-based compensation expense for the next four years for all options and warrants outstanding and unvested as of December 31, 2011, assuming all employees remain employed by the Company for their remaining vesting periods (in thousands):29, 2012.
| Fifty-Two Weeks Ending | ||||||||||||||||
| Dec. 29, 2012 | Dec. 28, 2013 | Jan. 3, 2015 | Jan. 2, 2016 | |||||||||||||
Future amortization of share-based compensation | $ | 1,685 | $ | 1,084 | $ | 620 | $ | 153 | ||||||||
Note 9 – Net Income (Loss)Loss Per Share
Net income (loss)loss per share has been computed in accordance with ASC 260Earnings per Share. The following table sets forth the computation of basic and diluted net income (loss)loss per share:share (in thousands, except per share data):
| 52 Weeks Ended January 2, 2010 | 52 Weeks Ended January 1, 2011 | 52 Weeks Ended December 31, 2011 | ||||||||||
| (in thousands, except share and per share data) | ||||||||||||
| Net income (Loss) Per Share | ||||||||||||
Numerator: | ||||||||||||
Net income (loss) | $ | 1,317 | $ | (13,926 | ) | $ | (15,137 | ) | ||||
Denominator: | ||||||||||||
Weighted-average common shares outstanding (basic) | 29,851,873 | 30,269,462 | 30,545,638 | |||||||||
Common equivalent shares from common stock options and warrants | 957,238 | — | — | |||||||||
|
|
|
|
|
| |||||||
Weighted-average common shares outstanding (diluted) | 30,809,111 | 30,269,462 | 30,545,638 | |||||||||
Basic net income (loss) per share | $ | 0.04 | $ | (0.46 | ) | $ | (0.50 | ) | ||||
Diluted net income (loss) per share | $ | 0.04 | $ | (0.46 | ) | $ | (0.50 | ) | ||||
|
|
|
|
|
| |||||||
| Fifty-Two Weeks Ended | ||||||||||||
| December 29, 2012 | December 31, 2011 | January 1, 2011 | ||||||||||
Net loss per share: | ||||||||||||
Numerator: | ||||||||||||
Net loss | $ (35,978 | ) | $ (15,137 | ) | $ (13,926 | ) | ||||||
Denominator: Weighted-average common shares outstanding (basic) Common equivalent shares from common stock options and warrants Weighted-average common shares outstanding (diluted) Basic and diluted net loss per sharePotentially dilutive 30,818 30,546 30,269 — — — 30,818 30,546 30,269 $ (1.17 ) $ (0.50 ) $ (0.46 )
The weighted-average anti-dilutive securities, were not included inwhich are excluded from the calculation of diluted net income (loss)earnings per share because these securities would be anti-dilutive due to the Company’s net loss position for the periods then ended (including securities that would otherwise be excluded from the calculation of diluted earnings per share due the Company’s stock price. The related securitiesprice), are as follows (in common equivalent shares)thousands):
| 52 Weeks Ended January 2, 2010 | 52 Weeks Ended January 1, 2011 | 52 Weeks Ended December 31, 2011 | ||||||||||
Common stock warrants | — | 12,033 | 20,000 | |||||||||
Options to purchase common stock | 6,777,494 | 1,508,289 | 2,524,982 | |||||||||
|
|
|
|
|
| |||||||
Total | 6,777,494 | 1,520,232 | 2,544,982 | |||||||||
|
|
|
|
|
| |||||||
Additionally, due to the net loss in fiscal 2010 and fiscal 2011, 1,700,550 and 1,418,460, respectively, common equivalent warrant and option shares have been excluded from the computation of diluted net income (loss) per share.
| Fifty-Two Weeks Ended | ||||||||||||
| December 29, 2012 | December 31, 2011 | January 1, 2011 | ||||||||||
Common stock warrants | 50 | 50 | 50 | |||||||||
Options to purchase common stock | 7,642 | 7,209 | 6,693 | |||||||||
|
|
|
|
|
| |||||||
Total | 7,692 | 7,259 | 6,743 | |||||||||
|
|
|
|
|
| |||||||
Note 10 – Income Taxes
As discussed in“Note 1 – Summary of Significant Accounting Policies and Nature of Operations”, the Company applies the current U.S. GAAP on accounting for uncertain tax positions, which prescribe a recognition threshold and a measurement attribute for the financial statement recognition and measurement of tax positions taken or expected to be taken in a tax return. For those benefits to be recognized, a tax position must be more-likely-than-not to be sustained upon examination by taxing authorities. The amount recognized is measured as the largest amount of benefit that has greater than 50 percent likelihood of being realized upon ultimate settlement. We consider many factors when evaluating and estimating our tax positions and tax benefits, which may require periodic adjustments and which may not accurately forecast actual outcomes. As of December 31, 2011,29, 2012, the Company had no material unrecognized tax benefits, interest or penalties related to federal and state income tax matters. The Company’s policy is to record interest and penalties as income tax expense.
The Company is subject to U.S. AUTO PARTS NETWORK, INC. AND SUBSIDIARIES
NOTES TO CONSOLIDATED FINANCIAL STATEMENTS—(Continued)
During fiscal 2010, the Company was audited by the Internal Revenue Service for the year ended December 31, 2008. The audit was concluded with no change.federal income tax as well as income tax of foreign and state tax jurisdictions. The tax years 2007-20102008-2011 remain open to examination by the major taxing jurisdictions to which the Company is subject, except the Internal Revenue Service for which the tax years 2009-20102009-2011 remain open. The Company does not anticipate a significant change to the amount of unrecognized tax benefits within the next twelve months.
The components of income (loss)loss before income taxestax provision consist of the following:following (in thousands):
| 52 Weeks Ended January 2, 2010 | 52 Weeks Ended January 1, 2011 | 52 Weeks Ended December 31, 2011 | Fifty-Two Weeks Ended | |||||||||||||||||||||
| (in thousands) | December 29, 2012 | December 31, 2011 | January 1, 2011 | |||||||||||||||||||||
Domestic operations | $ | 3,795 | $ | (2,540 | ) | $ | (16,976 | ) | $ | (37,469 | ) | $ | (16,976 | ) | $ | (2,540 | ) | |||||||
Foreign operations | 645 | 832 | 327 | 554 | 327 | 832 | ||||||||||||||||||
|
|
|
|
|
| |||||||||||||||||||
Total income (loss) before income taxes | $ | 4,440 | $ | (1,708 | ) | $ | (16,649 | ) | ||||||||||||||||
Total loss before income taxes | $ | (36,915 | ) | $ | (16,649 | ) | $ | (1,708 | ) | |||||||||||||||
|
|
|
|
|
| |||||||||||||||||||
Income tax (benefit) provision (benefit) for fiscal 2009, fiscalyear 2012, 2011 and 2010 and fiscal 2011 consists of the following:following (in thousands):
| 52 Weeks Ended January 2, 2010 | 52 Weeks Ended January 1, 2011 | 52 Weeks Ended December 31, 2011 | Fifty-Two Weeks Ended | |||||||||||||||||||||
| (in thousands) | December 29, 2012 | December 31, 2011 | January 1, 2011 | |||||||||||||||||||||
Current: | ||||||||||||||||||||||||
Federal tax | $ | (774 | ) | $ | (434 | ) | $ | — | $ | — | $ | — | $ | (434 | ) | |||||||||
State tax | 193 | 8 | 23 | 14 | 23 | 8 | ||||||||||||||||||
Foreign tax | 56 | 73 | 4 | (76 | ) | 4 | 73 | |||||||||||||||||
|
|
|
|
|
| |||||||||||||||||||
Total current taxes | (525 | ) | (354 | ) | 27 | (62 | ) | 27 | (354 | ) | ||||||||||||||
|
|
|
|
|
| |||||||||||||||||||
Deferred: | ||||||||||||||||||||||||
Federal tax | 2,568 | 61 | (5,516 | ) | ||||||||||||||||||||
State tax | 1,080 | 13 | (1,728 | ) | ||||||||||||||||||||
Foreign tax | — | — | — | |||||||||||||||||||||
|
|
| ||||||||||||||||||||||
Total deferred taxes | 3,648 | 74 | (7,244 | ) | ||||||||||||||||||||
|
|
| ||||||||||||||||||||||
Valuation allowance | — | 12,498 | 5,705 | |||||||||||||||||||||
|
|
| ||||||||||||||||||||||
Income tax provision (benefit), consolidated | $ | 3,123 | $ | 12,218 | $ | (1,512 | ) | |||||||||||||||||
|
|
| ||||||||||||||||||||||
Deferred: Federal tax State tax Foreign tax Total deferred taxes Valuation allowance Income tax (benefit) provision Fifty-Two Weeks Ended December 29,
2012 December 31,
2011 January 1,
2011 (12,612 ) (5,516 ) 61 (2,618 ) (1,728 ) 13 275 — — (14,955 ) (7,244 ) 74 14,080 5,705 12,498 $ (937 ) $ (1,512 ) $ 12,218
Income tax (benefit) provision (benefit) differs from the amount that would result from applying the federal statutory rate as follows:follows (in thousands):
| 52 Weeks Ended January 2, 2010 | 52 Weeks Ended January 1, 2011 | 52 Weeks Ended December 31, 2011 | ||||||||||||||||||||||
| (in thousands) | December 29, 2012 | December 31, 2011 | January 1, 2011 | |||||||||||||||||||||
Income tax at U.S. federal statutory rate | $ | 1,511 | $ | (581 | ) | $ | (5,661 | ) | $ | (12,551 | ) | $ | (5,661 | ) | $ | (581 | ) | |||||||
Share-based compensation | 1,086 | (93 | ) | 21 | 38 | 21 | (93 | ) | ||||||||||||||||
State income tax, net of federal tax effect | 729 | (759 | ) | (1,629 | ) | (2,528 | ) | (1,629 | ) | (759 | ) | |||||||||||||
Tax exempt interest | (16 | ) | (8 | ) | (3 | ) | — | (3 | ) | (8 | ) | |||||||||||||
Foreign tax | (163 | ) | (210 | ) | (108 | ) | (27 | ) | (108 | ) | (210 | ) | ||||||||||||
Non deductible acquisition costs | — | 258 | — | — | — | 258 | ||||||||||||||||||
Other | (24 | ) | 1 | 140 | 51 | 140 | 1 | |||||||||||||||||
Change in valuation allowance | — | 13,610 | 5,728 | 14,080 | 5,728 | 13,610 | ||||||||||||||||||
|
|
|
|
|
| |||||||||||||||||||
Effective tax provision (benefit) | $ | 3,123 | $ | 12,218 | $ | (1,512 | ) | |||||||||||||||||
Effective tax (benefit) provision | $ | (937 | ) | $ | (1,512 | ) | $ | 12,218 | ||||||||||||||||
|
|
|
|
|
| |||||||||||||||||||
U.S. AUTO PARTS NETWORK, INC. AND SUBSIDIARIES
NOTES TO CONSOLIDATED FINANCIAL STATEMENTS—(Continued)
The Company’s effective tax rate was impacted by income taxes incurred in foreign and state jurisdictions. With respect to the income of its foreign subsidiaries, the Company takes the position that the earnings of the foreign subsidiaries are permanently invested in that jurisdiction. Additionally, the foreign subsidiaries are currently in a cumulative deficit earnings and profits position for tax purposes. As a result, no additional income taxes have been provided on the possible repatriation of these earnings to the parent company. The favorable impact of foreign taxes is due in large part to a tax holiday in the Philippines, which was effective through September 2011. The Company is in the process of applying for a one year extension. Although management expects the extension to be approved based on its discussion with the foreign taxing authority, the full Philippines tax rate has been applied to the earnings after the expiration of the initial tax holiday. The impact of this tax holiday decreased foreign taxes by $136,000, $182,000 and $144,000 for fiscal 2009, fiscal 2010 and fiscal 2011, respectively. The benefit of the tax holiday on net income (loss) per share (diluted) was immaterial for the related years.
For fiscal 2009, fiscalyear 2012, 2011 and 2010, and fiscal 2011, the effective tax rate for the Company was 70.33%2.5%, (715.28)%9.1% and 9.08%(715.3)%, respectively. The Company’s effective tax rate for fiscal 2009 differs from the U.S. federal statutory rate primarily as a result of state income taxes and other non-deductible permanent differences including stock option forfeitures with a tax effected value of $1.1 million as described below. The Company’s effective tax rate for fiscal 2010year 2012 differs from the U.S. federal statutory rate primarily as a result of the recording of a $13.6$14.1 million valuation allowance against the Company’s deferred tax assets. In 2012, the effective income tax benefit stems primarily from the reversal of the net deferred income tax liability resulting from the write down of goodwill and other intangible assets, and the impact of the Philippine tax holiday, partially offset by the accrual of withholding taxes related to potential repatriation of earnings in the Philippines. The Company’s effective tax rate for fiscal year 2011 differs from the U.S. federal statutory rate primarily as a result of the recording of a $5.7 million valuation allowance against the Company’s deferred tax assets. Additionally, the Company’s fiscal 2011 tax benefit was substantially the result of a $5.1 million impairment loss on intangibles resulting in the reduction of long term deferred tax liabilities. The Company’s effective tax rate for fiscal year 2010 differs from the U.S. federal statutory rate primarily as further discusseda result of the recording of a $14.1 million valuation allowance against the Company’s deferred tax assets.
The Company’s effective tax rate was impacted by income taxes incurred in“Note — 6 Goodwill foreign jurisdictions. With respect to the income of its foreign subsidiaries, prior to 2012, the Company treated earnings of the foreign subsidiaries as permanently invested in that jurisdiction. As a result, no additional income tax withholding was provided on the possible future repatriation of these earnings to the parent company in prior years. During 2012, based on current year operating and Intangibles”.future cash flow needs the Company decided that it could no longer represent that these funds would be indefinitely reinvested in the foreign jurisdictions, but that such funds may be needed for general corporate purposes. As a result the Company has recorded future withholding taxes which would be due if the funds are required to be repatriated. The Company intends to continue to pursue all reasonable means to increase its investment in the foreign jurisdictions as dictated by future growth in general business activities or as allowed by the foreign jurisdictions to avoid incurring the income tax withholding expense. The favorable impact of foreign taxes is due in large part to a tax holiday in the Philippines, which was effective through September 2012. The Company is in the process of applying for a one year extension. Although management expects the extension to be approved based on its discussion with the foreign taxing authority, the Philippines tax liability has been computed assuming no tax holiday on the post expiration earnings. The impact of this tax holiday decreased foreign taxes by $72,000, $144,000 and $182,000 for fiscal year 2012, 2011 and 2010, respectively. The benefit of the tax holiday on net loss per share was immaterial for the related years.
Deferred tax assets and deferred tax liabilities at January 2, 2010, January 1, 2011 and December 31, 2011 consisted of the following:following (in thousands):
| January 2, 2010 | January 1, 2011 | December 31, 2011 | ||||||||||||||||||
| (in thousands) | December 29, 2012 | December 31, 2011 | ||||||||||||||||||
Deferred tax assets: | ||||||||||||||||||||
Inventory and inventory related reserve | $ | 642 | $ | 1,712 | $ | 1,591 | $ | 1,029 | $ | 1,591 | ||||||||||
Share-based compensation | 2,109 | 3,218 | 4,017 | 4,378 | 4,017 | |||||||||||||||
Amortization | 10,856 | 12,517 | 9,418 | 15,668 | 9,418 | |||||||||||||||
Sales and bad debt allowances | 422 | 689 | 795 | 773 | 795 | |||||||||||||||
Vacation accrual | 191 | 284 | 290 | 345 | 290 | |||||||||||||||
Other comprehensive income | 33 | 34 | 9 | — | 9 | |||||||||||||||
Net operating loss and AMT credit carry-forwards | 88 | 4,169 | 13,250 | 17,656 | 13,250 | |||||||||||||||
Other | 257 | 322 | 65 | 401 | 65 | |||||||||||||||
|
|
|
|
| ||||||||||||||||
Total deferred tax assets | 14,598 | 22,945 | 29,435 | 40,250 | 29,435 | |||||||||||||||
Valuation Allowance | — | (18,335 | ) | (22,817 | ) | (36,896 | ) | (22,817 | ) | |||||||||||
|
|
|
|
| ||||||||||||||||
Net deferred tax assets | 14,598 | 4,610 | 6,618 | 3,354 | 6,618 | |||||||||||||||
|
|
|
|
| ||||||||||||||||
Deferred tax liabilities: | ||||||||||||||||||||
Tax over book depreciation | 2,100 | 1,582 | 5,270 | 3,206 | 5,270 | |||||||||||||||
Tax over book amortization | — | 5,289 | 2,226 | 130 | 2,226 | |||||||||||||||
Prepaid catalog expenses | — | 426 | 272 | 293 | 272 | |||||||||||||||
|
|
|
|
| ||||||||||||||||
Total deferred tax liabilities | 2,100 | 7,297 | 7,768 | 3,629 | 7,768 | |||||||||||||||
|
|
|
|
| ||||||||||||||||
Net deferred tax assets (liabilities) | $ | 12,498 | $ | (2,687 | ) | $ | (1,150 | ) | ||||||||||||
Net deferred tax liabilities | $ | (275 | ) | $ | (1,150 | ) | ||||||||||||||
|
|
|
|
| ||||||||||||||||
At December 31, 2011,29, 2012, federal and state net operating loss (“NOL”) carryforwards were $28.3$39.2 million and $42.2$53.9 million respectively. Federal NOL carryforwards of $2.7 million were acquired in the acquisition of WAG which are subject to Internal Revenue Code section 382 and limited to an annual usage limitation of $135,000. Additionally, athe tax benefit of $0.9$0.7 million related toof the federal and state NOL carryforwards which was created by the exercise of stock options will be credited to additional paid-in-capital once recognized. Federal NOL carryforwards begin to expire in 2029, and 2030, while state NOL carryforwards begin to expire in 2016. The state NOL carryforwards expire in the respective tax years as follows:follows (in thousands):
2016 - 2022 | $ | 36,025 | ||
2023 - 2031 | 6,200 | |||
|
| |||
| $ | 42,225 | |||
|
|
U.S. AUTO PARTS NETWORK, INC. AND SUBSIDIARIES
NOTES TO CONSOLIDATED FINANCIAL STATEMENTS—(Continued)
2016 – 2022 | $ | 38,853 | ||
2023 – 2032 | 15,083 | |||
|
| |||
| $ | 53,936 | |||
|
|
The valuation allowance for deferred tax assets recorded during fiscal 2010year 2012 and 2011 is based on a more likely than not threshold. The ability to realize deferred tax assets depends on the ability to generate sufficient taxable income within the carryback or carryforward periods provided for in the tax law for each applicable tax jurisdiction. We considered the following possible sources of taxable income when assessing the realization of deferred tax assets:
Future reversals of existing taxable temporary differences;
Future taxable income exclusive of reversing temporary differences and carryforwards;
Taxable income in prior carryback years; and
Tax-planning strategies.
The assessment regardingUnder the provisions of ASC 740, “Income Taxes”, Management is required to evaluate whether a valuation allowance is required or should be adjusted also considers, among other matters,established against its deferred tax assets based on the nature, frequency and severityconsideration of recent lossesall available evidence using a “more likely than not” standard. Realization of the combined USAP and WAG operations, forecastsdeferred tax assets is dependent upon taxable income in prior carryback years, estimates of future profitability, the duration of statutory carryforward periods, our experience with tax attributes expiring unused andtaxable income, tax planning alternatives. In making such judgments, significant weight is given to evidencestrategies, and reversal of existing taxable temporary differences. ASC 740 provides that can be objectively verified.
Concludingforming a conclusion that a valuation allowance is not requiredneeded is difficult when there is significant negative evidence that is objective and verifiable, such as cumulative losses in recent years or losses expected in early future years. Although we expect that the operations of the recently acquired WAG business and our ability to achieve future profitability of these operations was enhanced by the cost reductions that occurred as a result of the acquisition and subsequent integration efforts, WAG’s historic operating results remain relevant as they are reflective of the industry and the effect of economic conditions. The fundamental businesses and inherent risks in which the WAG business operates did not change from those which existed prior to the acquisition. We utilized a three-year analysis of actual results as the primary measure of cumulative losses in recent years. However, because a substantial portion of those cumulative losses relate to impairment of intangible assets and goodwill, those three-year cumulative results are adjusted for the effect of these items. In addition, the near- and medium-term financial outlook is considered when assessing the need for a valuation allowance.
The valuation of deferred tax assets requires judgment and assessment of the future tax consequences of events that have been recorded in the financial statements or in the tax returns, and our future profitability represents our best estimate of those future events. Changes in our current estimates, due to unanticipated events or otherwise, could have a material effectBased on our financial condition and results of operations. Prior to the acquisition of WAG, the Company concluded that it was more likely than not that we would realize the deferred tax assets in all jurisdictions. However, with the acquisition of WAG in 2010, based largely on the weight of the combined cumulative three-year adjusted loss position, it was determined that it was not more likely than not that the Company would realize its net deferred tax assetsthis evaluation, as of January 1, 2011. Therefore,December 31, 2012, a valuation allowance of $18.3$36.9 million washas been recorded as of January 1, 2011, of which $4.7 million was recorded in relation to WAG in connection withagainst our acquisition in August 2010. Based on the same determination, an additional valuation allowance of $5.7 million was recorded as of December 31, 2011, resulting in a valuation allowance balance of $22.8 million as of December 31, 2011.deferred tax assets.
If, in the future, we generate taxable income on a sustained basis in jurisdictions where we have recorded full valuation allowances, our conclusion regarding the need for full valuation allowances in these tax jurisdictions could change, resulting in the reversal of some or all of the valuation allowances. If our operations generate taxable income prior to reaching
profitability on a sustained basis, we would reverse a portion of the valuation allowance related to the corresponding realized tax benefit for that period, without changing our conclusions on the need for a full valuation allowance against the remaining net deferred tax assets.
Included in accrued expenses are income taxes payable of $39,000,$25,000, $93,000 and $95,000 and $93,000 for the fiscal years ended 2009,year 2012, 2011 and 2010, and 2011, respectively, consisting primarily of foreign taxes.
Note 11 – Related-Party TransactionsCommitments and Contingencies
Beginning in November 2003, the Company leased itsFacilities Leases
The Company’s corporate headquarters and primary warehouse from Nia Chloe, LLC (“Nia Chloe”), a memberfacilities are located in Carson, California. As of which, Sol Khazani, is oneDecember 29, 2012, we maintained multiple separate leases for the Carson, California facilities. The Company’s corporate headquarters has an initial lease term of our board members. Another Nia Chloe member, Mehran Nia, was also one of our board members until his resignation in December 2009. Lease paymentsfive years through October 2016, and expenses associated with this related party arrangement totaled $535,000, $389,000 and $374,000, respectively, for fiscal years 2009, 2010 and 2011.optional renewals through January 2020. The Company has evaluated its relationship with Nia Chloe with regardalso leases warehouse space in Chesapeake, Virginia under an agreement scheduled to ASC 810Consolidation(“ASC 810”).expire in June 2016. The Company has determined that Nia Chloe does not meetalso leases office and warehouse space in Independence, Ohio on a month-to-month basis since the criteriaagreement expired in January 2013. The Company’s Philippines subsidiary leases office space under a sixty-three month agreement through May 2015, renewable for consolidation under ASC 810 and therefore this entity is not consolidated in the Company’s financial statements.
U.S. AUTO PARTS NETWORK, INC. AND SUBSIDIARIES
NOTES TO CONSOLIDATED FINANCIAL STATEMENTS—(Continued)
From time to time, the Company purchased inventory from an entity that was partially owned until 2009 by a memberadditional sixty months through April 2020. As of the Company’s Board of Directors. During fiscal 2009, the Company purchased inventory totaling $330,000, from the entity, which the Company believes to be at fair market value.
Since October 2006,date hereof, the Company has purchased paid search engine marketing servicesnot committed to any facilities lease renewals.
Facility rent expense for fiscal year ended 2012, 2011 and 2010 was $2.4 million, $2.6 million and $2.4 million, respectively. The Company’s facility rent expense was inclusive of amounts charged from a related party during the fiscal year ended 2012, 2011 and 2010 of $374,000, $374,000 and $389,000, respectively.
On September 22, 2011, the Company entered into a sublease agreement (the “Sublease”) with Timec Company Inc. (“Timec”) for the leasing of approximately 25,000 square feet of commercial office space located at 16941 Keegan Avenue, Carson, California 90746. The Sublease enabled the Company to consolidate its corporate office space from three buildings into one, and allowed the Company to consolidate its California fulfillment operations into one warehouse, which reduced its monthly rent expense. The Sublease has an entityinitial term of which a member60 months (“Initial Term”), and commenced on November 1, 2011. Pursuant to the terms of the Sublease, effective the 42nd month of the Initial Term, we have the ability to terminate the Sublease in exchange for the payment of a termination fee. Additionally, we have the option to renew the Sublease at the end of the Initial Term for an additional 12 month period, as well as the option to renew the Sublease for an additional period thereafter through January 2020. Pursuant to the terms of the Sublease, the rent, including additional rent, shall be approximately $26,300 per month for the first year, $27,600 per month for the second year, $29,100 per month for the third year, $30,600 per month for the fourth year, and $32,300 per month for the fifth year. Rent for any subsequent term, after the expiration of the Initial Term, will be negotiated in good faith between the parties. Under the terms of the Sublease, we are required to maintain certain levels of insurance and are required to indemnify Timec for losses incurred that are related to our use or occupancy of the property.
In January 2010, the Company’s BoardPhilippines subsidiary entered into a new lease agreement that accommodates the Company’s Philippines workforce into one office building from its previous offices in Pasig and Makati; the leases for the Pasig and Makati facilities were terminated in July and October 2010, respectively. Under the terms of Directors served as CEO until 2008 and chairman until mid-2009. During fiscal 2009,the lease agreement, the Company purchased paid search engine marketing services totaling $225,000 fromadded approximately 39,665 square feet of space for a period of 63 months, effective March 1, 2010. Monthly rental fee of approximately $25,000 is subject to 5% annual escalation beginning on the entity, which3rd year of the Company believes to be at fair market value.lease term and renewable for a sixty (60)-month term upon mutual agreement of both parties.
In SeptemberDecember 2008, the Company entered into a verbalfive-year operating lease for warehouse space in Chesapeake, Virginia, which commenced in January 2009 and was initially scheduled to expire in December 2013. Under the terms of the lease, the Company added approximately 72,500 square feet of space for initial monthly rent of approximately $15,000 with annual rent escalations. Additionally, the Company had the option to extend the terms for an additional five years on or before June 30, 2013. In July 2011, we signed a five-year extension to June 30, 2016, which also added approximately 87,000 square feet of space. The monthly base rent commitment was $59,700 as of December 29, 2012.
Upon our acquisition of WAG, we assumed a lease related to their office and warehouse space (60,845 square feet) in Independence, Ohio which was originally executed on January 1, 2003 and amended on October 3, 2003 and February 1, 2008. The lease expired on January 31, 2013 and we are currently on a month-to-month lease.
Also, upon our acquisition of WAG, we assumed a sublease related to their corporate headquarter office (22,323 square feet) in Chicago, Illinois which was originally executed on December 4, 2007. The term of the lease commenced on May 14, 2008 and would have expired on January 13, 2017. The annual base rent for the initial lease term through January 31, 2009
was $0.3 million with an annual escalation of $0.1 million commencing from February 1, 2009 through the remaining lease term. In October 2011, the Company, WAG, and Discovery Communications, LLC (“Discovery”) entered into a Buyout Agreement for the purpose of providing Discovery with an incentive to enter into a direct lease agreement with 111 East Wacker LLC (“East Wacker”) for WAG’s former corporate headquarters located in Chicago, Illinois. In connection with the Buyout Agreement, the total obligation of $1.5 million that was recorded in September 2011 was paid by the Company to Discovery during the fourth quarter of fiscal 2011. Also, in October 2011, the Company, WAG, East Wacker and Marketing Werks, Inc. (“Marketing Werks’) entered into a memberLease, Sublease, and License Termination and Surrender Agreement (the “Termination Agreement”) for the purpose of terminating WAG’s sublease agreement with Marketing Werks, dated December 4, 2007, related to WAG’s former corporate headquarters in Chicago, Illinois.
Minimum lease commitments under non-cancelable operating leases as of December 29, 2012 are as follows (in thousands):
2013 | $ | 1,399 | ||
2014 | 1,130 | |||
2015 | 1,127 | |||
2016 | 690 | |||
2017 | — | |||
Thereafter | — | |||
|
| |||
Total minimum lease commitments | $ | 4,346 | ||
|
|
Capital lease commitments as of December 29, 2012 were as follows (in thousands):
| Capital Lease Commitments | Less: Interest Payments | Principal Obligations | ||||||||||
2013 | $ | 74 | $ | 5 | $ | 69 | ||||||
2014 | 23 | 2 | 21 | |||||||||
2015 | 23 | 1 | 22 | |||||||||
2016 | 23 | 1 | 22 | |||||||||
2017 | 6 | — | 6 | |||||||||
|
|
|
|
|
| |||||||
Total | $ | 149 | $ | 9 | $ | 140 | ||||||
|
|
|
|
|
| |||||||
Legal Matters
Parts Geek Litigation.In June 2009, the Company filed suit in the United States District Court for the Central District of California against Parts Geek LLC (“Parts Geek”), certain of its members and employees for misappropriation of trade secrets, breach of contract and unfair competition and requesting monetary damages and injunctive relief, and Parts Geek filed an answer in August 2009. In January 2010, the complaint was amended to include claims for copyright infringement and to add Lucas Thomason, a former employee, as an additional party. Parts Geek filed an answer and counterclaims to the amended complaint in February 2010. Each party filed a motion for summary judgment requesting that the Court rule on all claims made in this matter without sending the matter to a jury. In June 2010, the Court ruled on all claims in the matter, denying the Company’s claims against Parts Geek and Lucas Thomason and denying Parts Geek’s claims against the Company. The judge additionally denied Parts Geek’s counterclaims against the Company. Parts Geek and Lucas Thomason petitioned the Court to order the Company to pay their legal fees and costs, the Court ordered the Company to do so and in August 2010 all parties stipulated that approximately $1.1 million of legal fees and costs would be owed to Parts Geek and Lucas Thomason should the Company lose its appeal or win its appeal and lose in trial. A bond was posted to guarantee payment of $1.1 million plus interest, at a cost of approximately $0.02 million to the Company. The Company filed an appeal and filed its initial brief on January 21, 2011. The reply brief was filed March 21, 2011. The appeal was fully briefed by all parties and oral argument before the Ninth Circuit Court of Appeals occurred on March 6, 2012. On August 31, 2012, the Ninth Circuit Court of Appeals reversed the District Court’s granting of summary judgment in favor of Parts Geek and Lucas Thomason; vacated the District Court’s entry of legal fees and costs to Parts Geek and Lucas Thomason; and remanded the case back to the District Court for trial. Also, the Ninth Circuit Court of Appeals upheld the District Court’s granting of summary judgment in favor of Parts Geek dismissing a portion of the Company’s Boardmisappropriation of Directors, Mehran Nia,trade secrets claim and dismissing the Company’s breach of contract claim as to provide consulting services. The arrangement could be terminatedonly one of Parts Geek’s employees. Also, the Ninth Circuit Court of Appeals upheld the District Court’s granting of summary judgment in favor of the Company dismissing Parts Geek’s counterclaims against the Company. On December 14, 2012, the Company and Parts Geek, certain of its members and employees, and Lucas Thomason entered into a settlement agreement resolving all of the parties’ claims against each other in this matter. On December 18, 2012, all claims of each of the parties to this matter were dismissed with prejudice and settlement amount was not material.
Asbestos. A wholly-owned subsidiary of the Company, Automotive Specialty Accessories and Parts, Inc. and its wholly-owned subsidiary WAG, are named defendants in several lawsuits involving claims for damages caused by either party at anytime,installation of brakes during the late 1960’s and early 1970’s that contained asbestos. WAG marketed certain brakes, but did not manufacture any brakes. WAG maintains liability insurance coverage to protect its and the director was paid $10,000 per month. Mr. Nia resignedCompany’s assets from losses arising from the Board of Directors in December 2009. During fiscal 2009litigation and 2010, the total consulting fees paid were $120,000 and $10,000, respectively, to the individual. The arrangement was terminated in January 2010,coverage is provided on an occurrence rather than a claims made basis, and the final payment was madeCompany is not expected to settle the account atincur significant out-of-pocket costs in connection with this matter that time.would be material to its consolidated financial statements.
The Company has entered into indemnification agreements withis subject to legal proceedings and claims which arise in the ordinary course of its business. As of the date hereof, the Company believes that the final disposition of such matters will not have a material adverse effect on the financial position, results of operations or cash flow of the Company. The Company maintains liability insurance coverage to protect the Company’s directorsassets from losses arising out of or involving activities associated with ongoing and executive officers. These agreements require the Company to indemnify these individuals to the fullest extent permitted under law against liabilities that may arise by reason of their service to the Company, and to advance expenses incurred as a result of any proceeding against them as to which they could be indemnified. The Company also intends to enter into indemnification agreements with the Company’s future directors and executive officers.normal business operations.
Note 12 – Commitments and Contingencies
The Company’s corporate headquarters and primary warehouse facilities are located in Carson, California. As of December 31, 2011, we maintained multiple separate leases for the Carson, California facilities, one of which will expire May 31, 2013 and another is scheduled to expire on March 31, 2012.
On September 22, 2011, the Company entered into a sublease agreement (the “Sublease”) with Timec Company Inc. (“Timec”) for the leasing of approximately 25,000 square feet of commercial office space located at 16941 Keegan Avenue, Carson, California 90746. The Sublease enabled the Company to consolidate its corporate office space from three buildings into one, and will allow the Company to consolidate its California fulfillment operations into one warehouse, which reduced its monthly rent expense and is expected to create warehouse operating efficiencies once the space consolidation has been completed. The Sublease has an initial term of 60 months (the “Initial Term”), and commenced on November 1, 2011. Pursuant to the terms of the Sublease, effective the 42nd month of the Initial Term, we have the ability to terminate the Sublease in exchange for the payment of a termination fee. Additionally, we have the option to renew the Sublease at the end of the Initial Term for an additional 12 month period, as well as the option to renew the Sublease for an additional period thereafter through January 2020. Pursuant to the terms of the Sublease, the rent, including additional rent, shall be approximately $26,300 per month for the first year, $27,600 per month for the second year, $29,100 per month for the third year, $30,600 per month for the fourth year, and $32,300 per month for the fifth year. Rent for any subsequent term, after the expiration of the Initial Term, will be negotiated in good faith between the parties. Under the terms of the Sublease, we are required to maintain certain levels of insurance and are required to indemnify Timec for losses incurred that are related to our use or occupancy of the property.
In January 2010, the Company’s Philippines subsidiary entered into a new lease agreement that will accommodate the Company’s Philippines workforce into one office building from its previous offices in Pasig and Makati; the leases for the Pasig and Makati facilities were terminated in July and October 2010, respectively. Under the terms of the lease agreement, the Company added approximately 39,665 square feet of space for a period of 63 months, effective March 1, 2010. Monthly rental fee of approximately $25,000 is subject to 5% annual escalation beginning on the 3rd year of the lease term and renewable for a sixty (60)-month term upon mutual agreement of both parties.
In December 2008, the Company entered into a five-year operating lease for warehouse space in Chesapeake, Virginia, which commenced in January 2009 and was initially scheduled to expire in December 2013. Under the terms of the lease, the Company added approximately 72,500 square feet of space for initial monthly rent of approximately $15,000 with annual rent escalations. Additionally, the Company had the option to extend the terms for an additional five years on or before June 30, 2013. In July 2011, we signed a five-year extension to June 30, 2016, which also added approximately 87,000 square feet of space. The monthly base rent commitment was $59,700 as of December 31, 2011.
Upon our acquisition of WAG, we assumed a lease related to their office and warehouse space (60,845 square feet) in Independence, Ohio which was originally executed on January 1, 2003 and amended on October 3, 2003 and February 1, 2008. The lease expires on January 31, 2013, with two five-year renewal options. The monthly base rent commitment was $16,700 as of December 31, 2011.
U.S. AUTO PARTS NETWORK, INC. AND SUBSIDIARIES
NOTES TO CONSOLIDATED FINANCIAL STATEMENTS—(Continued)
Also, upon our acquisition of WAG, we assumed a sublease related to their corporate headquarter office (22,323 square feet) in Chicago, Illinois which was originally executed on December 4, 2007. The term of the lease commenced on May 14, 2008 and would have expired on January 13, 2017. The annual base rent for the initial lease term through January 31, 2009 was $0.3 million with an annual escalation of $0.1 million commencing from February 1, 2009 through the remaining lease term. In October 2011, the Company, WAG, and Discovery Communications, LLC (“Discovery”) entered into a Buyout Agreement for the purpose of providing Discovery with an incentive to enter into a direct lease agreement with 111 East Wacker LLC (“East Wacker”) for WAG’s former corporate headquarters located in Chicago, Illinois. In connection with the Buyout Agreement, the total obligation of $1.5 million that was recorded in September 2011 was paid by the Company to Discovery during the fourth quarter of fiscal 2011. Also, in October 2011, the Company, WAG, East Wacker and Marketing Werks, Inc. (“Marketing Werks’) entered into a Lease, Sublease, and License Termination and Surrender Agreement (the “Termination Agreement”) for the purpose of terminating WAG’s sublease agreement with Marketing Werks, dated December 4, 2007, related to WAG’s former corporate headquarters in Chicago, Illinois.
Facility rent expense, inclusive of amounts paid to related party Nia Chloe, for fiscal years 2009, 2010 and 2011, was $1.9 million, $2.4 million and $2.6 million, respectively.
Future minimum facility lease payments required under the above operating leases as of December 31, 2011 are $1,653,000, $1,283,000, $1,130,000, $1,127,000 and $691,000 for 2012 to 2016, respectively.
Capital lease commitments at December 31, 2011 were as follows:
| 2012 | 2013 | Total | ||||||||||
Capital lease commitments | $ | 143 | $ | 38 | $ | 181 | ||||||
Less: interest payments | (8 | ) | (1 | ) | (9 | ) | ||||||
|
|
|
|
|
| |||||||
Capital lease principal obligations | $ | 135 | $ | 37 | $ | 172 | ||||||
|
|
|
|
|
| |||||||
Legal Matters
The Company is subject to legal proceedings and claims which arise in the ordinary course of its business. Although occasional adverse decisions or settlements may occur, the potential loss, if any, cannot be reasonably estimated. However, the Company believes that the final disposition of such matters will not have a material adverse effect on the financial position, results of operations or cash flow of the Company with the exception of the items noted below. The Company maintains liability insurance coverage to protect the Company’s assets from losses arising out of or involving activities associated with ongoing and normal business operations.
Parts Geek Litigation
In June 2009, the Company filed suit in the United States District Court for the Central District of California against Parts Geek LLC (“Parts Geek”), certain of its members and employees for misappropriation of trade secrets, breach of contract and unfair competition and requesting monetary damages and injunctive relief, and Parts Geek filed an answer in August 2009. In January 2010, the complaint was amended to include claims for copyright infringement and to add Lucas Thomason, a former employee, as an additional party. Parts Geek filed an answer and counterclaims to the amended complaint in February 2010. Each party filed a motion for summary judgment requesting that the Court rule on all claims made in this matter without sending the matter to a jury. In June 2010, the Court ruled on all claims in the matter, denying the Company’s claims against Parts Geek and Lucas Thomason and denying Parts Geek’s claims against the Company. The judge additionally denied Parts Geek’s counterclaims against the Company. Parts Geek and Lucas Thomason petitioned the Court to order the Company to pay their legal fees and costs, the Court ordered the Company to do so and in August 2010 all parties stipulated that approximately $1.1 million of legal fees and costs would be owed to Parts Geek and Lucas Thomason should the Company lose its appeal or win its appeal and lose in trial. A bond has been posted to guarantee payment of $1.1 million plus interest, at a cost of approximately $0.02 million to the Company. The Company is not required to pay the fees and costs at this time; they would be due if the Company loses its appeal and determines to not appeal beyond the 9th Circuit Court of Appeals, or if the Company wins on appeal but loses at trial once the case is remanded to the trial court and, in accordance with ASC 450-20Loss Contingencies (“ASC 450-20”), the Company has not accrued for these fees and costs. The Company filed an appeal and filed its initial brief on January 21, 2011. The reply brief was filed March 21, 2011. The appeal has been fully briefed by all parties and oral argument before the 9th Circuit Court of Appeals occurred on March 6, 2012. The ruling on the appeal by the 9th Circuit Court of Appeals is pending. The Company has analyzed this matter in accordance with ASC 450-20 and, in accordance with the definition of probable loss described therein, it has concluded that no accrual is necessary at this time. In addition, the Company believes that any reasonably possible losses which may be incurred would not be material to the financial statements as a whole.
U.S. AUTO PARTS NETWORK, INC. AND SUBSIDIARIES
NOTES TO CONSOLIDATED FINANCIAL STATEMENTS—(Continued)
California Air Resources Board Inquiry
The Company received an inquiry by the California Air Resources Board (“CARB”) into sales of non-California compliant catalytic converters in the state of California via our stock-ship and drop-ship network. In March 2010, and again in June 2010, the Company met with CARB to discuss alleged sales of catalytic converters into California by the Company and third-party suppliers that are not compliant with California regulations. CARB informed the Company that penalties shall be assessed with regard to any non-compliant sales. On October 26, 2011, the Company and CARB entered into a settlement agreement related to this inquiry. Without admitting any liability, the Company agreed to pay a non-material cash penalty, subject to being offset by contributions from some of the Company’s third-party suppliers, in exchange for a release from CARB of the Company and such third-party suppliers.
Asbestos
WAG is a named defendant in several lawsuits involving claims for damages caused by installation of brakes during the late 1960’s and early 1970’s that contained asbestos. WAG marketed certain brakes, but did not manufacture any brakes. WAG maintains liability insurance coverage to protect its and the Company’s assets from losses arising from the litigation and coverage is provided on an occurrence rather than a claims made basis, and the Company is not expected to incur significant out-of-pocket costs in connection with this matter that would be material to its consolidated financial statements.
Note 13 – Employee Retirement Plan and Deferred Compensation Plan
Effective February 17, 2006, the Company adopted a 401(k) defined contribution retirement plan covering all full time employees who have completed one month of service. The Company may, at its sole discretion, match fifty cents per dollar up to 6% of each participating employee’s salary. The Company’s contributions vest in annual installments over three years. Discretionary contributions made by the Company totaled $154,000,$324,000, $300,000 and $213,000 and $300,000 for fiscal 2009, fiscalyear 2012, 2011 and 2010, and fiscal 2011, respectively.
In January 2010, the Company adopted the U.S. Auto Parts Network, Inc. Management Deferred Compensation Plan (the “Deferred Compensation Plan”), for the purpose of providing highly compensated employees a program to meet their financial planning needs. The Deferred Compensation Plan provides participants with the opportunity to defer up to 90% of their base salary and up to 100% of their annual earned bonus, all of which, together with the associated investment returns, are 100% vested from the outset. The Deferred Compensation Plan, which is designed to be exempt from most provisions of the Employee Retirement Security Act of 1974, is informally funded by the Company through the purchase of Company-owned life insurance policies with the Company (employer) as the owner and beneficiary, in order to preserve the tax-deferred savings advantages of a non-qualified plan. The plan assets are the cash surrender value of the Company-owned life insurance policies and not associated with the deferred compensation liability. The deferred compensation liabilities (consisting of employer contributions, employee deferrals and associated earnings and losses) are general unsecured obligations of USAP.the Company. Liabilities under the Deferred Compensation Plan are recorded at amounts due to participants, based on the fair value of participants’ selected investments. The Company may at its discretion contribute certain amounts to eligible employee accounts. In January 2010, the Company began to contribute 50% of the first 2% of participants’ eligible contributions into their Deferred Compensation Plan accounts. In September 2010, the Company established and transferred its ownership to a rabbi trust to hold the Company-owned life insurance policies. As of January 1, 2011,December 29, 2012, the assets and associated liabilities of the Deferred Compensation Plan were $0.3$0.7 million $0.2and $0.7 million, respectively, and are included in other non-current assets and other non-current liabilities in our consolidated balance sheets. As of December 31, 2011, the assets and associated liabilities of the Deferred Compensation Plan were $0.5 million $0.4 million and are included in other non-current assets and other non-current liabilities, respectively, in our consolidated balance sheets. For fiscal 2010,year 2012, the associated liabilities mainly include the employee contributions of $0.2$0.5 million and the Company contributions of $34,000.$109,000. For fiscal 2011, the associated liabilities mainly include the employee contributions of $0.4 million and the Company contributions of $74,000. For fiscal 2010,year 2012, included in other income, the Company recorded a net gain of $11,000$34,300 for the change in the cash surrender value of the Company-owned life insurance policies. For fiscal year 2011, included in other income, the Company recorded a net loss of $34,000 for the change in the cash surrender value of the Company-owned life insurance policies.
Note 13 – Restructuring Costs
In August 2012, we executed key initiatives to reduce labor costs and improve operating efficiencies in response to the challenges in the marketplace and general market conditions. We closed our call center in La Salle, Illinois and reduced our workforce by 71 people resulting in severance charges of approximately $640,000 recorded in marketing expense, fulfillment expense and technology expense of $396,000, $228,000 and $16,000, respectively. In relation to this closure, we did not incur additional charges subsequent to the third quarter of 2012. As of December 29, 2012, severance payable was $220,000. For fiscal year 2011, related to our WAG acquisition, the Company incurred acquisition and integration related costs of $7.4 million, which were recorded in general and administrative expenses (refer to “Note 5 – Business Combination” for additional details).
Note 14 – Related-Party Transactions
Beginning in November 2003, the Company leased its corporate headquarters and primary warehouse from Nia Chloe, LLC (“Nia Chloe”), a member of which, Sol Khazani, is one of our board of directors. Lease payments and expenses associated with this related party arrangement totaled $374,000, $374,000 and $389,000 for fiscal year 2012, 2011 and 2010, respectively. The Company has evaluated its relationship with Nia Chloe with regard to ASC 810Consolidation(“ASC 810”). The Company has determined that Nia Chloe does not meet the criteria for consolidation under ASC 810 and therefore this entity is not consolidated in the Company’s financial statements.
The Company has entered into indemnification agreements with the Company’s directors and executive officers. These agreements require the Company to indemnify these individuals to the fullest extent permitted under law against liabilities that may arise by reason of their service to the Company, and to advance expenses incurred as a result of any proceeding against them as to which they could be indemnified. The Company also intends to enter into indemnification agreements with the Company’s future directors and executive officers.
Note 15 – Quarterly Information (Unaudited)
The following quarterly information (in thousands, except per share data) includes all adjustments which management considers necessary for a fair presentation of such information. For interim quarterly financial statements, the provision for income taxes is estimated using the best available information for projected results for the entire year. The sum of the four quarters may not agree to the year total due to rounding within a quarter.
U.S. AUTO PARTS NETWORK, INC. AND SUBSIDIARIES
NOTES TO CONSOLIDATED FINANCIAL STATEMENTS—(Continued)
| Thirteen Weeks Ended | Thirteen Weeks Ended | |||||||||||||||||||||||||||||||
| April 3, 2010 | July 3, 2010 | Oct. 2, 2010 | Jan 1, 2011 | April 2, 2011 | July 2, 2011 | Oct. 1, 2011 | Dec 31, 2011 | |||||||||||||||||||||||||
| (in thousands, except share and per share data) | ||||||||||||||||||||||||||||||||
Consolidated Statement of Income Data: | ||||||||||||||||||||||||||||||||
Net sales | $ | 56,291 | $ | 53,188 | $ | 72,349 | $ | 80,450 | $ | 86,978 | $ | 84,268 | $ | 78,593 | $ | 77,233 | ||||||||||||||||
Gross profit | 19,807 | 18,397 | 24,007 | 27,399 | 30,416 | 28,414 | 24,345 | 23,825 | ||||||||||||||||||||||||
Income (loss) from operations | 2,475 | 658 | (1,980 | ) | (2,580 | ) | 23 | (2,231 | ) | (5,216 | ) | (8,571 | ) | |||||||||||||||||||
Income (loss) before income taxes | 2,497 | 687 | (2,060 | ) | (2,832 | ) | (227 | ) | (2,369 | ) | (5,306 | ) | (8,747 | ) | ||||||||||||||||||
Net income (loss) | $ | 1,547 | $ | 462 | $ | (13,039 | ) | $ | (2,896 | ) | $ | (245 | ) | $ | (2,564 | ) | $ | (5,308 | ) | $ | (7,020 | ) | ||||||||||
Basic net income (loss) per share as reported and adjusted | $ | 0.05 | $ | 0.02 | $ | (0.43 | ) | $ | (0.10 | ) | $ | (0.01 | ) | $ | (0.08 | ) | $ | (0.17 | ) | $ | (0.23 | ) | ||||||||||
Diluted net income (loss) per share as reported and adjusted | $ | 0.05 | $ | 0.01 | $ | (0.43 | ) | $ | (0.10 | ) | $ | (0.01 | ) | $ | (0.08 | ) | $ | (0.17 | ) | $ | (0.23 | ) | ||||||||||
Shares used in computation of basic net income (loss) per share as reported and adjusted | 30,003,117 | 30,314,478 | 30,357,988 | 30,402,264 | 30,450,078 | 30,543,037 | 30,571,472 | 30,617,963 | ||||||||||||||||||||||||
Shares used in computation of diluted net income (loss) per share as reported and adjusted | 31,425,002 | 31,994,447 | 30,357,988 | 30,402,264 | 31,450,078 | 30,543,037 | 30,571,472 | 30,617,963 | ||||||||||||||||||||||||
| Thirteen Weeks Ended | Thirteen Weeks Ended | |||||||||||||||||||||||||||||||
| March 31, 2012 | June 30, 2012 | Sep. 29, 2012(1) | Dec. 29, 2012(2) | April 2, 2011(3) | July 2, 2011(3) | Oct. 1, 2011(3) | Dec 31, 2011 (3) (4) | |||||||||||||||||||||||||
Consolidated Statement of Income Data: | ||||||||||||||||||||||||||||||||
Net sales | $ | 87,436 | $ | 80,719 | $ | 73,014 | $ | 62,848 | $ | 86,978 | $ | 84,268 | $ | 78,593 | $ | 77,233 | ||||||||||||||||
Gross profit | 26,628 | 24,341 | 22,893 | 17,776 | 30,416 | 28,414 | 24,345 | 23,825 | ||||||||||||||||||||||||
(Loss) income from operations | (486 | ) | (1,031 | ) | (2,548 | ) | (31,725 | ) | 23 | (2,231 | ) | (5,216 | ) | (8,571 | ) | |||||||||||||||||
Loss before income taxes | (664 | ) | (1,568 | ) | (2,670 | ) | (32,013 | ) | (227 | ) | (2,369 | ) | (5,306 | ) | (8,747 | ) | ||||||||||||||||
Net loss | $ | (788 | ) | $ | (1,696 | ) | $ | (2,711 | ) | $ | (30,783 | ) | $ | (245 | ) | $ | (2,564 | ) | $ | (5,308 | ) | $ | (7,020 | ) | ||||||||
Basic and diluted net loss per share as reported and adjusted | $ | (0.03 | ) | $ | (0.06 | ) | $ | (0.09 | ) | $ | (0.99 | ) | $ | (0.01 | ) | $ | (0.08 | ) | $ | (0.17 | ) | $ | (0.23 | ) | ||||||||
Shares used in computation of basic and diluted net loss per share as reported and adjusted | 30,638 | 30,651 | 30,854 | 31,128 | 30,450 | 30,543 | 30,571 | 30,618 | ||||||||||||||||||||||||
| (1) | Included restructuring costs of $0.6 million related to severance charges incurred due to reduction in workforce from the closure of our call center in La Salle, Illinois. |
| (2) | Included impairment loss on goodwill, property and equipment and intangible assets of $18.9 million, $1.9 million and $5.6 million, respectively. |
| (3) | Included acquisition and integration costs of $1.2 million, $1.5 million, $3.8 million and $0.8 million for the thirteen weeks ended April 2, 2011, July 2, 2011, October 1, 2011 and December 31, 2011, respectively, related to our WAG acquisition. |
| (4) | Included a $5.1 million impairment loss on intangible assets. |
Note 1516 – Subsequent EventEvents
On March 23, 2012,As part of the Company and Silicon Valley Bank entered into an Amendment No. 4 to Loan and Security Agreement (the “Fourth Amendment”) pursuant to which the Company and Silicon Valley Bank amended that certain Loan and Security Agreement dated August 13, 2010, as amended. The Fourth Amendment amended one financial covenantCompany’s initiatives to reduce labor costs and improve operating efficiencies in response to the previously required ratio levelschallenges in the marketplace and general market conditions, we reduced our workforce in January 2013. We laid off 13 employees in the United States and 163 employees in the Philippines reducing our workforce to a total of 1,194 employees. The severance charges of approximately $493,000 was recorded in marketing expense, general and administrative expense, fulfillment expense and technology expense for the one quarter ending March 31, 2012$250,000, $94,000, $42,000 and for each fiscal quarter thereafter, as defined. See“Note 7 — Borrowings” for$107,000, respectively, in January 2013. We do not expect to incur material additional information.charges subsequent to January 2013.
F-38F-32