UNITED STATES
SECURITIES AND EXCHANGE COMMISSION
Washington, D.C. 20549
FORM 10-K
(Mark One)
| ||||
| [ X ] | ANNUAL REPORT PURSUANT TO SECTION 13 OR 15(d) | |||
| OF THE SECURITIES EXCHANGE ACT OF 1934 |
For the fiscal year ended December 31, 20112014
OR
| ||||
| [ ] | TRANSITION REPORT PURSUANT TO SECTION 13 OR 15(d) OF THE | |||
| SECURITIES EXCHANGE ACT OF 1934 |
For the transition period fromto
Commission file number 0-16633
THE JONES FINANCIAL COMPANIES, L.L.L.P.
(Exact name of registrant as specified in its charter)
MISSOURI | 43-1450818 | |
(State or other jurisdiction of incorporation or organization) | (IRS Employer Identification No.) | |
| ||
(314) 515-2000
Registrant’s telephone number, including area code
Securities registered pursuant to Section 12(b) of the Act:
12555 Manchester Road Des Peres, Missouri | 63131 | |
(Address of principal executive offices) | (Zip Code) | |
Registrant’s telephone number, including area code | (314) 515-2000 | |
Securities registered pursuant to Section 12(b) of the Act: | ||
Title of each class | Name of each exchange on which registered | |
| NONE | NONE | |
Securities registered pursuant to Section 12(g) of the Act:
Limited Partnership Interests
(Title of Class)
Indicate by check mark if the registrant is a well-known seasoned issuer, as defined in Rule 405 of the Securities Act. YES ¨[ ] NO x[ X ]
Indicate by check mark if the registrant is not required to file reports pursuant to Section 13 or Section 15(d) of the Act. YES ¨[ ] NO x[ X ]
Indicate by check mark whether the registrant (1) has filed all reports required to be filed by Section 13 or 15(d) of the Securities Exchange Act of 1934 during the preceding 12 months (or for such shorter period that the registrant was required to file such reports), and (2) has been subject to such filing requirements for the past 90 days. YES x[ X ] NO ¨[ ]
Indicate by check mark whether the registrant has submitted electronically and posted on its corporate Web site, if any, every Interactive Data File required to be submitted and posted pursuant to Rule 405 of Regulation S-T (§232.405 of this chapter) during the preceding 12 months (or for such shorter period that the registrant was required to submit and post such files). YES x[ X ] NO ¨[ ]
Indicate by check mark if disclosure of delinquent filers pursuant to Item 405 of Regulations S-K (§229.405 of this chapter) is not contained herein, and will not be contained, to the best of registrant’s knowledge, in definitive proxy or information statements incorporated by reference in Part III of this Form 10-K or any amendment to this Form 10-K. x[ ]
Indicate by check mark whether the registrant is a large accelerated filer, an accelerated filer, a non-accelerated filer, or a smaller reporting company. See the definitions of “large accelerated filer,” “accelerated filer” and “smaller reporting company” in Rule 12b-2 of the Exchange Act. (Check one):
Large accelerated filer [ ] |
| Accelerated filer [ ] |
| |||
Non-accelerated filer [ X ] |
| |||||
(Do not check if a smaller reporting company) |
|
| ||||
Indicated by check mark whether the registrant is a shell company (as defined in Rule 12b-2 of the Act). Yes ¨[ ] No x[ X ]
As of February 24, 2012, 660,50827, 2015, 925,767 units of limited partnership interests,interest (“Interests”) are outstanding, each representing $1,000 of limited partner capital, are outstanding (“Units”).capital. There is no public or private market for such Units.Interests.
DOCUMENTS INCORPORATED BY REFERENCE
None
THE JONES FINANCIAL COMPANIES, L.L.L.P.
TABLE OF CONTENTS
| Page | |||||||||
| |||||||||
| |||||||||
| |||||||||
| |||||||||
| |||||||||
| |||||||||
| 3 | |||||||||
Item 1A | 15 | ||||||||
Item 1B | 31 | ||||||||
Item 2 | 31 | ||||||||
Item 3 | 32 | ||||||||
Item 4 | 34 | ||||||||
Item 5 | |||||||||
| |||||||||
Management’s Discussion and Analysis of Financial Condition and Results of Operations | |||||||||
Changes in and Disagreements with Accountants on Accounting and Financial Disclosure | |||||||||
| |||||||||
| |||||||||
| |||||||||
Security Ownership of Certain Beneficial Owners and Management and Related Stockholder Matters | |||||||||
Certain Relationships and Related Transactions, and Director Independence | |||||||||
2
|
The Jones Financial Companies, L.L.L.P. (“JFC”) is a registered limited liability limited partnership organized under the Missouri Revised Uniform Limited Partnership Law of the State of Missouri Revised Statutes.Act. Unless expressly stated, or the context otherwise requires, the terms “Registrant” and “Partnership” refer to JFC and all of its consolidated subsidiaries. The Partnership’s principal operating subsidiary, Edward D. Jones & Co., L.P. (“Edward Jones”), was organized on February 20, 1941 and reorganized as a limited partnership on May 23, 1969. JFC was organized on June 5, 1987 and, along with Edward Jones, was reorganized on August 28, 1987.
As of December 31, 2011,2014, the Partnership operates in two geographic operating segments, the United States of America (“U.S.”) and Canada. Edward Jones is comprised of a U.S. registered broker-dealer in the U.S. and (throughone of Edward Jones’ subsidiaries is a subsidiary) a Canadian registered broker-dealer and primarily serves individual investors. Asin Canada. JFC is the ultimate parent company of Edward Jones JFCand is a holding company. Edward Jones primarily derives its revenue from the retail brokerage business through the sale of listed and unlisted securities and insurance products, investment banking, principal transactions, distribution of mutual fund shares, and through fees related to assets held by and account services provided to its clients.clients, the sale of listed and unlisted securities and insurance products, investment banking, and principal transactions. Edward Jones primarily conducts business in the U.S. and Canada with its clients, various brokers, dealers, clearing organizations, depositories and banks in the U.S. and in Canada.banks. For financial information related to these two operating segments for the years ended December 31, 2011, 20102014, 2013 and 2009,2012, see Part II, Item 7 – Management’s Discussion and Analysis of Financial Condition and Results of Operations and Part II, Item 8 – Financial Statements and Supplementary Data – Note 1715 to the Consolidated Financial Statements.
3
PART I
| Item 1. Business, continued |
ORGANIZATIONAL STRUCTUREOrganizational Structure.
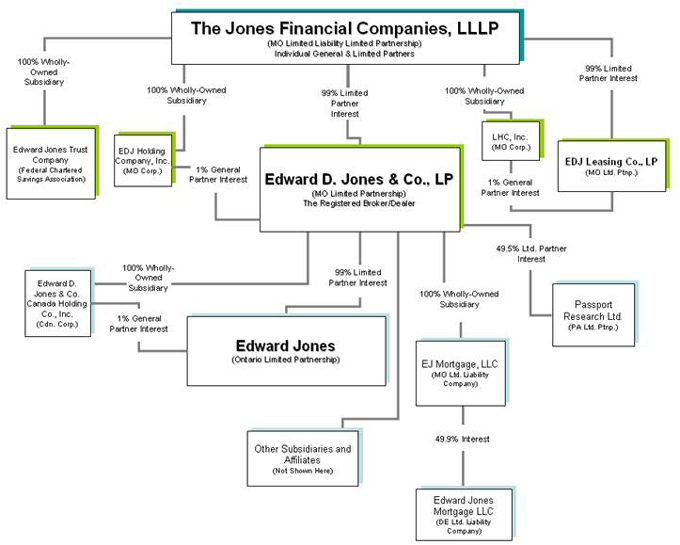
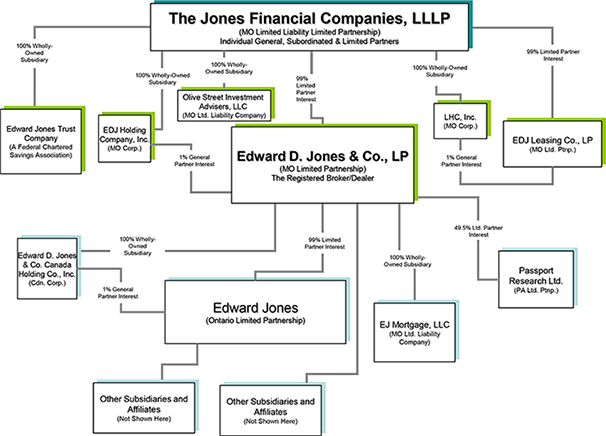
At December 31, 2011,2014, the Partnership was organized as follows:
For additional information about the Partnership’s other subsidiaries and affiliates, see Exhibit 21.21.1.
During 2009, Edward Jones sold 100% of the issued and outstanding shares of its subsidiary, Edward Jones Limited (“EDJ Limited”), a United Kingdom (“U.K.”) private limited company engaged in the retail financial services business in the U.K.
PART I
|
|
Branch Office Network. The Partnership primarily serves individual long-term investors in small to medium-size towns and metropolitan suburbs through its extensive network of branch offices. The Partnership operated 11,39012,016 branch offices as of February 24, 2012,December 31, 2014, primarily staffed by a single financial advisor and a branch office administrator. Of this total, the Partnership operated 10,84111,426 offices in the U.S. (located in all 50 states, predominantly in communities with populations of under 50,000states) and metropolitan suburbs) and 549590 offices in Canada.
4
PART I
Item 1. Business, continued
Governance.Unlike a corporation, the Partnership is not governed by a board of directors and has no individuals who are designated as directors. Moreover, none of its securities are listed on a securities exchange and therefore the governance requirements that generally apply to many companies that file periodic reports with the U.S. Securities and Exchange Commission (“SEC”) reporting companies do not apply to it. Under the terms of the Partnership’s EighteenthNineteenth Amended and Restated Agreement of Registered Limited Liability Limited Partnership, Agreement (“the Partnershipdated June 6, 2014, as amended (the “Partnership Agreement”), the Partnership’s Managing Partner has primary responsibility for administering the Partnership’s business, determining its policies and controlling the management and conduct of the Partnership’s business, andits management. The Managing Partner also has the power to admit and dismiss general partners of JFC and to adjust the proportion of their respective interests in JFC. As of February 24, 2012,December 31, 2014, JFC was composed of 362373 general partners, 14,41613,491 limited partners and 280333 subordinated limited partners. See Part III, Item 10 – Directors, Executive Officers and Corporate Governance for a description of the governance structure of the Partnership.
Revenues by Source. The following table sets forth on a continuing operations basis, for the past three years, the sources of the Partnership’s revenues.revenues for the past three years. Due to the interdependence of the activities and departments of the Partnership’s investment business and the arbitrary assumptions required to allocate overhead, it is impractical to identify and specify expenses applicable to each aspect of the Partnership’s operations. Further information on revenue related to the Partnership’s reportable segments is provided in Part II, Item 8 – Financial Statements and Supplementary Data – Note 1715 to the Consolidated Financial Statements and Part II, Item 7 – Management’s Discussion and Analysis of Financial Condition and Results of Operations.
(Dollars in thousands) | 2011 | 2010 | 2009 | |||||||||||||||||||||||||||||||||||||||||||||
($ millions) | 2014 | 2013 | 2012 | |||||||||||||||||||||||||||||||||||||||||||||
Fee revenue | ||||||||||||||||||||||||||||||||||||||||||||||||
Asset-based fees | $ | 1,776,883 | 39 | % | $ | 1,397,333 | 33 | % | $ | 967,386 | 28 | % | $ | 3,089 | 49% | $ | 2,523 | 44% | $ | 2,042 | 41% | |||||||||||||||||||||||||||
Account and activity fees | 617 | 10% | 568 | 10% | 574 | 11% | ||||||||||||||||||||||||||||||||||||||||||
|
|
|
|
|
| |||||||||||||||||||||||||||||||||||||||||||
Total fee revenue | 3,706 | 59% | 3,091 | 54% | 2,616 | 52% | ||||||||||||||||||||||||||||||||||||||||||
Trade revenue | ||||||||||||||||||||||||||||||||||||||||||||||||
Commissions | 2,168 | 34% | 2,134 | 38% | 1,979 | 39% | ||||||||||||||||||||||||||||||||||||||||||
Mutual funds | 866,005 | 19 | % | 856,020 | 21 | % | 766,192 | 21 | % | |||||||||||||||||||||||||||||||||||||||
Listed securities | 392,743 | 9 | % | 338,605 | 8 | % | 281,549 | 8 | % | |||||||||||||||||||||||||||||||||||||||
Insurance | 385,184 | 8 | % | 326,698 | 8 | % | 271,605 | 8 | % | |||||||||||||||||||||||||||||||||||||||
Over-the-counter securities | 54,755 | 1 | % | 54,529 | 1 | % | 41,581 | 1 | % | |||||||||||||||||||||||||||||||||||||||
|
|
|
|
|
| |||||||||||||||||||||||||||||||||||||||||||
Total commissions | 1,698,687 | 37 | % | 1,575,852 | 38 | % | 1,360,927 | 38 | % | |||||||||||||||||||||||||||||||||||||||
Account and activity fees | 522,898 | 11 | % | 503,264 | 12 | % | 489,605 | 14 | % | |||||||||||||||||||||||||||||||||||||||
Principal transactions | 284,231 | 6 | % | 320,777 | 8 | % | 398,108 | 11 | % | 136 | 2% | 183 | 3% | 156 | 3% | |||||||||||||||||||||||||||||||||
Investment banking | 153,100 | 3 | % | 208,615 | 5 | % | 183,797 | 5 | % | 156 | 2% | 122 | 2% | 112 | 2% | |||||||||||||||||||||||||||||||||
|
|
|
|
|
| |||||||||||||||||||||||||||||||||||||||||||
Total trade revenue | 2,460 | 38% | 2,439 | 43% | 2,247 | 44% | ||||||||||||||||||||||||||||||||||||||||||
Interest and dividends | 130,150 | 3 | % | 126,769 | 3 | % | 112,637 | 3 | % | 135 | 2% | 134 | 2% | 133 | 3% | |||||||||||||||||||||||||||||||||
Other revenue | 11,553 | 1 | % | 30,489 | 1 | % | 35,558 | 1 | % | 32 | 1% | 52 | 1% | 31 | 1% | |||||||||||||||||||||||||||||||||
|
|
|
|
|
|
|
|
|
|
|
| |||||||||||||||||||||||||||||||||||||
Total revenue | $ | 4,577,502 | 100 | % | $ | 4,163,099 | 100 | % | $ | 3,548,018 | 100 | % | $ | 6,333 | 100% | $ | 5,716 | 100% | $ | 5,027 | 100% | |||||||||||||||||||||||||||
|
|
|
|
|
|
|
|
|
|
|
| |||||||||||||||||||||||||||||||||||||
Asset-based Fees
The Partnership earns fees from investment advisory services offered in the U.S. through Edward Jones Advisory Solutions® (“Advisory Solutions”), and Edward Jones Managed Account Program® (“MAP”) and in Canada through MAP, Edward Jones Portfolio Program® (“Portfolio Program”) and Edward Jones Guided Portfolios™ (“Guided Portfolios”). Advisory Solutions and MAP are both registered as an investment advisory programprograms with the SEC under the Investment Advisers Act of 1940.
PART I
|
|
Portfolio Program isand Guided Portfolios are not required to be registered under this actAct as services from this programthese programs are only offered in Canada.
5
PART I
Item 1. Business, continued
Advisory Solutions provides investment advisory services to its clients for a monthly fee based upon the average value of their assets in the program, and consists of a Partnership managed account invested in mutual funds, exchange-traded funds (ETFs) and money market funds. For this program,funds, or Unified Managed Account models, which also include separately managed allocations. When investing in Advisory Solutions, the client must elect either a research or a custom type account model. If the client elects a research type model, the Partnership assumes full investment discretion on the accounts, whichaccount and the client assets will be invested in one of 60numerous different research models (including Unified Managed Accounts) developed and managed by Edward Jones’ Mutual Fund Research department. If the client elects to build a custom type model, the Partnership assumes limited investment discretion on the accounts developedaccount and the investments are selected by the client and his or her financial advisor. The vast majority of client assets within Advisory Solutions are invested in research type models.
In 2013, in order to accommodate the size and expected growth in investment advisory services offered through Advisory Solutions, as well as potentially lower client investment management expense, the Partnership formed the Bridge Builder Trust (the “Trust”) to launch the Bridge Builder Bond Fund for Advisory Solutions clients. The Bridge Builder Bond Fund is a sub-advised mutual fund and is the first fund in the Trust. Olive Street Investment Advisers, L.L.C. (“OLV”), a wholly-owned subsidiary of JFC and a Missouri limited liability company, is the investment adviser to the current sub-advised mutual fund and will be the investment adviser to any future sub-advised mutual funds of the Trust. For any sub-advised mutual funds in the Trust, OLV has primary responsibility for allocation of funds, setting the overall investment strategies, selection and management of sub-advisers, and supervisory responsibility for the general management of the Trust, subject to the review and approval by the Trust’s board of trustees. In December 2014, the Trust filed a prospectus with the SEC to register four additional sub-advised mutual funds. The Trust may introduce additional funds in the future. As of December 31, 2014, the Trust had client assets under management of $7.7 billion, all of which were invested in the Bridge Builder Bond Fund.
MAP and Portfolio Program offer investment advisory services to clients for a monthly fee based upon the average value of assets in the program, by using independent investment managers rather than Edward Jones’ Mutual Fund Research department.and proprietary asset allocation models. Guided Portfolios is a non-discretionary, fee-based program with structured investment guidelines. Fees for these programs are based on the average value of client assets in the program.
In addition to the advisory programs mentioned above, the Partnership also earns asset-based fees from the trust services and investment management services offered to its clients through Edward Jones Trust Company (“EJTC”)., a wholly-owned subsidiary of JFC.
The Partnership also earns revenue on clients’ assets through service fees on most of its clients’ assets which are held byand other revenues received under agreements with mutual fund companies and insurance companies. The fees generally range from 15 to 25 basis points (0.15% to 0.25%) of the value of the client assets so held.
In addition, the Partnership earns revenue sharing from certain mutual fund and insurance vendors.companies. In most cases, this is additional compensation paid by investment advisers, insurance companies or distributors based on a percentage of average vendor assets held by the Partnership’s clients, on those products covered under the revenue sharing agreements. Revenue sharing agreements that provide for a fixed annual payment are also included in asset-based fees.clients.
6
PART I
Item 1. Business, continued
The Partnership does not manage any mutual funds, although it is a 49.5% limited partner of Passport Research, Ltd. (“Passport Research”), the investment adviser to certainthe two money market funds made available to the Partnership’s clients. Revenue from this source is primarily based on client assets in the funds. However, due to the current low interest rate environment, the investment adviser voluntarily chose (beginning in March 2009) to reduce certain fees charged to the funds to a level that will maintain a positive client yield on funds. For further information on this reduction of fees, see Part II, Item 77A – Management’s DiscussionQuantitative and Analysis of Financial ConditionQualitative Disclosures About Market Risk.
Account and Results of Operations.Activity Fees
Account and activity fees include shareholder accounting service fees, Individual Retirement Account (“IRA”) custodial service fees, and other product/service fees.
The Partnership charges fees to certain mutual fund companies for shareholder accounting services, including maintaining client account information and providing other administrative services for the mutual funds. The Partnership acts as the custodian for clients’ IRA accounts and the clients are charged an annual fee for this and other account services. Account and activity fees also include sales-based revenue sharing fees, insurance contract services, and fees earned through a co-branded credit card with a major credit card company.
Commissions
Commissions revenue is primarily comprisedconsists of charges to clients for the purchase or sale of securities, mutual fund shares, equity and debt securities, and insurance products. The following briefly describes the Partnership’s sources of commissions revenue.
Mutual Funds.The Partnership distributes mutual fund shares in continuous offerings and new underwritings. As a dealer in mutual fund shares, the Partnership receives a dealer’s discount which generally ranges from 1% to 5% of the purchase price of the shares, depending on the terms of each fund’s prospectus and the amount of the purchase.
PART I
|
|
Listed Securities Transactions.The Partnership receives a commission when it acts as an agent for a client in the purchase or sale of listed securities. These securities include common and preferred stocks and debt securities traded on and off the securities exchanges.unlisted (over-the-counter) securities. The commission is based on the value of the securities purchased or sold.
Insurance.The Partnership sells life insurance, long-term care insurance, disability insurance, fixed and variable annuities and other types of insurance products of unaffiliated insurance companies to its clients through its financial advisors who hold insurance sales licenses. As an agent for the insurance companies, the Partnership receives commissions on the premiums paid for the policies.
Over-the-Counter Securities Transactions. Partnership activities in unlisted (over-the-counter) securities transactions are similar to its activities as a broker in listed securities. In connection with client orders to buy or sell securities, the Partnership charges a commission for agency transactions.
Account and Activity Fees
Revenue sources include sub-transfer agent accounting services fees, Individual Retirement Account (“IRA”) custodial services fees, and other product fees.
The Partnership charges fees to certain mutual funds for sub-transfer agent accounting services, including maintaining client account information and providing other administrative services for the mutual funds. Also, the Partnership acts as the custodian for clients’ IRA accounts and the clients are charged an annual fee for this service. Account and activity fees also include sales based revenue sharing fees pursuant to arrangements with certain mutual fund and insurance vendors where the vendors pay additional compensation to the Partnership based on a percentage of current year sales by the Partnership of products supplied by these vendors. The Partnership receives revenue from offering mortgage loans to its clients through a joint venture and through a co-branded credit card with a major credit card company. In addition, the Partnership earns transaction fee revenue relating to client purchases and sales of securities.
Principal Transactions
The Partnership makes a market in municipal obligations, over-the-counter corporate securities, municipal obligations, government obligations, unit investment trusts, mortgage-backed securities and certificates of deposit. The Partnership’s market-making activities are conducted with other dealers in the “wholesale” and “retail” markets where the Partnership acts as a dealer buying from and selling to its clients. In making markets in securities, the Partnership exposes its capital to the risk of fluctuation in the fair value of its security positions. The Partnership maintains securities positions in inventory solely to support its business of buying securities from and selling securities to its retail clients and does not seek to profit by engaging in proprietary trading for its own account. The related unrealized gains and losses for these securities are recorded within principal transactions revenue.
7
PART I
Item 1. Business, continued
Investment Banking
Investment banking revenue is primarily derived from the Partnership’s distribution of U.S. government obligations and unit investment trusts, on behalf of issuers,corporate and municipal obligations, and government sponsored enterprise obligations. Investment banking revenue also includes underwriting fee revenue related to underwriting and management fees as well as underwriting of corporate securitiesgross acquisition profit/loss and municipal obligations. volume concession revenue, which is earned and collected from the issuer.
The Partnership’s investment banking activities are performed primarily by its Syndicate, and Investment Banking and Unit Investment Trust departments. The principal service which the Partnership renders as an investment banker is the underwriting and distribution of securities, either in a primary distribution on behalf of the issuer of such securities or in a secondary distribution on behalf of a holder of such securities.
PART I
|
|
The distributions of corporate and municipal securities are, in most cases, underwritten by a group or syndicate of underwriters. Each underwriter has a participation in the offering.
Unlike many larger firms against whichroles the Partnership competes, themay play include senior manager, co-manager, syndicate member, selling group member, dealer or distributor and encompass both negotiated and competitively bid offerings.
The Partnership historically has not, and does not presently engage in other investment banking activities, such as assisting in mergers and acquisitions, arranging private placement of securities issues with institutions, or providing consulting and financial advisory services to entities.
In the case of an underwritten offering managed by the Partnership, the Syndicate, and Investment Banking and Unit Investment Trust departments may form underwriting syndicates and work with the branch office network for sales of the Partnership’s own participation and with other members of the syndicate in the pricing and negotiation of other terms. In offerings managed by others in which the Partnership participates as a syndicate member, selling group member, dealer or distributor, these departments serve as active coordinators between the managing underwriter and the Partnership’s branch office network.
The underwriting activity of the Partnership involves substantial risks. An underwriter may incur losses if it is unable to resell the securities it is committed to purchase or if it is forced to liquidate all or part of its commitment at less than the agreed upon purchase price. Furthermore, the commitment of capital to an underwriting may adversely affect the Partnership’s capital position and, as such, its participation in an underwriting may be limited by the requirement that it must at all times be in compliance with the SEC’s uniform net capital requirements (the “Uniform Net Capital Rule”).
Interest and Dividends
Interest and dividends revenue is earned on client margin (loan) account balances, cash and cash equivalents, cash and investments segregated under federal regulations, securities purchased under agreements to resell, partnership loans, for general partnership interests, inventory securities and investment securities. Loans secured by securities held in client margin accounts provide a source of income to the Partnership. The Partnership is permitted to use securities owned by margin clients having an aggregate market value of generally up to 140% of the debit balance in margin accounts as collateral for the borrowings. The Partnership may also use funds provided by free credit balances in client accounts to finance client margin account borrowings.
The Partnership is exposed to market risk for changes in interest rates and market prices on its inventory and investment securities. The Partnership’s interest income is impacted by the level of client margin account balances, cash and cash equivalents, cash and investments segregated under federal regulations, securities purchased under agreements to resell, partnership loans, inventory securities and investment securities and the interest rates it charges its clients, the interest rate earned on overnight investments and the level of clients’ loan balances and credit balances.each.
8
PART I
| Item 1. Business, continued |
Significant Revenue Source
As of December 31, 2011,2014, the Partnership distributed mutual funds for approximately 75 mutual fund sponsors,companies, including American Funds Distributors, Inc. which represents 19%represented 20% of the Partnership’s total revenue for the year ended December 31, 2011.2014. This revenue consisted of commissions, asset-based fees and account and activity fees, which are described above. All of theThe revenue generated from this vendorcompany relates to business conducted with the Partnership’s U.S. segment.
BUSINESS OPERATIONS
Research Department.The Partnership maintains a Research department to provide specific investment recommendations and market information for clients. The department supplements its own research with the services of an independent research service.services. In addition, the Research department provides recommendations for asset allocation, portfolio rebalancing and investment selections for Advisory Solutions client accounts.
Client Account Administration and Operations.Employees in theThe Partnership has an Operations division arethat is responsible for activities relating to client securities and the processing of transactions with other broker-dealers, exchanges and clearing organizations. These activities include receipt, identification and delivery of funds and securities, internal financial controls, accounting and personnel functions, office services, custody of client securities and the handling of margin accounts. The Partnership processes substantially all of its own transactions.
To expedite the processing of orders, the Partnership’s branch office system is linked to the home office through an extensive communications network. Orders for securities are generally captured at the branch electronically, routed to the home office and forwarded to the appropriate market for execution. The Partnership’s processing of paperwork following the execution of a security transaction is generally automated.
There is considerable fluctuation during any one year and from year to year in the volume of transactions the Partnership processes. The Partnership records such transactions and posts its books on a daily basis. The Partnership has a computerized branch office communication system which is principally utilized for entry of security orders, quotations, messages between offices, research of various client account information, and cash and security receipts functions. Home office personnel, including operationsthose in the Operations and compliance personnel,Compliance divisions, monitor day-to-day operations to determine compliance with applicable laws, rules and regulations. Failure to keep current and accurate books and records can render the Partnership liable to disciplinary action by governmental and self-regulatory organizations (“SROs”).
The Partnership clears and settles virtually all of its listed and over-the-counter equities, municipal bond, corporate bond, mutual fund and annuity transactions for its U.S. broker-dealer through the National Securities Clearing Corporation (“NSCC”), Fixed Income Clearing Corporation (“FICC”) and Depository Trust Company (“DTC”), which are all subsidiaries of the Depository Trust and Clearing Corporation located in New York, New York.
In conjunction with clearing and settling transactions with NSCC, the Partnership holds client securities on deposit with DTC in lieu of maintaining physical custody of the certificates. The Partnership also uses a major bank for custody and settlement of treasury securities and Government National Mortgage Association (“GNMA”), Federal National Mortgage Association (“FNMA”) and Federal Home Loan Mortgage Corporation (“FHLMC”) issues.
9
PART I
| Item 1. Business, continued |
The Canada broker-dealer handles the routing and settlement of client transactions. In addition, the Canada broker-dealer is a member of the Canadian Depository of Securities (“CDS”) and FundServ for clearing and settlement of transactions. CDS effects clearing of securities on the Canadian National Stock Exchange (“CNQ”), Toronto Stock Exchange (“TSX”) and TSX Venture Exchange (“CDNX”). Client securities on deposit are also held with CDS and National Bank Correspondent Network (“NBCN”).
The Partnership is substantially dependent upon the operational capacity and ability of NSCC, DTC, FICC, and Canadian Depository of Securities (“CDS”).CDS. Any serious delays in the processing of securities transactions encountered by these clearing and depository companies may result in delays of delivery of cash or securities to the Partnership’s clients.
Broadridge Financial Solutions, Inc. (“Broadridge”), along with its U.S. business, Securities Processing Solutions, U.S., and its international business, Securities Processing Solutions, International, provide automated data processing services for client account activity and related records for the Partnership in the U.S. and Canada, respectively. The Partnership does not employ its own floor brokers for transactions on exchanges. The Partnership has arrangements with other brokers to execute the Partnership’s transactions in return for a commission based on the size and type of trade. If, for any reason, any of the Partnership’s clearing, settling or executing agents were to fail, the Partnership and its clients would be subject to possible loss. To the extent that the Partnership would not be able to meet the obligations to the clients, such clients might experience delays in obtaining the protections afforded them.
The CanadianCanada broker-dealer has an agreement with Broadridge to provide the securities processing systems, as well as an agreement with Computershare Trust Company of Canada to act as trustee for cash balances held by clients in their retirement accounts. The CanadianCanada broker-dealer is the custodian for client securities and manages all related securities and cash processing, such as trades, dividends, corporate actions, client cash receipts and disbursements, client tax reporting and statements.
The Canadian broker-dealer handles the routing and settlement of client transactions. In addition, the Canadian broker-dealer is a member of CDS and FundServ for clearing and settlement of transactions. CDS effects clearing of securities on the Canadian National Stock Exchange (“CNQ”), Toronto Stock Exchange (“TSX”) and TSX Venture Exchange (“CDNX”). Client securities on deposit are also held with CDS and National Bank Correspondent Network (“NBCN”).
The Partnership believes that its internal controls and safeguards concerning the risks of securities thefts are adequate. The possibility of securities thefts is an industry-wide risk. The Partnership has not had, to date, significant problems with such thefts. The Partnership maintains fidelity bonding insurance which, in the opinion of management, provides adequate coverage.
Employees. In contrast to some other broker-dealers, theThe Partnership’s financial advisors are employees (or general partners of the Partnership) and are not independent contractors.. As of February 24, 2012,December 31, 2014, the Partnership had approximately 37,00040,000 full and part-time employees and general partners, including its 12,16914,000 financial advisors. The Partnership’s financial advisors are generally compensated on a commission basis and may in addition, be entitled to bonus compensation based on their respective branch office profitability and the profitability of the Partnership. The Partnership has in the past paidpays bonuses to its non-financial advisor employees pursuant to a discretionary formula established by management.
U.S. employeesEmployees of the Partnership in the U.S. are bonded under a blanket policy as required by New York Stock ExchangeFinancial Industry Regulation Authority, Inc. (“NYSE”FINRA”) rules. The Partnership has a per occurrence coverage limit forin the U.S. employees is $5.0 million,of $5,000,000, subject to a $2.0 million$500,000 deductible provision. In addition, there is excess coverage with an annual aggregate amount of $45.0 million. Canadian employees$45,000,000. Employees of the Partnership in Canada are bonded under a blanket policy as required by the Investment Industry Regulation Organization of Canada (“IIROC”). The Partnership has an annual aggregate amount of coverage for Canadian employees is CAD $25.0 million,in Canada of C$50,000,000 with a per occurrence limit of C$25,000,000, subject to a CAD $0.05 millionC$50,000 deductible provision per occurrence.
10
PART I
| Item 1. Business, continued |
The Partnership maintains ana comprehensive initial training program for prospective financial advisors that spans nearly four months which includes preparation for regulatory exams, concentrated instruction in the classroom and on-the-job training in a branch office. During the first phase, U.S. trainees spend nearly two months studyingstudy Series 7 and Series 66 examination materials and takingtake the examinations. In Canada, financial advisors have the requisite examinations completed prior to being hired. After passing the requisite examinations, trainees spend one week incomplete a comprehensive training program in one of the Partnership’s home office training facilities, followed by seven weeks of on-the-job training in their market and in a nearby branch location. This training includes reviewing investments, compliance requirements, office procedures, and understanding client needs, as well as establishing a base of potential clients. One final weekThe initial training program is then spentcompleted after spending additional time in a home office training facility to complete the initial training program. Five months later,facility. Later, the financial advisor attends an additional training class in aat home office location, and subsequently, theoffice. The Partnership also offers periodic continuing training to its experienced financial advisors for the entirety of their career. Training programs for the more experienced financial advisors continue to focus on meeting client needs and effective management of the branch office.
The Partnership considers its employee relations to be good and believes that its compensation and employee benefits, which include medical, life and disability insurance plans and profit sharing and deferred compensation retirement plans, are competitive with those offered by other firms principally engaged in the securities business.
Competition.The Partnership is subject to intense competition in all phases of its business from other securities firms, many of which are substantially larger than the Partnership in terms of capital, brokerage volume and underwriting activities. In addition, the Partnership encounters competition from other organizations such as banks, insurance companies, and others offering financial services and advice. The Partnership also competes with a number of firms offering discount brokerage services, usually with lower levels of personalized service to individual clients. With minor exceptions, clientsClients are free to transfer their business to competing organizations at any time, although a fee may be charged to do so. There is also intense competition among firms for financial advisors. The Partnership experiences continued efforts by competing firms to hire away its financial advisors, although the Partnership believes that its rate of turnover of financial advisors is not higher than that of otherin line with comparable firms.
REGULATION
Broker-Dealer and Investment Adviser Regulation
Broker-dealers are. The securities industry is subject to extensive federal and state laws, rules and regulations whichthat cover all aspects of the securities business, including sales methods, trade practices among broker-dealers, use and safekeeping of client funds and securities, client payment and margin requirements, capital structure of securities firms, record-keeping, and the conduct of directors, officers and employees.
The SEC is the federalU.S. agency responsible for the administration of the U.S.federal securities laws. Its mission is to protect investors, maintain fair, orderly and efficient markets and facilitate capital formation. Edward Jones is registered as a broker-dealer and investment adviser with the SEC. Edward Jones is subject to broker-dealer audits, review by a designated examining authority, and requirements to file forms regarding custody of securities and customer funds. Much of the regulation of broker-dealers has been delegated to SROs, principally the Financial Industry Regulation Authority, Inc. (“FINRA”).FINRA. FINRA adopts rules (which are subject to approval by the SEC) that govern the broker-dealer industry and conducts periodic examinations of Edward Jones’ operations.
11
PART I
| Item 1. Business, continued |
Securities firms are also subject to regulation by state securities commissions in those states in which they conduct business. Since Edward Jones is registered as a broker-dealer in all 50 states, Puerto Rico, the U.S. Virgin Islands and the District of Columbia, Puerto RicoEdward Jones is subject to state regulation in all of these states and the U.S. Virgin Islands.territories.
The SEC, SROs and state securities commissionsauthorities may conduct administrative proceedings which can result in censure, fine, suspension or expulsion of a broker-dealer, its officers or employees. Edward Jones has in the past been, and may in the future be, the subject of regulatory actions by various agencies that have the authority to regulate its activities (see Part I, Item 3 – Legal Proceedings for more information).
As an investment dealer in all provinces and territories of Canada, the CanadianCanada broker-dealer is subject to provincial, territorial and federal laws. All provinces and territorial jurisdictions have established securities administrators to fulfill the administration of securities laws. The CanadianCanada broker-dealer is also subject to the regulation of the CanadianCanada SRO, IIROC, which oversees the business conduct and financial affairs of its member firms, as well as all trading activity on debt and equity marketplaces in Canada. IIROC fulfills its regulatory obligations by implementing and enforcing rules regarding the proficiency, business and financial conduct of member firms and their registered employees, and marketplace integrity rules regarding trading activity on CanadianCanada debt and equity marketplaces.
In addition, Edward Jones and OLV are subject to the rules and regulations promulgated under the Investment Advisers Act of 1940 (“Investment Advisers Act”), which requires investment advisers to register with the SEC. Both Edward Jones and OLV are registered investment advisers. The rules and regulations promulgated under the Investment Advisers Act govern all aspects of the investment advisory business, including registration, trading practices, custody of client funds and securities, record-keeping, advertising and business conduct. Edward Jones and OLV are subject to examination by the SEC who is authorized to institute proceedings and impose sanctions for violations of the Investment Advisers Act.
Pursuant to U.S. federal law, Edward Jones belongs to the Securities Investors Protection Corporation (“SIPC”). For clients in the U.S., SIPC provides $500,000 of coverage for missing cash and securities, includingwith a maximum of $250,000 for cash claims. Pursuant to IIROC requirements, the CanadianCanada broker-dealer belongs to the Canadian Investor Protection Fund (“CIPF”), a non-profit organization that provides investor protection for investment dealer insolvency. For clients in Canada, CIPF limits coverage to CAD $1,000,000C$1,000,000 in total, which can be any combination of securities and cash.
The Partnership currently maintains additional protection for U.S. clients provided by Underwriters at Lloyd’s. The additional protection contract provided by Underwriters at Lloyd’s protects clients’ accounts in excess of the SIPC coverage subject to specified limits. This policy covers theft, misplacement, destruction, burglary, embezzlement or abstraction of cash and client securities up to an aggregate limit of $900 million (with maximum cash coverage limited to $1,900,000 per client) for covered claims of all U.S. clients of Edward Jones. Market losses are not covered by SIPC or the additional protection.
In addition, Edward Jones is subject to the rules and regulations of the Investment Advisers Act of 1940, which require investment advisers to register with the SEC. The Investment Advisers Act’s rules and regulations govern all aspects of the investment advisory business, including registration, trading practices, custody of client funds and securities, record-keeping, advertising and business conduct.
12
PART I
Item 1. Business, continued
Additional legislation, changes in rules promulgated by the SEC, the Department of Labor and SROs, and/or changes in the interpretation or enforcement of existing laws and rules, may directly affect the operations and profitability of broker-dealers and investment advisers. With the passage of the Dodd-Frank Wall Street Reform and Consumer Protection Act (“Dodd-Frank Act”), the SEC has been directed to study existing practices in the industry and granted discretionary rulemaking authority to establish, among other things, comparable standards of conduct for broker-dealers and investment advisers when providing personalized investment
PART I
|
|
advice about securities to retail clients and such other clients as the SEC provides by rule. The SEC may engage in rulemaking or issue interpretive guidance concerning the standard of conduct for broker-dealers and investment advisers. FINRA or other regulatory authorities may also issue rules related to the Dodd–Frank Act, but it is unclearthe Partnership cannot predict at this time what impact such rulemaking activities will have on the Partnership or its operations.
Trust Regulation of EJTC and Regulation of JFC as EJTC’s Parent
Pursuant. EJTC is a federally chartered savings and loan association that operates under a limited purpose “trust-only” charter, which generally restricts EJTC to the Dodd-Frank Act, effective July 21, 2011 authority for theacting solely in a trust or fiduciary capacity. EJTC and JFC are subject to supervision and regulation of EJTC was transferred from the Office of Thrift Supervision (“OTS”) toby the Office of the Comptroller of the Currency (“OCC”). As of the same date, responsibility for the supervision and regulation of JFC, based on its status as a savings and loan holding company (“SLHC”) (which such status is the result of its 100% ownership of EJTC), was transferred from the OTS to the Board of Governors of the Federal Reserve System (“FRB”). The Dodd-Frank Act, however, allows entities controlling a savings association that functions solely in a trust or fiduciary capacity to cease to be a SLHC. On July 25, 2011, the Partnership requested that the FRB deregister it as a SLHC. A permanent decision from the FRB is still pending, but, by letter dated March 15, 2012, the FRB: (a) granted JFC a temporary exemption from submitting the FRB regulatory reports beginning with the March 31, 2012 reporting period; (b) determined that JFC should submit certain informational filings to the FRB during the temporary exemption period; and (c) informed JFC that, if it does not receive a permanent exemption by December 31, 2012, it will be required to begin submitting the FRB’s regulatory reports by March 31, 2013.
Uniform Net Capital RuleRule.
As a result of its activities as a broker-dealer and a member firm of FINRA, Edward Jones is subject to the Uniform Net Capital Rule 15c3-1 of the Securities Exchange Act of 1934, as amended (“Uniform Net Capital Rule”) which is designed to measure the general financial integrity and liquidity of a broker-dealer and the minimum net capital deemed necessary to meet the broker-dealer’s continuing commitments to its clients. The Uniform Net Capital Rule provides for two methods of computing net capital and Edward Jones has adopted what is generally referred to as the alternative method. Minimum required net capital under the alternative method is equal to the greater of $0.25 million$250,000 or 2% of the aggregate debit items, as defined.defined under the Customer Protection Rule 15c3-3 of the Securities Exchange Act of 1934, as amended (“Customer Protection Rule”). The Uniform Net Capital Rule prohibits withdrawal of equity capital whether by payment of dividends, repurchase of stock or other means, if net capital would thereafter be less than minimum requirements. Additionally, certain withdrawals require the approval of the SEC to the extent they exceed defined levels even though such withdrawals would not cause net capital to be less than 5% of aggregate debit items. In computing net capital, various adjustments are made to exclude assets which are not readily convertible into cash and to provide a conservative valuation of other assets, such as a company’s securities owned. Failure to maintain the required net capital may subject Edward Jones to suspension or expulsion by FINRA, the SEC and other regulatory bodies and/or exchanges and may ultimately require liquidation. Edward Jones has, at all times, been in compliance with the Uniform Net Capital Rule.
The CanadianCanada broker-dealer and EJTC are also required to maintain specified levels of regulatory capital. Each subsidiaryof these subsidiaries has, at all times, been in compliance with the applicable capital requirements in the jurisdictions in which it operates.
13
PART I
| Item 1. Business, continued |
AVAILABLE INFORMATION
The Partnership files annual, quarterly, and current reports and other information with the SEC. The Partnership’s SEC filings are available to the public on the SEC’s website atwww.sec.gov.
FORWARD-LOOKING STATEMENTS
This reportAnnual Report on Form 10-K, and in particular Part II, Item 7 – Management’s Discussion and Analysis of Financial Condition and Results of Operations, contains forward-looking statements within the meaning of U.S. securities laws. You can identify forward-looking statements by the use of the words “believe,” “expect,” “anticipate,” “intend,” “estimate,” “project,” “will,” “should,” and other expressions which predict or indicate future events and trends and which do not relate to historical matters. You should not rely on forward-looking statements, because they involve known and unknown risks, uncertainties and other factors, some of which are beyond the control of the Partnership. These risks, uncertainties and other factors may cause the actual results, performance or achievements of the Partnership to be materially different from the anticipated future results, performance or achievements expressed or implied by the forward-looking statements.
Some of the factors that might cause differences between forward-looking statements and actual events include, but are not limited to, the following: (1) general economic conditions; (2) regulatory actions; (3) changes in legislation or regulation, including new regulations under the Dodd-Frank Act; (4) actions of competitors; (5) litigation; (6) the ability of clients, other broker-dealers, banks, depositories and clearing organizations to fulfill contractual obligations; (7) changes in interest rates; (8) changes in technology;technology and other technology-related risks; (9) a fluctuation or decline in the fair value of securities.securities; and (10) the risks discussed under Part I, Item 1A – Risk Factors. These forward-looking statements were based on information, plans, and estimates at the date of this report, and the Partnership does not undertake to update any forward-looking statements to reflect changes in underlying assumptions or factors, new information, future events or other changes.
14
PART I
|
The Partnership is subject to a number of risks potentially impacting its business, financial condition, results of operations and cash flows. In addition to the risks and uncertainties discussed elsewhere in this Annual Report on Form 10-K, or in the Partnership’s other filings with the SEC, the following are some important factors that could cause the Partnership’s actual results to differ materially from results experienced in the past or those projected in any forward-looking statement. The risks and uncertainties described below are not the only ones facing the Partnership. Additional risks and uncertainties not presently known to the Partnership or that the Partnership currently deems immaterial could also have a material adverse effect on the Partnership’s business and operations. If any of the matters included in the following risks were to occur, the Partnership’s business, financial condition, results of operations and cash flows could be materially adversely affected.
RISK RELATED TO THE PARTNERSHIP’S BUSINESS
MARKET CONDITIONS—As a part of the securities industry, a downturn in the U.S. and/or global securities markets historically has, and in the past had, andfuture could in the future have, a significant negative effect on revenues and could significantly reduce or eliminate profitability of the Partnership.
General political and economic conditions and events such as U.S. fiscal policy, economic recession, natural disasters, terrorist attacks, war, changes in local economic and political conditions, regulatory changes or changes in the law, or interest rate or currency rate fluctuations could create a downturn in the U.SU.S. and/or global securities markets. The securities industry, and therefore the Partnership, is highly dependent upon market prices and volumes which are highly unpredictable and volatile in nature. Events such as global recession, frozen credit markets, and institutional failures and government-sponsored bailouts of a number of large financial services companies, as well as debt ceiling debates, and sovereign credit downgrades, could make the capital markets increasingly volatile. Weakened global economic conditions and an unsettled nature of financial markets, among other things, could cause significant declines in the Partnership’s net revenues which willwould adversely impact its overall financial results.
WithAs the Partnership’s composition of net revenue nowbecomes more heavily weighted towards asset-based fee revenue, than trade revenue as in the past, a decrease in the market value of assets due to market declines can cause much morehave a greater negative impact on the Partnership’s financial results than experienced in prior years, due to the fact that asset-based fees are earned on the value of the underlying client assets. Conversely, in times of improved market conditions the Partnership’s asset-based fee revenue shouldwould be positively impacted due to the increase in the market value of assets on which fees are earned.
In addition, the Partnership could experience a material reduction in volume and lower securities prices in times of unfavorable economic conditions, which would result in lower commission revenue, decreased margins and losses in dealer inventory accounts and syndicate positions. This would have a material adverse impact on the profitability of the Partnership’s operations.
While the Partnership’s results have improved in 2010 and 2011, financial
15
PART I
Item 1A. Risk Factors, continued
Financial markets continue tomay experience extreme volatility and the risks to sustained global economic growth remain high.remain. Furthermore, the Partnership would be subject to increased risk of its clients being unable to meet their commitments, such as margin obligations, if there was an economicthe market were to experience a downturn or the economy were to enter into a recession. If clients are unable to meet their margin obligations, the Partnership has an increased risk of losing money on margin transactions and incurring additional expenses defending or pursuing claims. Developments such as lower revenues and declining profit margins could reduce or eliminate the Partnership’s profitability.
PART I
|
|
LEGISLATIVEAND REGULATORY INITIATIVES —Newly adopted —Proposed, potential and recently enacted federal and state legislation and pending regulatory proposalsrules intended to reform the financial services industry could significantly impact the regulation and operation of the Partnership and its subsidiaries, its revenue and its profitability.subsidiaries. In addition, such laws and regulations may significantly alter or restrict the Partnership’s historic business practices, which could negatively affect its operating results.
The Partnership is subject to extensive regulation by federal and state regulatory agencies and by SROs, within the industry.SROs. The Partnership operates in a regulatory environment that is subject to ongoing change and has seen significantly increased regulation in recent years. The Partnership may be adversely affected as a result of new or revised legislation or regulations, changes in federal, state or foreign tax laws and regulations, or by changes in the interpretation or enforcement of existing laws and regulations. The Partnership continues to monitor several regulatory initiatives and proposed, potential or enacted legislation or rules (“Legislative and Regulatory Initiatives”), including, but not limited to:
The Dodd-Frank Act. The Dodd-Frank Act, passed by the U.S. Congress and signed by the President on July 21, 2010, includes provisions that could potentially impact the Partnership’s operations. Since the passage of the Dodd-Frank Act, the Partnership has not been required to enact material changes to its operations. However, the Partnership continues to review and evaluate the provisions of the Dodd-Frank Act and the impending rules to determine what impact or potential impact itthey may have on the financial services industry, the Partnership and its operations. Among the numerous potentially impactful provisions in the Dodd-Frank Act are: (i) pursuant to Section 913 of the Dodd-Frank Act, the SEC staff issued a study recommending a universal fiduciary standard of care applicable to both broker-dealers and investment advisers when providing personalized investment advice about securities to retail clients, and such other clients as the SEC provides by rule. When proposed, the uniform standard of care for personalized investment advice is expected to require the broker-dealer and investment adviser to act in the best interest of the client;rule; and (ii) pursuant to Section 914 of the Dodd-Frank Act, a new SRO may be proposed to regulate investment advisers.advisers could be proposed. In addition, the Dodd-Frank Act contains new or enhanced regulations that could impact specific securities products offered by the Partnership to investors and specific securities transactions. Proposed rules related to all of these provisions are anticipated in 2012. It is unclearhave not yet been adopted by regulators. The Partnership cannot predict what impact any such rules, if adopted, would have on the Partnership.
Additionally, the Partnership continues to monitor several other proposed regulations and rules that do not presently appear as though they will have a material impact on the Partnership, such as Title X of the Dodd-Frank Act, which established the Bureau of Consumer Financial Protection with broad authority to issue new regulations, and proposed rules related to Section 956 of the Dodd-Frank Act, which would prohibit certain types of incentive-based compensation arrangements. In their present form, the Partnership does not believe these regulations and rules will have a material impact on the Partnership, but if revised the impact on the Partnership could be material.
It is expected that FINRA or other regulatory authorities will continue to issue rules related to the Dodd-Frank Act in the future and the Partnership will continue to monitor and review any such rules.
PART I
|
|
Department of Labor. In October 2010, the Department of Labor (the “DOL”) proposed a modification to a rule that would have impacted the Employee Retirement Income Security Act’s definition of “fiduciary” and potentially limited certain of Edward Jones’ business practices. In September 2011, the DOL announced that it was withdrawing the proposed rule and stated its intention to re-propose the rule in early 2012 with significant modifications.the future. The DOL has indicated thatfiled a new proposal with the re-proposedOffice of Management and Budget (“OMB”) on February 25, 2015. The proposed rule will impact IRAs and has indicated an intentionis expected to address what has been generally described as “third party payments,” such as revenue sharing.be published for public comment no later than 90 days from its filing with OMB. The Partnership cannot predict what the re-proposed rule will say, what its exact scope will be, when or ifwhether it will be re-proposed or adopted, or what the adverse impact will be on the Partnership. However, any such rule could impact the operations of Edward Jones and the profitability of the Partnership.
Trust Reform and the Volcker Rule. The Partnership has requested that the FRB deregister it as a SLHC and has received a temporary exemption from the FRB from submitting the FRB regulatory reports. The Partnership anticipates that this request will be approved and is preparing for supervision and regulation of the Partnership as a holding company by the OCC. If the request is not approved, however, the Partnership could become subject to what is commonly referred to as the “Volcker Rule”, which was jointly proposed in October 2011 by the SEC, the Federal Deposit Insurance Corporation, the FRB, and the OCC. The proposed Volcker Rule has the stated purpose of generally prohibiting certain banking entities from engaging in proprietary trading or sponsoring or investing in a hedge fund or private equity fund. At this time, it is unclear what impact the proposed Volcker Rule would have on the financial services industry, the Partnership and its operations if adopted and applicable to the Partnership. However, the Partnership continues to review and evaluate the proposed Volcker Rule to determine what impact or potential impact it may have.
International Financial Reporting Standards. The International Accounting Standards Board (“IASB”) developed a core set of accounting standards to act as a framework for financial reporting known as the International Financial Reporting Standards (“IFRS”). By 2007, the majority of listed European Union companies, including banks and insurance companies, began using IFRS to prepare financial statements. In contrast, the majority of public companies in the U.S. prepare financial statements under accounting principles generally accepted in the U.S. (“GAAP”).16
The SEC is evaluating adoption of IFRS in the U.S. It is unclear at this time whether the SEC will propose mandatory adoption of IFRS or some other form of GAAP and IFRS harmonization. The Canadian Accounting Standards Board began requiring use of IFRS in Canada in 2011 for publically accountable profit-oriented enterprises. This change did not impact the Partnership’s Consolidated Financial Statements.
The Partnership is currently waiting on further guidance from the SEC to determine what impact, if any, the adoption of IFRS in the U.S. could have on its financial position or results of operations. If adopted, IFRS could significantly impact the way the Partnership determines income before allocations to partners, allocations to partners, or returns on partnership capital. In addition, switching to IFRS would be a complex endeavor for the Partnership. The Partnership may need to develop new systems and controls around the principles of IFRS and the specific costs associated with this conversion are uncertain.
Rule 12b-1 Fees. The Partnership receives various payments in connection with the purchase, sale and holding of mutual fund shares by its clients. Those payments include Rule 12b-1 fees (i.e., service fees) and expense reimbursements. Rule 12b-1, under the Investment Company Act of 1940 (“ICA”), allows a mutual fund to pay distribution and marketing expenses out of the fund’s assets. The SEC currently does not limit the size of Rule 12b-1 fees that funds may pay.
PART I
| Item 1A. Risk Factors, continued |
FINRA does impose such limitations. However, on July 21, 2010 the SEC proposed reform of Rule 12b-1. The proposal called for the rescission of Rule 12b-1 and a proposed new Rule 12b-2 which would allow funds to deduct a fee on an annual basis of up to 25 basis points to pay for distribution expenses without a cumulative cap on this fee. Additionally, the proposal includes other amendments that would permit funds to deduct an asset-based distribution fee in which the fund may deduct ongoing sales charges with no annual limit, but cumulatively the asset-based distribution fee could not exceed the amount of the highest front-end load for a particular fund. The proposed rule also allows funds to create and distribute a class of shares at net asset value and dealers could establish their own fee schedule. The proposal includes additional requirements for disclosure on trade confirmations and in fund documents. These proposed rules have not been enacted and the Partnership cannot predict with any certainty whether or which of these proposals will be enacted in their current form, revised form or enacted at all. In addition, the Partnership is not yet able to determine the potential financial impact on its operating results related to this proposed reform of Rule 12b-1. For further information on the amount of Rule 12b-1 fees earned by the Partnership, see Item 7 – Management’s Discussion and Analysis of Financial Condition and Results of Operations.
Health Care Reform.The Patient Protection and Affordable Care Act (“PPACA”) was signed into law onin March, 23, 2010. PPACA2010, amended and revised by the Health Care and Education and Reconciliation Act of 2010 (collectively referred to as “Affordable Care Act”). The Affordable Care Act requires employers to provide affordable coverage with a minimum essential benefitvalue to full-time employees or pay a financial penalty.penalty and pay other fees for providing coverage. The billAffordable Care Act contains provisions that go into effectwill be implemented over the next several years that expand employee eligibility for the Partnership’s medical plan and places limitsplace certain requirements on plan design. Regulatory guidance required to fully assess the impact of this law is still forthcoming. Accordingly, theThe Partnership is not yet able to determine the full potential financial impact on its operating results in future years.of the Affordable Care Act.
Federal “Do Not Call” Regulations.The Partnership is also subject to federal and state regulations like other businesses and must evaluate and adapt to new regulations as they are adopted. In particular, the Partnership believes the federal “do not call” regulations enacted in recent years have affected the manner in which many of its financial advisors conduct their businesses. While the Partnership believes it is in compliance with these regulations, these regulations could impact the Partnership’s future revenues or results of operations.
Any ofMoney Market Mutual Funds. The SEC adopted amendments to the foregoing regulatory initiatives could adversely affect the Partnership’s business operations, business model,rules that govern money market mutual funds on July 23, 2014. The amendments preserve stable net asset value for certain retail funds and profitability.government funds. The amendments also impose, under certain circumstances, liquidity fees and redemption gates on non-government funds. The Partnership cannot predict with any certainty whether or which ofcontinues to evaluate the regulatory proposals that have not yet been adopted will be adopted, and if so whether they will be adopted in their current form or adopted subject to further revisions. If adopted, somepotential impact of these initiativesamendments.
These Legislative and Regulatory Initiatives may impact the manner in which the Partnership markets its products and services, manages its business and operations, and interacts with clients and regulators, any or all of which could significantly and adverselymaterially impact the Partnership’s operating costs, its structure, its ability to generate revenue,results of operations, financial condition, and its overall profitability.liquidity. However, the Partnership cannot presently predict when or if any of the proposed or potential Legislative and Regulatory Initiatives will be enacted or the impact that any Legislative and Regulatory Initiatives will have on the Partnership.
COMPETITION — —The Partnership is subject to intense competition for clients and personnel, and many of its competitors have greater resources.
All aspects of the Partnership’s business are highly competitive. The Partnership competes for clients and personnel directly with other securities firms and increasingly with other types of organizations and other businesses offering financial services, such as banks and insurance companies. Many of these organizations have substantially greater capital and additional resources, and some entities offer a wider range of financial services. Over the past several years, there has been significant consolidation of firms in the financial services industry, forcing the Partnership to compete with larger firms with greater capital and resources, brokerage volume and underwriting activities, and more competitive pricing. Also, the Partnership continues to compete with a number of firms offering discount brokerage services, usually with lower levels of personalized service to individual clients. With minor exceptions, clientsClients are free to transfer their business to competing organizations at any time, although there may be a fee to do so.
PART I
|
|
Competition among financial services firms also exists for financial advisors and other personnel. The Partnership’s continued ability to expand its business and to compete effectively depends on the Partnership’s ability to attract qualified employees and to retain and motivate current employees. If the Partnership’s profitability decreases, then bonuses paid to financial advisors and other personnel, along with profit-sharing contributions, may be decreased or eliminated, increasing the risk that personnel could be hired away by competitors.
17
PART I
Item 1A. Risk Factors, continued
In addition, during an extended downturn in the economy, there is increased risk the Partnership’s more successful financial advisors may leave because a significant portion of their compensation is variable based on the Partnership’s profitability. Further, the Partnership has recently faced increased competition from larger firms in its non-urban markets, and from a broad range of firms in the urban and suburban markets in which the Partnership competes.
The competitive pressure the Partnership experiences could have an adverse effect on its business, results of operations, financial condition and cash flow. For additional information, see Part I, Item 1—1 – Business Operations—– Business Operations – Competition.
BRANCH OFFICE SYSTEM — —The Partnership’s system of maintaining branch offices primarily staffed by one financial advisor may expose the Partnership to risk of loss or liability from the activities of the financial advisors and to increases in rent related to increased real property values.
Most of the Partnership’s branch offices are staffed by a single financial advisor and a branch office administrator without an onsite supervisor as would be found at broker-dealers with multi-broker branches. The Partnership’s primary supervisory activity is conducted from its home offices. Although this method of supervision is designed to comply with all applicable industry and regulatory requirements, it is possible that the Partnership is exposed to a risk of loss arising from alleged imprudent or illegal actions of its financial advisors. Furthermore, the Partnership may be exposed to further losses if additional time elapses before its supervisory personnel detect problem activity.
The Partnership maintains personal financial and account information and other documents and instruments for its clients at its branch offices, both physically and in electronic format. Despite reasonable precautions, because the branch offices are relatively small and some are in remote locations, the security systems at these branch offices may not prevent theft of such information. If security of a branch is breached and personal financial and account information is stolen, the Partnership’s clients may suffer financial harm and the Partnership could suffer financial harm, reputational damage and regulatory issues.
In addition, the Partnership leases its branch office spaces and a material increase in the value of real property may increase the amount of rent paid, which will negatively impact the Partnership’s profitability.
PART I
|
|
INABILITYTO ACHIEVE OURGROWTH RATE — —If the Partnership is unable to fully achieve its goals for hiring financial advisors or the attrition rate of its financial advisors is higher than its expectations, the Partnership may not be able to meet its planned growth rates or maintain its current number of financial advisors.
ItHistorically, during market downturns, it is more difficult for the Partnership to attract qualified applicants for financial advisor positions during market downturns.positions. In addition, the Partnership relies heavily on referrals from its current financial advisors in recruiting new financial advisors. During an economic downturn, current financial advisors can be less effective in recruiting potential new financial advisors through referrals.
18
PART I
Item 1A. Risk Factors, continued
Regardless of the presence of a market downturn, the Partnership mayhas not behistorically been able to consistently meet its hiringgrowth objectives. For instance,However for 2014, the Partnership has been belowgrew by 842 financial advisors, nearly matching its hiring objectives in 2010 and 2011 and did not achieve its hiring objectives in seven out of the past nine years.annual growth objective. There can be no assurance that the Partnership will be able to hiregrow at desired rates in future periods to achieve its planned growth. In addition, the Partnership may not be able to hire at levels toor maintain its current number of financial advisors.
A significant number of the Partnership’s financial advisors have been licensed as brokers for less than three years. As a result of their relative inexperience, many of these financial advisors have encountered or may encounter difficulties developing or expanding their businesses. Consequently, the Partnership has periodically experienced higher rates of attrition, particularly with respect to the less experienced financial advisors and especially during market downturns. The Partnership generally loses more than half of its financial advisors who have been licensed for less than three years. In the past, theThe Partnership also has experiencedmay experience increased financial advisor attrition due to increased competition from other financial services companies and efforts by those firms to recruit its financial advisors. There can be no assurance that the attrition rates the Partnership has experienced in the past will not continue or increase in the future. In addition, the Partnership raised the performance standards for its financial advisors in 2011, which may attribute to higher attrition for financial advisors unable to meet these performance standards.
Either the failure to achieve hiring goals or an attrition rate higher than anticipated may result in a decline in the revenue the Partnership receives from asset-based fees, commissions and other securities related revenues. As a result, the Partnership may not be able to either maintain its current number of financial advisors or achieve the level of net growth upon which its business model is based and its revenues and results of operations may be adversely impacted.
INCREASED FINANCIAL ADVISOR COMPENSATION —Compensation paid to new financial advisors, as well as current financial advisors participating in a retirement transition plan, could negatively impact the Partnership’s profitability and capital if the increased compensation does not help retain financial advisors.
In order to attract candidates to become financial advisors, in 2011 the Partnership increased the compensation paid toprovides new financial advisors a minimum base compensation during the first three years as a financial advisor. The intent is to attract a greater number of high quality recruits with an enhanced level of base compensation in order to meet the Partnership’s growth objectives.objectives and ability to serve more clients. If the Partnership increases new financial advisor base compensation and does not comparatively increase the level of productivity and retention rate of these financial advisors, then thethis additional compensation could negatively impact the Partnership’s financial performance in future periods.
Additionally, to better transition clients to a new financial advisor when their current financial advisor retires, as well as to retain quality financial advisors until retirement, the Partnership, in certain circumstances, offers individually tailored retirement transition plans to financial advisors. These retirement transition plans may offer increased financial consideration prior to and after retirement for financial advisors who provide client transition services in accordance with a retirement and transition employment agreement. If this increased financial consideration does not increase client asset retention or help to retain quality financial advisors until retirement, the additional financial consideration could negatively impact the Partnership’s profitability and capital in future periods. In addition, the Partnership expects that the retirement transition plans will result in higher financial advisor compensation expense in the future.
19
PART I
| Item 1A. Risk Factors, continued |
LITIGATIONAND REGULATORY INVESTIGATIONSAND PROCEEDINGS — —As a securities firm, the Partnership is subject to litigation involving civil plaintiffs seeking substantial damages and regulatory investigations and proceedings, which have increased over time and are expected to continue to increase even as global market conditions improve.increase.
Many aspects of the Partnership’s business involve substantial litigation and regulatory risks. The Partnership is, from time to time, subject to examinations and informal inquiries by regulatory and other governmental agencies.
Such matters have in the past, and could in the future, lead to formal actions, which may impact the Partnership’s business. In the ordinary course of business, the Partnership also is subject to arbitration claims, lawsuits and other significant litigation such as class action suits. Over time, there has been increasing litigation involving the securities industry, in general, including class action suits that generally seek substantial damages.
The Partnership has incurred significant expenses to defend and/or settle claims in the past. In view of the inherent difficulty of predicting the outcome of such matters, particularly in cases in which claimants seek substantial or indeterminate damages or in actions which are at very preliminary stages, the Partnership cannot predict with certainty the eventual loss or range of loss related to such matters. Due to the uncertainty related to litigation and regulatory investigations and proceedings, the Partnership cannot determine if future litigation will have a material adverse effect on its consolidated financial condition. Such legal actions may be material to future operating results for a particular period or periods. See Part I, Item 3 – Legal Proceedings for more information regarding certain unresolved claims.
RELIANCEON OTRGANIZATIONSHIRD PARTIES —The Partnership’s dependence on third-party organizations exposes the Partnership to disruption if itstheir products and services are no longer offered, supported or develop defects.
The Partnership incurs obligations to its clients which are supported by obligations from firms within the industry, especially those firms with which the Partnership maintains relationships by which securities transactions are executed. The inability of an organization with which the Partnership does a large volume of business to promptly meet its obligations could result in substantial losses to the Partnership.
The Partnership is particularly dependent on Broadridge, which acts as the Partnership’s primary vendor for providing accounting and record-keeping for client accounts in both the U.S. and Canada. The Partnership’s communications and information systems are integrated with the information systems of Broadridge. There are relatively few alternative providers to Broadridge and although the Partnership has analyzed the feasibility of performing Broadridge’s functions internally, the Partnership may not be able to do it in a cost-effective manner or otherwise. The Partnership also utilizes the sub-accounting functionality of The Bank of New York Mellon Corporation (“BNY Mellon”) for mutual fund investments held by the Partnership’s clients. BNY Mellon’s sub-accounting technology solution enables the Partnership to provide fund shareholder recordkeeping services to mutual funds. Consequently, any new computer systems or software packages implemented by Broadridgethese third parties which are not compatible with the Partnership’s systems, or any other interruption or the cessation of service by Broadridgethese third parties as a result of systems limitations or failures, could cause unanticipated disruptions in the Partnership’s business which may result in financial losses and/or disciplinary action by governmental agencies and/or SROs.
20
PART I
| Item 1A. Risk Factors, continued |
CANADIANANADA OPERATIONS — — The Partnership is focusing heavily on efforts,has made, and intends to continue to make, substantial investments to support the potential profitability of its CanadianCanada operations, which have not yet achieved profitability.
The Partnership commenced operations in Canada in 1994 and plans to continue to expand its branch system in Canada. Despite recent improvements in Canadian financial performance, the CanadianCanada operations have operated at a substantial deficit from inception. The Partnership plansintends to make additional investments in its CanadianCanada operations which may be substantial. However, the number of Canadian financial advisors employed by the Partnership has declined since 2009. This decline could affect the ability of the Partnership to reach its profitability goals for the Canadian segment.
In addition, Gary Reamey has decided to retire at the end of 2012 and therefore has stepped down as country leader for Canada effective January 1, 2012, and David Lane has assumed those responsibilities. The Canadian operationsaddress short-term liquidity, capital, or expansion needs, which could be adversely impacted during this transitional period.substantial.
There is no assurance the CanadianCanada operations will ultimately become profitable. For further information on the CanadianCanada operations, see Part II, Item 8 – Financial Statements and Supplementary Data – Note 1715 to the Consolidated Financial Statements.
CAPITAL LRIMITATIONSEQUIREMENTS; UNIFORM NET CAPITAL RULE — —The SEC’s Uniform Net Capital Rule imposes minimum net capital requirements and could limit the Partnership’s ability to engage in certain activities which are crucial to its business.
Adequacy of capital is vitally important to broker-dealers, and lack of sufficient capital may limit the Partnership’s ability to compete effectively. In particular, lack of sufficient capital or compliance with the Uniform Net Capital Rule may limit Edward Jones’ ability to commit to certain securities activities such as underwriting and trading, which require significant amounts of capital, its ability to expand margin account balances, as well as its commitment to new activities requiring an investment of capital. FINRA regulations and the Uniform Net Capital Rule may restrict Edward Jones’ ability to expand its business operations, including opening new branch offices or hiring additional financial advisors. Consequently, a significant operating loss or an extraordinary charge against net capital could adversely affect Edward Jones’ ability to expand or even maintain its present levels of business.
In addition to the regulatory requirements applicable to Edward Jones, EJTC and the CanadianCanada broker-dealer are subject to regulatory capital requirements in the U.S. and in Canada. Failure by the Partnership to maintain the required net capital for any of its subsidiaries may subject it to disciplinary actions by the SEC, FINRA, IIROC, OCC or other regulatory bodies, which could ultimately require its liquidation. In the U.S., Edward Jones may be unable to expand its business and may be required to restrict its withdrawal of subordinated debt and partnership capital in order to meet theits net capital requirements.
LIQUIDITY — —The Partnership’s business in the securities industry requires that sufficient liquidity be available to maintain its business activities, and it may not always have access to sufficient funds.
Liquidity, or ready access to funds, is essential to the Partnership’s business. The currentA tight credit market environment could have a negative impact on itsthe Partnership’s ability to maintain sufficient liquidity to meet its working capital needs. Short termShort-term and long termlong-term financing are two sources of liquidity that could be affected by the currenta tight credit market. AsIn a result of the concerns about the stability of the markets in general, sometight credit market, lenders have reducedmay reduce their lending to borrowers, including the Partnership.
PART I
|
|
There is no assurance that financing will be available at attractive terms, or at all, in the future. A significant decrease in the Partnership’s access to funds could negatively affect its business and financial management in addition to its reputation in the industry.
21
PART I
Item 1A. Risk Factors, continued
Many limited partners subordinated limited partners and general partners have financed the initial and subsequent purchases offinance their Partnership interestpartnership capital contributions by obtaining personal bank loans. Any such bank loan agreement is and will be between the limited partner and the bank. The Partnership performs certain administrative functions for the majority of limited partner bank loans, but does not guarantee thelimited partner bank loans, nor can limited partners pledge their Partnership interestInterests as collateral for the bank loan. Partnersloans. Limited partners who finance all or a portion of their Partnership interestInterests with bank financing or financing from the Partnershiploans may be more likely to request the withdrawal of capital to repay such obligations should the Partnership experience a period of reduced earnings. As a partnership, anyAny withdrawals by general partners, subordinated limited partners or limited partners are subject to the terms of the Partnership Agreement and would reduce the Partnership’s available liquidity and capital.
In 2011, theThe Partnership began makingmakes loans available to those general partners (other than those who are members of the Partnership’s Executive Committee) thatCommittee, which consists of the executive officers of the Partnership and is discussed in Part III, Item 10 – Directors, Executive Officers and Corporate Governance) who require financing for some or all of their individualpartnership capital contributions. Additionally, in limited circumstances, a general partner capital contributions.may withdraw from the Partnership and become a subordinated limited partner while he or she still has an outstanding partnership loan. Loans made by the Partnership to general partners are generally for a period of one year, but are expected to be renewed and bear interest at athe prime rate, as defined in the loan documents. The Partnership recognizes interest income for the interest paid byhas full recourse against any general partners in connection with such loans. General partners borrowing from thepartner that defaults on his or her Partnership are required to repay such loans by applying the majority of earnings received from the Partnership to such loans. As a result,loan obligations. However, there is no assurance that general partner’spartners will be able to repay the interest and/or the principal amount of their partnership loans at or prior to its maturity. If general partners are unable to repay the interest and/or the principal amount of their partnership loans at or prior to maturity, the Partnership could be adversely impacted.
UPGRADEOF TECHNOLOGICAL SYSTEMS — —The Partnership maywill engage in significant technology initiatives in the future which may be costly and could lead to disruptions.
From time to time, the Partnership has engaged in significant technology initiatives and expects to continue to do so in the future. Such initiatives are not only necessary to better meet the needs of the Partnership’s clients, but also to satisfy new industry standards and practices and better secure the transmission of clients’ information on the Partnership’s systems. With any major system replacement, there will be a period of education and adjustment for the branch and home office employees utilizing the system. Following any upgrade or replacement, if the Partnership’s systems or equipment doesdo not operate properly, isare disabled or failsfail to perform due to increased demand (which might occur during market upswings or downturns), or if a new system or system upgrade contains a major problem, the Partnership could experience unanticipated disruptions in service, including interrupted trading, slower response times, decreased client service and client satisfaction, and delays in the introduction of new products and services, any of which could result in financial losses, liability to clients, regulatory intervention or reputational damage. Further, the inability of the Partnership’s systems to accommodate a significant increase in volume of transactions also could constrain its ability to expand its business.
22
PART I
| Item 1A. Risk Factors, continued |
INTEREST RATE ENVIRONMENT—The Partnership’s profitability is impacted by thea low interest rate environment.
The currentA low interest rate environment adversely impacts the interest income the Partnership earns from clients’ margin loans, the investment of excess funds, and securities the Partnership owns, as well as the fees earned by the Partnership through its minority ownership in Passport Research, which is the investment adviser to the Edward Jonestwo money market funds. And, whilefunds made available to the Partnership’s clients. While a low interest rate environment positively impacts the Partnership’s expenses related to liabilities that finance certain assets, such as amounts payable to clients and other interest-bearing liabilities, its interest bearinginterest-bearing liabilities are less impacted by short-term interest rates compared to its interest earning assets, resulting in interest income being more sensitive to the currenta low interest rate environment than interest expense.
CREDIT RISK —The Partnership is subject to credit risk due to the nature of the transactions it processes for its clients.
The Partnership is exposed to the risk that third parties who owe it money, securities or other assets will not meet their obligations. Many of the transactions in which the Partnership engages expose it to credit risk in the event of default by its counterparty or client, such as cash balances held at various major U.S. financial institutions, which typically exceed Federal Deposit Insurance Corporation (“FDIC”) insurance coverage limits. In addition, the Partnership’s credit risk may be increased when the collateral it holds cannot be realized or is liquidated at prices insufficient to recover the full amount of the obligation due to the Partnership. See Part III, Item 710 – Management’s DiscussionDirectors, Executive Officers and Analysis of Financial Condition and Results of Operations,Corporate Governance, for more information about the Partnership’s credit risk.
LACKOF CAPITAL PERMANENCY — — Because the Partnership’s capital is subject to mandatory liquidation either upon the death or withdrawal request of a partner, the capital is not permanent and a significant mandatory liquidation could lead to a substantial reduction in the Partnership’s capital, which could, in turn, have a material adverse effect on the Partnership’s business.
Under the terms of the Partnership Agreement, a partner’s capital balance is liquidated upon death. In addition, partners may request withdrawals of their partnership capital, subject to certain limitations on the timing of those withdrawals. Accordingly, partnershipthe Partnership’s capital is not permanent and is dependent upon current and future partners to both maintain their existing capital investment and make additional capital investmentscontributions in the Partnership. Any withdrawal requests by general partners, subordinated limited partners or limited partners would reduce the Partnership’s available liquidity and capital. The Managing Partner may decline a withdrawal request if that withdrawal would result in the Partnership violating any agreement, such as a loan agreement, or any applicable regulations.
23
PART I
Item 1A. Risk Factors, continued
Under the terms of the Partnership Agreement, limited partners who request the withdrawal of their capital are repaid their capital in three equal annual installments beginning the monthno earlier than 90 days after their withdrawal request. Thenotice is received by the Managing Partner may, in his discretion, allow a limited partner to withdraw his or her capital in ninety days.Partner. The capital of general partners requesting the withdrawal of capital from the Partnership may be converted to subordinated limited partner capital or, at the discretion of the Managing Partner, redeemed by the Partnership. The withdrawalcapital of subordinated limited partnerpartners requesting withdrawal of their subordinated limited partnership capital is repaid in six equal annual installments beginning the monthno earlier than 90 days after their request for withdrawal.withdrawal is received by the Managing Partner. The Partnership’s Managing Partner has discretion to waive or modify these withdrawal restrictions and to accelerate the return of capital. Liquidations upon the death of a partner are generally required to be made within six months of the date of death. Due to the nature of the liquidation requirements of the capital as set forth in the Partnership Agreement, the Partnership accounts for its capital as a liability, in accordance with GAAP.U.S generally accepted accounting principles (“GAAP”). If the Partnership’s capital declines by a substantial amount due to liquidation or withdrawal, the Partnership may not have sufficient capital to operate or expand its business or to meet withdrawal requests by partners.
PART I
|
|
BUSINESSINTERRUPTION ROFISK BUSINESSAND OPERATIONS —Any substantial disruption to the Partnership’s business and operations, including cybersecurity attacks, could lead to significant financial loss to itsthe Partnership’s business and operations, as well as harm relations withthe Partnership’s reputation and client relationships.
The Partnership relies heavily on communications and information systems to conduct its clients.
business. The Partnership’s home office facilities and its existing computer system and network, including its backup systems, are vulnerable to damage or interruption from human error, natural disasters, power loss, sabotage, cybersecurity attacks, computer viruses and other malicious code, intentional acts of vandalism, attempts by others to gain unauthorized access to the Partnership’s information technology system, market disruptions due to third-party technology errors, and similar events. The risk of these types of events occurring has grown recently due to increased use of the internet and mobile devices, as well as increased sophistication of external parties who may attempt to cause harm. While cybersecurity attacks are on the rise, the Partnership has not experienced any material losses relating to cybersecurity attacks or other information security breaches. However, there can be no assurance the Partnership will not suffer such losses in the future. Such an event could substantially disrupt the Partnership’s business by causing physical harm to its home office facilities and its technological systems.systems, jeopardizing the Partnership’s, its clients’ or its third parties’ confidential information, or causing interruptions or malfunctions in the Partnership’s, its clients’ or its third parties’ operations. In addition, the Partnership’s reputation and business may suffer if clients experience data or financial loss from a significant interruption. The Partnership’s primary data center is located in St. Louis, Missouri. interruption or cybersecurity attack.
The Partnership has a data center in Tempe, Arizona, which operates as a secondary data center to its primary data centercenters in St. LouisMissouri and isArizona. These data centers act as disaster recovery sites for each other. While these data centers are designed to enable the Partnership to maintain service duringbe redundant for each other, a system disruption contained in St. Louis. A prolonged interruption of either site might result in a delay in service and substantial additional costs and expenses. While the Partnership has disaster recovery and business continuity planning processes, and interruption and property insurance to mitigate and help protect it against such losses, there can be no assurance that the Partnership is fully protected from such an event. In 2011, the Partnership began re-purposing its secondary data center in Tempe, Arizona, as a processing site for most critical systems such that they could run in St. Louis, Missouri or Tempe, Arizona. The Partnership anticipates that this process will take two to three years to complete.
24
PART I
Item 1A. Risk Factors, continued
UNDERWRITING, SYNDICATEAND TRADING POSITION RISKS —The Partnership engages in underwriting activities, which can expose the Partnership to material losses and liability.
Participation as a manager or syndicate member in the underwriting of fixed income and equity securities subjects the Partnership to substantial risk. As an underwriter, the Partnership is subject to risk of substantial liability, expense and adverse publicity resulting from possible claims against it as an underwriter under federal and state securities laws. Such laws and regulations impose substantial potential liabilities on underwriters for material misstatements or omissions in the document used to describe the offered securities. In addition, there exists a potential for possible conflict of interest between an underwriter’s desire to sell its securities and its obligation to its clients not to recommend unsuitable securities. There has been an increasing incidence of litigation in these areas. These lawsuits are frequently brought by large classes of purchasers of underwritten securities. Such lawsuits often name underwriters as defendants and typically seek substantial amounts in damages.
Further, as an underwriter, the Partnership may incur losses if it is unable to resell the securities it is committed to purchase or if it is forced to liquidate all or part of its commitment at less than the agreed upon purchase price. In addition, the commitment of capital to an underwriting may adversely affect the Partnership’s capital position and, as such, the Partnership’s participation in an underwriting may be limited by the requirement that it must at all times be in compliance with the SEC’s Uniform Net Capital Rule. In maintaining inventory in fixed income and equity securities, the Partnership is exposed to a substantial risk of loss, depending upon the nature and extent of fluctuations in market prices.
PART I
|
|
RISKOF INFLATION — —An increase in inflation could affect securities prices and as a result, the profitability and capital of the Partnership.
Inflation and future expectations of inflation can negatively influence securities prices, as well as activity levels in the securities markets. As a result, the Partnership’s profitability and capital may be adversely affected by inflation and inflationary expectations. Additionally, the impact of inflation on the Partnership’s operating expenses may affect profitability to the extent that additional costs are not recoverable through increased prices of services offered by the Partnership.
TRANSACTION VOLUME VOLATILITY — —Significant increases and decreases in the number of transactions by the Partnership’s clients can have a material negative effect on the Partnership’s profitability and its ability to efficiently process and settle these transactions.
Significant volatility in the number of client transactions may result in operational problems such as a higher incidence of failures to deliver and receive securities and errors in processing transactions, and such volatility may also result in increased personnel and related processing costs. In the past, periods, the Partnership has experienced adverse effects on its profitability resulting from significant reductions in securities sales and likewise, has encountered operational problems arising from unanticipated high transaction volume. The Partnership is not able to control such decreases and increases, and there is no assurance that it will not encounter such problems and resulting losses in future periods.
In addition, significant transaction volume could result in inaccurate books and records, which would expose the Partnership to disciplinary action by governmental agencies and SROs.
25
PART I
Item 1A. Risk Factors, continued
INVESTMENT ADVISORY ACTIVITIES —The Partnership’s investment advisory businesses may be affected by the investment performance of its portfolios.
Poor investment returns, due to either general market conditions or underperformance (relative to the Partnership’s competitors or to benchmarks) of programs constructed by the Partnership may affect its ability to retain existing assets under care and to attract new clients or additional assets from existing clients. Should there be a reduction in assets under care in programs which generate asset-based fees, the Partnership will experience a decrease in net revenue.
MANAGEMENTOF SUB-ADVISERS —The Partnership’s business may be affected by the heightened regulatory requirements it faces as a result of managing sub-advisers.
Serving as an investment adviser to proprietary mutual funds subjects the Partnership, through its ownership of OLV, the investment adviser to current and future mutual funds of the Trust, to additional operational risk and heightened regulatory requirements.
RISKS RELATED TO AN INVESTMENT IN LIMITED PARTNERSHIP INTERESTS (“INTERESTS”)
HOLDING COMPANY — JFC is a holding company; as a consequence, JFC’s ability to satisfy its obligations under the Partnership Agreement will depend in large part on the ability of its subsidiaries to pay distributions or dividends to JFC, which is restricted by law and contractual obligations.
Since JFC is a holding company, the principal sources of cash available to it are distributions or dividends from its subsidiaries and other payments under intercompany arrangements with its subsidiaries. Accordingly, JFC’s ability to generate the funds necessary to satisfy its obligations with respect to the Interests, including the 7.5% “guaranteed payment” (for tax purposes, within the meaning of the Internal Revenue Code)Code of 1986, as amended (the “IRC”)) to limited partners pursuant to Section 3.3 of the Partnership Agreement (the “7.5% Payment”), will be dependent on distributions, dividends, and intercompany payments from its subsidiaries, and if those sources are insufficient, JFC may be unable to satisfy such obligations.
JFC’s principal operating subsidiaries, including Edward Jones, are subject to various statutory and regulatory restrictions applicable to broker-dealers generally that limit the amount of cash distributions, dividends, loans and advances that those subsidiaries may pay to JFC. Regulations relating to capital requirements affecting some of JFC’s subsidiaries also restrict their ability to pay distributions or dividends and make loans to JFC. See “Business—Regulation”.
PARTPart I,
|
|
Item 1 – Business – Regulation for a discussion of these requirements.
In addition, JFC’s subsidiaries may be restricted under the terms of their financing arrangements from paying distributions or dividends to JFC, or may be required to maintain specified levels of capital. Moreover, JFC or its subsidiaries may enter into financing arrangements in the future which may include additional restrictions or debt covenant requirements further restricting distributions to JFC, which may impact JFC’s ability to make distributions to its limited partners.
26
PART I
Item 1A. Risk Factors, continued
ASVAILABILITYUFFICIENCYOF DISTRIBUTIONSTO REPAY FINANCING —Limited partners may finance their purchase of the Interests with a bank loan, but theloan. The Partnership does not guarantee those loans and distributions may be insufficient to pay the interest or principal on the loans.
Many limited partners finance the purchases of their Interests by obtaining personal bank loans. Any such bank loan agreement is between the limited partner and the bank. The Partnership performs certain administrative functions for the majority of limited partner bank loans, but does not guarantee the bank loans, nor can limited partners pledge their Partnership interestInterests as collateral for the bank loan. Limited partners who have chosen to finance a portion of the purchase price of their Interests assume all risks associated with the loan, including the legal obligation to repay the loan.
There is no assurance that distributions from the Partnership will be sufficient to pay the interest on a limited partner’s loan or repay the principal amount of the loan at or prior to its maturity. There also can be no assurance that such distributions will be sufficient to pay all income taxes due each year arising from the Interests. Furthermore, in the event the Partnership experiences a loss which leads to its liquidation, there is no assurance there will be sufficient capital available to distribute to the limited partners for the repayment of any loans.
STATUS AS PARTNER FOR TAX PURPOSESAND TAX RISKS —Limited partners will be subject to income tax liabilities on the Partnership’s income, whether or not income is distributed, and may have an increased chance of being audited. Limited partners may also be subject to passive loss rules as a result of their investment.
Limited partners will be required to file tax returns and pay income tax in each jurisdiction in which the Partnership operates, as well as in the limited partner’s state of residence or domicile. Limited partners will be liable for income taxes on their pro rata share of the Partnership’s taxable income. The amount of income the limited partner pays tax on can significantly exceed the net income earned on the Interests and the income distributed to such limited partner, which results in a disproportionate share of income being used to pay taxes. The Partnership’s income tax returns may be audited by government authorities, and such audit may result in the audit of the returns of the limited partners (and, consequently, an amendment of their tax returns). In addition, from time to time, legislative changes to the IRC or state laws may be adopted that could increase the tax rate applicable to the limited partners’ net income earned and/or subject the net income earned to additional taxes currently not applicable.
A limited partner’s share of the Partnership’s income or losses could be subject to the passive loss rules. Under specific circumstances, certain income may be classified as portfolio income or passive income for purposes of the passive loss rules. In addition, under certain circumstances, a limited partner may be allocated a share of the Partnership’s passive losses, the deductibility of which will be limited by the passive loss rules.
POSSIBLE TAX LAW CHANGES–From time to time, legislative changes to the IRC or state laws may be adopted that could increase the tax rate applicable to the limited partners’ net income earned and/or subject the net income earned to additional taxes currently not applicable.
Congress may enact legislation that subjects a limited partner’s share of the Partnership’s taxable income to self-employment tax. Such legislation, if ever enacted, may substantially reduce a limited partner’s after-tax return from his or her Interest. Other tax law changes may substantially impact a limited partner’s Interest and cannot be predicted.
27
PART I
Item 1A. Risk Factors, continued
NON-VOTING INTERESTS; NON-TRANSFERABILITY OFOF INTERESTS; ABSENCE OFOF MARKET;, PRICE FOR INTERESTS — —The Interests are non-voting and non-transferable, no market for the Interests exists or is expected to develop, and the price only represents book value.
None of the limited partners in their capacity as limited partners may vote or otherwise participate in the management of the Partnership’s business. The Managing Partner has the authority to amend the Partnership Agreement without the consent of the limited partners, subordinated limited partners or general partners. None of the limited partners may sell, pledge, exchange, transfer or assign their Interests without the express written consent of the Managing Partner (which is not expected to be given).
Because there is no market for the Interests, there is no fair market value for the Interests. The price ($1,000 per Interest) at which the Interests were offered represents the book value of each Interest. TheCapital could decline to a point where the book value of the Interests could be less than the price paid, if the capital of the general partners and subordinated limited partners was reduced to zero as a result of losses incurred by the Partnership.paid.
RISK OFOF DILUTION — —The Interests may be diluted from time to time, which could lead to decreased returns to the limited partners.
The Managing Partner has the ability, in his or her sole discretion, to issue additional Interests or Partnership capital. The Partnership filed a Registration Statement on Form S-8 with the SEC on January 17, 2014, to register $350 million of Interests pursuant to the Partnership’s 2014 Employee Limited Partnership Interest Purchase Plan (“2014 LP Offering”). On January 2, 2015, the Partnership issued $292 million of Interests in connection with the 2014 LP Offering. The remaining $58 million of Interests may be issued at the discretion of the Partnership in the future. The issuance of Interests will reduce the percentage of participation in net income by general partners, subordinated limited partners and pre-existing limited partners.
Any additionissuance of newadditional Interests will decrease the Partnership’s net interest income by the 7.5% PaymentsPayment for any such additional Interests, and holders of existing Interests may suffer decreased returns on their investment because the amount of the Partnership’s net income they participate in may be reduced as a consequence. Additionally,Accordingly, the issuance of Interests will reduce the Partnership’s net interest income and profitability beginning in 2015.
In 2014, the Partnership retains approximately 23%retained 13.8% of the general partners’ net income (as defined in the Partnership Agreement) as capital which is credited monthly to the general partners’ Adjusted Capital Contributions (as defined in the Partnership Agreement). Beginning in 2011, the Partnership decreased the amount ofRetention for 2015 is expected to remain at a similar level as 2014. Such retention, to approximately 23% from 28% of net income allocated to general partners.
PART I
|
|
Such contributions, along with any additional capital contributions by general partners, will reduce the percentage of participation in net income by limited partners. There is no requirement to retain a minimum amount of general partners’ net income, and the percentage of retained net income could change at any time in the future. In accordance with the Partnership Agreement, the percentage of income allocated to limited partners is reset annually and the amount of retained general partner income and any additional issuance of general partnership capital reduces the income allocated to limited partners.
28
PART I
Item 1A. Risk Factors, continued
LIMITATION OFOF LIABILITY; INDEMNIFICATION — —The Partnership Agreement limits the liability of the Managing Partner and general partners by indemnifying them under certain circumstances, which may limit a limited partner’s rights against them and could reduce the accumulated profits distributable to limited partners.
The Partnership Agreement provides that none of the general partners, including the Managing Partner, will be liable to any person for any acts or omissions by such partner on behalf of the Partnership (even if such action, omission or failure constituted negligence) as long as such partner has (a) not (a) committed fraud, (b) acted or failed to act in subjective good faith or in a manner which involveddid not involve intentional misconduct or a knowing violation of law or which was not grossly negligent, or (c) not derived improper personal benefit.
The Partnership also must indemnify the general partners, including the Managing Partner, from any claim in connection to acts or omissions performed in connection with the business of the Partnership and from costs or damages stemming from a claim attributable to acts or omissions by such partner unless such act was not in good faith on behalf of the Partnership, was not in a manner reasonably believed by the partner to be within the scope of his or her authority, nor in the best interests of the Partnership. The Partnership does not have to indemnify any general partner in instances of fraud, acts or omissions not in good faith or which involve intentional misconduct, a knowing violation of the law, or gross negligence, or where such partner derived improper personal benefit.
As a result of these provisions, the limited partners will have more limited rights against such partners than they would have absent the limitations in the Partnership Agreement. Indemnification of the general partners could deplete the Partnership’s assets unless the indemnification obligation is covered by insurance, which the Partnership may or may not obtain, or which insurance may not be available at a reasonable price or at all or in an amount sufficient to cover the indemnification obligation. The Partnership Agreement does not provide for indemnification of limited partners.
29
PART I
Item 1A. Risk Factors, continued
RISK OF LOSS—The Interests are equity interests in the Partnership. As a result, and in accordance with the Partnership Agreement, the right of return of a limited partner’s Capital Contribution (as defined in the Partnership Agreement) is subordinate to all existing and future claims of the Partnership’s general creditors, including any of its subordinated creditors.
In the event of a partial or total liquidation of the Partnership or in the event there were insufficient Partnership assets to satisfy the claims of its general creditors, the limited partners may not be entitled to receive their entire Capital Contribution amounts back. Limited partner capital accounts are not guaranteed. However, as a class, the limited partners would be entitled to receive their aggregate Capital Contributions back prior to the return of any capital contributions to the subordinated limited partners or the general partners. If the Partnership suffers losses in any year but liquidation procedures described above are not undertaken and the Partnership continues, the amounts of such losses would be absorbed in the capital accounts of the partners as described in the Partnership Agreement, and each limited partner in any event remains entitled to receive annual 7.5% Payments on his or her contributed capital under the terms of the Partnership Agreement. However, as there would be no accumulated profits in such a year, limited partners would not receive any sums representing participation in net income of the Partnership. In addition, although the amount of such annual 7.5% Payments to limited partners are charged as an expense to the Partnership and are payable whether or not the Partnership earns any accumulated profits during any given period, no reserve fund has been set aside to enable the Partnership to make such payments. Therefore, such payments to the limited partners are subject to the Partnership’s ability to service this annual 7.5% Payment, of which there is no assurance.
FOREIGN EXCHANGE RISK FOR CANADIAN RESIDENTS — Each foreign limited partner has the risk that he or she will lose value on his or her investment in the Interests due to fluctuations in the applicable exchange rate; furthermore, foreign limited partners may owe tax on a disposition of the Interests solely as the result of a movement in the applicable exchange rate.
All investors purchase Interests using U.S. dollars. As a result, limited partners who reside in Canada may risk having the value of their investment, expressed in Canadian currency, decrease over time due to movements in the applicable currency exchange rates. Accordingly, such limited partner may have a loss upon disposition of his or her investment solely due to a downward fluctuation in the applicable exchange rate.
30
PART I
Item 1A. Risk Factors, continued
In addition, changes in exchange rates could have an impact on Canadian federal income tax consequences for a limited partner, if such limited partner is a resident in Canada for purposes of the Income Tax Act (Canada). The disposition by such limited partner of an Interest, including on and as a result of the withdrawal of the limited partner or the Partnership’s dissolution, may result in the realization of a capital gain (or capital loss) by such limited partner. The amount of such capital gain (or capital loss) generally will be the amount, if any, by which the proceeds of disposition of such Interest, less any reasonable costs of disposition, each expressed in Canadian currency using the exchange rate on the date of disposition, exceed (or are exceeded by) the adjusted cost base of such Interest, expressed in Canadian currency using the exchange rate on the date of each transaction that is relevant in determining the adjusted cost base. Accordingly, because the exchange rate for those currencies may fluctuate between the date or dates on which the adjusted cost base of a limited partner’s Interest is determined and the date on which the Interest is disposed of, a Canadian-resident limited partner may realize a capital gain or capital loss on the disposition of his or her Interest solely as a result of fluctuations in exchange rates.
|
None.
|
The Partnership primarily conducts its U.S. home office operations from two campus locations in St. Louis, Missouri and one campus location in Tempe, Arizona. As of December 31, 2011,2014, the Partnership’s U.S. home office consisted of 1815 separate buildings totaling approximately 2.0 million square feet.
Of the 1815 U.S. home office buildings, two buildings areone building is leased through an operating lease and the remaining 1614 are owned by the Partnership. The land for the Tempe, Arizona campus is leased. In addition, the Partnership leases its CanadianCanada home office facility in Mississauga, Ontario through an operating lease. The Partnership also maintains facilities in 11,40812,016 branch locations as of December 31, 2011,2014, which are located in the U.S. and Canada and are predominantly rented under cancelable leases. See Part II, Item 8 – Financial Statements and Supplementary Data – Notes 1513 and 1816 to the Consolidated Financial Statements for information regarding non-cancelable lease commitments and related party transactions, respectively.
31
PART I
|
In the normal course of business, the Partnership is named, from time to time, as a defendant in various legal actions, including arbitrations, class actions and other litigation. Certain of these legal actions may include claims for substantial compensatory and/or punitive damages or claims for indeterminate amounts of damages. The Partnership is involved, from time to time, in various legal matters, including arbitrations, class actions, other litigation, and investigations and proceedings by governmental organizations and SROs, certain of which may result in adverse judgments, fines or penalties.SROs.
LyondellCountrywide.. In October 2010, There have been five cases filed against Edward Weisfelner, as trustee (“Trustee”) of a trust createdJones (in addition to numerous other issuers and underwriters) asserting various claims under the bankruptcy planU.S. Securities Act of 1933 (the “Securities Act”) in connection with registration statements and prospectus supplements issued for certain mortgage-backed certificates issued between 2005 and 2007.
Three of these cases were purported class actions (David H. Luther, et al. v. Countrywide Financial Corporation, et al. filed in 2007 in the Superior Court of the State of California, County of Los Angeles;Maine State Retirement System, et al. v. Countrywide Financial Corporation, et al. filed in 2010 in the U.S. District Court for the reorganization for Lyondell Chemical Company (“Lyondell”)Central District of California; and various affiliates,Western Conference of Teamsters Pension Trust Fund v. Countrywide Financial Corporation, et al. filed suit (the “First Lyondell Complaint”)in 2010 in the Superior Court of the State of California, County of Los Angeles) filed against numerous brokerage firmsissuers and banks,underwriters, including Edward Jones. The case was subsequently removed toplaintiffs sought compensatory damages and reasonable costs and fees, including attorneys’ and experts’ fees. The U.S. BankruptcyDistrict Court for the SouthernCentral District of New York (“SDNY”).California granted final approval of a settlement for these three cases on December 6, 2013, and dismissed the cases on December 17, 2013. The lawsuit challengesapproved settlement is not expected to have a 2007 leveraged buyoutmaterial adverse impact on the Partnership’s consolidated financial condition. On January 14, 2014, some objectors to the settlement filed a notice of Lyondell. Plaintiffs allege thatappeal of the payments made to former Lyondell shareholders for their stock were constructiveCourt’s final judgment and intentional fraudulent transfers. Edward Jones’ customers received approximately $7 milliondismissal, and the appeal is currently pending in the U.S. Court of Appeals for the Lyondell shares held atNinth Circuit.
On August 10, 2012, the FDIC, in its capacity as receiver for Colonial Bank, filed a separate lawsuit (FDIC v. Countrywide Securities Corporation, Inc., et al.) in the U.S. District Court for the Central District of California against numerous issuers and underwriters, including Edward Jones. InThe plaintiff sought compensatory damages and attorneys’ fees and costs. On April 8, 2013, the Court dismissed this case based on statute of limitations grounds. The FDIC filed a notice of appeal of the Court’s dismissal on October 3, 2013, and the appeal is currently pending in the U.S. Court of Appeals for the Ninth Circuit.
On December 12, 2013, a case was filed in the Superior Court of 2010,the State of California, County of Los Angeles, Northwest District (Triaxx Prime CDO 2006-1 LTD et al. v. Banc of America Securities, LLC et al.) that involved allegations regarding the sale of tranches of Countrywide Private Label Mortgage Backed Securities. The plaintiffs sought damages in an amount that was to be determined at trial and the consideration paid for the tranches at issue, less any income received on the tranches. The defendants removed the case to the U.S. District Court for Central District of California on January 10, 2014. A settlement was reached between the parties, and the case was dismissed with prejudice, by court order on October 1, 2014. The settlement does not have a material adverse impact on the Partnership’s consolidated financial condition.
32
PART I
Item 3. Legal Proceedings, continued
Daniel Ezersky, individually and on behalf of all others similarly situated. On March 14, 2013, Edward Jones was served withnamed as a second Lyondell related complaint (the “Second Lyondell Complaint”), broughtdefendant in U.S. Bankruptcya putative class action lawsuit in the Circuit Court of St. Louis County, Missouri. The petition alleged that Edward Jones breached its fiduciary duties and was unjustly enriched through the use of an online life insurance needs calculator that plaintiff claims inflated the amount of insurance he needed. The plaintiff sought damages on behalf of Missouri residents who purchased certain life insurance products from Edward Jones between March of 2008 and the present, including: actual damages, or alternatively, judgment in an amount equal to profits gained from the sale of term, whole life or universal life insurance to plaintiff/damages class; punitive damages; injunctive relief; costs, including reasonable fees and expert witness expenses; and reasonable attorneys’ fees. On August 18, 2014, Edward Jones filed a motion for the SDNYsummary judgment, which was subsequently granted by the same Trustee acting forCourt. Plaintiff filed a different trust created undernotice of appeal on December 10, 2014, and the Lyondell bankruptcy reorganization plan. This complaint also asserts fraudulent transfer claims, seeks similar relief, and names many of the same defendants as foundappeal is currently pending in the original Lyondell matter, including Edward Jones. InMissouri Court of Appeals, Eastern District.
Nicholas Maxwell, individually and on behalf of all others similarly situated. On December 2011,18, 2012, Edward Jones was dismissed from the First Lyondell Complaint without prejudice upon the filingnamed as a defendant in a putative class action complaint in Alameda Superior Court. The complaint asserted causes of an amended claimaction for unlawful wage deductions (Labor Code sections 221, 223, 400-410, 2800, 2802, Cal. Code Reg. title 8, section 11040(8)); California Unfair Competition Law violations (Business and Professions Code sections 17200-04); and waiting time penalties (Labor Code sections 201-203). Plaintiff alleged that removed Edward Jones asimproperly charged its California financial advisors fees, costs, and expenses related to trading errors or “broken” trades and failed to timely pay wages at termination. The parties reached a named defendant. Edward Jonessettlement, and the Court granted final approval of the settlement on September 22, 2014. A compliance hearing was dismissed fromheld on January 8, 2015, and the Second Lyondell Complaint, without prejudice,case is now closed. The settlement did not have a material adverse impact on February 28, 2012.the Partnership’s consolidated financial condition.
Tribune. In August 2011, retirees of Times Mirror/Tribune Company filed suit in the U.S. District Court for the SDNYSouthern District of New York (“SDNY”) against numerous brokerage firms and banks, including Edward Jones, claiming that a fraudulent transfer occurred during the 2007 Times Mirror/Tribune Company merger. Plaintiffs allege that payments made to Tribune Company shareholders, of which Edward Jones’ customers received approximately $6.5 million, constituted fraudulent transfers. The case is now stayed at the request of the parties. In January 2012, a second but related lawsuit was filed in Illinois state court against numerous brokerage firms and banks, including Edward Jones, regarding the same 2007 Tribune leveraged buyout. The lawsuit was brought on behalf of a number of investment entities, who claim that the payments made to former shareholders constituted fraudulent transfers. The case has been stayed atconsolidated in the request of the plaintiffs. The Illinois case was recently removed to U.S. District Court for the Northern DistrictSDNY along with a number of Illinois.similar cases as part of the multi-district litigation process. The case is pending.
33
PART I
Item 3. Legal Proceedings, continued
CountrywideIn the Matter of Edward D. Jones & Co., L.P. Municipal Bond Pricing.. Two matters (David H. Luther, et al. v. Countrywide Financial Corporation, et al. and Maine State Retirement System, et al. v. Countrywide Financial Corporation, et al.) were filed in 2007 and 2010. Both cases are purported class actions in which plaintiffs allege against numerous issuers and underwriters, including On April 27, 2012, the SEC’s Division of Enforcement informed Edward Jones certainthat it had commenced an investigation into Nebraska Public Power District’s (“NPPD”) Taxable Build America Bonds (“BAB”), which formed part of NPPD’s 2009 General Revenue Bonds offering. Edward Jones was a co-manager of that offering. The SEC’s investigation inquired into whether Edward Jones and others may have engaged in possible violations of the Securities Act, the Securities Exchange Act of 19331934, as amended (the “Securities“Exchange Act”) in connection with registration statements, and prospectus supplementsMunicipal Securities Rulemaking Board Rules. In January 2013, the SEC commenced an investigation that subsumed the one just described, relating more generally to municipal bond pricing at issuance and inquiring into the same types of possible violations. In August 2013, the SEC’s Division of Enforcement informed Edward Jones that it was requesting certain additional information growing out of a 2010 examination conducted by the SEC’s Office of Compliance Inspections and Examinations relating to the firm’s secondary trading of municipal bonds. On October 30, 2013, the Special Inspector General for the Troubled Asset Relief Program issued fora subpoena to Edward Jones requesting documents relating to certain mortgage-backed certificates between January 2005BAB transactions and June 2007. Defendants filed a demurrerinformed Edward Jones that it is in theLuther case that is scheduled to be argued later in 2012 in California state court. Plaintiffs seek unspecified compensatory damages, attorneys’ fees, costs, expenses and rescission. Separate plaintiffs filed a consolidated class action complaint in theMaine State Retirement System case in California federal court in July 2010. In November 2010, the court dismissed all process of plaintiffs’ claims to the extent they related to any certificates for which Edward Jones acted as dealer and directed plaintiffs to amend their complaint.
PART I
|
|
Thus, although Edward Jones could be a party to any potential appeal, there are no claims currently pending against Edward Jones in theMaine State Retirement System Case. On November 17, 2010, a third matter was filed in California state court,Western Conference of Teamsters Pension Trust Fund v. Countrywide Financial Corporation, et al., purporting to re-assert claims that were dismissed in theMaine State Retirement case. That case has been stayed by agreement of the parties.
Lehman Brothers. In 2008, numerous plaintiffs filed class and individual actions in state and federal courts related to the issuance of various securities by Lehman Brothers Holdings Inc. (“Lehman Brothers”). The actions primarily allege violations of the Securities Act and certain state law claims, and name several dozen purported underwriters as defendants, as well as numerous former officers and directors of Lehman Brothers and Lehman Brothers’ former auditor. All ofreviewing these actions were ultimately removed and/or transferred to the SDNY, where they were consolidatedissues. Consistent with a class action brought by lead plaintiffs. The consolidated class action complaint asserts claims against Edward Jones under section 11 of the Securities Act in connection with two offerings of Lehman bonds in 2008. Various underwriter defendants, including Edward Jones, settled in principle the claims as against them. In December 2011, an order was entered preliminarily certifying a settlement class. The settlement is subject to court approval after notice to class members and applies only to the claims brought by lead plaintiffs.
its practice, Edward Jones is a defendantcooperating fully with the SEC in three additional actions relatedan effort to resolve the matter and with the Special Inspector General with respect to its underwriting of Lehman Brothers notes that are pending in the SDNY. Two of the suits are putative class action suits originally brought by plaintiffs in state court in Arkansas (the “Arkansas Plaintiffs”), which assert Securities Act claims based upon two offerings of Lehman Brothers’ notes in 2007. The third suit was amended in October 2011investigation. No assurance can be given as to assert a Section 11 claim against Edward Jones related to three offerings of Lehman bonds in January and February 2008. Plaintiff alleges to have purchased $3 million of securities inhow or when these offerings, but did not make any of these purchases through Edward Jones. Collectively, these actions name several other purported underwriters as defendants, as well as numerous former officers and directors of Lehman Brothers and Lehman Brothers’ former auditor. On January 6, 2012, Edward Jones and other defendants moved to dismiss these actions and strike the class claims brought by the Arkansas Plaintiffs. The motions were fully briefed as of March 5, 2012.
Yavapai County Litigation. In September 2009, three lawsuits were filed in the State of Arizona; all three lawsuits were consolidated and are pending before the United States District Court for the State of Arizona. The actions relate to bonds underwritten by Edward Jones and other brokerage firms for the purpose of financing construction of an event center in Prescott Valley, Arizona. Edward Jones sold approximately $2.9 million of the bonds. The plaintiffs allege the underwriters, including Edward Jones, made material misrepresentations and omissions in the Preliminary Official Statementmatters will be resolved and/or in the Official Statement. One of the matters was filed as a putative class action in which the plaintiffs seek to represent all purchasers of the issued bonds. Allstate is suing as a purchaser of the bonds and Wells Fargo filed a separate action as indenture trustee on behalf of all bond holders. The Court entered an order in November, 2010 dismissing several of the claims against Edward Jones, including all claims brought on behalf of the class. The remaining claims against Edward Jones stem from allegations that defendants violated certain state securities acts and committed common law torts. Plaintiffs are seeking an unspecified amount of damages including attorneys’ fees, costs, expense, rescission or statutory damages, out-of-pocket damages and prejudgment interest. In 2011, Edward Jones filed a Third-Party Complaint and Counterclaim against Wells Fargo Bank, N.A., solely in its capacity as Indenture Trustee, asserting claims for negligent misrepresentation based on Wells Fargo’s involvement with the bond documents and Official Statement.concluded.
PART I
|
|
FINRA Fixed-Income Trading Matter. In the fall of 2007, FINRA began investigating Edward Jones’ trading activity in fixed-income securities during the period from January 1, 2004 through December 31, 2004. FINRA alleged that 31 of those trades were not priced as favorably as possible under prevailing market conditions, in violation of NASD Rules 2110 and 2320. FINRA also alleged that Edward Jones’ written supervisory procedures concerning best execution of fixed-income transactions in place in 2004 were inadequate, in violation of NASD Rules 2110 and 3010. Edward Jones furnished a written submission to FINRA in response to these allegations and is currently in discussions with FINRA to resolve this matter.
FINRA Municipal Bond Matter. In early 2010, FINRA began investigating five identified municipal bond transactions that occurred from January 1, 2008 to March 31, 2008. In May 2011, FINRA asked Edward Jones whether it wished to submit a written submission in connection with the pricing of the bonds, and Edward Jones furnished a written submission to FINRA. Edward Jones is currently in discussions with FINRA to resolve this matter.
FINRA Municipal Securities Matter. By letter dated June 1, 2010, FINRA advised Edward Jones it had made a preliminary determination to recommend a disciplinary action based on a review of five transactions during the period April 1, 2007, through June 30, 2007. FINRA alleged Edward Jones purchased municipal securities for its own account for a customer or sold municipal securities for its own account to a customer at an aggregate price (including mark-down and mark-up) that was not fair and reasonable, taking into consideration all relevant factors in violation of MSRB Rules G-17 and G-30(a). Edward Jones furnished a written submission to FINRA in response to these allegations and is currently in discussions with FINRA to resolve this matter.
FINRA Short-Interest Reporting Matter. By letter dated June 1, 2010, FINRA advised Edward Jones it had made a preliminary determination to recommend disciplinary action based on a review of Edward Jones’ short-interest reporting for the period July 31, 2007, through February 27, 2009. FINRA alleged the conduct was in violation of NASD Rule 3360 or FINRA Rule 4560, and NASD Rules 2110 and 3010. Edward Jones furnished a written submission to FINRA in response to these allegations and is currently in discussions with FINRA to resolve this matter.
FINRA Investigation. FINRA is investigating the activities of two former financial advisors who introduced and/or solicited clients to invest in an outside business venture. Edward Jones terminated both financial advisors and has settled with identified clients whose losses total approximately $2 million. State and federal authorities are investigating the two above-referenced financial advisors, but Edward Jones is not aware of any such investigation into the firm.
Missouri Investigation. The State of Missouri opened an investigation into the activities of a former financial advisor for allegedly misappropriating customer funds. Edward Jones terminated the financial advisor, who pled guilty to criminal charges. Edward Jones identified the clients involved and paid restitution totaling approximately $750,000 to those individuals. The State of Missouri opened an investigation, which has been inactive since 2010.
|
None.
Not applicable.
34
There is no established public trading market for the Partnership’s limited partnership and subordinated limited partnership interests and their assignment or transfer is prohibited. As of February 24, 2012,27, 2015, the Partnership was composed of 14,41620,257 limited partners and 280364 subordinated limited partners.
On January 2, 2015, the Partnership issued an aggregate of $4,538,500 of Interests to certain retired general partners of JFC and retired associates of Edward Jones for aggregate consideration of $4,538,500 in a private placement in reliance on the exemption from registration under Section 4(a)(2) of the Securities Act and Rule 506 of Regulation D promulgated thereunder. The Partnership obtained representations from each investor that such investor was either an accredited investor or has such knowledge and experience in financial and business matters that such investor was capable of evaluating the merits and risks of the investment.
|
The following information sets forth, for the past five years, selected financial data determined from the audited financial statements.
All information included in the Annual Report on Form 10-K is presented on a continuing operations basis unless otherwise noted.
Summary Consolidated Statements of Income Data:
(All dollars in millions, except per unit information and units outstanding)
($ millions, except per unit information | For the years ended December 31, | |||||||||||||||||||
and units outstanding) | 2014 | 2013 | 2012 | 2011 | 2010 | |||||||||||||||
| ||||||||||||||||||||
Net revenue | $ | 6,278 | $ | 5,657 | $ | 4,965 | $ | 4,510 | $ | 4,107 | ||||||||||
|
|
|
|
|
|
|
|
|
| |||||||||||
Income before allocations to partners | $ | 770 | $ | 674 | $ | 555 | $ | 482 | $ | 393 | ||||||||||
|
|
|
|
|
|
|
|
|
| |||||||||||
Income allocated to limited partners per weighted average $1,000 equivalent limited partnership unit outstanding | $ | 129.40 | $ | 121.12 | $ | 109.84 | $ | 104.66 | $ | 96.07 | ||||||||||
Weighted average $1,000 equivalent limited partnership units outstanding | 636,481 | 644,856 | 655,663 | 668,450 | 455,949 | |||||||||||||||
| 2011 | 2010 | 2009 | 2008 | 2007 | ||||||||||||||||
Total revenue | $ | 4,578 | $ | 4,163 | $ | 3,548 | $ | 3,821 | $ | 4,097 | ||||||||||
Interest expense | 68 | 56 | 58 | 72 | 80 | |||||||||||||||
|
|
|
|
|
|
|
|
|
| |||||||||||
Net revenue | $ | 4,510 | $ | 4,107 | $ | 3,490 | $ | 3,749 | $ | 4,017 | ||||||||||
Income from continuing operations | $ | 482 | $ | 393 | $ | 269 | $ | 385 | $ | 561 | ||||||||||
Loss from discontinued operations | — | — | (105 | ) | (73 | ) | (53 | ) | ||||||||||||
|
|
|
|
|
|
|
|
|
| |||||||||||
Income before allocations to partners | $ | 482 | $ | 393 | $ | 164 | $ | 312 | $ | 508 | ||||||||||
Income allocated to limited partners per weighted average $1,000 equivalent limited partnership unit outstanding | $ | 104.66 | $ | 96.07 | $ | 41.44 | $ | 86.21 | $ | 165.92 | ||||||||||
Weighted average $1,000 equivalent limited partnership units outstanding | 668,450 | 455,949 | 471,597 | 489,920 | 498,132 | |||||||||||||||
PART II
|
|
In accordance with Financial Accounting Standards Board (“FASB”) Accounting Standards Codification (“ASC”) No. 480,Distinguishing Liabilities from Equity (“ASC 480”), the Partnership presents net income of $0 on its Consolidated Statements of Income. See Part II, Item 8 – Financial Statements and Supplementary Data – Note 1 to the Consolidated Financial Statements for further discussion.
35
PART II
Item 6. Selected Financial Data, continued
Summary Consolidated Statements of Financial Condition Data:
(All dollars in millions)
| As of December 31, | ||||||||||||||||||||
| ($ millions) | 2014 | 2013 | 2012 | 2011 | 2010 | |||||||||||||||
Total assets | $ | 14,770 | $ | 13,795 | $ | 13,042 | $ | 9,584 | $ | 8,241 | ||||||||||
|
|
|
|
|
|
|
|
|
| |||||||||||
Long-term debt and bank loans | $ | 3 | $ | 4 | $ | 6 | $ | 7 | $ | 66 | ||||||||||
Other liabilities exclusive of subordinated liabilities and partnership capital subject to mandatory redemption | 12,549 | 11,660 | 10,953 | 7,521 | 6,366 | |||||||||||||||
Subordinated liabilities | - | 50 | 100 | 150 | 204 | |||||||||||||||
Partnership capital subject to mandatory redemption | 2,218 | 2,081 | 1,983 | 1,906 | 1,605 | |||||||||||||||
|
|
|
|
|
|
|
|
|
| |||||||||||
Total liabilities and partnership capital | $ | 14,770 | $ | 13,795 | $ | 13,042 | $ | 9,584 | $ | 8,241 | ||||||||||
|
|
|
|
|
|
|
|
|
| |||||||||||
| 2011 | 2010 | 2009 | 2008 | 2007 | ||||||||||||||||
Total assets(1) | $ | 9,584 | $ | 8,241 | $ | 7,168 | $ | 6,992 | $ | 5,824 | ||||||||||
|
|
|
|
|
|
|
|
|
| |||||||||||
Bank loans | $ | — | $ | — | $ | 58 | $ | 43 | $ | — | ||||||||||
Long-term debt | 7 | 66 | 59 | 9 | 11 | |||||||||||||||
Other liabilities exclusive of subordinated liabilities and partnership capital subject to mandatory redemption(2) | 7,521 | 6,366 | 5,327 | 5,203 | 4,087 | |||||||||||||||
|
|
|
|
|
|
|
|
|
| |||||||||||
| 7,528 | 6,432 | 5,444 | 5,255 | 4,098 | ||||||||||||||||
|
|
|
|
|
|
|
|
|
| |||||||||||
Subordinated liabilities | 150 | 204 | 257 | 261 | 275 | |||||||||||||||
|
|
|
|
|
|
|
|
|
| |||||||||||
Partnership capital subject to mandatory redemption / partnership capital (net of reserve for anticipated withdrawals) | 1,758 | 1,497 | 1,437 | 1,413 | 1,328 | |||||||||||||||
Reserve for anticipated withdrawals | 148 | 108 | 30 | 63 | 123 | |||||||||||||||
|
|
|
|
|
|
|
|
|
| |||||||||||
Partnership capital subject to mandatory redemption/partnership capital | 1,906 | 1,605 | 1,467 | 1,476 | 1,451 | |||||||||||||||
|
|
|
|
|
|
|
|
|
| |||||||||||
Total liabilities and partnership capital | $ | 9,584 | $ | 8,241 | $ | 7,168 | $ | 6,992 | $ | 5,824 | ||||||||||
|
|
|
|
|
|
|
|
|
| |||||||||||
36
|
|
|
|
PART II
MANAGEMENT’S DISCUSSION AND ANALYSIS OF FINANCIAL CONDITION AND RESULTS OF OPERATIONS |
The following Management’s Discussion and Analysis is intended to help the reader understand the results of operations and the financial condition of the Partnership. Management’s Discussion and Analysis should be read in conjunction with the Partnership’s Consolidated Financial Statements and accompanying notes included in Part II, Item 8 – Financial Statements and Supplementary Data of this Annual Report on Form 10-K. All amounts are presented in millions, except as otherwise noted.
Basis of Presentation
The Partnership broadly categorizes its net revenues into four categories: fee revenue, trade revenue (revenue from client buy or sell transactions of securities), fee revenue, net interest and dividends revenue (net of interest expense) and other revenue. In the Partnership’s Consolidated Statements of Income, trade revenue is composed of commissions, principal transactions and investment banking. Feefee revenue is composed of asset-based fees and account and activity fees. Trade revenue is composed of commissions, principal transactions and investment banking. These sources of revenue are affected by a number of factors. Trade revenue is impacted by the number of financial advisors, trading volume (client dollars invested), mix of the products in which clients invest, margins earned on the transactions and market volatility. Asset-based fees are generally a percentage of the total value of specific assets in client accounts. These fees are impacted by client dollars invested in and divested from the accounts which generate asset-based fees and change in market pricesvalues of the assets. Account and activity fees and other revenue are impacted by the number of client accounts and the variety of services provided to those accounts, and foreign exchange rates, among other factors. Trade revenue is impacted by the number of financial advisors, trading volume (client dollars invested), mix of the products in which clients invest, margins earned on the transactions and market volatility. Net interest incomeand dividends revenue is impacted by the amount of cash and investments, receivables from clients and payables to clients, the variability of interest rates earned and paid on such balances, the number of limited partner interests, interest received on general partner loansInterests, and interest paid onthe balances of partnership loans, long-term debt and liabilities subordinated to claims of general creditors.
In November 2009, the Partnership completed the sale of its U.K. operations. As a result, the U.K. operations are presented as a discontinued operation for 2009. For further details regarding the sale, see Note 2 to the Consolidated Financial Statements in Item 8, Financial Statements and Supplementary Data of this Annual Report on Form 10-K. Accordingly, all information contained in this Annual Report on Form 10-K is presented on a continuing operations basis unless otherwise noted.
37
PART II
| Item 7. Management’s Discussion and Analysis of Financial Condition and Results of Operations, continued |
OVERVIEW
The following table sets forth the increases (decreases)change in major categories of the Consolidated Statements of Income as well as several key related metrics for the last three years. Management of the Partnership relies on this financial information and the related metrics to evaluate the Partnership’s operating performance and financial condition. All amounts are presented in millions, except the number of financial advisors and as otherwise noted.
| For the years ended December 31, | % Change | For the years ended December 31, | % Change | |||||||||||||||||||||||||||||||||||||
| 2011 | 2010 | 2009 | 2011 vs. 2010 | 2010 vs. 2009 | 2014 | 2013 | 2012 | 2014 vs. 2013 | 2013 vs. 2012 | |||||||||||||||||||||||||||||||
Revenue: | ||||||||||||||||||||||||||||||||||||||||
Fee revenue: | ||||||||||||||||||||||||||||||||||||||||
Asset-based | $ | 3,089 | $ | 2,523 | $ | 2,042 | 22% | 24% | ||||||||||||||||||||||||||||||||
Account and activity | 617 | 568 | 574 | 9% | -1% | |||||||||||||||||||||||||||||||||||
|
|
|
|
| ||||||||||||||||||||||||||||||||||||
Total fee revenue | 3,706 | 3,091 | 2,616 | 20% | 18% | |||||||||||||||||||||||||||||||||||
|
|
|
|
| ||||||||||||||||||||||||||||||||||||
% of net revenue | 59% | 55% | 53% | |||||||||||||||||||||||||||||||||||||
Trade revenue: | ||||||||||||||||||||||||||||||||||||||||
Commissions | $ | 1,698.7 | $ | 1,575.8 | $ | 1,360.9 | 8 | % | 16 | % | 2,168 | 2,134 | 1,979 | 2% | 8% | |||||||||||||||||||||||||
Principal transactions | 284.2 | 320.8 | 398.1 | -11 | % | -19 | % | 136 | 183 | 156 | -26% | 17% | ||||||||||||||||||||||||||||
Investment banking | 153.1 | 208.6 | 183.8 | -27 | % | 13 | % | 156 | 122 | 112 | 28% | 10% | ||||||||||||||||||||||||||||
|
|
|
|
|
|
|
|
|
| |||||||||||||||||||||||||||||||
Total trade revenue | 2,136.0 | 2,105.2 | 1,942.8 | 1 | % | 8 | % | 2,460 | 2,439 | 2,247 | 1% | 9% | ||||||||||||||||||||||||||||
|
|
|
|
|
|
|
|
|
| |||||||||||||||||||||||||||||||
% of net revenue | 47 | % | 51 | % | 56 | % | 39% | 43% | 45% | |||||||||||||||||||||||||||||||
Fee revenue: | ||||||||||||||||||||||||||||||||||||||||
Asset-based | 1,776.9 | 1,397.3 | 967.4 | 27 | % | 44 | % | |||||||||||||||||||||||||||||||||
Account and activity | 522.9 | 503.3 | 489.6 | 4 | % | 3 | % | |||||||||||||||||||||||||||||||||
|
|
|
|
| ||||||||||||||||||||||||||||||||||||
Total fee revenue | 2,299.8 | 1,900.6 | 1,457.0 | 21 | % | 30 | % | |||||||||||||||||||||||||||||||||
|
|
|
|
| ||||||||||||||||||||||||||||||||||||
% of net revenue | 51 | % | 46 | % | 42 | % | ||||||||||||||||||||||||||||||||||
Net interest and dividends | 62.5 | 70.5 | 55.0 | -11 | % | 28 | % | 80 | 75 | 71 | 7% | 5% | ||||||||||||||||||||||||||||
Other revenue | 11.6 | 30.5 | 35.6 | -62 | % | -14 | % | 32 | 52 | 31 | -38% | 68% | ||||||||||||||||||||||||||||
|
|
|
|
|
|
|
|
|
| |||||||||||||||||||||||||||||||
Net revenue | 4,509.9 | 4,106.8 | 3,490.4 | 10 | % | 18 | % | 6,278 | 5,657 | 4,965 | 11% | 14% | ||||||||||||||||||||||||||||
Operating expenses | 4,028.1 | 3,714.0 | 3,221.8 | 8 | % | 15 | % | 5,508 | 4,983 | 4,410 | 11% | 13% | ||||||||||||||||||||||||||||
|
|
|
|
|
|
|
|
|
| |||||||||||||||||||||||||||||||
Income from continuing operations | $ | 481.8 | $ | 392.8 | $ | 268.6 | 23 | % | 46 | % | ||||||||||||||||||||||||||||||
Income before allocations to partners | $ | 770 | $ | 674 | $ | 555 | 14% | 21% | ||||||||||||||||||||||||||||||||
|
|
|
|
|
|
|
|
|
| |||||||||||||||||||||||||||||||
Related metrics: | ||||||||||||||||||||||||||||||||||||||||
Client dollars invested(1): | ||||||||||||||||||||||||||||||||||||||||
Trade ($ billions) | $ | 88.4 | $ | 87.8 | $ | 87.1 | 1 | % | 1 | % | $ | 112.8 | $ | 107.9 | $ | 97.4 | 5% | 11% | ||||||||||||||||||||||
Advisory programs ($ billions) | $ | 17.8 | $ | 21.6 | $ | 17.8 | -18 | % | 21 | % | $ | 19.8 | $ | 18.8 | $ | 11.9 | 5% | 58% | ||||||||||||||||||||||
Client households at year end (millions) | 4.48 | 4.46 | 4.46 | 0 | % | 0 | % | |||||||||||||||||||||||||||||||||
Client households at year end | 4.72 | 4.61 | 4.52 | 2% | 2% | |||||||||||||||||||||||||||||||||||
Net new assets for the period end ($ billions)(2) | $ | 52.3 | $ | 41.2 | $ | 30.3 | 27% | 36% | ||||||||||||||||||||||||||||||||
Client assets under care: | ||||||||||||||||||||||||||||||||||||||||
Total: | ||||||||||||||||||||||||||||||||||||||||
At year end ($ billions) | $ | 591.2 | $ | 572.6 | $ | 515.6 | 3 | % | 11 | % | $ | 866.2 | $ | 787.1 | $ | 668.7 | 10% | 18% | ||||||||||||||||||||||
Average ($ billions) | $ | 586.1 | $ | 535.8 | $ | 455.4 | 9 | % | 18 | % | $ | 831.6 | $ | 726.4 | $ | 636.9 | 14% | 14% | ||||||||||||||||||||||
Advisory Programs: | ||||||||||||||||||||||||||||||||||||||||
Advisory programs: | ||||||||||||||||||||||||||||||||||||||||
At year end ($ billions) | $ | 68.8 | $ | 53.7 | $ | 28.7 | 28 | % | 87 | % | $ | 136.9 | $ | 115.6 | $ | 87.4 | 18% | 32% | ||||||||||||||||||||||
Average ($ billions) | $ | 63.6 | $ | 40.8 | $ | 15.0 | 56 | % | 172 | % | $ | 127.7 | $ | 101.0 | $ | 78.8 | 26% | 28% | ||||||||||||||||||||||
Financial advisors: | ||||||||||||||||||||||||||||||||||||||||
Financial advisors (actual): | ||||||||||||||||||||||||||||||||||||||||
At year end | 12,242 | 12,616 | 12,615 | -3 | % | 0 | % | 14,000 | 13,158 | 12,463 | 6% | 6% | ||||||||||||||||||||||||||||
Average | 12,359 | 12,694 | 12,164 | -3 | % | 4 | % | 13,557 | 12,784 | 12,273 | 6% | 4% | ||||||||||||||||||||||||||||
Attrition % | 14.1 | % | 16.2 | % | 14.5 | % | n/a | n/a | 8.9% | 9.4% | 10.7% | n/a | n/a | |||||||||||||||||||||||||||
Dow Jones Industrial Average: | ||||||||||||||||||||||||||||||||||||||||
Dow Jones Industrial Average (actual): | ||||||||||||||||||||||||||||||||||||||||
At year end | 12,218 | 11,578 | 10,428 | 6 | % | 11 | % | 17,823 | 16,577 | 13,104 | 8% | 27% | ||||||||||||||||||||||||||||
Average for year | 11,958 | 10,669 | 8,886 | 12 | % | 20 | % | 16,778 | 15,010 | 12,965 | 12% | 16% | ||||||||||||||||||||||||||||
S&P 500 Index: | ||||||||||||||||||||||||||||||||||||||||
S&P 500 Index (actual): | ||||||||||||||||||||||||||||||||||||||||
At year end | 1,258 | 1,258 | 1,115 | 0 | % | 13 | % | 2,059 | 1,848 | 1,426 | 11% | 30% | ||||||||||||||||||||||||||||
Average for year | 1,268 | 1,139 | 948 | 11 | % | 20 | % | 1,931 | 1,644 | 1,379 | 17% | 19% | ||||||||||||||||||||||||||||
(1) Client dollars invested related to trade revenue represent the principal amount of clients’ buy and sell transactions resulting in commissions, principal transactions and investment banking revenues. Client dollars invested related to advisory programs revenue represent the net inflows of client dollars into the programs.
(2) Net new assets represent cash and securities inflows and outflows from new and existing clients. In the fourth quarter of 2014, net new assets was revised to exclude mutual fund capital gain distributions received by U.S. clients. Previously reported amounts were updated to conform to the current definition.
|
|
38
PART II
| Item 7. Management’s Discussion and Analysis of Financial Condition and Results of Operations, continued |
20112014 versus 20102013 Overview
The Partnership experienced improvedvery strong financial results in 2011during 2014 compared to 2010 despite some challenging economica successful 2013, including record net revenue, income before allocations to partners and client assets under care. Financial results benefitted from net new assets and rising market conditions throughout 2011 caused by the debt ceiling crisis, a downgradein 2014, including increases of the U.S. credit rating and concerns over European debt, all of which caused increased market volatility. This volatility is reflected17% in the fact that the S&P 500 Index was as low as 1,099 in October of 2011 and as high as 1,364 in April 2011, a 24% swing, ending the year at 1,258, the same as it started the year. However, the 2011 daily average S&P 500 Index was up 11% year-over-year and 12% in the average Dow Jones Industrial Average was up 12% year over year. The federal funds rate remained basically unchanged at a range of 0% to 0.25%.Average.
The Partnership’s key performance measures were relatively strong during 2014 and financial advisors attracted $52.3 billion in 2011 despite the challenging economic times.net new assets. Average client assets under care grew 9% in 201114% to $586.1$831.6 billion, which includesincluded a 56%26% increase in the average advisory programsprograms’ average assets under care to $63.6$127.7 billion. Net new assets totaled $27.3 billion in 2011. In addition, client dollars invested relatingrelated to trade revenue were up slightly5% to $88.4 billion from $87.8$112.8 billion.
Net revenue increased 11% to $6.3 billion in 2010.
In 2011, net revenue increased 10% to $4.5 billion driven2014. This increase was led by a 21%20% increase in total fee revenue, compared to 2010. This increase was primarily due to higher levels of asset values on which fees arewere earned, driven by the continued investment of client dollars into advisory programs and the overall rise in the equity markets.
Operating expenses increased 11% in 2014 compared to 2013, primarily due to increased compensation expense driven by higher revenues on which financial advisors are paid and higher variable compensation due to the increase in the Partnership’s profitability.
Overall, the increase in net revenue, partially offset by the increase in operating expenses, generated income before allocations to partners of $770 million, a 14% increase over 2013.
2013 versus 2012 Overview
The Partnership experienced very strong financial results during 2013 compared to a strong 2012, including record net revenue, income before allocations to partners and client assets under care. Financial results benefitted from improved market conditions, including increases of 19% in the average S&P 500 Index and 16% in the average Dow Jones Industrial Average.
The Partnership’s key performance measures were strong during 2013 and financial advisors attracted $41.2 billion in net new assets. Average client assets under care grew 14% to $726.4 billion, which included a 28% increase in the advisory programs’ average assets under care to $101.0 billion. In addition, client dollars invested related to trade revenue were up 11% to $107.9 billion.
Net revenue increased 14% to $5.7 billion in 2013. This increase was led by an 18% increase in fee revenue, primarily due to higher levels of asset values on which fees were earned, driven by the continued investment of client dollars into advisory programs and the overall rise in the equity market averages during 2011. These factorsdaily averages. Revenue growth was also contributed todriven by a changing composition of net revenue, which was 47%9% increase in trade and 51% fee revenue in 2011, compared to 51% trade and 46% fee revenue in 2010.revenue.
Operating expenses increased 8%13% in 20112013 compared to 2010. This was2012, primarily due to an 11% increase inhigher compensation and benefits expense driven by increased financial advisor productivity as well as higher variable compensation (which includes bonuses and profit sharing paid to financial advisors, branch office employees and home office employees) due to the increase in the Partnership’s profitability.
The 10% increase in net revenues coupled with an 8% increase in operating expenses resulted in income from continuing operations of $481.8 million in 2011, which is 23% higher than $392.8 million in 2010.
2010 versus 2009 Overview
During 2010, the Partnership’s results of operations improved significantly compared to 2009. Market conditions during the first half of 2009 were still turbulent, including declines in asset values, interest rates and client activity. The rebound in asset values that began in mid-2009 continued throughout 2010 as evidenced by the 20% increase in the daily average S&P 500 Index. The federal funds rate remained basically unchanged at a range of 0% to 0.25%.
The Partnership’s key performance measures also improved in 2010 in response to the rebound in economic conditions. Average client assets under care grew by 11% to $535.8 billion, which includes a 172% increase in the average advisory programs assets under care to $40.8 billion. In addition, client dollars invested in trade revenue generating transactions and in advisory programs increased 1% (to $87.8 billion) and 21% (to $21.6 billion) in 2010, respectively.
PART II
|
|
In 2010, net revenue increased 18% to $4.1 billion, which was primarily attributable to an 8% increase in trade revenue and a 30% increase in fee revenue. The increase in trade revenue was primarily due to increased margins earned on each $1,000 invested caused by client investments shifting more towards mutual funds and equities in 2010 from certificates of deposit and other fixed income products in 2009. Fee revenue increased primarily due to increased asset-based fees caused by continued growth of client dollars invested into advisory programs and increases in the average market values of client assets on which the Partnership receives asset-based fees.
Operating expenses increased 15% to $3.7 billion. This increase was primarily due to a 19% increase in compensation and benefits primarily driven by increased commissions paid to financial advisors related to increased financial advisor productivity as well as increases inproductivity. Higher variable compensation due to the increase in the Partnership’s profitability.profitability also contributed to the increase.
The 18%
39
PART II
Item 7. Management’s Discussion and Analysis of Financial Condition and Results of Operations, continued
Overall, the 14% increase in net revenues coupled with a 15%revenue, partially offset by the 13% increase in operating expenses, resulted ingenerated income from continuing operationsbefore allocations to partners of $392.8$674 million, in 2010, which is 46% higher than $268.6 million in 2009.a 21% increase over 2012.
RESULTS OF OPERATIONS FOR THE YEARS ENDED DECEMBER 31, 2011, 20102014, 2013 AND 20092012
The discussion below details the significant fluctuations and their drivers for each of the major categories of the Partnership’s Consolidated Statements of IncomeIncome.
Fee Revenue
Fee revenue, which consists of asset-based fees and account and activity fees, increased 20% in 2014 to $3,706 million and 18% in 2013 to $3,091 million. The increase in fee revenue for both 2014 and 2013 was primarily due to higher asset values and continued investment in advisory programs. A discussion of fee revenue components follows.
Asset-based
| Years Ended December 31, | % Change | |||||||||||||||||||
| 2014 | 2013 | 2012 | 2014 vs. 2013 | 2013 vs. 2012 | ||||||||||||||||
Asset-based fee revenue: | ||||||||||||||||||||
Advisory programs fees | $ | 1,732 | $ | 1,368 | $ | 1,052 | 27% | 30% | ||||||||||||
Service fees | 1,129 | 959 | 809 | 18% | 19% | |||||||||||||||
Revenue sharing | 184 | 155 | 139 | 19% | 12% | |||||||||||||||
Trust fees | 39 | 34 | 28 | 15% | 20% | |||||||||||||||
Cash solutions | 5 | 7 | 14 | -29% | -46% | |||||||||||||||
|
|
|
|
|
|
|
|
|
| |||||||||||
Total asset-based fee revenue | $ | 3,089 | $ | 2,523 | $ | 2,042 | 22% | 24% | ||||||||||||
|
|
|
|
|
|
|
|
|
| |||||||||||
Related metrics ($ billions): | ||||||||||||||||||||
Average U.S. client asset values(1): | ||||||||||||||||||||
Mutual fund assets held outside of advisory programs(2) | $ | 363.7 | $ | 312.9 | $ | 263.2 | 16% | 19% | ||||||||||||
Advisory programs | 126.8 | 100.6 | 78.8 | 26% | 28% | |||||||||||||||
Insurance | 70.4 | 62.6 | 54.6 | 12% | 15% | |||||||||||||||
Cash solutions | 20.0 | 19.9 | 18.4 | 1% | 8% | |||||||||||||||
|
|
|
|
|
|
|
|
|
| |||||||||||
Total client asset values | $ | 580.9 | $ | 496.0 | $ | 415.0 | 17% | 20% | ||||||||||||
|
|
|
|
|
|
|
|
|
| |||||||||||
(1) Assets on which the partnership earns asset-based fee revenue. The U.S. portion of consolidated asset-based fee revenue was 98%, 98% and 97% for 2014, 2013 and 2012, respectively.
(2) The amounts previously reported for 2013 and 2012 of $396.6 billion and $329.3 billion, respectively, have been corrected to exclude $83.7 billion and $66.1 billion, respectively, in mutual fund assets held in advisory programs which had been previously included. The amounts previously reported for the year endedsame periods for total client asset values were also corrected by the same amounts.
2014 vs. 2013 – Asset-based fee revenue increased 22% in 2014 to $3,089 million primarily due to greater advisory programs fees and service fees. Advisory programs fee revenue growth was primarily due to increased investment of client dollars into advisory programs and increases in the market value of the underlying assets. Investment of client dollars includes new client assets and assets converted from existing clients, previously held with the Partnership. Service
40
PART II
Item 7. Management’s Discussion and Analysis of Financial Condition and Results of Operations, continued
fees and revenue sharing increased in 2014 due to increases in the market value of the underlying assets as well as continued investment of client dollars into mutual fund products, which includes new client assets. The Partnership anticipates advisory programs fee revenue related to OLV to continue to increase as a result of expansion of the Bridge Builder Trust. This revenue will be offset by the expense paid to sub-advisers, resulting in no impact on net income. In December 31, 20112014, the Trust filed a prospectus with the SEC to register four additional sub-advised mutual funds. The Trust may introduce additional funds in the future.
2013 vs. 2012 – Asset-based fee revenue increased 24% in 2013 to $2,523 million primarily due to higher advisory programs fees and service fees. Advisory programs fee revenue growth was primarily due to increased investment of client dollars into advisory programs, which includes new client assets and increases in the market value of the underlying assets. Service fees increased in 2013 primarily due to increases in the market value of the underlying assets as comparedwell as continued investment of client dollars into mutual fund products, which includes new client assets. A majority of client assets held in advisory programs were converted from other client investments previously held with the Partnership.
Account and Activity
| Years Ended December 31, | % Change | |||||||||||||||||||
| 2014 | 2013 | 2012 | 2014 vs. 2013 | 2013 vs. 2012 | ||||||||||||||||
Account and activity fee revenue: | ||||||||||||||||||||
Shareholder accounting services fees | $ | 385 | $ | 350 | $ | 322 | 10% | 9% | ||||||||||||
Retirement account fees | 126 | 126 | 142 | 0% | -11% | |||||||||||||||
Other account and activity fees | 106 | 92 | 110 | 15% | -17% | |||||||||||||||
|
|
|
|
|
|
|
|
|
| |||||||||||
Total account and activity fee revenue | $ | 617 | $ | 568 | $ | 574 | 9% | -1% | ||||||||||||
|
|
|
|
|
|
|
|
|
| |||||||||||
Related metrics: | ||||||||||||||||||||
Average client: | ||||||||||||||||||||
Shareholder accounting holdings serviced | 21.9 | 19.8 | 18.4 | 11% | 8% | |||||||||||||||
Retirement accounts | 4.6 | 4.2 | 3.9 | 10% | 8% | |||||||||||||||
2014 vs. 2013 – Account and activity fee revenue increased 9% in 2014 to $617 million primarily led by growth in shareholder accounting services fees due to the year ended December 31, 2010increase in the average number of client mutual fund holdings serviced. The increase in other account and activity fees was due to revenue earned related to services provided for insurance contracts. Retirement account fees were flat, even though the year ended December 31, 2010number of retirement accounts increased, as comparedmore accounts reached the asset level at which fees are waived.
2013 vs. 2012 – Account and activity fee revenue decreased 1% in 2013 to $568 million primarily due to decreases in retirement account fees and other account and activity fees. Retirement account fees decreased as more client accounts reached the year ended December 31, 2009.asset level at which fees are waived. Effective January 1, 2013, the Partnership reduced the asset level on which retirement account fees and certain other account activity fees are waived. These decreases were partially offset by higher shareholder accounting services fees primarily related to an increase in the number of average client mutual fund holdings serviced.
41
PART II
Item 7. Management’s Discussion and Analysis of Financial Condition and Results of Operations, continued
Trade Revenue
Trade revenue, which consists of commissions, principal transactions and investment banking revenue, increased 1% to $2.1 billion$2,460 million during 20112014 and 8%9% to $2.1 billion$2,439 million during 20102013. The increase in trade revenue for both 2014 and 2013 was primarily due to increasesthe impact of increased client dollars invested, partially offset by a decrease in the margin earned. A discussion of trade revenue components follows.
| Years Ended December 31, | % Change | |||||||||||||||||||
| 2014 | 2013 | 2012 | 2014 vs. 2013 | 2013 vs. 2012 | ||||||||||||||||
Trade revenue: | ||||||||||||||||||||
Commissions revenue: | ||||||||||||||||||||
Mutual funds | $ | 1,139 | $ | 1,167 | $ | 1,051 | -2% | 11% | ||||||||||||
Equities | 636 | 594 | 539 | 7% | 10% | |||||||||||||||
Insurance | 393 | 373 | 389 | 5% | -4% | |||||||||||||||
|
|
|
|
|
|
|
|
|
| |||||||||||
Total commissions revenue | 2,168 | 2,134 | 1,979 | 2% | 8% | |||||||||||||||
Principal transactions | 136 | 183 | 156 | -26% | 17% | |||||||||||||||
Investment banking | 156 | 122 | 112 | 28% | 10% | |||||||||||||||
|
|
|
|
|
|
|
|
|
| |||||||||||
Total trade revenue | $ | 2,460 | $ | 2,439 | $ | 2,247 | 1% | 9% | ||||||||||||
|
|
|
|
|
|
|
|
|
| |||||||||||
Related commissions revenue metrics: | ||||||||||||||||||||
Client dollars invested ($ billions) | $ | 91.9 | $ | 87.3 | $ | 79.4 | 5% | 10% | ||||||||||||
Margin per $1,000 invested | $ | 23.6 | $ | 24.4 | $ | 24.9 | -3% | -2% | ||||||||||||
U.S. business days | 252 | 252 | 250 | 0% | 1% | |||||||||||||||
Commissions
2014 vs. 2013 – Commissions revenue increased 2% in 2014 to $2,168 million primarily due to a 5% increase in client dollars invested andin commission generating transactions, most notably in equities, due to the continued strong equity market. This increase was partially offset by a 3% decrease in the margin earned on eachper $1,000 invested. Total client dollars invested increased 1% in both 2011 and 2010 due to an improved levela lower proportion of confidence in the equity markets. The increases in the Partnership’s margin earned on each $1,000 invested were primarily due to client investments continuing to shift torevenue from mutual funds which have a higher margin than equities. In addition, the average trade size of mutual fund products fromincreased, resulting in lower commission rates and thus a decrease in margin fixed income products. A discussion specific to each component of trade revenue follows.earned.
Commissions
| Years Ended December 31, | % Change | |||||||||||||||||||
| 2011 | 2010 | 2009 | 2011 vs. 2010 | 2010 vs. 2009 | ||||||||||||||||
Commissions revenue ($ millions): | ||||||||||||||||||||
Mutual funds | $ | 866.0 | $ | 856.0 | $ | 766.2 | 1 | % | 12 | % | ||||||||||
Equities | 447.5 | 393.0 | 322.7 | 14 | % | 22 | % | |||||||||||||
Insurance | 385.2 | 326.7 | 271.6 | 18 | % | 20 | % | |||||||||||||
Corporate Bonds | — | 0.1 | 0.4 | -100 | % | -75 | % | |||||||||||||
|
|
|
|
|
|
|
|
|
| |||||||||||
Total commissions revenue | $ | 1,698.7 | $ | 1,575.8 | $ | 1,360.9 | 8 | % | 16 | % | ||||||||||
|
|
|
|
|
|
|
|
|
| |||||||||||
Related metrics: | ||||||||||||||||||||
Client dollars invested ($ billions) | $ | 65.3 | $ | 61.0 | $ | 53.2 | 7 | % | 15 | % | ||||||||||
Margin per $1,000 invested | $ | 26.00 | $ | 25.90 | $ | 25.60 | 0 | % | 1 | % | ||||||||||
U.S. business days | 252 | 252 | 252 | 0 | % | 0 | % | |||||||||||||
PART II
|
|
2013 vs. 2012 – Commissions revenue increased 8% in 20112013 to $1.7 billion and 16% in 2010 to $1.6 billion$2,134 million primarily due to increases in commission generating transactions in equities and insurance in both years. 2010 also benefited from ana 10% increase in mutual funds revenue. These increases were primarily the result of higher trading volumes causing increases in client dollars invested and margins earned per $1,000 invested in commission generating transactions resulting from continued improvement in both 2011market conditions and 2010. Higher trading volumes are typically experienced in times of increased volatilityclients continuing to reinvest their dollars from fixed income products into mutual fund and equity products. This increase was partially offset by a 2% decrease in the markets, such as 2011,margin earned per $1,000 invested, reflecting a change in product mix due to proportionally less insurance revenue which was caused byearns a higher margin. In addition, the debt ceiling crisis,average trade size of mutual fund products increased, resulting in lower commission rates and thus a downgradedecrease in margin earned.
42
PART II
Item 7. Management’s Discussion and Analysis of the U.S. credit ratingFinancial Condition and concerns over European debt. In 2010, the higher trading volume was a resultResults of the rebound in asset values that began in mid-2009 andOperations, continued throughout 2010, improving year-over-year results.
Principal Transactions
| Years Ended December 31, | % Change | |||||||||||||||||||
| 2011 | 2010 | 2009 | 2011 vs. 2010 | 2010 vs. 2009 | ||||||||||||||||
Principal transactions revenue ($ millions): | ||||||||||||||||||||
Municipal bonds | $ | 212.6 | $ | 239.5 | $ | 262.0 | -11 | % | -9 | % | ||||||||||
Corporate bonds | 35.2 | 43.5 | 67.2 | -19 | % | -35 | % | |||||||||||||
Certificates of deposit | 13.5 | 14.8 | 31.5 | -9 | % | -53 | % | |||||||||||||
Unit investment trusts | 11.0 | 7.4 | 6.1 | 49 | % | 21 | % | |||||||||||||
Government bonds | 5.9 | 8.9 | 20.2 | -34 | % | -56 | % | |||||||||||||
Collateralized mortgage obligations | 3.5 | 6.3 | 9.9 | -44 | % | -36 | % | |||||||||||||
Net inventory gains | 2.5 | 0.4 | 1.2 | 525 | % | -67 | % | |||||||||||||
|
|
|
|
|
|
|
|
|
| |||||||||||
Total principal transactions revenue | $ | 284.2 | $ | 320.8 | $ | 398.1 | -11 | % | -19 | % | ||||||||||
|
|
|
|
|
|
|
|
|
| |||||||||||
Related metrics: | ||||||||||||||||||||
Client dollars invested ($ billions) | $ | 18.0 | $ | 20.2 | $ | 28.0 | -11 | % | -28 | % | ||||||||||
Margin per $1,000 invested | $ | 15.70 | $ | 15.80 | $ | 14.20 | -1 | % | 11 | % | ||||||||||
U.S. business days | 252 | 252 | 252 | 0 | % | 0 | % | |||||||||||||
2014 vs. 2013 – Principal transactions revenue decreased 11%26% in 20112014 to $284.2 million and 19%$136 million. Overall, principal transactions revenue was negatively impacted by a 20% decrease in 2010 to $320.8 millionthe margin earned per $1,000 invested as client investment purchases shifted towards products with shorter maturities which is primarily reflected in decreases in revenue from municipal bonds and corporate bonds in both years as well as ahave lower margins. The decrease in revenue from certificates of depositwas also due to a 9% decline in 2010. These decreases were primarily attributable to lower client dollars invested resulting from a weak fixed income market. This decline was partially offset by a $1 million net inventory gain in products that resulted2014, while there was a $5 million net inventory loss in 2013.
2013 vs. 2012 – Principal transactions revenue increased 17% in 2013 to $183 million. Overall, principal transactions revenue was positively impacted by relatively higher interest rates during the last half of 2013, which increased demand and led to an increase in 2011 and 2010. However, in 2010, these decreases were partially offset byclient dollars invested. In addition, there was an increase in margin earned on principal transactionsper $1,000 invested.
Investment Banking
2014 vs. 2013 – Investment banking revenue for each $1,000 invested.increased 28% in 2014 to $156 million. The decreasesgrowth in investment banking revenue reflects a 32% increase in client dollars invested, were the result of global credit concerns and low interest rate environments in 2011 and 2010. The increase in margin per $1,000 invested in 2010 was primarily due to a shiftimproved market conditions which have led to increased investment in product mix away from certificates of deposit. In 2009, clients were investing more in shorter term fixed-income products such as certificates of deposit when the equity markets were more volatile, and then moved away from these products in 2010 as the equity markets began to recover.unit investment trusts.
PART II
|
|
Investment Banking
| Years Ended December 31, | % Change | |||||||||||||||||||
| 2011 | 2010 | 2009 | 2011 vs. 2010 | 2010 vs. 2009 | ||||||||||||||||
Investment banking revenue ($ millions): | ||||||||||||||||||||
Distribution | $ | 125.9 | $ | 166.5 | $ | 127.1 | -24 | % | 31 | % | ||||||||||
Underwriting | 27.2 | 42.1 | 56.7 | -35 | % | -26 | % | |||||||||||||
|
|
|
|
|
|
|
|
|
| |||||||||||
Total investment banking revenue | $ | 153.1 | $ | 208.6 | $ | 183.8 | -27 | % | 13 | % | ||||||||||
|
|
|
|
|
|
|
|
|
| |||||||||||
Related metrics: | ||||||||||||||||||||
Client dollars invested ($ billions) | $ | 5.1 | $ | 6.6 | $ | 5.9 | -23 | % | 12 | % | ||||||||||
Margin per $1,000 invested | $ | 29.90 | $ | 31.60 | $ | 31.30 | -5 | % | 1 | % | ||||||||||
U.S. business days | 252 | 252 | 252 | 0 | % | 0 | % | |||||||||||||
2013 vs. 2012 – Investment banking revenue decreased 27%increased 10% in 20112013 to $153.1 million and increased 13% in 2010 to $208.6$122 million. The decrease in 2011 was primarily due to decreased revenue from both the distribution and underwriting of securities, obligations and unit investment trusts primarily caused by a 23% decrease in client dollars invested in investment banking activities. Client dollars invested in investment banking activities were lower in 2011 due to a decreased supply of taxable municipal bonds and lower interest rates, which caused a shift in client interest primarily away from municipal bonds and unit investment trusts towards equity securities. In 2010, the increase in investment banking revenue was primarily due to an increase in client dollars invested resulting from improved market conditions. This increase was partially offset by an 11% decrease in the margin earned per $1,000 invested. Client investments shifted away from higher-margin municipal and corporate unit investment trusts towards lower-margin equity unit investment trusts.
43
PART II
Item 7. Management’s Discussion and Analysis of Financial Condition and Results of Operations, continued
Net Interest and Dividends
| Years Ended December 31, | % Change | |||||||||||||||||||
| 2014 | 2013 | 2012 | 2014 vs. 2013 | 2013 vs. 2012 | ||||||||||||||||
Net interest and dividends revenue: | ||||||||||||||||||||
Client loan interest | $ | 110 | $ | 108 | $ | 113 | 2% | -4% | ||||||||||||
Short-term investing interest | 15 | 14 | 11 | 7% | 26% | |||||||||||||||
Other interest and dividends | 10 | 12 | 9 | -17% | 25% | |||||||||||||||
Limited partnership interest expense | (48) | (48) | (49) | 0% | -2% | |||||||||||||||
Other interest expense | (7) | (11) | (13) | -36% | -21% | |||||||||||||||
|
|
|
|
|
|
|
|
|
| |||||||||||
Total net interest and dividends revenue | $ | 80 | $ | 75 | $ | 71 | 7% | 5% | ||||||||||||
|
|
|
|
|
|
|
|
|
| |||||||||||
Related metrics: | ||||||||||||||||||||
Average aggregate client loan balance | $ | 2,336.5 | $ | 2,109.4 | $ | 2,187.9 | 11% | -4% | ||||||||||||
Average rate earned | 4.69% | 5.12% | 5.15% | -8% | -1% | |||||||||||||||
Average funds invested | $ | 9,316.8 | $ | 8,764.6 | $ | 6,560.0 | 6% | 34% | ||||||||||||
Average rate earned | 0.16% | 0.16% | 0.17% | 0% | -6% | |||||||||||||||
Weighted average $1,000 equivalent limited partnership units outstanding | 636,481 | 644,856 | 655,663 | -1% | -2% | |||||||||||||||
2014 vs. 2013 – Net interest and dividends revenue from distribution activities,increased 7% in 2014 to $80 million. Results reflect a 2% increase in client loan interest primarily due to an increase in the average aggregate client loan balance, partially offset by a decrease in revenue from underwriting activities. The 2010 increase in revenue from distribution activities was primarily caused by a 12% increase in client dollars invested in investment banking activities resulting from increased demand for traditional tax free trusts and taxable municipal bonds, as well as the introduction of a new product partner for unit investment trusts. The 2010 decrease in revenue from underwriting activities resulted from a lower volume of taxable debt underwritings.
PART II
|
|
Fee Revenue
Fee revenue increased 21% in 2011 to $2.3 billion and 30% in 2010 to $1.9 billion. A discussion specific to each component of fee revenue follows.
Asset-based
| Years Ended December 31, | % Change | |||||||||||||||||||
| 2011 | 2010 | 2009 | 2011 vs. 2010 | 2010 vs. 2009 | ||||||||||||||||
Asset-based fee revenue ($ millions): | ||||||||||||||||||||
Advisory programs fees | $ | 849.6 | $ | 543.9 | $ | 192.8 | 56 | % | 182 | % | ||||||||||
Service fees | 765.0 | 693.9 | 579.7 | 10 | % | 20 | % | |||||||||||||
Revenue sharing | 129.0 | 119.0 | 110.8 | 8 | % | 7 | % | |||||||||||||
Trust fees | 23.9 | 19.6 | 14.2 | 22 | % | 38 | % | |||||||||||||
Cash solutions | 9.4 | 20.9 | 69.9 | -55 | % | -70 | % | |||||||||||||
|
|
|
|
|
|
|
|
|
| |||||||||||
Total asset-based fee revenue | $ | 1,776.9 | $ | 1,397.3 | $ | 967.4 | 27 | % | 44 | % | ||||||||||
|
|
|
|
|
|
|
|
|
| |||||||||||
Related metrics ($ billions): | ||||||||||||||||||||
Average U.S. client asset values(1): | ||||||||||||||||||||
Mutual fund assets held outside of advisory programs | $ | 305.3 | $ | 274.0 | $ | 216.6 | 11 | % | 27 | % | ||||||||||
Advisory programs | 63.6 | 40.8 | 15.0 | 56 | % | 172 | % | |||||||||||||
Insurance | 50.4 | 44.8 | 36.4 | 13 | % | 23 | % | |||||||||||||
Cash solutions | 17.8 | 18.8 | 21.4 | -5 | % | -12 | % | |||||||||||||
|
|
|
|
|
|
|
|
|
| |||||||||||
Total client asset values | $ | 437.1 | $ | 378.4 | $ | 289.4 | 16 | % | 31 | % | ||||||||||
|
|
|
|
|
|
|
|
|
| |||||||||||
|
|
Asset-based fee revenue increased 27% in 2011 to $1.8 billion and 44% in 2010 to $1.4 billion primarilyaverage rate earned due to increases in advisory programs fees and service fees. Advisory programs fee revenue, which includes Advisory Solutions, Managed Account Program and Portfolio Program fee revenue, increased 56% in 2011 and 182% in 2010 primarily due to continued investment of client dollars into the advisory programs and market appreciation of asset values. A majority of client assets held in the advisory programsnew relationship-based pricing. Results were converted from other client investments previously held with the Partnership. Service fee revenue increased in both 2011 and 2010 primarily due to increases in the market value of the underlying assets and client activity.
PART II
|
|
Account and Activity
| Years Ended December 31, | % Change | |||||||||||||||||||
| 2011 | 2010 | 2009 | 2011 vs. 2010 | 2010 vs. 2009 | ||||||||||||||||
Account and activity fee revenue ($ millions): | ||||||||||||||||||||
Sub-transfer agent services | $ | 289.1 | $ | 273.7 | $ | 269.5 | 6 | % | 2 | % | ||||||||||
Retirement account fees | 136.9 | 132.7 | 128.6 | 3 | % | 3 | % | |||||||||||||
Other account and activity fees | 96.9 | 96.9 | 91.5 | 0 | % | 6 | % | |||||||||||||
|
|
|
|
|
|
|
|
|
| |||||||||||
Total account and activity fee revenue | $ | 522.9 | $ | 503.3 | $ | 489.6 | 4 | % | 3 | % | ||||||||||
|
|
|
|
|
|
|
|
|
| |||||||||||
Related metrics (millions): | ||||||||||||||||||||
Average client accounts: | ||||||||||||||||||||
Sub-transfer agent services(1) | 17.1 | 15.8 | 15.4 | 8 | % | 3 | % | |||||||||||||
Retirement accounts | 3.5 | 3.4 | 3.2 | 3 | % | 6 | % | |||||||||||||
|
|
Account and activity fee revenue increased 4% in 2011 to $522.9 million and 3% in 2010 to $503.3 million primarily due to increases in revenue from sub-transfer agent services and retirement account services primarily caused by year-over-year increases in the respective number of average holdings serviced and accounts, respectively. In addition, the 2010 increase was also caused by net increases in various other types of fees including mortgage revenue, proxy revenue, dividend reinvestment fees, transaction fees and other fees.
Net Interest and Dividends
| Years Ended December 31, | % Change | |||||||||||||||||||
| 2011 | 2010 | 2009 | 2011 vs. 2010 | 2010 vs. 2009 | ||||||||||||||||
Net interest and dividends revenue ($ millions): | ||||||||||||||||||||
Client loan interest | $ | 115.2 | $ | 112.7 | $ | 100.0 | 2 | % | 13 | % | ||||||||||
Short-term investing interest | 7.4 | 9.9 | 6.7 | -25 | % | 48 | % | |||||||||||||
Other interest and dividends | 7.5 | 4.2 | 5.9 | 79 | % | -29 | % | |||||||||||||
Interest expense | (67.6 | ) | (56.3 | ) | (57.6 | ) | 20 | % | -2 | % | ||||||||||
|
|
|
|
|
|
|
|
|
| |||||||||||
Total net interest and dividends revenue | $ | 62.5 | $ | 70.5 | $ | 55.0 | -11 | % | 28 | % | ||||||||||
|
|
|
|
|
|
|
|
|
| |||||||||||
Related metrics ($ millions): | ||||||||||||||||||||
Average aggregate client loan balance | $ | 2,213.9 | $ | 2,144.3 | $ | 1,921.9 | 3 | % | 12 | % | ||||||||||
Average rate earned | 5.20 | % | 5.26 | % | 5.20 | % | -1 | % | 1 | % | ||||||||||
Average funds invested | $ | 4,815.0 | $ | 4,046.8 | $ | 3,150.2 | 19 | % | 28 | % | ||||||||||
Average rate earned | 0.15 | % | 0.24 | % | 0.21 | % | -38 | % | 14 | % | ||||||||||
Weighted average $1,000 equivalent limited partnership units outstanding | 668,450 | 455,949 | 471,597 | 47 | % | -3 | % | |||||||||||||
Net interest and dividends revenue decreased 11% in 2011 to $62.5 million primarily due to an increase in interest expense partially offset by an increase in other interest and dividends. In 2010, net interest and dividends revenue increased 28% to $70.5 million primarily due to increases in client loan and short-term investing interest.
PART II
|
|
Interest expense increased in 2011 primarily due to an increase ($15.9 million) in the minimum 7.5% annual return on the additional limited partnership interests resulting from the limited partnership offering completed in January 2011. This increase was partially offsetpositively impacted by a decrease in debtother interest expense in 2011 of $4.9 million (25%),primarily due to lower average debt balances outstanding caused by debt repayments during the current year.period as a result of debt repayments.
2013 vs. 2012 – Net interest and dividends revenue increased 5% in 2013 to $75 million. Interest income from client loans increased 2% and 13% in 2011 and 2010, respectively, primarily due to increases in average aggregate client loans. Collateral held in client accounts with loan balances decreased 2% to $9.8 billion in 2011 and increased 5% to $9.9 billion in 2010. Collateral held in client accounts can fluctuate due to market conditions or the withdrawal of securities, provided the client remains in compliance with applicable New York Stock Exchange rules (loan no greater than 75% of the value of the securities in the account) and maintenance requirements imposed by the Partnership (generally, loan no greater than 65% of the value of the securities in the account). Losses incurred on client loan balances were less than $100,000 during 2011, 2010 and 2009.
Interest income from short-term, primarily overnight investments, of cash and cash equivalents, cash and investments segregated under federal regulations and securities purchased under agreements to resell decreased 25%increased 26% in 2011 primarily due to a decrease in rates earned on these types of investments and increased 48% in 20102013 primarily due to an increase in the average funds investedinvested. Interest expense decreased in 2013 primarily due to lower average debt balances during the current period related to debt repayments in 2012 and rates earned2013. Other interest and dividends revenue increased 25% primarily due to an increase in interest income recognized on these typesgeneral partner partnership loans. These favorable increases were partially offset by a 4% decrease in interest income from client loans, a reflection of investments. The relateda lower average funds invested increased 19%aggregate client loan balance and 28% in 2011 and 2010, respectively. These funds included $3.9 billion, $3.0 billion and $2.3 billion of funds that were segregated in special reserve bank accounts for the benefit of U.S. clients under SEC Rule 15c3-3 as of December 31, 2011, 2010 and 2009, respectively. Thea lower average rate earned on total funds invested decreased 38% to 0.15% in 2011 and increased 14% to 0.24% in 2010. The average rate earned on the segregated funds invested decreased 44% to 0.14% during 2011 and increased 7% to 0.25% during 2010. See the Liquidity and Capital Resources discussion below for additional information.earned.
Other Revenue
Other revenue decreased 62%38% to $11.6$32 million in 20112014 and 14%increased 68% to $30.5$52 million in 2010.2013. The decreasesfluctuation in both years areis primarily attributable to decreaseschanges in the value of the investments held related to the Partnership’s non-qualifiednonqualified deferred compensation plan. In addition,The increase in investment value in 2014 was less than in 2013 due to a relatively smaller increase in market performance during 2014 compared to 2013. The Partnership has chosen to hedge the Partnership received $3.7 millionfuture liability for the plan by purchasing investments in transitional services revenue during 2010 causing a decreasean amount similar to the future expected liability. As the market value of these investments fluctuates, the gains or losses are recorded in other revenue with an offset in 2011compensation and an increasefringe benefits expense, resulting in 2010. This transitional services revenue resulted from the Transitional Services Agreement relatedminimal net impact to the sale of the Partnership’s U.K. subsidiary, further described in Note 2income before allocations to the Consolidated Financial Statements.partners.
44
PART II
| Item 7. Management’s Discussion and Analysis of Financial Condition and Results of Operations, continued |
Operating Expenses
| Years Ended December 31, | % Change | Years Ended December 31, | % Change | |||||||||||||||||||||||||||||||||||||
| 2011 | 2010 | 2009 | 2011 vs. 2010 | 2010 vs. 2009 | 2014 | 2013 | 2012 | 2014 vs. 2013 | 2013 vs. 2012 | |||||||||||||||||||||||||||||||
Operating expenses ($ millions): | ||||||||||||||||||||||||||||||||||||||||
Compensation and benefits | $ | 2,940.1 | $ | 2,643.7 | $ | 2,215.8 | 11 | % | 19 | % | ||||||||||||||||||||||||||||||
Operating expenses: | ||||||||||||||||||||||||||||||||||||||||
Compensation and benefits: | ||||||||||||||||||||||||||||||||||||||||
Financial advisor | $ | 2,182 | $ | 2,004 | $ | 1,739 | 9% | 15% | ||||||||||||||||||||||||||||||||
Home office and branch | 1,014 | 947 | 917 | 7% | 3% | |||||||||||||||||||||||||||||||||||
Variable compensation | 801 | 643 | 497 | 25% | 29% | |||||||||||||||||||||||||||||||||||
Financial advisor salary and subsidy | 256 | 199 | 132 | 29% | 51% | |||||||||||||||||||||||||||||||||||
|
|
|
|
| ||||||||||||||||||||||||||||||||||||
Total compensation and benefits | 4,253 | 3,793 | 3,285 | 12% | 15% | |||||||||||||||||||||||||||||||||||
Occupancy and equipment | 356.6 | 343.3 | 319.0 | 4 | % | 8 | % | 367 | 356 | 353 | 3% | 1% | ||||||||||||||||||||||||||||
Communications and data processing | 289.4 | 290.1 | 285.9 | 0 | % | 1 | % | 289 | 292 | 279 | -1% | 4% | ||||||||||||||||||||||||||||
Payroll and other taxes | 171.1 | 159.9 | 140.7 | 7 | % | 14 | % | 229 | 207 | 186 | 11% | 11% | ||||||||||||||||||||||||||||
Advertising | 54.2 | 55.7 | 48.4 | -3 | % | 15 | % | 70 | 58 | 56 | 21% | 3% | ||||||||||||||||||||||||||||
Professional and consulting fees | 59 | 48 | 37 | 23% | 30% | |||||||||||||||||||||||||||||||||||
Postage and shipping | 48.5 | 49.8 | 50.4 | -3 | % | -1 | % | 51 | 51 | 48 | 0% | 7% | ||||||||||||||||||||||||||||
Clearance fees | 12.6 | 11.6 | 13.1 | 9 | % | -11 | % | |||||||||||||||||||||||||||||||||
Other operating expenses | 155.6 | 159.9 | 148.5 | -3 | % | 8 | % | 190 | 178 | 166 | 7% | 7% | ||||||||||||||||||||||||||||
|
|
|
|
|
|
|
|
|
| |||||||||||||||||||||||||||||||
Total operating expenses | $ | 4,028.1 | $ | 3,714.0 | $ | 3,221.8 | 8 | % | 15 | % | $ | 5,508 | $ | 4,983 | $ | 4,410 | 11% | 13% | ||||||||||||||||||||||
|
|
|
|
|
|
|
|
|
| |||||||||||||||||||||||||||||||
Related metrics: | ||||||||||||||||||||||||||||||||||||||||
Related metrics (actual): | ||||||||||||||||||||||||||||||||||||||||
Number of branches | ||||||||||||||||||||||||||||||||||||||||
At period end | 11,408 | 11,375 | 11,182 | 0 | % | 2 | % | 12,016 | 11,647 | 11,415 | 3% | 2% | ||||||||||||||||||||||||||||
Average | 11,394 | 11,306 | 11,126 | 1 | % | 2 | % | 11,810 | 11,510 | 11,396 | 3% | 1% | ||||||||||||||||||||||||||||
Financial advisors: | ||||||||||||||||||||||||||||||||||||||||
At period end | 12,242 | 12,616 | 12,615 | -3 | % | 0 | % | 14,000 | 13,158 | 12,463 | 6% | 6% | ||||||||||||||||||||||||||||
Average | 12,359 | 12,694 | 12,164 | -3 | % | 4 | % | 13,557 | 12,784 | 12,273 | 6% | 4% | ||||||||||||||||||||||||||||
Branch employees(1): | ||||||||||||||||||||||||||||||||||||||||
Branch office administrators(1)(3): | ||||||||||||||||||||||||||||||||||||||||
At period end | 12,889 | 13,002 | 12,310 | -1 | % | 6 | % | 14,008 | 13,444 | 13,244 | 4% | 2% | ||||||||||||||||||||||||||||
Average | 13,130 | 12,665 | 12,062 | 4 | % | 5 | % | 13,714 | 13,309 | 13,093 | 3% | 2% | ||||||||||||||||||||||||||||
Home office employees(1): | ||||||||||||||||||||||||||||||||||||||||
Home office associates(1)(3): | ||||||||||||||||||||||||||||||||||||||||
At period end | 4,933 | 4,898 | 4,834 | 1 | % | 1 | % | 5,621 | 5,435 | 5,409 | 3% | 0% | ||||||||||||||||||||||||||||
Average | 4,919 | 4,866 | 4,817 | 1 | % | 1 | % | 5,573 | 5,425 | 5,307 | 3% | 2% | ||||||||||||||||||||||||||||
Home office employees(1)per 100 financial advisors (average) | 39.8 | 38.3 | 39.6 | 4 | % | -3 | % | |||||||||||||||||||||||||||||||||
Branch employees(1)per 100 financial advisors (average) | 106.2 | 99.8 | 99.2 | 6 | % | 1 | % | |||||||||||||||||||||||||||||||||
Home office associates(1) per 100 financial advisors (average) | 41.1 | 42.4 | 43.2 | -3% | -2% | |||||||||||||||||||||||||||||||||||
Branch office administrators(1) per 100 financial advisors (average) | 101.2 | 104.1 | 106.7 | -3% | -2% | |||||||||||||||||||||||||||||||||||
Average operating expenses per financial advisor(2) | $ | 166,096 | $ | 159,000 | $ | 159,849 | 4 | % | -1 | % | $ | 186,251 | $ | 182,697 | $ | 177,177 | 2% | 3% | ||||||||||||||||||||||
(1) Counted on a full-time equivalent (“FTE”) basis.
(2) Operating expenses used in calculation represent total operating expenses less financial advisor and variable compensation.
(3) The methodology used to calculate FTEs was revised at the beginning of 2014. Prior period metrics were updated to conform to the new methodology.
45 PART II Item 7. Management’s Discussion and Analysis of Financial Condition and Results of Operations, continued 2014 vs. 2013 |
|
|
|
Operating expenses increased 8%11% in 20112014 to $4.0 billion$5,508 million primarily due to a 12% increase in compensation and 15%benefits (described below). The remaining operating expenses increased 5% ($65 million) primarily due to a $22 million increase in 2010 to $3.7 billionpayroll and other taxes as a result of increased compensation, a $12 million increase in advertising expense and a $12 million increase in other operating expenses.
Financial advisor compensation increased 9% ($178 million) in 2014 primarily due to increases in compensation and benefits and related payroll taxes.
Total compensation and benefits costs increased 11% in 2011 and 19% in 2010, primarily due to increases in financial advisor compensation and variable compensation.
Financial advisor compensation (excluding financial advisor salary and subsidy and variable compensation) increased 12% ($176.0 million) and 22% ($251.9 million) in 2011 and 2010, respectively. These increases are primarily due to increases in trade and asset-based fee revenueand trade revenues on which financial advisor commissions are paid. In both 2011Financial advisor salary and 2010,subsidy increased 29% ($57 million) primarily due to growth in the number of financial advisors and compensation initiatives. The Partnership expects financial advisor salary and subsidy decreased 20% ($27.5 million) and 18% ($29.6 million), respectively, dueexpense to fewercontinue to increase as more financial advisor hires participatingadvisors participate in these compensation programs. The Partnership found that potentialinitiatives, which are intended to attract new, and retain quality financial advisors. One initiative expected to result in future expense increases is the offering of retirement transition plans to retiring financial advisors in certain circumstances. Such retirement transition plans offer financial consideration to retiring financial advisors who would haveprovide client transition services.
Home office and branch salary and fringe benefit expense increased 7% ($67 million) in 2014 primarily due to leave successful positions in a different industry or at a different firmhigher wages and more personnel to embrace a new opportunity at Edward Jones were reluctant to change jobs.
PART II
|
|
To help address this issue, effective January 2011, the Partnership raised the base pay to better recruit certain financial advisors. However,Partnership’s financial advisor growth remains a challenge for the Partnership, as thenetwork. The average number of financial advisors has decreased in 2011 compared to 2010.both the Partnership’s home office associates and branch office administrators (“BOA”) increased 3%.
Variable compensation expands and contracts in relation to revenues, income before allocations to partners and the Partnership’s related profit margin. As the Partnership’s financial results and profit margin improve,increase, a significant portion is allocated to variable compensation and paid to employees in the form of increased bonuses and profit sharing and bonuses.sharing. As a result, variable compensation increased 38%25% ($103.7158 million) in 2011 and 154% ($166.4 million) in 2010.
In 2011 and 2010, home office salary and fringe benefit expense increased 2% ($6.7 million) and 1% ($2.4 million), respectively, and branch salary and fringe benefit expense increased 8% ($37.2 million and $33.4 million, respectively) in both years primarily due2014 to wage increases, increases in fringe benefits expense caused by increased healthcare costs, and increases in personnel to support increased productivity of the Partnership’s financial advisor network. In addition, effective April 1, 2010, the Partnership lifted its salary freeze implemented as a result of overall market conditions on April 1, 2009. This resulted in approximately $9.0 million of additional annual expense during 2010 as compared to 2009, related to branch and home office employees. On a full-time equivalent (“FTE”) basis, the average number of the Partnership’s home office employees increased 1% in both 2011 and 2010 and branch employees increased 4% in 2011 and 5% in 2010. As of December 31, 2011, the Partnership had 12,889 branch employees, a decrease of 113 employees from December 31, 2010 due to fewer part time employees.
The remaining operating expenses increased 2% ($17.7 million) in 2011 and 6% ($40.0 million) in 2010 primarily due to increased payroll taxes due to the above noted increases in compensation and an increase in occupancy and equipment costs primarily due to increased rent expense.$801 million.
The Partnership uses the ratios of both the number of home office employees toassociates and the number of financial advisors, the number of branch employeesBOAs per 100 financial advisors and the average operating expenses per financial advisor as key metrics in managing its costs. AverageIn 2014, the average number of both the home office employeesassociates and BOAs per 100 financial advisors increased 4% in 2011 and decreased 3% in 2010. The 2011 increase was primarily the impact of the 3% decrease in the number of financial advisors, as the number of home office employees only increased 1%. This result is despiteThese ratios reflect the Partnership’s longer term cost management strategy to grow its financial advisor network at a faster pace than its home office and branch support staff. Lack of growth in the number of financial advisors in 2012 could result in growing home office compensation costs at a faster rate than financial advisors, which would cause theThe average operating expense per financial advisor to increase. In 2010, the decrease in the average home office employee per 100 financial advisors ratio was the result of the Partnership’s cost management strategy noted above. In 2011 and 2010, average branch employees per 100 financial advisors increased 6% and 1%, respectively. These increases were due to growth in branch employees at a higher rate than the growth in financial advisors. This is the result of increased branch employee hours in support of increased financial advisor productivity. In 2011, average operating expenses per financial advisor increased 4%,2% primarily due to increases in home office employees’ wagesassociates’ salary and fringe benefit expenses and branch operating expenses to support the Partnership’s financial advisor network, partially offset by the impact of spreading those costs over more financial advisors.
2013 vs. 2012
Operating expenses increased 13% in addition2013 to $4,983 million primarily due to a decrease15% increase in compensation and benefits (described below). The remaining operating expenses increased 6% ($65 million) primarily due to a $21 million increase in payroll and other taxes caused by the increases in compensation, a $13 million increase in communications and data processing and a $12 million increase in other operating expenses.
46
PART II
Item 7. Management’s Discussion and Analysis of Financial Condition and Results of Operations, continued
Financial advisor compensation increased 15% ($265 million) in 2013 primarily due to increases in asset-based fee and trade revenues on which financial advisor commissions are paid. Financial advisor salary and subsidy increased 51% ($67 million) primarily due to growth in financial advisors and new compensation initiatives.
Home office and branch salary and fringe benefit expense increased 3% ($30 million) in 2013 primarily due to higher wages and more personnel to support increased productivity of the Partnership’s financial advisor network. The average number of both the Partnership’s home office associates and BOAs increased 2%.
Variable compensation increased 29% ($146 million) in 2013 to $643 million, reflecting strong financial results and profit margin.
In 2013, the average number of both the home office associates and BOAs per 100 financial advisors decreased 2%, reflecting growth in the number of financial advisors.advisors at a faster pace than growth in the number of home office and branch support staff. The 1% decrease in 2010 in average operating expensesexpense per financial advisor wasincreased 3% primarily causeddue to increases in home office associates’ salary and fringe benefit expenses and branch operating expenses to support the Partnership’s financial advisor network, partially offset by the increase in averageimpact of spreading those costs over more financial advisors in 2010.advisors.
PART II
|
|
Segment Information
Operating segments areAn operating segment is defined as componentsa component of an entity that havehas all of the following characteristics: it engages in business activities from which it may earn revenues and incur expenses; the entity’s chief operating decision-maker (or decision-making group) regularly reviews its operating results for resource allocation and to assess performance; and it has discrete financial information is available. Operating segments may be combined in certain circumstances into reportable segments for financial reporting. The Partnership has determined it has two operating and reportable segments based upon geographic location, the U.S. and Canada.
Each segment, in its own geographic location, primarily derives its revenuesrevenue from the retail brokerage business through the distribution of mutual fund shares, fees related to assets held by and account services provided to its clients, the sale of listed and unlisted securities and insurance products, investment banking and principal transactions, as a distributor of mutual fund shares and through revenues related to assets held by and account services provided to its clients.transactions.
The Partnership evaluates thesegment performance of its segments based upon income from continuing operations(loss) before allocations to partners, as well as income before variable compensation which is(“pre-variable income before expenses for bonuses earned by financial advisors, home office and branch employees and profit sharing allocations.(loss)”). Variable compensation is determined at the Partnership level for profit sharing and home office associate and branch employeeBOA bonus amounts, and therefore is allocated to each geographic segment independent of that segment’s individual pre-variable income before variable compensation. The amount of financial(loss). Financial advisor bonuses isare determined in part by the overall Partnership’s profitability, as well as the performance of the individual segments. As such, bothfinancial advisors. Both income from continuing operations(loss) before allocations to partners and pre-variable income before variable compensation(loss) are considered in evaluating each reportable segment’s financialsegment performance.
The Canada segment information, as reported in the following table, is based upon the Consolidated Financial Statements of the Partnership’s CanadianCanada operations without eliminating any intercompany items, such as management fees that it payspaid to affiliated entities. The U.S. segment information is derived from the Partnership’s Consolidated Financial Statements less the Canada segment information as presented. This is consistent with how management reviewsviews the segments in order to assess performance.
47
PART II
| Item 7. Management’s Discussion and Analysis of Financial Condition and Results of Operations, continued |
FinancialThe following table shows financial information aboutfor the Partnership’s reportable segments is presented in the following table. All amounts are presented in millions, except the number of financial advisors and as otherwise noted.segments.
| Years Ended December 31, | % Change | Years Ended December 31, | % Change | |||||||||||||||||||||||||||||||||||||
| 2011 | 2010 | 2009 | 2011 vs. 2010 | 2010 vs. 2009 | 2014 | 2013 | 2012 | 2014 vs. 2013 | 2013 vs. 2012 | |||||||||||||||||||||||||||||||
Net revenue: | ||||||||||||||||||||||||||||||||||||||||
United States of America | $ | 4,324.5 | $ | 3,939.8 | $ | 3,367.0 | 10 | % | 17 | % | ||||||||||||||||||||||||||||||
U.S. | $ | 6,074 | $ | 5,457 | $ | 4,790 | 11% | 14% | ||||||||||||||||||||||||||||||||
Canada | 185.4 | 167.0 | 123.4 | 11 | % | 35 | % | 204 | 200 | 175 | 2% | 14% | ||||||||||||||||||||||||||||
|
|
|
|
|
|
|
|
|
| |||||||||||||||||||||||||||||||
Total net revenue | 4,509.9 | 4,106.8 | 3,490.4 | 10 | % | 18 | % | 6,278 | 5,657 | 4,965 | 11% | 14% | ||||||||||||||||||||||||||||
Operating expenses (excluding variable compensation): | ||||||||||||||||||||||||||||||||||||||||
United States of America | 3,468.6 | 3,261.7 | 2,957.3 | 6 | % | 10 | % | |||||||||||||||||||||||||||||||||
U.S. | 4,515 | 4,147 | 3,734 | 9% | 11% | |||||||||||||||||||||||||||||||||||
Canada | 181.2 | 177.7 | 156.3 | 2 | % | 14 | % | 192 | 193 | 179 | -1% | 8% | ||||||||||||||||||||||||||||
|
|
|
|
|
|
|
|
|
| |||||||||||||||||||||||||||||||
Total operating expenses | 3,649.8 | 3,439.4 | 3,113.6 | 6 | % | 10 | % | 4,707 | 4,340 | 3,913 | 8% | 11% | ||||||||||||||||||||||||||||
Pre-variable income (loss): | ||||||||||||||||||||||||||||||||||||||||
United States of America | 855.9 | 678.1 | 409.7 | 26 | % | 66 | % | |||||||||||||||||||||||||||||||||
U.S. | 1,559 | 1,310 | 1,056 | 19% | 24% | |||||||||||||||||||||||||||||||||||
Canada | 4.2 | (10.7 | ) | (32.9 | ) | 139 | % | 67 | % | 12 | 7 | (4) | 71% | 303% | ||||||||||||||||||||||||||
|
|
|
|
|
|
|
|
|
| |||||||||||||||||||||||||||||||
Total pre-variable income | 860.1 | 667.4 | 376.8 | 29 | % | 77 | % | 1,571 | 1,317 | 1,052 | 19% | 25% | ||||||||||||||||||||||||||||
Variable compensation: | ||||||||||||||||||||||||||||||||||||||||
United States of America | 366.7 | 266.1 | 106.0 | 38 | % | 151 | % | |||||||||||||||||||||||||||||||||
U.S. | 781 | 626 | 485 | 25% | 29% | |||||||||||||||||||||||||||||||||||
Canada | 11.6 | 8.5 | 2.2 | 36 | % | 286 | % | 20 | 17 | 12 | 18% | 45% | ||||||||||||||||||||||||||||
|
|
|
|
|
|
|
|
|
| |||||||||||||||||||||||||||||||
Total variable compensation | 378.3 | 274.6 | 108.2 | 38 | % | 154 | % | 801 | 643 | 497 | 25% | 29% | ||||||||||||||||||||||||||||
Income (loss) before allocation to partners: | ||||||||||||||||||||||||||||||||||||||||
United States of America | 489.2 | 412.0 | 303.7 | 19 | % | 36 | % | |||||||||||||||||||||||||||||||||
Income (loss) before allocations to partners: | ||||||||||||||||||||||||||||||||||||||||
U.S. | 778 | 684 | 571 | 14% | 20% | |||||||||||||||||||||||||||||||||||
Canada | (7.4 | ) | (19.2 | ) | (35.1 | ) | 61 | % | 45 | % | (8) | (10) | (16) | 20% | 35% | |||||||||||||||||||||||||
|
|
|
|
|
|
|
|
|
| |||||||||||||||||||||||||||||||
Total income before allocation to partners | $ | 481.8 | $ | 392.8 | $ | 268.6 | 23 | % | 46 | % | ||||||||||||||||||||||||||||||
Total income before allocations to partners | $ | 770 | $ | 674 | $ | 555 | 14% | 21% | ||||||||||||||||||||||||||||||||
|
|
|
|
| ||||||||||||||||||||||||||||||||||||
|
|
|
|
| ||||||||||||||||||||||||||||||||||||
Client assets under care ($ billions): | ||||||||||||||||||||||||||||||||||||||||
United States of America | ||||||||||||||||||||||||||||||||||||||||
At period end | $ | 576.4 | $ | 557.3 | $ | 502.5 | 3 | % | 11 | % | ||||||||||||||||||||||||||||||
U.S. | ||||||||||||||||||||||||||||||||||||||||
At year end | $ | 846.9 | $ | 768.8 | $ | 651.9 | 10% | 18% | ||||||||||||||||||||||||||||||||
Average | $ | 570.5 | $ | 521.9 | $ | 444.6 | 9 | % | 17 | % | $ | 812.4 | $ | 708.9 | $ | 621.1 | 15% | 14% | ||||||||||||||||||||||
Canada | ||||||||||||||||||||||||||||||||||||||||
At period end | $ | 14.8 | $ | 15.3 | $ | 13.0 | -3 | % | 18 | % | ||||||||||||||||||||||||||||||
At year end | $ | 19.3 | $ | 18.3 | $ | 16.8 | 5% | 9% | ||||||||||||||||||||||||||||||||
Average | $ | 15.6 | $ | 13.9 | $ | 10.8 | 12 | % | 29 | % | $ | 19.2 | $ | 17.5 | $ | 15.9 | 10% | 10% | ||||||||||||||||||||||
Financial advisors: | ||||||||||||||||||||||||||||||||||||||||
United States of America | ||||||||||||||||||||||||||||||||||||||||
At period end | 11,622 | 11,980 | 11,927 | -3 | % | 0 | % | |||||||||||||||||||||||||||||||||
Financial advisors (actual): | ||||||||||||||||||||||||||||||||||||||||
U.S. | ||||||||||||||||||||||||||||||||||||||||
At year end | 13,287 | 12,483 | 11,822 | 6% | 6% | |||||||||||||||||||||||||||||||||||
Average | 11,740 | 12,016 | 11,500 | -2 | % | 4 | % | 12,856 | 12,131 | 11,652 | 6% | 4% | ||||||||||||||||||||||||||||
Canada | ||||||||||||||||||||||||||||||||||||||||
At period end | 620 | 636 | 688 | -3 | % | -8 | % | |||||||||||||||||||||||||||||||||
At year end | 713 | 675 | 641 | 6% | 5% | |||||||||||||||||||||||||||||||||||
Average | 619 | 677 | 664 | -9 | % | 2 | % | 701 | 653 | 621 | 7% | 5% | ||||||||||||||||||||||||||||
United States
48
PART II
Item 7. Management’s Discussion and Analysis of AmericaFinancial Condition and Results of Operations, continued
U.S.
2014 vs. 2013
Net revenue increased 10% and 17%11% in 2011 and 2010, respectively,2014 primarily due to increases in asset-based fee revenue of 27% ($379.6 million) in 2011 and 45% ($429.9 million) in 2010account and increases in trade revenue of 1% ($30.8 million) in 2011 and 8% ($162.4 million) in 2010. U.S. asset-basedactivity fee revenue. Asset-based fee revenue increased 22% ($552 million) primarily due to an increase in both yearsadvisory programs fee revenue of 26% ($360 million), reflecting the continued growth in client assets under care. Account and activity fee revenue increased 9% ($50 million) primarily due to an increase in shareholder accounting services fees resulting from the increase in the average number of client mutual fund holdings serviced. Strong market performance also contributed to overall revenue growth.
Operating expenses (excluding variable compensation) increased 9% in 2014 primarily due to higher financial advisor compensation and salary and fringe benefits. The increase in financial advisor compensation was due to increases in asset-based fee and trade revenues on which financial advisor commissions are paid. Salary and fringe benefits expense increased due to wage increases and more personnel to support increased productivity of the Partnership’s financial advisor network.
2013 vs. 2012
Net revenue increased 14% in 2013 primarily due to increases in asset-based fee revenue and trade revenue. Asset-based fee revenue increased 24% ($471 million) primarily due to an increase in advisory programprograms fee revenue of 56%30% ($305.7314 million) in 2011 and 182% ($351.1 million) in 2010 primarily caused by significantwhich was the result of continued growth of averagein client assets under care in advisory programs.
PART II
|
|
In addition, service fee revenue increased 10% ($71.1 million) and 20% ($114.2 million) in 2011 and 2010, respectively, as increased equity market values in each year lifted the average asset values on which service fees are earned. U.S.care. The increase to trade revenue increased in both 2011 and 2010of 9% ($185 million) was primarily due to higher margins earned on each $1,000 invested by clients andthe impact of increased client dollars invested, year-over-year.partially offset by a decrease in the margin earned in 2013 compared to 2012. Strong market performance also contributed to overall revenue growth.
U.S. operatingOperating expenses (excluding variable compensation) increased 6%11% in 2011 and 10% in 20102013 primarily due to increaseshigher financial advisor compensation and salary and fringe benefits. The increase in financial advisor compensation and home office and branch salary and fringe benefits. These increases were partially offset by decreases in financial advisor salary and subsidy expense. The increases in financial advisor compensation werewas due to increases in trade and asset-based fee revenue on which financial advisor commissions are paid. Home office and branch salarySalary and fringe benefits expense increased due to wage increases, increases in fringe benefits expense caused by higher healthcare costs and increasedmore personnel to support increased productivity of the Partnership’s financial advisor network. Financial advisor salary and subsidy decreased due to fewer financial advisor hires participating in these compensation programs.
Canada
2014 vs. 2013
Net revenue increased 11% and 35%2% in 2011 and 2010, respectively,2014 primarily due to increasesan increase in asset-based fee revenue, of 22% ($8.9 million) in 2011 and 39% ($11.4 million) in 2010 and increasespartially offset by a decrease in trade revenue of 6% ($6.1 million) in 2011 and 28% ($23.1 million) in 2010. Canada asset-basedrevenue. Asset-based fee revenue increased in both 2011 and 201023% ($14 million) due to an increase in client assets under care resulting from the increases in average assetinvestment of client dollars and higher market values on which these fees are earned, mostlyof the underlying assets. Trade revenue declined 8% ($9 million) due to decreases in the overall improved market conditions year-over-year. Canada trade revenue increased in 2011margin earned, primarily from mutual funds, and the resultamount of increased client dollars invested and increased in 2010 primarily due to higher margins earned on each $1,000 invested by clients.
invested. Operating expenses (excluding variable compensation) increased 2%decreased 1% in 2011 and 14% in 2010 primarily due to increases in financial advisor compensation caused by increases in trade and asset-based fee revenue on which financial advisor commissions are paid and increases in home office and branch salary and fringe benefits resulting from increased personnel to support increased productivity of the Partnership’s financial advisor network. These increases were partially offset by decreases in financial advisor salary and subsidy, which decreased due to fewer financial advisor hires participating in these compensation programs.2014.
As a result, the pre-variable income (loss) forincreased 71% ($5 million) in 2014. Improvement in the Canadian businessCanada segment continues to improve from losses of $10.7 million and $32.9 million in 2010 and 2009, respectively to income of $4.2 million in 2011. These improvements to the financial results of the Canadian business segment areis due in part to the Partnership’scontinued focus on the Canada Plan to Profitability. The Canada Plan to Profitabilityachieve profitability. This includes several strategic initiatives to increase revenue and reducecontrol expenses. The revenueRevenue initiatives includedinclude the roll out of a managed fee-based program as well as other new products or enhancements, launched throughout 2010. Expense reduction efforts put into place throughout 2010 included a changeplan to new financial advisor compensation, conversion of certain communication systems to lower-cost options and review and renegotiation of several vendor contracts. These initiatives put into place throughout 2010 have improved the financial results of the Canadian business segment for 2011 as compared to 2010, as well as 2010 as compared to 2009.
PART II
|
|
However, the fact that the Partnership has had fewer financial advisor recruits in Canada and a further decrease ingrow the number of financial advisors, could impact the Partnership’s ability to grow revenue in the future, and thus could impact the ability of the Partnership to reach its plan to profitability for the Canadian business segment.
The Partnership announced during the third quarter of 2011 that Gary Reamey, who led the Canadian business segment since its inception in 1994, has decided to retire at the end of 2012 and therefore has stepped down as country leader effective January 1, 2012. Gary Reamey will remain with the Partnership as a member of the Executive Committee and a senior partner through 2012, at which point he will retire after 35 years of service. David Lane assumed responsibility as leader of the Canadian business segment and joined the Management Committee in 2012. David Lane joined the Partnership in 1986 and previously held various leadership roles including responsibility for Canadian Financial Advisor Recruiting, Training and Development.
REGULATORY REFORM
Financial Services Regulatory Reform. The SEC is responsible for implementing a series of regulatory initiativesclient assets under the Dodd-Frank Act. Among numerous other provisions, Section 913 of the Dodd-Frank Act directed the SEC to study existing practices in the industry and grants the SEC discretionary rulemaking authority to establish, among other things, comparable standards of conduct for broker-dealers and investment advisers when providing personalized investment advice about securities to retail clients and such other clients as the SEC provides by rule. On January 21, 2011, the SEC issued the mandated study with a recommendation that there should be a uniform standard of conduct for broker-dealers and investment advisers. To date, the SEC has not yet issued any rules in connection with the studycare and the Partnership cannot predict if or when any changes in such rules will be passed or the effectdepth of any such changes. For further discussion of this Act, see “Legislative and Regulatory Initiatives” risk factor in Part I, Item 1A – Risk Factors section.financial solutions provided to clients.
Trust Reform and the Volcker Rule. The Partnership has requested that the FRB deregister it as a SLHC and has received a temporary exemption from the FRB from submitting the FRB regulatory reports. The Partnership anticipates that this request will be approved and is preparing for supervision and regulation of the Partnership as a holding company by the OCC. If the request is not approved, the Partnership could become subject to what is commonly referred to as the “Volcker Rule,” which was jointly proposed in October 2011 by the SEC, the Federal Deposit Insurance Corporation, the FRB, and the OCC. The proposed Volcker Rule has the stated purpose of generally prohibiting certain banking entities from engaging in proprietary trading or sponsoring or investing in a hedge fund or private equity fund. At this time, it is unclear what impact the proposed Volcker Rule would have on the financial services industry, the Partnership and its operations if adopted and applicable to the Partnership. However, the Partnership continues to review and evaluate the proposed Volcker Rule to determine what impact or potential impact it may have.
Rule 12b-1 Fees. The Partnership receives various payments in connection with the purchase, sale and holding of mutual fund shares by its clients. Those payments include “Rule 12b-1 fees” and expense reimbursements. Rule 12b-1, under the ICA, allows a mutual fund to pay distribution and marketing expenses out of the fund’s assets. The SEC currently does not limit the size of Rule 12b-1 fees that funds may pay. FINRA does impose such limitations. However, on July 21, 2010 the SEC proposed reform of Rule 12b-1. The proposal called for the rescission of Rule 12b-1 and a proposed new Rule 12b-2 which would allow funds to deduct a fee on an annual basis of up to 25 basis points to pay for distribution expenses without a cumulative cap on this fee.49
PART II
|
|
Additionally, the proposal includes other amendments that would permit funds to deduct an asset-based distribution fee in which the fund may deduct ongoing sales charges with no annual limit, but cumulatively the asset-based distribution fee could not exceed the amount of the highest front-end load for a particular fund. The proposed rule also allows funds to create and distribute a class of shares at net asset value and dealers could establish their own fee schedule. The proposal includes additional requirements for disclosure on trade confirmations and in fund documents. These proposed rules have not been enacted and the Partnership cannot predict with any certainty whether or which of these proposals will be enacted in their current form, revised form or enacted at all. In addition, the Partnership is not yet able to determine the potential financial impact on its operating results related to this proposed reform of Rule 12b-1. For further information on the amount of Rule 12b-1 fees (i.e., service fees) earned by the Partnership, see Item 7 –7. Management’s Discussion and Analysis of Financial Condition and Results of Operations.Operations, continued
Health Care Reform.
2013 vs. 2012
Net revenue increased 14% in 2013 primarily due to increases in asset-based fee revenue and trade revenue. Asset-based fee revenue increased 18% ($9 million) primarily due to an increase in service fee revenue of 16% ($8 million), reflecting an increase in client assets under care due to the investment of client dollars and higher market values of the underlying assets. Trade revenue increased 8% ($8 million) primarily due to an increase in client dollars invested and favorable market conditions, reflected in the 5% increase in the daily average of the TSX.
Operating expenses (excluding variable compensation) increased 8% in 2013 primarily due to higher financial advisor compensation resulting from increases in trade and asset-based fee revenues on which financial advisor commissions are paid. As a result, pre-variable income (loss) improved from a loss of $4 million in 2012 to income of $7 million in 2013.
LEGISLATIVE AND REGULATORY REFORM
As discussed more fully in Part I, Item 1A – Risk Factors – Legislative and Regulatory Initiatives, the Partnership continues to monitor Legislative and Regulatory Initiatives, including the possibility of a universal fiduciary standard of care applicable to both broker-dealers and investment advisers under the Dodd-Frank Act and enacted reforms to the regulation of money market funds.
The PPACA was signed into law on March 23, 2010. PPACA requires employers to provide affordable coverageLegislative and Regulatory Initiatives may impact the manner in which the Partnership markets its products and services, manages its business and operations, and interacts with a minimum essential benefit to full-time employeesclients and regulators, any or pay a financial penalty. The bill contains provisions that go into effect over the next several years that expand employee eligibility forall of which could materially impact the Partnership’s medical planresults of operations, financial condition, and places limits on plan design.liquidity. However, the Partnership cannot presently predict when or if any proposed of potential Legislative and Regulatory guidance required to fully assessInitiatives will be enacted or the impact of this law is still forthcoming. Accordingly,that any Legislative and Regulatory Initiatives will have on the Partnership is not yet able to determine the full potential financial impact on its operating results in future years.Partnership.
MUTUAL FUNDS AND ANNUITIES
The Partnership derived 70%77%, 66%75% and 60%74% of its total revenue from sales and services related to mutual fund and annuity products in 2011, 20102014, 2013 and 2009,2012, respectively. In addition, the Partnership derived 19%from one mutual fund company 20%, 21%19% and 25%19% of its total revenue in 2011, 20102014, 2013 and 2009, respectively, from one mutual fund vendor. All of the2012, respectively. The revenue generated from this vendorcompany relates to business conducted with the Partnership’s U.S. segment.
Significant reductions in thethese revenues from this mutual fund source due to regulatory reform or other changes to the Partnership’s relationship with mutual fund vendorscompanies could have a material adverse effect on the Partnership’s results of operations.
50
PART II
Item 7. Management’s Discussion and Analysis of Financial Condition and Results of Operations, continued
LIQUIDITY AND CAPITAL RESOURCES
The Partnership requires liquidity to cover its operating expenses, net capital requirements, capital expenditures, debt repayment obligations, distributions to partners and redemptions of partnership interests. The principal sources for meeting the Partnership’s liquidity requirements include existing liquidity and capital resources of the Partnership, discussed further below, and funds generated from operations. The Partnership believes that the liquidity provided by these sources will be sufficient to meet its capital and liquidity requirements for the next twelve months. Depending on conditions in the capital markets and other factors, the Partnership will, from time to time, consider the issuance of debt and additional partnership capital, the proceeds of which could be used to meet growth needs or for other purposes.
Partnership Capital
The Partnership’s growth in capital has historically been throughthe result of the sale of limited partnership interestsInterests to its employeesassociates and existing limited partners, the sale of subordinated limited partnership interests to its current or retiring general partners, and retention of general partner earnings.
PART II
|
|
The Partnership completedfiled a limited partnership offeringRegistration Statement on Form S-8 with the SEC on January 3, 201117, 2014, to register $350 million of Interests pursuant to the 2014 LP Offering. On January 2, 2015, the Partnership issued $292 million of Interests in connection with $223.6the 2014 LP Offering. The remaining $58 million limited partner capital accepted. The Partnership is usingof Interests may be issued at the proceedsdiscretion of the limited partnership offering forPartnership in the future. Proceeds from the 2014 LP Offering are expected to be used toward working capital and general corporate purposes as needed.and to ensure there is adequate general liquidity of the Partnership for future needs, including growing the number of financial advisors. The issuance of Interests will reduce the Partnership’s net interest income and profitability beginning in 2015.
The Partnership’s capital subject to mandatory redemption at December 31, 2011,2014, net of reserve for anticipated withdrawals, was $1.8 billion,$1,973 million, an increase of $261.6$115 million from December 31, 2010, which includes the proceeds of the limited partnership offering discussed above. The2013. This increase in the Partnership’s capital subject to mandatory redemption iswas primarily due to the retention of general partner earnings ($83.282 million) and the issuance of limited partner,, additional capital contributions related to subordinated limited partner and general partner interests ($223.6 million, $35.247 million and $103.7$94 million, respectively) and the decrease of partnership loans outstanding ($17 million), partially offset by the redemption of limited partner, subordinated limited partner and general partner interests ($12.78 million, $1.7$16 million and $82.8$101 million, respectively). During the years ended December 31, 2014, 2013 and partnership loans outstanding ($86.9 million). The Partnership Agreement provides, subject to the Managing Partner’s discretion, that it is the intention, but not requirement, of2012, the Partnership to retain approximately 20% to 30%retained 13.8%, 13.8% and 23.0%, respectively, of income allocated to general partners. Beginning in 2011,In 2013, the Partnership decreased the amount of retention to approximately 23% from 28%13.8% of net income allocated to general partners. Ifpartners due to the increase in individual income tax rates increase, the Partnership may, in the future,2013 and current capital needs. The decrease in the percentage of retained net income further. During the years ended December 31, 2011, 2010 and 2009, the Partnership retained 23.0%, 27.6% and 26.6%, respectively,retention of income allocated to general partners.partners did not have a material impact on the Partnership’s capital or liquidity.
Under the terms of the Partnership Agreement, a partner’s capital is required to be redeemed by the Partnership in the event of the partner’s death resignation or terminationwithdrawal from the Partnership, subject to compliance with ongoing regulatory capital requirements. In the event of a partner’s death, the Partnership must generally redeemredeems the partner’s capital within six months. The Partnership has withdrawal restrictions in place limitingwhich govern the amountwithdrawal of capital that can be withdrawn at the discretion of the individual partner. Further, undercapital. Under the terms of the Partnership Agreement, limited partners withdrawing from the Partnership due to the partner’s termination or resignation from the Partnership are to be repaid their capital in three equal annual installments beginning the monthno earlier than 90 days after their resignation or termination.withdrawal notice is received by the Managing Partner. The capital of general partners resigning or terminatingwithdrawing from the
51
PART II
Item 7. Management’s Discussion and Analysis of Financial Condition and Results of Operations, continued
Partnership is converted to subordinated limited partnership capital or, at the discretion of the Managing Partner, redeemed by the Partnership. Subordinated limited partners are repaid their capital in six equal annual installments beginning the monthno earlier than 90 days after their request for withdrawal of contributed capital.capital is received by the Managing Partner. The Partnership’s Managing Partner has discretion to waive or modify these withdrawal restrictions and to accelerate the return of capital.
The Partnership capital consists of capital contributions made by individual limited partners,makes loans available to those general partners and subordinated limited partners(other than members of the Partnership. Effective January 2011, general partners may elect to finance a portionExecutive Committee) who require financing for some or all of their purchasepartnership capital contributions. It is anticipated that a majority of future general and subordinated limited partnership interestscapital contributions (other than for Executive Committee members) requiring financing will be financed through loans made availablepartnership loans. In limited circumstances a general partner may withdraw from the Partnership.
Partnership and become a subordinated limited partner while he or she still has an outstanding partnership loan. Loans made by the Partnership to general partners are generally for a period of one year but are expected to be renewed and bear interest at the prime rate, as defined in the loan documents. The Partnership will recognizerecognizes interest income for the interest paid by general partners in connection with suchreceived related to these loans. General partnersPartners borrowing from the Partnership will be required to repay such loans by applying the majority of earnings received from the Partnership to such loans, net of amounts retained by the Partnership, and amounts distributed for income taxes. However, any bank loans held by a general partner will be repaid prior to any applicationtaxes and 5% of earnings towards that partner’s Partnership loan.
PART II
|
|
distributed to the partner. The Partnership will havehas full recourse against any general partner that defaults on loan obligations to the Partnership. The Partnership does not anticipate that general partner loans will have a significantan adverse impact on the Partnership’s short-term liquidity or capital resources.
In addition, the Partnership has not and will not provide loansPartners may also choose to membershave individual banking arrangements for their partnership capital contributions. Any bank financing of the Executive Committee. Executive Committee members who require financing for some or all of their individual partner capital contributions will continue to have a loan directly with banks willing to provide such financing on an individual basis.
Any purchasesis in the form of partnership interests financed through banks are unsecured bank loan agreements and are between the individual and the bank. The bank loans of the individual general and subordinated limited partners, obtained for new general or subordinated limited partner capital purchases prior to 2011, were one year term loans due on February 24, 2012, which were subsequently renewed with one year term loans due on February 22, 2013. These loans are subject to annual renewal and have no required principal payments prior to maturity. The current bank loans of the individual limited partners are primarily due on January 2, 2014 and also have no required principal payments prior to that time. The Partnership does not guarantee these bank loans, nor can the individual general, subordinated limitedpartner pledge his or limited partners pledge theirher partnership interest as collateral for the bank loan.
Additionally, the The Partnership has performedperforms certain administrative functions in connection with its limited partners who have elected to finance a portion of the purchase oftheir partnership interestscapital contributions through individual unsecured bank loan agreements from banks with whom the Partnership has other banking relationships. For all individual purchaseslimited partner capital contributions financed through such bank loan agreements, the individual partners provide an irrevocable letter of instruction instructingeach agreement instructs the Partnership to apply the proceeds from the liquidation of that individual’s capital account to the repayment of their bank loan prior to any funds being released to the partner. In addition, the partner is required to apply partnership earnings, net of any firm retention and any distributions to pay taxes, to service the interest and principal on the bank loan. Should a subordinated limited or limited partner’s individual bank loan not be renewed upon maturity for any reason, the Partnership could experience increased requests for capital liquidations, which could adversely impact the Partnership’s liquidity.
Individual In addition, partners who finance all or a portion of their partnership interestcapital contributions with bank financing may be more likely to request the withdrawal of capital to meet bank financing requirements should the individual partners experience a period of reduced earnings, including potential operating losses.earnings. As a partnership, any withdrawals by general partners, subordinated limited partners or limited partners would reduce the Partnership’s available liquidity and capital.
As mentioned above, manyMany of the same banks that provide financing to individuallimited partners also provide various forms of financing to the Partnership. To the extent these banks increase credit available to the individual partners, financing available to the Partnership may be reduced.
52
PART II
| Item 7. Management’s Discussion and Analysis of Financial Condition and Results of Operations, continued |
The Partnership, while not a party to any individual partner unsecured bank loan agreements, does facilitate making payments of allocated income to certain banks on behalf of the limited partner. The following table represents amounts related to individual partnership loans as well as bank loans (for which the Partnership facilitates certain administrative functions). Individual partnersPartners may have arranged their own bank loans to finance their partnership capital for which the Partnership does not facilitate certain administrative functions and therefore any such loans are not included in the table.
| As of December 31, 2011 | ||||||||||||||||
($ in thousands) | Limited Partnership Interests | Subordinated Limited Partnership Interests | General Partnership Interests | Total Partnership Capital | ||||||||||||
Partnership capital(1): | ||||||||||||||||
Total partnership capital | $ | 662,226 | $ | 255,414 | $ | 927,578 | $ | 1,845,218 | ||||||||
|
|
|
|
|
|
|
| |||||||||
Partnership capital owned by partners with individual loans | $ | 381,485 | $ | 425 | $ | 418,600 | $ | 800,510 | ||||||||
|
|
|
|
|
|
|
| |||||||||
Partnership capital owned by partners with individual loans as a percent of total partnership capital | 57.6 | % | 0.2 | % | 45.1 | % | 43.4 | % | ||||||||
Individual loans: | ||||||||||||||||
Individual bank loans | $ | 100,447 | $ | 191 | $ | 75,650 | $ | 176,288 | ||||||||
Individual partnership loans | — | — | 86,853 | 86,853 | ||||||||||||
|
|
|
|
|
|
|
| |||||||||
Total individual loans | $ | 100,447 | $ | 191 | $ | 162,503 | $ | 263,141 | ||||||||
|
|
|
|
|
|
|
| |||||||||
Individual loans as a percent of total partnership capital | 15.2 | % | 0.1 | % | 17.5 | % | 14.3 | % | ||||||||
Individual loans as a percent of partnership capital owned by partners with individual loans | 26.3 | % | 44.9 | % | 38.8 | % | 32.9 | % | ||||||||
| As of December 31, 2014 | ||||||||||||||||
| Limited Partnership Interests | Subordinated Limited Partnership Interests | General Partnership Interests | Total Partnership Capital | |||||||||||||
|
| |||||||||||||||
Total partnership capital(1) | $ | 632 | $ | 336 | $ | 1,203 | $ | 2,171 | ||||||||
|
| |||||||||||||||
Partnership capital owned by partners with individual loans | $ | 61 | $ | 2 | $ | 597 | $ | 660 | ||||||||
|
| |||||||||||||||
Partnership capital owned by partners with individual loans as a percent of total partnership capital | 9.7% | 0.6% | 49.6% | 30.4% | ||||||||||||
Partner loans(2) | $ | 10 | $ | 1 | $ | 197 | $ | 208 | ||||||||
|
| |||||||||||||||
Partner loans as a percent of total partnership capital | 1.6% | 0.3% | 16.4% | 9.6% | ||||||||||||
Partner loans as a percent of partnership capital owned by partners with loans | 16.4% | 50.0% | 33.0% | 31.5% | ||||||||||||
(1) Total partnership capital, as defined for this table, is before the reduction of partnership loans and is net of reserve for anticipated withdrawals.
(2) Limited partner loans increased to approximately $170 in January 2015 in connection with the 2014 LP Offering. |
|
Historically, neither the amount of partnership capital financed with individual loans as indicated in the table above, nor the amount of individual partner capital withdrawal requests has had a significant impact on the Partnership’s liquidity or capital resources.
53
PART II
| Item 7. Management’s Discussion and Analysis of Financial Condition and Results of Operations, continued |
PartnershipLines of Credit and Debt
The following table shows the composition of the Partnership’s aggregate bank lines of credit in place as of December 31, 20112014 and 2010, are as follows:2013:
($ in thousands) | 2011 | 2010 | ||||||
Committed unsecured credit facilities: | ||||||||
2010 Credit Facility | $ | — | $ | 320,000 | ||||
2011 Credit Facility | 395,000 | — | ||||||
|
|
|
| |||||
Total committed | 395,000 | 320,000 | ||||||
Uncommitted credit facilities: | ||||||||
Secured | 595,000 | 595,000 | ||||||
Unsecured | — | 50,000 | ||||||
|
|
|
| |||||
Total uncommitted | 595,000 | 645,000 | ||||||
|
|
|
| |||||
Total bank lines of credit | $ | 990,000 | $ | 965,000 | ||||
|
|
|
| |||||
| 2014 | 2013 | |||||||
2013 Credit Facility | $ | 400 | $ | 400 | ||||
Uncommitted secured credit facilities | 365 | 415 | ||||||
|
|
|
| |||||
Total bank lines of credit | $ | 765 | $ | 815 | ||||
|
|
|
| |||||
In April 2010,November 2013, the Partnership entered into an agreement with eight12 banks for a $320.0five-year $400 million committed unsecured revolving line of credit (“2010 Credit Facility”), which had a final maturity date of April 20, 2011. The 2010 Credit Facility was put in place to provide short-term liquidity to the Partnership should the need arise.
In March 2011, the Partnership replaced the 2010 Credit Facility by entering into an agreement with 10 banks for a three year $395 million committed unsecured revolving line of credit (“20112013 Credit Facility”), which has a maturityan expiration date of March 18, 2014.November 15, 2018 and replaced a similar credit facility. The 20112013 Credit Facility is intended to provide short-term liquidity to the Partnership should the need arise. The 2011 Credit Facility has a tiered interest rate margin based on the Partnership’s leverage ratio (ratio of total debt to total capitalization). Borrowings made with a three-day-advance notice will have a rate of LIBOR plus a margin ranging from 1.50% to 2.25%. Same-day borrowings, which are subject to certain borrowing notification cutoff times, will have a rate consisting of a margin ranging from 0.50% to 1.25% plus the greater of the prime rate, the federal funds effective rate plus 1.00% or the one month LIBOR rate plus 1.00%. In accordance with the 2011 Credit Facility, the Partnership is required to maintain a leverage ratio of no more than 35% and minimum partnership capital, net of reserve for anticipated withdrawals, of at least $1.2 billion plus 50% of subsequent net issuances of partnership capital. As of the date of this filing,addition, the Partnership has not borrowed against the 2011 Credit Facility.
The Partnership’s uncommitted lines of credit that are subject to change at the discretion of the banks and, therefore, due tobanks. Based on credit market conditions and the uncommitted nature of these credit facilities, it is possible that these lines of credit could decrease or not be available in the future. During the first quarter of 2011, the Partnership’s uncommitted lines of credit were reduced by $50.0 million by a bank participating in the Partnership’s agreement for the 2011 Credit Facility. This decrease reduced the aggregated uncommitted bank lines of credit to $595.0 million. Subsequent to December 31, 2011, the Partnership’s uncommitted bank lines of credit were further reduced by $150 million by a bank reducing its exposure in the U.S. market. As of March 30, 2012, the Partnerships aggregated uncommitted bank lines of credit amounted to $445 million. In addition, the Partnership became aware that, effective May 25, 2012, the Partnership’s uncommitted bank lines of credit will be further reduced by $30 million by another bank. This decision is unrelated to the Partnership’s creditworthiness.
PART II
|
|
Actual borrowing availability on the uncommitted secured lines is based on client margin securities and Partnershipfirm-owned securities, which would serve as collateral on loans. loans in the event the Partnership borrowed against these lines.
There were no amounts outstanding on the 2013 Credit Facility and the uncommitted lines of credit as of December 31, 20112014 and 2010.2013. In addition, the Partnership did not have any draws against these lines of creditscredit during the yearyears ended December 31, 2011. 2014 and 2013, except for one nominal advance made on both the 2013 Credit Facility and the uncommitted facilities for the purpose of testing draw procedures.
The Partnership had two overnight draws against these lines of credit during the year ended December 31, 2010 in the amounts of $114.0 million and $40.0 million.
In 2009, the Partnership entered into a financing agreement with three banks to fund up to $30.0 million for purchases of office equipment. The Partnership borrowed the entire $30.0 million under this financing agreement. On November 1, 2011, the Partnership re-paid the outstanding principal and accrued interest on this financing agreement, which was prior to the final maturity date of October 1, 2014. The final payment of $18.3 million terminated this note payable.
In addition, the Partnership also entered into a $36.4 million fixed rate mortgage in 2009, collateralized by a home office building and related parking garage located on its St. Louis, Missouri, north campus location. On June 6, 2011, the Partnership re-paid the outstanding principal and accrued interest of $34.6 million on the fixed rate mortgage, which was prior to the final maturity date of December 22, 2012. This final payment terminated this note payable.
In 2011, the Partnership paid the final installment on the 7.79% capital notes in the amount of $3.7 million. This payment terminated the 7.79% capital notes. As a result, only the 7.33% capital notes remain with an outstanding balance of $150 million as of December 31, 2011.
As of December 31, 2011, the Partnership is in compliance with all covenants related to its outstanding debt agreements.agreements as of December 31, 2014. For further details on covenants related to lines of credit, see discussion regarding debt covenants in the NotesNote 6 to the Consolidated Financial Statements.
In June 2014, the Partnership paid the final scheduled installment on the liabilities subordinated to claims of general creditors of $50 million.
Cash Activity
As of December 31, 2011,2014, the Partnership had $819.5$1,033 million in cash and cash equivalents, and $676.4$634 million in securities purchased under agreements to resell, which generally have maturities of less than one week. This totals $1.5 billion$1,667 million of Partnership liquidity as of December 31, 2011,2014, a 50%3% ($0.5 billion)41 million) increase from $1.0 billion$1,626 million at December 31, 2010. In addition,2013. This increase is primarily due to timing of client cash activity and the resulting requirement for segregation. The Partnership also had $4.5 billion$8,848 million and $3.6 billion$8,435 million in cash and investments segregated under federal regulations as of December 31, 20112014 and 2010,2013, respectively, which was not available for general use.
During 2011, cash and cash equivalents of $819.5 million increased $731.9 million from $87.6 million as of December 31, 2010. This is primarily a result of the Partnership electing to leave more funds in cash and cash equivalents, that otherwise would have been invested in securities purchased under agreements to resell, due to the unlimited deposit insurance coverage currently being offered (under the Dodd-Frank Act) for non-interest bearing accounts at Federal Deposit Insurance Corporation (“FDIC”) insured depository institutions through December 31, 2012. In some cases, the banks will offer a credit for these uninvested cash balances that can be used to offset other bank fees, which is reflected as a reduction to other operating expenses in the Partnership’s Consolidated Statements of Income.
54
PART II
| Item 7. Management’s Discussion and Analysis of Financial Condition and Results of Operations, continued |
Cash provided by operating activities was $1.1 billionCapital Expenditures
The Partnership estimates 2015 capital spending of approximately $100 million for construction and facilities improvements at the year ended December 31, 2011. The primary sources of cash provided by operating activities include income before allocations to partners ($481.8 million) adjustednorth campus location in St. Louis and branch offices and for depreciation expense ($90.6 million) and a net increase in assets ($589.2 million) and a net increase in liabilities ($1.1 billion). During 2011, cash used in investing activities was $54.2 million consisting of capital expenditures supporting the growth of the Partnership’s operations. During 2011, cash used in financing activities was $294.6 million, consisting primarily of partnership withdrawals and distributions ($359.5 million), repayment of debt ($113.6 million) and redemption of partnership interests ($97.2 million), partially offset by issuance of partnership interests ($270.8 million) and repayment of general partnership loans ($4.8 million).technology upgrades.
Regulatory Requirements
As a result of its activities as a U.S. broker-dealer, Edward Jones is subject to the net capital provisions ofUniform Net Capital Rule 15c3-1 of the Securities Exchange Act of 1934 (the “Exchange Act”) and capital compliance rules of the FINRA Rule 4110. Under the alternative method permitted by the rules, Edward Jones must maintain minimum net capital, as defined, equal to the greater of $0.25 million or 2% of aggregate debit items arising from client transactions. The net capital rules also provide that Edward Jones’ partnership capital may not be withdrawn if the resulting net capital would be less than minimum requirements. Additionally, certain withdrawals of partnership capital require the approval of the SEC and FINRA to the extent they exceed defined levels, even though such withdrawals would not cause net capital to be less than minimum requirements. As
The Partnership’s Canada broker-dealer is a registered securities dealer regulated by IIROC. Under the regulations prescribed by IIROC, the Partnership is required to maintain minimum levels of risk-adjusted capital, which are dependent on the nature of the Partnership’s assets and operations.
The following table shows the Partnership’s net capital figures for its U.S. and Canada broker-dealers as of December 31, 2011, Edward Jones’ net capital of $722.6 million was 32.8% of aggregate debit items2014 and its net capital in excess of the minimum required was $678.6 million. Net capital after anticipated capital withdrawals, as a percentage of aggregate debit items was 30.6%. 2013:
| 2014 | 2013 | % Change | ||||||||||
U.S.: | ||||||||||||
Net capital | $ | 999 | $ | 873 | 14% | |||||||
Net capital in excess of the minimum required | $ | 948 | $ | 830 | 14% | |||||||
Net capital as a percentage of aggregate debit items | 38.9% | 41.4% | -6% | |||||||||
Net capital after anticipated capital withdrawals, as a percentage of aggregate debit items | 31.1% | 24.8% | 25% | |||||||||
Canada: | ||||||||||||
Regulatory risk adjusted capital | $ | 31 | $ | 34 | -9% | |||||||
Regulatory risk adjusted capital in excess of the minimum required to be held by IIROC | $ | 27 | $ | 27 | 0% | |||||||
Net capital and the related capital percentage may fluctuate on a daily basis. As of December 31, 2011, the Partnership’s Canadian broker-dealer’s regulatory risk adjusted capital of $42.5 million was $39.9 million in excess of the capital required to be held by IIROC. In addition, EJTC was in compliance with regulatory capital requirements in the jurisdiction in which it operates.requirements.
OFF BALANCE SHEET ARRANGEMENTS
The Partnership does not have any significant off-balance-sheet arrangements.
55
PART II
| Item 7. Management’s Discussion and Analysis of Financial Condition and Results of Operations, continued |
CONTRACTUAL COMMITMENTS AND OBLIGATIONS
The following table summarizes the Partnership’s long-term financing commitments and obligations as of December 31, 2011.2014. Subsequent to December 31, 2011,2014, these commitments and obligations may have fluctuated based on the changing business environment. The interest on financing commitments is based upon the stated rates of the underlying instruments, which range from 7.28% to 7.33%. For further disclosure regarding long-term debt liabilities subordinated to claims of general creditors and rental commitments, see Notes 9, 107 and 15,13, respectively, to the Consolidated Financial Statements.
(Dollars in thousands) | Payments Due by Period | |||||||||||||||||||||||||||
| 2012 | 2013 | 2014 | 2015 | 2016 | Thereafter | Total | ||||||||||||||||||||||
Long-term debt | $ | 997 | $ | 1,073 | $ | 1,153 | $ | 1,240 | $ | 1,333 | $ | 704 | $ | 6,500 | ||||||||||||||
Liabilities subordinated to claims of general creditors | 50,000 | 50,000 | 50,000 | — | — | — | 150,000 | |||||||||||||||||||||
Interest on financing commitments1 | 9,603 | 5,863 | 2,117 | 198 | 104 | 15 | 17,900 | |||||||||||||||||||||
Rental commitments | 128,445 | 34,173 | 23,029 | 17,400 | 12,601 | 49,477 | 265,125 | |||||||||||||||||||||
|
|
|
|
|
|
|
|
|
|
|
|
|
| |||||||||||||||
Total financing commitments and obligations | $ | 189,045 | $ | 91,109 | $ | 76,299 | $ | 18,838 | $ | 14,038 | $ | 50,196 | $ | 439,525 | ||||||||||||||
|
|
|
|
|
|
|
|
|
|
|
|
|
| |||||||||||||||
|
|
| Payments Due by Period | ||||||||||||||||||||||||||||
| 2015 | 2016 | 2017 | 2018 | 2019 | Thereafter | Total | ||||||||||||||||||||||
Long-term debt (including interest) | $ | 1 | $ | 1 | $ | 1 | $ | - | $ | - | $ | - | $ | 3 | ||||||||||||||
Rental commitments | 137 | 33 | 23 | 15 | 12 | 24 | 244 | |||||||||||||||||||||
|
| |||||||||||||||||||||||||||
Total financing commitments and obligations | $ | 138 | $ | 34 | $ | 24 | $ | 15 | $ | 12 | $ | 24 | $ | 247 | ||||||||||||||
|
| |||||||||||||||||||||||||||
In addition to the above table, the Partnership has a revolving unsecured line of credit outstanding as of December 31, 20112014 (see Note 86 to the Consolidated Financial Statements). Additionally, the Partnership would incur termination fees of $82.1approximately $162 million in 20122015 in the event the Partnership terminated existing contractual commitments with certain vendors providing ongoing services.services primarily for information technology, operations and marketing. These termination fees will decrease over the related contract periods, which generally expire within the next three years.
CRITICAL ACCOUNTING POLICIES
The Partnership’s financial statements are prepared in accordance with U.S. GAAP, which may require judgment and involve estimation processes to determine its assets, liabilities, revenues and expenses which affect its results of operations.
The Partnership believes that of its significant accounting policies, the following critical policies requirepolicy requires estimates that involve a higher degree of judgment and complexity.
Asset-Based Fees. Due to the timing of receipt of information, the Partnership must use estimates in recording the accruals related to certain asset-based fees. These accruals are based on historical trends and are adjusted to reflect market conditions for the period covered. Additional adjustments, if needed, are recorded in subsequent periods.
Legal Reserves. The Partnership provides for potential losses that may arise out of litigation, regulatory proceedings and other contingencies to the extent that such losses can be estimated, in accordance with ASC No. 450,Contingencies. See Note 1614 to the Consolidated Financial Statements and Part I, Item 3 – Legal Proceedings for further discussion of these items. The Partnership regularly monitors its exposures for potential losses. The Partnership’s total liability with respect to litigation and regulatory proceedings represents the best estimate of probable losses after considering, among other factors, the progress of each case, the Partnership’s experience and discussions with legal counsel.
PART II
|
|
Included in Part II, Item 7A – Quantitative and Qualitative Disclosures about Market Risk and in the notes to the financial statements (see Note 1 to the Consolidated Financial Statements),Statements, are additional discussions of the Partnership’s accounting policies.
56
PART II
Item 7. Management’s Discussion and Analysis of Financial Condition and Results of Operations, continued
THE EFFECTS OF INFLATION
The Partnership’s net assets are primarily monetary, consisting of cash and cash equivalents, cash and investments segregated under federal regulations, securities inventoriesowned and receivables, less liabilities. Monetary net assets are primarily liquid in nature and would not be significantly affected by inflation. Inflation and future expectations of inflation influence securities prices, as well as activity levels in the securities markets. As a result, profitability and capital may be impacted by inflation and inflationary expectations. Additionally, inflation’s impact on the Partnership’s operating expenses may affect profitability to the extent that additional costs are not recoverable through increased prices of services offered by the Partnership.
RECENTLY ISSUED ACCOUNTING STANDARDS
In May 2011,2014, the FASB and the International Accounting Standards Board (“IASB”) jointly issued Accounting Standards Update (“ASU”) No. 2011-04,2014-09,Fair Value MeasurementRevenue from Contracts with Customers (“ASU 2014-09”), a comprehensive new revenue recognition standard that will supersede nearly all existing revenue recognition guidance. The objective of ASU 2014-09 is that a company will recognize revenue when it transfers promised goods or services to customers in an amount that reflects the consideration to which the entity expects to be entitled in exchange for those goods or services. ASU 2014-09 will be effective for the first quarter of 2017. An entity can elect to adopt ASU 2014-09 using one of two methods, either full retrospective adoption to each prior reporting period, or recognize the cumulative effect of adoption at the date of initial application. The Partnership is in the process of evaluating the new standard and does not know the effect, if any, ASU 2014-09 will have on the Consolidated Financial Statements or which adoption method will be used.
In February 2015, the FASB issued ASU No. 2015-02,Consolidation (Topic 820)810) – Amendments to Achieve Common Fair Value Measurement and Disclosure Requirements in U.S. GAAP and IFRSsthe Consolidation Analysis (“ASU 2011-04”2015-02”), to establish common requirements for measuring fair value and for disclosing information about fair value measurements in accordance with U.S. GAAP and IFRS. The amendments in this update arewhich will be effective for interim and annual periods beginning after December 15, 2011.the first quarter of 2016. ASU 2015-02 provides updated guidance on consolidation of variable interest entities. The Partnership is in the process of evaluating the new standard and does not know what effect, if any, ASU 2015-02 will adopt ASU 2011-04 as of the effective date. Adoption is not expected to have a material impact on the Partnership’s Consolidated Financial Statements.
57
PART II
ITEM 7A. QUANTITATIVE AND QUALITATIVE DISCLOSURES ABOUT MARKET RISK
|
The SEC requires market risk disclosures of accounting policies for derivatives and other financial instruments and to provide quantitative and qualitative disclosures about market risk inherent in derivatives and other financial instruments. Various levels of management within the Partnership manage the Partnership’s risk exposure. Position limits in trading and inventory accounts are established and monitored on an ongoing basis. Credit risk related to various financing activities is reduced by the industry practice of obtaining and maintaining collateral. The Partnership monitors its exposure to counterparty risk through the use of credit exposure information, the monitoring of collateral values and the establishment of credit limits. For further discussion of monitoring, see the Risk Management discussion in Part III, Item 10 – Directors, Executive Officers and Corporate Governance of this Form 10-K.Annual Report.
The Partnership is exposed to market risk from changes in interest rates. Such changes in interest rates impact the income from interest earning assets, primarily receivables from clients on margin balances and short-term investments, which averaged $2.2$2.3 billion and $4.8$9.3 billion for the year ended December 31, 2011,2014, respectively. The changes in interest rates may also have an impact on the expense related to liabilities that finance these assets, such as amounts payable to clients and other interest and non-interest bearing liabilities.
The Partnership performed an analysis of its financial instruments and assessed the related interest rate risk and materiality in accordance with the SEC rules. Under current market conditions and based on current levels of interest earning assets and the liabilities that finance these assets, the Partnership estimates that a 100 basis point (1.00%) increase in short-term interest rates could increase its annual net interest income by approximately $57$83 million. Conversely, the Partnership estimates that a 100 basis point (1.00%) decrease in short-term interest rates could decrease the Partnership’s annual net interest income by approximately $7$16 million. A decrease in short-term interest rates currently has a less significant impact on net interest income due to the current low interest rate environment. The Partnership has two distinct types of interest bearing assets: client receivables from margin accounts and short-term, primarily overnight, investments, which are primarily comprised of cash and cash equivalents, investments segregated under federal regulations, and securities purchased under agreements to resell. These investments have earned interest at an average rate of approximately 1516 basis points (0.15%(0.16%) in 2011,2014, and therefore the financial dollar impact of further decline in rates is minimal. The Partnership has put in place an interest rate floor for the interest charged related to its client margin loans, which helps to limit the negative impact of declining interest rates.
In addition to the interest earning assets and liabilities noted above, the Partnership’s revenue earned related to its minority ownership interest in the advisorinvestment adviser to the Edward Jones money market funds is also impacted by changes in interest rates. As noteddiscussed in previous discussions,Part I, Item 1 - Business, as a 49.5% limited partner of Passport Research, Ltd., the investment adviser to some of the two money market funds made available to Edward Jones clients, the Partnership receives a portion of the income of the investment adviser. Due to the current historically low interest rate environment, the investment adviser voluntarily chose (beginning in March 2009) to reduce certain fees charged to the funds to a level that will maintain a positive client yield on the funds. This reduction of fees reduced the Partnership’s cash solutions revenue by approximately $100 million, $100 million and $90 million for the years ended December 31, 20112014, 2013 and 20102012, respectively, and is expected to continue at that level in future periods, based upon the current interest rate environment. Alternatively, if the interest rate environment improved such that this reduction in fees was no longer necessary to maintain a positive client yield, the Partnership’s revenue could increase annually by that same level.
58
PART II
|
Financial Statements Included in this Item
PART II
|
|
59
PART II
Item 8. Financial Statements and Supplementary Data, continued
MANAGEMENT’S REPORT ON INTERNAL CONTROL
OVER FINANCIAL REPORTING
Management of The Jones Financial Companies, L.L.L.P. and all wholly-owned subsidiaries (collectively, the “Partnership”), is responsible for establishing and maintaining adequate internal control over financial reporting. The Partnership’s internal control over financial reporting is a process designed under the supervision of the Partnership’s chief executive officer and chief financial officer to provide reasonable assurance regarding the reliability of financial reporting and the preparation of the Partnership’s financial statements for external purposes in accordance with U.S. generally accepted accounting principles.
As of the end of the Partnership’s 20112014 fiscal year, management conducted an assessment of the effectiveness of the Partnership’s internal control over financial reporting based on the framework established in Internal Control – Integrated Framework issued by the Committee of Sponsoring Organizations of the Treadway Commission (COSO)(2013). Based on this assessment, management has determined that the Partnership’s internal control over financial reporting as of December 31, 20112014 was effective.
The Partnership’s internal control over financial reporting includes policies and procedures that pertain to the maintenance of records that, in reasonable detail, accurately and fairly reflect transactions and dispositions of assets; provide reasonable assurances that transactions are recorded as necessary to permit preparation of financial statements in accordance with U.S. generally accepted accounting principles, and that receipts and expenditures are being made only in accordance with authorizations of management of the Partnership; and provide reasonable assurance regarding prevention or timely detection of unauthorized acquisition, use or disposition of the Partnership’s assets that could have a material effect on its financial statements.
The Partnership’s internal control over financial reporting as of December 31, 20112014 has been audited by PricewaterhouseCoopers LLP, an independent registered public accounting firm, as stated in their accompanying report, which expresses an unqualified opinion on the effectiveness of the Partnership’s internal control over financial reporting as of December 31, 2011.2014.
60
PART II
| Item 8. Financial Statements and Supplementary Data, continued |
REPORT OF INDEPENDENT REGISTERED PUBLIC ACCOUNTING FIRM
To The Jones Financial Companies, L.L.L.P.
In our opinion, the accompanying Consolidated Statements Ofof Financial Condition and the related Consolidated Statements of Income, of Changes in Partnership Capital Subject To Mandatory Redemption and of Cash Flows present fairly, in all material respects, the consolidated financial position of The Jones Financial Companies, L.L.L.P. and its subsidiaries (the “Partnership”) at December 31, 20112014 and 2010,2013, and the results of their operations and their cash flows for each of the three years in the period ended December 31, 20112014 in conformity with accounting principles generally accepted in the United States of America. In addition, in our opinion, the financial statement schedules listed in the index appearing under Item 15(a)(2) present fairly, in all material respects, the information set forth therein when read in conjunction with the related Consolidated Financial Statements. Also in our opinion, the Partnership maintained, in all material respects, effective internal control over financial reporting as of December 31, 2011,2014, based on criteria established inInternal Control—Control - Integrated Framework (2013) issued by the Committee of Sponsoring Organizations of the Treadway Commission (COSO)(“COSO”). The Partnership’s management is responsible for these financial statements and financial statement schedules, for maintaining effective internal control over financial reporting and for its assessment of the effectiveness of internal control over financial reporting, included in the accompanying Management’s Report on Internal Control over Financial Reporting. Our responsibility is to express opinions on these financial statements, on the financial statement schedules, and on the Partnership’s internal control over financial reporting based on our integrated audits. We conducted our audits in accordance with the standards of the Public Company Accounting Oversight Board (United States). Those standards require that we plan and perform the audits to obtain reasonable assurance about whether the financial statements are free of material misstatement and whether effective internal control over financial reporting was maintained in all material respects. Our audits of the financial statements included examining, on a test basis, evidence supporting the amounts and disclosures in the financial statements, assessing the accounting principles used and significant estimates made by management, and evaluating the overall financial statement presentation. Our audit of internal control over financial reporting included obtaining an understanding of internal control over financial reporting, assessing the risk that a material weakness exists, and testing and evaluating the design and operating effectiveness of internal control based on the assessed risk. Our audits also included performing such other procedures as we considered necessary in the circumstances. We believe that our audits provide a reasonable basis for our opinions.
A company’s internal control over financial reporting is a process designed to provide reasonable assurance regarding the reliability of financial reporting and the preparation of financial statements for external purposes in accordance with generally accepted accounting principles. A company’s internal control over financial reporting includes those policies and procedures that (i) pertain to the maintenance of records that, in reasonable detail, accurately and fairly reflect the transactions and dispositions of the assets of the company; (ii) provide reasonable assurance that transactions are recorded as necessary to permit preparation of financial statements in accordance with generally accepted accounting principles, and that receipts and expenditures of the company are being made only in accordance with authorizations of management and directors of the company; and (iii) provide reasonable assurance regarding prevention or timely detection of unauthorized acquisition, use, or disposition of the company’s assets that could have a material effect on the financial statements.
61
PART II
| Item 8. Financial Statements and Supplementary Data, continued |
Because of its inherent limitations, internal control over financial reporting may not prevent or detect misstatements. Also, projections of any evaluation of effectiveness to future periods are subject to the risk that controls may become inadequate because of changes in conditions, or that the degree of compliance with the policies or procedures may deteriorate.
/s/ PricewaterhouseCoopers, LLP
St. Louis, Missouri
March 30, 201227, 2015
62
PART II
| Item 8. Financial Statements and Supplementary Data, continued |
THE JONES FINANCIAL COMPANIES, L.L.L.P.
CONSOLIDATED STATEMENTS OF FINANCIAL CONDITION
ASSETS
| (Dollars in millions) | December 31, 2014 | December 31, 2013 | ||||||||||||||
| December 31, | December 31, |
| ||||||||||||||
(Dollars in thousands) | 2011 | 2010 | ||||||||||||||
ASSETS: | ||||||||||||||||
Cash and cash equivalents | $ | 819,506 | $ | 87,584 | $ | 1,033 | $ | 600 | ||||||||
Cash and investments segregated under federal regulations | 4,472,526 | 3,614,163 | 8,848 | 8,435 | ||||||||||||
Securities purchased under agreements to resell | 676,448 | 955,209 | 634 | 1,026 | ||||||||||||
Receivable from: | ||||||||||||||||
Clients | 2,353,308 | 2,318,306 | 2,789 | 2,300 | ||||||||||||
Mutual funds, insurance companies and other | 437 | 405 | ||||||||||||||
Brokers, dealers and clearing organizations | 252,410 | 239,520 | 122 | 148 | ||||||||||||
Mutual funds, insurance companies and other | 151,402 | 142,480 | ||||||||||||||
Securities owned, at fair value | ||||||||||||||||
Securities owned, at fair value: | ||||||||||||||||
Investment securities | 161 | 141 | ||||||||||||||
Inventory securities | 74,666 | 81,175 | 69 | 102 | ||||||||||||
Investment securities | 104,502 | 93,411 | ||||||||||||||
Equipment, property and improvements, at cost, net of accumulated depreciation and amortization | 579,439 | 615,036 | 549 | 543 | ||||||||||||
Other assets | 99,379 | 94,266 | 128 | 95 | ||||||||||||
|
| |||||||||||||||
|
| |||||||||||||||
TOTAL ASSETS | $ | 9,583,586 | $ | 8,241,150 | $ | 14,770 | $ | 13,795 | ||||||||
|
|
|
| |||||||||||||
LIABILITIES: | ||||||||||||||||
Payable to: | ||||||||||||||||
Clients | $ | 11,320 | $ | 10,596 | ||||||||||||
Brokers, dealers and clearing organizations | 88 | 79 | ||||||||||||||
Accrued compensation and employee benefits | 980 | 843 | ||||||||||||||
Accounts payable, accrued expenses and other | 161 | 142 | ||||||||||||||
Long-term debt | 3 | 4 | ||||||||||||||
|
| |||||||||||||||
| 12,552 | 11,664 | |||||||||||||||
|
| |||||||||||||||
Liabilities subordinated to claims of general creditors | - | 50 | ||||||||||||||
Commitments and contingencies (Notes 13 and 14) | ||||||||||||||||
Partnership capital subject to mandatory redemption, net of reserve for anticipated withdrawals | 1,973 | 1,858 | ||||||||||||||
Reserve for anticipated withdrawals | 245 | 223 | ||||||||||||||
|
| |||||||||||||||
Total partnership capital subject to mandatory redemption | 2,218 | 2,081 | ||||||||||||||
|
| |||||||||||||||
TOTAL LIABILITIES | $ | 14,770 | $ | 13,795 | ||||||||||||
|
| |||||||||||||||
The accompanying notes are an integral part of these Consolidated Financial Statements.
63
PART II
| Item 8. Financial Statements and Supplementary Data, continued |
THE JONES FINANCIAL COMPANIES, L.L.L.P.
CONSOLIDATED STATEMENTS OF FINANCIAL CONDITION (cont.)
LIABILITIESINCOME
| December 31, | December 31, | |||||||
(Dollars in thousands) | 2011 | 2010 | ||||||
Payable to: | ||||||||
Clients | $ | 6,727,090 | $ | 5,606,760 | ||||
Brokers, dealers and clearing organizations | 80,247 | 59,233 | ||||||
Securities sold, not yet purchased, at fair value | 7,586 | 6,704 | ||||||
Accrued compensation and employee benefits | 540,416 | 506,221 | ||||||
Accounts payable and accrued expenses | 165,970 | 187,162 | ||||||
Long-term debt | 6,500 | 66,397 | ||||||
|
|
|
| |||||
| 7,527,809 | 6,432,477 | |||||||
|
|
|
| |||||
Liabilities subordinated to claims of general creditors | 150,000 | 203,700 | ||||||
|
|
|
| |||||
Commitments and contingencies (Notes 15 and 16) | ||||||||
Partnership capital subject to mandatory redemption, net of reserve for anticipated withdrawals | 1,758,365 | 1,496,725 | ||||||
Reserve for anticipated withdrawals | 147,412 | 108,248 | ||||||
|
|
|
| |||||
Total partnership capital subject to mandatory redemption | 1,905,777 | 1,604,973 | ||||||
|
|
|
| |||||
TOTAL LIABILITIES | $ | 9,583,586 | $ | 8,241,150 | ||||
|
|
|
| |||||
| (Dollars in millions, except per | For the Years Ended December 31, | |||||||||||
| unit information and units outstanding) | 2014 | 2013 | 2012 | |||||||||
|
|
|
|
| ||||||||
Revenue: | ||||||||||||
Fee revenue | ||||||||||||
Asset-based | $ | 3,089 | $ | 2,523 | $ | 2,042 | ||||||
Account and activity | 617 | 568 | 574 | |||||||||
|
|
|
|
|
| |||||||
Total fee revenue | 3,706 | 3,091 | 2,616 | |||||||||
Trade revenue | ||||||||||||
Commissions | 2,168 | 2,134 | 1,979 | |||||||||
Principal transactions | 136 | 183 | 156 | |||||||||
Investment banking | 156 | 122 | 112 | |||||||||
|
|
|
|
|
| |||||||
Total trade revenue | 2,460 | 2,439 | 2,247 | |||||||||
Interest and dividends | 135 | 134 | 133 | |||||||||
Other revenue | 32 | 52 | 31 | |||||||||
|
|
|
|
|
| |||||||
Total revenue | 6,333 | 5,716 | 5,027 | |||||||||
Interest expense | 55 | 59 | 62 | |||||||||
|
|
|
|
|
| |||||||
Net revenue | 6,278 | 5,657 | 4,965 | |||||||||
|
|
|
|
|
| |||||||
Operating expenses: | ||||||||||||
Compensation and benefits | 4,253 | 3,793 | 3,285 | |||||||||
Occupancy and equipment | 367 | 356 | 353 | |||||||||
Communications and data processing | 289 | 292 | 279 | |||||||||
Payroll and other taxes | 229 | 207 | 186 | |||||||||
Advertising | 70 | 58 | 56 | |||||||||
Professional and consulting fees | 59 | 48 | 37 | |||||||||
Postage and shipping | 51 | 51 | 48 | |||||||||
Other operating expenses | 190 | 178 | 166 | |||||||||
|
|
|
|
|
| |||||||
Total operating expenses | 5,508 | 4,983 | 4,410 | |||||||||
|
|
|
|
|
| |||||||
Income before allocations to partners | 770 | 674 | 555 | |||||||||
Allocations to partners: | ||||||||||||
Limited partners | 82 | 78 | 72 | |||||||||
Subordinated limited partners | 87 | 73 | 61 | |||||||||
General partners | 601 | 523 | 422 | |||||||||
|
|
|
|
|
| |||||||
Net income | $ | - | $ | - | $ | - | ||||||
|
|
|
|
|
| |||||||
Income allocated to limited partners per weighted average $1,000 equivalent limited partnership unit outstanding | $ | 129.40 | $ | 121.12 | $ | 109.84 | ||||||
|
|
|
|
|
| |||||||
Weighted average $1,000 equivalent limited partnership units outstanding | 636,481 | 644,856 | 655,663 | |||||||||
|
|
|
|
|
| |||||||
The accompanying notes are an integral part of these Consolidated Financial Statements.
64
PART II
| Item 8. Financial Statements and Supplementary Data, continued |
THE JONES FINANCIAL COMPANIES, L.L.L.P.
CONSOLIDATED STATEMENTS OF INCOMECHANGES IN PARTNERSHIP CAPITAL
SUBJECT TO MANDATORY REDEMPTION
FOR THE YEARS ENDED DECEMBER 31, 2014, 2013 and 2012
(Dollars in thousands, | For the Years Ended December 31, | |||||||||||
except per unit information) | 2011 | 2010 | 2009 | |||||||||
Revenue: | ||||||||||||
Trade revenue | ||||||||||||
Commissions | $ | 1,698,687 | $ | 1,575,852 | $ | 1,360,927 | ||||||
Principal transactions | 284,231 | 320,777 | 398,108 | |||||||||
Investment banking | 153,100 | 208,615 | 183,797 | |||||||||
|
|
|
|
|
| |||||||
Total trade revenue | 2,136,018 | 2,105,244 | 1,942,832 | |||||||||
Fee revenue | ||||||||||||
Asset-based | 1,776,883 | 1,397,333 | 967,386 | |||||||||
Account and activity | 522,898 | 503,264 | 489,605 | |||||||||
|
|
|
|
|
| |||||||
Total fee revenue | 2,299,781 | 1,900,597 | 1,456,991 | |||||||||
Interest and dividends | 130,150 | 126,769 | 112,637 | |||||||||
Other revenue | 11,553 | 30,489 | 35,558 | |||||||||
|
|
|
|
|
| |||||||
Total revenue | 4,577,502 | 4,163,099 | 3,548,018 | |||||||||
Interest expense | 67,641 | 56,323 | 57,599 | |||||||||
|
|
|
|
|
| |||||||
Net revenue | 4,509,861 | 4,106,776 | 3,490,419 | |||||||||
Operating expenses: | ||||||||||||
Compensation and benefits | 2,940,088 | 2,643,683 | 2,215,791 | |||||||||
Occupancy and equipment | 356,555 | 343,305 | 318,953 | |||||||||
Communications and data processing | 289,358 | 290,070 | 285,870 | |||||||||
Payroll and other taxes | 171,125 | 159,916 | 140,683 | |||||||||
Advertising | 54,201 | 55,677 | 48,389 | |||||||||
Postage and shipping | 48,487 | 49,848 | 50,431 | |||||||||
Clearance fees | 12,564 | 11,562 | 13,130 | |||||||||
Other operating expenses | 155,700 | 159,930 | 148,534 | |||||||||
|
|
|
|
|
| |||||||
Total operating expenses | 4,028,078 | 3,713,991 | 3,221,781 | |||||||||
|
|
|
|
|
| |||||||
Income from continuing operations | 481,783 | 392,785 | 268,638 | |||||||||
Loss from discontinued operations (Note 2) | — | — | (104,331 | ) | ||||||||
|
|
|
|
|
| |||||||
Income before allocations to partners | 481,783 | 392,785 | 164,307 | |||||||||
Allocations to partners: | ||||||||||||
Limited partners | 69,960 | 43,803 | 19,543 | |||||||||
Subordinated limited partners | 50,292 | 41,720 | 16,530 | |||||||||
General partners | 361,531 | 307,262 | 128,234 | |||||||||
|
|
|
|
|
| |||||||
Net income | $ | — | $ | — | $ | — | ||||||
|
|
|
|
|
| |||||||
Income allocated to limited partners per weighted average $1,000 equivalent limited partnership unit outstanding | $ | 104.66 | $ | 96.07 | $ | 41.44 | ||||||
|
|
|
|
|
| |||||||
Weighted average $1,000 equivalent limited partnership units outstanding | 668,450 | 455,949 | 471,597 | |||||||||
|
|
|
|
|
| |||||||
(Dollars in millions) | Limited Partnership Capital | Subordinated Limited Partnership Capital | General Partnership Capital | Total | ||||||||||||
TOTAL PARTNERSHIP CAPITAL SUBJECT TOMANDATORY REDEMPTION, DECEMBER 31, 2011 | $ | 706 | $ | 271 | $ | 929 | $ | 1,906 | ||||||||
|
|
|
|
|
|
|
| |||||||||
Reserve for anticipated withdrawals | (44) | (16) | (88) | (148) | ||||||||||||
|
|
|
|
|
|
|
| |||||||||
Partnership capital subject to mandatory redemption, net of reserve for anticipated withdrawals, December 31, 2011 | $ | 662 | $ | 255 | $ | 841 | $ | 1,758 | ||||||||
Partnership loans outstanding, December 31, 2011 | - | - | 87 | 87 | ||||||||||||
|
|
|
|
|
|
|
| |||||||||
Total partnership capital, including capital financed with partnership loans, net of reserve for anticipated withdrawals, December 31, 2011 | 662 | 255 | 928 | 1,845 | ||||||||||||
Issuance of partnership interests | - | 36 | 103 | 139 | ||||||||||||
Redemption of partnership interests | (11) | (8) | (80) | (99) | ||||||||||||
Income allocated to partners | 72 | 61 | 422 | 555 | ||||||||||||
Distributions | (27) | (42) | (218) | (287) | ||||||||||||
|
|
|
|
|
|
|
| |||||||||
Total partnership capital, including capital financed with partnership loans | 696 | 302 | 1,155 | 2,153 | ||||||||||||
Partnership loans outstanding, December 31, 2012 | - | - | (170) | (170) | ||||||||||||
|
|
|
|
|
|
|
| |||||||||
TOTAL PARTNERSHIP CAPITAL SUBJECT TO MANDATORY REDEMPTION, DECEMBER 31, 2012 | $ | 696 | $ | 302 | $ | 985 | $ | 1,983 | ||||||||
|
|
|
|
|
|
|
| |||||||||
Reserve for anticipated withdrawals | (45) | (19) | (107) | (171) | ||||||||||||
|
|
|
|
|
|
|
| |||||||||
Partnership capital subject to mandatory redemption, net of reserve for anticipated withdrawals, December 31, 2012 | $ | 651 | $ | 283 | $ | 878 | $ | 1,812 | ||||||||
Partnership loans outstanding, December 31, 2012 | - | - | 170 | 170 | ||||||||||||
|
|
|
|
|
|
|
| |||||||||
Total partnership capital, including capital financed with partnership loans, net of reserve for anticipated withdrawals, December 31, 2012 | 651 | 283 | 1,048 | 1,982 | ||||||||||||
Issuance of partnership interests | - | 32 | 103 | 135 | ||||||||||||
Redemption of partnership interests | (10) | (10) | (95) | (115) | ||||||||||||
Income allocated to partners | 78 | 73 | 523 | 674 | ||||||||||||
Distributions | (31) | (49) | (300) | (380) | ||||||||||||
|
|
|
|
|
|
|
| |||||||||
Total partnership capital, including capital financed with partnership loans | 688 | 329 | 1,279 | 2,296 | ||||||||||||
Partnership loans outstanding, December 31, 2013 | - | - | (215) | (215) | ||||||||||||
|
|
|
|
|
|
|
| |||||||||
TOTAL PARTNERSHIP CAPITAL SUBJECT TO MANDATORY REDEMPTION, DECEMBER 31, 2013 | $ | 688 | $ | 329 | $ | 1,064 | $ | 2,081 | ||||||||
|
|
|
|
|
|
|
| |||||||||
Reserve for anticipated withdrawals | (48) | (24) | (151) | (223) | ||||||||||||
|
|
|
|
|
|
|
| |||||||||
Partnership capital subject to mandatory redemption, net of reserve for anticipated withdrawals, December 31, 2013 | $ | 640 | $ | 305 | $ | 913 | $ | 1,858 | ||||||||
Partnership loans outstanding, December 31, 2013 | - | - | 215 | 215 | ||||||||||||
|
|
|
|
|
|
|
| |||||||||
Total partnership capital, including capital financed with partnership loans, net of reserve for anticipated withdrawals, December 31, 2013 | 640 | 305 | 1,128 | 2,073 | ||||||||||||
Issuance of partnership interests | - | 47 | 94 | 141 | ||||||||||||
Redemption of partnership interests | (8) | (16) | (101) | (125) | ||||||||||||
Income allocated to partners | 82 | 87 | 601 | 770 | ||||||||||||
Distributions | (30) | (60) | (353) | (443) | ||||||||||||
|
|
|
|
|
|
|
| |||||||||
Total partnership capital, including capital financed with partnership loans | 684 | 363 | 1,369 | 2,416 | ||||||||||||
Partnership loans outstanding, December 31, 2014 | - | (1) | (197) | (198) | ||||||||||||
|
|
|
|
|
|
|
| |||||||||
TOTAL PARTNERSHIP CAPITAL SUBJECT TO MANDATORY REDEMPTION, DECEMBER 31, 2014 | $ | 684 | $ | 362 | $ | 1,172 | $ | 2,218 | ||||||||
|
|
|
|
|
|
|
| |||||||||
Reserve for anticipated withdrawals | (52) | (27) | (166) | (245) | ||||||||||||
|
|
|
|
|
|
|
| |||||||||
Partnership capital subject to mandatory redemption, net of reserve for anticipated withdrawals, December 31, 2014 | $ | 632 | $ | 335 | $ | 1,006 | $ | 1,973 | ||||||||
The accompanying notes are an integral part of these Consolidated Financial Statements.
65
PART II
| Item 8. Financial Statements and Supplementary Data, continued |
THE JONES FINANCIAL COMPANIES, L.L.L.P.
CONSOLIDATED STATEMENTS OF CHANGES IN PARTNERSHIP CAPITAL
SUBJECT TO MANDATORY REDEMPTION
FOR THE YEARS ENDED DECEMBER 31, 2011, 2010 and 2009CASH FLOWS
| Subordinated | ||||||||||||||||
| Limited | Limited | General | ||||||||||||||
| Partnership | Partnership | Partnership | ||||||||||||||
(Dollars in thousands) | Capital | Capital | Capital | Total | ||||||||||||
TOTAL PARTNERSHIP CAPITAL SUBJECT TO MANDATORY REDEMPTION, DECEMBER 31, 2008 | $ | 504,048 | $ | 182,313 | $ | 788,954 | $ | 1,475,315 | ||||||||
|
|
|
|
|
|
|
| |||||||||
Reserve for anticipated withdrawals | (21,682 | ) | (5,380 | ) | (35,558 | ) | (62,620 | ) | ||||||||
|
|
|
|
|
|
|
| |||||||||
Partnership capital subject to mandatory redemption, net of reserve for anticipated withdrawals, December 31, 2008 | $ | 482,366 | $ | 176,933 | $ | 753,396 | $ | 1,412,695 | ||||||||
Issuance of partnership interests | — | 25,312 | — | 25,312 | ||||||||||||
Redemption of partnership interests | (19,365 | ) | (6,304 | ) | (9,885 | ) | (35,554 | ) | ||||||||
Income allocated to partners | 19,543 | 16,530 | 128,234 | 164,307 | ||||||||||||
Withdrawals and distributions | (6,807 | ) | (13,558 | ) | (79,583 | ) | (99,948 | ) | ||||||||
|
|
|
|
|
|
|
| |||||||||
TOTAL PARTNERSHIP CAPITAL SUBJECT TO MANDATORY REDEMPTION, DECEMBER 31, 2009 | $ | 475,737 | $ | 198,913 | $ | 792,162 | $ | 1,466,812 | ||||||||
|
|
|
|
|
|
|
| |||||||||
Reserve for anticipated withdrawals | (12,736 | ) | (2,972 | ) | (14,576 | ) | (30,284 | ) | ||||||||
|
|
|
|
|
|
|
| |||||||||
Partnership capital subject to mandatory redemption, net of reserve for anticipated withdrawals, December 31, 2009 | $ | 463,001 | $ | 195,941 | $ | 777,586 | $ | 1,436,528 | ||||||||
Issuance of partnership interests | — | 35,984 | — | 35,984 | ||||||||||||
Redemption of partnership interests | (11,652 | ) | (9,957 | ) | (38,982 | ) | (60,591 | ) | ||||||||
Income allocated to partners | 43,803 | 41,720 | 307,262 | 392,785 | ||||||||||||
Withdrawals and distributions | (15,598 | ) | (26,273 | ) | (157,862 | ) | (199,733 | ) | ||||||||
|
|
|
|
|
|
|
| |||||||||
TOTAL PARTNERSHIP CAPITAL SUBJECT TO MANDATORY REDEMPTION, DECEMBER 31, 2010 | $ | 479,554 | $ | 237,415 | $ | 888,004 | $ | 1,604,973 | ||||||||
|
|
|
|
|
|
|
| |||||||||
Reserve for anticipated withdrawals | (28,205 | ) | (15,447 | ) | (64,596 | ) | (108,248 | ) | ||||||||
|
|
|
|
|
|
|
| |||||||||
Partnership capital subject to mandatory redemption, net of reserve for anticipated withdrawals, December 31, 2010 | $ | 451,349 | $ | 221,968 | $ | 823,408 | $ | 1,496,725 | ||||||||
Issuance of partnership interests | 223,560 | 35,182 | 12,097 | 270,839 | ||||||||||||
Issuance of partnership interests through partnership loans | — | — | 91,693 | 91,693 | ||||||||||||
Redemption of partnership interests | (12,683 | ) | (1,736 | ) | (82,772 | ) | (97,191 | ) | ||||||||
Income allocated to partners | 69,960 | 50,292 | 361,531 | 481,783 | ||||||||||||
Withdrawals and distributions | (26,482 | ) | (34,623 | ) | (190,114 | ) | (251,219 | ) | ||||||||
|
|
|
|
|
|
|
| |||||||||
Total partnership capital, including capital financed with partnership loans | 705,704 | 271,083 | 1,015,843 | 1,992,630 | ||||||||||||
Partnership loans outstanding | — | — | (86,853 | ) | (86,853 | ) | ||||||||||
|
|
|
|
|
|
|
| |||||||||
TOTAL PARTNERSHIP CAPITAL SUBJECT TO MANDATORY REDEMPTION, DECEMBER 31, 2011 | $ | 705,704 | $ | 271,083 | $ | 928,990 | $ | 1,905,777 | ||||||||
|
|
|
|
|
|
|
| |||||||||
Reserve for anticipated withdrawals | (43,478 | ) | (15,669 | ) | (88,265 | ) | (147,412 | ) | ||||||||
|
|
|
|
|
|
|
| |||||||||
Partnership capital subject to mandatory redemption, net of reserve for anticipated withdrawals, December 31, 2011 | $ | 662,226 | $ | 255,414 | $ | 840,725 | $ | 1,758,365 | ||||||||
| For the years ended December 31, | ||||||||||||
| (Dollars in millions) | 2014 | 2013 | 2012 | |||||||||
|
|
|
|
| ||||||||
CASH FLOWS FROM OPERATING ACTIVITIES: | ||||||||||||
Net income | $ | - | $ | - | $ | - | ||||||
Adjustments to reconcile net income to net cash provided by operating activities: | ||||||||||||
Income before allocations to partners | 770 | 674 | 555 | |||||||||
Depreciation and amortization | 82 | 82 | 80 | |||||||||
Changes in assets and liabilities: | ||||||||||||
Cash and investments segregated under federal regulations | (413) | (720) | (3,242) | |||||||||
Securities purchased under agreements to resell | 392 | 67 | (416) | |||||||||
Net payable to clients | 235 | 487 | 3,435 | |||||||||
Net receivable from brokers, dealers and clearing organizations | 35 | 55 | (100) | |||||||||
Receivable from mutual funds, insurance companies and other | (32) | (50) | (55) | |||||||||
Securities owned | 13 | (57) | (8) | |||||||||
Other assets | (33) | 4 | - | |||||||||
Accrued compensation and employee benefits | 137 | 178 | 125 | |||||||||
Accounts payable, accrued expenses and other | 21 | (9) | (27) | |||||||||
|
|
|
|
|
| |||||||
Net cash provided by operating activities | 1,207 | 711 | 347 | |||||||||
|
|
|
|
|
| |||||||
CASH FLOWS FROM INVESTING ACTIVITIES: | ||||||||||||
Purchase of equipment, property and improvements, net | (90) | (84) | (37) | |||||||||
|
|
|
|
|
| |||||||
Net cash used in investing activities | (90) | (84) | (37) | |||||||||
|
|
|
|
|
| |||||||
CASH FLOWS FROM FINANCING ACTIVITIES: | ||||||||||||
Repayment of long-term debt | (1) | (2) | (1) | |||||||||
Repayment of subordinated liabilities | (50) | (50) | (50) | |||||||||
Issuance of partnership interests (net of partnership loans) | 55 | 40 | 45 | |||||||||
Redemption of partnership interests | (125) | (115) | (99) | |||||||||
Distributions from partnership capital (net of partnership loans) | (563) | (490) | (424) | |||||||||
Issuance of partnership loans | - | (11) | - | |||||||||
|
|
|
|
|
| |||||||
Net cash used in financing activities | (684) | (628) | (529) | |||||||||
|
|
|
|
|
| |||||||
Net increase (decrease) in cash and cash equivalents | 433 | (1) | (219) | |||||||||
CASH AND CASH EQUIVALENTS: | ||||||||||||
Beginning of year | 600 | 601 | 820 | |||||||||
|
|
|
|
|
| |||||||
End of year | $ | 1,033 | $ | 600 | $ | 601 | ||||||
|
|
|
|
|
| |||||||
Cash paid for interest | $ | 55 | $ | 59 | $ | 63 | ||||||
|
|
|
|
|
| |||||||
Cash paid for taxes (Note 11) | $ | 10 | $ | 7 | $ | 4 | ||||||
|
|
|
|
|
| |||||||
NON-CASH ACTIVITIES: | ||||||||||||
Issuance of general partnership interests through partnership loans in current period | $ | 86 | $ | 95 | $ | 94 | ||||||
|
|
|
|
|
| |||||||
Repayment of partnership loans through distributions from partnership capital in current period | $ | 103 | $ | 61 | $ | 11 | ||||||
|
|
|
|
|
| |||||||
The accompanying notes are an integral part of these Consolidated Financial Statements.
66
PART II
| Item 8. Financial Statements and Supplementary Data, continued |
THE JONES FINANCIAL COMPANIES, L.L.L.P.
CONSOLIDATED STATEMENTS OF CASH FLOWS
| For the years ended December 31, | ||||||||||||
(Dollars in thousands) | 2011 | 2010 | 2009 | |||||||||
CASH FLOWS FROM OPERATING ACTIVITIES: | ||||||||||||
Net income | $ | — | $ | — | $ | — | ||||||
Adjustments to reconcile net income to net cash provided by operating activities: | ||||||||||||
Income before allocations to partners | 481,783 | 392,785 | 164,307 | |||||||||
Depreciation and amortization | 90,609 | 98,187 | 93,076 | |||||||||
Loss on sale of subsidiary | — | — | 70,000 | |||||||||
Changes in assets and liabilities: | ||||||||||||
Cash and investments segregated under federal regulations | (858,363 | ) | (802,009 | ) | (665,790 | ) | ||||||
Securities purchased under agreements to resell | 278,761 | (188,932 | ) | 587,723 | ||||||||
Net payable to clients | 1,085,328 | 723,968 | (27,118 | ) | ||||||||
Net receivable from brokers, dealers and clearing organizations | 8,124 | (26,795 | ) | 135,338 | ||||||||
Receivable from mutual funds, insurance companies and other | (8,922 | ) | 7,051 | (25,797 | ) | |||||||
Securities owned, net | (3,700 | ) | (11,151 | ) | (28,000 | ) | ||||||
Other assets | (5,113 | ) | (18,079 | ) | 736 | |||||||
Accrued compensation and employee benefits | 34,195 | 125,674 | 63,742 | |||||||||
Accounts payable and accrued expenses | (21,974 | ) | 14,221 | 6,530 | ||||||||
|
|
|
|
|
| |||||||
Net cash provided by operating activities | 1,080,728 | 314,920 | 374,747 | |||||||||
|
|
|
|
|
| |||||||
CASH FLOWS FROM INVESTING ACTIVITIES: | ||||||||||||
Purchase of equipment, property and improvements, net | (54,230 | ) | (95,653 | ) | (213,801 | ) | ||||||
Proceeds from sale of subsidiary | — | — | 10,160 | |||||||||
Cash retained by sold subsidiary | — | — | (23,121 | ) | ||||||||
|
|
|
|
|
| |||||||
Net cash used in investing activities | (54,230 | ) | (95,653 | ) | (226,762 | ) | ||||||
|
|
|
|
|
| |||||||
CASH FLOWS FROM FINANCING ACTIVITIES: | ||||||||||||
Issuance of bank loans | — | — | 45,000 | |||||||||
Repayment of bank loans | — | (58,000 | ) | (30,000 | ) | |||||||
Issuance of long-term debt | — | 14,806 | 51,593 | |||||||||
Repayment of long-term debt | (59,897 | ) | (7,709 | ) | (1,385 | ) | ||||||
Repayment of subordinated liabilities | (53,700 | ) | (53,700 | ) | (3,700 | ) | ||||||
Issuance of partnership interests | 270,839 | 35,984 | 25,312 | |||||||||
Redemption of partnership interests | (97,191 | ) | (60,591 | ) | (35,554 | ) | ||||||
Withdrawals and distributions from partnership capital | (359,467 | ) | (230,017 | ) | (162,568 | ) | ||||||
Repayment of general partnership loans | 4,840 | — | — | |||||||||
|
|
|
|
|
| |||||||
Net cash used in financing activities | (294,576 | ) | (359,227 | ) | (111,302 | ) | ||||||
|
|
|
|
|
| |||||||
Net increase (decrease) in cash and cash equivalents | 731,922 | (139,960 | ) | 36,683 | ||||||||
CASH AND CASH EQUIVALENTS | ||||||||||||
Beginning of year | 87,584 | 227,544 | 190,861 | |||||||||
|
|
|
|
|
| |||||||
End of year | $ | 819,506 | $ | 87,584 | $ | 227,544 | ||||||
|
|
|
|
|
| |||||||
Cash paid for interest | $ | 67,904 | $ | 56,403 | $ | 57,868 | ||||||
|
|
|
|
|
| |||||||
Cash paid for taxes (Note 13) | $ | 5,087 | $ | 4,043 | $ | 3,134 | ||||||
|
|
|
|
|
| |||||||
NON-CASH ACTIVITIES: | ||||||||||||
Additions of equipment, property and improvements in accounts payable and accrued expenses | $ | 1,371 | $ | 2,153 | $ | 4,812 | ||||||
Issuance of general partnership interests through partnership loans | $ | 91,693 | $ | — | $ | — | ||||||
|
|
|
|
|
| |||||||
The accompanying notes are an integral part of these Consolidated Financial Statements.
PART II
|
|
THE JONES FINANCIAL COMPANIES, L.L.L.P.
NOTES TO CONSOLIDATED FINANCIAL STATEMENTS
(Dollars in thousands,millions, except per unit information)information and the number of financial advisors)
NOTE 1 – SUMMARY OF SIGNIFICANT ACCOUNTING POLICIES
The Partnership’s Business and Basis of Accounting.The accompanying Consolidated Financial Statements include the accounts of The Jones Financial Companies, L.L.L.P. and all wholly-owned subsidiaries (collectively, the “Partnership”). All material intercompany balances and transactions have been eliminated in consolidation. Non-controlling minority interests are accounted for under the equity method. The results of the Partnership’s subsidiarysubsidiaries in Canada are included in the Partnership’s Consolidated Financial Statements for the twelve month periods ended November 30, 2011, 20102014, 2013 and 20092012 in the Partnership’s Consolidated Financial Statements because of the timing of the Partnership’s financial reporting process.
The Partnership’s principal operating subsidiary, Edward D. Jones & Co., L.P. (“Edward Jones”), is compriseda registered broker-dealer in the United States (“U.S.”), and one of twoEdward Jones’ subsidiaries is a registered broker-dealersbroker-dealer in Canada. Through these entities, the Partnership serves primarily serving individual investors in the United States of America (“U.S.”) and Canada. Edward Jones primarily derives its revenues from the retail brokerage business through the distribution of mutual fund shares, fees related to assets held by and account services provided to its clients, the sale of listed and unlisted securities and insurance products, investment banking, and principal transactions, as a distributor of mutual fund shares and through revenues related to assets held by and account services provided to its clients.transactions. The Partnership conducts business inthroughout the U.S. and Canada with its clients, various brokers, dealers, clearing organizations, depositories and banks. For financial information related to the Partnership’s two operating segments for the years ended December 31, 2011, 20102014, 2013 and 2009,2012, see Note 1715 to the Consolidated Financial Statements. Trust services are offered to Edward Jones’ U.S. clients through Edward Jones Trust Company (“EJTC”), a wholly-owned subsidiary of the Partnership.
On November 12, 2009, Edward Jones completed the sale of the issued and outstanding shares of its United Kingdom (“U.K.”) subsidiary, Edward Jones Limited (“EDJ Limited”). EDJ Limited is presented as a discontinued operation for all periods prior to the completion of the sale. All other information contained in these Consolidated Financial Statements is presented on a continuing operations basis unless otherwise noted. See Note 2 to the Consolidated Financial Statements for further details on this sale.
The Consolidated Financial Statements have been prepared on the accrual basis of accounting in conformity with accounting principles generally accepted in the U.S. (“GAAP”) which require the use of certain estimates by management in determining the Partnership’s assets, liabilities, revenues and expenses. Actual results could differ from these estimates.
Partnership Agreement.Under the terms of the EighteenthPartnership’s Nineteenth Amended and Restated Partnership Agreement of Registered Limited Liability Limited Partnership, dated June 6, 2014, as amended (the “Partnership Agreement”), a partner’s capital willis required to be redeemed by the Partnership in the event of the partner’s death resignation or termination.withdrawal from the Partnership, subject to compliance with ongoing regulatory capital requirements. In the event of a partner’s death, the Partnership must generally redeemredeems the partner’s capital within six months. LimitedThe Partnership has restrictions in place which govern the withdrawal of capital. Under the terms of the Partnership Agreement, limited partners withdrawing from the Partnership dueare to termination or resignation arebe repaid their capital in three equal annual installments beginning the monthno earlier than 90 days after their resignation or termination.withdrawal notice is received by the Managing Partner. The capital of general partners resigning or terminatingwithdrawing from the Partnership is usually converted to subordinated limited partnership capital.capital or, at the discretion of the Managing Partner, redeemed by the Partnership. Subordinated limited partners are repaid their capital in six equal annual installments beginning the monthno earlier than 90 days after their request for withdrawal of contributed capital.capital is received by the Managing Partner. The Partnership’s Managing Partner has discretion to waive or modify these withdrawal restrictions.restrictions and to accelerate the return of capital. All current and future partnership capital is subordinate to all current and future liabilities of the Partnership. The Partnership Agreement includes additional terms.
67
PART II
| Item 8. Financial Statements and Supplementary Data, continued |
Transaction Risk.Revenue Recognition. The Partnership’s securities activities involve execution, settlement and financingDue to the timing of various securities transactions for clients. The Partnership may be exposed to riskreceipt of loss in the event clients, other brokers and dealers, banks, depositories or clearing organizations are unable to fulfill contractual obligations. For transactions in which it extends credit to clients,information, the Partnership seeksmust use estimates in recording the accruals related to controlcertain asset-based fees. These accruals are based on historical trends and are adjusted to reflect market conditions for the risks associated with these activities by requiring clients to maintain margin collateral in compliance with various regulatory and internal guidelines. Cash balances held at various major U.S. financial institutions, which typically exceed Federal Deposit Insurance Corporation insurance coverage limits, subject the Partnership to a concentration of credit risk. Additionally, the Partnership’s Canadian broker-dealer may also have cash deposits in excess of the applicable insured amounts. The Partnership regularly monitors the credit ratings of these financial institutions in order to mitigate the credit risk that exists with the deposits in excess of insured amounts.
Revenue Recognition.period covered. The Partnership’s commissions, principal transactions and investment banking revenues are recorded on a trade date basis. All otherClients’ securities transactions are recorded on the date they settle. Other forms of revenue are recorded on an accrual basis. The Partnership classifies its revenue into the following categories:
Asset-based fee revenue is derived from fees determined by the underlying value of client assets and includes advisory programs, service fees and revenue sharing. Most asset-based fee revenue is generated from fees for investment advisory services within the Partnership’s advisory programs, including in the U.S., Edward Jones Advisory Solutions® (“Advisory Solutions”) and Edward Jones Managed Account Program® (“MAP”) and in Canada, MAP, Edward Jones Portfolio Program® and Edward Jones Guided Portfolios™. The Partnership also earns asset-based fee revenue through service fees received under agreements with mutual fund and insurance companies, including revenue related to the Partnership’s ownership interest in Passport Research, Ltd. (“Passport Research”), the investment adviser to the two money market funds made available to Edward Jones clients. In addition, the Partnership earns revenue sharing from certain mutual fund and insurance companies. In most cases, this is additional compensation paid by investment advisers, insurance companies or distributors based on a percentage of average assets held by the Partnership’s clients.
Account and activity fee revenue includes fees received from mutual fund companies for shareholder accounting services performed by the Partnership and retirement account fees primarily consisting of self-directed individual retirement account custodian account fees. This revenue category also includes other activity-based fee revenue from clients, mutual fund companies and insurance companies.
Commissions revenue consists of charges to clients for the purchase or sale of listed and unlisted securities, insurance products and mutual fund shares.shares, equity and debt securities, and insurance products.
Principal transactions revenue is the result of the Partnership’s participation in market-making activities in municipal obligations, over-the-counter corporate securities, municipal obligations, government obligations, unit investment trusts, mortgage-backed securities and certificates of deposit.
Investment banking revenue is derived from the Partnership’s underwritingdistribution of unit investment trusts, corporate securities and municipal obligations, and distribution of U.S. government obligations and unit investment trusts on behalf of issuers.
Asset-based fee revenue is derived from fees determined by the underlying value of client assets. Most asset-based fee revenue is generated from fees for investment advisory services within the Partnership’s advisory programs, including Edward Jones Advisory Solutions (“Advisory Solutions”), Edward Jones Managed Account Program (“MAP”) and, in Canada, Edward Jones Portfolio Program. The Partnership expanded its Advisory Solutions program in the second quarter of 2011 to include Unified Managed Account (“UMA”) models. The UMA models offer an expanded level of portfolio management expertise for eligible accounts.
The Partnership also earns asset-based fee revenue through service fees and other revenues received under agreements with mutual fund and insurance companies based on the underlying value of the Partnership’s clients’ assets invested in those companies’ products, including revenue related to the Partnership’s ownership interest in Passport Research Ltd., the advisor to the Edward Jones Money Market Funds.
Account and activity fee revenue includes fees received from mutual fund companies for sub-transfer agent accounting services performed by the Partnership and retirement account fees primarily consisting of self-directed IRA custodian account fees. This revenue category also includes other activity-based fee revenue from clients, mutual fund companies and insurance companies.
PART II
|
|
sponsored enterprise obligations.
Interest and dividenddividends revenue is earned on client margin (loan) account balances, cash and cash equivalents, cash and investments segregated under federal regulations, securities purchased under agreements to resell interest onand partnership loans for general partnership interests, inventory securitiesloans.
68
PART II
Item 8. Financial Statements and investment securities.Supplementary Data, continued
The Partnership derived from one mutual fund vendor 19%, 21% and 25% of its total revenue for
For the years ended December 31, 2011, 20102014, 2013 and 2009, respectively. All2012, the Partnership earned 20%, 19% and 19%, respectively, of theits total revenue from one mutual fund company. The revenue generated from this vendor relatescompany related to business conducted with the Partnership’s U.S. segment. Significant reductions in the revenues from this mutual fund sourcerevenue due to regulatory reform or other changes to the Partnership’s relationship with this mutual fund vendorcompany could have a material impact on the Partnership’s results of operations.
Foreign Exchange.Assets and liabilities denominated in a foreign currency are translated at the exchange rate at the end of the period. Revenue and expenses denominated in a foreign currency are translated using the average exchange rate for each period. Foreign exchange gains and losses are included in other revenue on the Consolidated Statements of Income.
Fair Value.Substantially all of the Partnership’s financial assets and financial liabilities covered under Financial Accounting Standards Board (“FASB”) Accounting Standards Codification (“ASC”) No. 820,Fair Value Measurement and Disclosure(“ASC 820”), are carried at fair value or contracted amounts which approximate fair value. Upon the adoption of fair value guidance set forth in FASB ASC No. 825,Financial Instruments, the Partnership elected not to take the fair value option on all debt and liabilities subordinated to the claims of general creditors.
Fair value of a financial instrument is defined as the price that would be received to sell an asset or paid to transfer a liability in an orderly transaction between market participants at the measurement date, also known as the “exit price”.price.” Financial assets are marked to bid prices and financial liabilities are marked to offer prices. The Partnership’s financial assets and financial liabilities recorded at fair value in the Consolidated Statements of Financial Condition are categorized based upon the level of judgment associated with the inputs used to measure their fair value. Hierarchical levels, defined by ASC 820 with the related amount of subjectivity associated with the inputs to value these assets and liabilities at fair value for each level, are as follows:
Level I – Inputs are unadjusted, quoted prices in active markets for identical assets or liabilities at the measurement date.
The types of assets and liabilities categorized as Level I generally are government and agency securities, equities listed in active markets, unit investment trusts andU.S. treasuries, investments in publicly traded mutual funds with quoted market prices.prices, equities listed in active markets, and government and agency obligations.
Level II – Inputs (other than quoted prices included in Level I) are either directly or indirectly observable for the asset or liability through correlation with related market data at the measurement date and for the duration of the instrument’s anticipated life. The Partnership uses the market approach valuation technique (incorporates priceswhich incorporates third-party pricing services and other relevant observable information (such as market interest rates, yield curves, prepayment risk and credit risk generated by market transactions involving identical or comparable assets or liabilities) in valuing these types of investments. When third-party pricing services are used, the methods and assumptions used are reviewed by the Partnership.
The types of assets and liabilities categorized as Level II generally are certificates of deposit, state and municipal bonds, mortgage and asset backed securitiesobligations and corporate debt.bonds and notes.
Level III – Inputs are both unobservable and significant to the overall fair value measurement. These inputs reflect management’s best estimate of what market participants would use in pricing the asset or liability at the measurement date. Consideration is given to the risk inherent in the valuation technique and the risk inherent in the inputs to the model.
69
PART II
| Item 8. Financial Statements and Supplementary Data, continued |
The Partnership did not have any assets or liabilities categorized as Level III during the periods ended December 31, 20112014 and 2010.2013. In addition, there were no transfers into or out of Levels I, II or III during these periods.
The Partnership estimates the fair value of long-term debt and the portion of liabilities subordinated to claims of general creditors maturing beyond one year, based on the present value of future principal and interest payments associated with the debt, using current interest rates obtained from external lenders that are extended to organizations for debt of a similar nature as that of the Partnership.Partnership (Level II input).
Cash and Cash Equivalents. The Partnership considers all highly liquid investments with original maturities of three months or less to be cash equivalents.
Cash and Investments Segregated under Federal Regulations. Cash, of $3,513,902investments and $2,708,256 and investments of $958,624 and $905,907 as of December 31, 2011 and 2010, respectively, werethe related interest receivable are segregated in special reserve bank accounts for the benefit of U.S. clients under Rule 15c3-3 of the Securities and Exchange Commission (“SEC”).
Securities Purchased Under Agreements to Resell.The Partnership participates in short-term resale agreements collateralized by government and agency securities. These transactions are reported as collateralized financing. The fair value of the underlying collateral as determined daily, plus accrued interest, must equal or exceed 102% of the carrying amount of the transaction.transaction in U.S. agreements and must equal or exceed 100% in Canada agreements. It is the Partnership’s policy to have such underlying resale agreement collateral delivered to the Partnership or deposited in its accounts at its custodian banks. Resale agreements are carried at the amount at which the securities will be subsequently resold, as specified in the agreements. The Partnership considers these financing receivables to be of good credit quality and, in response,as a result, has not recorded a related allowance for credit loss due to the fact that these securities are fully collateralized and, as a result,loss. In addition, the Partnership considers risk related to these securities to be minimal.
Securities Borrowing and Lending Activities. Securities borrowed andminimal due to the fact that these securities loaned transactions are reported as collateralized financings. Securities borrowed transactions require the Partnership to deposit cash or other collateral with the lender. In securities loaned transactions, the Partnership receives collateral in the form of cash or other collateral. Collateral for both securities borrowed and securities loaned is based on 102% of thefully collateralized. The fair value of the underlying securities loaned. The Partnership monitors the fair valuecollateral related to these agreements was $644 and $1,044 as of securities borrowedDecember 31, 2014 and loaned on a daily basis, with additional collateral obtained2013, respectively, and was not repledged or refunded as necessary. Securities borrowed and securities loaned are included in receivable from and payable to brokers, dealers and clearing organizations in the Consolidated Statements of Financial Condition.sold.
Collateral. The Partnership reports as assets collateral it has pledged in secured borrowings and other arrangements when the secured party cannot sell or repledge the assets or the Partnership can substitute collateral or otherwise redeem it on short notice. The Partnership does not report collateral it has received in secured lending and other arrangements as an asset when the debtor has the right to redeem or substitute the collateral on short notice.
PART II
|
|
Securities Owned and Sold, Not Yet Purchased.Securities owned and sold, not yet purchased, including inventory securities and investment securities, are recorded at fair value. Fair value which is determined by using quoted market or dealer prices. The Partnership records the related unrealized gains and losses for inventory securities and certain investment securities in principal transactions revenue within trade revenue.in the Consolidated Statements of Income. The unrealized gains and losses for investment securities related to the nonqualified deferred compensation plan are recorded in other revenue in the Consolidated Statements of Income (see below).
70
PART II
Item 8. Financial Statements and Supplementary Data, continued
Equipment, Property and Improvements. Equipment, including furniture and fixtures, is recorded at cost and depreciated using straight-line and accelerated methods over estimated useful lives of three to twelveseven years. Buildings are depreciated using the straight-line method over their useful lives, which are estimated at thirty years. Leasehold improvements are amortized based on the term of the lease or the economic useful life of the improvement, whichever is less. When assets are retired or otherwise disposed of, the cost and related accumulated depreciation or amortization is removed from the respective category and any related gain or loss is recorded as other revenue in the Consolidated Statements of Income. The cost of maintenance and repairs is charged against income as incurred, whereas significant enhancements are capitalized. Long-lived assets are reviewed for impairment whenever events or changes in circumstances indicate that the book value of the asset may not be fully recoverable. If impairment is indicated, the asset value is written down to its fair value.
Non-qualifiedNonqualified Deferred IncomeCompensation Plan. The Partnership has a non-qualifiednonqualified deferred compensation plan for certain financial advisors. The Partnership has recorded a liability for the future payments due to financial advisors participating in the non-qualified deferred compensation plan. As the future amounts due to financial advisors change in accordance with plan requirements, the Partnership records the change in future amounts owed to financial advisors as an increase or decrease in accrued compensation in the Consolidated Statements of Financial Condition and employeecompensation and benefits expense.expense in the Consolidated Statements of Income. The Partnership has chosen to hedge this future liability by purchasing investment securities in an amount similar to the future liability expected to be due in accordance with the plan. As the fair value of theThese securities are included in investment securities fluctuates,in the Consolidated Statements of Financial Condition and the unrealized gains orand losses are reflectedrecorded in other revenue.revenue in the Consolidated Statements of Income. Each period, the net impact of the change in future amounts owed to financial advisors in the non-qualifiednonqualified deferred compensation plan and the change in investment securities are approximately the same, resulting in minimal net impact in the Consolidated Financial Statements.
Retirement Transition Plan. The Partnership, in certain circumstances, offers individually tailored retirement transition plans to retiring financial advisors. Each retirement transition plan compensates a retiring financial advisor for successfully providing client transition services in accordance with a retirement and transition employment agreement. Generally, the retirement and transition employment agreement is for five years. During the first two years the retiring financial advisor remains an employee and provides transition services, which include, but are not limited to, the successful transition of client accounts and assets to successor financial advisors, as well as mentoring and providing training and support to successor financial advisors. The financial advisor retires at the end of year two and is subject to a non-compete agreement for three years. Most retiring financial advisors are paid ratably over four years. Compensation expense is recognized ratably over the two-year transition period which aligns with the service period of the agreement. Successor financial advisors receive reduced commissions on the Partnership’s financial results.transitioned assets.
Lease Accounting.The Partnership enters into lease agreements for certain home office facilities as well as branch office locations. The associated lease expense is recognized on a straight-line basis over the minimum lease terms.
Income Taxes. IncomeGenerally, income taxes have not been provided for in the Consolidated Financial Statements sincedue to the Partnership is organized as a partnership andtax structure where each partner is liable for itshis or her own tax payments. Any subsidiaries’For the jurisdictions in which the Partnership is liable for payments, the income tax provisions are insignificantimmaterial (see Note 13)11).
71
PART II
Item 8. Financial Statements and Supplementary Data, continued
Reclassification. Certain prior year balances have been reclassified to conform to the current year presentation, which includes discontinued operations.presentation.
Partnership Capital Subject to Mandatory Redemption.FASB ASC No. 480,Distinguishing Liabilities from Equity (“ASC 480”), established standards for classifying and measuring certain financial instruments with characteristics of both liabilities and equity. Under the provisions of ASC 480, the obligation to redeem a partner’s capital in the event of a partner’s death is one of the criteria requiring capital to be classified as a liability.
PART II
|
|
Since the Partnership Agreement obligates the Partnership to redeem a partner’s capital after a partner’s death, ASC 480 requires all of the Partnership’s equity capital to be classified as a liability. IncomeIn accordance with ASC 480, income allocable to limited, subordinated limited and general partners prior to the issuance of ASC 480 was classified in the Partnership’s Consolidated Statement of Income as net income. In accordance with ASC 480, these allocations are nowis classified as a reduction of income before allocations to partners, which results in a presentation of $0 net income for the years ended December 31, 2011, 20102014, 2013 and 2009.2012. The financial statement presentations required to comply with ASC 480 do not alter the Partnership’s treatment of income, income allocations or capital for any other purposes.
Net income, as defined in the Partnership Agreement, is equivalent to income before allocations to partners on the Consolidated Statements of Income. Such income, if any, for each calendar year is allocated to the Partnership’s three classes of capital in accordance with the formulas prescribed in the Partnership Agreement. Income allocations are based upon partner capital contributions including capital contributions financed with loans from the Partnership. First, limited partners are allocated net income (as defined in the Partnership Agreement) in accordance with the prescribed formula for their share of net income. Limited partners do not share in the net loss in any year in which there is a net loss and the Partnership is not dissolved or liquidated. Thereafter, subordinated limited partners and general partners are allocated any remaining net income or net loss based on formulas as defined in the Partnership Agreement.
The limited partnership capital subject to mandatory redemption is held by current and former associates and general partners of the Partnership. Limited partners participate in the Partnership’s profits and are paid a minimum 7.5% annual return on the face amount of their capital, in accordance with the Partnership Agreement. The minimum 7.5% annual return was $48, $48 and $49 for the years ended December 31, 2014, 2013 and 2012, respectively. These amounts are included as a component of interest expense in the Consolidated Statements of Income.
The subordinated limited partnership capital subject to mandatory redemption is held by current and former general partners of the Partnership. Subordinated limited partners receive a percentage of the Partnership’s net income determined in accordance with the Partnership Agreement. The subordinated limited partnership capital subject to mandatory redemption is subordinated to the limited partnership capital.
The general partnership capital subject to mandatory redemption is held by current general partners of the Partnership. General partners receive a percentage of the Partnership’s net income determined in accordance with the Partnership Agreement. The general partnership capital subject to mandatory redemption is subordinated to the limited partnership capital and the subordinated limited partnership capital.
72
PART II
Item 8. Financial Statements and Supplementary Data, continued
Recently Issued Accounting Standards.In May 2011,2014, the FASB and the International Accounting Standards Board (“IASB”) jointly issued Accounting Standards Update (“ASU”) No. 2011-04,2014-09,Fair Value MeasurementRevenue from Contracts with Customers (“ASU 2014-09”), a comprehensive new revenue recognition standard that will supersede nearly all existing revenue recognition guidance. The objective of ASU 2014-09 is that a company will recognize revenue when it transfers promised goods or services to customers in an amount that reflects the consideration to which the entity expects to be entitled in exchange for those goods or services. ASU 2014-09 will be effective for the first quarter of 2017. An entity can elect to adopt ASU 2014-09 using one of two methods, either full retrospective adoption to each prior reporting period, or recognize the cumulative effect of adoption at the date of initial application. The Partnership is in the process of evaluating the new standard and does not know the effect, if any, ASU 2014-09 will have on the Consolidated Financial Statements or which adoption method will be used.
In February 2015, the FASB issued ASU No. 2015-02,Consolidation (Topic 820)810) – Amendments to Achieve Common Fair Value Measurement and Disclosure Requirements in U.S. GAAP and IFRSsthe Consolidation Analysis (“ASU 2011-04”2015-02”), to establish common requirements for measuring fair value and for disclosing information about fair value measurements in accordance with U.S. GAAP and International Financial Reporting Standards (“IFRS”). The amendments in this update arewhich will be effective for interim and annual periods beginning after December 15, 2011.the first quarter of 2016. ASU 2015-02 provides updated guidance on consolidation of variable interest entities. The Partnership is in the process of evaluating the new standard and does not know what effect, if any, ASU 2015-02 will adopt ASU 2011-04 as of the effective date. Adoption is not expected to have a material impact on the Partnership’s Consolidated Financial Statements.
PART II
|
|
NOTE 2 – DISCONTINUED OPERATIONS
As noted in the Partnership’s Annual Report on Form 10-K for the year ended December 31, 2009, Edward Jones completed the sale of all of the issued and outstanding shares of its U.K. subsidiary, EDJ Limited, to Towry Law Finance Company Limited (“Towry”) on November 12, 2009, pursuant to a Share Purchase Agreement dated October 22, 2009. In connection with the sale, Towry acquired all of the EDJ Limited client accounts as well as its financial advisors, branch office administrators and home office employees.
The components of the loss from discontinued operations relating to EDJ Limited for the year ended December 31, 2009 is as follows:
| 2009 | ||||
Trade revenue | $ | 35,421 | ||
Fee revenue | 7,406 | |||
Interest and dividends | 716 | |||
Other | (1,081 | ) | ||
|
| |||
Total revenue | 42,462 | |||
Interest expense | (32 | ) | ||
|
| |||
Net revenue | 42,430 | |||
Operating expenses | (83,347 | ) | ||
Loss on sale of subsidiary | (70,000 | ) | ||
Foreign currency translation gain | 6,586 | |||
|
| |||
Loss from discontinued operations | $ | (104,331 | ) | |
|
| |||
NOTE 32 – RECEIVABLE FROM AND PAYABLE TO CLIENTS
Receivable from and payable to clients includeis primarily composed of margin balances and amounts due on cash transactions.loan balances. The value of securities owned by clients and held as collateral for these receivables is not reflected in the Consolidated Financial Statements. Collateral held as of December 31, 2014 and 2013 was $3,595 and $2,941, respectively, and was not repledged or sold. The Partnership considers these financing receivables to be of good credit quality due to the fact that these receivables are primarily collateralized by the related client investments and, as a result, the Partnership considers risk related to these receivables to be minimal. Payable to clients is composed of cash amounts held by the Partnership due to clients. Substantially all amounts payable to clients are subject to withdrawal upon client request. The Partnership pays interest on certainthe vast majority of credit balances in client accounts. The Partnership considers these financing receivables to be of good credit quality due to the fact that these securities are fully collateralized by the related client investments and, as a result, the Partnership considers risk related to these securities to be minimal.
PART II
|
|
NOTE 4 – RECEIVABLE FROM AND PAYABLE TO BROKERS, DEALERS AND CLEARING ORGANIZATIONS
The components of receivable from and payable to brokers, dealers and clearing organizations as of December 31, 2011 and 2010 are as follows:
| 2011 | 2010 | |||||||
Receivable from retirement account trustee | $ | 148,605 | $ | 147,186 | ||||
Receivable from money market funds | 58,598 | 44,019 | ||||||
Receivable from clearing organizations | 32,111 | 30,029 | ||||||
Securities failed to deliver | 4,757 | 13,609 | ||||||
Other | 8,339 | 4,677 | ||||||
|
|
|
| |||||
Total receivable from brokers, dealers and clearing organizations | $ | 252,410 | $ | 239,520 | ||||
|
|
|
| |||||
Payable to clearing organizations and issuers | $ | 37,654 | $ | 24,592 | ||||
Payable to brokers and dealers | 28,315 | 25,707 | ||||||
Securities failed to receive | 14,218 | 8,559 | ||||||
Cash or collateral received for securities loaned | 60 | 375 | ||||||
|
|
|
| |||||
Total payable to brokers, dealers and clearing organizations | $ | 80,247 | $ | 59,233 | ||||
|
|
|
| |||||
The receivable from retirement account trustee represents deposits held with a trustee for the Partnership’s Canadian client’s retirement account funds as required by Canadian regulations. Receivable from and payable to clearing organizations represent balances and deposits with clearing organizations. Securities failed to deliver/receive represent the contract value of securities which have not been delivered or received by settlement date.
NOTE 53 – RECEIVABLE FROM MUTUAL FUNDS, INSURANCE COMPANIES, AND OTHER
Receivable from mutual funds, insurance companies and other is primarily composed of amounts due to the Partnership for asset-based fees from mutual fund and insurance companies of $200 and fees for sub-transfer agentshareholder accounting services from the mutual fund vendors and insurance companies.companies of $48. The balance also consists of a $189 retirement account trustee receivable for deposits held with a trustee as required by Canadian regulations for the Partnership’s clients’ retirement account funds held in Canada.
73
PART II
| Item 8. Financial Statements and Supplementary Data, continued |
NOTE 64 – FAIR VALUE
The following table sets forthtables show the Partnership’s financial instruments measured at fair value:
| Financial Assets at Fair Value as of | Financial Assets at Fair Value as of December 31, 2014 | |||||||||||||||||||||||||||||||
| December 31, 2011 | Level I | Level II | Level III | Total | ||||||||||||||||||||||||||||
| Level I | Level II | Level III | Total |
| ||||||||||||||||||||||||||||
Investments segregated under federal regulations | ||||||||||||||||||||||||||||||||
Cash equivalents: | ||||||||||||||||||||||||||||||||
Certificate of deposit | $ | - | $ | 100 | $ | - | $ | 100 | ||||||||||||||||||||||||
|
| |||||||||||||||||||||||||||||||
Investments segregated under federal regulations: | Investments segregated under federal regulations: |
| ||||||||||||||||||||||||||||||
U.S. treasuries | $ | 708,624 | $ | — | $ | — | $ | 708,624 | $ | 1,109 | $ | - | $ | - | $ | 1,109 | ||||||||||||||||
Certificates of deposit | — | 250,000 | — | 250,000 | - | 225 | - | 225 | ||||||||||||||||||||||||
|
|
|
|
|
| |||||||||||||||||||||||||||
Total investments segregated under federal regulations | $ | 708,624 | $ | 250,000 | $ | — | $ | 958,624 | $ | 1,109 | $ | 225 | $ | - | $ | 1,334 | ||||||||||||||||
|
|
|
|
|
| |||||||||||||||||||||||||||
Securities owned: | ||||||||||||||||||||||||||||||||
Inventory securities: | ||||||||||||||||||||||||||||||||
State and municipal obligations | $ | — | $ | 41,484 | $ | — | $ | 41,484 | ||||||||||||||||||||||||
Equities | 20,285 | — | — | 20,285 | ||||||||||||||||||||||||||||
Corporate bonds and notes | — | 6,647 | — | 6,647 | ||||||||||||||||||||||||||||
Certificates of deposit | — | 5,390 | — | 5,390 | ||||||||||||||||||||||||||||
Government and agency obligations | 398 | — | — | 398 | ||||||||||||||||||||||||||||
Collateralized mortgage obligations | — | 249 | — | 249 | ||||||||||||||||||||||||||||
Unit investment trusts | 213 | — | — | 213 | ||||||||||||||||||||||||||||
|
|
|
| |||||||||||||||||||||||||||||
Total inventory securities | $ | 20,896 | $ | 53,770 | $ | — | $ | 74,666 | ||||||||||||||||||||||||
|
|
|
| |||||||||||||||||||||||||||||
Investment securities: | ||||||||||||||||||||||||||||||||
Mutual funds | $ | 77,266 | $ | — | $ | — | $ | 77,266 | $ | 136 | $ | - | $ | - | $ | 136 | ||||||||||||||||
Government and agency obligations | 14,507 | — | — | 14,507 | 19 | - | - | 19 | ||||||||||||||||||||||||
Equities | 6,932 | — | — | 6,932 | 5 | - | - | 5 | ||||||||||||||||||||||||
Municipal bonds | — | 4,902 | — | 4,902 | ||||||||||||||||||||||||||||
Corporate bonds and notes | — | 653 | — | 653 | - | 1 | - | 1 | ||||||||||||||||||||||||
Collateralized mortgage obligations | — | 242 | — | 242 | ||||||||||||||||||||||||||||
|
|
|
|
|
| |||||||||||||||||||||||||||
Total investment securities | $ | 98,705 | $ | 5,797 | $ | — | $ | 104,502 | $ | 160 | $ | 1 | $ | - | $ | 161 | ||||||||||||||||
|
| |||||||||||||||||||||||||||||||
Inventory securities: | ||||||||||||||||||||||||||||||||
State and municipal obligations | $ | - | $ | 40 | $ | - | $ | 40 | ||||||||||||||||||||||||
Equities | 17 | - | - | 17 | ||||||||||||||||||||||||||||
Mutual funds | 5 | - | - | 5 | ||||||||||||||||||||||||||||
Certificates of deposit | - | 3 | - | 3 | ||||||||||||||||||||||||||||
Corporate bonds and notes | - | 2 | - | 2 | ||||||||||||||||||||||||||||
Other | 1 | 1 | - | 2 | ||||||||||||||||||||||||||||
|
| |||||||||||||||||||||||||||||||
Total inventory securities | $ | 23 | $ | 46 | $ | - | $ | 69 | ||||||||||||||||||||||||
|
|
|
|
|
| |||||||||||||||||||||||||||
| Financial Liabilities at Fair Value as of | Financial Liabilities at Fair Value as of December 31, 2014 | |||||||||||||||||||||||||||||||
| December 31, 2011 | Level I | Level II | Level III | Total | ||||||||||||||||||||||||||||
| Level I | Level II | Level III | Total |
| ||||||||||||||||||||||||||||
Securities sold, not yet purchased: | ||||||||||||||||||||||||||||||||
Securities sold, not yet purchased(1): | ||||||||||||||||||||||||||||||||
Equities | $ | 2 | $ | - | $ | - | $ | 2 | ||||||||||||||||||||||||
Corporate bonds and notes | $ | — | $ | 3,336 | $ | — | $ | 3,336 | - | 1 | - | 1 | ||||||||||||||||||||
Equities | 3,210 | — | — | 3,210 | ||||||||||||||||||||||||||||
State and municipal obligations | — | 303 | — | 303 | ||||||||||||||||||||||||||||
Certificates of deposit | — | 277 | — | 277 | ||||||||||||||||||||||||||||
Government and agency obligations | 260 | — | — | 260 | ||||||||||||||||||||||||||||
Unit investment trusts | 129 | — | — | 129 | ||||||||||||||||||||||||||||
Collateralized mortgage obligations | — | 71 | — | 71 | ||||||||||||||||||||||||||||
|
|
|
|
|
| |||||||||||||||||||||||||||
Total inventory securities | $ | 3,599 | $ | 3,987 | $ | — | $ | 7,586 | ||||||||||||||||||||||||
Total securities sold, not yet purchased | $ | 2 | $ | 1 | $ | - | $ | 3 | ||||||||||||||||||||||||
|
|
|
|
|
| |||||||||||||||||||||||||||
(1) Securities sold, not yet purchased are included within accounts payable, accrued expenses and other on the Consolidated Statements of Financial Condition.
74
PART II
| Item 8. Financial Statements and Supplementary Data, continued |
| Financial Assets at Fair Value as of | Financial Assets at Fair Value as of December 31, 2013 | |||||||||||||||||||||||||||||||
| December 31, 2010 | Level I | Level II | Level III | Total | ||||||||||||||||||||||||||||
| Level I | Level II | Level III | Total |
| ||||||||||||||||||||||||||||
Investments segregated under federal regulations | ||||||||||||||||||||||||||||||||
Investments segregated under federal regulations: | ||||||||||||||||||||||||||||||||
U.S. treasuries | $ | 705,907 | $ | — | $ | — | $ | 705,907 | $ | 1,154 | $ | - | $ | - | $ | 1,154 | ||||||||||||||||
Certificates of deposit | — | 200,000 | — | 200,000 | - | 225 | - | 225 | ||||||||||||||||||||||||
|
|
|
|
|
| |||||||||||||||||||||||||||
Total investments segregated under federal regulations | $ | 705,907 | $ | 200,000 | $ | — | $ | 905,907 | $ | 1,154 | $ | 225 | $ | - | $ | 1,379 | ||||||||||||||||
|
|
|
|
|
| |||||||||||||||||||||||||||
Securities owned: | ||||||||||||||||||||||||||||||||
Investment securities: | ||||||||||||||||||||||||||||||||
Mutual funds | $ | 116 | $ | - | $ | - | $ | 116 | ||||||||||||||||||||||||
Government and agency obligations | 19 | - | - | 19 | ||||||||||||||||||||||||||||
Equities | 5 | - | - | 5 | ||||||||||||||||||||||||||||
Other | - | 1 | - | 1 | ||||||||||||||||||||||||||||
|
| |||||||||||||||||||||||||||||||
Total investment securities | $ | 140 | $ | 1 | $ | - | $ | 141 | ||||||||||||||||||||||||
|
| |||||||||||||||||||||||||||||||
Inventory securities: | ||||||||||||||||||||||||||||||||
State and municipal obligations | $ | — | $ | 55,639 | $ | — | $ | 55,639 | $ | - | $ | 67 | $ | - | $ | 67 | ||||||||||||||||
Equities | 15,980 | — | — | 15,980 | 27 | - | - | 27 | ||||||||||||||||||||||||
Corporate bonds and notes | — | 6,441 | — | 6,441 | - | 3 | - | 3 | ||||||||||||||||||||||||
Certificates of deposit | — | 1,772 | — | 1,772 | - | 2 | - | 2 | ||||||||||||||||||||||||
Collateralized mortgage obligations | — | 602 | — | 602 | ||||||||||||||||||||||||||||
Government and agency obligations | 474 | — | — | 474 | ||||||||||||||||||||||||||||
Unit investment trusts | 267 | — | — | 267 | 2 | - | - | 2 | ||||||||||||||||||||||||
Other | - | 1 | - | 1 | ||||||||||||||||||||||||||||
|
|
|
|
|
| |||||||||||||||||||||||||||
Total inventory securities | $ | 16,721 | $ | 64,454 | $ | — | $ | 81,175 | $ | 29 | $ | 73 | $ | - | $ | 102 | ||||||||||||||||
|
|
|
| |||||||||||||||||||||||||||||
Investment securities: | ||||||||||||||||||||||||||||||||
Mutual funds | $ | 73,446 | $ | — | $ | — | $ | 73,446 | ||||||||||||||||||||||||
Government and agency obligations | 15,254 | — | — | 15,254 | ||||||||||||||||||||||||||||
Municipal bonds | — | 4,711 | — | 4,711 | ||||||||||||||||||||||||||||
|
|
|
| |||||||||||||||||||||||||||||
Total investment securities | $ | 88,700 | $ | 4,711 | $ | — | $ | 93,411 | ||||||||||||||||||||||||
|
|
|
|
|
| |||||||||||||||||||||||||||
| Financial Liabilities at Fair Value as of | Financial Liabilities at Fair Value as of December 31, 2013 | |||||||||||||||||||||||||||||||
| December 31, 2010 | Level I | Level II | Level III | Total | ||||||||||||||||||||||||||||
| Level I | Level II | Level III | Total |
| ||||||||||||||||||||||||||||
Securities sold, not yet purchased: | ||||||||||||||||||||||||||||||||
Corporate bonds and notes | $ | — | $ | 3,519 | $ | — | $ | 3,519 | $ | - | $ | 2 | $ | - | $ | 2 | ||||||||||||||||
Equities | 1,927 | — | — | 1,927 | 1 | - | - | 1 | ||||||||||||||||||||||||
State and municipal obligations | — | 506 | — | 506 | ||||||||||||||||||||||||||||
Certificates of deposit | — | 323 | — | 323 | ||||||||||||||||||||||||||||
Government and agency obligations | 256 | — | — | 256 | ||||||||||||||||||||||||||||
Unit investment trusts | 99 | — | — | 99 | ||||||||||||||||||||||||||||
Collateralized mortgage obligations | — | 74 | — | 74 | ||||||||||||||||||||||||||||
Other | - | 1 | - | 1 | ||||||||||||||||||||||||||||
|
|
|
|
|
| |||||||||||||||||||||||||||
Total inventory securities | $ | 2,282 | $ | 4,422 | $ | — | $ | 6,704 | ||||||||||||||||||||||||
Total securities sold, not yet purchased | $ | 1 | $ | 3 | $ | - | $ | 4 | ||||||||||||||||||||||||
|
|
|
|
|
| |||||||||||||||||||||||||||
The Partnership attempts to reduce its exposure to market price fluctuations of its inventory securities through the sale of U.S. governmentTreasury securities and, to a limited extent, the sale of fixed income futures contracts. The amount of the securities purchased or sold will fluctuateopen futures contracts fluctuates on a daily basis due to changes in inventory securities owned, interest rates and market conditions. Futures contracts are settled daily, and any gain or loss is recognized as a component of net inventory gains, which are included in principal transactions revenue. The notional amountamounts of futures contracts outstanding were $3,500$8 and $5,000$9 at December 31, 20112014 and 2010,2013, respectively. The average notional amountamounts of futures contracts outstanding throughout the years ended December 31, 20112014 and 2010,2013 were approximately $5,400$5 and $8,900,$7, respectively. The underlying assets of these contracts are not reflected in the Partnership’s Consolidated Financial Statements; however, theStatements. The related mark-to-market adjustment losses of $10 and $43 are includedwas recognized in the Consolidated Statements of Financial Condition and included as an unrealized loss of $0.018 in accounts payable, accrued expenses and other as of December 31, 20112014, and 2010.an unrealized gain of $0.031 in receivables from mutual funds, insurance companies and other as of December 31, 2013. The total gainsgain or lossesloss related to these assets, recorded within the Consolidated Statements of Income, was a loss of $1,129,$0.858, a gain of $0.419 and a loss of $844 and a gain of $109$0.410 for the years ended December 31, 2011, 20102014, 2013 and 2009,2012, respectively. These gains and losses are reflected as a component of net inventory gains, which are included in principal transactions revenue on the Partnership’s Consolidated Statements of Income.
75
PART II
| Item 8. Financial Statements and Supplementary Data, continued |
The following table shows the estimated fair values of long-term debt and liabilities subordinated to claims of general creditors as of December 31, 20112014 and 2010:2013:
| 2011 | 2010 | 2014 | 2013 | |||||||||||||
Long-term debt | $ | 6,968 | $ | 66,732 | $ | 3 | $ | 5 | ||||||||
Liabilities subordinated to claims of general creditors | 157,762 | 210,422 | - | 50 | ||||||||||||
|
|
|
| |||||||||||||
Total | $ | 164,730 | $ | 277,154 | $ | 3 | $ | 55 | ||||||||
|
|
|
| |||||||||||||
See Notes 97 and 108 for the carrying values of long-term debt and liabilities subordinated to claims of general creditors, respectively.
NOTE 75 – EQUIPMENT, PROPERTY AND IMPROVEMENTS
Equipment,The following table shows equipment, property and improvements as of December 31, 20112014 and 2010 are summarized as follows:2013:
| 2011 | 2010 | |||||||
Land | $ | 18,742 | $ | 18,234 | ||||
Buildings and improvements | 787,714 | 758,430 | ||||||
Equipment, furniture and fixtures | 665,374 | 786,531 | ||||||
Construction in progress | — | 16,752 | ||||||
|
|
|
| |||||
Total equipment, property and improvements | 1,471,830 | 1,579,947 | ||||||
Accumulated depreciation and amortization | (892,391 | ) | (964,911 | ) | ||||
|
|
|
| |||||
Equipment, property and improvements, net | $ | 579,439 | $ | 615,036 | ||||
|
|
|
| |||||
As of December 31, 2010, the Partnership had construction in progress of $16,752. The Partnership’s 2010 construction in progress primarily related to costs of a parking garage at the St. Louis, Missouri, North Campus location which was completed and placed into service in 2011.
| 2014 | 2013 | |||||||
Land | $ | 26 | $ | 19 | ||||
Buildings and improvements | 846 | 813 | ||||||
Equipment, furniture and fixtures | 613 | 611 | ||||||
|
|
|
| |||||
Equipment, property and improvements, at cost | 1,485 | 1,443 | ||||||
Accumulated depreciation and amortization | (936) | (900) | ||||||
|
|
|
| |||||
Equipment, property and improvements, net | $ | 549 | $ | 543 | ||||
|
|
|
| |||||
Depreciation and amortization expense on equipment, property and improvements of $82, $82 and $80 is included in the Consolidated Statements of Income within the communications and data processing and occupancy and equipment categories.
The Partnership has recorded $1,371 and $2,153 of accrued costs which are included in equipment, property and improvements incategories for the Consolidated Financial Statements as ofyears ended December 31, 20112014, 2013 and 2010,2012, respectively.
PART II
|
|
The Partnership has purchased Industrial Revenue Bonds (“IRBs”) issued by St. Louis County related to certain self-constructed and purchased real and personal property. This provides for potential property tax benefits over the life of the bonds (generally 10 years). The Partnership is therefore both the bondholder and the debtor / debtor/lessee for these properties. The Partnership has exercised its right to offset the amounts invested in and the obligations for these bonds and has therefore excluded any bond related balances in the Consolidated Statements of Financial Condition. The amount issued as of December 31, 2014 and 2013 was approximately $350 and $400, respectively.
76
PART II
Item 8. Financial Statements and Supplementary Data, continued
NOTE 86 – LINES OF CREDIT
The following table shows the composition of the Partnership’s aggregate bank lines of credit in place as of December 31, 20112014 and 2010:2013:
| 2011 | 2010 | |||||||
Committed unsecured credit facilities: | ||||||||
2010 Credit Facility | $ | — | $ | 320,000 | ||||
2011 Credit Facility | 395,000 | — | ||||||
|
|
|
| |||||
Total committed | 395,000 | 320,000 | ||||||
Uncommitted facilities: | ||||||||
Secured | 595,000 | 595,000 | ||||||
Unsecured | — | 50,000 | ||||||
|
|
|
| |||||
Total uncommitted | 595,000 | 645,000 | ||||||
|
|
|
| |||||
Total bank lines of credit | $ | 990,000 | $ | 965,000 | ||||
|
|
|
| |||||
| 2014 | 2013 | |||||||
2013 Credit Facility | $ | 400 | $ | 400 | ||||
Uncommitted secured credit facilities | 365 | 415 | ||||||
|
|
|
| |||||
Total lines of credit | $ | 765 | $ | 815 | ||||
|
|
|
| |||||
In April 2010,November 2013, the Partnership entered into an agreement with eight12 banks for a $320,000five-year $400 committed unsecured revolving line of credit (“20102013 Credit Facility”), which had a final maturitywith an expiration date of April 20, 2011.November 15, 2018 and replaced a similar credit facility. The 2010 Credit Facility was put in place to provide short-term liquidity to the Partnership should the need arise.
In March 2011, the Partnership replaced the 2010 Credit Facility by entering into an agreement with 10 banks for a three year $395,000 committed unsecured revolving line of credit (“2011 Credit Facility”), which has a maturity date of March 18, 2014. The 20112013 Credit Facility is intended to provide short-term liquidity to the Partnership should the need arise. The 20112013 Credit Facility has a tiered interest rate margin based on the Partnership’s leverage ratio (ratio of total debt to total capitalization). Borrowings made with a three daythree-day advance notice will have a rate of LIBOR plus a margin ranging from 1.50%1.25% to 2.25%2.00%. Same day borrowings, which are subject to certain borrowing notification cutoff times, will have a rate consisting of a margin ranging from 0.50%0.25% to 1.25%1.00% plus the greater of the prime rate, the federal funds effective rate plus 1.00%, or the one monthone-month LIBOR rate plus 1.00%. In accordance with the 2011terms of the 2013 Credit Facility, the Partnership is required to maintain a leverage ratio of no more than 35% and minimum partnership capital, net of reserve for anticipated withdrawals, of at least $1,200,000$1,382 plus 50% of subsequent issuances of partnership capital. As of December 31, 2011,2014, the Partnership iswas in compliance with all covenants related to the 2011 Credit Facility. As of the date of this filing, the Partnership has not borrowed against the 20112013 Credit Facility.
The Partnership’s uncommitted lines of credit are subject to change at the discretion of the banks and, therefore, due to credit market conditions and the uncommitted nature of these credit facilities, it is possible that these lines of credit could decrease or not be available in the future. During the first quarter of 2011, the Partnership’s uncommitted lines of credit were reduced by $50,000 by a bank participating in the 2011 Credit Facility. This decrease reduced the aggregated uncommitted bank lines of credit from $645,000 to $595,000.
PART II
|
|
Subsequent to December 31, 2011, the Partnership’s uncommitted bank lines of credit were further reduced by $150,000 by a bank reducing its exposure in the U.S. market. As of March 30, 2012, the Partnerships aggregated uncommitted bank lines of credit amounted to $445,000. In addition, to the extent these banks provide financing to partners for capital contributions, financing available to the Partnership became aware that, effective May 25, 2012, the Partnership’s uncommitted bank lines of credit willmay be further reduced by $30,000 by another bank. This decision is unrelated to the Partnership’s creditworthiness.
reduced. Actual borrowing availability on the uncommitted secured lines of credit is based on client margin securities and partnershipfirm-owned securities, which would serve as collateral on loans. in the event the Partnership borrowed against these lines.
There were no amounts outstanding on the 2013 Credit Facility and the uncommitted lines of credit as of December 31, 20112014 and 2010.2013. In addition, the Partnership did not have any draws against these lines of creditscredit during the yearyears ended December 31, 2011. The Partnership had two overnight draws against these lines2014, 2013 and 2012, respectively, except for one nominal advance made on both the 2013 Credit Facility and the uncommitted facilities during 2014 for the purpose of credit during the year ended December 31, 2010 in the amounts of $114,000testing draw procedures.
77
PART II
Item 8. Financial Statements and $40,000.Supplementary Data, continued
NOTE 97 – LONG-TERM DEBT
Long-termThe following table shows the Partnership’s long-term debt as of December 31, 20112014 and 2010 is composed of the following:2013:
| 2011 | 2010 | |||||||
Note payable, collateralized by real estate, fixed rate of 7.28%, principal and interest due in fluctuating monthly installments, with a final installment on June 1, 2017 | $ | 6,500 | $ | 7,427 | ||||
Note payable, collateralized by office equipment, floating rate of 3.15% in excess of one-month LIBOR, principal and interest due in fixed monthly installments of $625, with a final installment on October 1, 2014 | — | 23,694 | ||||||
Note payable, collateralized by real estate, fixed rate of 3.50%, principal and interest due in fluctuating monthly installments, with a final balloon payment of $32,693 on December 22, 2012 | — | 35,276 | ||||||
|
|
|
| |||||
| $ | 6,500 | $ | 66,397 | |||||
|
|
|
| |||||
PART II
|
|
| 2014 | 2013 | |||||||
Note payable, collateralized by real estate, fixed rate of 7.28%, principal and interest due in fluctuating monthly installments, with a final installment on June 1, 2017 | $ | 3 | $ | 4 | ||||
|
|
|
| |||||
| $ | 3 | $ | 4 | |||||
|
|
|
| |||||
Scheduled annual principal payments as of December 31, 2011,2014 are as follows:
| Principal | ||||
Year | Payment | |||
2012 | $ | 997 | ||
2013 | 1,073 | |||
2014 | 1,153 | |||
2015 | 1,240 | |||
2016 | 1,333 | |||
Thereafter | 704 | |||
|
| |||
| $ | 6,500 | |||
|
| |||
2015 | 1 | |||
2016 | 1 | |||
2017 | 1 | |||
|
| |||
Total | $ | 3 | ||
|
|
In 2002, the Partnership entered into a $13,100$13 fixed rate mortgage on a home office building located on its Tempe, Arizona Campuscampus location. The loan has a balance of $6,500 as of December 31, 2011, and monthly principal and interest payments ending June 1, 2017. The note payable is collateralized by the building, which has a cost of $15,758$16 and a carrying value of $10,322$9 as of December 31, 2011.2014.
In 2009, the Partnership entered into a financing agreement with three banks to fund up to $30,000 for purchases of office equipment. The Partnership borrowed the entire $30,000 under this agreement. On November 1, 2011, the Partnership re-paid the outstanding principal and accrued interest on the note payable, collateralized by office equipment, which was prior to the final maturity date of October 1, 2014. This final payment of $18,285 terminated this note payable.
In 2009, the Partnership entered into a $36,400 fixed rate mortgage collateralized by a home office building and related parking garage located on its St. Louis, Missouri North Campus location. On June 6, 2011, the Partnership re-paid the outstanding principal and accrued interest on the 3.50% fixed rate note payable, which was prior to the final maturity date of December 22, 2012. This final payment of $34,645 terminated this note payable.
PART II
|
|
NOTE 108 – LIABILITIES SUBORDINATED TO CLAIMS OF GENERAL CREDITORS
LiabilitiesThe following table shows the Partnership’s liabilities subordinated to claims of general creditors as of December 31, 20112014 and 2010 consist of:2013:
| 2011 | 2010 | |||||||
Capital notes 7.33%, due in annual installments of $50,000 commencing on June 12, 2010 with a final installment on June 12, 2014 | $ | 150,000 | $ | 200,000 | ||||
Capital notes 7.79%, due in annual installments of $3,700 commencing on August 15, 2005, with a final installment of $3,700 on August 15, 2011 | — | 3,700 | ||||||
|
|
|
| |||||
| $ | 150,000 | $ | 203,700 | |||||
|
|
|
| |||||
Required annual principal payments, as of December 31, 2011, are as follows:
| Principal | ||||
Year | Payment | |||
2012 | $ | 50,000 | ||
2013 | 50,000 | |||
2014 | 50,000 | |||
2015 | — | |||
2016 | — | |||
Thereafter | — | |||
|
| |||
| $ | 150,000 | |||
|
| |||
| 2014 | 2013 | |||||||
Capital notes 7.33%, due in annual installments of $50 commencing on June 12, 2010 with a final installment on June 12, 2014 | $ | - | $ | 50 | ||||
|
|
|
| |||||
| $ | - | $ | 50 | |||||
|
|
|
| |||||
The capital note agreements contain restrictions which, among other things, require Edward Jones to maintain certain financial ratios, restrict encumbrance of assets and creation of indebtedness and limit the withdrawal of its partnership capital. As of December 31, 2011, Edward Jones was required, under the note agreements, to maintain minimum partnership capital subject to mandatory redemption of $400,000 and regulatory net capital of $165,117. Edward Jones was in compliance with all restrictions as of December 31, 2011 and 2010.
The liabilities subordinated to claims of general creditors are subject to cash subordination agreements approved by Financial Industry Regulatory Authority (“FINRA”) and, therefore, are included in Edward Jones’ computation of net capital under the SEC’s Uniform Net Capital Rule.
In August 2011, the Partnership paid the annual scheduled installments of $50 in 2013 and 2012 and the final installment on the 7.79% capital notesof $50 in the amount of $3,700.2014.
78
PART II
Item 8. Financial Statements and Supplementary Data, continued
|
|
NOTE 119 – PARTNERSHIP CAPITAL SUBJECT TO MANDATORY REDEMPTION
The following table shows the Partnership’s capital subject to mandatory redemption as of December 31, 20112014 and 2010:2013:
| 2011 | 2010 | |||||||
Limited partnership capital | $ | 662,226 | $ | 451,349 | ||||
Subordinated limited partnership capital | 255,414 | 221,968 | ||||||
General partnership capital issued | 927,578 | 823,408 | ||||||
|
|
|
| |||||
Partner capital contributions | 1,845,218 | 1,496,725 | ||||||
Partnership loans: | ||||||||
General partnership loans issued | (91,693 | ) | — | |||||
Repayment of general partnership loans | 4,840 | — | ||||||
|
|
|
| |||||
Partnership loans outstanding | (86,853 | ) | — | |||||
Partnership capital subject to mandatory redemption, net of reserve for anticipated withdrawals | 1,758,365 | 1,496,725 | ||||||
Reserve for anticipated withdrawals | 147,412 | 108,248 | ||||||
|
|
|
| |||||
Partnership capital subject to mandatory redemption | $ | 1,905,777 | $ | 1,604,973 | ||||
|
|
|
| |||||
FASB ASC No. 480,Distinguishing Liabilities from Equity (“ASC 480”), established standards for classifying and measuring certain financial instruments with characteristics of both liabilities and equity. Under the provisions of ASC 480, the obligation to redeem a partner’s capital in the event of a partner’s death is one of the criteria requiring capital to be classified as a liability.
Since the Partnership Agreement obligates the Partnership to redeem a partner’s capital after a partner’s death, ASC 480 requires all of the Partnership’s equity capital be classified as a liability. Income allocable to limited, subordinated limited and general partners prior to the issuance of ASC 480 was classified in the Partnership’s Consolidated Statements of Income as net income. In accordance with ASC 480, these allocations are now classified as a reduction of income before allocations to partners, which results in a presentation of $0 net income. The financial statement presentations required to comply with ASC 480 do not alter the Partnership’s treatment of income, income allocations or capital for any other purposes.
Net income, as defined in the Partnership Agreement, is equivalent to income before allocations to partners on the Consolidated Statements of Income. Such income, if any, for each calendar year is allocated to the Partnership’s three classes of capital in accordance with the formulas prescribed in the Partnership Agreement. Income allocations are based upon partner capital contributions including capital contributions financed with loans from the Partnership, as indicated in the previous table. First, limited partners are allocated net income (as defined in the Partnership Agreement) in accordance with the prescribed formula for their share of net income. Limited partners do not share in the net loss in any year in which there is a net loss and the Partnership is not dissolved or liquidated. Thereafter, subordinated limited partners and general partners are allocated any remaining net income or net loss based on formulas as defined in the Partnership Agreement.
PART II
|
|
| 2014 | 2013 | |||||||
Partnership capital outstanding: | ||||||||
Limited partnership capital | $ | 632 | $ | 640 | ||||
Subordinated limited partnership capital | 336 | 305 | ||||||
General partnership capital | 1,203 | 1,128 | ||||||
|
|
|
| |||||
Total partnership capital outstanding | 2,171 | 2,073 | ||||||
Partnership loans outstanding: | ||||||||
Partnership loans outstanding at beginning of period | (215) | (170) | ||||||
Partnership loans issued during the period | (86) | (106) | ||||||
Repayment of partnership loans during the period | 103 | 61 | ||||||
|
|
|
| |||||
Total partnership loans outstanding | (198) | (215) | ||||||
Partnership capital subject to mandatory redemption, net of reserve for anticipated withdrawals | 1,973 | 1,858 | ||||||
Reserve for anticipated withdrawals | 245 | 223 | ||||||
|
|
|
| |||||
Partnership capital subject to mandatory redemption | $ | 2,218 | $ | 2,081 | ||||
|
|
|
| |||||
The Partnership completed a limited partnership offering on January 3, 2011 with $223,600 of limited partner capital accepted. The Partnership is using the proceeds of the limited partnership offering for working capital and general corporate purposes, as needed.
Beginning in 2011, the Partnership mademakes loans available to those general partners that(other than members of the Executive Committee, which consists of the executive officers of the Partnership) who require financing for some or all of their new purchasespartnership capital contributions. It is anticipated that a majority of individualfuture general and subordinated limited partnership interests.capital contributions (other than for Executive Committee members) requiring financing will be financed through partnership loans. In limited circumstances a general partner may withdraw from the Partnership and become a subordinated limited partner while he or she still has an outstanding partnership loan. Loans made by the Partnership to general partners are generally for a period of one year but are expected to be renewed and bear interest at the prime rate, as defined in the loan documents. The Partnership recognizes interest income for the interest paid by general partners in connection with suchearned related to these loans. The outstanding amount of general partner loans financed through the Partnership is reflected as a reduction to total general partnership capital in the Partnership’s Consolidated Statements of Changes in Partnership Capital Subject to Mandatory Redemption. As of December 31, 2011,2014 and 2013, the outstanding amount of general partner loans financed through the Partnership amounted to $86,853was $198 and interest$215, respectively. Interest income from these loans, which is included in interest and dividends in the Partnership’s Consolidated Statements of Income, was $2,888 for the year ended December 31, 2011.
The limited partnership capital subject to mandatory redemption is held by current$7, $8 and former employees and general partners of the Partnership. Limited partners participate in the Partnership’s profits and are paid a minimum 7.5% annual return on the face amount of their capital, in accordance with the Partnership Agreement. The minimum 7.5% annual return totaled $50,137, $34,225 and $35,381$6 for the years ended December 31, 2011, 20102014, 2013 and 2009,2012, respectively. These amounts are included as
The Partnership filed a componentRegistration Statement on Form S-8 with the SEC on January 17, 2014, to register $350 million of interest expenselimited partnership interests (“Interests”) pursuant to the Partnership’s 2014 Employee Limited Partnership Interest Purchase Plan (“2014 LP Offering”). On January 2, 2015, the Partnership issued $292 million of Interests in connection with the 2014 LP Offering. The remaining $58 million of Interests may be issued at the discretion of the Partnership in the Partnership’s Consolidatedfuture.
79
PART II
Item 8. Financial Statements of Income.and Supplementary Data, continued
The subordinated limited partnership capital subject to mandatory redemption is held by current and former general partners of the Partnership. Each subordinated limited partner receives a varying percentage of the net income of the Partnership. The subordinated limited partner capital subject to mandatory redemption is subordinated to the limited partnership capital.
The general partnership capital subject to mandatory redemption is held by current general partners of the Partnership. Each general partner receives a varying percentage of the net income of the Partnership. The general partner capital subject to mandatory redemption is subordinated to the limited partnership capital.
NOTE 1210 – NET CAPITAL REQUIREMENTS
As a result of its activities as a broker-dealer, Edward Jones is subject to the net capital provisions of Rule 15c3-1 of the Securities Exchange Act of 1934, (“Exchange Act”)as amended, and capital compliance rules of the FINRAFinancial Industry Regulatory Authority (“FINRA”) Rule 4110. Under the alternative method permitted by the rules, Edward Jones must maintain minimum net capital equal to the greater of $250$0.25 or 2% of aggregate debit items arising from client transactions. The net capital rules also provide that Edward Jones’ partnership capital may not be withdrawn if resulting net capital would be less than minimum requirements. Additionally, certain withdrawals require the approval of the SEC and FINRA to the extent they exceed defined levels, even though such withdrawals would not cause net capital to be less than minimum requirements.
AtThe Partnership’s Canada broker-dealer is a registered securities dealer regulated by the Investment Industry Regulatory Organization of Canada (“IIROC”). Under the regulations prescribed by IIROC, the Partnership is required to maintain minimum levels of risk-adjusted capital, which are dependent on the nature of the Partnership’s assets and operations.
The following table shows the Partnership’s net capital figures for its U.S. and Canada broker-dealers as of December 31, 2011, Edward Jones’ net capital of $722,613 was 32.8% of aggregate debit items2014 and its net capital in excess of the minimum required was $678,582. Net capital after anticipated capital withdrawals, as a percentage of aggregate debit items, was 30.6%. 2013:
| 2014 | 2013 | |||||||
U.S.: | ||||||||
Net capital | $ | 999 | $ | 873 | ||||
Net capital in excess of the minimum required | $ | 948 | $ | 830 | ||||
Net capital as a percentage of aggregate debit items | 38.9% | 41.4% | ||||||
Net capital after anticipated capital withdrawals, as a percentage of aggregate debit items | 31.1% | 24.8% | ||||||
Canada: | ||||||||
Regulatory risk adjusted capital | $ | 31 | $ | 34 | ||||
Regulatory risk adjusted capital in excess of the minimum required to be held by IIROC | $ | 27 | $ | 27 | ||||
Net capital and the related capital percentages may fluctuate on a daily basis.
PART II
|
|
At December 31, 2011, the Partnership’s Canadian broker-dealer’s regulatory risk adjusted capital of $42,525 was $39,859 in excess of the capital required to be held by the Investment Industry Regulatory Organization of Canada (“IIROC”). In addition, EJTC was in compliance as of December 31, 2011, with its regulatory capital requirements in the jurisdiction in which it operates.requirements.
NOTE 1311 – INCOME TAXES
The Partnership is treated as sucha pass through entity for federal and state income tax purposes and generally does not incur income taxes. Instead, its earnings and losses are included in the income tax returns of its individualthe general and limited partners. However, the Partnership structure does include certain subsidiaries which are corporations that are subject to income tax. As of December 31, 20112014 and 2010,2013, the Partnership’s tax basis of assets and liabilities exceeds the book basis by $129,348$126 and $128,997,$103, respectively. The primary difference between financial statement basis and tax basis of assets is related to the timing in deducting depreciation expense related to equipment, property and improvements and prepaid expenses. The primary difference between financial statement basis and tax basis of liabilities is related to the deferral for tax purposes in deducting accrued expenses
80
PART II
Item 8. Financial Statements and Supplementary Data, continued
until they are paid. Since the Partnership is treated as sucha pass through entity for federal and state income tax purposes, the difference between the tax basis and the book basis of assets and liabilities will impact the future tax liabilities of the partners. The tax differences will not impact the net income of the Partnership.
ASC No. 740,Income Taxes, requires the Partnership to determine whether a tax position is greater than fifty percent likely of being realized upon settlement with the applicable taxing authority, which could result in the Partnership recording a tax liability that would reduce net partnership capital. The Partnership did not have any significant uncertain tax positions as of December 31, 20112014 and 20102013 and is not aware of any tax positions that will significantly change during the next twelve months. In addition,The Partnership and its subsidiaries are generally subject to examination by the Internal Revenue Service (“IRS”) and by various state and foreign taxing authorities in the jurisdictions in which the Partnership has analyzedand its subsidiaries conduct business. Tax years prior to 2011 are generally no longer subject to examination by the openIRS, state, local or foreign tax years ended 2008 through the current year and is not aware of significant examinations in progress.authorities.
NOTE 1412 – EMPLOYEE BENEFIT PLANS
The Partnership maintains qualified deferred compensation plansa Profit Sharing and Deferred Compensation plan covering all eligible U.S. employees and a Group Registered Retirement Savings Plan and a Deferred Profit Sharing Plan covering all eligible Canada employees. Contributions to the plans are at the discretion of the Partnership. Additionally, participants may contribute on a voluntary basis. Approximately $115,600, $94,100The Partnership contributed approximately $158, $141 and $56,300 were provided by the Partnership for its contributions$120 to the plans for the years ended December 31, 2011, 20102014, 2013 and 2009,2012, respectively.
PART II
|
|
NOTE 1513 – COMMITMENTS, GUARANTEES AND RISKS
The Partnership leases home office and branch office space under severalnumerous non-cancelable operating leases. Additionally, branchleases from non-affiliates and financial advisors. Branch offices are leased generally for terms of three to five years. Rent expense which is recognized on a straight-line basis over the minimum lease term, was $227,500, $218,100,term. Rent and $204,800other lease-related expenses were approximately $242, $234, and $229 for the years ended December 31, 2011, 20102014, 2013 and 2009,2012, respectively.
The Partnership’s non-cancelable lease commitments greater than one year as of December 31, 2011,2014, are summarized below:
| Principal | ||||
Year | Payment | |||
2012 | $ | 128,445 | ||
2013 | 34,173 | |||
2014 | 23,029 | |||
2015 | 17,400 | |||
2016 | 12,601 | |||
Thereafter | 49,477 | |||
|
| |||
| $ | 265,125 | |||
|
| |||
2015 | $ | 137 | ||
2016 | 33 | |||
2017 | 23 | |||
2018 | 15 | |||
2019 | 12 | |||
Thereafter | 24 | |||
|
| |||
Total | $ | 244 | ||
|
|
The Partnership’s annual rent expense is greater than its annual future lease commitments because the annual future lease commitments include only non-cancelable lease payments greater than one year.
81
PART II
Item 8. Financial Statements and Supplementary Data, continued
In addition to the commitments discussed above, the Partnership has a revolving unsecured line of credit outstanding as of December 31, 2011 (see Note 8), as well as2014, the Partnership would have incurred termination fees of $82,110 in 2012approximately $162 in the event the Partnership terminated existing contractual commitments with certain vendors providing ongoing services.services primarily for information technology, operations and marketing. These termination fees will decrease over the related contract periods, which generally expire within the next three years. As of December 31, 2014, the Partnership also has a revolving unsecured line of credit available (see Note 6).
The Partnership provides margin loans to its clients in accordance with Regulation T and FINRA, which loans are collateralized by securities in the client’s account. The Partnership could be liable for the margin requirement of its client margin securities transactions. To mitigate this risk, the Partnership monitors required margin levels and requires clients to deposit additional collateral or reduce positions to meet minimum collateral requirements.
The Partnership’s securities activities involve execution, settlement and financing of various securities transactions for clients. The Partnership may be exposed to risk of loss in the event clients, other brokers and dealers, banks, depositories or clearing organizations are unable to fulfill contractual obligations. For client transactions, the Partnership has controls in place to ensure client activity is monitored and clients meet their obligation to the Partnership. Therefore, the potential to make payments under these client transactions is remote and accordingly, no liability has been recognized for these transactions.
Cash balances held at various major U.S. financial institutions, which typically exceed Federal Deposit Insurance Corporation insurance coverage limits, subject the Partnership to a concentration of credit risk. Additionally, the Partnership’s Canada broker-dealer may also have cash deposits in excess of the applicable insured amounts. The Partnership regularly monitors the credit ratings of these financial institutions in order to help mitigate the credit risk that exists with the deposits in excess of insured amounts. The Partnership has credit exposure to U.S. government and agency securities which are held as collateral for its resell agreements, investment securities and segregated investments. The Partnership’s primary exposure on resell agreements is with the counterparty and the Partnership would only have exposure to U.S. government and agency credit risk in the event of the counterparty’s default on the resell agreements.
The Partnership provides guarantees to securities clearing houses and exchanges under their standard membership agreements, which require a member to guarantee the performance of other members. Under these agreements, if a member becomes unable to satisfy its obligations to the clearing houses and exchanges, all other members would be required to meet any shortfall. The Partnership’s liability under these arrangements is not quantifiable and may exceed the cash and securities it has posted as collateral. However, the potential requirement for the Partnership to make payments under these agreements is remote. Accordingly, no liability has been recognized for these transactions.
82
PART II
| Item 8. Financial Statements and Supplementary Data, continued |
NOTE 1614 – CONTINGENCIES
In the normal course of business, the Partnership has been named as a defendant in various legal actions, including arbitrations, class actions and other litigation. Certain of these legal actions include claims for substantial compensatory and/or punitive damages or claims for indeterminate amounts of damages. The Partnership is also involved, from time to time, in various legal matters, including arbitrations, class actions, other litigation, and investigations and proceedings by governmental organizations and self-regulatory agencies, certain oforganizations, which may result in adverse judgments, fines or penalties.losses. In addition, the Partnership provides for potential losses that may arise related to other contingencies.
The Partnership assesses its liabilities and contingencies utilizing available information. For those matters where it is probable the Partnership will incur a potential loss and the amount of the loss is reasonably estimable, in accordance with FASB ASC No. 450,Contingencies (“ASC 450”), an accrued liability has been established. These reserves represent the Partnership’s aggregate estimate of the potential loss contingency at December 31, 2014 and are believed to be sufficient at this time.sufficient. Such liability may be adjusted from time to time to reflect any relevant developments.
For such matters where an accrued liability has not been established and the Partnership believes a loss is both reasonably possible and estimable, as well as for matters where an accrued liability has been recorded but for which an exposure to loss in excess of the amount accrued is both reasonably possible and estimable, the current estimated aggregated range of additional possible loss is $3.0 million$16 to $34.0 million.$37. This range of reasonably possible loss does not necessarily represent the Partnership’s maximum loss exposure as the Partnership was not able to estimate a range of reasonably possible loss for all matters.
Further, the matters underlying any disclosed estimated range will change from time to time, and actual results may vary significantly. While the outcome of these matters is inherently uncertain, based on information currently available, the Partnership believes that its established reserves at December 31, 2014 are adequate and the liabilities arising from such proceedings will not have a material adverse effect on the consolidated financial position, results of operations or cash flows of the Partnership. However, based on future developments and the potential unfavorable resolution of these matters, the outcome could be material to the Partnership’s future consolidated operating results for a particular period or periods.
83
PART II
Item 8. Financial Statements and Supplementary Data, continued
|
|
NOTE 1715 – SEGMENT INFORMATION
Operating segments areAn operating segment is defined as componentsa component of an entity that has all of the following characteristics: it engages in business activities from which it may earn revenues and incur expenses; its operating results are regularly reviewed by the entity’s chief operating decision-maker (or decision-making group) for resource allocation and to assess performance; and it has discrete financial information is available. Operating segments may be combined in certain circumstances into reportable segments for financial reporting. The Partnership has determined it has two operating and reportable segments based upon geographic location, the U.S. and Canada.
Each segment, in its own geographic location, primarily derives its revenuesrevenue from the retail brokerage business through the distribution of mutual fund shares, fees related to assets held by and account services provided to its clients, the sale of listed and unlisted securities and insurance products, investment banking, and principal transactions, as a distributor of mutual fund shares and through revenues related to assets held by and account services provided to its clients.
The accounting policies of the segments are the same as those described in “Note 1 – Summary of Significant Accounting Policies.” Financial information about the Partnership’s reportable segments is presented in the following table. For the computation of its segment information, the Partnership allocates costs incurred by the U.S. entity in support of Canadian operations to the Canadian segment.transactions.
The Partnership evaluates thesegment performance of its segments based upon income from continuing operations(loss) before allocations to partners, as well as income (loss) before variable compensation which is(“pre-variable income before expenses for bonuses earned by financial advisors, home office and branch employees and profit sharing allocations.(loss)”). Variable compensation is determined at the Partnership level for profit sharing and home office associate and branch employeeoffice administrator bonus amounts, and therefore is allocated to each geographic segment independent of that segment’s individual income before variable compensation. The amount of financialpre-variable income. Financial advisor bonuses isare determined in part by the overall PartnershipPartnership’s profitability, as well as the performance of the individual segments. As such, bothfinancial advisors. Both income from continuing operations(loss) before allocations to partners and pre-variable income before variable compensation(loss) are considered in evaluating segment performance. Long-lived assets are not disclosed because the balances are not used for evaluating segment performance and deciding how to allocate resources to segments. However, total assets from continuing operations for each segment are provided for informational purposes.purposes, as well as capital expenditures and depreciation and amortization.
The accounting policies of the segments are the same as those described in Note 1 – Summary of Significant Accounting Policies. For computation of segment information, the Partnership allocates costs incurred by the U.S. entity in support of Canada operations to the Canada segment. Canada segment information as reported in the following table is based upon the Consolidated Financial Statements of the Partnership’s CanadianCanada operations without eliminating any intercompany items, such as management fees that it payspaid to affiliated entities. The U.S. segment information is derived from the Partnership’s Consolidated Financial Statements less the Canada segment information as presented. This is consistent with how management reviews the segments in order to assess performance.
84
PART II
| Item 8. Financial Statements and Supplementary Data, continued |
FinancialThe following table shows financial information for the Partnership’s reportable segments is presented in the following table for the years ended December 31, 2011, 20102014, 2013 and 2009:2012:
| 2011 | 2010 | 2009 | 2014 | 2013 | 2012 | |||||||||||||||||||
Financial metrics: | ||||||||||||||||||||||||
Net revenue: | ||||||||||||||||||||||||
United States of America | $ | 4,324,451 | $ | 3,939,831 | $ | 3,366,991 | ||||||||||||||||||
U.S. | $ | 6,074 | $ | 5,457 | $ | 4,790 | ||||||||||||||||||
Canada | 185,410 | 166,945 | 123,428 | 204 | 200 | 175 | ||||||||||||||||||
|
|
|
|
|
| |||||||||||||||||||
Total net revenue | 4,509,861 | 4,106,776 | 3,490,419 | $ | 6,278 | $ | 5,657 | $ | 4,965 | |||||||||||||||
|
|
| ||||||||||||||||||||||
Net interest and dividends revenue: | ||||||||||||||||||||||||
United States of America | 57,647 | 66,775 | 50,984 | |||||||||||||||||||||
U.S. | $ | 76 | $ | 70 | $ | 67 | ||||||||||||||||||
Canada | 4,862 | 3,671 | 4,054 | 4 | 5 | 4 | ||||||||||||||||||
|
|
|
|
|
| |||||||||||||||||||
Total net interest and dividends revenue | 62,509 | 70,446 | 55,038 | $ | 80 | $ | 75 | $ | 71 | |||||||||||||||
|
|
| ||||||||||||||||||||||
Pre-variable income (loss): | ||||||||||||||||||||||||
United States of America | 855,862 | 678,110 | 409,743 | |||||||||||||||||||||
U.S. | $ | 1,559 | $ | 1,310 | $ | 1,056 | ||||||||||||||||||
Canada | 4,189 | (10,715 | ) | (32,884 | ) | 12 | 7 | (4) | ||||||||||||||||
|
|
|
|
|
| |||||||||||||||||||
Total pre-variable income | 860,051 | 667,395 | 376,859 | $ | 1,571 | $ | 1,317 | $ | 1,052 | |||||||||||||||
Variable compensation: | ||||||||||||||||||||||||
United States of America | 366,663 | 266,100 | 105,962 | |||||||||||||||||||||
U.S. | $ | 781 | $ | 626 | $ | 485 | ||||||||||||||||||
Canada | 11,605 | 8,510 | 2,259 | 20 | 17 | 12 | ||||||||||||||||||
|
|
|
|
|
| |||||||||||||||||||
Total variable compensation | 378,268 | 274,610 | 108,221 | $ | 801 | $ | 643 | $ | 497 | |||||||||||||||
Income (Loss) from continuing operations: | ||||||||||||||||||||||||
United States of America | 489,199 | 412,010 | 303,781 | |||||||||||||||||||||
Income (loss) before allocations to partners: | ||||||||||||||||||||||||
U.S. | $ | 778 | $ | 684 | $ | 571 | ||||||||||||||||||
Canada | (7,416 | ) | (19,225 | ) | (35,143 | ) | (8) | (10) | (16) | |||||||||||||||
|
|
|
|
|
| |||||||||||||||||||
Total Income from continuing operations | $ | 481,783 | $ | 392,785 | $ | 268,638 | ||||||||||||||||||
Total income before allocations to partners | $ | 770 | $ | 674 | $ | 555 | ||||||||||||||||||
|
|
| ||||||||||||||||||||||
|
|
| ||||||||||||||||||||||
Capital expenditures: | ||||||||||||||||||||||||
United States of America | $ | 53,219 | $ | 90,500 | $ | 183,750 | ||||||||||||||||||
U.S. | $ | 88 | $ | 81 | $ | 36 | ||||||||||||||||||
Canada | 1,793 | 2,494 | 3,338 | 2 | 3 | 1 | ||||||||||||||||||
|
|
|
|
|
| |||||||||||||||||||
Total capital expenditures | $ | 55,012 | $ | 92,994 | $ | 187,088 | $ | 90 | $ | 84�� | $ | 37 | ||||||||||||
|
|
|
|
|
| |||||||||||||||||||
Depreciation and amortization: | ||||||||||||||||||||||||
United States of America | $ | 88,118 | $ | 95,548 | $ | 87,569 | ||||||||||||||||||
U.S. | $ | 80 | $ | 80 | $ | 78 | ||||||||||||||||||
Canada | 2,491 | 2,639 | 2,553 | 2 | 2 | 2 | ||||||||||||||||||
|
|
|
|
|
| |||||||||||||||||||
Total depreciation and amortization | $ | 90,609 | $ | 98,187 | $ | 90,122 | $ | 82 | $ | 82 | $ | 80 | ||||||||||||
|
|
|
|
|
| |||||||||||||||||||
Total assets: | ||||||||||||||||||||||||
United States of America | $ | 9,158,882 | $ | 7,785,698 | $ | 6,728,808 | ||||||||||||||||||
U.S. | $ | 14,290 | $ | 13,341 | $ | 12,618 | ||||||||||||||||||
Canada | 424,704 | 455,452 | 439,567 | 480 | 454 | 424 | ||||||||||||||||||
|
|
|
|
|
| |||||||||||||||||||
Total assets | $ | 9,583,586 | $ | 8,241,150 | $ | 7,168,375 | $ | 14,770 | $ | 13,795 | $ | 13,042 | ||||||||||||
|
|
|
|
|
| |||||||||||||||||||
Non-financial metrics: | ||||||||||||||||||||||||
Financial Advisors (as of year-end): | ||||||||||||||||||||||||
United States of America | 11,622 | 11,980 | 11,927 | |||||||||||||||||||||
Financial advisors at year end: | ||||||||||||||||||||||||
U.S. | 13,287 | 12,483 | 11,822 | |||||||||||||||||||||
Canada | 620 | 636 | 688 | 713 | 675 | 641 | ||||||||||||||||||
|
|
|
|
|
| |||||||||||||||||||
Total financial advisors | 12,242 | 12,616 | 12,615 | 14,000 | 13,158 | 12,463 | ||||||||||||||||||
|
|
|
|
|
| |||||||||||||||||||
85
PART II
| Item 8. Financial Statements and Supplementary Data, continued |
NOTE 1816 – RELATED PARTIES
Edward Jones owns a 49.5% limited partnership interest in Passport Research, the investment adviser to the two money market funds made available to Edward Jones money market funds.clients. The Partnership does not have management responsibility with regard to the advisor.adviser. Approximately 0.2%0.03%, 0.5%0.1% and 2.1%0.2% of the Partnership’s total revenues were derived from thethis limited partnership interest in the investment adviser to the fundfunds during 2011, 20102014, 2013 and 2009,2012, respectively.
As of December 31, 2014, Edward Jones leases approximately 10% of its branch office space from its financial advisors.advisors (see Note 13). Rent expense related to these leases approximated $21,000, $20,000$25, $23 and $19,000$20 for the years ended December 31, 2011, 20102014, 2013 and 2009,2012, respectively. These leases are executed and maintained in the samea similar manner as those entered into with third parties.
The Partnership created the Bridge Builder Trust (the “Trust”) to launch the Bridge Builder Bond Fund (the “Fund”) for Advisory Solutions clients. The Fund is a sub-advised mutual fund in the Trust. Olive Street Investment Advisers, L.L.C. (“OLV”), a wholly-owned subsidiary of the Partnership, is the investment adviser to the Fund. OLV has waived any investment adviser fees above those amounts paid to the Fund sub-advisers. In addition, the Partnership has waived receiving shareholder servicing fees from the Fund. The revenue earned by OLV from the Fund, included within advisory program fees on the Consolidated Statements of Income, is offset by the expense paid to the Fund sub-advisers, included within professional and consulting fees. The total amounts recognized for the years ended December 31, 2014 and 2013 were $8 and $1, respectively.
In the normal course of business, partners and employees of the Partnership and its affiliates use the brokerage services and trust services of the Partnership for the same services as unrelated third parties, with certain discounts on commissions and fees for certain services. The Partnership has included balances arising from such transactions in the Consolidated Statements of Financial Condition on the same basis as other clients.
The Partnership earnsrecognizes interest income for the interest earned from general partners who elect to finance a portion or all of their purchase of general partnership interestscapital contributions through loans made available from the Partnership. These partnership loans were first made available to general partners in 2011. The Partnership earned interest of $2,888 for the year ended December 31, 2011 on partnership loans outstanding as of December 31, 2011 of $86,853.(see Note 9).
86
PART II
Item 8. Financial Statements and Supplementary Data, continued
|
|
NOTE 1917 – QUARTERLY INFORMATION
(Unaudited)
| 2011 | 2014 Quarters Ended | |||||||||||||||||||||||||||||||
| Quarters Ended | Mar 28 | Jun 27 | Sep 26 | Dec 31 | ||||||||||||||||||||||||||||
| March 25 | June 24 | September 30 | December 31 |
|
| |||||||||||||||||||||||||||
Total revenue | $ | 1,123,893 | $ | 1,169,757 | $ | 1,166,777 | $ | 1,117,076 | $ | 1,504 | $ | 1,578 | $ | 1,596 | $ | 1,655 | ||||||||||||||||
Income before allocations to partners | $ | 117,639 | $ | 124,397 | $ | 115,620 | $ | 124,127 | $ | 186 | $ | 194 | $ | 195 | $ | 195 | ||||||||||||||||
Income before allocations to partners per weighted average $1,000 equivalent limited partnership unit outstanding | $ | 25.55 | $ | 27.03 | $ | 25.11 | $ | 26.97 | ||||||||||||||||||||||||
Income allocated to limited partners per weighted average $1,000 equivalent limited partnership unit outstanding | $ | 31.27 | $ | 32.67 | $ | 32.77 | $ | 32.69 | ||||||||||||||||||||||||
| 2010 | 2013 Quarters Ended | |||||||||||||||||||||||||||||||
| Quarters Ended | Mar 29 | Jun 28 | Sep 27 | Dec 31 | ||||||||||||||||||||||||||||
| March 26 | June 25 | September 24 | December 31 |
|
| |||||||||||||||||||||||||||
Total revenue | $ | 963,445 | $ | 1,034,211 | $ | 1,015,715 | $ | 1,149,728 | $ | 1,351 | $ | 1,431 | $ | 1,432 | $ | 1,502 | ||||||||||||||||
Income before allocations to partners | $ | 76,543 | $ | 104,841 | $ | 97,039 | $ | 114,362 | $ | 149 | $ | 172 | $ | 168 | $ | 185 | ||||||||||||||||
Income before allocations to partners per weighted average $1,000 equivalent limited partnership unit outstanding | $ | 18.72 | $ | 25.64 | $ | 23.74 | $ | 27.97 | ||||||||||||||||||||||||
Income allocated to limited partners per weighted average $1,000 equivalent limited partnership unit outstanding | $ | 26.72 | $ | 30.92 | $ | 30.13 | $ | 33.35 | ||||||||||||||||||||||||
In accordance with ASC 480,NOTE 18 – OFFSETTING ASSETS AND LIABILITIES
The Partnership does not offset financial instruments in the Consolidated Statements of Financial Condition. However, the Partnership presentsenters into master netting arrangements with counterparties for securities purchased under agreements to resell that are subject to net incomesettlement in the event of $0 on its Consolidated Statementdefault. These agreements create a right of Income. See Note 1offset for the amounts due to and due from the Consolidated Financial Statements for further discussion.same counterparty in the event of default or bankruptcy.
The following table shows the Partnership’s securities purchased under agreements to resell as of December 31, 2014 and 2013:
| Gross amounts of recognized assets | Gross amounts offset in the Consolidated Statements of Financial Condition | Net amounts presented in the Consolidated Statements of Financial Condition | Gross amounts not offset in the Consolidated Statements of Financial Condition | |||||||||||||||||||||
|
| |||||||||||||||||||||||
Financial instruments | Securities collateral(1) | Net amount | ||||||||||||||||||||||
|
|
|
|
|
| |||||||||||||||||||
2014 | $ | 634 | - | 634 | - | (634) | $ | - | ||||||||||||||||
2013 | $ | 1,026 | - | 1,026 | - | (1,026) | $ | - | ||||||||||||||||
| (1) | Actual collateral was greater than 102% of the related assets in U.S. agreements and greater than 100% in Canada agreements for all periods presented. |
87
PART II
CHANGE IN AND DISAGREEMENTS WITH ACCOUNTANTS ON ACCOUNTING AND FINANCIAL DISCLOSURE |
None.
CONTROLS AND PROCEDURES |
Evaluation of Disclosure Controls and Procedures. As required by Rule 13a-15e13a-15(e) under the Exchange Act, as of the end of the period covered by this Annual Report on Form 10-K, the Partnership’s certifying officers, the Chief Executive Officer and the Chief Financial Officer, carried out an evaluation, with the participation of its management, of the effectiveness of the design and operation of our disclosure controls and procedures. In designing and evaluating our disclosure controls and procedures, we recognize that any controls and procedures, no matter how well designed and operated, can provide only reasonable assurance of achieving the desired control objectives, and we were required to apply our judgment in evaluating and implementing possible controls and procedures. Based on that evaluation, our Chief Executive Officer and Chief Financial Officer have concluded that, as of the date of completion of the evaluation, our disclosure controls and procedures were effective to ensure that information required to be disclosed by the Partnership in the reports we file or submit under the Exchange Act is recorded, processed, summarized and reported, within the time periods specified in the SEC’s rules and forms. We will continue to review and document our disclosure controls and procedures, including our internal controls and procedures for financial reporting, on an ongoing basis, and may from time to time make changes aimed at enhancing their effectiveness and to ensure that our systems evolve with our business.
Management’s report on internal control over financial reporting and the report of independent registered public accounting firm are set forth in Part II, Item 8, of this annual reportAnnual Report on Form 10-K.
Changes in Internal Control Over Financial Reporting. There was no change in the Partnership’s internal control over financial reporting (as defined in Rules 13a-15(f) and 15d-15(f) under the Exchange Act) that occurred during the quarter ended December 31, 20112014 that has materially affected, or is reasonably likely to materially affect, its internal control over financial reporting.
OTHER INFORMATION |
None.
88
DIRECTORS, EXECUTIVE OFFICERS AND CORPORATE GOVERNANCE |
JFC does not have a board of directors. As of February 24, 2012,27, 2015, the Partnership was composed of 362386 general partners, 14,41620,257 limited partners and 280364 subordinated limited partners.
Managing Partner. Under the terms of the Partnership Agreement, the Managing Partner has primary responsibility for administering the Partnership’s business, determining its policies, and controlling the management and conduct of the Partnership’s business andbusiness. In addition, the Managing Partner has the power to admit and dismiss general partners and to fix the proportion of their respective interests in the Partnership. The Managing Partner serves for an indefinite term and may be removed by a majority vote of the Executive Committee (as discussed below) or a vote of the general partners holding a majority percentage ownership in the Partnership. If at any time the office of the Managing Partner is vacant, the Executive Committee will succeed to all the powers and duties of the Managing Partner until a new Managing Partner is elected by a majority of the Executive Committee. The Partnership does not have a formal code of ethics that applies to its Executive Committee members, as it relies on the core values and beliefs of the Partnership, as well as the Partnership Agreement. The Partnership’s operating subsidiaries are managed by JFC, under the leadership of the Managing Partner, pursuant to a services agreement.
Executive Committee. The Executive Committee consists of the Managing Partner and the executive officers of the Partnership, which are 5five to 9nine additional general partners appointed by the Managing Partner, with the specific number determined by the Managing Partner. The purpose of the Executive Committee is to provide counsel and advice to the Managing Partner in discharging his functions, including the consideration of partnership compensation, and to ensureensuring the Partnership’s business risks are managed appropriately.appropriately and helping to establish the strategic direction of the Partnership. In addition, the Executive Committee takes an active role in identifying, measuring and controlling the risks to which the Partnership is subject. Executive Committee members serve for an indefinite term and may be removed by the Managing Partner or a vote of general partners holding a majority percentage ownership in the Partnership. Furthermore, in the event the position of Managing Partner is vacant, the Executive Committee shall succeed to all of the powers and duties of the Managing Partner. Throughout 2011,Partner until a new Managing Partner is elected by a majority of the Executive Committee. The Partnership does not have a formal code of ethics that applies to its Executive Committee members, as it relies on the core values and beliefs of the Partnership, as well as the Partnership Agreement. Until July 7, 2014, the Executive Committee was comprised of James D. Weddle, Chairman, Kevin D. Bastien, Brett A. Campbell, Norman L. Eaker, Gary D. Reamey, Daniel J. Timm and James A. Tricarico, Jr. The Managing Partner appointed general partners Penny Pennington and Kenneth R. Cella, Jr. as members of the Executive Committee effective July 7, 2014. Effective December 31, 2014, Mr. Campbell retired from the Partnership and was no longer a member of the Executive Committee.
89
PART III
Item 10. Directors, Executive Officers and Corporate Governance, continued
The following table is a listing as of February 24, 2012,27, 2015 of the members of the Executive Committee, each member’s age, the year in which each member became an Executive Committee member, the year in which each member became a general partner and each member’s area of responsibility. Under terms of the Partnership Agreement, all general partners, including the members of the Executive Committee, are required to retire in their capacity as general partners at the age of 65. The members’ biographies are below.
Name | Age | Executive Committee | General Partner | Area of Responsibility | ||||||||||
James D. Weddle | 58 | 2005 | 1984 | Managing Partner | ||||||||||
Kevin D. Bastien | 46 | 2010 | 1998 | Chief Financial Officer | ||||||||||
Brett A. Campbell | 53 | 2006 | 1993 | Client Solutions Group | ||||||||||
Norman L. Eaker | 55 | 2005 | 1984 | Firm Administration | ||||||||||
Gary D. Reamey | 56 | 2006 | 1984 | Canadian Operations | ||||||||||
Daniel J. Timm | 53 | 2009 | 1998 | Branch Development | ||||||||||
James A. Tricarico, Jr. | 59 | 2007 | 2006 | Legal and Compliance | ||||||||||
| Name | Age | Executive Committee | General Partner | Area of Responsibility | ||||
| ||||||||
James D. Weddle | 61 | 2005 | 1984 | Managing Partner | ||||
Kevin D. Bastien | 49 | 2010 | 1998 | Chief Financial Officer | ||||
Kenneth R. Cella, Jr. | 45 | 2014 | 2002 | Branch Development | ||||
Norman L. Eaker | 58 | 2005 | 1984 | Firm Administration | ||||
Penny Pennington | 51 | 2014 | 2006 | Client Strategies Group | ||||
Daniel J. Timm | 56 | 2009 | 1998 | Branch Development | ||||
James A. Tricarico, Jr. | 62 | 2007 | 2006 | Legal and Compliance | ||||
| ||||||||
PART III
|
|
James D. Weddle, Managing Partner –Mr. Weddle joined the Partnership in 1976, was named a general partner in 1984 and has served as Managing Partner since January 2006. Mr. Weddle hasPreviously he worked in the Research department and as a financial advisor, in research, mutual fund sales, marketing and branch administration.has been responsible for the Mutual Fund Sales department as well as the Marketing and Branch Administration divisions. Mr. Weddle earned his bachelorbachelor’s degree from DePauw University and his MBA from Washington University in St. Louis. Mr. Weddle is a member of the FINRA Board of Governors.
Kevin D. Bastien, Chief Financial Officer –Mr. Bastien joined the Partnership in 1996, was named a general partner in 1998 and has served as Chief Financial Officer since January 2009. Previously he has had responsibilitybeen responsible for various areas of the Finance division including tax, partnership accounting, coordinating overall finance support for international operations and the Sourcing Office, which negotiates all Partnership financial commitments. Mr. Bastien earned his bachelorbachelor’s and master’s degrees in accounting from Southern Illinois University at Carbondale.Carbondale and is a certified public accountant.
Brett A. Campbell, Client Solutions GroupKenneth R. Cella, Jr., Branch Development –Mr. CampbellCella joined the Partnership in 1984 as a financial advisor1990 and was named a general partner in 1993. He2002. Mr. Cella assumed shared responsibility for the Branch Development division, which encompasses Financial Advisor and Branch Office Administrator Hiring, Branch Training, Branch and Region Development, Branch Administration and Financial Advisor Leadership Development, in July 2014. Previously he worked as a financial advisor and has been responsible for Financial Advisor Trainingvarious areas of the Client Strategies Group, including mutual funds, insurance, banking and Branch Development. Today, he is responsibleadvisory areas and for the Client Solutions Group, which encompasses all of the firm’s products and services as well as the Research department, Investment Banking, Trust Company and Marketing division.Branch Training department. Mr. Campbell is a certified public accountant and is a member of the American Institute of CPA’s. He serves on the Securities Industry and Financial Markets Association (SIFMA) Private Client Services Committee. Mr. CampbellCella earned his bachelorbachelor’s degree summa cum laude from Ball Statethe University of Missouri-St. Louis and graduated Kellogg Management Institute at Northwestern University.an MBA from Washington University in St. Louis.
Norman L. Eaker, Chief Administrative Officer –Mr. Eaker joined the Partnership in 1981, and was named a general partner in 1984. Mr. Eaker1984 and has served as the director of Internal Audit andChief Administrative Officer since 2008. As Chief Administrative Officer, Mr. Eaker is currently responsible for Firm Administration, which encompasses the Operations, Service, Human Resources and Information Systems divisions. Previously he has been responsible for the Internal Audit division and various areas within the Operations division. Mr. Eaker graduatedearned his bachelor’s degree from the University of Missouri–St. Louis. Mr. Eaker is a member of the Operations and Technology Steering Committee of SIFMA.the Securities Industry and Financial Markets Association (SIFMA).
90
PART III
Item 10. Directors, Executive Officers and Corporate Governance, continued
Gary D. Reamey, Canadian OperationsPenny Pennington, Client Strategies Group –Mr. ReameyMs. Pennington joined the Partnership in 19771996 and was named a general partner in 1984. Mr. Reamey has had2006. Ms. Pennington assumed responsibility for the Partnership’s U.S. Fixed Income and Trading and Equity Trading areas andClient Strategies Group, which encompasses all of the Partnership’s international expansion efforts into Canada. Mr. Reameyadvice and guidance, products and services, marketing, and branch support related to helping clients achieve their financial goals, in September 2014. Previously she worked as a financial advisor and has been responsible for the New Financial Advisor Training department, BOA Development department and Branch and Region Development division. Ms. Pennington earned his bachelorher bachelor’s degree from Wabash College and his MBA from the University of Chicago. He is a former GovernorVirginia and earned her MBA from the Kellogg School of the Toronto Stock Exchange, and a past Director of the Investment Industry Association of Canada, and a past member of the Ombudsman for Banking and Investments. Mr. Reamey has decided to retireManagement at the end of 2012 and therefore has stepped down as country leader effective January 1, 2012. Gary Reamey will remain with the Partnership as a member of the Executive Committee and a senior partner through 2012, at which point he will retire after 35 years of service.Northwestern University.
Daniel J. Timm, Branch Development –Mr. Timm joined the Partnership in 1983 as a financial advisor and was named a general partner in 1998. Mr. Timm has been responsible for recruitingthe Branch Development division, which encompasses Financial Advisor and hiring, trainingBranch Office Administrator Hiring, Branch Training, Branch and developmentRegion Development, Branch Administration and Financial Advisor Leadership Development, since 2007. Previously he worked as a financial advisor and has been responsible for various areas of all financial advisorsthe Branch Development division, including the Financial Advisor Training, Financial Advisor Development and branch employees, as well as branch administrationBranch Administration departments. Mr. Timm earned his bachelor’s degree and leadership development. HeMBA from the University of Missouri–Columbia. Mr. Timm is also a member of the SIFMA Private Client Steering Committee and Bulls Roundtable. He earned his bachelor degree in atmospheric science and MBA in finance from the University of Missouri–Columbia.
PART III
|
|
James A. Tricarico, Jr., General Counsel –Mr. Tricarico joined the Partnership as general partner and general counselGeneral Counsel in 2006. He is responsible for the Legal and Compliance divisions and Government Relations. Prior to joining the Partnership, he was in private practice and before that he served as general counsel and executive vice president of a large broker-dealer. Mr. Tricarico earned his bachelor’s degree from Fordham University and his law degree from New York Law School (cum laude). Mr. Tricarico is a member of the Board of Directors and the General CounselsExecutive Committee of the Board of SIFMA and is the Past President and a member of the Executive Committee of the Compliance and Legal Society of SIFMA and the National Arbitration and Mediation Committee of FINRA Dispute Resolution. He earned his bachelor degree from Fordham University and his law degree cum laude from New York Law School.SIFMA.
Management Committee.The Management Committee consists of up to 25 general partners appointed by the Managing Partner, with the specific number determined by the Managing Partner, and generally includes the members of the Executive Committee,Committee. As of February 24, 2012,27, 2015, the Management Committee consisted of 1920 general partners. The Management Committee is generally comprised of general partners with overall responsibility for a significant or critical functional division or area of the Partnership’s operating subsidiaries. The Management Committee meets weekly, is operational in nature, and is responsible for identifying, developing and accomplishing the Partnership’s objectives through, among other means, sharing information across divisions and identifying and resolving risk management issues for the Partnership. General partners on the Management Committee serve for an indefinite term and may be removed by the Managing Partner.
91
PART III
Item 10. Directors, Executive Officers and Corporate Governance, continued
Audit Committee. The Audit Committee was created by way of the Partnership Agreement. The Audit Committee operates according to its charter adopted by the Executive Committee. Pursuant to its charter and the Partnership Agreement, the Audit Committee is directly responsible for the appointment, compensation, retention and oversight of the work of any independent registered public accounting firm engaged by the Partnership for the purpose of preparing or issuing an audit report. The Audit Committee is responsible for the development and maintenance of an understanding of the firm’sPartnership’s financial statements and the financial reporting process, overseeing the firm’sPartnership’s efforts to comply with the financial reporting control requirements of the Sarbanes Oxley Act of 2002 (“Sarbanes Oxley”) and providing input to the firm’sPartnership’s Internal Audit division regarding audit topics and the resolution of outstanding audit findings. In 2011
As of February 27, 2015, the Audit Committee was comprised of James A. Tricarico, Jr., Chairman, James D. Weddle, Kevin D. Bastien, Brett A. Campbell, Norman L. Eaker, Penny Pennington, Anthony Damico, who is a member of the Management Committee and the general partner responsible for the Internal Audit division, Joseph Porter, who isLisa M. Dolan, a general partner in the Finance division, and independent members of the committee Ed Glotzbach who is an independent member of the committee. Kevinand Mark Wuller.
Mr. Bastien meets the requirements adopted by the SEC for qualification as an “audit committee financial expert.” Because Mr. Bastien is a general partner, he would not meet the definition of “independent” under the rules of the NYSE.New York Stock Exchange (“NYSE”). However, since the Partnership’s securities are not listed on any exchange, it is not subject to the listing requirements of the NYSE or any other securities exchanges. Audit Committee members serve for an indefinite term and may be removed by the Managing Partner.
92
PART III
Item 10. Directors, Executive Officers and Corporate Governance, continued
RISK MANAGEMENT
Overview
The Partnership’s business model and activities expose it to a number of different risks. The most significant risks to which the Partnership is subject include business and operational risk, credit risk, market and liquidity risk, and legal, regulatory and reputational risk. The identification and ongoing management of the Partnership’s risk is critical to its long termlong-term business success and related financial performance. The Partnership is governed by an Executive Committee, which is ultimately responsible for overall risk management. Throughout 2011,As of February 27, 2015, the Executive Committee consisted of the Partnership’s Managing Partner and six other general partners, each responsible for broad functional areas of the Partnership. The Executive Committee is responsible for providing advice and counsel to the Managing Partner and helps establish the strategic direction of the firm.Partnership. In addition, the Executive Committee takes an active role in identifying, measuring and controlling the risks to which the Partnership is subject. The Executive Committee communicates regularly, meets monthly and also conducts periodic planning sessions to meet its responsibilities.
PART III
|
|
The Management Committee assists the Executive Committee in its ongoing risk management responsibilities through its day-to-day operations. The Management Committee is responsible for identifying, developing and accomplishing the Partnership’s objectives. In addition, the Management Committee is responsible for sharing information across divisions and identifying issues and risks with other members of the Management Committee. The Management Committee meets weekly and provides a forum to both identify and resolve risk management issues for the Partnership.
Several other committees and departments support the Executive Committee’s risk management responsibilities by managing certain components of the risk management process. Some of the more prominent committees and departments and their primary responsibilities, as they relate to risk management, are listed below:
Audit Committee –-responsible for the development and maintenance of an understanding of the firm’sPartnership’s financial statements and the financial reporting process, overseeing the firm’sPartnership’s efforts to comply with the financial reporting control requirements of Sarbanes Oxley, overseeing the independent auditors qualifications and independence, and providing input to the firm’sPartnership’s Internal Audit division regarding audit topics and the resolution of outstanding audit findings.
New Products and Services Committee –- responsible for ensuring that all new products and services are aligned with clients’ needs, are consistent with the Partnership’s objectives and strategies, and that all areas of the Partnership are sufficiently prepared to support, service, and supervise any new activities. A new product or service has to be approved by the New Products and Services Committee and the Executive Committee before being offered to clients.
Credit Review Committee –-establishes policies governing the Partnership’s client margin accounts. The committee discusses and monitors the risks associated with the Partnership’s client margin practices and current trends in the industry. The committee reviews large client margin balances, the quality of the collateral supporting those accounts, and the credit exposure related to those accounts to minimize potential losses. Any margin loan over $1.0 million is subject to special approval
93
PART III
Item 10. Directors, Executive Officers and review procedures by the Credit Review Committee.Corporate Governance, continued
Capital Markets Committee –-approves new issue equity offerings and primary fixed income inventory commitments above $10.0$10 million. The approval is based upon Partnership guidelines and credit quality standards administered by the Partnership’s Product Review department. Additionally, a member of the Capital Markets Committee is responsible both for the hedging strategies employed by the Partnership to reduce inventory risk and for the communication of those strategies to the Capital Markets Committee.
Finance Risk Committee –-Reviews reviews the Partnership’s financial liquidity, cash investment portfolio and capital adequacy and assesses major exposures to financial institutions. These exposures include banks in which the Partnership has deposits or on which it depends for funding.
Product Review Department –-analyzes proposed new investments prior to them being made broadly available to the Partnership’s clients, and performs ongoing due diligence activities on all products broadly marketed by the Partnership.
PART III
|
|
In addition to the committees and department discussed above, each of the Partnership’s divisions also assists the Executive Committee in its ongoing risk management activities through their day-to-day responsibilities.
As part of the financial services industry, the Partnership’s business is subject to inherent risks. As a result, despite its risk management efforts and activities, there can be no absolute assurance that the Partnership will not experience significant unexpected losses due to the realization of certain operational or other risks to which the firmPartnership is subject. The following discussion highlights the Partnership’s procedures and policies designed to identify, assess, and manage the primary risks of its operations.
Business and Operational Risk
There is an element of operational risk inherent within the Partnership’s business. The Partnership is exposed to operational risk and its business model is dependent on complex technology systems, and there is a degree of exposure to systems failure. A business continuity planning process has been established to respond to severe business disruptions. The Partnership has established a data center in Tempe, Arizona, that operates as a secondary data center to its primary data center locatedcenters in St. Louis, MissouriArizona and which isMissouri. These data centers act as disaster recovery sites for each other. While these data centers are designed to enable the Partnership to maintain service duringbe redundant for each other, a system disruption contained to St. Louis. A prolonged interruption of either site might result in a delay in service and substantial costs and expenses. In 2011, the Partnership began re-purposing its secondary data center in Tempe, Arizona, as a processing site for most critical systems such that they could run in St. Louis, Missouri or Tempe, Arizona. The Partnership anticipates that this process will take two to three years to complete.
In order to address the Partnership’s risk of identifying fraudulent or inappropriate activity, the Partnership implemented an anonymous ethics hotline for employees to report suspicious activity for review and disciplinary action when necessary. The Partnership’s Internal Audit and Compliance divisions investigate reports as they are received. The Internal Audit and Compliance divisions review other firmPartnership activity to assist in risk identification and identification of other inappropriate activities. In addition, the Partnership communicates and provides ongoing training regarding the Partnership’s privacy requirements to better protect client information.
The Partnership is also exposed to operational risk as a result of its reliance on third parties to provide technology, processing and other business support services. The Partnership’s Sourcing Office primarily manages that risk by reviewing key vendors through a vendor due diligence process.
94
PART III
Item 10. Directors, Executive Officers and Corporate Governance, continued
Credit Risk
The Partnership is subject to credit risk due to the very nature of the transactions it processes for its clients. In order to manage this risk, the Partnership limits certain client transactions by, in some cases, requiring payment at the time or in advance of a client transaction being accepted. The Partnership manages the credit risk arising out of the client margin loans it offers by limiting the amount and controlling the quality of collateral held in the client’s account against those loans. In accordance with the FINRA rules, the Partnership requires, in the event of a decline in the market value of the securities in a margin account, the client to deposit additional securities or cash so that, at all times, the loan to the client is no greater than 75% of the value of the securities in the account (or to sell a sufficient amount of securities in order to maintain this percentage). The Partnership, however, generally imposes a more stringent maintenance requirement, which requires that the loan to the client be no greater than 65% of the value of the securities in the account.
PART III
|
|
The Partnership purchases and holds securities inventory positions for retail sales to its clients and does not trade those positions for the purpose of generating gains for its own account. To monitor inventory positions, the Partnership has an automated trading system designed to report trading positions and risks. This system requires traders to mark positions to market and to report positions at the trader level, department level and for the firmPartnership as a whole. There are established trading and inventory limits for each trader and each department, and activity exceeding those limits is subject to supervisory review. By maintaining an inventory hedging strategy, the Partnership has attempted to avoid material inventory losses or gains in the past (see Part II, Item 8 – Financial Statements and Supplementary Data – Note 64 to the Consolidated Financial Statements for further details). The objective of the hedging strategy is to mitigate the risks of carrying its inventory positions and not to generate profit for the Partnership. The compensation of the Partnership’s traders is not directly tied to gains or losses incurred by the Partnership on the inventory, which eliminates the incentive to hold inappropriate inventory positions.
The Partnership also has credit exposure with counterparties as a result of its ongoing, routine business activities. This credit exposure can arise from the settlement of client transactions, related failures to receive and deliver, or related to the Partnership’s overnight investing activities with other financial institutions. The Partnership monitors its exposure to such counterparties on a regular basis through the activities of its Finance Risk Committee in order to minimize its risk of loss related to such exposure.
Market and Liquidity Risk
Market risk is the risk of declining revenue or the value of financial instruments held by the Partnership as a result of fluctuations in interest rates, equity prices or overall market conditions. Liquidity risk is the risk of insufficient financial resources to meet the short-term or long-term cash needs of the Partnership. For a discussion of the Partnership’s market and liquidity risk, see “ItemPart II, Item 7A – Quantitative and Qualitative Disclosures about Market Risk”.Risk.
95
PART III
Item 10. Directors, Executive Officers and Corporate Governance, continued
Legal, Regulatory and Reputational Risk
In the normal course of business, from time to time, the Partnership is named as a defendant in various legal actions, including arbitrations, class actions and other litigation. Certain of these legal actions include claims for substantial compensatory and/or punitive damages or claims for indeterminate amounts of damages. Further, the Partnership is involved, from time to time, in various legal matters, including arbitrations, class actions, other litigation, and investigations and proceedings by governmental organizations and self-regulatory agencies, certain of which may result in adverse judgments, fines or penalties.organizations. The number of legal actions and investigations has increased among many firms in the financial services industry, including the Partnership.
The Partnership has established, through its overall compliance program, a variety of policies and procedures (including written supervisory procedures) designed to avoid legal claims or regulatory issues. As a normal course of business, new accounts and client transactions are reviewed on a daily basis, in part, through the firm’sPartnership’s field supervision function, to mitigate the risk of non-compliance with regulatory requirements as well as any resulting negative impact on the Partnership’s reputation. To minimize the risk of regulatory non-compliance, each branch office is subject to an annual on siteonsite branch audit, to review the financial advisor’s business and competency. Additionally, certain branches are visited regularly by field supervision directors to assure reasonable compliance. The Partnership’s Compliance division works with other business areas to advise and consult on business activities to help ensure compliance with regulatory requirements and Partnership policies.
PART III
|
|
The Partnership also has a clear awareness of privacy issues, uses client information responsibly, and trains its employees on privacy requirements, all of which come under the responsibility of the Partnership’s Chief Privacy Officer. The Partnership has specific policies related to prevention of fraud and money laundering and providing initial as well as annual training and review of competency to help mitigate regulatory risks.
SECTION 16(A) BENEFICIAL OWNERSHIP REPORTING COMPLIANCE
Section 16(a) of the Exchange Act requires officers of companies with securities registered pursuant to Section 12 of the Exchange Act to file reports of ownership and changes in ownership with the SEC. The general partners of the Partnership have designated the members of the Partnership’s Executive Committee as its executive officers. Under the Section 16 rules, these Executive Committee members are deemed officers of the Partnership. Given the unique structure of the Partnership, the Partnership’s officers were unaware of this requirement prior to March 2015. After becoming aware of this requirement, the Partnership’s Executive Committee members promptly filed the appropriate notices of ownership with the SEC. The following officers each filed a Form 3 on March 25, 2015: James D. Weddle, Kevin D. Bastien, Brett A. Campbell, Kenneth R. Cella, Jr., Norman L. Eaker, Penny Pennington, Daniel J. Timm, and James A. Tricarico, Jr.
96
PART III
|
COMPENSATION DISCUSSION AND ANALYSIS
The Partnership’s compensation program allocates profits to general partners, including members of its Executive Committee, primarily based upon their ownership interest in the Partnership. As general partners, Executive Committee members as general partners benefit annually from the profits of the Partnership through current cash payments from short-term results and from having an opportunity to continue to share in the long-term profitability of the organization. By owning general partnership interests, Executive Committee members are encouraged to balance short-term and long-term results of the Partnership as they have a significant amount of capital at risk. Also, by sharing in any annual operating loss of the Partnership, all general partners, including Executive Committee members, have a direct incentive to manage risk and focus on the short and long-term financial results of the Partnership.
Compensation Components
The Executive Committee members’ compensation components are the same as the Partnership’s other general partners. The components consist of base salary, deferred compensation, and the income allocated to partners. Executive Committee members do not receive any bonus, stock awards, option awards, non-equity incentive plan compensation, or any other elements besides those disclosed below related to their general partnership interest.
Salary –Each Executive Committee member receives an amount of fixed compensation in the form of salary. In establishing the salaries listed on the Summary Compensation Table, the Partnership considers individual experience, responsibilities and tenure. Because the Partnership’s principal compensation of Executive Committee members is based on general partnership ownership interests in the Partnership and special allocations of net income allocable to general partners, it does not benchmark the compensation of its Executive Committee members with compensation to executives at other companies in setting its base salaries, or otherwise in determining the compensation to its Executive Committee members. Each Executive Committee member receives a salary generally ranging from $175,000—$250,000 annually.
In addition to base salary, under the Partnership Agreement the Managing Partner has the discretion to allocate an additional $3 million (in the aggregate) in compensation to general partners. In 20112014, 2013 and 2012 no amounts were allocated by the Managing Partner. However, in 2010, and 2009, the Managing Partner allocated $0.1 million and $0.5 million, respectively. None of the Executive Committee members listed in the table below received this allocation in 2009 or 2010.
Deferred Compensation – Each Executive Committee member is a participant in the Partnership’s profit sharing plan, a qualified deferred compensation plan, which also covers all eligible employeesgeneral partners and associates of the Partnership’s subsidiaries. Each Executive Committee member receives contributions based upon the overall profitability of the Partnership. Contributions to the plan are made annually within the discretion of the Partnership and have historically been determined based on approximately twenty-four percent of the Partnership’s net income before allocations to partners. Allocation of the Partnership’s contribution among participants is determined by each participant’s relative level of eligible earnings, including their respective allocations of income. The plan is a tax-qualified retirement plan.
97
PART III
| Item 11. Executive Compensation, continued |
Income Allocated to Partners –The majority of all general partners’ compensation (including that of the Executive Committee members) comes from the members capital ownership interests in the Partnership as general partners, subordinated limited partners and limited partners. Of the Partnership’s net income allocated to general partners, including the Executive Committee members, ninety-two percent is allocable based upon their capital ownership interest in the Partnership. This ownership interest is set at the discretion of the Partnership’s Managing Partner, with input from the Executive Committee. Capital ownership interests, as general partners in the Partnership, held by each Executive Committee member ranged from 1.30% to 2.79% in 2011, 1.00% to 2.89%2.20% in 2010,2014, 1.55% to 2.50% in 2013, and 0.80%1.40% to 2.89%2.70% in 2009.2012. The remaining eight percent of net income allocated to general partners is allocable among the general partners, which includes the Executive Committee members,distributed based on merit and/or need as determined by the Managing Partner in consultation with the Executive Committee. None of the Executive Committee members listed in the table below received any portion of this 8% allocation in 2009, 20102014, 2013 or 2011.
PART III
|
|
2012.
The following table identifies the compensation of the Partnership’s Managing Partner (“CEO”), the Chief Financial Officer (“CFO”), and the three other most highly compensated Executive Committee members based on total compensation in 20112014 (including respective shares of income allocation).
| Year | Salaries | Deferred Compen- sation | Income Allocated to Partners1 | All Other Compensation | Total | |||||||||||||||||||
James D. Weddle | 2011 | $ | 250,000 | $ | 10,609 | $ | 9,552,406 | $ | — | $ | 9,813,015 | |||||||||||||
CEO | 2010 | 250,000 | 9,849 | 8,491,878 | — | 8,751,727 | ||||||||||||||||||
| 2009 | 250,000 | 6,615 | 3,299,736 | — | 3,556,351 | |||||||||||||||||||
Kevin D. Bastien | 2011 | $ | 175,000 | $ | 10,609 | $ | 5,057,572 | $ | — | $ | 5,243,181 | |||||||||||||
CFO | 2010 | 175,000 | 9,849 | 3,908,027 | — | 4,092,876 | ||||||||||||||||||
| 2009 | 150,000 | 6,615 | 1,347,297 | — | 1,503,912 | |||||||||||||||||||
Gary D. Reamey | 2011 | $ | 175,000 | $ | 10,609 | $ | 8,346,374 | $ | 386,249 | 3 | $ | 8,918,232 | ||||||||||||
General Partner - | 2010 | 175,000 | 9,849 | 7,482,205 | 383,181 | 4 | 8,050,235 | |||||||||||||||||
Canadian Operations2 | 2009 | 175,000 | 6,615 | 2,941,008 | 369,208 | 5 | 3,491,831 | |||||||||||||||||
Norman L. Eaker | 2011 | $ | 175,000 | $ | 10,609 | $ | 8,058,963 | $ | — | $ | 8,244,572 | |||||||||||||
General Partner - | 2010 | 175,000 | 9,849 | 7,035,541 | — | 7,220,390 | ||||||||||||||||||
Firm Administration | 2009 | 175,000 | 6,615 | 2,739,891 | — | 2,921,506 | ||||||||||||||||||
Brett A. Campbell | 2011 | $ | 175,000 | $ | 10,609 | $ | 7,923,529 | $ | — | $ | 8,109,138 | |||||||||||||
General Partner - | 2010 | 175,000 | 9,849 | 6,905,160 | — | 7,090,009 | ||||||||||||||||||
Client Solutions | 2009 | 175,000 | 6,615 | 2,683,176 | — | 2,864,791 | ||||||||||||||||||
| Year | Salaries | Deferred Compensation | Income Allocated to Partners(1) | Total | ||||||||||||||||
| ||||||||||||||||||||
James D. Weddle | 2014 | $ | 250,000 | $ | 12,818 | $ | 13,655,081 | $ | 13,917,899 | |||||||||||
CEO | 2013 | 250,000 | 12,291 | 12,658,728 | 12,921,019 | |||||||||||||||
| 2012 | 250,000 | 11,475 | 10,863,819 | 11,125,294 | ||||||||||||||||
Kevin D. Bastien | 2014 | $ | 175,000 | $ | 12,818 | $ | 10,265,697 | $ | 10,453,515 | |||||||||||
CFO | 2013 | 175,000 | 12,291 | 8,430,646 | 8,617,937 | |||||||||||||||
| 2012 | 175,000 | 11,475 | 6,255,984 | 6,442,459 | ||||||||||||||||
Brett A. Campbell | 2014 | $ | 175,000 | $ | 12,818 | $ | 12,494,542 | $ | 12,682,360 | |||||||||||
General Partner - Client Strategies Group | 2013 | 175,000 | 12,291 | 11,196,074 | 11,383,365 | |||||||||||||||
| 2012 | 175,000 | 11,475 | 9,095,065 | 9,281,540 | ||||||||||||||||
Norman L. Eaker | 2014 | $ | 175,000 | $ | 12,818 | $ | 11,814,257 | $ | 12,002,075 | |||||||||||
General Partner - Firm Administration | 2013 | 175,000 | 12,291 | 10,836,785 | 11,024,076 | |||||||||||||||
| 2012 | 175,000 | 11,475 | 9,237,983 | 9,424,458 | ||||||||||||||||
Daniel J. Timm | 2014 | $ | 175,000 | $ | 12,818 | $ | 11,119,514 | $ | 11,307,332 | |||||||||||
General Partner - Branch Development | 2013 | 175,000 | 12,291 | 9,655,616 | 9,842,907 | |||||||||||||||
(1) | Income Allocated to Partners includes earnings from general partner interests and any subordinated limited partnership or limited partnership investment in the Partnership. |
|
|
|
|
|
|
|
|
98
PART III
SECURITY OWNERSHIP OF CERTAIN BENEFICIAL OWNERS AND |
| MANAGEMENT AND RELATED STOCKHOLDER MATTERS |
As the Partnership is organized as a limited partnership, its management is vested in the general partners thereof and there are no other outstanding “voting” or “equity” securities. It is the opinionresponsible for management of the Partnership that the general partnership interests are not securities within the meaning of federal and state securities laws primarily because each of thebusiness. The general partners participates in the management and conduct of the business.
In connection withhave designated the Partnership’s outstanding limitedExecutive Committee as its executive officers. For additional information regarding the Partnership’s Executive Committee, refer to Part III, Item 10 – Directors, Executive Officers and subordinatedCorporate Governance.
The following table shows the ownership of limited partnership interests (which are inby each case non-voting securities), 312Executive Committee member and the Executive Committee members as a group as of February 27, 2015:
| Title of Class | Name of Beneficial Owner | Amount Beneficially Owned | % of Class | |||||||
Limited Partnership Interests | James D. Weddle | $ | - | 0% | ||||||
Limited Partnership Interests | Kevin D. Bastien | - | 0% | |||||||
Limited Partnership Interests | Kenneth R. Cella, Jr. | 115,600 | * | |||||||
Limited Partnership Interests | Norman L. Eaker | - | 0% | |||||||
Limited Partnership Interests | Penny Pennington | 27,000 | * | |||||||
Limited Partnership Interests | Daniel J. Timm | 105,000 | * | |||||||
Limited Partnership Interests | James A. Tricarico, Jr. | - | 0% | |||||||
Limited Partnership Interests | All Executive Committee Members as a Group (7 persons) | $ | 247,600 | * | ||||||
* Each of these Executive Committee members and the general partners alsoExecutive Committee members as a group own less than 1% of the limited partnership interests and 55 of the general partners also own subordinated limited partnership interests, as noted in the table below. No person is the beneficial owner of more than 2.7% of the Partnership’s general partner interests.outstanding.
As of February 24, 2012:
Title of Class | Name of Beneficial Owner | Amount of Beneficial Owner | % of Class | |||||||
Limited Partnership Interests | All General Partners as a Group | $ | 47,869,200 | 7 | % | |||||
Subordinated Limited Partnership Interests | All General Partners as a Group | $ | 96,246,319 | 33 | % | |||||
99
PART III
CERTAIN RELATIONSHIPS AND RELATED TRANSACTIONS, AND DIRECTOR INDEPENDENCE |
In the ordinary course of its business the Partnership has extended credit to certain of its partners and employees in connection with their purchase of securities. Such extensions of credit have been made on substantially the same terms, including with respect to interest rates and collateral requirements, as those prevailing at the time for comparable transactions with non-affiliated persons, and did not involve more than the normal risk of collectability or present other unfavorable features. The Partnership also, from time to time and in the ordinary course of business, enters into transactions involving the purchase or sale of securities from or to partners or employees and members of their immediate families, as principal. Such purchases and sales of securities on a principal basis are affected on substantially the same terms as similar transactions with unaffiliated third parties.
The Partnership leases approximately 10% of its branch office space from its financial advisors. Rent expense related to these leases approximated $21.0$25 million, $20.0$23 million and $19.0$20 million for the years ended December 31, 2011, 20102014, 2013 and 2009,2012, respectively. These leases are executed and maintained in the samea similar manner as those entered into with third parties.
PART III
|
|
In 2011, theThe Partnership began makingmakes loans available to those general partners (other than members of the Executive Committee)Committee, which consists of the executive officers of the Partnership) that desire financing for some or all of their new purchases of individual partnership capital interests. See the Liquidity section ofPart II, Item 7 – Management’s Discussion and Analysis of Financial Condition and Results of Operations – Liquidity for further information.
Policy for Review and Approval of Transactions with Related Persons
The Partnership’s policy with respect to related person transactions applies to transactions, arrangements and relationships (or any series of similar transactions, arrangements or relationships) that are reportable by the Partnership under paragraph (a) of Item 404 of SEC Regulation S-K in which the aggregate amount involved exceeds $120,000 in any calendar year, and in which a related person has or will have a direct or indirect material interest. For purposes of the policy, the term ‘‘related person’’ has the meaning set forth in Item 404(a) of SEC Regulation S-K‘‘Transactions with related persons, promoters and certain control persons’’.
Under the policy, the Partnership’s CFO or General Counsel will determine whether a transaction meets the requirements of a related person transaction pursuant to Item 404(a) of SEC Regulation S-K requiring approval by the Audit Committee. Transactions that fall within the definition will be referred to the Audit Committee for approval, ratification or other action. Based on its consideration of all of the relevant facts and circumstances, the Audit Committee will decide whether or not to approve such transaction and will approve only those transactions that are in the best interest of the Partnership. If the Partnership’s CFO or General Counsel becomes aware of an existing transaction with a related person which has not been approved under this policy, the matter will be referred to the Audit Committee. The Audit Committee will evaluate all options available, including ratification, revision or termination of such transaction.
As of December 31, 2014, the following transactions meet the definition of a related person transaction pursuant to Item 404(a) of SEC Regulation S-K. These contracts were subject to review by appropriate areas within the Partnership including the Partnership’s Finance and Legal areas prior to execution.
100
PART III
Item 13. Certain Relationships and Related Transactions, and Director Independence, continued
Touch of Class, Inc.
On July 28, 2008, the Partnership entered into a five-year master vendor agreement with Touch of Class, Inc. to provide artwork in the Partnership’s branch offices. This agreement was amended as of August 1, 2012 to extend the agreement through July 31, 2015. Touch of Class, Inc. is 100% owned by Shelia Timm and Eric Timm, spouse and son, respectively, of Daniel J. Timm, a member of the Partnership’s Executive Committee. The total amount paid to Touch of Class, Inc. in 2014 pursuant to this agreement was approximately $385,000.
Cassidy Turley
On September 1, 2004, the Partnership entered into two agreements with Cassidy Turley, one to manage the Partnership’s branch office leases and one to manage the Partnership’s home office facilities. Each agreement was for a term of five years. On May 3, 2010 each agreement was amended and extended for a period of five years. Cassidy Turley, which recently combined with DTZ, is a leading commercial real estate services provider with more than 28,000 professionals in more than 200 offices across the world. Lyle Gilbertson, a principal of Cassidy Turley, is the brother-in-law of Norman L. Eaker, a member of the Partnership’s Executive Committee. The total amount paid to Cassidy Turley in 2014 pursuant to this agreement was approximately $11.4 million.
Family Relationships
The Partnership has an anti-nepotism policy in the home office. However, the Partnership encourages the recruitment of family and friends to be financial advisors and branch office administrators. As such, it is very common for family members to be employed by the Partnership and paid consistent with the compensation programs provided to other financial advisors and branch office administrators of the Partnership. The following summarizes Family Relationships with members of the Partnership’s Executive Committee.
Brett A. Campbell, a member of the Partnership’s Executive Committee prior to his December 31, 2014 retirement, has a brother, Robert Campbell, who was employed by the Partnership as a financial advisor during 2014 (and presently). Robert Campbell earned approximately $330,000 in compensation during 2014 and has been employed by the Partnership for 35 years. The compensation program under which Robert Campbell is paid is consistent with the compensation programs provided to other financial advisors of the Partnership.
Daniel J. Timm, a member of the Partnership’s Executive Committee, has a sister-in-law, Kim Renk, who was employed by the Partnership as a financial advisor during 2014 (and presently). Ms. Renk earned approximately $560,000 in compensation during 2014 and has been employed by the Partnership for 20 years. The compensation program under which Ms. Renk is paid is consistent with the compensation programs provided to other financial advisors of the Partnership.
James D. Weddle, a member of the Partnership’s Executive Committee, has a son-in-law, Travis Selner, who was employed by the Partnership as a financial advisor during 2014 (and presently). Mr. Selner earned approximately $260,000 in compensation during 2014 and has been employed by the Partnership for nine years. The compensation program under which Mr. Selner is paid is consistent with the compensation programs provided to other financial advisors of the Partnership.
101
PART III
|
The following table presents fees paid and accrued by the Partnership to its independent registered public accountants, PricewaterhouseCoopers LLP.
(Dollars in thousands) | 2011 | 2010 | ||||||
Fees paid by the Partnership: | ||||||||
Audit fees | $ | 2,228 | $ | 2,104 | ||||
Audit-related fees (1) | 931 | 965 | ||||||
Tax fees (2) | 572 | 793 | ||||||
Other (3) | 100 | — | ||||||
|
|
|
| |||||
Total fees | $ | 3,831 | $ | 3,862 | ||||
|
|
|
| |||||
($ thousands) | 2014 | 2013 | ||||||
Audit fees | $ | 2,648 | $ | 2,359 | ||||
Audit-related fees(1) | 1,566 | 1,259 | ||||||
Tax fees(2) | 164 | 12 | ||||||
Other(3) | 123 | 89 | ||||||
|
|
|
| |||||
Total fees | $ | 4,501 | $ | 3,719 | ||||
|
|
|
| |||||
(1) | Audit-related fees consist primarily of fees for internal control reviews, attestation/agreed-upon procedures, employee benefit plan audits, and consultations concerning financial accounting and reporting standards. |
(2) | Tax fees consist of fees for services relating to tax compliance and |
(3) | Other primarily consists of fees for |
The Audit Committee pre-approved all audit and non-audit related services in fiscal year 20112014 and 2010.2013. No services were provided under the de minimis fee exception to the audit committee pre-approval requirements.
102
|
INDEX
| Page No. | ||||||
(a) | (1) | The following financial statements are included in Part II, Item 8: | ||||
Management’s Report on Internal Control over Financial Reporting |
| |||||
Report of Independent Registered Public Accounting Firm |
| |||||
Consolidated Statements of Financial Condition as of December 31, |
| |||||
Consolidated Statements of Income for the years ended December 31, |
| |||||
Consolidated Statements of Changes in Partnership Capital Subject to Mandatory Redemption for the years ended December 31, |
| |||||
Consolidated Statements of Cash Flows for the years ended December 31, |
| |||||
Notes to Consolidated Financial Statements |
| |||||
(2) | The following financial statements are included in Schedule I: | |||||
Parent Company Only Condensed Statements of Financial Condition as of December 31, |
| |||||
Parent Company Only Condensed Statements of Income for the years ended December 31, |
| |||||
Parent Company Only Condensed Statements of Cash Flows for the years ended December 31, |
| |||||
Schedules are omitted because they are not required, inapplicable, or the information is otherwise shown in the Consolidated Financial Statements or notes thereto. | ||||||
(b) | Exhibits | |||||
Reference is made to the Exhibit Index hereinafter contained. | ||||||
PART IV
103
Pursuant to the requirements of Section 13 or 15(d) of the Securities Exchange Act of 1934, the Registrant has duly caused this report to be signed on its behalf by the undersigned, thereunto duly authorized.authorized.
| THE JONES FINANCIAL COMPANIES, L.L.L.P. | ||||||
By: |
| |||||
James D. Weddle | ||||||
Managing Partner (Principal Executive Officer) March | ||||||
Pursuant to the requirements of the Securities Exchange Act of 1934, this report has been signed below by the following persons on behalf of the Registrant in the capacities and on the dates indicated:
Signatures | Title | Date | ||
/s/ James D. Weddle | Managing Partner (Principal Executive Officer) | March | ||
| James D. Weddle | ||||
/s/ Kevin D. Bastien Kevin D. Bastien | Chief Financial Officer (Principal Financial and Accounting Officer) | March | ||
PART IV104
EXHIBIT INDEX TO ANNUAL REPORT ON FORM 10-K
FOR THE YEAR ENDED DECEMBER 31, 20112014
Exhibit | Description | |||
3.1 | * |
| ||
3.2 | ** |
| ||
| ** |
| ||
| * |
| ||
|
| |||
| * |
| ||
| * |
| ||
|
| |||
PART IV
Exhibit Index to Annual Report on Form 10-K for the Year Ended December 31, 2010, continued
|
| |||
|
| |||
| * |
| ||
| * |
| ||
| * |
| ||
|
| |||
| 10.7 | * | The Jones Financial Companies, L.L.L.P. 2014 Employee Limited Partnership Interest Purchase Plan, incorporated by reference from Exhibit 99.1 to the Form S-8 Registration Statement (File No. 333-193431) filed on January 17, 2014. (Constitutes a management contract or compensatory plan or arrangement) | ||
105
EXHIBIT INDEX TO ANNUAL REPORT ON FORM 10-K
FOR THE YEAR ENDED DECEMBER 31, 2014, continued
| Description | |||
| 21.1 | ** | Subsidiaries of the Registrant | ||
23.1 | ** |
| ||
31.1 | ** |
| ||
31.2 | ** |
| ||
32.1 | ** |
| ||
PART IV
Exhibit Index to Annual Report on Form 10-K for the Year Ended December 31, 2010, continued
| ** |
| ||
|
| |||
99.1 | * |
| ||
99.2 | * |
| ||
99.3 | * |
| ||
99.4 | * |
| ||
101.INS | ** |
| ||
101.SCH | ** |
| ||
101.CAL | ** |
| ||
101.DEF | ** |
| ||
101.LAB | ** |
| ||
101.PRE | ** |
| ||
* | Incorporated by reference to previously filed exhibits. |
** | Filed herewith. |
|
|
106
Schedule I
THE JONES FINANCIAL COMPANIES, L.L.L.P.
(Parent Company Only)
CONDENSED STATEMENTS OF FINANCIAL CONDITION
| December 31, | December 31, | December 31, | December 31, | |||||||||||||
(Dollars in thousands) | 2011 | 2010 | ||||||||||||||
| (Dollars in millions) | 2014 | 2013 | ||||||||||||||
ASSETS: | ||||||||||||||||
Cash and cash equivalents | $ | 149,826 | $ | 3,183 | $ | 119 | $ | 252 | ||||||||
Investment securities | 15,224 | — | 9 | 9 | ||||||||||||
Investment in subsidiaries | 1,729,936 | 1,593,578 | 2,076 | 1,809 | ||||||||||||
Other assets | 11,150 | 9,863 | 15 | 12 | ||||||||||||
|
|
|
| |||||||||||||
TOTAL ASSETS | $ | 1,906,136 | $ | 1,606,624 | $ | 2,219 | $ | 2,082 | ||||||||
|
|
|
| |||||||||||||
LIABILITIES | ||||||||||||||||
LIABILITIES: | ||||||||||||||||
Accounts payable and accrued expenses | $ | 359 | $ | 1,651 | $ | 1 | $ | 1 | ||||||||
Partnership capital subject to mandatory redemption | 1,905,777 | 1,604,973 | 2,218 | 2,081 | ||||||||||||
|
|
|
| |||||||||||||
TOTAL LIABILITIES | $ | 1,906,136 | $ | 1,606,624 | $ | 2,219 | $ | 2,082 | ||||||||
|
|
|
| |||||||||||||
These financial statements should be read in conjunction with the notesNotes to the
Consolidated Financial Statements of The Jones Financial Companies, L.L.L.P.
107
Schedule I
THE JONES FINANCIAL COMPANIES, L.L.L.P.
(Parent Company Only)
CONDENSED STATEMENTS OF INCOME
| For the Years Ended | For the Years Ended December 31, | |||||||||||||||||||||||
(Dollars in thousands) | December 31, 2011 | December 31, 2010 | December 31, 2009 | |||||||||||||||||||||
| (Dollars in millions) | 2014 | 2013 | 2012 | |||||||||||||||||||||
|
|
|
| |||||||||||||||||||||
NET REVENUE | ||||||||||||||||||||||||
Subsidiary earnings | $ | 482,926 | $ | 394,861 | $ | 164,488 | $ | 764 | $ | 667 | $ | 548 | ||||||||||||
Management fee income | 78,485 | 62,438 | 62,473 | 78 | 76 | 78 | ||||||||||||||||||
Other | 1,166 | 1 | 7 | 7 | 9 | 9 | ||||||||||||||||||
|
|
|
|
|
| |||||||||||||||||||
Total revenue | 562,577 | 457,300 | 226,968 | 849 | 752 | 635 | ||||||||||||||||||
Interest expense | 50,231 | 34,227 | 35,389 | 48 | 48 | 49 | ||||||||||||||||||
|
|
| ||||||||||||||||||||||
|
|
| ||||||||||||||||||||||
Net revenue | 512,346 | 423,073 | 191,579 | 801 | 704 | 586 | ||||||||||||||||||
|
|
|
|
|
| |||||||||||||||||||
OPERATING EXPENSES | ||||||||||||||||||||||||
Compensation and benefits | 28,348 | 28,203 | 27,096 | 30 | 28 | 29 | ||||||||||||||||||
Payroll and other taxes | 151 | 316 | 147 | |||||||||||||||||||||
Other operating expenses | 2,064 | 1,769 | 29 | 1 | 2 | 2 | ||||||||||||||||||
|
|
| ||||||||||||||||||||||
|
|
| ||||||||||||||||||||||
Total operating expenses | 30,563 | 30,288 | 27,272 | 31 | 30 | 31 | ||||||||||||||||||
|
|
|
|
|
| |||||||||||||||||||
INCOME BEFORE ALLOCATIONS TO PARTNERS | $ | 481,783 | $ | 392,785 | $ | 164,307 | $ | 770 | $ | 674 | $ | 555 | ||||||||||||
Allocations to partners | (481,783 | ) | (392,785 | ) | (164,307 | ) | (770) | (674) | (555) | |||||||||||||||
|
|
| ||||||||||||||||||||||
|
|
| ||||||||||||||||||||||
NET INCOME | $ | — | $ | — | $ | — | $ | - | $ | - | $ | - | ||||||||||||
|
|
|
|
|
| |||||||||||||||||||
These financial statements should be read in conjunction with the notesNotes to the
Consolidated Financial Statements of The Jones Financial Companies, L.L.L.P.
108
Schedule I
THE JONES FINANCIAL COMPANIES, L.L.L.P.
(Parent Company Only)
CONDENSED STATEMENTS OF CASH FLOWS
| For the Years Ended | For the Years Ended December 31, | |||||||||||||||||||||||
| (Dollars in millions) | 2014 | 2013 | 2012 | |||||||||||||||||||||
CASH FLOWS FROM OPERATING ACTIVITIES: | ||||||||||||||||||||||||
| December 31, | December 31, | December 31, | ||||||||||||||||||||||
(Dollars in thousands) | 2011 | 2010 | 2009 | |||||||||||||||||||||
CASH FLOWS FROM OPERATING ACTIVITIES: | ||||||||||||||||||||||||
Net income | $ | — | $ | — | $ | — | $ | - | $ | - | $ | - | ||||||||||||
Adjustments to reconcile net income to net cash provided by operating activities - | ||||||||||||||||||||||||
Adjustments to reconcile net income to net cash provided by operating activities: | ||||||||||||||||||||||||
Income before allocations to partners | 481,783 | 392,785 | 164,307 | 770 | 674 | 555 | ||||||||||||||||||
Increase in investment securities | (15,224 | ) | — | — | ||||||||||||||||||||
(Increase) decrease in investment in subsidiaries | (136,358 | ) | (132,000 | ) | 2,657 | |||||||||||||||||||
Increase in other assets | (1,287 | ) | (353 | ) | (2,580 | ) | ||||||||||||||||||
(Decrease) increase in liabilities | (1,292 | ) | (6,840 | ) | 8,298 | |||||||||||||||||||
Changes in assets and liabilities: | ||||||||||||||||||||||||
Investment securities | - | 4 | 3 | |||||||||||||||||||||
Investment in subsidiaries | (267) | (136) | 56 | |||||||||||||||||||||
Other assets | (3) | - | (1) | |||||||||||||||||||||
Accounts payable and accrued expenses | - | 1 | - | |||||||||||||||||||||
|
|
|
|
|
| |||||||||||||||||||
Net cash provided by operating activities | 327,622 | 253,592 | 172,682 | 500 | 543 | 613 | ||||||||||||||||||
|
|
|
|
|
| |||||||||||||||||||
CASH FLOWS FROM FINANCING ACTIVITIES: | ||||||||||||||||||||||||
Issuance of partnership interests | 270,839 | 35,984 | 25,312 | |||||||||||||||||||||
Issuance of partnership interests (net of partnership loans) | 55 | 40 | 45 | |||||||||||||||||||||
Redemption of partnership interests | (97,191 | ) | (60,591 | ) | (35,554 | ) | (125) | (115) | (99) | |||||||||||||||
Withdrawals and distributions from partnership capital | (359,467 | ) | (230,017 | ) | (162,568 | ) | ||||||||||||||||||
Repayment of general partnership loans | 4,840 | — | — | |||||||||||||||||||||
|
|
| ||||||||||||||||||||||
Distributions from partnership capital (net of partnership loans) | (563) | (490) | (424) | |||||||||||||||||||||
Issuance of partnership loans | - | (11) | - | |||||||||||||||||||||
Net cash used in financing activities | (180,979 | ) | (254,624 | ) | (172,810 | ) | (633) | (576) | (478) | |||||||||||||||
|
|
|
|
|
| |||||||||||||||||||
Net increase (decrease) in cash and cash equivalents | 146,643 | (1,032 | ) | (128 | ) | |||||||||||||||||||
Net (decrease) increase in cash and cash equivalents | (133) | (33) | 135 | |||||||||||||||||||||
CASH AND CASH EQUIVALENTS: | ||||||||||||||||||||||||
Beginning of year | 3,183 | 4,215 | 4,343 | 252 | 285 | 150 | ||||||||||||||||||
|
|
|
|
|
| |||||||||||||||||||
End of year | $ | 149,826 | $ | 3,183 | $ | 4,215 | $ | 119 | $ | 252 | $ | 285 | ||||||||||||
|
|
|
|
|
| |||||||||||||||||||
NON-CASH ACTIVITIES: | ||||||||||||||||||||||||
Issuance of general partnership interests through partnership loans in current period | $ | 86 | $ | 95 | $ | 94 | ||||||||||||||||||
|
|
| ||||||||||||||||||||||
Repayment of partnership loans through distributions from partnership capital in current period | $ | 103 | $ | 61 | $ | 11 | ||||||||||||||||||
|
|
| ||||||||||||||||||||||
These financial statements should be read in conjunction with the notesNotes to the
Consolidated Financial Statements of The Jones Financial Companies, L.L.L.P.
114109